UAH Global Temperature Update for August, 2016: +0.44 deg. C

September 1st, 2016 by Roy W. Spencer, Ph. D.

August Temperature Up a Little from July

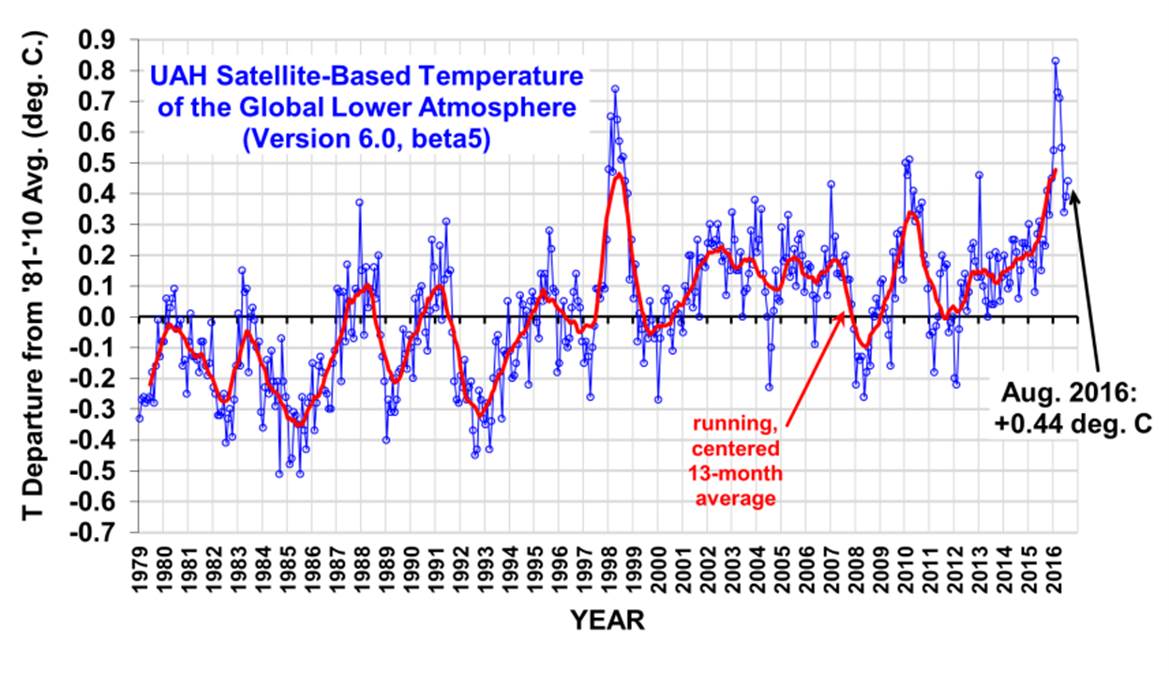
NOTE: This is the seventeenth monthly update with our new Version 6.0 dataset. Differences versus the old Version 5.6 dataset are discussed here. Note we are now at “beta5” for Version 6, and the paper describing the methodology is back to the journal editors from peer review.

The Version 6.0 global average lower tropospheric temperature (LT) anomaly for August 2016 is +0.44 deg. C, up a little from the July, 2016 value +0.39 deg. C (click for full size version):

UAH_LT_1979_thru_August_2016_v6

The global, hemispheric, and tropical LT anomalies from the 30-year (1981-2010) average for the last 20 months are:

YEAR MO GLOBE NHEM. SHEM. TROPICS
2015 01 +0.30 +0.44 +0.15 +0.13
2015 02 +0.19 +0.34 +0.04 -0.07
2015 03 +0.18 +0.28 +0.07 +0.04
2015 04 +0.09 +0.19 -0.01 +0.08
2015 05 +0.27 +0.34 +0.20 +0.27
2015 06 +0.31 +0.38 +0.25 +0.46
2015 07 +0.16 +0.29 +0.03 +0.48
2015 08 +0.25 +0.20 +0.30 +0.53
2015 09 +0.23 +0.30 +0.16 +0.55
2015 10 +0.41 +0.63 +0.20 +0.53
2015 11 +0.33 +0.44 +0.22 +0.52
2015 12 +0.45 +0.53 +0.37 +0.61
2016 01 +0.54 +0.69 +0.39 +0.84
2016 02 +0.83 +1.17 +0.50 +0.99
2016 03 +0.73 +0.94 +0.52 +1.09
2016 04 +0.71 +0.85 +0.58 +0.94
2016 05 +0.55 +0.65 +0.44 +0.72
2016 06 +0.34 +0.51 +0.17 +0.38
2016 07 +0.39 +0.48 +0.30 +0.48
2016 08 +0.44 +0.55 +0.32 +0.50

The July-August pause in cooling as La Nina approaches is unusual compared to the few other dissipating El Nino events in the satellite period of record; recent weeks’ ENSO predictions from CPC have suggested the coming La Nina won’t be as stong as previously forecast. Also, warmth elsewhere is offsetting cooling in the tropical Pacific, keeping global average temperatures up; the CFSv2 model average surface temperature for August as compiled at Weatherbell.com was +0.42 deg. C.

To see how we are now progressing toward a record warm year in the satellite data, the following chart shows the average rate of cooling for the rest of 2016 that would be required to tie 1998 as warmest year in the 38-year satellite record:
UAH-v6-LT-with-2016-projection

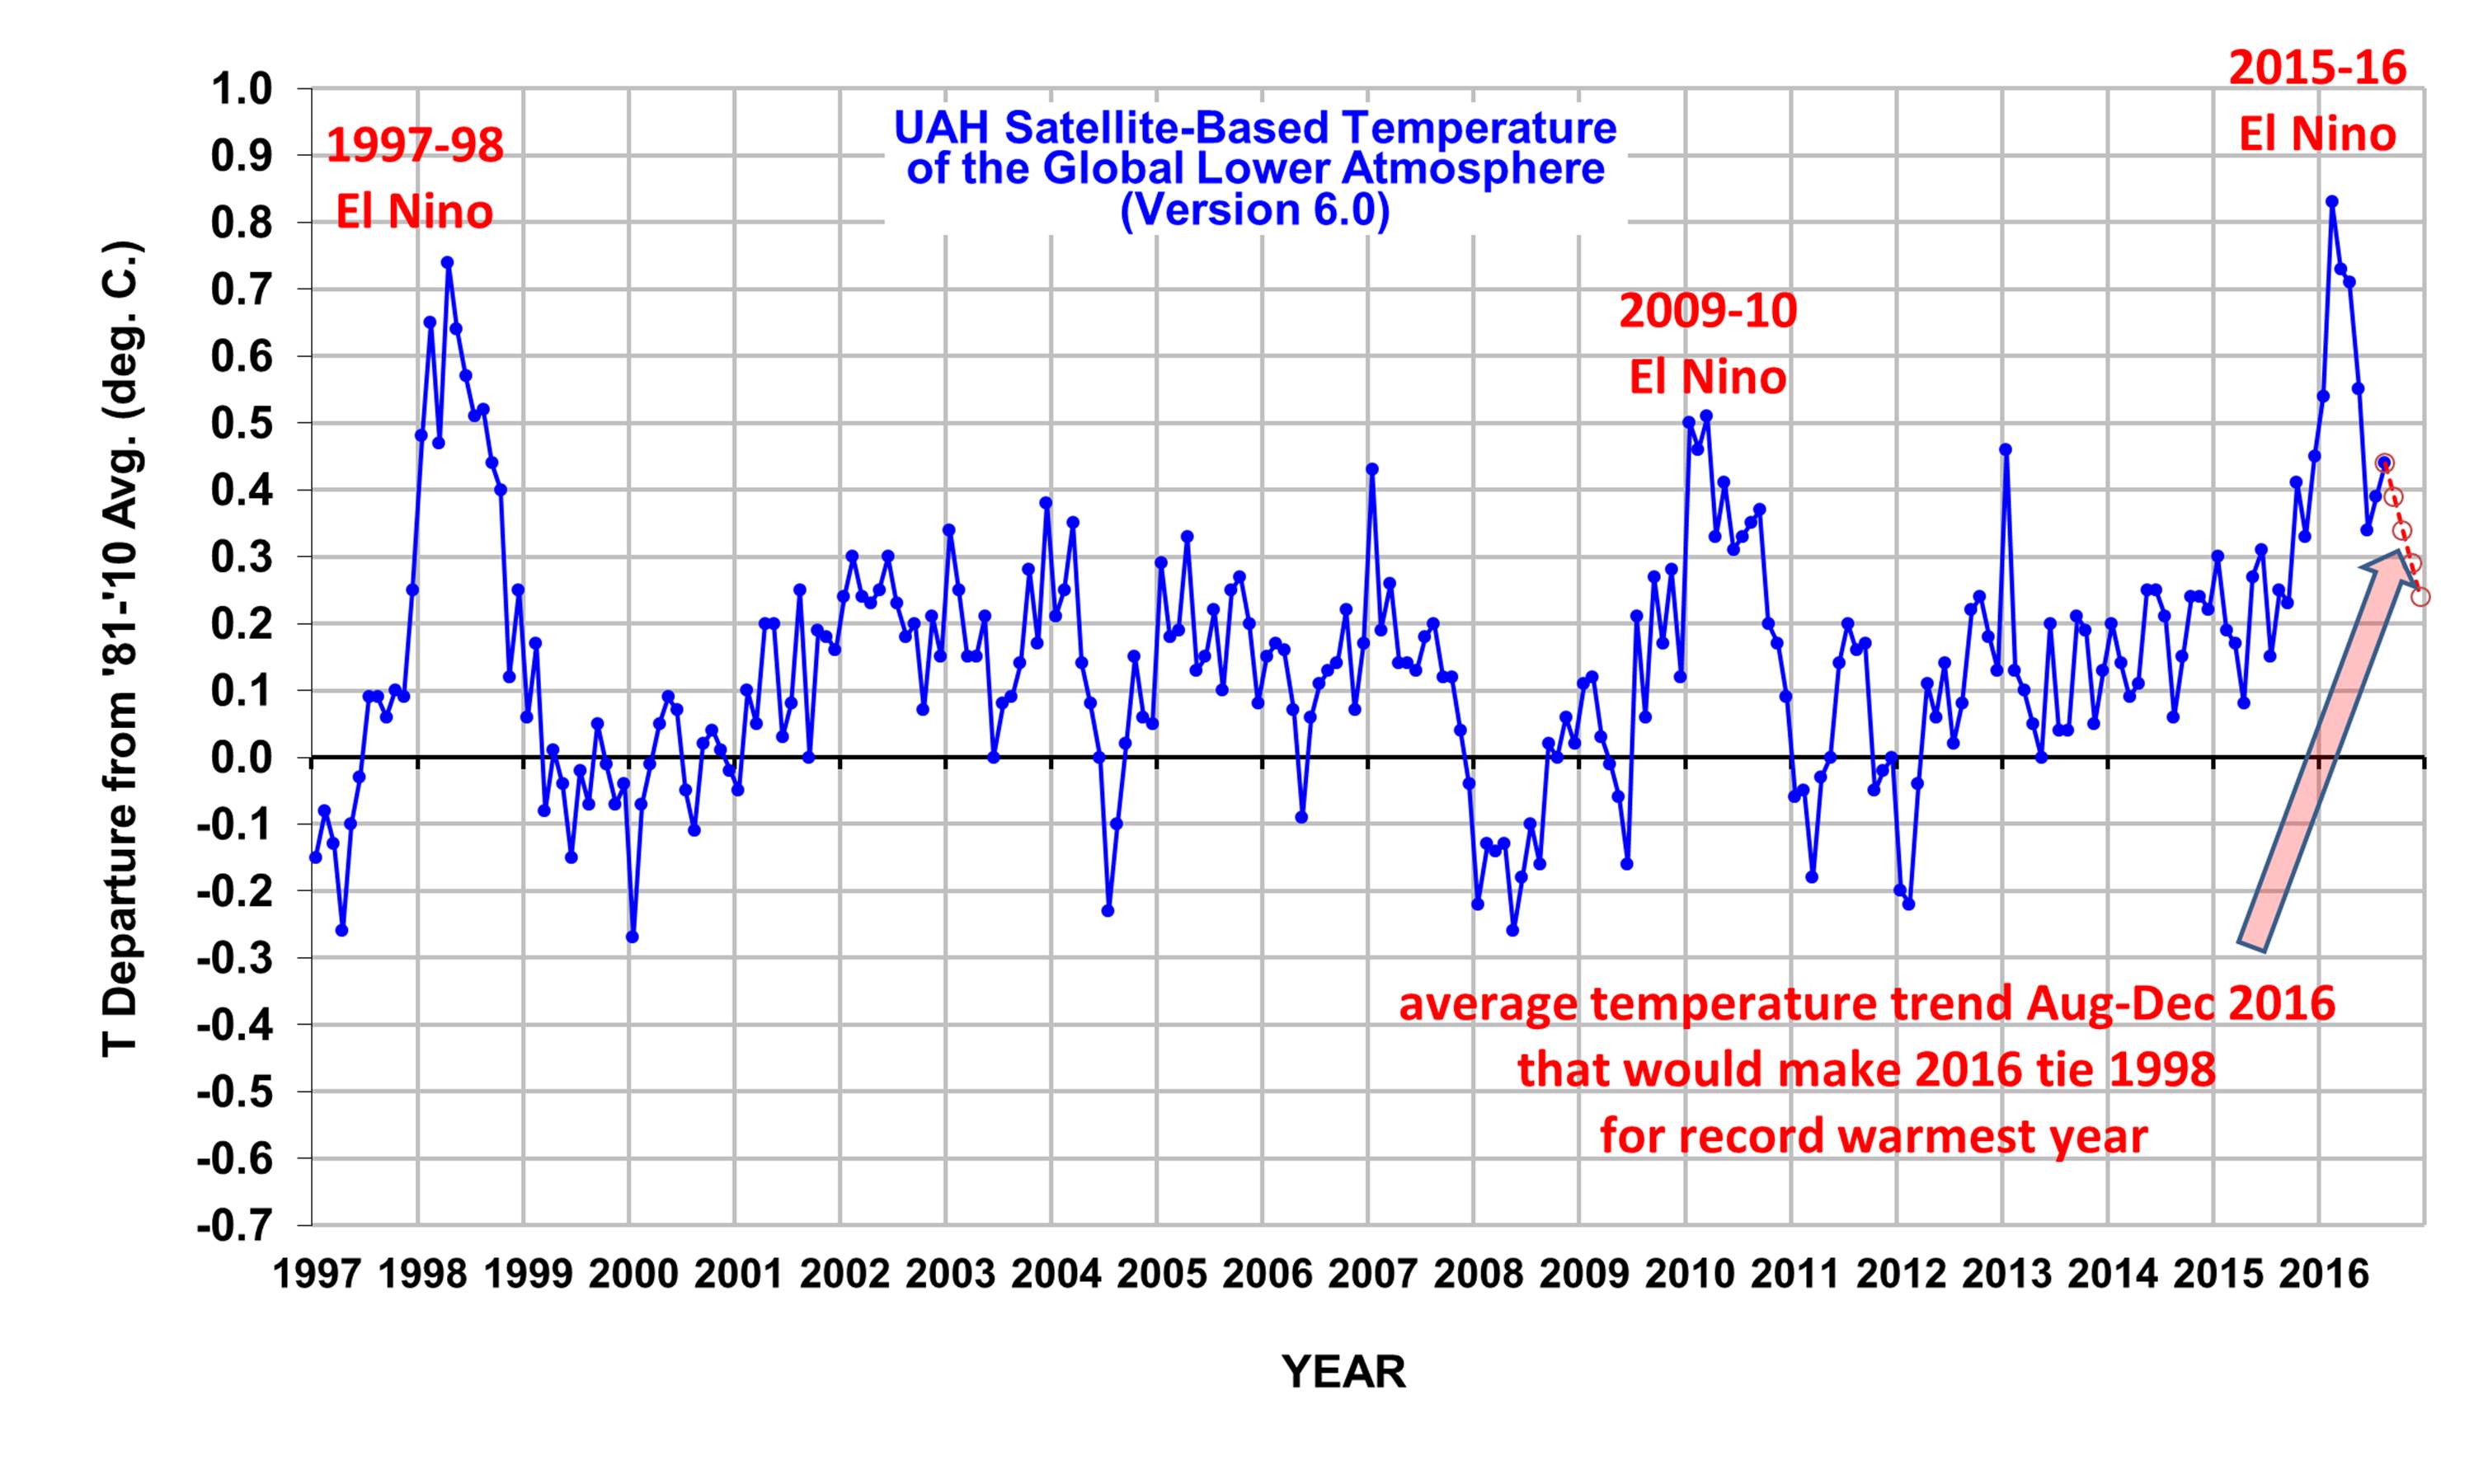
Based upon this chart, as we enter the home stretch, it now looks like a horse race to see whether 2016 will or won’t exceed 1998 as a new record-warm year (since the satellite record began in 1979).

The “official” UAH global image for August, 2016 should be available in the next several days here.

The new Version 6 files (use the ones labeled “beta5”) should be updated soon, and are located here:

Lower Troposphere: http://vortex.nsstc.uah.edu/data/msu/v6.0beta/tlt/uahncdc_lt_6.0beta5.txt
Mid-Troposphere: http://vortex.nsstc.uah.edu/data/msu/v6.0beta/tmt/uahncdc_mt_6.0beta5.txt
Tropopause: http://vortex.nsstc.uah.edu/data/msu/v6.0beta/ttp/uahncdc_tp_6.0beta5.txt
Lower Stratosphere: http://vortex.nsstc.uah.edu/data/msu/v6.0beta/tls/uahncdc_ls_6.0beta5.txt


906 Responses to “UAH Global Temperature Update for August, 2016: +0.44 deg. C”

Toggle Trackbacks

  1. Olof R says:

    I think we have a new 12 month running mean record!!

    • Tim Folkerts says:

      Roy,

      Speaking of “running average”, it always seems a bit odd to do a 13 month running mean. For August, both the February before and the February after get counted. It would seem more “accurate” or “correct” to weight the 1st and 13th month half as much as all the others.

      For global temperature anomalies like this, it is not such an issue. But for something seasonal you would introduce a spurious signal with a period of 1 year. For example, the 13 month centered average temperature anywhere in the US will almost always be below average in July because January gets counted twice.

      • David Appell says:

        Roy, I’ve wondered about the 13-month moving average too. What’s your reasoning on that? Thanks.

        • It’s just a time-averaged (low-pass filtered) version of the original time series, and allows easy plotting on the same monthly time series. As Olof said, one could do a 12-month centered average and somehow plot it in between the months. 13 months has no special climatological significance.

          • Christopher Game says:

            Somehow I too feel it would be nice to half-weight the first and last of the thirteen-month average.

            I think the reason for 13 as the length of the average is to remove annual cycling? I don’t see the 12 or 13 months as primarily to low-pass filter or smooth.

            As Dr Spencer points out, a 12-month average would shift the Centre by half a month; a bit untidy. A 13-month average tidies that up.

            The effect of the extra month of weighting is slightly to smooth as well as to remove the annual cycling. I don’t see any particular reason to do such a smoothing, slight though it is. The half-weighting would remove that slight extra smoothing.

          • Christopher Game says:

            Reading further, I learn from Dr Spencer that the series has no annual cycle component? Does this mean that each point is an anomaly from its own month?

          • Christopher Game says:

            If there is no annual cycling in the anomalies, then the purpose of the filter is purely for smoothing?

          • Christopher Game says:

            If the purpose of the filter is purely to smooth, and from the annual cycle viewpoint, any smoother is fine, I wonder why a uniform weighting is used for the moving average. Surely a more natural smoother would use binomial weighting?

      • Olof R says:

        Yes, 13-month averages doesn’t make climatological sense. It’s only for those who are to lazy to make a separate set of x-values for the graphs. The correct time for centered 12-month running means fall right between those of single months..

        BTW, the 12 month running mean is 0.496 C right now, whereas the highest in 1998 (the full year) was 0.484

      • Tim, these are anomalies. They have no seasonal cycle…it’s been removed. You can do time averages of the data any way you want: 3, 4, 5,..11, 12, 13,…59, 60, 61 months. They all are fine.

        • Tim Folkerts says:

          Yes, by plotting the anomalies the problem mostly disappears. Still, a “one year” moving average just somehow feels “right”.

        • Olof R says:

          It is quite common with drifts in the climatology, resulting in an increasing seasonal variation in the anomalies. This can be seen in SST datasets:

          http://www.woodfortrees.org/plot/hadsst3gl/from:2000/mean:3

          I think that there is some seasonal variation in the TLT anomalies as well. At least it becomes clearly visible in graphs showing the difference between various satellite datasets, or satellites vs radiosondes, although the base periods are the same.
          A 12-month smooth is a good remedy for seasonal variations..

      • Gordon Robertson says:

        @Tim Folkerts…”Speaking of running average, it always seems a bit odd to do a 13 month running mean”.

        Tim…will you please stop getting hung up on the math and look at the graph. In engineering we were taught to do visual averaging of graphs. Just look at the graph from 1998 till present and the red running average falls right where you’d expect it to be, except right at the end where it’s waiting for EN to make up its mind.

        Fill in the peaks and valleys visually, not on the graph above but on the main page. Then the red line males sense.

  2. Warmest year Evahhhhh! Here we come!!!! Not!!!!!! Global temps vary on a year to year basis! Get used to it! It’s the long term trend that matters! Obviously you alarmists are too blind too even notice that! Peace out yall!!!

      • Dave says:

        Interesting. I’d be interested to hear Roy’s view of the basis for the disparity between the two MT data sets: The RSS team make quite a big deal over using a method in V4.0 that more accurately removes intersatellite differences due to drifting local measurement times than V3.x

      • Climatechange4realz says:

        ToneB

        Okay yes maybe the past 38 years or so of the satellite era have caused warming. The question you have to ask your self is what caused that warming? Hmmmmmm let me think…….. Oh I know! What about that big bright object that gives us light every day and controls the seasons?! Or if your stupid enough you would think that the 0.04 % of the atmosphere will do the trick

        • David Appell says:

          In what way is the sun responsible for modern warming?

          • Lewis says:

            David,
            A simple mental experiment will answer your question: Remove the sun and see how warm earth remains.

          • Aaron S says:

            Dave it could be increases in aolar activity from the 1905 G-minimum to the sustained maximum that ended about 2000, which strengthened the sun’s magnetic field. This of course may have led to decreased galactic cosmic ray intensity that reduced average cloud albedio. Plus a simple lag related to ocean circulation to explain the poor correlation as of late.

            Could be increases in GHG.

            It also could be a lag to the peak orbital forcing related to internal momementum in the climate system. Dont forget 1. Orbital forcing is not perfectly in phase with climate and 2. Last interglacial sea level was 6m higher… so we dont exactly know the natural peak in elevation or timing to this interglacial or if there is some resonate harmonic in the system.

            Or random noise.

            Or some combination of any of the above.

          • It’s called solar cycles. Do you live under a rock Mr. Apell or are you just playing dumb with me? Ever heard of the dalton minimum or the Holocene maximum? Do the research!

          • David Appell says:

            Lewis, I asked how the Sun is responsible for the ADDITIONAL warming seen in the 20th century and the first two decades of the 21st.

          • David Appell says:

            Aaron: Could could could could could.

            Do you have any proof of these conjectures?

            Do any of them make CO2 less of a greenhouse gas?

          • Aaron S says:

            Pnas 9400 yr cosmic ray record correlated with asian monsoon. This strong correlation is not global climate but the Asian monsoon is a large system and dominated by cosmic rays.
            http://m.pnas.org/content/109/16/5967.full

            Nature. This paper shows the climate sensitivity to CO2 feedbacks likely has been exaggerated by IPCC models. So i dont disagree doubling co2 is about 1 degree C warming, but the feedbacks that dominate the warming in models are rather speculative. This is CERN by the way. Also shows CR do increase clouds. As they say-
            “This could raise the baseline aerosol state of the pristine pre-industrial atmosphere and so could reduce the estimated anthropogenic radiative forcing from increased aerosol-cloud albedo over the industrial period.”

            http://www.nature.com/nature/journal/v533/n7604/full/nature17953.html

            Video
            https://cds.cern.ch/record/2154271?ln=en

            Pnas paper showing causation that cosmic rays force global climate in multi annual time intervals and a century of correlation
            http://m.pnas.org/content/112/11/3253.full

            So proof is a difficult burden in science, but the uncertainty in models is growing. It will be interesting to see if during this La Nina model predictions are all overestimating measured temperature.

            ALSO, WHEN DATA COMES OUT THIS IS WHEN DAVE STOPS RESPONDING…

          • Aaron S says:

            Seriously this is like 3rd time Dave goes away after i post data. It could be random as this happens to anyone, but id like to hear the counter argument. There is not good reason to ignore galactic cosmic rays in some itterations of models and the sensitivity to ghg is likely exaggerated bc cloud errors. Its time for an update.

          • Sun Spot says:

            David Appell, you said “I asked how the Sun is responsible for the ADDITIONAL warming seen in the 20th century”. NATURAL CLIMATE VARIABILITY say’s their has been no un-natural ADDITIONAL warming seen in the 20th century. The premise for your warming fears are unfounded David.

          • Toneb says:

            So natural climate variability is increasing the energy stored in the oceans (~93% of all the climate system energy) and causing the energy imbalance at the TOA.
            Some kind of magical climate variability is it?
            That gets it’s energy out of thin air?

            How pray does it do it with a declining TSI and (if) no increasing GHE?
            Where’s that energy coming from at the Earth’s surface and why is it not leaving as quickly as it arrives??

          • Aaron S says:

            Toneb Id really like to have this discusion but im not sure what ocean temp data set or literature you are talking about. Can you share?

            Oceans obviously store heat. The intake and output of that energy can have significant lags. ENSO, PDO, or AMO are all couplets of energy storage and release. Longer lags exist also for example, 100 to 1000 yr current lags are used to explain the lack of warming in the Antartic and there are major lags in natural climate change. So yes current patterns of reducing solar activity can not explain warming, but lags are a 2 way street. The solar peak from 1950 to 2000 was a monster, do you exclude that the heat was stored in oceans and is released later?

            http://oregonstate.edu/ua/ncs/archives/2015/apr/researchers-find-200-year-lag-between-climate-events-greenland-antarctica

        • Mark B says:

          If only the climate scientists had thought to consider the “big bright object.” You’ve done it Climatechange4realz, AGW theory is now debunked.

          • Aaron S says:

            Does IPCC count as scientists? Bc they only consider TSI not UV or Magnetics for the sun. Physics is more complicated than they suggest and the literature is getting overwhelming this isnt valid. Magnetics influence climate even near equator.

          • Just goes to show you don’t have to be a climate scientist to debunk man made global warming!

          • Toneb says:

            “Just goes to show you dont have to be a climate scientist to debunk man made global warming!”

            I’m sure the psychology behind that bizarre statement eludes you.

    • Gordon Robertson says:

      @climatechange…”Warmest year Evahhhhh! Here we come!!!! Not!!!!!!…”

      Even if it was, by how much, a couple of hundredths of a degree C?

      • Toneb says:

        Would you expect any more on a year by year basis?
        And if so, why?

        You do realise global temp only varied by 3C either side of a mean between the last IA and the present (before modern warming) interglacial?

        Try thinking about that – If you really want to that is.

        • Aaron S says:

          Tone B. The 3 degrees C number you cite is from ice core data? Certainly ice core proxy has a significant smoothing effect for even century scale variability, so i dont think it makes a valid direct comparison. Also, if that is true then why was sea level 6m higher during the last interglacial? Im seriously unclear if it was warmer 120k yr ago or if it is duration and feedbacks that cause the transgression.

  3. An Inquirer says:

    Wow! that is a fast release of the previous month’s anomaly!

  4. Just wait! Three years from now you fools will be crying your eyes out because I was right all along!

  5. An Inquirer says:

    Probably not enough hurricanes and typhoons to cool the oceans. 🙂

  6. johnd says:

    And isn’t this now also the longest period (53 months) in the satellite record of unbroken positive deviations from (the current version of) the 1981-2010 global mean?

    • dave says:

      “…in the satellite record…”

      In the RSS series, the 94 months from February 2000 to December 2007 were positive, except for July 2004 which spoiled things by being -0.01 C.

      • johnd says:

        Fair enough. ‘in this satellite record’ shall we say. Each data series obviously has its own characteristics, which is going to shift the mean baseline a little, one way or the other. I guess this is where differential corrections over time of one sort and another come in.

        But certainly, 94 months is a pretty long period. What length of positive deviation is RSS currently up to? And slightly curious as to why UAH and RSS are significantly different over this period. UAH looks by eye to have an overall mean of +0.1 to +0.2 over the 2000-2007 period but there are multiple excursions into negative territory during the period.

  7. mpainter says:

    Both hemispheres and the tropics warmed.
    The CPC puts La Nina chances at 55-60% by winter. The “weak” La Nina forecasts seem to based on the “neutral” ENSO conditions that presently predominate. This will change, of course. It is in fact a question of the depth and duration of the incipient La Nina. Is Ma Nature up to her usual impish tricks?
    La Nina can be expected to materialize by the end of this year. Tell ’em you heard it first at Dr. Roy’s blog.

  8. Preliminary Global Forecast System based daily global temperature anomaly estimates from the University of Maine Climate Change Institute indicate a preliminary monthly average of 0.41C for August 2016, up from 0.38C in July. The WeatherBELL CFSR preliminary August 2016 estimate is 0.42C, up from 0.38C in July.

    I posted a graph of monthly estimates since 2014 from these two sources and UAH through August, as well as several other major sources through July here:
    https://oz4caster.wordpress.com/2016/09/01/global-temperature-august-2016-preliminary/

  9. David Appell says:

    This makes the last 12 months the warmest 12 months in the UAH LT record(*).

    (*) Assuming there are no big changes when the pre-2015 numbers are published.

    • mpainter says:

      Spike hype.

      • David Appell says:

        It’s also the warmest 5-yr period (60 months) in UAH’s LT record, the warmest 10 years, the warmest 15 years and the warmest 30 years.

        • mpainter says:

          Yep, ain’t it wonderful. Enjoy it while it lasts.

          • David Appell says:

            Is CO2 going to suddenly cease being a greenhouse gas?

          • mpainter says:

            CO2 has long been of no account in the GHE, as it is redundant to atmospheric water vapor and clouds in its radiative properties. But it makes wonderful plant food.

          • David Appell says:

            “CO2 has long been of no account in the GHE”

            You’re always good for a laugh, painter.

          • mpainter says:

            No joke, CO2 is redundant to atmospheric water. Its absorbed wavelengths are already about 85% thermalized by clouds and water vapor. In other words, remove the CO2 from the atmosphere and no change in climate, anywhere. Except Antarctica, where it would be warmer in the antipodal winter (a recent study has concluded that CO2 cools under the prevailing conditions there). Try not to get too upset.

          • David Appell says:

            “In other words, remove the CO2 from the atmosphere and no change in climate, anywhere.”

            Let’s see what the science says:

            Atmospheric CO2: Principal Control Knob Governing Earths Temperature, Lacis et al, Science (15 October 2010) Vol. 330 no. 6002 pp. 356-359
            http://pubs.giss.nasa.gov/abs/la09300d.html

          • mpainter says:

            Quite simple, David, just stay away from the CO2 knob.

          • David Appell says:

            The world is turning the CO2 knob about as fast as it can.

          • David, do you realize that the 400ppmv of co2 makes up only .04 % of the atmosphere? Co2 is not the main driver of climate change and it never will be. Even if co2 were to increase indefinitely the warming affect from it actually decreases because the rate at which its spewed out increases the rate at which total co2 is absorbed. See Murray Salbys latest vid for further details.

          • It amazing how brainwashed people (you) think compared to people who actually take the time to do the research and find the real facts (me) isn’t it mr Apell?

          • Anyways I’m done wasting my time here! Peace out everyone!

          • Lewis says:

            More CO2.
            I want it warmer. Let the Yankees stay in the north and if there’s less snow and ice up there (not to mention less taxes) they will.

          • SkepticGoneWild says:

            From 8000 years ago to the 19th century, ice core records records indicate a general cooling, plus wild swings in both warming and cooling temperatures that exceed the scope of the modern warming period, all while CO2 values rose from 260 to 280 PPM. Bummer. No GHE evident.

          • David Appell says:

            Lewis says:
            “I want it warmer.”

            About 3 B people live in the tropics.

            Do their feelings on the subject matter?

          • mpainter says:

            They want air conditioning and refrigeration, indoor electric conveniences and that means power generation. And that’s why the tropical countries are sniggering at COP21. David.

          • David Appell says:

            Who are you to speak for them, painter?

            No one, that’s who.

          • mpainter says:

            Oh, they speak for themselves, and they do not clamor for windmills. There is no confusion or warped priorities in the tropics.

          • Rob Honeycutt says:

            I’m amazed there are people here that are STILL rejecting CO2 as a contributor to the GHE.

          • yes, it seems to be a tradition here.

          • mpainter says:

            If CO2 contributes 3% of the GHE, according to one study, that is negligible. TOA CO2 spectrum shows that it mostly originates in the _stratosphere_. What does that tell you?

            The question is: what does CO2 add to water vapor and clouds in regard to the GHE? If it’s contribution is negligible, then doubling it brings negligible effect.

    • Toneb says:

      “all while CO2 values rose from 260 to 280 PPM. Bummer. No GHE evident.”

      Mmmm, lets figure.
      That’ll be a 7.7% increase.

      From 280 to 400 ….. that’ll be a 40% rise.

      Bummer.
      The GHE very much happening.
      And all against a background trend of what (should be) falling global temps.
      Hint the MC’s say so.

      • SkepticGoneWild says:

        Hello! McFLy! Temperatures FELL while CO2 increased.

        • Toneb says:

          Only down the Denier rabbit-hole they did.
          Waste of time linking evidence…

          It’ll either be:
          Not according to Sat temp data
          …. err, Oh, sorry UAH anyway (used to be RSS until they cooked the data).
          Giss is faudulent.
          The GHE goes against the 2 LoT.
          LWIR cannot warm the oceans.
          It’s the Sun
          It’s El Nino.
          The next IA is coming
          Still recovering from the LIA
          Glaciers are growing
          The MWP was warmer
          It’s happened before
          Co2 is only 0.4% of the atmosphere
          Greenland was green
          Arctic ice has recovered
          CO2 was 3000ppm in the Eemian
          There’s no tropospheric hot spot
          CO2 effect is saturated
          Mauna loa is on a volcano
          We’ve had record cold and snowfall in the US
          The world was warmer in the 1930’s
          It’s internal variability
          CO2 follows temp not leads
          97% consensus on human-caused global warming has been disproved

          Oh and the classic (favoured current meme)….

          CO2 is plant food

          + many many more

          • mpainter says:

            The biosphere expands under warming and contracts under cooling. Warming is life, cooling is death. Atmospheric CO2 is entirely beneficial, the more the better.

  10. RAH says:

    As long as Gavin has surface temperature data to fool with it will be declared the warmest evah no matter what the satellite data says.

  11. Nate says:

    FYI FOLKS,

    Though the annual record will be close, we’ve just broken the UAH record for periods of:

    24 mo. by .07 C

    36 mo. by .09 C

    48 mo. by .09 C

    60 mo. by 0.04 C

    • mpainter says:

      More spike hype. These types just can’t help themselves.

      • Nate says:

        Downward spikes are not breaking any record lows–funny how spikes on top of trends work.

        • mpainter says:

          You have seen your last big El Nino spike for 15-20 years, if the past is any indicator. With La Nina around the corner it’s adios “trend”. I expect the pause to continue until it starts to cool.

          But hopes dies hard, I understand. Go ahead and hype the spike, if it’s any comfort to you.

        • Nate says:

          Oh those pesky spikes, meddling with my plans for global cooling…(in the voice of Scooby Doo bad guy).

          • mpainter says:

            Cooling is a killer. Warming boosts the biosphere. CO2 provides the nourishment.

          • David Appell says:

            mpainter says:
            “CO2 provides the nourishment.”

            Wrong — the nutritional value of plants depends on their nitrogen uptake, not their carbon uptake.

            “Increasing CO2 threatens human nutrition,” Samuel S. Myers et al, Nature 510, 139142 (05 June 2014).
            http://www.nature.com/nature/journal/v510/n7503/full/nature13179.html

          • David Appell says:

            Higher CO2 tends to inhibit the ability of plants to make protein And this explains why food quality seems to have been declining and will continue to decline as CO2 rises because of this inhibition of nitrate conversion into protein.

            University of California at Davis Professor Arnold J. Bloom, on Yale Climate Connections 10/7/14
            http://www.yaleclimateconnections.org/2014/10/crop-nutrition//2014

            BLOOM: Its going to be fairly universal that well be struggling with trying to sustain food quality and its not just protein its also micronutrients such as zinc and iron that suffer as well as protein.

          • mpainter says:

            A little help for you David:

            “Photosynthesis is a process used by plants and other organisms to convert light energy into chemical energy that can be later released to fuel the organisms’ activities (energy transformation).”

            Life is about energy, David. Making protein takes _energy_. Go read up on photosynthesis. Learn about ATP. Don’t allow yourself to be fooled by alarmist science, lest you wind up thinking that CO2 is bad for plants.

          • David Appell says:

            You wrote:

            “CO2 provides the nourishment.”

            That’s wrong, as the experts I quoted say.

            Total protein and nitrogen concentrations in plants generally decline under elevated CO2 atmospheres. Recently, several meta-analyses have indicated that CO2 inhibition of nitrate assimilation is the explanation most consistent with observations. Here, we present the first direct field test of this explanation.. In leaf tissue, the ratio of nitrate to total nitrogen concentration and the stable isotope ratios of organic nitrogen and free nitrate showed that nitrate assimilation was slower under elevated than ambient CO2. These findings imply that food quality will suffer under the CO2 levels anticipated during this century unless more sophisticated approaches to nitrogen fertilization are employed.

            Nitrate assimilation is inhibited by elevated CO2 in field-grown wheat, Arnold J. Bloom et al, Nature Climate Change, April 6 2014.
            http://www.nature.com/nclimate/journal/vaop/ncurrent/full/nclimate2183.html

          • mpainter says:

            David,
            You take the position that only the gluten (protein) contained in the wheat derived foods provides nourishment. This is false.

            Bread flour gluten: 12-14%
            All-purpose flour gluten:10-12%
            Cakes, cookies, pastries flour gluten 8-10%

            The rest is starch, which provides 80-90% of the nourishment contained in wheat flour.

            Your problem David is that you hooked on alarmist hype.

          • mpainter says:

            Oh, yes, I forgot durum wheat. This wheat variety has the highest protein content of all the wheat varieties (16%), but it is not bread quality gluten as it lacks the property of elasticity. Durum semolina is used for making pasta products.

            So, if you like gluten, eat more pasta.

          • David Appell says:

            “You take the position that only the gluten (protein) contained in the wheat derived foods provides nourishment.”

            Hardly. The question is not about current concentrations, it’s about changes in the future under higher CO2.

            I’ll go with the experimental findings.

          • mpainter says:

            Quoting David from above:

            “Wrong the nutritional value of plants depends on their nitrogen uptake, not their carbon uptake.”

            ###

            David, you never seem mindful of your credibility

          • David Appell says:

            I’ve noticed you turn to insults when you are losing on the science.

          • mpainter says:

            No insult, but a fact. Others can see it, too. You are notorious, David.

          • Lewis says:

            David,
            One can suppose the function of plants is to feed people. Not so – it is to pass on their DNA. Further, a lower concentration means what? We are not told as far as I read. Also, the writer recommends GMO’s to adjust for the problem, but the radical leftists abhor GMO’s. What to do?

            Actually there is no problem. Plants grow better with more CO2 for 2 reasons. More food is available and they have to transpire less water to get the CO2.

            Those who depend upon them for food will adjust, as we always have. However, your argument points out the hypocrisy of the AGW crowd.

            Warm weather is better for plants and animals – notice how many don’t live in ice and snow. Yet the AGW crowd opposes more CO2 which they credit for the, oh so slightly, warmer climate. Instead they want colder, which is bad for mankind, among other creatures.

            Now, since CO2 supposedly lowers the amount of nutrition in plants, we have an opposing reason to decry CO2 – it causes man not to be fed as well.

            Well David, which one is it? Do you want mankind to freeze to death or starve to death. Make a decision.

          • SkepticGoneWild says:

            Record wheat yields……bummer.

          • David Appell says:

            SkepticGoneWild says:
            “Record wheat yieldsbummer.”

            Many factors determine yields, not just one (obviously).

            For wheat, maize and barley, there is a clearly negative response of global yields to increased temperatures. Based on these sensitivities and observed climate trends, we estimate that warming since 1981 has resulted in annual combined losses of these three crops representing roughly 40 Mt or $5 billion per year, as of 2002.
            — Global scale climatecrop yield relationships and the impacts of recent warming,” David B Lobell and Christopher B Field 2007 Environ. Res. Lett. 2 014002 doi:10.1088/1748-9326/2/1/014002
            http://iopscience.iop.org/1748-9326/2/1/014002

          • David Appell says:

            “We also find that the overall effect of warming on yields is negative, even after accounting for the benefits of reduced exposure to freezing temperatures.”

            — “Effect of warming temperatures on US wheat yields,” Jesse Tack et al, PNAS 4/20/15
            http://www.pnas.org/content/early/2015/05/06/1415181112

          • mpainter says:

            Your studies were conducted under drought conditions and attributed yield decline to higher temperature instead of low soil moisture. Dishonest science is performed by dishonest scientists, David, thanks for your examples.

          • mpainter says:

            “Our results also indicate that warming effects would be partially offset by increased rainfall in the Spring. Finally, we find that the method used to construct measures of temperature exposure matters for both the predictive performance of the regression model and the forecasted warming impacts on yields.”

          • mpainter says:

            The abstract of the other says it was based on “precipitation”.

          • David Appell says:

            mpainter says:
            “Your studies were conducted under drought conditions….”

            Where do they say that?

            Are you familar with the 20-yr history of FACE experiments?

          • mpainter says:

            David, record wheat harvests worldwide this year. Record corn and soybean harvest in the US forecast.

            Do you ever feel like giving up?

        • Nate says:

          Seriously though, I don’t think you understand what a trend is:

          “With La Nina around the corner its adios trend’

          A long term trend is not destroyed by a downward spike. There will always be a return to the short-term mean, on top of any trend.

          • mpainter says:

            “A long term trend is not destroyed by a downward spike”.
            ###
            Do imagine La Nina to be a “downward spike”?

          • Nate says:

            In the sense that El Nino is an upward spike- yes more or less. You dont see it that way?

          • crakar24 says:

            Look at the size of these numbers:

            24 mo. by .07 C

            36 mo. by .09 C

            48 mo. by .09 C

            60 mo. by 0.04 C

            They look more like errors generated by instrument variability than “spikes”, lets not get too excited here fellas.

            cheers

          • Gordon J. Fulks, PhD says:

            Thanks to mpainter for pointing out the obvious about David Appell: “Others can see it, too. You are notorious, David.”

            Appell has been hawking the utter nonsense that more CO2 is harmful to the world’s food supply. That flies in the face of all sorts of research that shows huge improvements in the quantity and quality of crops grown with more CO2. The game Appell is playing (and he is always playing some game) has to do with all crops that grow better. They produce much greater quantity for a marginal reduction in some attributes PER POUND. Net quantity and nutrition are up when growing conditions (eg., CO2) improve.

            Farmers who grow tomatoes in greenhouses have long enhanced the atmosphere in their greenhouses with more CO2. They increase concentrations of CO2 from the ambient level of 400 ppmv to about 1200 ppmv.

            On another website where this question was raised, one of the commenters maintained that such levels would kill people. Appell dutifully supported her, even after it was obvious that she had mistaken carbon monoxide for carbon dioxide. That is the “notorious” David Appell.

          • David Appell says:

            Gordon Fulks wrote:
            “Farmers who grow tomatoes in greenhouses have long enhanced the atmosphere in their greenhouses with more CO2.”

            The real world isn’t a greenhouse, is it?

            Greenhouses allow tight control of temperature and water. That isn’t the care in the real world, is it?

            Anyone who talks about CO2 fertlization with including the associated changes in temperature and precipitation isn’t being serious.

          • mpainter says:

            Dutiful Support Appell

          • AndyG55 says:

            “The real world isnt a greenhouse, is it?”

            FINALLY…. the rotten appell speaks the truth !!!

        • David Appell says:

          mpainter says:
          “Your studies were conducted under drought conditions and attributed yield decline to higher temperature instead of low soil moisture.”

          Wrong, as is obvious to anyone who reads the papers.

        • wert says:

          Funny how people can talk endlessly on slow steady growth with little annual and decadal variation.

          Look at sea level gauges! It has been warming for a long time at a steady pace.

          Good! I like steady slow pace.

  12. Nate says:

    and its likely we’ll continually break the 60 mo record for at least the rest of the year….

  13. tolou says:

    Wow… 0.012K in 18 years. What is that in 100 years? Wait… 0.067K !?

    My, my…

    • Nate says:

      not sure how you got that…its certainly not the trend over last 18 years (9/98-8/16) That is .177 K per 18 years.

      • CoRev says:

        Nate, so we would continue with a <1K/century change? Why should we worry, again? It is slightly more than what we got this past century, and we can review the disasters it caused during that century.

        • Nate says:

          CoRev,

          You can look only at the troposphere record, however all of the surface records (where we live) agree that the trend has been ~ .17 k/decade for the last four decades.

          If you only focus on the land portion (again, where we actually live). The trend is more like 0.25K/decade and only on the Northern Hemisphere (where most people live) it is 0.3 C/decade. So it is considerably more than 1k/century. We are talking about 5 degrees F in a centuury. That becomes quite noticeable, and impactful.

          • Lewis says:

            It appears the anomaly will drop down to below .3C in the next few months, which is within the range of .1 to .3 that it has been for the past 15 years. Not much change. So where does your 5 deg F come from if the anomaly is holding steady?

            What the AGW crowd has is an imaginary problem in search of a dictatorial solution, which solution will harm more people than help.
            But religions are always that way. In fact, I see little difference between AGW radicals and ISIS radicals. One is a bit more honest than the other. Both of them suffer from desires for radical authoritarianism. Both defer to the revealed wisdom as handed down from above.

        • A 1K per century rate is perfectly consistent with an exponential growth curve matching the growth in CO2 measured by Keeling amounting to 2-3K by the end of the century. No-one is naive enough to extrapolate across a century and anticipate an exponential curve in a non-linear system. I have to wonder, then, why you feel comfortable doing so with a linear rate.

    • tolou says:

      I was referring to Olof R:
      “12 month running mean is 0.496 C right now, whereas the highest in 1998 (the full year) was 0.484”

      The darn Reply structure i a mess really.

  14. doctor no says:

    Mpainter: “You have seen your last big El Nino spike for 15-20 years, if the past is any indicator. With La Nina around the corner its adios trend. I expect the pause to continue until it starts to cool.”

    What a laugh! The puniest, weakest, smallest, La Nina for some time is going to remove the egg off your face!

    Wishing and hoping and thinking and praying / Planning and dreaming each night of his charms / That won’t get you into his arms..

  15. This period in time is in no way unique in the climatic history of the earth. In no way unique at all and a cooling trend going forward is now in the process of taken place which should last many years.

    It is hard to call a reversal but that is what I am doing sand I think that process is now happening.

  16. Dr. Mark H. Shapiro says:

    Looks like there is a “pause” in the record cooling Dr. Roy was predicting a couple months ago. Anyone want to place bets on the reason?

  17. Wim Rost says:

    There is a high anomaly of warm surface waters around the North Pole: https://earth.nullschool.net/#current/ocean/primary/waves/overlay=sea_surface_temp_anomaly/orthographic=-90.73,91.52,466

    In the same time cooler than normal surface waters are surrounding the South Pole: https://earth.nullschool.net/#current/ocean/primary/waves/overlay=sea_surface_temp_anomaly/orthographic=-89.18,-87.06,466

    It is a pattern I already see some months.

    I wonder what the connection between these two could be. If there is one.

  18. barry says:

    FYI, woodfortrees is updated and is now displaying UAH6.5 (Beta) data.

    • barry says:

      I had a longer post with caveats and stuff and slowly whittled it down sentence by sentence until it the website permitted the post above, one sentence long. I permit myself one whinge about the pecularities of the site per article. I broke nothing in my office, showing admirable restraint during this process.

  19. dave says:

    On August 8th Dr Spencer wondered:

    “Will we reach October 6 without a major (Cat3 or higher) hurricane strike [on the Continental USA]?”

    Which would be 4,000 days without such an incident.

    Hermione came ashore as a briefly Cat1. So the question is still open.

  20. dave says:

    “…briefly Cat1…”

    Cat1 for a while in Georgia also.

  21. Wow, am I glad mpainter was here a couple of months ago to tell us this couldn’t possibly happen.

  22. ren says:

    The range of the jet stream in the south should be a warning for the north. The temperature in winter can change very quickly. La Nina will surely come. No matter that low. El Nino also could not arise in 2014.
    https://earth.nullschool.net/#current/wind/isobaric/250hPa/equirectangular
    http://www.cpc.ncep.noaa.gov/products/analysis_monitoring/lanina/enso_evolution-status-fcsts-web.pdf

  23. David V says:

    I’m a layman so apologies for what may be a silly question: If we haven’t seen warming in 18 or so years, and 2016 is not as warm as 1998, does this suggest cooling? Thank you.

    • barry says:

      2016 is currently warmer than 1998 by the data set most favoured here – UAH6.5.

      1998 average = 0.484 C
      2016 average = 0.567 C

      Of course the year isn’t out yet? Does that make any difference to your understanding? Would it be significant if 2016 ended up 0.1C warmer than 1998? I don’t think so, except for the Punch and Judy show that is much of the climate ‘debate.’

      The trend since 1998 shows a slight warming, and will likely continue to do so from now on.

      The uncertainty in the trend analysis is huge for that period. My take is that using data since 1997/98 alone gives you no indication of what the true trend is.

      Any trend from 1997/98 in lower tropospheric temp data is so uncertain we can’t say it is cooling, flat or warming.

      More data is needed, temporally and from other metrics.

    • mpainter says:

      No, it is not cooling.

    • wert says:

      David V, don’t believe in drivel. There is a lot of climate drivel around, both here and elsewhere.

      The warming should be seen in a 30 year scope. One year is just one year, even 18 years of lacking significance is not yet much.

      What we know is that warming has not been worse than expected, but rather steady with some noise.

  24. Milty says:

    Nate said
    “If you only focus on the land portion (again, where we actually live). The trend is more like 0.25K/decade and only on the Northern Hemisphere (where most people live) it is 0.3 C/decade. So it is considerably more than 1k/century. We are talking about 5 degrees F in a centuury. That becomes quite noticeable, and impactful.”

    Aye. Yup. True

  25. ren says:

    Hermine did not want to get off the land. He has power in the Atlantic.
    http://www.weatherplaza.com/en-US/radar?region=NAM-SOE

  26. Dan Pangburn says:

    Thermalization explains why CO2 (or any other noncondensing ghg) has no significant effect on climate. (Kinetic theory of gases and a smidgen of quantum mechanics)

    Global average water vapor is increasing. This has a warming effect which is countering the on-going cooling effect of dwindling numbers of sunspots and declining average sea surface temperature (declining temperature phase of an approximation of the average of all ocean cycles).

    Sunspot number time-integral plus net of all ocean cycles plus effect of water vapor increase provides a 98% match to measurements 1895-2015 as shown at http://globalclimatedrivers2.blogspot.com which also shows a graph of water vapor (as Total Precipitable Water (TPW)) vs. time since it has been measured by satellite (1988). The graph was constructed using numerical data by NASA/RSS (link provided).

    Increasing water vapor increases the probability of heavy rain and flooding.

    Switching from coal to natural gas increases water vapor.

    • Exactly DAN, but these people will not accept data that runs counter to what they believe which in this case is AGW.

      They are in denial and are basing all of their rants on this current warmth which is nothing more then the latest spike of warmth in global temperatures which have been going on since the Holocene Optimum came to an end around 8500 years ago.

      Which I might add despite this spike and all the other previous spikes the overall trend in global temperatures since the Holocene Optimum has been a slow gradual downward trend.

      This warmth which is in the process of ending by the way, is in no way unique or different from previous spikes of warmth.

      The reason for the warmth is mainly extreme high solar activity which the data Dan has provided clearly shows.

      Then again if the data does not support what you wish for ignore it which is what the AGW crowd does over an over again.

      Worse yet when one views this current warm spell against past warm spells as shown by the historical climatic record this warm spell is a nothing event.

      The magnitude of this warm spell being weak ,rate of temperature increase being weak and duration being weak when viewed against past periods of warmth.

    • barry says:

      Global average water vapor is increasing. This has a warming effect

      If GHE is insignificant, how does this warming occur from water vapor?

      • Dan Pangburn says:

        Water vapor can condense. The other ghg do not condense in the atmosphere and the energy they absorb is thermalized. Water vapor is the only ghg that has a significant effect on climate. Water vapor is what causes the so called GHE making the planet warm enough for life.

      • barry says:

        ‘Thermalised’

        “You keep saying this word. I do no think it means what you think it means.”

        WV is a GHG. So is CH4. So CO2. They absorb and re-emit IR radiation. Their presence in the atmosphere serves to slow down the rate at which infrared radiation escapes to space.

        WV condenses much faster than CO2. Its presence in the atmos is determined mainly by the heat capacity of the air and the pressure, and is variable throughout the atmosphere. It evaporates and rains out readily. Its concentration responds to atmospheric changes. This is why it is considered a feedback, not a ‘forcing’ when talking about climate change. We could pump a trillion tonnes WV into the atmosphere in one go and it would rain out in a matter of days. Not the case for the billions of tonnes of CO2 we pump out yearly.

        • Dan Pangburn says:

          OK, you prefer the British spelling of thermalized, i.e. thermalised.

          Apparently you do not know what it means. It is correctly described at http://globalclimatedrivers2.blogspot.co It explains how terrestrial radiation warms the atmosphere.

          It is about 50,000 times more likely at sea level conditions that the energy in a photon absorbed by a CO2 molecule will be thermalized than the molecule will emit a photon. Quite the opposite occurs at very high altitude where the molecules are greatly spread out.

          You (and a lot of others) have been egregiously misled on how non-condensing ghg act in the atmosphere.

          Also, apparently you refuse to acknowledge that water vapor is increasing in the atmosphere. It is satellite measured and reported by NASA/RSS. The link to the data is ftp://ftp.remss.com/vapor/monthly_1deg/tpw_v07r01_198801_201607.time_series.txt which is Ref 11 in my blog.

          The perception that WV is a feedback and not a forcing is wrong and perhaps contributes to the “epic fail” of IPCC projections as pointed out by Dr. Roy at http://www.drroyspencer.com/2013/06/still-epic-fail-73-climate-models-vs-measurements-running-5-year-means. The GCMs will be useless until they correct this.

        • barry says:

          Also, apparently you refuse to acknowledge that water vapor is increasing in the atmosphere

          What gave you that idea? WV should increase as a result of warmer atmosphere –> greater capacity to hold water vapour. I am aware that its concentration has increased. Occasionally ‘skeptics’ try to argue that it has not (and therefore, they reason, AGW predictions have failed).

          Apparently you are unaware that water vapour concentrations respond to changes in temperature (and pressure). WV does not drive changes in the atmos, it responds to them. Its short residence time in the atmos (quick turnover) is why it is considered a feedback. Of course, its presence contributes to surface temps.

          • Dan Pangburn says:

            Of course I’m aware of the vapor pressure of water as a function of temperature. Any fundamental engineering thermodynamics textbook has a table if you are interested. The local water vapor level depends on several things. The low density of water vapor, compared to air, causes updrafts, etc. etc.

            “skeptics try to argue that it [WV] has not [increased]” It is really dumb to argue about something that can simply be looked up. I gave the link above.

            “WV does not drive changes in the atmos, it responds to them.” Both happen. Engineers call it feedback.

            The residence time, whether short or long, cancels out of the assessment. (The EPA got it wrong). What matters is the concentration level and it is increasing. The ghg effect depends on total precipitable water (TPW) not relative humidity.

            The resulting feedback increases the effect of the forcing resulting from increasing WV (from irrigation, etc. see my blog). CO2 has no significant effect on temperature because of thermalization. The only ghg that influences temperature is water vapor.

            Increasing water vapor is countering and perhaps preventing planet cooling (the equation predicts a downtrend even with the rising water vapor but its too soon to be certain). Preventing the next LIA (or perhaps the next glaciation) would be a good thing. On the down side, more water vapor means more rain (and snow) and the potential for more flooding. How much of recent flooding is simply bad luck in the randomness of weather and how much is because of the thumb on the scale of added water vapor?

            “WV does not drive changes in the atmos, it responds to them.” Treating WV as just a feedback is a fundamental flaw. The GCMS will continue to be worse than useless until they at least correct this.

          • barry says:

            Why is water vapour increasing in the atmosphere? As you agree that concentration increases with a warmer atmosphere, what is causing the the warmer atmosphere?

            (You seem smart enough to recognize the folly of positing WV is the cause of its own increase…)

          • mpainter says:

            Increased insolation due to reduced cloud albedo globally. That’s what increased wv.

          • Dan Pangburn says:

            barry – Why do you act like you don’t understand feedback?

          • barry says:

            Dan, are you saying that there is more WV in the atmosphere because the atmosphere has warmed due to more WV?

            This is as much as I can glean from your rhetorical response just above.

            If you believe that this is the case, then what is the limiter preventing a runaway effect here, do you think?

          • Dan Pangburn says:

            Barry Although I think a temperature rise from rising water vapor is stopped by cloud increase, if the feedback factor is less than 1, the limit is finite. I am using the engineering definition of feedback, as Bode, the originator of Feedback Control Theory, defined it. Climate scientists employ a somewhat different definition.

            I suspect that in a comparatively local area (equatorial Pacific), feedback contributes to El Nino spikes. The increasing water vapor leads to more clouds which reduce the solar heating of the water, terminating the spike. Then the water cools producing less water vapor. Feedback speeds the temperature decline. The ‘spike’ in global water vapor coincident with El Nino spikes corroborates this hypothesis.

        • barry says:

          The data you provided show a positive trend since 1988 (coverage = 60N – 60S).

          According to your thesis this trend is temporary and will balance out when albedo change from increased cloud cover overwhelms warming from increased WV.

          When do you suppose this occurs? What is your prediction?

          Surface temperatures have warmed since the beginning of the 20th century. Do you also attribute this to your WV/cloud radiative model? Does this suggest to you that the long-term cycles are on centennial scale?

          How do we test your theory for the long-term?

          • Dan Pangburn says:

            barry – 60N-60S covers about 85% of the planet and the 15% ignored is really cold so WV doesn’t change much. They call it global. Close enough.

            I think 3 of your 4 questions are good ones:
            “when” I’m working on it. I’m looking for numerical data for average global cloud cover measured by satellite.
            “prediction” I don’t have one . . . yet.
            “how test” Perhaps there is no test acceptable to science types. As an engineer, I would compare the prediction of Equation (1) expaned to include cloud effect on WV, with measurements.

            WV (TPW) is a recent change (about a month ago) to my model (Eqn (1) at my blog. The model contains two other factors with the combination achieving a 98% match with measurements 1895-2015. I expect it to falter in the future without an accounting for attenuation of WV increase. We are talking years, at least.

          • gbaikie says:

            — Dan Pangburn says:
            September 11, 2016 at 9:34 AM

            barry 60N-60S covers about 85% of the planet and the 15% ignored is really cold so WV doesnt change much. They call it global. Close enough.–

            And that 15% get less than 1 kW hour of sunlight on average
            day- rest of world get +4 kW hours on average day.
            Or the sunlight has little direct effect upon this 15% of
            the world.
            Or roughly this 15% related to direct sunlight is less than 5%
            perhaps around 1%- depending on what effects of sunlight you are concerned about.
            This leads to point, I think clouds in the tropics in general
            are most important aspect relating to global average temperature. Or 40% of the planet receives most sunlight and each square km of cloud has more effect in tropics as compared to elsewhere.
            Or the fastest warming Earth is a cloudless tropics. The entire Earth has to warm at slow rate, but a cloudless tropics is fastest way to warm entire Earth.
            Flip side if concerned about output rather than input, clouds outside the tropics do the most in terms retaining global heat. Or if on could have clearest tropics and cloudiest rest of the world- that would be the warmest world.

  27. Elliott Bignell says:

    DavidV – 1998 was a super el-Nino, previously the highest peak in the entire series. Picking that year very obviously introduces the strongest possible bias against a positive trend. A linear regression trend or best-fit across the whole series is the only defensible way to assess the trend for a non-specialist. Starting at 1998 amounts to a deliberate attempt at self-delusion.

    The trend across the whole set is strongly positive – about 0.14K per decade, if I remember correctly.

  28. Simple analyses [22] indicate that either an increase of approximately 186 meters in average cloud altitude or a decrease of average albedo from 0.3 to the very slightly reduced value of 0.2928 would account for all of the 20th century increase in AGT of 0.74 K. Because the cloud effects work together and part of the temperature change is due to ocean oscillation (low in 1901, 0.2114 higher in 2000), substantially less cloud change would suffice.

    FROM THE ARTICLE DAN SENT IN THE PREVIOUS POST.

    My point which is if prolonged solar activity changes the terrestrial items which determine albedo, cooling will be in the offing.

  29. Gordon J. Fulks, PhD says:

    Because Roy reports anomalies rather than actual temperatures, we lose sight of the much larger annual temperature cycle that the Earth goes through. That involves 2.5 to 3.0 degree C swings on a yearly basis. Roy has shown that the annual cycle normally peaks in July, occasionally in August. Hence, if we want to determine the warmest month in the satellite record, we need to compare the July and August anomalies in various years.

    http://www.drroyspencer.com/wp-content/uploads/UAH-v6-LT-thru-feb-2016-with-anncyc-1-550×330.jpg

    If we do that, 1998 is the clear winner. July and August 1998 had anomalies of 0.51 and 0.52 C respectively. The July and August 2016 anomalies were only 0.39 and 0.44 C.

    The earth’s record high temperature over the satellite era is still held by August 1998, by a significant margin. In contrast, the largest anomaly was this past February, when the earth was not as cool as it normally is in February.

  30. Bindidon says:

    Jesus! Again a comment dropped off the stream without you knowing why.

    Is that boring…

  31. Eric H says:

    Dr. Spencer,

    This from NOAA: “Outgoing Longwave Radiation (OLR) data at the top of the atmosphere are observed from the Advanced Very High Resolution Radiometer (AVHRR) instrument aboard the NOAA polar orbiting spacecraft. Data are centered across equatorial areas from 160E to 160W longitude. The raw data are converted into a standardized anomaly index. Negative (Positive) OLR are indicative of enhanced (suppressed) convection and hence more (less) cloud coverage typical of El Nio (La Nia) episodes. More (Less) convective activity in the central and eastern equatorial Pacific implies higher (lower), colder (warmer) cloud tops, which emit much less (more) infrared radiation into space. More information can be found at the Climate Prediction Center OLR page.”

    So, even though La Nina corresponds to cooler temperatures there are less clouds and less convection thus more SWIR hitting the oceans and less heat being carried away from the ocean surface so the oceans should warm. El Nino then would be the discharge of this heat from the ocean to the atmosphere causing warmer air temps and the extra cloudiness would aid in trapping this heat in the atmosphere causing the increased air temps. Obviously this variation in cloudiness trumps other forcings determining air temps.

    This would mean that the magic to CAGW is in ocean temps. Until we get good long term ocean temps how do we really know what CO2 is doing to our climate? Seems a bit pointless to argue over air temps…

  32. Vincent says:

    David Appell says:
    September 1, 2016 at 6:42 PM
    mpainter says:
    CO2 provides the nourishment.
    Wrong the nutritional value of plants depends on their nitrogen uptake, not their carbon uptake.
    Increasing CO2 threatens human nutrition, Samuel S. Myers et al, Nature 510, 139142 (05 June 2014).
    http://www.nature.com/nature/journal/v510/n7503/full/nature13179.html

    David Appell says:
    September 1, 2016 at 6:42 PM
    Higher CO2 tends to inhibit the ability of plants to make protein And this explains why food quality seems to have been declining and will continue to decline as CO2 rises because of this inhibition of nitrate conversion into protein.
    University of California at Davis Professor Arnold J. Bloom, on Yale Climate Connections 10/7/14
    http://www.yaleclimateconnections.org/2014/10/crop-nutrition//2014
    BLOOM: Its going to be fairly universal that well be struggling with trying to sustain food quality and its not just protein its also micronutrients such as zinc and iron that suffer as well as protein.
    ————————————————————

    David,
    This is an interesting subject which requires more attention and more research. One of my main criticism of the way climate science is promoted by the AGW alarmists, is the biased nature of the promotion which tends to exclude any positives of increased CO2 levels, and concentrates only on the imagined negative aspects.

    The fact that increased CO2 levels encourage increased growth of most crops and plants, to varying degrees, using the same amount of water and fertilizers, is a tremendous asset for humanity as a whole.

    This increased growth, which certain greenhouse farmers have been aware of for many decades, and have used the knowledge to increase their profits by pumping CO2 into their greenhouses, has largely been ignored by AGW alarmists until recent research has unearthed some apparently negative qualities to the increased growth, such as a lower percentage of protein in the food, and a lower percentage of certain essential elements such as zinc and copper.

    So let’s get this into perspective. I’ll use some general quantities to illustrate my logic. Let’s say a doubling of atmospheric CO2 results in a 30% increase in the weight of a carrot. Now that carrot might not have a 30% increase in protein and a 30% increase in the elements of zinc and iron, according to the research you linked to. However, the important issue is whether or not the total amount of zinc, iron and protein in the bigger carrot is less than the total quantities in the smaller carrot.

    In other words, what I suspect is true is that the bigger carrot might have only 10% or 15% or 20% more iron, zinc and protein. This is the sort of information we need.

    Now let’s say a poor, undernourished, half-starving person is offered a choice of 2 carrots. One is 30% bigger and heavier, but contains only 10-20% more zinc, iron and protein than the smaller carrot. Which carrot do you think would be more beneficial for the half-starving person?

    This is a subject which requires a new topic, but I wouldn’t expect Roy to start such a topic because it would involve agricultural techniques which I presume is not a part of Roy’s expertise.

    • barry says:

      One of my main criticism of the way climate science is promoted by the AGW alarmists, is the biased nature of the promotion which tends to exclude any positives of increased CO2 levels, and concentrates only on the imagined negative aspects.

      I always see both.

      Have you, for example, 2 news articles that ignore the benefits of enhanced CO2 while discussing the negative aspects (eg, soil nitrogen, changed weather patterns)?

      Two such articles would lend some credence to your claim. One such article, of course, could easily be an anomaly. If you really want to demonstrate that your impression is well-founded, a series of links to different articles would help.

      Otherwise, I think you’ve made that up.

      • Vincent says:

        I assure you that I don’t make things up from no evidence, except when I’m in a completely spiritual mode communicating with the Gods. (wink)

        All my comments are based upon research accessed through the internet. There are always conflicting opinions, so one has to make one’s own judment based upon one’s own mental capacity and background.

        I recall some time ago there was a detailed research article from the Australian CSIRO explaining the enhanced blooming of Australian deserts during the occaisional downpours of rain, as a result of CO2 increases.

        This article was later removed without explanation. I surmised that the reason was due to objections by the AGW alarmists. But of course, I don’t know. However, the fact that an article is removed without explanation should in itself be a cause for alarm.

        I’ve been investigating food production and agricultural methods for some time, and observing the effects on my own 5 acre property.

        The issue of nutrient content of modern food, compared with the food our ancestors ate, has been well documented. The problem results from the modern agricultural practices which are oriented towards the maximum production with the minimal cost.

        Such practices result in a depletion of soil fertility and a reliance upon artificial fertilizers. I think that most people are not aware that the major proportion of food that is grown, is not eaten. It’s the crop residue that is removed after harvesting. It’s often thrown away, or used for other purposes, such as feeding flowers in the gardens of suburban dwellers, (in the form of sugar can mulch or some other product).

        This crop residue should be returned to the soil, as well as our feces, in order to maximise food quality and food production.

    • David Appell says:

      Vinny wrote:
      “Lets say a doubling of atmospheric CO2 results in a 30% increase in the weight of a carrot.”

      Let’s not say that.

      First of all, higher CO2 doesn’t happen without an increase in temperature and change in precipitation patterns.

      How do those affect your carrot’s growth?

      The photosynthetic efficiency of a plant depends on temperature and precipitation. What if those shift?

      Higher CO2 means more weeds and more insects, and perhaps more diseases.

      How do those affect your carrot’s growth?

      Yields don’t just increase forever. For example, the yields of wheat and barley in Europe have plateaued since the early 1990s (Moorea and Lobell 2015). Why?

      • An Inquirer says:

        Your comment reveals a profound lack of knowledge of how agriculture works . . . how crops are raised. And of precipitation patterns. And what the world wide crop yields have been in the midst of increases in CO2 concentration.

        • David Appell says:

          C3 crops prosper from nitrogen assimilation, not carbon uptake.

          The benefits of carbon uptake diminish quickly, as has been seen in two decades of FACE experiments.

          Food quality actually diminishes with increasing CO2. And the higher temperatures CO2 creates is not what plants want, or alterations in precipitation patterns.

          • mpainter says:

            Higher temperature and lower soil moisture correlates with increased gluten content, as a percentage of the wheat berry. Lower temperature and higher soil moisture correlates with higher starch percentage. However, with increased moisture, the crop yield is increased, the higher starch content being the result of a surfeit of moisture and contributing most to the higher yields.

            It should be noted that wheat is usually grown under dry conditions, that is, soil moisture is not at high levels, such as the conditions that usually obtain in the great plains of North America.

            It can be concluded that the first priority of the wheat plant is to provide a minimum level of protein, in absolute terms, and when that requirement is met in the wheat berry, remaining growth capacity is directed toward providing the wheat berry extra starch. The starch not only supplies the energy for plant development, but is also essential for building cellulose and other types of tissue.

            So should David allow himself to be alarmed over variable protein/starch ratios in wheat? No, because such variation is commonplace, and it appears to be resolveable by increased fertilizer.

      • mpainter says:

        This year brought a hard red winter wheat record harvest, worldwide.

        Grind your teeth, David, because corn and soybeans are forecast at record levels in the US.
        Post links and stamp your foot, David. Call people denialists. That’s what you do well.

  33. don penman says:

    It has been quite a cool Summer here in Lincoln UK as I have measured it with few days much over 20 degrees centigrade and yet we are told that it has been warm by weather experts, they are trying to lead people into thinking that we had a warm summer just because we had a few warm days. What does it matter that you cant make accurate predictions if you can alter peoples perception of what happened by giving us increasing global temperatures. I think that having a cooler Summer could be as reliable an indicator of then having a cooler winter as anything else because we know that temperatures must fall now.

    • Toneb says:

      “they are trying to lead people into thinking that we had a warm summer just because we had a few warm days.”

      That’s correct it has been …..

      http://www.metoffice.gov.uk/news/releases/2016/summer-statistics

      A tip:
      It doesn’t require a long run of hot days for the summer to have been warm.
      There is the other side of the equation my friend.
      Higher overnight minima.

      And as for….

      “What does it matter that you cant make accurate predictions if you can alter peoples perception of what happened by giving us increasing global temperatures.”

      Just the usual swipe at an organisation that has to 24/7/365 make predictions of some of the most complex weather on the planet, and to boot, try to get that across to a inattentive public.

    • mpainter says:

      Toneb is retired from the MET, by his own confession, but he’s clammed up about it.

      But ” and to boot, try to get that across to a inattentive public.”

      So pay better attention, says Toneb, never daring to consider that the public has good reasons for ignoring the MET.

  34. ren says:

    Strong earthquake Ferndale, California on September 3, 2016.
    http://earthquake-report.com/2016/09/03/strong-earthquake-ferndale-california-on-september-3-2016/
    The increase in the level of lava in the volcano Kilauea as a result of strong geomagnetic vibrations.
    https://losyziemi.pl/wp-content/uploads/2016/09/Kilauea-Poziom-lawy-2016.09.02.jpg

  35. barry says:

    BoM has a series of charts covering the Nino regions 1-4.

    http://www.bom.gov.au/climate/enso/indices.shtml?bookmark=nino3.4

    Nino3 is the only region to have touched below -0.5C for a brief moment in the last week of July. Regions 1 and 4 have remained in positive anomaly this year to present. Region 2 went negative in April and has been in positive territory since the first week of July.

    Nino3.4, typically used for sea surface temps WRT to ENSO, has been negative since July, but not crossed -0.5C to date.

    BoM, for example calls an el Nino when the 3.4 region is 0.8C or warmer for 5 consecutive months, and la Nina at -0.8C or cooler for 5 consecutive months.

  36. barry says:

    The latest US CPC ENSO forecast gives 55-60% chance of la Nina forming over the coming months, and it will likely be a weak one if it does.

    http://www.cpc.ncep.noaa.gov/products/analysis_monitoring/lanina/enso_evolution-status-fcsts-web.pdf

    Similar to BoM outlook mentioned above.

    JMA gives 70% chance of la Nina forming over the coming months.

    http://ds.data.jma.go.jp/tcc/tcc/products/elnino/outlook.html

  37. The bottom line is(lol) that the historical climatic data renders this period in the climate as in no way being unique.

    That is the fact and these AGW enthusiast keep trying to show in vain that it is unique, but it is not. It is that simple and straight forward.

    Unless this period of time in the climate can rise above previous warm spikes they have no argument that this period of time in the climate is somehow unique.

    What is worse this spike of warmth is now in the process of ending. I have the guts to say it and if one can not say it before it happens what is the use of saying it.

    • David Appell says:

      “here is my prediction for climate going forward, this decade will be the decade of cooling.”

      – Salvatore del Prete, 11/23/2010
      http://ourchangingclimate.wordpress.com/2010/10/20/andrew-dessler-debating-richard-lindzen/#comment-8875

    • barry says:

      Unless this period of time in the climate can rise above previous warm spikes they have no argument that this period of time in the climate is somehow unique.

      The surface of the earth was molten hot early in the planets formation. And because its not as hot today you think this somehow presents a problem to concern over AGW?

      Some very loose reasoning here, Salvatore. There is no need to demonstrate that this period is ‘unique.’ We have geological records of slower-moving spikes (and troughs) in global average surface temp, and they are accompanied by large die-off in the biosphere. We have all the evidence we need that spikes (and troughs) in surface temperature place stress on the biosphere. What we don’t have is any record of such events taking place in a world land-locked with human civilization and the agriculture and water supplies required to furnish those civilizations.

      Your challenge here does not remotely reflect the realities on the ground. It ignores a host of factors.

  38. Vincent says:

    barry says:
    September 3, 2016 at 4:15 AM
    “This article was later removed without explanation. I surmised that the reason was due to objections by the AGW alarmists. But of course, I dont know. However, the fact that an article is removed without explanation should in itself be a cause for alarm.”

    Here is the CSIRO article
    Here is a link to the study abstract
    Here is a link to the full version of the study
    I hope you can understand why Ill continue to cast an especially skeptical eye on claims you make.
    Reply
    barry says:
    September 3, 2016 at 4:17 AM
    Full version poorly formatted in my post. This is the link.
    https://www.researchgate.net/profile/Tim_Mcvicar/publication/261541229
    ———————————————————–

    Barry,
    Thanks for the links. This was some time ago that I was researching such information. I now think that it possibly wasn’t the link to the desert greening that was removed but an associated article I had read, from CSIRO, that detailed the precise percentages of increases in protein in certain crops grown in double the levels of CO2.

    I recall posting the link on this forum over a year ago, but I’m not so well-organised that I can remember which topic it was, and I’m now on a different computer without access to the links I would have saved at the time.

    You are quite right to be skeptical about any claims I make. I’m skeptical about all claims made by everyone on such issues because of the complexities of the situations.

    I suspect if a number of research groups were to conduct similar experiments growing the same type of crop with double the levels of CO2, but in different soils containing different quantities of nutrients and in different locations, the results would vary considerably.

    This is why I think more research should be devoted to such benefits of increased CO2 levels. We should try to exploit the advantages.

    • barry says:

      I searched google scholar under ‘benefits of co2 fertilization’, and came up with 38,700 hits.

      https://scholar.google.com.au/scholar?hl=en&q=benefits+of+co2+fertilization&btnG=&as_sdt=1%2C5

      Adapting to rising CO2 levels (and warmer temps, rising sea levels etc) is a good idea. I believe there are already a few studies assessing dedicated ways to capitalize on enhanced levels of atmos CO2 for plant growth WRT soils/irrigation. But I haven’t delved into that much. Have you tried searching google scholar for that sort of stuff?

      • Vincent says:

        Barry,
        I search Google Scholar frequently on all sorts of subjects. I have a general interest in dietary matters, health, the environment, alternative methods of agriculture, climate change, and so on.

        I’ve come across a number of studies that imply that food grown with modern agricultural methods often do not contain the same amounts of nutrients and vitamins as they used to in the past when soils were naturally richer in carbon content and other elements.

        In other words, the oranges our grandfathers ate were richer in vitamin C than a modern orange.

        The way that increased CO2 levels might change the mix of nutrients in a particular crop I suspect is only one factor in a complex situation involving soil health and biodiversity.

        • alphagruis says:

          I agree, Vincent.

          It’s really amusing that some naive zealots of CAGW doom and gloom even deny the positive effects of CO2 on photosynthesis because, they funnily nitpick, minerals and protein do not increase as much as plant weight does…
          Though it is a well known phenomenon and reality in agronomy since long that is merely linked with fertilization of any kind be it artificial N, P, K etc or even organic. Since the end of last glacial and invention of agriculture humans feed on cultivated crops which contain usually less minerals, protein, etc par weight unit than the wild plants our hunter-gatherer ancestors fed on. We have coped with that and adapted to it since 20000 years but our ridiculous zealots are not even aware of it. They didn’t get the news, feed on such crops but claim that if fertilization is by CO2 rather than NPK or compost we are going to die from mineral deficiencies. So funny.

          • David Appell says:

            alphagruis says:
            “Its really amusing that some naive zealots of CAGW doom and gloom even deny the positive effects of CO2 on photosynthesis because, they funnily nitpick, minerals and protein do not increase as much as plant weight does”

            Instead of insults, why don’t you tell us what those “positive effects” allegedly are?

        • barry says:

          I find it amusing that peer-reviewed studies are casually dismissed by blog commenters with over-inflated self-regard for their abilities, and that this arrogance is cloaked in talk about ‘alarmists’, as if the propositions being waved away were entirely fabricated in the minds of blog denizens.

          The matter under discussion is much more complex than fly-by comments could hope to expose. Enhanced CO2 can increase plant growth, all else being equal. But not all else is equal.

          • mpainter says:

            Barry, with that comment, you reveal yourself.
            You should see some of the rubbish that passes peer review. Climate Audit is a good place for this. The Abrams study is the current specimen on the disection table. Peer review in climate science can be clowns with slapsticks.

          • David Appell says:

            barry says:
            “I find it amusing that peer-reviewed studies are casually dismissed by blog commenters with over-inflated self-regard for their abilities….”

            That is the very essence of denialism.

            Exhibit #1: mpainter

          • alphagruis says:

            Come on barry. No peer-reviewed studies dismissed, just looked at critically.

            In particular all those “studies” that deal with complexity in a technical sense as in biology, medicine, health, food quality, etc (and… even climatology) deserve particular attention in this respect since they contain more bullshit than usual in the general scientific literature.

            Among us physicists, there is a well known joke about the inflation of the number of such studies: If present trend of inflation continues the speed of accumulation of the relevant journals copies on library shelves will soon exceed the speed of light, though this phenomenon won’t violate the principle of relativity since there is absolutely no information conveyed.

          • barry says:

            Come on barry. No peer-reviewed studies dismissed, just looked at critically.

            Not in this thread. I’m a skeptic. Drive-bys don’t fly, guy.

      • David Appell says:

        If CO2 is so good for plants, why are there no plants on Venus, where the atmosphere is 96.5% CO2?

  39. Ajos says:

    Atmosphere can have a dramatic effect. Consider Mercury – sure is hot, but Venus is hotter. Venus is much further from the Sun than mercury, orbiting at a distance of more than 108 million kilometers. Average temperature there is a hellish 735 Kelvin, or 462 degrees Celsius hot enough to melt lead. The reson for Mercury being hotter than Venus is the green house gasses in Mercury’s atmosphere.

    • An Inquirer says:

      Much more complicated that simply greenhouse gases. The clouds keep heat in. Also, the angle of tilt make it hotter. And Venus has a very, very slow spin.

    • barry says:

      The clouds also keep heat out. Venus is the most reflective planet in the solar system – reflects 75% of insolation. It receives 25% of the insolation at the surface that Mercury does. The greenhouse effect is very strong on that planet.

    • David Appell says:

      Inquirer: Venus’s immense heat is due to its immense greenhouse effect.

    • gbaikie says:

      Venus is nice place to live- if you in a sky city.

  40. Toneb says:

    “The reson for Mercury being hotter than Venus is the green house gasses in Mercurys atmosphere.

    We know you meat it the other way around.
    And very true …. especially when you consider the albedo of Venus is ~0.7.

    • David Appell says:

      Actually Venus Bond albedo is about 0.9.

      Makes its greenhouse effect all the more impressive.

        • Kristian says:

          No, the reason for Venus being hotter than Mercury is the giant mass of the Venusian atmosphere.

          • Toneb says:

            It how physically does it achieve that?

          • Kristian says:

            Venus emits its radiation flux to space from basically the same atmospheric pressure levels as Earth does. This tells us that it is the density/pressure of the BULK AIR that determines how high you need to go before sufficient amounts of energy escapes to space via radiation so as to ultimately stall convection (the Venusian tropopause is situated around (+/-) the 100 mb level, just like in the Hadley Cells on Earth).

            What the gigantic mass of the Venusian atmosphere does it making sure these sufficiently thin layers of air are situated much, much higher above the solid surface than on Earth. And that’s why the surface temp far below is so high – the ‘air’ down there is way to dense …

          • gbaikie says:

            Thick clouds on earth reflect about 90% of the sunlight reaching
            them.
            And the thick clouds of Venus reflect about 75% of the sunlight reaching them and have twice the sunlight as Earth has.

            So Earth 1000 watts, 900 watts reflected
            Venus +2000 watts, +1500 watts reflected.

            The acid of Venus clouds has gas and liquid phase- and
            chemical reaction
            “At around 60 kilometres altitude is a very thick cloud layer a 20 kilometre-deep blanket surrounding the planet.

            It is known today that the upper part of this layer is mostly composed of tiny droplets of sulphuric acid, but what is happening chemically in the lower clouds is still unknown. ”
            http://www.esa.int/Our_Activities/Space_Science/Venus_Express/Acid_clouds_and_lightning
            The water of earth has gas, liquid, and solid phase.
            And liquid, and solid phases evaporate at any temperature
            on Earth, and boils at sea level at 100 C
            Sulfuric acid:
            Melting point 10 C (50 F; 283 K)
            Boiling point 337 C (639 F; 610 K) When sulfuric acid is above 300 C (572 F), it will decompose slowly.
            https://en.wikipedia.org/wiki/Sulfuric_acid
            “Sulfuric acid is produced in the upper atmosphere of Venus by the Sun’s photochemical action on carbon dioxide, sulfur dioxide, and water vapor. Ultraviolet photons of wavelengths less than 169 nm can photodissociate carbon dioxide into carbon monoxide and atomic oxygen. Atomic oxygen is highly reactive. When it reacts with sulfur dioxide, a trace component of the Venusian atmosphere, the result is sulfur trioxide, which can combine with water vapor, another trace component of Venus’s atmosphere, to yield sulfuric acid. ”
            And:
            “Because the hydration reaction of sulfuric acid is highly exothermic, dilution should always be performed by adding the acid to the water rather than the water to the acid”
            So don’t water to the acid- like it could be done on Venus.
            And acid cloud are high in atmosphere because that where CO2 photo dissociates from the UV light and can’t be too low or heat
            evaporates and boils it- and removes the H20 from it- chemically alters it
            So cloud tops at 60:
            Venus:
            60 km −10C 0.2357 atm
            On earth sunlight can burn off clouds, Venus sunlight can’t evaporate acid clouds but can warm them- they evaporate when droplets get to massive or there is not enough uplift to support them, and then fall into furnace below.

            So droplets of clouds could be warmed to temperature higher than
            -10 C and thereby be able to warm the air. And another way is chemical reactions related making the acid and/or any additional adding of water to acid.

          • barry says:

            Thick clouds on earth reflect about 90% of the sunlight reaching
            them.

            “Them?”

            Clouds on Earth prevent 30% of sunlight reaching the surface

            And the thick clouds of Venus reflect about 75% of the sunlight reaching them

            …reaching the surface

            and have twice the sunlight as Earth has.

            Huh?

          • gbaikie says:

            ” barry says:
            September 7, 2016 at 7:47 AM

            Thick clouds on earth reflect about 90% of the sunlight reaching
            them.

            Them?

            Clouds on Earth prevent 30% of sunlight reaching the surface”

            I suppose you talking about globally or on average, I mean, thick
            clouds found on Earth will reflect 90% of the sunlight.

            So on Earth, clouds do not completely cover the planet, whereas on Venus, clouds completely cover the planet.

            Venus has a lot of clouds, Venus has more clouds than Earth. If there wasn’t so many clouds on Venus, one might be able to actually see it’s surface- or we can “see” the Venus surface by using radar which is able to penetrate these dense clouds of Venus and reflect signal off the surface. There are global maps of the surface Venus which the Magellan spacecraft made:
            http://science.nasa.gov/missions/magellan/

            –“And the thick clouds of Venus reflect about 75% of the sunlight reaching them”

            You added: ” reaching the surface.”–

            75% of all sunlight reaching Venus is reflected by the clouds
            of Venus.
            The clouds uniformly cover the entire the planet. The clouds are not like clouds on Earth. Earth clouds are made of water droplets,
            Venus clouds are made of Sulfuric acid droplets- droplets of acid
            which could near 100% concentration. battery acid:
            “Battery acid is sulfuric acid that has been diluted with water to attain a 37% concentration level.”
            http://www.atbatt.com/batterytimes/battery-acid
            so Venus cloud droplets have higher concentration [stronger acid]
            than a car’s lead battery.

            So when compared a thick cloud on Earth to thick clouds on Venus,
            Earth’s reflect 90% and Venus clouds reflect 75%.
            But all the clouds on earth reflect somewhere around 15 to 30%,
            whereas all Venus clouds reflect 75%.
            Or most of Earth’s cloud are not thick and Venus clouds are thick- though cloud in tropics of earth do tend to be thick.

            Said differently if Venus had thick water clouds which uniformly covered the planet [like acid clouds do] then the clouds would reflect 90% of sunlight- assuming that these clouds were 60 Km above the surface- or above +95% of the mass of atmosphere

  41. Norman says:

    Toneb

    On this blog a while back a person going by JohnKl suggested Venus could not be viewed by normal surface IR standards but it was all together a different system.

    He brought up that at high pressure carbon dioxide will act like a supercritical liquid.

    “Early Venus, with a boiling atmospheric pressure 100 times Earth’s may have had a carbon dioxide ocean, in supercritical liquid state.[30] The current atmosphere, which has an average temperature of 740 K and average pressure of 92 atm (varying by elevation), is in the supercritical range, as the critical temperature of CO
    2 is 304 K and the critical pressure is 72.9 atm.”

    From this link:
    https://en.wikipedia.org/wiki/Supercritical_carbon_dioxide

    I seems the thermal conductivity of supercritical liquid Carbon Dioxide may be less than water (Figure 2 of this link…if I read correctly).

    http://www.swri.org/4org/d18/sco2/papers2014/physicalProperties/27-Harvey.pdf

  42. Norman says:

    Toneb

    Continued: Did not want too many links in one post.

    Earth’s geothermal gradient near surface is 25 C/km

    https://en.wikipedia.org/wiki/Geothermal_gradient

    At around 18 km down the Earth is as hot as Venus surface of 464 C.

    The idea here would be that the surface of Venus is not the actual rock surface but the top of a supercritical liquid carbon dioxide ocean. The temperature of the rock surface (which would radiate around 16000 W/m^2) is no longer radiating through the liquid. Heat transfer is only through slow conduction as is with the Earth’s rocks. This may be why the surface of Venus is so hot. If this is the case Kristian would be correct that Venus’s massive atmosphere is why the surface is so hot.

    Not sure if this is a correct idea I am not sure if scientists have studied this possibility yet.

    • Nate says:

      Russians landed probes on Venus surface in 70s and 80s….. surface is not a liquid

      • Norman says:

        Nate,

        In the theory you still have the rocky surface, not an ocean. The difference is the carbon dioxide is in a liquid state rather than gaseous which may not make much of a difference to an object in it (supercritical fluid carbon dioxide) but it could drastically change the radiative properties of carbon dioxide. In a liquid radiation does not travel, in a gas it is able. Maybe anyway. It is possible that liquid Carbon Dioxide is transparent to IR and would not stop rocky surface emissions. It was just an idea thrown out a while back and I thought it was interesting.

    • Toneb says:

      Interesting Norman, however satellite/lander observations show no surface “supercritical” layer (if it were visible to the landers’ cameras or observable via radar). And soundings of the atmosphere follow a g/cp relationship as does Earth. Additionally would there not be a vast super-adiabat at the surface in order to insulate the geothermal flux?

      https://en.m.wikipedia.org/wiki/Observations_and_explorations_of_Venus

      To my mind the standard models come up with the correct observed vertical temp profile for Venus and so the standard GHE is valid.

      https://scienceofdoom.com/2010/06/12/venusian-mysteries/

      http://onlinelibrary.wiley.com/store/10.1029/2008JE003204/asset/jgre2566.pdf;jsessionid=0E6123FE904F6BACF28F08D5A5C678D1.f04t03?v=1&t=isoywh9v&s=1d43a1e7f8d61ca520758fa4f9000483a20a481e

      • Norman says:

        Toneb

        I read through Science of Doom’s GHE for Venus. It relies on the layered effect to achieve a super high temperature from a small amount of solar input.

        It is similar to this material that is actually works and is used in the space industry.

        Multi-layer radiant insulation.
        http://www.dunmore.com/products/multi-layer-films.html

        The point I do not understand, in order for SOD model to work he assumes the atmosphere is totally opaque to IR and the lower layers are all opaque until the Carbon Dioxide thins and allows radiation out.

        Does that mean if scientists compress Carbon Dioxide to Venus atmospheric pressures (at all the layers needed for SOD model) that the entire IR spectrum will be absorbed? Does CO2 bands expand to cover the entire spectrum when under intense pressure and density? I do not know much on this topic and have not been able to find much on it.

        • gbaikie says:

          “Does that mean if scientists compress Carbon Dioxide to Venus atmospheric pressures (at all the layers needed for SOD model) that the entire IR spectrum will be absorbed?”

          Apparently the science is settled, so don’t need scientists.
          Al Gore should invest his millions of dollars he scammed, hire engineers and Bernie Sander as CEO, make this perpetual energy machine.

    • Gordon Robertson says:

      @Norman…”Not sure if this is a correct idea I am not sure if scientists have studied this possibility yet”.

      Astronomer, Andrew Ingersoll, in a preview to a paper, has deemed that the 400+ C surface temperature could not have been produced by a greenhouse effect since it would contradict the 2nd law. Of course, he regularly contradicts himself.

    • Gordon Robertson says:

      @Norman…thought you’d want a link to the Ingersol abstract.

      http://onlinelibrary.wiley.com/doi/10.1029/JA085iA13p08219/abstract

      • Norman says:

        Gordon Robertson

        Thanks for the link but I could not view the whole article to determine what his logic process was and how he arrived at his conclusions.

  43. ren says:

    The decrease in sea levels indicates a decrease in the surface temperature of the Pacific Ocean.
    http://www.cpc.ncep.noaa.gov/products/analysis_monitoring/ocean/weeklyenso_clim_81-10/wksl_anm.gif
    Monthly Nio-3.4 index in August : -0,55
    http://www.cpc.ncep.noaa.gov/products/analysis_monitoring/ensostuff/detrend.nino34.ascii.txt

  44. Mack says:

    Roy,
    I was just quietly gazing at your UAH temperature graph and thinking about all the recordings and scientific stuff involved in plotting this graph, extending back all those years back to 1979. This is a life-times undertaking of work to achieve, and you and John Christy are to be admired and congratulated for this fine and important record.

    • barry says:

      Nice to read a fair comment here.

    • Gordon Robertson says:

      @Mack…”This is a life-times undertaking of work to achieve…”

      John and Roy have already been recognized by NASA and the American Meteorological Society with medals for excellence.

      Those medals certainly did not come from NASA GISS, the heart of climate alarm. Makes me wonder why GISS is part of NASA.

      • GISS started out without a political agenda. That changed under the leadership of James Hansen. He was a loose cannon, ignoring federal rules and even laws, but he helped sell climate alarmism to Congress, so NASA HQ looked the other way as it was hoping to sell “Mission to Planet Earth” to Congress. I know. I was there.

        • Nate says:

          Roy,

          I agree that Hansen has become an activist-therefore one might be more skeptical of his (recent) science work.

          But then again, shouldnt the same logic apply to you?

          That is you have become an activist, https://www.heartland.org/about-us/who-we-are/roy-spencer, so therefore your science should be taken with more skepticism?

          • I was responding to a comment about why GISS is part of NASA, so I gave some historical background. The difference is that Hansen broke the law while leading a government research organization. He took money from outside interests, he campaigned for a presidential candidate (violation of the Hatch Act), and routinely ignored the chain of command when talking to members of Congress and the media.

            In contrast, I resigned from NASA so I wouldn’t break the law. I joined the university where it is accepted that opinions flow freely.

            Hansen actually writes pretty good papers…I just disagree with his conclusions.

          • David Appell says:

            Roy, if Hansen’s papers are “good,” why are his conclusions wrong?

  45. barry says:

    Here’s a brief article on supercritical fluid CO2 on Venus – maybe in the past.

    http://www.space.com/28112-venus-weird-superfluid-oceans.html

    • ren says:

      The altitude of the troposphere most similar to Earth is near the tropopausethe boundary between troposphere and mesosphere. It is located slightly above 50 km.[17] According to measurements by the Magellan and Venus Express probes, the altitude from 52.5 to 54 km has a temperature between 293 K (20 C) and 310 K (37 C), and the altitude at 49.5 km above the surface is where the pressure becomes the same as Earth at sea level.[17][21] As manned ships sent to Venus would be able to compensate for differences in temperature to a certain extent, anywhere from about 50 to 54 km or so above the surface would be the easiest altitude in which to base an exploration or colony, where the temperature would be in the crucial “liquid water” range of 273 K (0 C) to 323 K (50 C) and the air pressure the same as habitable regions of Earth.[10][22] As CO2 is heavier than air, the colony’s air (nitrogen and oxygen) could keep the structure floating at that altitude like a dirigible.
      https://en.wikipedia.org/wiki/Atmosphere_of_Venus

  46. ren says:

    Changes in the circulation after a strong geomagnetic storm.
    http://www.ssd.noaa.gov/goes/east/eaus/h5-loop-wv.html

  47. ren says:

    The amount of water vapor indicates a drop in temperature of the eastern Pacific and western Indian Ocean.
    http://www.ospo.noaa.gov/data/mirs/mirs_images/n19/mirs_adv_poes_n19_amsuamhs_glb_20160905_tpw_sea_as.png

  48. I think temperatures will be on the downward path from here on out.

    • Gordon Robertson says:

      @Salvatore…”I think temperatures will be on the downward path from here on out”.

      Summer ended here in Vancouver, Canada rather abruptly. The end of August had a few days of temps in the high 20C range then September brought us back to reality.

      It’s noticeable mainly at night when their is a sudden chill in the air. However, even indoors, you can sense a major reduction in heat.

      It’s amazing how quickly summer can end when the Earth reaches a certain part of it’s orbit around the Sun. It can happen in a matter of days rather than gradually over a month at these latitudes.

      I’d like to know what caused the Earth to cool by about 1C over the 400+ year span of the Little Ice Age. The Maunder Minimum was somewhere in the middle.

      • Bindidon says:

        A huge sequence of volcano eruptions beginning with Samalas around 1257 (VEI 7) followed by a major cooling of the oceans.

        Mr Maunder accounts for no more than 0.3 C.

      • Bindidon says:

        Its amazing how quickly summer can end when the Earth reaches a certain part of its orbit around the Sun.

        Aha.

        Here in Western Europe, we experience exactly the contrary. That is exactly the difference between a century’s climate and daily meteorology.

        • Gordon Robertson says:

          Bindidon…”Here in Western Europe, we experience exactly the contrary. That is exactly the difference between a centurys climate and daily meteorology”.

          Enough of the propaganda. Here in western Canada, autumn comes on pretty fast in early September. I have played soccer in England through summer/autumn and I know it does the same.

          Where do you live, on the Mediterranean?

    • David Appell says:

      “here is my prediction for climate going forward, this decade will be the decade of cooling.”

      – Salvatore del Prete, 11/23/2010
      http://ourchangingclimate.wordpress.com/2010/10/20/andrew-dessler-debating-richard-lindzen/#comment-8875

  49. michael hart says:

    Current David Appell count on this post, about 50 out of 250 posts.

    • Gordon Robertson says:

      @michael hart…”Current David Appell count on this post, about 50 out of 250 posts”.

      Obviously a troll from one of the alarmist sites like realclimate, skepticalscience or desmogblog.

      Another one of them posts here, Eli Rabbett. He co-authored a rebuttal to the Gerlich and Tscheuschner paper on the falsification of the greenhouse effect, and was exposed as lacking in the fundamentals of thermodynamics.

      • MikeR says:

        Michael and Gordon.

        For those keeping score, currently Mpainter 51, Appell 51 . I have no doubt that Mpainter will come good and we wont need overtime. He clearly won with 68 in the previous month versus a measly 50 for David Appel.

        I was wondering who would replace the indefatigable D.C. after he received his life ban. It is now apparent that Mpainter has been ordained as his spiritual successor.

        • mpainter says:

          correction: mpainter 52

        • Gordon Robertson says:

          Mike R…”For those keeping score, currently Mpainter 51, Appell 51…”

          mpainter is one of us skeptics on a site run by a skeptic, Appell is an alarmist troll. mpainter’s comments are informative, Appell’s are disruptive.

          He once made an ignorant, insulting, uncalled for comment about mpainter’s wife, and when mpainter replied that his wife had died, Appell did not recant. Rather he admonished mpainter.

          This is typical Appell propaganda:

          http://www.davidappell.com/publications.html

          • MikeR says:

            Gordon.

            I am not sure whether mentioning an unfortunate spat between David Appell and Mpainter serves any purpose other than to inflame matters. Both of their arguments need to be judged on their relative merits.

            Accordingly I find your rush to the defence of Mpainter noble, if misguided.

            It is clear Mpainter doesn’t require any assistance as evidenced by the considerable volume of his contributions. He can defend himself adequately solely upon the basis of quantity without even considering the quality of his arguments.

            Likewise if you have to resort to labelling David Appell a troll, then it suggests that you believe the party line is so weak that it cannot cope with any dissenting viewpoints.

          • mpainter says:

            MikeR,
            After you clean up your puddle of poison, would you like to try a little science?
            Try this:

            TOA CO2 spectrum originates mostly in the stratosphere. What are the implications of that for AGW?

            Also, negative GHE posited for central Antarctica. Your thoughts?

          • David Appell says:

            Gordon:

            Name calling shows you have no better argument. Certainly not a scientific argument.

            Discuss the science, if you can.

          • MikeR says:

            Regarding mpainter’s comments of September 8, 2016 at 2:14 PM.

            I gather I might have created some offence to mpainter and, if so, I apologize. My only defence was that I thought that mpainter’s hide was sufficiently thick, as evidenced by his number and nature of his contributions, that my tiny barbs could not possibly penetrate. Obviously I was wrong.

            As for science, if I am going to get involved in another of mpainter’s Gish Gallops, at least he could define the starting conditions. Do we run clockwise or anticlockwise?

            In other words he needs to further elaborate his arguments in case they venture into areas beyond my limited level of competence. At least I have some level of self awareness of my many limitations , unlike those unfortunates suffering from the dreaded Dunning-Kruger (D-K) affliction.

            On that topic,can we all bask once again, in the glory of mpainter’s vast knowledge and deep insights in to all matters climatological? Could he please elaborate regarding TOA CO2 and AGW and the stratosphere and secondly inform us, who posited negative GHE for central Antarctica and, if so, for what reasons?

            It might be tempting fate but, rather than his insights being confined to the comments section of a blog, his exposition could then be the basis of a publication to a peer reviewed journal and more widely circulated.

            Alternatively if mpainter doesn’t mind, I could use his material for a case study of obsessive compulsive posting disorder exacerbated by a pre-existing condition (i.e.the above D-K syndrome). As they widen the scope of the DSM this kind of psychopathology could merit inclusion in the 6th edition.

            Either way he could become famous. Wouldn’t that be wonderful?

          • mpainter says:

            It’s a question of the contribution of CO2 to cooling in the upper troposphere. AGW puts that increasing atmospheric CO2 reduces the efficiency of CO2 its contribution to cooling of the troposphere. But TOA spectrum of CO2 shows that it contributes unappreciably to cooling of the troposphere (it radiates from the stratosphere, mostly, not the troposphere). Hence, increasing atmospheric CO2 has no effect on temperature.

            So
            MikeR, wipe the poison off your chin and try some science. Or drool more poison. Your choice.

          • mpainter says:

            Concerning the negative GHE of central Antarctica, this is addressed in Schmithusen, et al, 2015. This is a very interesting paper. It shows a TOA spectrum over that region, with a very low intensity spectrum (as per low temperatures), with the CO2 15 micron band radiating from the stratosphere at a higher intensity than the rest of the spectrum. Instead of a notch in the spectrum at the CO2 band (as usually seen in TOA spectra), there is a peak.

            In my view, this casts extreme doubt on the hypothetical “effective radiating level” for CO2 in the upper troposphere, a concept central to the formulation of the AGW hypothesis: if CO2 is not an important component in the cooling of the troposphere, doubling of CO2 is inconsequential for climate.
            Indeed, the oft-repeated refrain that “the science is settled” rings with an evermore hollow sound.

          • mpainter says:

            “In other words he needs to further elaborate his arguments in case they venture into areas beyond my limited level of competence. At least I have some level of self awareness of my many limitations , unlike those unfortunates suffering from the dreaded Dunning-Kruger (D-K) affliction.” Says MikeR. # # #
            ###
            So far, your area of competence appears to be spewing poison.

          • David Appell says:

            From the conclusion to Schmithsen et al:

            “It is important to note that these results do not contradict the key statements of the Intergovernmental Panel on Climate Change (IPCC) [Solomon et al., 2007; Ramaswamy et al., 2001; IPCC, 2013], namely, the well-known warming effect that CO2 has on the Earths climate;”

          • mpainter says:

            The well-known warming effect = the pause

          • MikeR says:

            Regarding mpainter’s series of commnents of September 9.

            Mpainter, firstly thank-you for drawing my attention to the interesting paper by Schmithsen(2015).

            Now that you have clarified the source of your material and asked for my opinion I think I can proceed to provide one.

            I think that this paper provides a convincing explanation for the lack of warming for the high altitude region of central Antarctica. They assert that CO2 plays a role in this at this particular location and the evidence they provide appears to be credible.

            They also suggest that extrapolation of these results to the globe is not warranted, which I strongly suspect is mpainter’s motive for introducing this material.

            For instance the full abstract reads –

            CO2 is the strongest anthropogenic forcing agent for climate change since preindustrial times. Like other greenhouse gases, CO2 absorbs terrestrial surface radiation and causes emission from the atmosphere to space. As the surface is generally warmer than the atmosphere, the total long-wave emission to space is commonly less than the surface emission. However, this does not hold true for the high elevated areas of central Antarctica. For this region, the emission to space is higher than the surface emission; and the greenhouse effect of CO2 is around zero or even negative, which has not been discussed so far. We investigated this in detail and show that for central Antarctica an increase in CO2 concentration leads to an increased long-wave energy loss to space, which cools the Earth-atmosphere system. These findings for central Antarctica are in contrast to the general warming effect of increasing CO2.”.

            Note the last sentence . Similar statements are at the end of the paper, in the Discussion and Conclusion section –

            “It is important to note that these results do not contradict the key statements of the Intergovernmental Panel on Climate Change (IPCC) [Solomon et al., 2007; Ramaswamy et al., 2001; IPCC, 2013], namely, the well-known warming effect that CO2 has on the Earth’s climate. Yet we showed that for the cold Antarctic continent some care needs to be taken when discussing the direct warming effect of CO2.”

            So this paper suggests that, for a particular case, the elevated regions of central Antarctica, we can get cooling due to CO2. The land mass of Antarctica in total is about 3% of the surface area of the earth. The elevated areas of central Antarctica, I would hazard a guess, would be in the order of 1% at best.

            So mpainter has yet again gilded the lily to excess, so that it has collapsed under its own weight.

            Next time mpainter, rather than selectively quoting snippets from a paper, you should actually read it, even just the abstract would do.

            I guess you believed readers of your comments would accept them at face value and no one would bother actually reading the paper. The full paper can be found at http://onlinelibrary.wiley.com/doi/10.1002/2015GL066749/full .

            As for the nature of my comments, i would think that they were bilious rather than poisonous. The emetic qualities of mpainter’s comments does induce feelings of nausea in the reader.

            It is also apparent painter has been inoculated against reason and has regular booster shots from reading his favourite denialist web sites. His regular regurgitation of this material may also mean that he may be drowned in his own bile so my contributions may be superfluous.

            Even if my comments are regarded as poisonous, then due to the vast amounts of Kool Aid that mpainter regularly consumes, i think he could drink Rasputin under the table in a “boat race”.

          • mpainter says:

            MikeR, your response dodged the issues that I raised, utterly. I’m not surprised, for some reason.
            But that’s fine with me because your style of commenting leaves me with a feeling of revulsion. You are creepy.

          • MikeR says:

            Mpainter.

            Which specific issues are you referring to? Again you talk in generalities. I believe every point you raised regarding spectra etc. is adequately covered in the paper by Schmithusen.

            So I suggest you read the paper.

            On the topic of creepiness, I quote your statement below of September 7, 8:04 am – ”
            Here necrophiliac barry pries off the coffin lid to get to pull out the smelly corpse beneath.”

            Now that is what I call creepy.

          • mpainter says:

            Yes, necrophilia is creepy. Tsk, Tsk, that Barry Schwartz.

          • MikeR says:

            Mpainter.

            Why did you suddenly introduce this unsavoury topic? Are you suggesting that climate change and this abominable practice are inextricably linked and who is this Barry Schwartz you speak of? Has he been arrested for the abominable practice you accuse him of?

            Perhaps your wish to include this topic in a debate about climate change is simply a result of the transference of your own repressed desires? So many questions…

          • David Appell says:

            mpainter says:
            “But thats fine with me because your style of commenting leaves me with a feeling of revulsion. You are creepy.”

            Personal insults aren’t necessary. Try to post science for a change.

          • mpainter says:

            It was no insult, but of description of a dominant personality trait

          • MikeR says:

            Being called a creep is not an insult?

            Mpainter must be on the receiving end of much worse insults if he regards it a compliment. Oh well, it takes all kinds…

            As for scientific content, note well that once again he has retreated into his foxhole. This is his modus operandi when challenged on these matters. Otherwise his only alternative is to launch yet another Gish Gallop.

            In the end, mpainter’s only saving grace is due to the collateral damage his comments inflict upon those who exhibit a similar mindset. Even I am not sure they deserve friends like this.

  50. barry says:

    RSS August anomaly is down from July: 0.469 –> 0.458

    Re-baselining that to UAH (-0.097), July and August are

    0.372 –> 0.361

    (Like the surface records, no one expects a perfect match, even in sign of difference one month to another)

  51. barry says:

    UAH record for 12-month average anomaly has been broken.

    Jan 1998 –> Dec 1998 = 0.484

    Sep 2015 –> Aug 2016 = 0.496*

    RSS 12-month average record was broken last May, and each month since has brought a new 12-month record average.

    Jan 1998 –> Dec 1998 = 0.550

    Jun 2015 –> May 2016 = 0.554

    Jul 2015 –> Jun 2016 = 0.560

    Aug 2015 –> Jul 2016 = 0.575

    Sep 2015 –> Aug 2016 = 0.581

    (* This figure will likely be a little different when the 3-sig fig anomaly appears)

    • doctor no says:

      RIP “the pause”

      Beloved by many, it died at a relatively young age (~16 years)

      Cause of death: global warming.

      Some refuse to believe it is dead and that it is alive and well living out of sight with Elvis Presley.

      Others think that it will eventually rise from the grave and return even stronger to smite the evil warmists.

      There are even some who are still applying mouth-to-mouth resuscitation to the corpse bleating “Don’t die! Please don’t die! La Nina will be here soon!”

      (I have heard that mpainter is having counselling)

      • Gordon Robertson says:

        @dr no…”RIP the pause”

        The pause, the hiatus, the end, anyway you put it, came from the IPCC. It had been noted by many others but the IPCC made it official following their 2012 5th review.

        It’s called a hiatus only because alarmists, in their denial, cannot come to grips with the notion that their AGW theory is wrong. A flat average trend was bound to happen as global temps returned to a normalized level following re-warming from the 400+ year Little Ice Age, during which the Maunder Minimum occurred.

        You alarmists carry on about peer review, as if it has meaning. The IPCC is the mother of all peer reviews and they admitted to the fact that no warming had occurred between 1998 and 2012. It’s plain from the UAH data sets that the so-called hiatus is still with us. All we’re waiting for is the EN to die off so the average can level off, or even reduce.

        Of course, alarmists are not satisfied with the 2500 reviewers on IPCC reviews, Urged on by uber-alarmists in the US Environmental Protection Agency, NOAA has used climate model smoke and mirrors to re-write the record to show warming where 2500 reviewers found none.

        NOAA is currently under investigation by a US Senate committee.

        • doctor no says:

          “Its plain from the UAH data sets that the so-called hiatus is still with us. All were waiting for is the EN to die off so the average can level off, or even reduce.”

          I’m not sure which group you belong to. Maybe all three.

          “Wishing and hoping and thinking and praying / Planning and dreaming each night of his charms / That won’t get you into his arms”

          • ren says:

            “Extensive planting and benign weather have forced analysts to repeatedly raise crop outlooks. The International Grains Council last week increased its global wheat production forecast to a record 743m tonnes, up 1 per cent from last year. []

            The recent US winter wheat harvest was 45m tonnes, up 21 per cent from 2015, according to the US Department of Agriculture. Merchants who have run out of room in silos are piling wheat outdoors.
            Storage concerns are also growing in Russia, which is this year set to become the largest wheat exporter after hauling in more than 70m tonnes. In Canada, the government anticipates the second-largest wheat crop in 25 years, of 30.5m tonnes. Australias imminent wheat harvest is forecast at 26.5m tonnes, the most in five years.”
            http://www.the-american-interest.com/2016/09/03/malthus-chokes-on-bumper-wheat-crop/

          • Gordon Robertson says:

            @dr no…”Im not sure which group you belong to…”

            Not sure what your point is? Are you having trouble reading graphs?

            Do you not understand that the area under a graph represents the cumulative data points represented by the graph?

            So, visually average the areas under the red running average and it becomes totally apparent that the trend is essentially flat.

          • David Appell says:

            ren says:
            “The recent US winter wheat harvest was 45m tonnes, up 21 per cent from 2015….”

            Harvests can increase for several reasons:

            * more acreage planted
            * better fertilizers
            * genetic modification
            * better farming techniques and technology
            * more CO2
            * changes in government farming subsidies
            * higher demand
            * better weather
            * better temperatures and precipitation
            etc.

            So just saying that yield has increased says nothing about why. Nor does it say anything about the influence of each factor.

            In particular, yields can increase even while some of these factors are contributing to a decreasing sub-trend.

            And that’s what scientists say is happening regarding climate change:

            For wheat, maize and barley, there is a clearly negative response of global yields to increased temperatures. Based on these sensitivities and observed climate trends, we estimate that warming since 1981 has resulted in annual combined losses of these three crops representing roughly 40 Mt or $5 billion per year, as of 2002.
            — Global scale climatecrop yield relationships and the impacts of recent warming,” David B Lobell and Christopher B Field 2007 Environ. Res. Lett. 2 014002 doi:10.1088/1748-9326/2/1/014002
            http://iopscience.iop.org/1748-9326/2/1/014002

            “We also find that the overall effect of warming on yields is negative, even after accounting for the benefits of reduced exposure to freezing temperatures.”
            — “Effect of warming temperatures on US wheat yields,” Jesse Tack et al, PNAS 4/20/15
            http://www.pnas.org/content/early/2015/05/06/1415181112

            “Negative impacts of global warming on agriculture, health & environment far outweigh any supposed positives.” Smith et al. PNAS (2009), http://www.pnas.org/content/106/11/4133.full.pdf

          • David Appell says:

            By the way, Ren, global per capita wheat production has been flat to slightly decreasing for the last 20 years, at about 100 kg/person/yr.

          • mpainter says:

            “at about 100 kilograms per year”

            Right, David, and how much wheat are we supposed to eat? Per year? On top of all that rice (118 kg/cap/year). And corn? Oats, potatoes, etc.

            It doesn’t seem to occur to David that demand is any factor in wheat production. In fact, wheat surpluses are the rule, rather than the exception and these are used as livestock and poultry feed.

            But for David, any little innocuous fact has screech potential. If only you can spin it fast enough.

          • David Appell says:

            Desite gains in global wheat production, per capita production is flat. So any stressors, like climate change, threaten the ability to feed everyone. And the science shows climate change is having an negative effect on yields.

            For wheat, maize and barley, there is a clearly negative response of global yields to increased temperatures. Based on these sensitivities and observed climate trends, we estimate that warming since 1981 has resulted in annual combined losses of these three crops representing roughly 40 Mt or $5 billion per year, as of 2002.
            — Global scale climatecrop yield relationships and the impacts of recent warming,” David B Lobell and Christopher B Field 2007 Environ. Res. Lett. 2 014002 doi:10.1088/1748-9326/2/1/014002
            http://iopscience.iop.org/1748-9326/2/1/014002

            General Mills CEO Ken Powell told the Associated Press:

            “We think that human-caused greenhouse gas causes climate change and climate volatility, and thats going to stress the agricultural supply chain, which is very important to us.”

            http://www.chicagotribune.com/business/ct-general-mills-greenhouse-gas-cuts-20150830-story.html

          • mpainter says:

            mpainter says:
            September 9, 2016 at 1:24 PM
            Higher temperature and lower soil moisture correlates with increased gluten content, as a percentage of the wheat berry. Lower temperature and higher soil moisture correlates with higher starch percentage. However, with increased moisture, the crop yield is increased, the higher starch content being the result of a surfeit of moisture and contributing most to the higher yields.

            It should be noted that wheat is usually grown under dry conditions, that is, soil moisture is not at high levels, such as the conditions that usually obtain in the great plains of North America.

            It can be concluded that the first priority of the wheat plant is to provide a minimum level of protein, in absolute terms, and when that requirement is met in the wheat berry, remaining growth capacity is directed toward providing the wheat berry extra starch. The starch not only supplies the energy for plant development, but is also essential for building cellulose and other types of tissue.

            So should David allow himself to be alarmed over variable protein/starch ratios in wheat? No, because such variation is commonplace, and it appears to be resolveable by increased fertilizer.

          • David Appell says:

            Word salad.

            Devoid of any science whatsoever.

            Typical for painter.

          • mpainter says:

            It tells David exactly what he doesn’t want to know

          • David Appell says:

            mpainter says:
            “Right, David, and how much wheat are we supposed to eat?”

            I’m sure you’re fed just fine. Many aren’t:

            “Some 795 million people in the world do not have enough food to lead a healthy active life. That’s about one in nine people on earth.”

            https://www.wfp.org/hunger/stats

            No need for you to start caring now.

          • mpainter says:

            UN report: 100 million fewer hungry people in 2015 compared to 2012.
            This year’s record cereal production means even fewer hungry people in 2016. Thanks to fossil fuels. And increased atmospheric CO2. The UN believes that, with more CO2, hunger can eventually be eliminated from earth. Pisses you off, don’t it, David.

          • mpainter says:

            Increased atmospheric CO2 will eliminate hunger eventually, it is believed. Of course, mechanization of agricultural equipment will help. Fossil fuels will save the world from hunger, David. Pisses you off, I know.

        • Bindidon says:

          Well, googling for ‘NOAA investigation US Senate committee’ gives nothing newer than november 2015.

          Nobody speaks today about Lamar Smith.

          But in 10 years Gordon Robertson still will tell us about it.

        • MikeR says:

          Interesting about the Senate committee investigating NOAA Geoffrey mentions at the end.

          Has HUAC and Senator Joe McCarthy been resurrected to weed out insidious influences?

          Is this James “Snowball” Inhofe’s committee?. I can see NOAA scientists being grilled with questions. Are you,or have you ever been in contact with, a climate change scientist or a fellow traveller?

          Maybe Mpainter could reprise Roy Cohn’s role.

          • Gordon Robertson says:

            @MikeR…”Is this James Snowball Inhofes committee?. I can see NOAA scientists being grilled with questions”.

            The question NOAA needs to be grilled on is why they threw out real data from 5000 weather stations and re-synthesized it using data from 1500 stations using a climate model.

            According to the IPCC, the real data NOAA threw out revealed no warming from 1998 – 2012. The climate model re-synthesized data showed not only warming, but record warming.

            Do you not think there’s something that needs investigating?

          • mpainter says:

            Mpainter was not there with Joe McCarthy and his aide Bobby Kennedy, third son of rumrunner Joe. You remember Bobby, surely. US Attorney General under JFK, second son of rumrunner Joe. Remember? Most people don’t know that Patriarch Joe Kennedy was pals with Red baiting Joe McCarthy. But they were close. That’s how Bobby got the job. Joe McCarthy’s aide. How about that!

          • barry says:

            The question NOAA needs to be grilled on is why they threw out real data from 5000 weather stations…

            They didn’t.

            http://tinyurl.com/zlhmomf

      • Toneb says:

        “RIP the pause”

        Except there was never “a pause” when considering the 93% of the climate system that isn’t the atmosphere……

        http://www.skepticalscience.com/pics/TotalHeatContent2.jpg

        • Lewis says:

          Toneb,

          It would be rather curious that the oceans could warm so much without impacting the temperature of the atmosphere to a noticeable amount. Take the El n’s. They both impact the atmosphere, which is why they are of such import.

          So if all this warming is going on, which it may well be, it hasn’t changed the atmospheric temperature significantly. So, does it really exist or is it just another way to avoid accepting the fact the atmosphere isn’t warming according to those who wish to use that predicted warming to control other’s lives.

          An offset is – since it is warmer than at some times in the past – more food is being grown (see previous posts) than in the past. That seems a good thing – although not to individual farmers.

          Best wishes,

        • barry says:

          1. There is not much of a ‘pause’ in the surface data sets for the interminably mentioned period since 1997/8. So we’re talking not only about air temps, we’re taking about a slice of the atmosphere measured by satellites – 2 records out of 7 that measure air temps.

          2. The variability in the temp data is such that periods shorter than 20 years – especially regarding the satellite data, which is more variable than surface – have trends that are strongly impacted by the choice of start and end date. IOW, the ‘noise’ in the data can swamp the long-term signal at short time periods.

          3. The in-system exchanges of heat are not perfectly monitored, so it is possible that the oceans (and/or the cryosphere) could have absorbed more heat in recent times than the share taken up by the atmosphere.

          The ‘pause’ or ‘hiatus’ or ‘slowdown’ is a talking point, not a nail-in-the-coffin as some would like. The only statistically significant trends the surface and satellite records produce over the last century are positive. There are no statistically significant negative trends of any decadal period in any of the data sets.

          • mpainter says:

            Here necrophiliac barry pries off the coffin lid to get to pull out the smelly corpse beneath.

            We are witness to the human condition: true believers desperately trying to prop up their collapsing world.

            Note how they parade out the ocean heat content meme, wherein the atmosphere warmed the ocean, without warming itself!

          • barry says:

            Here mpainter says nothing substantive.

            Note how they parade out the ocean heat content meme, wherein the atmosphere warmed the ocean, without warming itself!

            And yet the ocean has warmed while the atmosphere less so. Do you surmise, then, that the ocean is not responsible for atmospheric temps?

          • mpainter says:

            Barry “Do you surmise, then, that the ocean is not responsible for atmospheric temps?”###

            Yet AGW meme has atmosphere warming ocean, remember? CO2, remember? How easy it is forget. How easy to talk first out of one side of your mouth, and then the other, for the sake of expediency in argument.
            You will be cured of that tactic if you hang around skeptics very much.

            SST warming is due to increased insolation via global reduction in cloud albedo, not CO2. AGW RIP.

          • barry says:

            You have no answer?

            the ocean has warmed while the atmosphere less so. Do you surmise, then, that the ocean is not responsible for atmospheric temps?

            Well?

          • mpainter says:

            Ignore my answer?

          • David Appell says:

            mpainter says:
            “SST warming is due to increased insolation via global reduction in cloud albedo….”

            Where is the data on the global reduction in cloud albedo?

          • barry says:

            Ignore my answer?

            Yep, if it avoids answering my original question.

            the ocean has warmed while the atmosphere less so. Do you surmise, then, that the ocean is not responsible for atmospheric temps?

            Well?

          • mpainter says:

            Barry, spike-hyping still?

            Did El Nino warm the atmosphere? Yep.
            Was it CO2? Nope.
            But barry’s gonna hype it anyway.

            Hype away, if that makes you feel any better.

            El Nino is the proof that SST determines atmosphere temperature, and not the reverse. It was not CO2 that caused the spike, although you like to pretend otherwise. Any more questions?

          • mpainter says:

            Also Barry, you need to stop the atrocious habit of talking out of one side of your mouth and then the other, simply for the sake of hyping the spike. CO2 does not cause El Nino, and you know that. Nor is 0.1 C difference in spikes of any significance, the effusion of zealous hype notwithstanding.

          • mpainter says:

            And barry, the impression that you convey is that “mpainter says nothing substantive” and never will because mpainter does not hype spikes. Thus your measure.

          • David Appell says:

            painter, where is the data on the global reduction in cloud albedo?

            You’ve made this claim before, but have never yet produced the data proving it…..

          • mpainter says:

            mpainter says:
            September 9, 2016 at 1:24 PM
            Higher temperature and lower soil moisture correlates with increased gluten content, as a percentage of the wheat berry. Lower temperature and higher soil moisture correlates with higher starch percentage. However, with increased moisture, the crop yield is increased, the higher starch content being the result of a surfeit of moisture and contributing most to the higher yields.

            It should be noted that wheat is usually grown under dry conditions, that is, soil moisture is not at high levels, such as the conditions that usually obtain in the great plains of North America.

            It can be concluded that the first priority of the wheat plant is to provide a minimum level of protein, in absolute terms, and when that requirement is met in the wheat berry, remaining growth capacity is directed toward providing the wheat berry extra starch. The starch not only supplies the energy for plant development, but is also essential for building cellulose and other types of tissue.

            So should David allow himself to be alarmed over variable protein/starch ratios in wheat? No, because such variation is commonplace, and it appears to be resolveable by increased fertilizer.

          • David Appell says:

            As usual, you completely avoided providing what was asked for, to support your earlier claim: the data on the global reduction in cloud albedo.

          • mpainter says:

            People are laughing at you, David.

          • barry says:

            mpainter,

            El Nino is the proof that SST determines atmosphere temperature, and not the reverse.

            So your position is that the oceans drive atmospheric temps and not the other way around.

            So why did the upper oceans warm in the same period that lower tropospheric temps seemed not to from about 1997/98 to 2015?

            If oceans are the driving factor, why didn’t the lower troposphere also warm in this period?

          • David Appell says:

            mpainter says:
            “Barry, spike-hyping still?”

            Shorter painter: I”m right if you throw out the data I don’t like.

  52. barry says:

    The pause, the hiatus, the end, anyway you put it, came from the IPCC. It had been noted by many others but the IPCC made it official following their 2012 5th review.

    2012 – Wrong. 2013.

    IPCC official comment:

    Atmosphere

    Due to natural variability, trends based on short records are very sensitive to the beginning and end dates and do not in general reflect long-term climate trends. As one example, the rate of warming over the past 15 years (19982012; 0.05 [0.05 to 0.15] C per decade), which begins with a strong El Nio, is smaller than the rate calculated since 1951 (19512012; 0.12 [0.08 to 0.14] C per decade).

    Summary for Policy Makers, AR5 2013.

    Short-term trends in lower atmospheric temperature may not reflect the long-term underlying signal. That message is clear. And it’s not the only time in AR5 that point is made.

    I’ve noticed that certain interested parties indicate this passage as a source of authority for the pause. When the passage is explained to them they immediately decide that the IPCC remarks are no longer authoritative, but instead ‘propaganda’ or the like. The flip-flopping is amusing to watch.

    • mpainter says:

      Short term trends: see step-up UAH data, circa 2000. Note that it connects two flat trends.

      • Gordon Robertson says:

        @mpainter..”Short term trends: see step-up UAH data, circa 2000. Note that it connects two flat trends”.

        The long valley before the step-up nullifies the 1998 EN spike. The step-up has never been explained and alarmists wanted to erase a similar step-up circa 1977 when the Pacific Decadal Oscillation was discovered. The step-up of ’77 revealed the PDO, termed The Great Climate Shift at the time.

    • mpainter says:

      Note that Barry cites summary for policy makers written by no scientist but a political hack. What’s his name. Thus Barry Schwartz.

    • Bindidon says:

      Barry is right: the shorter the time period, the less meaning its trend will have.

      Best example: the trends for RSS in Wood for Trees from 1998 till
      – 2007
      – 2010
      – 2014
      – 2016

      http://www.woodfortrees.org/graph/rss/from:1997/to/plot/rss/from:1997/trend/plot/rss/from:1997/to:2014/trend/plot/rss/from:1997/to:2010/trend/plot/rss/from:1997/to:2007/trend

      Bare nonsense.

    • Gordon Robertson says:

      @barry…”trends based on short records are very sensitive to the beginning and end dates and do not in general reflect long-term climate trends”.

      Barry…a flat trend is a flat trend. The IPCC admits the flat trend occurred between late 1997 and 2012. That’s 14 years. It is now close to 20 years excepting the recent EN spike.

      The IPCC tried to hide the flat trend as a hiatus, suggesting it is temporary. There was no discussion of the fact that catastrophic global warming as presented may have been a mistake.

      According to Lindzen, back in 2007 when the IPCC made the iconic statement that it was 90% likely humans are causing global warming, that statement was made by 50 politically-appointed lead authors who wrote the Summary for Policymakers. Consensus among the rest of the reviewers was to wait and see what happened.

      The IPCC has a peculiar practice of taking the Summary, written by 50 lead authors, and using it to re-write the main report from 2500 reviewers.

      • barry says:

        The IPCC has a peculiar practice of taking the Summary, written by 50 lead authors, and using it to re-write the main report from 2500 reviewers.

        The comments in the body of the report are accurately reflected in the SPM on the so-called pause or hiatus.

        Chapter 2:

        Owing to natural variability, trends based on short records are very sensitive to the beginning and end dates and do not in general reflect long-term climate trends. As one example, the rate of warming over the past 15 years (19982012; 0.05 [0.05 to +0.15] C per decade), which begins with a strong El Nio, is smaller than the rate calculated since 1951 (19512012; 0.12 [0.08 to 0.14] C per decade)Trends for 15-year periods starting in 1995, 1996, and 1997 are 0.13 [0.02 to 0.24], 0.14 [0.03 to 0.24] and 0.07 [0.02 to 0.18], respectively…

        http://tinyurl.com/knt4bun

      • David Appell says:

        Gordon Robertson says:
        “The IPCC tried to hide the flat trend as a hiatus, suggesting it is temporary. There was no discussion of the fact that catastrophic global warming as presented may have been a mistake.”

        Because there’s no evidence it IS a mistake.

        And you certainly haven’t presented any.

    • barry says:

      Note that Barry cites summary for policy makers

      IPCC was brought up by one of your ‘skeptic’ brethren, not me, as the ‘official’ announcement of the pause.

      http://www.drroyspencer.com/2016/09/uah-global-temperature-update-for-august-2016-0-44-deg-c/#comment-224034

      I remarked that as soon as you cite the IPCC and reveal what it actually says about the pause, the ‘skeptics’ flip-flop to ridiculing it.

      Looks like you saved Gordon the trouble of flip-flopping himself.

    • barry says:

      The IPCC admits the flat trend occurred between late 1997 and 2012.

      Please furnish the precise quote from the IPCC in its entirety, giving the proper reference. I suspect you’ve just lied here, but I’m keen to give you the fullest opportunity to corroborate your claim.

      • David Appell says:

        The IPCC 5AR was written before the SST changes and consequent surface changes published in Karl et al, Science (2015).

        So the 5AR is already out-of-date on this topic.

        • mpainter says:

          Karl et al resigned and is facing prison for scientific malfeasance. tsk tsk

          • David Appell says:

            Two lies in one small comment.

            What a hack.

          • mpainter says:

            Karl resigned. While under investigation. He will go to prison.

          • barry says:

            God, why do people lie in these debates? And when it’s so easily checked.

            Karl has retired. He turns 65 this year.

            The skeptiverse has spun it that he has ‘resigned’. WUWT says so in its headline while quoting the NOAA announcement in the main body of the article saying ‘retired’. Shameless spin, as usual, regurgitated by the mindless.

            The ‘investigation’ is a fishing expedition for emails that isn’t getting much traction lately. Even if it should get further traction, which is doubtful, no one is going to prison.

            Your comments are fantastical, painter. “Lies” is a pretty accurate descriptor, if one assumes you are of sound mind.

          • mpainter says:

            So those who don’t swallow Karl’s press release are liars, barry? Karl resigned at age 64, a few months after his colleagues informed on him.
            There is a lesson here: fools will call you a liar if you aren’t one of them.

          • David Appell says:

            mpainter says:
            “Karl resigned. While under investigation.”

            Another lie.

            See how easy it comes to people like painter?

          • mpainter says:

            No, David, you are the liar. Karl is under investigation by the House Committee on Science. He refused to produce his emails, remember? He was forced to. The investigation continues. Meanwhile, he resigns.

          • Nate says:

            Sure, congress should use their authority and subpoena power to harass anyone they don’t agree with. Its all in good fun-since they don’t really legislate anymore.

            I’d like to see all emails from all congressional committee chairs. Let’s all enjoy reading their nasty comments about their perceived enemies and let’s take them out of context! Lets read further about which campaign donors they gave time to so we can find out, or just make-up, all the quid-pro-quos they got.

          • mpainter says:

            It is the duty of congress to investigate corruption and malfeasance in government. You don’t like it? tsk,tsk.

          • Nate says:

            Yes they feel they can harass anyone. Even state governments!

            Now the House psuedoscience committee chair is trying subpoena several Attorney Generals of states. Why because they had the nerve to investigate a BFF of his, Exxon.

            Talk about your federal overreach-I would think that would be a real no no among conservatives..

          • barry says:

            So those who dont swallow Karls press release are liars, barry?

            Being suspicious is fine. Announce something as fact when you don’t really know the truth – that is lying, pure and simple. Those who regularly invent facts are liars. Try not to make a habit of it.

          • mpainter says:

            Barry, it sounds like you are calling me a liar because I say that Thomas Karl resigned while under investigation.
            Is this indeed what you mean?

          • barry says:

            Yes. Karl has retired according to himself and his final place of employment. Not resigned. What you intend to convey by saying he has ‘resigned under investigation’ is to connect his retirement to Lamar Smith’s subpoenaing of NOAA documents. There is nothing to corroborate this linkage. This is your first lie.

            The picture you wish to paint is of a deceitful public servant resigning under pressure of investigation and near the jaws of imprisonment for criminal activity. It’s the kind of narrative a hack journalist at some overbiased political rag might have wrought.
            This is your second lie.

            Your third lie is that he’s “facing prison.”

            He is not. No criminal charges have been laid in the first place.

            Fabrication upon fabrication.

            Liar.

          • I’ve known Tom Karl for many years, although rarely interacted with him. He was well into retirement age, and I suspect he just grew tired of the daily grind.

  53. mpainter says:

    Record winter red wheat harvests worldwide this year. Record corn and soybean harvests forecast for the U.S. this year.
    World biomass increasing estimated ten gigatonnes per year. Wonderful stuff, that CO2.

    Incipient La Nina is the guillotine blade for the AGW movement. The pause extends until cooling (forecast by some). No more El Nino spike-hype for 15-20 years. AGW RIP.

    Atmospheric CO2 is entirely beneficial, the more, the better. The alarmists squawk in dismay and deny that plant food is good for plants.

    • ren says:

      “On the eastern Tibetan Plateauin an area where it was thought that “climatically induced ecological thresholds had not yet been crossed”Silva’s team found that the increasing availability of soil nutrients and water from thawing permafrost is stimulating the chemistry of the wood in a species of fir trees (Abies faxoniana).
      “Our results confirmed the reports of local herders and showed a recent increase in tree growth that has been unprecedented since the year 1760,” Silva said. “These result demonstrate that under a specific set of conditions, forests can respond positively to human-induced changes in climate.”
      The findings were published Aug. 31 in Science Advances, an online, open-access publication of the American Association for the Advancement of Science.
      Nomads had reported their observations to study co-author Geng Sun of China’s Chengdu Institute of Biology in Sichuan, China. The research team traveled to the region in eastern Tibet where they found old-growth forests, smaller patches of trees and trees isolated on the perimeter of the forests.
      “We wanted to take a long term view of changes in tree growth across this gradient,” Silva said. “To do so, we combined tree-ring measurements with laboratory analyses to look for changes in growth as well as chemical signals of climatic change.”
      Those techniques provided a window on the history of the area’s tree growth. Dramatic increases in growth have coincided with pulses of tree establishment just outside of the forest range but apparently not yet on a broader regional scale, he said. Growth was rapid between the 1930s and 1960s, but even more accelerated in the last three decades.”

      Read more at: http://phys.org/news/2016-09-eastern-tibetan-forest-tree-growth.html#jCp

      • mpainter says:

        Interesting. “showed a recent increase in tree growth that has been unprecedented since the year 1760, Silva said.”###

        So ,pre – 1761 shows same rate of growth. What climate conditions obtained then?

        De Silva, author, allows the possibility of CO2 fertilization. Hopes to be able to make a more definitive study.

      • mpainter says:

        “Wheat is barely keeping up with population growth” …David ###

        See David, this is the sort of horsegrunt that has people laughing at you.

        • David Appell says:

          Except I don’t care who here laughs at me.

          You should try it.

          • mpainter says:

            Wheat consumption is barely keeping up with production growth. What is to become of us?

          • David Appell says:

            “Some 795 million people in the world do not have enough food to lead a healthy active life. That’s about one in nine people on earth.”

            https://www.wfp.org/hunger/stats

          • mpainter says:

            Utilize more fossil fuels===> more fertilizer, more efficient agronomy, more food production. Much of malnutrition is due to inadequate distribution of food surpluses. This could be addressed with more fossil fuels ===> better system of transport ===> more efficient distribution of food surpluses. Also, home refrigeration, to maintain perishable foodstuffs. Which means more fossil fuels for power generation.

            Fossil fuels also yield plant food as a by-product of their combustion. Think happy thoughts.☺

    • Bindidon says:

      http://science.sciencemag.org/content/328/5980/899.abstract

      Actually experienced in glasshouses where CO2 overhead increases plant growth: only C4 plants really profit from the increase, whereas C3 plants (95% on Earth) do not: CO2 overhead inhibits their nitrogen and phosphor intake.

      • ren says:

        Needed for photosynthesis is also light and heat.

      • An Inquirer says:

        So it seems that the science is not settled! See http://www.co2science.org/subject/b/summaries/biodivc3vsc4.php where it is stated that “C3 plants typically respond better to atmospheric CO2 enrichment than do C4 plants in terms of increasing their rates of photosynthesis and biomass production.”

        • David Appell says:

          Plants prosper by taking up nitrogen, not carbon. And enhanced CO2 inhibits that (as has been shown in many FACE experiments):

          Elevated CO2 (or low O2) atmospheric concentrations decrease rates of photorespiration and initially enhance rates of photosynthesis and growth by as much as 35% in most plants (C3 plants). This enhancement, however, diminishes over time (days to years), a phenomenon known as CO2 acclimation. Most studies suggest a strong link between CO2 acclimation and plant nitrogen status. Nitrogen is the mineral element that organisms require in greatest quantity.

          Carbon Dioxide Enrichment Inhibits Nitrate Assimilation in Wheat and Arabidopsis, Arnold J. Bloom et al, Science, 14 May 2010, Vol. 328, Issue 5980, pp. 899-903. http://science.sciencemag.org/content/328/5980/899.abstract

          • mpainter says:

            Plants “prosper” by CO2 fertilization: biomass increasing estimated ten gigatonnes per year. Record us wheat, corn, soybean harvest in 2016. Record red winter wheat harvest worldwide, 2016. David thinks that CO2 is plant poison instead of plant food. David wants everyone to think like him.
            What are we to think of David, tsk, tsk.

          • David Appell says:

            PLants prosper by nitrogen, as the experts in the paper I cited note.

            Higher yields don’t matter as much as higher nutritional yields. And those are threatened.

            PS: As FACE experiments show, plants assimilate to higher CO2 levels, and their they growth levels off.

          • mpainter says:

            mpainter says:
            September 9, 2016 at 1:24 PM
            Higher temperature and lower soil moisture correlates with increased gluten content, as a percentage of the wheat berry. Lower temperature and higher soil moisture correlates with higher starch percentage. However, with increased moisture, the crop yield is increased, the higher starch content being the result of a surfeit of moisture and contributing most to the higher yields.

            It should be noted that wheat is usually grown under dry conditions, that is, soil moisture is not at high levels, such as the conditions that usually obtain in the great plains of North America.

            It can be concluded that the first priority of the wheat plant is to provide a minimum level of protein, in absolute terms, and when that requirement is met in the wheat berry, remaining growth capacity is directed toward providing the wheat berry extra starch. The starch not only supplies the energy for plant development, but is also essential for building cellulose and other types of tissue.

            So should David allow himself to be alarmed over variable protein/starch ratios in wheat? No, because such variation is commonplace, and it appears to be resolveable by increased fertilizer.

          • David Appell says:

            Did you look up those FACE experiments yet?

          • mpainter says:

            When soil moisture is at critical levels, C3 plants benefit most from increased atmospheric CO2. Thus wheat production during droughts is above expectations. Isn’t that nice David? It works like this:

            burn more fossil fuel ===> increase atmospheric CO2 ===> increase plant food ===> grow more crops ===> feed more people

            The UN is hopeful of eliminating hunger eventually.
            Wonderful stuff, that CO2.

        • Bindidon says:

          Well, Inquirer: did you really not know yet who finances co2science.org? I can’t even imagine that.

          Tsk, tsk mpainter would say 🙂

        • barry says:

          Yes, rather than cite blogs with an agenda, just go to Google scholar and enter in neutral search terms. Hoping for review papers (papers which sum up research to date) I entered the search terms ‘review CO2 fertilization climate’ and narrowed the date range from 2010 to 2016.

          Plenty on offer.

        • mpainter says:

          All plants benefit from higher atmospheric CO2. C4 plants have a more efficient photosynthesis and have the advantage under conditions of low moisture, nitrogen, and CO2 and high temperatures. C3 plants have high water requirements and respirate 97% of their water uptake through stomata. During periods of drought, the stomata close. This prevents CO2 uptake, thus photosynthesis can’t occur.Presumably, higher levels of CO2 allows C3 plants to more efficiently utilize soil moisture when this is at a critical level. From Wikipedia. Preguntas?

          • mpainter says:

            Wheat, a C3 grass, has of late yielded beyond expectations during drought. This occurred in the U.S. several years ago when drought occurred but yields exceeded modeled forecasts. The higher than expected yields were attributed to higher CO2 levels.

          • David Appell says:

            Global per capita wheat production is flat for the last 20 years, at about 100 kg/person/yr.

          • mpainter says:

            Right David, you said that already. I copy my response from above:

            mpainter says:
            September 9, 2016 at 12:15 PM
            at about 100 kilograms per year

            Right, David, and how much wheat are we supposed to eat? Per year? On top of all that rice (118 kg/cap/year). And corn? Oats, potatoes, etc.

            It doesnt seem to occur to David that demand is any factor in wheat production. In fact, wheat surpluses are the rule, rather than the exception and these are used as livestock and poultry feed.

            But for David, any little innocuous fact has screech potential. If only you can spin it fast enough.

          • David Appell says:

            Clearly wheat production is barely keeping up with population growth.

            So any negative influence on that production, like climate change, threatens everyone.

            “Negative impacts of global warming on agriculture, health & environment far outweigh any supposed positives.” Smith et al. PNAS (2009), http://www.pnas.org/content/106/11/4133.full.pdf

          • mpainter says:

            People are laughing at you, David.

          • alphagruis says:

            It would be of interest if any of the amusing zealots of “the anthropic CO2 is all bad” religion might be so kind and explain where the scientific evidence that the prevailing 270-280 ppm CO2 level till 19 th century was in any respect an optimum actually is.

            No speculative “numerical simulation” bullshit allowed, even if peer-reviewed.

          • Toneb says:

            “N2 and O2 do not absorb IR, except for a brief time when their molecules collide.”
            And:
            And please, David Appell do not make further horseshit fly like here (the above)

            Plain wrong because:

            http://scied.ucar.edu/carbon-dioxide-absorbs-and-re-emits-infrared-radiation

            Only *right* down the rabbit-hole Denialist physics.
            The stuff invented by them that makes the World conform to their belief that the GHE is not happening
            “Dragon-slayer” mentality that you can find interesting psychological studies of.
            Even on “Denialist” Blogs…..
            http://joannenova.com.au/2012/10/a-discussion-of-the-slaying-the-sky-dragon-science-is-the-greenhouse-effect-a-sky-dragon-myth/

          • alphagruis says:

            Toneb, I don’t know what you’re talking about.

            I neither question GHE nor the warming effect of CO2 but track idiots and what Appell told us in that comment was plain nonsense for a physicist like me.

            Neither N2 nor O2 absorb IR upon colliding.

            Collisions generally excite or de-excite non radiatively vibration-rotation modes of the molecules and ensure local thermodynamic equilibrium.

          • alphagruis says:

            Moreover what follows in that same comment by Appell it is also utterly wrong . Diatomic molecules such as CO, NO, HF, HCl etc all have electric dipole allowed strong IR transitions just as triatomic ones like C02.

          • An Inquirer says:

            Over the last couple of decades, global wheat production has increased approximately from 1600 million tons to 2300 million tons. Thank God (or thank goodness) for increased levels of CO2 which has helped this increase, insured that production per capita has not decreased, and has reduced hunger world wide. Literally hundreds of non-controversial studies have shown the beneficial impact of increased CO2 on wheat production. CAGW activists go into great contortions trying to dismiss this benefit of higher CO2 levels, but those contortions undermine their overall credibility.

          • David Appell says:

            An Inquirer says:
            “Over the last couple of decades, global wheat production has increased approximately from 1600 million tons to 2300 million tons.”

            Nope.

            It’s been 500-700 million metric tons.

            Source:

            https://en.wikipedia.org/wiki/International_wheat_production_statistics

          • mpainter says:

            World cereal production is currently over 2400 million tons. I believe Inquirer must have given cereal production figures.

        • barry says:

          Preguntas?

          Please provide a link to the wiki page you’re referencing.

          • mpainter says:

            Two Wikipedia articles, C3 & C4 photosynthesis

          • barry says:

            Are not net savvy enough to provide the links, or are you too arrogant to do what netiquette requires?

          • barry says:

            C4 plants are able to more efficiently fix carbon in drought, high temperatures, and limitations of nitrogen or CO2, while the more common C3 pathway is more efficient in the other conditions.

            https://en.wikipedia.org/wiki/C4_carbon_fixation

            C3 plants cannot grow in very hot areas because RuBisCO incorporates more oxygen into RuBP as temperatures increase. This leads to photorespiration (also known as the oxidative photosynthetic carbon cycle, or C2 photosynthesis), which leads to a net loss of carbon and nitrogen from the plant and can, therefore, limit growth. In dry areas, C3 plants shut their stomata to reduce water loss, but this stops CO2 from entering the leaves and, therefore, reduces the concentration of CO2 in the leaves. This lowers the CO2:O2 ratio and, therefore, also increases photorespiration.[citation needed] C4 and CAM plants have adaptations that allow them to survive in hot and dry areas, and they can, therefore, out-compete C3 plants in these areas.

            https://en.wikipedia.org/wiki/C3_carbon_fixation

            Over 90% of plants use C3 carbon fixation, compared to 3% that use C4 carbon fixation

            https://en.wikipedia.org/wiki/Photosynthesis

            Seems to me that if the world gets hotter, growing zones for c3 plants change.

          • barry says:

            That, by the way, is how you reference stuff, Michael Painter.

          • gbaikie says:

            “Seems to me that if the world gets hotter, growing zones for c3 plants change.”

            Mostly poleward and mostly warmer oceans.
            So raise the frostline and make areas which can’t grow trees, grow
            trees [raise treeline].
            But very unlikely to able to grow oranges in Oregon within a century.

          • mpainter says:

            Cut & paste, barry? Is that what impresses you? Doesn’t impress me.

            Say “thank you for the reference, mpainter.” That is good manners.
            Do not complain. That is bad manners.
            But perhaps yo mammy forgot to explain that to you.

          • barry says:

            Michael, providing links is god etiquette and part of the requirement when furnishing corroboration for a claim.

            Your habit of leaving others to do the footwork for your claims (eg, “it’s upthread”) is boorish, poor form, and designed to annoy. In the future, don’t be a twerp, just link what you’ve immediately read and cut the smug bollocks. Think less about scoring points and more about making them. That’s what honest interlocutors do.

          • mpainter says:

            You are welcome

          • mpainter says:

            “Think less about scoring points and more about making them.” Says barry. # # #

            Okay, I’ll think about …uh, what?

          • mpainter says:

            By the way, my name is not michael

          • barry says:

            My apologies. What is it?

          • David Appell says:

            Painter perfers to stay anomymous. Easier to insult people that way.

          • barry says:

            I was curious because he has asked me to reveal my name when I asked him to bet me. Apparently it is important to him in some way.

  54. Bindidon says:

    We are now prudently entering la Nina mode for the first time in this 2015-2016 edition:

    http://www.bom.gov.au/climate/enso/monitoring/soi30.png

  55. MikeR says:

    See, I knew you could it.

  56. ren says:

    Circulation in the atmosphere drives the rotational motion of the Earth and changes in air density due to changes in the amount of water vapor and ozone.
    http://mp1.met.psu.edu/~fxg1/SAT_NHEM/animwjap.html

  57. David Appell says:

    Chance of a La Nina this fall & winter now forecasted to be less than 50%:

    http://davidappell.blogspot.com/2016/09/la-nina-looking-even-less-likely.html

  58. Lewis says:

    Gentlemen, some of the arguments made are completely amusing although not quite LOL amusing. The debate devolves into guesses about what the climate/weather, in the instant case Nina, Nino, as if the prediction of what might occur is of utmost importance. Hardly and it will only be a few months before we know the answer.

    To distill the arguments to their basic: I’m right and you’re wrong – na na na.

    More interesting are the discussions about C3 C4 plants. David complains that wheat production has been steady at 100 KG per person per year which, considering population growth, is a fair amount of increase, but not according to him.

    The questions really comes down to: how will mankind survive?
    The answer is: if we are dictated to from above, only a few will. If not, many will. The authoritarians are winning and are using Politically Correct McCarthyism actions to enhance their position.

    Vote for Trump – seek freedom and self-reliance.
    In the interest of satisfying Barry’s demand for netiquette, I offer you: http://www.claremont.org/crb/basicpage/the-flight-93-election/

  59. ren says:

    The 11 year solar cycle signature on wave-driven dynamics in WACCM

    NASA Astrophysics Data System (ADS)

    Cullens, Chihoko Y.; England, Scott L.; Garcia, Rolando R.

    2016-04-01

    This study describes the influence of the 11 year solar cycle on gravity waves and the wave-driven circulation, using an ensemble of six simulations of the period from 1955 to 2005 along with fixed solar maximum and minimum simulations of the Whole Atmospheric Community Climate Model (WACCM). Solar cycle signals are estimated by calculating the difference between solar maximum and minimum conditions. Simulations under both time-varying and fixed solar inputs show statistically significant responses in temperatures and winds in the Southern Hemisphere (SH) during austral winter and spring. At solar maximum, the monthly mean, zonal mean temperature in the SH from July to October is cooler (~1-3 K) in the stratosphere and warmer (~1-4 K) in the mesosphere and the lower thermosphere (MLT). In solar maximum years, the SH polar vortex is more stable and its eastward speed is about 5-8 m s-1 greater than during solar minimum. The increase in the eastward wind propagates downward and poleward from July to October in the SH. Because of increase in the eastward wind, the propagation of eastward gravity waves to the MLT is reduced. This results in a net westward response in gravity wave drag, peaking at ~10 m s-1 d-1 in the SH high-latitude MLT. These changes in gravity wave drag modify the wave-induced residual circulation, and this contributes to the warming of ~1-4 K in the MLT.
    http://www.science.gov/topicpages/y/year+solar+cycle.html

  60. ren says:

    “El Nio refers to anomalous warming in the eastern equatorial Pacific, and has been studied
    for nearly five decades (Bierknes 1969). Owing to its teleconnection, El Nio has global
    effects, especially for atmospheric circulation anomalies in the tropics and extra-tropics.
    However, another type of El Nio has also been recognized in recent studies, whose
    maximum warming arises in the central Pacific and then extends eastward over time (Ashok
    and Yamagata 2009). This new type of El Nio has its own spatial pattern, teleconnection,
    and climate effect, and, in particular, has a strong decadal period (Ashok, Behera, and Rao
    2007; Kug, Jin, and An 2009). However, its mechanism is not as clear as that of traditional El
    Nio events. Generally speaking, the new type of El Nio is referred to as El Nio Modoki
    and the traditional El Nio as eastern Pacific El Nio (EP El Nio) (Ashok, Behera, and Rao
    2007; Kao and Yu 2009).
    In early May 2014, a positive SST anomaly appeared in the equatorial central-eastern
    Pacific, and was at the time thought to possibly be a very strong El Nio, like the one seen in
    1997/98 (NASA 2014). However, in the subsequent months of 2014, the SST anomaly
    unexpectedly fell back to a neutral state (Australian Government Bureau of Meteorology
    2014). The role of off-equatorial surface temperature anomalies has been noted (Zhu et al.
    2016). The arrival of weak El Nio conditions was then confirmed in May 2015 (NOAA
    2015b), and it eventually developed into one of the strongest El Nio events on record. Some
    studies and reports have suggested that this 2015/16 El Nio event will return to a neutral
    state by late spring or early summer 2016, with a chance for La Nia development by fall
    (International Research Institute for Climate and Society 2016). Alongside these events, in
    2014, solar activity reached its 24th solar cycle peak.
    Considering the influence of solar activity, we analyzed the characteristics of the 2015/16
    El Nios evolution in this study. It is known that the positive SST anomaly first arose in the
    central equatorial Pacific and northeastern Pacific near the west coast of North America
    before the onset of the 2015/16 El Nio event, which looked like the onset of an El Nio
    Modoki event (NOAA 2015a). However, it changed into an EP El Nio at a later time. Based
    on our previous work, it is possible that solar activity modulates El Nio Modoki events on
    decadal timescales. Thus, here, we investigated whether or not there was any influence of
    solar activity on the 2015/2016 El Nio event, and, if so, how it worked. Specifically, based
    on statistical analysis of historical data, we studied the evolutionary features of the 2015/16
    El Nio event, in the hope of gaining greater insights into the possible impact of solar
    activity
    http://www.tandfonline.com/doi/pdf/10.1080/16742834.2016.1231567?needAccess=true

  61. barry says:

    Trend since 1998:

    UAH6.5 ordinary least squares regression = 0.04C/decade (+/-0.185)

    • barry says:

      RSS trend for same metrics is 0.03C/decade

      I’m told UAH is superior…

      • AndyG55 says:

        Both indistinguishable form ZERO WARMING.

        Thanks baza 🙂

        • barry says:

          Both also indistinguishable from warming of 0.18C/decade and coooling of -0/18C/decade.

          IOW, trend = “we don’t know for this short a time period.”

          Not many people here understand the uncertainty intervals in trend analysis. Maybe you’re smarter than them.

          • mpainter says:

            Yet you spike-hype this insignificant trend, barry. Still talking out of one side of your mouth and then the other.Tsk,tsk.

            You acknowledge that there is no observable trend in the data and then dispute that the trend is flat.

            First one side, and then the other.

          • barry says:

            “Spike-hype”

            Drivel.

            “You acknowledge that there is no observable trend in the data and then dispute that the trend is flat.”

            Drivel.

            You’re not even close to articulating what I’ve been saying. And it’s not very hard to state my view correctly if you read any number of my comments including the one just above. Clue: it’s the bit in quotes after the = sign. I promise to let you know if you ever get my view right.

          • mpainter says:

            18 years with no warming. Hard facts for a global warmer. Two flat trends connected by a step-up circa 2000. Even harder facts.
            Watch “me no warmer” Barry have a fit when you poke his nose in hard facts.

    • David Appell says:

      No barry.

      UAH LT (v6beta5) trend since 1/1999 = 0.11 C/decade

      95% confidence level = 0.04 C/decade (statistical uncertainty only, no autocorrelation)

      statistical significance = 99%.

      • barry says:

        “No barry” = “I don’t like your start date”

        Statistical significance looks like complete bollocks to me.

        RSS from 1999 = 0.092C/decade +/-0.179

        No way in hell that is a statistically significant result. Not even close. UAH6.5 will be very similar.

        Anyway, I’m interested in the skeptical meme on temp trend since 1998. I’ll be including it quite a bit as the months roll on.

  62. barry says:

    I posited upthread that the warming trend in UAH6.5 (and RSS) global lower trop temp data since 1998 would very likely continue. This was cast as wishful thinking, but there is a statistical basis, even if the warming from GHG increase is very small.

    For the 1998 trend to become negative again by the end of next year the monthly anomalies from Sept 2016 to Dec 2017 would have to average -0.05C. How likely is this?

    Following the 1998 super el Nino, the months Sept ’98 to Dec 1999 averaged out at 0.04C. For the 12 months of 1999, the average anomaly was -0.02C.

    Thus, to get a negative trend by Dec 2017, the trajectory to cooler temps has to be steeper than after the last super el Nino. The trajectory is not steeper at present, and the predicted Nina – if there is one – looks to be a weak one and short-lived.

    How likely is it to get a 16 month period averaging -0.05C or less, using only the years after 1998 in the UAH record (Beta 6.5 data)?

    There have been 8 16-month periods that have been this cool or cooler, all centred on 2008, a year of a very strong la Nina, possibly the strongest on record.

    The coldest of the 16-month periods was -0.061C average.

    In simple terms, 2017 needs to be almost as cool as 2008 to yield a negative trend since 1998.

    I think that’s quite unlikely.

    And I don’t think the surface is going to cool towards 2008 values in the longer term, Even if climate sensitivity is small.

    I’m willing to be (whatever you think is reasonable) that we’re not going to see a negative trend from 1998 again – barring a massive volcanic eruption in the next few years.

  63. barry says:

    I ran a regression copying the same UAH6.5 lower tropospheric values per month from September 1998 to March 2001, laying them in for September 2016 to March 2019. I wanted to paste the double-dip, or extended la Nina following the 97/98 el Nino on to the coming months to see if a repeat of that extended la Nina would bring us a negative trend by March 2019.

    Yep, it would. It would give a trend of -0.01C/decade.

    So all that needs to happen is for a 2.5 year, deep la Nina to occur from now on to bring us a negative trend again by March 2019.

    I’m going to stick with my bet.

    • David Appell says:

      You made up numbers, and then calculated a trend from then?

      Not copacetic.

      • Rick says:

        Isn’t that just forecasting?

        • barry says:

          Others have been forecasting – and making absolute predictions. I’ve picked up on these and been trying out some VERY crude statistical analysis, layman stuff. I don’t care whether this year ends up warmer or cooler than 1998, or whether la Nina comes or not, or whether the trend since 1998 goes back to negative or not. But I fool around with numbers and try to figure the likelihood of any of these things happening because others are making unsubtle noise about it. Someone is going to be wrong in a little while, and I’m curious to see what happens when they are.

    • barry says:

      I made up no numbers, David. I ran a few tests based on previous data – the global temp anomlies concurrent with la Ninas and cold years, and the global anomalies immediately following the 1998 el Nino. Trying to gauge the likelihood of the slight positive trend since 1998 going negative again any time soon.

      Been doing that for a few months now as well as following ENSO forecasts. Mainly because people at various blogs – climate partisans mostly – have made absolute predictions about what is to come. Mpainter’s comments are typical of this, for example: definitely getting a la Nina this year, definitely not going to a get a record year UAH global temps, the cool trend will definitely return once the la Nina has kicked in and run for a few months…

      Dr No trends the other way – he’s keen to see a new record year, the failure of the la Nina etc.

      I want to see how the fatally convinced behave when their predictions fail. As there are different stripes, someone is going to be wrong. That’s when we find out their mettle.

  64. Dan Pangburn says:

    Science shows that non-condensing ghg (including CO2) have no significant effect on climate. Water vapor, the only ghg which condenses, is one of the three significant climate drivers.

    The average amount of time that passes between when a molecule of CO2 in the atmosphere absorbs a photon until it emits one (the relaxation time) is about 6 microseconds http://onlinelibrary.wiley.com/doi/10.1002/qj.49709540302/abstract . Heat is conducted in the atmosphere by collisions between molecules. The average time between collisions of molecules in the atmosphere at sea level conditions is less than 0.0002 microseconds http://hyperphysics.phy-astr.gsu.edu/hbase/kinetic/frecol.html .

    Thus it is about 30,000 times more likely that a collision will occur (thermal conduction) than a photon will be emitted. The process of a molecule absorbing the energy in a photon and conducting the energy to other molecules is thermalization. Thermalized energy carries no identity of the molecule that absorbed it.

    Thermalization explains why CO2 has no significant effect on climate.

    • David Appell says:

      “Science shows that non-condensing ghg (including CO2) have no significant effect on climate.”

      False – science shows the opposite:

      Radiative forcing measured at Earths surface corroborate the increasing greenhouse effect, R. Philipona et al, Geo Res Letters, v31 L03202 (2004)
      http://onlinelibrary.wiley.com/doi/10.1029/2003GL018765/abstract

      “Observational determination of surface radiative forcing by CO2 from 2000 to 2010,” D. R. Feldman et al, Nature 519, 339343 (19 March 2015)
      http://www.nature.com/nature/journal/v519/n7543/full/nature14240.html

      Press release for Feldman et al: “First Direct Observation of Carbon Dioxides Increasing Greenhouse Effect at the Earths Surface,” Berkeley Lab, 2/25/15
      http://newscenter.lbl.gov/2015/02/25/co2-greenhouse-effect-increase/

      • ren says:

        David Appell what is there with hurricanes in the Atlantic?

      • Dan Pangburn says:

        David – Apparently you lack the engineering science skill, with understanding of the Kinetic Theory of Gases and a smidgen of quantum mechanics, which might enable you to understand thermalization and realize that your three references are wrong. (The last two refer to the same erroneous assessment.)

        Likely sources of their errors are faulty modeling and/or invalid assessment of the influence of increasing water vapor.

      • barry says:

        Because the atmosphere has a temperature warmer than absolute zero it radiates. It radiates in every direction. Grasping this has helped some people.

        • Dan Pangburn says:

          Failing to know that non-ghg gas molecules such as oxygen and nitrogen do not absorb or radiate at terrestrial radiation wavelengths has misled a lot of folks. Only ghg and particulates (rain, snow, dust, cloud particles, etc.) “radiate in every direction”.

    • MikeB says:

      Dan
      You are correct in saying that an excited CO2 molecule is more likely to be thermalized than to emit a photon. What you are missing is that the process is reversible. CO2 can be put back into an excited state due to collisions with other air molecules.

      The proportion of CO2 molecules in an excited state at any one time is constant and is a function of the local air temperature.

      This enables us to determine air temperature by measuring radiation intensity at 15 microns and comparing that to what would be expected from a blackbody. This is how we know the temperature at the Effective Radiating Level when viewing outgoing radiation from a satellite.

      Raymond T. Pierrehumbert explains it very well in his paper, Infrared radiation and planetary temperature
      https://geosci.uchicago.edu/~rtp1/papers/PhysTodayRT2011.pdf

      Or maybe you think he is wrong too?

      • Dan Pangburn says:

        Reverse thermalization is noted in Figure 1 and in the third and fourth paragraphs after Fig 2.

        Thermalized energy carries no identity of the molecule that absorbed it. The first paragraph after Fig 1 explains why, at low altitude, nearly all reverse thermalization is to water vapor and at extremely high altitudes, some of the reverse thermalization is to CO2.

        I am unaware of and have been unable to find anything relating to CO2 molecules and measuring air temperature. Could you provide a reference?

        RTP does not appear to be aware of thermalization. Also he appears to be a proponent of the faulty GCMs and failed AGW theory blaming CO2.

  65. ren says:

    Next cold fronts will attack the United States from the northwest.

  66. ren says:

    Last Seven Days Satellite OHC Products Images:
    http://www.ospo.noaa.gov/Products/ocean/ohc_spac.html

  67. ren says:

    Atmospheric anomalies over the tropical Pacific Ocean largely indicated ENSO-Neutral conditions. The traditional Southern Oscillation index and the equatorial Southern Oscillation index were weakly positive during August. The lower-level winds were near average, while the upper-level winds were anomalously westerly in a small region to the east of the International Date Line. Convection was suppressed over the western and central tropical Pacific, although less suppressed compared to last month (Fig. 5).
    http://www.cpc.ncep.noaa.gov/products/analysis_monitoring/enso_disc_sep2016/ensodisc.shtml

  68. barry says:

    The ‘pause’ talk was way overblown throughout, IMO.

    Nevertheless, I’ve run with it as ‘skeptics’ pitch it to some degree.

    Christopher Monckton in February: “Dr Roy Spencers UAH v.6 satellite lower-temperature dataset shows the Pause has already (just) disappeared.”

    Christopher Monckton in July:

    “I cannot tell you whether there will be a la Nia later this year and into next year. But if there is, and if it is anything like as noticeable as it was following the 1998 temperature spike, then by this time next year the Pause will have reappeared, and will be close to 20 years in length.”

    The wishful thinking in the latter comment is what I’m following up on. This outlook has cropped up regularly in comments at this blog, so it’s a good place to check in with updates.

    • mpainter says:

      No, the AGW talk was overblown.where is it? Instead, we see the 18 year pause.

    • mpainter says:

      Without another step-up, as circa 2000, global warming is belly-up.
      AGW RIP

      • barry says:

        Oh come on. With another step-up AGW would still be belly-up in your head. There is no prediction you would agree with that could prove it.

        Is there?

        What would it take for you to concede that AGW is real?

        (Haven’t you already? Your opinion seems to rest on shifting sands…)

        • Kristian says:

          barry says, September 12, 2016 at 3:54 PM:

          What would it take for you to concede that AGW is real?

          Why would one ‘concede’ that something that obviously and evidently isn’t happening still really is!?

          The relevant data from the Earth system shows unequivocally that any warming is due to an increase in solar input (ASR) and that Earth’s output (OLR) isn’t reduced relatively to tropospheric temps at all over time. It rather tracks it tightly.

          Showing us that the real causal chain here goes like this:
          Increased heat INPUT (from the Sun) -> warming -> increased heat OUTPUT (from the Earth)

          So there is no trace of any increase in ‘insulation’ (“enhanced GHE”) over the last 30+ years, according to the data. Only of an increase in ‘heating’ from the Sun.

          Your “evidence”, barry, comes from models plus looking at the temperature record and saying “Wow, it’s really warm now. So it MUST be CO2! Because that’s what my hypothesis says.”

          • barry says:

            That last sentence. Suddenly you don’t seem half as bright as you did before. Not just that it’s completely wrong about my views, it’s basic trolling. What a shame.

            There’s plenty of evidence of enhanced GHE.

            But before we get into that, what data are you referring to re solar input for the last 30 years? Because insolation can be reckoned a number of different ways. Please clarify.

          • Kristian says:

            barry says, September 13, 2016 at 5:10 AM:

            (…) it’s completely wrong about my views (…)

            Really? In what way?

            There’s plenty of evidence of enhanced GHE.

            Name ONE piece of observational evidence.

            (…) what data are you referring to re solar input for the last 30 years?

            Heard of ERBE and CERES?

            Because insolation can be reckoned a number of different ways. Please clarify.

            If you’d had any knowledge regarding this subject, you would know that ASR (“absorbed solar radiation”) is the only relevant parameter. ASR is basically TSI minus albedo.

          • barry says:

            You are wrong about my views in every way. I’ve been reading widely on the general topic of AGW for 8 years. GCMs are not required to understand the principles involved. The evidence comes from paleoclimate, physics, spectroscopy, changes in the physical world, like cooling lower stratosphere over 30+ years while the troposphere has warmed in the same period, different rates of warming for summer and winter (winters warming faster globally av), different rates of warming for days and nights (over 50+ years)….

            That’s just the tip of the iceberg. If long-term warming is caused by increased insolation then the system isn’t responding as expected to that source – summers should warm more than winters, days more than nights.

            CERES/ERBE – provide very rough estimates of atmospheric radiant fluxes. The coverage is incomplete, physically and temporally.

            Do you happen to know what global cloud cover was like for the last year? I’d like to compare it against the high surface/tropospheric temps through the recent el Nino.

          • Kristian says:

            barry says, September 13, 2016 at 4:24 PM:

            You are wrong about my views in every way.

            You need to be a bit more specific than that, barry.

            GCMs are not required to understand the principles involved.

            And no one claims they are. Because they do NOT independently derive “the principles involved”. They’re not meant to. Rather the opposite. Their output is directly derived from “the principles involved”. They make their runs as if “the principles involved” were already empirically shown to be true. And so they are fundamentally begging the question. Completely circular.

            The evidence comes from paleoclimate (…)

            Really? The evidence of current AGW comes from “paleoclimate”?

            (…) physics (…)

            Really? And what part of physics is it that tells us that if you simply increase the amount of CO2 in the real-world atmosphere, then this MUST lead to a net rise in the surface T_avg?

            (…) spectroscopy (…)

            Really? So you can just look at an EM spectrum as *see* AGW, that is, global warming caused by an “enhanced GHE”.

            (…) changes in the physical world, like cooling lower stratosphere over 30+ years while the troposphere has warmed in the same period (…)

            The lower stratosphere hasn’t cooled at all for the last 21-22 years, barry. Not since the aftereffect of the Pinatubo eruption ended. And you don’t know what warmed the troposphere. That’s what we’re trying to find out.

            (…) different rates of warming for summer and winter (winters warming faster globally av) (…)

            Sorry, but this is simply not true, barry. Check the data. Since the aftermath of the Great Pacific Climate Shift of 1976/77, summers have warmed just as fast as winters.

            (…) different rates of warming for days and nights (over 50+ years) (…)

            Again, not true since the aftermath of the Great Pacific Climate Shift of 1976/77. Since then, days and nights have warmed at the same rate. Check the data, barry.

            Thats just the tip of the iceberg.

            There’s no tip and there’s no iceberg, barry. Keep searching.

            If long-term warming is caused by increased insolation (…)

            There’s no “if” here, barry. Long-term warming IS caused by increased insolation. You know how we know? Simple observational radiation flux data from the real world. ERBE+CERES, ISCCP.

            (…) then the system isn’t responding as expected to that source summers should warm more than winters, days more than nights.

            Why? Heard of the oceans, barry? Internal energy storage? Heard of atmospheric circulation? Internal energy transport?

            CERES/ERBE provide very rough estimates of atmospheric radiant fluxes. The coverage is incomplete, physically and temporally.

            The ANOMALY estimates aren’t “rough” at all. They are actually very precise. That’s why and how we are able to track the long-term evolution of the radiant fluxes at the ToA with such certainty. The ‘incomplete coverage’ argument is weak, to put it mildly, and appears more like an opportune excuse to dismiss or avoid inconvenient observations. I would like to see you back it up with anything except your own assertions …

          • barry says:

            You seem keen to use shorter periods of data than are available. Why is that? For diurnal and seasonal differences, you need more data statistically than for total global, because there is more variance. If you use data beginning 1960 or earlier, you get nights warming faster than days, and winters warming faster than summers. Use shorter time periods (or use regional instead of global data) and you get more mixed results. That’s not unexpected.

            We are talking about long-term climate effects. More data is better.

            Why do sekptics always airbrush out available instrumental data?

            They’ll wail and complain that weather stations were ‘thrown out’ of the instrumental record, but are quite happy to do it themselves if doing so seems to buttress their point of view.

            It looks blatantly opportunistic – dishonest – every time I see it.

            Really? The evidence of current AGW comes from paleoclimate?

            Yep. The correlation between CO2 and temps over the Quaternary ice age transitions, where orbital forcing triggered the transitions and CO2 contributed to further warming. Insolation forcing (change of focus of insolation) is too small to have caused global ice sheet reduction, and to focused to one hemisphere or other to cause effects globally.

            You want evidence, this is some right here. Part of a long list.

            I trust you understand what ‘evidence’ means. Stupid people think it means ‘proof’.

          • mpainter says:

            Barry, your confusion is complete. CO2 did not cause the Holocene warming. That is backwards. You mistake bald assertions (contrary to the facts) for evidence.

          • Kristian says:

            barry says, September 15, 2016 at 3:37 AM:

            If you use data beginning 1960 or earlier, you get nights warming faster than days, and winters warming faster than summers. Use shorter time periods (or use regional instead of global data) and you get more mixed results. Thats not unexpected.

            First of all, I use global data. Don’t worry about that. Second of all, there’s a VERY good reason why I started from the Great Pacific Climate Shift of 1976/77, barry. That’s when “the modern era of global warming” commenced. There was no ‘global warming at all from 1960 to 1976, there was global cooling:
            https://okulaer.files.wordpress.com/2016/09/trend.png

            barry, there has to be actual ‘global warming’ going on for you to be able to use the “nights warm faster than days, and winters warm faster than summers” argument. And during the modern era of global warming, nights have NOT warmed faster than days, and winters have NOT warmed faster than summers, globally.

            So try again.

            The correlation between CO2 and temps over the Quaternary ice age transitions, where orbital forcing triggered the transitions and CO2 contributed to further warming.

            Where in the data do you see that “CO2 contributed to further warming”, barry? All we ever see is that TEMPERATURE leads and CO2 follows. Cause and effect.

            This is seriously one of the stupidest warmist ‘arguments’ for AGW!

      • mpainter says:

        There is no AGW. You have none to show. The temperature record is best explained by natural processes. The AGW hypothesis fails conspicuously. You have warming on the brain. There is none, your spike-hype notwithstanding.

        • barry says:

          “spike-hype”

          Meaningless drivel.

          So there is nothing in the world that could change your mind. No set of conditions that would make you think that AGW is validated.

          You should think about what that position infers about your ‘skepticism.’

          • mpainter says:

            I agree that your spike-hype is drivel.
            You like to imagine that El Nino is CO2.
            Don’t expect skeptics to share your delusion. You say things like ” the pause is overrated”. 18 years. Doesn’t count, you say.

            AGW?
            Got evidence?
            Nope, none.

          • barry says:

            You like to imagine that El Nino is CO2.

            Again and again and again and again you attribute views to me that are completely off the mark.

            You are no skeptic, sir. Not even close.

          • barry says:

            There is plenty of evidence for AGW. None of it relies on el Nino.

            Conversely, much of what passes for skeptical argument against AGW does rely on el Ninos – particularly the 1997/98 el Nino.

            ‘Skeptics’ have yammered on and on about 97/98 for a few years. It’s bleeding obvious who is trying to build a climate case out of el Ninos.

            You have it entirely the wrong way around, painter.

          • mpainter says:

            Barry says “there’s plenty of evidence” # #

            None yet. Nothing. You have none. Your system of beliefs does not constitute evidence, cultist.

          • barry says:

            Yes, plenty. Of evidence.

            Well done for using the right term.

          • barry says:

            CO2 is a greenhouse gas.
            We have empirical measurements of its ability to absorb and re-emit IR.
            More in the atmos should cause warming at the surface, even if only a little (low climate sensitivity).
            There is more CO2 in the atmos since the industrial revolution.
            That increase is almost entirely anthropogenic.
            The global surface has warmed since the industrial revolution.

          • barry says:

            Globally, long term:

            Winters have warmed more than summers – consistent with GHG warming, not with warming from increased insolation.
            Nights have warmed faster than days – consistent with GHG warming, not with insolation warming.
            The stratosphere has cooled while the surface/lower trop has warmed – consistent with GHG warming, not with insolation warming.

          • barry says:

            Satellites see darkening of CO2 IR bands over time.

          • barry says:

            Ground instruments see back radiation brightening in the bands associated with CO2.

          • barry says:

            Paleoclimate record shows temps and CO2 moving together – when tectonic parameters are stable, as in the last few ice ages. (Yes, CO2 lags initial warming from orbital forcing, but otherwise tracks the large swings)
            In-system fluctuations even out over the long-term. Can’t be ENSO, AMO, PDO making it warm over a hundred years.

          • barry says:

            All the above is evidence of AGW.

          • mpainter says:

            Your doctrinaire “evidence” does not hold water. Hockey sticks, the claim that CO2 caused the ice ages, usual blather, all thoroughly refuted.
            You refuse to acknowledge natural variability of climate, attributing all changes to CO2.
            Hard-core AGW is your science, which is pseudoscience.

          • barry says:

            No. Rubbish. I don’t refuse to acknowledge natural variability. On the contrary, I bring it up – ice ages.

            That the ‘skeptic’ mind can be so dense…

            And again, I write plain English and you still can’t read or understand properly. I said of ice ages, “Yes, CO2 lags initial warming from orbital forcing, but otherwise tracks the large swings.”

            And you announce I’ve said CO2 causes ice ages. If you had any handle on this topic, or any handle on reading comprehension, you would immediately understand that I’m saying orbital forcing triggers ice age shifts.

            The ‘Hockey Stick’ meme is about millennial temp reconstructions. I didn’t mention that topic at all. You’re just throwing buzzwords around.

            You’re not a skeptic. You’re an ‘AGW skeptic.’ You react to certain phrases, blind to what’s actually said, and trot out comments that miss the point. Unless you can articulate the view you are opposing, what you say is entirely wasted. You are a long way from getting my view right.

          • mpainter says:

            El Chichon had the same effect: a permanent step-down cooling of the stratosphere, circa 1985, then flat trend to Pinatubo, ten years later and another stepdown; no cooling since then. You say that it was CO2. Easy to do when one has CO2 on the brain. Your evidence flops.

          • mpainter says:

            You have revealed yourself, citing “30 years of warming” which period includes the eighteen year pause.
            Next, you dismiss 21 years of no cooling in the stratosphere as cherry-picking.

            I rest my case. You are no scientist, you are a head crammed full of AGW doctrine.

          • mpainter says:

            Your paleoclimate “evidence” is nothing. A recitation which only serves to refute your claim of evidence. You cite natural variability and expect everyone to share your assumption that “CO2 did it”.

        • barry says:

          It’s simple – use as much data as possible to avoid statistical artefacts and non-climatic fluctuations (like el Ninos), to determin any long-term signal.

          Why would you not do this?

          There are 36 years+ of satellite data. There are 160 years+ of surface data.

          It seems like blatant opportunism and dishonesty to simply ignore more data when it is available.

          There is also more than temperature data. Ocean heat content. Sea level. Sea ice. Glaciers.

          The more data you use the better you can determine an underlying, long-term signal. But you and unskeptical skeptics like you prefer less data. This is blatant, painter.

          • mpainter says:

            Here is some long term data: warming circa 1920 – 1945. Natural variability, according to the IPCC. The IPCC claims only “half” of the post-1950 warming (actually post-1977) as due to CO2. But that is a bald assertion, nothing but an unsupported guess. So one-half of the step-up was natural, one-half CO2, according to AGW doctrine.

            Get it? A century of data, one-half of one step-up is your AGW, according to the IPCC.

            So much for your long term trends. AGW RIP

          • mpainter says:

            Ocean heat content, sea level, glaciers, all effects dependent on warming due to natural variation.
            This is not evidence, barry. You simply reiterate your bald assertion that CO2 did it.

          • Nate says:

            I think what is most convincing to scientists is when a prediction is made, a quantitative and detailed prediction is made, based on a physics-based theory, and then this prediction proves correct. This is convincing science, particularly when the prediction is made about the whole planet.

            Such a prediction was made in 1981 by Hansen and collaborators. http://science.sciencemag.org/content/213/4511/957

            They predicted that over the next few decades, global temperature would rise up out of the background noise of the flat 1950-80 period. They predicted the magnitude of this rise, and it proved very close (within error) to what actually occurred. They predicted the NH would rise faster than SH (this happened). They predicted arctic sea ice would begin a rapid retreat (this has occurred).

            What is most impressive was that none of this was obviously happening before the predictions. And they explained why (aerosols). They didnt just extrapolate existing trends (the trends were flat).

          • Nate says:

            Another prediction of Hansen 81: that high latitudes would warm faster, also proved correct

          • mpainter says:

            Hansen was wrong:

            1. Sea Level rise has not accelerated, according to Mean Sea Level Trends plotted for tidal gauges located on stable coasts (as per GPS)

            2. Antarctica is gaining ice mass, not losing it, according to the most up to date study (Zwally, 2015).

            3. No sign of desertification of agricultural regions.

            4. No expansion of deserts, but shrinkage (due to CO2 fertilization).

            5. No decrease in agricultural production but a 50% increase, worldwide.

            6. No polar amplification in Antarctica.

            7. No warming attributable to CO2 (the step-up circa 2000 was due to increased insolation via global reduction of cloud albedo).

            8. Hansen ignored the fertilization effects of increased CO2.

          • mpainter says:

            To sum up, atmospheric CO2 is entirely beneficial, the more, the better. The biosphere has benefited from it, and currently biomass is expanding an estimated ten gigatonnes/year. Strange that anyone should be against that.

          • mpainter says:

            Arctic sea ice retreat ended in 2007. Present year end sea ice extent fluctuates above the 2007 extent, with the exception of 2012 (this year equalled 2007 extent).

            So Ma Nature does it to the alarmists yet again, tsk, tsk.

          • mpainter says:

            Nate fails to note that Hansen did_not_attribute the temperature rise circa 1920-45 to AGW, unlike some alarmists who vehemently assert that period of warming was AGW.

            The bottom line on Hansen is no warming since that study except the step-up circa 2000, which we know was due to increased insolation.

            One has to wonder why Hansen is such a hero in the eyes of the AGW zealots.

            “In the land of the blind, the one-eyed man is king”
            Dostoevsky

          • Nate says:

            Paint,

            Your points are chock full of cherry picking and or just plain made up facts.

            1. Wrong sea level rise has accelerated. Current rise 3.4 mm/year. If that had been the rise through the last 2000 years, Roman sea levels would be 6.8 m lower. They weren’t, based on studies of fish ponds etc.

            2. The paper predicted WEST Antartica destabilization. This is happening.

            3-4 CA extended drought continues even w super El Nino. Desertification. Of course some of the microclimate predictions of the paper miss the mark. Not surprising.

            5 Paper did not make prediction about increase or decrease in farm production. Lots of technology reasons for increase.

            6.Again West Antarctica increased melting/destabilization. Sea ice at poles behaving differently because of land/ocean differences

            7. This is pure nonsense/opinion. Only if use imagination, and if you cherry pick and ignore all of the surface temperature records, can the record be interpreted as a single step. All surface records show a clear 40 year upward trend. I know this data is inconvenient for your view. Scientists are not allowed to ignore inconvenient evidence. Why is it acceptable to you? Oh yeah, you’re not a scientist

            8. Didnt discuss. So what.

          • mpainter says:

            Nat, the name is painter.

            1. Sea Level computations based on Jason data are not reliable. SL gauges on stable coasts give more accurate data. These show no acceleration in SL rise.

            2. Please show where Hansen uses the term “destabilize” with regard to w Antarctica. I cannot find it.

            3. Drought in California? Nothing new there. A population of 36 million exacerbates drought. You employ hyperbole to call that desertification.

            4. Hansen raised possibility of the effects on agricultural yields under increased CO2. I attributed no predictions to him in that regard. Apparently Hansen’s co-authors would not agree to his alarmism regarding agricultural effects.

            5. I note that you call the step-up a 40 year trend; you include the 18 year pause as part of that trend. Typical alarmist straight edge hyperbole. The step-up joins two flat trends. I am a scientist.

            6. Hansen ignored the fertilization effects of atmospheric CO2. That’s bad enough.

            Hansen, the original climate alarmist, was completely wrong. Atmospheric CO2 is entirely beneficial, the more, the better.

          • mpainter says:

            Mate thinks that doubling down on climate alarmism is the way to force it through. Self-deceived warmers are rife on the internet.

    • barry says:

      What I’m interested in following is this notion of the ‘pause’ resuming. It seems to be important to some people. Like yourself.

      • ren says:

        Barry, if this graph shows the genuinely impact of CO2? How so they take so deep temperature drops, if CO2 continues to grow?
        http://woodfortrees.org/graph/uah6/to:1998

      • barry says:

        Ren, increasing CO2 doesn’t stop the ups and downs of weather happening. The idea is that the world gets warmer over the long-term. If anomalies can vary by 0.5C over a year, then spotting a change of, for example, 0.2C decade will take some time – 25 years to change by as much as the largest interannual varability.

        I have to say, cherry-picking dates, and cherry-picking data sets and then reasoning the choices post-hoc is crappy practise, yet standard from some quarters.

        • mpainter says:

          Two flat trends connected by a step-up circa 2000: the satellite era temperature record (see UAH above). Where’s the CO2??

        • barry says:

          As I said, cherry-picking dates and data sets is crappy practise.

          An actual long-term signal that is punctuated by spikes, where the variability is similar magnitude to the trend, can look like a series of step-changes if one deliberately chooses to begin each trend period with a spike.

          Here’s one way to test for a break in trend: Run a linear trend to establish your prior (Jan 1979 to Dec 1998). Extend the slope to the future, adding 2 sigma error bars. That’s your prediction. If more than 95% of anomalies fall outside the expected range, then that is evidence of a deviation from the prior trend. If 95% of anomalies after Dec 1998 fall within the error bars, then there is no statistical reason to say that the trend has deviated.

          Prediction

          Result

          The post-’98 anomalies fall within the 2-sigma (95%) range. There is no statistical deviation from the prior trend.

          Note – The meme usually runs that “global warming stopped in 1998,” so I could have legitimately chosen ’97 as the cut-off. However, I wanted to give the test a good chance of getting the result skeptics prefer, so I chose to end the prediction slope on the warm el Nino year of 1998, rather than the year before.

          • mpainter says:

            Any idiot can connect the endpoints of a time series with a straight edge. Do you imagine that is science?

          • barry says:

            Do you imagine that is what is being suggested here, idiot?

          • mpainter says:

            You ignore the step-up, which is the only warming of your “thirty years trend”. You and your trusty straight edge.

          • MikeR says:

            Mpainter above – “Any idiot can connect the endpoints of a time series with a straight edge. Do you imagine that is science”.

            Of course this is not how a trend is calculated by scientists. The trend line, more often than not, does not pass through the end points.

            Mpainter, this how it is done –

            https://en.m.wikipedia.org/wiki/Simple_linear_regression.

          • mpainter says:

            It is a mathematical straight edge. Same thing; it connects the end points of a data series.
            A scientist is entitled to make an analysis of the data without resorting to a single derivative, i.e., a single straight line connecting the end of a series. Barry, in essence, denies the validity of any such analysis. Do you?

          • mpainter says:

            And please, no semantic quibbles over “endpoints” of a time series.

          • Miker says:

            Mpainter,

            The difference between a line joining the two end points of a data set and a line of best fit are so fundamentally different that it is clearly not an issue of semantics!

            In the first case , the line between two end points uses only the two data points (and ignores the rest) while a line of best fit uses the full data set (currently at 454 data points for the UAH data) . The degrees of freedom ( in estimation of the slope and intercept of the line) for the first case is zero, while for a linear best fit, the degrees of freedom are 452!

            Accordingly the statistical uncertainties inversely scale to these degrees of freedom.

            This is all covered in Statistics 101 , a subject that mpainter must have missed or failed miserably.

          • mpainter says:

            MikeR shows that he doesn’t know that trend = slope. He thinks that if you use the right sort of straight edge, then it’s not a straight line. Thus AGW types.

          • Miker says:

            Mpainter,

            Wow! You are one confused puppy . Your comment “He thinks that if you use the right sort of straight edge, then its not a straight line. ” makes no sense to anyone in the known universe except mpainter and I am not sure it even makes sense to him.

            To reinforce, in common parlance the trend and slope are the same thing. The slope function in Excel is very, very commonly used to determine trends. It uses linear least squares to calculate the trend/slope. It definitely does not calculate the trend from the slope of a line joining the end points.

          • mpainter says:

            MikeR confirms his inability to analyze data with any approach but a straight edge.

          • barry says:

            Wait a minute. Does mpainter not know what a linear regression is?

            Is he actually saying it’s akin to a line drawn by a ruler between two end points?

            Wow. Just wow. That’s incredibly ignorant.

          • MikeR says:

            Barry I feel your pain. Having to deal with this level of ignorance is incredibly frustrating. The only thing in question now is whether there exists an upper bound to mpainter’s level of ignorance. Let me know if you locate it.

          • mpainter says:

            miker and barry make a pair. They parade out a succession of sciency terms for their straight edge techniques. They fool no one.

            Analyzing data is beyond these types. If they cannot apply a straight edge and obtain a slope, they are bewildered.

            That Barry, who first claims that the 18 pause is part of forty years of global warming, and then offers that warming as proof of AGW. Then he declares that he is no warmist.

            Here is the.truth: the step-up connects two flat trends. See how the barry/miker types try to turn the step-up into a forty warming trend.

          • mpainter says:

            Hi, straight edger, how goes the arson? Or is it not the right season for bush fires?

          • MikeR says:

            I am not sure what the point of Mpainters repetitive, to the point of ad nauseum, references to edges. Other than demonstrating the limits of his knowledge regarding mathematics, statistics and science in general.

            His inability to respond in any other way to questions relevant to his one step theory (i.e. show me the evidence, any evidence) has become laughable. Possibly the only reason that I can think why he is continuing in this vein, is that the edge he continually refers to, might represent the borderline of his personality disorder.

            Additionally, anyone else who questions the sanity of mpainter, the material he alludes to (see immediately below) regarding arson and bushfires removes any doubt about the matter. It does make good reading and contains most of the cast of miscreants that pervade this site.

            Start at my comment and keep reading. http://www.drroyspencer.com/2016/01/on-that-2015-record-warmest-claim/#comment-207768 .

            Mpainter does like keep to digging a deeper and deeper hole for himself and I am happy , until my patience wears thin, to satisfy his masochistic tendencies.

    • mpainter says:

      The only specific evidence you cite, stratospheric temperature, is false. It has not changed for over twenty one years. Not since the Pinatubo step-down. The previous cooling was the El Chichon step-down.
      Nothing to do with CO2. Sorry.
      You also claim the troposphere has warmed “the last thirty years”. That is also false.

      The rest of your “evidence” is nothing more than a wishlist. Warming is only evidence of warming. It’s obvious that you don’t know what evidence means.

      • barry says:

        Over the last 30 years the troposphere has warmed and the lower stratosphere has cooled.

        Jan 1986 – Dec 2015 = 30 years:

        RSS: 0.12C/decade (+/-0.086)
        UAH: 0.15C/decade

        Both statistically significant warming for last 30 years.

        Also both statistically significant warming for the full period.

        Notice I didn’t include recent el Nino year.

        The lower stratosphere has cooled over the last 30 years.

        Lower Strat Jan 1986 – Dec 2015:

        RSS: -0.19C/decade
        UAH: -0.23C/decade

        You have to cherry-pick shorter time periods to make the claims you want to make. That trickery is pretty transparent these days.

        • mpainter says:

          What’s transparent is your adherence to the party line:
          The lower stratosphere has not cooled since 1995, which was the step down which followed Pinatubo, and you call that “cherry picking”.
          What is transparent is your claim of “warming for the last thirty years” when there was warming only circa 2000 (the step-up). You are pure doctrinaire AGW, as transparent as glass.

        • barry says:

          1995. Yep, I call that cherry-picking. The effect of volcanic eruptions is temporary, 2-3 years. Pinatubo cannot be responsible for lower strat long-term trends.

          We have a long-term record that irons out the short-term effects. Preferring short-term trends when more data is available is cherry picking.

          So use the entire data period. Result: cooling lower stratosphere, warming lower troposphere.

          36 years of opposite signed temp change in those parts of the atmosphere is evidence of GHG warming. Not solar variation, not insolation changes.

          To argue differently you have to ignore the long-term changes. You have to sweep half the data under the carpet. And so you do, painter.

          • mpainter says:

            Short term trends? See the step-up circa 2000. You stretch that into 30 years of a warming trend. You are too obvious, barry, with your accusations of cherry picking. 18 year pause becomes 18 years of warming in your thirty years trend. Easy to do when CO2 controls the brain.

          • Gordon Robertson says:

            barry…”To argue differently you have to ignore the long-term changes”.

            It’s explained clearly in the UAH 33 year report. Most alarmists don’t seem to get past the opening paragraph about a trend of 0.12c/decade over the 33 year period. That trend is mainly a re-warming trend not a true warming trend.

            In the report it explains that ‘true’ warming did not occur in the then 1979 – 2012 trend till the late 1997 El Nino drove the global average sky high. Pre EN, the global average was below the 1980 – 1997 average. Post EN, it was above the average.

            The jump to which mpainter refers is blatantly obvious circa 2001. Following the 98 EN, there was an LN that drove temps back below the 2010 – 2000 average. Based on the past 20 years the average should have remained at least around the 1980 – 2000 average. By late 2001, temps were about 0.25C above the average and have remained there to this day.

            Something about that 1998 EN messed with the global average. Over such a short term as a couple of years, ACO2 could not have warmed the atmosphere so sharply. If it had been ACO2 the trend would have continued and it did not.

            A similar jump came circa 1977 that was labeled the Great Climate Shift. That forced scientist to investigate and they discovered the PDO. Some denialist scientists have lobbied for erasing that jump, claiming it to be an error.

          • mpainter says:

            Barry steadfastly denies the step-up. In a previous thread he claimed it was “an artefact of data selection”.

            Barry blathers all sorts of foolishness which he then disowns when you remind him of it. Let’s see if he still denies the step-up.

          • barry says:

            I maintain that the time-periods here are TOO SHORT to determine a signal.

            I maintain that deliberately starting trends on spikes can give you flat-looking periods.

            The variance for Ninos can be as large as 0.5C over a year. If a warming trend was 0.15C/decade it would take 30+ years for the trend to have the same magnitude as that one year. So, yeah, using 18 years is a little too short to get a determination.

            Furthermore, the uncertainty is large. The satellite trend 1998 to present is 0.03C/decade +/- 0.185C. That means that 95% of anomalies in that period fall in the trend range from -0.155 to +215 C/decade.

            The uncertainty in trends from 2000/1 is, of course, larger.

            Skeptics completely ignore uncertainty. It’s a blind spot.

            El Ninos DO NOT cause long-term global warmth. They are short-lived events. Roberts is out to lunch on this.

          • mpainter says:

            Barry, no one claims that the El Nino caused the step-up. You made that up.

          • mpainter says:

            Barry, a step-up is not a trend.

            A step-up is not a trend.

            A step-up is not a trend

            A step-up is not a trend.

            If you keep repeating this, maybe you will come to understand that

            A step-up is not a trend

          • a cycle superimposed on a linear trend will produce something similar to what we have seen. The “steps” still result in net warming over the long term, potentially the same as if it was just a linear trend.
            http://www.drroyspencer.com/2013/11/the-magical-mystery-climate-index-luis-salas-nails-it/

          • mpainter says:

            Thanks for your response, Dr. Roy. What is the cycle that is imprinted on the trend, if you wouldn’t mind saying. Or do you mean hypothetically?

          • barry says:

            Roy answers your question in the linked article.

            You might want to write this out a hundred times.

            ‘I must learn the meaning of statistical uncertainty.’

          • Miker says:

            Roy,

            Here is an example of a sine wave added to a linear trend to illustrate your well made point (see top graph).

            https://s20.postimg.org/7dgyk03x9/cherry_pickers_picnic.jpg .

            I have also plotted , below the sine graph, the UAH TLT data with some cherry picked starting points.

            It is clearly evident that for a trend line modulated by a wave or oscillation (periodic or otherwise), that almost any result is possible for the trend, if you cherry pick the start.

            This is why the statistical significance of the pause was always questionable to say the least.

            To reinforce the message here is a trend back curve for the current UAH TLT data.

            https://s20.postimg.org/tqop6t4v1/Pause_Trend_back.jpg .

            For those who may require some assistance with interpreting the curve. The red trend line is the trend (vertical axis) for a given starting date (on the horizontal axis) until the present. I have also included 95% confidence intervals (C.I.) in dashed green lines for the upper C.I. and in blue for the lower C.I..

            To calculate confidence intervals I have used unbiased estimators of C.I. and adjusted them for serial correlation assuming AR(1) serial correlation. This was based on the paper by Foster and Rahmstorf , see http://tinyurl.com/zoq29p3 .

            To have a statistical significant pause, the green dashed upper C.I. curve need to be below or equal to zero. It doesnt even get close at any stage, even for the denialist’s favourite cherry pick year of 1998.

          • mpainter says:

            More pseudoscience blather from MikeR who doesn’t seem to know that trend = slope.
            He doesn’t want to be confused by the analysis of data, he draws a straight line and declares that the science is settled. Except for the “pause” which can’t be a straight line becuz 18 years is too short. And he knows that it’s too short cuz sks sez so.
            Straight edge science.

          • mpainter says:

            Barry says that the pause could be cooling. I think.

          • Gordon Robertson says:

            miker…”It is clearly evident that for a trend line modulated by a wave or oscillation (periodic or otherwise), that almost any result is possible for the trend, if you cherry pick the start”.

            Not if you understand calculus and statistical theory, you specify the context of your data, you specify your end points, and and make it clear you are drawing a straight line through data points as a best fit.

            An approximate best fit can be done visually if the data is grouped right. However, it can be done precisely.

            http://hotmath.com/hotmath_help/topics/line-of-best-fit.html

            It’s not difficult to see on the UAH graph from 1998 – mid 2015, using some visual calculus and the red running average curve, that a flat trend line fits in there.

            No one cares if the trend line is absolutely flat, but the IPCC laid it out statistically. They claimed the warming from 1998 – 2012 was (0.05C [0.05 to +0.15] per decade.

            That’s 5/100ths of a degree C in 10 years. You can’t even see that kind of warming on a room thermometer. The IPCC described it as a hiatus and hiatus means stopped.

          • Gordon Robertson says:

            barry…”Skeptics completely ignore uncertainty”.

            Show me the uncertainty in a thermometer or an AMSU unit. If there is uncertainty it is introduced by humans not the instrumentation.

            The practice of taking two thermometer readings a day, a high and a low, in surface stations, then averaging the readings, is bound to introduce uncertainty. That’s especially true when surface stations cover the land area of the globe mainly which is 30% of the planet’s surface.

            Then NOAA comes along and scraps 5000 reporting stations out of a global pool of 6500 stations and uses data from 1500 stations in a climate model to re-synthesize the missing 5000 stations.

            Satellites don’t have those problems. Their AMSU scanners are scanning bazillions of data points per instantaneous scan and averaging them electronically. The scanners cover 95% of the surface layer.

            The sats are provided by NOAA and they don’t show the warming the NOAA climate model-fudged synthesized data shows. Why does NOAA have no interest in its own satellite data?

            Is it not obvious to you?

          • Miker says:

            Gordon Robertson (Sept 16, 4:30 am),
            To quote –
            Its not difficult to see on the UAH graph from 1998 mid 2015, using some visual calculus and the red running average curve, that a flat trend line fits in there.

            As well as cherry picking the starting point to give the minimum trend, this depends on your definition of flat. The minimum trend that can be found using cherry picking is from December 1997 and is currently at 0.0362 degrees per decade and going up regularly each month (January , the last time there was even a negative slope for any starting month, this minimum slope was -0.00054).

            If you believe that the minimum trend is going to go down next month I will happily wager you for whatever amount of money you want. I need the pocket money.

            Gordon, your visual calculus must be astonishing. The days of doing lines of best fit visually are long gone. I havent done one since teaching students the concepts behind lines of best fit some 20 years ago. To try and visually minimize the R.M.S. sum of residuals by drawing lines of varying slopes and intercepts is difficult, especially when you are dealing with 450 points of data. Then try and manually calculate the correlation coefficient etc.. All doable with enough time and patience and a tolerance for mistakes.

            Now days, since they have invented these new fangled devices called the personal computer, it can done much more easily using the SLOPE or LINEST Excel function.

          • Miker says:

            Gordon again,

            “Show me the uncertainty in a thermometer or an AMSU unit. If there is uncertainty it is introduced by humans not the instrumentation.”

            I think you need to run this argument past Carl Mears of the RSS satellite team.

            As Carl Mears says:

            “A similar, but stronger case can be made using surface temperature datasets, which I consider to be more reliable than satellite datasets (they certainly agree with each other better than the various satellite datasets do!). ”

            Also see – http://arstechnica.com/science/2016/03/updated-satellite-data-shows-more-warming/ .

          • mpainter says:

            As I commented above, without another step-up after the coming La Nina, the flat trend continues and AGW becomes moribund, as a movement. There is no reason to expect a step-up at this time, Roy’s speculative cyclical super-imposition notwithstanding.

            In fact, a step-up is not a trend, and we know that the step-up circa 2000 was due to increased insolation via reduction in cloud albedo globally. Thus the step-up appears as a unique event (a natural variation), and not a cyclical event.

            Repeat: a step-up is not a trend, and there is no reason to expect another step-up and every reason to expect a continuation of the 18 year hiatus (as per the IPCC). We will see what happens after the coming La Nina.

          • mpainter says:

            Carl Mears ignores the fact that the UAH product is better corroborated by radiosonde data than the RSS product.
            For the most accurate data on global temperature anomaly, conscientious scientists rely on UAH.

          • barry says:

            Gordon, you are either unaware of the all the problems with inferring a global temperature record using instruments on satellites, or you irrationally reject that information. It has been posted here many times. You provide a classic example of skeptics ignoring uncertainty.

            The above is structural uncertainty. I was thinking more of statistical uncertainty, which is widely ignored by skeptics when discussing temperature trends.

          • mpainter says:

            “Statistical uncertainty”
            What Barry is trying to say is that the 18 year pause might be 18 years of cooling.

          • Gordon Robertson says:

            barry…”The above is structural uncertainty. I was thinking more of statistical uncertainty, which is widely ignored by skeptics when discussing temperature trends”.

            Barry…what does statistical uncertainty have to do with data from real instruments? Are you suggesting that the UAH graph was put together using statistical methods while ignoring the real data upon which it based?

            We all know there are variable with sats such as orbital issues. When you adjust for them, as a good scientist should, you must include error margins, which UAH have done. That’s all part of normal science.

            What Foster and Ramstorf have done, and what NOAA is now doing, is pure statistical analysis. They are using real data gathered by real instruments and synthesizing scenarios. In the case of NOAA, they are synthesizing interpolated temperatures between real reporting stations using climate models.

            NOAA now talks about statistical uncertainty. They claimed 2014 as the hottest year ever based on a confidence level of 48%. If they had used a 90% confidence level, 2014 would have been the 4th warmest year, as indicated by UAH data.

            Why did NOAA not use the 90% confidence level? You seriously don’t get it, do you?

            The kind of statistical methods applied by UAH and NOAA have a night and day difference. UAH are delivering the facts as close to reality as possible while NOAA is deliberately obfuscating that reality. Global warming skeptics are skeptics generally because of the sheer scientific misconduct perpetrated by climate alarmists such as NOAA.

            I don’t understand why you cannot see the chicanery employed in the climate alarm game.

          • Miker says:

            Referring to mpainter’s comment above of
            September 15, 2016 at 5:13 AM.

            Barry, no one claims that the El Nino caused the step-up. You made that up.

            Mpainter , I cannot see where Barry made that claim.

            John McLean appeared to be the one who was silly enough to claim, based on his 2009 paper that ENSO events such as El-Nino was driving the long term (multi-decadal) increases in temperatures.

            For his 2009 paper see- http://onlinelibrary.wiley.com/doi/10.1029/2008JD011637/full

            His comment “Finally, this study has shown that natural climate forcing associated with ENSO is a major contributor to variability and perhaps recent trends in global temperature, a relationship that is not included in current global climate models”

            And for information regarding John McLeans overall expertise see – http://www.abc.net.au/news/2010-03-29/39148

            Anyway he seems to have departed the scene after his predictions of cooling post 2010 see
            http://mclean.ch/climate/ENSO_paper.htm (the graph at the bottom does not appear to have been updated since Jan 8 2011, for some reason- I thought he was a computer professional) and http://www.drroyspencer.com/wp-content/uploads/UAH_LT_1979_thru_August_2016_v6.jpg.

            He then resurfaced in 2013/14 with his now discredited cloud thesis that suffered the indignity of being skewered at Watts Up With That by Willis Eschenbach and on numerous other sites.

            I am not sure how his PhD, that he was starting prior to 2010, has gone. I suspect badly.

          • mpainter says:

            Barry Schwartz speaks for himself @ 9/15 4:49am :
            “El Ninos DO NOT cause long-term global warmth. They are short-lived events. Roberts is out to lunch on this.”

          • mpainter says:

            John McLean, in his 2014 study, concluded that reduced cloud albedo, globally, resulted in an increase in insolation of 2.5 W/sq m – 5 W/sq m. I have not yet seen that conclusion refuted. This late twentieth century warming accounts for the approximately .3 C step-up at circa 2000.

          • mpainter says:

            By the way, a step-up is not a trend.
            Also, I do not agree with Barry that the 18 year pause should not be regarded as a flat trend due to “statistical uncertainty”.

          • Miker says:

            Mpainter,

            What empirical evidence do you have to support your step-up in temperatures from around 2000 to 2002, rather than just referring to a possible mechanism.

            I suspect the mechanism , which maybe plausible to some, is a single paper authored by a lone (his supervisor or any colleagues obviously didnt want to have anything to do with it ) PH.D student in 2014 that was published in a journal of last resort (see https://en.wikipedia.org/wiki/Scientific_Research_Publishing) .

            Needless to say this paper has been met with wide disdain and derision from even climate change skeptics and discussions regarding this paper has almost disappeared from view.

            So mpainter show me the empirical evidence for the step-up. Show me the numbers i.e. How large was the step-up in degrees C ?

            I have attempted to locate the step-up by comparing the average temperatures before and after a particular data , changing the data from 1980 to 2014, see – https://s20.postimg.org/gugf1hjh9/Average_Diff.jpg .

            There is no evidence for anything unusual about the period 2000 to 2002 compared to times earlier or later than this period. It just looks like noise. Which is really the best we can say about the many contributions of mpainter.

          • Miker says:

            Sorry mpainter, I missed your reference above to a step-up of 0.3 C.

            I am intrigued by this value. How , or from where, did you obtain this number? Is it 0.3 plus or minus 0.01 degrees or is it plus or minus 273 degrees C. i.e what, if any, is the statistical significance of this value?

            So many questions…

          • barry says:

            Gordon,

            Barrywhat does statistical uncertainty have to do with data from real instruments?

            Are you not familiar with confidence intervals in linear regression?

            You can have the most perfect data in the world, but unless they lie in a straight line over time there will be a measure of uncertainty estimating a trend.

            One way of writing it is trend x (+/- y)

            Specifically, the trend for satellite data (RSS in this case) from 1998 to present is 0.029C per decade (+/- 0.155).

            0.029C/decade is the mean estimate. The 2 sigma uncertainty (in bold) means that 95% of data points will fall in the range. IOW, the trend is anywhere between -0.156C/decade and +0.214C/decade to 95% confidence limits.

            You can get a narrower range by lowering the confidence level, but 95% is a common standard.

            This is statistical uncertainty. Different from structural uncertainty, which is what you have been referring to. The measurements could be perfect – it’s the trend that will be uncertain. This is a regular problem with the short time periods preferred by the skeptical milieu.

            There’s a simple app to compute global temperature trends and their uncertainties online. I recommend picking a data set and changing the period length to see how uncertainty decreases with more information – if you’re not already familiar with statistical uncertainty.

            http://www.ysbl.york.ac.uk/~cowtan/applets/trend/trend.html

          • barry says:

            Miker, mpainter,

            This is the post where Gordon suggests the 1998 el Nino was responsible for lacking up global temps thereafter.

            http://www.drroyspencer.com/2016/09/uah-global-temperature-update-for-august-2016-0-44-deg-c/#comment-225210

            To which I replied that Ninos do not have long-term warming effects (although Bob Tisdale may beg to differ…).

          • mpainter says:

            Gordon quite obviously refers to the step-up, which indeed co-incides with the ENSO cycle beginning in 1997.
            We note your confusion continues.

          • mpainter says:

            The stepup is obvious and everyone sees it except for the die-hard AGW types like Barry, miker, etc.

            And a_step_up_is_not_a_trend.
            And that is why they will not/cannot see the step-up.
            It doesn’t fit their straight edges.

          • mpainter says:

            So far, no one has made any attempt to refute the conclusion McLean, 2014. Three have been some ad hominems smeared on the wall by miker, but nothing else.

        • Gordon Robertson says:

          barry…”RSS: 0.12C/decade (+/-0.086)
          UAH: 0.15C/decade”

          Barry…please read the UAH 33 year report.

          http://www.nsstc.uah.edu/climate/2011/November/Nov2011GTR.pdf

          *The greatest warming has been in the Arctic. Temperatures in the atmosphere above the Arctic Ocean warmed by an average of 1.75 C (3.15 F) in 33 years.

          *There was little or no warming for the first 19 years of satellite data. Clear net warming did not occur until the El Nio Pacific Ocean warming event of the century in late 1997. Since that upward jump, there has been little or no additional warming.

          *Part of the upward trend is due to low temperatures early in the satellite record caused by a pair of major volcanic eruptions, Christy said. Because those eruptions pull tem-
          peratures down in the first part of the record, they tilt the trend upward later in the record.

          * When that cooling is subtracted, the long-term warming effect is reduced to 0.09 C.

          Your 0.14C/decade comes from the cooling period between 1979 and 1997.

          • barry says:

            I’m familiar with the views therein. Removing known effects from the temp record to look for a climate signal is a good idea.

            Spencer and Christy adjusted tropospheric data to remove volcanic effects and found a lower trend for the whole period.

            Other researchers went further and removed volcanic, ENSO and solar influences, coming up with higher trends.

          • Gordon Robertson says:

            Barry…”Spencer and Christy adjusted tropospheric data to remove volcanic effects and found a lower trend for the whole period”.

            Of course. The 0.14 C trend is almost all re-warming from 1979 – 1996 or so. It’s not real warming. It’s crucial to see that.

            If you remove the cooling, any warming is straddling the baseline, then the EN spike in late 97 upset the apple cart.

            Look at the graph and see what the red running average is doing. From 1979 – 1996, it’s like a sawtooth wave where only the peaks of the sawtooths break the baseline in ’88,’91 and ’96. There is a definite +ve trend in the sawtooth train.

            If it is 0.14C/decade, that would be 0.28C between 1979 and 1998. I can accept that if you admit it’s re-warming.

            Those anomalies are mainly UNDER THE BASELINE, meaning they represent cooling. So, any trend that is positive represents a recovery from cooling.

            True warming must be ABOVE the baseline and that happened in a big way in late 97 with the EN spike. It was followed by a cooling in 2000 below the baseline and in 2001, there was a mysterious blip to which mpainter refers. The blip is in the running average.

            For the previous 22 years the +ve anomalies had never exceeded 0.1C then in 2001 they shot up by another 0.1C.

            Why?? Between 2002 and late 2007, the trend was pretty flat. In 2008, a LN drove the average below the baseline, then in 2010 another EN drove the average to over 0.3C above.

            When you iron out all the peaks and valleys in the running average, you have a flat trend from 1997 to mid 2015. So you have a slight +ve trend from 1979 – 1997 followed by a flat trend from 1997 – mid 2015.

            Take out the cooling from 1979 – 1997 and you have a very slight positive trend due to the sudden unexplained warming in 2001. According to the record from 1979 – 1997, that warming from 2000 – 2002 should have reversed midway and cooled off again.

            The amended trend is 0.09C and with 3.3 decades (33 years) the overall warming should have been close to +0.3C. Look where the average is in 1979…-0.3C.

          • Gordon Robertson says:

            Barry…”Other researchers went further and removed volcanic, ENSO and solar influences, coming up with higher trends”.

            Yeah…that was Rahmstorf et all and I cannot express the disdain I feel for the man. He got in a debate with Lindzen once and resorted to peculiar tactics to get out of holes he had dug for himself.

            http://motls.blogspot.ca/2008/03/lindzen-vs-rahmstorf-exchange.html

            “…whenever Rahmstorf talks about the natural effects influencing the climate, he says that they are “masking” the man-made global warming. Such a language trick is equivalent to an unjustified, propagandistic assumption about the sign of an effect and it is very clear that once he formulates a hypothetical explanation in this way, it can’t be studied scientifically because its very essence is a dogma. In reality, many of these effects can have – and probably do have – the opposite sign than Rahmstorf implicitly assumes (including the total feedback of the clouds or the regulating effect of the oceans)”.

            That’s exactly what Rahmstorf did in the article to which you refer.

          • barry says:

            The paper I was thinking of is Forster and Rhamstorf (2011), not Rhamstorf et al (????).

            There is no adjustment for clouds in that paper. Motl’s commentary is often far removed from the facts, but in any case that article is dated 3 years before the paper was printed.

            But you’re not discussing the paper by citing this, are you? You’re citing a blog post by a string theorist because it smears Rhamstorf. And it does so with no content or citing of the exchange that actually happened. This is the laziest form of smearing.

            I could find dozens of blog posts where the author smears Lindzen. Is muck-raking truly how you like to proceed in debates?

            I wonder if you realize that Lindzen agrees with the basic AGW proposition.

            F&R attempt to remove ENSO, volcanic and solar effects. Other people took up this kind of work on blogsites.

            https://moyhu.blogspot.com.au/2013/06/adjusting-global-temperatures-for-enso.html
            https://moyhu.blogspot.com.au/2013/06/better-adjusted-global-temperatures-for.html
            https://troyca.wordpress.com/2014/02/21/breaking-down-the-discrepancy-between-modeled-and-observed-temperatures-during-the-hiatus/

          • mpainter says:

            In fact, Rhamstorf doesn’t need any help in gaining discredit, he does fine on his own. He probably the prime exponent of flaming AGW extremism, avoided by many who espouse the Cause for the discredit he brings on it.

            It’s no surprise that Barry Schwartz thinks he is a suitable reference.

          • Gordon Robertson says:

            barry…”…youre not discussing the paper by citing this, are you?”

            No…I cited Motl because he summed it up well. Rahmstorf revealed himself as a buffoon when he goaded Lindzen into a debate in which he got his butt kicked. Rahmstorf is a physicist who fancies himself as a climate expert.

            He’s not. Lindzen is the expert on climate and the atmosphere and rather than respect that, Ramstorf came at him with cockamamey arguments that were surreal, as Motl pointed out.

            His paper with Foster is not reliable due to the purely statistical analysis they used. I quoted this from the other link you supplied to the analysis technique:

            “From what I can tell, in this case, the multiple regression approach used by Foster and Rahmstorf (2011) [and Lean and Rind (2008), although I havent investigated the specifics of that paper] can produce misleading results, even failing to recognize a pause in the underlying signal”.

            I’ll state it more succinctly, IMHO, I don’t think Rahmstorf is capable of making an objective obervation on this subject since he’s an uber-climate alarmist. In his debate with Lindzen he drew on esoteric comparisons with climate theory such as relativity theory. He’s off in another world where real data has been replaced by obfuscated mathematics.

            Mark Twain would have seen through him based on his statement, “There are three kinds of lies: lies, damned lies, and statistics”.

          • barry says:

            It seems to be a little opportune to remove only one effect that would cool the record and not other effects. Trying to obtain an underlying signal by removing known fluctuations is a good idea.

            F&R aren’t the only ones who have attempted this. Links above, if you’re a genuine enquirer.

  69. Lewis says:

    Barry,
    The problem is ‘prediction’.

    What about the past? It is not as warm now as it has been in the past. The recent 20,000 years have seen global warming which melted glaciers and caused sea levels to rise 250 feet +/-. All this happened prior to mankind’s very recent contribution to CO2 etc. Yet, based on 30 years of records, and programs which don’t coincide with the record, we are now supposed to accept some theory about AGW.

    Perhaps it is real. Certainly, I’m all for a warmer climate as are most people, – notice how people move south from the north when they retire, they don’t move north.

    Yet, yet, the anti-human religious winds, as they ever have, blame man for something he has done wrong. What is the sacrifice to the gods this time? Will it cure the problem?

    Ah, industrialization is the cause – let us sacrifice it.

    No thank you or, more exactly, you give up industrialization first.

    Off to contribute my share to AGW by burning and causing to be burned, lots of hydrocarbon fuel.

    Lewis

    • Toneb says:

      “What about the past? It is not as warm now as it has been in the past. The recent 20,000 years have seen global warming which melted glaciers and caused sea levels to rise 250 feet +/-. All this happened prior to mankinds very recent contribution to CO2 etc. Yet, based on 30 years of records, and programs which dont coincide with the record, we are now supposed to accept some theory about AGW.”

      Has it not occurred to you that past warming may have been caused by other than CO2 (alone)?
      Has it occurred to you that perhaps the Earth’s orbital eccentricity may have been the cause?
      Oh, and it’s not “based on 30 years of data” either.

    • barry says:

      I’m not sure what point you’re trying to make, Lewis.

      Climate changed in the past. Uh-huh. Is there a point here? Dams were built long before humans came along (beavers), but we don’t imagine that this implies humans couldn’t possibly build dams. Forest fires occurred long before humans came along, but this is not evidence that human beings could not possibly be responsible for forest fires… or have I missed your point?

      “Sacrifice industrialization…” this is a straw man. An extreme position. How does one begin to have a useful conversation when ones ‘opponents’ pitch such wild stuff.

      I have a question for you.

      My views are never articulated by skeptics. They always presume wrongly – usually wildly incorrectly about what I think.

      What should I infer about the skeptic milieu that not one of them ever asks me what I think about the general topic?

      • mpainter says:

        Barry, you come on doctrinaire AGW. You blather a lot, too.

      • barry says:

        You tell me what I think and I’ll tell you if you’re right.

        • doctor no says:

          barry, how can you argue with such an expert as mpainter?
          He has successfully dug up the dead “pause”, invented the “step-up”, and is now warming us all about the impending gigantic “La Nina”.
          Mock him at your peril!

          • Gordon Robertson says:

            dr no…”He has successfully dug up the dead pause, invented the step-up, and is now warming us all about the impending gigantic La Nina”.

            Trolling seems to be going well. Too bad you have live under s bridge.

          • ren says:

            Region tropical Pacific is the main supplier of water vapor into the atmosphere. Now is cool. The surface temperature is extremely important, as evaporation occurs from the surface of the ocean.

      • Gordon Robertson says:

        barry…”Dams were built long before humans came along (beavers), but we dont imagine that this implies humans couldnt possibly build dams”.

        Who’s to say humans did not bring beavers along when they came here to populate the Earth? You don’t seriously support an arcane theory like evolution do you?

        “What should I infer about the skeptic milieu that not one of them ever asks me what I think about the general topic?”

        OK…what do you think about the general topic?

        • Lewis says:

          Barry has posted numerous times stating his opinions. From those we learn what he thinks – else he is misleading us.

          • mpainter says:

            Eight years! Eight years of reading, all to no avail! You reveal yourself as one with no foundation in science, no concept of what constitutes scientific evidence, and a fount of AGW doctrine. As for judgment, you show none, but only rigid adherence to the party line.

        • barry says:

          Thanks for asking, Gordon.

          Firstly, I accept that CO2 is one of the greenhouses gases in the atmosphere, the second most abundant after water vapour, and that its presence makes the surface temperature warmer than it would be without CO2 in the atmosphere.

          Secondly, I accept that increasing the concentration of CO2 in the atmosphere should cause warming at the surface, all else being equal.

          Thus far my views are the same as Roy Spencer’s, Anthony Watts’, Richard Lindzen’s, Roger Pielke Senior and Junior’s, and a large proportion of the skeptical milieu. If these views make me an ‘alarmist’, then so are the above scientists and a great many ‘skeptics’ on climate boards who agree with this. There are plenty of regulars at WUWT, for example, who agree with this position, and deride opponents of the greenhouse effect. So does Anthony Watts.

          I am not convinced that climate sensitivity is high. Nor am I convinced that it is low. I think it is too uncertain to know for sure. This is where my view departs from ‘alarmists’, but also from most ‘skeptics’. I don’t think climate sensitivity is well constrained. The doomsayers insist it is in the mid-range (3C/doubling) or higher: the Pollyannas insist it is very low. There is nothing scientific, to my mind, about these beliefs, only personal preference.

          The case for AGW is built on many lines of evidence, each of which is falsifiable. Thus arises the game that is played out on climate blogs. One evidential strand after another is put up for option and people have at it. This is what I’ve witnessed and participated in over the last 8 years.

          The most common error in the great climate debate cycle is failing to register and/or properly deal with uncertainty. Here we see who is a believer and who is an enquirer. Another common error is motivation – most climate blog denizens are driven by a personal agenda. These errors are easy to spot, but usually difficult to expose to those making them.

          Like nearly everyone else, I am a layperson on the general subject, and like everyone else, I am a layperson on most if not all the subtopics. I’ve read vigorously on the general and subtopics for 8 years now. Some issues I’ve given more attention than others. I think I’ve read about 100 papers on Quaternary ice ages and further commentary, for example. But while I can read and inform myself as deeply as possible, ultimately I must exercise some judgement on which views to take seriously and which to discard. And like a proper skeptic, every opinion I hold is provisional.

          That’s a general overview of what I think. There is more, of course, and even a policy outlook, but I don’t tend to get into that on climate science blogs.

          • Gordon Robertson says:

            barry…”Thus far my views are the same as Roy Spencers, Anthony Watts, Richard Lindzens, Roger Pielke Senior…”

            I have no issues with what you have said in this reply, in general. However, if your views are as stated, I don’t think you agree with Lindzen. In a paper he wrote on the GHE he barely mentioned the radiation theory. He claimed convection was as important and laid out a theory that concluded so-called [my words] anthropogenic greenhouse warming is limited to a fraction of a degree C.

            http://www-eaps.mit.edu/faculty/lindzen/230_TakingGr.pdf

            “There is something very seriously wrong with this oversimplified picture. Namely, the surface of the earth does not cool primarily by thermal radiation”.

            He goes on to describe a convective process, especially in the hot tropics, where water vapour transports heat as water molecules and vapour high into the atmosphere where it is radiated to space.

            I think his theory is far too reliant on models. However, Lindzen did claim the theories are highly complex and to attack them they need to simplify.

            “…this is only on the order of a third of the observed trend at the surface, and suggests a warming of about 0.4 over a century”.

            There it is, he predicts warming at 4/10ths C over a century.

            As I pointed out to Roy, UAH data proves the alarmist theories to be wrong. Lindzen’s prediction is more in line with UAH data.

          • Bart says:

            “Namely, the surface of the earth does not cool primarily by thermal radiation.”

            We’ve all used Thermos bottles. Or, lately, Tervis Tumblers have become popular. These are Dewar flasks – a bottle within a bottle, connected only at the top, with a gap in-between that is vacuumed out. The vacuum is very important. It is what makes the Dewar vessel so good at keeping the contents of the inner bottle warm or cold.

            Aside from the small amount of conducted heat where the bottles join, the only avenue for heat to escape or penetrate the inner bottle is via radiative transport. But, radiative transport is not very powerful, so the contents maintain their thermal state for long durations.

            Pierce the outer bottle to allow air into the gap, and the Dewar becomes just another vessel that exchanges heat much more rapidly between the contents and the ambient environment. It no longer “keeps warm things hot, or cold things cold” for very long.

            The cartoon version of AGW basically treats the Earth and its atmospheric radiating level as a Dewar flask. But, the gap has been pierced. There is no vacuum. Radiative exchange is not the only means of heat transport, and is not even the most powerful means, from surface to the effective radiating level.

          • Norman says:

            Bart

            Did you continue reading your link? They silver both sides of the flasks to minimize radiation loss. Why don’t you put values into the radiative heat equation to determine how much energy radiation is able to transfer and compare it to the other known heat transfer mechanisms (conduction and convection).

          • mpainter says:

            Norman, the point is valid: the earth does not cool primarily by radiation.

          • Bart says:

            Norman – Yes, they do, for classic Dewars. Other applications do not, e.g., the Tervis Tumbler or double paned windows.

            In any of these cases, once you break the seal, and allow air to flow into the intervening gap, you lose the greater part of the insulating property. Any readers who have suddenly looked out to see a fogged window (after the seal has been breached), and had to replace the window because it’s letting out prodigious amounts of heat, knows about it.

            https://www.energyguide.com/images/homenergy/windows.photo.5.jpg

          • Bart says:

            mpainter – I would amend that to say, the Earth’s surface does not cool primarily by radiation. And, it is the surface that we care about.

          • Norman says:

            Bart

            One fact on windows to consider is that IR does not go through normal glass, the lenses of IR cameras have to be made with glass that allows IR to transmit. So glass windows are a natural IR barrier and the thermal IR in a room will not move through the glass window. The outside surface of the glass will transmit IR so you want that to stay cold (as can be seen in the video with the person’s hand).

            https://www.youtube.com/watch?v=wsjjdwLFNIM

          • Norman says:

            mpainter

            I consider the amended point accurate. The main reason it does not primarily cool by radiation is because of the GHE. Without GHE radiation would become the dominant heat transfer from the surface.

          • mpainter says:

            Norman,the earth (and by “earth” I mean the earth’s surface, naturally. Funny that there should be a misunderstanding over such obvious usage) cools primarily through evaporation. Radiation is secondary, conduction third. The GHE depends on radiation, naturally. But the GHE is not the cause of evaporation, as you suggest. But the earth cools through evaporation because it is the “water” planet.
            I must say that talk of the earth without a GHE leads to absurdities such as positing an earth with an ocean but no GHE. But AGW deals in such absurdities without blinking an eye. Me, I pose absurdities when I wish to demonstrate absurdity.

          • barry says:

            However, if your views are as stated, I dont think you agree with Lindzen.

            I agree with him that the GHE is real, and that more CO2 in the atmos should cause warming at the surface.

            Where I disagree with him is on his conviction of a low climate sensitivity. If negative feedbacks are strong, then climate is correspondingly stable. This is why I started reading on the Quaternary ice ages 6 years years ago. I wanted to understand how much perturbation had occurred that gave rise to such significant climate change. I discovered it was very little. It would seem that feedbacks had a larger impact than the initial forcing (change in focus/intensity of insolation). That reading is why I am not convinced that climate sensitivity is low. Again, I am not convinced that it is necessarily high. I just don’t find Lindzen convincing on this matter.

            I have not read from those promoting low sensitivity anything explaining the large climate swings of the Quaternary ice ages.

          • mpainter says:

            Poor befuddled Barry thinks CO2 has something to do with ice ages, despite his vehement disclaimer above.

          • Gordon Robertson says:

            barry…”I wanted to understand how much perturbation had occurred that gave rise to such significant climate change. I discovered it was very little”.

            I have little faith in studies of ancient Earth. They rely on proxy studies and far too many liberties are taken.

            Look at MBB98 (the Hockey Stick). Mann et al had the scientific world convinced, including the IPCC, that the 1990s were the warmest decade in a 1000 years. He and his cohorts based their claim on tree ring proxies.

            Craig Loehle, an expert on trees and their rings, pointed out the obvious. Tree ring width are not necessarily an indication of warming, they can be narrow due to a lack of moisture.

            In MBE98, they used one tree to represent an entire century. They completely missed the Medieval Warming Period at the beginning of the study (1000 AD) and the Little Ice Age between about 1400 and 1850. That’s how they got such a flat shaft to contrast with warming in the 1990s which UAH data sets reveal did not have much in the way of warming.

            Worst of all, the tree ring proxies began showing cooling in the 20th century, forcing Mann et al to clip off the offending data and replace it with real data. Mann did not seem to find anything wrong with that practice which became known as Mike’s Nature Trick in the Climategate email scandal (aka Hide The Decline).

            Just as bad were ice core proxies from Antarctica used to establish atmospheric CO2 concentrations in the pre Industrial Era. They too ignored the Little Ice Age, which was going strong during the Pre Industrial Era. With cooler oceans, there would be less CO2 in the atmosphere but the IPCC cherry picked 280 ppmv from nearby ice cores samples which revealed concentrations IN THE ICE as high as 1600 ppmv (Jaworowski).

            I am sure there have been objective studies done on the past and maybe some researchers have pointed out the unreliability of proxy studies. Those promoting climate alarm, however, have gone out of their way to obfuscate the reality. Real-time atmospheric studies in the 1930 – 1940 era revealed atmospheric CO2 concentrations exceeding 400 ppmv (Beck).

          • Gordon Robertson says:

            Bart…”The cartoon version of AGW basically treats the Earth and its atmospheric radiating level as a Dewar flask. But, the gap has been pierced”.

            Even the theory upon which AGW is built, the greenhouse theory, suffers from the same kind of problem. In a real greenhouse, the glass traps (or slow down the escape of) heated atoms, mainly nitrogen and oxygen molecules that comprise 99% of the atmosphere, from escaping vertically.

            A real greenhouse is not heated by the 0.04% CO2 content of the air in the greenhouse. The air is heated through the soil absorbing short wave solar radiation and passing the accumulated warmth on to the greenhouse air through conduction. The warmed air molecules, which are 99% N2 and O2 want to rise but they can’t because of the glass.

            Outside the greenhouse, those molecules would rise and be replaced by cooler air. It should be noted that a greenhouse will warm despite the concentration of GHGs in the air. You could build a special greenhouse with soil and fill it with only N2 and O2 and it will warm just the same.

            This was proved back in 1910 by Woods, who constructed two device, one with a glass cover and one with a cover made of rock salt (halite), that would pass IR. Neither heated significantly more than the other, so he concluded it was lack of convection causing the greenhouse to warm.

            The atmosphere is rife with convective currents and it has no roof. There’s no reason whatsoever why the atmosphere should warm due to greenhouse gases trapping IR.

            http://principia-scientific.org/the-famous-wood-s-experiment-fully-explained/

            BTW…Woods also claimed that due to the inverse square law, the intensity of surface radiation would diminish so quickly that it would have little effect more than a few feet above the ground.

          • Toneb says:

            “A real greenhouse is not heated by ….blah blah”

            Yes, yes we know the GHE is badly named as the physical mechanism is different. The the outcome is the same.

            “Theres no reason whatsoever why the atmosphere should warm due to greenhouse gases trapping IR.”

            There’s every reason. Not least the one concluded by common sense. That adding anything that absorbs and then re-radiates heat (a proportion – inverse square – back where it came from) to something cladding a heated object …. will make that object “warmer” than it would have been otherwise.
            If you wish (?) to understand how that works as a function of the opacity of the atmosphere then go look up the Beer-Lambert law. Taking particular not of the path-length term.

            BTW: anything that is published by Principia … is there for only one reason. Because no one else will. For good reason. Co%%on *published* there FFS. I suppose you subscribe o his, err, *science* too?
            If you wish to go down the rabbit-hole chasing that particular none-existent Dragon then go to a current thread on WUWT.

            BTW: I do not respond to arguments about empirical science. There is a reason why it is empirical and neither you nor Co$$on nor any other Dragon-slayer has slayed any sort of Dragon. All you display is a majestic exercise in hubris that can only be displayed in a psychology text.

          • Kristian says:

            barry says, September 15, 2016 at 4:24 PM:

            Firstly, I accept that CO2 is one of the greenhouses gases in the atmosphere, the second most abundant after water vapour, and that its presence makes the surface temperature warmer than it would be without CO2 in the atmosphere.

            Secondly, I accept that increasing the concentration of CO2 in the atmosphere should cause warming at the surface, all else being equal.

            barry, you’re not “accepting” anything. You “believe”. Very different. You accept a fact. You believe a claim.

            CO2 isn’t a “greenhouse gas”, because it doesn’t turn the Earth into a “greenhouse”. Its atmospheric presence doesn’t make Earth’s surface temperature higher than it would be in its absence. It is simply an IR active molecule, able to absorb and emit IR at certain wavelengths at normal Earth temperatures.

          • Kristian says:

            Gordon Robertson says, September 16, 2016 at 6:58 PM:

            The atmosphere is rife with convective currents and it has no roof. There’s no reason whatsoever why the atmosphere should warm due to greenhouse gases trapping IR.

            True. The presence of IR active gases in an atmosphere will clearly NOT make that atmosphere any warmer. However, it will allow the T_avg of the solar-heated surface beneath it to rise.
            http://www.drroyspencer.com/2016/08/simple-time-dependent-model-of-the-atmospheric-greenhouse-effect/#comment-225362

          • Bart says:

            Norman says: @ September 16, 2016 at 2:50 PM

            The double pane windows, and the Dewars, and such are not meant as science experiments to prove out a particular effect. Their goal is to insulate, and they use every practical means to do so. So, yes, inhibition of IR and other radiation is a contributor to that.

            But, the point is that the gap provides powerful insularity. You can definitely feel it when the seal is broken, as evidenced by condensation between the panes. I once had one break in the dead of winter. The drop in temperature when walking past that particular window was very palpable.

            And, the further point is that the Earth’s atmospheric temperature profile is set not by radiation alone, but by a balance between all modes of heat transport, with convection being a particularly powerful one. Atmospheric heating stimulates convection, which then acts to transport heat more uniformly, particularly to heights where it can radiate away while bypassing the atmospheric IR filter. As such, it is a negative feedback that attenuates heating due to increasing GHG.

            I am confident that net sensitivity to additional IR gases, CO2 in particular, is essentially null in the current climate state. That is because CO2 itself has an integral response to temperature anomaly, and combining that with a significant sensitivity of temperature anomaly to CO2 produces a positive feedback loop which cannot be stabilized even by T^4 radiation.

          • Bart says:

            Toneb says: @ September 17, 2016 at 2:27 AM

            “Not least the one concluded by common sense.”

            “Common sense” is what was responsible for all manner of bunkum prior to The Enlightenment. If science were purely intuitive, there would have been no need to devise the Scientific Method for systematic investigation of hypotheses.

            My common sense tells me that initial warming by GHE results in a change of state of the system, and natural responses which would tend to resist the change (Le Chatelier’s principle). And so, the response to increasing GHG is unlikely to be monotonic and, indeed, it cannot be based upon reductio scenario’s.

            The question of whether GHGs warm the surface more than it otherwise would be, and whether a given incremental increase in concentration of a particular component necessarily gives rise to a corresponding incremental increase in surface temperature, are two separate questions. One is looking at the secant line, the other, the tangent line.

            What we are interested in is the tangent line, and there is no guarantee that it has significantly positive slope everywhere with respect to GHG concentration. There is no guarantee that it is not, in fact, negative for particular climate states. Indeed, it cannot be positive everywhere, because if the atmosphere became 100% GHG, it would become merely an extension of the surface, and surface temperatures would necessarily drop to the atmosphere-less case.

          • gbaikie says:

            “CO2 isnt a greenhouse gas, because it doesnt turn the Earth into a greenhouse. Its atmospheric presence doesnt make Earths surface temperature higher than it would be in its absence. It is simply an IR active molecule, able to absorb and emit IR at certain wavelengths at normal Earth temperatures.”

            Earth is greenhouse. It’s transparent to sunlight and the majority of the gases [N2 and O2] keep it warm. And it has plants growing in it.
            The earth’s ocean are also a greenhouse- a watery greenhouse
            with plants growing in it.
            One could make a watery greenhouse. And/or one add barrels of water to a typical greenhouse and keep that greenhouse warmer during cooler nites.

            I would say that the so called greenhouse gases cause some warming but I think we should able to to rules out them causing much warming. Or they don’t cause 33 K warming on Earth.
            Nor do I think greenhouse gases can cause 33 K of warming on Mars. Nor do I think the radiant properties of the large amount of CO2 on Mars cause much warming. Or they might cause 1 K of warming at most. Co2 of Mars does cause more than 1 k warming at the polar regions when meters of CO2 accumulate during the winter. I mean the warming at poles
            due to latent heat of CO2 causes the average global temperature to increase by more than 1 K- not just 1 K to polar regions itself- which would be quite insignificant amount of warming. The change in state from gas to solid is
            also responsible [I believe] for Mars dust storms. And the dust on Mars causes a measurable amount of warming.
            So the CO2 on Mars is related to processes which cause warming, but this not related to “greenhouse gas properties”- or the radiant effect of CO2.

            Likewise I think their should distinction in regard to H20
            on earth- one has the radiant effects of H20 and one other effect of H20 as gas, water, and ice.
            So clouds are not greenhouse gases. And clouds have radiant effects. Dust is likewise not a greenhouse gas.

            So if isolate greenhouse gas to just the radiant effect of this gasses, I believe they have some warming effect.
            Whereas cloud definitely can have warming effect- and cooling effect [by reflecting incoming sunlight].
            As a gas, H20 do more than just there radiant effect [absorbing sunlight and Long wave IR].
            Greenhouse gases also have chemical effects- ie Methane is converted into CO2 in the atmosphere from energy of sunlight- that also isn’t a “greenhouse gas” radiant effect.
            Or the “burning” of Methane in the atmosphere, could be quite a warming effect- assuming one had enough fuel and oxider and sunlight. But it’s slightly crazy to be concerned about this on planet Earth. Or in a modern world supposedly short of chemical energy [a finite supply]- the concern should the waste of this fuel resource, rather than it’s potential heating effects.

            Anyhow I think strictly the greenhouse effects of greenhouse gases do cause some amount of warming, but they don’t cause 33 K or even 20 K of warming.

          • barry says:

            Gordon,

            I have little faith in studies of ancient Earth. They rely on proxy studies and far too many liberties are taken.

            And yet you very often point to ancient history in comments here – the world is cooler now than it was X billion years ago.

            How do I NOT take this change of heart to be opportunistic commentary on your part? It’s OK to refer to ancient history when YOU want to make a point, but that history is too murky when an ‘opponent’ refers?

            The evidence for the glacial changes of the last million years is very strong, from multiple and congruent lines of evidence, such as high sea level ridges throughout the world, glacial carving across continents, the ice core and sediment records, etc.

            You would dismiss that as too uncertain and yet proffer the earth’s surface temp of 3.5 billion years ago as a reference for today? Based on far fewer proxies, too?

            Before snapping a retort out, just think for a minute how this contradiction looks to me. You have brought up 3.5 billion year old climate numerous times, and many times directly to me. Now you wave away ancient history – a history far more recent than your regular remarks refer to. How am I supposed to read this?

          • barry says:

            barry, youre not accepting anything. You believe. Very different. You accept a fact. You believe a claim.

            CO2 isnt a greenhouse gas, because it doesnt turn the Earth into a greenhouse.

            Not being a physicist, I understand as best I can and weigh the consensus of opinion. One has to know one’s limits and proceed accordingly. I have read your comments, argued with you, and read others arguing with you. I’ve read a lot more besides on the topic of GHGs, and from many people who try to argue the CO2 is not a greenhouse gas, or that the greenhouse effect is non-existent. The conversation I’ve participated in and been witness to goes far beyond this board. For a layperson, I’m fairly widely read.

            You trot out the old semantic game of greenhouse gases not operating like a real greenhouse. I cannot believe you are doing this in an intellectually honest way. You’ve read too much of what I’ve written to mistake that for my views, so you are being sarcastic or something. I rarely saw this behaviour from you until recently and I took you more seriously.

            In the absence of qualifications, I must use my judgement. I judge your position to be on the loony fringe derided by Anthony Watts and Roy Spencer, and rejected by Richard Lindzen, John Christy, Roger Pielke Senior, and every well-known ‘skeptic’ atmospheric scientist.

            I do not accept your claims.

            Though all knowledge is provisional, in that I ‘accept’ every bit of knowledge I hold to be valent, for all intents and purposes I ‘believe’ what I do about CO2. So you are welcome to apply that word to my understanding. But it’s not belief like faith or fairies, is it? So let’s not play that game.

            Let’s not play semantics at all, eh?

          • barry says:

            Poor befuddled Barry thinks CO2 has something to do with ice ages, despite his vehement disclaimer above.

            Are you dense? My comment was to do with climate sensitivity. I didn’t mention CO2 – nor does the point require CO2 in any way.

            Gordon offered Lindzen’s views on climate sensitivity. He’s a go-to author if you want to promote the notion that climate sensitivity is very low.

            I pointed out that climate has changed dramatically in the past* – in the not too distant past, either; in the same tectonic configuration we currently reside. How do these big swings occur if climate is very stable, and from such a small perturbation?

            The big swings of the ice ages is why I am not convinced that climate sensitivity is very low.

            * Foolish ‘skeptics’ try to put it that their opponents think climate never changed in the past or never changed from natural causes. Past and natural climate change is all over every IPCC report. This ‘skeptic’ meme is one of the dumbest.

          • barry says:

            Gordon,

            I read on Jaworowski and Beck and the Hockey Stick wars years ago, and returned from time to time to read more when the points have been brought up.

            I came to the position that Beck and Jaworowski are wrong. Jaworowski’s views are singular in the ice core community, and regarded as ill-informed. I’ve done this to death quite a few times, so I would simply recommend you read the rebuttals to Jaworowski. To argue qualitatively – pointing to him is like pointing to a crank paper explaining why all Einstein’s equations were wrong. No one reasonable bases their opinions on clearly maverick views.

            Beck is much easier to dismiss. If you look at his charts of CO2 concentrations, they’re all over the place right up until 1958 – the year that Revelle started taking measurements. Suddenly, concentrations are incredibly stable, growing at a steady rate, but not changing by 100ppm over a few years. Either some extraordinary geological stabilizing influence came into being in the same year that exacting atmospheric measurements started to be compiled, or Beck used less than exemplary methods.

            One of the best resources of atmospheric CO2 records comes from the skeptical milieu. Please read:

            http://www.ferdinand-engelbeen.be/klimaat/beck_data.html
            http://www.ferdinand-engelbeen.be/klimaat/jaworowski.html

            Dr Spencer has also reproduced an email from this author here on the blog.

            http://www.drroyspencer.com/2009/01/the-origin-of-increasing-atmospheric-co2-a-response-from-ferdinand-engelbeen/

          • Bart says:

            barry @ September 17, 2016 at 5:59 PM

            Ferdinand is just a hobbyist, not an authority. He frequently relies on assertions and “Just So” stories to form his conclusions.

            The bottom line is that nobody can say for certain if the ice core estimates are accurate or not. There is no control experiment against which to validate the results. We only guess at the long term dynamics. We do not know.

          • Bart says:

            It is very clear from the temperature and CO2 data that, since at least 1958 when reliable and universally accepted CO2 measurements became available, CO2 levels in the atmosphere have been driven by a temperature dependent phenomenon.

          • Bart says:

            I had more to add to the above, but it seems the filter thinks it is spam. Multiple attempts have been unsuccessful. So, maybe this pithy last statement will go through.

            The bottom line is, this is the dynamic to be expected from CO2 transport on the back of the THC flow. Human inputs cannot be having an impact greater than their proportionality to the natural flows, and that is near 3% of the total, according to most of the guesstimates.

          • barry says:

            Bart, Beck is a high school biology teacher, so if we’re going to throw out ‘hobbyists’ we can immediately discard Beck’s contribution. Fair?

            Qualitative discarding of views? Fine. Jaworowski is an extreme, outlying view in the ice core community. No one who workd in the field agrees with him. Yet he is cited by ‘skeptics’ as if he is the oracle on ice cores. Rather than put his views front and centre, let’s place squarely where they sit – on the fringes of expert opinion in a singular category.

            If for some reason you wish to repeal qualitative rejection of views then I urge you to read up on Jaworowski and Beck, including the rebuttals to their work. The weight of opinion, and, more importantly, the strength of reason is strongly against them both.

            The following is the very first blog rebuttal to Jaworowski that I ever read. It’s pretty comprehensive.

            http://web.archive.org/web/20090104033735/http://www.someareboojums.org/blog/?p=7

            God knows why these guys are referred to by anyone as the font of wisdom on this subject. A variation of single study syndrome – ooh, I found a thing that rejects a thing, so now that is the authority on the subject….

          • barry says:

            Bart, that graph is a phony. Here it is without any derivation of temps.

            http://woodfortrees.org/plot/esrl-co2/from:1958

          • barry says:

            You’ve discovered the minute tracking of surface temps with CO2.

            Linear trend of atmos CO2 since 1979 is 1.75 ppm/yr.

            Linear trend of the derivative is 0.002 ppm/yr.

            Temps are responsible for maybe 1000th of the increase in atmos CO2. The increase of atmos CO2 since the industrial revolution is almost entirely anthropogenic.

            This part of the science is settled. No one who is skeptical of it can explain how humans pump out more CO2 per annum for the last 60 years than the atmospheric increase per annum, and it can be anything other than anthropogenic rise.

            It’s simple arithmetic. We pump out nearly twice as much as remains. The debate should be over right here.

            Or else there is this amazing natural mechanism that carefully distinguishes the anthropogenic CO2 from the rest, and somehow sequesters only that CO2 and no other type, while at the same time the background level of CO2 is rising over the years from some unknown natural source that just happens to stay in ratio with anthropogenic emissions as they have increased over the years.

            Quite a coincidence!

            We also have to reject research in to isotopic changes in background atmospheric CO2 levels. We have to reject ice cores, fossil plant stomata, corals and sediments that all converge on the same thing.

            We have to set all this aside and trust a biology teacher and an alpinist who never drilled an ice core for climate studies in his life.

            Reviewing the ‘skeptic’ canon on CO2 makes me very skeptical indeed of the sincerity and/or sagacity of the skeptics on this matter.

            But come on – tell how anthro emissions can be twice the amount that background levels have increased in the atmos and it’s not us. You’d be the first to attempt it.

          • barry says:

            Gordon, I think I may have mistook your views on paleoclimate with another commenter here who goes on about the temp of earth 3.5 billion years ago. If so, I apologise for my comments regarding.

          • mpainter says:

            Indeed, you have confused Gordon with Mike Flynn and it’s 4.5 billion years, not 3.5.
            Poor Barry.

          • Bart says:

            barry @ September 17, 2016 at 11:05 PM

            “Bart, that graph is a phony.”

            Umm… no. If you do not understand what a derivative is, or what this relationship signifies, then there is very little reason to proceed further.
            barry @ September 18, 2016 at 12:03 AM

            “Its simple arithmetic. We pump out nearly twice as much as remains. The debate should be over right here.”

            There’s your problem. You never graduated beyond simple arithmetic.

            We’ve also “pumped out” innumerable other products. According to your “simple arithmetic”, we should be neck deep in excrement alone by now. But fortunately, nature is dynamic, and rates of decomposition exceed rates of deposit. Just so, our CO2 inputs are rapidly processed through the Earth’s natural flow regime.

            The math, actual sophisticated math that takes into account dynamic natural processing, shows incontrovertibly that atmospheric CO2 is not significantly impacted by human activity. I will grant you it is not widely recognized yet, but it will be. There really is no doubt about it.

          • Gordon Robertson says:

            barry…”Bart, Beck is a high school biology teacher, so if were going to throw out hobbyists we can immediately discard Becks contribution. Fair?”

            Not fair at all. Beck has made no personal claims about CO2 concentrations since 1850, he has collated hundreds of papers by legitimate scientists who have measured CO2 concentrations in excess of 400 ppmv since then.

            As for Jaworowski, he is an expert on ice cores. Regarding his as wrong because a few unnamed rebuttals have claimed otherwise is no proof that he’s wrong.

            Consider some of his points. At a depth of several hundred feet in a glacier, due to increased pressure, CO2 soldifies into a clathrate. As the ice core is extracted and the clathrates converts back to CO2, it is diluted by melt water from the drill.

            Secondly, ice core samples in the same Antarctic vicinity reveal dramatically different concentrations of CO2. The IPCC cherry picked 280 ppmv for the pre Industrial Era because it suited their theory.

            Putting Beck and Jaworowski together, there is ample proof that CO2 concentrations have varied dramatically after the pre Industrial Era and that the IPCC figure of 280 ppmv pre IE is not to be taken seriously.

            Furthermore, the pre EI was in the middle of the LIA when global temps were 1 C below normal.

            With regard to me posting about ancient geology It was not me. No offense taken.

          • barry says:

            As for Jaworowski, he is an expert on ice cores.

            No, Gordon, he is not. His ice core drilling amounted to several meters depth with a hand drill. He had no hand in any of the ice core drills for climate studies, which involved different machinery drilling hundreds to thousands of meters. He was not present for any of the long-core drillings for climate studies.

            Beck’s stuff is wrong and straightforwardly so. The best record of atmospheric CO2 measurements we have is from the late 1950s with the advent of Mona Lua and Antarctic data, now corroborated at sites around the world. There are no wild jumps in the CO2 record post 1957. The older measurements were very flawed, and Beck’s methods did’t account for that – such as taking readings in urban locations with large daily fluctuations in CO2 and then weighting parts of his index to those clearly contaminated readings.

            All one has to do is look at the post-1957 record to see that Beck’s methodology was flawed. Large swings such as his charts don’t happen on a global scale, only in or near cities/factories. Local conditions is what Beck’s charts represent.

          • barry says:

            Bart,

            Human industry has been emitting twice as much CO2 as the growth in atmospheric background levels for decades.

            If anthropogenic emissions are 40ppm over 10 years, the atmospheric concentration increases by 20ppm in the same time. The biosphere is a net sink, so about half of anthopogenically emitted CO2 remains in the atmosphere.

            It’s simple arithmetic.

            How can the increase not be anthropogenic?

            Explain.

          • Bart says:

            Barry,

            The concentration of CO2 in the atmosphere is determined by a balance between inflow and outflow. Inflow comes from, among others, combustion (both natural and anthropogenic e.g., forest fires, cars), volcanic activity, biological activity, and ocean upwelling currents.

            Outflow results from, among others, biological activity, mineral weathering, and ocean downwelling.

            The flows due to natural activities are many times greater than those due to human activities, on the order of 30X or more. Thus, a tiny variation in natural flows easily dwarfs that due to human activity.

            For equilibrium, you must have inflow equal to outflow. At no time are inflows simply accumulating over time. Rather, a balance is sought. The outflow is, in fact, proportional to the inflow, as increasing inflow stimulates biologic activity, produces greater mineral decomposition, and increases pressure on ocean downwelling.

            When you have such a system stimulated by a small additional input, the amount that input can cause the balance to shift is proportionally the same as the proportion of that additional input to the existing input. As humankind’s proportionate input is on the order of 30:1, human inputs can only account for about 1 part in 30 of any observed rise. So, for example, if the previous balance was 300 ppm, and it has been observed to rise, then human inputs can have only contributed up to about 10 ppm of the rise.

            I will give you an example to try to help you visualize it. Suppose you partially plug your lavatory drain and turn on the water. You will see that the water eventually rises to an equilibrium level. Now, turn the spigot to increase the input by 3%. How much higher will the water rise?

            It will rise 3%, because the outflow from the partially blocked drain is proportional to the height of the water column above the drain. So, when the height increases 3%, there is 3% more outflow, and equilibrium is reestablished.

            So, if you notice that the height of the water increased 30%, you know it wasn’t from your turning the water higher. It was mostly from something blocking the drain.

            As far as CO2 is concerned, what we see is mostly a result of rising temperatures causing a constriction in the drain.

          • barry says:

            Bart, I understand what you’ve said, but it doesn’t answer the question at all.

            We KNOW that anthro CO2 emissions have been twice as much as the additional CO2 in the atmos since the industrial revolution.

            We KNOW that we emit twice as much annually as remains in the atmos, accumulating over time.

            How do you mathematically get around that the contribution is entirely to us?

            The biosphere is a net sink for our emissions – but it only sinks half of that which we emit.

            As humankinds proportionate input is on the order of 30:1, human inputs can only account for about 1 part in 30 of any observed rise.

            This is the ratio to biosphere turnover in a single year. Thus,

            if the previous balance was 300 ppm, and it has been observed to rise, then human inputs can have only contributed up to about 10 ppm of the rise.

            The rise between 300ppm and 400ppm has occurred over 116 years (1900 to present). Humans need only account for about 0.86ppm per year on average. Of course, anthro emissions have increased over time.

            Average anthro emissions over the same time period are about twice as much as the increase. The biosphere has been a net sink for our emissions. We also know this because CO2 levels in the oceans have risen.

            Anthro emissions are responsible for the rise since the IR. It’s simple arithmetic.

            Try this analogy on.

            Think of a bank balance.

            You get $1000 a month pay and all of it goes on necessaries and various luxury items that take your fancy. Your balance does not increase nor decrease.

            Your get a pay increase of $50 a month. Your bank balance now climbs by about $25 a month. You’re spending a bit more, but not so much you wipe out the increase.

            You are arguing that the monthly increase in the bank balance is not due to the raise, but because of the spending habits.

            That’s nonsense.

  70. Martin Cropp says:

    Dear Dr Spencer
    Do you get progressive temperature data during the month and see a trend, or does it all arrive in a big lot at the end of each month. I would guess from observations that it may have started cooling in the NH about the 10th September.
    Thank you

  71. Lewis says:

    M Cropp,

    I have been wondering the same thing. Are the temperature measurements an accumulation of samplings?

  72. ren says:

    As for the temperature of the Arctic, it should be noted that the decline in solar activity generates increase in ionization of the air above the polar circle, which leads to anomalous pressure.
    http://sol.spacenvironment.net/raps_ops/current_files/rtimg/dose.15km.png
    http://www.cpc.ncep.noaa.gov/products/stratosphere/strat-trop/gif_files/time_pres_HGT_ANOM_JAS_NH_2016.png

  73. AndyG55 says:

    Roy, when will the August UAH Global temperature report be available?

    Still seems to be stuck on July.

  74. ren says:

    Believe it or not, but it’s better to worry about firewood for the winter.
    https://cosmicrays.oulu.fi/
    Minimum solar will come earlier.
    ftp://sidads.colorado.edu/DATASETS/NOAA/G02186/plots/4km/r09_Canadian_Archipelago_ts_4km.png

  75. mpainter says:

    Barry Schwartz says : “Are you dense? My comment was to do with climate sensitivity. I didnt mention CO2 nor does the point require CO2 in any way.”
    # # #

    I love it when people like barry comment that way.

    IPCC AR4 Chapter 8 on climate sensitivity: “It is broadly defined as the equilibrium global mean surface temperature change following a doubling of atmospheric CO2.”

    Watch barry explain to the IPCC AR4 Ch. 8 people that they are “dense”. I want to see this.

    • barry says:

      That definition is specific to CO2 forcing. Climate sensitivity is a general property of the climate system comprising many feedback components. The forcing can be anything that changes the radiative balance of the climate system, including changes in insolation, volcanism, aerosols and GHGs.

      From the same section:

      Climate sensitivity is largely determined by internal feedback processes that amplify or dampen the influence of radiative forcing on climate. To assess the reliability of model estimates of climate sensitivity, the ability of climate models to reproduce different climate changes induced by specific forcings may be evaluated. These include the Last Glacial Maximum and the evolution of climate over the last millennium and the 20th century…

      Feedbacks – not forcings (2xCO2) – is what I am referring to re ice age transitions and climate sensitivity. Take a breath, think, and avoid being dense.

      • mpainter says:

        “From the same section: [quote]”
        ## ## ##

        From the same section that defines climate sensitivity as quoted in my comment above. You remove your quote from its context to give it a different meaning. Another snapshot of your brain in action. You just can’t help yourself, can you?

      • Gordon Robertson says:

        barry…”Climate sensitivity is largely determined by internal feedback processes that amplify or dampen the influence of radiative forcing on climate”.

        In your comments, you make reference to forcings. A forcing is a reference to a forcing function in a differential equation. A square wave mathematical representation applied to an electronic amplifier equations forces a ringing in the output as well as revealing where oscillations may be expected.

        Models are based on differential equation theory, hence the term forcing. Just because the IPCC talks about forcings does not mean they exist in reality.

        You have to be careful with IPCC jargon because they pass off model jargon as if it is real. For example, in your quote above, they claim internal feedback processes cause amplification. That is a faulty notion that persists in many Internet articles, that feedback causes amplification.

        It’s the other way around. An amplifier supplies the gain required for amplification but if a positive feedback is applied so as to enhance the input signal, after a few amplification cycles the output can escalate out of bounds.

        That kind of positive feedback is incorrectly applied in climate models. It is programmed into models based on sheer supposition, not sound physics. Without it, models would not show catastrophic warming.

        • barry says:

          No. In this context a forcing is any physical factor that ‘forces’ change in the climate. Often it is described as some sustained change in the radiative balance of the climate system, whether solar intensity, insolation changes, volcanism (aerosols/albedo), land-use changes (albedo) etc.

          The term in this context is NOT derived from differential equations.

          https://www3.epa.gov/climatechange/glossary.html#F

        • barry says:

          Gordon,

          IPCC says gain is less than 1, even though the amplification (feedbacks) is greater than the forcing. Why? System forcings are limited in some manner. For CO2, it’s the logarithmic effect. Some feedbacks are also limited (eg, ice albedo).

          In the amplifier scenario the gain is greater than 1, hence the ear-splitting wail.

        • barry says:

          Also Gordon,

          Feedbacks are an emergent property of most AOGCMS, not a tunable parameter. Feedbacks (or rather, climate sensitivity) is set in some simpler models for other purposes.

    • barry says:

      And from the 2nd Assessment report:

      In IPCC reports, climate sensitivity usually refers to the long term (equilibrium) change in global mean surface temperature following a doubling of atmospheric equivalent CO2 concentration. More generally, it refers to the equilibrium change in surface air temperature following a unit change in radiative forcing (C/Wm’).

      My thinking isn’t limited to CO2, painter.

      • mpainter says:

        “My thinking isnt limited to CO2, ”

        # ## ## #

        In your dreams. Whom do you imagine to fool? You forget that you have given enough example of your thinking :
        Barry Schwartz: ” The step-up is an artefact of data selection”; “forty years of warming” which includes the pause, because “of statistical uncertainty”.
        Your straight edge mentality is all too evident.

      • barry says:

        The point, you dizzified broken record, is that small perturbations – specifically insolation changes from orbital variation during ice age transitions – seem to be sufficient to trigger larger responses in the climate system.

        It does not mater if the feedbacks are vegetation coverage or not, aerosols or not, albedo or not, GHGs or not, changes in heat transport through the atmosphere and/or oceans or not, or whatever combination of any or all of these or other factors.

        The point is that ice ages speak against the notion of climate sensitivity being low – that the earth’s climate system is very stable to perturbation.

        That’s it. No need to invoke AGW or CO2. Relax.

        • mpainter says:

          Still confused, poor Barry. If you wish not to sound like an idiot, then you need to specify the context of a climate response i.e., give a specific forcing. There is no general attribute of climate known as climate sensitivity.
          I hope that helps, poor fellow.

          • barry says:

            Uh, yeah, there is:

            IPCC on climate sensitivity:

            More generally, it refers to the equilibrium change in surface air temperature following a unit change in radiative forcing (C/Wm).

            Radiative forcing can be other than GHG.

            American Meteorological Society

            1.The magnitude of a climatic response to a perturbing influence.

            2. In mathematical modeling of the climate, the difference between simulations when the magnitude of a given parameter is changed.

            3.In the context of global climate change, the equilibrium change in global mean surface temperature following a unit change in radiative forcing.

            Climate Sensitivity often refers to the surface temp response to a doubling of CO2, particularly in IPCC reports but that is not the only usage.

          • mpainter says:

            Except the internet never forgets:

            Barry : “The point is that ice ages speak against the notion of climate sensitivity being low that the earths climate system is very stable to perturbation.”
            ## ### ##
            Yeah, right Barry, now pretend again that you did not say this.

      • Gordon Robertson says:

        barry…”And from the 2nd Assessment report:”

        To put things in perspective, Barry, the IPCC announced in TAR that future climate states cannot be predicted. Everything they have done since then have been hypothetical ‘projections’ from climate models.

        They were forced to change the term ‘prediction, to ‘projection’ when expert Vincent Gray pointed out that unvalidated models can predict nothing.

        http://www.int-res.com/articles/cr/10/c010p155.pdf

        http://hockeyschtick.blogspot.ca/2014/03/ipcc-expert-reviewer-dr-vincent-gray.html

        • barry says:

          I’m afraid that bit about Vincent Gray forcing the IPCC to do anything is nonsense.

          The very first assessment report (FAR 1990) was already using the term ‘projections’ for future climate change scenarios. Gray’s 1998 paper that you’ve linked (thank you) refers to this IPCC language from that and the subsequent reports.

          I have no idea why you have cited this ’98 paper. It contradicts your point rather than buttresses it, and seems to have no other purpose WRT to anything you wrote. Gray did not invent or promote the use of the terms scenario and projection WRT to future climate change.

          The Gray post in the hockeyschtick link has a substantial flaw. He cites Lorenz on climate. Lorenz was referring to weather.

          Climate is not weather. Lorenz never argued that the flap of a butterfly’s wing could turn summer into winter.

          • mpainter says:

            You got backwards, barry. Again. Climate is indeed weather. The expression that you muffed: weather is not climate. Poor fellow, so hard to keep it all straight in your mind, tsk, tsk.

          • barry says:

            Interesting logic there, pretzel. Let’s express that in classic terms.

            A is not B

            at the same time

            B is A

            Brilliant.

            Context is everything. This is why you fail.

          • mpainter says:

            Except climate is weather.
            A (weather) is component of B (climate).
            B is not component of A.
            Is this difficult for you, barry?

            Think: hot dry climate
            Or, cold wet climate
            Or, warm humid climate
            Or temperate, wet climate

            Climate===>weather

            Let me know if you need anymore help.

          • barry says:

            A (weather) is component of B (climate).
            B is not component of A.

            Climate is not a component of weather.

            Climate is not weather: in the context of the point being made. Do you remember it at this point? Probably not.

            You didn’t get the context. This is why you fail so often.

            Lorenz’s butterfly does not affect climate, because climate is not (like) weather.

            Are you getting it yet?

            No?

            The context is chaos theory.

            Weather is chaotic. Climate is…

            Let it tick over in your mind for a minute.

            Blindness to context is the sin of pedants and nit-pickers.

          • Non-linear dynamics also exist in the ocean circulation, which has time scales of centuries or longer. Therefore climate variations are also potentially chaotic.

          • mpainter says:

            For chaos in climate, it takes a longer perspective to identify; some examples:
            1.interstadials
            2. PETM
            3. Eocene Thermal Maximum
            4. Oligocene ice age (with repeated interstadial type warming spikes)
            5. Holocene Pluvial (utterly ignored by “climate scientists”)
            6. Catastrophic climate related extinctions through catastrophic events, as in the terminal K.
            7. Closer to home, ENSO, insofar as it influences climate.

            So much for the notion that climate is not subject to chaos.

          • Miker says:

            Barry, Roy and mpainter,

            I am glad that non-linear dynamics and chaos theory with regard to climate have got a mention here. A good summary of the history of this up till 2009 can be found at https://www.aip.org/history/climate/chaos.htm .

            The last paragraph is well worth reading.

          • barry says:

            Roy,

            For the kind of contexts we are discussing, climate is *relatively* stable (periodic or cyclical) and there are various analogues, like the seasons and ice ages.

            The difference between climate and weather is that a perturbing force on climate will produce a fairly predictable response, whereas a perturbing force on the scale of weather is much less predictable.

            Lorenz’s butterfly may affect weather but it won’t affect climate.

            If we turn the sun up by 1% per decade we can estimate the global surface temperature for the decade 2090-2099 with much better accuracy than estimating the weather in Perth on September 28 2096.

  76. mpainter says:

    Barry: “The big swings of the ice ages is why I am not convinced that climate sensitivity is very low.”
    # # #

    Here is a snapshot of the way the gears mesh in Barry’s brain. Note the shiny little metal flakes.

  77. ren says:

    When Jetstream in the Pacific goes back to the south falls index El Nino.
    http://www.tropicaltidbits.com/analysis/ocean/nino34.png

  78. mpainter says:

    Barry: “The big swings of the ice ages is why I am not convinced that climate sensitivity is very low.”
    # # #

    The term “climate sensitivity” is meaningless as used in this sentence. There is no general attribute of climate known as “climate sensitivity”, high, low or otherwise, as implicit in your comment above.
    Rather, the term has meaning only within specific context such as as a quantified forcing. Thus the IPCC definition in AR4 8.6.1 (quoted by me above), which puts the discussion of “climate sensitivity” within a specific context.

    Whenever the term “climate sensitivity” is used without specific reference, as in a seemingly general sense, it is always understood as referring to a doubling of CO2 as the specific, though unstated, forcing.

    Your statement above shows that none of this is clear to you.

    • barry says:

      The point, you dizzified broken record, is that small perturbations specifically insolation changes from orbital variation during ice age transitions seem to be sufficient to trigger larger responses in the climate system.

      It does not mater if the feedbacks are vegetation coverage or not, aerosols or not, albedo or not, GHGs or not, changes in heat transport through the atmosphere and/or oceans or not, or whatever combination of any or all of these or other factors.

      The point is that ice ages speak against the notion of climate sensitivity being low that the earths climate system is very stable to perturbation.

      Thats it. No need to invoke AGW or CO2. Relax.

      • mpainter says:

        Still confused, poor Barry. If you wish not to sound like an idiot, then you need to specify the context of a climate response i.e., give a specific forcing. There is no general attribute of climate known as climate sensitivity.
        I hope that helps, poor fellow.

      • barry says:

        If you wish not to sound like an idiot, then you need to specify the context of a climate response i.e., give a specific forcing.

        Oh. Dear.

        Read up. Or down. The context was given and repeated before you crashed in and spouted pap.

        Idiot. Looks like you killed the first reasonable conversation I’d had with Gordon. Just buzz off.

      • Lewis says:

        Barry,

        If you subscribe to the Milankovitch theory of orbital variations, then it seems AGW due to increased CO2 etc, is irrelevant, yet this seems to be what you argue regularly.

        Then, quite often you will say – ‘that’s not what I believe’, well, what do you believe? All the reader has is what you write, which, in large part, seems to be the opposite of mpainter.

        No matter.

        What I have learned here is that few, if anyone, are able to predict what comes next. Yet the AGW zealots, and that is the only accurate term for them, would have us believe they know all. BS Their purpose is political control and power. THAT is all. They care nothing for the people, if they did, they would warming.

        • barry says:

          Lewis,

          Are you familiar with the theory of climate change during Quaternary ice age transitions triggered by orbital variation?

          If all you know is “temperature leads CO2” then you need to read more. That’s where pseudo-skeptics tend to stop reading. They’ve got the bullet-point they need so they don’t inquire any further. Maybe you’re different.

          mpainter casts anyone who smells like they might vote for the Greens as an alarmist who needs a good sarcastic shellacking. His contribution is 95% dross. Do NOT look to him for any idea on what I think – or for how anyone else thinks for that matter.

          • mpainter says:

            It’s your science that has an odor, barry, I have no concern for your politics. Lewis has also got you smelled out, I’m afraid.

            Do you imagine that you can talk away your poor, odiferous science?

          • Gordon Robertson says:

            barry “Are you familiar with the theory of climate change during Quaternary ice age transitions triggered by orbital variation?”

            Can’t see what would cause an orbital variation unless it was something catastrophic like Velikovsky’s Worlds in Collision.

            The parameters of an orbit are fairly consistent. The only thing that’s going to alter an orbit to a significant extent is a change in the Sun’s gravitational field or a change in the angular momentum of the Earth. Once that overall momentum is lost there’s no way to get it back.

            Perhaps we had a greater momentum at one time and a catastrophic collision affected it. We could have dropped to a lower orbit or increased the orbit, but it’s unlikely to me that the orbit changed enough to cause an Ice Age then reverted to a normal orbit.

            Geologists and Earth Scientist, of necessity, live in a world of sheer conjecture.

          • Lewis says:

            Barry:
            Milankovitch – look it up.
            He was the originator of the theory of orbital changes affecting climate.

            Yes, I believe there is much there. Which, as I said, leaves CO2 as a follower, not a leader.

            It seems you twist and turn trying to convince others of – what?

            Good luck in that – it’s not likely you’ll change many minds here. Even if you were right, to which your inconsistency in arguments doesn’t lead.

          • barry says:

            Lewis,

            Milankovitch look it up.

            Thanks for the advice, but I did that nearly a decade ago.

            Which, as I said, leaves CO2 as a follower, not a leader.

            Apparently you did not read what I said:

            Are you familiar with the theory of climate change during Quaternary ice age transitions triggered by orbital variation?

            If all you know is temperature leads CO2 then you need to read more. Thats where pseudo-skeptics tend to stop reading. Theyve got the bullet-point they need so they dont inquire any further. Maybe youre different.

            The lead/lag argument was one of the first I came across many years ago. So I ended up reading a hundred papers or so on the ice age transitions. I recommend learning more than the bullet point.

          • barry says:

            Gordon,

            Cant see what would cause an orbital variation unless it was something catastrophic like Velikovskys Worlds in Collision.

            Surely you’re familiar with Milankovitch cycles? They are the leading candidate (by a country mile) for the cause of Quaternary ice age transitions.

            Have I been speaking past you then, with reference to the small insolation changes from orbital variation causing ice age shifts?

            Let me be more general then. Assuming you agree that the Earth has undergone large climate changes in the geological record, how does this square with the notion of a climate system than is fairly insensitive – or stable – to perturbations on it. If negative feedbacks are strong, how do large changes occur – like recent ice ages?

  79. mpainter says:

    “The point is that ice ages speak against the notion of climate sensitivity being low that the earths climate system is very stable to perturbation.”
    ## ## ##

    You confirm that you are confused over the proper meaning and use of “climate sensitivity”.
    One does not use the term without specific context,i.e., a quantified forcing. If you use the term in a general sense, it is nonsense unless you mean that the ordinary sense is understood: a doubling of CO2.

    • mpainter says:

      I should add that you are in no position to be calling people “dense”.

    • barry says:

      My dear blind painter, what part of “specifically insolation changes from orbital variation” confuses you about the forcing I am referring to?

    • barry says:

      You crashed the party when I responded to Gordon on climate sensitivity, referring to orbitally triggered ice age shifts. I’ve been talking about the system response to forcing supplied by small changes in focus and intensity of insolation. That’s the context.

      Loosen. Your. Grip.

      Like an alarmist you have CO2 on the brain.

      • mpainter says:

        Barry, unfortunately for you, the internet does not forget.
        From your comment to me above, 9/17/5:37 pm:

        “Are you dense? My comment was to do with climate sensitivity. I didnt mention CO2 nor does the point require CO2 in any way.

        Gordon offered Lindzens views on climate sensitivity. Hes a go-to author if you want to promote the notion that climate sensitivity is very low.

        I pointed out that climate has changed dramatically in the past* in the not too distant past, either; in the same tectonic configuration we currently reside. How do these big swings occur if climate is very stable, and from such a small perturbation?

        The big swings of the ice ages is why I am not convinced that climate sensitivity is very low.”

        • mpainter says:

          Also,

          The point is that ice ages speak against the notion of climate sensitivity being low that the earths climate system is very stable to perturbation.

          Tsk, tsk.

          • mpainter says:

            Try once more for quotes:

            “The point is that ice ages speak against the notion of climate sensitivity being low that the earths climate system is very stable to perturbation.” Says barry

          • mpainter says:

            Tsk, tsk

          • barry says:

            I cannot even guess the rabbit hole you’ve gone down. Looks like countering whatever I say is now a reflex action devoid of any meaning.

          • mpainter says:

            Devoid of meaning for you, not for others. Climate sensitivity only has meaning in the context of specific forcing.

        • Gordon Robertson says:

          mpainter…”Gordon offered Lindzens views on climate sensitivity. Hes a go-to author if you want to promote the notion that climate sensitivity is very low”.

          Not low per se but low to the effect of ACO2. I was not suggested the climate is insensitive to other factors. Something happened to produce the 400+ years of the Little Ice Age.

          • barry says:

            Lindzen suggests climate sensitivity is low to any forcing, not just CO2. He actually agrees with the mainstream view that doubling should lead to ~1K warming at the surface. His position is that the system has strong negative feedbacks.

            As I said before, he doesn’t explain how low sensitivity works WRT to ice age transitions. He pays scant attention to paleoclimate, though he does recognize that there were large changes during the Quaternary ice ages.

            This is a gap in the low-sensitivity argument that I find unconvincing (just as I find people who push only high-sensitivity unconvincing).

          • mpainter says:

            Paleoclimate: you need to consider it all. The Pleistocene is only a part of the picture. There were M-Cycles in the K, but no glaciers. Also in the Eocene, but no glaciers. Oligocene was an ice age (34-22 mya). Milankovitch cycles? Don’t bet on it. Mid Pliocene was some 8-12 C warmer than today, circa 3.3 mya, with deciduous forests at 80 N L. No glaciation except in Antarctica. So much for Milankovitch cycles forcing. Where was CO2? Alarmists who think that appeals to paleoclimate is going to redeem their fallen hypothesis are in for more disappointment.tsk, tsk.

          • RW says:

            Barry,

            The reason why Lindzen pays scant attention to that is because Milankovitch forcings are many orders of magnitude larger than what any extra forcing additional CO2 would provide. Moreover, one cannot possibly equate the positive feedback effect of melting ice leaving maximum ice to that of near minimum ice where the climate is now.

          • barry says:

            RW,

            You are wrong. The forcing from Milankovitch cycles is very small. It is a change in focus of insolation of 3 degrees latitude (obliquity), and in terms of eccentricity, a very small increase in solar intensity for several months of the year (with the opposite effect ~ 6 months later), amounting to a forcing of 0.45Wm/2 at the nearest point to the sun through the year. The response to these small perturbations is a global temp change of 4-6C, the formation or recession of kilometer thick ice sheets on Northern land masses, and a change in sea level of as much as 100 meters.

            It is amusing to see ‘skeptics’ grimly hanging on to CO2 in the discussion. The feedback factors could possibly be mainly albedo and ocean/atmosphere circulation. My point is simpler than arguing for CO2 amplifying the forcing for orbital changes, though I am aware of the thesis, of course. But skeptics gotta slap that CO2 sh!t down whether or not barry is making a case for it.

            Knee-jerk rejectionism, I suppose. Looks frantic to me.

          • mpainter says:

            “Looks frantic to me”
            ## ## ##

            Still pushing the forty year warming trend, barry? With the eighteen year pause rolled up in it? Still denying the step-up? Have you abandoned the spike hype? Still frantically pushing that AGW, it looks to me.

          • RW says:

            barry,

            I don’t think you understand what Milankovitch forcings are. They are not a change in the global mean, but a large change in the distribution of that global mean to higher latitudes. These forcings are multiple 10s of watts per meter squared. These forcings causing the swings between glacial maximums and glacial minimums, i.e. Milankovitch hypothesis, do not require any extra forcing from additional CO2.

          • RW says:

            barry,

            Here is link to a paper that estimates Milankovitch forcings. Note they are often 50+ W/m^2 in magnitude:

            http://earthweb.ess.washington.edu/roe/Publications/MilanDefense_GRL.pdf

            See Figure 1, for example.

          • Kristian says:

            barry says, September 19, 2016 at 4:01 PM:

            The feedback factors could possibly be mainly albedo and ocean/atmosphere circulation. My point is simpler than arguing for CO2 amplifying the forcing for orbital changes, though I am aware of the thesis, of course. But skeptics gotta slap that CO2 sh!t down whether or not barry is making a case for it.

            Well, it very much sounded as if you were specifically “making a case for it” back when you claimed the “paleo” argument as direct evidential support for the AGW case.

            But it’s good to see your acknowledging the obvious impact of the albedo and ocean/atmosphere circulation feedbacks. After all, there’s no need for anything else to explain the multi-millennial ice age swings …

          • barry says:

            RW,

            Not sure if you’re reading what I’m writing. We’re seeing the same orbital picture. Eg,

            Me: It is a change in focus of insolation of 3 degrees latitude (obliquity)

            You: They are not a change in the global mean, but a large change in the distribution of that global mean to higher latitudes

            I think ‘global mean’ is the wrong language – it’s not the global mean at all, but the focus of insolation which changes due to obliquity and precession. Eccentricity is a change in solar intensity owing to distance from the sun changing.

            But despite the language differences I think we view it the same way.

            The peak geological-time variation of insolation in June at 65N is about 100W/m2. This is half the difference between summer and winter at our current orbital dynamics. This effect at 65N is usually offset at the opposite latitude (65S). If the NH is getting more insolation the SH is getting less and vice versa, similarly to the seasons. Eccentricity changes affect both hemispheres in the same direction (eccentricity is about proximity to the sun), but the forcing changes from that are very small indeed. Earth’s eccentricity is a very minor deviation over time, amounting to less than 1W/m2.

            The small but significant forcing at 65N (relative to annual summer/winter changes) causes a global response of roughly equal magnitude at both hemispheres, even while the opposite-signed forcing is occurring in the other Hemisphere (also happens to NH when SH is receiving more insolation in Summer).

            If the significant orbital forcings (obliquity/precession) acted with no feedbacks, one hemisphere would cool while the other warmed. This is not the case during ice age/interglacial phases.

            Feedbacks have to be significant to get a uniform global response when forcing is zonal.

          • barry says:

            Kristian.

            I’m making a different argument here that does not require invoking CO2. I am amazed that ‘skeptics’ are desperate to force the issue.

          • RW says:

            barry,

            You’re missing the point. I’m not saying there are no feedbacks involved. Milankovitch hypothesis is incrementally increased insolation in higher latitudes during the NH summer, melting incrementally more and more of the winter accumulated snow and ice, allowing incrementally more and more energy from the Sun to be absorbed during the course of a year.

            This is not equivalent to a global average sensitivity in response to increased insolation (or increased GHGs, like CO2). Moreover, even if it were, you cannot possibly equate the positive feedback effect of leaving maximum ice to that of near minimum ice where the climate is now (and is during interglacial periods). The overwhelming amount of that effect was used up as we left the last glacial maximum.

            BTW, if you doubt this, just look at the contribution melting ice has on the IPCC models’ feedback response outputs. It’s very small in comparison to that which supposedly comes from water vapor and clouds. This is because the overwhelming amount of ice is now centered close to the poles which get little Sun and are dark (with way below freezing temperatures) six months of the year.

          • mpainter says:

            Yeah, but who believes you?

          • barry says:

            RW,

            Yes, I misunderstood you. I thought you were saying insolation changes were enough by themselves (no feedbacks) to account for uniform global changes over the several thousand years to deglaciation. Ice sheets play a major role, certainly, and maybe the primary (albedo) feedback. But that still leaves hemispherically anti-phased insolation changes producing a uni-directional global change. The global feedbacks to antiphased hemispheric insolation (which would effectively cancel each other out if the earth was featureless) must be significant to overcome dwindling insolation in the hemisphere that is warming.

          • RW says:

            barry,

            “But that still leaves hemispherically anti-phased insolation changes producing a uni-directional global change. The global feedbacks to antiphased hemispheric insolation (which would effectively cancel each other out if the earth was featureless) must be significant to overcome dwindling insolation in the hemisphere that is warming.”

            I’m not sure I fully understand what you’re saying here. Can you clarify?

          • barry says:

            Sure RW.

            When, orbital variations bring more insolation to the NH, the SH is getting less insolation (and vise versa). This is always the case for obliquity and precession orbital variations.

            So while the NH is getting warmer from more insolation, the SH is getting cooler (and vise versa).

            If insolation alone were the source of warming and cooling during ice age transitions, then the climate change would be anti-phased between the hemispheres. One would warm while the other cooled.

            And yet when ice age transitions happen, both hemispheres get warmer/cooler at virtually the same time, despite the orbital forcing having opposite effect on each hemisphere at the same time. This is particularly evident during the (relatively) fast warming phase to interglacials.

            Thus, some feedbacks must operate on a global scale to counteract the cooling in the hemisphere opposite to the one that is warming.

            And those feedbacks must be stronger than the insolaton forcing that is making one hemisphere cooler (while it warms the other).

            Is that clearer?

  80. ren says:

    The tropical Pacific as a key pacemaker of the variable rates of global warming.
    http://www.nature.com/ngeo/journal/v9/n9/full/ngeo2770.html

  81. ren says:

    Summary and Conclusions
    [15] The time evolution of the global OHC for the period
    19582009, as estimated by the ORAS4 ocean reanalysis,
    is dominated by a warming trend and pronounced cooling
    episodes, and shows an increasing warming trend at depths
    below 700 m. The cooling episodes correspond to cooling
    seen in SSTs in response to the El Chichn and Mt Pinatubo
    eruptions, and the radiative imbalance associated with the
    latter [Trenberth and Dai, 2007] is consistent with the
    cooling found here. More surprising is the extra cooling
    following 1998, a likely consequence of the ocean heat
    discharge associated with the massive 19971998 El Nio
    event [Trenberth et al., 2002]. Meehl et al. [2011] have
    demonstrated in a model study how La Nia events and
    negative PDO events could cause a hiatus in warming of
    the top 300 m while sequestering heat at deeper layers. This
    mechanism can also explain the increasing role of the depths
    below 700 m after 1999 in the ORAS4 OHC, consistent with
    La Nia-like conditions and a negative phase of the PDO
    which has dominated the last decade. The deep ocean warming,
    which mostly involves the depth range 7002000 m, may also
    be related to the weakening of the MOC after 1995, which is
    present in ORAS4 [BMW13]. Possibly changes in MOC and
    PDO are connected through changes in the atmospheric
    circulation patterns.
    [16] The deep ocean has continued to warm, while the
    upper 300 m OHC appears to have stabilized. The differences
    in recent trends among the different ocean layers are
    profound. The small warming in the upper 300 m is belied
    by the continuing warming for the ocean as a whole, with
    considerable warming occurring below 700 m. However,
    this raises the question of whether this result is simply
    because of the new Argo observing system? The results
    shown here suggest otherwise, although Argo clearly is
    vitally important quantitatively. Instead changes in surface
    winds play a major role, and although the exact nature of
    the wind influence still needs to be understood, the changes
    are consistent with the intensification of the trades in subtropical
    gyres. Another supporting factor is the uniqueness
    of the radiative forcing associated with global warming.
    [17] The magnitude of the warming trend is consistent
    with observational estimates, being equivalent to an average
    0.47 0.03 W m2 for the period 19752009. There is large
    decadal variability in the heat uptake, the latest decade being
    significantly higher (1.19 0.11 W m2
    ) than the preceding
    record. Globally this corresponds to 0.84 W m2
    , consistent
    with earlier estimates [Trenberth et al., 2009]. In an observing
    system experiment where Argo is withdrawn, the ocean
    heating for the last decade is reduced (0.82 0.10 W m2
    ),
    but is still significantly higher than in previous decades. The
    estimation shows depths below 700 m becoming much more
    strongly involved in the heat uptake after 1998, and subsequently
    accounting for about 30% of the ocean warming.
    [18] The analysis of ORAS4 OHC shows some interesting
    signals. In particular, the prolonged and intense cooling
    events during the 1980s and 1990s are not as distinct in other
    observation-only analyses [BMW13], and the rapid involvement
    of the deep ocean starting around the 19981999
    La Nia needs further investigation. Sensitivity experiments
    indicate that these features are robust, and suggest that
    changes in the atmospheric circulation play an important
    role in the heat uptake. Detecting, understanding and modeling
    the processes that lead to the vertical distribution of heat
    within the ocean is a key for the correct initialization of
    decadal predictions, because the trends in forecasts of the
    SST will likely depend on whether the ocean is in a recharge
    (low stratification) or discharge (high stratification) mode.
    file:///C:/Users/irek/Downloads/Distinctive_climate_signals_in_reanalysis_of_globa.pdf

    • ren says:

      “More surprising is the extra cooling
      following 1998, a likely consequence of the ocean heat
      discharge associated with the massive 1997/1998 El Nio
      event [Trenberth et al., 2002].”

      • mpainter says:

        Ren, this quote well illustrates the “massive” confusion that predominates in the thinking of so many concerning ENSO. In fact, the La Nina phase does not represent “cooling” of the ocean, rather, it is meridional overturning circulation. And this is *warming* of the ocean even though it means *cooling* of the atmosphere.

        • AndyG55 says:

          Just as an El Nino is RELEASE of built up solar and wind energy from the ocean to the atmosphere.. ie an ocean cooling event

          La Nina, slow build up — El Nino, fast release

          Question is, with the Sun being rather sleepy at the moment, how long will the next build up take. The longer it takes the more that atmospheric cooling.

      • Gordon Robertson says:

        ren…”More surprising is the extra cooling
        following 1998, a likely consequence of the ocean heat
        discharge associated with the massive 1997/1998 El Nio
        event [Trenberth et al., 2002],,”

        That was Trenberth’s cop out theory following his revelation in the 2009 Climategate email scandal that the warming has stopped and it’s a travesty that no one knows why. He went on to blame it on the lack of sensitivity of instrumentation before arriving at this cockamamey theory.

        • David Appell says:

          Gordon Robertson says:
          “That was Trenberths cop out theory following his revelation in the 2009 Climategate email scandal that the warming has stopped and its a travesty that no one knows why.”

          That wasn’t at all what Trenberth said.

          • Gordon Robertson says:

            David Appell…”That wasnt at all what Trenberth said”.

            What? That the warming has stopped and that it’s a travesty no one know why. That statement is documented in the Climategate portfolio for posterity.

            Or the one about the missing heat being hidden in the oceans? That was definitely Trenberth as well. He tried to cover his travesty gaffe by claiming there was still warming but that it was being drowned out by some kind of noise. He claimed they lacked instrumentation to retrieve the warming from the noise.

            Then he moved onto the ocean theory.

            I call it abject denial. He should have stopped at ‘the warming has stopped’. Anyone with any sense knows it has and he would have looked better as a seer rather than someone trying frantically to get egg off his face.

          • barry says:

            That statement is documented in the Climategate portfolio for posterity

            Indeed. So why not quote it, Gordon? And check the bolded bits.

            Hi all

            Well I have my own article on where the heck is global warming? We are asking that here in Boulder where we have broken records the past two days for the coldest days on record. We had 4 inches of snow. The high the last 2 days was below 30F and the normal is 69F, and it smashed the previous records for these days by 10F. The low was about 18F and also a record low, well below the previous record low. This is January weather (see the Rockies baseball playoff game was canceled on saturday and then played last night in below freezing weather).

            Trenberth, K. E., 2009: An imperative for climate change planning: tracking Earths global energy. Current Opinion in Environmental Sustainability, 1, 19-27, doi:10.1016/j.cosust.2009.06.001. [1][PDF] (A PDF of the published version can be obtained from the author.)

            The fact is that we cant account for the lack of warming at the moment and it is a travesty that we cant. The CERES data published in the August BAMS 09 supplement on 2008 shows there should be even more warming: but the data are surely wrong. Our observing system is inadequate.

            For some reason that last bit is almost always left out of the quote. Trenberth is lamenting the inadequate observing system, not contending that AGW has stopped.

            If there is any doubt about that, then you only need to read the reference he cites before making his point in the email – his own study:

            Given that there is continual heating of the planet, referred to as radiative forcing, by accelerating increases of carbon dioxide (Fig. 1) and other greenhouses due to human activities, why isnt the temperature continuing to go up? The stock answer is that natural variability plays a key role and there was a major La Nina event early in 2008 that led to the month of January having the lowest anomaly in global temperature since 2000. While this is true, it is an incomplete explanation. In particular, what are the physical processes? From an energy standpoint, there should be an explanation that accounts for where the radiative forcing has gone. Was it compensated for temporarily by changes in clouds or aerosols, or other changes in atmospheric circulation that allowed more radiation to escape to space? Was it because a lot of heat went into melting Arctic sea ice or parts of Greenland and Antarctica, and other glaciers? Was it because the heat was buried in the ocean and sequestered, perhaps well below the surface? Was it because the La Nina led to a change in tropical ocean currents and rearranged the configuration of ocean heat? Perhaps all of these things are going on? But surely we have an adequate system to track whether this is the case or not, dont we? Well, it seems that the answer is no, we do not. But we should! Given that global warming is unequivocally happening…

            A little context goes a long way.

  82. ren says:

    Abstract
    Changes in activity of deep convective clouds, developing over warm waters of tropical
    oceans, are dominant mode of diurnal to intraseasonal variability of the atmospheric
    circulation in the tropics. One the major factors determining the development and evolution
    of atmospheric convection are the sea surface temperature. Thus, the variability of the
    upper ocean stratification, which impacts the sea surface temperature, is an important
    factor in the variability of the atmospheric convection in the tropics. In this thesis, the two
    way interactions between atmospheric convection and upper ocean are investigated on the
    basis of the in-situ measurements, satellite data and numerical simulations.
    The results show that state of atmospheric convection impacts the diurnal distribution of
    thermal energy in the upper ocean. Under calm and clear sky conditions, with daily mean
    wind speed below 6 ms-1
    and daily mean solar radiation flux above 80 Wm2
    , a shallow warm
    layer of several meters depth develops on the surface of the ocean. This warm layer may be
    interpreted as a diurnal sea surface temperature anomaly which often reaches amplitude of
    0.8 ⁰C and drives an anomalous flux of 4 Wm2
    from the ocean to the atmosphere. Based on
    these results a predictive model of sea surface temperature anomaly, as a function of
    surface insolation and wind speed, is developed. The derived sea surface temperature
    anomaly and surface fluxes are used in analysis of the development and evolution of
    atmospheric convection organized in equatorial convectively coupled Kelvin waves.
    A novel Kelvin wave trajectory database based on satellite data is introduced in this study.
    The investigation of surface fluxes and remote sensing data, augmented by the numerical
    modeling, shows that substantial fraction of Kelvin waves is initiated as a result of
    interaction with another Kelvin wave. Two distinct categories are defined and analyzed
    independently. The first one accounts for two- and multiple Kelvin wave initiations which
    occur when diurnal sea surface anomaly is high. The second category is a spin off initiation
    which occurs when a Kelvin wave initiates over the area through which another Kelvin wave
    passed within a few days. Results show that primary forcing of such waves are increased
    wind speed and latent heat flux at the ocean surface.
    In the following Chapter investigation of interactions between Kelvin wave and upper
    ocean is presented. Variability of the ocean surface and subsurface along Kelvin wave
    trajectories over Indian Ocean is investigated. It is shown that fast propagating Kelvin waves
    8
    impact diurnal variability of the sea surface temperature, surface wind speed and latent
    heat flux. Composites of all the Kelvin waves show that changes in wind speed, latent heat,
    and sea surface temperature anomaly have similar signature. Wind speed and latent heat
    flux increase and a sea surface temperature anomaly decreases during Kelvin wave passage.
    Such changes depend on the phase of the Madden-Julian Oscillation in which Kelvin wave
    propagates.
    In the next Chapter the properties of convectively coupled Kelvin waves in the Indian
    Ocean and their propagation over the Maritime Continent are studied. It is shown that
    Kelvin waves are longitude-diurnal cycle phase locked over the Africa, Indian Ocean and
    Maritime Continent. This means that they tend to propagate over definite areas during
    specific times of the day. Over the Maritime Continent, longitude-diurnal cycle phase locking
    is such that it agrees with mean, local diurnal cycle of convection in the atmosphere. The
    strength of the longitude-diurnal cycle phase locking differs between non-blocked Kelvin
    waves, which make successful transition over the Maritime Continent, and blocked waves
    that terminate within it. It is shown that a specific combination of Kelvin wave phase speeds
    and time of the day at which a wave approaches the Maritime Continent influences the
    chance of a successful transition into the Western Pacific. Kelvin wave that maintains phase
    speed of 10 to 11 degrees per day over the central-eastern Indian Ocean and arrive at 90E
    between 9UTC and 18UTC has the highest chance of being non-blocked by the Maritime
    Continent. The distance between the islands of Sumatra and Borneo agrees with the
    distance travelled by an average convectively coupled Kelvin wave in one day. This suggests
    that the Maritime Continent may act as a filter for Kelvin waves, favoring successful
    propagation of those waves which are in phase with the local diurnal cycle of convection.
    The AmPm index, a simple measure of local diurnal cycle for propagating systems, is
    introduced and shown to be a useful metric depicting key characteristics of the convection
    associated with propagating Kelvin waves.
    Thus, the main message of this thesis is that interaction between atmospheric convection
    and upper ocean are characterized by two-way feedbacks. Mature atmospheric convection
    influences the distribution of the energy in the upper ocean affecting the sea surface
    temperature. On the other hand, changes in the sea surface temperature impact the
    organization of the atmospheric convection in equatorial convectively coupled Kelvin waves.
    https://arxiv.org/ftp/arxiv/papers/1603/1603.00902.pdf

  83. Bob says:

    Roy,

    Regarding your comment “these are anomalies. They have no seasonal cycleits been removed” ….

    This is true only if the individual months have similar distributions. I found the standard deviations for each of the twelve months in your data (I did this for the previous version – I haven’t got around to putting the latest version in a spreadsheet).

    November has the smallest SD at 0.170, January has the highest at 0.246. That is a non-trivial difference, and will certainly add a small seasonal component to a 13-month running mean.

  84. barry says:

    Gordon,

    To put it simply, I think the warming from increased CO2 could be anywhere from very little/benign to a lot/malign. I don’t side with the ‘skeptics’ or the ‘alarmists’ on what the future will look like.

    This confuses many of them. Most need to categorize in binary terms, the dimwits.

    • Bob says:

      Do you agree with the 1.5 to 4.5 climate sensitivity range?

      • barry says:

        Sure. I can’t see any reasonable way to ignore the full range except by personal preference. Skeptics point to low sensitivity papers and declare that these are oracular. Alarmists point to high sensitivity papers and say similar. To my mind both camps are barracking. The range is as wide as it was 30 years ago. Lower and higher values are possible. This is one of the components of the debate that is not settled.

        But any minute now someone will come along and declare the truth of one extreme or the other, if they already haven’t below.

        • Bob says:

          Even though that full range is possible, it is difficult to accept the 1.5 given the amount of warming we have already had, and given that current global temperatures are the result of CO2 levels between 20 and 60 years ago.

        • barry says:

          I’m not remotely qualified enough to gainsay this range. Studies to date have produced higher and lower ranges. Lower sensitivities recently have come from assessment of recent climate change. But there are also papers with higher sensitivity or similar to the canonical range we’ve had for 30 years. I can’t see that we’ve locked it down any tighter looking at the breadth of results still emerging.

    • David Appell says:

      barry, what’s your justification for ignoring the high side of CO2’s climate sensitivity?

    • Gordon Robertson says:

      barry…”I think the warming from increased CO2 could be anywhere from very little/benign to a lot/malign…”

      I go on the concentration. The IPCC admit all CO2 (natural + anthropogenic) is only 0.04% of the atmosphere. Prior to serious man made CO2 emissions, all CO2 must have been in that range yet did nothing of notice.

      Some alarmists are claiming ACO2 comprises 30% of all CO2 in the atmosphere but that’s a guesstimate at best. The IPCC, in TAR, claimed ACO2 was a small fraction of all CO2 based on a concentration of 390 ppmv. That was allegedly the contribution of humans to all CO2 in the 1990s and the ‘small fraction’ worked out to under 4% of all CO2 in the atmosphere.

      If all ACO2 is 0.04%, and ACO2 is 0.04% of that, in the 1990s decade ACO2 emissions comprised about 0.0016% of the atmosphere. I acknowledge an argument could be made as to the percentage since the pre Industrial Era but that ACO2 has become mixed with natural CO2 and is recycled as such. The 0.0016% figure is the ACO2 added to the natural base in the 1990s decade.

      I think neither the 0.04% of all CO2 nor the 0.0016% of added ACO2 can amount to a hill of beans with regard to warming. One meteorologist claimed we should not be fooled by percentages since a tiny percentage of arsenic in a cup of coffee will off you. I think that’s a seriously bad argument since the effect of arsenic in the human body has absolutely nothing to do with the effect of ACO2 in the atmosphere.

      As I indicated before, I think the greenhouse effect theory is faulty. Those who have calculated the temperature of the Earth without an atmosphere then calculated one, both highly theoretically, with an atmosphere, made one major oversight. They forgot to include the oceans, which comprise 70% of the planet’s surface area.

      • Bob says:

        What do you mean by “ONLY” 0.04% ?

        • Gordon Robertson says:

          Bob…”What do you mean by ONLY 0.04% ?”

          I was hoping you or someone else would explain its significance to me.

          The atmosphere in 99% nitrogen and oxygen. Since the temperature of the atmosphere is 99% dependent on the motion of those two gases, and since heat in the atmosphere depends on the kinetic energy contributed by those molecules, one might reasonably conclude that the contribution to atmospheric warming by a gas that comprises 0.04% of the atmosphere is negligible.

          Mathematicians and theoreticians who work with climate models seem to work in a world outside that real world. They have arbitrarily assigned a warming effectiveness to ACO2 of 8% to 25%, completely disregarding the fact that it comprises about 0.0016% of the all CO2 at roughly 400 ppmv.

          • barry says:

            Nitrogen is largely transparent to visible and infrared radiation, absorbing mainly in the extreme ultraviolet range. It has a small impact on total atmospheric temperature compared to GHGs, which covers a broader, more intense part/s of the EM spectrum. Oxygen also absorbs minute parts of the spectrum, and generally not in the parts GHGs do.

            IOW, GHG molecules are far more powerful absorbers of EMR than O2 and N.

            Here is a brief study on the various spectra:

            http://irina.eas.gatech.edu/EAS8803_Fall2009/Lec6.pdf

            And this is a detailed study on relative contribution of various atmospheric gases to atmospheric and surface temperature:

            www-ramanathan.ucsd.edu/files/pr15.pdf

          • barry says:

            They have arbitrarily assigned a warming effectiveness to ACO2 of 8% to 25%, completely disregarding the fact that it comprises about 0.0016% of the all CO2 at roughly 400 ppmv.

            ACO2 accounts for 30% of the 400ppm in the atmosphere.

            IOW, anthropogenic emissions have increased the pre-industrial concentration of atmos CO2 (~280ppm) by 120ppm. That is an increase of 43% over pre-industrial concentration.

      • barry says:

        I found it hard to make sense of that post.

        CO2 is 0.04% of the atmosphere. But only 2% of the atmsphere is greenhouse gases, so CO2 has a significantly larger share in the greenhouse effect looked at that way. And then there are other factors you’re not considering, like how efficacious is CO2 as a greenhouse gas etc.

        Human activity has increased the concentration of atmospheric CO2 by more than 40%.

        That is a significant amount in any language. The “0.04%” meme is pretty shallow to my mind. and a very old, well-worn meme at that.

        CO2 has fluctuated between 0.019% and 0.028% of the atmosphere for the last couple million years prior to the industrial revolution. These concentration changes have tracked the large swings in global surface temperature, sea level and ice sheet growth and recession – ice age/interglacial phases.

        CO2 has lagged glacial phase temperature changes – everyone knows that. But theory goes that increased CO2 amplified the warming already underway, along with other feedbacks like albedo (ice sheet) and vegetation changes.

        I’m the kind of mind that can hold this idea as a possibility – a piece of ‘evidence’ if you like without having to ram the idea down anyone’s throat, least of all mine. ‘Skeptics’ here may argue that absolutely for sure definitely CO2 has NO impact on glacial transitions. Because ‘skeptics’ are so good at questioning things, having doubts and comfortable with uncertainty…. Yes, I’m kidding. Most of the skeptics here are biblically attached to their rejection of CO2 having an impact on climate.

        But I reckon CO2 does have an impact, and the real argument is about how much.

        Anyway, ice age transitions of the Quaternary period – a period of consistent tectonic arrangement (continents have been in much the same position) – are accompanied by these swings of about 100ppm atmos CO2. Human activity is responsible for now adding a further 120ppm to the higher bound of natural CO2 swings over the Quaternary period when we had no other major changes (like continents being in different places, a dimmer sun etc).

        You comment on global climate models not including oceans is drastically wrong. I get the feeling you haven’t done much reading up outside ‘skeptical’ articles. Fact is there are atmospheric models, oceanic models, and AOGCMs – combined atmosphere and ocean climate models.

        http://ukclimateprojections.metoffice.gov.uk/23213

        • mpainter says:

          Here Barry tries some slick by coining a new term for the miserably failed global climate models: AOGCMs, haha. Thus he imagines to present these as valid science. Let’s see who gets fooled.

        • barry says:

          barry tries some slick by coining a new term for the miserably failed global climate models: AOGCMs

          If anyone was in doubt as to your frothing rubbish they only need click on the link I provided.

          If only you’d done the same.

          Atmosphere-Ocean Global Circulation Models (AOGCM), also known as ‘coupled atmosphere-ocean models’, are global climate models that model both atmospheric and ocean processes and interactions between them.

          Or you could have spent 10 seconds googling the acronym.

          Barry did not coin a new term, but mpainter made up a story about him doing that.

          Hard to pick which is worse in you – the ignorance or the casual lies.

          • mpainter says:

            Won’t work, barry, slick, but not slick enough. All the GCM’s incorporate circulation models, ocean/atmosphere coupled as a main component, so you have nothing new. Only the same, failed global climate models that Monckton has just exposed in a way that kills AGW dead- the feedback mathematics is erroneous. His new paper is being published. This is the final proof of the false AGW meme. Henceforth, those who push cAGW incur liabilities.

          • barry says:

            Hang on. You said I coined the term AOGCM.

            You sticking with that announcement, or should I read your diverting from that point as an apology for saying I fabricated?

          • mpainter says:

            You presented them as _climate_ models. They are circulation models. The C in AOGCM stands for circulation, not climate. And they are old hat, not something new.
            Are you pleading your usual confused state that when you passed these off as GCMs? Well, well we can believe that.

          • barry says:

            Here is the UK Met Office definition again.

            Atmosphere-Ocean Global Circulation Models (AOGCM), also known as coupled atmosphere-ocean models, are global climate models that model both atmospheric and ocean processes and interactions between them.

            Yes, the C in the acronym stands for ‘circulation’. And yes, AOGCMs (as well as GCMs) are also referred to as climate models.

            You really should know when to quit, but you need so badly to win you’ll pick a nit while the truth flies over your head.

            The point was, Gordon didn’t think climate models include oceans. I pointed out AOGCMs because of the acronym. If you believe that AOGCMs are not used for climate modeling, then you may be the most ignorant person on this blog.

        • David Appell says:

          mpainter says:
          “Here Barry tries some slick by coining a new term for the miserably failed global climate models”

          Show that GCMs have “miserably failed.”

      • Nate says:

        Gordon,

        If the small percentage of Co2 means to you that it is negligible-you could also consider that over each square meter of the surface there is about 13 pounds of CO2.

        Now imagine a 1 sq meter baby pool full of water with Lil Mermaids on the bottom. Dump 13 pounds of dirt in there and mix. You will no longer be able to see the Lil Mermaids on the bottom.

        Now no matter how deep the pool is, it makes no difference in the ability of that 13 ponds of dirt to absorb the light and block the bottom.

        Same goes with the 10 km column of air over our head- that 13 pounds of CO2 is certainly enough to absorb lots of IR light.

        And 200 y ago it was less, 8-9 pounds

        • mpainter says:

          Dirty lil’ mermaids, eh? Hmmmm, sounds interesting…but, wait a sec, mermaids are basically fish, right? And fish, well, you know, fish aren’t built like people. Hmmm..
          Not interested.

          • Nate says:

            Yeah they are a trash fish, but really? You gotta go there..

          • mpainter says:

            The baby pool is full of your dirt, tsk, tsk. Poor baby pool, poor baby.
            The earth’s atmosphere is opaque at 70 ppm CO2. Double and redouble and it’s still opaque. Double again, and….still opaque. Soooo, nate throws thirteen pounds of dirt in his baby’s pool when he only needs one pound to mess it up.

          • Nate says:

            ‘The earths atmosphere is opaque at 70 ppm CO2. Double and redouble and its still opaque. Double again, and.still opaque.’

            Good that you realize 400 ppm is significant.

            But you’re being opaque to learning from Roy and others. He has been over this many times. Radiative heat transfer doesn’t work that way.

          • Nate says:

            Point is first IR opaque layer of atmosphere is not opaque to heat transfer. It can re-radiate and heat the next IR opaque layer above it, and so on. The successive layers each are warmed a bit less. It is just like layering for skiing.

          • mpainter says:

            What, exactly, did Roy say, nate?

          • Nate says:

            “What, exactly, did Roy say, nate?”

            He has devoted several lengthy posts/discussions to radiative heat transfer and GHE in the last month or so. You were there. Go back and look.

          • mpainter says:

            Yes, but what did Roy say?
            Or do you forget?

          • Nate says:

            Not sure what you are looking for? He said GHE due to CO2 is real and explained it, and demonstrated it. What specifically do you want?

          • mpainter says:

            I am probing you to see if you have any understanding of the science. So far, you show none.

          • Nate says:

            Painter,

            “I am probing you to see if you have any understanding of the science. So far, you show none.”

            Wow. Ok. There we have it. Your classic go-to response when you don’t have anything intelligent to add, and have no answer when your science is legitimately challenged.

            Just insult.

            Classy.

          • mpainter says:

            Still nothing.

          • Nate says:

            mp,

            Dont understand why you are so fond of nonsensical all or nothing statements:

            “see if you have any understanding of the science. So far, you show none”

            ‘Hansen was completely wrong’

            ‘SST determined by insolation alone’

            ‘LWIR is not an input to SST’

            ‘atmospheric CO2 is entirely beneficial’

            Scientists know you cannot continually make black or white statements about facts that are gray —after a while you lose ALL credibility.

          • mpainter says:

            Those claims presently stand unrefuted.

        • ren says:

          Carbon Dioxide Surface Concentration
          the fraction of carbon dioxide present in air at the earth’s surface.
          https://earth.nullschool.net/#current/chem/surface/level/overlay=co2sc/equirectangular
          It is interesting that a lot is over Antarctica (click). But there was not warmer.
          There must be a very “dirty”.

          • ren says:

            You can see that the CO2 is used by land plants and algae.
            Especially in the summer you can see it in the oceans.

          • David Appell says:

            Gordon wrote:
            “It makes eminently more sense that the 99% of the atmosphere that is N2 and O2 would be doing 99% of the warming while ACO2 at 0.0016% would be doing barely any.”

            This is just dumb.

            N2 and O2 aren’t greenhouses. (See though “collisional broadening,” a small effect.)

            In fact, no molecules with less than two molecules are GHGs.

          • David Appell says:

            * Meant to say that no molecules with less than 3 atoms are GHGs.

        • Gordon Robertson says:

          Nate…”over each square meter of the surface there is about 13 pounds of CO2″.

          If that is true then it applies to all CO2, not to ACO2 per se. How many miles into the atmosphere does that square meter extend? And since that 13 pounds represents 0.04% of atmospheric gases, it means that oxygen and nitrogen combined should provide around 320 pounds per square meter.

          The warming supplied by the 0.04% that is all CO2 has been established over the centuries to be creating no destabilizing effect in global warming. Why should the addition of less than 0.01% have an effect?

          Give me some numbers from actual atmospheric research. How much can CO2 radiate? Remember it is supplied IR by the surface, which is warmer. That surface radiation is subject to the inverse square law and Woods (1909) explained that as such, radiation more than a few feet above the surface would be ineffective as a warming agent.

          Since CO2 above the surface would be cooler, in general, than the surface that is warming it, the 2nd law states clearly that it cannot transfer heat back to the surface. How exactly does the 15 pounds in your theoretical miles high vertical column cause warming?

          It makes eminently more sense that the 99% of the atmosphere that is N2 and O2 would be doing 99% of the warming while ACO2 at 0.0016% would be doing barely any.

          • Nate says:

            Gordon,

            ‘It makes eminently more sense that the 99% of the atmosphere that is N2 and O2 would be doing 99% of the warming while ACO2 at 0.0016% would be doing barely any.’

            99.999% of a silicon wafer may be silicon, but its the 1 part per million of added Boron that clearly makes it behaves very differently than pure Si.

            So I dont no why it would be sensible at all to believe that all molecules in the atmosphere behave the same, when they clearly have very different properties. Specifically the IR bands in which they absorb are very different. CO2 absorbs in an IR band that would otherwise be open to the cold of space.

            My argument about the 13 lbs/m2 etc was simply to say that it is a significant amount of material, certainly significant in its ability to absorb and re-radiate IR. In terms of absorbing photons, does not matter how tall the column is. It does matter in the detailed quantitative model, which I believe Roy has discussed in previous posts.

          • mpainter says:

            What, exactly, did Roy say?
            Mate?

      • MikeR says:

        Gordon,

        I agree with your principled stance.

        Because of their minority status, gases that are only tiny amount of the earths atmosphere should be dispensed with. There would be no endless disputes on sites such as this, if both CO2 (0.04%) s and ozone (0.00006%). were removed.

        Ozone was tried but those bleeding heart liberals got their way and that effort cost industries enormous amounts of money.

        In fact , think we should remove all minority gases, even O2, and go back to the good old days.

        The anaerobic organisms such as cyanobacteria and other nitrogen fixing organisms never got the chance to evolve. It was never a level playing field.

        p.s. Maybe the conservatives have changed their views on affirmative action and want to boost the concentration of CO2 to more reasonable levels. It was tried on Venus and if you like warm weather, its the place to be.

        • Gordon Robertson says:

          Mike R…”Because of their minority status, gases that are only tiny amount of the earths atmosphere should be dispensed with”.

          I would not want to interfere with Mother Nature, or her non-metaphorical counterpart. That was not my point. N2 and O2 make up 99% of the gases in the atmosphere yet they are completely ignored by alarmists for their part in atmospheric temperature.

          On the other hand, alarmists focus on a gas the comprises roughly 1/1000nds of 1% of the present atmosphere and give it a 30+ percent effectiveness in warming without offering the slightest of proof.

          Before banning so-called ozone-depleting gases, we had one hole in the ozone layer at one pole. Years after banning the CFCs, we now have two, one over each pole.

          Back in the 1960s, Rachel Carson wrote a book on the environment in which she focused on DDT. She had no expertise in science yet the emotional impact of her book, Silent Spring, lead to DDT being banned nearly world-wide.

          There are millions of children each year affected by malaria and DDT is very effective against it. No other drug is that effective yet alarmists and their propaganda have interfered in the well-being of those children.

          The focus on DDT she revealed were the eggs of wild birds like eagles. She rationalized that DDT was interfering with the shells of the eggs. Years after banning DDT, the eggs are still suffering the same problems and it has now been revealed the same issue was there long before DDT came into use.

          I have no interest in listening to a load of fanatics while they try to interfere with our atmosphere based on nothing more than hearsay.

        • David Appell says:

          Gordon wrote:
          “N2 and O2 make up 99% of the gases in the atmosphere yet they are completely ignored by alarmists for their part in atmospheric temperature.”

          Gordon, N2 and O2 aren’t greenhouse gases.

          Except in the tiny moments they collide, a phenomenon called “collisional broadening.”

        • David Appell says:

          Gordon wrote:
          “The focus on DDT she revealed were the eggs of wild birds like eagles. She rationalized that DDT was interfering with the shells of the eggs. Years after banning DDT, the eggs are still suffering the same problems”

          The data and evidence for this claim?

          (I’m genuinely interested.)

  85. ren says:

    I want to clearly say that such anomalies in the stratosphere threatened by sudden attacks of arctic air.
    http://www.cpc.ncep.noaa.gov/products/stratosphe