Short Answer: It all depends upon how you interpret the data.
It has been quite a while since I have addressed feedback in the climate system, which is what determines climate sensitivity and thus how strong human-caused global warming will be. My book The Great Global Warming Blunder addressed how climate researchers have been misinterpreting satellite measurements of variations the Earth’s radiative energy balance when trying to estimate climate sensitivity.
The bottom line is that misinterpretation of the data has led to researchers thinking they see positive feedback, and thus high climate sensitivity, when in fact the data are more consistent with negative feedback and low climate sensitivity. There have been a couple papers — an many blog posts — disputing our work in this area, and without going into details, I will just say that I am as certain of the seriousness of the issue as I have ever been. The vast majority of our critics just repeat talking points based upn red herrings or strawmen, and really haven’t taken the time to understand what we are saying.
What is somewhat dismaying is that, even though our arguments are a natural outgrowth of, and consistent with, previous researchers’ published work on feedback analysis, most of those experts still don’t understand the issue I have raised. I suspect they just don’t want to take the time to understand it. Fortunately, Dick Lindzen took the time, and has also published work on diagnosing feedbacks in a manner that differs from tradition.
Since we now have over 16 years of satellite radiative budget data from the CERES instruments, I thought it would be good to revisit the issue, which I lived and breathed for about four years. The following in no way exhausts the possibilities for how to analyze satellite data to diagnose feedbacks; Danny Braswell and I have tried many things over the years. I am simply trying to demonstrate the basic issue and how the method of analysis can yield very different results. The following just gives a taste of the problems with analyzing satellite radiative budget data to diagnose climate feedbacks. If you want further reading on the subject, I would say our best single paper on the issue is this one.
The CERES Dataset
There are now over 16 years of CERES global radiative budget data: thermally emitted longwave radiation “LW”, reflected shortwave sunlight “SW”, and a “Net” flux which is meant to represent the total net rate of radiative energy gain or loss by the system. All of the results I present here are from monthly average gridpoint data, area-averaged to global values, with the average annual cycle removed.
The NASA CERES dataset from the Terra satellite started in March of 2000. It was followed by the Aqua satellite with the same CERES instrumentation in 2002. These datasets are combined into the EBAF dataset I will analyze here, which now covers the period March 2000 through May 2016.
Radiative Forcing vs. Radiative Feedback
Conceptually, it is useful to view all variations in Earth’s radiative energy balance as some combination of (1) radiative forcing and (2) radiative feedback. Importantly, there is no known way separate the two… they are intermingled together.
But they should have very different signatures in the data when compared to temperature variations. Radiative feedback should be highly correlated with temperature, because the atmosphere (where most feedback responses occur) responds relatively rapidly to a surface temperature change. Time varying radiative forcing, however, is poorly correlated with temperature because it takes a long time — months if not years — for surface temperature to fully respond to a change in the Earths radiative balance, owing to the heat capacity of the land or ocean.
In other words, the different directions of causation between temperature and radiative flux involve very different time scales, and that will impact our interpretation of feedback.
Radiative Feedback
Radiative feedback is the radiative response to a temperature change which then feeds back upon that temperature change.
Imagine if the climate system instantaneously warmed by 1 deg. C everywhere, without any other changes. Radiative transfer calculations indicate that the Earth would then give off an average of about 3.2 Watts per sq. meter more LW radiation to outer space (3.2 is a global area average… due to the nonlinearity of the Stefan-Boltzmann equation, its value is larger in the tropics, smaller at the poles). That Planck effect of 3.2 W m-2 K-1 is what stabilizes the climate system, and it is one of the components of the total feedback parameter.
But not everything would stay the same. For example, clouds and water vapor distributions might change. The radiative effect of any of those changes is called feedback, and it adds or subtracts from the 3.2 number. If it makes the number bigger, that is negative feedback and it reduces global warming; if it makes the number smaller, that is positive feedback which increases global warming.
But at no time (and in no climate model) would the global average number go below zero, because that would be an unstable climate system. If it went below zero, that would mean that our imagined 1 deg. C increase would cause a radiative change that causes even more radiative energy to be gained by the system, which would lead to still more warming, then even more radiative energy accumulation, in an endless positive feedback loop. This is why, in a traditional engineering sense, the total climate feedback is always negative. But for some reason climate researchers do not consider the 3.2 component a feedback, which is why they can say they believe most climate feedbacks are positive. It’s just semantics and does not change how climate models operate… but leads to much confusion when trying to discuss climate feedback with engineers.
Radiative Forcing
Radiative forcing is a radiative imbalance between absorbed sunlight and emitted infrared energy which is not the result of a temperature change, but which can then cause a temperature change (and, in turn, radiative feedback).
For example, our addition of carbon dioxide to the atmosphere through fossil fuel burning is believed to have reduced the LW cooling of the climate system by almost 3 Watts per sq. meter, compared to global average energy flows in and out of the climate system of around 240 W m-2. This is assumed to be causing warming, which will then cause feedbacks to kick in and either amplify or reduce the resulting warming. Eventually, the radiative imbalance cause by the forcing causes a temperature change that restores the system to radiative balance. The radiative forcing still exists in the system, but radiative feedback exactly cancels it out at a new equilibrium average temperature.
CERES Radiative Flux Data versus Temperature
By convention, radiative feedbacks are related to a surface temperature change. This makes some sense, since the surface is where most sunlight is absorbed.
If we plot anomalies in global average CERES Net radiative fluxes (the sum of absorbed solar, emitted infrared, accounting for the +/-0.1% variations in solar flux during the solar cycle), we get the following relationship:
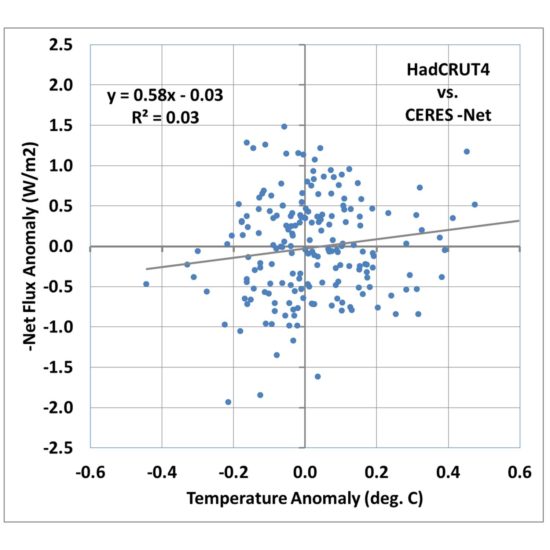
Fig. 1. Monthly global average HadCRUT4 surface temperature versus CERES -Net radiative flux, March 2000 through May 2016.
I’m going to call this the Dessler-style plot, which is the traditional way that people have tried to diagnose feedbacks, including Andrew Dessler. A linear regression line is typically added, and in this case its slope is quite low, about 0.58 W m-2 K-1. If that value is then interpreted as the total feedback parameter, it means that strong positive feedbacks in the climate system are pushing the 3.2 W m-2 K-1 Planck response to 0.58, which when divided into the estimated 3.8 W m-2 radiative forcing from a doubling of atmospheric CO2, results in a whopping 6.5 deg. C of eventual warming from 2XCO2!
Now thats the kind of result that you could probably get published these days in a peer-reviewed journal!
What about All That Noise?
If the data in Fig. 1 all fell quite close to the regression line, I would be forced to agree that it does appear that the data support high climate sensitivity. But with an explained variance of 3%, clearly there is a lot of uncertainty in the slope of the regression line. Dessler appears to just consider it noise and puts error bars on the regression slope.
But what we discovered (e.g. here) is that the huge amount of scatter in Fig. 1 isn’t just noise. It is evidence of radiative forcing contaminating the radiative feedback signal we are looking for. We demonstrated with a simple forcing-feedback model that in the presence of time-varying radiative forcing, most likely caused by natural cloud variations in the climate system, a regression line like that in Fig. 1 can be obtained even when feedback is strongly negative!
In other words, the time-varying radiative forcing de-correlates the data and pushes the slope of the regression line toward zero, which would be a borderline unstable climate system.
This raises a fundamental problem with standard least-squares regression analysis in the presence of a lot of noise. The noise is usually assumed to be in only one of the variables, that is, one variable is assumed to be a noisy version of the other.
In fact, what we are really dealing with is two variables that are very different, and the disagreement between them cant just be blamed on one or the other variable. But, rather than go down that statistical rabbit hole (there are regression methods assuming errors in both variables), I believe it is better to examine the physical reasons why the noise exists, in this case the time-varying internal radiative forcing.
So, how can we reduce the influence of this internal radiative forcing, to better get at the radiative feedback signal? After years of working on the problem, we finally decided there is no magic solution to the problem. If you knew what the radiative forcing component was, you could simply subtract it from the CERES radiances before doing the statistical regression. But you don’t know what it is, so you cannot do this.
Nevertheless, there are things we can do that, I believe, give us a more realistic indication of what is going on with feedbacks.
Switching from Surface Temperature to Tropospheric Temperature
During the CERES period of record there is an approximate 1:1 relationship between surface temperature anomalies and our UAH lower troposphere LT anomalies, with some scatter. So, one natural question is, what does the relationship in Fig. 1 look like if we substitute LT for surface temperature?
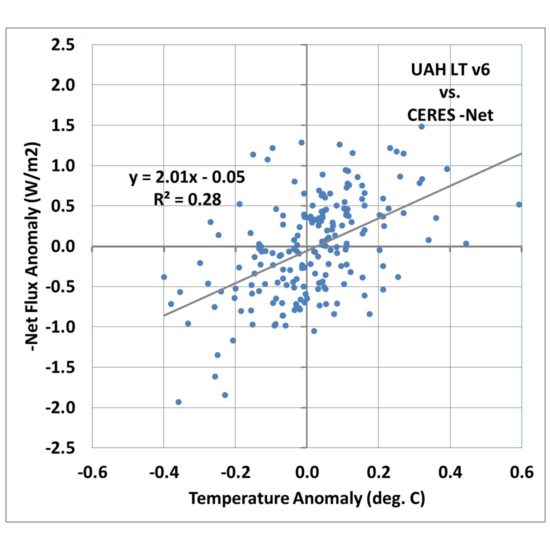
Fig. 2. As in Fig. 1, but surface temperature has been replaced by satellite lower tropospheric temperature (LT).
Fig. 2 shows that the correlation goes up markedly, with 28% explained variance versus 3% for the surface temperature comparison in Fig. 1.
The regression slope is now 2.01 W m-2 K-1, which when divided into the 2XCO2 radiative forcing value of 3.8 gives only 1.9 deg. C warming.
So, we already see that just by changing from surface temperature to lower tropospheric temperature, we achieve a much better correlation (indicating a clearer feedback signal), and a greatly reduced climate sensitivity.
I am not necessarily advocating this is what should be done to diagnose feedbacks; I am merely pointing out how different a result you can obtain when you use a temperature variable that is better correlated with radiative flux, as feedback should be.
Looking at only Short Term Variability
So far our analysis has not considered the time scales of the temperature and radiative flux variations. Everything from the monthly variations to the 16-year trends are contained in the data.
But there’s a problem with trying to diagnose feedbacks from long-term variations: the radiative response to a temperature change (feedback) needs to be measured on a short time scale, before the temperature has time to respond to the new radiative imbalance. For example, you cannot relate decadal temperature trends and decadal radiative flux trends and expect to get a useful feedback estimate because the long period of time involved means the temperature has already partly adjusted to the radiative imbalance.
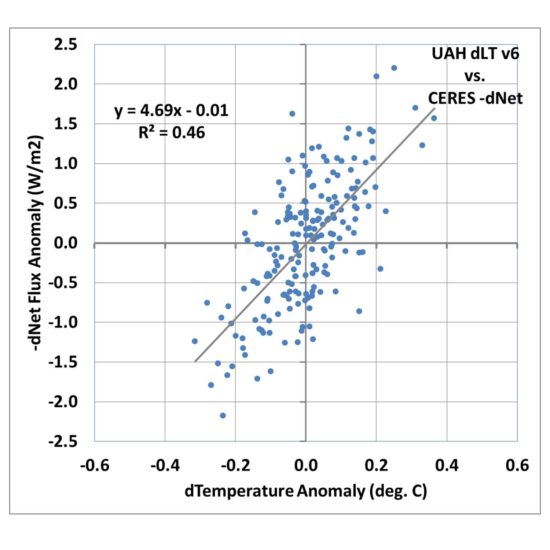
So, one of the easiest things we can do is to compute the month-to-month differences in temperature and radiative flux. If we do this for the LT data, we obtain an even better correlation, with an explained variance of 46% and a regression slope of 4.69 W m-2 K-1.
If that was the true feedback operating in the climate system it would be only (3.8/4.69=) 0.8 deg. C of climate sensitivity for doubled CO2 in the atmosphere(!)
Conclusions
I dont really know for sure which of the three plots above are more closely related to feedback. I DO know that the radiative feedback signal should involve a high correlation, whereas the radiative forcing signal will involve a low correlation (basically, the latter often involves spiral patterns in phase space plots of the data, due to time lag associated with the heat capacity of the surface).
So, what the CERES data tells us about feedbacks entirely depends upon how you interpret the data… even if the data have no measurement errors at all (which is not possible).
It has always bothered me that the net feedback parameter that is diagnosed by linear regression from very noisy data goes to zero as the noise becomes large (see Fig. 1). A truly zero value for the feedback parameter has great physical significance — a marginally unstable climate system with catastrophic global warming — yet that zero value can also occur just due to any process that de-correlates the data, even when feedback is strongly negative.
That, to me, is an unacceptable diagnostic metric for analyzing climate data. Yet, because it yields values in the direction the Climate Consensus likes (high climate sensitivity), I doubt it will be replaced anytime soon.
And even if the strongly negative feedback signal in Fig. 3 is real, there is no guarantee that its existence in monthly climate variations is related to the long-term feedbacks associated with global warming and climate change. We simply don’t know.
I believe the climate research establishment can do better. Someday, maybe after Lindzen and I are long gone, the IPCC might recognize the issue and do something about it.
Roy,
This is sooo simple. Your own gl TLT data shows an incredibly good fit both with the CERES gl ToA OLR data and with the CERES gl ToA ASR (TSI minus refl SW) data (taking ENSO conditions into consideration):
https://okulaer.files.wordpress.com/2016/01/olr-vs-tlt.png
https://okulaer.files.wordpress.com/2016/01/asr-vs-tlt.png
This easily tells you that THERE IS NO ENHANCEMENT OF ANY “GHE” GOING ON!
A “strengthening GHE” is supposed to reduce the ToA OLR relative to tropospheric temps (most of Earth’s total radiation to space originates from the troposphere) over time.
You can extend this relationship back to 1985, using ERBE data:
https://okulaer.files.wordpress.com/2016/06/uahv6-tlt-trop-x.png
https://okulaer.files.wordpress.com/2016/06/hirs-vs-uahv6-b.png
(Latest HIRS interpretation vs. UAHv6.)
https://okulaer.files.wordpress.com/2016/07/hirs-vs-erbs-1984-2000.png
OLR at the ToA is simply following tropospheric temps. Barring short-term ENSO-induced cloud/humidity anomalies.
Meanwhile, what actually caused the ToA radiative imbalance -> Earth system net accumulation of energy -> “global warming”:
https://okulaer.files.wordpress.com/2016/03/toafluxesfdvserbs_zps3489ddec.png
A substantial increase in the average level of ASR.
So the causal chain here looks like this:
Increase in heat input (ASR) -> warming -> increase in heat output (OLR)
This is what the actual DATA is telling us.
I’m come from the chemistry world. I would say that the experimental method needs to be significantly improved if I saw a plot like your figure one, and someone was attempting to correlate the data. So your point about noisy data and linear regression is well made I think. Why isn’t a multivariate approach used? Why are the units of the regression slope in W/m2K when the graph has the anomaly plotted in degrees C?
C and K are interchangeable for temperature changes.
RESPONSE TO KRISTIAN:
Yes, OLR will follow tropospheric temps for short-term fluctuations, that is very true. But what is the regression relationship? You will find it is less than 3.2 W m-2 K-1 (I get 1.8) which, at face value, suggests positive feedback in the infrared.
But this doesn’t say anything about whether CO2 is causing warming…here’s why:
Increasing CO2 effect on OLR: that process is so slow that the warming associated with it mostly results in equilibration with the forcing. In other words, even if CO2 is causing a long-term slow *decrease* in OLR, the resulting warming then *increases* the OLR, and all you are left with is the short-term variability signals that would be there anyway. You can’t see the radiative forcing signal of increasing CO2 because it is mostly cancelled out by radiative feedback.
If you would read the paper I linked to (twice) in the blog post, you would see this issue discussed.
Roy,
Why are you insisting on making this so difficult? To me it seems you do it because you’re stuck on the hypothetical notion that more CO2 in the atmosphere somehow MUST create some degree of warming, and so all you need to determine is whether the “feedbacks” to this necessary warming are positive or negative.
No. The matter is much more simple and straightforward than that.
If OLR goes up in step with tropospheric temps, then there is no “enhanced GHE”. Period. The OLR will have to go down relative to tropospheric temps over time for an “enhanced GHE” to even have the potential of explaining a rise in global temps:
http://www.climatetheory.net/wp-content/uploads/2012/05/greenhouse-effect-held-soden-2000.png
The “Planck feedback” parameter is NOT a feedback in the normal sense of the word. It is an integrated part of the hypothetical “pre-feedback” temperature rise from a doubling in atmospheric CO2. The doubling is supposed to produce a decrease in total radiative loss from Earth to space amounting to ~3.8 W/m^2, which in turn will force a rise in temperature to cause the total radiative loss to increase back to where it was: A new dynamic equilibrium at a higher temperature. But the OLR will never go up with the temperature OVER TIME in this scenario. It will remain unchanged (“flat”). THAT’S the postulated “greenhouse” warming mechanism, after all: The T_e remains constant while the Z_e rises, which will make the T_s rise also, as a result.
If we see the ASR go up and the OLR go up also, in step with tropospheric temps, then we pretty much know that the rise in ASR is the CAUSE of any observed warming, and the OLR simply a radiative RESPONSE to it.
And this is precisely what we see: The OLR went up when tropospheric temps did (1984/85 – 1998/99), and stayed flat when tropospheric temps did (2000/01 – 2015).
You say:
“(…) what is the regression relationship? You will find it is less than 3.2 W m-2 K-1 (I get 1.8) which, at face value, suggests positive feedback in the infrared.”
This doesn’t make any sense at all. Just have a look at this plot:
https://okulaer.files.wordpress.com/2015/05/tlt-vs-olr1.png
1) There is no overall TLT warming during this period.
2) The OLR tracks the TLT tightly and closely; there is no gradual “downward drift”.
“If OLR goes up in step with tropospheric temps, then there is no “enhanced GHE”. Period.”
If you don’t see the problem with this assertion, I can’t help you, Kristian.
Of course OLR goes up and down with temperature…that IS the Planck effect. It averages 3.2 W m-2 K-1. It proves nothing about feedbacks or climate sensitivity or whether increasing CO2 causes warming or not. It does not prove anything about the “enhanced greenhouse effect”. Nothing.
If we can’t agree on the basics, I have no reason to discuss the issue further.
I believe you have misinterpreted what Kristian is saying.
Over the period March 2003 to end 2014 the trend in lower troposphere temperatures was very similar to the trend in OLR from CERES. Both curves go up and down, but they do not diverge (much). If there was a significant increase in the greenhouse effect, the curves must diverge. The greenhouse effect IS the difference between near-surface temperature (Ts) and effective radiating temperature of the atmosphere (Te), the latter is calculated from the CERES OLR via Te= (OLR/sigma)^.25.
Using the average of UAH and RSS lower troposphere temperatures as the near-surface temperature, the Ts-Te = the greenhouse effect. Here is a graph of the average of UAH & RSS lower troposphere temperatures:
https://friendsofscience.org/assets/images/LT_Temperature_2000-03_2014-12.jpg
Note that the trend is -0.00028 C/decade, which is about zero. Therefore there is no trend in feedback, which can exist only if there were a temperature trend. There are monthly positive and negative feedbacks, but no overall trend in feedback over the period 2000-03 to 2014-12.
Here is the greenhouse effect, being the Ts-Te:
https://friendsofscience.org/assets/images/GHE_2000-03_2014-12_LTT.jpg
Note that the trend of 0.012 0.037 C/decade is insignificant at the 90% CI level.
You can see the radiative forcing signal of increasing CO2 as the Ts-Te trend, which is very small. The trend is caused only by increasing man-made greenhouse gas forcing, as there is no net feedback during the period.
During the period the CO forcing from a 30.5 ppm increase was 0.427 W/m2 and the total GHG forcing was 0.502 W/m2. The GHE temperature change was 0.018 C. The transient climate response (TCR) was 3.71 W/m2 x 0.018 C/0.502 W/m2 = 0.13 0.41 C.
The +- symbol [alt=0177] did not display.
The greenhouse effect trend is 0.012 +- 0.037 C/decade.
The TCR trend is 0.13 +- 0.41 C.
Ken, you said:
“Therefore there is no trend in feedback, which can exist only if there were a temperature trend. There are monthly positive and negative feedbacks, but no overall trend in feedback over the period 2000-03 to 2014-12.”
This suggests you don’t understand feedback. When you do, maybe you can rephrase your comments.
Are you being serious? You don’t understand the fundamental “greenhouse” warming mechanism!?
Roy, the OLR at the ToA (which directly translates into Earth’s T_e) is NOT meant to be observed rising over time during warming, if that warming were caused by an “enhancement of the GHE”:
http://www.climatetheory.net/wp-content/uploads/2012/05/greenhouse-effect-held-soden-2000.png
You’re confusing the expected rise in OLR at the ToA naturally associated with a tropospheric temperature rise, with what we would expect to see if that warming were caused by an “enhanced GHE”.
What we actually OBSERVE in the real world is the former scenario: The temp goes up -> OLR goes up accordingly:
https://okulaer.files.wordpress.com/2016/04/donohoe-et-al-2014-fig-1a-b.png
(Fig 1a & b from Donohoe et al., 2014.)
https://okulaer.files.wordpress.com/2016/07/hirs-vs-erbs-1984-2000.png
The whole idea behind the “greenhouse” warming mechanism, however, rests on the “raising of Earth’s level of effective emission to space” concept (see the Soden/Held figure above).
Within this cognitive framework, if you instantly doubled the atmospheric content of CO2, then you would REDUCE the OLR at the ToA by ~3.7-3.8 W/m^2, and so all altitude-specific layers of Earth from the tropopause down to the surface would be forced to warm by about 1 Kelvin in order for the OLR to RISE BACK to where it was BEFORE the atmospheric content of CO2 doubled.
We would now have a new dynamic equilibrium (steady state), where T_s1 = 1K + T_s0, but where still T_e1 = T_e0. The mean temp (T_s) went up, but the OLR (T_e) didn’t.
THAT’S the whole point, Roy. THAT’S the fundamental claim of the “AGW hypothesis”. And so this claim is what we need to test empirically. Do we see any sign of this postulated “greenhouse” warming mechanism anywhere? Nope. We only see the natural “+T -> +OLR” process going on. As it always has …
+ASR -> +T -> +OLR
There is no sign of any “enhancement of the GHE” anywhere to be found. The Sun + the Ocean are what’s caused the observed global warming. The positive radiative imbalance “seen” at the ToA is specifically caused NOT by a reduction in OLR (heat out), but by an increase in ASR (heat in). As clearly seen in the ERBE+CERES data …
Kristian, yes, I agree with all that, because now you are making more sense. But you made it sound like temperature and OLR going up and down together is some sort of evidence against the enhanced GHE….
Let me remind you of your original assertion to me:
“This is sooo simple. Your own gl TLT data shows an incredibly good fit both with the CERES gl ToA OLR data and with the CERES gl ToA ASR (TSI minus refl SW) data (taking ENSO conditions into consideration: (links)
This easily tells you that THERE IS NO ENHANCEMENT OF ANY GHE GOING ON!”
But what you described would occur with or without an enhanced greenhouse effect, and is not in any way evidence against it.
That’s what I was objecting to.
Kristian,
I guess we will have to wait for the resurrection of Ronald Fisher to re-introduce the null hypothesis. Until then, you are obligated to prove something does NOT exist that is described in the IPCC literature yet unobservable in the empirical data. Quite the task.
Best of luck.
Roy, you say:
If the OLR at the ToA is seen to neatly track the rise in tropospheric temperatures over a climatologically significant period of time (like, say, 30+ years), then this IS “some sort of evidence against” an “enhanced GHE” as theoretically defined; a very strong piece of evidence at that …
Because in such a situation, we can be pretty sure the warming wasn’t caused by some atmospheric retardation of radiative heat loss to space. The radiative heat loss to space, after all, simply rose with the temperatures …
If we, on top of this, during the same period of time, observe a substantial rise in the mean level of ASR (“absorbed solar radiation”), basically the input of solar heat to the Earth system, then there shouldn’t be much doubt about what REALLY caused the warming in question …
And this is precisely what we observe:
+ASR -> +T -> +OLR
Yes it is. Because the OLR specifically shouldn’t track the TLT over a 16 year period like this. IF there were a strengthening of the “GHE” going on.
Likewise, during the preceding period (1984/85-1999/00), covered by the ERBE mission, the OLR shouldn’t have been observed to go up in step with the TLT, IF an enhancement of the “GHE” were in fact the cause of the temperature rise.
Because THIS is the telltale sign of “greenhouse warming” to look out for:
T goes up, but T_e stays unchanged. Over decadal timespans. I am NOT talking about year-to-year noise here.
I believe some key observable points have been addressed here. The Earth system is not behaving as climate science would lead us to believe. I remember Dr Christy saying something along the lines of, ‘the atmosphere ‘should’ collect this energy but somehow it manages to shrug it off’. This is what we observe in the trending patterns in real time as Kristian has pointed out.
I believe the climate error goes back to Maxwell and the isothermal atmosphere. This was adopted by Manabe and Strickler 1964, which is the benchmark paper for climate modelling. Isaac Held (of Soden and Held) was a student of Manabe and through personal emails conveyed to me his belief that a non radiative atmosphere would be isothermal. Indeed the process of diffusion is accepted to mix temperature and homogenise.
This assumption bestows a gas with the ability to defy gravity and leaves us requiring another mechanism to produce a thermal gradient. Radiative transfer is then applied to produce the thermal gradient and therefore renders the lapse rate sensitive to radiative components. We are left with the popularly accepted ‘GHG’s warm the lower atmosphere and cool the upper.’
However, if we calculate a pure mechanical lapse including gravity then we find that there is nothing unusual going on. Latent heat alters heat capacity as in the presence of evaporation more energy is required per degree of temp change, and modifies the gradient as a ‘significant’ heat transfer mechanism.
We are left with simple heat transfer rules;
1. we require a temp gradient for heat transfer.
2. Significant heat transfer modifies a gradient.
3. Insignificant heat transfer remains a product of the gradient (from 1)
The persistence of the tropospheric lapse, provably unmodified by the total of long wave heat transfer renders the latter a product of the former.
It then follows that radiative heat lost from the surface into a persistent and maintained thermal gradient will, as a statistical certainty, be passed down the gradient and emitted to space. Nothing comes back as a statistical certainty to modify the gradient set and maintained by gravity, otherwise the lapse would be different to that calculated by its omission.
This is what we observe in the trending patterns (high correlation) of lower tropospheric temperature and outgoing long wave.
As an interesting aside, I recently on physicsforums.com asked the question,
“Would a non radiative atmosphere be isothermal?”
Within one day the thread was closed for moderation.
The personal email I received from moderator ‘berkeman’ was;
“jim mcnamara
@Geoffw
What I think: please supply a source (refereed ) article for your comments. I cannot separate what you think from what you are basing your statements on.
Thanks!
Thread will remain closed until @Geoffw can send me a private message with the refereed papers that he is referring to.”
So, apparently, I require refereed papers to ask a question on a physics forum!?!!
The closed thread is here;
https://www.physicsforums.com/threads/would-a-non-radiative-atmosphere-be-isothermal.889315/
Ooooh. Sounds like a raw nerve!
“Over decadal timespans.”
Kristian, this is a very good exchange here with doctor spencer and i hope he gets back to you at least one more time on this. Your’s is well articulated and to the point. i managed to read your rather lengthy exchange with doctor jan on new years day(ish). At a late juncture he seemed to concede your point only adding that he didn’t think that 15 years of data was quite long enough…
Geoff Wood says, October 24, 2016 at 12:21 PM:
We DO need “another mechanism” to produce a thermal gradient. That mechanism is called “heat transfer”. We need to have heat continuously flowing into and out of the atmosphere, thus flowing through it, from the ‘heating end’ to the ‘cooling end’. This process, for instance, is what creates and maintains the observed negative tropospheric temperature gradient.
So, yes, the atmosphere MUST be radiatively active to prevent it from ultimately ending up (more or less) isothermal from diffusion.
That doesn’t mean that radiation is what CAUSES the temperature gradient. It also doesn’t mean that radiation is what CAUSES the elevated average surface temperature when such an atmosphere rests on top of it.
Hi Kristian, you have said,
“We DO need another mechanism to produce a thermal gradient. That mechanism is called heat transfer. We need to have heat continuously flowing into and out of the atmosphere, thus flowing through it, from the heating end to the cooling end. This process, for instance, is what creates and maintains the observed negative tropospheric temperature gradient.”
Utter rubbish.
Heat transfer always acts to reduce a thermal gradient, as a temperature difference is required to produce heat transfer. As you know. Heat transfer alone could never produce an inhomogeneity. Sun transfers heat to Earth 5880K to 300K. Earth radiates to space 300K to 4K.
Venus is heated from the top. So where is the heating end? Well at the top obviously. That doesn’t stop the lower tropospheric temperature being high, does it?
It doesn’t require ‘heat transfer’ to explain the gradient, does it?
Both Earth and Venus exhibit a gravitationally driven lapse that is exactly as if long wave heat transfer wasn’t there.
Also,
“So, yes, the atmosphere MUST be radiatively active to prevent it from ultimately ending up (more or less) isothermal from diffusion.”
Go throw something up in the air. Watch it lose kinetic energy ascending and gain descending. Then explain why molecules in air that have mass and therefore feel gravity evade this observation by occasional collision.
The gradient obeys gravitational containment as the total energy at all tropospheric levels remains the same irrespective of radiative ability.
This is D**g C****n talk.
Your misconceptions are simply too elementary and too fundamental, and they seemingly run too deep, for me to bother spending time and effort trying to rectify them …
For instance, in your mind, is this expression: -dT/dz = g/c_p
associated with a “process” or a “state”?
Kristian, is it supported by data?
“Your misconceptions are simply too elementary and too fundamental, and they seemingly run too deep, for me to bother spending time and effort trying to rectify them ”
I accept your concession.
What about that expression?
-dT/dz = g/c_p
What does it describe?
Kristian. These are your own words from your own website;
“The problem is, gravitys effect on its surroundings is an empirically established fact, confirmed every day through billions upon billions of casual observations.”
So please explain how a column of gas, whose molecules spend most of their time between near perfectly elastic collisions, have mass and therefore feel gravity manage to evade the effects of gravity through collisions?
Why do you believe that a non radiative column would be isothermal in a gravity field?
It is perfectly evident that a single molecule travelling upwards at 285m/s would not get very far before loosing all of its kinetic energy to gravity. That being a result of containment.
Allowing collisions to normalise the lost kinetic energy from the total available that exchange through equipartition sets the rate of loss of kinetic energy with the accrual of potential i.e. Sets a vertical lapse rate.
If latent heat is included through changes in measurable specific humidity then the tropospheric thermal profile is exactly as this would predict. Near adiabatic to the lower condensation level, near isothermal steps where water condenses topped by free convection (redistribution of latent heat released) to equilibrium height. The total height to the tropopause being explainable by the temperature and specific humidity at the surface. Horizontal mixing produces small inconsistencies but these disappear in global averages.
The lower troposphere is no warmer than the upper conditions predict, and likewise the upper troposphere is no cooler than the surface conditions predict.
In light of this, the proposed isothermal atmosphere pulled into a gradient by radiative cooling from the top is pure fantasy insomuch that it is not required or supported by the data.
Take a block of iron. Compress it adiabatically to 3.5million atmospheres. Its lattice structure will move from bcc to fcc to hcp iron (hexoferrum) and the temperature will be that of the Earth’s core. This is exactly the same as dropping a piece of iron under gravity to the core and redistributing the energy released between all available energy storage states. At the core, most of the energy is in the PΔV term in the enthalpy. The pressure at the core being the weight of material under gravity. The elastic and bulk modulus terms describing how the volume changes with pressure. The resultant temperature is predictable from the surface if we understand gravitational containment. This process is exactly the same for gravitationally bound tropospheres. The thermal gradient or lapse is nothing to do with opacity or dependent in any way upon radiative losses from the top.
Geoff,
I will try to have this conversation/discussion with you if you would just please provide an answer to my simple question:
The expression: -dT/dz = g/c_p
What does it describe? A “process”, or a “state”?
Because, from what you write, it very much appears as if you believe that this expression is somehow describing the tropospheric temperature gradient in hydrostatic equilibrium.
Hi Kristian.
You ask about -dT/dh= g/Cp
This describes the thermal response of matter to changes in gravitational potential energy. Cp allows for the correct thermal response to energy changes in a gravitationally bound gaseous envelope as it includes the PΔV term, where PΔV= R. ie it respects the thermodynamic nature of celestial bodies.
Spontaneous changes in altitude by individual molecular or bulk motion gain or lose gravitational potential energy and the positive or negative accelerations due to gravity are reflected through Cp as a thermal response, by conservation, such that the total remains the same.
Hence -dT/dh= g/Cp tells us about the presence of a vertical field and the consequences of this to any motion, and its effects upon mean thermal velocity through the heat storage and thermodynamic properties of the respective matter.
(Not complete for Earth due to the presence of a condensing gas).
That this is what the tropospheric (but not the stratospheric?) gradient would look like (barring condensation) in static equilibrium even without any prior air mass movements …
Geoff, you say:
See, this is what I’m talking about. Where to begin?
No. It describes the “dry adiabatic lapse rate” (DALR) and NOTHING ELSE!
And so I have to ask you again:
Would the DALR develop naturally as the normal, observed temperature gradient in a static troposphere (disregarding condensation)? Or does it simply describe what happens to the temperature of a specific volume of air as it rises (or falls) in the atmospheric column? “State” or “process”?
Kristian you have asked
“And so I have to ask you again:
Would the DALR develop naturally as the normal, observed temperature gradient in a static troposphere (disregarding condensation)? Or does it simply describe what happens to the temperature of a specific volume of air as it rises (or falls) in the atmospheric column? State or process?”
And I have already answered this query. Your obsession with naming it is an irrelevance to me.
I have already said,
“Spontaneous changes in altitude by individual molecular or bulk motion gain or lose gravitational potential energy and the positive or negative accelerations due to gravity are reflected through Cp as a thermal response, by conservation, such that the total remains the same.”
By individual molecular or bulk motion.
I have also said,
“Not complete for Earth due to the presence of a condensing gas”
So I know the term is ‘dry’.
You however have failed to address why you believe that spontaneous motion for bulk motion is different to that for individual molecules when the sum of individual molecular motion IS bulk motion.
In reality all there is IS the sum of microscopic interaction which manifests as a predictable extension through laws of large numbers into macroscopic events.
And as I have already said, using the terms properly and including water for Earth and using the temperature adjusted Cp for Venus allows sensible projections to be made by including gravity in the lapse rate mechanism.
At http://www.drroyspencer.com/2016/10/what-do-16-years-of-ceres-data-tell-us-about-global-climate-sensitivity/#comment-228676, Geoff Wood says: “It is perfectly evident that a single molecule travelling upwards at 285m/s would not get very far before loosing all of its kinetic energy to gravity. That being a result of containment.”
Such a molecule, starting from below, going up at 285 m/s would not get very far, supposing it didn’t collide on the way up. Its lack of starting kinetic energy is the reason it wouldn’t get very far up. It won’t reach the top containing wall (the ceiling), so it’s not as a result of containment that it falls down again.
Importantly, it won’t contribute to the air in the parts of the column that are very far up. Those upper parts are populated by molecules that (again ignoring collisions) start going up significantly faster than 285 m/s, for example at 400 m/s.
When the statistical distribution of speeds is worked out precisely, this kind of reasoning shows that if the containing walls are rigid and fixed and impermeable to matter and heat, then when the contents are in their state of internal thermodynamic equilibrium, with zero heat transport, the temperature is uniform, invariant over height. The equilibrium statistical calculation is set out in standard textbooks, for example Chapman and Cowling (Chapman, S.,Cowling, T.G.(1939/1970).The Mathematical Theory of Non-uniform gases. An Account of the Kinetic Theory of Viscosity, Thermal Conduction and Diffusion in Gases, third edition 1970, Cambridge University Press, London; Section 4.14, pp. 7578). The result is also found in standard textbooks from macroscopic considerations by the calculus of variations. This problem is usually not considered in textbooks of meteorology because it is irrelevant to them, for in the natural atmosphere, things are utterly different.
In the natural atmosphere, there are no rigid fixed walls, nor walls that are impermeable to matter and heat; and there is nothing like internal thermodynamic equilibrium, because there is much heat transport in the natural atmosphere. The temperature lapse rate is then governed by laws of heat transport, not those of thermodynamic equilibrium, which requires zero heat transport.
“…the temperature is uniform, invariant over height.”
Old news Christopher. Superseded now.
In 1998 as discussed before, Christopher, that work was extended, the constant temperature solution T(z)=c was shown to have less entropy than the T(z) = To*(P(z)/Po)^R/Cp solution, thus nature would increase the entropy over time until at that non-constant T(z) (and only at that non-constant T(z) solution) heat death occurs in your universe i.e. entropy reaches a maximum. Subsequent work – that you pointed out – supported that result.
Thank you Ball4!!!!
That is exactly what I’ve been saying!!
I recognise the term R/Cp as being equal to γ-1/γ where γ is Cp/Cv.
This is an isentropic or reversible adiabatic equation.
For a known value of Cp it retrieves exactly the same gradient as;
-g/Cp.
Ball4 and Geoff Wood, thank you for your comments. Ball4 is referring to a textbook by C.F. Bohren and B.A. Albrecht, Atmospheric Thermodynamics, Oxford University Press, New York and London, 1998, pages 161-171 of Section 4.4. The finding of these authors is that there is a non-zero temperature lapse rate in a column of air in a gravity field.
Such a column, with a non-zero temperature lapse rate, has continuous radiative transfer of energy from the bottom layers to the top layers. It is thus not in internal thermodynamic equilibrium. On page 71, Bohren & Albrecht write “The atmosphere is not in a state of thermodynamic equilibrium, as evidenced by gradients of temperature, pressure, and density, as well as the winds themselves.”
Thank you for the reply Christopher. As I stated earlier heat transfer requires a gradient, and in the presence of one becomes a product unless its efficacy modifies such a gradient.
Perhaps you might like to think about the term ‘dynamic’.
The Sun, for example fantastically regulates core energy production with a massive heat transfer throughput. Near zero deep cycling by thermo ‘dynamic’ equilibrium.
“It is thus not in internal thermodynamic equilibrium.”
“It” is the atm. at large per B&A not the universe as defined by Christopher, which does reach thermo. equilibrium at the max. entropy point profile T(z) as shown; the radiation in that universe is also subject to heat death when there is no thermodynamic free energy able to further increase universe entropy.
In the presence of gravity, Bohren explains why the isolated universe equilibrium profile is not isothermal on p. 167. His work has been extended as pointed out by Christopher on an earlier thread.
Ball4 asks us to look at page 167 of that section. Consequently, I have read it over again.
Just above, I wrote Such a column, with a non-zero temperature lapse rate, has continuous radiative transfer of energy from the bottom layers to the top layers. It is thus not in internal thermodynamic equilibrium. It seems that my use of the word ‘it’ may be in need of remedy. I will try again.
Here is my improved form of expression:
A continuous air column with a non-zero temperature lapse rate is not in internal thermodynamic equilibrium, for it has continuous radiative transfer of energy from the bottom layers to the top layers.
Christopher, your column being at max. entropy is in perfect thermodynamic equilibrium, the rays in your universe are thus in equilibrium with the matter. No KE is transferred, the PE exactly cancels any change in KE at every point in your column universe due T(z) profile maximizing entropy as discussed by B&A p. 167 – as they point out, this was understood when the concept of heat death was invented by Lord Kelvin et. al.
Geoff Wood says, October 27, 2016 at 1:33 PM:
Ok. But it’s not an irrelevance to me. In fact, it goes to the very heart of this whole issue. There is no point for me to continue having this discussion with you until I know whether you think the -dT/dz = g/c_p expression describes the tropospheric (but not the stratospheric?) gradient (barring condensation) in static equilibrium even without any prior air mass movements, OR if you acknowledge that it simply decribes the (dry) temperature falloff rate with altitude inside a rising volume of air.
Can you please give me a straight answer? All I’ve gotten from you thus far is a string of nebulous, rambling excursions. Like this one:
“This describes the thermal response of matter to changes in gravitational potential energy. Cp allows for the correct thermal response to energy changes in a gravitationally bound gaseous envelope as it includes the PΔV term, where PΔV= R. ie it respects the thermodynamic nature of celestial bodies.
Spontaneous changes in altitude by individual molecular or bulk motion gain or lose gravitational potential energy and the positive or negative accelerations due to gravity are reflected through Cp as a thermal response, by conservation, such that the total remains the same.”
Hence -dT/dh= g/Cp tells us about the presence of a vertical field and the consequences of this to any motion, and its effects upon mean thermal velocity through the heat storage and thermodynamic properties of the respective matter.”
Spoken like a true devotee of pseudoscience.
“by individual molecular or bulk motion”
By thermal motion of particles (diffusion) or advective ‘parcels’
Already answered this (three times now).
I see Ball4 has taken up the crackpot baton from famed delusionists D. C****n and S. Wilde …
Bohren & Albright work with mathematical formulas, and don’t focus on their physical meaning. Their atmospheric column consists of infinitely many infinitesimally thin layers. The layers are adiabatically isolated. That means they can expand and contract but not pass heat or matter between each other.
This can be achieved by a fantastic and miraculous apparatus of infinitely many ultra-infinitesimally thin adiabatic walls that separate the layers. These walls prevent transfer of energy by radiation and conduction, as well as preventing transfer of matter between the layers. Hydrostatic equilibrium is possible because the adiabatic walls can move, allowing expansion and contraction of the layers.
Such a fantastic apparatus is fine for exercises in mathematics, such as entropy maximization, but is of course utterly unrealistic and unnatural from a physical point of view. It does not fit my phrase “continuous air column”, nor does it model a natural atmosphere. It creates an infinitely many times interrupted air column. It has the constraint of adiabaticity, mathematically plausible, but physically unrealistic and unnatural, creating a merely mathematically plausible constrained thermodynamic equilibrium. When the internal adiabatic walls are removed and the column is no longer internally adiabatically constrained, but is isolated from the surroundings by newly added fixed rigid impermeable walls, internal heat transfer will occur as well as work being done, and a uniform temperature, invariant over height, will be established. The constrained column was isolated only against heat and matter transfer but was not isolated against work. That was expressed in the enthalpy. For a column isolated except for gravity, the thermodynamic potential should be the internal energy.
I think these physical considerations escaped the notice of Bohren & Albrecht and of some of their readers. The usual texts and authors do not even think of such a fantastic and miraculous apparatus.
I didn’t require any elaborate apparatus. I just allowed molecules with mass to feel gravity. Got the same result. Simple analysis, simple solution. Then tested against data to find the solution perfectly useable.
Typo created by the wretched type-ahead engine: it should read ‘Bohren & Albrecht’, not ‘Bohren & Albright’.
Geoff Wood says, October 29, 2016 at 9:42 AM:
No, you’re doing the opposite of answering. I still don’t have a clue how you picture this. Clarity, Geoff. Clarity. I will try to make it simple for you.
i) Would the -dT/dz = g/c_p expression describe the tropospheric (but not the stratospheric?) gradient (barring condensation) in static equilibrium even without any prior air mass movements? “Yes” or “No”?
Or:
ii) Is it simply decribing the (dry) temperature falloff rate with altitude inside a rising volume of air? “Yes” or “No”?
Or, somehow, both? “Yes” or “No”?
That’s all I’m asking for. Three words from you. Can you handle it …?
No, because if you don’t realise that I have detailed this answer, you have nothing to tell me that I am interested in.
All molecules above zero Kelvin are perpetually moving. Through equipartition one third of the translational degrees of freedom is vertical, and obviously as molecules have mass, answer to gravity in the accrual or depletion of gravitational potential energy. I have stated, four times now, that I am including molecular motion, such that the macroscopic development does not require bulk motion which is simply the population net. But as the bulk motion is the net of microscopic motion then its properties are defined by the forces and properties of the microscopic domain. Air parcels do not exist separately they are the macroscopic development of microscopic processes.
You are simply laying a road of ignorance. Brick by brick.
It’s becoming quite amusing.
“Bohren & Albright work with mathematical formulas, and don’t focus on their physical meaning.”
Not true, B&A deliver more prose explanation/insight of the math than any other atm. text or name one that delivers more explanation. They also provide a long list of follow-up reading. By the original authors.
“The layers are adiabatically isolated.”
No, they expressly show T(z) that varies continuously with z, no adiabatic assumption or identify the formula number that does so.
“That means they can expand and contract..allowing expansion and contraction of the layers.”
Only up to the point of max. entropy, at that point this process would add entropy so it must cease.
“…course utterly unrealistic and unnatural from a physical point of view….physically unrealistic and unnatural, creating a merely mathematically plausible constrained thermodynamic equilibrium.”
Ok, now you get T(z) result really is thermo. equilibrium. Yes, of course, the whole exercise is ideal and cannot happen in real nature, the building of an alternate universe is impossible, there is no perfect insulation.
“It does not fit my phrase “continuous air column”…”
Yes, it does fit Christopher or specify where T(z) is discontinuous in an equation that is used. You cannot.
“It has the constraint of adiabaticity”
YOU defined the walls adiabatic that is the only adiabatic specification.
“..a uniform temperature, invariant over height, will be established.”
You will need to add power to drive the entropy down for T(z)=constant.
“The constrained column was isolated only against heat and matter transfer but was not isolated against work.”
No. Christopher’s own words: “the containing walls are rigid and fixed”. No work.
“I think these physical considerations escaped the notice of Bohren & Albrecht…The usual texts and authors do not even think of such a fantastic and miraculous apparatus.”
No physical considerations escaped B&A & even Christopher found two other authors that thought of such a fantastic apparatus extending B&A results.
Thank you, Ball4, for this careful post.
… B&A deliver more prose explanation/insight of the math than any other atm. text or name one that delivers more explanation.
They are indeed chatty, but their prose doesn’t deliver the right stuff. For example, they give a poor account of the zeroth law of thermodynamics. On page 45, they write: … the zeroth law of thermodynamics, which states that two systems at the same temperature as a third system are at the same temperature as each other. They miss the point of the law, first explained by Maxwell, in the early days before the principle was named as a law with a number. Though, sad to say, Maxwell italicized a statement about temperature, as do Bohren & Albrecht, he followed with a correct statement on pages 32-33 (revised by Rayleigh, 1899): This law is not a truism, but expresses the fact that if a piece of iron when plunged into a vessel of water is in thermal equilibrium with the water, and if the same piece of iron, without altering its temperature, is transferred to a vessel of oil, then if the oil and water were put into the same vessel they would themselves be in thermal equilibrium, and the same would be true of any other three substances. Bohren & Albrecht come close to deliberately calling the zeroth law a truism. The history of the statement of this law is a bit murky. The proper statement of the law, for example by Planck, does not mention temperature. It is about thermal equilibrium, a concept that in a rational development of thermodynamics is logically prior to temperature. That is why it is called the zeroth law. As it happens, it is just this law that warns us that Bohren & Albrecht are on thin ice. The key is that there is thermal radiation throughout a continuously connected body, such as the natural atmosphere, that does not have internal adiabatic walls. Thermal radiation mediates transfer of energy from hotter to colder parts of the body. While such transfer continues, internal thermodynamic equilibrium has not been established. Internal thermodynamic equilibrium requires that all internal fluxes vanish. And, ironically, Bohren & Albrecht’s Section 4.4, though it doesn’t mention Maxwell, is contradicting his correct answer to the problem of thermodynamic equilibrium in an internally unconstrained body, in a fixed rigid impermeable container in a gravity field. They missed the warning given by the zeroth law.
No, they expressly show T(z) that varies continuously with z, no adiabatic assumption or identify the formula number that does so.
Right from the start, Bohren & Albrecht choose their thermodynamic potential to be the enthalpy. With the words total enthalpy is conserved because the process undergone by the composite system is adiabatic they introduce formula (4.126). That sets the internal adiabatic constraints. They should have chosen the internal energy, as do for example Guggenheim, or ter Haar & Wergeland, who get the right answer, in agreement with Maxwell’s. The T(z) formula gives a continuous limit, but the point I am making is that it is conceptually based on an infinity of infinitesimally thin layers separated by ultra-infinitesimally thin adiabatic walls, a point that is not noticed by Bohren & Albrecht. Those walls are the discontinuities that I am talking about, not the continuous limit expressed by the formula.
Christopher. I particularly like your good manners in replying. But why do you think that a celestial body, which is thermodynamic should be treated as one in a fixed volume container?
The thermodynamic term ‘enthalpy’ as a representation of total energy is the correct term here. Using it allows correct and useable predictive calculations to be made.
Why are you avoiding this issue with me?
Sorry, my poor copying and proofreading. I left out a key point in Maxwell’s statement, “and is found to be also in thermal equilibrium with the oil”.
The correct version of Maxwell’s statement is
This law is not a truism, but expresses the fact that if a piece of iron when plunged into a vessel of water is in thermal equilibrium with the water, and if the same piece of iron, without altering its temperature, is transferred to a vessel of oil, and is found to be also in thermal equilibrium with the oil, then if the oil and water were put into the same vessel they would themselves be in thermal equilibrium, and the same would be true of any other three substances.
An above post reads:
the temperature is uniform, invariant over height.
“Old news Christopher. Superseded now.”
My summary response:
Yes, it’s old news. But not superseded.
Of previous texts far more reliable than Bohren & Albrecht, I listed only Guggenheim, and ter Haar & Wergeland, but there are others of comparable reliability. They stand directly against Bohren & Albrecht, who introduce nothing substantial but new mistakes. They go over the problem again, but with mistaken applications of old methods.
“They should have chosen the internal energy…”
No Christopher, there is an external gravity field in the thought experiment (invoking control volumes help!) for your fantastic apparatus so internal energy U is insufficient, total energy of interest U + PE is needed and appropriate which is enthalpy H (B&A eqn. 3.75).
Since your fantastic apparatus is a universe to itself, delta H = 0 which is the first law so correctly B&A invoke eqn. 4.126. Which is insufficient for zeroth law (as 1LOT allows the hotter object to become hotter Fig. 4.7) so correctly B&A invoke 2nd law entropy “to find our way along a line of possibilities” p. 163) which in their formulation starts with eqn. 4.130.
You now have 3+ authors correctly extending Maxwell, Guggenheim, ter Haar & Wergeland et. al. thought experiments. You simply assert without proof that these later 3+ authors are wrong, you remain unconvincing.
Though Christopher is correct to heed B&A chatting p. 102: “It is always wise to check mathematical results by physical reasoning. In so doing you acquire physical intuition and might even unearth errors.”
Christopher,
Here’s Richard Feynman from his physics lectures (volume I, chapter 40-1, “The exponential atmosphere”):
http://www.feynmanlectures.caltech.edu/I_40.html
So what apparently makes these people (like Ball4 and Geoff Wood) so confused is their inability to distinguish between the gravity-derived exponential pressure and density gradients in a massive atmosphere, and the heat transfer-derived temperature distribution in that same atmosphere.
So now we have a massless rod that defies gravity. It just gets better and better!
Actually it’s more than that, it’s a set of balls that pick up the temperature signal as frictionless, inertialess bodies connected to an inertialess vertically arranged rod that obviously is solid but weighs less than air (nothing) such that the whole ‘fantastical’ mechanism detects a difference in temperature over pressure by individual collision.
Wow!!!!!!!
You have succeeded in proving something there.
By inventing something ridiculous that defies gravity it obviously proves that everything else can.
All the rod would feel would be the insufficient pressure difference to lift its own weight against gravity.
Kristian, thanks for pointing out Feynman’s lecture c. 1961-3. B&A published later in 1998 also extending Christopher’s fantastic apparatus (not the at large atm.) science work of Prof. Feynman in addition to extending the earlier work of Maxwell, Guggenheim, ter Haar & Wergeland et. al.
In citing Guggenheim, I was going from memory and was mistaken. For this I am sorry.
Guggenheim shows how to use the internal energy but does not actually do the present calculation. He just assumes the the temperature is invariant with height for the case of thermodynamic equilibrium. Other physics texts that do the present calculation use a modified internal energy. Examples Muenster, Bailyn. This topic is the subject of some discussion in the literature.
Bohren & Albrecht use a special result from the ideal gas law to switch from modified internal energy to enthalpy. This changes the natural independent variables and thus the whole character of the analysis, and leads them to a wrong answer. One should continue to use the modified internal energy to express correctly the constraints for the entropy maximization, because the modified internal energy has the right independent variables for an isolated system.
Bohren & Albrecht get the wrong answer for thermodynamic equilibrium because of their choice of independent variables implicit in their use of enthalpy. This choice implicitly entails the bizarre apparatus that I pointed out. Their result would be a thermodynamic equilibrium if internal heat transfer were prevented. That is why they get a non-uniform temperature. When internal heat transfer is permitted, and the bottom happens to be hotter than the top, radiation will carry energy from bottom to top. To keep the profile time-invariant, conduction would need to balance the radiative energy flow by conducting heat from a colder region to a hotter one. This can’t happen. That’s why, when heat can flow unconstrained throughout the system of interest, uniform temperature is necessary for thermodynamic equilibrium, even with gravity present. Radiation is scarcely affected by gravity at the present level of analysis.
Christopher, why do you persist in defying the reasoning that a simple appraisal that includes gravity provides a useable solution supported by data?
Despite all of this ‘trammelling through’ insignificant details of specific papers, you are neglecting the fact that the results of the paper you are attempting to undermine are supported by data.
Cut to the chase.
“…(others) use a modified internal energy.”
Modified how? Why? Page, formula number? B&A use classic internal energy.
“Bohren & Albrecht use a special result from the ideal gas law to switch from modified internal energy to enthalpy.”
Explain what is special in B&A, it is actually un-special, basic classic thermo. Where exactly is anything they write special? In which formula?
“(B&A)result would be a thermodynamic equilibrium if internal heat transfer were prevented.”
No free thermodynamic energy at max. entropy, heat death. Until that point, B&A show no formula preventing internal energy transfer or show us the formula number preventing such. Radiation is in equilibrium with the matter, cannot further produce entropy at max. entropy. No radiation into or out of system per your constraints.
Christopher, you employ mostly useless assertion, I at least cite formula numbers, pages, you can settle this by finding one of your other sources that actually calculates (numeric integrates if needed) the entropy in a m^2 fantastic apparatus standard trop. atm. for T=constant=say 288K (or DIY). Then calculate B&A T(z) profile isentropic entropy To=288K, Po=1bar, which will be found higher.
If you can find/calculate a T(z) profile with even higher entropy than B&A, then be the first to extend B&A work.
My effort is to clarify how Bohren & Albrecht get a wrong answer.
The entropy maximization for thermodynamic equilibrium is for an appropriate class of possibilities, a set of suitably internally constrained thermodynamic equilibria, when the constraints are reduced to nil. Bohren & Albrecht look at a wrong class of possibilities, and arrive at a non-equilibrium answer.
Ball4 has helpfully pointed out that on page 106, Bohren & Albrecht derive their formula
U + P = … = H …… (3.75)
They derive this as follows.
“With p from the ideal gas law Eq. (3.73) becomes
“equation (3.74)
“and hence the sum of the internal and potential energies is
“equation (3.75).”
The natural independent variables of the internal energy U are S, V, and {Ni}. The natural independent variables of the enthalpy H are S, p, and {Ni}. In equation (3.75), the natural independent variables of the left hand side functions of state are S, V, and {Ni}, also with those of P, while the natural independent variables of the right hand side function of state are S, p, and {Ni}. For a minimization or maximization problem, this is problematic. The constraints are the problem.
Perhaps Bohren & Albrecht give us their understanding of this on page 91. They write:
“Because of this sloppiness in naming functions we run into notational problems in thermodynamics. An example will show why. The thermodynamic internal energy U of a simple system is a function of temperature T and pressure p, and if we were careful mathematicians, we would write this functional relationship symbolically as
“U = F (p,T) … (3.11).”
Thus they minimize the usual idea that their F is a Legendre transform of the internal energy, not the usual internal energy U(S, V) itself, a function of entropy and volume. The Legendre transform changes the independent variables from S and V to T and p. The result is usually called the Gibbs potential, G(T,p), not the internal energy in its natural independent state variables, U(S,V). I think their mistake in our problem arises from their cast of mind that dismisses the usual thinking behind what they construe as “sloppiness”.
Thus Bohren & Albrecht seem to change from the natural independent variables of the internal energy to those of the enthalpy without notice.
The effort does not clarify until Christopher at least starts with defining nomenclature S, V, {Ni}, p if any different than used in discussing B&A defined symbols.
The only forms of energy in the atm. layer that are of interest are the total enthalpy of the column including the PE as the column is defined to be in a gravitational field. No chemical energy, no nuclear energy, so forth are of interest in STP Earth atm.
Again, discussing independent variables can be avoided as well as the maximization process if Christopher computes the entropy in the standard troposphere column between two pressure layers for both T(z) profiles. This is already done in the literature Christopher has cited in the past, the entropy for the T(z)=constant profile comes out less than the B&A T(z) profile. Thus for T(z)=constant profile, there is not thermo. equilibrium as free energy is available that can still produce entropy.
AFAIK B&A T(z) profile entropy is still surviving as the max. entropy ever found in the column, no further free energy identified as yet. No higher entropy found, their maximization process is standing the test of time to date.
And supported as the simplest solution of the tropospheric thermal gradient of any atmosphere by all available data.
Kristian, how do you produce those grey left marginated inset quotes?
Ball4, the problem is to explain how Bohren & Albrecht get a wrong answer.
We know their answer is not a thermodynamic equilibrium for a system without internal constraints. The non-uniform temperature tells us so. That ensures continuing internal radiative transfer of energy; not just a one-way radiative contributory flux, but a net rate of continuing radiative transfer of energy from hot to cold. To maintain a time-invariant profile, conduction would need to transfer energy from cold to hot. No way. I can perhaps, imaginatively and contrary to fact, contemplate that gravity might exactly cancel conduction. But not that it could make conduction transfer from cold to hot.
The Bohren & Albrecht answer more or less matches an average natural troposphere, but doesn’t fit the stratosphere. Bohren & Albrecht tell us the the natural troposphere is not in a thermodynamic equilibrium. How can their answer, which more or less matches the natural troposphere, be in one? It isn’t, as noted in the previous paragraph. Why don’t they notice that? Why don’t they notice that it doesn’t fit the stratosphere?
The definition of thermodynamic equilibrium is not that it maximizes some mathematical formula that purports to give an entropy. It is that all (macroscopic) fluxes are permanently zero. Amongst scenarios with all fluxes permanently zero, the internally unconstrained one has maximum entropy. Evidently the mathematics of Bohren & Albrecht doesn’t follow that principle. To put the entropy maximization before the zero flux requirement is to put the cart before the horse.
“We know their answer is not a thermodynamic equilibrium for a system without internal constraints. The non-uniform temperature tells us so.”
As Dr. Bohren et. al. write p. 167-8, you are letting an example of conduction in solids impede your understanding of atm. convection. Mixing increases entropy, thus when entropy maximizes out at heat death of your universe, no more free energy, vertical mixing has to stop increasing entropy.
There is no conduction from hot to cold. As any constituent moves up against the gravity field, it loses the exact amount of KE as PE increase, no further entropy increase is possible at heat death.
B&A lengthy discussion of their “not everyone knows the answer p. 164” solution makes it clear their analysis is limited to hydrostatic troposphere with a normal lapse rate not the stratosphere where the fluid becomes warmed from above, no convection, no lapse. So B&A put you on notice right up front do not apply their result to stratosphere.
“To put the entropy maximization before the zero flux requirement is to put the cart before the horse.”
At max. entropy, there is no longer a horse and cart doing work, making entropy. They have suffered heat death. No free energy to do useful work at all, the horse and cart have ceased like the Norwegian Blue parrot of Monty Python fame.
Dear Ball4, I think we have both more or less put our cards on the table. I don’t foresee further progress soon.
Ball4 says, October 31, 2016 at 7:56 PM:
Exactly! Convection (or should I say, the large-scale atmospheric circulation, the more or less continuous turbulent mixing of the air masses) is what creates and maintains the negative tropospheric lapse rate. Convection in turn requires net heating at the bottom, net cooling at the top, plus a fluid subjected to gravity.
No convection in the stratosphere, no negative stratospheric lapse rate. It’s that simple.
Once convection stops (which requires an atmosphere without radiative properties, no absorp tion and no emission of radiation), conduction will slowly make sure the temperature evens out from top to bottom into a final thermal equilibrium.
Take heed of Feynman’s words:
“So, these are the two questions that we shall try to answer: How are the molecules distributed in space when there are forces acting on them [air pressure, air density], and how are they distributed in velocity [air temperature]?
It turns out that the two questions are completely independent, and that the distribution of velocities is always the same [in thermal equilibrium]. We already received a hint of the latter fact when we found that the average kinetic energy is the same, 1/2 kT per degree of freedom, no matter what forces are acting on the molecules. The distribution of the velocities of the molecules is independent of the forces, because the collision rates do not depend upon the forces.”
It’s that simple.
– – –
Christopher, try writing blockquote inside the brackets.
Kristian, you have said,
“Convection (or should I say, the large-scale atmospheric circulation, the more or less continuous turbulent mixing of the air masses) is what creates and maintains the negative tropospheric lapse rate. Convection in turn requires net heating at the bottom, ”
Venus has a high albedo (0.75) and at 0.723AU receives 1.91times the flux that the Earth receives. That means it is heated by 650W/m-2.
There is no atmospheric window for incoming radiation otherwise we would be able to ‘see’ the surface in that part of the spectrum.
Venus is heated from the ‘top’ by a small amount of incoming solar and the tropospheric lapse is identical in its heat distribution mechanism to the Earth without a mechanism to produce vertical overturning.
Thank you for that, Kristian. Here goes!
“No convection in the stratosphere…Once convection stops (which requires an atmosphere without radiative properties”
Funny, convection does essentially stop in the standard stratosphere (where constant T(z)=216.65K) and the stratosphere gases certainly have radiative properties. Kristian can not be correct by observation.
Actually, what is required for a fluid to essentially stop convecting (mass motion of molecules) is for that fluid to be ceased to be warmed from the bottom in a gravity field as happens above the tropopause. If gases can’t radiate in a thought experiment, the Earth would be mighty cold and the sun would not shine.
Feynman: “[in thermal equilibrium].”
Turns out Feynman’s thought experiment for Christopher’s fantastic apparatus was still producing entropy thus not at max. entropy as B&A later found a T(z) profile with higher (and no higher) max. universe entropy. As Dr. Bohren et. al. write p. 167-8, Kristian is letting an example of conduction in solids producing entropy impede understanding of atm. convection producing entropy.
Geoff Wood says, November 1, 2016 at 1:18 AM:
Well, on average it is heated by (its mean ASR at the ToA is) 163 W/m^2. Which is pretty much the same as at Earth’s global surface.
So you’re saying that 0 W/m^2 of the incoming solar radiation at the ToA ever reach the actual surface of Venus …?
What you’re actually equating the Venusian troposphere with here, Geoff, is Earth’s STRATOSPHERE, not its troposphere. Earth’s stratosphere is (mainly) heated from the top (by the absorp tion of incoming solar radiation) and lacks a mechanism to produce vertical overturning. However, its temperature gradient is … POSITIVE. The opposite of the Venusian tropospheric temperature gradient.
It seems you’re missing something crucial …
Could it be the simple fact that the Venusian troposphere couldn’t possibly be “heated from the top” as you claim, since this would violate the 2nd Law of Thermodynamics. Yes, the incoming solar radiation is coming in “from the top”, just like on Earth, but this doesn’t mean that heat moves through the troposphere from top (cold) to bottom (hot).
OF COURSE there is vertical overturning going on in the Venusian troposphere! OF COURSE the Venusian troposphere is heated from the bottom up! OF COURSE the Venusian surface heats the troposphere above! It’s HOTTER! Heat doesn’t spontaneously move from cold to hot, Geoff!
Kristian
The Earth is heated by a flux 0.7 of 1362W/m-2, which spatially averaged is 240W/m-2 of which 70% reaches the surface and heats the atmosphere from below.
Venus is heated by a flux of 0.25 of 2600W/m-2, which spatially averaged is the 163W/m-2 (less than what heats the Earth cf240) of which the global mean net at the surface is 20W/m-2. 50% of the absorbed flux is above 65km. So 80W/m-2 at the top and only 20W/m-2 reaching the surface.
That is heated at the top. Or at least certainly not heated at the bottom.
The two tropospheres are not heated the same but behave exactly the same.
You say,
“Could it be the simple fact that the Venusian troposphere couldnt possibly be heated from the top as you claim, since this would violate the 2nd Law of Thermodynamics. Yes, the incoming solar radiation is coming in from the top, just like on Earth, but this doesnt mean that heat moves through the troposphere from top (cold) to bottom (hot).”
The supportive flux balance merely provides a reference for the gradient that extends to the surface. The cold doesn’t heat the hot, it is in equilibrium with it and supports it. The gravitational potential energy difference manifests itself as a temperature increase in the lower layer, by everything that enters it being accelerated downwards.
http://www.climatetheory.net/wp-content/uploads/2012/05/greenhouse-effect-held-soden-2000.png
On Venus the ASR and EMRH are both upper atmosphere.
Also,
“OF COURSE there is vertical overturning going on in the Venusian troposphere! OF COURSE the Venusian troposphere is heated from the bottom up! OF COURSE the Venusian surface heats the troposphere above! Its HOTTER! Heat doesnt spontaneously move from cold to hot, Geoff!”
The total energy per unit mass at all altitudes within both tropospheres time averaged is the same. This is testable and surface temperatures are calculable from an upper tropospheric measurement without thinking about long wave radiative heat transfer. The surface of Venus is exactly in equilibrium with 49.5km 1bar. Even though the radiation balance is largely TOA.
Use the equation,
(T1/T2)=(P1/P2)^(R/Cp)
Or calculate the surface thermal response to dumping 49.5km of potential energy into the surface Cp starting at the 1bar temperature.
In both tropospheres there is no evidence of long wave radiative cooling or heat trapping in the profiles.
Ball4 says:
(His regular dose of tosh.)
Shouldn’t you rather busy yourself, Ball4, with starting a “crackpot club” with fellow distinguished delusionists D. C****n, S. Wilde and G. Wood, where you could all ramble on between yourselves as much as you like about this subject? Oh, and don’t forget Mr. HockeySchtick while you’re at it …
Unnecessary, but if that’s how you feel…..
Geoff Wood says, October 30, 2016 at 12:09 PM:
Yeah, he was quite the half-wit, this Feynman person, wasn’t he? Not being able to see, even after careful consideration, what you spotted right away.
Kristian, in the lecture you quoted, Richard Feynman theoretically connected the upper atmosphere to the lower with a set of balls and a vertically arranged rod. Without discussion he concluded that every incident molecule at the bottom would losslessly transfer kinetic energy to the top of the atmosphere. That’s what he said would happen ‘if’ a temperature difference existed.
So, by that thought experiment, there can’t be one!!!!!!
Pure fantasy by any stretch of the imagination. Don’t care really who said it.
Did you not question this reasoning at all?
Perhaps I should reply to Ball4 on the topic of horses and carts.
The maximum entropy is to be found for a given appropriate equilibrium energy. The horse is defining the appropriate equilibrium energy. The cart is finding the maximum entropy for that.
Christopher, that defines the reference temperature of the gradient not the relationship of altitude layers in the gradient. Reference defined by flux balance, gradient by entropy.
Christopher, the energy sealed in your universe is constant, always at maximum. To find the appropriate T(z) profile as your universe maximizes entropy is the assignment for analyzing the standard earth atm. between the two pressure layers contained in your fantastic apparatus at thermodynamic equilibrium.
There can be no thermodynamic equilibrium if there’s a temperature gradient, Ball4.
Gravity forces matter to interact. That interaction produces radiation that was the potential that became kinetic. Relentless until the process of wringing the potential from matter into the background of space is complete.
Kristian 1:40pm, once again, you let conduction in a solid impede your understanding of atm. convection. What you write is certainly true for an isolated gas container not in a gravity field (thus not convecting).
B&A 1998 prove adding a gravity field for a fluid warmed from below has a result “for which not everyone knows the answer p.164”.
Planck 1914 for an ideal gas verbatim, para. 130, p. 152: “Let us consider the state of thermodynamic equilibrium. According to the second principle of thermodynamics this state is distinguished from all others by the fact that, for a given volume V and a given energy E of the gas, the entropy S is a maximum.”
Consider Christopher’s fantastic apparatus ideal gas in a gravity field with B&A isentropic T(z) profile:
1) Entropy at maximum? Yes
2) Given volume? Yes
3) Given energy? Yes
Per Planck for an ideal gas, then the B&A isentropic T(z) result satisfies his defn. thermodynamic equilibrium.
If there were no gravity field the T(z) would be constant, the velocity distibution follow M-B.
As proven in B&A 1998, Christopher’s fantastic apparatus WITHIN a gravity field, warmed from below thus convecting, the isentropic temperatures are constant, unchanging, and their profile follows the Poisson potential temperature T(z) at universe max. entropy with gravity modified M-B velocity distribution.
Ball4 says, November 1, 2016 at 5:15 PM:
Nope. We try again: There can be no thermodynamic equilibrium as long as there’s a temperature gradient. You’re ignoring what Feynman is pointing out. If you put a fluid in a gravity field, the force of gravity WILL affect the distribution of the molecules inside the fluid, producing exponential pressure and density gradients. However, the force does NOT affect the distribution of the molecule VELOCITIES, and so will not by itself be able to create a TEMPERATURE gradient inside the fluid. For that you need the process of heat transfer into, through and out of the fluid in question.
C. Game is completely right: Gravity cannot influence the ‘flow’ of radiative energy. Photons have no mass. And so, if you impose a temperature gradient on a fluid and then you somehow cut off convection, then radiation will automatically start moving energy from the warmer regions of the fluid to its cooler regions. And this process will continue until the temperature is the same throughout the fluid. At this point we have reached thermal equilibrium and no more net energy (macroscopic energy flows) will move around inside the fluid via radiation. It doesn’t matter how long this process will take. It will ultimately make the fluid isothermal.
In order for your fluid to avoid becoming isothermal this way, as Game points out, conduction will have to somehow move energy up the gradient to counter the radiative transfer. That is, there will have to be a conductive heat transfer from cold to hot. Which will not and cannot happen in nature.
What Bohren & Albrecht have done here by implication is, again as Game has explained, turned the full interconnected fluid volume into a set of infinitesimally narrow layers, adiabatically isolated from one another (they cannot in any way exchange heat between themselves, conductively or radiatively), and so they basically disallow the process described above from running its natural course.
This way you will end up with separate thermodynamic equilibria inside each adiabatically isolated layer of the fluid, but NOT one inside the fluid as a whole. This strictly divisional arrangement will likely create an overall higher entropy than if you kept the fluid system internally open (as would happen in reality), but you are simply describing a different thermodynamic situation …
This is what Game meant when he cautioned you to distinguish between what is mathematically possible and what is physically possible.
Same with the Stefan-Boltzmann equation, which we’ve talked about earlier. Writing it like this is mathematically correct:
σT_c^4 = σT_h^4 P/A
But it has no real physical significance, no bearing on reality. The only version (the original, standard one) that actually describes the real physical situation is this:
P/A = σ (T_h^4 T_c^4)
But still the tropospheric lapse on both Earth and Venus follow an isentropic profile. Just like they haven’t read your words of wisdom Kristian?
“Photons have no mass.”
All energy has effective mass.
hν= mc^2
Even radiation feels gravity. Through the constancy of the speed of light it is red-shifted in leaving a gravitational potential well.
For a black hole the light can theoretically leave due to the constancy of light speed, but it is red-shifted to infinity. It does work leaving, like everything else in the Universe.
Sorry, the minus signs got lost there …
“However, the force does NOT affect the distribution of the molecule VELOCITIES..”
Only for the no gravity M-B distribution which is for a constant temperature gas held in a container forced to a constant temperature, Christopher’s fantastic apparatus does NOT have any forcing boundary condition. At max. entropy the gas inside IS all at constant temperatures in equilibrium with a profile as shown by B&A. The distribution of velocities is different than Feynman discusses, he was unaware that a higher entropy solution would be found than his T(z) = constant as in M-B.
Yet again, Kristian lets conduction in a solid impede understanding of atm. convection.
“For that you need the process of heat transfer into, through and out of the fluid in question.”
Of which there is none at heat death of Christopher’s fantastic apparatus universe.
“C. Game is completely right: Gravity cannot influence the ‘flow’ of radiative energy.”
Einstein proved otherwise supported by test though the effect is not important here, the radiation field inside Christopher’s fantastic apparatus is pure BB, isotropic (the same in all directions), unpolarized in his cavity, the universe radiation is in equilibrium with the matter.
“Photons have no mass.”
A string of papers published during at least the past 46 years, report ever-decreasing upper limits on the photon mass. If it were known to be identically zero, many physicists have been wasting their time and the taxpayers’ money. See Luo et. al. Physical Review Letters, Vol. 90, pp. 081801 (14).
“And so, if you impose a temperature gradient on a fluid…”
There is no such imposition on Christopher’s earth atm. gas, any initial condition will do, the system naturally increases entropy until all the free energy is used and then stops changing at the B&A T profile in equilibrium.
“It will ultimately make the fluid isothermal.”
That T profile has been shown to have a lower entropy (as calculated) than the (as calculated) higher entropy of the B&A profile so the fluid will not stop producing entropy at T(z) = constant.
“That is, there will have to be a conductive heat transfer from cold to hot.”
Not in Christopher’s fantastic apparatus, that would decrease entropy and in his isolated container entropy allways increases, relentlessly. There is no forcing provided to move local entropy down as in a refrigerator.
“This is what Game meant when he cautioned you to distinguish between what is mathematically possible and what is physically possible.”
The processes inside his apparatus are both physically possible as found from test and mathematically possible, what is not possible are only the boundary conditions which are ideal.
Ball4,
Start your club now and keep on discussing this matter there. ‘Cause this is just stupid. Bye.
Why do you define it as stupid Kristian? I have mentioned several times that this profile we are suggesting is supported by the data. What is stupid about that?
Perhaps the following may prevent some heartache.
There are two entirely different questions being canvassed here.
(1) why does the earth’s actual natural troposphere have a temperature lapse rate that can be approximately calculated by considering abiabatic transfers?
(2) what is the temperature profile of a putative hypothetical tall column of gas perpetually isolated, apart from a fixed gravity field, by walls that are rigid, fixed, and impermeable to matter and heat?
As I understand it, question (1) is the one that interests Geoff Wood. It is relevant to real actual natural atmospheric data such as he refers to. It is not relevant to question (2). Question (1) concerns a conveniently conceptual atmosphere that is defined as being in a steady state, unchanging in time, with significant and important non-zero flows of matter and energy. Someone might use the word ‘equilibrium’ for that conception, because of its time-invariance. Such a word use may be reasonable in ordinary language, but is contrary to the textbook definition of thermodynamic equilibrium, which stipulates that all macroscopic flows in the scenario are zero. It is evident that the real actual natural atmosphere of question (1) is not the putative hypothetical object considered in question (2).
Question (2) is an academic and largely theoretical one. It does not directly refer to the actual natural atmosphere, which is far from textbook-defined thermodynamic equilibrium. Question (2) refers to a body of gas that is in textbook-defined thermodynamic equilibrium. Most atmospheric thermodynamic textbooks do not discuss question (2) because the actual natural atmosphere is far from textbook-defined thermodynamic equilibrium. It happens, exceptionally, that Bohren & Albrecht do seem to discuss it. Geoff Wood, at http://www.drroyspencer.com/2016/10/what-do-16-years-of-ceres-data-tell-us-about-global-climate-sensitivity/#comment-228596, has adverted to Maxwell’s treatment of this question: “I believe the climate error goes back to Maxwell and the isothermal atmosphere.” Maxwell was considering question (2), not question (1). In logic and substance, questions (1) and (2) remain far different from one another. Real actual natural atmospheric data have no relevance to question (2). Such data are of course fully relevant to question (1).
I do not mean by this comment that I intend to continue this discussion.
Christopher, thank you for the considered reply.
I understand that you might not reply, but still, hopefully, you might read.
In the post of mine that you highlighted, I specifically said ‘a non radiative atmosphere’, in which irrespective of profile there is no radiative exchange, by definition. Being ‘non radiative’ the equilibrium conditions are constrained.
My attention was drawn to this by Isaac Held of (Soden and Held) who from Manabe and Strickler adopt a starting isothermal atmosphere in a gravity field in modelling real atmospheres.
This isothermal atmosphere is pulled into a super adiabatic profile by radiative heat exchange in the absence of convection, making the profile a function of opacity.
Then the super adiabatic profile is truncated by “the observed” profile of 6.5K/km as being the onset of convection. This is added without discussion in the benchmark paper of Manabe and Strickler.
When, in reality, modelling an atmosphere that can ‘feel’ gravity on the molecular level outside of the assumptions of Maxwell and Feynman, the exact profile is retrieved without correction, as a reversible adiabatic or isentropic profile, in line with the thermodynamic concept of enthalpy. And more importantly without resort to long wave opacity.
You are entirely correct that I am interested in real atmospheres. Also, if the colloquial meaning of ‘thermodynamic equilibrium ‘ applies to time invariance then I am quite happy to detract from the textbook definition, in favour of reality.
Perhaps it may be of interest to post some quotes from Maxwell.
The 1902 edition, revised by Rayleigh, of Maxwell’s Theory of Heat, tenth edition of 1891, says:
Maxwell’s own first edition, of 1871, as I read it, is word for word the same except that Rayleigh seems to have corrected Maxwell’s original value 0.233 to Rayleigh’s 0.29.
Christopher you are defending something that has no place in this world. As Ball4 has already said “the universe is not isothermal”. Gradients drive heat exchange. Without thermal gradients there is no heat exchange.
The Earth and other measured atmospheres including projections to the cores of planets follow the thermodynamic property of enthalpy.
It matters little that you think gravity contributes nothing to these profiles which exist, real world and accountable to gravity by continuing to argue that they don’t confirm to theoretical principles that exists nowhere.
The very bodies we are reasoning about are gravitational condensates. Density, pressure and thermal profiles are sensibly retrieved by allowing inclusion of the effects of gravity and potential energy interchange with total energy of which only a portion is thermal, some is PΔV, which varies accordingly.
From around 200mbar to the core of any celestial body the relationship as function of altitude is extremely adiabatic.
And in making the mistakes you think I am making I am still left with the ability to calculate and reason through a planetary atmosphere without concession to your objections.
The real world atmospheres of Earth and Venus behave exactly as if molecules feel gravity, and as a conclusion that the long wave radiation throughput especially in high opacity bands is a product of this gradient by definition. As highlighted by CERES data.
Geoff Wood says, November 4, 2016 at 2:31 PM:
See, this is what you don’t get, Geoff.
It’s the other way around. Net heating here and net cooling there (creating a temperature DIFFERENCE between the two regions) naturally and automatically sets up a heat transfer, from hot to cold. This heat transfer aims to equalise the temperatures of the two regions, cooling the heating end and warming the cooling end. But as long as there is net heating going on at the heating end and net cooling going on at the cooling end, this will never be accomplished in full. The heat transfer will, however, establish and maintain a steady-state temperature GRADIENT between the two regions as it operates.
As soon as you switch off the heating and the cooling at the opposing ends, though, the heat transfer will seize the upper hand and finally be able to fulfill its goal: The temperatures will eventually become equal. At this point the heat transfer is no more. Isothermal conditions. Thermal equilibrium.
The reason why there’s a negative temperature gradient in the troposphere is the simple fact that the Sun heats the surface every single day, driving atmospheric circulation (large-scale vertical overturning of air masses). The surface heating on Earth is strong enough to maintain convective circulation up to 10-20 km above the ground. And this is also how high up you will see a negative temperature gradient. Above the top of convection there is the tropopause. The tropopause has no vertical temperature gradient. It is vertically isothermal. Above the tropopause is the stratosphere. There is no convection in the stratosphere either. The stratosphere is static, stratified and mainly heated from above. Hence, it has a POSITIVE temperature gradient, cooler at the bottom, warmer at the top.
It’s that simple. Gravity directly determines the pressure and density gradients of a massive planetary atmosphere, but NOT (!!!) its temperature gradient(s). The various heat transfers do that, be they convective or radiative …
Despite all this, the gradient that, in the absence of your conjecture, remains. So what of substance do you have to add?
Are you telling me that the same method that correctly predicts the thermal gradient of two completely different atmospheres is wrong?
On what grounds?
Kristian, go and look at the distribution of long wave outgoing radiation from the Earth. The intensities are only available from lower tropospheric opacities and temperatures. The gradient is not produced by losses from the upper. The Earth mainly radiates to space from the denser regions of the lower troposphere.
Kristian, you have said,
“The stratosphere is static, stratified and mainly heated from above. Hence, it has a POSITIVE temperature gradient, cooler at the bottom, warmer at the top.”
It is not static.
The mistaken belief is that convection, as in advective mass flow, stops at the start of the tropopause. In reality there is a seasonally variable but steady upwards mass flux through the tropical 380K isentropic surface (~93mb, 192K) of around 1.2e10kg/s, this is balanced by net downwards mass fluxes in the extratropics.
As air rises into the stratosphere its natural cooling is countered by an increasing cross section to direct solar heating mainly by UVC/B oxygen/ozone cycling. Rising air faces a greater heating effect to around 25km above which falling density and pressure reduces the heating reaction cross-section, despite rising solar radiative fluxes.
Bulk motion exists through the tropical tropopause and into the stratosphere as a steady mass flux, the Brewer-Dobson circulation, such that the whole atmospheric mass is stratospherically processed in around 10 to 15yr, with significant stratospheric mass flux returning through the winter polar vortex.
The mass of the whole atmosphere above 93mb is less than one tenth of the full atmospheric mass and so at this overturning rate is potentially completely replaced with tropospheric air every 1.3yr.
See, this is what you dont get, Kristian.
Your confusion over heat leads you to wrong conclusions. If you rewrite that without using heat term you will begin to learn the real physics.
There is no heat to transfer in Christopher’s fantastic apparatus as heat does not exist in an object. At max. entropy, internal avg. KE loss by convection is exactly balanced by PE gain & vice versa. In this condition, Planck’s thermodynamic equilibrium of max. entropy, there is also thermal equilibrium established as the temperatures remain constant forever for an isolated gas in a gravity field.
It’s that simple.
“Hence, (stratosphere) has a POSITIVE temperature gradient, cooler at the bottom, warmer at the top.”
Not all, in the standard atm. there is about 10km of stratosphere isothermal (216.65K) conditions just above the midlatitiude tropopause. Lord Kelvin’s convection ~ceases in that layer as the fluid in a gravity field becomes warmed from above.
If I am correct which is I think by 2020 global temperatures will be around .5c cooler then they are presently then you will be vindicated. Even a drop of smaller magnitude would strengthen all of your correct assertions.
I think it is gong to happen and when you look at the global temperature picture you see most of the global warming that has taken place is in the Arctic which is a function of terrestrial items that influence the climate two of those being sea ice and the AO oscillation. In addition this warming has only been during winter. If the Arctic were truly warming it would be a year along event.
To cut to the chase I said initially global cooling would start with a -AO which corresponds to a warmish Arctic.
Thus far snow coverage is above normal globally and this along with the recent El Nino ending ,prolonged solar minimum conditions becoming established once again following 10+ years of sub – solar activity, and the weakening earth magnetic field should result in a cool down.
Salvatore, I know David Appell is anxiously awaiting your forecast to be verified. 😉
+1
“Lows will drop into the 20s across much of New York and New England, with 30s expected elsewhere across the region.
“Some areas untouched by frost so far this season in the mid-Atlantic could be reached during the middle part of the week,” according to AccuWeather Senior Meteorologist Alex Sosnowski.
Those who have not had to turn on the heat thus far may have to do so this week.
The cool push will be accompanied by blustery conditions which could knock down and blow around unsecured harvest and Halloween decorations”.
Why do you keep posting weather? It is utterly irrelevant to the climate situation.
Now that statement will no doubt come back to haunt you some time in the near future.
“If I am correct which is I think by 2020 global temperatures will be around .5c cooler then they are presently”
LOL oh boy.
https://arxiv.org/pdf/0802.4324v1.pdf
http://www.barrettbellamyclimate.com/page48.htm
Confused Jane,
From your link –
“Removal of all the greenhouse gases would reduce the temperature of the surface to that of the emission temperature; 255 K.”
Complete nonsense. The Moon has no greenhouse gases. Temperatures after equivalent exposure times exceed those on Earth – not surprising, since the surface receives the full 1367 W/m2 from the Sun, rather than the 1000 or so available on Earth.
Additionally, the hottest places on Earth are those with the lowest amount of the most important GHG (H2O) in the atmosphere.
Now is your time to divert to averages, and claim the surface gets hotter at night.
The Earth has cooled for four and a half billion years.
So sad. Too bad.No CO2 heating (as in “hottest year EVAH!)”. No GHE.
Cheers.
Mick, this reply can cover others.
You say “The Earth has cooled for four and a half billion years.”
No, That’s false. It’s unscientific it’s inaccurate it’s false. Your problem is that you have both psychological issues and logic issues and communication issues besides being unscientific and inaccurate.
What you could say is this: “The earth’s avg mean temp is lower today than it was 4.5 billion years ago.”
You cannot rationally claim that “the earth has cooled for …” any period of time. Because it has not. Avg mean temps have risen and fallen NOT “cooled” – “cooled” that is not a scientific reality. What you are saying is flat out incomprehensible.
iow it is Bullshit Speaking. You are way out of your depth. A anti-AGW/CC denier who imagines he is smarter than scientists all over the world.
“No GHE” is an assertion to establish your stupidity. You (and most of the others across the internet) are merely a social media blog troll with a huge argumentative mouth but no thinking ability in logic to back it up.
“Temperatures after equivalent exposure times EXCEED those on Earth” you’re a fool. What is the Avg Mean Temp of the Moon? Any idea? What do your thermometer readings show? What does the SCIENCE say it is?
— —
Now the biggy.
You and thousands of others rail on about a “missing null hypothesis” … to aid you this is a simple version of that:
“The two hypotheses divide the relevant world into two subsets: the desperately-hoped for result, HA, and everything else, H0. Think of the null hypothesis as the “killjoy hypothesis.”
e.g.: Blood pressure lowering drug X: the null hypothesis is that drug X has no effect on blood pressure.”
YOUR desperately-hoped for result is there is no GHE. Where is your Null Hypothesis? You do not have one.
YOUR other desperately-hoped for result is that any and all Global Temperature Increase (ie warming) since 1750, since 1850, since 1900, since 1960, since 1979 satellite era is ALL NATURAL VARIATION.
Where is your Null Hypothesis? You do not have one.
YOUR other desperately-hoped for result is that there has been ZERO Global Temperature Increase since 1750 etc
Where is your Null Hypothesis? You do not have one.
This is the empirical evidence upon which I assert that you (and all the others who think (sic) like you are incapable of rational logical unbiased objective scientific thought and as such are Stupid Idiots who need to learn to STFU find something else to do with your life.
Happy Daze!
“Happy Daze!”
SIT ON IT, JANE
Massive ADHD tablet overdose again, ..
5 year old TANTRUM CENTRAL !
Dear Confused … Your replies show up on a Google search on “missing null hypothesis” plus “climate”, three years after you made them. I hope you are feeling better now.
Jane you troll! You are denigrating women by the use of a woman’s name and adjective confused.
Mike Flynn wrote:
“No CO2 heating.”
You’re just playing with people, and not serious.
You don’t ever answer any of the questions posed to you, because you know the answers contradict your claims.
And you know full well how the greenhouse effects works — by reducing heat loss. As here:
Mike Flynn wrote:
In cold conditions, I wear clothes to reduce the rate of heat loss.
http://www.drroyspencer.com/2016/08/uah-global-temperature-update-for-july-2016-0-39-deg-c/#comment-219326
“The Earth has cooled for four and a half billion years”
False.
It’s false now. It’s false during the recent warmings from any glacial to interglacial period. It’s false during the PETM.
It’s just poppycock:
https://en.wikipedia.org/wiki/Geologic_temperature_record#/media/File:65_Myr_Climate_Change.png
confused…”LOL oh boy”.
Your first link to Arthur Smith has some history. Smith has a degree in physics but he has worked most of his career as a librarian. He wrote the paper as a rebuttal to the paper by Gerlich and Tscheuschner who gave a myriad of evidence that the greenhouse effect did not exist. G&T have backgrounds in thermodynamics whereas Arthur and his later collaborator in Halpern et al do not.
The Smith paper has a very narrow focus with regard to the G&T paper. He makes one highly theoretical argument against the entire paper. His paper was later critiqued by others who drew out flaws in it. There is a reference to the critique in the rebuttal to Halpern et al by G&T.
Gordon .. you said: “He wrote the paper as a rebuttal to the paper by Gerlich and Tscheuschner who gave a myriad of evidence that the greenhouse effect did not exist.”
WHY DO YOU ASSUME THAT I CAN REFERENCE A PAPER AND YET NOT EVEN KNOW WHAT IT SAYS IN IT, MISS THE REFS IN IT, AND NOT KNOW THAT IT WAS A REBUTTAL????
Why do you FALSELY BELIEVE that I need YOUR HELP pointing out the BLEEDING OBVIOUS?
Because your just a stupid anti-AGW/CC Troll and a fool.
That’s why.
RE: “The Smith paper has a very narrow focus with regard to the G&T paper.”
So what? That’s normal peer-reviewed science too – happens all the time, GET OVER IT.
RE: “He makes one highly theoretical argument against the entire paper.”
That’s your belief, so what? Gerlich and Tscheuschner was a HIGHLY THEORETICAL ARGUMENT too … good for the goose?
RE: “His paper was later critiqued by others who drew out flaws in it.”
SO what? Who says those criticisms are RIGHT? You?
And you say this while totally ignoring, side-stepping, denying, dismissing all the FLAWS is Spencer’s papers, in Soon’s papers, in Toll’s papers, in everyone else’s papers.
Your problem like Mike Flynn’s is that you are a disingenuous unqualified incompetent living in a fantasy world where you imagine you are a thousand times smarter than the collective research in over 100,000 climate science related papers by tens of thosuadns of real genuine climate scientists.
What you have here is a serious psychological problem not a “climate sceince” problem that you’re endlessly denying BY DEFAULT without any basis in logic or fact, and then complaining about to others walking past you on the cyberspace street.
GET A LIFE THAT SUITS YOUR SKILLS, TALENTS AND IS COMMENSURATE WITH YOUR ACTUAL ABILITIES
‘Because your just a stupid’
Why do you repeatedly need to utter the bleeding obvious in caps?
Poor confused one.. totally out of ITS depth !!
And you can tell from ITS angst and tantrums, that IT knows that to be the case.
confused…”Because your just a stupid anti-AGW/CC Troll and a fool”.
With a blatant ad hom attack like that it’s obvious you had no idea what the Smith paper was about. I seem to have hit a nerve by pointing it out.
There is nothing theoretical about the main thrust of the G&T paper that greenhouses warm due to a lack of convection rather than the blocking of IR by glass. That’s the premise of the AGW theory, that the pitifully small amount of CO2 in the atmosphere can act like glass in a greenhouse.
The Smith paper failed to address that basic truth which was proved by the Woods experiment of 1909. Woods also insisted that surface radiation would fall off in intensity due to the inverse relationship between radiation and distance from the source. According to Woods, the intensity would be too weak after a few feet to make any difference.
Gerlich and Tscheuschner is junk.
Everyone should know that by now.
https://scienceofdoom.com/2010/04/05/on-the-miseducation-of-the-uninformed-by-gerlich-and-scheuschner-2009/
http://www.realclimate.org/wiki/index.php?title=G._Gerlich_and_R._D._Tscheuschner#Rebuttals
David Appell…”Gerlich and Tscheuschner is junk”.
Another ad hom specialist. Where’s the proof from your own understanding?
Referencing SOD and realclimate is a serious joke. SOD’s analysis of G&T is like yours, full of ad homs and lacking in scientific analysis. SOD revealed their complete lack of understanding of thermodynamics with an attack on the 2nd law that reveals serious ignorance.
realclimate is run by Gavin Schmidt, a mathematician, and Michael Mann, who made a fool of himself in the Climategate email scandal and with his schoolboy hockey stick graph.
Gordon, I gave a link, if you can understand it:
https://scienceofdoom.com/2010/04/05/on-the-miseducation-of-the-uninformed-by-gerlich-and-scheuschner-2009/
I don’t see any reason to repeat the argument here.
No serious scientist thinks G&T is meaningful. If they did, they’d be addressing it in the scientific literature. They aren’t.
Salvatore makes lots of predictions, and he has always been wrong. And he seems incapable of learning anything whatsoever from his track record of failure.
“here is my prediction for climate going forward, this decade will be the decade of cooling.”
– Salvatore del Prete, 11/23/2010
http://ourchangingclimate.wordpress.com/2010/10/20/andrew-dessler-debating-richard-lindzen/#comment-8875
Global cooling has started, and it will be here for sometime to come. All the factors that control the climate are now in, or going toward a colder phase
– Salvatore del Prete, December 31, 2010
http://www.drroyspencer.com/2010/12/dessler-and-spencer-debate-cloud-feedback/#comment-8257
Temperatures in response to this will decline in the near future, in contrast to the steady state of temperature we presently have,or have been having for the past 15 years or so.
– Salvatore Del Prete, 11/6/2012
http://www.drroyspencer.com/2012/11/uah-v5-5-global-temp-update-for-october-2012-0-33-deg-c/#comment-64939
More:
“I think the start of the temperature decline will commence within six months of the end of the solar cycle maximum and should last for at least 30+ years.”
– Salvatore Del Prete, 7/13/2013
http://www.drroyspencer.com/2013/07/uah-v5-6-global-temperature-update-for-june-2013-0-30-deg-c/#comment-84963
“I think this blip ends before NOV. is through and if solar conditions continue to be sub par cooling in a more pronounced way will start in year 2014.”
– Salvatore del Prete, 11/15/2013
http://www.landscheidt.info/?q=node/4#comment-1047
“I can not wait to see what they will say once the temperature trend is down, and I wonder how accountable they will be for their wrong climate forecast.”
– Salvatore Del Prete, 7/8/15
http://www.drroyspencer.com/2015/07/revised-uah-global-temperature-update-for-june-2015-0-33-deg-c/#comment-194674
Actually it’s probably pretty shaky to predict any change in climate temperature inside of a five year period as that is about the length of an ENSO cycle.
Its pretty clear that climate is affected in many ways, some may be internal and others external.
However, climate models are in dire need of a temperature record they don’t need to adjust in the next 17 years (17 years being Santer’s minimum time period for measuring climate)
Surface temperature records have been regularly adjusted to create a warming trend closer to climate models now for at least 19 years. Are the adjustments justified? Heck I sure don’t know, all I know is they were needed to keep climate models close to observations.
Bob Osborn says:
“Are the adjustments justified? Heck I sure dont know….”
So then read this very good article:
“Thorough, not thoroughly fabricated: The truth about global temperature data: How thermometer and satellite data is adjusted and why it *must* be done,” Scott K Johnson, 1/21/16
http://arstechnica.com/science/2016/01/thorough-not-thoroughly-fabricated-the-truth-about-global-temperature-data/
David going through a list of all the reasons one might adjust raw temperature data adds nothing to answer the question as to whether the adjustments were justified.
One has to ask why so many adjustments have been made over the years and why all the adjustments have moved towards a steeper trend and closer to model results.
One of the most likely explanations is called confirmation bias. When the observation trend looks too shallow in relationship to your belief system, you look for adjustments that will bring it in line. Any critical person understands that, and thats why CAWG is in dire need of a temperature record they don’t need to manipulate in a way to make it read closer to their beliefs.
Bob Osborn says:
“David going through a list of all the reasons one might adjust raw temperature data adds nothing to answer the question as to whether the adjustments were justified.”
The adjustments are necessary to correct for biases.
How would you prefer to correct for these biases?
Bob Osborn says:
“One of the most likely explanations is called confirmation bias. When the observation trend looks too shallow in relationship to your belief system, you look for adjustments that will bring it in line.”
This simply shows how little you know.
There are *known* biases in the raw data, like the time of observation bias.
These must be corrected for, whether you understand them or not. (It looks like not.)
—
Speaking of corrections, what do you think of this one?
We therefore changed the AMSU5 reference Earth incidence angle (from 35.0 to 38.3 deg.) so that the trends over Greenland and the Himalayas were in much better agreement with the surrounding areas.
David the most common time of day observation error is in the middle of the night and failing to get the coldest hour. Yet the adjustments are always upwards. Yes there are bias’s that need correcting and apparently they have not been. My dad operated a weather station for many years. Assuming an error on the part of the station manager is a bit dumber than a dumb station manager. But it does fit with the politics of the day where some bureaucrat scientist in Washington or on Broadway in New York knows better than the guy in the field doing the actual work.
Bob Osborn says:
“David the most common time of day observation error is in the middle of the night and failing to get the coldest hour.”
Why is it necessary to get the coldest hour?
“Yet the adjustments are always upwards.”
Are they? Says what?
—
Look, it’s obvious the Earth is warming. Ice is melting, and sea level is rising. Or are these macro-indicators faked too?
“Look, its obvious the Earth is warming. Ice is melting, and sea level is rising. Or are these macro-indicators faked too?”
David you are the only one talking about faking anything. I think its clear the earth has been warming since about the year 1700 when the nadir of the Little Ice Age likely occurred at the end of the Maunder Minimum.
Today it is somewhere near its peak and has been for over 20 years. No its not obvious that is still warming, but it is obvious it has warmed at times and it is also equally obviously that it sometimes cools too.
Its not obvious that ice is still melting either. Annual average sea ice coverage has not shown much variation and the largest ice sheet in the world has been gaining ice.
Sea level has been rising for 15,000 years David. Here on the west coast its estimated the original human inhabitants had their shoreline villages out in about what is now about 100 to 150 meters of water about 12,000 years ago. Sea level rise in the 20th century is believed to have risen at a rate of .8 to 3.3mm per year. At the high end estimate thats only 50 meters in 15,000 years. If anything sea level rise has slowed down and is believed to have been slowing for quite sometime. So is any of this fake? It seems the only thing fake is claiming or suggesting its unusual.
Bob, this excellent article explains why most adjustments of modern raw tempertures are upward:
“Thorough, not thoroughly fabricated: The truth about global temperature data: How thermometer and satellite data is adjusted and why it *must* be done,” Scott K Johnson, 1/21/16
http://arstechnica.com/science/2016/01/thorough-not-thoroughly-fabricated-the-truth-about-global-temperature-data/
More:
“2016 will not be s warm as 2015, and 2017 will not be as warm as 2016 etc”
– Salvatore del Prete, 12/3/15
http://www.drroyspencer.com/2015/12/2015-will-be-the-3rd-warmest-year-in-the-satellite-record/#comment-203097
Also, here is my prediction for climate going forward, this decade will be the decade of cooling, DUE TO THE SUN, soi oscillation, volcanic activity, nao,ao oscillations ,pdo/amo ocean
DAVID I said due to the sun. Seems clear to me.
– Salvatore del Prete, 7/5/15
– http://www.drroyspencer.com/2016/07/record-warm-2016-what-a-difference-one-month-makes/#comment-216470
Lol.
But seriously if the temperatures on a global basis (forget about the sun)decline don’t you think your arguments will be proven to be correct?
Not “proven”, but it would be good evidence in support of low climate sensitivity.
Salvatore Del Prete says:
“But seriously if the temperatures on a global basis (forget about the sun)decline….”
But seriously, if a mile-wide asteroid hits Earth tomorrow, don’t you think the Earth will cool?
I like that point: “The radiative forcing still exists in the system, but radiative feedback exactly cancels it out at a new equilibrium average temperature.”
The forcing from the added CO2 since 1900 should give 3.2w/m2, but the temperature rise in the same time would most likely result in nearly the same negative forcing.
It is often not mentioned when we are told of the forcing and its influence on temperature.
yes, sometimes “radiative forcing” is used interchangeably with “radiative imbalance”, but it isn’t.
Imbalance = Forcing + Feedback
In 2011, Choi and Lindzen, using data, provided a climate sensitivity of 0.7. Earlier that year Shapiro et. al. provided a data analysis of solar output in the first half of the 20th century that implies a climate sensitivity of 0.7. Roy’s third analysis above mimics these earlier analyses. All are data-based in contrast to the dozens of computer models quoted so often. I am an experimental scientist. I think it wise to pay attention to the data.
0.7 what?
C, or C/(W/m2)?
K
No one thinks CO2’s climate sensitivity is 0.7 K.
That is precisely the figure published by Choi and Lindzen. I believe their confidence limits were 0.5 to 1.3.
And on one believes Lindzen and Choi.
Yep, Lindzen and Chow have most certainly over-estimated.
There is NO mechanism whereby CO2 can cause warming in a convectively controlled atmosphere.
End of story !!
All the untampered data PROVES that.
Heck even you admit it, with your continual linear trends over NON-CO2 based El Nino steps.
You PROVE IT every time you do it, but are WAY TOOOOOOOO DUMB to realise it.
You KNOW that the ONLY WARMING in the last 38 years since real data has been available, (as opposed to manic fabrication)has come from El Nino events and ocean oscillations
That reminds me.. did you ever get pictures of those weather stations. and all those birds killed by coal fired power stations
or are you STILL RUNNING and HIDING, you cowardly sci-fantasy grub. !
With much respect for the studies of Dr Spencer and Prof. Lindzen, I continue to feel very unhappy that the Hansen-Schlesinger-Dessler paradigm is used to make simplified analyses. The “feedbacks” are added to give a single “net feedback parameter”, which would seem to make all secondary and subsequent effects have one single combined time constant.
I think in accord with this worry, Dr Spencer’s post writes:
But theres a problem with trying to diagnose feedbacks from long-term variations: the radiative response to a temperature change (feedback) needs to be measured on a short time scale, before the temperature has time to respond to the new radiative imbalance. For example, you cannot relate decadal temperature trends and decadal radiative flux trends and expect to get a useful feedback estimate because the long period of time involved means the temperature has already partly adjusted to the radiative imbalance.
For a first approach to a linearized simplification, instead of the Hansen-Schlesinger-Dessler model, one might consider the ordinary mathematical linearized model, with a differential equation of the form
dx/dt = Mx
where x denotes a list of scalar variables including ground surface temperature, and M denotes a matrix of time rate coefficients. The different scalar variables can then have their respectively different time rates.
How to choose the list of scalar variables? No easy thing. One for the temperature of the ground. One for radiation from the ground to the atmosphere. One for radiation from the atmosphere to the ground. One for transporting energy from the ground to the middle and upper troposphere by convective circulation with water phase changes. One for radiation that penetrates the atmosphere and goes direct from the ground to space. One for radiation from the atmosphere direct to space. So far the more difficult ones, such as change in atmospheric optical thickness due to change of water vapour content, and changes in clouds, are not yet on the list!
A diabolical proliferation of variables. But is it so much worse than the problems Dr Spencer is revealing in the Hansen-Schlesinger-Dessler model? At least the ordinary mathematical model may be more physically interpretable. It may more quickly reveal that such simplification is hopelessly unfeasible.
The usual list of “feedbacks”, I think, does not include convective circulation, I don’t know why. It has been said by Murry Salby to be the fastest “feedback”. I have some time ago likened it to bubbles in boiling water on a stove, that stop the temperature from rising significantly above the boiling point. I think this would be non-linear, more of a threshold effect, keeping the sea surface temperature not much above 28 C.
I continue to feel unhappy about this ‘forcings’ and ‘feedbacks’ story. It seems to me to be designed and doomed to fail.
Dr Spencer writes Conceptually, it is useful to view all variations in Earths radiative energy balance as some combination of (1) radiative forcing and (2) radiative feedback. Importantly, there is no known way separate the two they are intermingled together.
He reports that the customary doctrine is to define ‘radiative forcing’ as follows:
Radiative forcing is a radiative imbalance between absorbed sunlight and emitted infrared energy which is not the result of a temperature change, but which can then cause a temperature change (and, in turn, radiative feedback).
And he reports that the customary doctrine is to define ‘radiative feedback’as follows:
Radiative feedback is the radiative response to a temperature change which then feeds back upon that temperature change.
Ptolemy invented a scheme of circles riding on circles that gave a semblance of accurate description of planetary motion. I would describe that scheme as Procrustean: force the data into a preconceived form. At least Ptolemy’s scheme was testable (so I believe, but do not know because I haven’t studied it). It was able to give any desired degree of approximation by being made more and more complicated. It had no trace of explanatory power, but was derived from a belief in circles as somehow perfect. It was eventually replaced by Kepler’s much more parsimonious scheme.
But it seems to me, just looking at them, that the foregoing customary doctrinal definitions for radiative quantities are not even testable. I think Dr Spencer’s post demonstrates that. The definitions seem to have been dreamed up by a committee of spin doctors with no interest in testability.
Causality is the key concept of science. The usual experimental technique for tracing causality is to find an external driver, not mentioned in my just-above post. The driver is varied in time at the whim of the experimenter in order to be sure that is unaffected by factors internal to the system. Such arbitrary variation is of course not feasible in the climate radiation problem. I think that is no reason to abandon the basic idea of the technique. One just needs to find naturally independent drivers. Difficult though this may be, I think it is an ineluctable necessity for a useful investigation.
The driver idea may be written
dx/dt = Mx(t) + f(t),
where f(t) denotes a list-valued function of time, that is arbitrarily prescribed by the investigator, or determined by nature in a way that is believed to be causally independent of the system’s state variables and state functions.
Perhaps some kind person will tell me whether or not the customarily defined ‘radiative forcing’ is regarded as a kind of external driver, or as an adequate investigative substitute for an external driver. It seems to me that it is far from such, since it is defined by state variables of the system under investigation.
Christopher: “Perhaps some kind person will tell me whether or not the customarily defined ‘radiative forcing’ is regarded as a kind of external driver..”
Depends on the source of the radiation. It should help you to draw an imaginary, arbitrary closed control volume at the orbit of CERES where the radiation is measured. Radiation crossing into this control volume from the sun would be the external driver (SW), i.e. an external forcing. Radiation from the surface is internal driver (LW), an internal forcing on the atm.
Say, for example, if in Jan. 2003 CERES measures 240 crossing into the control volume and 240 out (spatial, temporal avg.d). System is balanced in steady state.
Then according to CERES team, in Dec. 2014, there is still measured 240 SW in but the measured LW out (OLR) has declined to 239.11. No longer in steady state, there is an imbalance. System temperatures are then changing.
The imbalance could have been caused by many possible internal processes, say for example an increase in atm. opacity. The surface avg. temperature would then rise in response, emitting more radiation, in part absorbed by the more opaque atm. and in part radiated from the atm. until LW (OLR) is increased from 239.11 across the control volume out to again balance at 240, steady state again achieved at higher surface avg. global temperature. The higher LW being termed in this field as a radiative feedback.
This is as kindly explained by Dr. Spencer in top post: “Eventually, the radiative imbalance cause by the (internal) forcing causes a temperature change that restores the system to radiative balance. The radiative forcing still exists in the system, but radiative feedback exactly cancels it out at a new (higher) equilibrium average (surface) temperature.”
NB: Note that the avg. temperature of the total system does NOT change at 240 in = 240 out in either of the steady state cases, only surface Tmedian increases in the second case with higher atm. opacity. Thus the Tmedian of the upper atm. must then decrease in the second case to keep total system avg. Tmedian constant (energy conservation).
Thank you, kind Ball4, for this post.
It still leaves me puzzled.
For the present problem I imagine the thermal radiation from the sun to be considered a time-invariant parameter, not an external driver. It would make things easier if the sun would kindly vary its thermal radiation from time to time, and then I would see it as an external driver that would be very useful. Because nothing on earth will affect it.
To me, the phrase ‘internal driver’ is a contradiction in terms or oxymoron. And it is a pleonasm to write ‘external driver’, but I just did it for belt-and-braces certainty.
As I presently see it, the IPCC language “forcing” refers to internal state variables that by definition are not permitted directly to be external drivers. For example, CO2 added to the atmosphere would count as an external driver, but not directly as a forcing. It would lead nearly directly to changes D in internal state variables. I would count these initial changes as primary effects of added CO2. I would think of them as persisting unchanged while the added CO2 survives unchanged. For example, changes in the rate of ground-emitted infrared radiation St that penetrates the atmosphere and escapes directly to space. And changes in the rate of ground-emitted infrared radiation Aa that fails to penetrate the atmosphere but is absorbed by it. And changes in the rate of atmosphere-emitted radiation Eu that escapes directly to space. And changes in the rate of atmosphere-emitted radiation Ed that reaches the ground and is absorbed there. Naturally, OLR = St + Eu, and D Aa + D St = 0. And D Eu > 0, and D Ed > 0, and D St < 0. Over time, these quantities will accumulate regionally to change the temperatures of the ground and the layers of the atmosphere.
Initially, just after the step of added CO2, the global radiative effect on the atmosphere Fca could be called the initial radiative atmospheric forcing due to added CO2. Then one would write
Fca = D Aa – (D Eu + D Ed) .
Initially, just after the step of added CO2, the global radiative effect on the ground Fcg could be called the initial radiative ground forcing due to added CO2. Then one would write
Fcg = D Ed .
This would very soon concern me because soon after the initial step of added CO2, the accumulated flows would change the temperatures, and consequently the ongoing flows. The changes in ongoing flows would then be secondary effects, not primary effects, nor drivers. I think they should not continue to be dignified as "forcings". They are just internal state variables. The only external driver considered in this restricted problem would be the surviving added CO2. It would be reasonable to say that the initial forcings also persist as "virtual forcings" as long as the added CO2 persists. They would be virtual quantities, not actually directly measurable. In the case of a continuous driving by continuously added CO2, they would be calculated, not directly measured.
In a nutshell, I would see a "forcing" as a translation of a driver (e.g. added CO2) into a virtual primary internal effect (e.g. D Aa).
Christopher, It is clear you haven’t grasped the usefulness of a control volume. Doing so will reduce your puzzlement. In the field of climate there is little use of control volumes to clarify meaning which is unfortunate, be brave and use them anyway.
The sun is an external forcing to the system inside the control volume whether it varies or not. The sun’s energy crosses into the control volume and is measured, must be accounted.
All…ALL the processes inside the control volume are internal forcings and do not change the control volume energy content of interest unless they affect the measured energy in (albedo) or out (OLR) of the control volume. In the case of 240 in and 240 out steady state the avg. temperature in the control volume is unaffected as the energy content of interest remains constant. Delta U = 240-240 = 0.
In this field an internal process that affects 240 in and/or 240 out is termed a radiative forcing as only radiative energy gets in or out of the control volume. As Dr. Spencer points out: “I didnt invent the climate use of “feedback”, but have to live with the terminology and conventions others are using.” This may be unfortunate but reading in this field requires an understanding of the terminology. You won’t change the field singlehandedly, you must adapt if you want to be understood.
For example, in my case reading about Ocean Heat Content makes me cringe but I know in this field it really means Ocean Energy Content (of interest) as I can see that is the case in the formulae and units.
Thank you Ball4 for your kind care in this. It is interesting how different viewpoints appear. If I understand you, you think of ‘internal’ and ‘external’ in terms of where, spatially, things go or happen. That’s a very reasonable literal reading of the terms, and I have no quarrel with it. But it’s not what I am driving at here. I am thinking of ‘internal’ and ‘external’ in what I now see is a metaphorical way. One man’s metaphor is another’s literal expression.
By ‘internal’ I mean ‘pertaining to a state variable’. By external I mean ‘causally independent of state variables’. Neither term belongs to the lingo of “forcings and feedbacks”. I am thinking in terms of the theory of abstract dynamical systems. I think you get the term ‘control volume’ from a different context: fluxes between fixed defined regions of space, in an engineering conception. By a parameter, I mean a quantity that one does not intend to vary in time in the problem of interest.
Dr Spencer says (1) radiative forcing and (2) radiative feedback. Importantly, there is no known way separate the two … they are intermingled together. He also says … climate researchers have been misinterpreting satellite measurements of variations the Earths radiative energy balance when trying to estimate climate sensitivity. And It all depends upon how you interpret the data.
However customarily established are the terms “forcing and feedback”, I think they need revision, for it seems that they are not yet successful or even clear. I think the reason is that they do not recognize adequately the notion of drivers as distinct from state variables (external and internal factors in my metaphorical terms). This distinction is central to the experimental method in science.
“‘internal driver’ is a contradiction in terms or oxymoron..”
A forcing internal to the control volume is not a contradiction. For example, any internal process permanently increasing the opacity of the atm. intitially reduces OLR (becoming a radiative forcing in climate terms) until the system increases lower temperatures and decreases upper temperatures to regain balance at the orginal OLR with no change in total avg. temperature inside the control volume.
” the IPCC language forcing refers to internal state variables that by definition are not permitted directly to be external drivers.”
As I just explained, internal control volume processes can affect the outgoing radiation (OLR) so the IPCC language of radiative forcing can be understood (without contradiction) using control volumes.
“For example, CO2 added to the atmosphere would count as an external driver..”
The added CO2 is an internal forcing to the control volume system and modulates OLR crossing out of the control volume down until certain temperatures increase and certain temperatures decrease back to steady state (240in, 240out) thus becomes a radiative forcing in this field’s terminology. During the OLR decreased time the added CO2 is indeed a forcing in the field’s terms.
“And changes in the rate of”…various processes… occur while the OLR is changing back to equilibrium thus in the field’s terminology are radiative forcings on the OLR.
“Then one would write Fca = D Aa (D Eu + D Ed)”
I suspect the site has stripped some nomencature, possibly you can adapt.
“..after the initial step of added CO2, the accumulated flows would change the temperatures, and consequently the ongoing flows.”
Meaning change the outgoing flow (OLR) back to equilibrium with sun (ASR), e.g. back to 240in and 240 out. Agreed. In the framework of the control volume, fairly easy to comprehend.
“By ‘internal’ I mean ‘pertaining to a state variable’. By external I mean ‘causally independent of state variables’.”
In basic thermodynamics internal means inside the control volume (internal energy) and external means outside the control volume of interest. Redefining to YOUR convenience will only mean the reader must work harder, this is not fair!
I like less work and will tend to avoid unnecessary extra work. It is the author’s burden to use terms already defined in the field to convey meaning, so we have to live with radiative forcing, feedback, Ocean Heat Content as used in this field & so forth to read works in THIS field. Other fields have their own pre-req.s, e.g. try “antidilutive”, my favorite in accounting,
Ball4, it seems we are conversing. You have written several comments. I won’t try in one post to deal with them all. I will start with a few.
Quoting you:
“internal driver is a contradiction in terms or oxymoron..
“A forcing internal to the control volume is not a contradiction. For example, any internal process permanently increasing the opacity of the atm. intitially reduces OLR (becoming a radiative forcing in climate terms) until the system increases lower temperatures and decreases upper temperatures to regain balance at the orginal OLR with no change in total avg. temperature inside the control volume.”
end of quote.
It seems you are using ‘driver’ and ‘forcing’ as synonyms. I see them as different. ‘Forcing’ is a special term belonging to the customary lingo in this field. ‘Driver’ as I use it is not part of that lingo. ‘Driver’ as I use it refers to something that I don’t see made explicit in the customary lingo. I find that a crippling defect of the current lingo. The current lingo is not solving the problem, and it is reasonable to criticize it.
Also you use the term ‘control volume’. In my limited reading, this term belongs to engineering thermodynamics, but is not part of the IPCC “forcings and feedbacks” lingo. I have no objection to the term ‘control volume’, and I think I understand you when you say it refers to the spatial and material contents of a sphere (near enough) that is described by the orbit of the satellites.
You write “In basic thermodynamics internal means inside the control volume (internal energy) and external means outside the control volume of interest.” Leaving out your parenthetic “(internal energy)” I will re-write this as “In basic thermodynamics internal means inside the control volume … and external means outside the control volume of interest.” To me this is engineering terminology, and I have no objection to it. I am not clear why you put in the parenthesis “(internal energy)”, but at present this doesn’t seem an urgent question, and I won’t ask it. ‘Control volume’ is a term that is used for open system thermodynamics. The idea is that matter and energy and entropy flow in and out of it. It is fixed in space, at least for the context of the problem. It contrasts with ‘control mass’. Matter does not flow in and out of this. It can move around in the space of interest in the problem. Energy and entropy can flow in and out of it. Entropy can be created inside both control volumes and control masses.
In your language, yes indeed, a “forcing” ‘internal to the control volume’ is not a contradiction. But I am not saying that it is. I am saying that ‘a driver dependent on state variables’ is a contradiction in terms. By definition a driver is independent of state variables.
Dr Spencer defines thus: Radiative forcing is a radiative imbalance between absorbed sunlight and emitted infrared energy which is not the result of a temperature change …
This is a function of state variables, and has only an indirect connection with the term ‘driver’. In my language it is an internal (metaphoric usage) quantity by definition simply because it is a function of state variables. Absorbed sunlight is composed of incident sunlight less reflected sunlight. I regard incident sunlight as by custom and near enough a fixed constant for the present problem; I call it a parameter. Reflected sunlight is dependent on the state of the atmosphere including clouds, and on the state of the ground including plants. As I read it, one may think of radiative forcing as a virtual quantity determined by some chosen and nominated driver. I guess implicitly Dr Spencer may be meaning that the chosen driver is added CO2, but that is just a guess, because I don’t think he says so explicitly. It is hard or even currently impossible to reliably calculate virtual cloud quantities.
“I am not clear why you put in the parenthesis “(internal energy)”
Common term in thermo. U = internal energy, U is the internal energy of interest inside the control volume of interest. In steady state 240 in = 240 out, delta U = 0, temperatures are steady. Chaotic, but global avg. is steady.
“‘Driver’ as I use it refers to something that I don’t see made explicit in the customary lingo.”
The sun forcing net of albedo (e.g. 240) is in units of W/m^2 at the orbit of CERES, what are the units of a “driver”? If not different units than forcings, then forcings and drivers are one and the same.
“‘Control volume’ is a term that is used for open system thermodynamics.”
If mass crosses the control volume, then system is referred to as open system. For the control volume of basic interest in climate, there is no mass of interest crossing the orbit of CERES therefore it is commonly a closed system.
An advanced exception would be energetic cosmic particles coming in that can cause nucleation of rain drops to modulate cloud formation. That would be external forcing crossing the control volume coming in changing the system U, internal energy & thus modulating internal temperatures causing climate field invoking the radiative forcing term as OLR would change.
Ball4, it seems you are not interested in my distinction between ‘driver’ and “forcing”. Perhaps we can leave it at that. Thank you for your kind and thoughtful comments.
Christopher, in this field a radiative forcing of the OLR has as a driver CO2 emissions from atm. opacity. There are other drivers that affect OLR like aerosols, halocarbons, NOx. There are also ASR drivers like land use affecting albedo. These are all internal radiative forcings on the OLR and ASR as termed in this field.
You are apparently trying to define some sort of “state variable” as a driver to use in formulae so that “state variable” needs units. If those units are not different than W/m^2 then you just have another radiative forcing on OLR in this field.
I’m trying to make sense of the cloud-induced-noise issue and the regression issue raised by Greg Goodman. I feel what he describes is in fact the same thing you mention:
a) You say the presence of unknown, internal, natural radiative forcing (mostly changes in clouds) will cause a low correlation between between temperature and net flux. I didn’t see it mentioned in this article but iirc a closely linked issue is the different time responses – the ocean mixed layer takes weeks or months to heat in response to a decline in cloud cover, whereas clouds respond in a matter of days to sea surface heating.
b) Greg says if there are errors in measuring the ‘independent’ or horizontal axis, linear regression will always underestimate the slope – giving a low feedback parameter, high sensitivity. This is known as regression dilution.
He seems to think the two issues are separate: ‘it is not an illusion created by the climate system, it is an illusion created by the incorrect application of OLS regression’
But could it be that the ‘errors’ in diagnosing temperature that Greg mentions are the same thing as this cloud noise? In the sense that even if temperature is accurately measured, it will tend to fluctuate far more due to natural, cloud forcing.
If it’s not too much to ask, could you run the regression in the first figure the other way around? With net flux in the horizontal axis. I get the feeling that as long as correlation is low, the slope will tend to get horizontal – so when reversing the regression you might get a high feedback parameter, low sensitivity.
I’ve done this many times. In the presence of very low correlations, regression of X against Y rather than Y against X gives a very large regression slope (after you take it’s reciprocal, so the units remain the same). What seems to work reasonable well is the square root of the product of the 2 regression slopes (the geometric mean). As I said in my post, I didn’t want to go down that rabbit hole.
Hi Dr Spencer
I was just wondering if you’ve considered publishing a response to the paper Murphy and Forster 2010? I did read the blog critique of it that you published on this website http://www.drroyspencer.com/2010/07/can-climate-feedbacks-be-diagnosed-from-satellite-data-comments-on-the-murphy-forster-2010-critique-of-spencer-braswell-2008/
However, I was wondering if you’d considered addressing the paper in the peer reviewed literature?
Thanks
Adam
I’m sure we thought about it at the time, but we have no plans to submit anything. Those who are actually interested in the issues can examine our original paper and their rebuttal and make their own conclusions based upon the evidence presented.
In the battle of who “has the last word”, we will likely lose that one because any paper rebutting us is fast-tracked into publication and seems to sail through peer review easily. Our papers are often delayed and a single poor review out of, say, four can kill it.
As our careers wind down (Spencer, Braswell, Christy) we are becoming more selective of what we spend our time on.
http://www.realclimate.org/index.php/archives/2016/09/the-snyder-sensitivity-situation/
and
http://www.realclimate.org/index.php/archives/2016/09/why-correlations-of-co2-and-temperature-over-ice-age-cycles-dont-define-climate-sensitivity/
Dr Spencer:
Many years ago I wrote to you and Dr. Lindzen with regard to his Lindzen/Choi 2011 paper. He used a 3 month moving average pre-filter of the data and got a particular result for sensitivity. I suggested he should also use a 12 month moving average(which also removes possible seasonal effects), and compare the results. I argue that if the results are valid, then the sensitivities should be similar. The long term sensitivity that we seek should not change grossly with integration period. If the results change then they are not reliable or useful for long term prediction. This is a direct and (in principle) simple test.
My very preliminary and questionable results indicated the results did change grossly. I don’t think anything along these lines has ever been done. Given that Dr Lindzen’s paper estimates the lowest observationally based sensitivity yet published(?)(i.e. an important lower bound), don’t you think such a test is warranted?
without knowing the details, I will point out that computing feedbacks from observational data requires large enough variations in temperature and radiative flux to get a signal to analyze. In the satellite record, most of that signal is from ENSO, and 12-month averaging might well destroy much of the signal. There are no substantial longer-term signals in the data to analyze feedback from and, as I and Lindzen have pointed out, the variations have to be short enough for there to not have been a re-equilibration….you need to measure a temperature change and its radiative response, but before the radiative response has time to damp the temperature change substantially.
Yes the signal to noise may degrade, but there would probably be enough signal to get a result, and check for consistency.
I hope you are not saying this test of validity should not be done because it MIGHT be too noisy.
How often can a definitive test like this be done in climatology…I would think any researcher should jump at the chance. I continue to think this is an important test of a crucial paper.
Dr Spencer,
“So, what the CERES data tells us about feedbacks entirely depends upon how you interpret the data even if the data have no measurement errors at all (which is not possible).”
A good start. At least a scientist with the courage to say “I don’t know – but I’ll keep trying to establish a few facts.”
I hope that’s what you’re saying, anyway!
Cheers
Thanks Roy, this was informative.
Anyone that uses a trend from data with an r2 of 0.03 is abusing that interpretation. I dont know enough to say otherwise, but unbelievable if any part of the climate sensitivity in models or theory came from this sort of method. Literally interpreting noise.
I have to say another thing for all the watermellons out there (political based believers in the climate change hypothesis- green on outside red inside). The selective citing and funding of science in the climate field has distorted the science to nearly meaningless. Along with papers mentioned above that are relevant but ignored, also consider this paper (link below). It explicitly shows that cosmic rays influence climate at low latitudes, it was published in nature, it has been cited only 6 times, and this implies that the more than 100 IPCC models that all exclude solar magnetics as a climate force are missing a first order climate driver. Im not even saying that a significantly stronger sun should be the base case, but not including the role of galactic cosmic ray influx and solar magnetics in any of the models is ABSURD given the breadth of literature supporting the relationship.
http://www.nature.com/articles/srep05159
Submit your own paper asap. Show your proofs to the world.
Confused Jane. Ironic i just did finish another paper on the signal of solar magnetics in the paleoclimate record. If i share a pre pub then will u read it?
Yes
http://publisci.com/discussion.php?d=171
This is partially a test of a webpage that I am developing called PubliSci.com. If it doesn’t work (I know Ref Cit are not included yet) then I will give you another version.
I’m looking forward to the feedback about the paper. 🙂
Here’s a little song for Jane, while she’s reading..
https://www.youtube.com/watch?v=FIPWNtjUflA
Here you can see the currently observed changes in the magnetic field of the sun. It looks very interesting.
http://www.vukcevic.talktalk.net/LFC6.htm
And this graph from the University of Stanford.
http://wso.stanford.edu/gifs/Polar.gif
A big change is happening! Its sad that each of us get about 11 yr 7 solar cycles in an average lifetime. Just not enough time, but we are lucky we may see a big transition from a prolonged max to a minimum (although the sun is difficult to predict).
Ooops only get 7- 11 yr cycles.
Aaron S says:
“A big change is happening!”
According to what evidence. Every month I plot total daily solar irradiance, and there is nothing unusual about it whatsoever.
“Just not enough time, but we are lucky we may see a big transition from a prolonged max to a minimum”
Why should we expect that?
And why would it matter? It won’t:
Papers that find a minimal impact from a future grand solar minimum:
Feulner and Rahmstorf (2010)
http://onlinelibrary.wiley.com/doi/10.1029/2010GL042710/abstract
Meehl et al (2013)
http://onlinelibrary.wiley.com/doi/10.1002/grl.50361/abstract
Maycock et al (2015)
http://centaur.reading.ac.uk/40588/
Paper 1 says: “The results show that a large decline in solar activity over the 21st century could have important impacts on the stratosphere and regional surface climate.” And that is not including magnetics. Seems odd to use that as evidence to the contrary. let me read others.
Paper 2 says: “Thus, a future grand solar minimum could slow down but not stop global warming.”
And again no magnetics considered
Feulner and Rahmstorf (2010)
http://onlinelibrary.wiley.com/doi/10.1029/2010GL042710/abstract
Meehl et al (2013)
http://onlinelibrary.wiley.com/doi/10.1002/grl.50361/abstract
Maycock et al (2015)
http://centaur.reading.ac.uk/40588/
All 3 papers disregard magnetics and cloudiness. Is this natural climate forcing An inconvenient truth for you natural climate change deniers?
David, I do actually agree we dont know what the next cycle will be. It is difficult to predict the quasi periodic sun at the longer period cycles (22 and 11 SSN are much more periodic. However it is safe to say we have left the sustained max from 1950 to 2000 and are back to at least normal activity.
Aaron S says:
“And that is not including magnetics.”
What do you mean exactly by “magnetics?”
And how do they influence climate?
Dave u know this right? Just dont believe it? The sun has a dynamic magnetic field. It influences climate by changing cloudiness and thus albedo of the atmosphere. It does this because increasing solar activity increases magnetic field, more magnetics less galactic cosmic rays, less GCR less clouds, less cloudiness less albedio more warming.
Aaron, here’s what paper #1 actually says:
“Here we use a coupled climate model to explore the effect of a 21st-century grand minimum on future global temperatures, finding a moderate temperature offset of no more than −0.3C in the year 2100 relative to a scenario with solar activity similar to recent decades. This temperature decrease is much smaller than the warming expected from anthropogenic greenhouse gas emissions by the end of the century.”
http://onlinelibrary.wiley.com/doi/10.1029/2010GL042710/abstract
Paper 1 i read was your paper 3 in sequence. Still it lacks the role of solar magnetic field and is incomplete.
Aaron S says:
“David, I do actually agree we dont know what the next cycle will be. It is difficult to predict the quasi periodic sun at the longer period cycles (22 and 11 SSN are much more periodic. However it is safe to say we have left the sustained max from 1950 to 2000 and are back to at least normal activity.”
Yes — TSI averaged over a solar cycle has been slowly decreasing since the 1960s.
Hence it isn’t responsible for modern warming.
TSI isn’t what’s doing the solar warming, Appell. ASR is. You know, the solar heat.
So when you claim that ‘TSI has gone down, hence the sun hasn’t done the warming,’ it only shows you don’t have a clue …
Kristian, what is ASR?
“You know, the solar heat.”
What is the definition of “solar heat?”
ASR is the opposite of OLR. Incoming heat to the Earth system vs. outgoing heat from the Earth system.
ASR: absorbed solar radiation (net sw)
OLR: outgoing longwave radiation (net lw)
ASR = TSI minus reflected SW (albedo)
Dave,
The idea that the sun declined slightly during an abnormal max thus can not explain warming is absurd. It is regurgitated from skeptical science blog. I’ve debated on there with them.
Simply put. The slope of increase in solar activity from 1905 to 1950 is much greater than the slight decline from 1950 to 2005, and the entire interval was a solar max and much stronger than pre 1900 sun (even in the adjusted SSN, but definitely in the radiogenic Be and C isotope records). If you are to simple minded to understand the potential for lags, then Id be shocked. SO more than likely you are using a double standard- there is a major hiatus in global warming relative to models from forcing from GHG that is commonly explained by a lag in literature, but you disregard the same process for a delay in response to the sun. Total BS. It is that simple man. YOu can’t use 8 yr old logic in science and I can’t believe you are willing to suggest that. You are better than that man.
Aaron s …”It explicitly shows that cosmic rays influence climate at low latitudes…”
I think science in general is due a renovation once the effect of subatomic particles in the atmosphere are better understood. The latest is the discovery of the way neutrinos can behave.
Einstein once claimed that if Dayton Miller’s theories on an aether come true, his theories on relativity are null and void. Neutrinos may be that aether no one suspected had an existence. The Mickelsen experiment that claimed to disprove an aether may not have had instruments sensitive enough to detect them. It has only been recently that the peculiar behavior of neutrinos has been revealed. Apparently, so-called empty space is teaming with them.
A long time ago, Syun Akasofu did pioneer work on the solar wind. In one of his books he described the effect of the interaction of the solar wind, which is essentially raw electrons and protons, with the Earth’s magnetospehere. He claimed the solar wind induced voltages and currents into the Earth’s atmosphere that ran through the atmosphere and through the ground and oceans.
I like the thought of a potential quantum influence on climate… just so much to be learned at that scale. Thanks for the perspective. Have u seen the literature that at a grand scale the Earths climate (ice ages) was thought to be dependant on where we are in galaxy. As i googled it for a link i found that it appears the hypothesis has fallen out of trend now, but it remains an interesting thought.
http://www.universetoday.com/33538/past-climate-change-cannot-be-tied-to-earth-passing-through-galactic-plane/
Gordon: Neutrinos aren’t an ether. For one thing, they hardly interact with matter at all.
You’re posting physics gibberish.
David Appell…”Neutrinos arent an ether. For one thing, they hardly interact with matter at all”.
Don’t you have a citation from realclimate or SOD to back you up?
Gordon: Again, spend 20 minutes reading about the elementary properties of neutrinos.
Dave true neutrinos are mostly inert even at a quantum scale, but how about the protons traveling at almost the speed of light through space until they slam into molecules and create a series of charged products that just like the feynman diagrams predict charge ions in the atmosphere. These charged ions then nucleate water droplets and increase cloudiness. More of the gibberish? Thats not what CERN thinks… they have published in nature this is real. If u would just try it you would like it… u know its a great integration of quantum physics and climate… come to the dark side! DAVE the skeptics are calling u!
What about such protons? Have they suddenly increased since 1970, after which most global warming has taken place?
The CERN CLOUD results certainly do not establish the Sun or cosmic rays as the source of warming. In fact, here is what those scientists themselves wrote in their August 2011 press briefing:
“This result leaves open the possibility that cosmic rays could also influence climate. However, it is premature to conclude that cosmic rays have a significant influence on climate until the additional nucleating vapours have been identified, their ion enhancement measured, and the ultimate effects on clouds have been confirmed.”
http://press.web.cern.ch/press/pressreleases/Releases2011/downloads/CLOUD_SI_press-briefing_29JUL11.pdf
There is a great deal more to be proven in the inference chain for the Svensmark hypothesis to be accepted. Plus there is the fact that there has been no overall trend in cosmic rays in the last 60 years.
And even if the Svensmark hypothesis applied it would not disprove or nullify the warming properties of CO2, which are quite strong — it would only mean we might face even *more* warming in the future.
http://www.nature.com/nature/journal/v533/n7604/full/nature17953.html
Dave catch up dude. It isnt 2010. Science progresses. CERN released a new paper.
Dave, there are lots of new papers.
1. Nature Dongge Cave strong solar connection to cosmic rays.
http://www.nature.com/articles/srep05159
2. Pnas 9400 yr cosmic ray record correlated with asian monsoon
http://m.pnas.org/content/109/16/5967.full
At what height above the Earth begins stratosphere?
Above the equator is visible increase in ozone of about 18 km above the earth. Graphics below.
http://www.cpc.ncep.noaa.gov/products/stratosphere/strat-trop/gif_files/time_pres_TEMP_MEAN_ALL_EQ_2015.png
Above the Arctic Circle increase ozone it is visible from approximately 8 km above the Earth. Graphics below.
http://www.cpc.ncep.noaa.gov/products/stratosphere/strat-trop/gif_files/time_pres_TEMP_MEAN_ALL_NH_2015.png
The increase in temperature in the stratosphere indicates the presence of ozone, an optionally N2O (the gases in the stratosphere, radiate infrared).
Changes in temperature in the stratosphere means changes the density of the gas and do not affect the temperature of the tropopause.
The tropospause is a boundary, and so has zero volume, so talking about its temperature is meaningless.
Tropopause is a boundary LAYER.
Your gross ignorance precedes you, yet again.
But gross ignorance is all you have, isn’t it appell-worm.
Hi Roy. It would be interesting to get Andy Dessler’s take on your Figure 3. I seem to recall he did a couple of posts on here a wee while back, so it would be good to have his comments. I think he might be able add something useful to the discussion whatever the position he comes from. Rgds Terry
I suspect he would respond, “that’s not how it’s done”. I’ve gone round and round with him before, and I really can’t tell whether he’s avoiding the issues I raise, or just doesn’t understand them.
As I understand him, Dessler claims that all radiative change is the result of temperature change, even if at some previous time, and therefore feedback can be diagnosed in the usual manner. (This is to rebut my claim that temperature change can result from radiative change..e.g. cloud variations…which decorrelates the data). But when I say, “OK then, do your regressions with a time lag (as Lindzen has done) and gets strong negative feedback”, I get no response from him.
“I get no response from him.”
That really puts off when people don’t have time to either think about a question or guts to admit they have caveats. Having caveats is OK, pretending they don’t exist is not.
Lately I have been reading scientific literature of certain narrow topics very extensively, and have noticed correspondents don’t return to my email (as I’m unknown to them) if I have questions. If the correspondent is a paid university staffer whose task is the correspondence, then yes, but doctors themselves don’t feel like answering every email.
As I know the people can be busy, I write only to the point and only pose clear, closed questions very much related to the paper itself. The authors are still too busy to talk about their paper. They’re already catching the next fish.
Roy…”This is assumed to be causing warming, which will then cause feedbacks to kick in and either amplify or reduce the resulting warming”.
You referred just before this quote to the engineering definition of feedback. Is there any other kind?
A common mistake with feedback is that it can amplify or attenuate. Feedback is part of a system and not the driving force which is generally an amplifier as in an electronic amplifier with feedback.
Please don’t confuse that with the +ve/-ve feedback in servomotor systems. Those are correction voltages, not true feedback, even though the correction voltage is fed back in a sense.
There are very few systems that can amplify a signal without an amplifier in the system to produce gain. Without gain, there can be no positive feedback. About the only natural example of positive feedback I can think of without an amplifier is the resonance in a harmonic system.
The Tacoma Narrows Bridge tore itself apart and collapsed due to wind blowing through its undamped suspension cables. The amplifier was natural resonance, not feedback.
In an electronic amplifier for audio circuits, feedback is always negative. Positive feedback produces instability and oscillation. Of course, controlled oscillation is used in many applications and an electronic oscillator is an amplifier.
Negative feedback is used to essentially clamp the output to the input over the audio spectrum and broaden the frequency response. If you introduced positive feedback, the amplifier would essentially burn out it’s output transistors.
In summary, it is an amplifier that produces the gain for which many people mistakenly give positive feedback the credit. Without gain, there can be no positive feedback and the atmosphere has no gain device.
Gordon, yes I have had this discussion with others, especially Christopher Game who sometimes comments here. I didn’t invent the climate use of “feedback”, but have to live with the terminology and conventions others are using.
The effect of radiative forcing on temperature is always damped by the Planck effect, so I suppose that it would have been more proper for climate researchers to have talked about strong damping (little temperature response) or weak damping (large temperature response), but I suppose they decided “feedback” was sexier.
But remember, how we talk about it does not change the equations in the climate models. Models do not specify a feedback, nor do they use any kind of “feedback equation”. People HAVE used a feedback equation to try to illustrate the concept of feedbacks in the climate system, but I really don’t pay attention to that because the models do not depend upon those equations.
“Models do not specify a feedback, ”
However, they can be tuned to yield a particular sensitivity.
Absolutely. Look TCR in CMIP5 models here:
http://www.thegwpf.com/matt-ridley-global-warming-versus-global-greening
And notice how many have TCR 2 and not 1.9 or 2.1. Random? I have no real clue, but the spike looks like it could be something else.
MikeN says:
“However, they can be tuned to yield a particular sensitivity.”
Prove it.
You can’t.
Roy…”I suppose that it would have been more proper for climate researchers to have talked about strong damping…”
Roy…I seem to remember you saying at one time that positive feedback in climate science is a not-so-negative negative feedback. That would fit better with what you seem to be saying about damping.
However, Hansen’s tipping point can meaning nothing more than true positive feedback. Hansen et al seem to believe there is a real positive feedback acting and that it is capable, without an amplifier, of increasing atmospheric temperatures exponentially beyond what the atmosphere is warmed by solar energy.
If that was the case, the amount of natural CO2 in the atmosphere should have created a runaway greenhouse effect long ago.
“Models do not specify a feedback, nor do they use any kind of feedback equation”.
I would hope not with the way mathematician/modeler Gavin Smith botched the feedback equation.
See halfway down this article under “Gavin Schmidt On Positive Feedback”.
http://www.rocketscientistsjournal.com/2006/11/gavin_schmidt_on_the_acquittal.html
Gordon Robertson says:
“If that was the case, the amount of natural CO2 in the atmosphere should have created a runaway greenhouse effect long ago”
Why?
David Appell…”Why?”
I am not really claiming a constant level of CO2 at 0.04% would cause a runaway greenhouse effect, I am claiming that if the AGW theory is predicting that, as Hansen did with his tipping point theory, that the runaway should have happened already.
We have not deviated appreciably from 0.04% CO2 for millenia. Why should the addition of a fraction of that value, as claimed by the IPCC in TAR for ACO2, change anything?
Gordon Robertson says:
“I am not really claiming a constant level of CO2 at 0.04% would cause a runaway greenhouse effect, I am claiming that if the AGW theory is predicting that, as Hansen did with his tipping point theory, that the runaway should have happened already.”
Why?
A genuine amplifier has a power gain element, that has arbitrary access to an external source of power, such as a battery. If the battery goes flat, the device doesn’t amplify.
Often the power gain element itself has erratic and non-linear gain. H.S. Black was struck by the idea that negative feedback could greatly ameliorate these two defects. Since then, most amplifiers use it.
Electronic feedback takes a sample of output current or voltage back to the input, as current or voltage. Thus there four kinds of feedback. Depending on which are used, there are sixteen (2^4) kinds of feedback amplifier (counting no feedback as one kind). For examples, one can make an accurate transconductance amplifier, or one can make a power gain amplifier with input and output impedances accurately fixed by feedback without the wastefulness and noise of impedances in the signal path. Ernst Nordholt is the originator of this complete classification.
With negative feedback, the greater the loop gain, the better the improvement of accuracy and linearity. With positive feedback with loop gain magnitude less than unity, special transfer functions can be achieved. When positive feedback has loop gain magnitude greater than unity, the transfer is unstable and draws power from the battery till overload, and the device doesn’t work as a useful amplifier; this is the source of the warmist propaganda’s “tipping point” fib, even though there is no power gain element in the atmosphere.
Passive resonance is not amplification because ‘passive’ means ‘no power gain’. Passive resonance is about time delays, not power gain. Likewise, effects in the atmosphere are about time delays, not power gain.
This theory of feedback makes no sense if there is no power gain element. But the warmist propaganda uses the words anyway, because, as Dr Spencer says, they are sexy, particularly the “tipping point” fib.
My remarks just above presuppose the context set by Schlesinger’s citing of Bode’s 1945 textbook on negative-feedback amplifiers.
Christopher Game…”A genuine amplifier has a power gain element, that has arbitrary access to an external source of power, such as a battery”.
Put another way, without battery/power supply current through the output transistor, there can be no power gain. Battery/power supply current is the supplier of gain current/voltage.
A gain device, whether it is voltage controlled like a vacuum tube or a FET (Field Effect Transistor), or current controlled like a BJT (Bipolar Junction Transistor) achieves gain by controlling a much larger current from the power supply with a much smaller current/voltage at the input.
Positive or negative feedback adds to or subtracts from the input signal which is then amplified.
In the vacuum tube, a grid, which is a cylindrical mesh in close proximity around a heated cathode, a source of electrons, can use a small voltage to control a relatively larger electron current between the cathode and the anode. The voltage developed over a plate resistor between the plate and the power supply, produces the gain even though the active device, the tube, controls the current that produces the gain.
Transistors operate in a similar manner although the mechanism of control in a semiconductor is not as obvious. A FET acts similarly to a tube in that a voltage controlled channel controls the current through the channel.
There is a problem when you compare temperature to TOA balance. “So far our analysis has not considered the time scales of the temperature and radiative flux variations”
The temperature on Earth, if stable, could have any value higher than some minimum, and the TOA net balance would be 0.
A balance different from 0 means either cooling or heating of the earth.
Would it help to look at the trend in temperature rather than the actual temperature?
You once gave an example with a house with a constant heating power inside. The lost power from the house must in the end equal the internal power. If you put more insolation on the house the lost power drops until a new temperature inside gives out the same power through the insolation.
I know it is not so simple for the earth, because the power source is the sun, and it has to pass the atmosphere and clouds, so the power source is not constant, neither is the insolaton (clouds again).
Fools rush in where angels fear to tread. I am such a fool, so here goes. I am surprised to read Dr Spencer’s definition of radiative forcing. His post says:
Radiative forcing is a radiative imbalance between absorbed sunlight and emitted infrared energy which is not the result of a temperature change, but which can then cause a temperature change (and, in turn, radiative feedback).
For example, our addition of carbon dioxide to the atmosphere through fossil fuel burning is believed to have reduced the LW cooling of the climate system by almost 3 Watts per sq. meter, compared to global average energy flows in and out of the climate system of around 240 W m^-2. This is assumed to be causing warming, which will then cause feedbacks to kick in and either amplify or reduce the resulting warming.
Perhaps misguided, I would define radiative forcing as the increase of radiative heating (aka reduction of radiative cooling) of the climate system by added carbon dioxide. This quantity is not derived from CERES data. Practically independent of CERES data, it is derived by calculated simulations of atmospheric radiative transfer, and measured atmospheric carbon dioxide. It varies on an annual cycle. I think the annual cycling is deliberately removed by Dr Spencer’s method.
In my proposal, radiative forcing is an external driver. It is not affected by internal system fluctuations. It is thus conceptually far from the view of radiative forcing expressed in Dr Spencer’s post. Perhaps he may very kindly tell me the reason for that view, before I make more of a fool of myself. I may say why I like my proposal. It seems to offer a complete and water-tight separation between “forcing” (that horrible IPCC neologism for the primary effect of added CO2) and “feedback” (another horrible IPCC neologism, for the secondary effects of added CO2). Admittedly it is not derived from CERES data, but I think such driver independence of CERES data is a logical necessity to solve the present problem.
A potent objection to my view would be that the annual CO2 cycling is driven by temperature changes and is therefore not independent of the CERES processes, however much I might wish it to be so. I don’t know how to address that objection.
Christopher, I think the answer is you are begging the question, and not understanding the argument being made.
MikeN, perhaps you may expand on this a little?
The point that underlies my comment is that an external driver is needed for tracing causality. An external driver should be independent of the internal dynamical variables. This means that its cross-correlation time course for negative lags should show zero values, and for short positive lags significant non-zero values, which would decay to zero for longer positive lags. Oscillatory time courses must always be watched for, and can vitiate the analysis.
Internal pseudo-drivers usually have cross-correlation time courses with large values for both positive and negative lags, and usually are oscillatory. It is usually, therefore, practically impossible to find causal linkages with them.
I think the main point that Dr Spencer is making here is that these maxims are illustrated in his analysis of the CERES data. For example, he writes So, what the CERES data tells us about feedbacks entirely depends upon how you interpret the data even if the data have no measurement errors at all (which is not possible). And In other words, the different directions of causation between temperature and radiative flux involve very different time scales, and that will impact our interpretation of feedback. And some combination of (1) radiative forcing and (2) radiative feedback. Importantly, there is no known way separate the two they are intermingled together.
One may wonder can ENSO be regarded as an external driver?
Christopher Game…”Perhaps misguided, I would define radiative forcing as the increase of radiative heating…”
Nothing wrong with admitting one is a fool. I’ll join you.
There are two theories in AGW. Physicist/meteorologist Craig Bohren, in his book Atmospheric Radiation, describes them as both models. One of them is the heat trapping mechanism to which Roy refers and the other is a model of two surfaces interacting with each other through radiative heat transfer.
Bohren argues that the heat trapping model is a metaphor at best, and at worst, plain silly. He argues that the theory is overly simplistic and that photons of IR are not errant schoolboys being corralled by CO2 molecules as a truant officer.
Gerlich and Tscheuschner argued from a POV based on quantum theory that surface IR photons cannot be described by a straight vector field but would require Feynman diagrams based on quantum theory. From that perspective it’s not possible to visual a heat trapping blanket.
The heat trapping theory is based on a thought experiment, not measurement.
The other theory, according to Bohren, is more plausible, but still a theory. It claims that IR absorbed by CO2 molecules can be back-radiated to the surface to somehow raise the surface temperature produced by solar radiation.
Many of us have argued that such a theory contradicts the 2nd law in that a cooler surface is transferring heat to a warmer surface that warmed the cooler surface. G&T described that theory as perpetual motion.
I have pointed out to Roy that his own data sets at UAH contradict either theory.
Dear Gordon, as I wrote above, fools rush in where angels fear to tread. I am likely foolish in answering your post.
One man’s metaphor is another’s categorical expression. I find Bohren very chatty and habitually careless with language. Some of his stuff is self-contradictory and therefore at least partly wrong, and occasionally it is nonsense. I suppose you are referring to Section 1.6, pages 31 to 37? I wouldn’t say that either of his stories to which you refer is a thorough exposition of a definite theory. As a teaching exercise, it is chatty stuff. So I won’t try to criticize it in detail.
As for the second law. You are talking about a deduction from the second law, not immediately and directly about the law in its general form. You refer to a statement that “a cooler surface is transferring heat to a warmer surface that warmed the cooler surface”. This is at face value a statement about the historical course of a process that continues indefinitely, not about a simple thermodynamic process, that is triggered by a thermodynamic operation of removing a wall or constraint between two systems, and that thereupon takes the joint system from an initial state of thermodynamic equilibrium to a final one. Obviously the statement abuses language and hardly has a definite meaning. It is so muddled that it does not call for detailed comment.
I think we all agree as follows. One may consider two bodies separated by a wall that does not allow any transfers between them, and are in a thermodynamic equilibrium under that constraint, having different temperatures. Then a thermodynamic operation changes the wall so that it passes heat as radiation, only partly obstructed by matter or distance, but continues to completely obstruct all other transfers, and leaves the wall perpetually so. This triggers a process of radiative heat transfer from the hotter to the colder body. Thereby the entropy of the joint system is increased.
This thermodynamic story does not consider the details of the course of the transfer. That is the nature of thermodynamics.
Prevost’s theory of exchanges began the history of radiative transfer theory. In a radiative transfer, there are always one-way component radiative fluxes going both ways. The Helmholtz reciprocity principle observes that at thermodynamic equilibrium the partial obstructivity of the radiative pathway between the bodies is the same for both senses of traverse, for both one-way component fluxes . The net transfer is governed by the initial temperature difference between the bodies. At the final thermodynamic equilibrium, they have the same temperature, and continue to exchange one-way fluxes, though heat transfer has ceased. The net transfer of the process may be small in comparison with the accumulated amounts of the two one-way component fluxes that constitute it.
The quantity of heat considered by the second law is the net transfer. The law says nothing about the separate accumulated amounts of the two one-way component fluxes, nor about the two one-way component fluxes themselves.
This was understood by Prevost though not as a version of, or deduction from, the second law. The radiative transfer theory that his work led to is sound and reliable and well verified by experiment.
Christopher…I appreciate you taking the time to respond but there are a few things you claim with which I cannot agree, nor can Clausius. He told me he doesn’t mind me speaking on his behalf as long as I give him credit. 🙂
You said, “The quantity of heat considered by the second law is the net transfer…”
and, “Then a thermodynamic operation changes the wall so that it passes heat as radiation…”
Clausius said nothing about net transfer. If net transfer applies in radiative transfer then it should apply to conduction and convection as well, and it does not. Heat is transferred in one direction only, without compensation, and that applies equally to radiation.
Net transfer in a steel rod heated by a flame on one end implies a two way transfer from the cooler end to the warmer end and vice versa. that is nonsense. There are no special conditions for the 2nd law as applied to radiation.
In your two way radiation flow you are relying on presumptions that many modern scientists presume based on consensus. The equations of Boltzmann, Kircheoff and Planck apply to theoretical cavity resonators which are better modeled by the temperatures and radiation spectra of stars. I would like to see serious confirmation of those equations with the radiation in our atmosphere.
I don’t think a two way radiative transfer applies in our atmosphere. I base that on a claim of Bohr that only EM of certain frequencies and intensities can be absorbed by a body at a specific temperature. If my interpretation of Bohr is correct, the surface does not have to absorb IR from a cooler atmosphere, nor does a warmer body in proximity to a cooler body necessarily have to absorb IR from it.
Why should it? The energy level of an atom is related to the energy state of it’s valence electrons. To force them to a higher energy level, hence to warm them, you must add energy of a specific intensity and frequency. There’s no reason that IR from a cooler body, lacking the required intensity and frequency should affect the energy state of the valence electrons in a warmer body.
With such a setup, the hotter body would get warmer and warm the cooler body more. The cycle would eventually lead to perpetual motion. That’s exactly what one of the AGW theories suggests and it’s the basis of Hansen’s tipping point theory.
We know with hydrogen that it absorbs and emits at certain discrete frequencies. That’s how it is identified with a radio-telescope. I would like to know at which frequencies and intensities IR from ACO2 can be absorbed and transmitted.
We know basically what spectra CO2 has but we don’t know for sure if IR from CO2 at 0C can be absorbed by the surface at +15C. We are also not taking into account the inverse law by which EM fluxes dissipate with distance. According to Woods, circa 1909, surface radiation would be ineffective more than a few feet above the surface.
You are making the same mistake as others who confuse infrared energy with heat. When heat is transferred radiatively, the IR energy is not thermal energy. Heat cannot be transferred physically without mass and it gets transferred from body to body by radiation in name only. The transfer does not involve the transfer of mass and heat is related directly to mass, as in atoms and molecules.
If one body is at a higher temperature that means it’s atoms are more highly energized (higher kinetic energy) than the atoms in a cooler body. It also means the thermal energy, which is the heat, is at a higher level of energy. When the hotter atoms emit IR, they cool, and when the atoms in a cooler body absorb that IR, they warm.
Therefore heat has been effectively transferred but the associated atoms have gone nowhere. Heat does not flow with IR and it can be transferred only in one direction. Therein lies a clue that IR from a cooler body does not warm a warmer body.
Clausius made it very clear that a cooler body cannot of itself warm a warmer body. That is the 2nd law. By ‘of itself’ he explained there must be compensation for heat to be transferred from a cooler body to a warmer body.
He did explain that in circumstances where independent radiators are in proximity, the cooler radiator can never transfer more heat to the warmer radiator than vice-versa, but that is a special case that does not involved two bodies radiating against each other. It’s a reference to situations in a heat engine.
Furthermore, he made that statement with reference to compensation, implying that a cooler body could transfer energy to a warmer body only if it is compensated immediately for the loss of heat.
In the surface-atmosphere model, the surface is an independent radiator and the GHGs in the atmosphere are dependent radiators. The GHGs are theoretically warmed by the interception of IR emitted from the warmer surface.
I think Bohren is quite correct in claiming the trapping of that massive surface flux by a pithy amount of CO2 molecules is damned silly. That’s especially true when the complexity of the flux field cannot be measured or seen. It is presumed by alarmists that the IR flux from the surface is a straight vector field and has a one to one relationship with CO2 molecules. There’s not the slightest proof for that.
The notion that the same pithy amount of CO2 can back-radiate enough IR to affect the surface temperature is even sillier.
Dear Gordon, I have said what I think. You disagree. I don’t expect to change your mind.
☺ =
that is ☺ = 🙂
I forgot to mention that the two bodies are not permitted to make any other transfers than the ones mentioned. In other words they are isolated apart from the heat transfer that is mentioned.
Christopher…”I forgot to mention that the two bodies are not permitted to make any other transfers than the ones mentioned. In other words they are isolated apart from the heat transfer that is mentioned”.
I have a problem with thought experiments in general. I am not knocking your use of them but there are so many intangibles that are often missed.
Take the thought experiment of the twin paradox. Speaking of a paradox, Chico Marx asked, “Why a pair of ducks, why not a pair of chickens or a pair of geese?
One of a set of twins leaves the earth at the speed of light and returns later to find his twin has aged and he has not.
This is a perfect example of how the mind is affected by illusions. We presume humans age based on time whereas they age due to cellular changes. The cells change due to chemical issues, not time.
The speed at which the traveling twin travels has no bearing on how they will age. When he returns he will be exactly the same biological age as the twin who remained. There is nothing about traveling at the speed of light that affects the way human cells age.
In fact, there’s no such thing as time. It is an illusion created by the human mind in which the human has ordered his thoughts chronologically somehow and began believing the thoughts, as memories, represented a dimension of time.
There is little mention of mechanical clocks before 1300 AD. Prior to that time (excuse the illusion) was often kept by a sundial which revealed the true source of time, the Earth’s rotational periodicity. Still our minds were so full of illusions we thought the movement of the shadow on the Sun dial was due to the Sun’s moving across the sky.
Imagine the Sun revolving around the Earth.
The real impetus to develop an accurate clock was to measure longitudes in sailing. Latitudes could be accurately calculated using the Sun’s angle with the horizon at a particular time of day (there’s that illusion again). However, longitudes depended on keeping accurate time as one progressed. Also, the time had to be synchronized with a standard time in Greenwich, England.
To this day, people stuck in the illusion will insist time is real but they just can’t demonstrate it. People talk of space-time curvature using a second we invented and a space we defined using dimensions measured in metres and degrees we invented.
When you use thought experiments you have to be mighty careful that you have covered all your bases. Otherwise, the illusion will get you.
Dear Gordon, I have said what I think. You disagree. I dont expect to change your mind.
Gordon Robertson says:
“One of a set of twins leaves the earth at the speed of light….”
No he doesn’t. It is impossible to travel at the speed of light.
Gordon Robertson says:
“There is nothing about traveling at the speed of light that affects the way human cells age.”
Wrong again. Again about traveling at the speed of light. And you have completely misunderstood special relativity. Par for your course, Gordon.
You should learn about the time dilation of the lifetimes of rapidly moving partiles:
https://en.wikipedia.org/wiki/Time_dilation_of_moving_particles
Gordon Robertson says:
“The heat trapping theory is based on a thought experiment, not measurement.”
False.
Radiative forcing measured at Earths surface corroborate the increasing greenhouse effect, R. Philipona et al, Geo Res Letters, v31 L03202 (2004)
http://onlinelibrary.wiley.com/doi/10.1029/2003GL018765/abstract
“Observational determination of surface radiative forcing by CO2 from 2000 to 2010,” D. R. Feldman et al, Nature 519, 339343 (19 March 2015)
http://www.nature.com/nature/journal/v519/n7543/full/nature14240.html
Press release for Feldman et al: “First Direct Observation of Carbon Dioxides Increasing Greenhouse Effect at the Earths Surface,” Berkeley Lab, 2/25/15
http://newscenter.lbl.gov/2015/02/25/co2-greenhouse-effect-increase/
David Appell….some basic problems with your links.
In the article at link one, the claims are based on a model. That is, a thought experiment.
In all three articles they claim a warming between 2000 and 2010 caused by ACO2. They claim the IPCC agrees.
Bull feathers!! The IPCC stated clearly in the 2012 review that no significant warming had occurred between 1998 and 2012. They called it a warming hiatus, yet papers 2 and 3 claimed there was warming.
Of course, one of the papers claimed the measurements were made in two locations only and did not provide proof the warming they claim was caused by ACO2.
If you are going to Google to support your arguments at least read the papers.
Gordon Robertson says:
“In the article at link one, the claims are based on a model.”
All results are based on models.
How do you think UAH calculates its monthly temperature anomalies?
Via models!
Gordon Robertson says:
“In all three articles they claim a warming between 2000 and 2010 caused by ACO2.”
No they don’t — they claim a forcing.
Gordon Robertson says:
“Of course, one of the papers claimed the measurements were made in two locations only and did not provide proof the warming they claim was caused by ACO2.”
Read harder and better.
Gordon Robertson says:
“The IPCC stated clearly in the 2012 review that no significant warming had occurred between 1998 and 2012.”
The 5AR is already out of date.
You need to keep up with developments.
Gordon Robertson continues to paraphrase – not quote – the IPCC, and continues to get it wrong, despite being corrected numerous times.
Not that correction seems to help, here is Gordon’s words, and then direct from the most recent (AR5) IPCC report.
Bull feathers!! The IPCC stated clearly in the 2012 review that no significant warming had occurred between 1998 and 2012. They called it a warming hiatus
IPCC did not call a hiatus, only a smaller trend, so there was continued warming, and also said that short-term trends like this do not reflect underlying trends. Here are the quotes – one from the SPM, and one from Chapter 2.
SPM Page 5…
Due to natural variability, trends based on short records are very sensitive to the beginning and end dates and do not in general reflect long-term climate trends. As one example, the rate of warming over the past 15 years (19982012; 0.05 [0.05 to 0.15] C per decade), which begins with a strong El Nio, is smaller than the rate calculated since 1951 (19512012; 0.12 [0.08 to 0.14] C per decade).
Chapter 2 Page 194…
Owing to natural variability, trends based on short records are very sensitive to the beginning and end dates and do not in general reflect long-term climate trends. As one example, the rate of warming over the past 15 years (19982012; 0.05 [0.05 to +0.15] C per decade), which begins with a strong El Nio, is smaller than the rate calculated since 1951 (19512012; 0.12 [0.08 to 0.14] C per decade)Trends for 15-year periods starting in 1995, 1996, and 1997 are 0.13 [0.02 to 0.24], 0.14 [0.03 to 0.24] and 0.07 [0.02 to 0.18], respectively.
No mention of a hiatus – yet Gordon makes this claim over and over. I searched the SPM and Ch 2 (Observations) for the word. It doesn’t appear.
IPCC says smaller trend for the period 1998 to 2012 than since 1951. Please note that for future reference, Gordon.
Gordon Robertson says:
“Gerlich and Tscheuschner argued from a POV based on quantum theory that surface IR photons cannot be described by a straight vector field but would require Feynman diagrams based on quantum theory. From that perspective its not possible to visual a heat trapping blanket.”
Complete bull.
You clearly do not know what a Feynman diagram is.
David Appell…”You clearly do not know what a Feynman diagram is”.
We’re not talking about me, we’re talking about two experts in thermodynamics. You don’t seem to understand Feynman diagrams, or anything else about science, since your MO is ad homs.
See pages 58 to 60 where they take apart the Kiehl-Trenberth radiation balance diagram:
https://arxiv.org/PS_cache/arxiv/pdf/0707/0707.1161v4.pdf
Gordon, I’ve calculated dozens of Feynman diagrams. You?
Developing and understanding the Kiehl-Trenberth radiation balance diagram has nothing to do with Feynman diagrams. Not even close.
“Ive calculated dozens of Feynman diagrams”
roflmao….. Not bad for a low-end sci-fantasy writer.
You are FOOLing yourself, appell-grub… living in your own fantasy world.
Gordon Robertson wrote:
“I have pointed out to Roy that his own data sets at UAH contradict either theory.”
There is no ether. This has been known since Michaelson-Morley.
What’s far more interesting about you, Gordon, is not your poor knowledge and wacked ideas, but how someone comes to think he knows more than all the world’s scientists for the last 125 years.
Someone should be writing a dissertation about this phenomenon.
Fig 3 illustrates the Planck response to surface temperature. Any effect from CO2 is lost in the noise of Fig 3.
pochas94 says:
“Fig 3 illustrates the Planck response to surface temperature. Any effect from CO2 is lost in the noise of Fig 3.”
How so?
http://www.giss.nasa.gov/research/briefs/schmidt_05/curve_s.gif
You really cannot diagnose feedback from scatterplots like this. It assumes immediate response with no lag. It assumes minimum phase. It assumes a dominate I/O relationship. None of these items are established. A failure of any one of these assumptions to hold can produce any slope you like on a scatterplot regardless of whether the feedback is positive or negative.
I attempted a more rigorous analysis here back in 2011. It would be interesting to see how well it holds up with the latest data.
Good remarks. Thanks for you and Dr. Spencer for explaining in easy terms why fitting a straight line does not work in this case.
Your analysis appears to be technically difficult to read (matlab code yes) as said, but you brought a nice perspective that I wouldn’t personally have been capable of formulating.
Of course, I trust no true climate scientist would ever seriously fit a straight line to a scatterplot like that. Right.
Roy, why is there such a difference between UAH lt tropics between versions 5.6 and 6.0 in the period Dec 1978 to Mar 1995?
https://snag.gy/1vw7AP.jpg
https://snag.gy/AHu1wO.jpg
Those aren’t the only huge changes going from UAH v5.6 to UAHv6beta. In some regions the change was as much as 1.4 C:
http://davidappell.blogspot.com/2015/04/some-big-adjustments-to-uahs-dataset.html
Imagine the outcry if NOAA or GISS made such changes…..
You are still so damn IGNORANCT that you don’t comprehend that UAH adjustments are due to KNOW issues with satellite orbits.
GISS adjustments are anti-science fudges to do with desperately trying to match the massive FARCE that is the climate models.
Even then the models miss the side of the fabricated barn.
Thermalization explains why CO2 has no significant effect on climate.
Increasing water vapor is the only significant factor countering the average global temperature decline which would otherwise be occurring due to declining net effect of ocean cycles and declining sunspot numbers. Water vapor is hundreds if not thousands of times more effective at warming the planet than CO2 would be even if effect of CO2 wasnt made insignificant by thermalization.
Dan, great comment… Isn’t the sun the most effective at warming water (thus creating more water vapor)? AND won’t a sustained higher level of that solar activity continue to produce more and more water vapor (as the oceans continue to warm over time)? Your’s is a point that needs to be continually developed. So few are paying attention to the water vapor/ solar connection…
If the sun is causing modern warming, why is the stratosphere cooling?
(BTW, a cooling stratosphere is a prediction of AGW theory. But it must be separated from cooling due to ozone loss.)
David Appell says, October 26, 2016 at 4:41 PM:
First of all, there’s no “IF”. The Sun IS causing modern warming. It’s in the data, after all.
And why is the stratosphere cooling? -O3 and +CO2.
Anything else?
Kristian says:
“First of all, theres no IF. The Sun IS causing modern warming. Its in the data, after all.”
What data?
Link to it.
Heard of CERES? ERBE?
Kristian: Again, where is the evidence the Sun is responsible for modern warming?
In the data. OLR vs. ASR. ERBE+CERES.
http://www.drroyspencer.com/2016/10/what-do-16-years-of-ceres-data-tell-us-about-global-climate-sensitivity/#comment-228453
http://www.drroyspencer.com/2016/10/what-do-16-years-of-ceres-data-tell-us-about-global-climate-sensitivity/#comment-228469
Kristian, are either CERES or ERBE measuring solar irradiance?
*Sigh*
No, but they’re measuring reflected SW (‘ToA SW up’). Here’s ERBE and ISCCP FD:
https://okulaer.files.wordpress.com/2016/03/toafluxesfdvserbs_zps3489ddec1.png
CERES is using SORCE data for its “Solar Incoming Flux” (TSI) product.
The decline in solar wind strength since the mid 1990’s has increased negative North Atlantic Oscillation, driving a warm AMO and Arctic.
Dan Pangburn says:
“Increasing water vapor is the only significant factor countering the average global temperature decline….”
Have you ever heard of the Clausius-Claperyon equation.
Air can only hold so much water vapor. That amount doensn’t increase until the temperature of the air first changes. CO2 creates that initial change.
David Appell…”CO2 creates that initial change”.
How??
CO2 makes up 0.04% of atmospheric gases. It’s effect should be trivial.
“CO2 makes up 0.04% of atmospheric gases. Its effect should be trivial.”
Yes indeed, and O3 ….
“is only 0.00006 % of the atmosphere. The peak concentration of ozone occurs at an altitude of roughly 32 km above the surface of the Earth. At that altitude, ozone concentration can be as 0.0015 percent”.
And what is it that O3 shouldn’t do and is “trivial”
Toneb…”And what is it that O3 shouldnt do and is trivial”
There’s so much misinformation about ozone that it’s not worth discussing. Years ago we banned fluorides because they were reportedly destroying the ozone layer and opening up a huge hole in it over the Antarctic. Decades after banning it, another hole has opened up over the other pole.
What does it supposedly cut down on…ultraviolet??
Prove it. Back in the day we accepted all that garbage, but no more. No proof, no theory. That’s why AGW isn’t cutting it except among those who have accepted it as a religion, based purely on consensus.
Gordon Robertson says:
“What does it [ozone] supposedly cut down onultraviolet??
Prove it.”
Ridiculous. Spend 20 minutes educating yourself, instead of expecting people to prove to you the most elementary scientific facts.
“What does it supposedly cut down onultraviolet??”
Go to the top of the class!
“Prove it.”
Nope – you dispel your own ignorance.
Contrary to what you seem to think – it’s not big and clever displaying it like a badge.
Mind there are several wearing said badges on here.
Gordon Robertson says:
“CO2 makes up 0.04% of atmospheric gases. Its effect should be trivial.”
Why?
Who says small things are always trivial?
By your calculations, what effect should just 0.04% CO2 have on Earth’s surface temperature?
David Appell…”By your calculations, what effect should just 0.04% CO2 have on Earths surface temperature?”
Let’s put it this way. If you had a greenhouse with 100 panes of glass and you removed 99 panes, what effect would that have on the greenhouse? Solar energy would not warm it at all. All GHGs are only 1% of atmospheric gases and that 1% represents one pane of glass.
Same with the atmosphere, the 0.04% is total CO2 which is 96% from natural sources. That’s way, way less than one pane of glass in a real greenhouse and we have seen the effects of that concentration for at least several thousand years.
The IPCC confirmed that in a diagram in TAR and a subsequent note which claimed that anthropogenic CO2 was a small fraction of natural CO2. When you work it out from the graph, which the Department of Energy provided independently in a table, all CO2 is 0.04% of atmospheric gases.
Based on a concentration of 390 ppmv, ACO2 is less that 4% of that value, making it about 1/1000nds of 1%. ACO2 would represent a tiny sliver of glass in one frame of the greenhouse.
There are alarmists who insist that ACO2 is up to 35% of that 0.04%. That’s based on the serious cherry-picking of CO2 concentrations found in Antarctic ice cores. I have little faith in ice core proxies especially after seeing Mann’s hockey stick fall flat on it’s face with tree ring proxies.
Even if it is 35% of that value, we have witnessed the effects of a similar concentration for moillenia and it has made little difference.
Gordon, again you are assuming, with on science to back it up, that trace gases are necessarily insignificant.
The beauty of science is that it can address such questions, and often it dispels intuitive notions.
You’ve offered on reasoning at all.
Would you drink a glass of water that was 0.04% cyanide, without first looking at the science?
The Earth’s ozone layer is less than 10 ppm ozone. 0.001%. And yet without it we’d all be dead.
You said “Have you ever heard of the Clausius-Claperyon equation”
Apparently you don’t because it has nothing to do with water vapor being a greenhouse gas and that its increase is countering the cooling that would otherwise be occurring.
Just Google it and you will find out what it applies to.
If you don’t understand the Clausius-Claperyon equation, you need to go back and study basic thermodynamics.
I did. You obviously did not because you still don’t know what the Clausius-Clapeyron equation relates to. At least you might learn to spell Clapeyron correctly . . .
That’s all you got, that I mispelled a name?
The LEAST of your errors.!!
Most of your errors are based on what could genuinely be called ANTI-KNOWLEDGE. !!
fonz – Solar activity (sunspots) is on the decline and will be until at least about 2020 (ocean cycle decline will continue until about 2037). Back radiation from the added WV is reducing the NET radiation from the oceans so ocean temp has been rising (Dr Roy has been valiantly attempting to get through to some folks on this who aren’t ‘up’ on radiation heat transfer). WV increases due to increased vapor pressure at 15 C of about 6.25% per Kelvin degree.
Rising WV trend leads to more clouds reflecting sunshine so the effect on temperature is self-limiting. However, IMO we are in for increased flooding from increased rain.
My blog shows a graph of WV (TPW) through Sept and links to the NASA/RSS source.
i’m of the thinking that solar activity, though on the decline, is higher than average still (compared to, say, centuries ago). And since the ocean is like a big kettle of water, it will continue to warm even though the flame is being turned down. (land warming and ocean warming are somewhat different then) So a weakening sun will produce water vapor even still; this along with, as you say, “back radiation from the added WV”. What say you? (thanx)…
fonz – I agree at least qualitatively with what you are saying. I have not tried to account for solar variation other than associated with sunspots. Others have found small (about 0.03%) variation of non-sunspot related solar thermal radiation over multi-decade periods based on proxies. I haven’t found any direct measurements of solar output prior to about 1961. Because I got such excellent match to measured (98%) without considering it I have not been motivated to look into it.
The sun itself does not produce water vapor. Water vapor happens because of the partial pressure of water vapor according to the temperature of the liquid water (and a bunch of weather stuff). The partial pressure is a forcing though so atmospheric water vapor content varies in response to the time-integral so there is a ‘lag’.
There are other things also adding water vapor such as recent dramatic increase in irrigation and increase in burning hydrogen rich fossil fuels. In any event, the water vapor content of the atmosphere is currently increasing (see links in my blog). My finding is it has been increasing slowly for centuries with dramatic increase in rate in the mid 1900s as shown in Fig 3 of my blog.
Increased WV means more warming but also more clouds which reflect more sunshine so the effect is ultimately self-limiting.
The best indicator is what happens to the average global temperature trend.
“There are other things also adding water vapor such as recent dramatic increase in irrigation….”
Tiny compared to the world’s oceans and lakes.
Care to estimate how tiny?
The worlds oceans and natural lakes have pretty much always been there and contribute the water vapor and nearly all of the huge effective thermal capacitance that has made the planet suitable for life. The dramatic increase in irrigation is relatively recent (started about 1950). Any addition of WV will raise average global temperature but the effect is self-limiting because of increased clouds. My calculations show the temperature is about 0.26 K warmer than it would be with no increased WV. (Table 1, file #E)
NASA/RSS measurements show WV increase rate of about 2.3E13 kg/yr which is the approximately 2% that stays in the atmosphere of the 1.1E15 kg/yr used for world irrigation. The other 98% apparently rains out. The data on irrigation was calculated using information mostly from here: http://www.fao.org/nr/water/aquastat/didyouknow/index3.stm
Dan Pangburn says:
“The worlds oceans and natural lakes have pretty much always been there….”
Then they can’t be responsible for modern temperature change, by your way of thinking.
Do you doubt the results of the Clausius-Claperyon equation?
Hi Fonz,
Am curious why you think the ocean temperature will continue to warm even though the flame is being turned down?
Have you ever considered how the specular reflection of direct solar radiation upon a spherical, smooth, ocean surface can ever be observed from a satellite orbiting the earth?
Have a good day, Jerry
Hi, Jerry, nice, as always, to see you… Dr Spencer once explained that there is a temperature gradient in the ocean. So, i figure that if you raise the surface temperature of the ocean, then the ocean on the whole should continue to warm until the new temperature gradient (or equilibrium state) is achieved. Simply put the ocean is a very big kettle of water and it takes time for it to warm given a change in surface temps. i think this is born out in the sea level rise data which indicates that seas were rising even during the global cooling of 1940-1970. (granted, the ipcc tells us that thermal expansion only accounts for about a third of the oceanic rise, but the data is useful none the less) The data indicates that the equilibrium state temperature was achieved or nearly achieved circa the cooling around the turn of the century (1900). The carbon growth rate also shows exactly the same thing with the growthrate going up and down in lock step with temperature. (and always positive as long as ocean surface temps are above the equilibrium state temperature set during the LIA, about .8C cooler than recent surface temps) It, too, went negative around the turn of the century, very similarly to that of the sea level rise data. i really think there is an obviousness to it all that seems to escape the groupthink of the skeptical community at large. Trenberth has been a godsend for skeptics in my opinion, a sort of “be careful what you ask for you just might get it” for the pro-agw crowd. The ocean is a heat sink (who knew?!). And this may have vast implications for agw theory. Indeed, even though surface temps have been at a standstill (the so called “pause”), the ocean is still thought to be warming “faster than evah!”. (and i think that they are “absaposalutely” correct) imagine a scenerio where we could see significantly cooling surface temps all the while that the ocean continues to warm. i think that certainly would kill agw politically, if not scientifically…
Hi Fonz,
Good to exchange comments with you. Jerry delete much he had written because you gave you answer to one of my questions and it was not my objective to ‘grade’ your answer. I was just curious.
But there was a second question which you did not answer. And I am curious as to what your answer might be.
Do you know what happened to JohnKl? I had written to both of you that I did not consider this site on which to seriously exchange and discuss ideas. May 30, this year, I discovered PSI and no site is perfect. Its major problem is the lack of comments about the many various articles that are published there. But the PSI has generously published several of the articles I have submitted and of course any comments I make about the other articles stand out like a sore thumb because there are so few comments made by others.
Have a good day, Jerry
And I have become even worse about my proofreading. But you are clever and can correct the mistakes.
“But there was a second question which you did not answer.”
Jerry, there a joke whose meaning i follow religiously at these climate blogs which goes as follows: When people open their mouths, “dumb” falls out. So if you keep your mouth shut, then people will never know how dumb you are…
Truth is, i have no idea what your question means. So to avoid the appearance of being a dummy, i simply avoided the question! That’s one fringe benefit of being “fonzie”. Just like the television character, i ain’t exactly the brightest bulb on the tree. (this from “happy days”: epilepsy? isn’t that the disease where they send you to an island in the pacific?) So, it’s been a great fall back for me to be fonzie. If i ever run into trouble i just say, “hey, i ain’t no egghead, i’m just a guy in a tee shirt and leather jacket”. Works every time… So, you might want to rephrase that one so that i can better understand what you’re asking. Now, as far as your first question goes, it’s ironic that you mentioned that you had no intention of “grading” me. It was you who introduced this layman to the writings of feynman (for which i’m forever grateful). Everything feynman lectured about are things that we all know are true in the back of our minds. By articulating those things (as only he could do), it brings them from the back of our minds to the fore. So, when you asked me a simple question that you were “just curious” about, my mind lapsed into feynman mode. Make sure to be fair, thorough and bend over backwards to show where i may be going wrong. But, mostly i was thinking “cargo cult” (and especially so because it was you that introduced me to that concept). Is it junk science to suggest that the ocean warms so long as surface temps remain above the equilibrium state temperature? And more importantly, how do i convey that to someone else in writing. (remembering, of course, that others may be reading my comment as well; i think trenberth is important for others, especially skeptics, to ponder) So, i have to chuckle a bit when you said that you were just curious. Because when jerry l krause asks me a question, i’m not thinking he is just curious, no, i’m thinkin’ feynman (cargo cult!!!) and how to be as thorough and true as my limitations will allow. Tall task for the guy in a tee and leather…
You know, i have seen john around not too long ago. It was after dr spencer’s hiatus with his comments, i believe. He stuck around for one or two posts (of spencer’s) and then he split. John’s a very good natured fellow with an enviable well roundedness. While he’d often stumble through the science he always had his head well in the game. And boy was he well read. (i sure learned a lot from him) He’s one of those who, when they develope some self confidence, go far. i watched his commenting really blossom through the few years that he was here. I can see why you yourself find this forum stifling… Many folks who come through here can be quite abrasive. Not very conducive for discussions about anything, let alone climate science. Me? i like the rough and tumble, because that’s mainly what the climate change debate is all about. Not so much science, but egos pitted against egos. The abrasive nature of the debate can’t be ignored, so i prefer to embrace it. It’s part and parcel of the big picture…
Jerry, nice “chatting” with you. This insomniac has to go back to bed. (so much to sleep and so little time to do it in) i hope we all find the conversationing more civil as time winds on… fonzie
Hi Fonz,
What a good conversation!! You had never written to my knowledge about Feynman. Good to hear you appreciate his ‘wisdom’. What I find amazing is how seldom anyone refers to it.
Have you noticed that not only the commenters but actually the ‘scientists’ who get paid for studying the greenhouse effect etc, seldom, if ever, refer to any quantum mechanical considerations. I consider this is because as Feynman taught is it does not make classical sense. A particle which has mass can behave as a ‘wave’ and a ‘wave’ without beginning or end can behave as a finite particle. And the mathematics involved is far beyond us mortals.
But, chemists know they cannot explain why it is that ice floats on liquid water without the knowledge which is provided by quantum mechanics. So while physicists such as Tim ??? and Joel Shore avoid referring to Feynman’s and Einstein’s wisdom, I, a chemist, embrace it even though I do not pretend to really understand calculus. But I did work through an exercise of how Schrodinger solved the hydrogen atom using wave mechanics. But to be a chemist only requires that you accept what Schrodinger and other founders of quantum mechanics theoretically ‘discovered’ which clearly as led to the invention of many important devices based on the nonsense produced by these scientists.
And you only have to be smart enough to understand that you should not ignore what they learned.
Your comment about my second question is very meaningful to me. Specular reflection. Go into a dark room which has a mirror with a simple laser. Point the laser at the mirror and look on the wall opposite the mirror to see the red light incident upon the wall. If you do this you have seen the result which is termed specular refection. In my question, the sun is the laser and the spherical ocean surface is a spherical mirror instead of the common ‘flat’ mirror of our common experiences with a mirror.
Now ponder the question. I consider the answer so simple that no one has seen it.
Thanks again for your comments because I never knew.
Have a good day, Jerry
jerry l krause “You had never written to my knowledge about Feynman. Good to hear you appreciate his wisdom”.
My favourite Feynman claim is that quantum theory works but no one knows why.
Planck didn’t either when he fudged the math to find the quantum levels required to explain EM intensity vs. wavelength. He admitted that he fudged the math to make the graph fit the data. Since, then, Planck’s constant has been an important part of quantum theory even though it’s basis is fudged math.
Unfortunately, people like Neils Bohr read way to much into the concept of quanta and took science off on a roller coaster ride in the wrong direction. That’s why we have people wasting everyone’s time these days trying to develop a quantum computer based on entanglement theory.
Both Einstein and Schrodinger, the father of quantum theory, distanced themselves from the notion of entanglement and Einstein went so far as to claim no one knew for sure whether EM was a wave or discrete particles.
Hi Gordon,
“My favourite Feynman claim is that quantum theory works but no one knows why.”
Newton wrote at the end of The Principia that he knew of no evidence that suggested would be cause of gravity was. It was enough to know the result of gravity was.
And inertia, a law of motion. We know the effect but we do not know the cause.
You and others try to dismiss QM or WM as false (wrong) ideas. What is your explanation of why ice floats on liquid water without considering the fundamental ideas of QM (WM)?
Have a good day, Jerry
Hi Fonz,
The cartoons serve to make what the author want to present quite simple. However, there is a second Einstein quote: “Make everything as simple as possible, but not simpler.”
In the 80s to mid-90s I read much about El Ninos – La Ninas. The cartoons present a far too isolated system. There is too much ‘weather’ precipitation that is never mentioned. At this point I went back to the link and scan the text before the cartoons and discovered that what is presented is merely a summary of a much larger book. So I now term the cartoons are deceptive of the bigger picture which needs to be consider (my opinion) even in the case of the simplest level.
The basic problem for me I really do not know what is actually known about this very large Pacific Ocean. Like how much actual precipitation and where. You might ask, because it is not considered in the cartoons, what is the importance of the precipitation? I have this unique (because it so seldom seems to be considered as part of a general atmospheric circulation) idea that precipitation is the exhaust of the atmospheric heat engines which primarily drive (cause) the circulation wherever it is found. It is the condensed water is the exhaust because I consider water vapor to be the fuel the heat engines that are the prime movers of the atmosphere. And one fact about which it seems nearly everyone agrees is that the winds, with their greater velocities, cause the major ocean surface currents wherever they are found.
One fact I was considering to draw to your attention and you first have drawn it to my intention. Although I consider this may have occurred without any intention on your part. On page 23, I read: “The oceans release heat primarily through evaporation.”
Now, I am going to bed and will pick up on this evaporation tomorrow if possible.
Have a good day or night, Jerry
Jerry, bottom line, i would think, is that whatever those mechanics are, relatively warm surface waters pile up in the western pacific where they begin to sink and eventually move east causing thermohaline circulation. Only question remaining is just how much this circulation behaves as a true sink where we would expect variations of the sink rate commiserate with temperature…
fonzarelli “…i think trenberth is important for others, especially skeptics, to ponder”
Not this cowboy. I think Trenberth has single-handedly set climate science back on its ear.
Gordon, by saying “trenberth” what i really mean is “trenberth deep ocean warming”. (shorthand of sorts) i know next to nothing about the rest of the guy’s work. That whole deep ocean warming thing made such a notable splash in the great climate debate. i think most skeptics just kind of knee jerk rejected it. (including one of my favorite people, “bart of the immaculate convection” who i see has graced this thread a little ways up) if the ocean behaves as such as a heat sink, then we are NEVER going to see the predicted numbers at the surface. The more the surface temps depart from the equilibrium state temperature, the faster heat will sink into the ocean. In fact, we’re far enough away from the equilibrium state temperature that we could see significant cooling at the surface all the while that the ocean continues to warm. That would spell big trouble for agw theory as it stands today…
BTW, thanx for the smiley face code. i’ve gotten a lot of milage out of it… ☺
Hi Fonz,
It does not bother me to be wrong. I have not read what Trenberth has written or stated. So, I know nothing of his reasoning. What I have read is that in mines the temperature increases with greater depth. This seems reasonable because it is proposed that somewhere down there is liquid iron. And I have property, a portion of which is covered by ash from a volcano eruption and a rim rock of extruded solidified lava. So I cannot wrap my mind around what you understand Trenberth to be understanding.
At the same time I recognize the possibility that at there could colder water beneath a warmer surface layer. I admit again I do not know what really exists and where it exists. As we know, the ocean is a big, big chunk of matter which has a significant specific heat.
I know that a physical property of pure liquid water does not apply to ocean ‘salt’ water. This property of pure water is that the most dense water has a temperature several degrees greater than its freezing point. Which, given a sufficient depth the water of this temperature greater than 0C or 32F is found at the bottom while pure solid water (ice) (maximum temperature 0C or 32F) floats in the water’s surface layer.
I know the density of ‘salt’ water depends upon its temperature and the concentration of the salt (impurities). Hence, the importance the ice that forms around the Antarctic continent during its winter and then begins to melt come spring. As the ice freezes the water beneath the ice become ‘saltier’ and likely more dense than the water beneath it. Now a question, to which I do not know the answer, is: does this shallow layer of more dense water sink as a parcel of more dense salt water or does the salt of the greater concentration of salt diffuse into less dense salt water beneath it? But when the ice melts a layer of fresh (pure) water forms and it is certainly less dense than the salt water layer beneath it and it floats.
I could go on with some speculation based on other factors which I know exist, but because it is speculation and there is so much that basically no one really knows (the ocean has a big area where very few people live). All oceans, except the Arctic Ocean, have no continental boundaries in the Southern Hemisphere which separate them as they are separated in the Northern Hemisphere. Etc. Etc.
And I ask my question about the ocean’s albedo, as observed from satellite, for a specific reason. So, keep working on the problem because I am sure you are capable of discovering the answer.
Have a good day, Jerry
Jerry, it may take me quite a while to mull over that ocean albedo thing. (think of me as the kid in a leather jacket sitting in the back of the class with a pea shooter; it’ll take that kid a while to get there…) i thought instead that i’d answer a question that you proposed a while back and maybe relate that to what i think i know about “trenberth deep ocean warming”. Now, i may be wrong about what exactly that question was that you asked as it was quite some time ago. i believe it was something like, “how does the earth behave like a machine?”. In the case of “trenberth” (which i’ll use as shorthand for “deep ocean warming”) the earth acts like a heat pump, pumping warm surface waters into the depths of the ocean. Thermohaline circulation begins with the rotation of the earth causing hadley cell trade winds which begin the process of blowing relatively warm surface waters at a constant rate toward the western part of the pacific. Ultimately, this results in walker cell trade winds blowing surface waters also to the western pacific but at a rate that varies with temperature. Now, i haven’t done whole lot in my little life, but one thing that i have done is live on the island of maui. (i was actually born in honolulu but left there as a baby only to return later on to visit my brother who ultimately resided on maui…) Looking back, it all seems quite prophetic. i always remember the talk about trade winds as they were said to occur around noon and sure enough they would happen once the sun was high in the sky. i pondered even back then why this was as i always thought trades would happen day and night if they were caused by the rotation of the earth. Not interested in climate change back then, i soon dropped the thought as being not too particularly relevent. These days i realise that folks living on maui were referring to “walker trade winds” and not the classic definition of trade winds. These “walker trades” origionate in the eastern pacific where the cool upwelling waters are. The air above being cooler and denser travels west once the morning sun gives way to the mid day in the hawaiian islands. (mornings on maui could be quite still and gorgeous) Once the noon hours hit the trade winds pick up rather rigorously due to that heat differential from east to west. So this temperature dependant process blows surface waters toward the western pacific. The warmer the surface waters are, the faster they get blown. Once in the western pacific, of course, they pile up and ultimately sink. Thus, the relatively warm surface waters get pumped into the ocean depths, beginning the thermohaline circulation. And that’s how “trenberth” works. i think it makes sense really. Apparently that’s one reason why temperatures increase firstly at the poles. They don’t have thermohaline circulation to cool things off as we see in the tropics. My guess (and it’s just a guess) is that if back radiation from co2 merely heats the “surface skin” of the ocean, that surface heat is more likely to end up in the depths of the ocean than say heat from the sun that penetrates deeper into the ocean. So maybe that could be a reason the back radiation is less effective at raising surface temps than the sun (that and perhaps a host of other reasons). All this spells trouble, i think, for agw theory. If global warming is really ocean warming then we may never see the ultimate rise in temps at the surface as predicted by the models. Because the faster the surface warms, the faster it gets blown into the depths. Now, trenberth had a mechanism, that of the thermohaline circulation, but i’m not so sure that a mechanism is even necessary. It seems to me that if the surface temps of the ocean are merely raised, a new temperature gradient should form via vertical mixing, thermohaline circulation would merely add to that…
Jerry, it’s bed time once again. i wake in the middle of the night only to fall asleep again hours later. (unfortunately only with the help of medication) i look forward to any reply. That ocean albedo thing is going to take some doing as i’m not sure where you’re going with that. i hope that i wasn’t repeating a bunch of stuff that you already knew with “trenberth”. If that is the case, perhaps others who read my comment might learn a thing or two. i honestly think that the skeptic group think among skeptics that put down “trenberth deep ocean warming” is quite disturbing. It’s always a sad thing when skeptics exhibit the same shallow mindedness that can be seen on the pro-agw side. As fonzie’s “grandma nussbaum” used to say, ‘two wrongs a right don’t make, honey’…
Hi Fonz,
This is a very good discussion and I am learning. I discover that I have something right but do not know the words. I had to look up thermohaline and finds its defines what I use many word to describe.
Next I had to look up Walker cell circulation which I find as you described.
Again I have a question. It is: If you were on a cruise ship a hundred miles east of the islands or west of the islands, would there ever be a strong Walker trade wind which would begin blowing over its decks at midway? Here I will give my answer: No.
Why no? You and most recognize that atmospheric circulation (winds) require there be a temperature difference. And it is generally true, the case, that the surface water of the Pacific off the coast of South America is significantly colder, because of upwelling there, than the surface further to the west.
And it is the case that the consistent trade wind which is from east to west creates a ‘sloped’ ocean surface as the wind ‘pushes’ surface water toward the west. I have read and believe the result of this sloped ocean is that there is a counter current below the surface which is pushed from west to east by gravity. And what must happen when this west to east flow at depth encounters the South American coast? Might it upwell?
Now, a question I find to be seldom asked concerning the tradewinds, which are observed to be relatively consistent both day and night, is: To where are these winds blowing? Do they just circle the globe of the earth blowing the east to west along the earth surface? Now that I ask this question I see something which I did not see last night. And if you had not written what I read this morning I maybe would not have ever seen that which I now see which I consider, right or wrong, important.
There is a lot of nonsense being written by people who should know better. Case in point: When I searched for an better understanding of thermohaline or the ocean circulation caused by it. I encountered a NOAA cartoon (sequence of figures which picture a process) about what occurs around the Antarctic continent during winter as ice forms on the surface of the ocean. The first figure shows an iceberg floating on an ocean whose temperature is 0C. The problem is saline water does not freeze at 0C. The ocean’s surface water typically freezes at -3C. And in the sequence of figures the ocean continues to cool until the third or so figure has water at -3C. And then there are several more figures with the constant temperature of -3C. So, why are there more figures? The answer is in every additional figure the iceberg is larger. The problem with the NOAA cartoon is the ocean does not freeze as an iceberg. Icebreakers do not break up icebergs, they break up ice layers at most 9ft thick as I previously wrote.
Another observation which you may or may not know is the tradewinds about the Antarctic continent are from west to east and there is a constriction which interferes with thing west to east flow. It is the south end of the South American continent.
My point in writing would have I already written is there are things that should be written that are not and there are things that are not commonly written that should be. Now, I do not claim that everything I write is correct. But obviously when I write it I consider that it is correct because as you have stated: it is not wise to write wrong things. Better not to write anything.
Now back to Walker circulation which has a strong diurnal influence. In the case of your observations at Hawaii, which I have also observed, I conclude the strong winds near midday are a combination of a localized cell which is a combination of a mountain-valley breeze and an ocean-beach breeze which are the result of relatively large differences of localized surface temperatures due to differences in the solar heating.
At PSI I have written an article about thunderstorms which I consider are the prime movers of atmospheric circulation and while they do occur over a wide range of latitudes, it is those that occur near the equator which quickly lift the warm (hot) humid surface layer atmosphere from the surface to the top of the troposphere. And this surface atmosphere which is lifted from the surface needs to be replaced: hence trade winds in the tropics. But do not ignore that the tropics are a very large area and that within the oceans are large areas without tradewinds and these areas are known as the doldrums. Which doldrums are seldom considered at any depth beyond they are large areas without any consistent trade winds.
And as usual I am curious what your response might be from which I might learn something new or which might catalyze an thought which I would not have had except for what you wrote.
Have a good day, Jerry
Hi Fonz,
From time to time I have awaken with things in my mind that keep me from going to asleep again so I begin composing. But it is seldom.
I consider I compose best when I am responding to someone’s writings instead of establishing the topic which I consider needs to be considered. I consider we are discussing important issues here and fortunately no one is bothering us. I welcome the opportunity to get my thoughts ‘published’ and dated. You are my peer and I am your peer so anything you or I write has been peer reviewed and it becomes something as permanent as any article published in Science or Nature or any other ‘scientific’ journal.
I am naive about some ‘modern’ words. What is a troll? Is a person who continues day after day basically writing the same thing? I know from time to time I have repeated but I try to focus on things which I have not commonly read. And some people really carry this to extreme. Because I am having a private email discussion, I just had to reflect if you were the one to whom I will refer. Pretty sure you were not. I have encountered two people who state they question the idea (fact?) of photons. And I sort of lost a little consulting job because the person, a metallurgist, I was to consult with, did not believe in atoms and considered I was talking down to him when I began to consider chemical reactions occurring on an atomistic basis. I hope my ideas, about which I seldom read, are that off-the-wall.
Finally I will actually begin to write about ‘our’ scientific focus. I have read the name Trenberth but had never considered anything he wrote because I considered it was too far from simple. Of course, I am sure you are aware of Einstein’s quote: “If you can’t explain it simply, you don’t understand it well enough.” Which I embrace because it seems that is the only level at which I can participate. And I find that many seem to not be able to understand simple or maybe more kindly, to have a desire to consider things at a simple level.
So, when I read about the ‘extent’ of the ‘ice’ which forms around Antarctica, I do not read specifically what this ‘ice’ is. And, I wonder if you understand what specifically I want to know better. This because it maybe never has been written by anyone who has written about the ‘extent’ of this ice which is considered an important possible result of ‘global warming’. Now I could question you about what this specific information is but I will this time tell you what I consider.
Ships get caught (trapped) in floating slush or larger pieces of ice which are drifted about by variable winds. If it is floating slush I know the temperature of surface is -3C. But if the slush freezes to form a continuous sheet of ice so there is not liquid water at the surface, I only know that the surface temperature cannot be greater than 0C. And that the surface temperature can decrease to far below -3C. The difference between the radiation emitted by ice-water surfaces at 0C and -3C is not great. But the difference of emission between a surface at -3C and -40C is not insignificant. Hence, the greater the extent of a solid ice sheet, the less the cooling of the water beneath the ice sheet surrounding Antarctica. My question is: When Trenberth reasons about the ocean circulation system, does he consider what I consider to be a potentially important variable. Which produces a result just the opposite that maybe considered to be related to an ice surface of great extent. As I have implied, if not directly stated, I do not know what others consider unless they tell me what they consider. Hence, the critical importance of discussions such as this. Because you might be able to point me to what Trenberth has stated relative to that I admit I do not know.
You admit that you have no idea about the importance of the observation of specular reflection by ocean surfaces from a satellite. I just reviewed what I had written relative to my question. And I did not find that I had written the word albedo. So, you evidently have decided my question has something to do with the albedo. And you are absolutely correct. Do you really expect me to believe, that you do not know what it means if that the actual albedo being considered for the ocean surfaces in any modeling (understanding or explanation) is significantly incorrect?
Have a good day, Jerry
https://bobtisdale.files.wordpress.com/2012/09/preview-of-who-turned-on-the-heat-v2.pdf
Jerry, quick note, here’s an excellent link on thermohaline circulation by tisdale (courtesy of kristian whose comment began this thread). This is really worthy in that the whole thing is explained via cartoon illustrations. So, if you want to cut to the chase (and skip over all the ‘gobbledygook’), then go right to page 16 where the pictures get started. i found it to be a “not so heady” way of learning about thermohaline circulation…
Jerry, your october 28 11:00pm comment seems to be misplaced. i’ll put a (short) reply below it above…
Hi Fonz,
Not going to consider evaporation just now. Had decided this before I read your last comment. Instead I ask you to go to–(http://principia-scientific.org/?s=de+Saussure++). You are maybe the only one who has not questioned my intelligence in this arena of trying to understand weather and climate where the focus is upon radiation.
This article begins with a lament and I explain how it is that I consider myself unique and that my approach to science is different than most. Then I illustrate qualitative reasoning by explaining how a device invented in 1767 by Horace de Saussure functions.
In this email I will review, or give reference to, some of what one can read in the Old Testament of the Holy Bible. Regards of one’s possible religion, I believe one must accept it was written by men a quite long time ago before Galileo started ‘science’ on the right path. King Solomon is one of the characters and he was also a philosopher. And in Ecclesiastes 1:5-11, it is claimed he stated: “The sun rises and the sun sets, and hurries back to where it rises. The wind blows to the south and turns to the north, round and round it goes, ever returning on its course. All streams flow into the sea, yet the sea is never full. To the place the streams come from, there they return again. What has been will be again, what has been done will be done again: there is nothing new under the sun. Is there anything of which one can say, “Look! This is something new”? It was here already, long ago; it was here before our time. There is no remembrance of men of old, and even those who are yet to come will not be remembered by those who follow.” (NIV)
Horace de Saussure was quite a meteorologist and I only learned about him and the device he invented maybe a month or two ago. Look him up.
I will give you time to consider what I have just written and responded before writing more. This nothing against you.
Have a good day, Jerry
Hi Fonz,
You might be interested in something from 2013. http://semivision.blogspot.com/
Have a good day, Jerry
Gordon Robertson wrote:
“Planck didnt either when he fudged the math to find the quantum levels required to explain EM intensity vs. wavelength. He admitted that he fudged the math to make the graph fit the data.”
It wasn’t “fudging,” it was an ansatz, which has a long tradition in theoretical physics.
“Both Einstein and Schrodinger, the father of quantum theory, distanced themselves from the notion of entanglement and Einstein went so far as to claim no one knew for sure whether EM was a wave or discrete particles.”
Both of them were wrong.
“Both of them were wrong.”
How the heck would a base level sci-fantasy know anything about stuff which is so far above its intelligence quota.
You are an ignorant grub, with absolutely NOTHING to offer to science.
Roy, the discussion here is much more interesting than the usual petty arguments that seem to proliferate like spot fires.
However, your final sentence:
“I believe the climate research establishment can do better. Someday, maybe after Lindzen and I are long gone, the IPCC might recognize the issue and do something about it.”
deserves some comment since it seems to me the issue may not be as important as you imply. At some future point in time (hopefully not too soon for yours and Lindzen’s sakes) the whole issue surrounding global warming will be even better resolved than it is today due to the accumulation of various temperature measurements and related observations. Especially as it should, according to theory, be accelerating irrespective of any short term changes to co2 emissions. By then, won’t he issue of whether one can determine the magnitude of the radiative feedback from CERES data be somewhat redundant?
i.e. it is an interesting scientific question but may not be that relevant to the bigger issues?
The total greenhouse effect is the temperature difference between the average surface temperature Tsfc and the effective radiating temperature of the earth-atmosphere system Te, where Te = (OLR/sigma)^.25.
Tsfc – Te is the greenhouse effect and should be increasing with time if our emissions of greenhouse gases are creating an enhanced greenhouse effect, as per Hansen et al 1981.
Tsfc – Te = LR x H, where LR is the lapse rate = 6.5 K/km and H is the effective radiating height at about 5.1 km. LR x H gives the approx. greenhouse effect of 33 deg. C. Only a change in the greenhouse effect can change the H. A change in absorbed solar radiation will not change H much as it would increase Tsfc and Te almost equally (ignoring a change in LR).
I presented a graph that shows the lower troposphere temperature best fit trend from March 2000 to December 2014 from the average of RSS and UAH data is essentially zero.
https://friendsofscience.org/assets/images/LT_Temperature_2000-03_2014-12.jpg
Then presented a graph of Ts – Te = greenhouse effect.
The best fit line shows a slope of 0.012 +- 0.037 C/decade, which is insignificant at the 90% CI level.
https://friendsofscience.org/assets/images/GHE_2000-03_2014-12_LTT.jpg
This implies the the best fit line of Te has a slope of -0.012 C/decade over the period.
Kristen wrote October 23, 2016 at 8:26 AM
“[T]he telltale sign of greenhouse warming to look out for:
T goes up, but T_e stays unchanged. Over decadal timespans.” That isn’t quite correct as Te can change due to a cloud cover change. Ts – Te is the telltale sign of “greenhouse warming”.
Feedback is a change in a climate parameter, such as surface albedo, that is caused by a temperature change and which causes a further temperature change. If there is no temperature change then there can be no temperature-induced change in surface albedo, and no albedo feedback, nor any other feedback.
I wrote, “Note that the trend is -0.00028 C/decade, which is about zero. Therefore there is no trend in feedback, which can exist only if there were a temperature trend.” Dr. Spencer unhelpfully responded “This suggests you dont understand feedback. When you do, maybe you can rephrase your comments.”
Dr. Spencer’s article at the links given in the lead post shows equation (1):
Cp[dTsfc/dt] = F(t) – LAMDAnet x Tsfc(t)
During the period dTsfc/dt = 0, so; F(t) = LAMDAnet x Tsfc(t).
Using the best fit line, there was no temperature change between the two dates (March 2000 to December 2014), so there was no total forcing change (assuming LAMDAnet is constant), but there was a greenhouse forcing change of 0.489 W/m2, which must have been exactly offset by a natural forcing change of -0.489 W/m2. The greenhouse forcing caused the greenhouse effect change of 0.012 C/decade, offset by -0.012 C/decade from natural climate change. Therefore, I can calculate the transient climate response (TCR) by;
TCR = F2xco2[dTgh/dFgh], where Tgh is the change in the greenhouse effect, dFgh is the change in the greenhouse forcing.
TCR = 3.7 W/m2 x [0.012 C/decade x 1.476 decades / 0.489 W/m2]
TCR = 0.13 C
Do you see any problem with this? Why is this wrong?
Ken
“Then presented a graph of Ts Te = greenhouse effect”
No you didn’t. You presented TLT – Te.
The water vapour component of the greenhouse effect cools the sunlit side and warms the dark side.
https://www.linkedin.com/pulse/earths-surface-temperatures-using-hemispherical-rather-ulric-lyons?trk=pulse_spock-articles
“I presented a graph that shows the lower troposphere temperature best fit trend from March 2000 to December 2014 from the average of RSS and UAH data is essentially zero.”
Bzzzzzt!
Cherry-picking data is a no-no.
David Appell,
I agree. Temperature four and a half billion years ago – hot enough to melt rock.
Temperature now – not nearly so hot.
I would say the surface temperature has dropped. And you?
No cherry picking, mind you!
Cheers.
“And you?”
Given Earth temperatures will again increase to be high enough to melt rock in a few more billion years, I’d say temperatures are increasing Mike. No cherry picking needed.
Ball4,
You’d say temperatures are increasing. And so they do, when the Sun comes out, or when summer comes.
The fact is that Nature doesn’t care what you say. Over the longest period possible, temperatures have dropped.
You’re apparently predicting a reversal of physics – scisyhp!
I stole that from somewhere else, but you’re welcome to it.
Cheers.
And in the future Mike, you can’t deny over the longest period possible temperatures will increase. No cherry picking.
Ball4,
May I gently point out that the future hasn’t happened yet?
Your speculations remain speculation, until the future has become fact.
Maybe you should put your predictive talents to picking winners. Good luck.
Cheers.
Well, you know what Mike? The future has arrived as Mike wrote that in the past. And temperatures have gone up since Mike’s writing, I am vindicated. No cherry picking!
Mike Flynn says:
“Over the longest period possible, temperatures have dropped.”
Where are the data showing that?
And why is temperature increasing now?
Mike Flynn says:
“I agree. Temperature four and a half billion years ago hot enough to melt rock.
Temperature now not nearly so hot.
I would say the surface temperature has dropped.”
So what?
This would only be relevant if one single factor controlled Earth’s temperature.
Which of course is not true.
How do you explain the PETM? The recent glacial-interglacial temperature differences? 20th Century+ warming.
David,
Questions, questions.
If you actually seeking help, rather than trying for a gotcha, in an attempt to look intelligent (fat chance, eh!), I would provide with the details – at least about 20th century temperature increases – peer reviewed and all!
Alternatively, you could do as I did, and ascertain the information for yourself. Don’t blame me for your inability to think!
As to the past, nobody knows what the world was like in detail – except you, maybe? I’ll go as far as saying that before any ice formed on the surface, it was above freezing everywhere.
Maybe you should ask around for a falsifiable hypothesis propsing planet heating properties for CO2. Or even for some experiments showing that reducing the amount of energy reaching an object – say by blocking some with a GHG – causes a rise in temperature.
You claim to have a PhD – should be kid stuff to you! Or is PhD an acronym for “piled higher and deeper” as one of my Canadian colleagues humorously put it? He said a BS was “bullsh*t”, a MS was “more of the same”, and a PhD was as above.
He obtained his PhD. Not a big fan of the GHE, by the way. More science based.
Cheers.
Notice how Mike Flynn again avoided all questions.
He didn’t even attempt to answer then.
Because he has no answers. He’s just a bullshit artist.
David Appell,
Can you give me a single cogent reason why I should answer your questions?
You’re not seeking knowledge. Why should I waste my time dancing to your silly tune?
Deny, divert, confuse. The Earth has cooled since its creation. Trying to divert the conversation won’t change the facts. Confusing people with overcoats or other nonsense might not help, either.
It look like people in the US are more scared of clowns than climate change. Maybe you need to act like a clown, if you want people to be scared of you.
Cheers.
Mike Flynn says:
“Can you give me a single cogent reason why I should answer your questions?”
Because they challenge your claims, and disprove your ideas.
Mike Flynn says:
“If you actually seeking help…I would provide with the details at least about 20th century temperature increases peer reviewed and all!”
More diversion, still no answers.
Mike Flynn says:
“I would say the surface temperature has dropped. And you?”
IF the Earth is cooling, why has surface temperature gone up 1 C in the last century?
David Appell,
Around 7 times as many people, generating more than 7 times as much energy per head results in around 50 times as much being produced night and day.
I know you deny the fact that thermometers record the heat they are subjected to, but don’t blame me for your inability to accept fact.
Lurch off into spiels about overcoats, or the GHE magic Sun which shines on all parts of the world at once.
You might like to correct your assertion that surface temperatures are measured. They aren’t. The supposed surface temperature is a hodge podge of air temperatures, water temperatures, remotely sensed temperatures of grass, soil, roads, buildings, jungle canopies and the lik
Surface temperatures? I wish.
No gotcha there. Not even good try. I answered because it’s obvious you can’t work things out for yourself. You probably don’t realise that putting more fires rounds thermometer causes an increase in temperature. If you want to experiment with just one heat source, move the thermometer closer. If the thermometer doesn’t get hotter, it must be a special climatological thermometer used for measuring hockey sticks or missing heat!
No CO2 heating. No GHE. Just normal physics at work. Didn’t you learn old fashioned physics when you studied for your PhD? The radiative transfer equations will help.
Cheers.
Mike Flynn says:
“Around 7 times as many people, generating more than 7 times as much energy per head results in around 50 times as much being produced night and day.”
Just where do you think the energy people radiate comes from?
It comes from they eat. From plants and animals, who ultimately came from solar energy. So people are energy-neutral from the Earth’s point of view.
Aren’t you some kind of engineer? You should have at least worked out the numbers. 7 billion people radiating about 100 W each comes to 0.001 W/m2 over the Earth’s surface.
Entirely negligible.
Now, via machines, humans do generate about 20 TW to power civilization. That’s still only 0.04 W/m2.
Also negligible.
What’s your next excuse?
Mike Flynn wrote:
“You might like to correct your assertion that surface temperatures are measured.”
Surface temperatures are measured by surface weather stations of thermometers.
Mike Flynn wrote:
“No CO2 heating. No GHE.”
Then explain this diagram, which you always avoid when asked:
http://www.giss.nasa.gov/research/briefs/schmidt_05/curve_s.gif
Account for the difference between the red and black curves.
Guess what, appell-grub.
China, India, Indonesia, Turkey, Poland, and MANY, MANY other countries are going to be continuing to INCREASE their coal and gas fired electricity production.
If humans really are the cause of the massively beneficial CO2 rise we have been fortunate enough to experience, then that atmospheric CO2 level will continue to climb, and climb and climb
And Guess what, little appell-grub…
There is ABSOLUTELY NOTHING you, or any of your CO2 haters, can do about it. (BIG GRIN)
This anti-CO2 idiocy many destroy the economic and power supply stability of some of the stupidest developed countries, but that will be but a tiny reduction in CO2 compared to the massive increases still to come from the developing nations.
TCR = 3.7 W/m2 x [0.012 C/decade x 1.476 decades / 0.489 W/m2]
TCR = 0.13 C
“Do you see any problem with this? Why is this wrong?”
It’s a time series. Dr. Spencer’s scatter diagram is not a time series. The independent variable is temperature not time.
“Tsfc Te = LR x H, where LR is the lapse rate = 6.5 K/km and H is the effective radiating height at about 5.1 km. LR x H gives the approx. greenhouse effect of 33 deg. C.”
That’s not how greenhouse effect is computed. Can you cite textbooks on atmospheric physics where you got this formula?
The link to your research paper Spencer-Braswell-JGR-2010.pdf is broken in the article.
Both links work fine for me!
Due to the drop of the TSI in subsequent cycles of solar changes in the albedo of the Earth they are inevitable.
http://woodfortrees.org/plot/pmod
I am trying to decode this statement. I think he/she means:
The Volkswagen TSI dropped in price.
But I am still interested in buying a solar powered cycle.
My libido will make you enviable.
Dr No, you’ve nailed it . I thought TSI referred to the Trump Stupidity Index or possibly the Trump Scandal Index and I couldn’t understand why anyone would claim it is going down.
The relationship with albedo was also puzzling but your your reference to libido seems appropriate in this context.
Thanks for clearing that up.
doctor no
Please indicate anomalies in sea surface temperature. Where do they occur?
http://www.tropicaltidbits.com/analysis/ocean/cdas-sflux_sst_global_1.png
http://www.metoffice.gov.uk/hadobs/hadsst3/data/HadSST.3.1.1.0/diagnostics/HadSST.3.1.1.0_monthly_globe_ts.txt
From early 1990s the values of both eleven-year and bicentennial components of TSI variations are decreasing at
accelerating (at present) rate (Fig. 2), and hence a fraction of TSI absorbed by the Earth is declining at practically
the same rate (e.g., Frhlich, 2011; Abdussamatov, 2007b, 2009a, b). Average value of TSI in the 23rd cycle was
by 0.17 W/m2 less than in the 22nd cycle. Smoothed value of TSI in the minimum between the cycles 23/24
(1365.24 0.02 W/m2) was by 0.26 W/m2
and by 0.33 W/m2 less than in the minima between cycles 22/23 and
21/22, respectively. However, forming from early 1990s long-term deficit of TSI (see Fig. 2) was not
compensated by decrease in the emission of the Earth intrinsic thermal energy into space which practically
remains on the same high level during 146 years due to thermal inertia of the World Ocean. Since the Sun is
now entering a bicentennial long-term phase of low luminosity (e.g., Abdussamatov, 2004, 2005, 2007b; Penn
and Livingston, 2010; American-astronomical-society, 2011) such energy imbalance of the system (E<0) will
continue further for the next few 11-year cycles. As a result, the Earth as a planet will henceforward have
negative balance (E<0) in the energy budget. This gradual consumption of solar energy accumulated by the
World Ocean during the whole XX century will result in decrease of global temperature after 146 years because
of a negative balance in the energy budget of the Earth. This, in its turn, will lead to the rise of Earth albedo, the
drop of atmospheric concentration of the most important greenhouse gas water vapor, as well as of carbon
dioxide and other gases. Let us note that water vapor absorbs ~68% of the integral power of the intrinsic
long-wave emission of the Earth, while carbon dioxide only ~12%. As a consequence, a portion of solar
radiation absorbed by the Earth will gradually go down together with manifestations of the greenhouse effect
caused by the secondary feedback effects. The influence of the growing consecutive chain of such changes will
cause additional decrease of the global temperature exceeding the effect of a bicentennial TSI decrease.
http://www.ccsenet.org/journal/index.php/apr/article/view/14754/10140
ren says:
“Since the Sun is now entering a bicentennial long-term phase of low luminosity (e.g., Abdussamatov, 2004, 2005, 2007b….”
Abdussamatov’s prediction is already failing:
http://davidappell.blogspot.com/2016/04/is-abdussamatovs-prediction-of-tsi.html
Gees look at the current cycle
REALLY LOW
https://tamino.files.wordpress.com/2016/04/tsispots.jpeg
Abdussamatov is going to have a FAR better prediction than ANY of the ludicrous climate models are to actual real temperatures.
Those silly little climate models just need a barn 10 times the size, so they have at least a small chance of hitting it.
David Appell
A comprehensive spectral analysis of both the solar background magnetic field (SBMF) in cycles 21-23 and the sunspot magnetic field in cycle 23 reported in our recent paper showed the presence of two principal components (PCs) of SBMF having opposite polarity, e.g., originating in the northern and southern hemispheres, respectively. Over a duration of one solar cycle, both waves are found to travel with an increasing phase shift toward the northern hemisphere in odd cycles 21 and 23 and to the southern hemisphere in even cycle 22. These waves were linked to solar dynamo waves assumed to form in different layers of the solar interior. In this paper, for the first time, the PCs of SBMF in cycles 21-23 are analyzed with the symbolic regression technique using Hamiltonian principles, allowing us to uncover the underlying mathematical laws governing these complex waves in the SBMF presented by PCs and to extrapolate these PCs to cycles 24-26. The PCs predicted for cycle 24 very closely fit (with an accuracy better than 98%) the PCs derived from the SBMF observations in this cycle. This approach also predicts a strong reduction of the SBMF in cycles 25 and 26 and, thus, a reduction of the resulting solar activity. This decrease is accompanied by an increasing phase shift between the two predicted PCs (magnetic waves) in cycle 25 leading to their full separation into the opposite hemispheres in cycle 26. The variations of the modulus summary of the two PCs in SBMF reveals a remarkable resemblance to the average number of sunspots in cycles 21-24 and to predictions of reduced sunspot numbers compared to cycle 24: 80% in cycle 25 and 40% in cycle 26.
http://cdn.iopscience.com/images/0004-637X/795/1/46/Full/apj501502f4_lr.jpg
http://iopscience.iop.org/article/10.1088/0004-637X/795/1/46/meta;jsessionid=82CB8252B832C0AE611DF30F8001DE5C.c1.iopscience.cld.iop.org
David Appell
“CAUSE LONG CYCLES SOLAR (CONTINUED)
LAW AND OHL GNEVYSHEV
Solar cycles are numbered from a minimum to a minimum since Cycle 1 of 1755/1766, the maximum was in 1761. And now we come to the cycle No. 24 which had its absolute minimum in late 2008 and should have its maximum 2013.Selon to the law of GO (Gnevyshev-Oh) an odd-numbered cycle is more active and thus more sunspots that the number is even cycle preceding it. This allows to have an idea of solar activity cycles odd.
But during these 23 cycles, the O G-law was raped by three pairs of odd-even cycles. Those are the cycle No. 4-5 so the solar cycle from 1785 to 1798 and from 1798 to 1810, the cycles No. 8-9 so the solar cycle from 1834 to 1843 and from 1843 to 1856 and then the cycles No. 22- 23 is of 1985-1996 and 1996-2007 because contrary to the law of the GO odd-numbered cycle is more active than the preceding even cycle.
If as was indicated Mr Hathaway (NASA, member of the panel forecasting the solar cycle) cycle No. 25 could be one of the lowest of the last century then there will be violation of the law between the GO N cycles 24 and 25 .
Violations of the G-O Law held near a time when the orbital motion of the Sun around the center of gravity is retrograde and when the orbital angular momentum of the Sun decreases a lot and quickly. At these times there was approximately an alignment of Jupiter-Sun-Saturn-Uranus-Neptune so the center of gravity is near the center of the Sun and reverse with an alignment of the Sun-Jupiter-Saturn-Uranus-Neptune around 6 years after the more or nearly one year. So a quick change in the distance between the Sun and the center of gravity. Because when Saturn-Uranus-Neptune are on the same side of the Sun while Jupiter has a shorter orbital period varies very quickly the distance between the Sun and the center of gravity.”
http://la.climatologie.free.fr/soleil/soleil2.htm#g-o
Let’s look at the forecast of circulation in the lower stratosphere at the northern hemisphere.
http://www.cpc.ncep.noaa.gov/products/stratosphere/strat_a_f/gif_files/gfs_z70_nh_f120.png
http://www.geomag.bgs.ac.uk/images/charts/jpg/polar_n_f.jpg
I forgot to mention that the two bodies are not permitted to make any other transfers than the ones mentioned. In other words they are isolated apart from the heat transfer that is mentioned.
Christopher Game,
You may be interested in this:
https://wattsupwiththat.com/2016/09/07/how-climate-feedback-is-fubar
as he seems to be making similar arguments as you are regarding Bode, Hansen, etc.
Thank you for this, RW. Yes, parts of that article do say things about Bode’s theory, more or less as I am saying. It specifically blames Schlesinger, as well as Hansen. On other parts of that article I make no comment.
It starts very strong geomagnetic storm. Opposite the Earth is huge coronal hole that sends streams of high-energy electrons.
http://www.n3kl.org/sun/images/noaa_kp_3d.gif?
Very rises ionization over the polar circle.
http://sol.spacenvironment.net/raps_ops/current_files/rtimg/dose.15km.png
This is a tough one. I think it means:
Viruses in the nation cycle over the pole.
During strong geomagnetic storms increases the strength and depth of earthquakes in California.
https://ww2.volcanodiscovery.com/fileadmin/charts/quakes-r103_25.png
The Italian Chef Behind The World’s Best Restaurant Makes Some Crazy Lasagna.
http://www.huffingtonpost.com.au/2016/10/25/the-chef-at-the-worlds-best-restaurant-makes-some-crazy-lasagna/?utm_hp_ref=au-homepage
If you are in Rome to remember that the Italian shoe the breaks.
“If you are in Rome to remember that the Italian shoe the breaks.”
Now you are making much more sense.
Please translate a:
Most important Earthquake Data:
Magnitude : 4.2
Local Time (conversion only below land) : 2016-10-27 01:52:33
GMT/UTC Time : 2016-10-26 23:52:33
Depth (Hypocenter) : 10 km
Most important Earthquake Data:
Magnitude : 6.1
Local Time (conversion only below land) : 2016-10-26 21:18:11
GMT/UTC Time : 2016-10-26 19:18:11
Depth (Hypocenter) : 20 km
http://earthquake-report.com/2016/10/26/very-strong-earthquake-central-italy-on-october-26-2016-2/
Please translate a:
27 ottobre 2016 Decine e decine di scosse nella notte hanno continuato a far tremare il centro italia dopo le tre, violente avvertite ieri sera lungo il confine tra Marche e Umbria. La prima alle 19.10 di magnitudo 5.4 . La seconda – la pi forte – alle 21.18 di magnitudo 5.9. La terza, alle 23.42 di 4.5. L’epicentro tra i Comuni di Castel S’Angelo sul Nera, Visso, Ussita – nel maceratese – e Preci, in provincia di Perugia. . Sono migliaia al momento gli sfollati. Ci sarebbero alcuni feriti. E una vittima .un anziano colto da infarto alla prima scossa. Oggi scuole chiuse a L’Aquila, Assisi, Foligno, Bastia umbria, Perugia, Camerino, Teramo, Terni e Ascoli Piceno. – See more at: http://www.rainews.it/dl/rainews/articoli/Terremoto-La-terra-torna-a-tremare-tra-Marche-e-Umbria-Ussita-Visso-crolli-e-paura-Interi-borghi-inagibili-46beadb6-a1d3-452d-a984-2a76c5d2e105.html
Such a pressure distribution in the stratosphere means the influx of Arctic air to the eastern US.
http://www.cpc.ncep.noaa.gov/products/stratosphere/strat_a_f/gif_files/gfs_z30_nh_f00.png
http://www.nationalreview.com/article/441438/wikileaks-john-podesta-silenced-climate-change-dissent
If climate sensitivity is low we must have some major forcing during ice age transitions to effect 4-6C global temp change.
I would expect to see a much more stable geological climate timeline with strong negative sensitivity.
Strong negative feedback maybe. However, small negative feedback would lead to low sensitivity as well
barry
I think your point is interesting. I might suggest that the melting Arctic Ice actually results in greater cooling overall or that is what the evidence suggests. It is true less ice in summer months could allow more solar energy into the system but it seems cloud in the Arctic summer prevent this and act like sea ice.
https://en.wikipedia.org/wiki/Climate_of_the_Arctic
From this article: “Frequent cloud cover, exceeding 80% frequency over much of the Arctic Ocean in July (Serreze and Barry, 2005), reduces the amount of solar radiation that reaches the surface by reflecting much of it before it gets to the surface. Unusual clear periods can lead to increased sea-ice melt or higher temperatures”
The evidence that melting sea ice cools the globe comes from CERES net longwave (all-sky) radiation in the Arctic Circle.
With this tool:
https://ceres-tool.larc.nasa.gov/ord-tool/jsp/EBAFSFCSelection.jsp
It should be set for the Arctic Circle.
Click “Visualize Data”
Scroll down to image of “Surface Net Longwave Flux (all-sky)” then click on an image.
In the box that is brought up click on “Area Mean Time Series” and it will bring up a graph.
This graph indicates that as sea ice melts the net loss of longwave radiation increases (the GHE is not changing much but the warmer open water is radiating more energy than the colder ice would).
From the graph I estimate maybe an increase loss of 10 Watt/m^2 from 2000 to today. The Arctic Circle makes up 4% of the globe’s surface so a 10 Watt/m^2 loss would be 0.4 W/m^2 spread over the entire globe.
If the Arctic would become ice free in summer and warm so that ice did not form till much later it would really be radiating away a lot of energy once the Sun went down.
And what of the change in albedo?
David Appell
The CERES data shows what happens. Clouds in the Arctic summer do what ice would do as I had put in my post to barry.
If you use the CERES tool to build your own graphs of the Arctic.
https://ceres-tool.larc.nasa.gov/ord-tool/jsp/EBAFSFCSelection.jsp
You can check out All-Sky and Clear-Sky conditions. In July for Shortwave flux Net, clear sky is 214 Watt/m^2 in July but all sky it is only 150. The difference is in the clouds.
Also you can see a gain in shortwave net to surface in clear sky over the time period from 2000 to now but you do not see any increase in the all sky net shortwave for the same period. The albedo effect is working during clear sky conditions, but most the Arctic summer is dominated by clouds so the decrease in sea ice albedo is countered by clouds so that overall effect is very little.
Norman – if you are suggesting that there is strong negative feedback in the Arctic, how then do you explain global changes of 4-6C during ice age transitions? And regionally, the temp change at both poles is in the order of 9-12C for the complete transition. If – and I’m not sure I understood your post correctly, so tell me if I’m mistaken – the negative feedbacks work for both cooling and warming at the pole, the forcing must be very strong indeed to effect such a large change.
Consider also that during ice age transitions only one pole is getting more of the initiating forcing (change in focus of insolation), while the other is getting less – yet the temp changes are in sync at both poles (there is a relatively small lag compared to the thousands of years during glacial transition).
This is why I question that there is – necessarily – strong negative feedbacks. Strong neg feedbacks make large climate swings like the ice ages/interglacials of the last couple million years very difficult to explain.
They don’t really. Milankovitch hypothesis can explain the the large temperature changes between the glacial/interglacial periods. More (or less) solar energy is distributed into the NH during the summer, which affects how much winter snow melts or doesn’t melt. These distribution swings are on the orders 50 W/m^2.
134 km NE of Roma, Italy / pop: 2,564,000 / local time: 19:10:38.6 2016-10-26
62 km E of Perugia, Italy / pop: 150,000 / local time: 19:10:38.6 2016-10-26
39 km NW of Ascoli Piceno, Italy / pop: 51,400 / local time: 19:10:38.6 2016-10-26
Most important Earthquake Data:
Magnitude : 5.5
Local Time (conversion only below land) : 2016-10-26 19:10:39
GMT/UTC Time : 2016-10-26 17:10:39
Depth (Hypocenter) : 10 km
http://earthquake-report.com/2016/10/26/earthquakes-in-the-world-on-october-26-2016-m4-5-or-more/
The stratospheric PV is predicted to significantly weaken into early November. All weather models now predict an unprecedented and significant early split of the stratospheric PV. I expect the circulation anomalies associated with the PV split to descend into the mid and lower troposphere later in November. When this occurs expect the cold and snow that has been mostly confined to Siberia so far, to expand into the mid-latitudes resulting in an early start to winter weather for widespread portions of northern Eurasia, including Europe and East Asia, and possibly the eastern United States (US).
https://www.aer.com/science-research/climate-weather/arctic-oscillation
Radiation levels in the cabin of the Boeing 767 (Condor flight 2091) tripled within ten minutes after takeoff, and were nearly 40 times ground level by the time the plane reached cruising altitude at 33,000 feet. There was no solar storm in progress. The extra radiation was just a regular drizzle of cosmic rays reaching down to aviation altitudes. This radiation is ever-present and comes from supernovas, black holes, and other sources across the galaxy.
http://spaceweather.com/
Re failed La Nina.
I have just noticed that the 30-day average SOI has gone negative for the first time in a long while.
What are the odds of an El Nino next year?
That thought will make the deniers nervous!
Indeed:
https://www.longpaddock.qld.gov.au/seasonalclimateoutlook/southernoscillationindex/30daysoivalues/
Indeed:
http://www.tropicaltidbits.com/analysis/ocean/nino34.png
Clutching at straws certainly increases the chance of an El Nino!
The BOM fine print:
“Sustained negative values of the SOI below −7 often indicate El Niño episodes. “
“30 day (or larger) average SOI values are the key indices for forecast purposes.”
The 30 day avg SOI has just hit -1.4! The 90 day avg SOI is +5.5
Other BOM fine print (25 Oct, 2016):
“Most climate models predict SSTs will remain cooler than average, but ENSO-neutral, through until the end of the 2016–17 summer. Only two of eight models suggest brief, weak La Niña levels may occur towards the end of 2016. The ENSO Outlook remains at La Niña WATCH.
Warmer than average sea surface temperatures to Australia’s north suggest that some La Niña-like impacts are likely, even if an event never fully develops.”
ENSO Update prepared by:
Climate Prediction Center / NCEP
24 October 2016
“ENSO Alert System Status: La Niña Watch
–
neutral conditions are present.*
Equatorial sea surface temperatures (SST) are below average in the central and east
–
central Pacific Ocean.
La Niña is favored to develop (~70% chance) during the Northern Hemisphere fall 2016 and slightly favored to persist (~55% chance) during winter 2016 “
–
Clutching at straws would certainly increase the chance of an El Nino!
The BOM fine print:
“Sustained negative values of the SOI below -7 often indicate El Nio episodes.
30 day (or larger) average SOI values are the key indices for forecast purposes.”
The 30 day avg SOI has just hit -1.4! The 90 day avg SOI is +5.5
Other BOM fine print (25 Oct, 2016):
“Most climate models predict SSTs will remain cooler than average, but ENSO neutral, through until the end of the 201617 summer. Only two of eight models suggest brief, weak La Nina levels may occur towards the end of 2016. The ENSO Outlook remains at LaNia WATCH.
Warmer than average sea surface temperatures to Australia’s north suggest that some La Nina-like impacts are likely, even if an event never fully develops.”
ENSO Update prepared by:
Climate Prediction Center / NCEP
24 October 2016
“ENSO Alert System Status: La Nina Watch
–
neutral conditions are present.
Equatorial sea surface temperatures (SST) are below average in the central and east
–
central Pacific Ocean.
1. La Nina is favored to develop (~70% chance) during the Northern Hemisphere fall 2016 and slightly favored to persist (~55% chance) during winter 2016 “
It might be worthwhile to check the current sea surface temperature?
http://www.tropicaltidbits.com/analysis/ocean/cdas-sflux_sst_global_1.png
Decreased surface temperature of the north eastern Pacific.
http://www.intellicast.com/Global/Satellite/Infrared.aspx?region=hipacsat&animate=true
If I may be permitted to answer my own question:
3 out of 8 models predict positive Nino3.4 anomalies by March of next year.
Early days, but the chances of an El Nino for next year must definitely be greater than zero!
What about the anomalies of heat in the Pacific?
http://www.cpc.ncep.noaa.gov/products/analysis_monitoring/enso_update/heat-last-year.gif
The tautology of your answer is impeccable much like stating that prior to satellites one had to attribute a probability greater than zero that the other side of the moon was made of green cheese.
However your question was followed by a statement:
“What are the odds of an El Nino next year?
That thought will make the deniers nervous!”
I don’t know of anyone being concerned that some rats might be aboard the moon landing craft and feared they might eat half the moon away.
Similarly with your claim that THE “deniers” would be nervous. I am such a “denier” and can say I am neither quivering nor concerned. Do you know of even one such “denier” who is nervous?
Tell me your estimate of the chances for an el nino next year.
It is not difficult to arrive at an estimate.
Clue: El Ninos occur, on average, every 4 to 5 years.
The issue is not what I guesstimate but the garbage that you write – admirably followed up by Sir Apple with an emphatic “indeed!”
“garbage” ?
Please, let’s be polite.
I am confident that my statements are all factually correct.
Please advise otherwise.
El Ninos are driven by SOLAR forcing … nothing to do with anthropogenic anything.
Thanks for confirming that the ONLY warming in the last 38 years has come from NON-CO2 El Nino events.
Oh wait there.. that was an accident, wasn’t it.. you actually no-nothing. !
I have been exceptionally polite as my descriptor for your comment is mild. It seems you could not see your logical fallacies even when your nose is rubbed in the stench of that garbage.
As for being polite you might start to contemplate your use of the term “denier” if you can ever bring yourself to be introspective enough to face truth. What exactly are “deniers” denying might be a good start.
You might address my statement and question:
Similarly with your claim that THE deniers would be nervous. I am such a denier and can say I am neither quivering nor concerned. Do you know of even one such denier who is nervous?
I doubt you will but even if you do there is no need to report back.
“I have been exceptionally polite as my descriptor for your comment is mild. It seems you could not see your logical fallacies even when your nose is rubbed in the stench of that garbage.”
That sounds suspiciously impolite to my tender ears.
“What exactly are deniers denying might be a good start.”
Lets start with this:
When trying to understand what’s happening to our climate, do you consider the full body of evidence? Or do you find the denial instinct kicking in when confronted with inconvenient evidence?
For example, let’s look at the question of whether global warming is happening. Do you acknowledge sea level rise, a key indicator of a warming planet, tripling over the last century? Do you factor in the warming oceans, which since 1970 have been building up heat at a rate of two-and-a-half Hiroshima bombs every second? Glaciers are retreating all over the world, threatening the water supply of hundreds of millions of people. Ice sheets from Greenland in the north to Antarctica in the south are losing hundreds of billions of tonnes of ice every year. Seasons are shifting, flowers are opening earlier each year and animals are migrating towards the poles. The very structure of our atmosphere is changing.
We have tens of thousands of lines of evidence that global warming is happening. A genuine skeptic surveys the full body of evidence coming in from all over our planet and concludes that global warming is unequivocal. A climate denier, on the other hand, reacts to this array of evidence in several possible ways.
http://www.abc.net.au/news/2011-05-30/cookskeptic/2737050
Secondly, If I was a (god forbid!) denier, I would be thinking at this moment:
“Unfortunately,that La Nina was a fizzer. It could have put a break on rising temperatures and allowed me to claim that the pause was still in place. Now it has fizzled, there is a slim possibility of an El Nino next year, which would make rising temperatures appear to be accelerating at an even greater rate. That would severely go against my “denial instinct” and may even make me appear foolish to the world at large. I am feeling a bit nervous.”
I have been exceptionally polite given your pachyderm behaviour and penchant to throw pejorative labels clearly associated with Holocaust deniers and Dr Lew idee fixe. Your tender ears reveal more delusional behaviour. No doubt Dr Lew would be impressed with your level of cognitive dissonance; surely you would make good bed-fellows.
It is clear from the start that rather than address the logical fallacy in your original comment you try to distract by obfuscating and conflating in an attempt to swing the issue to anything other than your comment.
In brief I went to some extreme lengths to highlight the absurdity of your original post all to no avail. I even emphasized the incongruity of the all inclusive nature of your absurd statement to which again you have not responded viz:
“Similarly with your claim that THE ‘deniers’ would be nervous. I am such a ‘denier’ and can say I am neither quivering nor concerned. Do you know of even one such ‘denier’ who is nervous?”
Instead you placed yourself in the position of a denier when I asked whether you knew of even ONE such denier. Only delusional people would use such an argument and label. You are well qualified!
When challenged on your use of the the term denier you go into waffle and more garbage as I know of no-one who disputes the general gist of your claim. This general gist is nothing that has not happened before in the Holocene and geologic history; natural variation it is called.
Indeed there are far more extreme illustrations of climate change and clear disparities with CO2 being over ten times the current levels and T being no greater than today. Hence, your use of the term denier is clear evidence of your penchant to cast aspersions.
Science is about hypothesis testing and not general alarmist waffle or Mann’s belief that proofs are for spirits and geometry and that as long as you feel it is right then that is good enough. Thus far the alarmist hypothesis is falsified by the ample failure of key predictions made and unvalidated models all failing in one direction. The chance of that happening if they were correct is zilch.
It only needs one failure to reject a hypothesis.
Even Dr Lew would surely get it right in declaring extreme cognitive dissonance in your case. You are wasting my time.
“I am such a denier and can say I am neither quivering nor concerned”
“You are wasting my time.”
All right then, let’s not use the term “nervous”.
How about “irritated”? – which you obviously are.
You are a time waster indeed.
Irritated at your obfuscation, conflation, meandering, cognitive dissonance, presumptiveness, lack of science and simply concluding you are time waster yes, freely admit that. Have seen close similarities with religious proselytizing wanderers.
As for any other irritation (as some sort of substitute for your nervous) and you are again found wanting by presuming too much. I actually welcome warming having just gone through the coldest September in 120 years!! Do I need to repeat that? Oct is not going to be much better. The warming is a blessing by most objective accounts. Naah it never gets through to pachyderms with an idee fixe.
Between Lew, Cook and yourself we have the consummate three amigos. The only persons in denial of facts are people such as yourselves who fail to accept all the facts both supportive and contra to an idea, a conjecture. In science we are entitled, indeed encouraged, to dream up whatever idea or conjecture in falsifiable form that we wish. If it is to be science, real science, then that conjecture must be shown to hold and continue to hold true. Thus far this is a complete failure even with highly dubious massaging of records.
Yet you have the hide, pachyderm hide, to label skeptics as deniers when the cap fits you ever so neatly. Cognitive Dissonance thy name is Dr No!! No? Oh yes!! Cmon try and face some reality in your life.
“Yet you have the hide, pachyderm hide, to label skeptics as deniers when the cap fits you ever so neatly. Cognitive Dissonance thy name is Dr No!! No? Oh yes!! Cmon try and face some reality in your life.”
My oh my.
You are really irritated.
I feel as though the wrath of God is about to smite me.
Now I am the one who is nervous.
Oh and I tried to save you – from yourself.
If you are afraid to face reality then I guess you have cause for concern. But to believe in the wrath of God is not only so passe but a clear indicator of why you are so afflicted by cognitive dissonance.
You need help; Dr Lew will surely assist.
Poor Dr No-nothing.. nervous at your third try at your junior high exams are you !
It’s AndyG55!
With TonyM on my case, the wrath of God hovering and now you – I am really nervous.
.
.
(not)
doctor no
Never fear ; Dr Lew will be near.
Pressure anomalies in the stratosphere still persist.
http://www.cpc.ncep.noaa.gov/products/stratosphere/strat-trop/gif_files/time_pres_HGT_ANOM_OND_NH_2016.png
http://www.cpc.ncep.noaa.gov/products/stratosphere/strat_a_f/gif_files/gfs_z50_nh_f00.png
http://www.cpc.ncep.noaa.gov/products/stratosphere/strat_a_f/gif_files/gfs_o3mr_50_nh_f00.png
“It has always bothered me that the net feedback parameter that is diagnosed by linear regression from very noisy data goes to zero as the noise becomes large (see Fig. 1). A truly zero value for the feedback parameter has great physical significance a marginally unstable climate system with catastrophic global warming yet that zero value can also occur just due to any process that de-correlates the data, even when feedback is strongly negative.”
Dr. Spencer,
Climate change occurs at 2.8 x 10⁻⁷ degree K per hour; it is infinitesimal change. For all practical purposes, the earth system is in thermodynamic equilibrium at every thermodynamic transformation. If it is in equilibrium, why feed-backs of any sort would exist?
Your number is too low by a factor about 5-10.
But you could get it even lower if you used units of K/second. Go for it.
Nabil, scientific notation confuses the appell-grub.
He is a low-end sci-fantasy writer.. that is all he knows.
David, In practical applications we use per hour. If you think warming of 0.65 degree K per 265 years is not infinitesimal, then what is infinitesimal in your opinion?
Mmmm
As ever the inability of some to think in *relative* terms.
As though human experience covers it all….
“As the Earth moved out of ice ages over the past million years, the global temperature rose a total of 4 to 7 degrees Celsius over about 5,000 years. In the past century alone, the temperature has climbed 0.7 degrees Celsius, roughly ten times faster than the average rate of ice-age-recovery warming.”
http://earthobservatory.nasa.gov/Features/GlobalWarming/page3.php
Is the sun may be even more quiet?
http://wso.stanford.edu/gifs/DipallR.gif
There will still be warmer in the Arctic because the polar vortex in the stratosphere is broken.
http://www.cpc.ncep.noaa.gov/products/stratosphere/strat_a_f/gif_files/gfs_t30_nh_f00.png
On the animation you can see how warm air flows into the Arctic over the Bering Strait.
http://www.intellicast.com/Global/Satellite/Infrared.aspx?region=hinpole&animate=true
Jumping the speed of the solar wind, which led to the breakdown of the polar vortex.
http://files.tinypic.pl/i/00834/avvo6shk1bng.gif
http://files.tinypic.pl/i/00834/ktfgtynlbfgd.png
It would be interesting to see the time series that went into Figures 1 & 2. Can Dr. Spencer post a list of data points and the dates/times they correspond with? I know figure 3 basically takes this into account but the raw data would contain more information.
I’ve worked it out!
Ren is a budding Japanese Haiku poet.
Is the sun may be even more quiet?
There will still be warmer in the Arctic
The polar vortex in the stratosphere is broken
See how warm air flows
Into the Arctic over the Bering Strait
Jumping the speed of the solar wind
Quite beautiful.
You guessed it, it’s my name:
REN氣
Doctor no unfollow El Nino 3.4 index.
http://www.tropicaltidbits.com/analysis/ocean/nino34.png
Temperature at 2 meters on the northern hemisphere.
http://pamola.um.maine.edu/fcst_frames/GFS-025deg/5-day/GFS-025deg_ARC-LEA_T2_5-day.png
Very high pressure in the Arctic.
http://pamola.um.maine.edu/fcst_frames/GFS-025deg/5-day/GFS-025deg_ARC-LEA_PMSL_5-day.png
http://pamola.um.maine.edu/fcst_frames/GFS-025deg/DailySummary/GFS-025deg_WORLD-CED_PMSL.png
Speaking of the wrath of God, he/she may be getting ready to inflict another flooding/sea level rise event on us:
“The Northwest Passage, a mythical link through the Canadian Arctic between the Pacific and Atlantic until 1854, is now a viable commercial route. Until 2009, the Arctic pack ice prevented regular marine shipping throughout most of the year but the Arctic sea ice decline has rendered the waterways more navigable. Currently, the Arctic sea-ice extent shows a record low for late October, as calculated by the National Snow and Ice Data Center after measurements began by satellite measurements in 1979.
The year’s Antarctic ice extent peaked very early, on August 31, and is now at its second-lowest value on record for late October, beaten only in 1986. In a review paper published in Nature Climate Change in September, unmistakable signs of climate change in the Antarctic were noted, including warming of the subsurface ocean, thinning of ice shelves, and the acceleration of outlet glaciers that ring the ice sheet.”
http://www.aljazeera.com/news/2016/10/antarctic-melting-161027111059714.html
doctor no:
So now you have decided it is no longer CO2 but the wrath of God which causes sea level rise.
Your God will need to change the Physics laws if you believe that melting sea ice is going to increase sea levels.
You need help urgently; time to bypass Dr Lew and go straight to the top!
the doctor no post referred to was:
http://www.drroyspencer.com/2016/10/what-do-16-years-of-ceres-data-tell-us-about-global-climate-sensitivity/#comment-228942
Since this post is still open, I will add a comment.
Dr Spencer writes:
This is why, in a traditional engineering sense, the total climate feedback is always negative.
With respect, I don’t think the Hansen-Schlesinger use of the word ‘feedback’, that seems to be used here, is in the traditional engineering sense.
As I understand the traditional engineering sense, there is implicit in it, in the system, a definite loop around which a signal passes. The system has a source signal, which is an independently set arbitrary function of time. The source signal passes through a summing element, the output of which is the input to a forward gain element, which has an output, which is an other function of time, functionally dependent on the input. The output is sampled and the sample (possibly operated upon by another circuit element) is added to or subtracted from the source signal by the summing element. The signal is thus passed around a loop, which has a definite loop transfer characteristic.
The problem is that the present source signal of interest seems to be the atmospheric carbon dioxide level. The usual approach is to suppose the earth/atmosphere system to run at a steady state, and to impose a time variation on the atmospheric carbon dioxide level. The customary time variation is a step of the level, from some fixed chosen historical time-invariant value, to a new time-invariant value twice the historical value. The output signal of interest is the temperature of the earth/atmosphere system at some place, for example the surface. The traditional engineering feedback signal would be a change in carbon dioxide level, to be added to, or subtracted from, the new (as just defined) doubled carbon dioxide level.
As a matter of fact, it is not absurd to speak of a change in carbon dioxide level governed by an input carbon dioxide level. But such is not what is intended in the Hansen-Schlesinger model.
Therefore I think it is not right to say that the traditional engineering sense of the word ‘feedback’ is being used here. If it is intended to have some kind of energy transfer as the signal, then in the traditional engineering model, I think the carbon dioxide level is more naturally regarded as a step-changed parameter than as a signal quantity subject to feedback.
Consequently, I think the talk of ‘feedback’ in the present study is a new and specific usage of the word. The step of carbon dioxide level is regarded as a virtual step of added radiative source signal. As far as I can see, this added radiation is obtained by subtracting some outgoing long-wave radiation and treating it as a source. This is so far from the traditional engineering model that I think it deserves a new and specific mathematical formalism and exposition. I think without such a new and specific mathematical formalism and exposition, the study is bound to be unsatisfactory.
Dr Spencer writes of ‘noise’. I think this really refers to signal that is not given satisfactory expression in the formalism that is used in the study. This is a problem.
It could be said that the customary talk, as exemplified in what Dr Spencer has posted here, is based on an inappropriately simplified model. I think Dr Spencer reaches a conclusion not far from this, when he writes:
… the IPCC might recognize the issue and do something about it.
With respect, I don’t trust the IPCC to do something useful about it. I would like to see Dr Spencer supply a new model, with appropriate formalism and mathematical exposition. I would think it better to avoid the use of the term ‘feedback’ because it has been muddied by Hansen and Schlesinger in the present context.
Commenting further:
Dr Spencer writes:
Radiative forcing is a radiative imbalance between absorbed sunlight and emitted infrared energy which is not the result of a temperature change, but which can then cause a temperature change (and, in turn, radiative feedback).
and
Radiative feedback is the radiative response to a temperature change which then feeds back upon that temperature change.
To me, ‘radiative forcing’ and ‘radiative feedback’ both look like functions of state of the system. Neither looks like an arbitrarily or independently imposed source signal. I am not optimistic that this study can make good progress without a good independently imposed source signal.
A little reading informs me that the formalism I am asking for, as an improvenent on the Hansen-Schlesinger one, is supplied in the textbook of Pierrehumbert (2009).
The telltale signature of phase-space time series, the looping behavior, first appeared to me when I was trying to infer the thermal conductivity and heat capacity of dry soil from nothing more than soil-temperature time series at different depths for my M. S. project in the mid 1980s. It showed up again in the mid-2000s when I was trying to infer the extinction efficiency of agricultural aerosols from time series of extinction coefficients regressed against aerosol mass concentrations. The looping behavior in those two cases was easily removed by an appropriate lag function, which is appropriate for systems that don’t have many moving parts. Given the dramatically greater complexity of the climate system, it’s remarkable that you and co-authors found the central tendency of the slopes of those striations to approximate one of the key model parameters.
So my question to Dr. Spencer is this: might it be helpful to go a step beyond the sort of _ad_hoc_, visual appraisal of the phase-space diagrams and generate a histogram of their temporal, point-to-point variations (dX/dt, dY/dt)? I would expect to see a histogram whose MODE, at least, is on the order of the system parameter, with stronger central tendency for systems in which the interference between internal forcing and actual feedback is weaker. Not sure if that would add anything to an already excellent, accessible analysis, but it is a curiosity.
Thanks, BTW, for a great teaching tool in the form of your 2010 paper, “On the diagnosis of…” I plan to use it as a teaching tool, not about atmospheric science itself, but about the interactive use of dynamic models and statistics to tease out analytical bias, which students these days desperately need to learn and understand.
Brent