Brace Yourselves: Snowstorm to Breed Global Warming Hysteria

March 13th, 2017 by Roy W. Spencer, Ph. D.

With apologies to Benjamin Franklin, only three things in life are certain: death, taxes, and blaming bad weather on global warming.

By mid-week this week, newspaper and website stories will be reporting that climate experts (e.g. Al Gore, Bill Nye) have now blamed the historic snowstorm and unseasonable cold now descending on New England on climate change.

I suspect a few of these experts already have their tweets composed, just waiting for snow totals to exceed one foot.

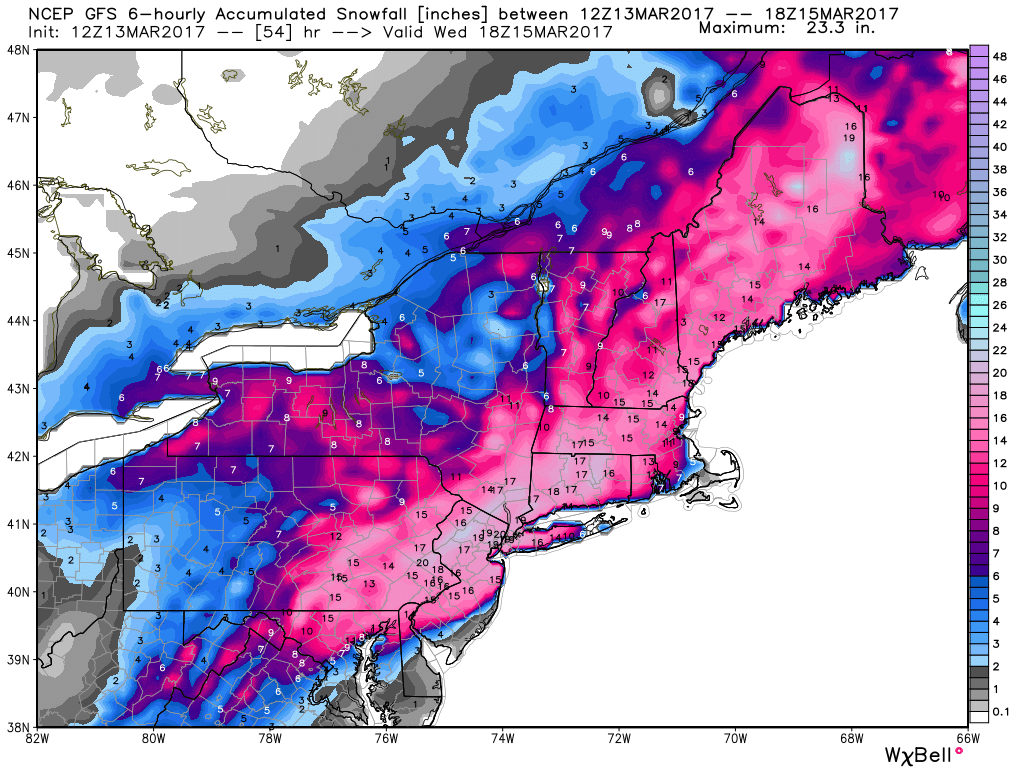
Indeed, the latest GFS model forecast shows that by midday Wednesday some rather spectacular snow totals will have probably accumulated, from the DC area through Philadelphia, NYC (maybe 20 inches there), and Boston (graphic courtesy of Weatherbell.com):

The Nor’easter and cold temperatures will be blamed on the same climate change that caused the unusual warmth over the eastern U.S. over the past couple months.

Global warming theory is in fact so malleable that it predicts anything. More cold, less cold. More snow, less snow.

What a powerful theory.

And what’s even more amazing is that climate change can be averted by just increasing your taxes.

But what nobody ever reports on — because it would be boring — are the storms and severe weather events that haven’t happened. For example, U.S. tornado counts have been running below average, or even at record lows, in recent years.

Amazingly, the low tornado activity has been blamed on climate change. So, too, have actual tornado occurrences!

What a grand and gloriously useful theory global warming provides us.

Is it any wonder that the public tends to be skeptical of what the experts tell us, when those experts continually change the narrative as their forecasts turn out wrong?

Winters in the U.S. are notoriously variable. Typically, if it’s warm in the East, it’s cold in the West. This is exactly what has happened this winter, except for this brief reversal before winter’s end.

Normal people call it weather. More enlightened people, in contrast, call it climate change. Next winter it could be the opposite. No one knows.

Like death and taxes, though, what is certain is that anything “unusual” that happens will somehow be blamed on your SUV.


539 Responses to “Brace Yourselves: Snowstorm to Breed Global Warming Hysteria”

Toggle Trackbacks

  1. Thomas says:

    Nostradamus had nothing going for him in the way of universality and versatility compared to the AGW theorists.

    • Gordon Robertson says:

      Thomas…”Nostradamus had nothing going for him in the way of universality and versatility compared to the AGW theorists”.

      The thing I liked best about Nostradamus was his claim that he grew himself a new set of teeth. If the body has the intelligence to create a seriously complex structure like a human body from a few cells, surely it’s possible to tap that intelligence to grow a new set of teeth. Who knows?

      Unfortunately, many climate alarmists presume whatever is in their minds must be stemming from intelligence. Unfortunately we humans don’t choose intelligence, it chooses us, whenever we get out of the way and allow it to act.

      The way the human mind operates we are likely suppressing the true intelligence that created us with an ego that demands the focus. Most arguments I hear from alarmists are myopic and ego-based.

      • David says:

        As quoted by Albert Einstein;
        Two things are infinite: the universe and human stupidity; and I’m not sure about the universe.
        Happy 138th Birthday AE!

    • Nate says:

      Roy,

      You seem to have an unusual weather filter: only highlighting the cold episodes, and never mentioning the warm periods, like the one we had couple of weeks back (set records many places).

      • JDHuffman says:

        Nate, it appears you overlooked this:

        Winters in the U.S. are notoriously variable. Typically, if its warm in the East, its cold in the West. This is exactly what has happened this winter, except for this brief reversal before winters end.

        • Kes Heffer says:

          Report:
          “On March 12, temperatures in the Northeast hovered in the mid-50s. But on March 13, cold Arctic air from Canada collided with Gulf air from the south and temperatures plunged. Rain turned to snow and winds reached hurricane-strength levels. By midnight on March 13, gusts were recorded at 85 miles per hour in New York City. Along with heavy snow, there was a complete whiteout in the city when the residents awoke the next morning.

          Despite drifts that reached the second story of some buildings, many city residents trudged out to New Yorks elevated trains to go to work, only to find many of them blocked by snow drifts and unable to move. Up to 15,000 people were stranded on the elevated trains; in many areas, enterprising people with ladders offered to rescue the passengers for a small fee. In addition to the trains, telegraph lines, water mains and gas lines were also located above ground. Each was no match for the powerful blizzard, freezing and then becoming inaccessible to repair crews. Simply walking the streets was perilous. In fact, only 30 people out of 1,000 were able to make it to the New York Stock Exchange for work; Wall Street was forced to close for three straight days. There were also several instances of people collapsing in snow drifts and dying”
          Correction: I have just added 2 days to the correct dates; the year was 1888.
          http://www.history.com/this-day-in-history/great-blizzard-of-88-hits-east-coast

      • The warm period, regardless of records set (so VERY brief, our records), is NORMAL. And therefore “human caused,” just like this blizzard is NORMAL, and therefore “human caused.”

        So, Nate, think really, really hard and tell me, what, exactly, is NOT predicted by Climate Change Theory… What type of weather/climate would that be?

        But it is too late for your answer to be correct – ALL weather events and ALL climate events are predicted. There is NOTHING that is not “within predictions,” even a 50+ cooling cycle would be blissfully explained away, as even THAT is “within predictions,” especially since a 40 year cooling cycle has already occurred and is therefore “within predictions.”

        Have you figured out predictions of catastrophe are Cargo Cult science yet?

      • JB says:

        To conflate a weather event with climate change is folly.

      • Nate says:

        The media and weather channels like to hype every weather event, even naming snowstorms. This snowmageddon may turn out to be snowbigdeal.

        Dont confuse what some media do with what climate science is actually saying.

        what climate science evidence shows is that certain extreme weather, especially heat waves, has become more likely. There are other tentative predictions, such as extreme rain events.

        There is research (not yet proven) that arctic air may occasionally penetrate further south. If the arctic is several degrees C warmer than in the past, and if more arctic ocean is ice free in warm months, it should not be surprising that this will have consequences down here.

        • Have you thought about attempting to answer my simple question? There are infinite hypotheses and theories whose proponents can confidently state MANY occurrences that would falsify (disprove) the main tenets.

          Why is this answer so illusive in AGW theory? You are a proponent of this theory – tell me, if you can, what would falsify AGW? If you cannot, you should at least wonder why…

          Climate science, such as it is, also predicts LESS extreme weather (not including heat waves) since mainstream climatology used to agree that generally cooling climate states would bring more powerful storms because storms are energized by temperature differentials. Also, during the cooling scare of the late 60s to 70s it was known that a cooling climate tends to increase droughts. But climate is chaotic and unpredictable, and therefore predictions are malleable, on short term scales and long term scales, and confident long term predictions by ANYONE are definitely counter to the chaotic reality of climate…

          Unless you are gullible. And then, EVERYTHING is “within expectations” and NOTHING can disprove the fear-based statistical game called “Climate Change.”

          My gullibility died when my geology professor laughed out loud in 1982 when I told him I was terrified of the future cooling predicted by every scientific article I had read for the past decade… He said, “Those buffoons have changed their story recently – now they are terrified about Global Warming, not cooling! They are embarrassing themselves, first chasing a downward trend and begging for more funding and now they are chasing a upward trend and claiming future calamities – they are ambulance chasers trying to fund their delusions! Don’t worry about a thing, Dave – they have no ability to predict anything…”

          • Lewis says:

            Dave,
            Excellent point – what would disprove AGW. The answer, as you are aware, is nothing, since everything that happens proves AGW.

            Best wishes for warmer weather,

            Lewis

          • Nate says:

            Dave,

            EVERYTHING is not predicted by actual climate science as you seem to believe.

            Some specific things have been predicted since 1980 and have proven accurate: global warming of about the right magnitude, faster warming of the arctic, loss of summer arctic sea ice, faster warming of the NH, faster warming of land masses.

            Other things, as discussed in my comment above, are a matter of research and are not proven, just as you expect in any field of science.

            Falsifiable. Some tests that could have falsified AGW were carried out.

            For example-increased radiative forcing due to rising CO2 was directly measured in Oklahoma and Alaska https://phys.org/news/2015-02-carbon-dioxide-greenhouse-effect.html. Failure to detect this forcing would have falsified AGW theory. But, sorry, it was detected.

          • JDHuffman says:

            Nate, if the instruments record IR, do you interpret that as “radiative forcing”?

            Do you then believe that an ice cream cone can warm your basement apartment next winter?

          • Nate says:

            JD huffman,

            One important thing in science is that there has to be agreement on what measurements mean. We have to speak a common language. Otherwise there can be no progress.

            There is general agreement among physical scientists on how IR flux is measured with instruments and what it means. If there werent, then communicating results to others would be very difficult.

            You don’t agree with that general understanding of IR? Well, thats a you problem.

          • Nate says:

            ‘Do you then believe that an ice cream cone can warm your basement apartment next winter?’

            Igloos

          • Bart says:

            “… forcing due to rising CO2 was directly measured…”

          • Bart says:

            I do not know why. I have tried every variation, but the filter will not let the rest of my comment through. Suffice it to say, this is not sufficient to establish warming due to increasing atmospheric concentration of CO2.

          • JDHuffman says:

            Nate–Yes, igloos are another good example that DWIR is not capable of heating much. It would be possible to measure the IR emitted by the ice, inside an igloo. But, that IR could not raise the temperature.

            But, it you want to believe an igloo produces heat, be my guest.

          • Nate says:

            JD,

            Why do people keep bringing up the strawman argument that Co2 or ice in Igloo produces no heat. No-one disagrees with this.

            What Co2 and the ice in igloos does do is impede the transfer of heat.

            Igloo: humans produce heat, ice insulates and temp inside rises. Agree?

            Atmosphere: solar input provides heat and Co2 reduces transfer to space. Temperature rises–until heat transfer to space returns to normal (= input)

          • Nate, you say: “Some specific things have been predicted since 1980 and have proven accurate: global warming of about the right magnitude, faster warming of the arctic, loss of summer arctic sea ice, faster warming of the NH, faster warming of land masses.”

            Every single one of those “predictions” have absolutely and eternally happened in the past – you are confident in science that predicts the wetness of water…? Was water not wet before Climatology existed?

          • David Appell says:

            Lewis says:
            “Excellent point what would disprove AGW. The answer, as you are aware, is nothing, since everything that happens proves AGW.”

            Simply show that atmospheric CO2 doesn’t create a warmer surface.

            You can’t.

          • Nate says:

            Dan,

            Yes the earth has warmed in the past.

            It has also had earthquakes, volcanoes and floods. Predicting where and when these will happen, and their magnitude would be amazing.

            The predictions of warming circa 1980 accurately predicted the rate of warming, and where and when it would happen.

            https://pubs.giss.nasa.gov/abs/ha04600x.html

            All in all quite impressive.

          • Nate says:

            Not Dan, meant Dave.

          • Bart says:

            “All in all quite impressive.”

            Not very. The natural trends were already evident, so the direction things were moving was already known. Picking one study out of thousands that sort of matched the outcome is cherry picking. And, the 1998-present pause completely obliterates the hypothesis that CO2 forcing is dominant.

          • Nate says:

            Bart,

            ‘Not very. The natural trends were already evident’

            Ugghhh, here we go again..

            Bart, in 1980, says: ‘the previous 60-70 years was a rise followed by a flat. I predict the next 60 years will be a repeat.’

            Pretty impressive monday-morning quarterbacking, Bart!

            Even so, rise was faster and longer this time, and the flat, or pause, appears to have come and gone.

          • Bart says:

            The rise was not faster and longer this time. It was, for all intents and purpose, precisely the same. And, the pause is not even remotely gone.

          • Nate says:

            Maybe in barts world, but not in the real world with real numbers.

          • Nate says:

            But regardless, please explain how you made

          • Nate says:

            But regardless, please explain how you foretold the future in 1980.

        • An Inquirer says:

          Nate says, “Some specific things have been predicted since 1980 and have proven accurate: global warming of about the right magnitude, faster warming of the arctic, loss of summer arctic sea ice, faster warming of the NH, faster warming of land masses.”

          Several problems with that paragraph. Global warming has been far below the consensus of models, and if not for two items, the difference would be even more laughable: first, adjustment processes give an amazing increase over raw temperatures and second is the recent El Nino. Back in 1980, the prediction was not just faster warming of the arctic. That is an adjustment in models to fit reality. For loss of summer arctic sea ice — the models were an utter fail there, and there are better explanations for that loss than
          CO2 emissions. Maybe there are additional reasons for faster warming of land masses, such as UHI, fall off of rural stations used, and shifting to lower latitudes of remaining stations.

          • Nate says:

            ‘Global warming has been far below the consensus of models’

            Not at all true. Other than denialist blogs, show me where I can find that conclusion.

            ‘Back in 1980, the prediction was not just faster warming of the arctic’ what are you trying to say here?

            ‘For loss of summer arctic sea ice the models were an utter fail there, and there are better explanations for that loss’

            Show me the utter failure. Who says so? What is the better explanation?

        • Sam says:

          “heat waves” have not become ‘more common’ there is no ‘evidence’ to this effect just some crap non-definitive bs study. The heat waves were more common in the 1930’s and 1890’s-that is when the world had the most intense heat waves (just look at the dust bowl) JoNova has a detail of this heat wave that struck Australia in the 1890’s, just from the news at the time it was more intense than anything we’re having today.

          • Nate says:

            Sam, I wouldnt trust blogs for factual info-check out sources for yourself-often you will find that the blogger is misrepresenting, cherry picking, or exaggerating, to make their point.

            Anecdotal vs statistical evidence. Science prefers the latter for drawing conclusions.

    • Sam Pyeatte says:

      The AGW theorists could do just as well as rolling a dice and claim the result will be odd or even.

      • +1
        A metaphor of our times…

      • Gordon Robertson says:

        Sam Pyette…”The AGW theorists could do just as well as rolling a dice and claim the result will be odd or even”.

        That’s essentially what NOAA did when they claimed 2014 as the warmest year ever. The small print indicated a 48% confidence level in that claim, which amounts to flipping a coin.

        All of the claims of warmest year since have come with confidence levels that have been withheld.

    • David says:

      How often is the fact the earth has a liquid iron core causing its magnet field come into play with these so-called calculated climate models? How often do these “scientists” predict the occurrence of Aurora Borealis and Aurora Australis and their effect on the earth’s atmosphere? These are a couple questions that might need some higher taxes to answer and lie about.
      https://www.youtube.com/watch?v=-aIUFUm3OQw

      • Gordon Robertson says:

        David “How often is the fact the earth has a liquid iron core causing its magnet field come into play with these so-called calculated climate models?”

        It’s not as much the magnetic field as the temperature at the core which is claimed to be as hot as the surface of the Sun. Also, recently it was found that the Earth’s mantle is far hotter than suspected.

        That heat has to go somewhere and like all heat it will gravitate toward the surface where it is cooler.

        Until now, Earth scientists have claimed the heat escaping from the surface is insignificant, but is it? It’s measured in terawatts but over the surface area of the planet it is considered low scale heating.

        I often wonder if something is being missed. I mean, exactly how well is heat transmission at the surface distinguished from the heating caused by solar energy? How would you measure it all over the surface?

        • David says:

          Gordon,
          I base my questioning on the effect heliophysics never seems to be addressed when “climate scientists” like Al Gore or Bill Nye start scolding us nit-whits for our lack of penance. I mean for the love of Gaia, we can’t allow all those needy souls at the UN miss any lavish “conferences” that never do anything but to cajole the masses into sustaining their compassionate based lifestyles. For all the noise coming from them, the sun better not be a factor!
          Just to regurgitate some terms…
          Coronal mass ejections
          Geomagnetic storms
          Solar flares
          Solar prominences
          Solar wind
          Solar proton events
          Solar superstorms
          Sunspots
          Nuclear EMPs
          … do humans have the power to counterbalance any of these events in respect to overall temperature anywhere on the earth?
          Sorry for my snarkiness, I personally sense a lack of science, without the sun, in the whole AGW ‘business’, for which Al Gore has been ordained as its CEO and Bill Nye is weaseling in as a board member. Too many are getting rich.

          • Gordon Robertson says:

            David…” do humans have the power to counterbalance any of these events in respect to overall temperature anywhere on the earth? Sorry for my snarkiness….”

            Good point. Did not notice any snarkiness. My reply was based on a point of interest. No snarkiness intended either.

      • David Appell says:

        David says:
        “How often is the fact the earth has a liquid iron core causing its magnet field come into play with these so-called calculated climate models?”

        Heat flow from Earth’s interior averages = 44 TW = 0.09 W/m2.

        Miniscule.

        http://newscenter.lbl.gov/news-releases/2011/07/17/kamland-geoneutrinos/

  2. HERE IS MY CLIMATE FORECAST BASED ON TWO FACTORS

    FACTOR NUMBER ONE ALL of the solar conditions must meet my criteria. Thus far all have with the exception of the solar wind /ap index but that should come in line soon ,as sunspots vanish. The coronal holes will dry up which is temporary keeping up the solar wind speed and ap index .

    FACTOR TWO The upcoming probable El Nino, but this is very temporary and will last worst case scenario 9 months.

    So lets say a moderate El NINO develops and last around 9 months that would take us to the end of 2017 /early 2018.

    At that time that is when the global temperatures will fall below the 30 year running normal.

    It will be fast not slow when it happens.

    Look at the period 1275-1325 the climate changed quickly.

    Now if El Nino should fizzle and major volcanic activity picks up this dramatic cooling below the 30 year avg. will come before the end of year 2017.

    So my climate outlook is, this is the end of the warm period. It has one year or less to go and when it ends the global temperatures will fall fast and be below the 30 year running normal and stay there.

    If my two factors take place and the global temperatures do not fall I will be wrong.

    I know two things for sure which are this period of time in the climate is in no way unique and AGW does not exist.

    Remember the sun has been way above the solar parameters I have called for in order to have a climate impact until just recently.

  3. Gordon Robertson says:

    “By mid-week this week, newspaper and website stories will be reporting that climate experts (e.g. Al Gore, Bill Nye) have now blamed the historic snowstorm and unseasonable cold now descending on New England on climate change”.

    Well said, Roy.

    I recall Bill Nye trying to debate Richard Lindzen and it became painfully obvious that Nye had not the slightest idea of how atmospheric systems work. At least Gavin Schmidt had the good sense to refuse a debate with Lindzen one on one.

    Lindzen taught atmospheric physics at MIT, and with the calibre of genius at MIT, arguably the top engineering school in the world, you have to be genius level in order to be a professor there. All Bill Nye has going for himself is that ridiculous bow tie he insists on wearing.

    Al Gore studied the climate science of his day under professor Roger Revelle at Harvard. Revelle was a remarkable pioneer in climate science dating back to the 50s. Gore seems to have misunderstood the message of Revelle because he lost it when Revelle co-authored a book with Fred Singer and claimed people should not jump to conclusions on the effect of CO2 in the atmosphere.

    Gore insulted Revelle, claiming he must have been senile when he made the statement and blamed Singer for taking advantage of him. Singer sued and won.

    http://media.hoover.org/sites/default/files/documents/0817939326_283.pdf

    • Gordon Robertson says:

      I had not realize that Roy is mentioned in the pdf to which I linked:

      “Like Senator Gore, Dr. Lancaster seemed to be under the impression that scientists who question the basis for a global warming catastrophe, such as Robert Balling, John Christy, Hugh Ellsaesser, William Happer, Sherwood Idso, Richard Lindzen, Patrick Michaels, William Nierenberg (Revelles successor as director of the Scripps Institution), Chauncey Starr, Roy Spencer, and many others are part of some sort of energy-industry conspiracy”.

      You’re in good company there Roy, must be part of the 3% alleged not to believe in the CAGW model.

      • Mark says:

        The trouble with global warming will start when the sun burns out in a million years…

        • Gordon Robertson says:

          Mark…”The trouble with global warming will start when the sun burns out in a million years”

          In my astrophysics class they claimed the Sun should expand as it loses fuel into a red giant, engulfing the Earth. With all the protons and electrons streaming off it as the solar wind it’s is likely expanding as I write. And we are worried about a few millimetres of ocean rise.

          I am not as concerned about that as I am about the Moon losing momentum and spiraling in on us. When I look up at the Moon some nights I say, “just stay up there good buddy”.

          • Bart says:

            In actual fact, the Moon is spiraling away from us, currently at a rate of about 1.5″ per year. Google lunar recession for more info.

        • David Appell says:

          Mark says:
          “The trouble with global warming will start when the sun burns out in a million years”

          Wrong timescale by a factor of over 1000.

          See my article:

          “The Sun Will Eventually Engulf Earth–Maybe” Scientific American, September 2008, p. 24.
          https://www.scientificamerican.com/article/the-sun-will-eventually-engulf-earth-maybe/

          • Bart says:

            FTA: “The slowed rotation causes a tidal bulge on the suns surface. The gravity exerted by this bulge pulls Earth inward.”

            That is imprecise, and I think either they got it wrong or you took away the wrong message. A lagging tidal bulge pulls an orbiting body backwards, and that results in a decreasing radius. But, a leading tidal bulge does the opposite.

            That is the situation we have with lunar recession – the tidal bulge leads the Moon, pulling it forward, which increases the radius of orbit. It leads because the Earth’s spin rate is faster than the Moon’s orbit rate. When the two are the same, you have a tidal lock.

            As of now, the Sun’s mean rotation period is between 25 and 38 days, much faster than the Earth’s orbit period of 365.25 days. As such, the tidal bulge from Earth’s influence leads the orbit, and the Earth’s orbit radius must thus increase. Although the Sun’s rotation rate should decrease from the loss of angular momentum, by the time it is sync’d with the revolution of the Earth, the Earth may be very far out indeed.

            But, the situation is not symmetrical. The influence is greater when the Earth is nearer. So, it will never result in the Earth spiraling back in farther than it spiraled out.

            Maybe that is what they meant, though. The article says that, “With such a consideration, the researchers find that any planet with a present-day orbital radius of less than 1.15 AU will ultimately perish.” But, that is lower than the 1.2 AU radius given for the Sun’s expansion, so perhaps they actually find that there is a net increase in orbit radius.

  4. One more time this period of time in the climate is not unique.

  5. Kevin White says:

    Alarmists have truly gone mad, one wonders whether schizophrenia is an inherent symptom of the leftist mind to the extent that these political cultists even have minds. Its impossible to reason with these Marxist messianic fanatics. Facts don’t matter one iota to them only their ideology in which “global warming” justifies more globalism and redistribution.

    • Ken in Idaho says:

      “whether Schizophrenia” or weather schizophrenia…

    • Gordon Robertson says:

      Kevin White…”Alarmists have truly gone mad, one wonders whether schizophrenia is an inherent symptom of the leftist mind…”

      Kevin…please don’t equate the lunacy of climate alarmists to the left, or socialism. The leftist wannabees, aka politically correct, who are furthering the propaganda of catastrophic climate change are not true leftists in my books. They are philosophers and intellectuals who have become entrapped by the beliefs and conditioning in their own minds.

      There are extreme leftists who want to subdue capitalism but I am not one of them. Socialism, which stems from a workers movement in democratic countries like the US and Canada, has little interest in seeing capitalism fail.

      Workers need jobs and capitalists need workers. If everyone exercised his/her right to be a capitalist who would do the work? What we need is for both sides to become aware of that simple fact and begin treating each other with respect and compassion.

      The average socialist with whom I have been acquainted through unionism would very likely be a skeptic. Those are few and far between these days since many capitalists have been attracted to the gains made by true socialists through unionism and have watered down the movement.

      It’s far more likely that supporters of CAGW will be middle-class, capitalists with fantasies of saving the planet from who knows what.

  6. Scott Scarborough says:

    Unfortunately 95% of Americans would not recognize your article as sarcastic.

  7. Obama says:

    California’s cap & trade scheme resulted in the end of the California drought.

    I’m telling you. Higher taxes = better weather. Trust me.

    Fight climate change (aka bad weather) with higher taxes & government subsidies!

    We urgently need bold action or the weather (climate) will only get worse.

  8. Ric Werme says:

    I have about 20 years of New England snow fall and snow “depth day” data at http://wermenh.com/sdd/ . About the only climatological conclusion it supports is that “snow is really lousy place to look to for climate trends.”

    You’ll do somewhat better looking at a whole continent’s data, I’m sure. Tomorrow’s storm will be somewhere about half what I got all last season.

    What will it mean? Mainly that I’m glad I have a good snowblower.

    • duke silver says:

      That’s interesting Ric. I live in Farmington, ME and would agree that snowfall and duration of snow cover can be highly variable and hard to use as a gauge. Our snowfall last year – 45″. This year 118 with a 20+ inch monster bearing down and more to follow that one. Our biggest snow year (in the modern era was nearly 200″ in 2009.

  9. ren says:

    Please see the direction of the jet stream in the northeast. It is the jet stream is the cause of the snowstorm.
    http://images.tinypic.pl/i/00880/x1vc0uirh3jp.gif
    http://images.tinypic.pl/i/00880/4a18seanny6h.png
    It may be more than 40 cm of snow on the coast due to the warm Gulf Stream.

  10. ren says:

    Due to the direction of the jet stream winter in the East will continue for many days.
    http://squall.sfsu.edu/scripts/namjetstream_model_fcst.html

  11. ren says:

    Here you can keep track of the current situation – the temperature, radar and clouds.
    https://www.wunderground.com/wundermap

  12. Chas says:

    I’m confused…are you using this impending storm to declare climate change is not real? Sure, details of what are and are not climate change may be debatable to some extent, but the facts of climate change are not up for debate. It is very irresponsible of you to write an article suggesting that climate change is not real or has no impact on weather.

    • ren says:

      The range of the jet stream depends on the strength of the stratospheric polar vortex and pressure over the polar circle. In the stratosphere, the temperature and the strength of the polar vortex depends on the decomposition of ozone. CO2 does not affect the decomposition of ozone in the stratosphere.
      It has an impact whereas the magnetic field, because ozone as diamgnetic is repelled in a magnetic field.
      Thus, changes in the magnetic activity of the Sun will cause climate change.
      http://www.solen.info/solar/polarfields/polar.html

    • Turbulent Eddie says:

      Chas: It is very irresponsible of you to write an article suggesting that climate change is not real or has no impact on weather.

      I think “climate change has no impact on weather” is probably accurate.

      Don’t get me wrong – radiative forcing is real and would tend increase global average temperature.

      But weather is not determined by global average temperature. Weather is largely a function of, as mentioned above, undulations in the jet stream. The jet stream is a representation of an intense pressure gradient, which in turn, is the result of a temperature gradient determined largely by the spheroidal shape of earth in its orbit about the sun.

      Although global warming is thought to reduce this gradient somewhat, if isn’t a large effect. And for any given gradient, there is an infinite possibility of wave arrangements, constrained by oceans/continents and mountains.

      The variations of Nor’Easters should remind you of this. Sometimes they happen in November, sometimes in the dead of winter in January, or as with this one, in March. NH temperatures and gradients vary across these periods, but can all lead to storms such as this.

      • Gordon Robertson says:

        turbulent eddie…”…radiative forcing is real and would tend increase global average temperature…”

        Forcing is a term used to describe a forcing function in a differential equations, that are used in climate models. There is no such thing in the real atmosphere as a forcing and you have no proof that radiative forcing is real, or to what extent it is effective.

        In fact, there’s no proof that surface radiation is having any effect on the atmosphere other than a few feet above the surface. Circa 1909, Woods proved that greenhouses don’t warm by trapping infrared radiation, they warm due to a lack of convection. While he was at it he suggested surface radiation would have little effect beyond a few feet due to the inverse square law.

        I have offered this experiment and no one has rebutted it. Turn on a 1500 watt ring on an electric stove till it is cherry red. Hold your hand close to it and feel the intense heat. Now pull your hand back 4 feet and you feel nothing. The 260 watts/m^2 radiated by the surface, or whatever it is, would be ineffective after a few feet.

        • David Appell says:

          Gordon Robertson says:
          “I have offered this experiment and no one has rebutted it. Turn on a 1500 watt ring on an electric stove till it is cherry red. Hold your hand close to it and feel the intense heat. Now pull your hand back 4 feet and you feel nothing. The 260 watts/m^2 radiated by the surface, or whatever it is, would be ineffective after a few feet.”

          So where did all that heat go between “close” and “four feet?”

          Did it just vanish into thin air?

        • Nate says:

          Gordon does not seem to understand that a point source behaves differently from a planar source…

      • barry says:

        But weather is not determined by global average temperature. Weather is largely a function of, as mentioned above, undulations in the jet stream.

        Does that mean the weather in New York was the same 20,000 years ago when half of America was covered in ice? And if not, was that thick ice sheet a product purely of changes in the jet stream?

    • Gordon Robertson says:

      Chas…”…the facts of climate change are not up for debate”

      Oh, yes, they are. Climate change of a catastrophic degree will require catastrophic global warming and there has been no significant global warming for 18 years.

      In fact, there are no facts of climate change. All we have is consensus based on unvalidated climate models. The data says otherwise.

    • Ross Brisbane says:

      It old Roy up to his tricks. Do NOT play his game. The way he treats scientists who disagree with him is cutely called bible based authoritarianism. He thinks because he is enlightened by being born again – he has insights into climate no else sees. Christy the same. You see they think God the creator is on their side. Me – I think not as I am an “enlightned one” as well. I find his stabs at the science establishments quite honestly SICKENING, ARROGANT and RUDE. Sad so sad.

      • JDHuffman says:

        Dang Ross, it’s not Roy’s fault your false believe system is failing.

      • Gordon Robertson says:

        ross brisbane…”The way he treats scientists who disagree with him is cutely called bible based authoritarianism. He thinks because he is enlightened by being born again he has insights into climate no else sees. Christy the same. You see they think God the creator is on their side. Me I think not as I am an enlightned one as well”.

        You are an asshole. Isaac Newton was devoutly religious, did that make him any less a scientist? John and Roy have demonstrated utmost integrity with their science and they don’t need to be ad hommed by an idiot alarmist who lacks the scientific understanding to critique them on their science.

        • Ross Brisbane says:

          Really just who is wrong Gordon? You are wrong, so wrong. If you live long enough maybe just maybe you can change your opinions and apologise to me. Rue the day when two cranky ageing men with a contrarian climate hypothesis (contradicts virtually nearly all true climate scientists on a 97 to 3% ratio!) change their minds as well.

          • Gordon Robertson says:

            RB…”If you live long enough maybe just maybe you can change your opinions and apologise to me. Rue the day when two cranky ageing men with a contrarian climate hypothesis (contradicts virtually nearly all true climate scientists on a 97 to 3% ratio!) change their minds as well”.

            There was no need for your rudeness in claiming the religious faiths of Roy and John have anything to do with their science. They have the data and it comes from NOAA satellites. Both have been awarded medals for excellence by NASA and the American Meteorological Society.

            You owe them an apology. It was a vicious ad hom attack with no corroborating evidence.

        • David Appell says:

          Gordon Robertson says:
          “Isaac Newton was devoutly religious, did that make him any less a scientist?”

          Yes.

          • Scott says:

            Isaac Newton was devoutly religious, did that make him any less a scientist?

            No.

            See David? You’re not the only one who can provide a black-and-white answer to a complicated question with no knowable certainty.

            -Scott

      • David says:

        Hey RB,

        Here are a few quotes to get you through your day! Good luck!

        Two things are infinite: the universe and human stupidity; and I’m not sure about the universe.

        If you can’t explain it to a six year old, you don’t understand it yourself.

        Science without religion is lame, religion without science is blind.

        The world as we have created it is a process of our thinking. It cannot be changed without changing our thinking.

        Happy 138th Birthday to Albert Einstein and Happy Pi Day

        • Ross Brisbane says:

          The world is NOT a process of our thinking. The universe has its own “mind” and it will evolve according to its own set laws. Those “laws” are what the universe is trying to tell you and I. The source of its own voice – is God – its creator and often referred to as the higher power – that is infinite and our finite minds cannot fully understand it. For in one word above and beyond the laws of the universe’s discoveries by Albert Einstein – one word even he could not fathom – the ETERNAL nature of that higher power. Hence we do have a finite universe as all cosmologists conjecture – one day the universe will cease to create new suns and energy. That is within the 2nd of thermodynamics.

          From Wikipedia:

          The theory of heat death (energy death of the universe) stems from the second law of thermodynamics, of which one version states that entropy tends to increase in an isolated system. From this, the theory infers that if the universe lasts for a sufficient time, it will asymptotically approach a state where all energy is evenly distributed. In other words, according to this theory, in nature there is a tendency to the dissipation (energy transformation) of mechanical energy (motion) into thermal energy; hence, by extrapolation, there exists the view that the mechanical movement of the universe will run down, as work is converted to heat, in time because of the second law.

          • Gordon Robertson says:

            RB…”The world is NOT a process of our thinking”.

            Of course it is. We look outward to observe the world and most of the time we create images of what is seen. Those images are full of errors based on our conditioning and range from mild to extreme.

            Einstein knew that and I would like to have seen him talk more about it. A good friend of Einstein, physicist David Bohm, did talk about it and he concluded basically that the human mind is not capable in it’s ordinary mode of perceiving what is real.

            In order to perceive reality on our planet, which is the reality left behind if all humans were removed from the planet, we must observe without a self-centre. It’s the ego that gets in the way, colouring what is observed with a bias.

            What we tend to see of the world is directly related to our thinking. The word ‘world’ comes from human thought and it means different things to different people, as does reality. Therefore, different people see reality in different ways.

            Human thought even creates time. We store the past as a sequence of memories which are stored thoughts. The linear dimension of our ordered thoughts from past to present to future is time. It has no independent existence other than an illusion in the human mind.

            What we need is an actuality which I described earlier as this planet with all humans removed. Everything left would be actual and real.

            The conditioned mind sees the Sun rising in the east and setting in the west after apparently rotating about the Earth. That has more to do with the ability of the brain to create illusions based on relative motion than it does out and out conditioning. However, after a while the notion becomes conditioned in our minds that the Sun actually revolves around the Earth.

          • Gordon Robertson says:

            RB…”That is within the 2nd of thermodynamics”.

            I would regard whatever is written on Wikipedia with skepticism. Anyone can enter an article on the 2nd law of thermodynamics and much of what I have read indicates the writer has not read Clausius, the creator of the law.

            Much license is taken with the 2nd law. Clausius stated it succinctly when he claimed that heat cannot of it’s own be transferred from a cooler body to a warmer body. That’s all he stated. He did not interpret the 2nd law in terms of entropy, that came later from people who found that more convenient. I think by doing so they lost contact with the original intent of the 2nd law.

            As an aside, he brought up the subject of entropy, which he also invented. He used the word entropy in lieu of energy since that word had already been taken. He described entropy in words as the integral of infinitesimal changes of heat at a temperature T at which the changes occurred over a process.

            If the process was reversible, the entropy over the process was zero. If not reversible, the entropy was always positive. He implied that all irreversible processes were positive. That lead to the notion that the universe is breaking up. No one has ever proved that.

            Others added to his thoughts, sometimes in remarkable ways. I have found many of the interpretations deviated from the transfer of heat to which Clausius originally applied the theory. Whatever the meaning in your wiki article, I don’t see the relationship between what they are claiming and the 2nd law.

            Regarding the entire universe as a huge heat engine doesn’t make a lot of sense to me. Taking the physics beyond a simple heat engine in which heat is lost during an irreversible processes means the heat is lost to the process only.

            Heat is related to atoms and cannot exist independent of atoms. If a substance breaks up in an irreversible process, the atoms representing the heat don’t disappear. In deep space, where the surrounding temperatures are close to absolute zero, the heat could be lost to radiation. However, if that radiation encounters more atoms and is absorbed, it could warm those atoms.

            I think the problem is far more complex than the wiki article claims.

          • Gordon Robertson says:

            RB…BTW, heat death implies that all atoms in the universe have stopped vibrating altogether, reducing their temperatures to absolute zero.

            As long as there are stars radiating energy that won’t happen.

          • David Appell says:

            Gordon Robertson says:
            “As long as there are stars radiating energy that wont happen.”

            My god you are clueless.

            Completely and utterly clueless.

        • David Appell says:

          David says:
          “If you cant explain it to a six year old, you dont understand it yourself.”

          So explain special relativity to a six year-old.

          I dare you.

    • pete says:

      Climate change is very real, only nobody can stop it from changing.

    • Obama says:

      Chas,

      Please specifically describe (scope & magnitude) the most obvious climate disaster that will take place in North America in the next 50 years that we have not observed in the last 50 years?

      Chas, the most obvious worse thing that will happen to North American climate next 50 years? Unprecedented disaster. Just 1. The scariest that will happen?

      Chas, climate change is real and we must urgently take bold action to avoid unprecedented disaster?

      Crickets. Wind whistles through the trees. Silence. A bustling in the hedgerow.

      Sigh.

    • TedM says:

      Now I’m confused because I can’t find anywhere in Roy’s article that he suggests that climate change is not real.

      • Ross Brisbane says:

        TedM, Roy suggests that Climate Change has ALWAYS happened. The problem a majority of science climate studies show is that human activity is driving RAPID Climate Changes over very short time frames. 50 to 100 years instead of thousands through natural processes of the sun, earth’s tilt and sea temperature trends over thousands of years.

        Rapid Climate Change leading to a dangerous effect on the well being of humans is the truth. This will affect and cause national poverty growing out of control, diminish water resources, threaten nation’s coastlines through rapid rising seas (100s of years), massive starvation through increasing spells of record droughts, create inhabitable parts of the earth where temperatures may exceed 55 degrees Celsius in equatorial belts. Massive migration of humanity will lead to global food wars and diminishing water resources.

        Roy and his mate, John clearly are at odds with the great body of science on climate. They are in denial that our human contribution to rapid climate change will cause the above things. They believe that minor effects of warming will eventuate and be beneficial.

        I have serious issues with their almost biblical authoritarianism on this subject and they accuse scientists in being chicken littles. They are devout in their beliefs along with there upper atmospheric temperature profiling MODELLING. They are of the 3% minority. You can choose to think they have done nothing wrong and are simply being true scientists. And above their Christian beliefs there are also many devout Christian scientists who fall within the 97% majority: MAJORITY of climate scientists: WE ARE HEADED for CATASTROPHIC times ahead for humanity if we just sit on our hands and just play with our computer models and allow the continued extraction of coal and its growth of use UNABATED.

        There is a Baptist theological construct that DOES NOT see apocalypses happening over centuries – hence some of this contributes to denial through their defective theological constructs on climate science and blindsides them from OBJECTIVITY.

        We are on the road to NOWHERE with these two scientists. What we do right NOW and the decisions of those CONSEQUENCES we take over the next 50 years will affect humanity for the next 1,000 years.

        Imagine a world in 300 years time with sea rises that may exceed 10 meters, massive genocides of millions of humanity, a water world, survival mode civilisations that long lasted over 200 years and a world economy that simply died 100s of years before.

    • David says:

      Hey Chas,
      (similarly for Ross Brisbane, earlier)

      Here are a few quotes to get you through your day! Good luck!

      Two things are infinite: the universe and human stupidity; and I’m not sure about the universe.

      If you can’t explain it to a six year old, you don’t understand it yourself.

      Science without religion is lame, religion without science is blind.

      The world as we have created it is a process of our thinking. It cannot be changed without changing our thinking.

      (plus one extra)
      Try not to become a man of success. Rather become a man of value.

      Happy 138th Birthday to Albert Einstein and Happy Pi Day

      • barry says:

        Einstein:

        “The word God is for me nothing more than the expression and product of human weakness, the Bible a collection of honorable, but still purely primitive, legends which are nevertheless pretty childish. No interpretation, no matter how subtle, can change this for me.”

        Of course, a better understanding on how he viewed religion and science comes from more than just a couple of quotes. I provide a contradictory quote to encourage more reading for those with a bent to cherry-pick his words. I don’t provide that quote to say anything general about religion or science, only to suggest Einstein’s conception of those pillars are not what David selects for us.

  13. The climate has been in the same regime since 1840 – present.

    That however may change as the warm period is on it’s last legs.

    • Gordon Robertson says:

      Salvatore…”The climate has been in the same regime since 1840 present.

      That however may change as the warm period is on its last legs.”

      I think you have to allow for the fact that the planet was in the dying moments of the Little Ice Age in 1840. Glaciers and other ice had expanded to an extreme amount and the process of rewarming was bound to take a century or more.

      Whatever caused and ended the LIA is worth exploring. Many thought it was due to a variation in solar energy.

    • David Appell says:

      Your study, the CO2 man made global warming hoax, don’t mean anything because in the next few years we will know ,who is right and who is wrong.
      I will be proven correct along with many in my camp that predict this will be the decade of global cooling and a large part of that cooling will be due to LOW solar activity. Mark my words.

      – Salvatore del Prete, Reply to article: IC Joanna Haigh – Declining solar activity linked to recent warming, 10/8/2010
      http://climaterealists.com/index.php?id=6428

    • David Appell says:

      Salvatore, saw that even Watts — Watts! — now rejects your comments.

      “Ok, back in the bit-bucket you go.your comments are just too stupid to publish anymore.”

      https://wattsupwiththat.com/2017/03/19/solar-update-march-2017-still-slumping/comment-page-1/#comment-2455624

  14. pete says:

    Punxsutawney Phil had predicted this on the 2nd of February. Winter wasn’t over yet Phil said when his handlers asked him about it ’cause Phil could see his own shadow.

    Phil is a better weather predictor than Al Gore and his cabal of money grabbers.

    • Gordon Robertson says:

      pete…”Punxsutawney Phil had predicted this on the 2nd of February”.

      Speaking of gophers, are you aware that an alpha male is actually a reference to a gopher. People have started using it as a reference to an aggressive human male but they are just idiots with far too much testosterone.

  15. ossqss says:

    Global warming just caused a tornado warning for me near Sarasota! That has never happened except for every year when a strong winter FROPA happens, which in fact happens every year several times, or strong T storms and other weather systems the rest of the year, soooooo nevermind…..I have to go to my safe place now 😉

    https://static.esea.net/global/images/users/471605.1433210541.jpg

    • Gordon Robertson says:

      ossqss…”Global warming just caused a tornado warning for me near Sarasota!”

      What caused the tornado warning was a mass of cold air from the North mixing with a mass of warm air from the Gulf.

      Global warming of the variety we have had the past 18 years (none) could not cause that. In fact, global warming would warm the cold air masses producing less likelihood of tornadoes and severe weather.

      • ossqss says:

        My appologies for not properly placing a Sarc tag on my comment.

        • Gordon Robertson says:

          ossqss…”My appologies for not properly placing a Sarc tag on my comment”.

          Apologies not necessary. I kind of figured you had your tongue in your cheek. I was commenting for the benefit our our resident alarmist who tend to miss those things.

  16. AaronS says:

    Regarding taxes. I support a C tax in the US mostly on car fuel. I do not support because i want to lower global CO2 (i dont see how a US C tax will do this), but because i want to set it up under republicans to pay down debt and build infastructure like trains in big cities and bridges and roads. These are real construction jobs. Ultimately, the US will be in trouble if we are dependent on foriegn oil (including Canada). US oil unconventionals like Bakken are in decline and showing the life of the play is limited. Saudi’s mega oil field Ghawar will most likely decline rapidly like most carbonate reservoirs do (see Cantarell for analogy). Once the Ghawar 10% of global oil production declines the cost of oil will be very high. Thus US is better off with methane, which has much longer reserves. Coal can stay in the ground until we need it bc extraction of remaining reserves are a challenge to landscapes and coal burns more dirty for air quality.

    If republicans dont do this now then democrats will possibly go the path of green energy. The numbers just dont add up when you start to transition agriculture and transportation to the electricity sector. Plus i care about birds bugs and bats.

    So yes, I want taxes to increase but its because I am patriotic.

    • WizGeek says:

      AaronS, your neglect of unintended consequences is quite evident. Your lack of complete and up-to-date facts and science is disconcerting. You have much to learn, Grasshopper.

    • Ron Hayes says:

      There is plenty of fossil fuel energy, we are not even close to running out.

      https://www.youtube.com/watch?v=KTsYjRqPmNA

      When the time comes that we actually start running out, a free market (if one does not exist at that time an inevitable black market will accomplish same) will naturally make other forms of energy more economically feasible and they will be brought to the forefront in an economically sustainable fashion.

      • JDHuffman says:

        “There is plenty of fossil fuel energy, we are not even close to running out.”

        Well stated, Ron!

      • AaronS says:

        Examples of unintended consequences? Yes There are hundreds of years of total ff remaining, but not cheap oil. That is a myth. At 100 USD there is more oil, but that hurts the US if it is not coming from US and US has mostly methane reserves remaining. At 150 USD a bbl the economy is hurting and the transition will happen anyway.

        • WizGeek says:

          Silly Boy. “Cheap” is a relative term depending upon current market supply and demand. Add basic economic education to your Bucket List.

          • AaronS says:

            Can easily quantify cheap as percent median income. So Oil cost is directly associated with cost of oil products like gasoline and the costs harm the economy as a pecentage of median income. We saw this at 100.00 USD. People stopped traveling and didnt take vacations or even go to store as much. Delivery costs went up etc. Its not hypothetical… the data was measured. At a 50% gain from 100 USD the impact became more serious based on models.

      • David Appell says:

        Ron Hayes: By the time fossil fuels run out, it will be far far too late to stop global warming and climate change.

        The free market cannot solve this problem. Period.

    • David says:

      CO2, H2O and sunlight are sugar for plants, drive a car and be friendly to our flora inhabitants.

      • David says:

        Oh yeah, isn’t water vapor a greenhouse gas?

        • Gordon Robertson says:

          David…”Oh yeah, isnt water vapor a greenhouse gas?”

          I am picking up some sarc here but please allow me to address my alarmists friends who lack humour.

          wv is an infrared absorber. The term greenhouse gas is a metaphor based more on consensus than actual observation.

          Some people think that means wv can trap heat and act as a greenhouse, which is plain silly. Heat is the kinetic energy of atoms and you would have to trap the atoms as glass does in a real greenhouse. No such mechanism in the atmosphere which is rife with the convection that real greenhouses lack.

          I have no argument that the absorbed IR can be converted to heat but no one has demonstrated how that translates to catastrophic global warming.

          • David Appell says:

            Gordon Robertson says:
            “I have no argument that the absorbed IR can be converted to heat but no one has demonstrated how that translates to catastrophic global warming.”

            Does that heat warm the surface?

          • barry says:

            Some people think that means wv can trap heat and act as a greenhouse

            Not that I can see in this place. Could you name someone here who thinks like that?

  17. Steve Fitzpatrick says:

    Roy,
    All I can say is: I’m sure glad that I won’t be on Cape Cod until May 9.
    .
    I do love theories which are consistent with any event at any time. The common description for these theories is: ‘ridiculous’.

  18. DMA says:

    I just sent this to the op-ed of the local paper. Seems to line up with Dr.Roy’s thoughts here.

    The headline said Warm February 3 times as likely because of human caused climate change. Does that seem reasonable? Did we also cause the intense cold and snow in Eastern Europe and Siberia in January? How about the snow in the Sahara-first in 40 years? Is there any weather event that human caused climate change doesn’t effect? This is truly fake news and needs to be questioned not accepted as factual.

    Dr. Judith Curry’s recent review of climate models like the one mentioned under the noted headline stated that these models are unfit for attribution or policy purposes. CO2 recently added to the atmosphere natural or man made is expected to increase the radiative forcing by less than 2 watts per square meter while the uncertainty in latent heat flux is an order of magnitude greater (20Wm-2) leaving the anticipated flux unrecognizable in the uncertainty (Pierce et. al.2006 as quoted in IPCC AR5).

    Several new papers show human emissions don’t even effect atmospheric CO2 enough to be detected (Humlum 2013, Harde 2017). Dozens of papers that demonstrate that the recent warming is not global, unprecedented, or remarkable (eg Wilson 2017, Leif 2017). There are over 100 papers in the last year that show the recent warming is likely almost entirely due to solar activity.

    So the climate models can’t be used to isolate effects of increased CO2. The human emissions of CO2 can’t be shown to be the cause of the increased CO2 in the atmosphere. The uncertainty in the heat flux is 10 times the hypothesized effect of increased CO2, and nothing unusual is occurring in our climates. How can someone determine that the chances of some weather event is increased by a factor of 3 by human CO2 emissions?

    This headline is propaganda not science.

    • Ross Brisbane says:

      DMA,

      I will NOT comment fully on your Gish gallop nonsense. (non-science).

      Try one paper you quoted WITHOUT drilling down into that paper:

      http://www.realclimate.org/index.php/archives/2017/02/something-harde-to-believe/

      Another paper predicts cooling for the next 15 years – the paper: Humlum 2013.

      Unless your prepared to PROPERLY study those papers don’t bother to mention them.

      DMA – it’s all smoke and mirrors the denial machinery. These aberrant papers are nothing but ghosts that speak falsehoods over the REAL science.

  19. Tom Howe says:

    Actually, there are FOUR certainties. The fourth is that NPR will fall over the left edge supporting alarmism, if any increase in government power is in the offing. Just yesterday, the “On the Media” program, ostensibly about “The Media”, found time for an “expert” to pontificate about the “science of climate” being now SO MATURE that it is possible to attribute specific weather events to climate change. It was truly sickening.

    • David Appell says:

      Tom Howe says:
      “Just yesterday, the On the Media program, ostensibly about The Media, found time for an expert to pontificate about the science of climate being now SO MATURE that it is possible to attribute specific weather events to climate change.”

      Have you read the IPCC SREX?

      Your specific critique?

  20. darryl says:

    I have, for a long time, thought that a major cause of the hysteria is how the questions given to the IPCC were explicitly or implicitly stated.

    1) Has it warmed?
    2) Has CO2 caused the warming?

    Simple, Right?

    As a retired high school physics,chem teacher, I emphasized careful wording of a question or hypothesis to be tested.

    Knowing human nature, I would suggest that the nature of questions like this would simply induce circular thinking

    Anyone care to comment?

    • Gordon Robertson says:

      darryl…”I have, for a long time, thought that a major cause of the hysteria is how the questions given to the IPCC were explicitly or implicitly stated”.

      Of course. The IPCC has been a political body since its inception. Although many people take shots at left wingers as being the cause of the AGW theory, the IPCC actually stems from a manipulation of the UN by uber-right winger and former UK PM Margaret Thatcher.

      She was having serious problems with striking coal miners and an adviser suggested she use her degree in chemistry to baffle delegates to the UN to make it appear as if coal emissions were a bad thing. Ironically, anyone who lived in the UK when every home was burning coal already knew that. The problem was soot particles which caused a thick smog and blackened buildings, not the CO2 produced.

      However, Thatcher got the UN thinking along a new direction in which all CO2 emissions were bad because they caused the atmosphere to warm. The UN had been looking for a cause to which they could attach their designs on a world government that could raise taxes to help poorer UN nations. The idea that anthropogenic causes could explain global warming gave them the cause they needed to tax people on their emissions of carbon.

      When the UN and the World Meteorological Organization formed the IPCC one of the IPCC’s first co-chair was a climate modeler and a protege of Thatcher, John Houghton.

      Houghton was instrumental in pushing climate model theory to the extent that CO2 took on a far greater theoretical role in warming (in models) than could be proved in physics or chemistry. Even though the IPCC admitted in the 2001 review that future climate states could not be predicted, Houghton saw to it that scenarios based on climate model theory could ‘suggest’ future climate states that were entirely theoretical. They were later forced to acknowledge that and change the word ‘prediction’ to ‘projection’.

      IPCC documents are full of carefully crafted inferences that are passed off as ‘suggesting’ fact when they are in fact only guessing. As you claim, they have carefully crafted questions to exclude other questions. For example, the IPCC mandate is to investigate the role of humans in causing global warming while excluding any research that examines natural causes.

      The IPCC has also devised a scale of probability to measure their opinions that has no evidence to back it. That’s because the models on which they base their probabilities are not validated.

      Possibly the most political attribute of IPCC policy is allowing 50 politically appointed lead authors to write a Summary for Policymakers that comes out before the main report and used to amend the main report. The Summary is written solely for politicians and reflects what the politicians want to hear, not what the reviewers determined as a whole.

      • David Appell says:

        Gordon Robertson says:
        “Houghton was instrumental in pushing climate model theory to the extent that CO2 took on a far greater theoretical role in warming (in models) than could be proved in physics or chemistry.”

        Can’t wait to see GR prove his claim.

        I wish I could sell tickets.

    • AaronS says:

      Well science is a method simplified as: 1. State a Hypothesis. 2. Make Observations, 3. Take measurements 4. Report updates to the hypothesis. If multiple lines of evidence strongly support a position then it becomes a theory. The IPCC stops at step 1. Making a hypothesis bc a model or suite of models is a hypothesis, and when their hypothesis that the CO2 drives global warming doesnt match empirical data they appear to change the data (be it temperature measurements or the SSN). If your base case is off, then you update. In this case with a suite of 100 plus models being used to define a median base case, you either add additional low sensitivity versions to widen the low range or remove high sensitivity to make the P50 case match the data (satellite or hadley temp version three). It is obvious to me they have simple cut out the low sensitivity versions. It is not science.

      • David Appell says:

        AaronS says:
        “Well science is a method simplified as: 1. State a Hypothesis. 2. Make Observations, 3. Take measurements 4. Report updates to the hypothesis. If multiple lines of evidence strongly support a position then it becomes a theory. The IPCC stops at step 1.”

        Blinkered. Anyone who does science knows that that’s not at all how it is done.

        Every read Paul Feyerbend?

        • AaronS says:

          Sorry so late a reply. Dave. I disagree. The anarchy in science of Paul Feyerbend is how left is abusing science to advance thier objectives from using uncertainty, be it race, gender, climate, or other non politocal fields like string theory. Science does not stop at a hypothesis or model even a math model. It requires empirical data. String theory is most likely dead… the higgs mass killed supersymetry. So the hypothesis was greatly advanced but a dead end. Same holds for any hypothesis. Anthropogenic CO2 warming needs confirmation from best available data. Its not the model based hypothesis can not continue to advance and evolve towards the best model possible, but the experiment is ultimately required to confirm. The complexity with climate change is global temperature estimates are themselves dynamic in time. So until the eatablishment figures out their final answer for global temperature estimates and stops adjusting, they can not test their model based hypothesis. So at a minimum we are something like a decade away from knowing the sensitity of gloval temp to CO2. The process of adjusting both coevally is problematic. This debate goes on. My view the hypothesis fails in the end. I have a good reason. Waiting to roll it out.

    • David Appell says:

      darryl says:
      “Knowing human nature, I would suggest that the nature of questions like this would simply induce circular thinking
      Anyone care to comment?”

      Yes.

      You’re wrong.

    • barry says:

      Anyone care to comment?

      Yep. Those are two of many questions asked by the IPCC. Others are:

      3) What natural factors impact global climate?
      4) What impact have they had prior to the industrial revolution?
      5) What impact have they had since?
      6) Can warming since the industrial revolution be explained by natural factors alone?

      etc..

  21. SocietalNorm says:

    Anyone who has been an avid skier for quite a few years would know that all of these weather patterns we have had for the past few years (i.e.. snowy west, cold east or vice versa) are unremarkable.

  22. Dr No says:

    “Brace Yourselves: Snowstorm to Breed Global Warming Hysteria”
    A comment based on a forecast reaction to a weather forecast!
    What an enormous red herring*.

    *A red herring is something that misleads or distracts from a relevant or important issue.

  23. Dr No says:

    Meanwhile, in Australia the facts show that:

    Australia endured a summer of record-breaking extremes, scientists said on Wednesday, with climate change tipped to increase the frequency and severity of such phenomena.

    Intense heatwaves, bushfires and flooding plagued the December-February summer season with more than 200 records broken over 90 days, the independent Climate Council said in a report.
    “Climate changedriven largely by the burning of coal, oil and gasis cranking up the intensity of extreme weather events,” the “Angry Summer” report said.
    “Days of extreme heat and heatwaves will become even more frequent and severe in Australia, and will increase the risks to critical infrastructure (e.g. electricity), the economy, health and ecosystems.”
    Australia has warmed by approximately 1.0 Celsius since 1910, according to the biannual State of the Climate report from the Bureau of Meteorology and national science body CSIRO released in October.
    While bushfires are common in Australia’s arid summers, climate change has pushed up land and sea temperatures and led to more extremely hot days and severe fire seasons.

    Read more at: https://phys.org/news/2017-03-angry-australian-summer-weather.html#jCp

    • FTOP says:

      Meanwhile, New Zealand is calling this “The Summer that Never Was”

      Snowed in January — dead of summer.

      https://www.theguardian.com/commentisfree/2017/mar/01/new-zealands-lost-summer-how-will-we-make-it-through-the-winter-gloom

    • Gordon Robertson says:

      dr no…”Meanwhile, in Australia the facts show that:”

      Did the facts show that Australia is the western terminus of ENSO and that we just had a major El Nino?

      The EN has produced record rainfall in California, which had been proclaims a drought region, yet you find it odd that extremes exist in Australia, which is right at the source of the EN.

      I’d get more sense out of a wallaby.

      • Dr No says:

        “yet you find it odd that extremes exist in Australia, which is right at the source of the EN”

        I see, weather extremes in Australia cannot be compared with weather extremes in the US.
        What a stupid idea.

        The Australian weather has set new records.
        Will the current snow event break any records?

        • Gordon Robertson says:

          dr no…”I see, weather extremes in Australia cannot be compared with weather extremes in the US”.

          No they can’t. Australia is surrounded by miles of ocean in a hemisphere that is mainly ocean. From what I understand, sailing from certain parts of Australia you can sail right around the world at one latitude without leaving the ocean. That lends itself to unusual weather conditions.

          Australia lacks the mountains of North America and the extreme winter temperatures gifted to us by the Arctic.

          Australia is the Western terminus of ENSO and the effects of ENSO on the US is far different than the immediate effects as a terminus of ENSO.

          The word record these days as applied to temperatures is highly suspect. From what I have read of Australian weather history any modern records are within a fraction of a degree of former records dating back well into the 20th century.

          • David Appell says:

            Gordon Robertson says:
            “From what I understand, sailing from certain parts of Australia you can sail right around the world at one latitude without leaving the ocean. That lends itself to unusual weather conditions.”

            Why?

      • Dr No says:

        Norman,
        Maybe these facts will help you.
        “While land burned, the sea around Australia broiled. The bureaus statement said despite the surface temperature of the seas around Australia being consistently high in recent years, 2016 reached a new record temperature, being 0.73C above the 1961-90 average.

        Off the coast of Queensland, those record temperatures led to the worst coral bleaching on record, where an estimated 22% of the coral on the entire 2,300km length of the Great Barrier Reef was lost.

        In the northern, most remote and most pristine part of the reef, coral was devastated by the unusually warm water, which scientists say will become the norm in fewer than 20 years.

        The bureaus statement also notes that ocean temperatures were at record highs around Tasmania in 2016. The freakishly hot waters there have been attributed as the cause of damage to oyster, salmon and abalone industries, as well as increased stress to kelp forests, already devastated by warmer waters in recent years.”

        Of course, I could be wrong. These observations could all be alternative facts – as Donald likes to describe uncomfortable news.

        • Norman says:

          Dr. No.

          I think your news report would be considered “fake news” primarily because of the word choice designed to create an emotional state.

          Article: “While land burned, the sea around Australia broiled.” Broiled??

          Here is some data I found.

          https://www.seatemperature.org/australia-pacific/australia/

          Does not seem Darwin sea temperature is anything outside of normal for this time of year.

          http://www.holiday-weather.com/darwin/averages/

          • Dr No says:

            I see, because Norman doesn’t think there is any problem, then there is no problem.
            All the observations about coral bleaching, damage to oyster, salmon and abalone industries, as well as increased stress to kelp forests were simply made up?
            And, of course, the measurements indicating “2016 reached a new record temperature, being 0.73C above the 1961-90 average” were all in error?

            I think you have provided the perfect example of a denialist at work. I can use this in my next lecture. Thank you.

          • Gordon Robertson says:

            dr no…”I see, because Norman doesnt think there is any problem, then there is no problem”.

            Just summer in Australia. Your predecessors would be mocking your softness.

          • Dr No says:

            Norman, take your head out of your
            “Parts of the Great Barrier Reef will never fully recover from repeated bleaching of its corals, caused by spikes in the water temperature, a detailed analysis of the reef over the past 20 years shows.”
            http://www.abc.net.au/news/science/2017-03-16/coral-graveyards-grow-as-bleaching-becomes-the-new-normal/8353030

          • Norman says:

            Dr. No

            Have you read this one.
            https://www.scientificamerican.com/article/coral-reefs-show-remarkable-ability-to-recover-from-near-death/

            YOU: “I think you have provided the perfect example of a denialist at work. I can use this in my next lecture. Thank you.”

            How are you defining “denialist”? You put up your links and I gave evidence that maybe it is not so unusual.

            I gave a list of previous death-killing heat waves in Australia that span a long time frame. I provided a study if heat waves in Australia are getting more frequent, lasting longer or more intense. The empirical study did not confirm this. Why is empirical data considered denial?

            I think the “fake news” is working on your mental state. They use emotionally charged words and make all seem worse and you buy right into it. When a rational person comes along to pour a little water on your hysteria you react by calling them a “denier” but you do not even attempt to counter the empirical data provided.

            Fake news works. Not fake in the sense it is totally made up, fake in that it is not representing the reality of the situation.

          • Dr No says:

            Norman,
            for a start, the article that you linked to begins with the statement:
            “As the planet heats up so do the world’s waters, and that means more coral bleaching.”

            Secondly, your link to heat waves is to an unknown writer playing with data on some obscure web page. My links refer to recognised authorities and peer-reviewed studies.

            Thirdly, you are deliberately avoiding the fact that records are being broken. Yes – records!
            That means something unusual is occurring and being complacent may well be dangerous.

            Anyway, thanks for your responses – my lecture will be entertaining.

          • David Appell says:

            Dr No: Deniers simply do not care about any climate-caused destruction on Earth.

            The death of part of the Great Barrier Reef? FALSE! And who cares anyway?

            Certainly deniers don’t. They have no ethics, Christian or otherwise.

      • Norman says:

        Dr. No

        YOU: “Thirdly, you are deliberately avoiding the fact that records are being broken. Yes records!
        That means something unusual is occurring and being complacent may well be dangerous.”

        I do not think any intelligent or rational information will change the state of hysteria manifesting within your mind based upon mostly “fake news” designed to keep you in a state of perpetual panic and ignore reality but stay focused on the hysteria they feed you.

        I can only hope this might open your frenzied mental state but the odds are very strong against it. A fanatic cannot change even when overwhelming evidence is presented to them. You will ignore or not understand the significance of the data and continue with your clouded delusional mental state as the frenzy supplies you with a purpose and mission in life.

        But I can still try.

        http://members.iinet.net.au/~jacob/worldtp.html

        Look at the dates of the hottest recorded temperatures of locations around the World and Australia and see if any are in this century? Most are long before I was born.

        That local records are broken in a heat wave is not surprising. The most intense portions of a heat wave are usually not that large of an area (kind of like super heavy rain in the multiple inches…it tends to be restricted to a fairly small area so if there is a multi-inch rain in a non monsoon region, it will probably shatter some previous record…do you understand this?)

      • David Appell says:

        Norman says:
        “Maybe this study.
        http://theclimatescepticsparty.blogspot.com/2015/02/are-heatwaves-in-australia-becoming.html

        Web pages aren’t “studies.” They’re Web pages.

        Got any real, peer reviewed published data?

    • Kneel says:

      “Australia endured a summer of record-breaking extremes…”

      Indeed.
      For example:

      “36.1C recorded in Perth last Saturday.”
      vs
      “Perths hottest ever March day was 42.4C”

      On 8, 9 and 10 February 2017, 33 WA weather stations had their record lowest February daily maximum temperature.

      Eight WA weather stations had their record lowest February mean daily maximum temperature, their average being 27.54C.

      Three WA weather stations had their record lowest February mean temperature

      The mean maximum temperature for WA was 1.3 C below average, the lowest for six years since February 2011.

      The maximum at Perth Metro from April 2016 to February 2017 was 0.9C cooler than the average since the station opened in 1994. The minimum at Perth Metro from April 2016 to February 2017 was 0.5C cooler than the long-term average.

      • Gordon Robertson says:

        Kneel…”Perths hottest ever March day was 42.4C”

        Heck, it gets hotter here in Canada in a desert climate 150 miles NE of Vancouver. The record in that area is 44.4C.

        When we talk about climate change we MUST indicate the location of the change and why it’s changing. It is arrogant and unscientific to use the generic term climate change. It means nothing just as giving the planet an average temperature means nothing.

        The desert climate I mentioned here in Canada is 150 miles from a rain forest climate around Vancouver that is on average more than 20 C cooler. That climate has not changed, it is still sand, sage brush, rattlesnakes, and small cactii, with smatterings of other vegetation.

        It’s the same Sun shining at close enough to the same latitude that it should not matter. The effect of the Sun is 20C+ hotter over a 150 mile distance. Alarmist would attribute that change to anthropogenic CO2 while completely ignoring the real factors that cause such a change in climate.

        Just noticed when verifying the record that Environment Canada and other alarmists are now listing temperatures from 1981 onward. In their alarmists zeal they seem intent on erasing long standing records dating back to the 1930s to align themselves with the chicanery of NOAA and NASA GISS.

        I think it takes an unmitigated gall for modern climatologists to go back in the temperature record and change a recorded temperature because it does not fit in their alarmist minds.

        • David Appell says:

          Gordon Robertson says:
          “I think it takes an unmitigated gall for modern climatologists to go back in the temperature record and change a recorded temperature because it does not fit in their alarmist minds.”

          What do you think of UAH’s adjustments?

          PS: Adjustments REDUCE the long-term warming trend.

          You therefore want MORE warming than the science calculates today.

          PS: How much more, Gordo?

        • Mick says:

          The record for this day in Vancouver was 17.8 C in 1939. People would be running around claiming, “see? global warming.” if this were to happen today.

  24. ren says:

    Meanwhile, South Australia arrive already chilly fronts. To the east, a lot of rain.
    http://images.tinypic.pl/i/00880/lxa2978e4nhj.png

  25. Robert Young says:

    In the early 70’s in Missouri, 50 Miles south of St. Louis, we had a cold April. I forget which year, but I had to go to my Great-grandfather’s and my Grandfather’s funerals within 7 days of each other. Early April and we got 12 inches of snow! Before that in December around Christmas, I got yelled at by my mom for being outside in shorts, no shoes, no shirt. Temp was in the 70’s. Climate Change? No! Crazy Weather? Yes!

  26. Natalie Green says:

    Global warming isn’t working in Northern Alberta either. It’s been below normal temperatures since the beginning of December, other than 1 week in January, and a couple days in February

    • Gordon Robertson says:

      Natalie green…”Global warming isnt working in Northern Alberta either. Its been below normal temperatures since the beginning of December, other than 1 week in January, and a couple days in February…”

      Same on the coast, near Vancouver. Record cold for December, extending into January 2017. Has not warmed up much seasonally since.

      It’s all about Arctic air. Alarmists seem to think people in the Arctic are lying on the beach and sailing in the ice free water all winter.

      • David Appell says:

        No, they don’t. But they’re not stupid enough to believe that two months of local data represents long-term global trends.

        • Gordon Robertson says:

          DA…”No, they dont. But theyre not stupid enough to believe that two months of local data represents long-term global trends”.

          But they are stupid enough to believe that a trace gas can warm the atmosphere and that it’s still warming when their demigod, the IPCC, tells them it is not.

          • David Appell says:

            GR, what does your calculation show for the warming of this “trace gas?”

            Show your work, or link to it.

          • David Appell says:

            Gordon Robertson says:
            “But they are stupid enough to believe that a trace gas can warm the atmosphere and that its still warming when their demigod, the IPCC, tells them it is not.”

            GR, do you know the concentration of ozone in the ozone layer?

            And you know, I assume, that without that we’d all be dead — or never born.

  27. MikefromFarmington says:

    “Global warming theory is in fact so malleable that it predicts anything. More cold, less cold. More snow, less snow”. Yes! Finally we have the ToE (Theory of Everything) of the new “Climate Science”.

    • John Smith says:

      I’ve had a little trouble following the ‘science’ of climate change.
      Then I started thinking of it as a religion.
      That helps.
      I grew up as a Methodist.
      The ‘method’ is unclear to me.
      Who or what frack is the Holy Ghost?
      I was told if I were good and had faith all would be well.
      Now I’m told if I am good and have faith the weather will stay friendly.
      So there.

    • Lewis says:

      String theory of climate.

  28. Rick Kargaard says:

    This is a diagram which shows you exactly how to change fiction to truth.

    https://thelogicofscience.files.wordpress.com/2016/10/ci.jpg?w=450&h=206
    “These are hypothetical data that illustrate the fact that whether or not a model worked should be evaluated based on whether or not the observed data fell within the 95% confidence interval of the model.”

    Sorry, the image would not paste here but follow the link for a good laugh.

  29. Lewis says:

    If my wife gets pregnant, can I blame that on AGW and, if so, who do I sue?

  30. Brian Barnett says:

    The AGW juggernaut is having a seriously negative impact on our lives. The South Australian Government entrusted renewable energy to increasingly provide the state with most of its power. In September last year the entire state was blacked out for many days (over 1.7m people were affected) following an intensive storm. The wind was too strong for the windfarms to operate which provides up to 35% of the state’s power. An interconnecter bringing power from another state was damaged and the South Australia was subsequently blacked out. The government had shut down and reduced to rubble a functioning coal powered electricity generator only months before. It could therefore offer nothing to the state’s electricity requirements. Instead of steadily and responsibly developing renewable energy production while still providing sufficient base load power and energy security, the government has nothing to offer. The government’s green philosophy has also put hundreds of people out of work. The closure of the power station also resulted in the closing down of a town of several hundred people which was solely there to service the coal mine that provided the now defunct power station. The forecast for the state is now for more blackouts over the next few years while they try to fix the mess we are in. We are being turned back in to a third world country because of unrealistic targets on reducing carbon dioxide emissions that will make about five poofteenths difference to the global climate.

  31. JDHuffman says:

    …five poofteenths?

    How about “pico-poofteenths”?

  32. ren says:

    The current temperature in the eastern US.
    http://images.tinypic.pl/i/00881/en7m70oajwo4.png

  33. ren says:

    Winter Storm Stella a Record Snowstorm for Binghamton, New York; Over 30 Inches of Snow Reported From Northeast Bombogenesis.
    https://www.wunderground.com/news/winter-storm-stella-northeast-blizzard-warning-noreaster-snow-forecast-march-2017

    • ren says:

      “This major nor’easter has taken shape as an area of low pressure off the East Coast underwent bombogenesis, meaning there was a rapid drop in atmospheric pressure, indicating strengthening.”

  34. Bob says:

    Why do your comments smell more like those of a YouTube troll instead of those of a scientist?

    • Gordon Robertson says:

      Bob…”Why do your comments smell more like those of a YouTube troll instead of those of a scientist?”

      Roy is a down-to-Earth scientist with a sense of humour. I suppose you are used to the hyper-serious alarmist scientist who lack the real data to which Roy and UAH are privy.

      • Dr No says:

        Bob,
        Note, that unlike that amateur denialist Gordon, Roy is a warmist – albeit luke warm.
        However, Roy appears conflicted since he is a scientist but also appears to be a conservative religious type.

        • Gordon Robertson says:

          dr no…”Roy appears conflicted since he is a scientist but also appears to be a conservative religious type”.

          Get off your propaganda. Roy and UAH have the data. That’s what science runs on, not the opinions of Aussie trolls.

          Disprove the data, never mind the ad homs. You can’t disprove it, however, so you are forced to use base innuendo and propaganda.

          • Dr No says:

            Gordon, what are you so upset about?
            Calm down.

            Roy would not mind my assessment of him. I think it is pretty fair.
            Secondly, I have no need to disprove UAH data – it clearly indicates long-term warming.

          • David Appell says:

            Gordon Robertson says:
            “Roy and UAH have the data.”

            No Gordon, they have a model. Whether that model is accurate is a whole different question. The large changes going from v5.6 to v6.0 suggests they are still figuring things out.

            Carl Mears, Senior Research Scientist, Remote Sensing Systems (RSS)

            “A similar, but stronger case can be made using surface temperature datasets, which I consider to be more reliable than satellite datasets.”

            http://www.remss.com/blog/recent-slowing-rise-global-temperatures
            video: https://www.youtube.com/watch?v=8BnkI5vqr_0

          • Gordon Robertson says:

            DA…”No Gordon, they have a model. Whether that model is accurate is a whole different question”.

            You are in deep denial. The data is gathered from oxygen molecules which transmit microwave corresponding to their temperature.

            Anyone like Mears who claims the sat data is not as good as the surface data is an alarmist. I have always suspected RSS of working for the alarmist side.

            If the AMSU units on sats are models then so are thermometers. You apparently know nothing about electronics or communications theory.

          • Gordon Robertson says:

            dr no…”Gordon, what are you so upset about?
            Calm down”.

            You are mistaking intensity for uncontrolled emotion. I don’t like to see good scientists denigrated by ad homming them over their religious beliefs.

            As I said, Isaac Newton was far more devout than either Roy or John, having written volumes on his interpretation of the Bible. Are you going to suspect his work on calculus, optics, and gravity, based on his religious beliefs?

          • Gordon Robertson says:

            dr no…”I have no need to disprove UAH data it clearly indicates long-term warming”.

            Only to the brain dead and the scientifically-challenged.

            And trolls.

            Your trolling is highly ineffective. You lack the wit and cleverness to be a true troll. If you are trying to bait me you’d better step up a couple of notches.

          • Dr No says:

            “Your trolling is highly ineffective. You lack the wit and cleverness to be a true troll. If you are trying to bait me youd better step up a couple of notches.”

            Gordon, the very fact that you keep responding to my informative posts suggests to me that I am getting under your skin.
            You must understand that I am not trolling – I am teaching. Nothing I have posted has been proved to be other than correct and relevant – a record of which I am very proud.

          • David Appell says:

            Gordon Robertson says:
            “Anyone like Mears who claims the sat data is not as good as the surface data is an alarmist.”

            You are a joke.

            Mears knows infinitely more than you about the satellite data.

            Infinitely more.

            Your opinion means absolutely nothing compared to his. It’s hilarious that you would even pretend so.

        • David Appell says:

          Gordon Robertson says:
          “dr noI have no need to disprove UAH data it clearly indicates long-term warming.
          “Only to the brain dead and the scientifically-challenged.”

          Now you disagree that the UAH data show warming.

          Let’s see your calculation. Can’t wait.

    • ren says:

      Is another strong rain in California are consistent with climate science? Or “theory” is more important than reality? Drought may be theoretical?
      https://earth.nullschool.net/#2017/03/18/2100Z/wind/isobaric/850hPa/overlay=total_cloud_water/orthographic=-122.23,41.01,1979

  35. don penman says:

    I have been keeping a temperature record both internal and external where I live in Lincoln UK at 15m above sea level.
    2015-2016 internal external
    min max min max
    November 9.1 17.2 -1.5 17.1
    December 9.2 14.7 1.00 15.3
    January 5.5 13.6 -2.4 14.8

    2016-2017 internal external
    November 8.7 16.4 -1.1 12.3
    December 7.1 12.7 -2.9 13.0
    January 5.4 10.7 -2.4 9.9
    I note that an internal temperature below 8 degrees is colder than a fridge.Using the minimum temperature we should keep our rooms by the NHS of 18 degrees centigrade the temperatures recorded have a relative value of -12.6 at minimum internal temperature. I note that the internal temperature has dropped by 0.1 degrees centigrade in one year this is not an insignificant drop in surface warming caused by a drop in solar radiation as I have not heated my flat. I don’t think that the named storm even if it crosses the Atlantic will produce a lower internal temperature than I recorded in January.

  36. Norman says:

    Dr. No

    This data source may appeal to you. Australia’s temperatures throughout 100 years of data beginning in 1914. If you go through the years you might realize there are not strong established patterns to heat or cool. Some years half the continent is cold the other half hot, other years all is hot or cold. It does seem to be getting warmer which agrees with global warming but not to any noticeable pattern.

    http://www.abc.net.au/news/2014-07-09/100-years-of-temperatures/5582146

    • Dr No says:

      You only have to look at the trend maps at
      http://www.bom.gov.au/climate/change/#tabs=Tracker&tracker=timeseries
      to see the spatial pattern of maximum, minimum and mean temperature trends between 1910 and 2015.
      Nowhere is there any sign of cooling.
      Pretty simple, really.

      • Norman says:

        Dr. No

        And it is also very simple to see clearly you have been deluded by the “fake news” you consume and now believe is rock solid.

        Look at your own link. In the graphs they have one of extreme temperatures from 1910 to 2015. They show the average number of very hot days.

        http://www.bom.gov.au/climate/change/#tabs=Tracker&tracker=extremes-timeseries

        The graph certainly does not show any support that extreme temperatures are increasing in Australia. The graph you link to shows an increase in background temperature of over 1 C in the time frame but that does not show any effect on days that are much warmer than the 1 C increase. In US heat waves must have temperatures 5 C above normal for at least 3 consecutive days.

        • Norman says:

          Dr. No

          This graph would show about a 1 C increase in the average hottest temperatures and the following one shows about the same for cold days.

          http://www.bom.gov.au/climate/change/#tabs=Tracker&tracker=extremes-timeseries&tQ=graph%3DTXmx%26ave_yr%3D0

          http://www.bom.gov.au/climate/change/#tabs=Tracker&tracker=extremes-timeseries&tQ=graph%3DTXmn%26ave_yr%3D0

          Both show an upward trend of about 1 C which your linked graph shows, that does not mean Australia is having many more super hot days which is not supported by the post above.

          What evidence do you provide that you are correct in extreme heat coming to Australia?

          • Dr No says:

            “What evidence do you provide that you are correct in extreme heat coming to Australia?”

            How about this:
            The early 2009 southeastern Australia heat wave was a heat wave that commenced in late January and led to record-breaking prolonged high temperatures in the region. The heat wave is considered one of the, if not the, most extreme in the region’s history.[2] During the heat wave, fifty separate locations set various records for consecutive, highest daytime and overnight temperatures. The highest temperature recorded during the heat wave was 48.8 C (119.8 F) in Hopetoun, Victoria, a record for the state.[3] Many locations through the region recorded all-time high temperatures including capital cities Adelaide, which reached its third-highest temperature, 45.7 C (114.3 F), and Melbourne, which recorded its highest-ever temperature on record, 46.4 C (115.5 F). Both cities broke records for the most consecutive days over 40 C (104 F), while Mildura, Victoria recorded an all-time record twelve consecutive days over 43 C (109 F).
            https://en.wikipedia.org/wiki/Early_2009_southeastern_Australia_heat_wave

          • Dr No says:

            Or this:
            “In Australia the number of days per year over 35 degrees Celsius has increased and extreme temperatures have increased on average at 7 per cent per decade.

            Very warm monthly maximum temperatures used to occur around 2 per cent of the time during the period 19511980. During 20012015, these happened more than 11 per cent of the time.”
            http://www.abc.net.au/news/2017-01-19/2016-hottest-year-on-record-australia-needs-to-get-heat-smart/8194182

            That wasn’t too difficult.

          • David Appell says:

            Are there any reported deaths from the recent Australian heat wave?

          • David Appell says:

            Norman, I already showed you the math on this.

            If temperature increases linearly, the chances of extreme heat events rises exponentially:

            http://davidappell.blogspot.com/2015/07/why-very-warm-events-are-much-more.html

          • Norman says:

            Dr. No

            Please check out these records and note the dates and the highest temperatures.

            http://www.bom.gov.au/climate/extreme/records.shtml

            Also please try to take a few minutes and look at this graphic.
            http://www.abc.net.au/news/2014-07-09/100-years-of-temperatures/5582146

            Go to the date 1980 then compare it to your 2009 and tell me why you think 2009 is much different in extent of heat than 1980?

          • Norman says:

            David Appell

            Your math may be a nice exercise but it does not seem to be supported by the empirical evidence.

            http://www.bom.gov.au/climate/change/#tabs=Tracker&tracker=extremes-timeseries&tQ=graph%3DHD40%26ave_yr%3Dt

            The graph shows a slight upward trend but definitely not an exponential increase. Maybe rework the math to reflect reality.

          • Dr No says:

            “What evidence do you provide that you are correct in extreme heat coming to Australia?”

            The time series you refer to indicate an average increase of about :
            1 day of temperatures above 40 (about +10%)
            5 days of temperatures above 35 (about +10%)
            12 days of overnight temperatures above 25 (about +60%)
            17 days of overnight temperatures above 20 (about +25%)

          • Gordon Robertson says:

            DA…”Norman, I already showed you the math on this”.

            You are applying probability theory in an area where it does not fit. There is no way to calculate the probable temperature based on an existing temperature.

            You are missing a factual basis for the heating. CO2 can be regarded as a partial gas in the atmosphere based on it’s volume, pressure, or number of atoms. The relationship is Vx/Vt = Px/Pt = Nx/Nt where Vx is CO2 as a partial volume, Px is a partial pressure and Nx is a partial number of atoms.

            They are all related since volume, pressure, and mass are related. Through the ideal gas law, T is related to P, V, and n as in PV = nRT.

            It becomes exceedingly obvious that the heat contribution of each partial gas to the atmosphere is related to its mass. I realize each molecule has a different AMU, I am only generalizing.

            All CO2 has an approximate relative mass of 0.04% compared to the mass of all atmospheric gases while N2 and O2 combined have an approximate relative mass of over 99%. The actual masses vary slightly but not enough to have significance.

            Why should CO2 have any more of an effect on atmospheric heating than 0.04%? And why should ACO2 not produce a fraction of that? All GHGs combined, given a 1% by mass weighting, which is generous, should contribute only 1% of the warming.

            If it did warm 1C since 1850, that means the contributions of GHGs should be around 0.01C.

            There is no exponential heating related to the physical cause of warming unless the Sun suddenly changes it’s output. Whether the atmosphere heats more has nothing to do with probability it is all about the motion of atoms and molecules in the atmosphere.

            The variations to which you refer have been accounted for. Lindzen explained that the surface temperature could rise to 72C were all convection to stop. We are cooled by convection and when convective winds become still, temperatures can rise to the uncomfortable levels you experienced.

            I experienced the same thing here while visiting a desert climate about 150 miles NE of Vancouver. There was not a hint of a convective breeze, the Sun was beating down so mercilessly we had to move our camp site.

            I talked to a local hotelier later and he told me the locals left thermometers out in direct sunlight and watched them rise to over 50C, just so they could brag about it. I know that’s not scientific but even in the shade it was close to 45C, which is 113 F.

          • David Appell says:

            Norman says:
            “Your math may be a nice exercise but it does not seem to be supported by the empirical evidence.
            http://www.bom.gov.au/climate/change/#tabs=Tracker&tracker=extremes-timeseries&tQ=graph%3DHD40%26ave_yr%3Dt

            Nope. You graph shows number of events. But I calculated the increase in events AT a certain temperature, as a function of temperature.

          • David Appell says:

            Gordon Robertson says:
            “You are applying probability theory in an area where it does not fit. There is no way to calculate the probable temperature based on an existing temperature.”

            That wasn’t what I calculated.

          • David Appell says:

            Gordon Robertson says:
            “The relationship is Vx/Vt = Px/Pt = Nx/Nt where Vx is CO2 as a partial volume, Px is a partial pressure and Nx is a partial number of atoms.”

            That’s wrong. Something like the ideal gas law applies, not Boyle’s law (at constant temperature).

            “It becomes exceedingly obvious that the heat contribution of each partial gas to the atmosphere is related to its mass.”

            Wow, you really misunderstand global warming.

            Global warming works by trapping *radiative* energy (infrared radiation; photons), not by trapping molecular kinetic energy. That extra radiation is eventually spread equally through all the air molecules in the atmosphere, not just the CO2 molecules.

          • Gordon Robertson says:

            DA…”Global warming works by trapping *radiative* energy (infrared radiation; photons), not by trapping molecular kinetic energy. That extra radiation is eventually spread equally through all the air molecules in the atmosphere, not just the CO2 molecules”.

            I did not claim heat was trapped in the atmosphere, I claimed it is impossible to trap it.

            1)How does a gas representing 0.04% of the atmosphere trap enough of the massive IR flux radiated from the surface to make a difference?

            2)the greenhouse theory is built on the notion that GHGs in the atmosphere trap heat, just as the glass traps heat as excited molecules of air. The AGW theory, as the extended GHE, expands on the GHE to claim ACO2 as a GHG traps heat. Although it’s wrong, it’s common AGW knowledge.

            3)molecular kinetic energy is heat. To trap heat, the molecules would have to be trapped by glass, as in a real greenhouse. There is no mechanism in the atmosphere than can trap molecules.

            4)It would not be possible for 0.04% of the atmospheric molecules to trap radiation and spread it around to the other 99%+. That is a ludicrous statement that shows how lame the AGW theory really is.

            Alarmists hammer home the point that only GHGs can absorb and transmit IR at the wavelengths transmitted by the surface. If the rest of the gases like N2 and O2 could absorb that energy they would do so straight from the surface. What’s so magical about CO2 emissions that N2 and O2 can absorb IR from it that they cannot absorb from the surface?

            Heat in gases is normally passed by collisions. Since N2 and O2 massively out-number CO2 molecules by mass it is far more likely that N2 and O2 get their increased kinetic energy (heat) from the surface directly by conduction and transfer it by convection, as Lindzen implied.

            IMHO, the radiation theory of atmospheric warming is dead wrong.

          • Gordon Robertson says:

            DA…”Thats wrong. Something like the ideal gas law applies, not Boyles law (at constant temperature)”.

            I am not interested in your yes or no opinion, I want to see you debunk what I just said. Is temperature in the atmosphere related to partial pressure, partial volume, and the partial number of atoms (mass)?

            I made no reference to Boyle’s Law. My formulae came from an adaptation of Dalton’s Law of partial pressures. Dalton proved the total gas pressure is the sum of the partial pressures of non-reactive gases. Since volume, pressure, and the number of atoms are directly related to each other and the temperature, through the ideal gas law, then the partial number of atoms/molecules should indicated the partial temperature.

            All I am trying to indicate is that the mass of CO2 in the atmosphere is far too small to contribute a significant amount of heat. Certainly far less than the 9% to 25% claimed by Gavin Schmidt and other modellers.

          • Nate says:

            Gordon,

            Co2 is trace gas at 400 ppm.

            Similarly trace amts of impurities, 100 ppm, make clear aluminum oxide into a deep blue sapphire. Agree? You can look it up.

            Now shine a strong blue light on the clear Aloxide and it will do nothing. Shine it on the sapphire, it will heat up. Agree?

            Similarly a strong IR light shined on air with 400 ppm CO2 will heat up. Because co2 absorbs strongly in IR. Agree? If not explain.

          • Nate says:

            ‘Shine a strong blue light’ might actually absorb yellow. So make that a strong yellow light. You get the idea.

          • David Appell says:

            Gordon Robertson says:
            “I am not interested in your yes or no opinion, I want to see you debunk what I just said.”

            I already did. Read harder.

          • David Appell says:

            Gordon Robertson says:
            “All I am trying to indicate is that the mass of CO2 in the atmosphere is far too small to contribute a significant amount of heat. Certainly far less than the 9% to 25% claimed by Gavin Schmidt and other modellers.”

            What does your calculation find, instead of the 9-25%?

          • David Appell says:

            Gordon Robertson says:
            “3)molecular kinetic energy is heat. To trap heat, the molecules would have to be trapped by glass, as in a real greenhouse. There is no mechanism in the atmosphere than can trap molecules.”

            Again, utterly and sadly clueless about the physics.

          • Gordon Robertson says:

            DA…”Again, utterly and sadly clueless about the physics”.

            I don’t think you have a degree, either that or you scraped through by the skin of your teeth.

            Anyone who does not understand that heat is the kinetic energy of atoms is clueless in thermodynamics. Clausius stated that more than 150 years ago and so did Planck.

          • Gordon Robertson says:

            DA…”What does your calculation find, instead of the 9-25%?”

            If you’d read what I said with any degree of comprehension rather than skimming to find points with which you disagree you would have seen that I estimated 0.01C over the past 150 years.

          • David Appell says:

            Gordon Robertson says:
            “Anyone who does not understand that heat is the kinetic energy of atoms is clueless in thermodynamics”

            Every monkey knows THAT.

            But kinetic energy is not the basis of the greenhouse effect. You claim that it is is wrong.

          • David Appell says:

            Gordon Robertson says:
            “1)How does a gas representing 0.04% of the atmosphere trap enough of the massive IR flux radiated from the surface to make a difference?”

            I’m not permitted to reply here in detail.

          • David Appell says:

            Not even permitted to break up my answer into many tiny parts.

          • David Appell says:

            Gordon: it’s about cross sections.

        • David Appell says:

          Still can’t comment here. Stupid blog.

    • Gordon Robertson says:

      DA…”ideal gas law applies, not Boyles law (at constant temperature)”.

      The formula I supplied Vx/Vt = Px/Pt = Nx/Nt obviously comes from the Ideal Gas law by holding the temperature constant.

      PV = nRT

      Let’s hold n and V constant instead of T. If we assume n is constant in the atmosphere and V as well, we have P = (nR/V)T. That means P is proportional to T.

      I am proposing that if we take the partial pressure of CO2 wrt to the pressure of the entire atmosphere, we should be able to determine a partial temperature as in:

      Px/Pt = Tx/Tt.

      Not very elegant and it takes great license with matters like n and V being constant. A partial temperature would actually refer to the relative heat contributed by mass of each gas.

      However, it indicates that the temperature of the entire atmosphere in a totally ideal state is dependent on the partial pressures of it’s constituent gas pressures, hence the number (mass) of those constituent molecules.

      Before you try to skewer me with this, I admit that my proposition is highly idealized. All I’m trying to convey is that the partial pressure of CO2 in the atmosphere is far to low for it to contribute much to atmospheric warming.

      • Norman says:

        Gordon Roberts

        From reading your posts on how you believe the GHE works I think that the conclusion is that you do not quite understand the process and in your lack of understanding are coming up with incorrect conclusions.

        Here is one of your points that is not correct:

        “1)How does a gas representing 0.04% of the atmosphere trap enough of the massive IR flux radiated from the surface to make a difference?”

        The non radiating gases like oxygen and nitrogen do play a strong role in the GHE but no with IR emission. The amount of IR they emits is several magnitudes less than CO2 and only exotic configurations of these gases will emit any IR.

        The CO2 is not “trapping” the IR. Some of the IR from the surface is absorbed by GHG and clouds (only 10% of the surface IR makes it through without being absorbed and reemitted…atmospheric window).

        This absorbed energy can be reradiatied but a large part gets lost in collision with surrounding molecules. This then warms the surrounding molecules and they can excite the GHG to emit in all directions. Also the atmospheric gases are warmed by convection, conduction and latent heat when water vapor condenses.

        The overall effect is a warmed GHG continuously emit IR in all directions with some being directed back to the surface.

        Here is actual empirical data.
        http://fchart.com/ees/gas%20emittance.pdf

        If you take the CO2 concentration at 0.0004 for the partial pressure to use in this graph. Go through 1000 meters of atmosphere with this concentration to get your beam path. You get a value of 0.4. Look at the graph. This will give you an emissivity of around 0.17. Use the Stefan-Boltzmann equation and you can find that Carbon Dioxide at around 8.5 C (loss of temp of 6.5 from surface 15 C – 6.5).

        Power (watts/m^2) = 0.17(5.67^10-8)(281.65)^4= 60.65 W/m^2 in all directions. The total downwelling IR is 340 W/m^2 which means carbon dioxide contributes about 18% to the GHE and Gavin is quite correct on this point. Do you see how that works?

        • Norman says:

          Gordon Roberstson

          GHE is caused by a warmed atmosphere with IR emitting gasses that emit this energy in all directions. The amount of Carbon Dioxide in the air is quite enough to add to the GHE which leads to a warmer surface.

          http://www.patarnott.com/atms411/pdf/StaleyJuricaEffectiveEmissivity.pdf

          Read through this one and it will greatly help you understand the GHE. Your arguments against it are not really useful or helpful and will only reduce the validity of some of the points you make (which I like and agree with). You really need to try and correct your incorrect understanding of the GHE and then when you post about it you will be posting with knowledge instead of a faulty reasoning based upon incorrect assumptions on how the process works.

          • Gordon Robertson says:

            Norman…”Read through this one and it will greatly help you understand the GHE”.

            Norman…I appreciate your interest but I’ve read quite enough of the ‘theory’ behind the GHE. I don’t accept it as valid science and apparently physics in general does not subscribe to it.

            Here’s a critique of the GHE by two experts on the atmosphere, coming from a background in thermodynamics. They have carefully presented a critique using physics and thermodynamics and they have addressed most modern claims on the GHE and revealed their weak points.

            https://arxiv.org/PS_cache/arxiv/pdf/0707/0707.1161v4.pdf

            Here an article by Nahle which questions the emissivity of CO2.

            http://climaterealists.com/index.php?id=7466

            Another one in which Nahle reproduces the experiment of Woods from 1909.

            http://www.biocab.org/Wood_Experiment_Repeated.html

            There is plenty of evidence to suggest the GHE is wrong and that CO2 is highly over rated as a warming mechanism.

          • David Appell says:

            All junk science. Naturally Gordon accepts it — he can’t tell the difference.

          • Norman says:

            Gordon Robertson

            I would strongly agree with David Appell’s assessment of your links. I looked through the long one stating the GHE was not correct but I did not see where they did a calculation of the atmospheric emissivity. It had many flawed arguments and they try to cover it in some complex math that is difficult to follow hoping they can dazzle the untrained with a bunch of crap.

            I have read material from this person Nahle, I consider him a complete fraud and terrible scientist. I find flaws in all his material that is not supported by any established physics. I think he is a good example of a “crackpot” and that you use him as a source makes me hope you shake the dust from this one.

            In one of your links from Nahle he shows this equation.

            I can’t follow it, non of the terms are defined or explained.
            “Ɛcd = [1 (((a-1 * 1 PE)/(a + b (1 + PE)) * e (-c (Log10 ((paL)m / paL)^2))] * (Ɛcd)0 [8]”

            Then using this bogus equation he comes up with a emissivity of Carbon Dioxide in 7000 meters of air at 0.0017. How the hell he came up with that I have no clue and without some really good explanation it should go into the toilet.

            Did you even attempt to look at Hottel’s actual graphs I linked to? They are based upon measurements and are considered valid data and used in industry applications.

            http://fchart.com/ees/gas%20emittance.pdf

            The Hottel graph for Carbon Dioxide should convince you Nahle is an idiot. You can do the math yourself as I have done above. Take the partial pressure of Carbon Dioxide 0.0004 and multiply this my 1000 meters you get a value that is 0.4 follow this line to the lower temperatures on the left and you get around 0.17 emissivity not 0.0017. Makes a big difference.

          • David Appell says:

            Gordon Robertson says:
            “I do not believe the GHE theory at all, I think it is metaphorical nonsense.”

            Q: Does the atmosphere store heat?

            If yes, then there is greenhouse effect.

          • David Appell says:

            Gordon, again: does the atmosphere store heat?

        • Gordon Robertson says:

          Norman…”From reading your posts on how you believe the GHE works I think that the conclusion is that you do not quite understand the process and in your lack of understanding are coming up with incorrect conclusions”.

          Norman…thanks for reply but you presume too much. I do not believe the GHE theory at all, I think it is metaphorical nonsense.

          What I described is how other believers thinks it works. I think it’s nonsense that GHGs, making up on average, about 1% of atmospheric gases have any effect at all. As I described, based on partial pressures, which translate to partial mass per gas, the warming attributed to CO2 over the past 150 years would be about 0.01C.

          1)”The non radiating gases like oxygen and nitrogen do play a strong role in the GHE but no with IR emission”.

          Once again, I think the radiation theory of atmospheric warming is nonsense. It was adopted by modelers only because they had standard Navier-Stokes equation which can be readily applied to the different equations that are the basis of models.

          As Woods claimed, circa 1909, infrared surface radiation would be ineffective more than a few feet from the surface. I have given a poignant example of that where a 1500 watt element on an electric stove, glowing cherry red, would literally cook the flesh on your hand by radiative heat transfer if you held your hand close enough. Five feet away it has absolutely no effect.

          If you don’t believe that, take a marshmallow, stick a fork in it. and hold it an 1/8th of an inch above the element. See if it turns brown and eventually catches fire. Now place it back 5 feet and see if it even gets warm. That’s the effect surface radiation has on GHGs in the atmosphere.

          I have nothing but contempt for climate modelers, feeling strongly that they have corrupted science. I don’t even regard them as scientists, unless you consider social scientists to be valid scientists.

          I don’t think N2 and O2 play a role in a fictitious GHE, I think they run the atmosphere through pure conduction and convection. CO2 has absolutely no effect on atmospheric warming.

          Without the convective flow of N2/O2 we humans would have been fried a long time ago as surface temperatures without convection reached the 72C suggested by Lindzen.

          I’ll continue this in another post for fear of falling prey to the censors.

        • Gordon Robertson says:

          Norman…from 1)…”This absorbed energy can be reradiatied but a large part gets lost in collision with surrounding molecules. This then warms the surrounding molecules and they can excite the GHG to emit in all directions”.

          Consider the concentration of CO2 in a background mass of N2 and O2. N2 and O2 account for close to 99% of atmospheric mass and CO2 about 0.04%.

          In ppmv, giving CO2 400 ppmv, N2 is 780,840 ppmv and O2 209,460 ppmv. Do you think a molecule of CO2 is going to have any warming impact against such odds? If so, where is the proof for that? Where in climate science has anyone ever proved a one to one correlation between CO2 and the rest of the atmosphere?

          The N2 and O2 are likely already warmed to a certain level via conduction and convection and have likely warmed the CO2 through collision. How much more can the CO2 warm by absorbing a photon of IR? Also, if the CO2 is in temperature equilibrium who is to say it will absorb surface radiation at all?

          It’s ridiculous to presume that a scant, trace gas can have that impact in the atmosphere. This is a classic case of the tail wagging the dog.

          The radiative theory is far too narrow in scope. There are far too many assumptions made that have never been proved and are outright false.

        • Gordon Robertson says:

          Norman…”The total downwelling IR is 340 W/m^2 which means carbon dioxide contributes about 18% to the GHE…”

          That 340 w/m^2 comes from the fiction published by Kiehle-Trenberth in their radiation budget. They admitted to having contrived their values from pure theory.

          There is no way that GHGs, making up 1% of atmospheric gases at best, can back-radiate the same amount of radiation the surface produces. Furthermore, the alleged heat transfer via back-radiation takes place from a colder region to a warmer region, a direct contravention of the 2nd law.

          I have already demonstrated, using the ideal gas equation, that atmospheric temperature is directly proportional to mass, via pressure. If Co2 had an 18% effect it’s mass would need to be in proportion and it’s not.

          Norman…I studied the application of Boltzmann to stars while taking a course in astronomy. Boltzmann applies to highly theoretical black body radiators at extremely high temperatures. Applying it to our atmosphere is plain silly, especially to a gas that is so insignificant it should not even be considered in calculations.

          If two stars were very close to each other so that their independent radiation impinged on each other, you could apply Boltzmann and Kircheoff but never be able to verify either. The entire exercise is purely hypothetical.

          In the atmosphere/surface interface, where the surface is a relatively independent radiator of IR and GHGs are totally dependent absorbers, especially where losses and the 2nd law apply, applying Boltzmann makes no sense.

          The 2nd law has to be satisfied and you cannot write it off by implying that the sums of radiation between bodies is positive. The 2nd law requires that heat cannot be transferred from a cooler atmosphere to a warmer surface.

          There’s nothing to stop the atmosphere radiating IR, it’s simply ignored by the surface and any other body at a warmer temperature. If you apply Boltzmann or Kircheoff in those situation you will not get correct answers and I think it’s because the requirements of blackbody radiation are not met.

          IR does not have to be absorbed by a body just because it strikes it. There are rules involving the requirements of electrons in atoms that must be met before they will change energy levels to cause warming. The presumption that all IR will warm a body it encounters is plain wrong.

          • David Appell says:

            Gordon Robertson says:
            “That 340 w/m^2 comes from the fiction published by Kiehle-Trenberth in their radiation budget. They admitted to having contrived their values from pure theory.”

            They simply divided the solar constant by the well-known factor of 4 that accounts for the Earth’s rotation.

            Baby physics. You should learn it.

          • Norman says:

            Gordon Robertson

            Where do you get this stuff? Do you just make things up that sound good to you?

            You make a claim (with zero support) which I do not accept at all.
            “That 340 w/m^2 comes from the fiction published by Kiehle-Trenberth in their radiation budget. They admitted to having contrived their values from pure theory.”

            Look at the CERES global graph of Downwelling IR. It averages around 340 W/m^2.

            https://ceres-tool.larc.nasa.gov/ord-tool/jsp/EBAFSFCSelection.jsp

            Click tab “Visualize Data” to pull up graphs

            Look at Surface Longwave Flux Down All-Sky

          • Norman says:

            Gordon Robertson

            The GHE is based upon empirical measured values with actual instruments.

            https://www.esrl.noaa.gov/gmd/webdata/tmp/surfrad_58cdb9934135a.png

            The red line in the graph is the downwelling IR produced by GHG in the atmosphere. At this location it is close to 340 W/m^2

          • Norman says:

            Gordon Robertson

            YOU: “Theres nothing to stop the atmosphere radiating IR, its simply ignored by the surface and any other body at a warmer temperature. If you apply Boltzmann or Kircheoff in those situation you will not get correct answers and I think its because the requirements of blackbody radiation are not met.”

            Making up things does not reflect a scientific mind upon your part. You are closed minded as the other side. Open up and become more scientific. Seeking the truth, looking for evidence, not ignoring things you don’t like. I was at your mental state a few years ago reading the PSI website, reading Nahle etc. Then I started to research and learn real science and rejected all this garbage (and it really is bad once you actually learn the subject, they make many false assumptions that lead to false conclusions)

          • Norman says:

            Gordon Robertson

            This is real material that actually works.

            https://en.wikipedia.org/wiki/Multi-layer_insulation

            Read how it works. The layer surrounding the material you want to insulate is radiating energy back to it slowing the cooling rate considerably.

            The atmosphere acts as the material in the example. It radiates in both directions. Some of it returns to the source. If you want to postulate it does not get absorbed by a warmer surface than prove this statement correct. It is not based upon any laws of physics or experiments. It is an invalid theory conjured up by a “crackpot” and for some unknown reason you accept it as a fact. It is not verified it has no logical basis. It is actually a very irrational and unscientific thought process.

            Your idea would suggest that a photon has a means of communicating with the surface telling it if is comes from a warmer source or a colder source and in that it will not get absorbed if the source is colder.

            It goes like this. There are two 15 micron photons moving toward the Earth’s surface. One comes from a hot Sun and the other from a carbon dioxide molecule in the atmosphere. They both have the same energy only the emitting source was at different energies. So you are trying to convince me that your ridiculous idea is correct that the surface would know that the 15 micron from the air was from a colder source so it rejects it but absorbs the one from the Sun. How could such a stupid thought process end up here?

            I can still hope someone or something can kick your brain out of the awful cult thinking you have accepted as valid and will not look at it for what it is (a stinking pile of crap). I think you have good ideas and thoughts, I think you got pulled into the cult thought and turned parts of your brain off.

          • David Appell says:

            Thanks for that, Norman.

      • David Appell says:

        Norman says:
        “The non radiating gases like oxygen and nitrogen do play a strong role in the GHE but no with IR emission.”

        Really? Prove it.

        • Norman says:

          David Appell

          Nitrogen and Oxygen store energy that they transfer to GHG via collisions and excite the molecules of H2O and CO2 with energy transfer so they act as continuous emitters based upon the temperature of the gases.

          • David Appell says:

            Norman says:
            “Nitrogen and Oxygen store energy that they transfer to GHG via collisions and excite the molecules of H2O and CO2 with energy transfer so they act as continuous emitters based upon the temperature of the gases.”

            Their collisions incite infrared excitations? Where is that science?

            N2 and O2 do act as a weak GHG through what’s called “collisional broadening.” During the brief time of their collisions — N2/N2, N2/O2, O2/O2 — they exist in essentially a 4-molecule gas molecule that has rotational and vibrational bands that can absorb infrared radiation, and then re-emit it.

            But it’s a second-order effect. Collisional broadening is covered in any decent climate science textbook, like Pierrehumbert’s.

        • Gordon Robertson says:

          Proof that N2 and O2 play a strong role in atmospheric warming and emission to space:

          http://www-eaps.mit.edu/faculty/lindzen/230_TakingGr.pdf

          • Norman says:

            Gordon Robertson

            I did not find proof “Proof that N2 and O2 play a strong role in atmospheric warming and emission to space:”

            In this Lindzen article. Can you specify? Lindzen himself believes in a GHE that keeps the surface warmer than if no GHE were present.

            His concern is that the models of climate have a far too high sensitivity for Carbon Dioxide. I do not see any discussion of oxygen or nitrogen role in emission to space.

          • barry says:

            Yes, citing this is odd. Lindzen clearly accepts ‘greenhouse’ theory, and that a doubling of CO2 would lead to a surface temperature rise of 1C in the absence of any feedbacks.

            He does not invoke NO2 and O2 in this paper. Not once. He is arguing that climate sensitivity is overestimated. He’s definitely not denying the enhanced greenhouse effect.

        • Norman says:

          David Appell

          I did find this one, I have found other material a few years ago saying similar things but have not been able to locate it with may current searches.

          Here is the information: “In practice this is not quite true because CO2 molecules can and do collide with nitrogen and oxygen molecules. In fact, the interval between such collisions with the bulk gas, and the time for which an absorbed photon is held by CO2 before being released again, are about equal at 10 nanoseconds. Thus, some energised CO2 molecules will be forced to give up part or all of their vibrational energy to a bulk gas molecule as a result of a collision, in which case they will be unable to re-emit the photon. In other cases, collisions with bulk gas will impart sufficient vibrational energy to a CO2 molecule for it to emit a brand-new infrared photon of its own accord, without having had to absorb one. Probably, both happen to some extent. This is where things get a little complex, because it is extremely hard to predict which of these two mechanisms will predominate. It may be that some of the ‘greenhouse effect’ trapped heat is transferred to the bulk gas, warming the atmosphere, or that the bulk gas excites CO2 molecules which in turn radiate 50% of that heat to space and the other half back to the Earth. Opinions on this, and its likely effect on the greenhouse effect, differ.”

          From this source:
          https://iwrconsultancy.co.uk/science/greenhouse_gas

  37. ren says:

    Some say that it rains in California because we have El Nino. Yes, we have, but only Nino 1 + 2.
    http://www.cpc.ncep.noaa.gov/products/analysis_monitoring/enso_update/ssta_c.gif

  38. ren says:

    Dr. Roy Spencer, please do not be offended.
    https://www.youtube.com/watch?v=L-yw3J6xeJ4

  39. David Appell says:

    Roy, so did you find any evidence to support your claim here?

    I just Googled for news articles on “northeast snowstorm” and “global warming,” but found only one recent (3/13), which was really about Scott Pruitt’s idiotic claim on CO2.

    PS: By the way, what do you think about Inhofe using a snowball to deny global warming?

    • Chris Hanley says:

      You should have tried ’snowstorm + climate change’ which brings up a few results:
      … Snowstorms and cold weather traditionally bring out the science deniers (we’ll never forget you, Senator Snowball), but in an atmosphere that is being fundamentally changed by human activity, every weather event is influenced in some way by climate change, and this week’s storm is no exception … Grist Mar 13, 2017.
      … Storm Stella has brought chaos to millions in America’s north-east. Scientists are increasingly convinced climate change plays a role in extreme weather events … The Day 15 March 2017.
      … Climatologist and environmental writer Eric Holthaus couldn’t help himself. He had to link the storm to man-made global warming in a Daily Beast article. Holthaus wrote that “[t]wo studies published last year argue that climate change may be making the ingredients for big East Coast snowstorms more likely” … The Daily Caller 03/13/2017.
      I think generally people are seeing through the hysteria and the climate alarmists and shysters are becoming more circumspect in making wacky claims.

      • David Appell says:

        Grist is right — every weather event *does* have some influence of ACC in it. Kevin Trenbeth has been saying this for years.

        • Gordon Robertson says:

          DA…”Kevin Trenbeth has been saying this for years”.

          Trenberth also said in the Climategate emails that the warming has stopped and it’s a travesty that no one knows why. The IPCC later corroborated that in 2013.

          It’s apparent these people knew the warming stopped after the 98 EN yet they have carried on with propaganda aimed at misleading the public into thinking we are facing catastrophic warming and climate change.

          The IPCC knew it had stopped for 8 years when they announced in 2007 that it is 90% ‘likely’ humans are causing the warming. Following their admission in 2013 that the previous 15 years had no warming, they upped the confidence level to 95% that humans are ‘likely’ causing the warming.

          You can’t trust alarmists. They are on a mission and it’s not related to science.

        • David Appell says:

          Gordon Robertson says:
          “DAKevin Trenbeth has been saying this for years.
          “Trenberth also said in the Climategate emails that the warming has stopped and its a travesty that no one knows why.”

          No he didn’t. (Your citation?)

          He wrote about how the current observation system was missing regions, and thus without full data the heat budget couldn’t be closed.

  40. Mike Flynn says:

    DA,

    What do you think about Gavin Schmidt declaring “Hottest year EVAH”? (With a probability of 0.38 – and he should know – he’s a mathematician!)

    Or James Hansen’s claims of storms lifting mighty boulders from the sea bed, and raining them down on our poor unbelieving heads?

    Oh, the terror!

    Cheers.

    • David Appell says:

      For 2016, Gavin said 62%:

      https://www.giss.nasa.gov/research/news/20170118/NOAA-NASA_Global_Analysis-2016-FINAL.pdf

      You’ll have to cite Hansen saying that before I can look into it.

      • Gordon Robertson says:

        DA…”For 2016, Gavin said 62%…”

        Why is he not using a confidence level of 90%? What’s with NOAA using 48% for 2014 and Schmidt using 62% for 2016.

      • Gordon Robertson says:

        DA…”For 2016, Gavin said 62%:…”

        It’s apparent that both NOAA and NASA GISS are lowering the confidence level till they get their year rated as the warmest.

        They have 2015 rated with a 36% confidence level. Flipping a coin would give a far better probability as to whether it was the warmest year.

        Also, look at the right side of one of the graphs. Does it not claim that 2016 was the hottest year in North America only. It ranks it from 2nd to 5th in other parts of the planet.

        If 2016 is tied with 1998, as UAH claims, then 1934 is still the warmest year in the US. GISS tried to change that a few years ago and Steve McIntyre of climateaudit forced them to re-instate 1934.

    • Gordon Robertson says:

      Mike Flynn…”What do you think about Gavin Schmidt…”

      Could not tell you what I really think of him in words allowed on this blog.

    • David Appell says:

      MF: Citation to what you wrote that Hansen said?

      Or do you not have one?

  41. ren says:

    Strong rain will start tomorrow in California.
    http://virga.sfsu.edu/gif/17031706_jetstream_h108.gif

  42. ren says:

    In California mountains the snow will fall.
    After a few days to the eastern Canadian arctic frost returns.

  43. ren says:

    Soon directly in front the Earth will be a large coronal hole. It will emit a very fast solar wind. The jet stream could also accelerate.
    http://www.solen.info/solar/images/AR_CH_20170316_hres.png

  44. Gordon Robertson says:

    Tried to post this as a new post and it got relocated.

    KneelPerths hottest ever March day was 42.4C

    Heck, it gets hotter here in Canada in a desert climate 150 miles NE of Vancouver. The record in that area is 44.4C.

    When we talk about climate change we MUST indicate the location of the change and why its changing. It is arrogant and unscientific to use the generic term climate change. It means nothing just as giving the planet an average temperature means nothing.

    The desert climate I mentioned here in Canada is 150 miles from a rain forest climate around Vancouver that is on average more than 20 C cooler. That climate has not changed, it is still sand, sage brush, rattlesnakes, and small cactii, with smatterings of other vegetation.

    Its the same Sun shining at close enough to the same latitude that it should not matter. The effect of the Sun is 20C+ hotter over a 150 mile distance. Alarmist would attribute that change to anthropogenic CO2 while completely ignoring the real factors that cause such a change in climate.

    Just noticed when verifying the record that Environment Canada and other alarmists are now listing temperatures from 1981 onward. In their alarmists zeal they seem intent on erasing long standing records dating back to the 1930s to align themselves with the chicanery of NOAA and NASA GISS.

    I think it takes an unmitigated gall for modern climatologists to go back in the temperature record and change a recorded temperature because it does not fit in their alarmist minds.

    • Gordon Robertson says:

      I should clarify that the warmer climate in the desert region applies to the summer months only. In winter, the region is covered in snow and much cooler than Vancouver.

    • Dr No says:

      Gordon, it is obvious you never studied climate, climate science, maths, statistics or logic.
      Let me help you by suggesting some useful recent articles:

      “Shifting with climate? Evidence for recent changes in tree species distribution at high latitudes”
      http://onlinelibrary.wiley.com/doi/10.1890/ES14-00111.1/full

      “How Will Shifting Climate Change U.S. Forests?”
      http://blogs.ei.columbia.edu/2016/03/15/how-will-shifting-climate-change-u-s-forests/

      • Gordon Robertson says:

        dr no…”Gordon, it is obvious you never studied climate, climate science, maths, statistics or logic”.

        Before we address your illogical pseudo-science perhaps you could explain climate change with no global warming. Before you protest, it was your demigod, the IPCC, who officially revealed the bad news for you alarmists.

        What was it they called it, a warming hiatus? Other alarmists call it a pause. Has it occurred to anyone the warming is stopped for good?

        • Dr No says:

          Gordon, have you read those articles?
          No – I thought not.
          You really are a recalcitrant student.

          Here is another useful article I just saw today :
          “Second hottest February on record – is another El Nio on the way already?”
          http://blog.hotwhopper.com/2017/03/second-hottest-february-on-record-is.html

          I cannot see any hiatus in the graph.
          Maybe you can point it out to us all.
          Or maybe you could point out the flaws in the findings – I am all ears.
          And remember, try and restrain yourself from attacking the messenger.

          • Gordon Robertson says:

            dr no…”I cannot see any hiatus in the graph”.

            Doc…you have to stop looking at amateur graphs created by mathematicians and astronomers.

            There’s a really good one right here on Roy’s site. Click on it and it shows good detail.

            http://www.drroyspencer.com/wp-content/uploads/UAH_LT_1979_thru_February_2017_v6.jpg

            Now, follow the red curve, the running average. The spike at 1997/8 is your start point. Draw an imaginary horizontal line from that spike at 0.15C through present. Now eyeball the red curve above and below that line. Astute observation will reveal a very rough flat trend.

            The exception is 2016 and into 2017 where we are waiting to see what develops with the post 2016 El Nino. It’s taking its time falling but if it reaches the baseline soon the EN will be cancelled.

            There’s always a chance it won’t come down but I don’t regard that as being due to CO2 warming. It’s something natural.

          • David Appell says:

            GR draws lines by eye. Serious people calculate.

          • David Appell says:

            GR says:
            “The spike at 1997/8 is your start point.”

            What a blatant, dishonest cherry pick.

            Even with that ugly nonsense, UAH LT v6.0 linear trend since peak at 2/1988 = +0.06 C/decade.

          • David Appell says:

            Gordon Robertson says:
            “The exception is 2016 and into 2017 where we are waiting to see what develops with the post 2016 El Nino.”

            We are seeing that now.

            Feb UAH LT v6.0 = 4th warmest Feb in their records.

            GISS GMST = 2nd warmest Feb in their records. Same for NOAA.

          • Gordon Robertson says:

            DA…”We are seeing that now”.

            What we are seeing is the last stages of an El Nino that has not quite fizzled out. I understand another one may be on the way so we may have to wait another year to see the extent of post-EN cooling.

            If you think CO2 can increase the global average that much in a few months you are in serious denial.

            I just hope this is not a last hurrah before another mini ice-age sets in, like the LIA.

          • Gordon Robertson says:

            DA…”What a blatant, dishonest cherry pick”.

            I was referring to the IPCC claim of a warming hiatus from 1998 – 2012. Where else would you begin given that a rebound warming post-98 set the flat line trend around 0.15C?

            Pre ’97, on the UAH graph, the anomalies seldom cleared the base line. As UAH has pointed out, true warming was not indicated till the late ’97 EN struck.

            I was trying to point out the flat trend visually using basic calculus on the red running average. It’s blatantly obvious to the eyes of someone used to visually summing the areas beneath the curve.

          • Gordon Robertson says:

            DA…”GR draws lines by eye. Serious people calculate”.

            In engineering we learned to do a quick visual on a problem by eyeballing the graph. Gets interesting in saddle regions on a 3-D graph.

            On exams, we could gain a quick 25 points if we noticed a washer region centred on (0,0) or even (0,0,0). With moments of inertia, a washer region cancels and they would accept a cancellation by inspection if you had the awareness to notice it.

            Otherwise you’d have to do some hairy 3-D calculus to calculate the moments of inertia around the origin, using up valuable time on an exam. We had to do that on many an occasion but they also taught us to use inspection.

            So, we were taught to read graphs visually. If you took the time to do that on the UAH graph before number-crunching, you might notice things you’d miss while hitting your calculator buttons. The first thing you should notice is that a straight line trend from 1979 to 2017 means absolutely nothing.

            You should know from university exams that the first thing you MUST do is READ and UNDERSTAND the question. There is no point rushing ahead to find solutions if you have missed something crucial in the question. Obviously, you alarmists have not taken the time to understand the contexts that apply to the temperature data.

          • Gordon Robertson says:

            “In engineering we learned to do a quick visual on a problem by eyeballing the graph”.

            I might add that we had to construct the graphs before applying the visual. In engineering drawing, we had to construct complex structures by drawing them freehand on paper then measure a distance on a curved surface. Freehand drawings, often in 3-D, became the basis for solving many engineering problems.

            Sometimes you have to unfold a complex diagram to find the true length of a line drawn on a curved surface. I don’t know if you ever experienced the cream containers for coffee that were shaped like triangles in 3-D. We were given that container on an exam and asked to calculate the length of a line drawn on it.

            Here’s one here:

            https://www.dynamicelements.co.za/milk-and-creamers/175-parmalat-milk-portions-50.html

            The object is created from a flat, rectangular piece of paper with a hole punched in it’s centre. If you roll and glue the paper into a cylinder, pinch one end and glue it, then rotate it 90 degrees and pinch that end and glue it, you get the shape required.

            We had to visually unfold the finished product, lay it out and calculate the length of the line drawn on it, all in the space of half an hour on an exam. If you had an insight to the construction of the container you were off and running. Unfortunately, under the pressure of the exam environment, many of the guys did not see it right away and some not at all.

            It’s hard to visualize a cylinder rolled from a flat piece of paper till someone points it out. That’s why they trained us so extensively in visualization and why I don’t have a lot of trouble looking at a graph and eyeballing it.

            I don’t pretend that eyeballing is all that accurate but it’s often close enough to arrive at a fairly accurate conclusion. Afterwards, you might use statistical techniques to verify but you never use statistical techniques without the visualization first, and a thorough understanding of the various contexts from which the data was acquired.

          • David Appell says:

            Gordon Robertson says:
            “What we are seeing is the last stages of an El Nino that has not quite fizzled out.”

            Wrong!

            The NINO3.4 index went negative in June 2016, and has stayed there since, except to a positive value in late February 2017.

            The El Nino ended 9 month ago. But another El Nino this year may happen again (the Australian BOM puts that odds at 50-50).

            Source:
            http://www.cpc.ncep.noaa.gov/data/indices/wksst8110.for

          • David Appell says:

            Gordon Robertson says:
            “I was referring to the IPCC claim of a warming hiatus from 1998 2012.”

            The IPCC doesn’t cherry pick.

            You did.

            And you still refuse to acknowledge that better data has come in since the 5AR.

          • David Appell says:

            Gordon Robertson says:
            “If you think CO2 can increase the global average that much in a few months you are in serious denial.”

            That’s not what anyone thinks, Gordo.

            But they do know that the ocean is storing enormous amounts of heat from CO2’s additional greenhouse effect, and that some of that heat comes out of the ocean during El Ninos.

          • David Appell says:

            Gordon Robertson says:
            “So, we were taught to read graphs visually.”

            This is precisely why those in the hard sciences find engineers to be so laughably lame.

        • Dr No says:

          And another one which just appeared for you and Norman:

          “Peanut growers face ‘horrendous season’ following Queensland’s hottest summer on record
          “It’s been the hottest, driest February on record.”
          http://www.abc.net.au/news/2017-03-18/peanut-growers-face-horrendous-season-queensland-hottest-summer/8366236

          I have resisted the temptation to make comparisons to peanuts

          • Harry Cummings says:

            Perhaps they should consider giving the land back to the aboriginal people they took it from and see what they can do with it

          • ren says:

            “Growers now face the gamble of harvesting the few peanuts they have, or wait for the new flowering plants to develop, and risk losing it all to frost.”???

          • Norman says:

            Dr. No

            Maybe similar to this one.
            http://www.cbsnews.com/news/2011-was-texas-driest-year-on-record/

            Just weather doing what weather does. You seem an intelligent human that cares. Would you take the time to read a little about meteorology and see what is behind actual weather events?

            Droughts and heat waves have a known meteorological pattern that did not come about just the last few years because of a little global warming. That is why I gave you a graph of Australia since cold and hot times for 100 years. I am not sure you took the time to investigate.

            High pressure aloft that persists is the major link to heat waves around the world. The high pressure acts like a cap on rising air so it restricts convective cooling raising the surface temperature.

            With a cap on convection you also do not form clouds as you would under other conditions. This allows in much more solar radiant energy than other conditions. Now with no clouds forming cutting off the solar input, the ground water evaporates with no rain to replenish it and you then start losing your evaporative cooling which makes it get even hotter and drier. When the high pressure system moves or breaks apart rain and cooler weather return and the drought and heat wave end. It is a known process and has been going on quite some time (read the Bible about the severe famines the people of those times faced).

            Look at Texas today, no severe drought.
            http://droughtmonitor.unl.edu/

          • David Appell says:

            But there is moderate drought, and much abnormally dry area.

            I’m sure your comment is reassuring to those in Texas having to deal with it

          • David Appell says:

            Harry Cummings says:
            “Perhaps they should consider giving the land back to the aboriginal people they took it from and see what they can do with it”

            You’re very reply demonstrates your bias — the western view of “what can be done with it” was not that of Australia’s aboriginals, or of native Americans. They had other values, especially simplicity and sustainability. It is far, far from obvious that western values are somehow better than theirs.

          • David Appell says:

            Norman says:
            “Droughts and heat waves have a known meteorological pattern that did not come about just the last few years because of a little global warming.”

            1. That’s not the question. The question is about incidences.

            2. Global warming always makes droughts worse, because it means the atmosphere can hold more moisture (Clausius-Claperyon equation) and because evaporation rates increase (exponentially with temperature.)

          • Norman says:

            David Appell

            The only problem is that the available evidence does not support your speculations:

            YOU: “1. Thats not the question. The question is about incidences.

            2. Global warming always makes droughts worse, because it means the atmosphere can hold more moisture (Clausius-Claperyon equation) and because evaporation rates increase (exponentially with temperature.)

            The actual science and not an opinion.
            http://www.nature.com/nature/journal/v491/n7424/full/nature11575.html

            Maybe you should reconsider your position.

          • David Appell says:

            The water vapor feedback is certainly real. Here’s the evidence for an increase in atmospheric water vapor:

            IPCC 5AR WG1 Ch2 Figs 2.30 & 2.31 documents positive trends in water vapor in multiple datasets.
            http://www.ipcc.ch/pdf/assessment-report/ar5/wg1/WG1AR5_Chapter02_FINAL.pdf

            “Attribution of observed surface humidity changes to human influence,”
            Katharine M. Willett et al, Nature Vol 449| 11 October 2007| doi:10.1038/nature06207.

            “Identification of human-induced changes in atmospheric moisture content,” B. D. Santer et al, PNAS 2013.

            “How much more rain will global warming bring?” F.J. Wentz, Science (2007), 317, 233235.

            “Analysis of global water vapour trends from satellite measurements in the visible spectral range,” S. Mieruch et al, Atmos Chem Phys (2008), 8, 491504.

          • David Appell says:

            Sorry, this sad excuse for a blog won’t let me provide links to citations.

        • David Appell says:

          Gordon Robertson says:
          “Before you protest, it was your demigod, the IPCC, who officially revealed the bad news for you alarmists. What was it they called it, a warming hiatus?”

          Gordon can’t understand. Or is lying.

          Better data has come in since the 5AR. Gordon is stuck in the past, with his fingers in his ears.

          • Gordon Robertson says:

            DA…”What was it they called it, a warming hiatus?
            Gordon cant understand. Or is lying”.

            I am tired of reposting the link to the IPCC statement declaring a ‘warming hiatus’ only to have your denial fail to absorb it.

            What the heck, just so others can see Appell is a an alarmist and a denier.

            page 6

            http://www.climatechange2013.org/images/uploads/WGIAR5_WGI-12Doc2b_FinalDraft_Chapter02.pdf

            “Despite the robust multi-decadal timescale warming, there exists substantial multi-annual variability in the rate of warming with several periods exhibiting almost no linear trend including the warming hiatus since 1998. The rate of warming over 19982012 (0.05C [0.05 to +0.15] per decade)…”

            What is it I don’t understand, DA, or what am I lying about?

            Note the error margin. It could have been a cooling trend, knowing the IPCC tendency to err in favour of warming.

          • David Appell says:

            Gordon Robertson says:
            “I am tired of reposting the link to the IPCC statement declaring a warming hiatus only to have your denial fail to absorb it.”

            I am tired of your inability to understand that better data has come in since the 5AR.

            You cling to the 5AR because you know that, but are afraid to admit it.

          • Gordon Robertson says:

            DA…”I am tired of your inability to understand that better data has come in since the 5AR”.

            Better data?? You mean data that cannot reach a 90% confidence level and has to be passed off with CLs as low as 35%? What scientist with any degree of integrity would allow any confidence in a CL lower than 90%?

            Get serious. The UAH data comes from NOAA satellites and UAH have been awarded medals for excellence from NASA and the American Meteorological Society for their data sets. UAH does not show a trend from 98 either with the exception of the EN warming from 2016 onward. The only trend that can be seen is from idiots and amateurs plugging data into the engine on woodfortrees.

            Your reference to better data is a reference to data manipulated through scientific misconduct. Of course, alarmists don’t care about cheating in their zeal to carry on a lie that has long since been revealed and disproved.

          • barry says:

            Note the error margin.

            Indeed.

            0.05C [-0.05 to +0.15] per decade

            The mean trend is slight warming, but within the margin of error it could have been cooling or warming. It is more probable that the trend was warming, but to 95% confidence no specific trend can be determined.

            Gordon cites this because it includes the word ‘hiatus’. From this one word all his understanding flows like a muddy river.

            Couple of things to point out.

            This is not the final draft of the report, and it comes with numerous caveats to that regard at the top of the document. This is like citing a paper that did not pass peer-review and ignoring the revised version that did. The final Ch2 does not include the word hiatus.

            Strangely, even though Gordon has seen the final revision of the Technical Assessment which includes the word ‘hiatus’, he still cites the working draft of Ch2. Is it laziness or stubbornness?

            Whatever the reason, he has shown no capacity for understanding the issue in any finer detail than that the word hiatus appears. He doesn’t understand the error bars it seems. Seems to imagine you can ‘fudge’ something like that.

        • David Appell says:

          Gordon Robertson says:
          “I dont pretend that eyeballing is all that accurate but its often close enough to arrive at a fairly accurate conclusion.”

          Baloney. You don’t know what “accurate” is until you calculate the best fit straight line.

          In your particular case, you’re wrong about UAH. All because you can’t do linear regression.

          • Gordon Robertson says:

            DA…”Baloney. You dont know what accurate is until you calculate the best fit straight line”.

            Your reliance on best fit straight lines proves you know nothing about basic physics, climate science or statistics. You are an amateur professing to have a degree. I am aware that any idiot can acquire a degree by simply putting in the time but your understanding of the real world belies even that.

            You’re an alarmist, a believer, an authority-figure junkie, and an all-around buffoon. You lack the objectivity and degree of skepticism required to be e student of science.

        • David Appell says:

          Gordon Robertson says:
          “Before we address your illogical pseudo-science perhaps you could explain climate change with no global warming.”

          Wrong.

          You pathetically refuse to calculate trends for yourself, and cling to an 5AR number that was wrong.

          Funny how you like what you think is the scientific consensus when it supports your claims, but dismiss all of that when it suits you.

          You’re so easy to see through, Gordon.

          • Gordon Robertson says:

            DA…”You pathetically refuse to calculate trends for yourself, and cling to an 5AR number that was wrong”.

            The pathetic thing here is your sole reliance on number crunching. You blindly plug data into a calculator without any understand of the context in which the data was acquired.

            The AR5 number came from Had-crut, the official database of the IPCC.

            Your emotional outbursts flag you as a myopic alarmist who has the religion bad.

    • David Appell says:

      Gordon Robertson says:
      “I think it takes an unmitigated gall for modern climatologists to go back in the temperature record and change a recorded temperature because it does not fit in their alarmist minds.”

      Adjustments REDUCE the long-term warming trend.

      You don’t understand why or how to correct for biases. You don’t understand that UAH and RSS also do adjustments.

      Have you ever studied the subject? I doubt it.

      Read:

      “Thorough, not thoroughly fabricated: The truth about global temperature data: How thermometer and satellite data is adjusted and why it *must* be done,” Scott K Johnson, Ars Technica 1/21/16.

      http://arstechnica.com/science/2016/01/thorough-not-thoroughly-fabricated-the-truth-about-global-temperature-data/

      • Gordon Robertson says:

        da…from your link…”Find me a scientist whos involved in making measurements who says the original measurements are perfect, as are. It doesnt exist, he told Ars. Its beyond a doubt that we have tohave todo some analysis. We cant just take the data as a given.”

        Here lies the problem. How are statisticians in the future able to ascertain what is good data and what is bad data? And how do you prevent a bias with corrections if the statisticians are admittedly in agreement that CO2 is warming the planet?

        In the article, the author did not prove his point that adjustments are necessary. In fact, he kept referring only to cooling biases, not warming biases. The author is an alarmist as well and his article reflects that. He is not looking at the science and the competence of the original data gatherers, he has a pre-conceived notion that there is a cooling bias in the historical record..

        Why would NOAA set out to find warming post-1998 only after the IPCC declared a warming hiatus from 1998 – 2012? And why would they use confidence levels to declare the warmest year, selecting a 48% confidence level for 2014 over the traditional 90% level.

        Prior to their chicanery, NOAA’s datasets showed the same hiatus as Had-crut, NASA, UAH and RSS. That’s why the IPCC reached the hiatus conclusion. The IPCC normally uses Had-crut as it’s database but seeing the other database creators showing a hiatus, they were no doubt encouraged to declare a hiatus.

        After NOAA’s scientific misconduct, both NOAA and GISS showed warming post-1998, since GISS gets their data from NOAA. GISS is run by one of the leading climate alarmists on the planet, Gavin Schmidt.

        • David Appell says:

          Gordon Robertson says:
          “Here lies the problem. How are statisticians in the future able to ascertain what is good data and what is bad data?”

          How are scientists today ascertain it?

          Why don’t you go learn? This work started in the 1980s and is mature by now.

          Remember why Richard Mueller founded the BEST project?
          What did BEST find?

          • Gordon Robertson says:

            DA…”What did BEST find?”

            According to co-author Judith Curry, they found nothing of consequence since Mueller altered the data after the fact.

        • barry says:

          How are statisticians in the future able to ascertain what is good data and what is bad data?

          The raw data are archived. Statisticians in the future may test its veracity in any way they like.

          • Gordon Robertson says:

            barry…”The raw data are archived. Statisticians in the future may test its veracity in any way they like”.

            Unless you work at NOAA where leaders like Karl can bypass the archives any time he likes.

          • Gordon Robertson says:

            barry…”The raw data are archived. Statisticians in the future may test its veracity in any way they like”.

            Who is better to judge the veracity: the person collecting the data when it is archived or people analyzing it statistically at a later date?

            In 1977, there was a global leap in the average of 0.2C. Some scientists wanted to go back and erase that increase as an outlier anomaly but it has been linked to the PDO which was unknown at the time.

            I think it should be against the law for any data keeper to arbitrarily change the record and erase the old record.

          • barry says:

            No one has erased the old record. Anyone, including the compilers and you and I, can access the old data. It is often done to show the difference between that and later revisions. For the long-term record it is apparent that the long-term trend is higher with the old data.

            Here’s another effort by skeptics to take the raw data and work it differently to the main institutes.

            https://noconsensus.wordpress.com/2010/03/24/thermal-hammer/

            First the obvious, a skeptic, denialist, anti-science blog published a greater trend than Phil Climategate Jones. What IS up with that…?

            Several skeptics will dislike this post. They are wrong, in my humble opinion. While winning the public “policy” battle outright, places pressure for a simple unified message, the data is the data and the math is the math. We’re stuck with it, and this result. In my opinion, it is a better method.

            Several groups of skeptics have done the actual work only to discover that their results are the same as the institutes or result in a higher trend. Only those skeptics who have never done the work maintain that the raw data shows a cooler long-term trend than the adjusted.’

            And they drone on about it interminably.

    • David Appell says:

      Gordon Robertson says:
      “KneelPerths hottest ever March day was 42.4C
      Heck, it gets hotter here in Canada in a desert climate 150 miles NE of Vancouver. The record in that area is 44.4C.”

      What’s the March record? Or September’s? That’s what’s relevant.

      • Gordon Robertson says:

        DA…”Whats the March record? Or Septembers? Thats whats relevant”.

        They are both summer records, that’s what’s relevant.

        Our records would likely have been set in July or August and the equivalent in Australia would be February and March.

        Furthermore, the northern end of Australia is in a tropical region and is affected by tropical conditions. Perth is halfway up Australia on the west coast.

        Lytton BC is an anomaly. It is located on the Fraser River where the Thompson River joins the Fraser. The Thompson Valley from the Fraser east, north, then east to Kamloops and beyond is desert country. Yet north and south of Lytton on the Fraser is not. North of Lytton it is drier and south it gets progressively wetter.

        So, Lytton is well inland whereas Perth is on the ocean.

        The 44.4C record for Lytton was for the entire month of July and the record for September was 38.7C. We often have ‘Indian summers’ in BC where the hot summer months continue well into September. In the Lytton area and east to Kamloops that can come to an abrupt end in mid- to late September as winter temperatures descend.

        To have a record of 38.7C for September, given how cold it is in late September (sometimes below 0C) around Lytton, is to say something. The record for May in Lytton is 40.4C.

        You should get over her sometime and check it out. It’s safe traveling from Vancouver up through that area as it is in most of Canada. The roads are excellent.

        • David Appell says:

          Gordon Robertson says:
          “DAWhats the March record? Or Septembers? Thats whats relevant.
          They are both summer records, thats whats relevant.”

          False. One was for SH March. Your’s was for any month.

          No comparison is possible.

          • Gordon Robertson says:

            DA…”False. One was for SH March. Yours was for any month.
            No comparison is possible”.

            Are you really as obtuse as this comment suggests? I laid it out very clearly, referring to the specific month and comparing the specific months that corresponded to the NH and SH respectively.

        • David Appell says:

          Stop lying, Gordon — 1934 is only the 6th warmest year in USA48.

  45. ren says:

    March 22 strong precipitation in the southwest US. Will Valley of Death blossom?
    https://earth.nullschool.net/#2017/03/22/1200Z/wind/isobaric/250hPa/orthographic=-119.91,36.19,653

  46. Dr No says:

    Norman,
    “Just weather doing what weather does.”

    No.
    If that was the case there would be approximately equal numbers of new warm records versus cool records. It has been observed that this is not the case, all around the globe.

    It is more correct to say
    “”Just weather doing what weather does under the influence of global warming”

    • ren says:

      Australias Variable Rainfall
      April to March Annual Australian Rainfall Relative to Historical Records 18902016.
      https://www.longpaddock.qld.gov.au/products/pdf/australiasvariablerainfall.pdf

    • Norman says:

      Dr. No

      One problem is there is no realistic way for me to determine if the studies are valid.

      Here is one that studied the year 2014 and found cold records exceeded hot records globally and in the US.

      http://www.accuweather.com/en/weather-blogs/weathermatrix/are-global-cold-records-overtaking-warm/24662335

      Or you have this one:
      http://www.climatecentral.org/gallery/graphics/record-highs-vs-record-lows

      I can try to check on my own with this one:
      http://www.intellicast.com/Local/History.aspx?month=9

      But that is a daunting task as you have a record for each day for a US city and I have a hard time finding data like this globally.

      I have to just keep watching on this. I think you would have to download a global data set of temperatures and run it all through computer programs to get an answer but then it would depend on your program and if it had flaws.

      Manually looking at all records can give one perspective.

      I can quickly look at the hottest day of all for a given month and coldest for a given city and that would not be as time consuming. I can get some idea of the number of extreme hot or cold temperatures (all-time monthly record rather than the daily record which can be considerably higher than a daily record).

      • Dr No says:

        “One problem is there is no realistic way for me to determine if the studies are valid.”

        This is pure denialist claptrap. It enables amateurs, such as yourself, to dispute any study that does not conform to your world view but cherry pick studies that appear to support it.
        If you do not do a study yourself or do not bother to read and accept the analyses of experts you are doomed to irrelevance.
        Let me try one more time to help you:
        Simply google “record-highs-vs-record-lows”
        There are excellent graphs on climatecental.org which, even you, can understand.

        • Norman says:

          Dr. No

          I do not think you understood what I was trying to state in my post.

          There are two studies that state complete opposite conclusions.

          In the world of Climate Science it is now a political arena and not strictly a science based topic. Because of the nature of political thought and the tribal mentality I will not blindly trust an authority on the topic (nor should one ever, I can respect an authority but if I am just a follower than I am no longer scientific but religious, following a leader blindly).

          I do not have a “world-view” on climate science. I see two camps of opposing views both of which I think do not reflect the search for truth and both of them biased.

          • Dr No says:

            Sorry, not good enough.
            Saying
            “There are two studies that state complete opposite conclusions”
            is completely wrong.
            (1) The conclusions are yours entirely – and they are faulty
            (2) The wealth of studies demonstrate warm records in excess of cool records.
            (3) If you bothered to look, you will see that, in a single year, cool records can exceed warm records but that on decadal time scales the opposite occurs – and big time.
            (4) Finding a single study that erroneously disputes the conclusions of the majority does not represent ” two camps of opposing views”. Only in your mind.
            (5) Typically, your view of the world embraces the view that professionally trained experts, who work very hard to understand the world, who are not motivated by anything other than curiosity and the chance to make a discovery, are not to be trusted. That is sad. If you can’t trust the scientists. who can you trust?
            politicians? -no
            bankers? – no
            big business?- no
            priests? – no
            newspapers/TV? – no

            Tell me – who do you place your trust in?

          • Norman says:

            Dr. No

            The same ailments that affect humans also affect scientists. Scientists are human with the same flaws. Desire to be right, ego, suppressing things that go against what you believe true.

            Because of the way people are wired you should trust no one for truth and you should never assume those doing the studies are doing it purely for some altruistic motive.

            In a perfect world:

            Your list:
            politicians? -Are motivated to make a better world
            bankers? Motivated to lend money fairly to help stimulate economic growhth and development
            big business?- Motivated to produce goods and services people need at a reasonable cost to the consumer and to reward hard working employees with good wages and benefits to keep them producing.
            priests? Motivated to tell the truth and bring people closer to God with truth and understanding.
            newspapers/TV? To try and paint the most accurate, realistic and true picture of the events they cover.

            All things could be wonderful but humans have flaws and egos. Why would science be free of this?

            The best thing to do is try to do your own research. What data are the researchers using? Are they cherry picking to create an illusion? How do you know what they are doing, you see a finished report and believe it because it agrees with your world view and you attack any who would challenge this view. I am not saying your world view is wrong and that scientists are fudging things, but the possibility of such does exist and it would be wise to at least “trust but verify”….try doing a little of your own work to see if they are valid or maybe some spot checking.

          • David Appell says:

            Norman says:
            “Because of the way people are wired you should trust no one for truth….”

            Applies to you as well.

            Wolf!

          • Dr No says:

            “All things could be wonderful but humans have flaws and egos. Why would science be free of this?”
            (a) because there is no money to be made going after the truth
            (b) because scientists are all individuals eager to detect any flaws in their colleagues’ work
            ( c ) because they have spent there whole lives learning and practising their skills and earning their reputations. In general, they would never sully such hard-earnt reputations by engaging in behaviours attributed to them by non-scientists and scoundrels.

            Think on this – how many scientists can you think of who have been convicted of fraud, mal-practice or deception. Far fewer than engineers.

          • Norman says:

            Dr. No

            Do you ever look into things before you have the compulsion to comment?

            Here read this article and look at a sampling of some of the scientific fraud cases.

            Science is not this perfect system you falsely believe it is. Have you ever heard of “Publish or Perish”, their is pressure on scientists to come up with material. Also their is intense competition for grant money, there are forces that can easily corrupt the scientific world not to mention wanting to be someone.

            https://en.wikipedia.org/wiki/Scientific_misconduct

            I do not think you have a very realistic world-view. Time to lift your head out of the sand and look around and research the subject of scientific fraud.

          • Gordon Robertson says:

            dr no…”Think on this how many scientists can you think of who have been convicted of fraud, mal-practice or deception. Far fewer than engineers”.

            For one, engineers are scientists. They are scientists who apply science. For another, I know of not a single engineer who has been convicted of malpractice, deception, or fraud.

            A few doctors have been, and ironically they use the same abbreviation as you…dr.

  47. ren says:

    Very strong galactic cosmic rays.
    https://cosmicrays.oulu.fi/webform/monitor.gif

    Sources of galactic cosmic radiation originate from the deep space. Galactic cosmic radiation consists of high-energy electromagnetic component (gamma radiation) and nucleonic component. Radiation enters our atmosphere and interacts with the air molecules, producing cascades of secondary galactic cosmic radiation (Figure 1). They attenuate when travelling through the atmosphere where their energies are absorbed by the surrounding air molecules. The primary and secondary galactic cosmic radiations share the largest portion of the radiation dose we receive during air travel at high altitude.
    http://www.weather.gov.hk/m/article_e.htm?title=ele_00295

    • David Appell says:

      What does this have to do with the topic of this post?

      Or are you just desperate for attention?

      • Harry Cummings says:

        David this is not your blog, if you want to say what and what should be posted go back to you own (failed) site.

        • David Appell says:

          I’m free to comment here, just as you are, and free to point out that “ren” (fake name) is attempting to usurp the conversations here with irrelevant comments. They get in the way and add nothing to the discussion.

          • Gordon Robertson says:

            DA…irrelevant to whom? Roy’s a meteorologist and ren’s posts are interesting items in meteorology and climate science.

      • Gordon Robertson says:

        DA…”What does this have to do with the topic of this post?”

        I find ren’s posts to be interesting and informative. I presume Roy would have blocked him long ago if he did not thinks so too.

        Based on such a criterion, Roy would have blocked both you and me long ago. I appreciate his patience.

  48. Dr No says:

    Call me “alarmist”, but it seems to me that the setting of new warm records around the globe, almost every month that goes by, is now the “norm”.
    In one sense that is scary as it means we may all becoming complacent – much like the proverbial frogs in a beaker of heated water.
    It may take (as always seems to be the case) a gigantic catastrophic event to focus our politicians. The chances such a catastrophe increase every day that goes by. It is merely a question of how soon.

    • Gordon Robertson says:

      dr no…”Call me alarmist, but it seems to me that the setting of new warm records around the globe, almost every month that goes by, is now the norm”.

      You’re an alarmist.

      The UAH yearly global averages since 1979 are not showing your concern. If such records were the ‘norm’ the global average would be increasing. There has to be enough cold ‘norms’ to offset them but you alarmists tend to ignore those.

      I mentioned that here in Vancouver, BC, we just experienced the coldest December on record. It extended till mid-January 2017. While we were experiencing that, record cold spells were recorded across North America, Europe, and Siberia.

      When I point out that the warmest year in the US was 1934 I am reminded that the US is a small part of the planet. Please try to remember that Australia is a small part of the planet as well.

      • Dr No says:

        You have to be an idiot to conflate surface temperature records with monthly averaged, global, upper atmosphere temperatures!

        It is pathetic that the UAH data – despite showing a long-term warming trend – is the last refuge of desperate scoundrels.

        • Gordon Robertson says:

          It is pathetic that the UAH data despite showing a long-term warming trend is the last refuge of desperate scoundrels.

          What’s pathetic is alarmists like you being unable to read a graph and correctly interpret data even though it is laid out for you in words in the UAH 33 year report.

      • David Appell says:

        Stop lying, 1934 is only the 6th warmest USA48-year.

    • David Appell says:

      Irrelevant to the topic of this post.

      Don’t be an ass.

      • ren says:

        Current temperature in northern North America.
        http://files.tinypic.pl/i/00882/g7cxyo8o9v7q.png

      • Gordon Robertson says:

        DA…”Irrelevant to the topic of this post. Dont be an ass”.

        So are you. Go back to your hole, troll.

        • Dr No says:

          Gordon, why don’t you regale us again with how you became an engineer by playing with bits of paper and glue.
          That bit of ancient history was really relevant.
          Especially as, back then, only “guys” sat the exams.
          I bet you still marvel at the use of a slide rule.

          • Gordon Robertson says:

            dr no…”Gordon, why dont you regale us again with how you became an engineer by playing with bits of paper and glue”.

            It would do no good, your reading comprehension is so poor you can’t take in most of what I say. I said nothing about gluing paper anywhere and by focusing on that you missed a rare insight into engineering processes.

            ‘Back then’, there were several females in our engineering classes and we used calculators. I have also used slide rules and look-up tables for logs, sines, cosines, etc. It’s always handy to have such skills.

            It’s even better when you can do series expansion and make your own tables. Of course, you’ll have no idea what I’m talking about as you focus on sticking paper together with glue.

        • David Appell says:

          Stop lying, Gordon — 1934 is only the 6th warmest year in USA48.

          • Gordon Robertson says:

            DA…”Stop lying, Gordon 1934 is only the 6th warmest year in USA48″.

            Only in NOAA mythology after they retroactively recreated the historical record using smoke and mirrors. In the real world, using data from real thermometers, 1934 is still the warmest year in the lower 48.

            When you placed 1934 in 6th place, did you observe the confidence levels? We know 1934 had a confidence level of 95% or more and I’ll bet all those years from 1 to 5 had confidence levels ranging from 35% – 65%.

            Does it not worry you when NOAA and NASA GISS lie to you like that? Of course not, all you need is the comfort of an authority figure.

  49. ren says:

    On the Present Halting of Global Warming
    Syun-Ichi Akasofu
    International Arctic Research Center, University of Alaska Fairbanks, USA; Tel.: 1-907-474-6012; Fax: 1-907-474-5662
    Received: 28 January 2013; in revised form: 15 April 2013 / Accepted: 15 April 2013 / Published: 3 May 2013
    Abstract: The rise in global average temperature over the last century has halted since roughly the year 2000, despite the fact that the release of CO2 into the atmosphere is still increasing. It is suggested here that this interruption has been caused by the suspension of the near linear (+ 0.5 C/100 years or 0.05 C/10 years) temperature increase over the last two centuries, due to recovery from the Little Ice Age, by a superposed multi-decadal oscillation of a 0.2 C amplitude and a 50~60 year period, which reached its positive peak in about the year 2000a halting similar to those that occurred around 1880 and 1940. Because both the near linear change and the multi-decadal oscillation are likely to be natural changes (the recovery from the Little Ice Age (LIA) and an oscillation related to the Pacific Decadal Oscillation (PDO), respectively), they must be carefully subtracted from temperature data before estimating the effects of CO2.
    http://www.mdpi.com/2225-1154/1/1/4/htm

    • ren says:

      As the increase in temperature since 1800~1850 is nearly linear, the trend is quite different from the increase in CO2, which has shown a near quadratic increase over the same periodrapidly increasing after 1946, after a gradual increase that began around 1900. It is at least problematic, therefore, to consider this near linear increase in temperature during the 19th and 20th centuries as mainly due to CO2.
      It may also be noted that the solar modulation function derived from C14 and Be10 [11]; Muscheler et al. [12] displays a trend inversely proportional to the temperature trend shown in Figure 2, Figure 3, and it may be speculated that the LIA and its recovery is perhaps related to changes in solar activity, even though changes in solar output during a sunspot cycle (11 years) are known to be small, at ~ 0.1 %.
      http://www.mdpi.com/climate/climate-01-00004/article_deploy/html/images/climate-01-00004-g002.png

      • David Appell says:

        See ren, you’ve posted so much crap that no one takes anything you say seriously, even when you are trying to be serious.

        It’s your own fault.

        • Lewis says:

          Really David,
          Your physics studies leads you to this type comment?
          Leads me to think physics students are only good at math.

    • Gordon Robertson says:

      ren …”On the Present Halting of Global Warming
      Syun-Ichi Akasofu…”

      Akasofu was a pioneer in the study of the solar wind. His book on it is a ‘must read’ for anyone trying to understand the interaction between solar plasma and our magnetosphere.

      As the solar wind, which is an electrical current of protons and electrons, interacts with our magnetosphere, it induces voltages which in turn induce electrical currents into the atmosphere, the surface, and the oceans.

      I think he is right in claiming much of the warming attributed to CO2 is in fact a re-warming from the Little Ice Age. We’ll never understand the full extent of that till we can explain how the Little Ice Age began and why it lasted 400 years.

      Volcanic aerosols don’t explain that but a change in solar output could. They could interfere in a natural order and bring on the catastrophe they fear.

      The Medieval Warm Period occurred only a few hundred years before the LIA began. It could be that warm/cold periods occur alternately over hundreds of years and that what we are experiencing now is a warm period. In that case it could get warmer due to natural causes.

      It scares me that any further warming will be jumped on by alarmist politicians to interfere in the natural processes of the planet like a bunch of egotistical idiots.

      • Gordon Robertson says:

        Akasofu on the Little Ice Age re-warming:

        http://file.scirp.org/Html/3217.html

        • Dr No says:

          Akasofu is suspect and linked to the disreputable Heartland institute.

          In September 2013, Dana Nuccitelli, John Abraham, Rasmus E. Benestad and Scott Mandia published a letter responding to Akasofu’s flawed study, detailing numerous errors and concluding that all of these errors in a single study guarantees that its conclusions cannot be supported and, in fact, are demonstrably incorrect.

          Try again.

          • Lewis says:

            So says the disreputable dr no.

            Disreputable, flawed: these are words of great import.
            I’m impressed that you used them correctly in a sentence.

          • Gordon Robertson says:

            dr no…”Akasofu is suspect and linked to the disreputable Heartland institute”.

            Very scientific doc. You have nothing on Akasofu but ad homs. If scientists want to allow Heartland to publish their works, when alarmists block their papers during peer review, there is nothing in that action to claim Heartland is disreputable.

            Only a raving alarmist would claim that because he has no scientific proof to rebut the scientists.

          • Dr No says:

            In the 1990s, the Heartland Institute worked with the tobacco company Philip Morris to question or deny the health risks of secondhand smoke and to lobby against smoking bans.

          • Dr No says:

            The Heartland Institute has received at least $676,500 from ExxonMobil since 1998 but no longer discloses its funding sources. The Union of Concerned Scientists found (PDF) that Nearly 40% of the total funds that the Heartland Institute has received from ExxonMobil since 1998 were specifically designated for climate change projects.

          • Dr No says:

            At its annual meeting in Chicago, the institute’s president, Joseph Bast, said Heartland had ‘discovered who our real friends are.’ The 100-odd guests who failed to show up for the ‘7th Climate Conference’ were not among them.

          • Dr No says:

            Something to do with that famous billboard.
            Anyway, “disreputable” may not be appropriate. Something stronger maybe?

        • ren says:

          The climate is cyclical because air circulation is cyclical. Therefore, the temperature changes in the defined area.
          Changes occur after 20 to 30 years, because the cycle lasts from 40 to 60 years.
          http://virga.sfsu.edu/gif/17031918_jetstream_h84.gif

      • David Appell says:

        “It could be that warm/cold periods occur alternately over hundreds of years”

        Neither the MWP or LIA were global events:

        “There were no globally synchronous multi-decadal warm or cold intervals that define a worldwide Medieval Warm Period or Little Ice Age.”

        — “Continental-scale temperature variability during the past two millennia,” PAGES 2k Consortium, Nature Geosciences, April 21, 2013
        http://www.nature.com/ngeo/journal/v6/n5/abs/ngeo1797.html

        • Gordon Robertson says:

          DA…”Neither the MWP or LIA were global events:”

          Only to alarmists. How would you explain a cooling of between 1C and 2C restrained to one locale?

          http://www.co2science.org/subject/l/summaries/asialia.php

        • Gordon Robertson says:

          DA…nice try…your link was to an article by a consortium, Pages 2k consortium, who appear to be a hotbed of climate alarmists. They quote Mann as an authority on climate change along with Stieg, who is part of the consortium, and with whom Mann wrote propaganda about Antartica warming the past 50 years.

          Mann and Stieg used a surface station buried under 4 feet of snow as one of their sources. It was revealed in a critique that they had extrapolated warmer temperatures from the tip of the Antarctic peninsula, located closer to South America than continental Antarctica, than to the mainland.

          Mann was caught in the Climategate emails wishing he could get rid of the LIA and the MWP. He was part of Chapter 9 in an IPCC review in which statistics expert Wegmann claimed Chapter 9 were nepotic. They cited only works from each other.

          Please don’t ad hom Wegman as having plagiarized Bradley. He was investigating him for cripes sake, it’s not as if he was trying to steal his work.

      • David Appell says:

        Gordon Robertson says:
        “I think he is right in claiming much of the warming attributed to CO2 is in fact a re-warming from the Little Ice Age. Well never understand the full extent of that till we can explain how the Little Ice Age began and why it lasted 400 years.”

        “Abrupt onset of the Little Ice Age triggered by volcanism and sustained by sea-ice/ocean feedbacks,” Gifford H. Miller et al, GRL (2013).
        DOI: 10.1029/2011GL050168
        http://onlinelibrary.wiley.com/doi/10.1029/2011GL050168/full

      • barry says:

        I think he is right in claiming much of the warming attributed to CO2 is in fact a re-warming from the Little Ice Age. Well never understand the full extent of that till we can explain how the Little Ice Age began and why it lasted 400 years.

        This whole ‘rebound from LIA’ notion is quackery. More understanding is good. Analogizing climate to a piece of elastic is not.

        • David Appell says:

          Right. Climates don’t change willy nilly — they can only be forced to change.

        • Lewis says:

          Barry,
          Quackery?
          You’re not improving your standing among those who thought you stuck to facts.

        • barry says:

          Facts? I replied to what was given.

          I’ll take a back-handed compliment, though, and return the courtesy in equal measure.

          :smiley:

          But if you’re interested in exploring the issue, let’s chat.

        • Gordon Robertson says:

          barry…”This whole rebound from LIA notion is quackery. More understanding is good. Analogizing climate to a piece of elastic is not”.

          Mainly because it throws your pseudo-science about CO2 warming out the window.

          The scientist you are calling a quack (Akasofu) was an important pioneer in the study of the solar wind. He knows how to observe and research, unlike you alarmists.

        • Gordon Robertson says:

          barry…”This whole rebound from LIA notion is quackery”.

          BTW…the IPCC has recognized the LIA and MWP as far back as 1990. Mann and his buddies who created the hockey stick lie tried to obliterate the LIA and the MWP but their graph was disproved, and junked by the IPCC. The replacement, called the spaghetti graph, re-instates the LIA and the MWP.

          With regard to your fellow alarmist’s claim, that the LIA was regional and not global, a bit of evidence to counter that.

          http://www.co2science.org/subject/l/summaries/asialia.php

          It’s highly unlikely that a mini ice age could occur in one region only. The coldest part of the LIA occurred during the Maunder Minimum when solar activity was very low.

          We have a period coming up between 2030 and 2040 when that is expected again. Get out your woolies and your ice skates.

        • barry says:

          People who think that the global climate ‘rebounds’ absent any change in cause need their heads examined.

          The notion is pure rhetoric of the most ignorant kind.

          Yes, there was an MWP and LIA. While it is disputed whether they were global phenomena, that is not what I’m arguing.

          There seems to be nothing I can do to prevent you missing the point, Gordon.

  50. barry says:

    David, nothing you say is going to stop ren posting, clearly. Ignore.

  51. ngCop says:

    fsomebodyv antidepressants for dogs buy celexa
    cheap antidepressants drugs
    oadvantagea zyprexa

  52. David Appell says:

    Still blocked from responding with real science.

    Guess that’s convenient for Roy.

    • Gordon Robertson says:

      DA…”Still blocked from responding with real science”.

      If you are blocked, why do your posts far out-number the posts of anyone else?

  53. David Appell says:

    Global warming is now, according to UAH LT v6.0, about 0.012 C/yr. Last year warming was 0.02 C relative to the year before.

    According to Roy and John, as we heard all about, this annual increase was not statistically significant.

    So despite 36 years of such trendline warming, not of the years showed statistically significant warming.

    But their entire record shows (0.012 C/yr)*(37 yrs) = 0.44 C of warming.

    So how can the entire record show a lot of statistically significant warming when the annual increases are each not statistically significant?

    I’d like to hear a reply from Roy and/or John. Though I’m sure they will conveniently ignore this question.

    • Massimo PORZIO says:

      David please,

      “So how can the entire record show a lot of statistically significant warming when the annual increases are each not statistically significant?”

      why should they reply to your silly question when you are not capable to understand that you posed a very silly question?

      Do you realize that (limited between its startpoint and its endpoint ) a linear regression does exactly what you wonder they say?

    • Gordon Robertson says:

      DA…”But their entire record shows (0.012 C/yr)*(37 yrs) = 0.44 C of warming”.

      Once again, I don’t think you have studied either physics or statistics. Anyone who had studied statistics would understand immediately that the 0.12C/decade trend occurred mainly in the negative anomaly region of the UAH graph, hence indicates a recovery from cooling.

      Furthermore, the fact that you claim starting a flat trend during the 1997/8 El Nino is cherry picking indicates a complete misunderstanding of the UAH data. In the 33 year report, UAH makes it clear that TRUE warming (ie. warming in the positive anomaly region) began with the 1997/98 EN.

      Both the IPCC and UAH indicate a flat trend from 1998 onward. What you should be looking at is why the warming did not return to the baseline after the 98 EN. It dipped below the baseline briefly then rebounded in 2001 to about 0.15C. Are you going to claim that CO2 warming can increase the global average by 0.15C in one year?

      In that case, it should have increases it by 1.5C/decade. There is something going on in the atmosphere that needs to be explained and you are missing it by crunching numbers and completely misinterpreting trends.

      • barry says:

        Anyone who had studied statistics would understand immediately that the 0.12C/decade trend occurred mainly in the negative anomaly region of the UAH graph, hence indicates a recovery from cooling.

        If I have seen a more fatuous understanding of statistics I can’t remember it.

        The baseline (which yields the negative and positive anomalies) is a matter of choice. You could raise it so that all the anomalies were negative, or lower it so that all the anomalies were positive.

        The trend would be the same.

        If all the anomalies were negative, Gordon might say it had “gone from cooling to less cool.” If they were all positive Gordon might say it had gone from warm to warmer.”

        That’s about as daft as it gets. It’s more straightforward. It’s a positive trend, meaning a warming trend.

        “Recovery” is mumbo jumbo. I guess it’s some sort of rhetoric meant to imply “it’s all natural.” This rhetoric side-steps any need for considering cause and effect. It’s like circular reasoning without the reasoning part.

        • Gordon Robertson says:

          barry…”The baseline (which yields the negative and positive anomalies) is a matter of choice”.

          Of course it is. In the case of the UAH graph they chose the global average from 1981 – 2010. All the surface records do the same.

          • Gordon Robertson says:

            Here’s your favourite, NOAA, on anomalies:

            “The term temperature anomaly means a departure from a reference value or long-term average. A positive anomaly indicates that the observed temperature was warmer than the reference value, while a negative anomaly indicates that the observed temperature was cooler than the reference value”.

        • Gordon Robertson says:

          barry…”Recovery is mumbo jumbo”

          You’ll have to take that up with UAH. In the 33 year report they claimed ‘true’ warming did not begin till the 98 El Nino drove the anomalies about the baseline.

          Like I said, if the baseline is the reference value, or the norm, anomalies below the baseline represent relative cooling. Since 98, the data points have been higher than the baseline meaning the atmosphere has warmed beyond the average. However, if you look at the UAH graph that warming came all in one year, 2001.

          The first 18 years of the record showed a gradual and steady warming trend but why are the data points mainly below the average over the range? There is a note on the UAH graph explaining that, volcanic aerosol cooling.

          • Nate says:

            ‘The first 18 years of the record showed a gradual and steady warming trend but why are the data points mainly below the average over the range?

            Lets face it, about half of us are below average in height, IQ, etc. except in Lake Wobegon.

            So with the temp data. If youve got an upward trend than most of first data will be below the average.

            BTW, baseline is pretty meaningless and arbitrary. Other sets use 1951-1980, others 1881-1910. UAH does not have that luxury of choosing.

  54. Vincent says:

    “David Appell says:
    March 19, 2017 at 8:03 PM
    Norman says:
    Droughts and heat waves have a known meteorological pattern that did not come about just the last few years because of a little global warming.
    1. Thats not the question. The question is about incidences.
    2. Global warming always makes droughts worse, because it means the atmosphere can hold more moisture (Clausius-Claperyon equation) and because evaporation rates increase (exponentially with temperature.)”
    ………………………………………………………………..
    David,
    I recall some time ago we had a discussion about the low confidence expressed in the latest IPCC report, that extreme weather events have been increasing during our current warming phase. I couldn’t find the precise quotes in the report. Perhaps I was looking at AR4 instead of AR5.

    However, I’ve now found the references I was seeking, in the Synthesis Report (SYR) of the IPCC Fifth Assessment Report (AR5).
    Here it is. https://www.ipcc.ch/pdf/assessment-report/ar5/syr/AR5_SYR_FINAL_All_Topics.pdf

    Under the heading of ‘Extreme Events’ on page 53, you’ll find the following statements.

    “There is low confidence that anthropogenic climate change has affected the frequency and magnitude of fluvial floods on a global scale. The strength of the evidence is limited mainly by a lack of long-term records from unmanaged catchments. Moreover, floods are strongly influenced by many human activities impacting catchments, making the attribution of detected changes to climate change difficult.
    However, recent detection of increasing trends in extreme precipitation and discharges in some catchments implies greater risks of flooding on a regional scale (medium confidence). Costs related to flood damage, worldwide, have been increasing since the 1970s, although this is partly due to the increasing exposure of people and assets. {WGI 2.6.2,

    There is low confidence in observed global-scale trends in droughts, due to lack of direct observations, dependencies of inferred trends on the choice of the definition for drought, and due to geographical inconsistencies in drought trends.

    There is also low confidence in the attribution of changes in drought over global land areas since the mid-20th century, due to the same observational uncertainties and difficulties in distinguishing decadal scale variability in drought from long-term trends. {WGI Table SPM.1, 2.6.2.3, 10.6, Figure 2.33, WGII 3.ES, 3.2.7}

    There is low confidence that long-term changes in tropical cyclone activity are robust, and there is low confidence in the attribution of global changes to any particular cause. However, it is virtually certain that intense tropical cyclone activity has increased in the North Atlantic since 1970. {WGI Table SPM.1, 2.6.3, 10.6}”

  55. ren says:

    In California, a lot of rain. In the mountains of snow. Will also appear storms.
    http://www.tinypic.pl/ogd8f715wg8y

  56. Sapa says:

    I have just watched a youtube video where I was interested in your views about creation v evolution. I have spent my 63 years asking similar questions. My field was archaeology and prehistory. I did no more than a batchelors. I did the human evolution course twice and both times we were asked if anyone present would raise their hand if they didn’t Believe the theory of evolution. I was the only one to raise my hand both times around but was never asked what I do believe. Belief is faith, why any scientific mind should have faith in an unproven theory is beyond me.
    For reasons too complicated to write here I have come to a third option and want to share this with you. We were seeded by a living and sentient universe. It seeds life whenever and wherever conditions are right. It is not a god because we are all fractal representations of it. It is sentient and so is all life. In fact there is no death. The ancients knew this, all their writings tell us this. They had various ideas, reincarnation, and places of the underworld etc.
    We return to the source, Confucius said the only certainty in life is change. This taoist view is close to my own heart. Seeding explains so much that is missing from the other theories, including all the phenomena that we have and which is taboo, such as otherworldly experiences, past life memories, falls of frogs etc etc
    It is logical.
    Earth is alive and growing. Like any other living being it has spurts of growth accompanied by symptoms such as increase in temperature. It has cycles as does Everything.

    • Gordon Robertson says:

      Sapa…”I did the human evolution course twice and both times we were asked if anyone present would raise their hand if they didnt Believe the theory of evolution. I was the only one to raise my hand both times…”

      You were likely the only sane person in the class.

      The theory of evolution is pseudo-science, and I am not affiliated with any religion. I have no beliefs, my interest is purely scientific.

      Although I don’t believe your theory either, it makes far more sense than the theory of evolution. Having studied several courses in chemistry, I have become fairly well educated in the process of covalent bonding as well as several other forms of bonding. None of them can explain how five basic elements bonded by covalent means to form life as we know it today. The odds against it are billions and billions to one.

      The initial alleged formation of life via covalent bonding of inanimate objects such as atoms of hydrogen, oxygen, carbon, phosphorus and nitrogen is called abioegenesis. Many evolutionists with whom I have communicated claim abiogenesis has nothing to do with evolution theory. In other words, they ignore the beginning and jump into the theory along the way.

      Even at that, claims of one species evolving into another species have not one single fossil to back the theory. It is sheer conjecture. Natural selection is a mystery that no one can explain.

      Possibly the most damning evidence against evolution is the codes found in DNA. In order to produce protein, amino acids have to be formed by RNA, which literally interrogates the codes in DNA to find the codes required to form certain amino acids. Each amino acid requires a different code.

      Where did those codes come from? If 5 basic elements formed life in the first place where did they acquire the intelligence to create DNA with codes embedded in it? There is nothing in covalent bonding theory to explain that.

      I find evolutionists to be similar to climate alarmists. They fabricate theories then worship their own theories. They have no interest in proving the theories they simply regurgitate them, moving the goal posts to obfuscate inconsistencies in the theory.

      • Dr No says:

        “The theory of evolution is pseudo-science” !!!!
        Keep digging Gordon.
        You are doing a great job of damaging the denialists’ cause by associating with creationists.
        It doesn’t greatly surprise me but let me explore further.
        I bet you don’t believe in:
        vaccinations
        fluoridation
        Einstein’s theories
        equal rights
        alternative energy
        stricter gun controls
        vegetarian diets
        health risks due to smoking
        CNN
        democrats
        academics
        young people
        teachers
        doctors
        unionists
        .

        • Gordon Robertson says:

          dr no…”You are doing a great job of damaging the denialists cause by associating with creationists”.

          You are the one associating me with creationists. I mentioned nothing about God or Genesis. I was talking pure science, expressing my skepticism of the theory of evolution using fact.

          “I bet you dont believe in:”

          I don’t believe anything. I have worked in the electrical and electronics field much of my life but I don’t believe that atoms consist of a core with electrons neatly orbiting them. I don’t know what’s going on in that weird and wonderful micro-environment. Wish I did.

          The reason I don’t believe the theory in particular is that valence electrons are shared between atoms to form a relatively strong bond. How do electrons orbit and still form a bond?

          I question everything doc. I feel strongly that the moment you stop questioning and think you ‘know’ then you cease to learn.

          In Zen Bhuddism they call it emptying your cup. When your cup is full, you cannot take any more in. So you keep emptying it and look at the universe differently each time.

      • barry says:

        Well goodness me, Gordon. I’m curious to know how you think life appeared.

        • Dr No says:

          barry, I know how intelligent life evolved, but I am stumped working out why people like Gordon and Norman are here.

          • Norman says:

            Dr. No

            I am here to keep science alive. The desire to research and look for the truth. People like you are convinced you know the truth and are no longer scientific but religious. You have conviction you are “right” and any debate against it is wrong and bad and you are not capable of thinking about arguments that do not support your convictions.

            I have clearly linked you to articles that counter your convictions and beliefs but they have no effect. You are too strongly convinced that only your understanding of reality is the truth and all other views are immediately wrong and need to be destroyed since they challenge your beautiful and perfected thought.

          • Gordon Robertson says:

            dr no…”barry, I know how intelligent life evolved, but I am stumped working out why people like Gordon and Norman are here”.

            No…you don’t ‘know’ how intelligent life evolved. You have deluded yourself into thinking you do through blindly accepting authority. You have never proved how intelligent life formed, you are only regurgitating what someone else told you, same as your views on climate science.

          • Norman says:

            Gordon Robertson

            You make a very good point.

            I would wonder if Dr. No would enlighten us and explain just exactly how intelligent life did evolve since he knows how.

            I guess since we are not intelligent by his opinion he can convince himself that he has the correct mechanism down but we are too stupid to understand it.

            I think it would be an amazing thing for him to give the mechanism to intelligence since no one really knows what it is. They can make tests for it but what is going in at the neuronal level is still beyond the level of empirical science.

            http://blog.brainfacts.org/2012/12/what-is-intelligence/#.WNHvjG8rKAY

        • Gordon Robertson says:

          barry…”Well goodness me, Gordon. Im curious to know how you think life appeared”.

          I don’t know, and neither does anyone else. What’s wrong with leaving it as a question?

          I would have no problem with the theory of evolution if it was presented as an interesting hypothesis. I don’t mind conjecture in science, I object when people start presenting a hypothesis as fact, based on nothing more than consensus.

          If evolution was presented as a hypothesis I would want to ask questions such as, how do covalent bonds explain the transition from non-living chemicals to actual life. No one has explained that. It was tried as an experiment in the 1950s and all they got was a sticky goo. They concluded that life could not have existed in the environment required to produce the goo.

          I’d also want to know what is meant by natural selection. People speak of it broadly while describing evolutionary processes but no one has ever demonstrated it live. Evolution is often mistaken for genetics, where changes take place within species but never from one species to a different species.

          • Dr No says:

            Keep going.
            You are half way to China.

          • Norman says:

            Gordon Robertson

            You have some valid points but it is not just an untested hypothesis. They do have a vast fossil record. In the layers of sedimentary rock the life is always simplest in the earliest formed layers. There is no sign of any higher developed or complex organisms in the earliest fossil records. As one progresses through the layers more complex life forms start to show up.

            Natural Selection is proven in microbiology on a regular basis and also in farming on a macroscopic level. Bacteria that survive a treatment become resistant to the treatment (the surviving organisms transmit their DNA to their offspring who are all now resistant).

            Weeds also seem to use Natural Selection to overcome herbicides. A given weed with a slightly varied molecular system is not killed by a given herbicide and transmits the DNA to its offspring and they also are resistant (super weeds is the term used).

            I am not sure what causes the changes in organisms that drive evolution. Fossil records do strongly support it and no other proposed theory can explain the evidence. Some biologists believe random chance drives evolution. I would totally agree their is not any evidence to support it. It does appear possible that some form of intelligence is involved in the process yet we have not found the link to this intelligence but complex systems have generally needed an intelligent agent behind them to make them.

            I agree the topic is open to debate and one should not ridicule those who question random chance as the primary driver to develop ever more complex living systems over eons of time.

          • Gordon Robertson says:

            Norman…”They do have a vast fossil record. In the layers of sedimentary rock the life is always simplest in the earliest formed layers”.

            I enjoyed this article although I don’t know if the author is a creationist. I don’t care. If an article makes scientific sense I will consider it, even though one has to be extremely careful not to jump to conclusions based on seemingly scientific logic.

            http://www.newgeology.us/presentation32.html

            I studied the fossil record as part of a geology course, the earliest forms of life found being trilobytes. There are no intermediate fossils found that would suggest the evolution of one species to another and I find it a quantum leap to suggest insects like trilobytes can be tracked back to elements like hydrogen, oxygen and carbon mixing randomly in primeval muds.

            How did we get from trilobytes to dinosaurs?

            “Natural Selection is proven in microbiology on a regular basis and also in farming on a macroscopic level”.

            I am aware of that in genetics but the selections come generation to generation within a particular species. There is never an overall change in the species. As far as I know, there is no explanation as to why. Extrapolating that process to evolution as a whole makes no sense to me.

            “Some biologists believe random chance drives evolution. I would totally agree their is not any evidence to support it”.

            The Wismar Symposium in Philadelphia, in 1966, debated that thoroughly. It was agreed even by diehard evolutionists that they had no explanations. Unfortunately, creationists have elbowed most other sources off Google and it’s hard to find an unbiased report on the symposium. Even so, the creationists do present original documentation.

            One of the outcomes of the symposium was a report by a mathematician that the odds of covalent bonding processes forming life by chance were in the order of billions and billions to one against. Another study on the entropies of such reactions found similar odds against.

          • Gordon Robertson says:

            “…the earliest forms of life found being trilobytes”

            should read, “the earliest fossils found being trilobytes”

          • Dr No says:

            Id also want to know what is meant by natural selection.
            Look up “Darwin Award”
            Darwin Awards are given to people who kill themselves doing something stupid
            Winners of the Darwin Award eliminate themselves from the gene pool in such an idiotic manner that their action ensures one less idiot will survive.

            I suspect that somebody in the future, a survivor, may award one to you and Norman.

      • ren says:

        The DNA revolution is due to the action of the cosmos and the magnetic field.
        http://m.pnas.org/content/109/16/5967/F3.large.jpg

        • ren says:

          What is Galactic Cosmic Radiation?
          Galactic Cosmic Radiation, or GCR, comes from outside the solar system but primarily from within our Milky Way galaxy. In
          general, GCR is composed of the nuclei of atoms that have had their surrounding electrons stripped away and are traveling at
          nearly the speed of light. Another way to think of GCR would be to imagine the nucleus of any element on the periodic table
          from hydrogen to uranium. Now imagine that same nucleus moving at an incredibly high speed. The high-speed nucleus you are
          imagining is GCR. These particles were probably accelerated within the last few million years by magnetic fields of supernova remnants
          (but not the supernova explosion itself). The giant expanding clouds of gas and magnetic fields that remain after a supernova
          can last for thousands of years.8
          During that time, cosmic rays are probably accelerated inside them. The action of the particles
          bouncing back and forth in the magnetic field of the supernova remnant randomly causes some of the particles to gain energy and
          become cosmic rays.9
          Eventually they build up enough speed that the remnant can no longer contain them and they escape into
          the galaxy. As they travel through the very thin gas of interstellar space, some of the GCR interacts with the gas and emits gamma
          rays. Detection of that reaction is how we know that GCR passes through the Milky Way and other galaxies.
          The GCR permeates interplanetary space and is comprised of roughly 85% hydrogen (protons), 14% helium, and about 1% highenergy
          and highly charged ions called HZE particles. An HZE is a heavy ion having an atomic number greater than that of helium
          and having high kinetic energy. Examples of HZE particles include carbon, iron, or nickel nuclei (heavy ions). Though the HZE
          particles are less abundant, they possess significantly higher ionizing power, greater penetration power, and a greater potential for
          radiation-induced damage.10 GCR is extremely damaging to materials and biology. In general, we are largely shielded from GCR
          on Earth because of our planets atmosphere and magnetic field, whereas the Moon is not shielded from GCR because it lacks
          a global magnetic field and atmosphere.
          In summary, GCR is heavy, high-energy ions of elements that have had
          all their electrons stripped away as they journeyed through the galaxy
          at nearly the speed of light. They can cause the ionization of atoms as
          they pass through matter and can pass practically unimpeded through a
          typical spacecraft or the skin of an astronaut. The GCR are a dominant
          source of radiation that must be dealt with aboard current spacecraft
          and future space missions within our solar system. Because these particles
          are affected by the Suns magnetic field, their average intensity is
          highest during the period of minimum sunspots when the Suns magnetic
          field is weakest and less able to deflect them. Also, because GCR
          is difficult to shield against and occurs on each space mission, it is often
          more hazardous than occasional solar particle events.11 The picture at
          left shows GCR falling onto the surface of Mars. GCR appears as faint
          white dots, whereas stars appear as white streaks.
          https://www.nasa.gov/pdf/284273main_Radiation_HS_Mod1.pdf

          • Gordon Robertson says:

            ren…”The GCR permeates interplanetary space and is comprised of roughly 85% hydrogen (protons), 14% helium, and about 1% highenergy…”

            How about neutrinos”?

          • ren says:

            Potential sources:

            AGN: Active Galactic Nuclei (AGN) is one of the possible, and likely, acceleration sites to produce EHE cosmic rays, and the accelerated proton energy loss due to proton-proton and/or proton-gamma interactions in the AGN accretion disk or with UV photons in the associated jets are dominant mechanism for neutrino (and photon) production.

            GRBs: GRBs are expected to produce significant fluxes of neutrinos from the approximately 100 MeV thermal spectrum and from accelerated protons producing pions by photoproduction on the radiations fields present. These radiation fields include, the thermal radiation, synchrotron radiation for accelerated electrons, Compton-up-converted versions of these original fields.
            Diffuse sources:

            CR-CMB: EHE neutrinos above 1019 eV are produced by photopion production of the 2.7 K cosmic background radiation photons and the ultra-high energy cosmic ray nucleons during propagation in intergalactic space.
            http://astronomy.nmsu.edu/tharriso/ast536/ast536week10.html

        • ren says:

          One way to reduce astronauts exposure to galactic cosmic rays could be to send them to space only during the peak of the suns natural 11-year solar cycle. During solar maximum, the suns radiation blows counteractively against the cosmic rays streaming in to our solar system, reducing an astronauts exposure. Of course, being in space during this time also means the sun could unleash a potentially deadly solar flare, frying astronauts in their spaceship.

          What kind of extra exposure are astronauts normally dealing with? People living in the U.S. are exposed to about 3 millisieverts of radiation from natural background sources each year (millisieverts are units of radiation exposure in the human body). A nuclear accident, like Fukushima, might raise this by about 1 millisievert. An astronaut on a round-trip, two-and-a-half-year Mars mission, by contrast, can expect to receive around a sievert of cosmic ray radiation, nearly 1,000 times more.
          https://www.wired.com/2014/04/radiation-risk-iss-mars/

          • Norman says:

            ren

            I agree with your point about cosmic rays.

            http://www.universetoday.com/92897/can-solar-flares-hurt-astronauts/

            Do you think they may be able to build powerful magnetic fields around space ships of the future to deflect the higher energy cosmic rays away from astronauts?

          • ren says:

            Radiation Hazards from Cosmic Rays
            Galactic Cosmic Rays (GCRs) pose the most serious chronic radiation hazard for long duration interplanetary missions to Mars, particularly in solar minimum activity conditions when approximately 10 cm of aluminum shielding may be needed to bring the radiation dose down to the current limit for astronauts in low-Earth orbit [Davis et al., 2001]. Most of the problem lies in the < 1 GeV/nuc GCRs, with a significant contribution from heavy nuclei, despite their low intensities. Although the GCR problem is less severe during solar maximum, large SEP events are more frequent, raising the frequency of acute exposure.

            The following parametric tables for dose and dose equivalent in the Mars atmosphere from GCRs were calculated with the HZETRN 2005 model at the University of Tennessee:
            http://prediccs.sr.unh.edu/#MarsAtaglance

        • ren says:

          Current Dose Rates

          The NAIRAS model predicts atmospheric radiation exposure from galactic cosmic rays (GCR) and solar energetic particle (SEP) events. GCR particles are propagated from local interstellar space to Earth using an extension of the Badhwar and O’Neill model, where the solar modulation has been parameterized using high-latitude real-time neutron monitor measurements at Oulu, Thule, Lomnicky, and Moscow. During radiation storms, the SEP spectrum is derived using ion flux measurements taken from the NOAA/GOES and NASA/ACE satellites. The cosmic ray particles – GCR and SEP – are transported through the magnetosphere using the CISM-Dartmouth particle trajectory geomagnetic cutoff rigidity code, driven by real-time solar wind parameters and interplanetary magnetic field data measured by the NASA/ACE satellite. Cosmic ray transport through the neutral atmosphere is based on analytical solutions of coupled Boltzmann transport equations obtained from NASA Langley Research Center’s HZETRN transport code. Global distributions of atmospheric density are derived from the NCEP Global Forecasting System (GFS) meteorological data.

          The current figures below show the NAIRAS prediction of the radiation exposure quantity related to biological risk – Effective dose rate (uSv/hr) – at several altitudes and flight paths. To put the exposure rates into perspective, one chest X-ray is about 100 uSv, and a CT scan is about 8,000 uSv.
          http://sol.spacenvironment.net/nairas/Dose_Rates.html

      • Nate says:

        Gordon, indeed you are conundrum. How can you say you are only interested in science, the deny basic science facts. You blieve DNA has the code but dont believe in evolution? Very confused and contradictory. You say noone can explain natural selection when darwin explained it very well. Maybe you mean the mechnism? Well you said you believ in DNA, that provides a mechanism!
        Missing fossils? Youve missed reading about them, but they are there. Pick up s j gould book.

        You seem to feel pick and choose which aspects of biology you want to believe in and ignore the rest. That maakes no sense. First its not about belief. Its about evidence. Second, our whole understanding of life, and medicine falls apart and makes no sense if evolution is discarded. It is central.

  57. Norman says:

    David Appell

    The Tiny URL link worked so I will post it as the source of my research.

    https://tinyurl.com/lqs6wcz

    This brings up a really nice research tool on record temperatures. I used the US for the research.

    If you look at this graphic:
    https://tinyurl.com/mo6pzc4

    It goes through the decades of temperatures for the 48 states. Clearly it does show a linear increase in temperature over the decades and it even supplies support of your contention with Gordon Robertson on 1934. The Midwest was very hot in the 1934 year but other parts of the US were not as hot.

  58. Norman says:

    David Appell

    I was working on your hypothesis you posted on your blog.
    http://davidappell.blogspot.com/2015/07/why-very-warm-events-are-much-more.html

    You propose that as temperatures increase linearily that the chance for hotter temperatures increases exponentially.

    After doing research on this concept I do not find any supporting evidence that this is the case.

    If you actually like to research and spend some time, look at the tool I used to research your proposal in the previous link.

    The tool gives all the record daily high maximum temperatures for a month block going way back in time.

    I used the tool to make an excell spreadsheet for summers of 1934 and 1936 (Note: record warm days in winter are not dangerous to health so I was not looking into them for this study. A 70 F day in January is most pleasant and will not lead to fatality induced by excessive heat so I kept the study focused on dangerous summer high maximum temperatures).

    I also did all the summers starting from 2011 throuht 2016 and did some random samples during cooler decades like 1979-1981.

    • Norman says:

      David Appell

      What I found does not support your claim in the least, it actually shows that a warmer background temperature does not lead to excessive heat. Also if you use the record temperature tool it will clearly show you that record temperatures clump in regions and are not scattered all over the US. This greatly reinforces the reality that excessive heat is not a random fluctuation subject to Bell Curve statistics but a meteorological effect which would be a blocked upper level high that limits convection, cloud formation, leading to drier conditions that greatly reduce evaporative cooling that will then lead to excessive heat.

      I do not think you will see this pattern until you do your own research on it. All the record high temperatures are dots on the map of the US (they also include Hawaii and Guam) but you will clearly see the regional clumping and it would strongly support a blocked high pressure aloft.

    • Gordon Robertson says:

      Norman…”You propose that as temperatures increase linearily that the chance for hotter temperatures increases exponentially.

      After doing research on this concept I do not find any supporting evidence that this is the case”.

      No kidding, it’s nonsense. There is no correlation between the chance of increasing temperatures and the observable data.

  59. Norman says:

    David Appell

    I will attempt to copy the Excel sheet data here but not sure how it will format, may not be readable.

    Daily Records Highest Maximum temperature
    Potential Tied Broken Total Total
    Jun-34 110747 1128 3738 4866
    Jul-34 114421 1626 5777 7403
    Aug-34 114421 1045 3322 4367
    Jun-36 112560 1200 3335 4535
    Jul-36 116281 1574 8626 10200
    Aug-36 116281 1765 6984 8749
    Jun-11 138413 1869 3434 5303
    Jul-11 142697 1536 2138 3674
    Aug-11 142536 2255 4121 6376
    Jun-12 134447 1442 3300 4742
    Jul-12 138628 1865 4455 6320
    Aug-12 138211 1121 1803 2924
    Jun-13 130669 923 2249 3172
    Jul-13 134765 559 1010 1569
    Aug-13 134291 596 707 1303
    Jun-14 127268 302 448 750
    Jul-14 131270 516 573 1089
    Aug-14 130951 324 296 620
    Jun-15 123817 972 2373 3345
    Jul-15 127768 613 970 1583
    Aug-15 127639 918 1286 2204
    Jun-16 121313 861 1846 2707
    Jul-16 125101 878 1084 1962
    Aug-16 124659 573 816 1389
    Jul-79 170500 677 869 1546
    Jul-80 170791 2620 5553 8173
    Jul-81 170531 1090 1755 2845
    Jul-65 170004 248 387 635

  60. Norman says:

    David Appell

    I did not think it would format to a readable chart.
    Tied Broken Total
    Jun-34 1.02 3.38 4.39
    Jul-34 1.42 5.05 6.47
    Aug-34 0.91 2.90 3.82
    Jun-36 1.07 2.96 4.03
    Jul-36 1.35 7.42 8.77
    Aug-36 1.52 6.01 7.52
    Jun-11 1.35 2.48 3.83
    Jul-11 1.08 1.50 2.57
    Aug-11 1.58 2.89 4.47
    Jun-12 1.07 2.45 3.53
    Jul-12 1.35 3.21 4.56
    Aug-12 0.81 1.30 2.12
    Jun-13 0.71 1.72 2.43
    Jul-13 0.41 0.75 1.16
    Aug-13 0.44 0.53 0.97
    Jun-14 0.24 0.35 0.59
    Jul-14 0.39 0.44 0.83
    Aug-14 0.25 0.23 0.47
    Jun-15 0.79 1.92 2.70
    Jul-15 0.48 0.76 1.24
    Aug-15 0.72 1.01 1.73
    Jun-16 0.71 1.52 2.23
    Jul-16 0.70 0.87 1.57
    Aug-16 0.46 0.65 1.11
    Jul-79 0.40 0.51 0.91
    Jul-80 1.53 3.25 4.79
    Jul-81 0.64 1.03 1.67
    Jul-65 0.15 0.23 0.37

  61. Norman says:

    David Appell

    I do not think I will be able to display the results of the study in a readable format.

    It does show that the summers of 1934 and 1936 did set considerable more heat records than the summers of 2011-2016 with the summers of 2011 and 2012 setting the most records and the numbers declining after that even though the background temperature was shown to continue increasing. The study strongly suggests that the slight background temperature increase does not lead to a higher probability of record breaking high temperatures and it seems the two are not linked or connected. High temperatures records will continue to be made but they will be regional based upon weather patterns as they have always been.

    • Dr No says:

      Can you display the results in “slide rule” format so Gordon can play with them.
      I hear he needs to cut the numbers out with scissors and then glue them back in some sort of order.
      p.s. he wants some colouring crayons for Christmas.

      • Norman says:

        Dr. No

        Are such post useful and necessary? Can you spend some time and look at the data sources and then come up with your own conclusions? Would that not be a better way to spend your time then coming up with insults to another poster?

        • Dr No says:

          Norman,
          I believe I have pointed to more factual and informative articles than yourself.
          Whereas I have identified the faults in yours, I don’t believe that you have laid a finger on any of mine.
          Therefore my posts are far more useful and necessary.
          The fact that you and Gordon invite ridicule is your problem, not mine.

          • Norman says:

            Dr. No

            YOUR WORDS: “I believe I have pointed to more factual and informative articles than yourself.”

            Hard to debate with someone with a belief.

            I do not agree that you have identified faults in my links nor do I accept your claim I have not laid a finger on your.

            I also do not agree that your posts are far more useful or necessary. You are a narcissist and deluded by your own beauty therefore by your own words it is obvious that you are of little science value. You are unable to investigate or challenge anything stated by authorities. That is one thing Gordon will do. If he makes mistakes along the way all okay as long as he learns from them.

            You are a religious zealot that cannot cope with anyone who might dare question you, you love authority because you want others to love you as an authority. When it becomes clear you really are not what you think you are you go into a temper tantrum and lash out with a foul tongue.

            Regardless of your opinion of myself or Gordon Robertson, as long as Roy Spencer permits I will challenge both sides of this debate to keep the mind active and working. If I think something is not true or valid I will continue to research it and present my case.

          • Massimo PORZIO says:

            +1

          • Dr No says:

            “Regardless of your opinion of myself or Gordon Robertson, as long as Roy Spencer permits I will challenge both sides of this debate to keep the mind active and working. If I think something is not true or valid I will continue to research it and present my case.”

            The difference between you and me is that I trained and practised as a scientist – so I know what I am talking about.
            Importantly, I also know my limitations and would never, for example, dare to criticise the work of cosmologists, geologists, chemists, physicists etc. simply because they draw conclusions that make me feel uncomfortable. I am simply unqualified to doubt their expertise in their fields and to do otherwise would be conceited – some might say even arrogant.
            That is why I find the posturing of amateur such as yourself laughable – and richly deserving of ridicule.
            Nothing personal of course.

          • Norman says:

            Dr. No

            I have a Chemistry degree and continue to read and research science of all fields since it interests me.

            You must have had a some really poor level Professors at whatever University you attended. My Chemistry professor (Dr. Bunck) taught us to question and challenge all science even accepted science. It is useful for the mind and keeps one open minded.

            You have an authoritarian mentality which was probably instilled by some poor quality professors. They probably taught you that they know best and don’t dare question what they teach or you will get a bad grade.

            I rest my case on your point: “I also know my limitations and would never, for example, dare to criticise the work of cosmologists, geologists, chemists, physicists etc. simply because they draw conclusions that make me feel uncomfortable. I am simply unqualified to doubt their expertise in their fields and to do otherwise would be conceited – some might say even arrogant.”

            I would openly criticize anyone if their conclusion did not seem logical or was not supported by empirical evidence. I would also learn along the way in researching the material and gain knowledge in these areas.

            You science view is based upon an authoritarian view and is more of a religion than a science. There is nothing in my mind that would prevent me from learning what your authorities know in their field but time and effort. They were not born with the specific knowledge, they had to learn it. Some people are more motivated and put more time and effort into a subject, some just do it to get the degree and hope for a good job and are not so passionate about the subject.

            You worship at the alter of the High Priests and will not dare question what they claim

            I am glad you have a religion to help you in life and guide you. Now let the scientific minded continue since you are not part so this mentality.

            What subject are you trained in? Maybe they teach that topic different. I think whoever taught you did a great disservice to science. Can you think on your own about anything or do you need some expert to tell you the answer?

          • Dr No says:

            “My Chemistry professor (Dr. Bunck) taught us to question and challenge all science even accepted science. It is useful for the mind and keeps one open minded.”
            As a chemist then, you must feel free to question and challenge:
            quantum mechanics
            the theory of evolution
            the effectiveness of vaccinations
            Einsteins theories
            the so-called dangers of smoking tobacco
            the claim that NASA landed on the moon
            the idea that diet is linked to heart disease
            etc etc
            Go right ahead – question and challenge away.
            Dr Bunck should have told you to restrict your meanderings to Chemistry only -otherwise we we would have to give equal time to fools and scoundrels when it comes to climate science.
            Hang on! That is what I am doing right now!

          • Dr No says:

            “I have a Chemistry degree and continue to read and research science of all fields since it interests me.”
            Is that so? Please inform us all on your views on the latest in brain surgery techniques.

          • Dr No says:

            “There is nothing in my mind that would prevent me from learning what your authorities know in their field but time and effort”
            I see, you must be a genius then if you think you can become an expert in so many fields simply by reading up on them.
            You could still become a cancer researcher or an expert mathematician or an expert astronomer or whatever – possibly by reading up on the books “for Dummies”.
            You are obviously in awe of your abilities.
            I am in awe of your conceit.
            Typical of armchair experts.

          • Dr No says:

            “What subject are you trained in? Maybe they teach that topic different. I think whoever taught you did a great disservice to science. Can you think on your own about anything or do you need some expert to tell you the answer?”
            I trained and practised in climate science – for many years – and know far more about it than you ever will.
            Importantly, while I can think on my own, I know when to defer to experts.

          • Norman says:

            Dr. No

            If you are a representative of climate science education then most certainly it would be a topic which should be questioned.

            I have not seen anything in your posts that profess some high knowledge of anything. Mostly weak attempts at belittling people who do not blindly follow your religion.

            You ask a series of questions and I would question things in anyone of those.

            Long ago when I was getting my degree it did take other science courses of varied type and did quite well. A’s mostly a few B’s. Astronomy, Meteorology, Psychology, Sociology, Physics and did well in Chemistry.

            Later in life I took Computer courses at a Community college and made 4.0 in every class I took (C, C++, Visual Basic, AS-4000, Unix, Cobol).

            I also took one class in Engineering statics without having studied geometry or calculus for 20 years and got a B. I think I can learn most any science if I spend time and effort at it. I like science so it is easier for me to learn in this area than others.

            YOU: “Is that so? Please inform us all on your views on the latest in brain surgery techniques.”

            I am sure I could inform you if I chose to read and study the topic. I may not be able to perform the procedure as that would require some specialized skill but understanding a process should not be that impossible.

          • Massimo PORZIO says:

            Norman,

            You are great!

            Have a nice day.

            Massimo

          • Nate says:

            Norman,

            Questioning is fine. But you have to admit it takes a long time to really become expert at some field, like medicine, or physical sciences. PhDs take 5+ years.

            So if there is something outside my area of expertise that doesnt make sense to me, but is widely understood/accepted in that field, then my first assumption would and ought to be that I am lacking some knowledge in this field, and if I could learn more about it, then I would understand it.

            Is that how you feel. Or would your first assumption be these so-called experts are wrong.

            Then you are saying there is no point to studying long and hard to become expert, if they’re just as likely to be wrong as non-experts.

          • Norman says:

            Nate

            I would generally go with textbook knowledge of a subject as the most reliable source.

            If you read my post, I would question an expert if they made a conclusion that was not supported by some empirical evidence. That does not mean their conclusion is wrong, I would just be inclined to question it.

            I am not sure if you correctly understand why questioning is good in science. It is not to upset an authority or to be arrogant as Dr. No believes it to be. It keeps a person’s mind open and active and thinking. If you do not understand something, far better to question it than just believe it is true because of some expert.

            Also you stated this: “Then you are saying there is no point to studying long and hard to become expert, if theyre just as likely to be wrong as non-experts.”

            I do not recall ever saying something of this nature. I did not say experts are likely to be wrong about their special subject. I said if they made a claim that seemed illogical and was not supported by empirical evidence I would question it. This process would not make me right and them wrong, but I would then want to research the topic and learn more to see what is going on or why maybe they came up with their conclusions.

          • Nate says:

            Norman, ok good.

            Let me also add that in my experience, learning a new area, even one connected to my own, takes full-time effort. There are details and subtleties that I wont learn just from reading, but may learn after several years of working on the subject, putting my ideas out for critique, and going to conferences and discussing with people.

            Now if you are making a claim that some aspect of climate science is wrong, that is generally accepted by most climate experts, chances are high you are the one that is wrong.

            Anyway at least you being not trained in this field, your burden of proof should very high.

      • ren says:

        Dr No
        15th March 2017

        “Scientists have their best estimate yet of how many Adélie penguins live in East Antarctica, numbering almost six million, 3.6 million more than previously estimated.

        The new research by a team of Australian, French and Japanese scientists used aerial and ground surveys, tagging and resighting data, and automated camera images over several breeding seasons.

        The researchers focused on a 5000 kilometre stretch of coastline in East Antarctica, estimating 5.9 million birds and extrapolating that out to likely global estimate of 14-16 million birds.”
        The research also estimates the amount of prey (krill and fish) needed to support the Adélie penguin population.

        “An estimated 193 500 tonnes of krill and 18 800 tonnes of fish are eaten during the breeding season by Adélie penguins breeding in East Antarctica,” Dr Emmerson said.

        This information will be used by the Commission for the Conservation of Antarctic Marine Living Resources to set sustainable krill fishery catch limits.
        http://www.antarctica.gov.au/news/2017/millions-of-adelie-penguins-call-antarctica-home#v199449

        • Dr No says:

          Is this addressed to me?
          I am not sure why though.
          Seriously, you should get help since you have some sort of obviously repetitive compulsion disorder.

          • ren says:

            I want to ask you, whether the increase acidification of the ocean has affected the growth of Antarctic krill population?

          • Dr No says:

            Go ahead and ask.
            My answer will be:
            “Don’t be so lazy. Go and look up the topic.”
            Or is that too difficult? Maybe you should stick to posting random trivia.
            p.s. get some help

  62. ren says:

    The animation shows the relationship of temperature and ozone over the southern polar circle. This dependence is closely related to the strength of the polar vortex.
    It can be seen that the ozone column extends well below 5 km.
    https://www.esrl.noaa.gov/gmd/dv/spo_oz/movies/index.html
    http://www.cpc.ncep.noaa.gov/products/stratosphere/polar/gif_files/ozone_hole_plot.png

  63. Norman says:

    Jun-34 110747 1128 3738 4866

  64. CO2isLife says:

    Dr Spencer, here is a theory that might be worth exploring:

    Climate Science on Trial; Did Cosmic Rays End the CA Drought?
    https://co2islife.wordpress.com/2017/03/22/climate-science-on-trial-did-cosmic-rays-end-the-ca-drought/

  65. Snowready says:

    Al gore should have never made AGW a political issue. All he did is polarize the issue. His money making carbon tax credits would do nothing to adress AGW but enrich himself.

  66. Snowready says:

    AGW was not a democrat republican issue before the release of Incinvent truth. In fact regan bush Sr and W bush supported the study of AGW

    • Dr No says:

      This looks like a nice reference book on the topic.
      I note that the authors state:
      “The final chapter (Chapter 15) presents an overview to the science of climate change with an emphasis on how a warmer climate might affect changes in the frequency and intensity of extreme weather events”
      and:
      “..the book intends to challenge you [the student] to think critically about if and how these [extreme] events may change in frequency and or intensity in the future as the earth becomes warmer from climatic changes.”

      I recommend you read it and study it – not just look at the pretty pictures.

      • ren says:

        Is the temperature of the southern ocean is low or high?
        http://www.ospo.noaa.gov/data/sst/anomaly/2017/anomnight.3.20.2017.gif

      • Norman says:

        Dr. No

        You searched other links for this book to find your quote?

        https://tinyurl.com/leyubv3

        Link to your quote:

        Please note what the author is stating!!

        “the book intends to challenge you [the student] to think critically about if and how these [extreme] events may change in frequency and or intensity in the future as the earth becomes warmer from climatic changes.

        Note: “if” and “how”. The book gives details on how severe weather forms so that a student can use this information to determine if a slight warmed planet will actually lead to an uptick in extreme weather. It is all about thinking about the issues that they are hearing from the media.

        I think you missed the “if” or you really do not know what that word means.

        • Dr No says:

          Norman, do you agree with these statements:
          (A) “extreme events may change in frequency and or intensity in the future as the earth becomes warmer”

          (B) As the mean temperature increases, it is likely that the maximum temperature will also increase.

          A simple answer YES or NO is all that is required.

          • Norman says:

            Dr. No

            A) YES

            B) Possible I have to research this one some more before giving an answer.

        • Massimo PORZIO says:

          Norman,
          I would be more detailed in your A answer:
          A) YES if the warming is due to Tmax increase they are expected to increase in frequency, otherwise if the warming is due to Tmin increase then they are expected to reduce in frequency.

          • Norman says:

            Massimo PORZIO

            The reason I answered YES for Dr. No’s question because it had the word “may” in it. The possibility of changing extremes “may” happen and it would be unscientific to say NO with this wording.

            If Dr. No had put the declarative “will” instead of “may” I would have had to answer “Not enough data to determine”

            Also his question did not stipulate any direction in frequency or intensity just a change in these variables.

          • Massimo PORZIO says:

            Yes, I agree.
            I just wrote that because Dr.No question was deceptive.

  67. Norman says:

    Dr. No

    What is really sad is that you claim to be a trained scientist and all you got from my link was a chance to spread your religion. You did not even consider the causes and underlying reasons for severe weather.

    You are concerned that hot records are now exceeding cold records. The book would actually help you to understand why this is if you choose to read any of it (which you did not and it is obviously you will not since you really are not the curious type and only want to read things that support your religion).

    If you read the material in the book I linked to, you would see that cold records and warm records are produced by very different processes.

    With cold records you need to have a mass of cold air move into your region. This will mean, even if the polar cold air is the same temperature each winter, the number of cold records will go down as you extend the time period of your collection. I don’t think you will be able to understand what I am saying but maybe someone else reading this will be able to grasp the concept.

    The point would be that if the cold air remains the same, it will eventually have contacted most regions and they will not get any colder the next time so no new records will occur.

    A heat wave does not require a hot mass of air to move into a colder area. It is a much different mechanism and is not as limited in record breaking ability as a cold record would be.

    If you read any of the book they describe how a heat wave forms and why the temperature goes up so much. It is caused by high pressure aloft. It can persist for a long time even years, it is not dependent upon an external air mass to generate it, the heat wave in a region is based upon the duration of the high pressure system aloft so you can continue to set high temperature records even if the globe stayed the same temperature because a region could have a longer duration high pressure and get hotter than a previous event.

    I really think discussing it with you is a total waste of time as I do not think you care enough to really try to understand the concepts I am stating. You will continue in your beliefs. Nothing will change you.

    • Dr No says:

      “I dont think you will be able to understand what I am saying but maybe someone else reading this will be able to grasp the concept.”
      Norman, let me try.
      You claim that:
      (A) New warm records than cold records are possible in a region due to the different mechanisms that apply
      (B) This can occur while the global average temperature remains unchanged.

      Think about it. You are suggesting that an abundance of new record maximum temperatures, not counteracted by any record low temperatures, will have no effect on global average temperature. That is illogical.

      Provide us with a simple set of numbers to illustrate this novel concept.

      • Norman says:

        Dr. No

        That is not exactly what I am getting at but I can show you some information to demonstrate that comparing record high and lows is not a very valid study to determine risk.

        Here is a graph of US temperatures.
        https://data.giss.nasa.gov/gistemp/graphs_v3/Fig.D.pdf

        I would like you to focus your attention to 1980. See where the temperatures were at for the US in 1980. Significantly cooler than the late 2000 decade.

        • Norman says:

          Dr. No

          Since you agree 1980 was much colder than 2011 I will demonstrate the point.

          https://tinyurl.com/lqs6wcz

          • Norman says:

            Dr. NO

            The link won’t go to a unique date page so you will have to use the tool yourself or trust what I post (I hope you check yourself)

            I used July 1980 and July 2016 to show how comparing low and high records does not indicate background temperatures.

            In July 1980 for the US, you had 8173 total high records (tied or broken) and 1204 cold temperature records. This gives you a ratio of 6.788 Highs to Lows.

            Move on to July 2016 and you have 1962 high records and 448 low records. This ratio is 4.379. You have a noticeably less ratio of hot to cold in July 2016 than in July 1980 even though the background temperature in 2016 shows it to be about `1.75 C vs 1980 of about 0.25 C. 2016 is listed as 1.5 C warmer than 1980 but the ration of High records to Low records is lower than 1980 ratio. This should convince you no clear correlation exists between record high and lows vs a background temperature.

          • Norman says:

            Dr. No

            A better study would be to see if record high numbers are increasing as US temperatures rise. I could do it but it is very time consuming and may not mean anything to you anyway. I might do it for my own benefit and learning.

            It takes a while for the graphs to develop for each monthly period and it takes time to log the data on an excel sheet. Maybe a NOAA programmer could compile the data available and see if record high temperature numbers increase with increasing background temperature (apples to apples)…comparing Highs to Lows is an apples to oranges process of comparing. It does not mean much. If you want to know if heat waves are getting worse you only would compare record highs to record highs from month to month over several years.

  68. Norman says:

    Dr. No

    Maybe if you posted some intelligent and knowledgeable information you might be of value to people who spend time on Dr. Spencer’s blog. Your childlike insults of me or Gordon Robertson do not demonstrate the “high knowledge” of climate science you are professing to contain.

    I have not really seen anything in your posts that would lead me to believe you are an actual climate scientist and understand the material.

    I can learn things from posters like David Appell or barry but I really have not been able to gain any new knowledge or information from your posts. If I want to learn grade school playground insult techniques then I would consider you a master and I could really learn some good ones. But when it comes to climate science I can’t see evidence that you studied anything more than reading main stream media views on the topic.

    • Dr No says:

      You can lead a horse to water but you cannot make him drink.
      Tell me which of my many linked articles have you read and understood.

  69. Norman says:

    Dr. No

    https://tinyurl.com/lkjxmtx

    This link shows the US (selected for July) percentage of hot areas vs cold areas. The coldest July on this list was 1950 with 0% warm area vs 62.64% of the US was very cold. Yet even in this very cold July with 3515 record low temperatures you still had 725 record high temperatures. This shows just how regional high temperatures can be, in spite of a super cold July some isolated regions still recorded record high temperatures.

  70. Hi there all, here every one is sharing these kinds of familiarity, so it’s good to read this website, and I
    used to go to see this website everyday.

Leave a Reply