
 Home/Blog
 In the debate arena, the public likes simple narratives. If the narrative supports their pre-conceived notions, they like it even better.
On technical issues which have major public policy impact, however, the nuances can be very important even if they are not easily explained or grasped.
The scientific nuances in the climate change realm are abundant: How much of recent warming has been natural? We aren’t sure. Will clouds respond to warming in ways that make it worse, or lessen it? We aren’t sure.
In the global warming (aka climate change) realm, there is a spectrum of beliefs among the public, as the following chart shows:
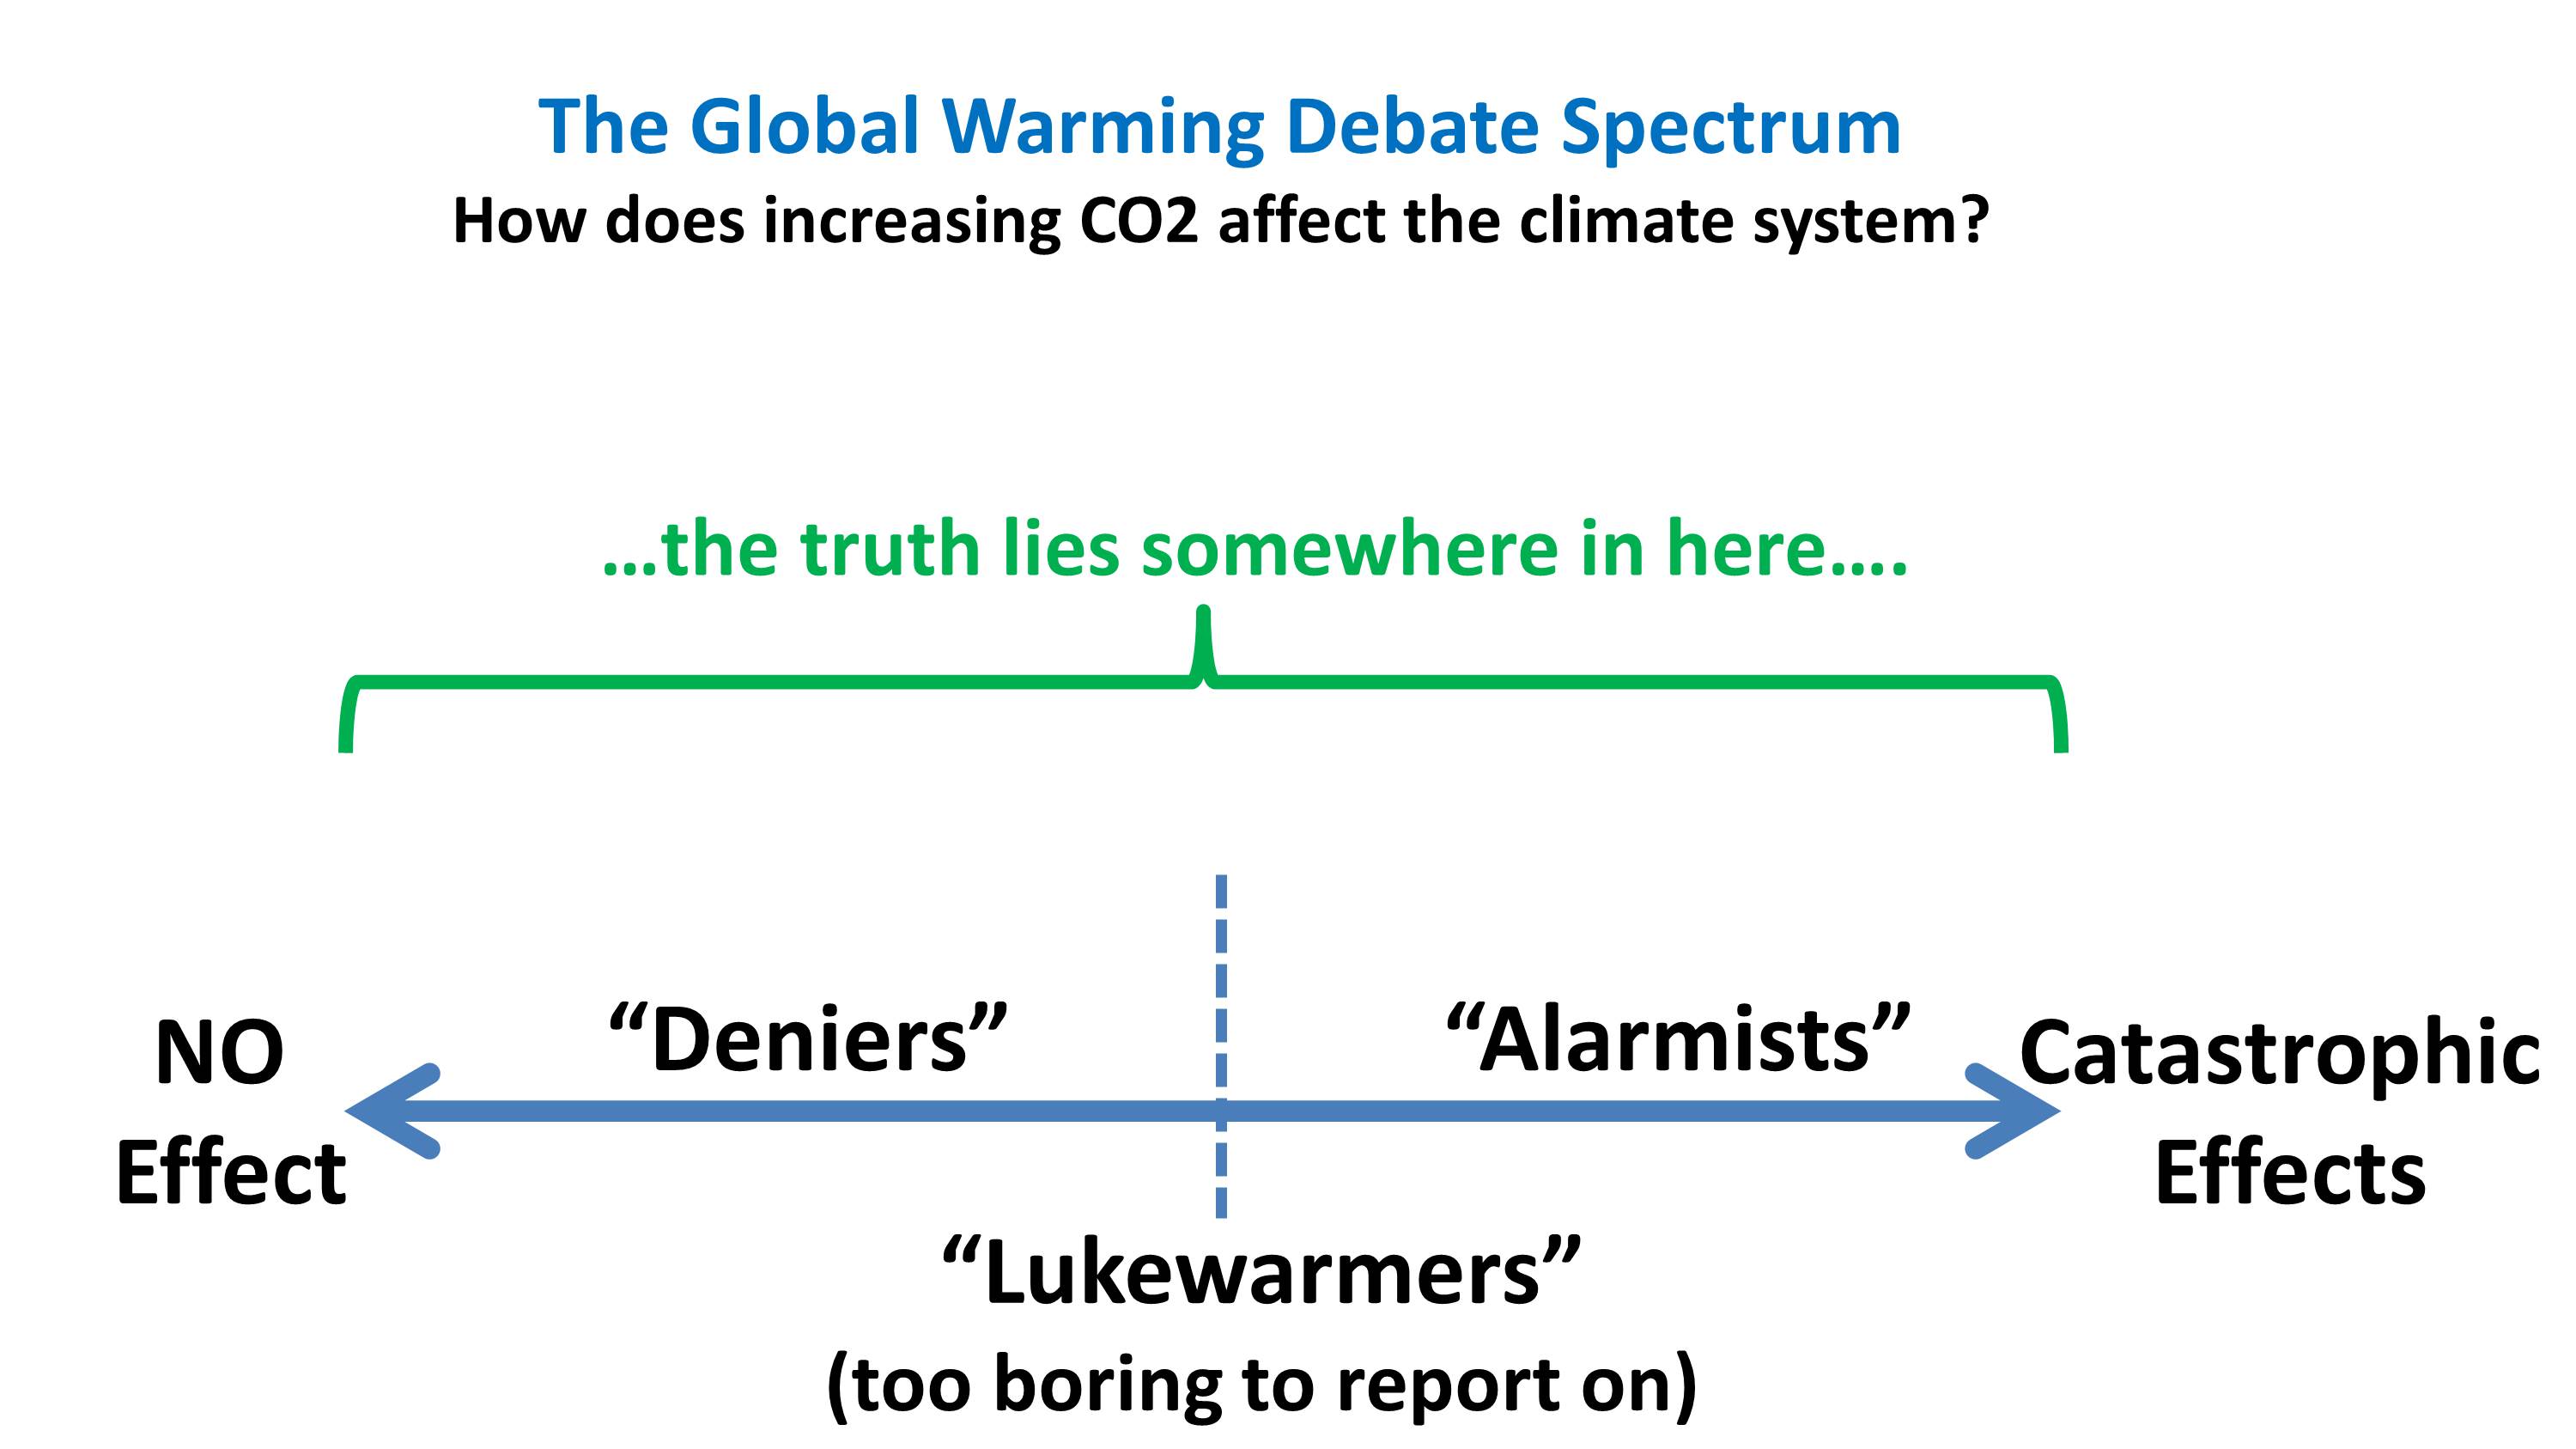
Those who tend to view issues in black-or-white terms, and who don’t want to be bothered with understanding the details of the global warming debate, tend to gravitate to one or the other extreme. Which one they choose depends upon their worldview, or even their view of the role of government in our lives.
I’ve heard from people representing the opposite ends of the spectrum over the last 25 years in emails, claiming either increasing carbon dioxide in the atmosphere simply cannot affect climate, or claiming that we have pushed the fragile climate system past a tipping point and unstoppable warming, more severe weather, rapidly rising sea levels, death, destruction, and mayhem, are the inevitable result of our burning of fossil fuels.
I find it more than a little ironic that Greenpeace was basically forced to admit its own extremism of message in their defense against a defamation lawsuit in Canada that their extremist statements really can’t be taken as factual, but more as hyperbole.
It should be obvious that the truth lies somewhere between the two extremes in the above chart. That is sort of a trivial statement, though, without much value because it is so unhelpful in the policy realm since it covers a wide range of potential outcomes.
Policy changes depend partly upon our confidence in our predictions. If we are certain that in exactly one year a large asteroid will hit Earth, there would be a legitimate global effort to come up with a scheme for averting disaster, no matter the cost. But if there is a relatively small chance of it happening in the next 100 years, there might be little or no effort.
Costs versus benefits must also be addressed, including the impact of forcing more expensive energy on the poor through either legislation or EPA regulations. If it was relatively painless to switch to renewable energy sources, sure, do it.
But it’s not. Ask the countries that have tried.
Also, global greening in recent decades indicates more CO2 isn’t necessarily a bad thing. Crop productivity continues upward, even without planting more acres. 2016 saw record yields in corn, soybeans, and wheat. I’ve been a consultant with corn market interests for the last 6 years, and climate change isn’t even on their radar screen… except indirectly, since the ethanol mandate was supposedly intended to reduce CO2 emissions. It didn’t.
We see in the global warming policy arena there has been a gradual loss of public interest in doing something about global warming. A lot has happened since NASA’s James Hansen sensationally testified in Congress that he was mostly sure that the 1988 heat wave and drought were at least somewhat the fault of humans influencing the climate system.
Despite the initial alarm, in the last 20 years Gallup polling has shown that climate change has remained at the bottom of the list of environmental concerns among Americans. Except for the most recent survey results, there has also been a long-term downward trend over that 20 year period in how serious the public views the threat of global warming.
Why has the public lost interest? The reasons are many.
For example, most of the world’s population experiences many tens of degrees of natural temperature variation, yet they are asked to fret over two degrees of warming on time scales so long almost no one would notice it in their lifetime. The observed rate of warming has been about half of that predicted by the average climate model, and the climate model average is what guides energy policy.
Furthermore, the models do not produce realistic natural climate variability without considerable fudging and tinkering to fit the observed temperature record. As a result, we really aren’t sure recent warming isn’t partly or even mostly natural in origin. (Our study of ocean warming since the 1950s suggests about 50% each).
Finally, like the rock musician who is embarrassed to admit he actually likes ABBA, we are hesitant to admit we love our fossil-fueled transportation. We like the convenience of flying in jets. And the smaller cars get, the more pickup trucks we buy. Leonardo DiCaprio loves his yacht, I’m sure.
The polarization of the debate has led to a simplification of the narratives: you are either a denier if you tend toward the no-impact end in the above chart, or an alarmist if you tend toward the dangerous impact end of the spectrum. Judith Curry has written a lot about the polarization of the debate in the years since the Climategate email release pushed her into the skeptic camp.
In the quarter century I have studied this issue, I dont think we are much closer to having an answer to just where the climate system will end up. Just about anything is theoretically possible. The science is much more difficult than putting a person on the Moon, which was basically just an engineering exercise involving man-against-gravity, and making sure he has air, food, and water for several days.
Nevertheless, a little-known hint of what direction the science might be going is the fact that the latest U.N. IPCC report (AR5), which historically tends toward the alarmist extreme (at least in its Summary for Policymakers) has lowered the lower limit of warming to about 1 deg. C for a doubling of atmospheric CO2. (How could this be, you ask, if weve already experienced about 1 deg. C of warming without CO2 doubling? Because there could be natural warming influences causing a substantial portion of observed warming.) Admittedly, they consider 1 deg. C to be extremely unlikely. If I had to choose a number, I’d go with about 1.5 deg. C, but they consider that unrealistically optimistic as well.
The fact that our satellite observations have shown less warming than the surface, rather than more warming as would be expected theoretically is another hint that the theory encapsulated in the models has a serious bias. The most obvious potential reason for this is that water vapor feedback is not as strong in reality as in the models, since those models with the strongest positive water vapor feedback also produce the strongest amplification of warming with height in the troposphere.
My opinion tends toward the little-impact end of the spectrum. I suspect that future warming will be slow and relatively benign (say, 1.5 deg. C by the end of this century), severe weather events won’t become demonstrably worse, and slow sea level rise will continue roughly as it has for centuries. People will adapt to whatever slow changes occur.
And renewable energy (or maybe safer nuclear energy) breakthroughs will come from the private sector and market forces, not from legislative fiat.
While climate science will continue to try to nail down just where we are in the spectrum of climate impacts, what we hear in the news media will continue to veer toward the ends of the spectrum, with exaggerated claims from opposing tribes, based upon fears and click-seeking more than on evidence. Heat waves, freezes, floods, droughts… these events make news, just as they have throughout recorded history. Average weather does not. We lukewarmers will continue to be lost in the noise.
I suspect we will not have much more scientific confidence ten years from now. A lot will depend on where global temperatures go from now on, because the science will just remain too uncertain until Mother Nature shows her hand.
Congressional hearings into climate issues, put on mostly for show, will continue to pit competing views against one another. As usual, the opposing views will largely cancel each other out, despite each of the tribes claiming victory.
And the wheels on the bus go round and round.


