The Version 6.0 global average lower tropospheric temperature (LT) anomaly for April, 2017 was +0.27 deg. C, up from the March, 2017 value of +0.19 deg. C (click for full size version):
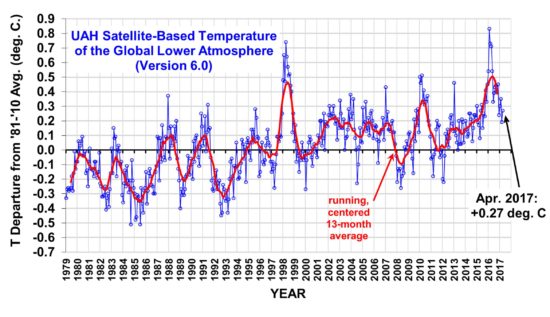
Global area-averaged lower tropospheric temperature anomalies (departures from 30-year calendar monthly means, 1981-2010). The 13-month centered average is meant to give an indication of the lower frequency variations in the data; the choice of 13 months is somewhat arbitrary… an odd number of months allows centered plotting on months with no time lag between the two plotted time series. The inclusion of two of the same calendar months on the ends of the 13 month averaging period causes no issues with interpretation because the seasonal temperature cycle has been removed as has the distinction between calendar months.
The global, hemispheric, and tropical LT anomalies from the 30-year (1981-2010) average for the last 16 months are:
YEAR MO GLOBE NHEM. SHEM. TROPICS
2016 01 +0.54 +0.69 +0.39 +0.84
2016 02 +0.83 +1.16 +0.50 +0.98
2016 03 +0.73 +0.94 +0.52 +1.08
2016 04 +0.71 +0.85 +0.58 +0.93
2016 05 +0.54 +0.64 +0.44 +0.71
2016 06 +0.33 +0.50 +0.17 +0.37
2016 07 +0.39 +0.48 +0.29 +0.47
2016 08 +0.43 +0.55 +0.31 +0.49
2016 09 +0.44 +0.49 +0.38 +0.37
2016 10 +0.40 +0.42 +0.39 +0.46
2016 11 +0.45 +0.40 +0.50 +0.37
2016 12 +0.24 +0.18 +0.30 +0.21
2017 01 +0.30 +0.26 +0.33 +0.07
2017 02 +0.35 +0.54 +0.15 +0.05
2017 03 +0.19 +0.30 +0.07 +0.03
2017 04 +0.27 +0.27 +0.26 +0.21
The UAH LT global anomaly image for April, 2017 should be available in the next few days here.
The new Version 6 files should also be updated soon, and are located here:
Lower Troposphere: http://vortex.nsstc.uah.edu/data/msu/v6.0/tlt/uahncdc_lt_6.0.txt
Mid-Troposphere: http://vortex.nsstc.uah.edu/data/msu/v6.0/tmt/uahncdc_mt_6.0.txt
Tropopause: http://vortex.nsstc.uah.edu/data/msu/v6.0/ttp/uahncdc_tp_6.0.txt
Lower Stratosphere: http://vortex.nsstc.uah.edu/data/msu/v6.0/tls/uahncdc_ls_6.0.txt
I once said that when IR is absorbed and re-emmitted from a GHG, that 1/6 is redirected toward the Earth and 5/6 is toward space. I was corrected because of the cone shape toward Earth traced out toward Earth is not 1/6. Out of the blue it came to my mind this morning that time is a factor. The shortest distance/time back to Earth is straight down, thus as we trace out the distance/time back to Earth as we move outward along that cone, I’m sure that would trace and arc opposite of the curvature of the Earth, whose volume within might represent the 1/6 I was talking about.
Alick,
It should be about half back towards Earth and half back up towards space, because the probability of re-emission at any discrete layer is (by and large) equal in any direction.
RW,
The distribution of emission would be a sphere over time. There are six basic directions in 3D space, 5 of which are toward space, or in other words, away from Earth’s surface because of the nature of Earth being a sphere.
IR is vector isn’t it? It has magnitude and direction. Thus it can be broken down into it’s unit vectors along the x,y,z axis. Wouldn’t the distribution pattern of a sphere just breakdown into the 1/6 toward Earth and 5/6 away from Earth?
You are assuming that the IR emitted by a CO2 molecule travels all the way to the ground. Most do not — they are reabsorbed before they get there.
The IR that strikes the ground will come from very low altitudes, i.e. half of it will strike the ground.
Only a detailed calculation, requiring a model, can solve this completely.
“The IR that strikes the ground will come from very low altitudes, i.e. half of it will strike the ground. ”
I would agree. But what is very low altitude?
One might think 500 meters is very low altitude. Or it could be 100 feet or less.
As I recall there was some study showing warming from “very low altitude” CO2 concentration. But I don’t have the link to it [or effectively lost in large numbers bookmarks I keep:).
I think there could warming from low altitude CO2 concentration, but I don’t regard this as related to greenhouse effect theory- or I don’t regard +5 km altitude as “very low altitude”, though someone could consider this is very low.
+gbaikie
At precisely 15 microns, the mean free path under today’s CO2 concentrations is just over 30 cm.
Applied physics uses the Poynting vector to calculate the net flux ax a single component through a surface. Good enough for industry and real world machines. By vector analysis all horizontal components of surface and atmospheric fluxes cancel leaving a reduced radiative coupling in the purely vertical.
On line center it is less than 10 meters.
4 of the 5 non-Earthward directions of the 6 perpendicular ones are not all that spaceward, but essentially horizontal. At the altitude of a typical GHG molecule, the horizon is not much below perpendicular to straight up. Have you seen what the horizon looks like from a jetliner at cruising altitude, which is higher than most of the mass of the atmosphere?
Even if it is such a small amount, they are spaceward. They will reach space or achieve a higher altitude upon collision with another object. What happens from there is anyones guess.
Now maybe other things like Earth’s magnetic field would nullify what I’m talking about. It would be interesting to know if Earth’s magnetic field could influence CO2 molecules orientation that could influence a distribution pattern in which they emit IR or absorb it.
Alick
I think you’re oversimplifying. Distance above the earth’s surface is critical. Concider a molecule of GHG at 2 feet elevation compared to 2000 feet. At 2 feet, the curvature of the earth would be irrelevant.
Snape, it looks as if someone oversimplified because KT and AER both have the net upward flux from the surface to be 68W/m-2 which is almost exact 1/6th of the in vaccuo radiosity.
Snape says:
“I think youre oversimplifying. Distance above the earths surface is critical. Concider a molecule of GHG at 2 feet elevation compared to 2000 feet.”
The emissions of the molecule at 2000′ is very unlikely to reach the surface.
So why are you acting like it is??
Slightly upward paths curve back towards the higher density, in the same way that hot air near the ground produced a mirage.
Again, most emitted IR does not go far enough to reach the surface. So talking about its path is nonsense….
On the contrary David, you are talking about opacity, not heat transfer. Over very short distances the temperature difference between emitters is near zero so the subtraction of intensities leaves nearly zero. Over long vertical paths in side bands relative intensity drives heat transfer and produces the small surface to atmospheric ‘net’ of around 17 to 40W/m-2. That’s what LBLRTM reveals.
Photons have energy.
Where they do, energy goes.
Period.
Easily provably incorrect by repeatable experiment.
Find a source of IR photons and optically condense the radiation onto a smaller area. The theoretical condensation of the energy you think is there, doesn’t heat the target beyond the temperature of the source. Which for a cold object remains cold at the target irrespective of the number of calculated photons carrying ‘energy’. It doesn’t matter how many optical paths (additional photons) you add to focus upon the target. ‘Theoretical’ photons do not add up in heating a warmer target.
Do the same with sunlight and you can heat a 300K environment. But you couldn’t heat a target already at 5880K.
If what you are suggesting is true we should all invest in a large terrahertz lens and power our lives with it from downwelling long wave!!!!!
Classic mistake. What the downwelling radiation does is compensate for some of the upwelling radiation. Net effect is to slow down how fast the surface cools.
Ask yourself why the temperature decrease at night when is is humid is slower than when it is not (MS vs AZ if you will)
‘Ask yourself why the temperature decrease at night when is is humid is slower than when it is not (MS vs AZ if you will)”
One reason could be related to humid air having condensed water droplets.
Warm air holds more H20 in form of a gas, and as air cools it is unable to have as much H2O as gas in the cooler air. When H2O gas become liquid it has latent heat. Or opposite of when liquid water evaporates it requires energy to become a gas.
So typical actual droplet visible has millions of molecules in it. A rain droplet.
“Water drops vary dramatically in size, so this starting number defines the calculation. The rest of it is a simple chemistry calculation. Let’s use the volume of a water drop that is used by the medical and scientific community. The accepted average volume of a drop of water is exactly 0.05 mL (20 drops per milliliter). It turns out there are over 1.5 sextillion molecules in a water drop and more than 5 sextillion atoms per droplet.”
https://www.thoughtco.com/atoms-in-a-drop-of-water-609425
And sextillion.
1.
a cardinal number represented in the U.S. by 1 followed by 21 zeros, and in Great Britain by 1 followed by 36 zeros.
I will assume US. And a drop of water must begin with a smaller number and a droplet with just 1 million molecules would be small. And at some point of when they get large enough they will more rapidly grow in size and then you get something like dew on the ground or mist in the air. But you have to have smaller droplets in the air before this.
And in addition to the latent heat, water has higher specific heat than air or H20 gas- or requires more energy per molecule mass to warm or cool down.
The so-called ‘plane parallel assumption’ is what’s operative here. I’m not following what you’re saying.
The Stefan-Boltzmann Law involves area. Clearly the projected area of the earth versus that of the cold outer space is a function of altitude from the standpoint of a greenhouse gas That goes further to explain that the upper atmosphere is cooler than the surface, along with the fact that greenhouse gases in the lower atmosphere have more warm neighbors.
Huh?
Alick: it will depend on altitude and wavelength. Altitude not just because of the angle to the ground, but because it also determines the density of air (and hence CO2). And wavelength, because CO2 does not absorb (or, hence, emit) all wavelengths equally. Some emitted IR will be reabsorbed within centimeters; some won’t.
This is one of the problems that climate models solve.
Two points David,
1, Altitude plays a rather large role because the temp of a body dictates its IR emission levels.
2, All my wine maker friends fill the empty space in the top of the wine barrels with CO2, they do this because the co2 sinks down to the surface of the wine and stops oxygen from reaching the surface. This stops the wine from going off.
The laws of physics that exist in the wine barrels exists in the atmosphere.
Re #1: that’s exactly what I said.
Re #2: utterly irrelevant to the discussion of the gaseous atmosphere or climate change. It’s well known that CO2 is a well-mixed gas in the atmosphere, as these data show:
http://davidappell.blogspot.com/2012/03/joe-bastardi-idiot-liar-or-both.html
It is debatable whether CO2 is well mixed at high altitudes, but it is certainly not well mixed at low altitude.
The IPCC take the position that CO2 is not a well mixed gas at low altitude and it is because of this, that they reject the Beck historical chemical analysis. You may recall that this historic data suggest that CO2 was over 400ppm in the 1940s.
I recall discussing this with Ferdinand Engelbeen, and he provided me with an example where CO2 levels, at low altitude, varied between about 300 ppm and about 650 ppm (ie, more than double) depending upon the conditions of wind, sun, temperature.
In one of your comments above, you argue “The IR that strikes the ground will come from very low altitudes, i.e. half of it will strike the ground.” but you fail to take account of the fact that CO2 is anything but a well mixed gas at low altitude.
This, of course, is one of the problems that models face and do not address well.
richard:
The data I cited prove you wrong.
Read it.
David, ‘utterly irrelevant’ is a totally appropriate phrase when discussing the effects of ‘back radiation’ upon surface temperature, irrespective of all notions about how short the mean free path is.
Listen, from altitude where water has precipitated out the total thermodynamic energy per unit mass is exactly the same as the surface layer. In the tropics the surface layer has slightly less energy than the tropospheric cold point (380K isentrope) due to horizontal fluxes poleward.
That is, within the bulk of the atmosphere there is no evidence of increased thermal energy in the surface layer or at the surface itself, due to ‘heat trapping’ of the gases people obsess about.
Pyrgeometers measure radiative potential not heat transfer. Back to back units give net surface losses as true sensible fluxes which in a long term sustained gradient do not come back but are transferred to space and are rendered products due to the fact that the efficacy of this heat transfer process does not modify the gradient.
David
Naturally, I read the reference before responding, but it does not deal with the issue that I raise.
At high altitude (circa the height at which Mauna Loa samples are drawn), CO2 varies between about 385 to 415 ppm, ie., approx 400 ppm +/- 3.5% Now it is debatable whether that range constitutes well mixed. My personal view is that for practical purposes CO2 is sufficiently well mixed at high altitude.
However, at low altitude, ie., below say 1,000 feet, it is a very different story. As I noted, this is the reason that the IPCC reject the Beck historical chemical analysis study, and instead favour ice cores. It is not that there is any problem with equipment or laboratory standards used in the many chemical analyses, merely that the samples are said to be unrepresentative because CO2 fluctuates so widely at low altitudes and at which height the samples were drawn
I would suggest that you look at the Beck study, and also consider why the IPCC rejected the study. It is illuminating.
Just to give you one example, see:
http://www.ferdinand-engelbeen.be/klimaat/klim_img/diekirch_diurnal.jpg
So for example, on 14th July 2005 (at Giessen Germany), CO2 varied between 380ppm and 480ppm. Such a variation is anything but well mixed. As I say, I have ssen data where the variance is more than 100%.
The observations still show you are wrong.
Time to give it up.
richard, in what peer reviewed journal was your study published?
richard verney says:
“So for example, on 14th July 2005 (at Giessen Germany), CO2 varied between 380ppm and 480ppm. Such a variation is anything but well mixed. As I say, I have ssen data where the variance is more than 100%.”
One dumb little stupid day?
Is that really all you got, Richard??
Stop wasting my time.
Roy,
It is a darn shame that you can’t call in “Pest Control” to get rid of annoying twerps such as David Appell.
David has his own blog called “Quark Soup” to promote his weird views but it attracts little attention which explains why he has so much time to make a nuisance of himself here
Alick: You are assuming that any emitted IR has a clear, uninterrupted path to the surface.
But you haven’t proved this assumption, in any way. (It is, in fact, not true.)
And herein lies one of the problems. Once a molecule of CO2 has absorbed a photon, and then re-radiates it in a downward direction, how does the photon get back to the surface?
CO2 is only a trace gas, and that means that there are very few molecules of CO2 near to one another. In fact in a vertical direction, CO2 is probably separated by about 13 molecules of other non radiating gases.
This means that when a molecule of CO2 re-radiates a photon in a downward direction, the photon probably will not be absorbed by another molecule of CO2, that could theoretically re-radiate the photon once more in a downward direction, but instead the photon will be absorbed by a molecule of Nitrogen or Oxygen and thereby end its downward travel.
Richard:
Learn to calculate.
You are arguing science by waving your hands. That’s always a bad and dumb move.
Calculate!
richard verney says:
“CO2 is only a trace gas, and that means that there are very few molecules of CO2 near to one another.”
Calculate dude. Calculate.
If you are scientifically capable…. (Are you??)
Your approximation could be improved and it might help you to think about not only 6 directions, but the 26 directions defined by non-null vectors {[-1..1 -1..1 -1..1]}. Using a randomly oriented base, 13 of those vectors point towards the Earth unless the distance from the ground is large (say > 100 km), in which case still more than 1/6 of the 26 vectors point towards the Earth. If you go beyond the Moon, then less than 1/6 of the vectors points toward the Earth.
Q: What’s a non-null vector?
A: Go out to play football.
Test
Test
Testing 123
In the troposphere strictly apply hydrostatic equilibrium. This applies to atmospheres up to a pressure of less than 100 hPa.
http://ds.data.jma.go.jp/tcc/tcc/products/clisys/STRAT/gif/zt_sh.gif
You can see how the cold troposphere shrinks over the south pole.
Time-height cross section of zonal mean temperature averaged over 60S – 90S (top) and time-series representation of vertical components of E-P flux averaged over 30S – 90S at the 100-hPa level (bottom).
http://ds.data.jma.go.jp/tcc/tcc/products/clisys/STRAT/gif/jikei_tep_sh.gif
The above graphic also shows that practically in winter the boundary between the troposphere and the stratosphere over the polar circle disappears.
Temperature jumps in the stratosphere in winter in the northern hemisphere.
http://ds.data.jma.go.jp/tcc/tcc/products/clisys/STRAT/gif/pole30_nh.gif
Time-height cross section of zonal mean temperature averaged over 60N – 90N (top) and time-series representation of vertical components of E-P flux averaged over 30N – 90N at the 100-hPa level (bottom).
http://ds.data.jma.go.jp/tcc/tcc/products/clisys/STRAT/gif/jikei_tep_nh.gif
Please stop with the irrelevant picayune links, ren — you are just clogging up the comments.
Davie, it might be that you are the one clogging up the comments.
As solar conditions weaken the upshot is going to be for the albedo of the earth to increase, while surface sea surface temperatures cool.
Albedo will increase due to an increase in global cloud coverage, global snow coverage , an increase in major volcanic activity, a greater meridional atmospheric circulation pattern.
This in response to very low solar conditions compounded by the weakening geo magnetic field.
The test is now on as low solar is now in play versus increasing co2. Which way global temperatures go from this point on should shed light as to which side is correct.
“Global cooling has started, and it will be here for sometime to come. All the factors that control the climate are now in, or going toward a colder phase.”
– Salvatore del Prete, December 31, 2010
http://www.drroyspencer.com/2010/12/dessler-and-spencer-debate-cloud-feedback/#comment-8257
The best I can tell, it is cooler now than it was in 2010.
Further, the AGW predictions are a bit off. Where is that hockey stick David?
Lewis, is that really your “best?”
Do you ever look at the data, Lewis?
average UAH LT v6.0 temperature for 2010 = +0.33 C
average UAH LT v6.0 temperature for 2016 = +0.50 C
And, of course, none of this says anything the long-term trend, which is what is important for AGW….
Nice cherry picking there Davie.
But, that’s what you do best.
Why didn’t you start your “trend” from same time last year?
0.71 vs. 0.27.
Answer: It’s not about science, it’s about agenda.
@g*e*r*a*n:
David didn’t cherry pick, he responded to Lewis’ comment about 2010 being hotter than now. 2010 was objectively cooler than 2016. Not that difficult to parse…
Nope.
Lewis used the word “now”, not “2016”.
Now is weather.
2010 is weather.
None of that above makes any difference.
No response, Lewis?
Can’t back up your claim?
THen withdraw it.
Why is now weather, and a year weather, and not 10 years, or fifty, according to Nasa climate is a 30 year average. If we use that, they we have very little warming. https://www.nasa.gov/mission_pages/noaa-n/climate/climate_weather.html If we took the 30 year average in the graph above it would be flat. How accurate are temperatures before 50 years ago. And before that. When you see climate temperatures over thousands of years, It should be a 30 year average. But why is it 30 and not 50? Who knows. Scientist say man has only played a factor in global warming since the 1960’s well if we do a running average of the data over 30 years, the global tempertures haven’t increased much since the 1960, considering is only 57 years ago, that basically only two samples of data. This is why climate vs weather debate doesn’t make much since, because even the current warming is still technically weather.
If you plot the 30 year average of this data, it looks like this:
http://www.woodfortrees.org/plot/uah6/mean:360
Most distinctly not flat.
Look at the scale, looks basically flat, only a 10th of a degree. and again it’s there isn’t enough data to accurately see change over a “climate” period. That’s the whole point we don’t have enough accurate data.
Salvatore, I’m curious — how do you know there will be an increase in “major volcanic activity?”
What is this conclusion based on?
David, you’re paying such close attention to Salvatore, you should go back and read where he talks about volcanos.
Why can’t Salvatore simply answer his question?
I’d like to know what the answer is, but I’m not in the mood for a research project.
Lewis: what did Salvatore once write about major volcanic eruptions?
You can provide a link, I’m sure….
THanks.
Funny how Lewis can never respond to questions…when his claims get shot down in an instant.
Salvatore Del Prete says:
May 1, 2017 at 7:33 AM
As solar conditions weaken the upshot is going to be for the albedo of the earth to increase…
Albedo increase? Certainly not in the Arctic! The sea ice extent is on the decline there since years due to high surface temperatures, and even the troposphere is warming above.
Look at UAH’s 2.5 deg grid data, average the 9,504 grid cell anomalies for 2016, and you will see that the 600 highest anomalies all are located in latitudes between 60N and 82.5N.
+1
I always have trouble with this. The December as usually was cloudy here, meaning the ground was wet, low albedo. But, there is no DWSW to use that. The clouds, looking from space, have a high albedo, but the incidence angle is low, so they have little effect.
Albedo has an effect at low and mid-latitudes, but in the Arctic, it works in a limited manner.
What comes to Salvatore, I’m not sure there’s any common ground to have exchange at.
I see UAH6 is still not being plotted correctly in WoodForTrees. This capability was added to WFT back in August 2016 but now seems stuck with data only through October 2016.
Did the UAH6 data sets change at that time? Is there a way to pass on the correct data sets to Paul?
the paths to the files might have changed, but the formats shouldn’t have…it would be an easy fix for him.
In my experience you can’t trust Wood for Trees — they often do not use the latest versions of the data.
Everybody may switch to e.g.
http://www.ysbl.york.ac.uk/~cowtan/applets/trend/trend.html
There you obtain the stuff with 2 sigma CIs.
But Kevin doesn’t provide for superposition of plots in charts for comparison, that is so nice at WFT or in Excel (I don#t like GNUplot very much).
Bin, if you “massage” the data enough, you may be able to find some hint of AGW.
I prefer to download the new data every month and do my own calculations.
That way I’m sure of the data and the math.
“and the math”
ROFLMAO !!!
High farce, for sure.!
The UAHv6 link being used at WFT goes to the beta6.5 data, which no longer updates. People notify Paul but he only updates occasionally. I emailed him the correct link a while back.
Thanks for the report, Roy.
Looks like a couple of months of ENSO neutrality has allowed the atmosphere to stabilize around the 0.20-25 range following the brief La Nia. Should remain stable for several more months of ENSO neutrality which could change depending on rate of El Nio development.
Such a circulation in the lower stratosphere will cause great cooling in northern and central Europe.
https://earth.nullschool.net/#2017/05/06/0000Z/wind/isobaric/70hPa/orthographic=-348.21,59.03,684
And in the east of the USA.
https://earth.nullschool.net/#2017/05/06/0000Z/wind/isobaric/70hPa/orthographic=-108.14,50.26,684
https://earth.nullschool.net/#2017/05/06/0000Z/wind/isobaric/1000hPa/overlay=temp/orthographic=-82.22,45.12,684
On 5 May in California, thunderstorms will occur.
https://earth.nullschool.net/#2017/05/05/0000Z/wind/isobaric/850hPa/overlay=temp/orthographic=-120.89,42.02,1572
Please see the jet stream forecast on May 6.
https://earth.nullschool.net/#2017/05/06/0600Z/wind/isobaric/250hPa/orthographic=-103.16,45.04,1191
I am not a scientist, but I do have some experience with the practical aspects of Thermodynamics and heat transfer along with data analysis as it pertains to process control. I notice two important trends. One is that the temperature trend is upward — not nearly as much as the CMIP5 models, but up nonetheless. It very much seems more like a step change in the late 1900s rather than a steady progression. Is this possible, or just a result of the random nature of the data due to various competing forcings both positive and negative?
The other observation I have is that the 13 month running average is almost never flat except when at the top or bottom a transition. Is this possibly due to the very strong effect of the swings in the ENSO?
Thanks to anyone who can answer.
Tim
If we had seen step-ups after the last 4 or 5 strong El Nino’s, then I would predict we’d get one now. In reality, our records are too short, so the step-up you notice after 1998 shouldn’t, by itself, be considered a pattern, and therefore not a predictor. Just my opinion.
Another term for “step-ups” is “global warming.”
DavidA
I agree the “step-ups” we’re talking about are the result of global warming. My point was that global warming doesn’t necessarily have to appear in steps.
I agree with you, Snape. THanks for clarifying.
I don’t really think “step-ups” is the appropriate term. Roughly speaking, what we are seeing is similar to a sinusoidal model of temperatures superimposed upon an increasing trend, eg. the graph of y=x+sinx. The fluctuating cycle seems to correspond quite closely with positive and negative phases of the PDO.
Bob says:
May 2, 2017 at 2:38 AM
The fluctuating cycle seems to correspond quite closely with positive and negative phases of the PDO.
Really? I’m not quite sure…
http://fs5.directupload.net/images/170502/dt44vih6.jpg
And if the steps occurred three times as often with three times the magnitude, the CMIP5 models might represent reality. But they don’t, so the models don’t either. 🙂
But as far as AGW is concerned, it should be noted that step changes in temperature are not consistent with CO2 driving temperature, since CO2 is not increasing in steps. Step changes in temperatures suggest some process other than CO2 being involved.
The step changes, sirs, are figments of your imagination. You can only call them steps if you have a physical explanation, like qualitative ocean circulation change, that happened at the time.
I’m not saying such changes did not happen, but you can’t detect them by just looking at the centered 13-month line.
richard verney says:
“But as far as AGW is concerned, it should be noted that step changes in temperature are not consistent with CO2 driving temperature, since CO2 is not increasing in steps.”
Oh, please. There are many factors that influence temperature, not just CO2.
Long-term trends are what matter.
But, CO2 emissions *are* the prime variable we have control over.
Tim – In the engineering physics of transient heat transfer, a step change in temperature is not physically possible. They are prevented by the effective thermal capacitance. Any perceived step change is therefore an artifact of measurement.
Dan
Please explain what you mean by “artifact of measurement”?
Dan
Maybe you’re talking about how it’s not possible to jump straight up or down from one temperature to the next? Therefore, when it comes to changes in temperature, a perfectly vertical “step-up” (90 deg. angle) is not possible?
If this is what you mean, I should point out that steps don’t have to be at 90 deg. angles! (flat,diagonal,flat,diagonal,flat….etc.)
Snape – I think you might grasp the concept but even a step change in forcing (such as turning on the burner under a tea kettle) results in a 1-e^(-kt) shaped transient for temperature.
The time constant (time to reach 63.21% of the final temperature change after a step change in forcing) for the planet is about 5 years. If you only looked at the beginning and end of the transient it would look like a step. But step changes in a year or less for the planet are not possible.
Dan
“If you only looked at the beginning and end of the transient it would look like a step.”
So if you also looked at the middle of the transient, why would it no longer look like a step?
Snape – Of course looking at the beginning and ‘half way’ would look like a step. But the second ‘half’ of the transient would follow the step. The second ‘half’ can not be flat.
Do you not understand what is meant by ‘time constant’ in thermal analysis? It would take about 11.5 yr to get 90% of the temperature change from a step change in forcing.
If you measured the temperature at regular time intervals you could graph them and see the shape of the transient.
Dan
I guess I don’t understand what you’re saying.
You wrote, “Tim In the engineering physics of transient heat transfer, a step change in temperature is not physically possible. They are prevented by the effective thermal capacitance. Any perceived step change is therefore an artifact of measurement.”
My understanding is that If temperatures start off relatively stable, rise steeply during an El Nino , and then stabilize again at the higher temperature, we would see a “step-up” on a graph (similar to what is observed around 1997/1998).
How is this step-up not possible except as an artifact of measurement?
Snape – “If temperatures start off relatively stable, rise steeply during an El Nino , and then stabilize again at the higher temperature, we would see a step-up on a graph” is not physically possible because of the high effective thermal capacitance as corroborated by the time constant.
Apparently transient heat transfer analysis is not your strong suit.
What is “transient” about it?
Dav – ‘transient’ heat transfer analysis means to calculate the temperature as a function of time such as the rising temperature of a teapot after you turn the burner on. This is different from ‘steady state’ heat transfer analysis which only calculates the final temperature after it stops changing.
In what way is climate heating transient?
Dav – The net forcing (causing climate heating/cooling) is essentially always changing. Average global temperature depends on variations of OLR modulated by water vapor and clouds (which appear to be influenced by SSN) and incoming radiation modulated by clouds, solar variations (multiple cycles including the approx. 11 year cycles) and is therefore essentially always in transient.
Step changes as fully instantious change don’t exist, but we’re not talking about that.
step-like behavior can be the result of a linear trend superimposed on a low frequency cycle. http://www.drroyspencer.com/2013/11/the-magical-mystery-climate-index-luis-salas-nails-it/
Roy
Thanks for the interesting link. Makes sense.
And the PDO “cycle” explains the “pause” and the subsequent exit from the pause pretty well.
I can see two distinct step-ups there, and three pauses.
I can see spaghetti, but science is not about just seeing but quantifying things in a precice manner.
Like, you calculate a trend line, you don’t draw it just as how you see it.
TimS. A bit out of my former area of research, but there are ocean circulation patterns that can store and release heat after a lag. One is the ~4 yr El Nino or ENSO, another is the multi-decadal PDO. The two are clearly linked with warm El Nino events dominating cool La Nina events during a positive PDO and visa versa. I think the PDO stores heat then a step ups in global temp occur when PDO flips back to a positive phase. So the flat trend in global temperature during the 50s to 70s was a negative PDO. The warming trend was partially stored heat from the past. This current hiatus in warming is also a mostly negative PDO phase. I am excited to see if the PDO just flipped back to positive and if so if the temp will jump. I evaluate the PDO index at a 5yr running average.
That was my point.
TimS.
Sorry to state the obvious then. One other hypothesis i am excited to have tested is when the PDO does flip back to positive phase- I am curious if the deep ocean heat added to the G..I..S…S and H.A.D.C.R.U.T 4 data will break down. Sort of like robbing Peter to pay Paul does not right a wrong. In a complex zero sum game of oscillating currents, scientists adding heat to the surface temperature from deeper in one phase might prove to be a real problem in the counter phase. This is why with every manipulation of the thermometer methods it is really back to uncalibrated estimate to test the new hypothesis. It is also why Dr. John Bates whistle blowing that this most recent set of manipulation should have been a new version and included “Karl’s thumb on the scale, pushing for, and often insisting on, decisions that maximize warming and minimize documentation” becomes very interesting. Only time will tell.
The PDO doesn’t add heat to the Earth system, it just shuffles some around. (And not that much, really, compared to changes in ocean heat content.)
Dave, I agree that the PDO is one of many ocean circulation patterns that redistribute heat in space and time (a lag) and none create significant heat. AMO, ENSO, Thermohaline etc all contribute as well as the antarctic one that was credited for storing heat and preventing predicted warming there in a Nature paper. The PDO and tropical Pacific are a large source of Earths total warmth because the low latitude and high annual insolation. What data are you using to for ocean heat content to compare? I ask because i dont see it in A.R.G.O. and dont buy the pre instrumental guestimates.
Global Ocean Heat Content:
http://tinyurl.com/jbf2xco
Apparently links to noaa-dot-gov aren’t allowed to be posted here.
How stupid is that, for a science blog?
Dave 100% agree that it is difficult to communicate and discuss.
I posted this comment near the end of the last thread, so I thought I’d repost it here:
TLT and surface models are measuring different things (virtually no overlap), so why would we expect them to show the same rates of warming? In other words, maybe both datasets are accurate, even though they produce different results.
According to Nick Stokes:
..The reason is that satellites really cant measure near the surface, because that is itself a big emitter of microwave radiation, which is just noise to this signal. In fact the definition of TLT has been creeping up. UAH V5.6 claimed a peak weight at 2km, but V6 has settled for 4, as does RSS TTT V4. And you may note that John Christy nowadays rarely mentions TLT, but usually TMT. NOAA produces a TMT measure, but not TLT.
Satellites really have very little ability to discriminate levels. They just have one signal beam coming in, with different channels, and they rely on differential weighting of this channels. Very little depth resolution.
“…so why would we expect them to show the same rates of warming?”
We don’t. But, according to the AGW hypothesis, we should be seeing the troposphere warming faster than the surface.
Why do you think the troposphere should warm faster than the surface?
Because the inventors of the AWG hypothesis said so that’s why.
Every theory needs to be able to be tested……falsified, the LTL (8K’s up approx.) should warm at three times the rate of the surface if it does not then AGW theory is along way down the road of falsification.
I’m sure you mean UPPER troposphere. Would you please link to an IPCC projection that the upper troposphere would warm faster than the lower troposphere at ALL latitudes.
Its called the missing hotspot Bob you may have heard of it. Google will give you pages of links.
Cheers
Bob
We’re talking about the lower troposphere (near surface compared to vast area above).
crakar24 says:
May 2, 2017 at 12:27 AM & May 2, 2017 at 4:05 AM
Well I’m not a fan of SKS, but… having a tough look at
https://www.skepticalscience.com/tropospheric-hot-spot-advanced.htm
is really helpful.
Bin admits “Well Im not a fan of SKS…”
Bin, you should have left it at that.
The painful part there is the consistent tendency of the site. If they really wanted to create a useful site, then Cook should have allowed more room for uncertainty and differing opinion. There is always differing opinion, pet theories, conjectures and such in science. Cook tried to create a consensus even where it doesn’t exist and then ridicules people who dare to object. That makes the site stink. It turns me off and makes me feel facts don’t matter in the church of Cook.
But, if you want to know how the climatariat explains the inconsistency between theory of socialism and real socialism, them Cook’s your restaurant.
The ‘hotpspot’ is an expectation that enhanced warming occurs in the tropical mid-troposphere if the atmosphere warms. It’s not a function of any particular cause of warming. A lack of enhanced warming doesn’t say anything about ‘greenhouse’ warming, but it would mean that modeling of heat transfer through the atmosphere is wrong.
The jury appears to be out on whether the hotspot has been observed, as getting good data for that part of the atmosphere is problematic. It’s an active area of research.
“Its not a function of any particular cause of warming.”
Yes, it is. The heat aggregates at the point where the outward energy flux is most significantly impeded. Not every warming impetus results in a tropospheric hot spot, but hypothesized “greenhouse” warming from CO2 does result in a tropospheric hot spot. If the hot spot is not there, then the warming is not from CO2.
“…but it would mean that modeling of heat transfer through the atmosphere is wrong.”
A.K.A., the hypothesis of CO2 induced global warming is wrong. I.e., it is at best incomplete, and it does not provide a sound basis upon which to formulate public policy, allocating trillions of dollars to futile efforts at mitigation, diverting resources from beneficial pursuits, and consigning millions particularly in the Third World to energy poverty and earlier death.
“Its an active area of research.”
That’s just playing for time. If the hot spot were there consistent with the AGW hypothesis, it would not be playing hide and seek. It would be unambiguous and readily observable.
Explain why the stratosphere is cooling — a prediction of aGHG theory.
BTW, RSS shows a hotspot, UAH doesn’t. Conclusion: we need better data.
“Explain why the stratosphere is cooling a prediction of aGHG theory.”
Post hoc ergo propter hoc is the fallacy you are looking for here. It is not a unique prediction of the aGHG hypothesis.
RSS shows no more a hot spot than UAH. They are virtually identical.
Bart says:
“Post hoc ergo propter hoc is the fallacy you are looking for here. It is not a unique prediction of the aGHG hypothesis.”
What other warming hypotheses predict stratospheric cooling?
Bart says:
“RSS shows no more a hot spot than UAH. They are virtually identical.”
Prove this.
You can’t. You’re allergic to data.
Bart, hotspot isn’t a GHG function. It’s a function of changes in the moist adiabat if the atmosphere warms.
Or as Roy Spencer puts it:
Thus, the lack of a hot spot is evidence for a lack of water vapor feedback. I believe this is the physically proper way of looking at the issue.
Ross McKitrick:
“…it is true that amplification would be observed in response also to increased solar forcing…”
John Christy:
“it [the hot spot] is broader than just the enhanced greenhouse effect because any thermal forcing should elicit a response such as the ‘expected’ hot spot.”
The ‘hotspot’ issue (a term coined by skeptics) came from someone misreading this graph years ago:
http://tinyurl.com/k5bkcj8
Panel (c) shows enhanced warming in the tropical troposphere from GHGs. It has the highest amount of amplified warming for that region. Does this mean that the ‘hotspot’ is a signature purely of GHG warming?
No.
The panels represent observations of various forcings, all except for which CO2, for the period assessed, have minimal warming/cooling influence.
Eg, panel a) is solar forcing, which is assessed to have had a relatively small warming influence on the surface. Thus, the warming estimated in the ‘hotspot’ region is also comparatively smaller. But it’s there. Warming at the surface is amplified in the tropical troposphere due to solar forcing.
For any of the significant forcing panel over the period assessed, there is an amplified response in the tropical troposphere (whether cooling or warming). Thus, the IPCC, like McKitrick, Christy and Spencer, see enhanced warming (or cooling) of the tropical troposphere as a result of changes in the temperature of the whole atmosphere (or, more commonly put, changes at the surface).
The 6 panels represent these forcings:
a) solar forcing, (b) volcanoes, (c) greenhouse gases, (d) ozone, (e) sulfate aerosols and (f) sum of all forcing
Amplified changes in the tropical troposphere are supposed to occur as a result of changes in surface/atmospheric temps from any cause, due to water vapour amplification. As John Christy, Ross McKitrick and Roy Spencer (all skeptics) attest.
The skeptical blogosphere has always gotten this wrong (except this blog).
http://www.ipcc.ch/publications_and_data/ar4/wg1/en/figure-9-1.html
“Amplified changes in the tropical troposphere are supposed to occur as a result of changes in surface/atmospheric temps from any cause, due to water vapour amplification.”
Then the cause would be water vapor amplification. But, the troposphere isn’t warming. So, what does that tell you about the hypothesis of water vapor amplification?
That’s two strikes:
A) AGW should cause a tropospheric hot spot
B) Water vapor amplification should amplify the tropospheric hot spot
Yet, there is no tropospheric warming. This is the point at which non-pathological science would focus on reconsidering the hypotheses before stepping back up to the plate.
The hypothesis in doubt is of heat transfer in the atmosphere – water vapour amplification. Not GHG warming.
I already linked to that graph (in my last post – look above) and explained it. Skeptics misunderstood it, and the whole hotspot = GHG misconception is based on that misunderstanding.
Roy Spencer, John Christy and Ross McKitrick get it. Skeptic blog ‘scientists’ don’t.
“The hypothesis in doubt is of heat transfer in the atmosphere water vapour amplification. Not GHG warming.”
Au contraire. It really does not matter if, as you erroneously insist, any warming leads to a tropospheric hot spot. There simply is no significant net tropospheric warming in evidence for the past 20 or so years.
Ergo, by your claim, there is no warming, period. Yet, you insist there is surface warming. So, it appears your argument is self-refuting.
It really does not matter if, as you erroneously insist, any warming leads to a tropospheric hot spot
The rest of your post deviates from the point.
I do not insist. I am quoting experts (who are also skeptics), which you are ignoring.
When skeptic experts agree with their opponents, and the alternative view is unsubstantiated, then only the ideologically stubborn would go with unsubstantiated malarkey I’n arguing that the ‘hotspot’ is is or isn’t there in observations. why change the subject? I think the jury is still out (skeptics appear to have no skepticism on that point).
There are several hyptohesised ‘fingerprints’ for greenhouse warming. The hotspot isn’t one of them. Just ask Roy Spencer or John Christy – the expert opinion your are ignoring in favour of who knows what.
“In arguing that the hotspot is is or isnt there”
Typos = Im notarguing that the hotspot is is or isnt there – I’m correcting the misapprehension that it is supposed to be a function purely of GHG warming.
As our host understands.
Well predating the term ‘hotspot’ are model experiments underlying the expectation that the tropical troposphere should more than the surface regardless of the cause of warming.
1997 paper:
In the troposphere, the vertical structure of the temperature
response to solar variability (Fig. 5) resembles the one obtained by the greenhouse gas increase experiment, i.e., a general warming with a maximum in the upper tropical troposphere
That’s very clear. And here is the Fig 5 graph comparing zonal response in the atmosphere from a) solar-forced warming and b) GHG-forced warming.
Solar vs GHG forcing
Solar forcing is based on sunspot count for the period 1889-1995, and GHG forcing is for the same period.
Here’s a graph on sunspot count for that period, in 11-year averages in order to see the signal beneath the 11-year solar cycle.
Thus, for the period with solar-forced warming, models expect enhanced warming of the mid-troposphere (hotspot).
Whether or not this has been observed is an interesting but different question. I just want to set the record straight on causes of the hotspot.
“Im correcting the misapprehension that it is supposed to be a function purely of GHG warming.”
You have misapprehended, and corrupted the syllogism. My syllogism is:
AGW produces a tropospheric hotspot.
There is no tropospheric hotspot.
Therefore, there is no AGW.
That is a valid syllogism. You are arguing:
AGW produces a tropospheric hotspot.
All warming produces a tropospheric hotspot.
Therefore, one cannot tell if there is or is not AGW merely on the basis of there being a tropospheric hotspot.
That is not actually valid, because the minor premise is wrong – not all warming mechanisms produce a tropospheric hotspot. But, even if the minor premise were true, it is beside the point. What we have observed is an absence of a tropospheric hotspot.
You are arguing ad verecundiam that your minor premise is true. I claim it is not. But, in the end, it does not matter. The question is moot, because there is no tropospheric hotspot.
Note well that, when I say there is no tropospheric hotspot, I am speaking in terms of an anomalous hotspot. There is no significant increased warming of the troposphere in the past two decades, at a time when CO2 concentration increased by about 50 ppmv, which is fully 40% of the rise above the purported pre-industrial level.
AGW demands that the troposphere should have heated in response. It has not. Therefore, the AGW hypothesis is wrong, in whole or in part, and projections made on the basis of that hypothesis have no basis at all in observable fact.
Your syllogism has two false premises.
1) The hotspot is not a function purely of CO2. It is also expected from solar warming, for example. Or from any cause that warms the surface.
Thus, the lack of a hotspot does not mean AGW isn’t valid. It means that the expectation that warming at the surface should be amplified in the tropical troposphere is invalid. AGW may still cause surface warming, but not cause a hotspot (same with any other cause of warming).
The mistaken assumption is that the hotspot is a unique signature of GHG warming.
2) The jury is out on whether the hotpot is there. Different data sources and methods give different answers.
A true skeptic acknowledges this and doesn’t barrack for a preferred conclusion.
“Explain why the stratosphere is cooling a prediction of aGHG theory.”
Post hoc ergo propter hoc is the fallacy you are looking for here. It is not a unique prediction of the aGHG hypothesis.
Post hoc? The prediction is 50 years old.
http://journals.ametsoc.org/doi/pdf/10.1175/1520-0469%281967%29024%3C0241%3ATEOTAW%3E2.0.CO%3B2
“AGW may still cause surface warming, but not cause a hotspot.”
No. AGW must cause a hotspot. You have read the material backwards. If you have a hotspot, it may or may not be due to AGW. But, if you have AGW, you must have a hotspot.
“Different data sources and methods give different answers.”
According to the AGW hypothesis, it should be strong and unambiguous. This is just rationalization to stall an undesired conclusion.
“The prediction is 50 years old.”
But, it is not unique. If AGW, then you must have a cooling stratosphere. But, a cooling stratosphere does not uniquely indicate warming via CO2.
I don’t know why you are having so much trouble here. You are consistently turning logic on its head, arguing that sufficient conditions are necessary, and necessary conditions are sufficient.
If you have a hotspot, it may or may not be due to AGW
Excellent. We have agreement.
But, if you have AGW, you must have a hotspot.
Yes, according to the theory of warming at the surface being amplified in the tropical mid-troposphere. Whether from GHGs or solar or any cause.
So a missing hotspot doesn’t mean that GHG warming is false, it means that modeled changes in the moist adibiat due to surface warming are wrong. No hotspot doesn’t mean no GHG warming the surface (or surface warming from any cause), it just means that there is no enhanced warming in the tropical mid-troposphere.
This is just rationalization to stall an undesired conclusion.
No, your statement there is a rationalization to support a conclusion you’re wedded to.
I’ve provided plenty of references to support my contentions in this sub-thread thread. Even from astrophysicists on team skeptic.
You have provided exactly zero corroboration for your views on this topic. You are a serial committer of Bald Assertion fallacy.
“…it means that modeled changes in the moist adibiat due to surface warming are wrong.”
That’s not a minor thing to have wrong!
I’ve seen a bit of debate on the consequences of a lack of a hotspot. Some argue that it implies lower climate sensitivity because the WV amplification is’t happening in a part of the atmosphere where it is expected to. I’m not sure if WV amplification is meant to be located just in the hotspot region or in the atmosphere generally. I don’t know how a lack would affect the surface where we live any differently from warming that has a hotspot. But yes, lack of a hotspot would mean an emergent property of all atmospheric modeling is significantly flawed.
I expect surface temperatures will show a huge drop from March. Was quite surprised to see UAH up.
Because we base our predictions on local weather or parts of the world whose weather makes the headlines. Very few people are aware of the weather over significant portions of the globe for significant portions of a month.
Bob
“Very few people are aware of the weather over significant portions of the globe for significant portions of a month.”
This is very true, but weather nuts like me are amoung the exceptions. I check out sites like “climatereanalyzer” and “Moyhu” every couple of days for a quick snapshot of global weather and temperature. Very geeky, I know.
NCEP/NCAR was down 0.226 C. in April
https://moyhu.blogspot.com/2017/05/may-ncepncar-down-0226.html?m=1
This is OT, but if you’re a weather nut like me, you might be interested in the wacky weather over Hawaii right now.
http://cliffmass.blogspot.com/2017/05/record-cold-and-unprecedented-trough.html?m=1
And, the usual suspects tell us the record cold is, of course, indicative of AGW. If it is too hot, it is AGW. If it is too cold, it is AGW. If my Aunt Fanny’s bunions ache, it is AGW. It can do anything, just so long as it is bad.
It is classic unfalsifiable pseudoscience of the sort generally associated with doomsday cults.
Settle down, Bart. Cliff Mass, the guy who posted the blog, doesn’t believe unusual weather is the result of AGW.
Snape,
I believe that the WMO, the IPCC, and most non delusional people believe that climate is the average of weather.
Are you saying that climate causes weather? Or is climate, along with AGW not meant to be taken literally?
Maybe AGW is a metaphor for the apocalypse predicted by delusional doomsayers – death by boiling, roasting, frying, toasting, for unbelievers. I’m not sure, but being able to make things hotter by the judicious use of CO2 seems to be positively beneficial.
No need to burn coal to heat water to operate steam turbines! Just surround boilers withCO2! Need higher temperatures? Just use more CO2.
Or is the GHE a product of fanciful imagining, and not meant to be taken literally?
Not actually anything to do with greenhouses, and of no effect?
Cheers.
Flynn
I think climate describes long term weather trends.
As for your other questions? We’ve been down that road several times before.
Good reply, Snape. MF is just a troll, especially on the GHE.
Bart says:
“And, the usual suspects tell us the record cold is, of course, indicative of AGW.”
Just wondering — do you know the meaning of the word “global?”
Do you think CO2 is the only influence on short-term climate?
That’s a cop out. We were assured at the beginning of the circus that CO2 was THE dominant driving force, and it would henceforward be calling the shots. Now, in the face of uncooperative nature to support that meme, proponents have retreated into, “oh, it’s just one influence among many.”
But, the “pause” at the very least indicates natural variability is at least strong enough to cancel the CO2 effect. And, if natural variability can cancel the CO2 impact now, then it is more than powerful enough to have been responsible for the temperature run-up from 1970-2000, upon which the whole house of cards is founded.
It means, the proponents have got absolutely nothing more than a gut feeling as to what is going on, and gut feelings are not science. Just because you think something should be happening is no basis upon which to conclude that it is.
That is science. That is the scientific method. Your hypothesis must be verified, uniquely and unambiguously. Intuition is not enough, because intuition has proved notoriously unreliable time and again in settling questions of a scientific nature.
CO2 IS calling the shots.
And no one ever said that meant universal, continuous, monthly warming everywhere.
Your misconceptions about the science aren’t reasons against it.
Excuses, excuses…
Your misconceptions about the science arent reasons against it
Possible snowstorm on May 6 in the Great Lakes region.
How is this relevant to the topic of this post?
Meanwhile the World looks to elsewhere… Giant HORNETS…are threatening to all Humankind…it is necessary that the human beings, instead of destroy among them, destroy to those dangerous insects of huge exponential growing…seriously beginning already, at present.
I think I saw one of those in my backyard
When 100 ton lizards roamed the planet atmospheric CO2 exceeded today’s level by multiple times. Who’s to say gigantic mutant hornets are not caused by rising CO2?
Or how about this. In 1982, scientists published research showing that termites produced twice as much CO2 as all the smokestacks in the world. Maybe the termites and the hornets are conspiring to take over the world.
http://www.nytimes.com/1982/10/31/us/termite-gas-exceeds-smokestack-pollution.html
Another author of the report, Patrick R. Zimmerman of the atmospheric center in Boulder, said that plant respiration and decay added 10 to 15 times as much carbon dioxide to the air as termites.
While the contribution of fuel burning is even less, it is superimposed on what, until recently, …
had been a balanced cycle …
“…had been a balanced cycle “
That is an expression of faith. And, completely wrongheaded. Balance in nature does not just happen. It comes about due to the opposition of forcings in equal measure, with each forcing resisting change in its direction. You cannot shift that balance by an amount proportionally greater than the ratio of any added forcing to the existing forcing.
Word salad.
Bart says: “Balance in nature does not just happen.”
It goes without saying that no state of affairs arises without a reason(s). Without necessarily understanding those reasons it has always struck me as remarkable that the Earth’s mean temperature has only fluctuated within a 15 degree K or so range within the last 500 million years. That’s only a 5% band despite many environmental changes affecting the system.
I’m not saying that 15 degrees is not significant in terms of environmental change for human beings – merely that Earth’s climate has been relatively tightly bounded even on long geological scales.
It’s about carbon’s cycle and balance, nothing else.
Where do termite CO2 emissions come from? The CO2 taken up by trees? If so, there is no net creation of CO2.
Are there more termites now than in 1982? IF so, why? If so, it’s probably due to man’s building, but their carbon emissions are still coming from natural sources that themselves too up CO2.
The findings concerning carbon dioxide and methane production by termites do not offer much comfort regarding the long-term trend in atmospheric gases. The output from insects does not appear likely to increase greatly, while combustion of fuel is rising steadily as developing nations industrialize.
Except, with more buildings made of wood, there are more termites.
Still not adding fossil carbon to the cycle though!
All of the above were quoted from the 1982 NYT article by the way.
Are termites creating new carbon, or just recycling it?
The article says: “Termite gas production has become particularly high, the researchers say, because widespread clearing of land has offered them abundant food in the debris of felled forests.”
Wooden buildings could act like a sink if the forest could renew itself.
Termites are not adding fossil carbon to the “balanced cycle”, so you are in agreement with the article.
Wooden buildings would act as a *temporary* sink. They are eventually torn down and, usually, burned or left to rot.
Scott says:
“Or how about this. In 1982, scientists published research showing that termites produced twice as much CO2 as all the smokestacks in the world.”
Are termites creating new carbon, or just changing how it cycles around?
There is really no difference. It is an input. For equilibrium, the input balances with the output. If you add to the input, the new equilibrium point shifts by the ratio of the added input to the existing input. That is how dynamic systems work.
There is a big difference, if input = output.
For that reason, mammalian respiration does not contribute to atmospheric CO2.
Look at atmo CO2 over the Holocene — quite level, up until the industrial era when man began transferring fossil carbon into the atmosphere.
“There is a big difference, if input = output.”
Not in a dynamic system in which outputs self-adjust based on inputs.
“…quite level, up until the industrial era when man began transferring fossil carbon into the atmosphere.”
Only according to unverifiable interpretations of ice core analysis. They will be proved wrong in time.
Bart says:
“Only according to unverifiable interpretations of ice core analysis.”
There have been many ice cores drilled. All give the same results.
“They will be proved wrong in time.”
Why?
Bart, the first ice core was drilled in the 1960s.
How much more time do you need to prove it wrong? Say, to the nearest century?
“There have been many ice cores drilled. All give the same results.”
That only proves they are consistent. It does not prove they are consistently right.
“Why?”
Because they are inconsistent with the changes we have observed in direct readings in the past 60 years, and they are inconsistent with the hypothesis that CO2 levels are extraordinarily sensitive to our puny inputs.
For CO2 to have remained so stable for such a very long period of time requires high bandwidth regulation. But, high sensitivity to outside perturbations requires low bandwidth regulation. The system cannot be both high and low bandwidth at the same time, ergo there is a contradiction.
Inconsistent in what way?
“…and they are inconsistent with the hypothesis that CO2 levels are extraordinarily sensitive to our puny inputs.”
Inconsistent in what way?
I explained the inconsistency. That you do not understand the explanation says volumes. Why are you engaged in this debate, when you really don’t have the technical chops to engage in it knowledgeably?
‘They will be proved wrong in time’
Well ok Bart, then you have much undiscovered brilliance, or just much hubris.
Why not submit your ideas for publication and proper vetting by the professional scientists? It would obviously turn climate science on its head, and prove many of the experts wrong.
I know why, because your ideas can’t pass the vetting of professionals, because they are inconsistent with many established facts.
Because I am an outsider, and the odds of my getting something published in a field related to, but not coincident, with my area of expertise are vanishingly small.
It will take a lot more than a lone voice, or a few isolated voices (there are others, some directly engaged in the field, who agree with me), to break down the entrenched dogma of the climate establishment. Reputations and billions, even trillions, of $$$ are at stake.
It is going to require a stark change in the evolution of temperatures, that cannot be denied or swept under the rug, to erode the foundation of smug ignorance that has been laid down. Fortunately, nature may have just that outcome in store for us in the near future. The temperatures are falling fast, coming off the still lingering monster El Nino. We are already back to the “pause” level, and are likely to start sinking below it in the near future.
Stay tuned, and make sure you’ve got plenty of popcorn at hand. We’re getting to the good part.
Outsiders can get published if they present useful ideas that are supported by data. Your ideas are not consistent with the data. You cant just say, trust me, you’ll see, im going to be right, all of the experts will be wrong. Prognostication is not science. Its religion.
What would it take to change your mind?
If temps kept rising to 2030, would that be long enough? To 2040? How long?
Or would you always find something to maintain your belief?
“Outsiders can get published if they present useful ideas that are supported by data.”
Dream on! So, so innocent and naive.
“If temps kept rising to 2030, would that be long enough? To 2040? How long?”
I expect temperatures to keep rising for some time, Barry. The pattern was laid in over 100 years ago. I do not yet see any indication that it is changing. This is my prediction going forward:
https://tinyurl.com/ltb3n9v
But, the pattern was laid in well before CO2 rose appreciably, and CO2 cannot have a significant impact on temperatures in the present climate state. It’s just a natural phenomenon.
A ‘pattern’ seen once in the past is not a good basis for predicting the future, and is certainly not science.
Going back further, in the available long term records, such as CET, and central European temp, it is clear that the ‘pattern’ does not repeat.
Bart, if your ideas are so easily disproven that they cannot even pass blog review, much less peer review, then they are for you only and are pointless. Mental masterbation.
Bart I notice that your future telling has the temp continuing to rise throughout the century, with oscillation on top. Things dont happen without cause. Science aims to find the causes.
I also noted that you earlier said, ‘The aggregate climate system responds in a manner to resist change.’
Yet you now predict endless change without obvious cause.
Its all just so much nonsense.
“A pattern seen once in the past is not a good basis for predicting the future, and is certainly not science.”
That is insane. That is precisely how scientific discoveries typically are made. It was by the recognition of order and predictable repeatability in nature that science was born.
“Yet you now predict endless change without obvious cause.”
A body in motion tends to stay in motion, though it resists motion via inertial mass.
‘Body in motion tends to stay in motion’
Bad analogies will get you nowhere.
a. Earth is a driven dissipative system.
b. A warming system tends to keep warming? No. Not without cause.
Bart, what is causing the long-term warming in your prediction?
I see your chart predicts slightly cooler temps over in the 2020s than the last decade. If temps were warmer in the 2020s, would you think that interferes with your prediction? Or the 2030s?
I guess I’m asking you to provide a prediction that would falsify your opinion and corroborate AGW. Is there such a thing, or is your model not falsifiable?
“Bart, what is causing the long-term warming in your prediction?”
A long term cycle in storage and release of heat from the oceans would be my expectation. But, I do not have to know for sure what it is to know that it preceded significant growth in atmospheric CO2.
“If temps were warmer in the 2020s, would you think that interferes with your prediction? Or the 2030s?”
Well, obviously it would interfere with my prediction, since my prediction is for cooling through the 20’s. But, would it make me believe that CO2 is controlling the planet’s temperature?
No. That hypothesis has already been falsified. An alternative would have to be sought that was not already contradicted by the available evidence.
‘My prediction’.
Without using a weather model, Bart is predicting it will rain next Tuesday because it rained last Tuesday.
‘My prediction’. I would not dignify it that way. Hunch or premonition, maybe. I suggest focusing your predictive skills on lottery numbers.
A long term cycle in storage and release of heat from the oceans would be my expectation.
Seems unlikely when the oceans have been gaining heat, corroborated by sea level rise.
Seems you don’t understand that “storage and release” covers the entire set of possibilities.
If ocean release is the cause of warming periods in the global surface record, shouldn’t we have seen a corresponding drop in global ocean heat content and sea level? Instead we see the opposite.
No, you have it backwards. As the ocean goes at the surface, so goes the atmosphere. We have been in an era of storage, not release.
There are oscillations going on in the oceans at all times, just like water sloshing in a bowl. The patterns exist in 3-dimensions, latitudinal, longitudinal, and depthwise.
Note, BTW, that the Southern oceans have not been warming. Google “southern oceans cooling” for info.
From 1975 to 2016 the Earth’s averaged surface has warmed.
From 1975 to 2016 the world’s averaged oceans have warmed.
Global sea level has risen throughout that period.
If the oceans are supposed to be responsible for the warming of the globally averaged surface by release of thermal energy, then we should see a corresponding drop in thermal energy in the globally averaged oceans when the surface warms.
We see regional differences (naturally) but globally oceans have warmed. Southern ocean cooling (below 40 lat since 1982) has not been strong enough to offset that. More heat energy has gone into global oceans than out. If it is storing it from the atmosphere, then there should be a corresponding drop in global surface temps.
If some part of the ocean has released more thermal energy than other parts have gained, leading to warmer surface temps, then sea level should drop correspondingly. We should see evidence that matches what you’re saying as net thermal exchange between oceans and atmosphere.
Ocean heat content has been rising fairly steadily since the late 1950s, corroborated by sea level rise for the same period. The surface has definitely warmed in that period, corroborated by numerous observations.
The data we have do not corroborate your perspective.
If some part of the ocean has released more thermal energy than other parts, leading to warmer surface temps, then average global sea level should drop correspondingly.
We have been in an era of storage, not release.
Well that’s vague. Since when? Since about 1998? then you agree with the warmists that the oceans have been taking up atmospheric heat.
Since 1975? No, oceans and atmosphere are both warmer now.
Since 1950? No, oceans and atmosphere are both warmer now.
Since 1900? No, oceans and atmosphere are both warmer now. (Evidence for ocean warming from sea level rise)
Ocean/atmosphere exchanges can explain short-term global fluctuations (ENSO) and regionally at decadal scale (AMO/PDO etc), but none of those can explain the long-term, global warming. If there is an unmonitored part of the ocean releasing more energy than comes in – for any period – that should correspond to a global sea level drop.
We’re not seeing any of this.
NOAA publishes a product called the Oceanic Nino Index. The correlation with the UAH satellite record is amazing. Clearly, the ENSO affects water in the atmosphere. It seems to me that is the primary effect causing the up and down swings in the 13-month average as I stated in my previous comment.
Tim S says:
May 2, 2017 at 10:27 AM
The correlation with the UAH satellite record is amazing.
ONI doesn’t have the precision of their other product called MEI (Multivariate ENSO Index) which is much more complex and elaborated.
Here is a comparison of UAH6.0 and MEI:
http://fs5.directupload.net/images/170502/ttqdskcb.jpg
with a little mistake (I forgot to change from OLS to running means).
The interesting question is: if ENSO is the climate driver you suppose, why were then the 2016 anomalies in comparison so much higher than those of 1998, though the 1998 El Nino was quite a bit stronger than the 2016 edition?
http://fs5.directupload.net/images/170502/i9csreut.png
Bin, if the atmosphere can “trap heat”, then where is the heat from the 1998 El Nino?
(Laughing in advance at your answer.)
g*e*r*a*n
If my sleeping bag can “trap heat”, where is the heat from the time I slept in it in 1998?
Exactly.
Where did that heat go?
The heat is long gone. So what’s your point?
I understand you and Bin have no knowledge of thermodynamics. But all energy has to be accounted for.
Where did the heat energy go?
Bin can explain the heat loss from 1998 El Nino, and you can explain the heat loss from your sleeping bag in the same year.
What a team!
☺:
By “long gone” I meant it has left the earth’s atmosphere – assumed that was understood. Do you have a point or not?
I was laughing too hard to check for typos….
☺
Snape: By long gone I meant it has left the earths atmosphere…
So heat energy leaves Earth’s atmosphere, huh?
The atmosphere does not “trap heat”, huh?
Welcome to reality.
g*e*r*a*n says:
“So heat energy leaves Earths atmosphere, huh?”
Some does, some doesn’t.
Is that too complicated for you to deal with?
Yeah, there was another pseudoscientist that explained it as “Energy leaves the system, but energy does not leave the system”.
He was really hilarious, too!
Bindidon,
Can you tell me how to use CO2 to trap some heat? Can I trap some heat here in the tropics, and sell it to someone in a cold place later on? Every time I heat CO2, it cools down again – paricularly at night!
Or is this CO2 heat trapping only available to certified climate scientists?
Is there a special knob you have to turn to get the heat out when you want to release it? I recall Gavin Schmidt referring to a CO2 control knob in a pseudo scientific paper, but I can’t seem to find one anywhere.
All in all, most unsatisfactory. I hope you can help – maybe I need something “. . . much more complicated and elaborated.”
Cheers.
Mike Flynn asks: “I hope you can help – maybe I need something”
Ok, I’ll help Mike. The something Mike needs is to become informed in this field.
“Can you tell me how to use CO2 to trap some heat?”
You follow Prof. Tyndall’s design. One can trap all the heat allowed by nature using his published test methods.
“Can I trap some heat here in the tropics, and sell it to someone in a cold place later on?”
Of course, your price will need to be lower than the local utility.
Every time I heat CO2, it also cools down again – “paricularly” at night when the SW input has set or one turns off the Bunsen burner or Prof. Tyndall shuts his gas flame petcocks.
“Or is this CO2 heat trapping only available to certified climate scientists?”
No, available to anyone wants to do the proper lab experiments or observational work in the wild.
“Is there a special knob you have to turn to get the heat out when you want to release it?”
Nothing special about the knobs, Prof. Tyndall simply closed certain valves.
Ball4 believes cabbages emit visible light.
No one compete with that pseudoscience.
Ball4,
I’ve read Tyndall quite extensively. He warmed CO2 and other gases. When he removed the heat source, the gas cooled. Is this how you define climatological heat trapping? Seems common heating and cooling to me.
How much does it cost to trap 1 kilowatt/hour of energy using CO2? How long will it remain trapped? Tyndall doesn’t seem to provide the answer. Why are you refusing to divulge the information you imply you have?
I was already aware that CO2 cools down when you remove the source of heat involved in raising its temperature. Does this mean that CO2 loses all its trapped heat when it stops being heated above ambient environmental temperature?
Are you aware that any gas at all can be heated by the simple expedient of compressing it? No particular SW, LW, or other wavelengths involved. On the other hand, CO2 obviously traps cold. Releasing the contents of a CO2 filled fire extinguisher creates frozen CO2 – really cold!
Maybe you could tell me where I could buy the special CO2 knob that would let me trap and store some heat, rather than cold, in a CO2 cylinder. Just telling me that everyone knows how to do it isn’t much help.
Maybe you’re confusing CO2 with propane or butane. They trap a lot of heat, and when you use the knob on the gas cylinder, you can release it when you want. All you need is a spark.
CO2 is relatively inert, and provides no heat at all, unlike CO, which burns, and definitely does produce heat.
Sorry – no GHE. Putting more CO2 between the Sun and a thermometer won’t make the thermometer any hotter at all!
Cheers.
“Is this how you define climatological heat trapping?”
Yes, just as Mike writes: “(Tyndall) warmed CO2 and other gases”.
“How much does it cost to trap 1 kilowatt/hour of energy using CO2?”
Prof. Tyndall paid his lab nat. gas bills, Mike can figure at today’s rates.
“How long will it remain trapped?”
Until the power source is extinguished.
“Why are you refusing to divulge the information you imply you have?”
My info. is all contained in the extensive reading of Tyndall’s experiments Mike performed.
“Does this mean that CO2 loses all its trapped heat when it stops being heated above ambient environmental temperature?”
Yes.
“Are you aware that any gas at all can be heated by the simple expedient of compressing it?”
Yes.
“Maybe you could tell me where I could buy the special CO2 knob that would let me trap and store some heat, rather than cold, in a CO2 cylinder.”
At your local hardware store like Prof. Tyndall.
“Putting more CO2 between the Sun and a thermometer wont make the thermometer any hotter at all!”
It did for Prof. Tyndall!
“Sorry no GHE. Putting more CO2 between the Sun and a thermometer wont make the thermometer any hotter at all!”
As it happens, high schools these days have a standard physics experiment that shows exactly this taking place.
Mike Flynn obviously doesn’t understand heat transfer. Increasing CO2 in the atmosphere is like adding insulation to your house. The extra insulation will slow the flow of thermal energy from inside the house to the outside in winter and similarly will slow the flow from outside to inside in the heat of summer if you use A/C. In winter, the result would be a warmer house with the same rate of input of heating energy or, by setting the thermostat at a fixed point, less heating energy would be needed with the extra insulation.
In the atmosphere, the heat source is the SW energy which continually flows from the Sun thru the atmosphere to the Earth’s surface. Adding CO2 to the blanket of air surounding the Earth will slow the outward flow from the surface to deep space, warming the surface. It’s more complex than that, but one should get the basics of the physics from the analogy.
“..but one should get the basics of the physics from the analogy.”
Mike Flynn won’t “get” even the basic physics as found from tests as he has repeatedly demonstrated. He’s just an amusing poster that likes to sow discord with the intent of provoking emotional responses. Fun to play with & that’s about all.
When folks believe the atmosphere is a “blanket”, there is not need to try to discuss physics with them. They are lost in pseudoscience.
Actually, I would rather call the atmosphere the “shell of our space craft”, but most people can’t comprehend that the Earth is surrounded by deep space with an effective temperature just above absolute zero (-273 C). That “shell” insulates the surface from the cold of deep space and absorbs the high energy photons from the Sun, as well as stopping most small asteroids and comets from impacting on the surface. Obviously, my point was that the CO2 isn’t the source of the energy, but one component in the complex interactions as the solar energy flows thru the climate system.
ES: deep space with a brightness temperature (CMB) just above absolute zero.
E. Swanson, from above: “Adding CO2 to the blanket of air surounding the Earth will slow the outward flow from the surface to deep space, warming the surface.”
Then, E. Swanson states: “Obviously, my point was that the CO2 isnt the source of the energy, but one component in the complex interactions as the solar energy flows thru the climate system.”
So, the atmosphere is NOT a “blanket”, but it is a “complex interaction”.
When prodded, E. Swanson rapidly abandons his/her pseudoscience.
Welcome to reality E. Swanson.
g*e*r*a*n, the atmosphere still insulates the surface from the surrounding near vacuum of deep space. Adding more CO2 to the atmosphere increases the effectiveness of that insulation, i.e., it slows the outgoing flow of energy from the surface to deep space. Flynn’s argument is based on his supposition that the CO2 is the source of the energy, which is incorrect.
What is g*e*r*a*n’s explanation for the fact that the surface of the Earth is warmer than the surface of the moon, which lacks an atmosphere?
E. Swanson—It you want to understand then you first must give up your “blanket”.
Earth’s atmosphere is NOT a blanket. That poor analogy has been used for decades (centuries?), but is highly inaccurate. Warmists cling to it because it helps to foster their pseudoscience.
The atmosphere is a “heat transfer regulator”. It enables excess heat to move to space. It can adjust the rate of heat transfer (regulate), as needed.
Hydrostatic Equilibrium Demonstration
https://www.youtube.com/watch?v=lkg1p173TAc
g*e*r*a*n, you had an opportunity to prove that you actually could “discuss physics”, but instead you chose to waffle away with no real reply. Here’s another chance for you to show your vast understanding of atmospheric physics. What’s the physics which explains the fact that the temperature in the stratosphere increases as altitude increases?
g*e*r*a*n says:
“Earths atmosphere is NOT a blanket.”
How profound.
“That poor analogy has been used for decades (centuries?), but is highly inaccurate.”
Look up the definition of “analogy.”
E. Swanson queries: “Whats the physics which explains the fact that the temperature in the stratosphere increases as altitude increases?”
E., look up UV and oxygen/ozone in the stratosphere.
(Nice attempt to distract for your “blanket analogy”, BTW.)
Davie whines: “Look up the definition of ‘analogy.'”
Davie, I have enough trouble explaining physics to you. I’m not going to help you with vocabulary.
The best for you, Mike Flynn, is to become informed by people who are not known as warmistas, e.g. Dr Sherwood B. Idso, president of the Center for the Study of Carbon Dioxide and Global Change.
Google will have a pleasure to direct you to a so called “CO2Science” page, e.g.
http://www.co2science.org/subject/questions/1998/greenhouse.php
whenever you ask for things like ‘Can carbon dioxide trap heat ?’.
It is exactly what many people tried to explain you here since years.
Of course CO2 does not really ‘trap’ heat, nor does H2O; that’s nonsense, it must be understood as metapher like ‘green house’.
Trace gases like CO2, H2O, CH4 and some other crazy little boyz simply absorb IR radiation coming from Earth’s surface, and reemit it in all directions.
A little amount moves back to surface; more of it is absorbed and reemitted again by trace gas molecules.
The result is that less IR radiation is emitted to space, and that subsequently a bit more heat is kept in the atmosphere.
C’est tout…
Bin, you were doing fine until you got to the end—-
“The result is that less IR radiation is emitted to space, and that subsequently a bit more heat is kept in the atmosphere.”
Then, you had to run back to your pseudoscience. Heat is NOT “kept” in the atmosphere.
g*e*r*a*n says:
May 3, 2017 at 12:25 PM
I quote Idso’s CO2Science here:
Some of this thermal radiation is absorbed and re-radiated by the atmosphere’s CO2 molecules back toward earth’s surface, providing an additional source of heat energy.
You won’t think Idso be a warmista, huh?
This is what NOAA’s Earth System Research Laboratory has discovered with the SURFRAD ; but this backradiation directly down to Earth is only a part of what trace gases reemit.
Maybe you think all these photons manage to come around all molecules and pretty good escape to space?
It doesn’t matter how you write your pseudonym: the messages’ contents don’t change.
“…providing an additional source of heat energy.”
“Bzzzzzzz”! (Buzzer sound.)
Violation of 1st Law of Thermodynamics. CO2 is NOT a “heat source”.
angry does comment something decent here (in its own way) and makes a good point I have to admit: the link by Bindidon to CO2Science needs to be corrected. Perhaps angry or Bindidon will contact the Center at the email they provide redacting the unneeded heat term:
“Some of this thermal radiation is absorbed and re-radiated by the atmosphere’s CO2 molecules back toward earth’s surface, providing additional amount of **** energy.”
Odd — Roy won’t allow a 1-sentence scientific reply from here here.
I wonder what the problem is.
I don’t expect him to reply.
g, no one thinks carbon dioxide is a “heat source.”
If you’re going to try to criticize an idea, you should at least, as a first step, understand it.
Davie, there are constant references to CO2 as a heat source by pseudoscience types. You have to have a closed mind not to see them.
Oh….
Quote a scientist or scientific textbook saying so.
Davie, no scientist would advocate pseudoscience!
I didn’t think you could cite any science.
And I was right.
As the amount of solar energy increases, the troposphere expands.
http://www.cpc.ncep.noaa.gov/products/stratosphere/strat-trop/gif_files/time_pres_TEMP_MEAN_ALL_NH_2016.png
The warm air rises and the temperature drops depending on the pressure drop down to the tropopause. The average temperature of tropopause is constant.
Troposphere has no “roof”.
So why is heat being added to the atmosphere (and ocean, and land)?
If 5 degrees cooler than now produces an ice sheet across North America and we’ve had a degree or two of warming… shouldn’t there be a natural climate variability margin of 3 to 4 degrees? Meaning we still need more CO2 to stop the next ice age?
“Meaning we still need more CO2 to stop the next ice age?”
Probably. But we’re getting more CO2, aren’t we?
Darwin: when was the next glacial period due to arrive?
Why the 13 Month Moving Average on Satellite Data?
While doing some research I stumbled upon an article on Think Progress that appeared to be mocking Dr. Spencer at the UAH regarding his usage of a 13-month moving average.
https://co2islife.wordpress.com/2017/05/02/why-the-13-month-moving-average-on-satellite-data/
as a result of questions like this, I’ve started adding a caption to the monthly plot. Read it. It’s a non-issue.
Roy, like your “entertaining” third-order polynomial, it’s better to just leave off anything but the simple presentation of your data.
http://davidappell.blogspot.com/2012/04/roy-spencers-entertaining-polynomial.html
The polynomial is gone. Other institutes give smoothed profiles for their temp records. Why flog dead horses?
(Eg, UK Met Office time series and GISS)
They don’t give projections.
And they don’t try to fit ridiculous functions that are so easily and laughably debunked.
This point has nothing to do with projections.
Different institutes smooth in different ways. There’s nothing inherently wrong with using a 13-month average. It’s just a smoothing choice and doesn’t suggest anything about the future. A 12-month average gives almost exactly the same result. UK Met Office use a 21 point binomial filter. GISS uses a 5-year lowess smooth (annual values) at the home page, which you can adjust if you like. NOAA have used a 13-term Gaussian filter. There’s no standard way to do it, and any specific choice would depend on the question being asked.
Why not use a 12 month centered moving average? That would also solve the problem — and in a way that should make everyone happy.
http://www.itl.nist.gov/div898/handbook/pmc/section4/pmc422.htm
Why not use a lowess smooth? Or a 5-year running mean? Or a 21-point binomial filter? Or a 13-term Gaussian filter?
They’re all fine. So is a 13-month smooth.
If anyone wants to complain about a smoothing choice, they need to explain what it is trying to be achieved, and why a certain choice is appropriate/inappropriate.
This banging on about a 13-month average is a non-starter. Every institute uses a different filter for their smooths. None give reasons. It’s a subjective choice to smooth out the noise and look for the signal, and there is no standard or ‘correct’ way to do it.
The 4 different smoothing methods I listed at the top of this post have all been used by the major institutes presenting global surface temps. They all do it differently. And that just doesn’t matter.
Using a 13 month moving average is only another subjective choice about what to use for relative measurements. The time series, 1979 to 2010 is another. But, unfortunately, we don’t have measurements from the satellite era going back into the 1700’s or whenever so we are limited.
To make light of those, in view of the limitations we are faced with seems a bit hysterical.
On a bit of a different note.
From the graph, without being extraordinarily accurate:
there are about 28 points on the graph below -.3 and about 36 points above +.3. Combined that is about 14% of, what I will subjectively consider, outliers. Leaving those aside, the measured 38 years has us staying within a .6C variance. Except for the accuracy of the measurements, how would anyone notice?
Hopefully we will stay on the positive side of this and be without too much snow and ice, despite the best efforts of the AGW religious March Saturday (see previous Dr. Roy blog) to cause more.
The long-term trend is statistically significant.
In a science like climate, you rarely get the data you want, so you have to make the most of the data you have.
Snape,
Here’s what the IPCC states –
“Climate in a narrow sense is usually defined as the “average weather,” or more rigorously, as the statistical description in terms of the mean and variability of relevant quantities over a period of time ranging from months to thousands of years. The classical period is 3 decades, as defined by the World Meteorological Organization (WMO).”
Is it your contention that “months” is a “long term weather trend”? How would you distinguish months from thousands of years? Are the months of winter a different “long term weather trend” compared with the months of summer?
This is supposed to be science, after all. Definitions need to be rigorous – not subject to an individual’s erratic whims.
Is the IPCC to be taken literally, do you think?
As to the heating properties of CO2 (commonly referred to as the GHE, I believe), I sympathise with your desire to avoid any involvement with such a ridiculous notion!
Having dismissed CO2 as a causative agent of AGW, what might you suggest as an alternative?
You could always toss out a patronising and dismissive ad hom insult, if you can’t find anything scientific and testable to back up your arguments. I generally decline to feel insulted or offended, but try anyway, if it makes you feel better.
Cheers.
Flynn
My description of climate was off the top of my head. Far from perfect. Did you want me to google the definition and send you the link?
Is “off the top of my head” better than ‘pseudoscience”?
Snape,
Why would I want you to provide another off your head definition? You have admittedly facto that you are sloppy, imprecise, and imperfect, and anything you say should not be taken literally.
I’ve provided you with the IPCC definition, which in turn refers to the WMO definition. Why do you refuse to accept the IPCC definition? Afraid someone might take it literally?
Wriggle, wriggle, Warmist worm! Maybe you’ve inadvertently hooked yourself.
Let me know if you ever find a testable GHE hypothesis, involving CO2. I won’t hold my breath while I’m waiting.
Cheers.
“Let me know if you ever find a testable GHE hypothesis, involving CO2.”
Ok, a testable GHE hypothesis involving CO2 has now been found in the lab and in the wild.
And UAH work indicated the GHE fails in the “wild”.
Incorrect anger, the GHE due CO2 has been measured in the wild. UAH v6.0 includes those affects in its total LT measurements.
g*e*r*a*n says:
“And UAH work indicated the GHE fails in the wild.”
How so? Provide details.
🙂
Davie,
1) Look at the chart above.
2) Note the two big El Ninos (1998 and 2016).
3) Note the drops after the peaks.
Pseudoscience tells us the atmosphere can “trap heat”. The UAH values indicate the atmosphere cannot “trap heat”.
It’s no wonder pseudoscience types do not like UAH results, huh?
anger, UAH v.6.0 is measuring LT temperature changes from all ~9+ radiative forcings changing not just the changing GHGs.
And those measurements indicate the GHE fails, in the “wild”.
Incorrect anger, the GHE due CO2 has been measured in the wild. UAH v6.0 includes those affects in its total LT measurements.
NOPE!
As always, you confuse DWIR with the GHE.
But, then what do you NOT confuse?
No confusion angry. The case is clear if competent enough to read the relevant published papers.
That’s probably one of your problems. You’ve read too much pseudoscience.
No problems either, anger, the published papers are based on proper measured data from well calibrated instrumentation. I have now learned why you are so angry.
Are these “papers” where you learned that cabbages emit visible light?
Are these “papers” filled with pseudoscience like Davie’s favorite one that states the Sun can raise Earth to 800,000K?
Climate clowns are so hilarious.
“Are these “papers” where you learned that cabbages emit visible light?”
No.
“Are these “papers” filled with pseudoscience like Davie’s favorite one that states the Sun can raise Earth to 800,000K?”
No, anger. Some day the sun will do so.
You are even confused by your own pseudoscience.
That just adds to the hilarity.
g*e*r*a*n says:
“Are these papers filled with pseudoscience like Davies favorite one that states the Sun can raise Earth to 800,000K?”
You constantly and purposely misinterpret for the sake of snark.
You aren’t an honest debater, you insult others, and you can’t conduct a scientific discussion. There’s no more reason to try with you.
Davie, here is the exact quote, for your reading enjoyment:
“In a single second, Earth absorbs 1.22 1017 joules of energy from the Sun. Distributed uniformly over the mass of the planet, the absorbed energy would raise Earths temperature to nearly 800 000 K after a billion years, if Earth had no way of getting rid of it.”
You don’t know enough physics to figure out why that is wrong, so you try to claim I’m “misinterpreting”!
You clowns are hilarious.
(What’s even funnier here, is his wording, “if Earth had no way of getting rid of it.” I’m sure that is lost on you also!)
Did you see the word “if?”
Well, as I surmised, you do not get it.
PH is admitting that Earth can cool itself.
It went right over your head.
Snape: Try to ignore “Mike Flynn.” He is a troll who isn’t interested in a scientific discussion. He won’t discuss his claims, or answer questions about them. He never has.
MF. You argue like my teenager. Lots of snark, not much logic, ridiculous strawmen.
Try reading and arguing with what is actually being said. No one is saying co2 is a heat source. Let it go.
The global temperatures are not responding to increasing co2 concentrations as the data shows.
EL NINO was 100% responsible for last years warmth.
Now with low solar in play as I have said for years AGW theory will be proven wrong before year 2020.
Prolonged solar will result in a higher earth albedo even 1/2 of 1% will be significant, while also causing sea surface temperatures to cool overall. The result will be a decline in global temperatures as we move forward.
“I have said for years AGW theory will be proven wrong before year 2020.”
Since there are around 9 radiative global near surface radiative T forcings (RF) identified from observations with some arguably reasonable error bars, the UAH v.6.0 LT chart anomaly declining before year 2020 could be the result of change in any one or a combination of the RFs. Any long term global temperature decline will have no effect on AGW theory, Salvatore, as the theory is developed from lab tests and observed in the wild.
Don’t you just love it?
Ball4 states “Any long term global temperature decline will have no effect on AGW theory.”
In his mind, AGW can never be disproved!
Correct anger, the AGW theory rests on confirming tests starting prior to 150 years ago. The tests have never been disproved, rather the testing has been improved with even better equipment and more observations.
QED
Thank you.
g*e*r*a*n says:
“Ball4 states Any long term global temperature decline will have no effect on AGW theory.
“In his mind, AGW can never be disproved!”
AGW has already been proved.
CO2 warms climates. That’s as solid as any scientific finding out there.
It won’t be disproved any more than will Euclid’s theorems.
Davie,
CO2 does not “warm climates”.
“Beliefs” are not “proofs”, except in pseudoscience.
Not sure why you would deny science that is over 100 years old.
Why?
It’s NOT science, so easy to “deny”.
Why it is not science?
The Arrhenius CO2 equation is bogus. There is NO mathematical proof for the equation. It is a “belief system”, not science.
You think AGW is based on Arrhenius 1896?
Then you are a fool.
So are you now in “denial” of the equation?
David Appell,
You can’t even define what AGW is supposed to be.
You say silly things such as “CO2 warms climates”. Climate is defined as the average of weather. Saying “CO2 warms the averages of weather” sounds about as silly as it is. Totally meaningless.
To warm something, ie. to make it hotter, requires heat in excess of that which is lost. CO2 provides no heat, in and of itself.
Why you continue to deny reality is obvious – you are afflicted with a mental aberration similar to that of Gavin Schmidt, who seems to believe he is a scientist, rather than an undistinguished mathematician. Or possibly Michael Mann, who seemed to be convinced he was a Nobel Laureate – possibly even after the Nobel Committee wrote to him to inform he wasn’t.
You may continue to demand that others bend to your will. I can’t think of any reason anybody would bother, but I suppose there are people even less capable of rational thought than yourself.
Maybe you could make your demands even more strident! Have you considered marching, or resisting? Refusing to write about AGW might bring people to their senses (or maybe not).
If all else fails, a good old tantrum, accompanied by the threat of holding your breath until you turn blue, might work!
Give us all a laugh, if nothing else. I’m not aware of any peer reviewed research showing that laughter shortens life at all. Give it your best shot – I’ll have a little chuckle while I wait, if you don’t mind too much.
Cheers.
Davie is in denial. He is trying to distance himself from the bogus Arrhenius CO2 equation.
The equation is the basis of the IPCC/CO2/AGW nonsense. The equation has NO mathematical proof. It was conjured up by Arrhenius. The equation violates the laws of thermodynamics.
It’s hilarious to see Davie run from his own pseudoscience.
Mike Flynn, you’re clearly a troll. You’re done here, as far as I’m concerned.
g says:
“The Arrhenius CO2 equation is bogus.”
Which specific equation are you referring to?
Davie, why do I have to explain your pseudoscience to you? Don’t you even know what tripe you have been swallowing?
This is the equation that calculates a “forcing” from increasing CO2 in the atmosphere.
Forcing = 5.35ln(C/Co)
C = Current CO2 ppm = 405
Co = CO2 ppm from late 1800s = 280
Forcing is in units of Watts/sq. meter
Why is it “bogus?”
You don’t know enough physics to figure it out?
Hint 1: Where is the mathematical proof?
Hint 2: 1st Law of Thermo VIOLATION!
See if you can figure it out with those hints, before the pizza arrives.
☺
Just more snark.
I knew you couldn’t prove it.
You lose again.
How many times is that now?
Again, why is it bogus?
A straight answer, please.
Oh, you didn’t flee. You just were gone for a day.
Okay, you can’t figure it out from my hints, so here it is.
1) The equation has NO mathematical proof. It is an equation conjured up by Arrhenius. The method, these days, is known as curve fitting!
2) The equation creates energy out of thin air. That violates the 1st Law of Thermo. The equation basically “says” that if you had CO2 to the atmosphere, you get Watts/sq meter.
Curve fitting, violating the laws of physics–PSEUDOSCIENCE!
2. The eqn doesnt speak, without context. It doesnt create energy either. In the context of incoming solar flux, it says that co2 impedes outgoing flux. Surface temp rises to bring outgoing up to match incoming.
Nate, the equation “speaks” when the derived value has units of “Watts/sq.m.”
THAT is creating energy out of thin air!
You might want to look up the mathematical proof for the [bogus] equation.
(Hint: There is NO proof. It’s as someone once said, it’s BOGUS!)
if i add another blanket on top of me, i get warmer. You would argue the blanket created heat out of thin air? Just as dumb.
Nate, trying to use blankets to cover your lack of science just means you have a bunch of blankets over your head.
once again no science answers. So just insults
Nate, you probably missed the “science”, because you had your eyes closed.
http://www.drroyspencer.com/2017/05/uah-global-temperature-update-for-april-2017-0-27-deg-c/#comment-246145
I already adressed your false assertion of 1st law violation. Once again, there is a source of energy known as the sun, which you seem to willfully ignore. No energy created, as you state, from nowhere.
The eqn of Arrhenius is approximate, has more modern derivations that are well argued, and in any case it has been experimentally tested.
Salvatore del Prete wrote:
“EL NINO was 100% responsible for last years warmth.”
Prove this, Salvatore.
David I can’t prove it but if it were not responsible how come the global temperatures declined after this EL NINO ended and rose when it started?
Do you think it was coincidental? I do not.
Salvatore, if you can’t prove it, why claim it?
It detracts from your (already tiny) credibility….
Salvatore, asking again: if you can’t prove something, why claim it?
Salvatore del Prete wrote:
“The result will be a decline in global temperatures as we move forward.”
Salvatore, how about explaining why your similar prediction of 7 years ago was wrong?
Your conclusions are in a word wrong, and that will be proven over the coming years, as the temperatures of earth will start a more significant decline (which started in year 2002 by the way).
– Salvatore del Prete, Reply to article: IC Joanna Haigh – Declining solar activity linked to recent warming, 10/8/2010
http://climaterealists.com/index.php?id=6428
Salvatore Del Prete says:
“EL NINO was 100% responsible for last years warmth.”
Prove this.
Hey Dr spencer. Why does your graph only show a brief recovery spike when I got information that the earths temperature dropped 0.5 C for the month of April? Which one can I rely on for the most accurate information?
Doesn’t that require Dr. Roy knowing what your other source is?
Good point. Here it is:
http://www.thegwpf.com/global-temperatures-plunge-0-5-celsius-in-april/
I can make a hazard at answering that myself, based on that source: By-and-large, when asking “Which one can I rely on for the most accurate information?”, if the GWPF is the source then the answer will be “the other one”. But they’re actually providing an interpretation of someone else’s data, so I can be slightly more concrete: Dr. Roy’s figure is the MONTHLY anomaly. The 0.5C figure quoted on that site clearly refers to the daily variation DURING the month of April. The two statements could both be perfectly accurate while referring to the exact same data.
So you can take either, just so long as you are clear about what either is saying.
I would think the one I provided would be the more accurate one because it doesn’t average out the temperatures over a whole month like Spencer’s does but actually takes measurements for each day through the end of the month. It is a more specific measurement since it measures daily not monthly temperature trends like the UAH or RSS do. am I right or wrong?
The Univ Maine Climate Reanalyzer already does a fine job of this:
http://cci-reanalyzer.org/
Define “the Earth’s temperature.”
Surface? Troposphere? Ocean?
Hilariously, the data used by GWPF is from a forecast model. They just hunt around for any data that makes things look cooler. It’s a propaganda unit, not a serious resource.
This is their data source:
http://www.cpc.ncep.noaa.gov/products/CFSv2/CFSv2_body.html
How would you estimate the chance of an El Nino in coming months, without a model?
David
By looking at a wind anolomy chart I can predict ENSO 3 or 4 months out.
If it was that easy, why isn’t everyone doing that?
Can you back up your claim with historical data?
David
That came across as sounding boastful – it’s actually very easy. Just scroll down to the “zonal, low-level wind anomalies chart. Look to the left of the screen. Deep red (westerly wind burst) and we’re headed for, or strengthening, an el nino . Deep blue, a la nina. Right now it looks warm/neutral.
I know this is very unscientific, but for the past several years, I’ve had close to 100% accuracy (looking about 3 months out). I’ve found that model forecasts (scroll lower on page) have often lagged this simple “eyeball”
test.http://www.cpc.ncep.noaa.gov/products/analysis_monitoring/lanina/enso_evolution-status-fcsts-web.pdf
David
I don’t know why this hasn’t been talked about much…. maybe 3 months out isn’t very helpful?
I think I could provide evidence but it would be a lot of work. I have caveman computer skills.
Better, in the coming months/years, the data will either prove me right, or a babbling fool. lol!!
Simple explanation? A “westerly wind burst” initiates the eastward movement (kelvin wave) of warm water towards the ENSO region. Strong easterlies and warm surface water gets driven down into the ocean depths. Near normal winds and you can expect “ENSO neutral”in the next few months.
To clarify, strong “easterlies” drive warm surface waters west towards Indonesia, where it has nowhere to go and so is driven downwards.
The key driver of all this is, as far as I can tell, the near constant, east-to-west trade winds. They blow sun- warmed surface water towards Indonesia, where a huge “warm pool” hangs out. The eastern tropical pacific, it follows, is much cooler.
Westerly wind bursts, I should point out, are the infrequent exception to the trade winds. Also, a westerly wind burst near the central or eastern tropical pacific doesn’t do much because that’s not where the warm water is located. That’s the reason for looking at the left side (western pacific) of the chart.
Snape says:
“Simple explanation? A westerly wind burst initiates the eastward movement (kelvin wave) of warm water towards the ENSO region.”
Oh please.
Sounds super goofy, I know.
The “simple explanation” is just a hypothesis for explaining real world observations – it’s my best guess.
I think the problem with ENSO climate models is they can’t predict anomalous wind events, which would be described as “weather”.
I will alert y’all when something interesting happens in the western tropical pacific and provide a link to the chart.
An update is released every Monday morning. Takes about 10 seconds to check out the wind anomalies.
Well in that case. I am never relying on them for accurate information
This may have got CC4R’s attention:
As the record 2015/16 El Nino levels off, the global warming hiatus is back with a vengeance
Except it isn’t. Trends for all global surface/satellite lower trop trends are still positive since 1998.
I see that they created their first chart by linking to… twitter. Naturally, it goes all the way back to October 2016, and from this they claim the ‘pause’ from 1998 is back.
(Facepalm)
CC4R, definitely do not trust the GWPF. It’s snake oil.
If you talk about a slowdown, then the slowdown is back. The zero-trend isn’t, but then, who should be picky.
http://www.thegwpf.com/global-temperatures-plunge-0-5-celsius-in-april/
I’m not in for the snake oil, because they don’t sell anything. This is just ordinary goofy stuff. Given the general goofiness, I think this is not from the worst end, just mediocry (spell check complains) goofy.
who should be picky
Anyone interested in accuracy.
I realize that might not be important for talking points…
I was slightly sarcastic on who should be picky.
But still yes, I think this is just ordinary goofy stuff discrediting a bit its author.
I understand that there is a more-than-evens chance of ENSO turning positive again this year. That would be consistent with the slow tailing off after the recent peak shown on Dr. Roy’s graph. One month’s fluctuation doesn’t mean anything useful, and even a double el Nino doesn’t say anything about trends. But there’s nothing surprising about a sustained rising trend over the whole dataset either, is there?
The Temperature 10-Day Departure image shows areas where temperatures are expected to be above, below, or near normal for the next 10 days.
http://images.intellicast.com/WxImages/CustomGraphic/wg10t.gif
Northern Hemisphere Minimum Temperature 5-day Forecast.
http://pamola.um.maine.edu/fcst_frames/GFS-025deg/5-day/GFS-025deg_ARC-LEA_T2_min_5-day.png
North Sierra Precipitation: 8-Station Index, May 03, 2017
http://cdec.water.ca.gov/cgi-progs/products/PLOT_ESI.pdf
Salvatore, how about explaining why your similar prediction of 7 years ago was wrong
David ask and the answer is solar activity never reached my parameters 7 years ago. Now finally solar activity is reaching my parameters which I had said would be needed to produce global cooling.
So this time David we will know because the sun is going to be very quiet going forward and how the global temperatures react will tell us if I may or not be correct.
Again my argument is if solar activity is low enough it will result in increasing the earth’s albedo and lowering overall sea surface temperatures the former due to an increase in volcanic activity ,global cloud/snow coverage the lower sea surface temp due to a decline in UV light.
A simple concise argument.
Salvatore, you have made definite claims, that did not depend on anything else. For example:
Global cooling has started, and it will be here for sometime to come. All the factors that control the climate are now in, or going toward a colder phase.
– Salvatore del Prete, December 31, 2010
http://www.drroyspencer.com/2010/12/dessler-and-spencer-debate-cloud-feedback/#comment-8257
Why did THIS prediction fail, Salvatore?
sun did not cooperate
“Cooperate?” That’s an odd choice of words.
Is the Sun supposed to agree with your claims, Salvatore?
Or were you wrong — WRONG — about the Sun??
Salvatore, if the sun did not cooperate, why did you claim it had?
Have you learned ANYTHING from your many, many failures, Salvatore?
Do you personally believe you have any credibility left?
I was wrong on the solar activity it was way higher then I thought it was going to be back then. 2011 – mid 2016
“I intend to make sure everyone will know who forecasted the climate correctly, and who forecasted it wrong.”
– Salvatore del Prete, 7/8/15
http://www.drroyspencer.com/2015/07/revised-uah-global-temperature-update-for-june-2015-0-33-deg-c/#comment-194674
Salvatore, it is refreshing to hear someone say, “I was wrong, and here is where I was wrong.”
That increases your credibility.
As opposed to the CAGW activists who deny that they have been wrong . . .
Yes, Salvatore salvaged some credibility.
that simple David but guess what the sun is now cooperating
Salvatore, you said in the past that “all the factors that control the climate are now in, or going toward a colder phase.”
That would include the Sun.
Now you’re admitting you were wrong then.
Why are you’re just as wrong now, Salvatore?
DA
its very easy for your side to say sorry I was wrong because they have to do it so often where as the other side is not used to it so its a bit harder. Maybe it comes naturally to warmers incorperated
HC
The sun did not cooperate the values were to high now this has changed.
If the temp do not decline from now going forward I will admit to being wrong.
Salvatore, you’re just making excuses.
“I think the start of the temperature decline will commence within six months of the end of the solar cycle maximum and should last for at least 30+ years.”
– Salvatore Del Prete, 7/13/2013
http://www.drroyspencer.com/2013/07/uah-v5-6-global-temperature-update-for-june-2013-0-30-deg-c/#comment-84963
Salvatore, now that conditions are right, what is your prediction to 2020 and to 2025? That’s a short enough time frame where we will probably still be here to discover the results together.
temp will be below the 30 year avg means
Salvatore, not a single one of your many predictions has ever come true. Not one.
“2016 will not be s warm as 2015….”
– Salvatore del Prete, 12/3/15
http://www.drroyspencer.com/2015/12/2015-will-be-the-3rd-warmest-year-in-the-satellite-record/#comment-203097
Thanks. Just to be clear – which 30-year average? The most recent to 2016? Or the baseline (which is different for every data set)?
David Appell wrote –
“Define the Earths temperature.
Surface? Troposphere? Ocean?”
An excellent question, which no one has yet managed to answer with any scientific rigour.
Nobody has even managed to come up with a precise definition of the Earth’s surface, in relation to climatology. Maybe David Appell might like to take a stab.
Cheers.
What rigor is missing, specifically?
In your expert opinion?
How can he know when he doesn’t research his own questions? Of course there is a definition for surface temps. But he’s not interested in discovering it, he just wants to be argumentative.
You should take your own advice and quit trying to help him. That’s not what he really wants.
barry, Flynn is a troll that has never answered a single question when asked.
I know you’re trying to the “honest broker,” but you’re learning far too much towards the denier side.
Then stop feeding the troll.
Mike Flynn says:
“Nobody has even managed to come up with a precise definition of the Earths surface, in relation to climatology.”
The average of any scalar function is easily defined over any continuous manifold.
Look it up.
David Appell,
Hard to say, when you can’t even provide any definition. Something like asking me to comment on the verification protocols for the non-existent untestable GHE hypothesis.
Some climatologists apparently claim that something is getting hotter, due to the presence of some gases in the atmosphere, due to some unspecified and unknown mechanism which supposedly depends on a non-testable hypothesis which has never existed in written form.
Quite obviously, the molten blob we call the Earth must cool, if its internal temperature exceeds 255 K or so, which is the maximum which can be sustained by the Sun – at least according to climatologists.
Day is generally hotter than night, summer generally hotter than winter, and so on.
However, these are extremely vague terms, if intended to be applied to a specific part of the Earth. The influence of the Sun is imperceptible at relatively shallow depths into the crust. Should a virtual surface be defined at this level?
So what’s your definition of the surface? Just cut and paste something if you wish – hopefully it will even define what the surface is, for a start. Climatologists certainly appear rather confused, and refer to different parts of the system as the surface, complaining furiously if someone tries to pin them down.
I await your definition with bated breath – although I am not hopeful that you can provide anything at all, let alone alone anything useful. Don’t be discouraged – give it your best shot.
Cheers.
Let me know when you’re ready to answer questions about your claims.
David Appell,
What claims might those be? If you don’t how how to quote what I wrote by copying and pasting, I’m sure some other GHE supporter might be able to help.
If you are asking a question in an effort to seek knowledge, I’ll endeavour to assist.
If I form the opinion that you are just trying for a “gotcha” or otherwise acting in bad faith, why should I waste my time?
Just let me know what you need help with, and I’ll do my best to present relevant facts, if you can’t find them yourself.
In the meantime, if you quote exactly what it is with which you disagree, not only I, but other readers, will have the faintest inkling what you’re complaining about!
Cheers.
MF, you have always skipped out on relevant questions.
That’s your calling card.
Davie, Mike Flynn just asked you to state your specific question.
And YOU “skipped out”!
Hilarious.
It’s been done many times. Always ignored.
MF says: “If you are asking a question in an effort to seek knowledge, Ill endeavour to assist.
If I form the opinion that you are just trying for a gotcha or otherwise acting in bad faith, why should I waste my time?
… and that is exactly how we feel when you start in with
“I had a similar experience trying to sell CO2 house heaters….”
I’m really not sure if you are 1) trying for a “gotcha” with your CO2 house heater, or 2) so willfully ignorant that you think your example has anything to do with the warming of the earth due to CO2, or 3) simply acting in bad faith to annoy people.
Given how often you repost similar ideas, I don’t see much chance that you have any intention of learning — but you could always prove me wrong about those intentions.
barry,
Just for fun –
From RSS (which Dr Spencer no doubt knows about) –
“Sea surface temperature is a key climate and weather measurement obtained by satellite microwave radiometers, infrared (IR) radiometers, in situ moored and drifting buoys, and ships of opportunity. Different instruments measure the temperature at different depths. For instance, most buoys have sensors located at about 1 meter depth, or placed at regular intervals along a tether line. Sea surface temperatures, when measured from space, represent a depth that is related to the frequency of the satellite instrument. For example, IR instruments measure a depth of about 20 micrometers, while microwave radiometers measure a depth of a few millimeters.”
I know I’ve provided the following before, but some GHE enthusiasts have a short retention ability, so –
“Land surface temperature is how hot the surface of the Earth would feel to the touch in a particular location. From a satellites point of view, the surface is whatever it sees when it looks through the atmosphere to the ground. It could be snow and ice, the grass on a lawn, the roof of a building, or the leaves in the canopy of a forest. Thus, land surface temperature is not the same as the air temperature that is included in the daily weather report.” – NASA (which Dr Spencer also knows about, I suspect).
Of course, climatologists ignore both, and substitute some nonsense claiming air temperatures are actually surface temperatures – which leads some GHE supporters to claim that the term “surface” is not meant to be taken literally.
To complicate the issue, the Australian Bureau of Meteorolgy scientists decided that air temperatures recorded prior to 1910 were unreliable. Any definition of the surface prior to 1910 is obviously irrelevant in relation to Australia and its Territories, parts of Antarctica, and so on. Oh well.
David Appell may well be able to provide the secret climatological definition of the Earth’s surface, and the temperature thereof, but it seems that even so called climate scientists have difficulty.
Only the truly gullible or mentally afflicted would be silly enough to believe that increasing the concentration of CO2 in an atmosphere causes a rise in temperature. Which category do you fall into?
Cheers.
Mike Flynn 8:45pm, then you fall into the truly gullible category.
The sizes of various CERES radiometers mean it can resolve the snow and ice of say winter in a region of Canada (spatial resolution 1 degree lat. by 1 degree of long.); CERES does not have the spatial resolution to resolve grass on a lawn (or even a lawn!), the roof of a building and especially not the leaves in the canopy of a forest though it can resolve certain forest regions. You will want to double check the expertise at whatever link you used for your -NASA clip label.
And yes, follow the NASA rec. for checking the daily weather reports for your surface thermometer temperatures.
Ball4,
If you don’t believe nasa.gov to be reliable, maybe you should demand that the US Govt cut their funding. Have you any facts to contradict the NASA information?
May I point out, yet again, that daily weather reports, from NASA or anybody else, do not provide temperatures of the surface. GHE supporters have to attempt to deny, divert, and confuse, in an attempt to avoid appearing even more unscientific than they obviously are!
If you don’t accept definitions provided by RSS, the WMO, the IPCC, or NASA, you’re likely to look a bit silly to readers of the comments here.
Maybe you could get together with David Appell, and provide your own definitions. Don’t be too surprised if the response doesn’t include people bowing down in awe of your effulgent intellects.
Have NASA or RSS approached you or David to take up positions as bosses of those organisations? If not, I can’t say I’m surprised!
Cheers.
Air in the troposphere is compressed only by gravity. Therefore, an increase in air temperature must cause its expansion, as pressure increases.
Mike appears not to have the ability to check facts on his own, asks others: “Have you any facts to contradict the NASA information?”
The facts are on NASA dot gov CERES resolution expertise site. Ought to be easy to find for such a gullible commenter as yourself.
No funding cuts needed, CERES et. al. data is why you are here. Again, follow your own link for the NASA recommendation “the air temperature that is included in the daily weather report.” At least I accept definitions provided by RSS, the WMO, the IPCC, and NASA even if Mike does not.
“Have NASA or RSS approached you or David to take up positions as bosses of those organisations?”
No, Mike Flynn is even more gullible than I recently found out and I see now joins the category mentally afflicted.
MF wrote:
“David Appell may well be able to provide the secret climatological definition of the Earths surface”
If you don’t know what the surface of a planet is — or any manifold — you are beyond my help.
Currently increasing the surface temperature of the eastern Pacific, which causes an increase in evaporation of the ocean.
http://www.cpc.ncep.noaa.gov/products/analysis_monitoring/enso_update/ssta_c.gif
At the same time very slowly increasing the amount of heat accumulated by the ocean.
http://www.cpc.ncep.noaa.gov/products/analysis_monitoring/enso_update/heat-last-year.gif
Water vapor, unlike CO2, is mainly concentrated in equatorial regions.
https://earth.nullschool.net/#current/chem/surface/level/overlay=co2sc/equirectangular
http://www.ospo.noaa.gov/data/atmosphere/radbud/gs19_prd.gif
The North Pacific is very cold.
http://pamola.um.maine.edu/fcst_frames/GFS-025deg/DailySummary/GFS-025deg_NH-SAT4_SST.png
But you told me earlier co2 is a well mixed gas and drives the climate by trapping heat like a blanket. Now you say it only does this sometimes in random places around the globe……
By the way I started a new company selling thermos flasks insulated with co2 so as to keep peoples coffee hot. Have sold hundreds but am now gone broke because everyone wanted a refund, turns the co2 could not trap the heat after all 🙂
Crakar
The atmosphere and a blanket both trap heat, but the atmosphere is way more complicated. Don’t expect too much from a simple analogy.
For example, the atmosphere also has a strong cooling effect. A summer afternoon in Sydney would be HUNDREDS of degrees hotter if there was no atmosphere.
It’s a wickedly complicated subject.
It’s not that complicated, unless a person is wicked.
The atmosphere cannot “trap heat”, or warm the planet. It only cools the planet.
Nice and simple, not complicated.
g*e*r*a*n says:
“The atmosphere cannot trap heat, or warm the planet. It only cools the planet.”
So your hypothesis is that planets with atmospheres are cooler than planets without atmospheres?
You have proof of this hypothesis?
Planet Earth, Davie. Planet Earth.
Try to grasp the systems on this planet before blasting off to other planets.
Sorry, I need to retract my last statement:
Not HUNDREDS of degrees hotter…. I misremembered something. Still think a lot hotter but need to do a little research.
Snape, with no albedo, and peak Australian summer, Sydney would receive about 1400 W/m^2. That would correspond to about 400K, 127C, 261F.
I don’t want you to have to do any “research”, you might learn something….
Test
Rude. Irrelevant.
Trade winds (easterlies) are still strong in western to central Pacific. Neutral/la nina continue to be more likely by late summer
g*e*r*a*n
YOU: “Snape, with no albedo, and peak Australian summer, Sydney would receive about 1400 W/m^2. That would correspond to about 400K, 127C, 261F.
I dont want you to have to do any research, you might learn something.”
It is painfully obvious that he will not learn anything from your troll posts. You are not very good at reason or rational thought, excellent at annoying fellow posters for no real reason except you enjoy doing it.
Here is why your logic and reason are poor quality.
Moon surface:
https://tallbloke.files.wordpress.com/2012/03/diviner_moon_temperatures.png
The graph is in lunar hours which each hour being equivalent to 1.14 days. If you had even a bit of thought process you would see how little you understand science.
Look at the linked graph and in 54.6 hours of continuous Sunlight the temperature has risen to 27 C.
One hour of peak sunlight in the Australian summer would not raise the temperature to this degree. There is an effect of heat capacity of the real world.
Also with any atmosphere present the surface could not get so hot as convection would remove a vast amount of energy from the surface and spread it to cooler areas.
g*e*r*a*n
In your poor reasoning ability you only consider the hottest temperature to be significant as with the moon. For unknown reasons you do not think the colder part of the moon surface matters.
Here is something for you to consider (which is beyond your ability since consideration does not annoy anyone and it is unlikely you are able to do anything else but annoy and troll).
The Moon high is 116 C, the low is -180 C. The average between the two is a cold -32 C
Look at this graph.
https://www.esrl.noaa.gov/gmd/webdata/tmp/surfrad_590bfa8d3e1f3.png
In the hot desert on Earth you have a high of 37 C and a low of 25 C
with an average of 31 C.
Now with simple math which number is the greater of the two? Is minus 32 C warmer than plus 31 C??
Max 32 min 25????? Never been to Alice springs have you norman
Norman spouts off: “Also with any atmosphere present the surface could not get so hot as convection would remove a vast amount of energy from the surface and spread it to cooler areas.”
Norm, my poor lost puppy, the context involved Sydney, Australia, not the Moon. And, the scenario was with NO atmosphere. Translation–NO convection.
You just can’t get anything right!
Sydney would receive 1/4th of that, because the Earth is spherical and because it is rotating.
Davie, i’m not averaging energy, I’m talking peak solar intensity.
Sheesh, do you know anything?
g: Your assumption is unrealistic. And Sydney’s peak solar energy would still be lower, because of its latitude.
Davie, the solar flux drops off sinusoidally. Sydney is only about 10 degrees from max solar for Southern Hemisphere. That works out to be 98% of peak. I said “about”.
You are soooo desperate.
Now solar is low going lower so if temperatures do not decline from this point going forward I will be wrong this time. I will not be able to say this time that the sun did not cooperate.
Game on.
Crakar24,
I had a similar experience trying to sell CO2 house heaters. As I told my customers, the world’s finest climate scientists vouched for the heating properties of CO2. Even filling a house with 100% CO2 raised the temperature of a house not at all – not to mention the resultant inconvenience of the occupants having to wear external air supplies when in the house!
I feel quite let down. Maybe the whole GHE industry is a complete scam – the result of seriously deluded pseudo scientists being taken seriously!
Is it possible CO2 only heats up in the presence of sunlight (or another heat source)? All these climatologists, with their peer reviewed papers, 97% consensus, and super computers couldn’t possibly be wrong, could they?
Cheers.
What did you think? Of course a ‘greenhouse’ needs some sunlight to warm up.
The Sun is the number one driver. If it wasn’t there, our CO2 would be solid and around 3K.
The question was: given what the Sun does, does adding up CO2 have an effect. Well, it has an effect. Does it have a catachlysmic anthropogenic global warming effect, or just partly beneficial, partly negative, and mostly indifferent effects?
I see beneficial effects for far, if any. And I’m not just saying it is plant food, because its effects on plant growth are positive and undeniable. Really. People who deny the positive effects are just wind and solar power funded lobbyists.
It remains to be seen how much negative effects are in the queue. In any case, I don’t see a realistical cure that would fix CO2 emissions without being worse for us than the expected negative CO2 effects are.
Like, yes, if you give me 100% nuclear, I go for it, but at the moment, we have NO IDEA WHAT SO EVER how to stop CO2 emissions. The emissions are not only continuing, they are still growing. They are in China already as large as in the dreaded Western countries. They will be in India.
Stop being silly. CO2 emissions will not stop, because we need food, we need transportation, we need factories, we need steel, aluminium, plastic, science, recreation. THERE IS NO WAY stopping what is going on without killing the patient. So don’t even think about that. Some suggest that, killing the patient to save her!
Think about how to adapt. That’s cheap and comes in handy should the temps go up in Canadian Arctic. And stop pestering about non-problems like Maldives sinking before some year in the past.
“Does it have a catachlysmic anthropogenic global warming effect, or just partly beneficial, partly negative, and mostly indifferent effects?”
More to the point, does its effect set in motion a train of compensating effects that tend to reduce the aggregate impact to negligible levels?
It is a complex, nonlinear feedback system. It does not necessarily behave the same way in every climate state. So, there is no reason that CO2 cannot help warm the surface to its present state, but have diminishing returns as that state is reached. I.e., there is no contradiction inherent in saying that the GHE is real, and CO2 contributes to it, but it has very little additional impact in the current climate state.
It is said, and I agree, that all things being equal, a decrease in atmospheric emissivity due to accumulation of CO2 should produce an increase in average surface temperatures. But, all things are decidedly not equal. There are hydrological, biological, and mineralogical reactions, just to name a few of the obvious ones. There is no guarantee whatsoever that increasing CO2 today on average has even a non-zero aggregate impact.
More word salad.
Do you have any *science*? I’ve never seen an iota of science from you.
Again with the “word salad” meme. I suppose it does appear as such to you. But, if you do not understand technical arguments, why are you engaged in this debate?
You *never* offer technical explanations — just a bunch of hand waving word salad.
Did you ever take a college course in physics? (Seriously?)
Let’s see some real science, Bart.
So far, you’re demonstrated that you can’t provide anything like it………..
I do, you just do not understand them. I can’t dumb it down for you. You would need the necessary background, which you obviously do not have.
“What did you think? Of course a greenhouse needs some sunlight to warm up””
Not according to AGW pseudo-scientists. Backradiation shines at night too and provides warming! LMAO. According to the pseudo-scientists 1 W/m2 of backradiation is the same as 1 W/m2 of solar insolation.
Your tag is right. More wild than skeptical.
99.999% of Earth’s surface and atmospheric energy comes from the sun. The heat of the day takes a long time to dissipate at night. In fact, it never fully dissipates. Hence backradiation occurs night and day.
In order to get slower night cooling you need (a) daytime sunlight (check) and (b) more CO2 (check). Calling slowed and prematurely ending nighttime cooling as “warming” is an error from your side. The actual warming happens when sun shines the next day.
Waiting for you to pick up your ass you laughed off.
You’ll find an excuse, Salvatore. You always do.
“Also, here is my prediction for climate going forward, this decade will be the decade of cooling, DUE TO THE SUN, soi oscillation, volcanic activity, nao,ao oscillations ,pdo/amo ocean
DAVID I said due to the sun. Seems clear to me.”
– Salvatore del Prete, 7/5/15
– http://www.drroyspencer.com/2016/07/record-warm-2016-what-a-difference-one-month-makes/#comment-216470
Dave if temperature rise despite low solar from this point on you will be right.
Temperature has been rising for decades, despite a decrease in solar irradiance since the 1960s:
http://spot.colorado.edu/~koppg/TSI/TIM_TSI_Reconstruction.png
I’m already right.
To sum up my climate argument in one sentence.
It is a solar induced increased albedo ,lower sea surface temperatures which should translate to lower global temperatures as we move forward due to very weak solar activity.
Salvatore,
When people are too attached to a theory it can be hard for them to look at evidence without bias.
So Salvatore albedo decides.
http://www.ospo.noaa.gov/data/atmosphere/radbud/as19_prd.gif
http://www.ospo.noaa.gov/data/atmosphere/radbud/gs19_prd.gif
http://www.ospo.noaa.gov/data/atmosphere/radbud/gld19_prd.gif
I think so Ren .
How to increase albedo?
I say major volcanic activity , increase in global cloud coverage and global snow/sea ice coverage.
I say very low solar will promote the above.
Not to mention less UV light should lower sea surface temperatures overall.
Salvatore: volcanic influence on climate is temporary.
Not that you can predict when eruptions will happen.
BUT MAJOR VOLCANIC ACTIIVTY IS HIGHER DURING SOLAR MINIMUMS.
That is part of the equation for cooling.
Really? Prove that.
Then explain the causal connection.
Salvatore, what was wrong with this prediction?
“Dont you realize that, the warming that has now ended, that took place last century was one of the weakess warming periods the earth has undergone ,lets take a time period ,of the last 20,000 years.”
– Salvatore del Prete, April 7, 2011
https://bbickmore.wordpress.com/2011/04/05/roy-spencers-non-response/
The spacing is wrong. Apostrophes. The prediction is wrong. Among others.
and it has ended
When did the warming end, Salvatore?
You’ve said that before, and were wrong every time. Why should anyone believe you now?
“Dont you realize that, the warming that has now ended, that took place last century was one of the weakess warming periods the earth has undergone ,lets take a time period ,of the last 20,000 years.”
– Salvatore del Prete, April 7, 2011
https://bbickmore.wordpress.com/2011/04/05/roy-spencers-non-response/
The jet stream will continue to cause flooding in the US.
https://earth.nullschool.net/#2017/05/05/0000Z/wind/isobaric/250hPa/orthographic=-95.61,30.85,786
http://www.ssd.noaa.gov/goes/comp/ceus/flash-wv.html
Once again, the ideal gas law must be satisfied and until you lot can understand that there’s no point talking theory about GHGs warming the surface.
PV = nRT
Keep V and n constant because they are essentially constant in the atmosphere. That means P = T and we all know that to be true. Near the surface, the attraction of gravitational force is greatest and air pressure near the surface is greatest in an ideal environment. We know temperature is generally greatest near the surface.
Now, let’s talk partial pressures. There are 4 main gases in the atmosphere, N2, O2, Ar, and CO2. Water vapour should be included.
The contribution of warming in the atmosphere per gas is related to its partial pressure hence its mass. It doesn’t take a degree in rocket science to see that N2 and O2 account for nearly 99% of the mass of the universe and nearly 99% of the partial pressure.
N2 and O2 contribute close to 99% of the warming and CO2 at 0.04% could contribute no more than 1/100ths C.
QED. CO2 has absolutely nothing to do with atmospheric warming or surface warming.
“It doesnt take a degree in rocket science to see that N2 and O2 account for nearly 99% of the mass of the universe…”
Brain lock…I obviously meant atmosphere, not universe.
“That means P = T and we all know that to be true.”
Except for nature which doesn’t cooperate with Gordon’s assertions for an atm. A quick glance at Vancouver Airport weather last 24hr.s shows times when pressure goes up and temperature goes down. Thus P .NE. T at times in nature.
As Dr. Feynman would say, so much for that pet theory.
https://weather.gc.ca/past_conditions/index_e.html?station=yvr
GR wrote:
“CO2 has absolutely nothing to do with atmospheric warming or surface warming.”
Do you think CO2 doesn’t absorb infrared radiation, or do you think the Earth doesn’t emit any?
Davie, if all CO2 did was absorb IR, it would be a “heat sink”. It it both absorbed and emitted, it would be a “heat conductor”.
CO2 is NOT a “heat source”. You must get that worm out of your brain.
g*e*r*a*n
YOU: “CO2 is NOT a heat source. You must get that worm out of your brain.”
Or you must rethink your unscientific assertion. You are making a declarative statement with no context and hence demonstrate your poor reasoning skills.
CO2 can be a “heat source”, it depends upon external conditions. If the CO2 gas is hot and the surroundings are cool it will definitely be a “heat source”
Currently the atmosphere has temperature so CO2 is an energy source. It is emitting IR energy in all directions based upon the atmospheric temperature where it resides. So CO2 is an energy source. The Downwelling IR given off by CO2 in the atmosphere will be absorbed by the Earth’s surface and hence require less internal kinetic energy to be used in maintaining the upward energy flux (which is only based upon the Earth’s surface temperature). The overall result of this returning energy will keep the Earth’s surface warmer than if the CO2 were not present.
If the Sun was gone, the Earth’s surface cooling would be slower than the Moon. The poles go 6 months a year with no Sun (far longer than the Moon’s 27+ day night).
If you dare to care you can look at CERES graphs and look at The South Polar area (-65 North, -90 South).
You will find that the DWIR in the cold dark winter is around of Antartica is about 165 W/m^2.
The Upwelling IR is 185 W/m^2.
So during the dark long night of the Antarctica Winter, because of GHE the region is only losing 20 W/m^2 instead of 185 W/m^2. So in your logical thought process which rate of energy loss is greater? This would clearly mean GHG is warming the Antarctic considerably as it would be much colder without the presence of these gases. Warming is a relative and not an absolute term when comparing two potential states.
Norm, with your lack of understanding of physics, you just can’t get anything right.
A thermodynamic “heat source” brings NEW heat energy into a system. A mass warmed from within a system is NOT a heat source.
You’ve never had any course close to thermo, so quit trying to fake it.
“A thermodynamic heat source brings NEW heat energy into a system”
New energy huh? Now anger resorts to creating energy. Next anger will resort to destroying some energy. Hilarious.
All in a days comments from anger. Actually find energy can only be transformed, anger, once you get some lab work accomplished.
Now don’t be angry, just calmly study nature in action.
Ball4, your lack of science knowledge puts you in the same category as Norm.
Strike a match in your apartment. You are converting chemical energy into heat energy. The match is now a “heat source” within the apartment (system). You are adding “new” heat energy to the system.
Your lack of understanding is hilarious.
Sorry anger, the energy was always in the match, the energy is not newly created as you write. Hilarious.
anger thinks if I extinguish the match flame I’ve destroyed its energy.
PS Ball4, if you plan to do any “lab” experiments with matches, make sure you have some adult supervision. Matches are NOT toys. You can burn yourself!
This is just a boring word game.
And yes, I have actually studied physics to extent I know what I talking about.
“CO2 is NOT a heat source.”
Nobody thinks it is.
Stop with the red herrings.
Davie, ever hear of “climate forcing”. It’s a common term used by Warmists/pseudoscientists. The units are “Watts/m^2”.
If you continue with your pseudoscience, you must believe CO2 is a “heat source”. You don’t want to get kicked out of the AGW cult, do you?
W/m is the unit of energy flow density over surface. Nothing to do with heat sources but with energy flow. And components of energy flow are summed up to get the total flow.
wert is in denial that CO2 warms the planet!
Welcome to reality wert!
GR wrote:
“The contribution of warming in the atmosphere per gas is related to its partial pressure hence its mass.”
Prove this.
Oh that’s just oversimplified BS. And once you see such stuff, usually the people parroting that are not really going to learn something.
But anyhow, Jupiter is very hot at the bottom, so the size of the gas ball does have an effect on its temperature.
There is more CO2 in Mars (0.6 mb) than here (0.041 percent). I think Mars needed a thick atmosphere to be warm, thicker than the Earth if the composition was similar. I’m not sure exactly how warm Mars would be with a 1013 mb CO2 gasosphere, perhaps you can provide with a scientific approach? But be very careful, some people would calculate the temperature and want it to be high or low result based on their beliefs, so they’d do a mistake in one direction only. Mars is also described by being a dry planet, so its temperature swing and latitude-specific temperature gradient would be different. As also the thick atmosphere would have a tremendous storm capacity.
The hard part here is of course the ceteris paribus, which is never applicable. Warm Mars would be wetter with water and gas leaking from the ground, with no polar ice, albedo changed, dust in air, etc.
Mass of Martian atmosphere is 200 times less than Earth’s, and surface pressure is 0.6% that of Earth’s. Though CO2 is 95% of the Martian atmosphere, and it is more abundant in the atmosphere (mass) than on Earth, the extremely low density of the gasosphere lets upwelling IR escape to space far more rapidly than through Earth’s atmos. Mass of all GHGs in Earth’s atmos (incl water vapour) is 4 times greater in Earth’s atmos. Water vapour is a stronger absorber of IR than CO2, to, so the ‘greenhouse’ effect on Earth is much stronger than on Mars in several ways.
Gordon Robertson
The only thing going with your poorly thought out assertion is reality. Empirical evidence. The thing the non-scientists on this thread (g*e*r*a*n and Mike Flynn) will never consider or ignore. It suits there troll behavior and they have no interest in reality or truth, just how much dwarf beard they can pull to get a cheap thrill for the day. Pathetic waste of keyboard time but each to his own.
Gordon I hope you are not like the trolls who have little interest in the truth.
Here look at the graph. This is empirical evidence (unless your name is Kristian as he is unable to think what this evidence relates).
https://www.esrl.noaa.gov/gmd/webdata/tmp/surfrad_590bf4ca0c802.png
The Downwelling IR is a real and measured value. If you want to be a nonscientist you can ignore the reality. The DWIR comes from pointing an instrument up in the sky so the only radiant energy to hit the sensing material is IR radiation coming from the sky which hits the instrument and also the Earth’s surface.
I would not try to convince the resident trolls since they really do not care and their agenda is to annoy someone with whatever method they can find.
I try to convince you since I think you might be a person who really wants to know the truth. I can only hope you are such a person.
Gosh Norm, I just can’t get enough of your mindless rambling, attempted insults, and hilarious pseudoscience.
More, please!
g*e*r*a*n
YOU: “Gosh Norm, I just cant get enough of your mindless rambling, attempted insults, and hilarious pseudoscience.
More, please!”
Yes I know how to make you happy. I have taken care of your needs. When will you actually read a science textbook? It might be even more fun than reading my posts.
Sarcasm, like science, flies right over your head.
Norman says, May 4, 2017 at 9:47 PM:
Yeah, that sure didn’t take long, did it? Here he is again, pontificating – on repeat – from his tiny veranda up on his exceedingly snug little bubble mansion about things he evidently doesn’t understand in the least. Well, to each his own.
I know of course – from a seemingly endless string of empirical observations – that the back of this particular duck is perfectly resistant to all perspectives different from that of its owner. But here goes, for the umpteenth time:
No. This is NOT empirical evidence of the atmosphere irradiating the surface with a separate incoming macroscopic (thermodynamic) flux of energy, right next to and just like the solar heat flux, directly raising the surface temperature in the process. Plotting things on a piece of paper doesn’t magically turn them into real, detected phenomena. These values are ALL simply CALCULATED!
Of course there are PHOTONS being exchanged at the surface all the time. But this process is a single and fully integrated one; the exchange happens instantaneously, continuously, simultaneously. There are NO separate macroscopic fluxes of energy (W/m^2) coming in or going out. That is – still – just a mental construct, a highly simplifed mathematical model of reality, and nothing else. There is always a LOSS – and a loss ONLY – in “internal energy” [U] for the surface in its radiative thermal exchange with the atmosphere above. Empirical evidence: It cools during the night.
Kristian
Have you done any actual testing yet? I didn’t think so. I have done actual tests and you are just wrong. No textbook supports your view, no evidence support your view. You think everyone else is wrong but will do not tests one way or the other.
Yes there are macroscopic flows of energy toward and away from the surface. Photons are moving away and toward the surface. Photons are bosons and do not exchange energy with each other. They move right on through. They can interfere but do not exchange any energy with each other. The photons moving down from the atmosphere do not exchange energy with those moving upward. You can integrate the energy of all the downwelling photons that strike an area of surface in a given amount of time and that becomes a MACROSCOPIC flow of ENERGY into the surface. Please do some experiments and when you do then tell me what I don’t know. Or read a textbook. I have linked you to several and they ALL say what I do and NOT one says what you do. Why is that? And yet for some reason you think you understand physics correctly.
The actual physics, which you never seem to read but keep up the posts of your unfounded physics based on nothing but your own opinion. All surfaces emit energy away from their surface based upon their temperature. It is an actual macroscopic flux of real energy. If you have more than one surface each surface radiates away (which can easily be tested with an FLIR that you will never use) energy based only upon its temperature with a macroscopic flow of energy away (integrate the photons leaving, none are returning to the surface that emitted them). The IR from another surface will have a macroscopic flow of energy away from its surface. This energy will move to and be absorbed by the emitting surface, real energy, real macroscopic flow.
Kristian: “There are NO separate macroscopic fluxes of energy (W/m^2) coming in or going out. That is still just a mental construct.”
Not according to nature Kristian, your mental constructs are heat and insulation. Nature’s construct is every object radiates at every other object in its view creating two real macro streams made of incoherent photons (EMR).
No matter what Kristian calls heat or insulation, nature demonstrates both added solar energy flux and added atm. energy flux result in a higher near surface L&O temperature than without the energy flux.
Kristian needs to hit the lab. Study lotsa’ results from nature not just read wordsmiting blog sites using heat and insulation mental constructs.
According to Kristian’s clip above, someone has found an object that does not radiate if there are NOT two separate fluxes. That would need a replicable lab test and Kristian hasn’t gone anywhere near a lab in quite awhile according to his comments.
Ball4
I like your post. You are the one who has demonstrated that I should use energy flows and leave the calculated heat flux out of the posts.
I would like Kristian to explain something.
If you have a plate at a certain temp in a vacuum (to eliminated conduction or convection) you can measure the rate temperature change on a graph.
Get the plate back to the same initial temperature and now put another plate (less temperature than your original plate) facing it and relatively close (to minimize field of view considerations). You can see your original plate temperature is not going down as much. Why? What is the other plate doing that lowers the rate of temperature change? If the second plate is not sending a macroscopic energy flux to the original plate why does the rate of temperature drop go down with the other plate. And you could try many various temperatures of the second plate and see how they all affect the rate of temperature drop of the original. Since the plates are not in contact and there is no air between them to conduct energy, what exactly is the second plate doing to the first to slow its cooling rate? If it is not adding energy to the first what exactly is it doing? Does the IR from the second plate have the ability to suppress the rate of emission from the original plate? Describe exactly how this process might work.
Kristian you call Ball4 the troll. You are just a loud salesman pitching your ego version of reality and the scientists are not buying it. Go sell you wares in your own market (your blog) and see how many scientists come to you for your brilliant revelation that all of them have somehow missed.
Norman, your thought experiment reads a lot like Dr. Spencer’s actual plate experiment at 1bar with convection minimized (except for a slight demo) where some of the usual suspects showed up except for Kristian being on vacation.
http://www.drroyspencer.com/2016/08/experiment-results-show-a-cool-object-can-make-a-warm-object-warmer-still/
Kristian says:
“This is NOT empirical evidence of the atmosphere irradiating the surface with a separate incoming macroscopic (thermodynamic) flux of energy, right next to and just like the solar heat flux, directly raising the surface temperature in the process.”
It’s been measured, by many. As in Norman’s graph, as in the Philipova and Feldman papers I’ve often cited, and in many more.
Instead of pontificating in bold text, tell us what is the error with these measurements.
David Appell says, May 5, 2017 at 4:35 PM:
First, David: Rolf Philipona is not a woman, he’s a man, and she’s not Russian, he’s Swiss.
Secondly, I have no problem with the “measurements” themselves, only with how people like you (and Norman) INTERPRET them.
Kristian, what is wrong with our interpretations of the measurements of the downward infrared radiation?
Kristian,
is it because DWLWIR is sort of a reflection that you only want to talk about the net balance here?
You say that only the difference can be measured, but that does not matter because you acknowledge that there are incoming and outgoing photons (“from all directions” – e.g. from above onto a flat surface).
Just to clarify, how do you think of the radiation balance with a distant star, which might be gone by the time our photons get there?
Is it not more reasonable to assume that earth radiates similarly in all directions, instead of calculating a net towards every spot in the sky?
Errol says, May 6, 2017 at 3:17 AM:
No, it’s because the net balance is all there is. The idea of two separate macroscopic fluxes (in/out) to the surface is but a mental construct, a simplified, geometrically constrained model of reality.
Why exactly doesn’t it matter? Acknowledging that there are photons flying in all directions doesn’t mean that one is thereby “admitting” that there are two separate, opposing macroscopic fluxes (W/m^2) occupying the exact same radiation field, like two straight arrows on a piece of paper.
You should read up on “statistical mechanics”, to get a grasp of the fundamental distinction between quantum (MICRO) realm phenomena and thermodynamic (MACRO) realm phenomena. Should be enlightening …
Don’t worry. There’s no need to calculate “a net towards every spot in the sky”, Errol. You can easily consider the Earth to be a “pure radiator” in space:
http://hyperphysics.phy-astr.gsu.edu/hbase/thermo/cootime.html
The Sun is basically the only celestial body that you need to account for radiatively when considering Planet Earth’s thermal exchange with its surroundings (space).
Kristian,
It doesn’t matter that you think separate fluxes can’t be measured, because you understand and accept all the physics involved, for example that there are photons flying in all directions.
It is only when you add all incoming photons from above that you get a straight line, so you are right that this arrow is not “real”.
In your example with the Sun, is it not so much more reasonable to first determine the spectrum of each than to always bundle them up?
Errol says, May 6, 2017 at 10:59 AM:
I’m sorry, but I’m still not sure what you’re getting at, Errol.
I don’t THINK separate fluxes can’t be measured. Two opposing macroscopic fluxes occupying the exact same thermal radiation field CAN’T be measured separately. That’s a physical fact. You will HAVE TO somehow manipulate the set-up to make it SEEM that you’re “measuring” two separate macroscopic fluxes of energy inside the one. What you do is EITHER, 1) calculate two opposing fluxes from actually detected physical inputs like “net LW exchange” (radiative heat flux) at sensor and sensor temperature, OR 2) cool your detector to such a low temperature that the incoming radiation itself comes close to a perfect radiative heat flux.
You CANNOT physically detect the sfc UWLWIR (-398 W/m^2) and the atm DWLWIR (+345 W/m^2) separately. You can ONLY EVER detect the NET exchange of photons, which equals the sfc radiative heat flux. MATHEMATICALLY, the sfc radiative heat flux is the UWLWIR minus the DWLWIR, [-398+345=] -53 W/m^2, a negative value, which means that there is always a LOSS in sfc U (“internal energy”), and thus a drop in sfc T, resulting from the radiative thermal exchange between the warmer sfc and the cooler atm above.
So the UWLWIR and DWLWIR “component fluxes” are merely conceptual entities, potential radiative heat fluxes. Mathematically, they’re simply the radiative expressions of opposing system temperatures.
You can’t “add” all incoming photons without also “subtracting” all outgoing photons at the same time. The IN/OUT-exchange happens simultaneously. It is one single, fully integrated process. The separate “incoming flux” vs. “outgoing flux” concept is just a highly simplified model of reality, all conjured up inside the human mind. In reality, there’s a “photon gas/cloud” filling the entire radiation field, and an instantaneous, continuous exchange of energy throughout. Through this “photon gas/cloud” there’s a probabilistic potential gradient of radiative intensity, from high at the surface (higher T) to progressively lower up through the tropospheric column (lower T). The net (macroscopic) movement of radiant energy, the radiative flux, moves DOWN this gradient and ONLY down. From surface up towards space.
No. Why would you think that?
Kristian, I’m trying to understand.
So you can only detect net exchange of photons.
Exchange would imply incoming and outgoing photons.
Photons carry energy.
In other words you say it is hard to measure the separate flows, but you believe they exist.
You say you can measure them separately if you cool the sensor.
Errol says, May 7, 2017 at 4:17 PM:
No. They DON’T exist. Not as separate macroscopic entities. The photons exist. But they aren’t separate macroscopic entities. They’re MICROscopic entities.
No. That way you can make it SEEM you’re “measuring” them separately. But you’re still only detecting a net exchange of photons. Quantum detectors aren’t really built to detect (let alone quantify) macroscopic fluxes of radiation. They’re built to detect specific photons, normally within rather narrow wavelength ranges. The radiometric instruments most commonly used when “measuring” the atm DWLWIR and the sfc UWLWIR are called pyrgeometers and use sensors of the “thermal” kind – they sense the radiative heat transfer directly at their surface, whether it’s coming in OR going out.
Kristian,
If there was a photon counter that could produce an incoming spectrum, do you think it would look different to the measurements we already have? In what way?
Would it look different to the spectrum from a cooled sensor like you proposed, i.e. one with a negligible amount of outgoing photons?
David,
Things always have a tendency to go round in circles with you. It’s just upthread, on this very string that you’re posting on right here:
http://www.drroyspencer.com/2017/05/uah-global-temperature-update-for-april-2017-0-27-deg-c/#comment-245700
Gordon, you’re ignoring quantum effects, which are responsible for the greenhouse effect.
Davie, what are you babbling about now?
Quantum effects are part of the reason the GHE is bogus!
gordon. Why do you think that the different properties of the gases can be ignored?
David says we can control C02. But only 1 percent of the 4 percent.its a bit like steering your car with a piece of string. Also David if you want a no atmosphere model. ,Their is one not to far away.its called the moon.NASA may have temperature records
We are controlling CO2 right now — that’s why it’s increasing in the atmosphere.
Someday, I think, we’ll control it on Mars and begin to terraform the planet.
The Moon’s temperature is easily explained by standard radiative physics, as I showed here:
http://davidappell.blogspot.com/2012/04/norfolk-constabulary-made-wrong-charges.html
Has anyone considered cloud cover as a factor in global temperatures.the CERN biosphere experiment suggested that their was much more cloud cover before the industrial revalution .They found that trees can seed clouds by giving off biogenic vapours.and it may be case of a simple lack of trees in our modern world
Everyone has considered cloud cover. It’s in every IPCC report, for example.
Though CERN have not published anything on pre-industrial cloud cover, an article from CERN stated:
Therefore, the cloudiness in pre-industrial times was more similar to the present situation than previously thought
https://cds.cern.ch/record/2155296
sorry Barry ,both papers published in nature,state that pre-industrial times may have been much cloudier than first thought,by itself it proves nothing,just another pointer to how little we actually know about what is happening in the atmosphere
Ian, would you please give links to these papers? Thanks.
David best I can do at the minute is http://www.nature.com CERN cloud experiment. There is a link to Jasper Kirby one of the scientists who ran the chamberi can’t give the links .My useless broadband speed won’t let me running less than 2 my.its nothing conclusive. Just interesting
Could you link to the papers? I might be looking at different ones.
by itself it proves nothing,just another pointer to how little we actually know about what is happening in the atmosphere
Does it not indicate how little we know about pre-industrial atmosphere? We have a much more comprehensive monitoring system of the atmosphere now.
I’d love to see those papers.
I assume Ian couldn’t find such papers, if he looked. I couldn’t. but I did find a paper or two from CERN on which the pre-industrial claim is based. The papers don’t discuss pre-industrial cloudiness at all. The CERN article I linked above mentions pre-industrial cloudiness, but the paper it references does not.
Hi Barry. Did you try Jasper Kirby.its interesting but not final.much more to be done.they may run it again if directed to
Ok, so I found the 2 papers from a WUWT article. The pre-industrial condition was mentioned in one of them.
This could raise the baseline aerosol state of the pristine pre-industrial atmosphere and so could reduce the estimated anthropogenic radiative forcing from increased aerosol-cloud albedo over the industrial period.
In the CERN article I noted above, it is hypothesised from CERN experiments that pre-industrial cloudiness is similar to post-industrial, whereas before it was thought pre-industrial times were less cloudy owing to fewer anthropogenic aerosols.
The consequence for attribution of forcings on climate is that the historical cloud forcing component is reduced.
Here are both papers. The first contains the quote.
https://www.nature.com/nature/journal/v533/n7604/full/nature17953.html
https://www.nature.com/nature/journal/v533/n7604/full/nature18271.html
Hello Barry yes that’s what I found.i think the problem they have it’s all to controlled .But the real world is not.ill have a go at Brian Cox see if he has any !NFO.its a while since he worked at CERN.but may have contacts
Nope.
2010 is a whole year.
The closest comparable data point we have for ‘now’ is 2016.
Test
My posts keep getting lost
my short “test posts” go through. Longer ones get lost?
It’s a site glitch. Everyone has the same problem from time to time.
Usually it’s a particular collection of letters. For instance, these won’t let you post:
N.S.I.D.C
H.a.d.C.R.U.t.4
A.b.s.o.r.p.t.i.v.e
(if you remove the punctuation)
If a link is responsible, convert it to a tinyurl.com link and it always gets through.
Barry
I didn’t have any problems until very recently.
Well, that worked fine. I will try a longer post.
Several knuckleheads on this blog believe the atmosphere only cools the planet. Simple logic to the contrary is labeled “pseudoscience”, with no explanation. Their main tactic when discussing this subject is: insult/evade. They will avoid honest debate.
Snape, you might want to debate this “knucklehead”. He believes the atmosphere has a “strong cooling effect”.
http://www.drroyspencer.com/2017/05/uah-global-temperature-update-for-april-2017-0-27-deg-c/#comment-245599
What would the temperature be in Sydney, on a clear summer’s day, if there were no atmosphere and thus no convection?
The albedo from clouds, made possible by our atmosphere, does indeed have a strong cooling effect. On the other hand, cloud cover at night does the opposite. It acts as insulation and traps heat that would otherwise be lost to space.
The atmosphere is complicated place
The average temperature on earth, which has an atmosphere, is much warmer the the average temperature of the moon, which does not.*
* (Recent discoveries reveal the moon does have an atmosphere, but it’s so thin as to be insignificant when compared to earth’s)
It has both warming and cooling properties, it’s not one or the other. (but as mentioned above, it turns out the warming wins.)
Snape, you asked above, “What would the temperature be in Sydney, on a clear summers day, if there were no atmosphere and thus no convection?”
My S/B calculations are good estimates for maximum values. To get any closer wold require so many assumptions that the effort would become guesswork.
http://www.drroyspencer.com/2017/05/uah-global-temperature-update-for-april-2017-0-27-deg-c/#comment-245608
Your calculation was irrelevant to the discussion. Atmosphere and albedo are not interchangeable.
Snape opines “The albedo from clouds, made possible by our atmosphere, does indeed have a strong cooling effect. On the other hand, cloud cover at night does the opposite. It acts as insulation and traps heat that would otherwise be lost to space.”
Snape, you are confused. When I said the atmosphere only cools, I was talking about the atmosphere as a whole. I am not talking about localized weather. I am not talking about a mass of warm air that moves into your ghetto. I am talking about the trillions of Joules being lost to space every second, of every day, of every year. THAT is some serious cooling!
Localized cloud cover is NOT the entire atmosphere.
If GHG’s were not increasing, rate of heating and cooling would be equal. This does not mean the atmosphere does not trap heat.
When a person is in a sleeping bag, heat produced by their body and lost to the outside air are equal. Otherwise the person would get too hot (which, yes, is sometimes the case). Does this mean the sleeping bag does not trap heat?
My advice is to leave the Moon out of the discussion until you learn how Earth’s atmosphere works.
Keep your feet on the ground, so to speak….
The moon is pertinent to our discussion because it demonstrates the value of our atmosphere by way of contrast. The laws of physics do not apply to the earth alone.
You just want to keep the moon out of the debate because it destroys your argument.
If your afraid to consider the moon, then consider this:
On a calm, clear night we can observe the effects of radiative cooling – it gets colder. But where is this cooling most pronounced? At high altitudes and arid deserts – places where the atmosphere is thin. At locations where the atmosphere is more dense, like the tropics, there is also much less radiative cooling.
“Your calculation was irrelevant to the discussion. Atmosphere and albedo are not interchangeable.”
(I feel like I’m talking to Norman!)
Snape, in your wildest imagination, how did I interchange atmosphere and albedo?
Ok, I misunderstood you. I see you were referring to the albedo from clouds alone, and not from Sydney’s total albedo. There’s a difference.
In my “wildest imagination” I believed you were knucklehead enough to calculate Sydney as a blackbody (no albedo).
“Ok, I misunderstood you. I see you were referring to the albedo from clouds alone, and not from Sydneys total albedo.”
Your scenario did not involve an atmosphere. So, there was NO atmospheric albedo. How could you misunderstand your own scenario?
Then, you bring out your sleeping bag! Do you not understand the difference between conductive and radiative heat transfer?
I’m guessing, like Norman, you’ve never has a college-level physics course.
It was understood albedo had nothing to do with the discussion, so why did you bring it up in your calculation?
“Snape, with no albedo, and peak Australian summer, Sydney would receive about 1400 W/m^2. That would correspond to about 400K, 127C, 261F.
I dont want you to have to do any research, you might learn something.”
The sleeping bag analogy is not intended to illustrate the difference between radiation and conduction. It’s a familiar example of insulation.
Besides having no physics background, Snape must be a blond.
I specify that there is NO albedo in my calculation, and Snape thinks I am bringing it into the calculation!
(You just can’t make this stuff up!)
There is no grapefruit in your calculation either… thankfully you didn’t point that.
This would have been clear:
Snape, with no atmosphere , and peak Australian summer, Sydney would receive about ….”
Instead you wrote,
Snape, with no albedo, and peak Australian summer, Sydney would receive about…..”
The city of Sydney does indeed have albedo. Your wording is makes it sound like you are trying to calculate it’s temperature as if it were instead a “blackbody” (no albedo).
Ger* why the need to belittle? Reflects some deep insecurity, usually..
“The sleeping bag analogy is not intended to illustrate the difference between radiation and conduction. Its a familiar example of insulation.”
Oh, I thought you wanted to learn how the atmosphere cools the planet. But now you want to talk about insulation.
Hilarious.
I guess you prefer one thing at a time.
In my mind, the two topics are essential to understanding the atmosphere – they combine to create an equilibrium of incoming and outgoing energy in our atmosphere and thus relatively stable temperatures.
As to CO2 heat trapping, heating, or other mystical concepts.
Everything in the known universe can be heated. Everything in the known universe can cool – all the way to 0 K, at the limit.
Nothing in the known universe is transparent to radiation – except the absence of anything, which is a vacuum.
Any gas can be heated to, say, 500 C, by the simple expedient of compressing it quickly and sufficiently. Even keeping it at this pressure, it cools. So, compressed gas is no hotter than uncompressed gas, after a period.
As a test, ask someone of the GHE persuasion to explain the heating of air by compression in a lightless cylinder, to 500 C or so – as in a compression ignition engine (Diesel), for example.
The description can be expressed using nothing more than the interaction between photons and electrons, but GHE supporters will be unable to give any coherent explanation, able to withstand even the most cursory and elementary queries.
GHE? A folly foisted by fools upon the gullible!
Cheers.
Read this book, it will help you to grasp some fundamentals:
https://books.google.de/books?id=J2KZq0e4lCIC&printsec=frontcover&dq=michael+modest+%22radiative+heat+transfer%22&hl=en&sa=X&ved=0ahUKEwji-OjW5JzTAhUlJMAKHedZDroQ6AEIJDAA#v=onepage&q=michael%20modest%20%22radiative%20heat%20transfer%22&f=false
Bindidon,
I generally don’t respond to demands from GHE supporters to do this or that, without good reason.
I’m not sure what you are disagreeing about. Maybe you could quote my exact words, and provide a direct quote from your reference supporting your contention that I am mistaken.
If you are unable to achieve this seemingly trivial task, others might assume that you are only following the “deny, divert, and confuse” paradigm, used by those who have great faith, but little fact.
In any case, after you have read and comprehended chapter 10 of your linked reference, you might have a change of heart – or maybe not! Cut and paste is probably not that difficult – at least it will show you are prepared to make a minimal effort.
Or you could just attempt the usual deny, divert, and confuse tactics. They don’t seem to work too well, theses days.
Cheers.
Mike Flynn says:
May 5, 2017 at 9:22 PM
Less GHGs less impediment to radiation reaching the surface from the Sun, or being emitted by the surface to outer space.
http://www.drroyspencer.com/2017/05/uah-global-temperature-update-for-april-2017-0-27-deg-c/#comment-245860
My question for Dave is where is the global warming? It seems to be stalled and related to ENSO when it does occur.
See the graph at the top of this post? That’s your global warming. It’s recently reached record levels, and is anything but “stalled.”
It is *SO* amusing to see Dr. Spencer et al post a number here, then see 380 comments ensue. It’s truly amazing.
(With liberties: “Lyings and Tryings and Trolls, OH MY!”)
Glad to participate for your entertainment. I trust you didn’t read any of them.
@barry: I avoid only yours.
Yes, you’ve demonstrated that with your reply.
I notice you’re helping bump the post count higher. Thank you for your donations.
Wiz Geek says, with liberties tryings and trolls oh my, sarcasm is the lowest form of wit
Wiz Geek – ever tried poking an ants’ nest with a stick?
You see a similar effect here.
The usual suspects appear and get all excited, running around in circles, at least once a month.
@DrNo: Excellent observation! I guess it’s fun for some to argue with conjecture. Maybe it’s cathartic or even therapeutic to do so. I’ll continue to scan these “tomes” hoping science will triumph over conjecture. Until then: Poke with reverence, earnest aplomb, and keen objectivity.
Wiz: Are you a Jack Vance fan?
No, Lewis. I’m not familiar with Vance’s work. What is the relevance?
Dr. No: Yes, sometimes even no poking is required, the usual suspect roundup ants just jump right out at you. I’m shocked, shocked! to find that science is going on in here!
I’m sorry. I see very little science going on.
Apart from my good self and a few other brave souls who attempt to educate them, most of the ants are non-scientists.
That’s why I am so shocked. Of all the blog joints, in all the towns, in all the world, the ants walk into this one. I came here for the science in comments. I was misinformed.
I’ve done a lot of thinking since then, and it all adds up to one thing: can’t educate the ants.
Sadly, you may be correct.
@UK-Ian-Brown: My butchered quote was neither sarcasm nor wit–it was accurate. 😉
No WizGeek it was pointless.you obviously have nothing intelligent to say on the subject
No cites to your Nature papers, above, huh?
Can’t be bothered?
Too many theories to contend with?
Where the jet stream takes its energy?
https://earth.nullschool.net/#2017/05/06/1800Z/wind/isobaric/250hPa/orthographic=-129.48,87.35,342
http://images.tinypic.pl/i/00898/lqx6e41yliet.png
Where? Yes, where. Where. Where? — Where!!?
That’s where.
The troposphere on Venus contains 99% of the atmosphere by mass. Ninety percent of the atmosphere of Venus is within 28 km of the surface; by comparison, 90% of the atmosphere of Earth is within 10 km of the surface. At a height of 50 km the atmospheric pressure is approximately equal to that at the surface of Earth.[19] On the night side of Venus clouds can still be found at 80 km above the surface.[20]
The altitude of the troposphere most similar to Earth is near the tropopausethe boundary between troposphere and mesosphere. It is located slightly above 50 km.[17] According to measurements by the Magellan and Venus Express probes, the altitude from 52.5 to 54 km has a temperature between 293 K (20 C) and 310 K (37 C), and the altitude at 49.5 km above the surface is where the pressure becomes the same as Earth at sea level.[17][21] As manned ships sent to Venus would be able to compensate for differences in temperature to a certain extent, anywhere from about 50 to 54 km or so above the surface would be the easiest altitude in which to base an exploration or colony, where the temperature would be in the crucial “liquid water” range of 273 K (0 C) to 323 K (50 C) and the air pressure the same as habitable regions of Earth.[10][22] As CO2 is heavier than air, the colony’s air (nitrogen and oxygen) could keep the structure floating at that altitude like a dirigible.
https://en.wikipedia.org/wiki/Atmosphere_of_Venus
https://upload.wikimedia.org/wikipedia/commons/thumb/6/63/Venusatmosphere.svg/1024px-Venusatmosphere.svg.png
Tropopause Venus, just like the Earth, is at about 100 hPa (0.1 bar).
At the same pressure, the temperature in the troposphere is similar to that of Earth, although Venus is closer to the Sun.
Yes, the sulphur clouds have a very high albedo, so the greenhouse warming is what gives such high temperatures nearer the surface.
Another interesting factoid – the average surface temperature of Venus is higher than that of Mercury, which is much closer to the sun and has no atmosphere.
g*e*r*a*n
YOU from somewhere above: “Snape, you are confused. When I said the atmosphere only cools, I was talking about the atmosphere as a whole. I am not talking about localized weather. I am not talking about a mass of warm air that moves into your ghetto. I am talking about the trillions of Joules being lost to space every second, of every day, of every year. THAT is some serious cooling!
Localized cloud cover is NOT the entire atmosphere.”
I suppose in your logic that 203 quadrillion is a smaller sum than 123 quadrillion. I know you get your math backwards often.
Take the Earth’s surface at 510 trillion m^2 and then TOA area of 511 trillion m^2. Now you have the total emitting surface temperatures of Earth surface and TOA. Average emission from the Earth’s surface is given as 398 W/m^2 (derived from CERES) and the TOA average is derived at 240 W/m^2.
If you multiply the area of Earth’s surface you get around 203 quadrillion joules/sec leaving the entire surface. At the TOA you get around 123 quadrillion joules/sec.
If you had no atmosphere at current conditions for the surface it would lose considerably more energy than with an atmosphere.
Not that I expect you to follow this post, you have demonstrated you are completely unable to follow any type of logic or reason. Maybe luck will be with me and you won’t respond to the post, it is not for you anyway but always hope to educated anyone who wants to learn.
Always remember your math. 123 is a larger value than 203 and the Sun is 120 C and Turkey’s can cook ice.
Well, very good Norman. You were able to understand my comment and do the very basic calculations I hinted at.
But, you should have stopped there.
Instead, you ventured off into your pseudoscience, following those worms in your head. Cooling became warming, because you compared the atmosphere to NO atmosphere, tossing out any relevance to the scientific method.
So, what should have been a “gold star” for you, turned into a rusty pull tab.
But, I always find your ramblings hilarious, if I bother to read them.
g*e*r*a*n
Not sure what point you are trying to make with your post. You have the scientific method with the no or very little atmosphere Moon that receives an equivalent amount of solar input flux as the Earth.
You have actual bodies to compare.
The Moon’s average temperature (with no atmosphere) is much colder than the Earth’s average temperature.
Will you accept this statement as fact or do you dispute it?
Norman,
I don’t know about g* . . . , but you haven’t the faintest idea of the average temperature of the Moon’s surface, otherwise you’d no doubt say what it is.
You may be interested in this –
“The moon has an iron-rich core with a radius of about 205 miles (330 km). The temperature in the core is probably about 2,420 to 2,600 F (1,327 to 1,427 C). The core heats an inner layer of molten mantle, but it’s not hot enough to warm the surface of the moon.”
On the other hand, the Earth’s molten interior actually breaks through the surface continuously, at the mid ocean ridges. The heating effect of the Sun is imperceptible (even on an annual basis) just a few metres below the surface, as the surface is heated from below.
The temperature increases at about 25 C per kilometre of depth, depending on location.
So your valiant attempt to compare non existent average temperatures in order to justify a non existent GHE, gets another rusty pull tab from me, as well.
Don’t squander it!
Cheers.
Mike Flynn
A human that posts on a science blog and can’t comprehend the simple concept of averages or why scientists use them does not deserve a response.
I think nearly all posters understand that when you talk about average temperature it is for the surface of the planets. Only an unthinking and truly dense person would require an explicit explanation for every time one said Earth’s global average temperature.
g*e*r*a*n is already too dense to discuss ideas with, since he seems to have this mental blindness and only has limited understanding and will intentionally pick out something he believes he understands with purpose to annoy (a troll).
Since you post on a science blog and can’t understand the averages I consider you to be a troll who posts only to annoy someone and hope for a response to justify your existence.
(When the pseudoscience types blast off to the Moon, that tells us they know they have lost the debate.)
You can NOT compare Earth’s climate to the Moon. The Moon doesn’t have water over 70% of its surface.
Clueless.
g*e*r*a*n
YOU: “You can NOT compare Earths climate to the Moon. The Moon doesnt have water over 70% of its surface.”
Wow you really are demonstrating your lack on reason. Who is comparing the Moon and Earth’s Climate??? Climate is what takes place in the atmosphere and effects the Earth. When did I make a claim about “climate” in my post? Climate is average weather over a period of time, Moon has no weather!
You can compare radiant energy exchange between the two. Energy in vs energy out and surface temperature.
You ignore the question so I will ask again.
ME: “The Moons average temperature (with no atmosphere) is much colder than the Earths average temperature.”
Do you dispute this?
Note do you see me comparing climate in this question?
Or in your world temperature=climate?
Norm, my comment referred to “pseudoscience types”. So, obviously you knew to respond!
And, as to your asking me if I dispute your sentence:
The Moons average temperature (with no atmosphere) is much colder than the Earths average temperature.
I just have to fix it for you:
The Moons average temperature (with no atmosphere, and no oceans) is much colder than the Earths average temperature.
There, all nice and fixed….
g*e*r*a*n says, May 6, 2017 at 7:16 AM:
g*e*r*a*n,
What is it that holds Earth’s oceans in place? What is it that prevents them from simply boiling off into space?
It is of course the atmospheric pressure, the weight of the atmosphere on top of them.
Would there be any oceans on Earth if there were no atmosphere?
Water vapor and ice measured spewing from Enceladus shows an ocean exists there with no or minuscule atmosphere. Those that write Earth’s oceans would boil off without an atm. need to catch up on modern science achievements.
Oh, and there are two way photon fluxes to Enceladus not just a net macro flux as radio communications are possible between Earth and a receiver/transmitter nearby Enceladus.
Incoherent photons in the radio EMR beams do not interact to make just a net macro flux; just like the diffuse EMR between Earth surface and atm. do not interact to cancel to just a net macro flux.
Ball4
The ocean on Enceladus is not on the surface. It lies beneath a thick crust of ice.
https://www.nasa.gov/press-release/cassini-finds-global-ocean-in-saturns-moon-enceladus
Ball4
It’s interesting to speculate about earth’s ocean if there were no atmosphere. Temperatures would be similar to the moon, so my guess is water vapor during the day, turning to ice crystals at night.
As for no atmospheric pressure? I think the water vapor/ice crystals would float freely above the planet. Essentially creating a new atmosphere of non-liquid H20.
Exactly, Kristian.
That’s why the pseudoscience types can NOT compare the Moon to Earth. The conditions are too different.
Sure, similar to the ice floating in Earth’s arctic regions. The point is that an ocean is found to exist without atm. pressure.
Without that 1bar pressure, Earth global surface temperature on avg. would be lower (as Kristian points out demonstrated elsewhere found by the measured moon brightness T), and the oceans could still exist as also demonstrated elsewhere.
Ball
“The point is that an ocean is found to exist without atm. pressure.”
I see your point, but to be fair to Kristian, he was talking about a surface ocean and you’re talking about a subterranean ocean.
“Would there be any oceans on Earth if there were no atmosphere?”
My point was the usual answer of no (they’d boil off) has been recently demonstrated less than accurate by the discovery of oceans existing elsewhere w/o atm. pressure, the better thought experiment answer to Kristian’s question is now yes.
Ball
Now that I’ve thought about it a little more, I think you’re right.
I first imagined ice crystals floating above earth’s surface but then realized they may not “float”. With no atmosphere to hold them aloft, gravity would pull them to the surface, possibly creating a giant ice sheet.
Norman says, May 5, 2017 at 9:06 PM:
There are certainly quite a few things we can agree on, Norman.
We clearly disagree on exactly HOW the atmosphere manages to force Earth’s average global surface temperature up, but we DO agree that it’s a fact that it – somehow – DOES.
Like you point out, the simplest way for anyone to verify this fact for oneself is by comparing the average global surface temperature of Earth with that of the Moon; both bodies at 1AU, only with the former WITH an atmosphere and the latter WITHOUT one.
The global surface of the Moon absorbs about 296 W/m^2 of solar heat (“net SW”) on average. That’s almost 80% more solar heat than what the global surface of the Earth absorbs on average (about 165 W/m^2). This huge difference derives from a much lower lunar global albedo (no clouds, no ice) plus the lack of an absorbing intervening atmosphere.
So the lunar surface on average gets a LOT more heat in from the Sun than what the Earth’s surface does.
And STILL the average global surface temperature of Earth is about 92K higher than the average global surface temperature of the Moon: 289 vs. 197K (estimated from LRO data).
So the evidence of an atmospheric “thermal enhancement effect” on a planetary surface is almost ridiculously obvious. Our atmosphere simply INSULATES our solar-heated surface, reducing its heat LOSS at any given surface T. It evidently reduces its heat GAIN as well (Moon vs. Earth), but this appears to have less of an impact all in all.
Remember now that we’re only talking about “global averages” here … The global average solar heat input and the global average surface temperature. It both gets much hotter AND much colder on the Moon than on Earth.
Kristian
That was a great argument. Made me realize how little I know about the moon.
Norman, an excellent response which, judging by the reply, is again wasted on an ant-brain.
g*e*r*a*n gets his kicks from insulting people. I don’t think he even cares about the science.
Just one example of your hypocrisy, Snape:
http://www.drroyspencer.com/2017/05/uah-global-temperature-update-for-april-2017-0-27-deg-c/#comment-245754
We all take an occasional swipe at one another. For you it seems like a pastime.
http://www.drroyspencer.com/2017/05/uah-global-temperature-update-for-april-2017-0-27-deg-c/#comment-245754
Snape, in your pseudoscience, I think you just got promoted to “Snake”.
Somebody seems to under the mistaken impression that sunlit surface temperatures fall as altitude increases. Complete nonsense, of course.
According to the estimable Professor Tyndall (and verified by myself in the Himalayas), –
“At 10,000 feet, in December, at 9 a.m., I saw the mercury mount to 132, while the temperature of shaded snow hard by was 22. At 13,100 feet, in January, at 9 a.m., it has stood at 98, with a difference of 68.2, and at 10 a.m. at 114, with a difference of 81.4, whilst the radiating thermometer on the snow had fallen at sunrise to 0.7.'”
You may read the rest of the book’s chapter at your leisure. No correlation between adjacent surface temperatures, let alone the supposed air temperature above both!
As Prof Tyndall points out, the less impediment between the Sun and the thermometer, the higher the sunlit temperature. GHE supporters confuse themselves by not making the distinction between surface and air temperatures.
Combined with an inabilty to understand the differences and relationships between heat, energy, temperature, and power, it is no wonder that even supposedly well educated people dupe themselves into believing the impossible – even possibly believing that sunlit surface temperatures decrease with altitude!
Still no testable GHE hypothesis. Unsurprising, given the impossibility of raising a thermometer’s temperature by increasing the amount of CO2 between it and the Sun.
Cheers.
Sunlit surface? You need to read more carefully!
” On a calm, clear night we can observe the effects of radiative cooling it gets colder. But where is this cooling most pronounced? At high altitudes and arid deserts places where the atmosphere is thin.
In locations where the atmosphere is more dense, like the tropics, there is much less nighttime cooling.”
Allow me edit the grammar errors:
“On a calm, clear night we can observe the effects of radiative cooling. It gets colder. Where is this cooling most pronounced? At high altitudes and arid deserts. Places where the atmosphere is thin.
At locations where the atmosphere is more dense, like the tropics, there is much less nighttime cooling.
Snape,
A calm clear night at 9 am? Or 10 am? A clam clear night is usually a fair indication that the Sun is absent. That’s what distinguishes night from day, in general.
In an case, as you point out, at night the cooling is more pronounced in, for example, arid deserts where the atmosphere contains minimal amounts of that most important so-called GHG – H2O!
And of course, these places have the highest temperatures during sunlit hours, due to less blocking of sunlight – less GHGs to lower the temperature.
However, you haven’t managed to contradict the observations of Professor Tyndall. He also pointed out that the Earth would be as inhospitable as the Moon, if it lacked atmosphere to the same extent. Surface temperatures on Earth range from around 90 C (properly designed solar heat collector) to around -90 C.
The Moon gets both hotter and colder. Furious pretend averaging doesn’t make this inconvenient fact go away.
Of course, foolish organisations, like NASA, still publish brightly coloured diagrams showing the Earth as flat, with all the continents sunlit at the same time. No night at all – too inconvenient! Just search for “trenberth budget” images, if you don’t believe me.
Still no GHE. Not even a tiny bit.
Cheers.
Whoops. Of course I meant “calm” rather than “clam”, and “any” instead of “an” . . .
It might not matter to a Warmist – anything can really mean anything else, and none of it is to be taken literally, anyway!
Great science, this climatology! Very flexible – a perfect refuge for the incompetent, the delusional, and the dim. Competent scientists are slowly exiting the field, as the inconsistencies become ever more visible.
Cheers.
Yes, Flynn, in a desert like the Sahara, there is very little water vapor (an important GHG), and almost constant high pressure. These conditions combine to inhibit convection during the day, so less hot air is carried away from the sun baked ground.
At night, no clouds and very ltitle water vapor means there’s not much to get in the way of radiant cooling.
This produces a huge drop in temperature.
In places where it’s very humid, pretty much the opposite is true.
Snape,
Pressure has precious little to do with it. Nor has convection. The surface heats by absorbing radiative energy. It cools by emitting energy.
Less GHGs – less impediment to radiation reaching the surface from the Sun, or being emitted by the surface to outer space.
Taken to extremes, as on the Moon, much higher temperatures during daylight, much lower temperatures at night. I can’t see why basic radiative theory, backed up by experiment and observation, is denied in favour of a bizarre GHE, which is not even expressed as a testable hypothesis. The GHE supporters cannot even clearly express what this obviously mis-named so-called effect is supposed to do!
As you point out, less GHG results in higher temperatures during the day, and lower temperatures at night.
So far, you haven’t managed to contradict anything I’ve written – flying off at a tangent in an effort to avoid addressing the obvious deficiencies in the supposed GHE won’t win more recruits to the Cult.
Can you bring any new facts to support your fantasy?
Cheers.
Flynn
I can only comment on your first two paragraphs because I don’t have the patience to read more.
Atmospheric pressure influences convection. Less convection means less of the surface warmed air is lifted to higher levels of the atmosphere.
GHG’s are mostly transparent to solar radiation.
“Less GHGs – less impediment to radiation reaching the surface from the Sun, or being emitted by the surface to outer space.”
Thus Mike Flynn concedes Earth GHE does exist.
😊
Air over Sahara does not accumulate heat. This clearly shows the satellite.
http://www.ospo.noaa.gov/data/atmosphere/radbud/gd19_prd.gif
Product shows the Outgoing Longwave Radiation (OLR) from the Advanced Very High Resolution Radiometer (AVHRR) and High Resolution Infrared Sounder (HIRS). The AVHRR and HIRS OLR products are divided into day and night (ascending and descending) products.
http://www.ospo.noaa.gov/data/atmosphere/radbud/swar19_prd.gif
Product shows the average solar radiation absorbed (W/m2) in the earth-atmosphere system. It is derived from AVHRR Channels 1 and 2. The mean is displayed on a one degree equal area map on a seasonal basis. This product is also referred to as Shortwave Absorbed Radiation (SWAR). Absorbed solar radiation is the difference between the incoming solar radiation at the top of the atmosphere and the outgoing reflected flux at the top of the atmosphere.
Interesting, thanks for that ren.
Good catch, Ball4.
Game over.
Mike Flynn admits there is a greenhouse effect:
May 5, 2017 at 9:22 PM
“Less GHGs less impediment to radiation reaching the surface from the Sun, or being emitted by the surface to outer space.”
http://www.drroyspencer.com/2017/05/uah-global-temperature-update-for-april-2017-0-27-deg-c/#comment-245860
Is stronger ocean evaporation during El Nino increasing the mass of gases in the troposphere?
Is the increase in total gas mass in the troposphere can increase the temperature of the air at the surface?
Ren
I think that’s a tough question to answer, probably being studied.
Yes water vapor is a greenhouse gas, but unlike the others, it produces clouds (and thus albedo) and has a tremendous influence on weather.
More importantly, the average amount of water vapor in the atmosphere only changes when the temperature first changes. (See the Clausius-Claperyon equation.)
This is why climate scientists say “water vapor is a feedback, not a forcing.”
“Still no testable GHE hypothesis.”
Proof of the GHE hypothesis:
https://www.giss.nasa.gov/research/briefs/schmidt_05/curve_s.gif
David,
That’s a graph, not an hypothesis! (And a fairly pointless attempt at implying some sort of correlation between assumption and reality. Would you like me to tell you why this is so?)
And you don’t “prove” an hypothesis to be correct. On the other hand, it may take only one experiment to prove the most seductive and elegant hypothesis wrong.
You still can’t find a GHE hypothesis capable of even being tested, can you?
You might need to try harder.
Cheers.
Sorry you don’t understand that graph. It only requires freshman physics.
Mike Flynn admits the GHE:
May 5, 2017 at 9:22 PM
“Less GHGs less impediment to radiation reaching the surface from the Sun, or being emitted by the surface to outer space.”
http://www.drroyspencer.com/2017/05/uah-global-temperature-update-for-april-2017-0-27-deg-c/#comment-245860
Hypothesis: If there is no greenhouse effect, the Earth’s outgoing spectrum should approximate that of a blackbody.
Fact: False
https://www.giss.nasa.gov/research/briefs/schmidt_05/curve_s.gif
The average height of the troposphere over the equator is constant. What happens with excess water vapor during El Nino?
http://www.cpc.ncep.noaa.gov/products/stratosphere/strat-trop/gif_files/time_pres_TEMP_MEAN_ALL_EQ_2016.png
Sorry.
http://www.cpc.ncep.noaa.gov/products/stratosphere/strat-trop/gif_files/time_pres_TEMP_MEAN_ALL_EQ_2017.png
Ren
Generally speaking, more humidity means more convection and therefore more or stronger thunderstorms.
Then as the air cools following an el nino, it would suddenly hold less water and so I would expect a big uptick in global precipitation.
This is all just speculation though. Not sure what the science actually says.
Ball4 wrote –
“Less GHGs less impediment to radiation reaching the surface from the Sun, or being emitted by the surface to outer space.
Thus Mike Flynn concedes Earth GHE does exist.”
Ball4 obviously needs to upgrade both his logic and mind reading skills.
Ball4 apparently believes in something that has no testable hypothesis, that cannot be defined or demonstrated, but which can produce contradictory miracles, which defy rational explanation.
Sounds more like religion than science, to me. Faith is faith. Facts are facts.
Sorry, but GHE is faith. Not fact.
Cheers.
No use denying it Mike, it is recorded for all to read, you’ve shown us you now agree Earth GHE does exist no matter your protestations, the cat will not go back in the bag. The internet does not forget.
Mike Flynn concedes: “Less GHGs less impediment to radiation reaching the surface from the Sun, or being emitted by the surface to outer space.”
Ball4 is not exactly the best monitor of reality.
He believes cabbages glow in the dark.
Ad hom attacks are rarely effective.
Was Ball4 wrong when he quoted Mike saying Less GHGs less impediment to radiation reaching the surface from the Sun, or being emitted by the surface to outer space.
Was he wrong concluding that this statement does, indeed,describe how the greenhouse effect works?
If he was not wrong, then what is the purpose of your comment?
Tim Folkerts,
He wasn’t wrong quoting me. An example is the Moon, with virtually no GHGs – the surface heats rapidly, and cools rapidly, as I pointed out. Its maximum temperature exceeds that of the Earth’s surface due to a lack of GHGs. The low temperature is likewise lower, due to a lack of GHGs.
If this is supposed to demonstrate the action of the non-existent GHE on the Earth, then no wonder you can’t actually state what the GHE is!
I assume you are not saying that conditions on the Moon are responsible for some 30% of the Sun’s incident radiation not even reaching the surface of the Earth? Are you really implying that a thermometer’s temperature can be raised by placing CO2 between it and a heat source?
Anyone who believes this is quite simply deluded. CO2 doesn’t provide heat, nor does it somehow multiply heat through some arcane but unspecified feedback mechanism!
As to glowing cabbages, I asked Ball4 whether he really believed in such a thing. I can’t see where he has denied it, but maybe I missed it.
Cheers.
Tim, I’m glad to see you have given up trying to fake physics, and have started your own ministry.
Where can folks send donations?
Mike Flynn admits there is a greenhouse effect:
May 5, 2017 at 9:22 PM
“Less GHGs less impediment to radiation reaching the surface from the Sun, or being emitted by the surface to outer space.”
http://www.drroyspencer.com/2017/05/uah-global-temperature-update-for-april-2017-0-27-deg-c/#comment-245860
Mike says: “An example is the Moon, with virtually no GHGs the surface heats rapidly, and cools rapidly, as I pointed out. Its maximum temperature exceeds that of the Earths surface due to a lack of GHGs. The low temperature is likewise lower, due to a lack of GHGs.”
No. These effects you state are due to no *ATMOSPHERE* at all, not to no *GHGs* specifically. Also, the looooong lunar day plays a role. If you put a pure nitrogen atmosphere on the moon, the temperature swings on the moon would be smaller than they are now. And if you also made the moon rotate every 24 hr, the temperature swings would be quite similar to earth. Well, except that the surface would be MUCH colder than the earth.
Basically, you are attributing the interesting effects on the moon to the WRONG CAUSES.
g*e*r*a*n
From reading the various posts I would conclude that Ball4 is much more knowledgeable than you in the field of science. That does not mean you could not gain more knowledge but currently you seem to posses a lack in many areas which I have not found so lacking in Ball4’s comments.
When you make statements at least you should learn to tell the truth. Your post: “He believes cabbages glow in the dark.”
That is a complete dishonest comment. The claim made by Ball4 was that a cabbage at room temperature would emit a tiny amount of EMR in the visible range (since some surface molecules would have enough energy to move electrons to higher orbitals) that could be detected by a sensitive spectrometer.
The “glow in the dark” is your own misunderstanding of what someone else posted. It seems you do this a lot, have you considered going to a specialist to find out why you have such a lack of ability at understanding other people? It might help your posting ability if you properly understood what someone actually posts and not your strange and delusional twisting of someone else’s content.
Norm, accusing me of dishonesty is pretty low. It’s an act of desperation.
I can spend the 10 minutes to find the relevant comments, but you would squirm out of any apology. That’s what you do.
{smile}
+1 Ball4. Good catch.
Ball4,
Do you really believe cabbages glow in the dark? Is that also part of the non-existent GHE hypothesis?
As to your “Earth GHE”, if you could actually specify what you are talking about, it might help. Just stringing letters together in an attempt to sound sciency doesn’t impart much information, other than to emphasise the depth of your delusion.
Maybe you don’t believe the Earth no longer has a molten crust, due to cooling, rather than the heating which occurs only in your febrile imagination, but your beliefs are irrelevant to those of us who manage to walk on the cooled surface.
Nature doesn’t seem to care what I think. Do you think that Nature is more likely to bend to your will?
Cheers.
Mike Flynn admits the GHE:
May 5, 2017 at 9:22 PM
Less GHGs less impediment to radiation reaching the surface from the Sun, or being emitted by the surface to outer space.
http://www.drroyspencer.com/2017/05/uah-global-temperature-update-for-april-2017-0-27-deg-c/#comment-245860
Yes, Mike, Ball4 really believes cabbages glow in the dark. (I can find his comments, if necessary.)
If you think about it, all GHE believers MUST believe that. They have to have some way to convince other folks that a cold atmospheric gas can boil the oceans!
Ball4 says:
“Mike Flynn concedes: Less GHGs less impediment to radiation reaching the surface from the Sun, or being emitted by the surface to outer space.”
Mike Flynn just admitted there is a greenhouse effect.
Game over.
Good going, Ball4.
The course of the jet stream determines the temperature distribution in the middle and high latitudes. As shown in the temperature of the North Pacific winter jet stream pattern is very durable.
http://images.remss.com/data/msu/graphics/tlt/medium/n_pole/ch_tlt_2017_04_anom_v03_3.png
Heavy weather in eastern Canada. After spring floods will return frost.
ftp://sidads.colorado.edu/DATASETS/NOAA/G02186/plots/4km/r10_Hudson_Bay_ts_4km.png
What holds the atmosphere and oceans in place ?.Any chance it could be something simple like gravity.or is that another myth . Although Tesla was convinced it was magnetism. Newton Tesla.and maybe Tyndall in the same room.now that would be some discussion.
I doubt Tesla thought the ocean was held in by magnetism.
How is it possible we even have an atmosphere? Nitrogen , oxygen, etc, are somehow able to rise above the surface. This seems to defy gravity.
Winds.
Winds? How is there wind without an atmosphere?
20 minutes on google and still can’t find the answer. Here is another way to pose my question:
Imagine earth with no atmosphere (no air). Hold a nitrogen or oxygen molecule, say, 100 feet off the ground and let go. They each have mass and are affected by gravity, so why don’t they fall to the ground?
Why are these molecules dispersed above earth’s surface as air instead of lying in a big pile on the ground?
There *IS* an atmosphere.
Hence, winds.
David
I posed my question a different way (directly above your last comment).
Atmospheric turbulence keeps gases aloft.
Barry
I wrote, “Imagine earth with no atmosphere (no air).”
You did, but I’m not sure why. The Earth has had an atmosphere of various kinds since it was born. You may want to look up planetary formation and then the geologic history of Earth’s atmosphere. Volcanic outgassing was the initiator of Earth-formed atmosphere when this planet was in the crib.
If there were no atmosphere there would be no gases to be affected by gravity. I’m not sure where you’re going with this?
Snape
YOU ASK: “Imagine earth with no atmosphere (no air). Hold a nitrogen or oxygen molecule, say, 100 feet off the ground and let go. They each have mass and are affected by gravity, so why dont they fall to the ground?
Why are these molecules dispersed above earths surface as air instead of lying in a big pile on the ground?”
The answer would be perfectly elastic collisions. The nitrogen molecule would be pulled down by gravity bu convert it potential energy to kinetic energy. When it hits the surface it bounces back up with no loss of internal energy to the surface so it goes back to its original height.
In our atmosphere the molecules all have considerable kinetic energy and when they collide with other molecules all the collisions are perfectly elastic. The molecules can exchange energy (some get faster, others slower) but the total energy is not lost as with larger groupings of molecules (such as a bouncing ball, it does not have a perfectly elastic collision, some of the energy of deformation turns into internal energy).
Does that help?
Thank you, Norman!
I read a more complicated description of this and didn’t quite get it. Your’s was much easier to understand.
I guess this “bouncing” also explains why the moleculules in our atmosphere are all mixed up instead of in layers according to density. Barry used the term, “atmospheric turbulence”.
Snape,
At absolute zero, all the gas will lie on a big heap on the ground.
Look up Brownian motion for an explanation of why CO2, for example, doesn’t settle out – nor do small particles of pollen or dust.
You might care to read Feynman – The strange theory of light and matter. This will set you straight on so called perfectly elastic collisions (nonsense), total atmospheric kinetic energy being conserved (also nonsense), and a few other things.
If you think Feynmans grip on physics and QED is rubbish, fair enough. If you choose to heap abuse on me, I’ll ignore it unless you can convince me that you at least have made some effort to understand the ohysics involved.
Cheers.
Mike Flynn
I am reading some of the Feynman book you talk about. If the link works this should lead to the book.
http://www.academia.edu/8507721/QED_The_strange_theory_of_light_and_matter_by_Richard_Feynman
It is a most interesting book to read. I have not read through the whole thing but would like you to inform me what part of this book rejects the notion of perfectly elastic collisions?
Snape
Maybe this helps.
https://chemistry.stackexchange.com/questions/41544/are-the-collisions-between-the-real-gas-particles-perfectly-elastic
Norman,
I’m pleased you are taking the trouble to read Feynman’s little book.
As to your question – the whole of the book? Photons interact with electrons. The notion of atoms colliding is an old one, and not correct.
For a start, you might care to look up “collisions” or “atoms” or “elastic”, and take it from there. I could always be wrong, you know. If you find I am incorrect, please let me know.
You might even find that many things parroted by scientists about photons and their interaction with matter are wrong (at least according to Feynman). I’m happy to believe Feynman, until something better comes along.
Cheers.
David. Tesla stated he believed magnetism and not gravity held the universe together.my point was it is easy to be blinded by theories at the expense of everything else no matter how unlikely it may be.its textbook detective work.you look at all possibilities disregard what it can’t be.and what is left no matter how unlikely must be the answer.i was just trying to broaden the debate.
Ian
No gravity and everything goes flying into space. Still, the atmosphere exerts tremendous pressure on the oceans. What would happen if that pressure was suddenly gone?
Dr. Spencer,
Warmists admit that anthropogenically generated CO2 does not directly cause sufficient warming for mankind to be alarmed (even if it doubled or even tripled in concentration). However, they claim a positive feedback mechanism is at work where the additional heat “trapped” by the anthropogenic CO2 causes just a little more H2O to evaporate from earth’s surface, and because H2O absorbs a much broader range of IR wavelengths, it causes the added warming that we should all be alarmed about. If I have this wrong, please tell me so.
Question 1: Assuming we accept such an arguement, and if the concentration of atmospheric H20 is already a magnitude or 2 greater than that of CO2, and because it absorbs IR energy at more and broader ranges of IR wavelengths, then why doesn’t any warming at all (be it for whatever reason) cause an unending (like a perpetual motion machine) evaporation of more water from the oceans, a resultant higher concentration of atmospheric H2O, a resultant entrapment of yet more IR energy, resulting in a higher global temperature, and repeat, repeat, repeat? How do the warmist explain this? What am I missing?
Question 2: Rain is always mildly acidic because upon condensation into liquid droplets, and while falling through the atmosphere, it dissolves CO2 in accordance with Henry’s Law, returning CO2 to earth’s surface. So how is it possible for the nominal retention time of a molecule of CO2 in the atmosphere to be measured in decades? The portion of the continuous flux of the natural CO2 cycle returning CO2 to the surface of the earth (photosynthesis, precipitation) should result in a much shorter retention period than decades shouldn’t it? Where does this decades-long nominal rentention period come from?
Any one is more than welcome to answer my questions, so long as the answer is science-based, not political in nature, nor a personal assault on my character for asking the dumb questions.
Russ
El ninos release a lot of extra water vapor into the atmosphere and we don’t get this runaway warming you’re talking about. It’s a good question though. Maybe a meteorologist could explain why.
Good point Snape.
“So how is it possible for the nominal retention time of a molecule of CO2 in the atmosphere to be measured in decades?”
A particular, individual CO2 molecules doesn’t last in the atmosphere for decades.
But it is (almost always) replaced by a different individual CO2 molecular, via the climate cycle seeking equilibrium.
This is a very long cycle, and it takes 10s of thousands of years for all the “added CO2” to decline back to its baseline level. (see the work of David Archer, U Chicago). Perhaps as long as a million years.
Davie believes every pseudoscience paper he reads. His favorite pseudoscience paper indicates the the Sun can radiatively warm the Earth to 800,000K!
(If you’ve studied quantum physics, thermo, and heat transfer, try reading that last sentence again, without laughing.)
Dishonest Troll.
Davie didn’t get his welfare check last week, so he’s a little miffed.
{smile}
Dave,
Do you even have a clue as to what I’m asking? Anyway, I specified only scientifically based answers. Yours doesn’t qualify. No need for you to respond to this comment either. Thanks.
Russ, your very first sentence isn’t serious, so I don’t see any need to take *YOU* seriously.
Until then, get lost.
As to question 1:
Positive feedback doesn’t necessarily mean runaway of the phenomenon in question as you seem to believe. It depends on the amplitude of the feedback. If in your reasoning first step results in an effect A which in turn adds a further amount rA (r times A) where r is a factor that measures the magnitude of the feedback, which in turn adds a further amount rrA (r times r times A)..etc, repeating the process one gets eventually a total effect T = A + rA + rrA + rrrA +
This is mathematically the sum the well known geometric series namely T= a / ( 1- r) which is a finite number provided r < 1. Runaway only takes place when r is approaches 1 or becomes larger than 1 i.e. at large enough feedbacks.
No trouble with the AGW theory at this level.
I’m happy to hear that AGW is not reliant upon the creation of a perpetual motion machine. Maybe we should be spending a lot more time and energy on determining what the value of “r” is then, instead of picking a number out of the air and flying with it to make the case…… AGW should concern us, or AGW should not concern us. I appreciate your mathematical explanation Alphagruis.
Thanks.
Russ, you indeed point precisely to the main trouble with AGW theory, namely it’s inability to provide a quantitatively accurate and reliable enough estimation of the effect. Uncertainty is huge.
There are in fact other feedbacks besides the water vapor one you mentioned above. So there are various “r” values to consider and it’s the overall effect of them that matters of course. As pointed out elsewhere by Dr. Spencer there is always the strong “Planck feedback” that is definitely negative and prevents in principle runaway.
Good questions, Russ.
In answer to question 1,
The theory states if you add co2 you raise the height of the co2 column thus cooling the emission layer causing the surface to raise its temp in order to emit the same amount of ir lost at the top of the co2 emission layer
This increase in surface temp increases wv, wv then generates the catastrophic temps rises predicted.
Ergo yes you are right it should be a perpetual warming but in reality the ir simply leaves via another emission layer whether it be h2o, methane cloud tops.
Problem is people still believe co2 traps “heat’
1) If there are limiters on the gain the amplification is stable. Limiting factos include logarithmic effect of CO2 and some other negative feedbacks (lapse rate changes provide negative feedback). Supposedly the sum of all feedbacks is positive, but not enough to make the gain unstable.
2) Where does this decades-long nominal rentention period come from?
Not from the lifetime of a single CO2 molecule. It’s an estimate of the time it takes for the system to re-absorb CO2 from a large pulse of that increases the level from the background.
It’s based on the question – how long would it take the added CO2 to be removed from the atmosphere if anthro emissions stopped completely?
Analogy: imagine a large tank of water half filled with a small hole at the water level. The water is constantly mixed by some device. Now start filling it at a rate that exceeds the rate at which water pours out through the hole. When the water reaches the top, stop filling it, and then…
Calculate the time it takes for the water to get back to its original level. That is the analogy for the ‘residence time’ of CO2 that you refer to.
Mixing spreads the water (CO2) around, so that in a given mass in the tank (atmosphere) going through the hole (carbon sink), some of the water molecules will be the ones from the hose. Thus, average residence time for a single water molecule from the hose is much shorter than the time it takes for all the excess water to drain.
When you read about residence time WRT CO2 emissions, this is what they’re talking about. Whereas the average residence time of an individual CO2 molecule in the atmos is about 5 years, I’ve read.
Excellent analogy Barry. Thanks for that. I still have a problem though with the very long retention time that the warmists claim. Let’s call it “mean” retention time, since that’s probably a better description. It seems to me that the “hole” in your tank is likely bigger than we are imagining. The size of the hole is analagous to the flux of CO2 returning to earth’s surface, which is due mainly to photosynthesis and precipitation. These are relatively big numbers in the natural CO2 cycle are they not? I further suggest that your hole is significantly below the surface of the tank contents, since both photosythesis and precipitation still occur at high rates when the atmosphere contains much less CO2 than it does now.
I’d like you to consider that the rising atmospheric CO2 level in the atmosphere we’re currently seeing is at least partly due to currently warming ocean surfaces and Henry’s Law. I suggest “largely due to”. When the ocean surfaces begin cooling, we should expect to see atmospheric CO2 concentrations start to fall. The net flux of CO2 will reverse in direction. Wish I could be around to see this, but I doubt that I will. Apparently this cycle is about 800 years in duration.
Barry
Really interesting. I had never heard the term “resIdense time” but
Barry
Really interesting. I had never heard that analogy before.
I was actually really confused by your last paragraph. The term “residence time” is used for two very different things:
1. The time is takes “a certain quantity of extra Co2” to leave the atmosphere.
2. the time it takes an individual molecule to leave the atmosphere.
It took me a while to figure out what was going on.
Russ,
Before the industrial revolution average concentration atmospheric CO2 was about 280ppm. It is now about 404 ppm. The increase is thus about 124 ppm.
Human activities have released roughly twice as much as the increase. It’s then a mater of arithmetic. If anthro emissions account for twice the increase, then the increase is definitely from anthro. If anthro emissions were half the increase, then we would have to other sources for the rest.
Because the increase is only half what we pumped out, there is then a ‘fast’ hole that operates to absorb half emissions. It is reckoned the oceans’ capacity for extra CO2 absorbs most of that. There’s been a bit of greening of the planet recently, so that would absorb some, but there’s also been a lot of foliage clearing since the industrial revolution, meaning slightly less of a sink for CO2.
But we know the oceans are absorbing about the excess (above background levels) because we measure CO2 in seawater and find it has increased over time (hence interest in the de-alkanization of the oceans).
It’s also how we know that the oceans are not responsible for the long-term rise of CO2.
We have many other lines of evidence that converge on anthropogenic contribution to virtually all the rise since the indstrial revolution. But we don’t even have to rely on them, because the emissions/atmospheric increase arithmetic makes it very straightforward.
At short time scales atmospheric CO2 responds to global temp fluctuations, particularly ENSO events. CO2 goes up a wee bit with el Ninos and down a little bit with la Ninas. This is reckoned to be because of the short-term influence of ENSO on plants.
But these factors in no way can explain the long-term rise.
Consider – when the globe warmed out of the last ice age, the temperature change was 5 – 6C over 5 thousand years. The change in CO2 concentration was from 180 – 280 ppm over 4000 years. But in the space of 250 years the concentration of atmos CO2 has risen even more than out of the last ice age, much more quickly, and when the globe has warmed by about 1C at most.
Where is the 5 – 6C warming preceding the >100 ppm CO2 rise in the modern age? How has it happened 200 times faster than the last time the planet warmed significantly?
Because human activity is digging up carbon stored in the ground and pumping it into the air at a rate of nearly 3 ppm per year (currently).
“….
Where is the 5 6C warming preceding the >100 ppm CO2 rise in the modern age? How has it happened 200 times faster than the last time the planet warmed significantly?
Because human activity is digging up carbon stored in the ground and pumping it into the air at a rate of nearly 3 ppm per year (currently).”
For millions of years, earth has had low global levels of CO2. Or for last 500 million years, Earth has had dips in CO2 levels but most of the time the CO2 levels have been higher than compared to the present.
Cf:
http://earthguide.ucsd.edu/virtualmuseum/climatechange2/07_1.shtml
From goggle search; “geology last millions of year CO2 levels” and above is one link I picked- because it roughly matched what had read about [elsewhere].
Or one could say we in a geological age in which “there should be” low levels of CO2. And all the new mountain building, could give you this clue.
So I would say/guess that over the time frame of +10,000 years of your interglacial period, the entire ocean has warmed by 1 or 2 degree and has outgased a lot of CO2 but it’s had a large amount of time for weathering and other processes which remove the addition of CO2 to the atmosphere.
The Ocean is vast and will always take more than 1 thousand years to warm or cool it by 1 C, but this not to say that upper levels of the ocean or other portions of the ocean can’t warm or cool at faster rates. So picking something like the top 700 meter of the ocean, it may warm or cool at faster rate. Or say pick the ocean near Antarctic or top levels of Arctic Ocean.
Now I would say that we know very little about Earth’s carbon cycle, but what we know, is that this natural cycle dwarfs the amount of human CO2 emission [on yearly basis]- eg some claim +100 billion ton emitted and absorbed. Also once upon time human activity in general was thought to cause more CO2 emission than merely the burning of fossil fuels. And would add that because fossil fuel burning can be account for, that it’s sort of like a drunk looking for his keys under the street lamp- because that is where the light is.
But one explanation or at least one factor of explanation is that the fast rate in which CO2 is added to atmosphere by human activity explains the bump up in CO2 levels.
But in been fashionable to talk about how nature would rapidly disappear our cities, if humans weren’t around. Likewise, I believe our geological age would disappear the added CO2 if humans disappeared. Also were we to return to glacial period, likewise the CO2 would also lower. Though neither of these seem likely any time soon.
‘
The time it would take for the excess CO2 be completely absorbed is reckoned in hundreds to thousands of years because the ‘fast’ hole (sink) becomes less efficient when a new, higher equilibrium is reached (differently to the tank analogy). CO2 *a.b.s.o.r.p.t.i.o.n is then done by rock weathering (rocks absorb CO2 through erosion over very long time scales) and ocean turnover, which takes about a thousand years for a full turnover cycle.
An active area of research is concerned with whether the ocean uptake of excess CO2 will diminish in the future. Colder sea water holds more CO2 – the CO2 rise during the last transition out of the ice age caused outgassing of CO2 from warmer oceans. The oceans are warming now, but still able to offset some of the anthro emissions due to changing partial pressure at sea surface and wind cycling of ocean waters taking CO2 down to depths. That may change in the future as the ocean buffer becomes more ‘filled’ and less efficient.
In the carbon budget there are multiple factors at play, and feedbacks, too, mostly negative for now.
(* Had to put full stops in that word because this site rejects posts with that word in it)
Russ,
It seems to me that the “hole” in your tank is likely bigger than we are imagining. The size of the hole is analagous to the flux of CO2 returning to earths surface, which is due mainly to photosynthesis and precipitation. These are relatively big numbers in the natural CO2 cycle are they not? I further suggest that your hole is significantly below the surface of the tank contents, since both photosythesis and precipitation still occur at high rates when the atmosphere contains much less CO2 than it does now.
That is one side of the ledger, and it is an annual cycle.
The other side of the ledger is plant die-off in the Autumn/Winter months, when trees shed their leaves. As the leaves decay they release CO2. This is evident globally in the CO2 record from many locations around the world. The Northern Hemisphere contains the vast majority of the world’s foliage (much more land surface). So the annual cycle we see in the global record matches the seasonal cycle in the NH.
This cycle had been in equilibrium for the last few thousand years, then came the CO2 spike from anthro emissions (abetted by land clearing).
So the ‘hole’ in the tank (of the atmosphere) for excesses CO2 is not plants. Otherwise atmos CO2 should have been on a significant downward trajectory prior to the industrial revolution. Instead, it was always replenished seasonally.
The hole in the tank is the longer term processes, like rock weathering. These slow processes are what will mainly take up excess CO2, reckoned to occur over hundreds to tens of thousands of years.
The ocean won’t absorb CO2 at the same rate should we cease emitting, as the oceans are trying to stay in equilibrium with atmos CO2. They shouldn’t be absorbing now, as you note, because a warmer ocean should outgas CO2. Even if they did immediately start absorbing, it takes a thousand years for complete hydrological turnover of the oceans. That’s the soonest possible we could expect excess CO2 levels to drop and the system return to equilibrium. But it will take longer than that.
Horse racing fans will know that today’s Kentucky Derby was held in very cold temperatures.
Pseudoscientists believe the atmosphere is “trapping heat”.
Today, they have to also believe Churchill Downs is “trapping cold”!
http://www.cbsnews.com/news/kentucky-derby-churchill-downs-begins-cold-wet-conditions/
And you wonder why people are rejecting you as a clown.
Davie, you have demonstrated you have no knowledge of physics. Your personal life indicates you have no work ethic. Now you are revealing you have no originality.
But, please continue….
🙂
{smile….}
Davie, a “smiley” is made, on this site, with “&-#-9786;”
Just leave out the two “-“s.
And, don’t forget to include the “;”
Above info courtesy of Gordon Robertson, who also tries to help you to understand physics.
{smile}
If Earth had no global ocean, it would have a lower average global temperature.
The atmosphere can retain some heat and it can also ‘trap cold”.
What does “trap cold” mean?
I think he’s talking about a temperature inversion. Warm air aloft trapping colder surface air.
This description is inaccurate though. The cold air isn’t really trapped. It’s heavier than the air above and won’t budge.
Snape,
Seriously –
“A large-scale katabatic wind that descends too rapidly to warm up is called a fall wind. In areas where fall winds occur, homes and orchards are situated on hillslopes above the lowlands where the cold air accumulates.”
Additionally, low level inversions form typically at night, under clear skies. In a depression or concavity, the air will tend to sit there. This could be referred to as “trapping cold”, I suppose.
I prefer the use of normal physical or meteorological terms. Heat and cold are fairly imprecise terms. Somebody will probably tell you they prefer to slip their feet into their warm slippers, rather than stand on the cold stone floor, when arising. In fact, both the slippers and the stone are the same temperature.
Personal preference, of course.
Cheers.
Flynn
That’s why I explained (referring to an inversion):
“The cold air isnt really trapped. Its heavier than the air above and wont budge.”
Weird. Somehow the apostrophes disappeared from my quote.
If you copy and paste apostrophes and quotation marks, they turn into a different font when you paste them and this site doesn’t recognize them. If you want them there, you have to delete and rekey them, and then this site recognizes the font.
Just of one of quite a few glitches on this site.
Further evidence that no one is deleting posts or trying to kill certain words deliberately.
Although, Roy has made a few words spam words, particularly to do with a certain (skeptic) poster who spammed this board with CO2-is-not-a-greenhouse-gas rubbish.
David Appell wrote –
“But it is (almost always) replaced by a different individual CO2 molecular, via the climate cycle seeking equilibrium.”
Climate is the average of weather. An average “seeks” nothing.
Maybe you would care to rephrase your confusing and incorrect assertion, and try to express what you are trying to say? Are you trying to claim that CO2 levels do not change? Or does “almost always” really mean “almost never”?
Very confusing. Sad.
Cheers.
Mike Flynn admits there is a greenhouse effect:
May 5, 2017 at 9:22 PM
Less GHGs less impediment to radiation reaching the surface from the Sun, or being emitted by the surface to outer space.
http://www.drroyspencer.com/2017/05/uah-global-temperature-update-for-april-2017-0-27-deg-c/#comment-245860
David,
Your mind reading abilities are on par with your scientific knowledge.
What is this wondrous “greenhouse effect” to which you refer?
It seems to be preying on your mind to an unhealthy degree. Maybe if you could write down what you think this “greenhouse effect” represents, you might be able to communicate more clearly.
Or you could just tell anybody asking inconvenient questions to “get lost”. I’m sure people will appreciate your lucid and logical explanation.
Cheers.
Solar activity very low. No coronal holes.
Solar minimum to about 2 years?
http://www.solen.info/solar/images/AR_CH_20170505_hres.png
Does anyone think that in California it will stop raining?
http://www.intellicast.com/National/Radar/Current.aspx?location=USCA0062&animate=true
According to Michael Mann 2015 –
“That study similarly concludes that there is growing risk of unprecedented drought in the western United States driven primarily by rising temperatures, regardless of whether or not there is a clear trend in precipitation.”
Unprecedented drought . . . whether or not there is . . . precipitation.
Interesting. Where I live, the Dry season is characterised by lower temperatures. Temperatures are higher during the Wet.
Maybe things are different in Mannland.
Cheers.
BACA COUNTY, Colo.
Thousands of cattle died or wandered off earlier this week when more than two feet of snow blanketed Southeastern Colorado.
http://www.ajc.com/news/national/thousands-cattle-killed-colorado-spring-snowstorm/NUrVl1w7m0CPglinx8r7FL/
“Part of the reason the precipitation levels have been so high is due to the meandering nature of the jet stream, a path of air in the upper atmosphere. Often storm systems are influenced by it. It’s normally somewhat smooth, but recently it’s had more “kinks” in it, resulting in wetter systems and sometimes allowing storms to linger where they’d normally just pass through. While it’s too early to definitively link this weather system with climate change, recent studies have suggested it could be a sign of things to come.”
http://www.cbc.ca/news/technology/flood-quebec-ontario-1.4098915
https://www.nohrsc.noaa.gov/snow_model/images/full/National/nsm_depth/201704/nsm_depth_2017042005_National.jpg
Index AO sharply down.
http://www.cpc.ncep.noaa.gov/products/precip/CWlink/daily_ao_index/ao.obs.gif
ftp://sidads.colorado.edu/DATASETS/NOAA/G02186/plots/4km/r11_Central_Arctic_ts_4km.png
http://ocean.dmi.dk/arctic/plots/meanTarchive/meanT_2017.png
Russ
Regarding Question 1.
The positive feedback to which you refer has a different meaning for an engineer and a scientist.
An engineer thinks of positive feedback as a self-amplifying change which continues to the limit of the system. The classic example is the feedback squeal a sound system can produce if the microphone picks up too much noise from the loudspeakers.
In science positive feedback usually continues until limiting factors kick in to slow and eventually stop further change.
With respect to increasing water vapour leads there are two limiting factors.
Increased water vapour leads to increased precipitation. Increased evaporation from the surface is balanced by increased rainfall removing extra water vapour.
Increased water vapour also leads to increased cloud cover. More energy is reflected back to space. This partially cancels out the increased H2O greenhouse effect.
Eventually a brighter Sun may trigger the runaway H2O greenhouse effect you describe, but this is not expected for another billion years.
Regarding Question 2
Retention time is a bit misleading. Rather than thinking of an indvidual molecule staying in the atmosphere longer, think of the change in concentration persisting longer.
Our CO2 emissions have upset the dynamic balance between the atmosphere and the existing carbon sinks. The further the system gets out of balance, the longer it will take to stabilise.
Entropic Man,
Great answer to my question 1. I guess I like it because it’s what makes sense to me too. But it sure doesn’t support an ever increasing positive feedback that will result in catastrophic global warming. Refer to the exchange between Alphagruis and me. Alphagruis pointed out some useful math that offers a sensible explanation of the positive feedback that warmists hang their hats on too. I found it quite meaningful, and you might too.
As for your answer to my question 2, thanks but I see the concentration of CO2 being in a constant state of flux (always tending towards stability, but rarely being there), and although mankind is partly responsible for the increased levels of atmospheric CO2 we’re currently seeing, another source is the warming oceans. Because of Henry’s Law, I suggest that the warming oceans have the bigger impact of the two. If it was just anthropogenic CO2 that was adding to the atmosphere, I expect that natural flux forces (like photosynthesis, rain, even cooling oceans in the future) would cause the net flux to change directions more more quickly and at at a greater rate than the warmists tell us it has to be.
I suggest that if man was to suddenly stop burning hydrocarbons, the atmospheric level of CO2 would not suddenly start dropping at a high rate, and might even keep on rising. NOT because of the very long mean retention time that warmists warn us about, but because the warming ocean surfaces will continue to release CO2 as per Henry’s Law, maintaining a net flux in the same direction.
Appreciate your response. Thanks.
Russ
Regrettably the equilibrium between CO2 in the air and in the ocean is complicated.
Henry’s Law identifies two relevant variables.
All else being equal, as the water temperature rises less CO2 can be dissolved . Thus global warming would cause CO2 to come out of solution and move from the oceans to the atmosphere.
All else being equal, the amount of dissolved CO2 in the ocean increases with the concentration of CO2 in the air above it. Thus our CO2 emissions would cause more CO2 to move from the air into the ocean.
At present the second effect is the larger, so the oceans are taking up CO2, though as the oceans warm they will take up less.
There is an extra effect. CO2 does not spend long in solution.
It reacts with water to form carbonic acid.
CO2 + H2O H2CO3
This then dissociates to hydrogen ions and bicarbonate ions.
H2CO3 H+ + HCO3-
The H+ ions reduce pH. This makes the oceans less alkaline/more acid.(Doesn’t matter which term you use, they mean the same)
This chain is reversible. Higher temperatures, lower pH and lower atmospheric CO2 favour turning HCO3- into CO2. Lower temperatures, higher pH and higher atmospheric CO2 favour HCO3- formation.
In the short term the news is good, The oceans continue to take up CO2. In the long term the news is bad. As the ocean pH drops,(known in the trade as ocean acidification) their capacity for CO2 decreases. Eventually they will stop absorbing. Atmospheric CO2 and it’s warming effect will increase more rapidly.
Sorry. The second equation should be H2CO3 H+ + HCO3-
Hate to Say I Told You So, But I Told You So
Here on CO2isLife weve been making a couple of predictions. The first was that the record high temperatures that the climate alarmists were celebrating as proof of their theory, were, in fact, an anomaly caused by a natural phenomenon called an El Nino, and that once that natural event ended, temperatures would plummet. That is in fact what has been happening.
https://co2islife.wordpress.com/2017/05/07/hate-to-say-i-told-you-so-but-i-told-you-so/
What amusing arrogance. Everybody knows that el Ninos increase average global surface temps while in effect. And everyone acknowledged that el Nino contributed to warmer temps in 2015/16.
What’s a good term for a particularly shabby straw man? A scarecrow?
So I read one of your links – oh my goodness.
The climate alarmists simply seem to start with the conclusion that CO2 is the cause, and never bother to look for any natural causes.
This kind of guff is so obviously, demonstrably, wildly wrong it’s hard to believe someone is still saying it.
IPCC have entire sections on paleoclimate, for example. Climate studies (which support IPCC reports) include the sun, volcanism, ENSO effects (which you’ve just mentioned), ocean/atmosphere oscillations, monsoons, tropical storms, clouds, and a host of other natural factors. The climate literature is jam-packed with this stuff.
I’m going to take a wild guess that you have not even looked at the chapters of IPCC reports to see if maybe you’re wrong. Even the laziest skeptic should do that little.
IPCC 2007 – Ch 6 – Paleoclimate
For example.
…never bother to look for any natural causes.
Good grief.
Barry
the whole point of IPCC is prove/confirm man made global warming (note not climate change) and its dangers so can one really expect a fair call.
HC
That’s pretty much irrelevant to the point. CO2isLife says that climate scientists never look at natural causes. That is patently, gob-smackingly wrong. How else do they do attribution studies?
This point is irrelevant to whatever is concluded by looking at such studies. The fact is natural causes are a major feature of climate science. That’s why we have large numbers of researchers examining paleoclimate, solar fluctuations, ocean/atmosphere oscillations, volcanism, clouds etc, whose work is relied on by climate science, including the IPCC. I can literally cite thousands of papers that examine natural causes of climate change that have nothing to do with AGW. The first few thousand would come from papers examining climate change before the birth of humankind. No AGW there.
barry,
You wrote –
“Everybody knows that el Ninos increase average global surface temps while in effect.”
Oh well, that’s settled then. Hopefully, it’s a little more reliable than everybody knowing that the Sun revolves around the Earth.
Do you think everybody knows that the greenhouse has precisely nothing to do with greenhouses?
Cheers.
As you don’t give any credence to me, why not talk with a fellow skeptic who ‘believes’ in the GHE and the enhanced GHE effect.
Mike Flynn, meet CO2isLife.
http://www.drroyspencer.com/2017/05/uah-global-temperature-update-for-april-2017-0-27-deg-c/#comment-246045
When you understand this:
1) Essentially all absorbed outgoing longwave radiation (OLR) energy is thermalized.
2) Thermalized energy carries no identity of the molecule that absorbed it.
3) Emission from a gas is quantized and depends on the energy of individual molecules.
4) This energy is determined probabilistically according to the Maxwell-Boltzmann distribution.
5) The Maxwell-Boltzmann distribution favors lower energy (longer wavelength) photons.
6) Water vapor exhibits many (170+) of these longer wavelength bands.
7) The Maxwell-Boltzmann energy distribution in atmospheric gas molecules effectively shifts the OLR energy absorbed by CO2 molecules to the lower energy absorb/emit bands of water vapor.
8) As altitude increases (to about 10 km) the temperature declines, magnifying the effect.
You should realize why CO2 does not now, has never had and will never have a significant effect on climate.
Further discussion of this with graphs and links to source data are at http://globalclimatedrivers2.blogspot.com which also identifies the factors which do cause climate change (98% match 1895-2016).
Dan Pangburn
I am reading your material but I do have one question. Why would not reverse thermalization work on CO2 as well as H2O.
If you look at this link:
http://www.spectralcalc.com/spectral_browser/db_intensity.php
You can put in water vapor and carbon dioxide and plot a graph based upon the abundance of each gas in the atmosphere over any wavelength you want to examine. The plot show that carbon dioxide intensity is in the range of H2O. Try your own and see what you think.
http://www.spectralcalc.com/spectral_browser/plots/guest854685413.png
Dan Pangburn
This graph shows the emissivity of each gas based upon partial pressure and path length.
http://fchart.com/ees/gas%20emittance.pdf
The next link is an article that shows how much each gas contributes to atmospheric emission.
http://www.patarnott.com/atms411/pdf/StaleyJuricaEffectiveEmissivity.pdf
Nor – That 1971 paper appears to perceive that radiation from a gas is in accordance with Planck spectrum and Stephan-Boltzmann (T^4) law. Gas molecules radiate according to their absorb/emit bands and the Maxwell-Boltzmann distribution of energy of individual molecules.
Dan Pangburn
This graph might be a good one to show the contribution of CO2 and H2O
http://www.spectralcalc.com/spectral_browser/plots/guest269923029.png
H2O does emit considerably more than CO2 but CO2 is not rendered insignificant. The AGW may not be that great. But it certainly would look more than insignificant.
It can be swamped by other effects.
Nor – That link did not work for me.
I intentionally us the weasel word ‘insignificant’ because I cannot be certain that it is zero. Whatever it is, I am certain that it does no harm and there is substantial evidence that it is doing a lot of good (more food). The planet is still impoverished for CO2 as shown graphically in Fig 7 of my analysis.
So why has average global temperature (AGT) been increasing? The top-down approach as used in my analysis (strongly influenced by Dr. Roy and Lord M although Im not so sure they like the idea) identifies the three factors that matter and matches reported measurements 98% 1895-2016.
Water vapor molecules have more than 170 absorb/emit bands at lower energy levels than the single OLR band for CO2 and there are about 35 times as many WV molecules as CO2 molecules.
NASA/RSS has been measuring & reporting WV content of the atmosphere (Total Precipitable Water, TPW) since about 1987. It is increasing at about 1.5% per decade. With my extrapolation, that amounts to about 8% increase since the more rapid increase began, about 1960 (Fig. 3). This is more than 2.5 times what it would be based on temperature increase alone (feedback). This WV increase is countering the temperature decline that would otherwise be occurring. Declining net effect of ocean cycles since 2005, declining solar activity dropping below ‘breakeven’ in early 2016.
Preventing the temperature decline is a good thing but the added WV is certainly exacerbating the risk of flooding. IMO all rainwater retaining systems (dams, dykes, etc.) should be upgraded from 100 yr floods to 10,000 yr floods.
My analysis has Links to this stuff.
These charts represent forecasts of Mean Sea Level Pressure (MSLP) and Wind speed at 850 hPa all from the ECMWF high resolution forecast (HRES).
http://stream.ecmwf.int/data/atls12/data/data03/scratch/render-atls12-98f536083ae965b31b0d04811be6f4c6-xGO7dE.png
Congress Should Investigate the Peer Review and Publication Process
It is almost unfathomable to believe that a survey performed through a simple search of journal article performed by a researcher with an Anti-Trump book in the works can be justification for spending TRILLIONS of US taxpayers dollars.
https://co2islife.wordpress.com/2017/05/08/congress-should-investigate-the-peer-review-and-publication-process/
It is almost unfathomable to believe that a survey performed through a simple search of journal article performed by a researcher with an Anti-Trump book in the works can be justification for spending TRILLIONS of US taxpayers dollars.
So unfathomable it’s not even true.
Points 2 and 3 in your article are simply not true. There are a few skeptics around who don’t believe in the enhanced GHG effect. They are concentrated in but hardly limited to the Principia Scientific website.
“When it comes to temperatures or CO2, the future research should be to treat the two as a completely different and not connected topics.”
http://principia-scientific.org/publications/PROM/PROM-DARKO-Virtual_vs_Reality.pdf
barry,
I believe most scientists believed in the luminiferous ether. It didn’t make any difference. The luminiferous ether still doesn’t exist.
Many climatologists (and their supporters) believe in the GHE. Whether the percentage is 1% or 100% is irrelevant. Just as the luminiferous ether, the GHE doesn’t exist. No amount of religious fervour can make the non-existent become real.
Just look at comments here. It seems that the claim is that increasing the amount of CO2 between a surface thermometer and the Sun, will cause the temperature of the thermometer to rise. Nonsensical, I know, but nobody seems to be able to express precisely what the GHE hypothesis is – in testable terms.
I understand why GHE believers attack so-called skeptics, in ways ranging – from implying opponents are racist, politically incorrect, and part of some conspiracy funded by invisible manipulators, to calls for imprisonment or even perhaps discharging firearms in their direction.
Surely a reproducible scientific experiment would be more effective in silencing non believers?
Claiming that the GHE hypothesis cannot be experimentally supported merely shows that the GHE hypothesis is poorly framed – if indeed it can be framed in any way that does not appear completely nonsensical.
Many people believe Uri Geller can bend spoons with the power of his mind, but I don’t.
I don’t believe in unicorns either.
Cheers.
“I believe most scientists believed in the luminiferous ether.”
Ah but there is a difference. Many things have been believed at various times (like ether, stationary continents, flat earth …). But they were ‘believed’ because they were a simple answer that fit with the available data of the time (or ‘lack of data’ as the case may be).
The basic physics of the greenhouse effect can be stated easily. For example, http://www.drroyspencer.com/2017/05/uah-global-temperature-update-for-april-2017-0-27-deg-c/#comment-246083
This is ‘believed’ not due to any lack of data or lack of better hypothesis. It is ‘believed’ because it is 100% compatible with all of the accepted laws of thermodynamics.
Well there you go, CO2isLife. You have a skeptic that doesn’t believe in the enhanced GHE right above this post.
They are numerous.
So the point on your website:
Strawman #4: Skeptics deny CO2 is a greenhouse gas effect and its ability to cause global warming. No one, not even the most skeptical skeptic denies that CO2 is a greenhouse gas and can cause some warming.
Needs amending.
Will you please talk to Mike Flynn? He might listen to you.
He doesn’t even believe in the GHE effect. Any chance you’ll correct him CO2isLife?
barry,
It’s not a matter of who agrees with whom. There is no GHE. There is not even a GHE effect, let alone an enhanced GHE effect.
It doesn’t matter whether you believe that Gavin Schmidt is a scientist, or even if Michael Mann is a Nobel Laureate. Facts are facts.
Facts are not determined by vote. Science is not a matter of consensus. Either you can make a thermometer hotter by putting CO2 between it and the Sun, or you can’t. And of course you can’t!
Telling people that fantasy is a satisfactory substitute for fact appeals to the gullible, the deluded, and the mentally deficient. Keep trying. Even former supporters are starting to question the reason that nobody can even produce a testable GHE hypothesis!
Cheers.
To turn the tables, Mike, you are now definitely claiming there is NOT greenhouse effect. To make such a claim, you must have tested some hypothesis and found it to be incorrect.
So what is the hypothesis that you considered, and what convinced you that it is wrong?
TIm, the GHE “hypothesis” is debunked by the UAH graph above of global anomalies. And, by the “unadjusted” surface temps.
No, you can’t see it. That’s why you need to get those worms out of your head.
(Didn’t the ministry work out for you? Back so soon?)
For what its worth, here is my (approximate, non-mathematical) statement of “the greenhouse effect”.
Suppose you have a surface (like the earth) that is exposed to EM radiation from a hot source (like the sun). That surface in turn can radiate EM radiation to cool surroundings (like space). Further suppose you have a material that is (relatively) transparent to the incoming EM radiation and is (relatively) opaque to the outgoing EM radiation (like H2O & CO2).
If such a material were placed between the surface and the surroundings (like the atmosphere), then the equilibrium surface temperature would be higher than it would be without the material.
PS g*e*r*a*n, you are describing a much more complex issue of how the greenhouse effect COMBINES with OTHER effects to produce the actual climate on earth. No one claims the greenhouse effect is the ONLY factor affecting global climate. But no one should claim it is not a factor at all!
Tim, you “arrange” your scenario to fit your belief system. You build a simple model that approximates the Earth/atmosphere system, but you neglect the realities. You are correct about the warming effect of the Sun in this model, but you seem to confuse “transient” with “equilibrium”. Of course the Sun can warm the Earth system. And, of course heat transfer occurs in the atmosphere.
But, such a weak model can easily promote pseudoscience. It is important that people understand:
“cold” does not warm “hot”;
ice can not bake a turkey;
the atmosphere does not “trap heat”;
a hand held IR thermometer reading sky temperatures does not prove the sky is heating the planet;
photons of differing wavelengths do not add;
the atmosphere is not a “blanket”;
the Sun’s irradiance can not raise Earth’s temperature to 800,000K;
etc., etc., etc., ad nauseam.
G*, I am proposing a simple bit of physics. A rather undeniable bit of physics. Greenhouse gases warm the earth. I suppose that means “physics” is my “belief system” for understanding global warming.
Yes, simplified models can cause misunderstanding. But denying the physics of simple models leads to even greater misunderstanding.
Yes, reality is more complicated. But none of your “clarifications” are about reality. They are about semantics. they are about the twisted misunderstandings of pseudoscientists.
* cool can *help* warm hot (when it replaces something even colder)
* only deluded anti-scientists make claims about ice cooking turkeys.
* the atmosphere DOES absorb IR from the ground that would otherwise escape to space. “Trapping” is not the ideal word, but it s not actually that bad.
* the IR thermometer DOES show the air helps keep the planet warm.
Etc.
Your objections sometimes are reasonable when narrowly interpreted. But (IMHO) your list of objections are much more confusing and misleading than my simplified greenhouse effect model.
“But (IMHO) your list of objections are much more confusing and misleading than my simplified greenhouse effect model.’
Exactly Tim, it is your opinion. And, in pseudoscience, opinions outweigh facts every time.
“And, in pseudoscience, opinions outweigh facts every time.”
Again, you miss the mark badly. In discussions, opinions are interesting. In discussions, you learn by considering the opinions of others and seeing what you can learn. You seem to be arguing that YOUR opinions should outweigh MY opinions. That my opinions are pseudoscience, but your opinions are science — illogical and inconsistent!
When I consider your ‘opinions’ as presented in your list, I find it interesting mostly because it is misleading in a very specific way. Your whole list encourages the idea that the atmosphere does not help warm the ground. This is simply false.
In fact, it seems that you agree with the basic physics of my “greenhouse effect hypothesis” — that in the simple scenario adding the ‘cool material’ above the ‘warm surface’ can and does lead to the surface becoming warmer than before.
Or “cool warms warm”. There are lots of more technical ways to say this and lots of details that could be added, but there is absolutely nothing incorrect or misleading about this statement with regards to the impact of the cool atmosphere on the warm earth. This is not pseudoscience.
Tim states: Your whole list encourages the idea that the atmosphere does not help warm the ground. This is simply false.
No, it’s true. The atmosphere does NOT warm the planet. Consider the atmosphere as a thermodynamic control volume (CVA). Consider the planet itself as a thermodynamic control volume (CVE). If you believe CVA can warm CVE, then you do not understand physics.
Tim states: In fact, it seems that you agree with the basic physics of my greenhouse effect hypothesis that in the simple scenario adding the cool material above the warm surface can and does lead to the surface becoming warmer than before.
No, that is your “rewrite” of what I wrote. It is your “confirmation bias” speaking for you. The “worm” in your head. You read what you want to read.
Tim states: Or cool warms warm. There are lots of more technical ways to say this and lots of details that could be added, but there is absolutely nothing incorrect or misleading about this statement with regards to the impact of the cool atmosphere on the warm earth. This is not pseudoscience.
No Tim, sadly it is pseudoscience. It is absolutely incorrect and misleading to claim that a cool atmosphere can warm the Earth.
“No Tim, sadly it is pseudoscience. It is absolutely incorrect and misleading to claim that a cool atmosphere can warm the Earth.”
Only if the tests presented by Dr. Spencer are ignored or not well understood, as in your case anger.
If not, show us a test supporting your opinion anger, not just assertion.
The brightness T of the planet is observed as ~255K from orbit, the planet surface T is observed as ~288K by thermometer. The only thing in between is the atm.
The physics demonstrated for this in the actual tests Dr. Spencer performed.
Ball4, you talk in circles.
The “test” Dr. Roy presents is revealed in the graph at the start of his post here. If you had any appreciation for the scientific method, you could study the graph and find some significant flaws in the AGW hoax.
It seems the hypothesis to consider is the idea that the existence or addition of greenhouse house gases to an atmosphere will cause the average temperature of a planet which is warmed by a star to have a higher average temperature.
Or the removal of greenhouse gases from such a planet would cause a lower global average temperature.
To make such a claim, you must be able to measure the average temperature of a planet so as to be able to determine if it’s temperature has increased or decreased.
One must also have some means of isolating the effects of any warming or cooling influences which not due to greenhouse gases. Though some believers might consider that all warming and cooling of Earth average temperature is caused by greenhouse gases. Or it’s known to me that a small group claim that without CO2, Earth would have average temperature of -18 C.
And it seems to me that a simple greenhouse which could not have any greenhouse gases involved with it, can be used to disprove this idea. Not by measurably warm the planet, but rather measurably warm the air within the greenhouse.
And I should note in passing that greenhouse effect {GHE or enhanced GHE] is not the same as the effect of an actual greenhouse.
And there other factor which can cause warming or cooling.
For instance glacial ice building up in region is considered to be a cooling effect- and ice is not a gas. Erupted volcanic dust is also considered to have a global cooling effect- also not a gas.
But Tim I don’t want to put words in your mouth, since you appear to advocate this rather old idea, why don’t you provide the exact and modern hypothesis which in your opinion must be proven or disproven.
[[Or the person known to have began the idea had hypothesis regarding what caused the geologically recent glacial and interracial periods- ie, he thought it had to do with the trace gas, CO2, and also expressed the idea that a warming world would obviously be a better world. [I guess he knew something about history. And not fan of living under a mile if ice] ]]
anger asserts: “you could study the graph and find some significant flaws in the AGW hoax.”
Well, then fill us in anger. Cite testing. Cite numbers from top post.
Ball4, you want numbers? You want numbers when you adhere, without questioning, to the bogus Arrhenius CO2 equation?
Okay, here’s some numbers for you to play with, in your pseudoscience:
7.2 degrees
92.734 Watts/sq.m.
2 ppm
134.225 qt
107 Sieverts
Want more?
“You want numbers when you adhere, without questioning, to the bogus Arrhenius CO2 equation?”
No, I want your numbers that you could study the graph and find. The ones that show significant flaws in the AGW hoax. Like anger wrote. Numbers from testing that anger can cite showing us nature’s results.
When we all know anger really has nothing or would lay out the case.
Should be pretty simple for such an accomplished commenter as anger. And there is no bogus Arrhenius CO2 equation either, anger just makes that up, asserts without cite, a common useless anger practice.
I tried to get Davie to own up to the bogus CO2 equation, but he fled.
Are you a believer in the equation?
(That question is formatted for a straight-forward “yes or no” answer. Let’s see how much spin you can add.)
I’m a believer in proper test and observation of nature anger, show me those. What eqn. are you trying to discuss?
(BTW, if Davie is watching, I just checked and he did not really flee. He was just a day late answering. But, his “answer” was just another “red herring” questions.
Ball4, well, that’s not as much spin as usual.
The equation is the same one Entropic Man has presented down thread.
∆f = 5.35ln(C/Co)
So, I will ask again. Do you believe that equation is correct?
You are misinformed anger, as usual, that eqn. is not from Arrhenius time, that eqn, is correctly from Myhre 1998 from Earth atm. test data Table 3, only for CO2 not the other well mixed gases which are also listed.
Well, you’re somewhat correct, but largely uninformed.
The form of the equation was introduced by Arrhenius.
∆f = Kln(C/Co)
He used the constant instead of the current 5.35. He knew the equation had no scientific value, so he put in the “fudge factor”. To get to the next step, the temperature increase, another fudge factor is introduced.
With all the fudge factors, you can make the equation work for any temperature!
It’s called “pseudoscience”.
anger, what you write means nothing, useless unless you cite what Arrhenius actually wrote. Myhre 1998 is developed from atm. test data existing at the time, does not even directly cite Arrhenius.
I just wanted you to admit how confused and uninformed you really are Ball4.
I mean, anyone that believes cabbages glow in the dark…sheeesh!
Go to the link and scroll down to find the equation. (I think you just got promoted to Pseudoscientist of the Month!)
https://en.wikipedia.org/wiki/Svante_Arrhenius
Sorry, anger, you are just another victim of a wiki page.
Don’t feel bad though, this happens all the time. Even in text books. You always have to check the original author writings. Sometimes a trip to the local college library is necessary.
Arrhenius did not write that formula in his work (you know, go read the original Arrhenius paper on the subject), ∆f = 5.35ln(C/Co) originated from atm. test data of the time as I cited below from Myhre et. al. 1998. At which the ref. link on your wiki page points.
Ball4, do you really believe you are fooling anyone but yourself?
As I explained, the original equation, with the constant, was from Arrhenius. The equation with the value “5.35” was from Myhre.
You’re wrong again. And now you have to find some way to spin yourself out of your own mess.
Hilarious!
“..the original equation, with the constant, was from Arrhenius.”
Again, those are angry words not those of Arrhenius. Show us Arrhenius words, angry words are useless.
Ball4, can’t you do anything for yourself?
I gave you the link. I told you to scroll down. Now, I have to copy/paste for the little puppy?
In its original form, Arrhenius’ rule reads as follows:
if the quantity of carbonic acid [ CO2 + H2O → H2CO3 (carbonic acid) ] increases in geometric progression, the augmentation of the temperature will increase nearly in arithmetic progression.
Wrong again, pup!
No mention of ∆f = 5.35ln(C/Co) anger, you will have to do better and actually find Arrhenius first writing the formula.
Well, as usual with the pseudoscience types, Ball4 cannot answer a simple “yes or no” question. He has to resort to “red herrings”, obfuscation, and innuendos to mask his ignorance.
Hilarious!
anger asks 4:17pm about: the bogus Arrhenius CO2 equation.
When asked which eqn. 5:27pm, anger claims Arrhenius wrote eqn: ∆f = 5.35ln(C/Co)
When correctly shown that really is a Myhre et. al. eqn. from 1998 atm. test data published about 100 years after Arrhenius, anger obfuscates, dodges to a wiki page that actually correctly references the Myhre 1998 eqn. origination which shows anger actually didnt bother to check his red herring.
anger flees tossing off innuendo.
Hilarious, but sad. Turned red by his smoke (& mirrors). Try hand waving too next time anger maybe some other magic will work.
Talking colloquially for a moment, suppose I have a little shed with a heater. On a cold winter night (-30 C air temperature), the heater can only manage to keep the interior of the shed at 5C. A “warm front” move through (-10 C air) and the interior of the shed increase to 15 C. The only change was the exterior air temperature. It is not at all inappropriate to say the warm front ’caused’ the rise from 5C to 15C. Or to say that the changing exterior conditions caused the changing interior temperatures.
Or I could leave the air @ -30 C and add some insulation. It would be perfectly understandable to say that adding the insulation was the cause of the warmer interior temperatures.
Sure, the shed would be even colder without the heater. Sure, the shed would not warm from 5C to 15 C without the heater. But the heater is a given. A steady input of heat from the electric heating elements is part of the assumed conditions. In such a situation, the factors affecting the heat OUTflow ’cause’ the temperature to change.
Similarly, I have no problem saying the atmosphere causes the earth’s surface to be warmer than it would be otherwise. Of course, a continued input from the sun is required.
[I do have a bit of a problem saying the atmosphere “heated” the ground, because “heat” (“Q”) has a specific technical meaning in thermodynamics. The air is part of ‘warming’ the ground, but it does not technically ‘heat’ the ground — it restricts the heat that is leaving.]
Ball4, aka “Trick”, tries to trick us again.
The comments are here for everyone to see.
Ball4 cannot answer a simple question, but hides behind word tricks.
Hilarious.
Tim, you are still hung up on “insulation”. You believe that the atmosphere is a “blanket”. You have been deceived.
To correct your scenario, the shed walls are “active”. They maintain the interior temperature. If the interior temp rises, the walls do whatever it takes to release more heat.
You need to study how the atmosphere handles heat.
Hint: The atmosphere does NOT trap heat.
“To correct your scenario, the shed walls are active. They maintain the interior temperature. If the interior temp rises, the walls do whatever it takes to release more heat.”
So G*, what temperature does the atmosphere try to maintain? 20C? 30C? 0C? 255 K?
Tim inquires: “So G*, what temperature does the atmosphere try to maintain? 20C? 30C? 0C? 255 K?”
Tim, don’t try to act like Davie with a bunch of questions that are easily available online.
Move away from pseudoscience. The atmosphere is NOT a blanket. People that try to foist that concept only reveal that they do not understand quantum physics, thermodynamics, heat transfer, and the gas laws.
The atmosphere is an amazing system that displays many laws of physics. You should learn to appreciate it.
Mike Flynn
You ask for evidence of a GHE. Have you looked at Hottel’s empirical study of H2O and CO2 and found there emissivity based upon path length and partial pressure of the gas involved?
Fossil fuel power plants use his empirical data to calculate heat exchange in boiler furnaces.
You can deny science but it is only your opinion. I think you have one strong supporter g*e*r*a*n but he is not very logical and twists what people say and reaches false conclusions all the time about science and what posters post so I would think he is a very poor supporter.
Not sure why you hate science so much Mike. The evidence is all around but you ignore and deny it. Why? You have actual empirical measurements of downwelling IR. You have empirical measurements of IR emitted from the surface that is much larger value than what is leaving the atmosphere above (what is happening to this energy with your understanding of the First Law of Thermodynamics).
You can find all the information you want if you go to the CERES web site and look at their many graphs of radiant energy. I can not make you look but if you like science at all you will and you will open your mind to a reality you seem to deny no matter what evidence is presented to you.
Why are you so obsessed with denying reality and empirical data? I know g*e*r*a*n will always deny reality because he is just a troll that gains pleasure from annoying posters. I am hoping you are a little different, not sure if you are yet or not. I hope you are not like the troll g*e*r*a*n.
Nice ramble, Norm.
I’m glad you never had a course in physics. Your pseudoscience is much more hilarious that way.
Norm’s pseudoscience: “The energy leaves the system, but the energy does not leave the system”.
g*e*r*a*n
As always and predictably you are wrong and clueless with only purpose in life to annoy.
I did take college physics for one semester and also was top student in High School physics. What led you to a false conclusion that I never took a physics course?? Oh I forgot it is you and you always twist and distort reality to try an annoy. I guess you figure if you make up an untrue statement it will annoy me.
Like I said in another post, I think there are Specialists that can help resolve your issues that make you want to annoy people. I do not have enough training to help you, sorry. I did take a Semester of Psychology and Sociology but I don’t have enough knowledge to help you overcome your inner demons.
Like I stated in my post to Mike Flynn. I hope he does not suffer from your delusions of grandeur and your uncontrollable need to twist and distort what people post.
g*e*r*a*n
I think I spent about 20 useless posts explaining how you got what I stated wrong and then correcting what I was saying.
YOU: “Norms pseudoscience: The energy leaves the system, but the energy does not leave the system.
Kind of pointless to spend another 30 posts explaining this to you when you really do not care and have these mental issues that thankfully not many other posters suffer. I think you might be about the only one that is such an intentionally annoying poster. I see how you respond to others and it is all the same. You provide no information, just twist and distort someone’s posts and try and annoy them.
Norm, was that “college” physics course at the same school you got a chemistry degree from that does not offer a chemistry degree?
Did you take a physics course from a school that does not offer a physics course?
That might explain your addition to pseudoscience.
☺
Norm, maybe this will trigger those 30 posts. I can’t wait…
http://www.drroyspencer.com/2015/12/2015-will-be-the-3rd-warmest-year-in-the-satellite-record/#comment-203812
g*e*r*a*n
You never did check on Midland Lutheran College in the 1980’s with what degrees they offered. I don’t need to convince you of anything. If you want to lie and deceive, fine, that is your nature. If you want the truth spend some time, do some real research, email them and ask if they offered a BA in Chemistry in the 1980’s. You can also ask them if they had a Chemistry Professor at that time that went by the name Dr. Bunck. Believe what you need to, it is what you do with science.
In your fantasy world that you dwell in pseudo-science is empirical data. Things that are actually measured are not real to you.
Norm, as usual, you entirely miss the point. How many people have a “meaningful” degree from an institution that no longer offers that degree?
g*e*r*a*n
No I do not understand your point. Can you elaborate?
YOU: “How many people have a meaningful degree from an institution that no longer offers that degree?”
I don’t follow your point at all. But you do accuse me of making up phony information about myself. Not sure why you make such accusations.
Here is a picture of the Chemistry Instructor I had.
http://fremonttribune.com/fremont-area-united-way-kick-off/image_a78fbe8c-03f0-11e2-92df-0019bb2963f4.html
Steve Bunck
And here is an article that confirms for you he was an instructor at Midland Lutheran College (the name it had when I attended).
http://fremonttribune.com/midland-college-to-observe-th-anniversary-of-man-s-first/article_bf0811d0-8e3a-5c87-8df2-be372d75b34a.html
From article: “Three other Midland instructors, Steve Bunck, Greg Clements and Ronald Johnson will be on campus Tuesday to help with the viewing.”
Norm asks: “Can you elaborate?”
Hint–A person with a weak academic background should not be quick to judge the qualifications of others.
So Mike Flynn does not believe in GHE effect or the enhanced GHE effect. And is there any way to encourage him in having such a faith?
Is the GHE effect equal in all places on Earth?
For example is there more GHE effect in the tropics as compared to Temperate zones.
And related to above, does enhanced GHE effect and/or GHE effect make the ground surface or water surface warmer. Or Does *more* GHE effect or more enhanced GHE effect make the surface [not “air surface”] hotter.
Different question, does more GHE effect or enhanced GHE effect make surface air temperature hotter than compared when there is less GHE effect or enhanced GHE effect?
Or if there were places with more enhanced GHE effect are they also typically the hottest places on Earth?
The total solar irradiance, a measure of the power produced by the sun in the form of electromagnetic radiation, varies by only about 0.1% over the course of the 11-year solar cycle. Climate scientists have understood this effect for some time and it is already built into the computer models that are used to try and forecast our climate.
But there are still some uncertainties. Changes in the ultraviolet portion of the Sun’s output over a solar cycle can be much greater and can deposit energy in the stratosphere – at altitudes above 10km. How this energy influences our weather and climate in the lower atmosphere is still not clear, but there is growing evidence that during periods of low solar activity, atmospheric “blocking” events are more prevalent. These blocking episodes comprise extensive and almost stationary anti-cyclones in the eastern Atlantic that can last for several weeks, hindering the flow of the jet stream and leading to colder winters in the UK and Europe.
Read more at: https://phys.org/news/2015-07-mini-iceage.html#jCp
Many solar physicists have put the cause of the solar cycle down to a dynamo caused by convecting fluid deep within the Sun. Now, Zharkova and her colleagues have found that adding a second dynamo, close to the surface, completes the picture with surprising accuracy.
“We found magnetic wave components appearing in pairs, originating in two different layers in the Sun’s interior. They both have a frequency of approximately 11 years, although this frequency is slightly different, and they are offset in time. Over the cycle, the waves fluctuate between the northern and southern hemispheres of the Sun. Combining both waves together and comparing to real data for the current solar cycle, we found that our predictions showed an accuracy of 97%,” said Zharkova.
Zharkova and her colleagues derived their model using a technique called ‘principal component analysis’ of the magnetic field observations from the Wilcox Solar Observatory in California. They examined three solar cycles-worth of magnetic field activity, covering the period from 1976-2008. In addition, they compared their predictions to average sunspot numbers, another strong marker of solar activity. All the predictions and observations were closely matched.
Looking ahead to the next solar cycles, the model predicts that the pair of waves become increasingly offset during Cycle 25, which peaks in 2022. During Cycle 26, which covers the decade from 2030-2040, the two waves will become exactly out of synch and this will cause a significant reduction in solar activity.
Read more at: https://phys.org/news/2015-07-irregular-heartbeat-sun-driven-dynamo.html#jCp
“Many solar physicists have put the cause of the solar cycle down to a dynamo caused by convecting fluid deep within the Sun. Now, Zharkova and her colleagues have found that adding a second dynamo, close to the surface, completes the picture with surprising accuracy.”
Hmm, loosely or metaphorically, the Sun’s dynamo is the Sun and one call a second dynamo it’s moon.
Of course moons don’t travel within an atmosphere or ocean and it might be [metaphorically] like drops of water on hot frying pan- skittering across frying pan in what appear a friction less movement. And how fast does the second dynamo travel within the sun’s atmosphere/ocean/mantel.
I guess I look at the link and see what they claim.
Reminds of wild idea of the sun [or stars] spitting out planets, but anyhow, I personally, have “always wondered” what happen when the larger [largest] space rocks hit the Sun.
Blocking the jet stream.
http://files.tinypic.pl/i/00898/w7b13th9fnv9.gif
The situation in Canada will be very difficult. Low persists.
http://images.tinypic.pl/i/00899/0uanqcithyg4.png
Average/moderate trade winds in western pacific continue. Accordingly, model enso predictions continue cooler toward neutral/la nina.
http://www.cpc.ncep.noaa.gov/products/analysis_monitoring/lanina/enso_evolution-status-fcsts-web.pdf
To clarify: Look to left side of zonal, low – level anomaly chart to find western pacific trade wind activity.
As I mentioned up thread, model forecasts parallel/react to observed conditions in this area.
http://www.ospo.noaa.gov/Products/ocean/sst/anomaly/anim_2mw.html
The global cooling is now starting to take place as solar values continue to weaken.
Look for a more -AO especially this next winter ,look for sea surface temperatures to fall overall, look for an increase in major volcanic activity, and an increase in global cloud coverage, snow coverage ,and sea ice coverage.
Upshot higher albedo ,cooler global temperatures coming on.
Finally the moment of truth is upon us.
http://www.dailystar.co.uk/news/latest-news/611671/ice-age-britain-freeze-climate-change-weather
GHE is real but I maintain it is the result of the climate in contrast to mainstream saying the climate is the result of the GHE.
We will soon find out.
Salvatore
We will no nothing because, as they say, even a broken clock is right twice a day. This is what your doing.
SNAPE -if the temp. fall to below the 30 year means at the very least do you not think that would prove AGW is false?
Forget about if I am correct or not.
Salvatore
There is natural variation in global temperatures. If a monthly anomaly value is -0.08 , how do we know it would not have been -0.48 in the absence of rising GHG’s?
This is why we look at *long term trends*!!! When the long term trend becomes nearly flat or negative, I will trade in my Prius for a Suburban.
If my cat kept predicting a cool down, eventually he would be right.
I say let’s see what happens and go from there.
according to AGW theory temperatures are suppose to keep rising, no cool downs.
Salvatore
Nonsense!
AGW theory predicts a LONG TERM WARMING TREND of the surface/lower troposphere. We will always have periods of ups, downs and sideways.
This is expected. It is predicted. It is inevitable. The planet could warm 5 deg.C and there would still be short term cooling trends.
Salvatore
When you say, “let’s see what happens?” Do you mean, “let’s see what happens to the long term trend”?
If that’s the case, I totally agree.
“AGW theory predicts a LONG TERM WARMING TREND of the surface/lower troposphere.”
Due to one component CO2 ppm with the 8+ others held ~steady. For that one RF component, results decline logarithmically with +ppm.
Overall TLT could show long term cooling attributed to any one or combination of 8+ other radiative forcings. AGW theory & test not shown wrong in any way if that happens.
Salvatore’s long history is to just write he hadn’t counted on the other _____ factor (fill in the blank) and/or _____ natural cycle (fill in the blank). Undoubtedly he will ignore any other factor changing the trend down. As do many.
Oops. Know not no
Its not a matter of who agrees with whom.
That’s right, it;s a matter of disagreement between skeptics and thei true motivations.
As CO2isLife believes in the GHE and you don’t, I know it is good as a fact that that CO2isLife won’t debate the point with you, because their take is based on politics, not truth.
So CO2isLife will say nothing because your view helps the political cause.
Skeptics rarely argue with each other because they are not interested in the truth, only in winning the politics.
I like to test whether ‘skeptics’ will debate their disagreements, and they never disappoint. Ever. Truth doesn’t matter to them.
Barry
If liberals were skeptical of climate change, Rush Limbaugh would be a “warmist”.
Hahaha. Rush does seem to have a jerky knee.
Warmists rarely argue with each other because they are not interested in the truth, only in winning the politics.
I like to test whether Warmists will debate their disagreements, and they never disappoint. Ever. Truth doesnt matter to them.
There barry, I fixed it for you.
People rarely argue with people who agree with them.
There … fixed it for everyone.
Indeed!
☺
Not only do I argue with people who agree with me on other stuff, I also sometimes argue for the opposite of my own perspective, because that is what a skeptic does – challenges their own opinions by fully understanding counter arguments. If you can’t accurately articulate the converse, then you do not understand it.
In a dialog where comprehension and truth is the driving force rather than ‘winning,’ intellectually rigorous and honest participants should be able to fearlessly and accurately argue the opposite case. What usually happens in the semi-popular climate debates is that the counter-proposition is caricatured and otherwise misrepresented by opponents. Because winning is more important than truth.
Extracting a logical signal from all the fallacious noise takes a fair bit of discipline. Disciplining oneself to contribute more of the former takes even more discipline, it seems.
barry, your “discipline” ain’t there yet.
You are consumed with your pseudoscience. You cannot even imagine Earth where CO2 from mankind is not about to boil the planet.
First paragraph.
http://www.drroyspencer.com/2017/05/uah-global-temperature-update-for-april-2017-0-27-deg-c/#comment-246003
Barry,
I’m not sure if you saw this but Norman was able to help with my question.
I asked:
“Why are these molecules (nitrogen/oxygen) dispersed above earths surface as air instead of lying in a big pile on the ground?
Norman replied:
“The answer would be perfectly elastic collisions. The nitrogen molecule would be pulled down by gravity bu convert it potential energy to kinetic energy. When it hits the surface it bounces back up with no loss of internal energy to the surface so it goes back to its original height.
In our atmosphere the molecules all have considerable kinetic energy and when they collide with other molecules all the collisions are perfectly elastic. The molecules can exchange energy (some get faster, others slower) but the total energy is not lost as with larger groupings of molecules (such as a bouncing ball, it does not have a perfectly elastic collision, some of the energy of deformation turns into internal energy).”
Reply
Yes, I saw that. I’ve read in many places that atmospheric turbulence is what keeps gases aloft. Our different points of view may not be mutually exclusive. Norman knows more about physics than I.
Right. There was lots of information about how a nitrogen molecule behaves in the atmosphere, but almost nothing about how it would behave in the absence of an atmosphere. David replied, “wind”. You replied, “turbulence”. It was very annoying! Lol!
I find this confusing. The atmosphere is gases. In the absence of an atmosphere there are no gases. Your question appears to me to be straightly self-contradictory.
Do you mean, for example – what would a single nitrogen atom do on the moon?
Barry
Yes. That’s what I meant. You wouldn’t call just one or two molecules an “atmosphere”.
– In my thought experiment, I didn’t want the individual molecule to bump into other molecules on the way to the ground.
– the question I originally asked myself was, “if air keeps a balloon aloft, what keeps air aloft?”
– your answer, “atmospheric turbulence” didn’t make sense because it seemed to defy gravity. After all, would a trillion tennis balls remain aloft just because they were bouncing against each other?
-The clue I was missing was “perfect elasticity”. If, in a vacuum, you let go a nitrogen molecule, it would fall to the ground and bounce all the way back up to where it started. It would never come to rest.
*in our atmosphere, nitrogen atoms are bound together in pairs (Na). That’s why I used the term “nitrogen molecule”.
Not to overly complicate things, but a better model would have the molecules rebounding from the ground with varying energies as they collided with the “thermal reservoir” of the ground. The N2 molecules would leave a distribution of energies — the Maxwell-Boltzmann distribution.
This extra detail is important for more detailed calculations with kinetic theory.
Tim
Thanks. Unfortunately my understanding of physics and chemistry could be described as “science for kids”. I couldn’t do a detailed calculation if my life depended on it.
— Tim Folkerts says:
May 9, 2017 at 10:37 AM
Not to overly complicate things,…–
That is what I am thinking.
On Earth the average velocity of air molecules is a bit faster
than the speed of sound. One could say the average velocity of air molecules controls the speed of sound.
The temperature of the air affects/controls the speed of sound- cooler air slower speed of sound, warmer air temperature, the faster speed of sound.
And the average velocity of air molecules is the temperature of the air. Or the kinetic energy of gas molecule is the temperature of the air. Or Kinetic energy = 1/2 Mass x velocity squared.
Air molecules are perfectly elastic collisions- unless they doing things which use/need energy- such as chemical reactions or changing from gas to liquid or solid [or plasma].
Or water vapor does change from gas to liquid or solid in our atmosphere and can’t be said the always involved in perfectly elastic collisions.
Or one can say according to Idea Gas Law air molecules are perfectly elastic collisions. And according the Idea Gas Law
water gas molecules can be sticky- the kinetic energy of water vapor can added to or removed. But gas molecules of Nitrogen or Oxygen don’t condense within normal temperature and pressure of Earth’s atmosphere- or in Earth atmosphere they are Ideal gases and water vapor isn’t.
All atoms/molecules have perfectly elastic collisions but with gases the atoms/molecule are moving, whereas in comparison with solids and liquid atoms/molecules are held together by molecular structures. If gas molecule hits a brick, it has a perfectly elastic collision.
Now at sea level elevation [or in entire troposphere of earth] one has a lot of molecules within 1 centimeter cube volume of air- roughly ^19 [billions of billions] and they have average velocity of about 500 m/s [faster than speed of sound]. And a or any molecule can’t go anywhere- because billion of billions of other molecule have a chance to hit it.
If there was a lot less gas molecules in a cube cm, or if a gas molecule was travel a lot faster, it could have a chance of moving say 1 cm distance, before being hit by another gas molecule. And hitting another gas molecule will change the direction it is traveling.
So, a or any gas molecule at sea level elevation is changing the direction it’s traveling, somewhere around billion times per second, on average. Or it do not travel someplace, though it does travel someplace if a crowd of molecules are going somewhere.
Now all these collisions have an average velocity AND they average the velocity of the molecule in terms of their kinetic energy. Or less massive molecule “needs” to travel at higher velocity than a more massive molecule to have same average kinetic energy. So H2 is less massive as compared to N2, so Nitrogen gas has lower average velocity and Hydrogen gas has higher average velocity.
Gbaikie
Interesting. I’m not sure how much of that relates to the question, “if air keeps a balloon aloft, what keeps air aloft? , but interesting nonetheless.
I’m wrong, it’s not wind — it’s pressure, counterbalancing gravity, at least hydrostatically.
“Why Doesn’t the Atmosphere Fall to the Ground?”
http://www.pdas.com/nofall.html
David
I read your link about air molecules and hydrostatic pressure, but am not sure how that relates to what I wrote:
“The clue I was missing was perfect elasticity. If, in a vacuum, you let go a nitrogen molecule, it would fall to the ground and bounce all the way back up to where it started. It would never come to rest.”
*(This was based on an earlier explanation by Norman.)
No need to reply, I think I’ll let it go.
“.. Im not sure how much of that relates to the question, if air keeps a balloon aloft, what keeps air aloft? , but interesting nonetheless.”
Same way a boat floats- buoyancy.
A boat made from steel can float if it displaces the same amount of weight of water as the boat [and cargo].
Gas can resemble a liquid. One pour cooler pure CO2 gas. You can pour it into say a cup and it would “fill” the cup.
Eventually, it mixes with the air but it could take a while.
In order for a balloon to float it needs to displace enough air so it’s gross weight equals the weight of volume of the surrounding air.
Air at sea level and say 20 C weighs about 1.2 kg per cubic
meter. Trapped [by the balloom] warm air is less dense than cooler surrounding air. It could be say, .9 kg per cubic meter. So if had 1000 cubic meter displaced by balloon, it can lift 300 Kg.
And as said before with hydrogen [or helium] molecules travel faster than N2. Or the kinetic energy of surrounding air of balloon [mostly N2] atmosphere in order to equaled it term of kinetic must “make up for it” by having higher velocity- or takes up same volume but is much lighter.
Or a vacuum balloon doesn’t work because the pressure of atmosphere would crush it,
And you can also heat up the helium or hydrogen so it displaces more air- or need less of the gas to displace same amount of atmosphere.
Oh, what keeps the air up is same as what keeps surface of ocean up- the water below it- and earth crust below the water keep ocean “up”.
one could say the molecular structure of the water keeps water “up” likewise with air, heat [or the massive amount of kinetic energy] keeps it up. [cool the entire atmosphere and it will drop, like a rock]
Gbaikie
I thought I had asked a simple question, but the answers I’ve received have included: atmospheric turbulence, kinetic energy, thermal reservoir, perfect elasticity, and hydrostatic pressure.
Now my head hurts.
Ball4
“Due to one component CO2 ppm with the 8+ others held ~steady. For that one RF component, results decline logarithmically with +ppm.”
I have noticed a tendency for sceptics to overestimate the reduction in rate due to the logarithmic effect.
When you run the numbers you find that each doubling of CO2 concentration produces 15% less warming than the one before.
Thus the doubling from 280ppm to 560ppm is expected to produce 3C warming. A second doubling to 1120ppm would produce a further 2.55C, a total change for two doubling a of 5.55C.
Courtesy of WFTT you can see the long term trend of GISTEMP from 1970 on (the red line).
http://www.woodfortrees.org/plot/gistemp/from:1970/to:2018/every/trend/plot/gistemp/from:1970/to:2018/every/trend/offset:0.09/plot/gistemp/from:1970/to:2018/every/trend/offset:-0.09/plot/gistemp/from:1970/to:2018/every
The blue and green lines show the uncertainty in the long term trend, +/-0.1C
Looking at the monthly values (the purple line) you can see that on a timescale of a few months or a year individual measurements can be up to 0.4C above or below the warming trend, but they are temporary and always return to the trend.
These temporary variations cannot be used to infer that the trend has accelerated or slowed without a longer baseline.
I think the numbers may be wrong – 3C is the estimated warming from doubled CO2 plus feedbacks. I’m not sure that the logarithmic effect applies to the feedback effect so neatly.
Doubled CO2 with no feedbacks leads to about 1C warming.
Good.
Double the CO2
Thoughtless.
We’re aware you are, Davie.
But we hold out hope.
“Thus the doubling from 280ppm to 560ppm is expected to produce 3C warming.”
Due only to CO2 RF component. Other RF components and natural cycles could make that 0 in overall T (“the pause”) or even negative acting together.
This sort of est. is all over the place, imo think some predictive value but not at all thoroughly. The Myhre 1998 paper is concise first read on the subject going over the reasons for your numbers and the other IR active gas contributions. The Feldman 2015 paper puts some observed atm. numbers on the CO2 RF component over a decade at 2 observation sites.
Ball4
The direct impact of doubling CO2 to 560ppm is a forcing equivalent to about 1C. To reach 3C you include another 2C from secondary forcings such as increased water vapour.
My own calculation for the effect of doubling CO2 to 560ppm uses the Myhre et all 1998 forcing equation ∆f = 5.35ln(C/Co).
I converted this to a temperature change using the IPCC mid-range climate sensitivity of 3.0 and their estimate that 3.7W of forcing produces 1C warming. The direct warming contribution of CO2, ignoring climate sensitivity, is thus
5.35ln(560/280)/3.7 = 1.002C
Including climate sensitivity the temperature change for the first doubling is thus
5.35ln(560/280)3/3.7 = 3.006C
For two doubling to 1120ppm
5.35ln(1120/280)3/3.7 = 6.01C
Still, you leave out the other 8+ forcings as did Myhre et. al. (“Only the direct forcing from (well mixed greenhouse gas) concentration is considered here.”).
Not too many (none?) discuss the predictive effects those other 8 or so along with natural cycles will have on global T at the same time. As Snape implies, a cooling trend forced from those others will generate lotsa’ discussion that forgets CO2/wv is not the only game in town.
Ball4
Excluding CO2 and its secondary forcings there are about eight other natural drivers of climate. These include variations in solar insolation, volcanoes, orbital cycles and ENSO.
When you add up their combined effect, they almost cancel out, leaving a very slow cooking tendency.
This leaves increasing CO2 as the only significant current driver of temperature change.
For a summary graph of the data go to
http://globalwarmingindex.org
The blue line is the temperature effect of the combined natural forcings.Orange is the effect of human activity, mostly CO2, and the red line is the combined total for all forcings.The black line is the observed temperature.
“We note that the monthly index uncertainty range is +/-0.0013K (95% confidence level).”
Well, your link must have nailed all of them, I was misinformed.
Actually, if you want to read up on an author mentioned in the ref. to that index, P. Forster, he was lead author for AR4 discussion of all the RF factors not just CO2 of Myhre, from some 700+ ref.s. To become knowledgeable about the sum total not just Myhre’s focus on one RF, there is a lot of reading ahead:
http://www.ipcc.ch/pdf/assessment-report/ar4/wg1/ar4-wg1-chapter2.pdf
Commenters here like to forgo the work involved in what they comment on, and not just the work went into developing the top post graph
Ball4
Regrettably the suggestion that natural forcings have been ignored is a straw man.
You can get more detailed values for individual natural and human forcings from Bloomberg here.
https://www.bloomberg.com/graphics/2015-whats-warming-the-world/
The other radiative forcings are not ignored in the literature EM, my point is they are ignored by certain commenters here including you in quoting just the limited Myhre formula.
It is just too much work to read all the literature for overall global T forcings before commenting. One look at the top post and anyone should be able to see there is way more to the global TLT story than your 5.35ln(560/280)3/3.7 = 3.006C.
Unfortunately, process of elimination only works if you have a closed set of known alternatives from which to choose. Obviously, they haven’t neglected some natural forcings. The question is, what have they neglected?
Appears they left off some knowns 1) substantial warming bias from halocarbons and 2) black carbon on snow. Not clear if aerosols included the 3) substantial cooling bias on cloud albedo or just the direct affect, and 4) slight warming of linear contrails.
As you write, certainly left off the unknown unknowns (Rumsfeld term).
“The question is, what have they neglected?”
Ah, yes, the science of unicorns.
Even if there are overlooked natural forcings (unlikely), CO2 is still a greenhouse gas and it still traps heat and it still warms the atmosphere. That science is rock solid. So any additional forcing has to be evaluated in that climate system.
Even if there are overlooked natural forcings (unlikely), CO2 is still a greenhouse gas and it still traps heat and it still warms the atmosphere. That is rock solid PSEUDOSCIENCE.
Fixed it fer ya, Davie!
40 Years Ago: Massachusetts Snags a Memorable Snowfall in May Storm.
https://wattsupwiththat.com/2017/05/08/40-years-ago-massachusetts-snags-a-memorable-snowfall-in-may-storm/
http://www.intellicast.com/National/Radar/Current.aspx?location=USNY0124&animate=true
richard varney,
David Appell believes that CO2 produced by humans dominates “Climate Change”. If that were true the temperature would be rising like Mike Mann’s fraudulent “Hockey Stick.
Reality is quite different given that global temperature has flatlined for almost 20 years while CO2 has soared. David Appell can’t explain the “Pause” so he quotes fraudulent papers authored by acolytes of Trofim Lysenko. Even the Lame Stream Media could not apply enough lipstick to make this ugly pig attractive:
http://www.powermag.com/blog/pausebuster-did-noaas-tom-karl-cook-climate-data/
Camel
The oceans are a giant heat sink. Far more so than the atmosphere. A 20 year uptake in OCH is all that’s needed to explain the pause in atmospheric warming. Do we have a comprehensive (the entire ocean, top to bottom), reliable, monthly, 40 year record for OCH like we do for the lower troposphere?
Nevertheless, do you understand that this long, “unexplainable” pause is included in the long term trend? And that the long term trend shows significant warming?
Here are the data on ocean heat content.
http://tinyurl.com/jbf2xco
Some go back to the late ’50s.
Snape, the ocean can cool the atmosphere [by a lot] and the ocean can warm the atmosphere [by a lot].
The average temperature of the ocean is about 3 C. If mixed the ocean so it has uniform temperature, the surface of the ocean would be 3 C.
Merely because the ocean covers 70% of the surface area of Earth, if the ocean surface was 3 C, the average global temperature would be about 3 C.
But that would be the simple version and Earth would [or could] be colder than an average temperature of 3 C.
For simple reason that the warmth of world’s ocean surface, warms the entire world.
One might find people [experts”] saying the tropics warms the rest of the world, but it more precise to say the tropical ocean warms the rest of the world. Or deserts in tropics, don’t. Nor do other tropical land masses. And 80% of the tropics is ocean area.
So if cause the surface of world’s ocean to have uniform temperature of 3 C, than ocean are inhibited in terms warming land area.
Other factors include inhibting global generation of water evaporation. Though there would be a lot strange stuff happen- or you made the polar waters warmer, and it matter what season it was. A polar winter ocean water would be significantly warmer.
One could make less complicated if instead of mixing the entire ocean, one had only the tropical ocean mixed- again it’s surface waters would still be around 3 C. And one still would have average global temperature being around 3 C – though perhaps, 4 C. And it still would have very dramatic affects on global weather.
And if the average temperature of the entire ocean was warmer, than global temperature would be higher. Or world would be more tropical. And Earth in the past has had much higher average ocean temperature than we have now- and had much higher average temperature {and more of the world had tropical conditions]
Gbaikie
You may have misunderstood me. It’s my opinion that the “hiatus” can be explained by the oceans releasing less heat that usual into the atmosphere. Less heat released means more heat retained, thus greater OHC.
I thought scientists lacked evidence for this idea because the data on OHC was inadequate. David Appell’s link makes me think I might be wrong about this.
— Snape says:
May 9, 2017 at 10:18 PM
Gbaikie
You may have misunderstood me. Its my opinion that the hiatus can be explained by the oceans releasing less heat that usual into the atmosphere. Less heat released means more heat retained, thus greater OHC. —
Definitely- in the long term. And I mean many centuries.
Or it would require the ocean to retain more heat for centuries in order to warm the entire ocean [by a small amount].
But if you are referring retaining more ocean heat in the top 100 meter layer of surface waters- this by itself is something with much shorter term effects [years, decades]
There is no reason not to expect that Earth’s ocean with not warm in next few thousands years- that is, if the interglacial period continues. Or in the interglacial before this one [Eemian**], the average ocean temperature was a few degrees warmer [and sea level was about 5 meters higher]
** https://en.wikipedia.org/wiki/Eemian
Gbaikie
Very helpful. Let me make sure I understand you.
– during a la nina, for example, the Pacific Ocean releases less heat into the atmosphere and the planet cools a little. This produces a noticeable warming in the top 100 meters of the ocean ( more heat is being retained), but the amount is too small to show up in the ocean as a whole (OHC). Is that right?
“…but the amount is too small to show up in the ocean as a whole (OHC). Is that right?”
Correct.
Adding say, a couple of degrees temperature to top 100 meters is too small- or more precisely, not measurable, yet, to show up in the entire ocean.
[ There is an ongoing effort to measure the oceanic temperature more accurately- called, Argo.
“Argo is an international program that uses profiling floats to observe temperature, salinity, currents, and, recently, bio-optical properties in the Earth’s oceans; it has been operational since the early 2000s.” wiki, https://en.wikipedia.org/wiki/Argo_(oceanography) ]
The average depth of ocean is ‘3,688 meters” [wiki, Ocean]
100 meter is about 1/36th- if entire surface water of earth were warmed.
And limited to the surface ocean in the tropics- it’s about 1/2 of the area [or say, 1/70th of the ocean waters].
I would say if you mix the ocean, you are increasing global temperature- long term.
Global climate is a long term process and so in terms of global climate, mixing the entire ocean would be a warming mechanism.
Though if you are expecting the Earth to warm up a lot in next few centuries, it could be viewed as a massive cooling mechanism.
One thing I have considered is that volcanic heat added to the ocean [and there is a lot of volcanic activity under the ocean] may be insignificant, but one can also view as another factor involved with mixing the ocean.
And similar to our lack data on global ocean temperature, we have not enough data regarding the volcanic activity on the Ocean floor.
Like they used to say, we know more about the moon than our own oceans.
I’ve always thought that adding GHG’s to the atmosphere is a giant science experiment. Wish I could live to 2100 if only to see what happens.
As you say, the oceans are a great heat sink and that accounts for the the fact that [CO2] lags temperature by 500 to 1,000 years. There is “Hard Science” to back this up but the EPICA researchers (e.g.Thomas F. Stocker) dare not admit it!
https://diggingintheclay.wordpress.com/2013/05/04/the-dog-that-did-not-bark/
It takes hundreds of years to distribute heat throughout the oceans so over shorter periods only the upper layers are warming or cooling and this is being tracked by the ARGO buoys.
https://notalotofpeopleknowthat.wordpress.com/2013/09/30/study-finds-argo-buoys-show-no-evidence-of-missing-heat/
My advice is read the scientific papers yourself, stop listening to people who tell you what to think and then make up your own mind.
The public has lost interest in climate catastrophes. You can’t keep crying “Wolf” while nothing shows up but puppies or kittens.
The temperature is increasing. Ice is melting. Sea level is rising. The ocean is gaining heat fast.
Atmospheric CO2: Principal Control Knob Governing Earths Temperature, Lacis et al, Science (15 October 2010) Vol. 330 no. 6002 pp. 356-359
http://pubs.giss.nasa.gov/abs/la09300d.html
“The temperature is increasing. Ice is melting. Sea level is rising. The ocean is gaining heat fast.”
Don’t stop there, Davie.
Birds are dying
Planes are falling out of the sky
Coral reefs are ablaze
The last whale just ate the last polar bear
The oceans are boiling
Mountains are melting
The canary-in-the-coal-mine has just filed a worker’s comp lawsuit
The atmospheric temperatures have exceeded 800,000K
Just wait until the “feedback” kicks in….
In the meantime, it has just been reported:
“Dutch officials have opened what is being billed as one of the worlds largest offshore wind farms, with 150 turbines spinning far out in the North Sea.
Over the next 15 years the Gemini windpark, which lies some 85km (53 miles) off the northern coast of the Netherlands, will meet the energy needs of about 1.5 million people.
Gemini would contribute about 13% of the countrys total renewable energy supply and about 25% of its wind power, he added.
It would help reduce emissions of carbon-dioxide emissions, among the greenhouse gases blamed for global warming, by 1.25m tonnes, the company says.”
https://www.theguardian.com/environment/2017/may/09/full-tilt-giant-offshore-wind-farm-opens-in-north-sea
DR NO that should get rid of a few seagulls,
And, in another bit of good news, I have just read that:
“India ..has unveiled the world’s largest-ever solar farm at Kamuthi, in Tamil Nadu.
It stretches across 2,500 acres, and its 2.5 million solar modules are cleaned each day by a team of robots, themselves solar-powered.
.. India and China are ramping up their installations.
India quadrupled its capacity in the last three years to 12GW (gigawatts) – 1GW can power about 725,000 homes.
This will almost double again this year, with India adding 10GW in 2017; another 20GW is in the pipeline.
China is installing solar panels at a similar clip; its capacity leapt to 77GW last year, up from 43GW.”
http://www.bbc.com/news/business-39844446
Bye bye coal.
On the other hand (same source) –
“Even with costs of solar cells dropping, there are pretty large leaps forward in efficiency needed before solar energy can broadly supplant fossil sources, says Dr Ross Hatton, an associate professor of physical chemistry at Warwick University.”
Like everything else to do with renewables, all that is needed is another 10 years, and just a little more research and ongoing Government subsidies!
Cheers
Wind and solar may be a way to go. Solar, especially, is nice around the house and, if you want to tie up farmland, it is nice in large arrays – very PC.
For long term industrial applications, which are still necessary to our economy, nuclear seems the best option.
In the meantime, fossil fuels will be necessary for years. What will be interesting is if some young chemist can figure out how to convert cellulose to liquid fuel, without exorbitant costs.
Hopefully, with enough CO2 in the atmosphere, the climate will stay warmer and we won’t need to use too much energy on keeping us warm.
It’s UFO that have caused “global warming”. As Dr. Roy’s research indicates, as UFO sightings rose last century, global temperatures rose. The last 20 years, UFO sightings are down, and we have a “pause” in “global warming”.
Hi g*e*r*a*n
You are great!
Massimo
Hi Massimo—
http://www.drroyspencer.com/2014/04/do-aliens-cause-global-warming-the-data-say-yes/
Hi g*e*r*a*n,
I missed that thread, I’m not sure what I was doing that time because I usually read this blog on a daily basis.
Anyways, that’s a very nice example of how correlation not always means causation.
These days I’m a little busy, so I can’t intervene in the discussions, but I still read here and there.
I’m very interested in how Tyndall’s experiment should have demonstrated the GHGe.
I also read above that someone finally asked hisself how could the atmosphere stay up there, and I read the idiocy of an answer like “winds”.
Hey, does somebody admit that the atmosphere without the ground temperature does’t exist at all?
Any gas molecule at 0K collapse aiming the single point at the gravitational barycentre of the system.
Have a grat day.
Massimo
Ok, I missed the “e” of “great”.
It’s around midnight and I’m tired this night.
Sorry.
Lewis wrote:
“Hopefully, with enough CO2 in the atmosphere, the climate will stay warmer and we wont need to use too much energy on keeping us warm.”
You’ve written this before. Again you seem not to care about anyone but yourself. What about the 3B people who live in the tropics. For example, Lagos, at 6 degrees N latitude. Do you think people there want or need more warming? Or Ethiopia? Chad? Mexico? India?
Davie, did you send all your savings to Lagos this year? Can you provide the proof?
Are you only thinking of yourself?
I think the pizza delivery guy is at your door….
You’re just trying to divert attention from your lack of concern for how anyone else might be affected by climate change.
Wishing for warming because (you seem to think) it’s good for you is selfish.
Davie, deep breaths!
It’s okay.
I know you don’t understand the science, so let’s try some humor:
“AGW is a hoax, started by the Chinese!”
Feel better now?
Mike Flynn says:
“Like everything else to do with renewables, all that is needed is another 10 years, and just a little more research and ongoing Government subsidies!”
In developing countries, solar is now the cheapest way to add capacity:
World Energy Hits a Turning Point: Solar Thats Cheaper Than Wind:
Emerging markets are leapfrogging the developed world thanks to cheap panels.
Bloomberg News, 12/14/16
https://www.bloomberg.com/news/articles/2016-12-15/world-energy-hits-a-turning-point-solar-that-s-cheaper-than-wind
PS: How do you feel about the huge subsidies given to the fossil fuel industry?
at least it will still be in the ground for use when the oil and gas runs out,it will be like CHRISTMAS for the next generation
Yes the long term trend
Ball4
The present overall forcing is 0.7W/M2. It can be derived from direct measurement from orbit, from the rate of change in ocean heat content or from sea level rise. With three independent lines of evidence it is quite a reliable measure of energy uptake by the earth system.
O.7W is producing a long term warming trend of 0.18C/decade.
Both are close to the values projected for the observed change in CO2.
Show me numbers. Your hypothesis is that non-CO2 natural forcings are sufficient to explain the observed energy imbalance and the observed temperature change. You should be able to produce a forcing budget from the available data.
10:22 am EM: “Your hypothesis is that non-CO2 natural forcings are sufficient to explain the observed energy imbalance”
I don’t understand how you got that impression, if you clip my actual words I might see how I could have been clearer. My point is that there are more forcings to consider on the top post TLT graph than just CO2 after your discussion 4:35pm of only CO2.
“Show me numbers.”
The magnitude with current confidence intervals of the 9 or so radiative forcings chart is available from many sources on the internet, choose the one you like.
Your 0.7 W/m^2 imbalance is not given a cite, a time period, nor error bars, it implies much too precise a number.
Stephens 2012 indicates don’t have enough precision in all the energy budget numbers to know with any confidence whether it is even net cooling or net warming over the decade of satellite observations 2000-2010, they report 0.6 W/m^2 +/- 17 !! Fig. B1.
L’Ecuyer 2015, a great survey paper, uses the same time period and seeks to improve on Stephens et. al. energy balance using improved methods to come up with much more precise net absorbed 0.45 W/m^2 +/-0.4 in Fig. 4. So at least that shows confidence in a warming signal and if you eyeball top post chart there was arguably bias to the warm side in that decade around ~0.1C global T departure from 1981 to 2010 avg.
The analysis of Gregory Johnson et al significantly reduced the error bar:
“Here, we update our calculations and find…heat uptake of 0.71 0.10 W m2 from 2005 to 2015….”
Nature (2016)
http://www.nature.com/nclimate/journal/v6/n7/full/nclimate3043.html
That should be 0.71 +/- 0.10 W/m2.
The Pastafarians explain that piracy causes global temperature change. There is a strong inverse correlation between them. More piracy produces cooler temperatures.
https://www.venganza.org/2008/04/pirates-temperature/
The question then arises what controls cloud cover? This is an area of intense research at the moment, but the available evidence thus far indicates that the global cloud cover is affected by the Suns magnetic activity high solar activity creates conditions for fewer clouds (causing warming), while a low activity promotes more clouds (causing cooling). According to the above figure, the appreciable slowdown of global warming after year 2000 is likely the result of increased low-level clouds. The Suns influence on Earths cloud cover and albedo, although small in absolute terms, is sufficient to cause global temperature variations in the order of 0.7 C, which is the size of climatic change we have observed since 1850. The good news is that solar induced changes in cloud cover are buffered by negative feedbacks within the Earths climate system making it impossible for the global temperature to deviate more than 0.7 C around a central mean.
https://tallbloke.wordpress.com/2016/09/25/ned-nikolov-in-science-new-messages-mean-more-than-the-messengers-names/comment-page-1/
We started our quest by asking What controls the long-term average surface temperature of a planet?. Instead of looking at theoretical explanations, we decided to answer this question by analyzing data from a broad range of planetary environments in the Solar System. Our initial premise was that factors controlling Earths mean global temperature must also be responsible for determining the temperature on other planetary bodies. After an extensive query of the peer-reviewed literature we selected 6 bodies for analysis: Venus, Earth, the Moon, Mars, Titan (a moon of Saturn) and Triton (a moon of Neptune). Our selection was based on 3 criteria: a) presence of a solid surface; b) availability of high-quality data on near-surface temperature, atmospheric composition, and total air pressure/density preferably from direct observations; and c) representation of a wide range of physical environments defined in terms of solar irradiance and atmospheric properties. Using vetted NASA measurements from numerous published sources, we assembled a dataset of incoming solar radiation, surface temperature, near-surface atmospheric composition, pressure, density, and a few other parameters for the selected planetary bodies. We then applied DA to group the available data into fewer non-dimensional variables (ratios) forming 12 prospective models that describe the average planetary surface temperature as a function of solar radiation reaching the orbit of a planet, atmospheric greenhouse-gas concentrations, greenhouse-gas partial pressures, total atmospheric pressure and total atmospheric density. Next, we performed a series of regression analyses to find the best mathematical model capable of describing the non-dimensional data. One non-linear model outperformed the rest by a wide margin. This model describes the atmospheric greenhouse effect only as a function of total atmospheric pressure. In our study, we call the Greenhouse Effect an Atmospheric Thermal Enhancement (ATE) quantified as a ratio of the planets actual surface temperature (Ts) to a temperature that the planet would have in the absence of atmosphere (Tna). ATE = Ts/Tna. The no-atmosphere temperature, Tna, depends on solar irradiance and is computed from the physical model of Volokin and ReLlez (2014). The figure below illustrates the final pressure-temperature relationship emerging from the data and its success in reproducing the relative atmospheric thermal effects of the 6 planetary bodies.
https://tallbloke.files.wordpress.com/2016/09/ate-v-p.png?w=614
Those models can’t right, because they can’t explain this observation:
https://www.giss.nasa.gov/research/briefs/schmidt_05/
Which observation are your referring too? In the article it states…
This is more of a “thought experiment” than an observable state
If we assume no change in albedo from changes in cloud cover does it reflect reality? Just curious, when I have visited these places (just south of equator), it was always a bit cooler on cloudy days.
The observations represented by the big graph near the top of the page…. This same graph appears throughout the scientific literature.
The term “thought experiment” does not refer to these data or the graph, but to a theoretical measurement of the GHE’s warming of 33 C.
Thanks David, could you explain how that graph would invalidate the models that Ren is referring to? If cloud cover reduces sunlight to the earth surface and also reduces infrared leaving the earth it still would be possible that the result is a lower surface temperature even with less infrared leaving. Thus on days with partial cloud cover, it is cooler for me when the sun is blocked by clouds versus in direct sunlight. I am really just trying to understand the dynamic of that graph that would be invalidated by Ren’s comment. In my experience, clouds in day meant for a cooler day and in the evening slightly warmer, but what is the overall net affect?
Arctic Sea Ice Extent
http://ocean.dmi.dk/arctic/plots/icecover/osisaf_nh_iceextent_monthly-05_en.png
http://ocean.dmi.dk/arctic/plots/meanTarchive/meanT_2017.png
Ren , I think the decline has finally started in global temperatures. What do you think?
You’ve said this many times before. For instance
Your conclusions are in a word wrong, and that will be proven over the coming years, as the temperatures of earth will start a more significant decline (which started in year 2002 by the way).
– Salvatore del Prete, Reply to article: IC Joanna Haigh – Declining solar activity linked to recent warming, 10/8/2010
http://climaterealists.com/index.php?id=6428
See what is happening on the east side of Greenland. Large cooling in Europe.
ftp://sidads.colorado.edu/DATASETS/NOAA/G02186/plots/4km/r07_Greenland_Sea_ts_4km.png
ftp://sidads.colorado.edu/DATASETS/NOAA/G02186/plots/4km/r03_East_Siberian_Sea_ts_4km.png
http://www.cpc.ncep.noaa.gov/products/stratosphere/strat_a_f/gif_files/gfs_toz_nh_f00.png
Norman,
You wrote –
Mike Flynn
“You ask for evidence of a GHE. Have you looked at Hottels empirical study of H2O and CO2 and found there emissivity based upon path length and partial pressure of the gas involved?”
You’re just making stuff up now,
I don’t bother asking for evidence of something that doesn’t exist. You cannot even provide a GHE hypothesis which refers to CO2.
The reason you cannot find anybody silly enough to propose a GHE hypothesis in testable scientific terms, is that it would have to include something to the effect that increasing the amount of CO2 between the Sun and a thermometer on the Earth’s surface causes the thermometer to become hotter!
If a testable GHE hypothesis existed, don’t you think some GHE supporter might have triumphantly waved it in my face by now? I’m hardly the most popular commenter with the GHE believers, am I?
Raising the temperature of a thermometer requires an increase in heat, however defined. Go for it. Multiply some heat by using CO2. Record your reproducible results, along with your experimental setup. Tyndall demonstrated precisely the opposite, but don’t let that stop you. Tyndall was wrong about the meteoric origin of the Sun’s heat, wasn’t he?
Cheers.
“he reason you cannot find anybody silly enough to propose a GHE hypothesis in testable scientific terms, is that it would have to include something to the effect that increasing the amount of CO2 between the Sun and a thermometer on the Earths surface causes the thermometer to become hotter!”
ok,ok,ok, I will take the bait (for the umpteenth time mind you):
(1) put yourself and your thermometer on the far side of the moon.
(2) pretty cold yes?
(3) imagine that we now flood the moon with a co2 atmosphere
(4) do you get colder, stay the same, or get warmer?
Alternatively,
go outside on a clear calm dry night here on Earth
getting cold yes?
What happens if you could inject more co2 into the atmosphere above your head?
Would the rate of cooling drop, stay the same or reverse?
What would happen if we injected a non radiative active gas instead of co2?
In both situations, it would depend on the temperature of the CO2 added to the system. Bringing enough heat energy into a system would raise temperatures. Bringing CO2 that is colder than ambient would tend to lower temperatures.
IOW, your “tests” are inconclusive and meaningless, just like the AGW hoax.
The test above implicitly includes rough balance