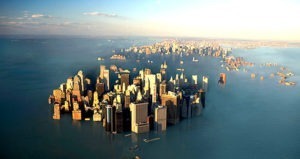
Study: Sea Level Rise Revised Downward

July 21st, 2017 by Roy W. Spencer, Ph. D.

If I had not looked past the headline of the press report on a new study, I would have just filed it under “It’s worse than we thought”. A new study in Nature reported on July 17 carried the following headlines:

“Satellite snafu masked true sea-level rise for decades”
“Revised tallies confirm that the rate of sea-level rise is accelerating as the Earth warms and ice sheets thaw.”

When I read that, I (like everyone else) assumed that corrections to the satellite sea level data since 1993 have now led to a revised trend toward faster (not slower) sea level rise. Right?

Wrong.

During the satellite era (since 1993), the trend in sea level rise was revised downward, by almost 10%, from 3.28 mm/year to about 3.0 mm/year. (For those concerned about Miami going underwater, these numbers equate to a little more than one inch every 10 years). This result was published back in April in Geophysical Research Letters, and the new Nature study looks at the wiggles in the revised data since 1993 and makes ominous pronouncements about sea level rise “acceleration”.

I’m calling “fake science news” on the Nature reporter who covered the story. The headline was technically correct…but misleading. (I can also make up technically correct headlines: “Scientists Agree: Sea Levels are Rising, We are All Going to Die”)

The researchers in April made a major adjustment to the first 1/4 of the satellite record, bringing those early sea levels up. This results in adding curvature to the upward trend (an acceleration) by flattening out the early part of the curve. This new signature of “acceleration” was what made the news in the new Nature study, even though the long term trend went down.

Should this New “Acceleration” be the News?

In a word, no.

Short-term undulations in the sea level rise curve should not be used as a predictive curve for the future. They are affected by a wide variety of natural phenomena. For example, ice loss from Greenland (which was large in 2011-12) has recently reversed itself with huge gains made in the last year. These events are governed by natural variations in weather patterns, which have always occurred.

For longer-term variations, yes, the rate of sea level rise during the entire period since 1993 probably is a little more than, say, during the period since 1900 (sea level rise was occurring naturally, anyway). But the inferred acceleration is small. And even that acceleration could be mostly natural — we simply don’t know.

My main point is that the Nature headline was misleading. They clearly had to find something in the study that supported the alarmist view of sea level rise, and they figured few people would read past the headline.

A face-value reading of the two main studies together results in the conclusion that sea level rise since 1993 has been revised downward. The most recent study then reads too much into the wiggles in the new data, and even implies the acceleration will continue with the statement, “The suggested acceleration… highlights the importance and urgency of mitigating climate change and formulating coastal adaptation plans to mitigate the impacts of ongoing sea level rise”.

The new study does NOT revise recent sea level rise upward, as is suggested by the Nature headline quoted above.


638 Responses to “Study: Sea Level Rise Revised Downward”

Toggle Trackbacks

  1. Thank God we have your objectiveness, who has some visibility in this climate war.

    • Allan Spector says:

      We urgently need more geoscientists who have the guts to go public about real science. The media have betrayed us terribly!

      • D K Smith says:

        As a professional geoscientist I can tell you that many of us are telling the truth, but few of us are listened to. I don’t have a PhD but I am actively employed in the geoscience’s. The work I do is directly affected by historical change in climate.
        When I tell people my thoughts I am often quoted the “97%” study, or told how biased I am.
        The problem today isn’t just the media, the problem today is that everyone is too smart to listen to more qualified people. I don’t diagnose cancer as I am not a doctor, but your average Latin major is qualified to lecture me on how climate works!

        • David Appell says:

          If you’re really a professional scientist, then you should know that the only forums that count are the peer reviewed literature, and (secondarily) conference proceedings, institutional seminars and colloquia.

          Have you made your case there?

          • AaronS says:

            Dave- I have. I did a phd documenting (in literature) examples of regional high frequency climate change using empirical data. Care to argue your published literature against mine? Most geologists in industry study high frequency sea level changes from the rock record. They know they are everywhere. IMHO Peer review in climate science is currently prone to bias and publishing some real junk along with some really good research. History is the only perspective that can show the presence of such bias objectively- so i will wait and see. However i wouldnt be writing this if I wasnt concerned. As I see it the majority of the field of climate science is relatively new and was built with the assumption the century scale abrupt climate change last century was man made. It was a good idea to consider the posibility and to continue to evaluate the situation given the potential severity of climate change on the ecosystem, but the process of creating a new field would be inherently prone to bias bc there is a clear link between the need for climate researchers and the presence of man made climate change. Not to mention the objectives of the UN and progressive political movements and their potential role in the science.

            Science dies hard… look at string theory post Higgs. As I understand it, the lack of new particles makes SUSY unlikely. Without SUSY there are not be fermions in String theory, so the theory no longer includes matter. So what is next? Its a similar situation to if the climate catastrophy goes away (and not saying it will). SL is empirical data. It is rising, that says a lot, but it can be measured and is very important to the field. The modelers have a lot of power. Their power has a lot of influence in the field.

            So do you think this Nature article accurately represents the data? If not, how do you David Appell explain this disconnection?

          • theo says:

            “…high frequency sea-level changes…”

            Been there, done the course. Only recommended if you enjoy doing three-dimensional jigsaw puzzles in your head.
            The sea comes in, the sea goes out. The sea comes in, the sea goes out……On and on and on. Gravel, sand, silt clay, silt…oh a turbidite…salt followed by wind erosion?…
            Oh, the whole Med dried up – Again! That is at least seventy times in this period.

          • AaronS says:

            Yea century, decadal, even annual climate records are possible using varves or tree rings. The 80 to 90 yr cycle can be seen all over the place. It often looks very similar to today, i think this is why geologist are more willing to accept this century of global warming might have a bigger natural component than many “modern climate” researchers. The problem is the records are sparse in space and time so its not possible to differentiate local and global events in most high frequency data. Obviously they have limitations.

          • David Appell says:

            Aaron: sure, there may have been short-term SLR in the past for specific reasons. So what?

          • David Appell says:

            AaronS says:
            “As I see it the majority of the field of climate science is relatively new and was built with the assumption the century scale abrupt climate change last century was man made.”

            Pure bullsh*t.

            Climate science is neither new (it’s about 200 years old) nor was there ever an “assumption” that warming was man-made. That conclusion is a consequence of the data.

          • AaronS says:

            David, You forgot to answer my question.

            Response to your comment #1.
            High frequency (abrupt) climate change and sea level is common and natural, thus it is plausible the abrupt climate change from 1900 to 2000 was dominantly natural. CO2 wothout feedbacks or with negative feedbacks is weak and would not warm climate significantly onward.

            Comment # 2.
            It is true the field of climate goes back in time. The debate about CO2 potentially influencing climate at all raged in the 50s and 60s… I have the papers. Climate models started in 80s became popular in 90s and built an entire field subsequently. Their hypothesis that CO2 must force climate might explain why 4 independent data sets have all been adjusted since 2014 to undo the hiatus (R.S.S. GT, Satellite sea level, GT thermometer, and sun spot number). Think about it if each is independent and had even a 50:50 chance of a mistake that led to a 15yr hiatus, then the probability that all 4 had it would be 6%. Very unlikely. And this is the most conservative stats you can do.

          • g*e*r*a*n says:

            Davie vomits: “That conclusion is a consequence of the data.”

            Davie, do you mean “data”, as in your favorite pseudoscience paper that says the Sun can heat the Earth to 800,000K?

            Those “data”?

          • David Appell says:

            I see you’re still choosing to lie.

            It’s no longer a surprise.

          • g*e*r*a*n says:

            Davie, all you have to do is produce the physics. Show how the Sun can heat the Earth to 800,000K. That’s all you have to do.

            But, you can’t.

            So you have to imply that I am “choosing to lie”.

            Just show the physics. Then we won’t have to call you a “pseudoscience pimp”.

          • David Appell says:

            You keep lying by not including the full quotation, which gives the context.

          • g*e*r*a*n says:

            Davie, you keep avoiding the issue. We both have the exact quote. You are in denial. Even if the Earth could not emit heat, the Sun could still not heat it to 800,000K.

            More denial, please.

          • David Appell says:

            In a single second, Earth absorbs 1.22e17 joules of energy from the Sun. Distributed uniformly over the mass of the planet, the absorbed energy would raise Earth’s temperature to nearly 800000 K after a billion years, if Earth had no way of getting rid of it.

            Pierrehumbert RT 2011: Infrared radiation and planetary temperature, Physics Today 64, 33-38.
            http://geosci.uchicago.edu/~rtp1/papers/PhysTodayRT2011.pdf

          • g*e*r*a*n says:

            Davie, you just keep quoting the paper. You haven’t provided the (nonexistent) physics to support the bogus claim.

            Once again, you are trapped in your pseudoscience.

          • donb says:

            Perhaps it is an accurate calculation but totally theoretical. Even IF the Earth could not radiate away energy it received by radiation, long before it reached 800,000 degrees the much higher velocity of its hot vapor would have reached escaped velocity, and the Earth would boil away. The solar wind is how some of the Sun boils away. SW has much higher temperature, but then the Sun has much greater gravity.

          • g*e*r*a*n says:

            donb, you’re right, but for the wrong reason.

            The Sun can NOT radiatively heat the Earth to a temperature hotter than it is radiating. The Sun radiates from the photosphere at about 5800K. So, it can NOT heat the Earth beyond about 5800K, even in the non-sensical scenario that the Earth could not lose heat.

            Davie does not understand thermodynamics and quantum physics.

          • David Appell says:

            Not only do you lie about that quote, but you can’t do freshman physics, either.

            Why am I not surprised…?

          • Svante says:

            G*e*r*a*n, we already resolved the 800000K issue here:
            http://www.drroyspencer.com/2017/07/uah-global-temperature-update-for-june-2017-0-21-deg-c/#comment-254544

            That second sentence is hypothetical, just continue and you will grasp the remaining six pages in no time.

          • Gordon Robertson says:

            DA….”the only forums that count are the peer reviewed literature….”

            Once again, peer review is not a requirement of the scientific method and peer review in climate science is stscked with biased climate alarmists.

          • Gordon Robertson says:

            DA…”Pierrehumbert….”

            May I suggest you stop reading Pierrehumbert. He’s a geoscientists whose basic understanding of physics is questionable. That’s why he is the authority on realclimate where science is not a priority.

          • David Appell says:

            Gordon Robertson says:
            “Once again, peer review is not a requirement of the scientific method and peer review in climate science is stscked with biased climate alarmists.”

            How would you know???

            Funny.

          • David Appell says:

            g*e*r*a*n says:
            “The Sun can NOT radiatively heat the Earth to a temperature hotter than it is radiating.”

            You’re still lying about the article.

            Note the “if”:

            In a single second, Earth absorbs 1.22e17 joules of energy from the Sun. Distributed uniformly over the mass of the planet, the absorbed energy would raise Earth’s temperature to nearly 800000 K after a billion years, if Earth had no way of getting rid of it.

            Pierrehumbert RT 2011: Infrared radiation and planetary temperature, Physics Today 64, 33-38.
            http://geosci.uchicago.edu/~rtp1/papers/PhysTodayRT2011.pdf

          • David Appell says:

            Gordon Robertson says:
            “May I suggest you stop reading Pierrehumbert. Hes a geoscientists whose basic understanding of physics is questionable.”

            Gordon who the f**k do you think you are?

            You’re a nobody, a nothing, a clown, a scientific assh*le. Time to start acting like it. Your boasts, without an iota to back them up, prove you are an idiot.

          • barry says:

            Their hypothesis that CO2 must force climate might explain why 4 independent data sets have all been adjusted since 2014 to undo the hiatus

            A professional would ask, “are the adjustments technically valid?” and investigate that instead of making claims based on some meta-narrative, ‘motives’ and personal incredulity.

            For example:

            Why is the global temp record of the 1980s different to today’s?

            One major reason is coverage. At that time there was only land-station data from Europe and the US – less than 8% of the globe. Not even the Northern Hemisphere was well covered. Just so happened that those two regions had extremely hot temps in the 30s. In other regions that hot blip doesn’t appear (SH), or not as pronounced, so as they got more coverage of the globe the ‘global’ record changed.

            You can look this stuff up and assess for yourself. That’s valid, professional enquiry. Complaints about the results without that diligence is not science. It’s politics.

        • g*e*r*a*n says:

          I’m being generous with the 5800K, as the Earth only receives a small portion of total solar flux. So the maximum temperature Earth could reach would be no more than 400K.

          Davie and Svante do not understand thermodynamics and quantum physics.

          • Svante says:

            So what did you think about the rest of the document, after the first two sentences?

          • gbaikie says:

            “So the maximum temperature Earth could reach would be no more than 400K.”

            If Earth “naturally” changed it’s orbit, otherwise it’s about
            350 K. And that assuming we talking about time period of millions of years.
            And if talking about millions of years, does anyone know how much Earth orbit could changed within such a time frame?

            Of course there also the potential of unnatural change in Earth’s orbit- which as already been changed slightly by the evil humans, and could be dramatically altered by humans within thousands of years- “accidentally” or “without even trying to do it”. [Or if humans actually wanted to change Earth’s orbit, that could be done within a century of time- for relatively insignificant cost [compared to the trillions of dollars for “climate change” stuff.]
            Or humans have launched a insignificant amount rockets into space, compared to what they could do in the future. And it’s altered Earth orbit a little bit [without trying to change Earth orbit]. So insignificant is about 50 launches per year- SpaceX did 16 in one year and it’s fraction of global launch- more than China and about Russia’s launch.
            But SpaceX owner, Elon Musk wants to go the Mars- wants to live on Mars in his lifetime. And working toward hundreds of launches per year for his company. And basically if he doing that all others will probably be launching more than that. Or Musk might want a monopoly but launch is far too important for anyone to allow this. So hundreds of bigger rockets then are being launched now [actually very big rockets. Anyhow, that still is only changing Earth orbit by a tiny bit, but talking about within 50 years- or unless these life extension ideas/hopes pan out, Musk will be dead within 50 years. And centuries of this kind stuff, will have measurable effect- like altering the “accuracy” of atomic clocks measuring a year. Anyway hundred of launches is still rather insignificant to the amount if could be.

          • Gordon Robertson says:

            g*r…”Davie and Svante do not understand thermodynamics and quantum physics”.

            If any alarmists, understood thermodynamics there would be no climate alarmists and no GHE or AGW theories.

          • David Appell says:

            Gordon Robertson says:
            “If any alarmists, understood thermodynamics there would be no climate alarmists and no GHE or AGW theories.”

            Let’s see your science, Gordon, while canning the insults.

        • Svante says:

          Gordon Robertson says: “May I suggest you stop reading Pierrehumbert. Hes a geoscientists whose basic understanding of physics is questionable.”
          D K Smith says: the problem today is that everyone is too smart to listen to more qualified people.
          g*e*r*a*n says pseudo-science.

          Raymond T. Pierrehumbert, University of Oxford, Atmospheric, Oceanic and Planetary Physics.
          https://users.physics.ox.ac.uk/∼pierrehumbert

          Research Interests: Physics of climate, especially regarding the long term evolution of the climates of solar system and extrasolar planets. Water vapor and global change. Baroclinic instability. Hamiltonian chaos and fluid mixing.

          Education
          – Massachusetts Institute of Technology,Cambridge, MA Ph.D. March, 1980 (Dept. of Aeronautics and Astronautics)
          – University of Cambridge Cambridge, England, Knox Fellow, 1976-1977 (Dept. of Applied Mathematics and Theoretical Physics)
          – Harvard College, Cambridge, MA A.B. Magna cum Laude in Physics June, 1975
          – Halley Professor of Physics University of Oxford, 2015-present

          • Svante says:

            Positions And Fellowships
            – Professorial Fellow Jesus College, Oxford, 2015-present
            – Kung Karl XVI Gustaf Professorship (visiting), Stockholm 2014-2015
            – Louis Block Professor University of Chicago, 2005-2015
            – Professor in Geophysical Sciences University of Chicago, 1989-2015
            – Directeur de Recherche Ecole Polytechnique, France (2003-2004,visiting position)
            – John Simon Guggenheim Fellow Laboratoire de Meteorologie Dynamique, Ecole Normale Superieur, Paris. 1996/1997 (sabbatical visit)
            – Professor of Geology and Geophysics Princeton University 1988-1989
            – Guest InvestigatorStockholms Universitet, Meteorologiska Institutionen 1987/1988 (sabbatical visit)
            – Research Scientist Geophysical Fluid Dynamics Laboratory/NOAA. 1982-1988.
            – Concurrent appointments at Princeton University: Visiting Lecturer with Rank of Associate Professor (Atmospheric & Oceanic Sciences Program), Affiliated Faculty Member, Applied & Computational Mathematics Program.
            – Assistant Professor of Meteorology Massachusetts Institute of Technology, 1980-1982

          • Svante says:

            Awards
            – John Simon Guggenheim Fellow
            – Fellow, American Geophysical Union
            – Chevalier de lOrdre des Palmes Academiques
            – Kung Karl XVI Gustaf Professorship (visiting), Stockholm 2014-2015
            – Fellow, American Academy of Arts and Sciences
            – PhD. honoris causa, Stockholms University

          • Svante says:

            Publications
            Recent Open access versions of most papers are available at
            https://users.physics.ox.ac.uk/~pierrehumbert/papers/publist.html
            Allen, M., Fuglestvedt, J., Shine, K., Reisinger, A., Pierrehumbert, R. & Forster, P. (2016), New use of global warming potentials to compare cumulative and short-lived climate pollutants, Nature Climate Change 6, 773776.
            Clark, P., Shakun, J., Marcott, S., Mix, A., Eby, M., Kulp, S., Levermann, A., Milne,G., Pfister, P., Santer, B., Schrag, D., Solomon, S., Stocker, T., Strauss, B., Weaver, A., Winkelmann, R., Archer, D., Bard, E., Goldner, A., Lambeck, K., Pierrehumbert, R. & Plattner, G.-K. (2016), Consequences of twenty-first-century policy for multi-millennial climate and sea-level change, Nature Climate Change 6 pp. 360369. Ding, F. & Pierrehumbert, R. (2016), Convection in condensible-rich atmospheres, Astrophysical Journal, 822.
            Malone, A., Pierrehumbert, R., Lowell, T., Kelly, M. & Stroup, J. (2015), Constraints on southern hemisphere tropical climate change during the little ice age and younger dryas based on glacier modeling of the quelccaya ice cap, peru, Quaternary Science Reviews 125, 106116.
            Pierrehumbert RT 2016: How to decarbonize? Look to Sweden, Bulletin of the Atomic Scientists 72(2), 105-111.
            Pierrehumbert RT and Eshel G 2015: Climate impact of beef: an analysis considering multiple time scales and production methods without use of global warming potentials, Environmental Research Letters 10 (8), 085002.
            McNutt, M. K., Abdalati, W., Caldeira, K., Doney, S. C., Falkowski, P. G., Fetter, S., Fleming, J. R., Hamburg, S. P., Morgan, M. G., Penner, J. E., Pierrehumbert, R. T., Rasch, P. J., Russell, L. M., Snow, J. T., Titley, D. W. & Wilcox, J. (2015a), Climate Intervention Carbon Dioxide Removal and Reliable Sequestration, National Academies Press.
            McNutt, M. K., Abdalati, W., Caldeira, K., Doney, S. C., Falkowski, P. G., Fetter, S., Fleming, J. R., Hamburg, S. P., Morgan, M. G., Penner, J. E., Pierrehumbert, R. T., Rasch, P. J., Russell, L. M., Snow, J. T., Titley, D. W. & Wilcox, J. (2015b), Climate Intervention: Reflecting Sunlight to Cool Earth, National Academies Press.
            Wordsworth, R., Kerber, L., Pierrehumbert, R., Forget, F. & Head, J. (2015), Comparison of warm and wet and cold and icy scenarios for early mars in a 3-d climate model, Journal of Geophysical Research E: Planets 120, 12011219.
            Bloch-Johnson J , Pierrehumbert RT and Abbot DS 2015: Feedback temperature dependence determines the risk of high warming, Geophys. Research Lett. 42(12), 4973-4980.
            Wordsworth R and Pierrehumbert RT 2014: Abiotic Oxygen-dominated Atmospheres on Terrestrial Habitable Zone Planets.Ap. J. Lett., 785 785 L20. doi:10.1088/2041-8205/785/2/L20
            Glotter M, Pierrehumbert RT, Elliott J and Moyer, EJ 2014: A Simple Carbon Cycle Representation for Economic and Policy Analyses. Climatic Change, 126, 319-335.
            Pierrehumbert RT 2014: Short Lived Climate Pollution. Annual Reviews of Earth and Planetary Sciences 42, doi:10.1146/annurev-earth-060313-054843
            Pierrehumbert RT 2013: Hot Climates, High Sensitivity. Proc. Nat. Acad. Sci., 110,14118-14119, doi:10.1073/pnas.1313417110
            Wordsworth R and Pierrehumbert RT 2013: Water loss from terrestrial planets with CO2-rich atmospheres. Astrophysical J., 778 doi:10.1088/0004-637X/778/2/154
            Abbot DS, Voigt A, Li D, Le Hir G, Pierrehumbert RT et al 2013: Robust elements of Snowball Earth atmospheric 2 circulation and oases for life. J. Geophys. Res. Atmospheres, 118(12),6017-6027, doi:10.1002/jgrd.50540
            Shields A, Meadows VS, Bitz C, Pierrehumbert RT et al 2013: The Effect of Host Star Spectral Energy Distribution and Ice-Albedo Feedback on the Climate of Extrasolar Planets. Astrobiology, 13(8), 715-739, doi:10.1089/ast.2012.0961
            Pierrehumbert RT 2013: Strange news from other stars. Nature Geoscience 6, 81-83. doi:10.1038/ngeo1711
            Wordsworth R and Pierrehumbert RT 2013: Hydrogen-nitrogen greenhouse warming in Earths early atmosphere. Science, 339, 64-67. doi:10.1126/science.1225759
            Pierrehumbert RT 2012: Cumulative Carbon and Just Allocation of the Global Carbon Commons. Chicago Journal of International Law, 13.2 pp 527-548 .
            Pierrehumbert RT 2012: Computation in Python for the Mathematical and Physical Sciences. Princeton University Press (under contract).
            Abbot DS, Voigt A, Branson M, Pierrehumbert RT et al 2012: Clouds and Snowball Earth deglaciation. Geophys. Res. Lett., 39, doi:10.1029/2012GL052861
            Solomon S, Pierrehumbert RT, Matthews D Daniel JS and Friedlingstein P 2012: Atmospheric composition, irreversible climate change, and mitigation policy. in Climate Science for Serving Society: Research, Modelling and Prediction Priorities, Hurrell, J. and Asrar, G., eds., Springer.
            Matthews HD, Solomon S and Pierrehumbert RT 2012: Cumulative carbon as a policy framework for achieving climate stabilization. Phil. Trans. Roy. Soc. A, 1974,4365-4379, doi:10.1098/rsta.2012.0064
            Li D., and R. T. Pierrehumbert 2011: Sea glacier flow and dust transport on Snowball Earth, Geophys. Res. Lett., 38, L17501, doi:10.1029/2011GL048991.
            Pierrehumbert RT and Gaidos E. 2011: Hydrogen greenhouse planets beyond the habitable zone. Ap. J. Lett. 734 doi:10.1088/2041-8205/734/1/L13.
            Pierrehumbert RT 2011: A palette of climates for Gliese 581g. Ap. J. Lett., 726 doi: 10.1088/2041-8205/726/1/L8.
            Pierrehumbert RT 2011: Infrared radiation and planetary temperature. Physics Today 64, 33-38.
            Pierrehumbert RT, Abbot DS, Voight A and Koll D 2011: Neoproterozoic Climate. Annual Reviews of Earth and Planetary Sciences 39:417-60, doi:10.1146/annurev-earth-040809-152447.
            Abbot DS, Silber M, and Pierrehumbert RT 2011: Cloud Feedbacks and Arctic Sea Ice Tipping Points. J. Geophys. Res.- Atmospheres 116, D19120, doi:10.1029/2011JD015653 .
            Abbot DS and Pierrehumbert RT 2010: Mudball: Surface dust and Snowball Earth deglaciation, J. Geophys. Res.-Atmospheres 115, doi: 10.1029/2009JD01200
            Pierrehumbert RT 2010: Principles of Planetary Climate. Cambridge University Press,
            652pp.
            Archer DA and Pierrehumbert RT 2010: The Warming Papers. Wiley/Blackwell.
            Solomon S, Battisti D, Doney S, Hayhoe K, Held I, Lettenmaier D, Lobell D, Matthews D, Pierrehumbert RT, Raphael M, Richels R, Root T, Steffen K, Tebaldi C and Yohe G 2010: Climate Stabilization Targets: Emissions, Concentrations and Impacts over Decades to Millennia. National Academy Press:Washington 190pp.
            Williams IN, Pierrehumbert RT and Huber M 2009: Global warming, convective threshold and false thermostats. Geophys. Res. Lett. 36. doi:10.1029/2009GL03984
            Abbot DS, Eisenman I and Pierrehumbert RT 2010: Sea Ice Resolution and the Snowball Diurnal Cycle. J. Climate 23, 6100-6109.
            Lee J.-E.,Pierrehumbert RT, Swann A, and Lintner BR 2009: Sensitivity of stable water isotopic values to convective parameterization schemes. Geophys. Res. Lett. 36 L23801. doi:10.1029/2009GL040880.
            Mitchell JL, Pierrehumbert RT, Frierson DMW and Caballero R 2009: The impact of methane thermodynamics on seasonal convection and circulation in a model Titan atmosphere. Icarus 203, 250-264. doi:10.1016/j.icarus.2009.03.043
            Halevy I, Pierrehumbert RT, Schrag DP 2009: Radiative transfer in CO2-rich paleoatmospheres J. Geophys. Res.-Atmospheres 114 D18112. doi:10.1029/2009JD011915.
            Le Hir G, Donnadieu Y, Godderis Y, Pierrehumbert RT, Macouin M, Halverson G, Nedelec A, and Ramstein G 2008: The Snowball Earth aftermath: exploring the limits of continental weathering processes. Earth Plan Sci Lett doi:10.1016/j.epsl.2008.11.010.
            Caballero R, Mitchell J and Pierrehumbert RT 2008: Axisymmetric, nearly inviscid circulations in non-condensing radiative-convective atmospheres. Quart J Roy Meterol Soc 134,1269-1285.
            Godderis Y, Donnadieu Y, de Vargas C, Pierrehumbert RT, Dromart G 2008: Causal or casual link between the rise of nannoplankton calcification and a tectonically-driven massive decrease in Late Triassic atmospheric CO2 ? Earth Plan Sci Lett 267,247-255.
            Le Hir G, Ramstein G, Donnadieu Y and Pierrehumbert RT 2007: Investigating plausible mechanisms to escape a hard Snowball-Earth. Comptes rendus Geoscience 339 (3-4), 274- 287
            Brogniez H and Pierrehumbert RT 2007: Intercomparison of the tropical tropospheric humidity in GCMs with AMSU-B water vapor data. Geophysical Research Letters 34, L17812, doi:10.1029/2006GL029118
            Pierrehumbert RT, Brogniez H, and Roca R 2007: On the relative humidity of the atmosphere. in The Global Circulation of the Atmosphere, T Schneider and A Sobel, eds. Princeton University Press 400pp.
            Brogniez H and Pierrehumbert RT 2006: Using microwave observations to assess large-scale control of free tropospheric water vapor in the mid-latitudes. Geophysical Research Letters doi:10.1029/2006GL026240
            Donnadieu Y, Godderis Y, Pierrehumbert R, Dromart G, Fluteau F and Jacob R 2006: A GEOCLIM simulation of climatic and biogeochemical consequences of Pangea breakup. Geochemistry Geophysics Geosystems 7: Art. No. Q11019
            Mitchell J, Pierrehumbert RT, Frierson D and Caballero R 2006: The dynamics behind Titans tropospheric methane clouds. Proc. Nat. Acad. Sci. 103 (49),18421-18426.
            Pierrehumbert RT 2006: Climate change: A catastrophe in slow-motion. Chicago Journal of International Law 6, 573-596.
            Donnadieu Y, Pierrehumbert R, Jacob R and Fluteau F 2006: Modelling the primary control of paleogeography on Cretaceous climate. Earth Plan Sci Lett 248, 426-437.

          • Svante says:

            Earlier
            Pierrehumbert RT 2005: Climate dynamics of a hard snowball Earth. J. Geophys Res publications Atmospheres, Vol.110,No.D1, D01111 doi:10.1029/2004JD005162.
            Pierrehumbert 2004a: Warming the world. Nature 432 677.
            Pierrehumbert 2004b: Translation of Memoire sur les Temperatures du Globe Terrestre et des Espaces Planetaires by J-B J. Fourier. Nature 432 (online supplementary material to Pierrehumbert, 2004a)
            Pierrehumbert RT 2004: High levels of atmospheric carbon dioxide necessary for the termination of global glaciation Nature 429, 646-649. doi:10.1038/nature02640
            Goodman JC, Collins GC, Marshall J and Pierrehumbert RT 2004: Hydrothermal Plume Dynamics on Europa: Implications for Chaos Formation. J. Geophys. Res. 109(E3),E03008, doi:10.1029/2003JE002073.
            Goodman, JC and Pierrehumbert RT 2003: Glacial flow of floating marine ice in Snowball Earth. J. Geophys. Res. 108 (C10),3308,doi:10.1029/2002JC001471.
            Alley RB, Marotzke J, Nordhaus WD, Overpeck JT,Peteet DM,Pielke RA Jr., Pierrehumbert RT, Rhines PB, Stocker TF,L. Talley LD,Wallace JM 2003: Abrupt Climate Change. Science 299, 2005-2010.
            Pierrehumbert RT 2003: Counting the Cost (Review of Risk and Reason by C. Sunstein). Nature 422 263.
            Sukhatme J and Pierrehumbert RT 2002: Decay of passive scalars under the action of single scale smooth velocity fields in bounded two-dimensional domains: From non-self-similar probability distribution functions to self-similar eigenmodes. Phys. Rev. E 66, art. no. 056302.
            Sukhatme J and Pierrehumbert RT 2002: Surface quasigeostrophic dynamics: The study of an active scalar. Chaos 12, 439-450.
            Pierrehumbert RT 2002: The Hydrologic Cycle in Deep Time Climate Problems. Nature 419,191-198.
            Alley RB, Marotzke J, Nordhaus W, Overpeck J, Peteet D, Pielke R, Pierrehumbert RT, Rhines P, Stocker T, Talley L and Wallace JM 2002: Abrupt Climate Change: Inevitable Surprises National Academy Press,244pp.
            Stocker TF,Clarke GKC,Le Treut H, Lindzen RS, Meleshko VP, Mugara RK, Palmer TN, Pierrehumbert RT, Sellers PJ, Trenberth KE, and Willebrand J 2001: Physical Climate Processes and Feedbacks, Ch. 7 in The Physics of Climate Change: IPCC WG1 Third Assessment Report, Cambridge University Press.
            Rowley DB, Pierrehumbert RT and Currie BS 2001: A new approach to stable isotope-based paleoaltimetry: implications for paleoaltimetry and paleohypsometry of the High Himalaya since the Late Miocene. Earth and Planetary Science Letters 188 ,253-268.
            Poulsen CJ, Pierrehumbert RT, and Jacob RL 2001: Impact of ocean dynamics on the simulation of the Neoproterozoic Snowball Earth; Geophysical Research Letters , 28 ,1575- 1578.
            Hu Y and Pierrehumbert RT 2001: The Advection-Diffusion Problem for Stratospheric Flow: Part II. Probability distribution function of tracer gradients. J. Atmos. Sci. 59, 2830-2845.
            Hu Y and Pierrehumbert RT 2001: The Advection-Diffusion Problem for Stratospheric Flow: Part I. Concentration probability distribution function. J. Atmos. Sci. 58 ,1493-1510.
            Ngan K and Pierrehumbert RT 2000: Spatially inhomogeneous and intermittent random advection. Phys. Fluids 12 , 822-834.
            Pierrehumbert RT 2000: Climate change and the Tropical Pacific: The Sleeping Dragon Wakes. Proc. Nat. Acad. Sci. 97, 1355-1358.
            Pierrehumbert RT 2000: Lattice models of advection-diffusion Chaos 10 , 61-74.
            Pierrehumbert RT 1999: Huascaran δ 18O as an indicator of tropical climate during the Last
            Glacial Maximum. Geophysical Research Letters , 26 , 1341-1344.
            Pierrehumbert RT 1999: Subtropical water vapor as a mediator of rapid global climate change. . in Clark PU, Webb RS and Keigwin LD eds. Mechanisms of global change at millennial time scales . American Geophysical Union:Washington, D.C. Geophysical Monograph Series 112 , 394 pp.
            Boatto S and Pierrehumbert RT 1999: Dynamics of a passive tracer in a velocity field of four identical point vortices. J. Fluid Mech 394 , 137-174.
            Pierrehumbert RT and Roca R 1998: Evidence for control of Atlantic subtropical humidity by large scale advection. Geophysical Research Letters 25, 4537-4540.
            Pierrehumbert RT 1998: Lateral mixing as a source of subtropical water vapor. Geophysical Research Letters 25 , 151-154.
            Forget, F and Pierrehumbert RT 1997: Warming Early Mars with carbon dioxide clouds that scatter infrared radiation. Science 278 , 1273 – 1276.
            Pierrehumbert, RT and Erlick C 1997: On the scattering greenhouse effect of CO2 ice clouds. J. Atmos. Sci 55, 1897-1903.
            Pierrehumbert, RT 1996: Anomalous scaling of high cloud variability in the tropical Pacific. Geophysical Research Letters 23 , 1095-1098.
            Swanson K and Pierrehumbert RT 1997: Lower-tropospheric heat transport in the Pacific storm track. J. Atmos. Sci 54 , 1533 – 1543 .
            Emanuel, K and Pierrehumbert, RT 1996: Microphysical and dynamical control of tropospheric water vapor. in Clouds, Chemistry and Climate, Nato ASI Series 35. Springer:Berlin, 260pp.
            Pierrehumbert, RT 1996: Some remarks on mechanisms for the regulation of tropical sea surface temperature. in Clouds, Chemistry and Climate, Nato ASI Series 35. Springer:Berlin, 260pp.
            Held, I. M. , Pierrehumbert, R. T. , Garner, S.T. and Swanson, K.L. 1995: Surface quasigeostrophic dynamics. J. Fluid Mech 282 , 1-20.
            Vainshtein, S. I Sreenivasan, K.R., Pierrehumbert, R. T. , Kashyap, V., and Juneja, A. 1994: Scaling exponents for turbulence and other random processes and their relationships with multifractal structure. Phys. Rev . E50, 1823-1835.
            Swanson, K. and Pierrehumbert, R. T. 1995: Potential Vorticity Homogenization and Stationary Waves. J. Atmos. Sci 52 , 990 – 994.
            Pierrehumbert, R. T. 1995: Thermostats, Radiator Fins, and the Local Runaway Greenhouse. J. Atmos. Sci. 52 , 1784-1806.
            Pierrehumbert, R.T. and K.L Swanson 1995: Baroclinic Instability Ann. Rev. Fluid Mech . 27 , 419-467.
            Yang, H. and Pierrehumbert, R. T. 1994: Production of dry air by isentropic mixing. J. Atmos. Sci . 51 , 3437-3454.
            Pierrehumbert, R. T., Held, I.M. and Swanson, K. 1994: Spectra of local and nonlocal two dimensional turbulence. Chaos, Solitons and Fractals , 4 , 1111-1116.
            Pierrehumbert, R. T. 1994: On tracer microstructure in the large-eddy dominated regime. Chaos, Solitons and Fractals , 4 , 1091-1110.
            Swanson, K. and Pierrehumbert, R. T. 1994: Nonlinear wave packet evolution on a baroclinically unstable jet. J. Atmos. Sci 51 , 384 – 396.
            Pierrehumbert, R. T. and Yang, H. 1993: Global chaotic mixing on isentropic surfaces. J. Atmos. Sci 50 , 2462-2480.
            Lin, S-J. and Pierrehumbert, RT 1992: Is the mid-latitude zonal flow absolutely unstable? J. Atmos. Sci 50 , 505 – 517.
            Lamb, K. and Pierrehumbert, RT 1992: Steady state nonlinear internal gravity wave critical levels satisfying an upper radiation boundary condition. J. Fluid Mech. 238 , 371-404.
            Pierrehumbert, R. T. 1992: Spectra of tracer distributions: A geometric approach. in Nonlinear phenomena in atmospheric and oceanic sciences , R. Pierrehumbert and G. Carnevale, eds. Springer-Verlag:New York 229pp.
            Pierrehumbert, R. T. 1991: Chaotic mixing of tracers and vorticity by modulated travelling Rossby waves. Geophys. Astrophys. Fluid. Dyn . 58 , 285-320.
            Pierrehumbert, R. T. 1991: Large scale horizontal mixing in planetary atmospheres. Phys. Fluids A , 3 ,1250-1260.
            Pierrehumbert, R. T. 1991: Dimensions of Atmospheric Variability. in Beyond Belief:Randomness, Prediction and Explanation in Science. J. L. Casti and A. Karlqvist, eds. CRC Press:Boston, 110-142.
            Carissimo, B.C., Pierrehumbert, RT, and H.L. Pham 1988: An estimate of mountain drag during ALPEX for comparison with numerical models. J. Atmos. Sci 45 , 1949-1960.
            Bacmeister, J. T. and Pierrehumbert, RT 1988: On high drag states of nonlinear stratified flow over obstacles. J. Atmos. Sci 45 , 63 – 80.
            Pierrehumbert, RT 1987: An essay on the parameterization of orographic gravity wave drag. in Observation, theory and modelling of orographic effects . European Center for Medium Range Weather Forecasting: Reading, England 1987.
            Lin, S-J and Pierrehumbert, RT 1988: Does Ekman friction suppress baroclinic instability? J. Atmos. Sci 45 , 2920-2933.
            Panetta, R.L., I. Held and Pierrehumbert, RT 1988: External Rossby waves in the 2-layer model. J. Atmos. Sci 44 , 2924-2933.
            Lin, S-J and Pierrehumbert, RT 1987: Absolute and convective instability of stratified shear flow. in Proceedings of the 4th international symposium on stratified flow , Caltech 1987. Elsevier
            Pierrehumbert, RT and J. Bacmeister 1987: On the realizability of Longs Model solutions for nonlinear stratified flow over obstacles. in Proceedings of the 4th international symposium on stratified flow , Caltech 1987 . Elsevier.
            Lin, S-J and Pierrehumbert, RT 1987: Comment on Richardson criteria for stratified vortex motions under gravity; Phys. Fluids 30 1231-1232.
            Pierrehumbert, RT 1986: A universal shortwave instability of two-dimensional eddies in an inviscid fluid. Phys Rev Letters 57 , 2157-2159.
            Pierrehumbert, RT 1986: Spatially amplifying modes of the Charney baroclinic instability problem. J. Fluid Mech ., 170 , 293-317.
            Pierrehumbert, RT 1986: Remarks on a paper by Aref and Flinchem. J. Fluid Mech. , 163 ,21-26.
            Held, I., Pierrehumbert, RT, and R. L. Panetta 1986: Dissipative destabilization of external Rossby waves. J. Atmos. Sci. , 43 ,388-396.
            Pierrehumbert, RT 1986: Lee cyclogenesis. Chapter 13 of Mesoscale Meteorology and Forecasting , P. Ray ed. American Meteorological Society: Boston.
            Pierrehumbert, RT 1985: The effect of local baroclinic instability on zonal inhomogeneities of vorticity and temperature. Adv. Geophysics , 29 , 165-182.
            Pierrehumbert, RT 1985: A theoretical model of orographically modified cyclogenesis. J. Atmos. Sci. , 42 , 1244-1258.
            Held, I., R. L. Panetta and Pierrehumbert, RT 1985: Stationary external Rossby waves in vertical shear. J. Atmos. Sci. , 42 , 865-883.
            Pierrehumbert RT, and B. Wyman 1985: Upstream effects of mesoscale mountains. J. Atmos. Sci. , 42 ,977-1003.
            Pierrehumbert RT 1985: Stratified semigeostrophic flow over two dimensional topography in an unbounded atmosphere. J. Atmos. Sci. , 42 , 523-526.
            Pierrehumbert RT 1985: Orographic distortion of fronts. Revista di Meteorologia Aeronautica, Anno 44 , 1234.
            Pierrehumbert RT 1985: Formation of shear layers upstream of the Alps. Revista di Meteorologia Aeronautica , Anno 44 , 1234.
            Pierrehumbert RT 1984: Local and global baroclinic instability of a zonally varying flow. J. Atmos. Sci. 41 , 2141-2162.
            Pierrehumbert RT 1984: Linear results on the barrier effects of mesoscale mountains. J. Atmos. Sci. 41 , 1356-1367.
            Pierrehumbert RT , and P. Malguzzi 1984: Forced coherent structures and local multiple equilibria in a barotropic atmosphere. J. Atmos. Sci. 41 , 246-257.
            Pierrehumbert RT 1983: Bounds on the growth of perturbations to non-parallel steady flow on the barotropic beta plane. J. Atmos. Sci. 40 , 1207-1217.
            Reinhold, B. B. and Pierrehumbert RT 1982: Dynamics of weather regimes: Quasi-stationary waves and blocking. Mon. Wea. Rev. 110 , 1105-1145.
            Pierrehumbert RT , and S. E. Widnall 1982: The two and three dimensional instabilities of a spatially periodic free shear layer. J. Fluid Mech. 114 , 59-82.
            Pierrehumbert RT , and S. E. Widnall 1981: The structure of organized vortices in a free shear layer. J. Fluid Mech. 102 , 301-313.
            Pierrehumbert RT 1980: The Structure and Stability of Large Vortices in an Inviscid Flow. Ph.D. Thesis, Massachusetts Institute of Technology.
            Pierrehumbert, R. T. 1980: A family of steady, translating vortex pairs with distributed vorticity. J. Fluid Mech. 99 , 129-144.

          • Svante says:

            PhD Students:
            – B. Reinhold (PhD, MIT 1981) Dynamics of Weather Regimes: Quasi-Stationary Waves & Blocking
            – D. Dritschel (PhD, Princeton 1984) The Stability of Certain two dimensional and three dimensional Vortical Motions
            – J. Bacmeister (Princeton GFD program, PhD 1987) Nonlinearity in Transient two dimensional flow over topography.
            – B. Carissimo (Princeton GFD program, PhD Aug. 1987) Observation and modelling of drag during transient airflow over mountains
            – F. Parham (Princeton Appl. Math. PhD. June 1988) Rossby wave critical levels in a baroclinic atmosphere.
            – S. Lin (Princeton GFD program, PhD. July 1988) The instability mechanism of synoptic scale eddies
            – K. Lamb (Princeton Appl. Math, PhD. July 1988) Nonlinear gravity wave critical levels
            – M. Dahleh (Princeton Appl. Math 1989) Subject: Discrete vortex methods on the beta plane
            – J. Anderson (Princeton GFD program 1989, jointly advised with Isaac Held) Subject:Numerical methods for large non Hermitian eigenvalue problems
            – Kyle Swanson (U. of C. Geophysical Sciences, Ph.D 1995) Subject: Storm tracks and low frequency variability
            – Stefanella Boatto (U. of C. Physics, Ph.D 1995) Subject: Chaotic mixing by aperiodic flows.
            – Yongyun Hu (U. of C. Geophysical Sciences PhD 2001) Subject: Atmospheric stirring and mixing.
            – Hui Zhang (U. of C. Geophysical Sciences PhD 2002) Tropical upper tropospheric water vapor distribution.
            – Jai Sukhatme (U. of C. Geophysical Sciences PhD 2003) Subject: Multifractal and stochastic models in geophysics
            – Jude Sabado (U.of C.Geophysical Sciences PhD 2006) Subject: Baroclinic instability on Early Mars
            – Jonathan Mitchell (U. of C. Astrophysics PhD 2007) Subject: Climate Dynamics of Titan
            – Ian N. Williams (U. of C. Geophysical Sciences PhD 2011) Subject: Tropical convection and Climate Sensitivity
            – Dawei Li (U. of C. Geophysical Sciences PhD, in progress) Subject: Sea glaciers and neoproterozoic climate
            – Feng Ding (U. of C. Geophysical Sciences PhD, in progress) Subject: GCM modeling of exoplanet climates
            – Andrew Malone (co-supervised) (U. of C. Geophysical Sciences PhD, in progress) Subject: Mountain glaciers as climate proxies
            – Jonah Bloch-Johnson (co-supervised) (U. of C. Geophysical Sciences PhD, in progress) Subject: Bifurcations and climate sensitivity

          • Svante says:

            Recent Postdocs
            – Keith Ngan
            – Huijun Yang
            – Chris Poulsen
            – Gilles DeLaygue
            – Jason Goodman
            – Rodrigo Caballero
            – Johnny Lin
            – Christian Dieterich
            – Yannick Donnadieu
            – Helene Brogniez
            – Dargan Frierson
            – David McInerney
            – Dorian Abbot
            – Jung-Eun Lee
            – Robin Wordsworth

          • Svante says:

            Selected invited lectures
            – Haldane Lecture, Wolfson College, University of Oxford (2017)
            – Lobanov-Rostovsky Lecture, University of Oxford (2016)
            – Distinguished Planetary Science Lecturer, Bern University (2014)
            – Tyndall Lecture, American Geophysical Fall Meeting (2012)
            – Distinguished Atmospheric Science Lecturer, Beijing University (2012)
            – Invited lecturer, Swedish Royal Academy Bolin Symposium (2012)
            – University Lecturer, Cornell University (2012)
            – Niels Bohr Lecture, Copenhagen University (2011)
            – Fairchild Lecture, University of Rochester (2010)
            – Noble Lecturer, University of Toronto (Toronto, 2010)
            – Invited lecturer, Vatican study group on astrobiology (Rome, 2009)
            – Halley Lecture (Oxford University, 2009)
            – Kibbe lecture (Bowdoin College, 2008)
            – Berkeley Distinguished Atmospheric Science Lecture (Berkeley, 2008)
            – Aggasiz Lectures (Harvard, 2008)
            – Thompson Lectures (National Center for Atmospheric Research, 2008)
            – Low Order Models Invited lecture at The Lorenz Symposium (MIT, Dec. 1987)

          • Svante says:

            Selected Professional Activities
            – Scientific Advisory Board, Bolin Center for Climate Research, Stockholm
            – Science and Security Board, Bulletin of the Atomic Scientists
            – Editorial board, Annual Reviews of Earth and Planetary Science.
            – Co-organizer Exoclimes 2012, Aspen, CO, Exoclimes 2014, Davos, CH and Exoclimes 2016, Vancouver, BC.
            – Co-author National Research Council Report on Climate Intervention
            – Co-author National Research Council Report on Climate Stabilization Targets
            – Member, National Research Council Board on Atmospheric Science and Climate, 2009-2014
            – Member, City of Chicago Mayors Task Force on Climate Change, 2007-2008
            – Co-organizer, 2008 Kavli Institute of Theoretical Physics Program on Physics of Climate.
            – Lead Author, Intergovernmental Panel on Climate Change (IPCC) Third Assessment Report (1997-2001)
            – Member, National Research Council Panel on Abrupt Climate Change and its Societal Impacts (2000-2001).
            – Editor, Journal of the Atmospheric Sciences (1988-1991)

          • David Appell says:

            Svante: Thanks, but a simple reply laughing in Gordon’s face would have sufficed, him thinking he can judge R. Pierrehumbert and his science.

            Gordon is laughably idiotic.

          • Svante says:

            Gordon and g*e*r*a*n know better than Pierrehumbert so we must assume they will produce their superior credentials any day now.

    • AlecM says:

      Yup: it’s an objective analysis.

  2. Curious George says:

    The difference between 3.28 mm/year and 3.0 mm/year is 0.28 mm/year, or 28 mm (1 inch+) in 100 years.

  3. Headline: the sea levels are going to rise, we are all going to die! Let’s break this childish claim down shall we?

    1. The sea levels are going to rise. Yes The sea levels have been rising and will continue to rise at about an inch per century! What a huge life threatening sea level rise!

    2. We are all going to die: oh no! We are all going to die eventually no matter what! We are not meant to live forever! People die! its a natural part of life! Deal with it! Another foolish claim made by foolish scientists!

    Thank you dr spencer for pointing out this silly sea level rise claim!

    • Absolutely ridiculous! They have been wrong peddling this nonsense for more then century now! How can people trust these morons!

    • David Appell says:

      Climatechange4realz says:
      “Yes The sea levels have been rising and will continue to rise at about an inch per century!”

      Before the industrial era, sea level rise was about 1 meter in 5000 years — an average of 0.2 mm/yr. Now it’s 15 times faster. Why?

      https://en.wikipedia.org/wiki/Sea_level_rise#/media/File:Post-Glacial_Sea_Level.png

      • Ha! Seriously Davie old pal? Your stupidity has gotten so bad now that it is enabling you to see and read charts properly! You are flat out stupid david. The line has flattened out over the recent thousands of years in sea level rise! Your stupidity on the other hand has continued to rise dramatically. I think someone is putting too much greenhouse gases in your brain that is keeping the stupidity from escaping.

        • Btw that website you are using is totally professional and supported by most scientistific originizations such as the iPCC aka idiots predicting climate change. Keep using it pal! It is the best source on the web!

          **eye roll**

          • Svante says:

            I agree, it is a great source because of its references, so it is easily checked.

            It says:

            These methods in combination suggest a mean eustatic component of 0.07 mm/yr for the last 2000 years.[12]

            Recently, it has become widely accepted that late Holocene, 3,000 calendar years ago to present, sea level was nearly stable prior to an acceleration of rate of rise that is variously dated between 1850 and 1900 AD.

  4. g*e*r*a*n says:

    SLR is just more alarmist pseudoscience. The Warmists are 100% certain that the ONLY thing that causes sea levels to rise is AGW! In their “minds”, SLR is caused by “heat” only–melting glaciers, melting land ice, and thermal expansion of the oceans.

    Oh yeah, there are also some that believe melting sea ice causes SLR.

  5. There are some tiny islands that have been around for more then a century now such as Hawaii. It should have been under water already! Oops still there! Oh don’t worry the science is more advanced at predicting the affects of man made climate change then it use to be! 5 years later still there! This time I am telling the truth the science has gotten much better! Oops wrong again! The train just goes on and on and on! chuga
    Chuga chuga chuga! Chop chop! Down the train it goes with the clueless shills in the drivers sheet and the brainwashed citizens along with the ride!

    • David Appell says:

      ClimateChange4realz says:
      “There are some tiny islands that have been around for more then a century now such as Hawaii. It should have been under water already!”

      Flat-out stupid.

      • Not explaining yourself david way the hell stupider then resorting to insulting someone’s fact that agrees with reality. Think again cheapskate!

        • David Appell says:

          If you don’t already know why the island of Hawaii should certainly not be underwater now, then nothing I can say would get through to you. Your claim is pure ignorance.

          • Davie it is alarmists like you who keep the money flowing and the hoax of CAGW alive by asking experienced skeptics in the field like me dumb obvious questions only to expect smart scientific answers without looking at the overall picture and getting caught up and tangled into a inescapable web of tiny details. The sea level is rising about an inch per century. That is a fact. People like you however say that by 2030 Florida should be underwater but you don’t do the math and you don’t expect other people to do so either. If the sea level has been rising for the past 100 years now and the pesky alarmists say that south Florida will be under water by 2100 then at least the beaches and the costal areas should be underwater by now. They are not. I live in south Florida and we still have beaches. There is no significant sea level rise. The answer will come to those who do the math on these false claims

          • Wow! Would you look at all these well educated scientists making horribly wrong predictions! Chee Davie old boy sure makes me wonder why so many smart scientists like you make so many dumb ass predictions that haven’t come to pass.

            https://www.thenewamerican.com/tech/environment/item/22289-climate-alarmists-have-been-wrong-about-virtually-everything

          • David Appell says:

            ClimateChange4realz says:
            “The sea level is rising about an inch per century.”

            So why do you think the island of Hawaii should be inundated by now?

            Hmm?

          • David Appell says:

            David Appell says:
            The sea level is rising about an inch per century.

            Wrong.

            3 mm/yr = 12 in/century

            Learn how to calculate.

          • David Appell says:

            ClimateChange4realz says:
            The sea level is rising about an inch per century.

            Let’s see your calculation.

          • Let’s see you try to explain why all these so called “scientists” made all these wrong innacurate global warming end of time doomsday predictions that have never come to pass.

          • How can I believe these people when all there predictions they made about global warming have been wrong. Co2 does not significantly control the climate in any way, size shape or form and these scientists using this greenhouse gas theory have been wrong numerous times. CAGW is not science. It has fallen apart miserably. It is a governmental scare tactic to mislead people about what’s really causing the climate to change. The earth is cooling fast and there is going to be food shortages in the near future because of it. The government doesn’t Want to cause panic to early so they use global warming as an excuse to mislead you and suddenly when the SHTF to the point where they can’t hide the cooling any longer they drop the curtains and lay it on you all at one time. that is when the panic will begin. Climate change will affect us no matter what we do. There is nothing we can do about it

          • What about all these other record floods and hail storms and record cold and snow. The media simply chooses to ignore it. They should be reporting as much as they can but they only report what they want. Why is that? Oh that’s right they have an agenda and don’t want to cause too much panic!

          • Svante says:

            I hope you don’t base your scientific knowledge on anecdotes in media.

  6. theo says:

    You have to remember that much of what you think are competing and independent sources of knowledge or authority are just divisions, or “brands”, or “shil mags” of a small number of unaccountable, oligopolising, multinational, media empires.

    Nature is an example:

    https://en.wikipedia.org/wiki/Springer_Nature

  7. Norman says:

    There is another source of water that has been linked to sea level rise that is not currently considered in the IPCC reports.

    This article suggests that about 1/4 of the current sea level rise is caused by extraction from ground sources.

    If the rate of extraction of groundwater is increasing it will show and increasing amount in SL even if the other factors (melting ice and thermal expansion) are held constant.

    http://www.waterworld.com/articles/wwi/print/volume-25/issue-5/groundwater-development-flow-modeling/groundwater-depletion-linked-to-rising.html

    • David Appell says:

      Not only this, but reservoirs reached their global capacity around 2000. So they’re no longer holding back SLR. (Charles Vorosmarty of Univ of New Hampshire, Science, circa 2000.)

      • g*e*r*a*n says:

        Yeah, reservoirs reached their capacity due to the global AGW drought.

        You pseudoscience clowns are funnier together than separate. A great comedy team!

        • Norman says:

          g*e*r*a*n

          I may disagree with David Appell on things but one thing he has that you do not is some scientific knowledge. You have proven several times you have none. You got all your information from your hero Joe Postma and he is a deceptive individual who manipulates unscientific people like you to accept pseudoscience and bad physics.\

          You never did give even one supporting evidence (even though I asked several times) on another thread (a few back) on why you believed a 300 K plate would not absorb IR from a plate at the same temperature. I linked you to Kirchhoff’s Law but that did not register with you. You called that link rambling or something. You are unable to process or understand scientific thought process. It goes above your ability so obviously any science on a science blog makes you laugh since it seem ridiculous to your limited thought process.

          I am glad you find amusement in your limitations. Too bad you don’t see how unable you are to comprehend a scientific thought.

        • David Appell says:

          g*e*r*a*n says:
          “Yeah, reservoirs reached their capacity due to the global AGW drought.”

          Reservoirs reached their capacity because they release less water than their catchment basins collect.

          Or did you think reservoirs would hold water back forever?

  8. John Smith says:

    It is nice of Gaia to keep the non-liquid parts of our planet perfectly still so that we can measure global sea level to the tiniest mm and thus understand the shame of our own existence.

  9. Gary845 says:

    Should this New Acceleration be the News?

    Should this be in the news?

    ” . .ice loss from Greenland (which was large in 2011-12) has recently reversed itself with huge gains made in the last year.”

    You bet – but it won’t be.

    I recall that 2-3 years back, there’d been one monster story after another about Antarctic ice shelves collapsing. Was everywhere in the news. Then, NASA comes out with it’s massive study which found that the continent was adding ice volumn and that it was a net negative contributor to global SLR.

    News media? crickets.

    • RAH says:

      Not only is it not news, they are in fact blatantly lying and saying the opposite is happening.

      SMB in Greenland is growing. It’s like they have had no summer there as the get far below average temperatures and large snow storms over much of the island. In the Artic temperature has run under the 44 year mean since the 1st of May and they still write articles claiming the Greenland ice sheet and Arctic ice is melting.

      These people are not part of a new religion. They’re members of a cult!

      https://realclimatescience.com/wp-content/uploads/2017/07/Image1759_shadow.png

      • Bindidon says:

        SMB in Greenland is growing.

        It was really time it exceptionally does.

        https://www.dmi.dk/en/groenland/maalinger/greenland-ice-sheet-surface-mass-budget/

        But that doesn’t change a bit to the amount of melting there:

        ‘Over the year, it snows more than it melts, but calving of icebergs also adds to the total mass budget of the ice sheet. Satellite observations over the last decade show that the ice sheet is not in balance. The calving loss is greater than the gain from surface mass balance, and Greenland is losing mass at about 200 Gt/yr.’

        In the Artic temperature has run under the 44 year mean since the 1st of May…

        Aha. A very interesting fact we can compare with:

        1. http://ocean.dmi.dk/arctic/icecover.uk.php

        2. http://ocean.dmi.dk/arctic/plots/icecover/osisaf_nh_iceextent_seasonal_en.png

        I don’t think that DMI is a warmista host. Do you?

        • g*e*r*a*n says:

          Bin copy/pastes from DMI: “The calving loss is greater than the gain from surface mass balance, and Greenland is losing mass at about 200 Gt/yr.”

          Bin, I’ve seen that same text on that site for over five years. It would not be accurate for the last three years, at least.

          • Bindidon says:

            If I well remember, Ive seen that same text on that site for over ten years.

            With the only tiny difference that about ten years ago, a 1 was where today we see the 2.

            It would not be accurate for the last three years, at least.

            Wow! Don’t you think a valuable source (i.e. something different from ‘notrickszone’ or similar) would be better than your rather intuitive guessing?

          • g*e*r*a*n says:

            Jean, maybe you should consider DMI as your “source”.

          • Bindidon says:

            Thus you don’t seem to have any.

          • g*e*r*a*n says:

            Jean, my “source” is negating YOUR “source”. You wanted to hug DMI. Now you admit their text is OLD.

            You’re the one that needs a “source” to promote your pseudoscience.

      • Bindidon says:

        RAH on July 21, 2017 at 2:13 PM

        Not only is it not news, they are in fact blatantly lying and saying the opposite is happening.

        As for the other commenter, I’d like you would be able to give us here valuable sources confirming what you conveniently publish here behind a pseudonym. I use a pseudonym as well but do not pretend behind it that people are ‘blatantly lying’.

        In the Arctic (60N-82.5N according to the satellite datasets) the lowest absolute surface temperature measured by the unadjusted average of GHCN V3 stations in 2017 was in January (-16.35 C). Below you see the lowest unadjusted temperatures there since July 1973:

        1982 | 1 | -24.73
        1979 | 2 | -24.71
        1985 | 2 | -22.75
        1989 | 1 | -22.20
        1974 | 1 | -22.07
        1975 | 1 | -22.03
        1976 | 2 | -21.56
        1979 | 1 | -21.42
        1980 | 1 | -21.33
        1987 | 1 | -21.29
        1976 | 1 | -21.15
        1990 | 1 | -21.06
        1974 | 2 | -20.98
        1980 | 12 | -20.77
        1986 | 1 | -20.63
        1983 | 1 | -20.26
        1977 | 12 | -20.08
        1999 | 1 | -19.89
        1983 | 2 | -19.87
        1988 | 1 | -19.81

        Thus you can see that recent lowest temperatures in the Arctic are way above even the mean of the lowest temperatures measured there during the last 44 years (January 2017 appears in your 44 year selection at position 96).

        But what you are welcome to show all these ridiculous blah blah warmistas pretending that recent warming in the Arctic region is unprecendented, is this:

        http://fs5.directupload.net/images/170723/jxgxzw95.jpg

        The 36 highest GHCN anomalies in the Arctic all occured at the end of the XIXth century.

        • Bindidon says:

          Addendum: when I write about lowest GHCN temperatures, I of course mean the average of all stations located within the latitude band ’60N-82.5N’.

          It is evident that there, the one or the other station, e.g.

          CA002400300 82.5167 -62.2833
          CA002400305 82.5000 -62.3333
          CA002400306 82.5000 -62.3333
          CA002402682 81.8167 -71.3000
          CA002403833 81.1667 -91.8167
          CA00240BFH9 80.0667 -99.3000
          GLE00147401 81.6000 -16.6497
          ICW00091004 80.0000 -113.0000
          RSM00020046 80.6000 58.0000
          RSM00020049 81.8000 57.9700

          certainly will have measured temperatures lower than such averages.

      • barry says:

        In the Artic temperature has run under the 44 year mean since the 1st of May

        Arctic temperature was much warmer than the 44 year mean before the 1st of May than it was after.

        http://ocean.dmi.dk/arctic/meant80n.uk.php

        But warm or cold for a few months says nothing about long-term change.

        they still write articles claiming the Greenland ice sheet and Arctic ice is melting

        Because ‘they’ are looking at the long-term record, not just a few months.

        The inane confusion between weather and climate is forehead-slap inducing.

    • David Appell says:

      Gary845 says:
      “Should this be in the news?
      . .ice loss from Greenland (which was large in 2011-12) has recently reversed itself with huge gains made in the last year.
      You bet but it wont be.”

      The major mistake of deniers everywhere — misinterpreting short-term variations for trends. There is no end to it.

  10. MikeW says:

    The Global Warming of Doom hysteria about sea level rise is total nonsense. At any location, the local sea level is dominated by land movements, not climate change. And worldwide, coastal land areas over the past 30 years have actually increased (e.g. from river silting and land uplift) more than they have decreased (e.g. from subsistence), as revealed from actual satellite observations. If climate change were a significant factor in local sea levels, the coastal land areas worldwide would be decreasing, not increasing.
    http://www.nature.com/nclimate/journal/v6/n9/full/nclimate3111.html
    https://www.deltares.nl/en/news/how-the-earth-has-changed-over-the-past-30-years/

  11. MikeW says:

    Snape, from my experience, you are exceptional. All of my liberal friends and family members have been taken in by the Global Warming of Doom cult hysteria, including SLR of Doom. GWOD hysteria is also quite common in mainstream media articles.

    • Snape says:

      Mike

      How much time do you reckon the major television networks give to global warming, etc.? Maybe one minute a month?

      I’m guessing Brad Pitt gets more coverage.

      • Snape says:

        “Snape, from my experience, you are exceptional”

        I hear that a lot.

      • theo says:

        In the UK, the BBC gives it several HOURS a month. When Trump repudiated the Paris Accord it was the main news-lead for days, as “The mad presumption of the American idiot, Trump.” “Trump defies 19 world-leaders.” etc.,etc.

        It also appears as a throwaway line,

        “because of, [or, ‘despite’], global warming [or, ‘climate change’]”,

        in EVERY program about Nature, or Farming, or the Environment.

        • Snape says:

          Theo

          Not a fair example. Here in the US, almost ANY issue involving Trump gets hours of coverage.

          “It also appears as a throwaway line,

          because of, [or, despite], global warming [or, climate change],

          in EVERY program about Nature, or Farming, or the Environment.”

          Well, that’s true. On the other hand, I I think people’s reaction is more often a yawn than hysteria.

          • theo says:

            “…ANY issue involving Trump gets hours of coverage…”

            Not in the UK. They (BBC, MSM) exhausted themselves by gleefully anticipating WWIII or, failing that, Trump’s impeachment or walk of shame. They stopped talking about him, and went back to trying to get rid of the Conservatives, and to foiling Brexit.

            It was Trump’s climate heresy that set their “frothing at the mouth” machine off again.

            “A yawn” means aquiescence in the status quo, and is actually more useful to the elite than hysteria.

          • Snape says:

            Theo

            Here in the US, criticism of Trump remains very popular.
            Good ratings = happy advertisers, etc.

            The free market thrives.

          • g*e*r*a*n says:

            Theo, don’t waste your time with snake. He is a known 12-year-old.

      • MikeW says:

        Snape, I don’t watch TV network news, but GWOD coverage is very common in web-based news stories and magazines. And much of it is alarmist and inaccurate.

        • Snape says:

          MikeW

          Which makes more money – accurate, measured science reporting or alarmism? We all know the answer.

          • g*e*r*a*n says:

            Upthread, snake denied the alarmism. Now, he acknowledges it.

            The kid has so much to learn….

          • Snape says:

            No contradiction, g*r*n*. What little attention the media gives to climate change tends to be alarmist. Otherwise, even fewer people would give a hoot.

          • lewis says:

            Which is why I stopped with TV news years, decades ago.
            All they try to do is upset you – alarmism!!!!

            And it gets mucho advertising dollars. Why, because a large number of people watch.

          • Snape says:

            Lewis

            Still, a market driven media is way better than what you get in North Korea, China, etc.

  12. jimc says:

    “MSNBC host says it’s the media’s job to ‘control exactly what people think,’…”

    http://www.theblaze.com/news/2017/02/22/msnbc-host-says-its-the-medias-job-to-control-exactly-what-people-think-not-trumps/

  13. Andre says:

    “During the satellite era (since 1993), the trend in sea level rise was revised downward, by almost 10%, from 3.28 mm/year to about 3.0 mm/year. (For those concerned about Miami going underwater, these numbers equate to a little more than one inch every 10 years).”

    But the craziest part of this is that knowing the global sea level and whether it is rising or falling is of no use whatsoever to Miami residents. i.e. It is data with zero information value even if it is valid. Residents of coastal communities need to know whether their particular bit of ocean relative to their particular bit of land is going to go up or down, by how much and over what time period. Even considered on a global scale, the average is of no use if we don’t know the distribution because a global average rise in sea level could equate to a net gain in human welfare. It distresses me that climate scientists seem so unconcerned with such practical matters. Or if they are not unconcerned, at least they could have the honesty and decency to admit that they don’t yet have the answers to the questions that matter.

    • barry says:

      the craziest part of this is that knowing the global sea level and whether it is rising or falling is of no use whatsoever to Miami residents.

      Of course it matters. The background state of global sea level change has an influence on local changes, whether the land is subsiding or rising, and whether local sea level is rising or falling.

      If you’re chained to a jetty, you have a very reasonable interest in knowing if the tide is going in or out. If you’re a city planner, you have a reasonable interest in knowing if global sea level is changing.

  14. Bart says:

    Almost everyone agrees that temperatures have risen since the end of the LIA.

    Almost everyone agrees that sea level has been rising for millennia, currently at a very slow rate.

    Anyone with a brain knows that if something is melting, it will melt faster with higher temperature.

    But, none of this tells us the source of the temperature rise. A warming world is not evidence of anthropogenically induced warming.

    So, in the end, it is really just a sideshow, anyway.

    • gbaikie says:

      “Anyone with a brain knows that if something is melting, it will melt faster with higher temperature.

      But, none of this tells us the source of the temperature rise. A warming world is not evidence of anthropogenically induced warming.”

      It seems to me that it’s not question of what causes temperature rise, but why do we live in one of coldest times in Earth’s long history- or, question is why does temperatures lower.
      So for millions of years we have been in what is called an
      icebox climate. Well whatever, wiki calls it icehouse:
      “An “icehouse earth” is the earth as it experiences an ice age. Unlike a greenhouse earth, an icehouse earth has ice sheets present, and these sheets wax and wane throughout times known as glacial periods and interglacial periods. During an icehouse earth, greenhouse gases tend to be less abundant, and temperatures tend to be cooler globally. The Earth is currently in an icehouse stage”
      Or we are in an ice age or icehouse climate or I like to say
      icebox climate.
      We have longer periods of glaciation and shorter periods of interglacial, and we in the interglacial period of an Ice Age [or icehouse or icebox climate.
      Or without whatever is causing this icehouse effect, we would much warmer than we are now.
      But I don’t like icehouse [it’s like an outhouse] so going back to proper name of icebox climate.
      An icebox climate has cold oceans and even during interglacial period within the ice age, has polar ice caps.
      So cold oceans and ice caps characterize an icebox climate.
      It should be noted that if ice caps were a permanent thing, we have ice hundreds of millions [or billions] of year old- we don’t. Mars could have hundreds of millions of year old frozen water ice. And maybe hundreds of million of year old frozen CO2 ice. Or as recall no one found ice [anywhere] more than 10 million years old- and best hope is on Mars [somewhere other than Earth.
      Go back wiki and it’s outhouse, I mean icehouse:
      “The causes of an icehouse state are much debated, because not much is really known about the transition periods between greenhouse to icehouse climates and what could make the climate so different. One important aspect is clearly the decline of CO2 in the atmosphere, possibly due to low volcanic activity.”
      I think others say Low Co2 is from mountain building and increased weathering which removes CO2 from atmosphere.

      Now if not a member of warmist religon, and don’t think Co2 has much effect, what caused us to be in this ice box climate?

      • Gary845 says:

        Let’s assume that they are correct and the Earth has warmed about 1 C since the late 1800’s (I assume a bit more since the end of the LIA).

        Even if the warming ends about now, but we stay roughly at the current global average temp – for the next 200 years (is this perhaps similar to the MWP) – will not the oceans continue to warm a bit? Will not there continue to be a general trend of melting glaciers and sea ice (excepting where this slightly warmer climate cycle results in more snow fall)?

        Turned around, I’d argue that continued melting of sea ice and glaciers is not proof of global warming; rather, global warmth.

        • gbaikie says:

          — Gary845 says:
          July 22, 2017 at 10:46 AM

          Lets assume that they are correct and the Earth has warmed about 1 C since the late 1800s (I assume a bit more since the end of the LIA).

          Even if the warming ends about now, but we stay roughly at the current global average temp for the next 200 years (is this perhaps similar to the MWP) will not the oceans continue to warm a bit?–
          Yes.
          Or something like 6 to 12 inches per century of sea level rise and 2 to 4 inches of that rise being from a warming ocean’s thermal expansion.

        • Svante says:

          That’s right Gary.

          See Table 2: https://tinyurl.com/kdab4ou

          Median estimates:
          – One degree => 2.3 m after 2000 years.
          – Two degrees: 4.8 m, and 10.9 m at equilibrium.

    • David Appell says:

      Bart says:
      “Almost everyone agrees that sea level has been rising for millennia, currently at a very slow rate.”

      False.

      Sea level rose about 1 meter in the 5,000 years before the industrial era:

      https://en.wikipedia.org/wiki/Sea_level_rise#/media/File:Post-Glacial_Sea_Level.png

      or an average of 0.2 mm/yr. It’s now rising about 15 times faster, and accelerating.

    • Emeritus says:

      “Almost everyone agrees that sea level has been rising for millennia, currently at a very slow rate.”

      Wrong, sea level was higher 7 – 8000 years ago under the Holocene optimum, and has fallen after that, had a bump up during the MWP, i little bit down (some cm’s)from MWP to LIA, and thereafter up in a rate that has not been seen for thousand of Years.

      http://www.pnas.org/content/111/43/15296

      • Rockkicker says:

        Sea level has risen 120 meters since last glacial maximum 20,000 years ago (www.giss.nasa.gov/research/briefs/gornitz_09/).
        Thats when many humans migrated across land bridges that are now 100m deep ocean.
        Average sea level rise since that time is 6mm/year, with many signs of significantly faster rates up to 15mm/year (based on studies of coral atolls).
        The high rates of SL rise are due to the loss of continental ice sheets, so we should expect that to reduce once these sheets are reduced, as they have been. So the current rates of around 3mm/year seem pretty normal for where we are in the cycle.
        These climate trends occur over thousands of years and are well documented in the geologic record, but data on the rate of change is much harder to date. But there is nothing in geological records that suggest current trends are unusual, and quite a bit to suggest they are normal.
        Seems like too much is being made of short term trends that may well just be noise in the bigger picture.

        • Emeritus says:

          This i simply nonsense, if the average SLR the 4 – 5000 last years was 6 mm/year – or six meters each millennium – most historical records of Civilization would be under water, they are not. Sea level has been very stable the last 4 – 5000 years.

          • Rockkicker says:

            Emeritus
            There is clear geological evidence that sea level at last glacial maximimum was 120m lower than present. That was 20,000 years ago.
            So so from that time the AVERAGE rate of rise is 6mm /year.
            In last 5000 years sea level rise slowed and as you say has been relatively stable, well below the 20,000 average, so the rate of rise in the first 15,000 years was obviously much higher.
            The simple point being that 3mm/year is well in the range of previous rates or rise.
            Still make no sense to you?

          • David Appell says:

            The proper question is, why is sea level rising now?

          • Emeritus says:

            I’am answering Your July 23, 2017 at 9:22 AM comment since there is no Reply button on the latter.

            There is no disagreement that sea level rose 120 – 130 meters after the last glacial period. We ar now in an Interglacial period and 10.000 years B.P. all innland Glaciers i Norway was melted out. Today we have approximately 2000 of them, the largest being The Jostedal Glacier;

            https://en.wikipedia.org/wiki/Jostedal_Glacier

            And there is clear geological evidence that this glacier among others in the Alps and in Northern America was melted out during The Holocene, and then started to grow again.

            And there is no disagreement that the sea level rise was much higher for instance 15.000 years ago, in singel years and possible decades, more than one meter/year.

            But You are pushing a climate myth; “the sea level has always been rising since the last Ice Age,” it has not. It was probably higher during the Holocene Temperature Optimum and has decreased since then (with small up and down ticks) and started ricing again 150 years ago.

          • Rockkicker says:

            Not pushing any myths at all.
            Simply pointing out there are long term natural trends that drive temperature, and as being discussed now, associated effects in sea level and many other things.
            Our knowledge of what drives these is still still limited and being debated. The recent study in the context of climate change and the rates of change and trend is particularly limited to what amounts to ~100-200 year snapshots of events that have timescales over 10’s of thousands of years.
            How meaningful are these snapshots? They may seem meaningful to people who think in years and 10’s of years, especially if the same people are ignorant of the real timescale of natural climate cycles.
            We are clearing living in a naturally warming world, evidenced by glacial retreat and sea level change over thousands of years.
            This is almost never discussed by those raising concerns about mans contribution to warming in the context of current global warming debates. For example, try finding a single reference to the role of natural warming in anything said by Al Gore, or any of the other high profile commmentators for AGW.
            The real debate should be about whether mans contribution to warming is resulting in a rate of change or end result that is outside the natural range, and to what extent that is going to be a problem.
            We never seem to see any sensible discussion on those issues where there are actually some useful, although limited, data rather than just spurious models.
            (The exception might be the studies of past sea level changes and apaption response by coral atolls, where some interesting work is being getting limited exposure in media reporting).

          • Svante says:

            Emeritus just gave you a sensible discussion.

            His reference is not what you would call a snapshot.

            “during the ∼6,000 y up to the start of the recent rise ∼100−150 y ago, there is no evidence for global oscillations in sea level on time scales exceeding ∼200 y duration or 15−20 cm amplitude.”

          • gbaikie says:

            “The real debate should be about whether mans contribution to warming is resulting in a rate of change or end result that is outside the natural range, and to what extent that is going to be a problem.”

            Humans are not doing anything which will result in changing Earth’s present icebox climate [into something more normal for Earth.
            Humans are quite capable of doing this, but they are not demonstrating such competency currently [current being within the last century]. Or one need to “actualize” some of the wild ideas associated with “progress thought” and we aren’t heading anywhere near this [it seems to going the opposite way of this- or in an “unprogressive” direction [if anything].

          • gbaikie says:

            I mean business as usual is giving lot’s benefits- or progress- flying airplane and people “texting”, etc, etc.
            But this an outgrowth of industrial age, which was outgrowth 16th century “enlightenment”. What could be call “progressive” was late 18th century- wild ideas related to human freedom and wealth creation [and more to point how to get there]. One could sort of say the business as usual [rather than anything newer] got us there [with of course many unwanted things, also] but the progressive aspect, didn’t get us there [one could claim it caused more unwanted things than anything notable as an improvement].

          • Rockkicker says:

            Svante
            Not sure where that reference comes from but it is a very ill informed statement.
            There is abundant data from many sources using radiocarbon dating of corals throughout the Indian and Pacific oceans showing sea level fluctuations over many meters over cycles of hundreds of years.
            Although the major rate of SL increase since last glacial maximum does flatten out about 6,000 years ago, the multi meter SL fluctuations since then show that the 0.2m rise we see over past 100 years does not seem unusual in its range or rate.
            Plenty of references if you simply google Holocene sea level changes.

          • Svante says:

            Emeritus gave us the reference in this thread, why did you not read it?

            Google found a lot of local estimates with big changes, is that what you were thinking of?

            Google also found this global one: https://tinyurl.com/hc4bpt3

          • Svante says:

            Where your numbers not compensated for uplift/subsidence?

          • David Appell says:

            Rockkicker says:
            “We are clearing living in a naturally warming world”

            What’s causing this “natural warming?”

          • David Appell says:

            “What’s Really Warming the World,” Bloomberg Business, 6/24/15
            http://www.bloomberg.com/graphics/2015-whats-warming-the-world/

  15. Cloudbase says:

    We won’t be discussing sea level rise it that goes off. 😯

  16. theo says:

    “…neutral ENSO.”

    https://www.tropicaltidbits.com/analysis/ocean/global.png

    zzzzzzzzzzzzzzzzzzz……………

  17. Steve Case says:

    Colorado University’s Sea Level Group has adjusted their data with nearly every release. Here’s the Then and Now since 1993:

    If there hadn’t been any changes, both of those plots should have fallen right on top of each other. It will be interesting to see what changes the first CU release in 2017 brings.

  18. spalding craft says:

    Is there a graph available illustrating the Nature adjustments Dr. Spenser is talking about? I can’t visualize the issue without a picture of some sort.

    Thanks

  19. Bindidon says:

    My opinion is that Roy Spencer is a science man, as opposed to people like David Middleton at WUWT:

    https://wattsupwiththat.com/2017/07/17/tales-of-the-adjustocene-satellite-sea-level-edition/

    I inderstand his claim concerning the low accuracy of Nature’s publication, but I would by far more appreciate scientific comments about

    http://sealevel.colorado.edu/content/tide-gauge-sea-level

    https://www.aviso.altimetry.fr/fileadmin/images/data/Products/indic/msl/MSL_Serie_MERGED_Global_AVISO_GIA_Adjust_SerieReference_sm.png

    http://sealevel.colorado.edu/files/2016_rel3/sl_ns_global.png

    etc etc etc…

    • g*e*r*a*n says:

      Bin, I would “far more appreciate scientific comments about” the natural mass being added to the oceans.

      • Snape says:

        Here’s an interesting question I found online:

        Is the ocean really “rising”, or is the floor just getting “thicker/higher”? The article states that millions of tons of sediment is being deposited on the ocean floor every year. Most people say/believe that melting ice is causing the ocean level to rise. I’m not trying to counter that, but couldn’t all that sediment be a significant factor as well? i.e. Maybe the ocean level isn’t “rising” as much as we believe, but, rather, the water is getting displaced by all that sediment?

        A plausible answer:

        “Three things: sediment is subducted back into the mantle, so only a limited amount accumulates before it’s gone. Also, the additional mass “presses” the crust down into the mantle, aka isostasy. Third, the time scales are completely different. Ice melting happens (nowadays) in decades. Sedimentation is a much longer process, thousands of years and longer.”

        • Snape says:

          (Here is another, similar answer:)

          “In a geologically static world you might have a point. Erosion would wear down the land surface, depositing the sediment in the ocean – where ‘Archimedes principle’ would apply, and seas level would rise by displacement. There are two main reasons why this doesn’t account for the rate of sea level rise that we are seeing: plate tectonics and observed rates.

          The Earth is a tremendously dynamic environment in which plate tectonics drive an approximate balance between crustal destruction by erosion and subduction, as against freshly generated land at ‘constructive margins’. This ‘wobbly balance’ has been going for the past 3+ billion years, and is likely to continue for several billion years more. The balance of rise and fall in sea level averages close to zero but has positive and negative anomalies over time. In all cases, fluctuations are slow – in the order of millions of years (excluding the much larger short-term fluctuations caused by ice ages). So for all practical purposes the base-line is ‘zero change’, upon which is superimposed the effects of sea level rise as we exit the last ice age, i.e. the last 12000 years and continuing. On top of that is the recent effect of human-induced climate change.”

          • gbaikie says:

            Another way to say it, the ocean are vast and have largely sterile and transparent waters, the coastal regions are small part of the ocean and tend to have murkier water from sedimentary river run off, coast wave action upon the beaches. And coastal current which transport material along the coast- causing erosion and deposition.
            {And the ocean life that feeds off off this material]

            What material gets to open ocean is driven by winds, smoke from forest fire, or dust storms [ie from Africa to south America- “They found that wind carries roughly 182 million tons of Saharan dust out to sea each year. The cloud sheds roughly 50 million en route to South America, but the remainder fans out over the Amazonian basin and the Caribbean Sea,.. http://time.com/3723750/dust-africa-south-america/
            And other stuff like extra-terrestrial material, and volcanic eruptions.

          • Snape says:

            gbaikie

            I’m not real confident in those answers I posted. Just thru them out as a conversation starter.

          • Snape says:

            gbaikie

            Not sure what your point about the “open ocean” is. Sediment entering the ocean near the shoreline would displace the same amount of water as anywhere else.

          • gbaikie says:

            -Snape says:
            July 23, 2017 at 9:11 AM

            gbaikie

            Not sure what your point about the open ocean is. Sediment entering the ocean near the shoreline would displace the same amount of water as anywhere else.-
            True.
            Probably our icebox climate cause more sedimentary material to get into the ocean, because sea level rise and lowers by 150 meters. And plus the very erosive effects of glaciers.

            It seems whenever sediments getting into the ocean in terms of how little it is, the discussion concerns the vast majority of the ocean which is called the Abyssal plain:
            “An abyssal plain is an underwater plain on the deep ocean floor, usually found at depths between 3,000 metres (9,800 ft) and 6,000 metres (20,000 ft). Lying generally between the foot of a continental rise and a mid-ocean ridge, abyssal plains cover more than 50% of the Earths surface”
            https://en.wikipedia.org/wiki/Abyssal_plain

            But most of sediments would deposited above the above abyssal plain- and such deposition above abyssal plain would related to sea level rise.

          • Snape says:

            gbaikie

            What does the abyssal plain have to do with this discussion?

          • gbaikie says:

            “What does the abyssal plain have to do with this discussion?”

            Oceans cover 70% of planet.
            The ocean’s abyssal plain covers more than 50% of surface of planet.
            The ocean or as I said above the “open ocean” is above the abyssal plain.
            The shallow waters of the ocean- say less the 1000 meters deep, ie, Gulf of Mexico and Sea of Japan and all the continental shelves would be of small portion of the ocean area which would not be ocean waters above the abyssal plain.
            [Though one can call such places open oceans [everywhere you look is ocean- but it’s not what meant by open oceans].
            Though about the 2/7th of earth’s ocean is a big area- though smaller than all land area of Earth.

            Earth is 511 square km, more half being say 260 million.
            511 times .7 is 357. So roughly the non-abyssal plain area is around 100 million square km.
            In parts of this 100 million square km areas, one has a lot sediment carried into by rivers. I would assume not much in regard to Sea of Japan, though lots in regard Gulf of Mexico [Mississippi river], Bay of Bengal, or Yellow Sea.

            One also has iceburg carrying sediment, say from Greenland into Baffin Bay. And other glaciers falling into the oceans, carrying sediments and dropping it, as they melt.
            Or:

            “One of the most striking differences between Antarctic
            and Arctic glaciers has to do with the amount of debris
            they are observed to carry.
            Arctic glaciers and icebergs are typically laden with
            debris at all levels in the ice (Ovenshine, 1970), whereas
            Antarctic glaciers and icebergs have been reported to be,
            for the most part, barren of debris”
            -(Journal of Glaciology)’, Vol. 25, No. 93, 1980″
            https://www.igsoc.org/journal/25/93/igs_journal_vol25_issue093_pg387-396.pdf

            Later, in time:
            “Although it is known that the loads of these sediments may be large, there is very little evidence whether loads sufficient to increase the bulk density of the ice and sediment to greater than that of sea water occur commonly
            (cf. Goldschmidt, 1994)….

            Grab samples from the sea floor in an embayment in front of Swift Glacier, James Ross Island, western Weddell Sea (Fig. 1) collected during a U.S. Antarctic Programme cruise on RVIP N.B. Palmer in January 2002 provide the first documentation of iceberg fragments submerged by their sediment content”
            https://www.erudit.org/en/journals/gpq/2004-v58-n1-gpq1200/013115ar/

      • David Appell says:

        SLR rise due to sedimentation is estimated to be about 0.02 mm/yr:

        “Is sedimentation in the oceans accounted for in the GMSL estimate?” CU Sea Level Research Group, 2012-03-13
        http://sealevel.colorado.edu/content/sedimentation-oceans-accounted-gmsl-estimate

        • g*e*r*a*n says:

          Davie, what about the other “estimates”?

          Cosmic dust, underwater lava vents and volcanoes, land dust, and the most “terrifying” of all, coral reefs!

          Yeah, coral reefs are filling up the oceans. They can’t be stopped. The more they grow, the higher sea levels rise.

          Move to the mountains!

  20. Lance Wallace says:

    The Nature article references Jevrejeva’s 2008 study finding an acceleration of 0,01 mm/yr/yr. However, it does not reference Jevrejeva’s 2014 study, which dialed back the acceleration to 0.002 mm/yr/yr. Curious.

    I confirmed Jevrejeva’s estimate using a slightly different approach. But the value is on the order of 0.002 +- 0.0014. In other words not significantly different from zero.

    https://dl.dropboxusercontent.com/u/75831381/Jevrejeva%20sea%20level%20change.xlsx

  21. spalding craft says:

    I hate to appear dense, but the material I’ve been referred to illustrate Roy’s point is very technical and difficult to understand.

    Can anyone refer to some pictures that might help a layman understand What Roy is saying?

  22. David Appell says:

    Roy wrote:
    “Im calling fake science news on the Nature reporter who covered the story. The headline was technically correctbut misleading.”

    Reporters don’t choose the headline, editors do.

  23. AaronS says:

    The AMO dominates the climate in greenland. I wonder how much of the entire trend in sea level could be related to the positive AMO phase.

    http://journals.ametsoc.org/doi/abs/10.1175/JCLI-D-12-00845.1

  24. Christian says:

    Thanks for your great work, Roy!

  25. ren says:

    Visible shortage of ozone in the northern hemisphere.
    http://exp-studies.tor.ec.gc.ca/ozone/images/graphs/gl_dev/current.gif

    • David Appell says:

      Another irrelevant ren comment, his ego begging for attention.

      ren, try getting a dog.

      • g*e*r*a*n says:

        Davie begs for attention again. No dog will have him.

        • Emeritus says:

          Mr. Grr, I have been reading Spencers blogg for approximately two years.

          In almost each bloggpost Your drivel takes part. But no facts, no science, no coherent thinking, no Cognitive skills, no logic, just annoying noise.

          What kind of spices are You? Echinococcus multilocularis?

          There should be a dedicated Climate blog for annoying microbes.

          • g*e*r*a*n says:

            So, you find me offensive, but not the promoters of pseudoscience?

            Interesting.

          • Snape says:

            g*r*n*

            You are an offensive promoter of pseudoscience. Even so, I still value your contributions here.

            Just as every story needs a good villain, every blog needs a good troll. You play the part brilliantly!

          • g*e*r*a*n says:

            snake, I’d ask you for one example of me “promoting pseudoscience”, but I’ve learned not to attempt discourse with 12-year-olds.

          • Bindidon says:

            The problem with people like you, g*e*r*a*n, is that you lack the mirror revealing to yourself your own – mental – age (maybe a bit more than 12, but not that much).

            None of us does therefore might ever wonder that you never tell us about science.

            Like a child just having learned the word “pseudoscience”, you endlessly repeat and repeat and repeat it.

            A few years ago you wrote your pseudonym without asterisks.
            I remember… hilarious!

          • g*e*r*a*n says:

            Bin, if you can just get your rambling rants a little longer, you will be up to the level of that other con-artist.

          • barry says:

            Bin, if you can just get your rambling rants a little longer, you will be up to the level of that other con-artist.

            When you have grown up you may use grown-up terms properly. Take this cookie and run off, now.

      • ren says:

        I show climatic changes that are real and are happening now. The changes in ozone will have a great impact on the climate, as well as human malignancies.

  26. jimc says:

    I hope the climate activists practice what they preach. I won’t. I suppose that’s why they demand tyranny.

    http://www.nationalreview.com/article/449770/climate-change-activists-advise-stop-driving-flying-grilling-burgers-having-children

  27. Uk Ian brown says:

    Come on girls .sticks and stones come to mind

    • Snape says:

      Trade winds have strengthened a little in the eastern Pacific. This makes me lean towards neutral/cool ENSO conditions by fall.

  28. Gordon Robertson says:

    This will likely only make sense to US and Canadian citizens but does anyone think the extreme El Nino in 1998 had anything to do with the Denver Broncos winning the Super Bowl that year? They won it in ’97 as well therefore the effect could have been cumulative.

  29. Snape says:

    Gordon

    Canadians are only interested in hockey. You should know this.

    But to your point, yes, the strong el nino of 1998 unfairly benefited the Denver Broncos. This was proven last year. Another strong El Nino, another Denver championship!

    • Snape says:

      Gordon

      The Broncos didn’t win the 1997 super bowl, they won it in 1999. Turns out that victory was a total fluke.

      • Gordon Robertson says:

        snape…”The Broncos didnt win the 1997 super bowl, they won it in 1999. Turns out that victory was a total fluke”.

        They actually won it in 1998 and 1999. It was no fluke though, I watched both games. One of them was won by Elway on a mad dive across the goal line. Denver had a strong D, good receivers, tight ends, and of course Elway, the man.

        Sure you’re not thinking of the New England – Seattle game Seattle had won till they coughed up the ball?

        Since the ’98 game was played in January of ’98 that date would align with the emergence of the late 97 start of the El Nino. Maybe we could do a paper on this.

    • Gordon Robertson says:

      snape…”Canadians are only interested in hockey. You should know this”.

      As a Canadian, I have no particular interest in hockey. I support the local Vancouver Canucks to a degree but only when they are winning.

      I like the Canadian Football League better with my home team being the BC Lions. Played soccer all my life and the old Whitecaps of the NASL were fun but I would not go across the street to watch the modern Caps.

      What has this to do with global warming? They still play outdoor hockey in Canada in winter and in the Vancouver area they play soccer year round except for the days when it’s too cold (i.e. frozen turf). That has not changed in over 50 years.

      • Snape says:

        Gordon

        Just messing with you about the football stuff.

        There’s been less than 1 deg. warming in the last 50 years. Why would this mean Canadians could no longer play outdoor hockey?

        • Snape says:

          Global warming is happening really fast in “earth years”, really slow in human years.
          A lot of the predictions I’m seeing are for the end of the century…..my children will be in their nineties!

          • UK Ian brown says:

            Just a lot of old men making predictions about something they will never know.you can not live your life based on predictions its absurd.

          • Svante says:

            Dinosaurs could not predict the asteroid that killed them,
            We can do better than that.

          • g*e*r*a*n says:

            Svante, what is your prediction for the temperature at noon, July 4th, 1918, in Kansas City Missouri?

            How much would you bet on your prediction, to an accuracy of 1 degree F?

          • Svante says:

            I can bet on the 1918 10−year moving average with 95% percent certainty: https://tinyurl.com/yd2hjy38.

        • Gordon Robertson says:

          snape…”Theres been less than 1 deg. warming in the last 50 years. Why would this mean Canadians could no longer play outdoor hockey?”

          I gathered you were messing with me that’s why I replied with humour. The cold air that freezes much of Canada in winter comes from the North. There’s no reason whatsoever that 0.04% of CO2 in the atmosphere should affect that.

          As I understand it, the cold air from the North is caused by the lack of solar energy in winter that causes colder air to descend from the upper atmosphere. That cold air finds its way south.

          I cannot buy into the idea that CO2 has any effect on global temps let alone a significant effect.

  30. RealOldOne2 says:

    Dr. Spencer,
    Quick question. Did you post a reply to one of my comments on another website two days ago?
    If not, then someone is impersonating you, as they replied as and signed their comment, Dr Roy Spencer.
    Someone previously impersonated me on the same website.

    Thanks.

  31. Now SNAPE if you choose to dismiss it that is your choice.

  32. SNAPE ,GORE IS A CON MAN.

  33. Snape, your view and my view on the climate are different.

    That is why data/charts you like and think are correct I think are garbage and vice versa for you.

    • Snape says:

      Salvatore

      What are you talking about? Earlier you showed me graphs from the DMI and just now, NASA. I liked them!

      • Snape says:

        Salvatore
        Here is the punchline to the last blog you showed me, “How much ice will melt, I wonder, at minus 33 degrees?”

        Did he (Robert) explain that this was at 10,530′ in central Greenland? That ice almost never melts at that altitude or location, even in the middle of summer? Did he say that on that same day ice was infact melting and calving almost all around Greenland’s periphery, which is at or near sea level? Nope, he left all that out.

      • OK

        What I am trying to say is let’s see what the global temperatures go from here.

  34. Bindidon says:

    A download from the dataset

    Greenland Mass Variability Time Series Version 1 from JPL GRACE Mascon CRI Filtered

    http://tinyurl.com/y7x2owff

    shows us this:

    http://fs5.directupload.net/images/170726/tgvnwmvk.jpg

    No wonder that it is nearly the same as what NASA shows:
    https://sealevel.nasa.gov/

    Between 2010 and 2013, the loss experienced a higher increase (480 Gt in 2011 compared with the mean at 280 Gt); 2014 was the opposite with only 60 Gt.

    It would be interesting to know how much snowfall has been accumulated over the period, because like all precipitations, it is originating from evaporation of ocean water and hence should be subtracted from the sea level rise of 1 mm per 380 Gt ice melt.

    • Snape says:

      Bindidon

      Maybe I don’t fully understand your question, but Greenland’s contribution to SLR is based on how much total mass it is losing. The accumulation of snowfall is already factored in.

      • Bindidon says:

        Snape says on July 26, 2017 at 10:47 AM

        It seems indeed that you didn’t quite. But I don’t know if I can manage to express it with more precision.

        *

        I wasn’t speaking about Greenland’s net mass loss which is accurately measured by the satellites.

        What I mean is that if NASA tells us that one mm SLR is equivalent to a net loss of 380 Gt land ice, the snowfall included in the net loss nevertheless is a precipitation resulting from ocean water evaporation.

        And in my honest opinion, this evaporation results in a sea level decline which has to be subtracted from the ice loss/SLR equivalent above.

        • Snape says:

          Bin

          Yes, water is moving from the ocean to Greenland (first as evaporation, then snow). Water is returned to the ocean from melt and calving.

          When melt/calving is greater than ocean evaporation/snowfall, sea level will rise. So, like I said, evaporation is already accounted for.

          • Bindidon says:

            Snape on July 26, 2017 at 1:15 PM

            Yes I can agree.

            I suppose that satellites scanning Greenland’s or Antarctica’s inlandsis or glaciers around the world measure, time slice upon time slice, the height for every land ice cell.

            Regardless wether increase of snowfall or decrease of melting or vice-versa, the sum of all height differences between subsequent time slices indeed should inform us wether or not a local contribution to global SLR has occured.

  35. Bindidon says:

    In the context of the thread’s topic:

    https://sealevel.jpl.nasa.gov/elnino2015/1997vs2015-animated-485.gif

    This is really one of the most interesting comparisons of the two recent bigger El Ninos I have ever seen up to now.

    • Snape says:

      Salvatore

      So, since July 12, global SST’s have been falling (the nino region has been cooling as well). Yet, according to climatereanalyzer, global atmospheric temperature has been spiking upward during the same time period.

      Must be a weather situation. More sun over land, more clouds over the ocean.

      • Snape says:

        Another way of putting it:
        “must be a global distribution of cloud cover which favors warming”

        • No one can pin the miniscule temperature changes you are talking about to any one particular thing other then randomness within a particular climate regime.

        • but if one looks at the AAO index going from +2.0 to -2.0 during the last week that caused Antarctica to warm up recently that probably has caused the slight temporary warming in the S.H.

          NOTHING TO DO WITH AGW.

          • Snape says:

            Salvatore

            Right, nothing to do with AGW. Just speculating what could cause daily variation in global temperature.

          • Snape says:

            Salvatore

            Pointing to warming in one location (for instance Antarctica) doesn’t really tell us anything.

            *why is this warming in one place not balanced by cooling somewhere else?

          • David Appell says:

            Salvatore, what is your proof that the change in the AAO index caused warming in Antarctica?

      • I say randomness . The climate system has randomness within a particular range, which we have been in since the end of the Little Ice Age.

        That range I think is now in the the process of ending as we move to a new lower range.

        Snape until higher global temperatures come about that makes this period in the climate unique AGW has nothing to stand on. We are not even close.

        The climate is in a range it has been in +/- 1c since the Little Ice Age ended around 1840 or so.

        • Snape says:

          Salvatore

          “I say randomness . The climate system has randomness within a particular range, which we have been in since the end of the Little Ice Age.”

          I don’t think temperatures change willy-nilly, either short term or long term. There is always a reason. It only appears to be random.

          Short term temperature fluctuations must be the result of cloud-cover distribution favoring either warming or cooling. That’s my hypothesis.

          • good luck in quantifying it

          • Snape says:

            Anyway, direct sun over land warms the surface and heat is radiated upward. Whereas when direct sun is over ocean, a lot of energy is absorbed by the water and less is available to the atmosphere. So if global cloud distribution (weather) favors one situation over the other, global temperatures should fluctuate.

          • lewis says:

            Snape,
            if the sun warms the water, it will only get so much warmer until evaporation equals the incoming radiation. Thus the atmosphere does receive the ‘radiated’ heat. Which, as you say, will result in increased cloud cover, which will….

          • Snape says:

            Lewis

            Like gbaikie said, sunlight doesn’t just warm the ocean surface, it penetrates many meters down. Some of this warmer water will soon rise to the surface, but some will not. The ocean, being a liquid, has a great capacity for vertical transport of heat.

            On the orher hand, sunlight does not penetrate beneath the earth’s surface. Some heat is moved downward via conduction, but not very far. Therefore, land areas, heated by the sun, move energy to the atmosphere more rapidly than would the ocean.

          • Snape says:

            (Maybe this is good example of vertical heat transport- liquid vs solid.)

            My sister had an unheated 10′ deep swimming pool in Texas. The water was almost 90 degrees in summer, and not much difference in temperature top to bottom.

            In contrast, the top few inches of soil in her yard was very warm, but much cooler just a little deeper.

          • gbaikie says:

            ” lewis says:
            July 26, 2017 at 7:26 PM

            Snape,
            if the sun warms the water, it will only get so much warmer until evaporation equals the incoming radiation. ”
            The surface of the water radiates and/or evaporates and sunlight doesn’t directly heat the water surface- it heats the body of the water and warmed water rises to surface [where it could radiate and/or evaporate]

            “Thus the atmosphere does receive the radiated heat. Which, as you say, will result in increased cloud cover, which will.” A body of water warms the air by added gas molecules to the air [evaporation] therefore air above heated water is same temperature as the water surface, whereas heated land surfaces are [or become] hotter than air temperatures. Or land temperature the same temperature as air temperature doesn’t heat atmosphere, but ocean the same temperature as air does warm the atmosphere.

          • gbaikie says:

            Or only land surface warms air above 40 C. And globally, air above 40 C is rare. Oceans warm air up to 35 C. Most air is below 35 C and oceans warm most of Earth’s air [which is below 35 C].
            This should explain why a planet with 80% ocean area in the tropics can’t become hot [anything over 35 C], but the average temperature of earth being 15 C, can increase this average temperature by quite a bit- say up to 20 or 25 C and had such warming it make earth more tropical than it is right now. Or how Germany could alligators and hippopotamus [not just in some zoo].

          • David Appell says:

            You’re throwing a lot of numbers around without proving any of them.

          • g*e*r*a*n says:

            800,000K is only ONE number, Davie. Yet you never “proved” it.

          • David Appell says:

            Are you still struggling with simple high school calculation?

            Hint: dT = dQ/mc

          • g*e*r*a*n says:

            Obviously you don’t understand radiative heat transfer and thermodynamics.

            If you did, you wouldn’t be hyping AGW.

            Unless you have an agenda….

          • David Appell says:

            It has nothing to do with “radiative heat transfer.” That’s just ridiculous.

            If you can’t calculate a dT given a dQ, you have no understanding of basic physics whatsoever.

          • g*e*r*a*n says:

            Davie believes the Sun heating the Earth has “nothing to do with radiative heat transfer”!

            Hilarious.

          • David Appell says:

            Do I really have to explain to you how to do an 11th grade calculation???

          • g*e*r*a*n says:

            Oh yes, please show us your math as to how the Sun can heat Earth to 800,000K!

            That would be a hoot!

          • David Appell says:

            dT = dQ/mc

            Keep working on this; perhaps you’ll figure it out eventually.

          • g*e*r*a*n says:

            Well AGAiN, Davie avoids showing the calculations as to how the Sun can heat the Earth to 800,000K.

            No surprise.

          • Svante says:

            Still stuck on the 2nd sentence, please try the 3rd.

          • g*e*r*a*n says:

            Davie is so confused by the first two, he’s not ready for the 3rd.

  36. Bindidon says:

    A further interesting comparison: below you see an overlay of tide gauge and satellite altimeter data.

    http://fs5.directupload.net/images/170726/qx3u9ybx.png

    Source: the Australian CSIRO.

    • Gordon Robertson says:

      bindidon…”A further interesting comparison: below you see an overlay of tide gauge and satellite altimeter data”.

      How many tidal gauges are there covering the 70% of the planet’s surface area that are oceans? Hansen admitted that thermometers are inadequate for accurately representing the atmosphere based on location and altitude. Why should tidal gauges be any different?

      How accurate is the surface altitude telemetry? How long is any one satellite in position to scan the same portion of ocean?

      Tidal forces from the Moon and Sun are overlapping and ENSO causes a net level difference in the ocean level between Australia and South America.

      I don’t think we have instrumentation that cam measure to within mm and I don’t think we know enough about ocean levels.

      • Bindidon says:

        What you think or do not think, Gordon Robertson, does not interest me at all.

      • Snape says:

        Gordon

        You just asked four questions regarding sea level measurement, then form an opinion without knowing the answers.

      • David Appell says:

        Gordon Robertson says:
        “Hansen admitted that thermometers are inadequate for accurately representing the atmosphere based on location and altitude.”

        Really??

        I bet you can’t provide a citation.

      • David Appell says:

        Gordon Robertson says:
        “I dont think we have instrumentation that cam measure to within mm and I dont think we know enough about ocean levels.”

        Your opinion on the subject is irrelevant.

        As usual, you’re not willing to learn or do the necessary research to produce an intelligent statement.

  37. ren says:

    The reference mean sea level (Topex/Poseidon, Jason-1 and Jason-2) since January 1993 (left) is calculated after removing the annual and semi-annual signals. A 2-month filter is applied to the red points, while a 6-month filter is used on the blue curve. By applying the postglacial rebound correction (-0.3 mm/year), the rise in mean sea level has thus been estimated as 3.30 mm/year (mean slope of the plotted data). Analysing the uncertainty of each altimetry correction made for calculating the GMSL, as well as a comparison with tide gauges gives an error in the GMSL slope of approximately 0.5 mm/year with a 90% confidence interval. (Credits CLS/Cnes/Legos)
    https://www.aviso.altimetry.fr/fileadmin/images/data/Products/indic/msl/MSL_Serie_MERGED_Global_AVISO_GIA_Adjust_SerieReference.png

  38. barry says:

    My main point is that the Nature headline was misleading. They clearly had to find something in the study that supported the alarmist view of sea level rise, and they figured few people would read past the headline.

    Nature Headline:

    “Satellite snafu masked true sea-level rise for decades

    Revised tallies confirm that the rate of sea-level rise is accelerating as the Earth warms and ice sheets thaw.”

    Study title and abstract:

    The increasing rate of global mean sea-level rise during 19932014

    Global mean sea level (GMSL) has been rising at a faster rate during the satellite altimetry period (19932014) than previous decades, and is expected to accelerate further over the coming century1. However, the accelerations observed over century and longer periods2 have not been clearly detected in altimeter data spanning the past two decades3, 4, 5. Here we show that the rise, from the sum of all observed contributions to GMSL, increases from 2.2 0.3 mm yr−1 in 1993 to 3.3 0.3 mm yr−1 in 2014. This is in approximate agreement with observed increase in GMSL rise, 2.4 0.2 mm yr−1 (1993) to 2.9 0.3 mm yr−1 (2014), from satellite observations that have been adjusted for small systematic drift, particularly affecting the first decade of satellite observations6. The mass contributions to GMSL increase from about 50% in 1993 to 70% in 2014 with the largest, and statistically significant, increase coming from the contribution from the Greenland ice sheet, which is less than 5% of the GMSL rate during 1993 but more than 25% during 2014. The suggested acceleration and improved closure of the sea-level budget highlights the importance and urgency of mitigating climate change and formulating coastal adaption plans to mitigate the impacts of ongoing sea-level rise.

    I set little store in media reports, but I don’t see a lot of daylight between the headline and the abstract. The uncertainty in the estimate is absent, but that’s alluded to in the body of the article. In any case, the headline matches the paper title.

    I’m as apt as anyone to criticize the media (including Nature press releases) for sensationalism. But that cuts both ways on the climate issue, so I wonder that anyone who looks deeper than the headlines gives a fig.

    • David Appell says:

      An accelerating sea level rise isn’t sensational?

      • Jake says:

        If I accelerate from 65 to 66 mph on the highway, the change is not sensational.
        If I accelerate from 65 to 85 mph in the same time frame on the highway, that might be described as sensational, it depends on the time frame, and the highway.
        Sea level rise, independent of what metric you use to describe it, doesn’t appear to be sensational.
        Electricity cost-acceleration in South Australia? Now that’s sensational ……

      • Bindidon says:

        No.

      • barry says:

        An accelerating sea level rise isnt sensational?

        As it is a requirement for IPCC sea level projections to 2100, confirmation is hardly sensational. Because sea level acceleration is difficult to detect to statistical significance over short periods, the length of the satellite period has hindered a determination. This revision strengthens that signal. But, being a real skeptic and not a fake one, I know this isn’t the last revision that will be undergone, and i’m not yet convinced the acceleration statistically significant across different instruments, decadal cycles in sea level, and statistically. I think it’s reasonable to think that acceleration has been occurring, but if I set the bar as high as I do for, say, notions on the “pause,” I must and do apply them equally to this topic.

        For people who eyeball the temp record, and say the pause is obvious just by viewing the plotted data, I wonder if they will also be consistent and agree that acceleration is pretty bloody obvious if you leave out statistical significance and just look.

        I have higher standards. I’d be a hypocrite if I didn’t stick to them.

        Is Bart around? I’d like to know what his eyes tell him about sea level acceleration just by looking. He’s got a thing for acceleration, and a repugnance for uncertainty analysis. This would be a great test of his consistency.

        • David Appell says:

          barry wrote:
          “As it is a requirement for IPCC sea level projections to 2100, confirmation is hardly sensational.”

          What does that mean, “requirement?”

        • David Appell says:

          barry says:
          “Is Bart around? Id like to know what his eyes tell him about sea level acceleration just by looking.”

          You’re kidding, right?

          You’d rather people just look at data, instead of analyzing it mathematically?

          Totally unscientific.

          • UK Ian brown says:

            You don’t need science to tell if see levels are rising.if they are to small to be observed then they are insignificant right?.

        • barry says:

          You are totally not getting me, and not responding to the substance of my remarks.

          1) For global sea level to reach IPCC 2100 projections, the rate has to exceed current – hence, acceleration is a requirement to reach projections. This is obvious from “analyzing it mathematically.”

          2) I clearly don’t “rather people just look at data, instead of analyzing it mathematically?” That is evident from my post. All you have to do is read it for comprehension instead of pounce on snippets, and attempt to form a rebuttal from a decontextualization of them. I’ll help you out, though. Here’s what I said:

          …Im not yet convinced the acceleration is statistically significant across different instruments, decadal cycles in sea level, and statistically. I think its reasonable to think that acceleration has been occurring, but if I set the bar as high as I do for, say, notions on the pause, I must and do apply them equally to this topic.

          I then mention the rubbish standards promulgated here on the “pause” (“But you can see it with your eyes!”) and wonder if skeptics will be consistent in applying them to sea level acceleration, which should apparent to any fool who only looks with their eyes.

        • barry says:

          Here’s the optical evidence for sea level acceleration.

          https://www.cmar.csiro.au/sealevel/images/CSIRO_GMSL_figure.png

          For those who think their eyeballs are all they need, acceleration (from 20th cen to 21st cen) should be obvious from that graph.

          I don’t think eyeballs are the best tools, though, and doubt that acceleration is statistically valid. Even more so for the short-term period that is the topic of this post.

          None of which has much to do with AGW: it’s about statistical (and structural) validity WRT acceleration.

        • g*e*r*a*n says:

          barry pontificates: “But, being a real skeptic and not a fake one…”

          barry,

          1) What are you skeptical of?

          2) What is a “fake skeptic”, a “Lukewarmer”?

        • David Appell says:

          “Optical evidence?”

          Completely unscientific.

          Hence meaningless. A sad excuse.

          • UK Ian brown says:

            So observations are a waste of time David that would be a hell of a way to run a science lab its like saying my experiment tells me it should be 2 o’clock but my watch says its 3 o’clock.which do I believe

        • barry says:

          1) What are you skeptical of?

          It’s a general condition.

          2) What is a fake skeptic, a Lukewarmer?

          Fake skeptics don’t practice real skepticism, but instead cherry-pick, distort and dismiss out of hand anything that doesn’t agree with their decidedly non-skeptical take.

          Doubt is the basis of skepticism, not belief. How often do you see skeptics use qualified language, like “suggests,” “indicates,” “possible”? That is one clear indicator. So is using uncertainty selectively – only when it props up their point of view.

          • g*e*r*a*n says:

            Various estimates of man’s contribution to atmospheric CO2 range from 0 to 100%. Estimates of how much warming CO2 causes range from 0 to 100%. No one really knows how much sea levels are rising, and even if any rise is caused by warming.

            Looks like there is plenty of “doubt” out there, if one tends to be a skeptic.

          • barry says:

            Yes there are doubts. More to the point, there are many uncertainties in the estimates we have.

            The ones who are telling us, “A warmer world is better for us,” “Climate sensitivity is low,” “The global temperature adjustments are fraudulent,” “Consensus is actually groupthink,” “Sea level rise is driven by non-anthropgenic forces,” “Arctic sea ice change is purely natural,” “This paper proves (X),” “The MWP was a global event,” or “warmer than today,” “Climate scientists toe the party line for job security/advancement/personal gain/an overweening need to save the world”: they aren’t skeptics. There is no doubt in these statements.

            Also: “it’s going to be bad,” “it’s worse than we thought,” “this paper proves (X),” “climate sensitivity is higher than we thought,” “civilization won’t be able to cope”: these aren’t the cautious statements that true skeptics would utter, either.

            Another one – “We aren’t certain, so we don’t really know anything” – isn’t skepticism. It’s stupidity. Or an inability to deal with complexity. Fake skeptics make lousy gamblers, because they think snake eyes has as much chance as rolling a 7. Sure, there’s oodles of uncertainty for one roll of the dice….

            The sad thing about the conversations we have is that we are so pitted against each other that a fundament of acquiring knowledge is squashed – natural, neutral curiosity.

          • g*e*r*a*n says:

            barry states: “The sad thing about the conversations we have is that we are so pitted against each other that a fundament of acquiring knowledge is squashed…”

            Well, I certainly agree with that!

            I’ve been trying to get some knowledge to some that comment here, but they squash it.

        • barry says:

          David, you are utterly not getting me. Clearly you are skim-reading, or you would realize that I’m dissing analysis by eye (optical analysis) and favouring analysis by math.

          We’re saying the same thing.

          • David Appell says:

            Then your sarcasm needs improvement.

          • barry says:

            It’s not sarcasm. Your reading comprehension needs improvement. Start from the beginning and see what you missed while your knee jerked.

            I’ve noted things you’ve missed. For example, do you now understand that sea level requires acceleration from present rate to reach IPCC projections?

          • David Appell says:

            I shouldn’t have to read everything you’ve ever written from the beginning in order to understand the meaning of your latest comment.

          • David Appell says:

            barry says:
            “For example, do you now understand that sea level requires acceleration from present rate to reach IPCC projections?”

            The IPCC doesn’t “require” acceleration.

            The science projects acceleration.

            Huge difference.

            That’s obviously what the science says. And that acceleration is already happening.

          • barry says:

            Don’t be obtuse. From the beginning of this sub-thread.

          • barry says:

            The IPCC doesnt require acceleration.

            Distortion. You’re as bad as the psuedo-skeptics.

        • Bart says:

          Is Bart around? Id like to know what his eyes tell him about sea level acceleration just by looking.

          I have been on vacation.

          It is very difficult to say. The data are such a hodgepodge, and most of the purported rise is from isostatic “adjustments”. Are the adjustments on the up and up? Maybe. Who can say for sure?

          The length of day has not been significantly increasing beyond what is expected from tidal recession, which suggests there is not a significant shift occurring in planetary inertia due to thermal expansion and polar melt.

          So, while I expect accelerating sea level rise simply due to rising temperatures, there is no compelling evidence of it that I can see. However, again, if it were, it would be consistent with a warming world, but not necessarily a warming world due to CO2, so the question is rather moot.

  39. Bindidon says:

    Sometimes I get really disturbed by these arrogant and stubborn comments ‘produced’ by people continually discrediting the work of others, though having not half a bit of the competence needed to express even the slightest criticism against that work.

    I downloaded sea level anomaly data originating from both tide gauge

    http://www.cmar.csiro.au/sealevel/downloads/church_white_gmsl_2011_up.zip

    and satellite measurements

    ftp://podaac.jpl.nasa.gov/allData/merged_alt/L2/TP_J1_OSTM/global_mean_sea_level/GMSL_TPJAOS_V4_199209_201703.txt

    and shifted the two datasets to have them on the same baseline (1993-2013):

    http://fs5.directupload.net/images/170727/j6i23dlr.jpg

    Linear trend estimates in mm/yr for 1993-2013 (Excel linest, no autocorrelation handling):
    – gauges: 3.56 +- 0.06
    – sat: 3.23 +- 0.03

    Thus gauge measurements are no more than 10% higher than satellite altimetry.

    My respect for all these persons who work on so tremendously differing instruments, techniques and software. The similarity of their results couldn’t be a better answer to commenters’ ignorance.

    An interesting detail is the sequence of trends for the gauge time series:
    – 1880-2013: 1.60
    – 1950-2013: 1.99
    – 1980-2013: 2.60
    – 1993-2013: 3.56

    • Snape says:

      Bindidon

      I enjoy the juxtaposition of great comments like yours next to the mostly inane ones posted by skeptics.

    • g*e*r*a*n says:

      Bin says: “Sometimes I get really disturbed by these arrogant and stubborn comments produced by people continually discrediting the work of others, though having not half a bit of the competence needed to express even the slightest criticism against that work.”

      Bin, don’t let the Alarmists scare you. AGW is a hoax. The Earth is fine. Sea levels are not going to flood countries.

      Relax and enjoy life.

    • David Appell says:

      Bindidon: what you’ve rediscovered is that SLR is accelerating. This makes a huge difference in its seriousness.

    • Bindidon says:

      Mr Appell: I didn’t rediscover anything. I just inform about what is evident when having a look at a time series.

      And to be clear: I don’t share your warmista-like sensationalism.

      If there is anything to be considered really serious actually, then it is the increase of war conflicts and of waste,
      together with the decrease in quality of what is most important on Earth: drinking water.

      • David Appell says:

        Bin: You rediscovered the acceleration in SLR that has been apparent for some time. It now even appears in the much shorter satellite record.

        • Bindidon says:

          Your obtrusive mania reminds me of these retired teachers who not only think they know everything a bit better but above all feel some permanent urge to communicate about that.

          Your are in my opinion a (worse) counterpart to commenters like Gordon Robertson who in comparison with you suddenly behaves quite sympathic.

          One more time, Mr Appell: I’m aware of what you feel the need to point out. Point final.

          • Gordon Robertson says:

            Bindidon…”Your are in my opinion a (worse) counterpart to commenters like Gordon Robertson who in comparison with you suddenly behaves quite sympathic”.

            Bindidon…a legend, in his own mind.

      • Gordon Robertson says:

        bindidon…”with the decrease in quality of what is most important on Earth: drinking water”.

        Contaminated drinking water, malnutrition, and parasitic infections in places like Africa are now ironically blamed on a sexual transmission of the HIV virus.

        The scientist who discovered HIV, Dr. Luc Montagnier, has recently claimed that HIV will not harm a healthy immune system. In Africa he thinks the solution is to end malnutrition, contain parasitic infections like malaria, and ESPECIALLY to provide clean water for consumption.

        He thinks AIDS (a set of opportunistic infections related to depressed immune activity) is due to oxidative stress and he recommends antioxidants AFTER the conditions that created the immune problems are taken care of.

    • Gordon Robertson says:

      bindidon…”I downloaded sea level anomaly data originating from both tide gauge…and satellite measurements…”

      Yes…but you have failed to explain the relevance. Your appeal to authority goes in one ear and out the other.

      If you want to talk science then explain how a few tidal gauges and satellite scanning can place ocean levels to within a few millimetres. They obviously can’t but in the studies claiming they can they offer quantum leaps in faith that are not backed by proof.

      • barry says:

        On a topic about satellite-derived sea level rates Bindidon compares the tide gauge record with the satellite-derived record. Ren posts about a volcano 500 miles from the sea and you think Bin’s post is irrelevant?

        There’s no fathoming the mid of a pseudo-skeptic. Because it has no depth.

        (puns intended)

  40. Harry Cummings says:

    I agree being a scientist who takes the skeptical position with the threat of losing ones job and income takes a tremendous amount of fortitude Hopefully things will improve over the next few years

    HC

    • David Appell says:

      If a scientist isn’t scientific, why should anyone keep them around in a scientific capacity?

      • g*e*r*a*n says:

        Davie doesn’t understand that “skepticism” IS science. Unquestioning “belief” is religion.

        • gbaikie says:

          hmm, reminds me.
          What is most pathetic religion?
          You got the North Korean worship of a little fat guy.
          {which make some sense, in a nation which is starving}.

          Perhaps the older religion of Fidel Castro?
          Then we have the atheists, being a grandfather of
          Castro and/or little fat boy.

          With ancient Rome, one had worship of political leaders. They were gods.
          Would you consider that ancient Rome [and ancient countries/city states in general] as about as pathetic as the current crop?

          Ancients civilization as general matter have better excuse to be stupid, but did the people grovel as much for their religion as the peoples of Cuba and N Korea?

          • g*e*r*a*n says:

            “You got the North Korean worship of a little fat guy.
            {which make some sense, in a nation which is starving}.”

            Funny!

          • Gordon Robertson says:

            gbaikie…in N. Korea, Cuba, and ancient Rome, the populace had no other choice than to go along to get along. I wonder what they discuss(ed) in private among trusted friends?

          • gbaikie says:

            “I wonder what they discuss(ed) in private among trusted friends?”

            That assumes that in N Korea or Cuba one can have trusted friends.
            And if one happenned to have trusted friends, things you choose to talk about could get your friends killed.

  41. ren says:

    A powerful series of earthquakes in Iceland.
    http://pics.tinypic.pl/i/00921/hmbwlvc4d6ng.png

    • David Appell says:

      Irrelevant for climate.
      But I suspect you already knew that.
      So why this link?

    • barry says:

      ren’s bulletin board is not interested in the topic du jour. Hence the anecdotal non sequiturs.

      • David Appell says:

        All ren does is junk up the conversation with irrelevant comments. Always cut-and-pasted. Because he has no original thoughts of his own, and can’t even follow the thread.

    • g*e*r*a*n says:

      ren, it appears Davie and barry do not understand that movements of the planet effect sea levels.

      • g*e*r*a*n says:

        “affect”, of course.

        (Only 2nd cup of coffee.)

      • barry says:

        ren isn’t talking abut sea level.

        • g*e*r*a*n says:

          * ren’s link was about earthquakes
          * This post is about sea level.
          * Earthquakes are related to movements of Earth’s crust, which is related to sea levels.
          * You and Davie appeared to be criticizing ren for making his comment, obviously not seeing the connection.

        • barry says:

          It’s up to ren to make the connection. In any case, he frequently posts off-topic links – for more often than he posts on-topic. It’s just what he does. He’s a bulletin board for short-term events.

          Volcanic ejecta from one volcano contributes virtually nothing to sea level. If he’s actually trying to make that connection, it’s daft. But as usual, he makes no argument whatsoever.

          • David Appell says:

            ren is purposely being a pest in order to try to derail the conversation.

          • Gordon Robertson says:

            DA…”ren is purposely being a pest in order to try to derail the conversation”.

            If you look closer, most of his comments are subtle pokes at the AGW theory.

          • barry says:

            If you look closer, most of his comments are subtle pokes at the AGW theory.

            Subtle, no. Pokes, most definitely. Credible? Not remotely.

        • barry says:

          The scientific topic is revised estimates in the rate of sea level change in the satellite era. The changes are to the early part of the record. The topic Roy introduced is about how the results have been reported.

          Here’s ren being “on-topic” in the comments. These are one-line posts, usually accompanied by a link.

          “The temperature in Greenland is very sensitive to atmospheric turbidity.”

          “Where are the hurricanes in the Atlantic?”

          “Visible shortage of ozone in the northern hemisphere.”

          A post with 3 links to Arctic sea ice changes over the last month – no comment. Arctic sea ice has no effect on sea level.

          “Lows moving over Europe.”

          “A stronger blockade of circulation in the south begins.”

          “Nino 3 index falls.”

          “Tremors in the Yellowstone caldera.” [Yellowstone is 500 miles inland from the nearest coastline]

          These are weather reports. Nothing to do with sea level adjustments to data in the 2000s, or to do with long-term sea level change.

          Almost all of them nothing to do with sea level.

          This is de rigeur for ren.

          • g*e*r*a*n says:

            “Arctic sea ice has no effect on sea level.”

            I’ve actually known Warmists that believe melting sea ice will cause SLR. That’s one of the reasons AGW has held on so long–very few people understand physics.

            But, back to ren–anyone that is bothered by his climate/weather comments/links has the option of ignoring them.

          • Snape says:

            Barry

            g*e*r*a*n’s comments are idiotic and rude, ren’s are off topic. It’s all part of the fun.

          • Bindidon says:

            This is de rigeur for ren.

            Well I think that if you want to show how pretty good you master a language, then better you really do.

            The correct spelling for the word is rigueur.

          • Gordon Robertson says:

            bindidon…”This is de rigeur for ren.
            The correct spelling for the word is rigueur”

            In English it’s colour, in the States it’s color. Maybe rigueur in French is rigeur in Australia.

            Barry???

          • Gordon Robertson says:

            g*r…”Ive actually known Warmists that believe melting sea ice will cause SLR”.

            Just a thought. The ice sheets in Antarctica are the toes of glaciers pushed out over and into the ocean as the glacier ice extends. They are still attached to the glacier toes.

            Is it possible that parts of the ice sheets in the water have already displaced the oceans somewhat?

          • Gordon Robertson says:

            barry…”Heres ren being on-topic in the comments. These are one-line posts, usually accompanied by a link.
            The temperature in Greenland is very sensitive to atmospheric turbidity.”

            barry…I think you are missing the gist of ren’s comments. Alarmists think temperatures in Greenland are the result of a 0.04% concentration of CO2 in the atmosphere, which is ridiculous. Ren is pointing out in a subtle manner that Greenland temps are sensitive to atmospheric turbidity.

            How is that off topic? Roy’s comments in general are in defense of the skeptical POV. Ren is supporting it.

          • Gordon Robertson says:

            snape…”Its all part of the fun”.

            That’s how I take it.

          • barry says:

            Today in Sydney is warmer than average. You reckon that’s meaningful?

            It’s a basic fallacy, confusing weather with climate. Climate is the long-term average of weather. Snapshots are anecdotes.

        • barry says:

          Ive actually known Warmists that believe melting sea ice will cause SLR. Thats one of the reasons AGW has held on so longvery few people understand physics.

          I’ve not seen that. I doubt that misconception is a lynch-pin for convincing ‘warmists’ about AGW.

          But, back to renanyone that is bothered by his climate/weather comments/links has the option of ignoring them.

          I usually do. You have the option of not erroneously defending them as being on topic.

          Bindidon, my posts often have typos. I didn’t know how to spell rigueur, so thanks for that. I don’t have any ambition to master French, just to be clear enough.

          • Bindidon says:

            Understood, barry!

          • Bindidon says:

            But please let me add that we commenters all (me included) should avoid deciding wether or not ren’s comments make sense.

            It’s up to him I guess.

          • barry says:

            Despite that he doesn’t comment much (which in many places would get him banned for spam), he promotes an agenda by conflating cherry-picked weather events with climate. Mostly I ignore him, sometimes I don’t. Dunno if it’s better to respond occasionally or permanently give him special provision. The latter seems patronizing, but possibly justified.

          • barry says:

            Hmm. Do you know ren personally?

            If so, I’d be inclined to take your advice.

          • Gordon Robertson says:

            barry…”Despite that he doesnt comment much (which in many places would get him banned for spam), he promotes an agenda by conflating cherry-picked weather events with climate”.

            Maybe ren’s first language is not English. If not, maybe he could write in his native language and let the rest of us figure out his comments using Google translator.

            Furthermore, this is Roy’s blog and we are guests. Roy is a meteorologist and perhaps he finds ren’s links to weather interesting. I know I do much of the time.

          • barry says:

            You think I should treat ren differently to everyone else?

  42. dr No says:

    Meanwhile:
    Scientists are “very worried” that the melting of the Greenland ice sheet could accelerate and raise sea levels more than expected.
    They say warmer conditions are encouraging algae to grow and darken the surface.
    Dark ice absorbs more solar radiation than clean white ice so warms up and melts more rapidly.
    Currently the Greenland ice sheet is adding up to 1mm a year to the rise in the global average level of the oceans.
    It is the largest mass of ice in the northern hemisphere covering an area about seven times the size of the United Kingdom and reaching up to 3km (2 miles) in thickness.
    This means that the average sea level would rise around the world by about seven metres, more than 20ft, if it all melted.
    That is why Greenland, though remote, is a focus of research which has direct relevance to major coastal cities as far apart as Miami, London and Shanghai and low-lying areas in Bangladesh and parts of Britain.
    http://www.bbc.com/news/science-environment-40686984

    • Snape says:

      This is from the NSID*C:

      Snowfall in eastern and southeastern Greenland through the 2016 to 2017 autumn and winter was far above average, adding 500 millimeters water equivalent to some areas. Much of this occurred during a series of storms in October, when a large persistent low-pressure pattern southeast of Greenland pushed warm moist air onto the eastern and southeastern mountains. This additional snowfall increased the overall mass of the ice sheet by about 150 billion tons more than average prior to the start of the melt season. However, melting and run-off, though off to a slow start, will reduce this excess mass through the course of the summer. As the season progresses, we will evaluate whether the total effect of the full annual climate led to mass gain or mass loss for the ice sheet.

    • Bindidon says:

      This means that the average sea level would rise around the world by about seven metres, more than 20ft, if it all melted.

      Yes yes, dr No!

      But… Greenland’s inlandsis has a volume of about 2.9 M km, roughly equivalent to a mass of 2.9 M Gt.

      What means that even if we had a net ice mass loss of ten times the actual level of round 300 Gt / year, it would take 1,000 years for that nice little melting work to be done.

      • Bindidon says:

        Rats! I forgot that the site doesn’t support spec chars other than the basic ASCII set. So we silently read here 2.9 M km3.

      • dr No says:

        Yes, you are correct. But the average contribution to sea level rise would be about 7 mm per year – roughly double the current observed rate.

      • David Appell says:

        Bindidon says:
        “:But Greenlands inlandsis has a volume of about 2.9 M km, roughly equivalent to a mass of 2.9 M Gt.

        “What means that even if we had a net ice mass loss of ten times the actual level of round 300 Gt / year, it would take 1,000 years for that nice little melting work to be done”

        Again you are ignoring acceleration, which changes all the calculations significantly.

    • Gordon Robertson says:

      dr no…”Scientists are very worried that the melting of the Greenland ice sheet could accelerate and raise sea levels more than expected”.

      Whenever I see a reference to ‘scientists’ with no reference to who they are I get a strong suspicion of alarmists trying to push something past me. The ‘very worried’ only adds to my suspicion.

      Many of those alleged scientists are working on lucrative funding and think nothing of making allegations based purely on consensus and projections from models for which they have written the programs. Data and objectivity are well in the background.

  43. ren says:

    Sorry.

    SHEVELUCH VOLCANO
    56.64 N, 161.32 E; Elevation 10768 ft (3283 m), the dome elevation ~8200 ft (2500 m)
    Aviation Color Code is ORANGE

    Explosive-extrusive eruption of the volcano continues. Ash explosions up to 32,800-49,200 ft (10-15 km) a.s.l. could occur at any time. Ongoing activity could affect international and low-flying aircraft.

    A growth of the lava dome continues (a viscous lava flow reveal in the northern its part), strong fumarole activity, ash explosions, hot avalanches and an incandescence of the dome blocks and hot avalanches accompany this process. According to satellite data by KVERT, a thermal anomaly over the volcano was noting all week. Strong explosions sent ash up to 11-12 km a.s.l. on 23 July, and on 23-24 July ash plume extended for about 1400 km to the east from the volcano.
    http://www.kscnet.ru/ivs/kvert/van/index.php?name=Sheveluch&n=30-2017

    • David Appell says:

      “One characteristic of the emerging postmodern science is its stress on nonlinearity and discontinuity: this is evident, for example, in chaos theory and the theory of phase transitions as well as in quantum gravity. At the same time, feminist thinkers have pointed out the need for an adequate analysis of fluidity, in particular turbulent fluidity. These two themes are not as contradictory as it might at first appear: turbulence connects with strong nonlinearity, and smoothness/fluidity is sometimes associated with discontinuity (e.g. in catastrophe theory); so a synthesis is by no means out of the question.”

      — Alan Sokal

    • Gordon Robertson says:

      ren…”SHEVELUCH VOLCANO….”

      Where is Sheveluch volcano?

      Oh…it’s in the Kamchatka region.

      Which is where?

      It’s a peninsula extending south from the east coast of Russia, almost to Japan.

      http://www.kscnet.ru/ivs/kvert/map.php?lang=en

      Some photos of the volcanoes:

      http://www.kscnet.ru/ivs/kvert/index_eng.php

      KVERT in the article refers to the Kamchitka Volcanic Eruption Response Team. Hope they are not located in Moscow.

  44. dr No says:

    BTW, I seem to recall another Dr No on this site who claimed Donald Trump was his creation and that he was destined to win the presidency and cause world-wide chaos. That Dr No was obviously mad, but prescient nonetheless.

    • Snape says:

      I feel bad for having dissed Al Gore, “Salvatore, Ive never posted a link to Al Gore and am not interested in his opinions.”

      I voted for him and think he would have been a good president. I also admire is efffort to bring attention to the issue of AGW.

      • gbaikie says:

        Snape says:
        July 28, 2017 at 10:22 AM

        I feel bad for having dissed Al Gore, Salvatore, Ive never posted a link to Al Gore and am not interested in his opinions.

        Wow! Hard for me to wrap my head around idea of feeling bad about Al Gore. I feel bad for all the people, he duped.
        It’s like feeling bad for Hitler, or imagining Hitler was a genius [which idiots do claim].

        “I voted for him and think he would have been a good president. I also admire is effort to bring attention to the issue of AGW.”

        Well voting for someone should be mostly about choosing the lesser of evils as general rule. Was Al Gore less evil than George Bush? That’s a tough one. I think Al Gore would have destroyed the dem party quicker than Obama did. But I think Obama was more amusing than Al Gore. Or Obama wasn’t very amusing but had his moments. Obama not only destroyed the Dems but also trashed MSM. And Al Gore could not get such a suicidal commitment from MSM.
        Of course at the time significant aspect of Gore vs Bush was the war on terror- which probably was hard to predict.
        Now if Al Gore was president and Joe Lieberman was VP, 911 could framed to be about having a Jewish VP. And that would have been a boring and fruitless national discussion.

        Now AL Gore was more crazy about AGW than Bush or Obama, But Al Gore never did anything about AGW in terms his personal life [unlike George Bush]. I don’t think Gore cared about Africa nor have interest working with India regarding their nuclear development program. I think Al Gore might stipped Europe from being so crazy about AGW- because of his talking about.

        • Snape says:

          gbaikie,
          I don’t feel bad for Al Gore, I’m sure he’s doing just fine. I feel bad for the flippant comment I made.

          • gbaikie says:

            Oh, that you aren’t interested in Al Gore’s opinion.
            Well, generally I am not interested in the opinion of advertising. Which is about the same any opinion of any pol.

            I can want to watch Superbowl advertising- and maybe more interested in ads than the actual football game.
            And Politican opinion is sort of like watching the same ad, over and over.
            And likewise politicians could say stuff which is worth watching- sometimes.
            I guess Al Gore’s actual opinion might be quite interesting.
            For instance I think he said it was politics of global warming rather than science which important. but that might more of echoing of opinion rather than his opinion. Anyhow that kind of stuff might be interesting.

          • David Appell says:

            Al Gore has clearly made a big effort to education himself. What he has to say on climate isn’t wrong — he’s just repeating what the scientists are telling him.

          • gbaikie says:

            -David Appell says:
            July 28, 2017 at 9:47 PM

            Al Gore has clearly made a big effort to education himself. What he has to say on climate isnt wrong hes just repeating what the scientists are telling him.–

            Well, mostly what James Hansen is telling him. I imagine Al Gore thinks Hansen is a bit nutty. Or at least not a skillful politician, as Gore imagines he is.

          • David Appell says:

            Why would anyone think Hansen is a politician? He clearly is not and never tried to be. You just trying to make up something to complain about.

          • g*e*r*a*n says:

            Davie, maybe this will help you to understand: “Hansen is the “Donald Trump” of climate alarmism”.

          • Gordon Robertson says:

            DA…”Why would anyone think Hansen is a politician?”

            Could it have anything to do with Hansen being arrested with actress Daryl Hannah while protesting the Keystone pipeline?

            It’s not clear if they were put in the same cell together but that thought boggles my mind after seeing Hannah in Bladerunner.

          • Gordon Robertson says:

            DA…”Al Gore has clearly made a big effort to education himself. What he has to say on climate isnt wrong hes just repeating what the scientists are telling him”.

            Not quite. Gore was educated in climate science at Harvard under the tutelage of oceanographer, Dr. Roger Revelle. When Dr. Revelle advised the public not to read too much into CO2 levels with the regard to warming, Gore went ballistic.

            Revelle wrote a paper with Fred Singer and Gore went after Singer since Revelle had subsequently died. Gore made statements to the effect that Revelle must have been senile and that Singer had taken advantage of him. Singer sued and won.

            So, he is not repeating what Dr. Revelle stated and he was a pioneer in global warming, his work dating back to the 1950s.

            Gore served 8 years as Vice President and I did not hear a peep out of him about global warming during that period. His claim to fame came with his wife Tipper as they skulked about trying to find demonic lyrics and subliminal messages in rock songs.

      • Gordon Robertson says:

        snape…”I voted for him and think he would have been a good president. I also admire is effort to bring attention to the issue of AGW.”

        Compared to George Bush I would agree with you. I supported him at the time as a Canadian but I had no idea at the time about his views on global warming.

        Mind you, that was the year 2000 well before the IPCC made their iconic statement in 2007 that it is 90% likely humans are causing global warming. It was just after the 1998 EN had occurred and dropped back below the UAH baseline. No one could foresee that a sudden spurt in 2001 would stabilize the global average around 0.2 C for the next 15 years.

        I was not even aware of catastrophic global warming in 2000 and most people were not. I got drawn into it when I saw the 90% confidence level and wondered how the IPCC could apply that to opinion.

        Back in 2007, even NOAA was showing a flat trend. Since then they have gone back and fudged the data to show a warming trend. NASA GISS has followed, as the butt-kissing alarmists they are.

        • Snape says:

          Gordon

          “Back in 2007, even NOAA was showing a flat trend.”

          You are so dense. In 2007, the long term trend was not flat, and it’s in the long term that we are more able to see global warming. Shorter periods are easily overwhelmed by natural variation (like increased heat uptake by oceans). Longer term, these variations tend to average themselves out.

          The pause you are always talking about is INCUDED in the long term trend, and the long term trend indicates warming.

    • Gordon Robertson says:

      dr no…”another Dr No on this site who claimed Donald Trump was his creation and that he was destined to win the presidency and cause world-wide chaos”.

      Thus far it has been the Democrats and their supporters, including the media, on a sour-grapes frenzy, who have created the chaos. They have been supported in part by stupid Republicans who seem unclear as to whose side they are on.

    • Snape says:

      Ren

      Ever wonder how Australians can get used to being upside down?

    • Bindidon says:

      From the first of August it gets quite cold in Australia.

      http://www.bom.gov.au/climate/outlooks/#/temperature/summary

      Are you really really sure, ren?

      • Gordon Robertson says:

        bindidon…”Are you really really sure, ren?”

        The link is referring to likelihoods for cripes sake. It’s an Australian government site run by blatant climate alarmists.

    • Gordon Robertson says:

      ren…”From the first of August it gets quite cold in Australia”.

      Yay!!!!! I was wondering how we’d get the global average down with the heat we’re having in the NH. With snow in Brazil and cold weather in Oz, maybe it will drop even more.

    • barry says:

      August is the 2nd coldest month of the Australian year, on average.

      Downthread, I’ve pointed out that there is a light breeze forecast for Patagonia tomorrow.

      Breaking news: rain is forecast for Sydney tomorrow.

  45. gbaikie says:

    This new model reveals a variety of interesting topographic features, as shown in the animation above, including the highest and lowest points on the planet. The highest elevation on Mercury is at 2.78 miles (4.48 kilometers) above Mercurys average elevation, located just south of the
    equator in some of Mercurys oldest terrain. The lowest elevation, at 3.34 miles (5.38 kilometers) below Mercurys average, is found on the floor of Rachmaninoff basin, an intriguing double-ring impact basin suspected to host some of the most recent volcanic deposits on the planet.
    https://www.nasa.gov/feature/first-global-topographic-model-of-mercury

    So you at highest point on Mercury which near the equator, and going to dump endless amounts water until such time as there is ocean leaving this highest
    point not submerged. So it’s going to have a beach.

    How much atmospheric pressure will the endless amount of water create.
    The amount of water would be say the flow rate of the Mississippi and it will be near lukewarm [30 C].
    Some of this water will escape from the planet, but not much. If one imagines a huge amount leaving the planet, the evaporation of water from the Planet would freeze the Planet.
    And I don’t care at this point, how much leaves
    the planet in a million years. I have not fiqured out how many years it will take to make the ocean, and I assume it will be less than 1 million years.

    So when start dumping all this water, it will freeze until such time as the atmosphere pressure increases.
    This point should around time Mercury has around the pressure of Mars. Which has 25 trillion tons of CO2, so when
    Planet, Mercury has around 20 trillion tonnes of water vapor in it’s atmosphere, the 30 C water will boil, but will stop boiling when it’s around 5 C.

    So two things will cause there to be liquid water on Mercury, vast amount liquid water being dumped and the blazing sunlight.

    To get 1/2 atm of water vapor, one needs the sun to heat the water to 80 C.
    Or at 7 psi water boils at 80.4 C.
    Or in region where there is sunlight and water is boiling, one should have planetary atmospheric pressure of about 1/2 atm- though would have higher pressure in region
    in sunlight region.

    Mississippi flow rate is 16,792 cubic meter per second. 1.45 billion cubic meter per day or 1.45 billion tonnes per day. Or decades to get near Mars 25 trillion tonnes.
    Or centuries but not thousands of years.

    Now, in terms of something vaguely practical, one could have something like a space elevator [sort of] which drops water on Mercury, and like hydro-dam uses the water’s gravitational energy to make electrical power.
    But at a Mississippi flow rate, it’s vast amount of electrical energy. Or hydro-dam has about 100 meter drop, and this would be thousands of km of drop.
    Or if simply wanted an ocean on Mercury, probably just impact it with space rocks- and just use solar power for any electrical power needs.
    Of course there may not be any need in any future to have Mercury have global ocean [maybe just a few lakes or something].

    But this about climate stuff, which is about vastly silly stuff, and the question is were Mercury naturally have lot’s of water, would be in the habitable zone- could earth like microbial life evolve. Of course if microbial life evolved on a planet, it could be very nasty place for humans to live- so, we keeping to the general theme of silliness.

    Oh, another thing about habitable zones, what rate of impactors would be upper limit to being habitable? Is Earth anywhere near perfect in this regard for life?
    Would less be better? More be better? One advantage of more, could be more political support for space exploration.
    Or certainly less worry about rising sea levels.

    • dr No says:

      Is English your second language?

      • gbaikie says:

        I speak only one language, and it’s fortunate for me that it happens to be the international language.
        Some effort has been involved with instructing me in French and Spanish but it seem to have been mostly for naught.

        • David Appell says:

          Clearly your interest is in space.

          But much of what you write have almost nothing to do with climate change.

          Maybe you should seek a better forum.

          • gbaikie says:

            I think habitable zones are related to understanding Earth’s climate.
            I think if put ocean on Mars or Mercury, anyone who understands climate should be able to know the climate effects of doing that.

            Or said differently, anyone who doesn’t understand the effect of Earth ocean on climate, has no understanding of Earth’s climate.

          • David Appell says:

            HZs aren’t related to understanding manmade climate change.

            You are barking up the wrong tree.

          • David Appell says:

            gbaikie says:
            “I think if put ocean on Mars or Mercury, anyone who understands climate should be able to know the climate effects of doing that.”

            If put???

            Such questions are irrelevant to the subject of manmade climate change. They may be interesting, but they contribute nothing here.

          • g*e*r*a*n says:

            gbaikiie, Davie only likes pseudoscience, not actual science. So, if he wants you to go away, you must be doing a GREAT job!

          • Bindidon says:

            Maybe you should seek a better forum.

            This is a sentence I politely invite you, Mr Appell, to restrict to your worldwide recognised Quark Soup.

            There you are after all the Chief Operating Officer. Enjoy it!

          • dr No says:

            gbakie’s unintelligible scribblings do, indeed, indicate his knowledge of science has been gleaned from reading comic books.

          • gbaikie says:

            -*-dr No says:
            July 29, 2017 at 7:12 PM

            gbakies unintelligible scribblings do, indeed, indicate his knowledge of science has been gleaned from reading comic books.—
            Superman staying on Earth is rather lame.

  46. barry says:

    GMSL (Global Mean Sea Level)

    Modern estimates, particularly the sat record, measure mean sea level as a proxy for volume. This allows for changes in the ocean basins that affect mean sea level. The crustal rebound from the last glaciation 20,000 years ago has slowly enlarged the ocean basins, while coastal land has subsided or elevated in response, depending on location. Nearly all satellite sea level records factor the overall change in the shape of the ocean basins for sea level estimates.

    Geologically stable tide gauge locations are used to calibrate satellite readings. Vertical land movement for less stable locations can then be inferred for particular locations from satellite data.

    ENSO fluctuations lead short-term global sea level fluctuations. While el Nino temporarily raises sea level globally, the opposite is seen in some regions (depressed sea level in the South Western Pacific).

    The tide gauge record is near-continuous for modern gauges. Satellites read the same location once every 10 days.

    Satellite altimetry estimates the distance between the altimeter and the sea surface. A single reading only gets the chop, wave effects or instantaneous tide reading, but multiple readings over time average out these effects. Accuracy of 1-2 cm for a single reading after accounting for tides and atmospheric pressure. Multiple readings reduce that to 4-5 mm, and long-term readings reduce trend uncertainty to about about 0.4 mm.

    As with the satellite temperature records, there are challenges with short life of satellites requiring stitching together the record from different satellites, which requires calibration and modeling of satellite drift and decay.

    Global tide gauge and satellite sea level records match well, although that agreement is influenced in (very) small part by intercalibration.

    • Bindidon says:

      What about citing yourt sources, barry? Your are after all certainly not the origin of all this interesting info!

    • Bindidon says:

      As an example: where did you find an info concerning intercalibration between tide gauge and satellite altimetry measurements?

      I only know of intercalibration among
      – different satellites;
      – different satellite altimetry techniques (e.g. SAR vs. traditional radar).

    • barry says:

      I can’t remember most of them. This is gleaned from all the reading I’ve done over the last 10 years and a bit of googling prior to hitting the button to check a few things (be glad if anyone corrected anything).

      I realized that we keep having these discussions and almost never have a solid background to them. At best we get it piecemeal during arguments. If I remember, I’ll try to post stuff like this (if I know a bit about it) on each topic. Others could, too. Might as well learn stuff while we’re punching each other.

    • Gordon Robertson says:

      barry…”Multiple readings reduce that to 4-5 mm, and long-term readings reduce trend uncertainty to about about 0.4 mm”.

      You mean trend ‘guessing’ don’t you? Sounds like yet another model projection to me.

      The oceans are far too vast and dynamic to be measured to within a few millimetres given the scant number of tidal gauges, with sats taking readings every 10 days. People doing these studies need to get over themselves.

      • barry says:

        It’s averaging. Law of large numbers etc. Mathematically valid, not ‘guessing’, and commonplace in scientific analysis. Every global data set applies such techniques to improve accuracy when there’s a lack of instrumental precision. Including the satellite temp records.

        Sounds like yet another model projection to me.

        A projection is a forecast based on an assumed scenario. This is about observations.

        People doing these studies need to get over themselves.

        Ignoramuses need to get over their superiority complex.

        • Massimo PORZIO says:

          Hi barry,
          “Its averaging. Law of large numbers etc. Mathematically valid, not guessing, and commonplace in scientific analysis.”
          No, you miss the very first statement of your link which says:
          “In probability theory, the law of large numbers (LLN) is a theorem that describes the result of performing the same experiment a large number of times. According to the law, the average of the results obtained from a large number of trials should be close to the expected value, and will tend to become closer as more trials are performed.”

          Please point your attention to the detail of the source of the average: “the result of performing same experiment a large number of times”.
          You can’t apply that law to a bunch of different low resolution measurements and pretend to get it working in improving the resolution of the measurement.
          The LLN worked if and only if the dataset was made of multiple low resolution temperature measurements of the same place into a sufficiently close time to consider the temperature unchanged between the first and the last measurement.

          If your statement “Every global data set applies such techniques to improve accuracy when theres a lack of instrumental precision.” is true, then all those datasets didn’t improve the final resolution.

          BTW the LLN (when correctly applied) improves the resolution (that is the precision) not the accuracy of the measurements.

          https://en.wikipedia.org/wiki/Accuracy_and_precision

          Have a great day

          Massimo

        • Gordon Robertson says:

          barry…”Its averaging. Law of large numbers etc. Mathematically valid, not guessing, and commonplace in scientific analysis”.

          The application of statistical analysis to something as dynamic and variable as the ocean is nothing more than mathematical bs. Statistics has it’s place but that place is not averaging tidal gauges and satellite data taken every 10 days then claiming a result to within millimetres.

          Statistical averaging is far more valuable if you manufacture batteries. You can take a test sample of 10 batteries and test them for failure. Then you take another sample, and another, and another….

          You can get a pretty good guess as to your quality control by applying statistical analysis to that data.

          The problem with statistics is that you can never prove it. You can get a confidence level that your batteries are 95% good then you can draw 5 batteries at random and have them all test bad. It’s not likely, but it happens.

          When someone applies statistical analysis to data gathered from the ocean, you can believe it if you want. I don’t.

        • Gordon Robertson says:

          barry…”A projection is a forecast based on an assumed scenario. This is about observations”.

          No one has observed the entire ocean level or come anywhere near it. I mean, how would you even begin to observe it? You measure one spot and it measures a certain height then a second later it’s a different height.

          I am not talking about an average at one tidal gauge, I get that. I am talking about mid-ocean where levels are seriously chaotic.

          If the waves were symmetrical and flowed like sine waves you might have a chance.

          The ocean is so dynamic that it’s level varies by feet in places. There are currents, like rivers, crossing waves, and the tidal forces from the Sun and Moon overlap to produce different tidal levels dependent on the position of each.

          There are also waves that build over thousands of miles in the Southern Pacific Ocean where there is no land to interfere. They are not regular waves, their altitudes vary all the time, up to 100 feet.

          You could tell by tidal marks on seawalls if the SLR was dramatic. I live near the ocean and have been hearing about catastrophic SLR for years. I am seeing no evidence of it, however.

          I live near a major river delta that has dikes to keep the water out. There is not the least concern shown by our civic governments regarding the height of the dikes, where in certain tidal conditions and floods the water gets near the top. They state that in their reports. SLR is not an issue.

          Why do people keep talking about it as if it’s imminent?

          There has been no average warming for 18 years, there is no significant ice melt in regions that could affect SLR, why are we still talking about this?

        • barry says:

          Massimo,

          You cant apply that law to a bunch of different low resolution measurements and pretend to get it working in improving the resolution of the measurement.

          That’s true but nonsensical regarding the point. You’ve flipped the point with that statement. Large numbers of measurements cannot, of course, improve the accuracy of a single measurement. It is the large number of measurements averaged that improves the estimate of the property being measured.

          There are numerous examples. Here’s one of my favourites, comparing measurements of star-brightness done by human eye with professional photometric data.

          One human being taking a few thousand measurements of fluctuating star brightness by eye gets a close match to hi-tech instrumentation, with resolution two orders of magnitude greater than his measuring instrument – his eyeball. That is the power of large numbers.

          Verification of altimetry sea level estimates is comprehensive, including comparison with tide gauges, the ARGO array and GRACE mission.

        • barry says:

          satellite data taken every 10 days

          Measurements are continuous. You have to do something about your ignorance. I’ve given up. You might want to re-read what I wrote about what happens every 10 days.

  47. UK Ian brown says:

    I must be missing something. in the UK the models change the data changes the predictions change.the climate in the UK refuses to conform.pretty much the same as when I was a boy.very annoying

    • Bindidon says:

      Be lucky to live in a country so stable wrt climate! In Germany things are well changing (in 50 years climate moved here from rather “continental” to rather “atlantic”).

      I guess we both wouldn’t appreciate much to live these days in Canada’s Northern Territories, for example…

      • UK Ian brown says:

        No people prefer a warm climate.cold kills

      • Gordon Robertson says:

        bindidon…”In Germany things are well changing (in 50 years climate moved here from rather continental to rather atlantic)”.

        Sound like political propaganda from Angela Merkel.

        How does the German climate change when the IPCC has announced no average warming 1998 – 2012 and UAH has extended that to 18 years?

        • Bindidon says:

          Typical Robertson nonsense blah blah.

          You don’t even read comments before answering them.

          Where did I mention any warming in my comment?

          Robertson, you behave so ridiculous, so silly all the time that I’ll soon believe you’re permanently drunk.

          • Gordon Robertson says:

            bindidon…”Where did I mention any warming in my comment?”

            You mentioned climate change, how does climate change without warming or cooling? This climate change tomfoolery is based on global warming theory. Because the alarmists could not see significant warming they changed their focus to climate change which means absolutely nothing.

            There is no global climate as suggested by ‘climate change’. Climates are an aggregation of micro-climates and there are thousands of them at least. There are probably several micro-climates within Germany itself so your statement about changing from a a continental climate to an atlantic climate is nothing more than gibberish.

          • Bindidon says:

            Robertson: please manage to read my comment again instead of producing your silly nonsense.

            I wrote

            …in 50 years climate moved here from rather continental to rather atlantic.

            This, Robertson, has NOTHING to do with your stubborn polemic.

            It was no more than a slight hint of the fact that, within 50 years, the average weather especially in Eastern Germany changed from cold winter / warm summer into a yearly mix of all seasons, with – yes yes – an unprecedented increase of western winds which sometimes lets you think Berlin moved toward the Belgian coast.

            But manifestly you aren’t intelligent enough to understand even such simple thoughts.

            So feel free to avoid commenting what I write at Roy Spencer’s site, if you can’t manage to stop writing garbage.

        • Snape says:

          Gordon

          “Speaking of anomalies if you look at UAH lower troposphere v6.0, establish decadal breakpoints, and then take the mean for that decade, you see this little trend:
          1970s Mean : -0.284583 (1978 & 1979)
          1980s Mean : -0.142167
          1990s Mean : 0.00125
          2000s Mean : 0.10425
          2010s Mean : 0.223583 (through May 2017)”

          (Repost of a comment by Greven)

        • g*e*r*a*n says:

          Bin asks: “Where did I mention any warming in my comment?”

          Well Bin, if you are seeing “climate change”, but there is no warming, then is the planet getting colder?

  48. Bindidon says:

    A few days ago I discovered by accident:

    https://www.geosci-model-dev.net/9/4521/2016/

    Ice Sheet Model Intercomparison Project (ISMIP6) contribution to CMIP6

    published in 2016 by Sophie M. J. Nowicki & al.

    It is always interesting to read at the beginning of a paper’s intro something like ‘Ice sheets constitute the largest and most uncertain potential source of future sea-level rise’.

    This is, in these times of 360 degree exaggeration we actually experience, a source of motivation to continue reading.

    And indeed the intro is full of info valuable for laypersons like me, by giving precious information about the various consequences of ice sheet loss (some I didn’t even imagine).

    But… I was searching for the comparison of observations of sea level rise (with the expansion component subtracted of course) and ice sheet loss, and not for how to integrate the latter into CMIP6 models.

    Thus anyone having read papers concentrating on observations is kindly invited to give me links to them. Papers avoiding the blind-alley of overfocusing on AGW and the like are clearly a bit more welcome than others.

    • g*e*r*a*n says:

      And any SLR “paper” that does not include the natural mass contributions to oceans is obviously only good to catch the droppings in bird cages.

      • Bindidon says:

        As long as you do not present any valuable data showing or paper explaining the natural mass contributions to oceans, your comments themselves will remain no more than droppings in bird cages.

        If you can’t manage to present either, I assume that they do not exist.

        • dr No says:

          “natural mass contributions”
          ha ha ha!
          Lets have some fun with this.
          3mm per year observed SLR
          area of ocean 360 million square kilometres
          I make that about 10**12 cubic meters in total water equivalent per year

          Modern erosion rates are about 20000 cubic km per million years,
          or about 2×10**9×10**5/10**6 cubic meters per year – 18×10**8 cubic meters per year
          i.e. not enough to explain the observed SLR

          So where does this “natural mass” come from?
          Maybe it is generated within the oceans – by somehow extracting mass out of the atmosphere. e,g, forming corals, micro organisms, and skeletal remains which accumulate on the ocean floor? Surely this must be relatively constant over time (about 3mm per year).
          If not, why would it accelerate? Maybe global warming? – there, you have the answer.

        • g*e*r*a*n says:

          Bin, if you want to ignore river deltas, sand storms, sea floor lava vents, underwater volcanoes, cosmic dust, etc., go for it.

          Just don’t get mad if you get laughed at.

          • barry says:

            There’s another complication. We take a lot of fish out of the sea every year…

          • Bindidon says:

            g*e*r*a*n on July 29, 2017 at 7:37 PM

            … if you want to ignore river deltas, sand storms, sea floor lava vents, underwater volcanoes, cosmic dust, etc., go for it.

            But I don’t want to ignore all that.

            The problem here, g*e*r*a*n, is that you manifestly can’t manage to produce either relevant data or papers quantifying all that, so we could put it here in relation with the other factors (land ice melting, steric elevation due to OHC and salinity changes etc).

            As long as you solely mention these possibly important factors without quantifying them, the discussion can’t continue in a meaningful way.

            Please let me give you a little example.

            The amount of sand / dust transferred westwards from Africa’s deserts down to the Atlantic Ocean is estimated at some 100 millions of tons per year (I’ll manage to find the source again).

            But the satellite altimetry data over Greenland tells us about a loss of some billions of tons per year.

            So to reach the same level of magnitude, you have to present more data… I have no idea where to obtain it.

          • g*e*r*a*n says:

            Bin, that is NOT how the scientific method works. Alarmists are claiming the seas are rising. They claim the rise is accelerating. They claim the acceleration is due to mankind burning fossil fuels and releasing CO2 into the atmosphere.

            I claim all “warming” and SLR, if it is even happening, is natural. It’s called the “null hypothesis”. In the scientific method, it is the duty of Alarmists to PROVE their “theory”. Until their “theory” is proved, the null hypothesis holds.

            Alarmists do not follow the scientific method. Their “belief” is all the “proof” they need. “Alarmism”, “Warmism”, and “Lukewarmism” all fall in the category of “cultism”.

          • Bindidon says:

            Null hypothesis! The very last refugium for people lacking data and / or arguments.

            Sorry g*e*r*a*n, that’s a bit too simple, too trivial. I notice: you have neither data nor a fortiori arguments to publish right here, right now.

            As usual: put up – or shut up. End of discussion as far as I’m concerned. I know: you’ll want to have the last word. Feel free!

          • g*e*r*a*n says:

            The “last word” means nothing. What I like is documentation that pseudoscience types disregard the scientific method, facts, and logic.

          • gbaikie says:

            –Alarmists do not follow the scientific method. Their belief is all the proof they need. Alarmism, Warmism, and Lukewarmism all fall in the category of cultism.–

            I am lukewarmer in same sense as I am a libertarian.
            I would put myself in such a category AND if I do one those tests of political views, I end up there.
            It seems that broadly speaking, lukewarmers don’t agree with each other, but there a few things they agree about [but I don’t agree about some of this- for instance, I think most lukewarmer accept that the greenhouse effect theory has something to do with science. And I think it’s definitely pseudo science.
            There may be things about the greenhouse effect theory which vaguely correct, sort of. But the greenhouse effect theory is useless for any scientific use, and should not be called a “theory”. The only thing correct about it, is that a planet at earth distance should be around 5 C in terms of it’s average temperature. And Earth present average temperature is about 5 C. Or currently [in last few million years] Earth is in an icebox climate and an icebox climate is about 5 C.

            What I agree with lukewarmers is that within a few centuries Earth may get as much as 3 C warmer and some warming may be due to CO2. Also I think most lukewarmers don’t accept that warming effect of CO2 in terms causing warming earth as much as 3 C, has been proven.

          • gbaikie says:

            Btw about 5 C is more accurate than about 5.3 C.
            One aspect of pseudo science is without greenhouse gases Earth would be -17 to -18 C and greenhouse gases add 33 K.
            This is stupid/foolish/deceitful in a number of ways.
            In simplest way to illustrate this, there is no basis for estimating the precision of about -17 to 18 C.
            And is proven by their stated uncertainty of how much various greenhouse gas add towards their number of 33 K.

            But a more interesting aspect, is one I brought before, which none of believers know what a world of -17 to -18 C should look like.

        • barry says:

          Don’t forget to count bird droppings for sea level rise.

          • Snape says:

            Don’t dismiss cosmic dust, Barry. It makes a mess of my driveway when I forget to sweep.

          • barry says:

            Theres another complication. We take a lot of fish out of the sea every year…

          • Snape says:

            Lol!

          • dr No says:

            LOL!
            Don’t forget we also extract oil and gas from the ocean basins.

          • barry says:

            At any given moment there may be millions of people in the sea. As population has exploded over the last century, there is more tonnage of human flesh polluting the record. And have you ever urinated in the sea? C’mon, people – think!

          • dr No says:

            Lol again
            Yes, all those people swimming and splashing!
            What about all those ships and boats ? They must displace quite a volume of water too!

          • g*e*r*a*n says:

            I’m glad to see such silliness from the kiddos. It means they are healthy and happy. When they try to act all “sciency” is when they get so cranky.

          • barry says:

            We like to have grown-up conversations, too, child. Sometimes we forget you’re only little.

          • g*e*r*a*n says:

            Well, here’s some “grown up” facts for you barry.

            The Earth is covered by water. Less than 30% of Earth’s surface has land mass high enough to be above sea level. If all mass, above sea level, were moved into the depths of ocean basins, sea level would be more than a mile (1.6 km) ABOVE the submerged “land”.

          • barry says:

            Have you been on the computer again?

    • Gordon Robertson says:

      bindidon…”by giving precious information about the various consequences of ice sheet loss (some I didnt even imagine)”.

      Not clear what you mean by ice sheet loss. Are you referring to the entire continent of Antarctica, the glaciers to the ocean, or the toes of the glaciers that emerge over the oceans as ice sheets?

      All you need to know comes from polar expert Duncan Wingham, who is a global warming alarmist. He declared in a radio interview that it’s far too cold in Antarctica for glaciers to melt. He was referring to the allegations that glaciers are shrinking in Antarctica to which he added that lowered precipitation will do that.

      All the nonsense about Antarctic warming is about a small area on the Antarctic Peninsula closer to South America than the Antarctic continent.

      • Bindidon says:

        Typical Robertson nonsense blah blah.

        Are you too lazy to read at least the introduction in

        https://www.geosci-model-dev.net/9/4521/2016/

        or is it more convenient for you simply to pretend that all therein is by definition wrong?

        Read papers, Robertson, instead of writing inane nonsense all the time!

        • g*e*r*a*n says:

          Bin, I hope you have a lot of bird cages.

          “…relies on CMIP6 climate models…”
          “…coupled ice-sheetclimate models…”
          “…as well as standalone ice-sheet models.”
          “…multi-model ensemble…”
          “…ice-sheet models…”

          And, that’s just the abstract!

        • Gordon Robertson says:

          bindidon…”Are you too lazy to read at least the introduction in
          https://www.geosci-model-dev.net/9/4521/2016/

          A model….ha, hahhahahahhahahahahahahahahahahaha

          Get serious!!

          Why don’t you head down to Antarctica right now and test the real temps? If you survive, which is highly unlikely, you’ll find it’s -67C at the South Pole.

          Are you from this planet?

          • Bindidon says:

            Robertson: read the end of my comment again:

            But I was searching for the comparison of observations of sea level rise (with the expansion component subtracted of course) and ice sheet loss, and not for how to integrate the latter into CMIP6 models.

            Thus anyone having read papers concentrating on observations is kindly invited to give me links to them.

            Papers avoiding the blind-alley of overfocusing on AGW and the like are clearly a bit more welcome than others.

          • Bindidon says:

            Why don’t you try to obtain real information about temperatures, Robertson?

            http://models.weatherbell.com/climate/ncep_cfsr_t2m_anom_ytd.png

      • dr No says:

        The more and more data that comes in demonstrating global warming the fewer and fewer places the skeptics have to hide.
        It is quite possible that Antarctica will remain cold while everywhere else heats up – I suggest all you skeptics migrate there.

        • g*e*r*a*n says:

          Drano admits Antarctic is not warming.

          At least he is starting to get it.

        • barry says:

          Antarctica – the last refuge for skeptics.

          Actually, Antarctica has warmed according to UAHv6. But the Antarctic oceans have cooled. So that would be the last refuge for ‘skeptics’.

        • Gordon Robertson says:

          dr no…”It is quite possible that Antarctica will remain cold while everywhere else heats up I suggest all you skeptics migrate there”.

          Where’s this heat to which you refer? The IPCC shows no average global warming 1998 – 2012 and UAH 1998 – 2015. That’s 18 years.

          Why do you alarmists keep talking about heat that is not there?

          You are surely not going to cite NOAA and GISS are you, both fudge artists? Both of them rate the warmest years based on confidence levels that are reduced to such an extent they show record warming.

          You might ask the obvious question, why do they need confidence levels in the first place? Both use climate models to reconstruct temperature data based on a smattering of real data. Their projections are statistically-based guesses, hence the need for a confidence level.

          • dr No says:

            Yet you are so confident that there was no trend.
            C’mon!
            You cannot have it both ways.

          • dr No says:

            “June 2017 was characterized by warmer to much-warmer-than-average conditions across much of the world’s land and ocean surface. The most notable warm temperature departure from average were present across much of central Asia, western and central Europe, and the southwestern contiguous U.S. where temperature departures from average were 2.0C (3.6F) or greater. Record warmth was observed across parts of the northern and southern Atlantic Ocean, specifically near the U.S. eastern coast, the African west coast and the southern South America east coast, central Asia and scattered across parts of Africa, western Europe, the Middle East, Brazil, and western Indian Ocean. .. No land or ocean areas had record cold June temperatures.”
            Time for you to head to Antarctica

          • dr No says:

            I repeat:

            “No land or ocean areas had record cold June temperatures.

            Amazing goal for the warmists !

          • Bindidon says:

            NOAA? GISS? Why?

            Weatherbell made by Ryan N. Maue!

            http://models.weatherbell.com/climate/ncep_cfsr_t2m_anom_ytd.png

          • barry says:

            Ryan Maue uses NOAA data. See the graph you linked, Bindidon? Where it says NCEP CFSv2?

            http://www.cpc.ncep.noaa.gov/products/CFSv2/CFSv2_body.html

          • g*e*r*a*n says:

            Drano claims: “No land or ocean areas had record cold June temperatures.”

            Drano, NOAA reports 1752 record cold readings for June 2017, just in the U.S. alone.

          • Bindidon says:

            Barry, you didn’t understand me.

            I’m talking about this:

            http://tinyurl.com/hglcz3g

            That Dr Maue uses NOAA data when using

            http://cfs.ncep.noaa.gov/

            is evident but is imho another point when “talking” to somewhat stubborn skeptics…

          • barry says:

            Still don’t get you… is Maue a favourite with skeptics or something?

          • barry says:

            No land or ocean areas had record cold June temperatures

            Sure there were. There always are. You’d be on firmer footing saying the were more record-breaking hot days than cold. That’s been the case for at least the last 14 years.

          • lewis says:

            Barry,
            Why would he be on firmer footing? Is his information wrong or do you prefer that he cite information more to your liking?

          • barry says:

            His information is wrong, as I said. He wants to make some point about warming, so he’s better off using the information I’ve provided, which is factual.

          • Norman says:

            g*e*r*a*n and dr. No both seem wrong with invalid conclusions not based upon any data and with a hope no one would actually look at evidence.

            Here is a source of record hot and cold temperatures.

            http://tinyurl.com/lqs6wcz

            If you put in record cold for US you get 16 returned results for record cold in US in June 2017. I do not know how g*e*r*a*n turns this into 1700 plus.

          • g*e*r*a*n says:

            Norm admits: “I do not know…”

            Yup Con-man, there are many things you do not know. And, most of what you “know” is WRONG.

            “…1,752 record cold daily high (974) and low (778) temperature records.”

            Hilarious.

          • dr No says:

            “No land or ocean areas had record cold June temperatures.

            Global climate Report June 2017 by NOAA

          • Norman says:

            g*e*r*a*n

            Okay, call me a con-man for asking you for actual evidence. That is how distorted your thought process has become. You think textbook science is pseudoscience, you think I am a con-man for using actual textbook physics, now you make a claim with a quote but you don’t provide any link to this source so we can see it for ourselves. Maybe you don’t know how to link to a webpage. My source claims there were just 16 low temperature records in June 2017 for the US of over 100,000 data points.

          • g*e*r*a*n says:

            Norm, there you go again, trying to con us. You know perfectly well why I call you “Con-man”. It is because you try to deceive folks. You have earned your nickname.

            You always say one thing, and then say the opposite later. Like now, you are wanting me to give you a link. But, you have stated that I don’t ever give out links. So, which is it?

            “The energy does not leave the system, but the energy leaves the system.” Which is it?

            (Hilarious.)

          • Norman says:

            g*e*r*a*n

            Your pattern of behavior is redundant. I ask you for a link and you go off on an unrelated tangent to cover you ignorance. You do it all the time.

            So I intentionally deceive people by linking to textbooks on heat transfer and use the material verbatim to prove points?

            I have seen you post a few unrelated links. On the issue of SLR you post Archimedes Principle. The scientists know about the other effects contributing to sea level rise but they are not significant contributors. You have been shown this with links and mathematical arguments but you persist in your ignorance acting like “but what about this?” People clearly explain in detail the other effects but you are incapable of understanding the debate.

            You really are not a very bright person. You just don’t have a mirror to see how ignorant you really are.

            So provide a link to your source of the 1700 plus cold records in US for June 2017 or just plainly shut up! Your stupidity does not contribute positively to this conversation but wastes endless amounts of time having people try to convince you of your own ignorance (one can never show another how little they really know, especially when they have this false sense that they really do know it).

          • g*e*r*a*n says:

            (Norm is at his funniest when he is ranting incoherently.)

          • Gordon Robertson says:

            dr no…”Global climate Report June 2017 by NOAA…”

            NOAA is corrupt.

          • Norman says:

            g*e*r*a*n

            To make this simple. What is your proof of your statement that in the US there were over 1700 cold records set in the the month of June 2017?

            Will or will not a link appear? I strongly suspect no supporting link will be given by “fake” g*e*r*a*n.

          • barry says:

            US – During June there were 4,343 record warm daily high (1,848) and low (2,494) temperature records, which was nearly 2.5 times the 1,752 record cold daily high (974) and low (778) temperature records.

            http://tinyurl.com/ycgbu6mu

            778 coldest temps ever in locations across the US (record daily low readings).

            1848 warmest temps ever in locations across the US (record daily high readings).

            June 2017 was characterized by warmer to much-warmer-than-average conditions across much of the world’s land and ocean surface. The most notable warm temperature departure from average were present across much of central Asia, western and central Europe, and the southwestern contiguous U.S. where temperature departures from average were 2.0C (3.6F) or greater. Record warmth was observed across parts of the northern and southern Atlantic Ocean, specifically near the U.S. eastern coast, the African west coast and the southern South America east coast, central Asia and scattered across parts of Africa, western Europe, the Middle East, Brazil, and western Indian Ocean. Meanwhile, near to cooler-than-average conditions were observed across eastern Scandinavia, western Russia and parts of Russia’s Far East, western Canada, eastern Alaska, the southeastern U.S., Australia, and across parts of southern Asia and Antarctica. Across the oceans, the northern Atlantic Ocean had the most notable cool temperature departure from average, with temperatures 0.5C to 1.0C (0.9F to 1.8F) below the 19812010 average. No land or ocean areas had record cold June temperatures.

            http://tinyurl.com/ybl5op8y

            This global report from the same institute (what Dr No quoted) is for larger areas of land than towns and cities.

            g*e*r*a*n and Dr No are both right, but looking at different metrics.

            Guys, always provide links. It’s not just netiquette, it prevents misunderstandings that can lead to useless back and forths like the above. No one should have to do this for you.

            (If your link doesn’t post, convert it to tinyurl as I did. They will always work, except if the tinyurl contains the letters D and C adjacent – if that happens, just do the conversion again until you get one without that spam-filter sequence in the url. Here’s the link to easily convert for future reference – http://tinyurl.com/)

          • g*e*r*a*n says:

            barry contributes: “g*e*r*a*n and Dr No are both right, but looking at different metrics.”

            Thanks barry for your effort. That makes Norm WRONG, again!

            I wasn’t going to give him the link because it only took me about 60 seconds to find it, just searched on “2017 cold records”. Norm thinks he is a “researcher”. He usually finds a link that doesn’t even fit the discussion. Once he found a link to a temperature study in a boiler firebox, and thought CO2 at 3000F had some significance to the atmosphere! The poor guy is a “climate clown”. He’s hilarious.

          • Norman says:

            g*e*r*a*n

            barry does your work for you. That does not excuse your laziness in not posting a link. Your claim is bogus.

            YOU: “I wasnt going to give him the link because it only took me about 60 seconds to find it, just searched on 2017 cold records. Norm thinks he is a researcher. He usually finds a link that doesnt even fit the discussion. Once he found a link to a temperature study in a boiler firebox, and thought CO2 at 3000F had some significance to the atmosphere! The poor guy is a climate clown. Hes hilarious.”

            If you make a claim you should be the one supporting it with the link you found to make the claim. And you are still completely wrong about my link to the hot CO2. I did explain it to you in depth but then you can’t understand it and call the long explanations rambling.

            I will point out again, since you falsely are bringing up incorrect information (the dishonesty in you never has a limit). You made a claim that hot gas would not absorb IR and I pulled up this link to show you that you were wrong and hot CO2 is still quite able to absorb IR. As it gets hotter the emissivity goes down and so would the absorbitivity, as more molecules are at excited energy levels.

          • g*e*r*a*n says:

            Just one more rambling, erratic, bumbling rant from the hilarious con-man.

          • Svante says:

            Thank you for stopping after just one g*e*r*a*n.

          • barry says:

            Somebody please hide his keys.

        • UK Ian brown says:

          Come to the UK global warming has past us by changing the subject a little quote fro Churchill.the truth is incontrovertible. malice may attack it ignorance may deride it but in the end there it is

  49. barry says:

    Light breeze forecast for Patagonia.

    https://www.yr.no/place/Argentina/Other/Patagonia/

  50. ren says:

    The temperature of the North Pole begins to fall.
    http://pics.tinypic.pl/i/00921/lfj6n4blk7xt.png

    • barry says:

      Sea ice is a poor proxy for surface temps in the Arctic – sea ice minimum occurs in September, 3 months after the peak of summer. The slight sea ice gain you’re seeing in that graphic is mostly due to ice compaction. Central Arctic sea ice will decline a bit over the next 2-months, then grow again through October to maximum sometimes around March.

      On average, surface air temps at the North Pole start to fall about now, and they’ve been a bit below average recently.

      http://ocean.dmi.dk/arctic/meant80n.uk.php

        • Gordon Robertson says:

          ren…”Not necessarily.
          http://ocean.dmi.dk/arctic/plots/meanTarchive/meanT_2017.png

          ERA40 is a model based re-analysis of historical temperature data. There is absolutely no reason to re-analyze historical temperature unless you are an alarmist bent on making the past appear warmer than it was.

          Re-writing historical data is the height of arrogance and ignorance. Scientific misconduct at it’s worst.

          You can bet the temperatures have been inflated grossly. Even at that, the temperatures for 100 days of the year between 1958 and 2002 barely exceed 0C. That was the warmest it got in whatever region is being measured.

        • barry says:

          Blah blah smear accuse blah blah.

          The 1998-2012 ‘pause’ comment you always come up with is based on global surface temperature data you think is fraudulent. It’s disingenuous to refer to data you think has no credibility to make a positive claim of any kind.

          Either the data is good and there was a slowdown (‘pause’) in temps, or the data is bad and the ‘pause’ is invalid as a result. Having it both ways is cynical, opportunistic, and dishonest.

      • barry says:

        Ren, I just linked to that exact same graph, and it corroborates exactly what I said re air temps at the North Pole:

        barry : On average, surface air temps at the North Pole start to fall about now, and theyve been a bit below average recently.

        I follow Arctic sea ice. It’s a poor proxy for surface air temperatures – it lags surface air temps by 2-3 months.

      • barry says:

        Here is a plot of Central Arctic sea ice extent from 2006 to present. [PLOT]

        First thing to understand is that these are plots of sea ice extent, not area. Extent is measured (by most monitoring groups) as ocean surface with more than 15% sea ice coverage.

        As you can see, most years Central Arctic sea ice declines up to about mid-September, when sea ice minimum occurs for the whole Arctic. You can see the large spikes in the two years of lowest extent – 2007 and 2012. On the very right of the graph, the last few months, you can see the decline starting, with a slight bump up in the last week or so. This is quite normal. Decline is not steady – especially when measuring extent.

        Extent is affected short-term (days/weeks) by winds, which push the sea ice around the Arctic, sometimes spreading it out, sometimes compacting it. Extent is measured as areas with greater than 15% ice cover. If the ice is spread out by winds, there can easily be more coverage with 15% sea ice – even if total sea ice area is less. If winds compact the ice during the re-freeze as the Arctic gets seasonally colder, you can get short-term drops in extent even if the total area of ice is larger.

        For various reasons, Arctic sea ice extent is a poor proxy for air surface temperatures over the same period.

        I’ve looked at Central Arctic sea ice extent data in detail. It goes up and down day to day, but is lower in extent in September than in March. Tracking changes over a few days or weeks can easily give a false impression as to both seasonal variation and long-term change.

  51. Even now with global temperatures today +.4c or so it is still far short of what AGW is calling for.

    Still within a climatic regime with no break up what so ever on the upside in sight.

    The climate is in no way unique, at least not as of today as AGW enthusiast keep trying to say otherwise despite all of the data which continues to show otherwise.

    And if my call is correct and global temperatures by next summer are at or below 30 year means I wonder what the AGW crowd will be saying?

    GLOBAL OCEAN TEMPERATURES +.301 C AS OF TODAY.

    Not that warm although above normal.

  52. dr No says:

    And in news just in:
    “The winter weather record has tumbled as Sydney experienced its warmest July day on record with the temperature topping 26 degrees at Observatory Hill.

    Scarves were traded for shorts as the mercury rose throughout the day, reaching 26.5 degrees at 2:10pm, creeping above the previous record of 25.9 degrees set on July 24, 1990.”

    http://www.smh.com.au/nsw/july-weather-record-tumbles-as-temperature-tops-26-degrees-20170729-gxljw8.html

  53. Bindidon says:

    For those who are interested in some stat concerning the Antarctic: here is a list of the 50 least monthly absolute values measured at GHCN stations there since 1903, with the station name aside:

    01 | 1987 | 8 | -75,30 | VOSTOK
    02 | 1983 | 7 | -73,80 | VOSTOK
    03 | 1978 | 8 | -73,60 | VOSTOK
    04 | 1975 | 8 | -73,10 | VOSTOK
    05 | 1967 | 8 | -73,00 | VOSTOK
    06 | 1997 | 7 | -72,80 | VOSTOK
    07 | 1979 | 7 | -72,40 | VOSTOK
    08 | 1982 | 8 | -72,40 | VOSTOK
    09 | 1998 | 9 | -71,90 | VOSTOK
    10 | 1958 | 8 | -71,80 | VOSTOK
    11 | 2016 | 7 | -71,70 | VOSTOK
    12 | 1968 | 9 | -71,50 | VOSTOK
    13 | 1973 | 8 | -71,50 | VOSTOK
    14 | 1997 | 8 | -71,50 | VOSTOK
    15 | 2002 | 8 | -71,50 | VOSTOK
    16 | 1966 | 8 | -71,40 | VOSTOK
    17 | 1982 | 9 | -71,30 | VOSTOK
    18 | 1968 | 7 | -71,20 | VOSTOK
    19 | 1977 | 9 | -71,20 | VOSTOK
    20 | 1960 | 8 | -70,90 | VOSTOK
    21 | 1976 | 5 | -70,90 | VOSTOK
    22 | 1993 | 7 | -70,90 | VOSTOK
    23 | 2010 | 8 | -70,90 | VOSTOK
    24 | 2012 | 8 | -70,90 | VOSTOK
    25 | 1993 | 8 | -70,70 | VOSTOK
    26 | 2016 | 6 | -70,70 | VOSTOK
    27 | 1960 | 6 | -70,60 | VOSTOK
    28 | 1984 | 6 | -70,60 | VOSTOK
    29 | 1986 | 6 | -70,50 | VOSTOK
    30 | 2008 | 6 | -70,50 | VOSTOK
    31 | 2015 | 5 | -70,40 | VOSTOK
    32 | 1999 | 5 | -70,30 | VOSTOK
    33 | 1970 | 8 | -70,20 | VOSTOK
    34 | 1968 | 8 | -70,10 | VOSTOK
    35 | 2015 | 8 | -70,10 | VOSTOK
    36 | 1964 | 9 | -70,00 | VOSTOK
    37 | 1975 | 9 | -70,00 | VOSTOK
    38 | 2012 | 9 | -70,00 | VOSTOK
    39 | 2008 | 8 | -69,90 | VOSTOK
    40 | 1969 | 9 | -69,80 | VOSTOK
    41 | 1999 | 7 | -69,80 | VOSTOK
    42 | 2012 | 7 | -69,80 | VOSTOK
    43 | 1959 | 8 | -69,60 | VOSTOK
    44 | 1969 | 8 | -69,50 | VOSTOK
    45 | 1975 | 7 | -69,50 | VOSTOK
    46 | 1979 | 6 | -69,50 | VOSTOK
    47 | 1981 | 5 | -69,50 | VOSTOK
    48 | 1990 | 8 | -69,50 | VOSTOK
    49 | 2017 | 6 | -69,50 | VOSTOK
    50 | 1964 | 4 | -69,40 | VOSTOK

    Yes: ‘station’ without an ‘s’ at the end, because Nr 2, AMUNDSEN-SCOTT, first appears at position… 129.

    VOSTOK is one of the coldest points on Earth.

    One might suppose that, lying exactly at the South Pole, AMUNDSEN-SCOTT should have been cooler. No Sah.

    In the Arctic as well, the exact North Pole is good a bit warmer than the coldest stations in Eastern Siberia: VERHOYANSK, OMJAKON and JAKUTSK.

    • barry says:

      Did a bit of googling to figure out why. First thing to note – it is at a higher altitude than geographic South Pole.

      Amundsen Scott elevation: 2835 meters
      Vostok elevation: 3488 meters

      Atmospheric temperature lapse rate is 6.5 C per km altitude (variable):
      Average temperature difference: 4.2 C

      But annual average temps are not exactly 4.2C, and there is more monthly variability between them. Geographic location WRT marine weather probably plays a part, as well as topography channeling wind.

  54. Bindidon says:

    In my comment published on July 30, 2017 at 8:39 AM, I presented a list of the 50 least monthly absolute values measured at GHCN stations there since 1903.

    Let us now look at the 50 least anomaly values wrt the UAH temperature baseline, i.e. wrt the 12 monthly means for the period 1981-2010:

    01 | 2003 | 2 | -61.84 | VOSTOK
    02 | 1987 | 8 | -56.38 | VOSTOK
    03 | 2016 | 11 | -55.44 | VOSTOK
    04 | 1964 | 4 | -54.89 | VOSTOK
    05 | 1976 | 5 | -54.68 | VOSTOK
    06 | 1978 | 8 | -54.68 | VOSTOK
    07 | 1983 | 7 | -54.51 | VOSTOK
    08 | 1998 | 9 | -54.38 | VOSTOK
    09 | 1975 | 8 | -54.18 | VOSTOK
    10 | 2015 | 5 | -54.18 | VOSTOK
    11 | 1967 | 8 | -54.08 | VOSTOK
    12 | 1999 | 5 | -54.08 | VOSTOK
    13 | 1974 | 4 | -53.99 | VOSTOK
    14 | 1968 | 9 | -53.98 | VOSTOK
    15 | 1982 | 9 | -53.78 | VOSTOK
    16 | 1977 | 9 | -53.68 | VOSTOK
    17 | 1982 | 3 | -53.58 | VOSTOK
    18 | 1997 | 7 | -53.51 | VOSTOK
    19 | 1982 | 8 | -53.48 | VOSTOK
    20 | 1981 | 5 | -53.28 | VOSTOK
    21 | 1979 | 7 | -53.11 | VOSTOK
    22 | 1960 | 4 | -53.09 | VOSTOK
    23 | 2009 | 4 | -53.09 | VOSTOK
    24 | 2016 | 6 | -53.02 | VOSTOK
    25 | 2010 | 4 | -52.99 | VOSTOK
    26 | 1979 | 5 | -52.98 | VOSTOK
    27 | 1960 | 6 | -52.92 | VOSTOK
    28 | 1984 | 6 | -52.92 | VOSTOK
    29 | 1958 | 8 | -52.88 | VOSTOK
    30 | 1986 | 6 | -52.82 | VOSTOK
    31 | 2008 | 6 | -52.82 | VOSTOK
    32 | 2017 | 4 | -52.79 | VOSTOK
    33 | 1989 | 5 | -52.78 | VOSTOK
    34 | 1995 | 5 | -52.78 | VOSTOK
    35 | 1964 | 5 | -52.58 | VOSTOK
    36 | 1973 | 8 | -52.58 | VOSTOK
    37 | 1997 | 8 | -52.58 | VOSTOK
    38 | 2002 | 8 | -52.58 | VOSTOK
    39 | 1964 | 9 | -52.48 | VOSTOK
    40 | 1966 | 8 | -52.48 | VOSTOK
    41 | 1975 | 9 | -52.48 | VOSTOK
    42 | 2012 | 9 | -52.48 | VOSTOK
    43 | 2016 | 7 | -52.41 | VOSTOK
    44 | 1977 | 4 | -52.39 | VOSTOK
    45 | 1967 | 5 | -52.38 | VOSTOK
    46 | 1966 | 4 | -52.29 | VOSTOK
    47 | 1969 | 9 | -52.28 | VOSTOK
    48 | 1981 | 4 | -52.19 | VOSTOK
    49 | 1986 | 4 | -52.19 | VOSTOK
    50 | 1960 | 8 | -51.98 | VOSTOK

    You might ask: ‘What did change here? 50 times VOSTOK as in the preceeding list!’.

    But… here and there you’ll see the one or the other difference. Draw your own conclusions!

    • barry says:

      Monthly anomalies remove the annual cycle (seasonal differences). So now we are seeing the lowest anomalies compared to the monthly average instead of all time.

      Are these the lowest anomalies of all weather stations, or just Vostok?

      • Bindidon says:

        Are these the lowest anomalies of all weather stations, or just Vostok?

        …values measured at GHCN stations there since 1903!
        Should have been evident from the context above…

      • Bindidon says:

        Why do feel the need to explain everything a posteriori, barry schwarz? Are you a retired teacher?

      • barry says:

        A working teacher, actually.

        Draw your own conclusions!

        Forgive me for seeing this as an invitation.

        I followed up on your first comment on Vostok because I was curious.

        I still don’t know if the anomalies are all time worldwide GHCN lows, or just the lowest for Vostok. Your text, and your answer, wasn’t clear.

        “values measured at GHCN stations there since 1903!”

        Stations, plural. But, “there” gives me to think you mean either Vostok only, or the Antarctic in general.

        I’m just curious, looking for clarity, not trying to make a point.

      • barry says:

        Bindidon, I enjoy your contribution here. I’m not always arguing, sometimes I like to examine what people say for my own curiosity and post the results, as I’ve done here. Your own curiosity and investigation leads you to do the same, hence your posts on Vostok. No harm done.

      • Bindidon says:

        barry, it was rather my bad here, apologies for unnecessarily ‘overreacting’.

        Moreover, my comment couldn’t have been worde, I mixed two datasets and used a wrong baseline (anomalies of -60 C are pure nonsense). That I should have checked before sending the comment.

        Out of that there were of course no conclusions to draw!

      • barry says:

        I mixed two datasets and used a wrong baseline (anomalies of -60 C are pure nonsense). That I should have checked before sending the comment.

        People who admit mistakes are trustworthy. Those anomalies did look rather large!

        I should probably at some stage find out how to download individual station data from GHCN.

        • Bindidon says:

          1. Download and unzip GHCN V3 monthly (here: adjusted)
          http://tinyurl.com/y7v27t5e

          Therein you find data (the file ending in .dat) and metadata (the file ending in .’inv’)

          2. Select station line(s) out of the metadata file into a file

          3. Each line begins with the stations’ GHCN id and contains lots of data (latitude, longitude etc).

          4. Select all data lines out of the data file beginning with this/these GHCN id(s) into a file

          5. Each line contains 12 months of (absolute) temperature readings

          Everybody has his own tool preferences. An example among so many:

          https://www.nu42.com/2015/11/ghcn-climate-files.html

        • barry says:

          Thank you very much.

  55. gbaikie says:

    My post of “July 28, 2017 at 1:29 PM” is still in moderation.
    It was too long and and had too many links, as far as a reasonable guess of why it’s there.
    It’s been a while, since I had a post in moderation- and I wasn’t sure the blog did that sort of thing, anymore. Or it posted or didn’t post rather “will think about it”.

    • Bindidon says:

      I’m sure your post didn’t have too many links.

      Put all of them into
      http://tinyurl.com/create.php?url=about%3Ablank
      and I guess everything will go well.

    • Gordon Robertson says:

      gbaikie…”It was too long and and had too many links, as far as a reasonable guess of why its there”.

      It’s more likely you used a word WordPress does not like. For example, Had-crut without the hyphen is rejected.

      If you have a long post, it is better to break it into smaller chunks. Post the first to see if it goes through. If not, troubleshoot it to find the offending word or link, then post the next chunk as a reply to your first chunk.

      It’s also possible one of your links is rejected. I had one rejected and had to add a hyphen to a name in the URL then instruct viewers to remove the hyphen then copy/paste it into the URL bar.

      I don’t think it has anything to do with moderation by Roy.

      • gbaikie says:

        hmm
        …And why tropical ocean can only reach about 35 C
        So start with googling it:
        The new global datasets show that clouds typically cover more than 60 percent of the planet, some 10 percent more than had been thought. Oceans are significantly cloudier than continents. Roughly 67 percent of the sky over water is cloudy, and more than half of that area is densely overcast. Just about half of the total land area is usually covered with clouds and only 15 percent is thickly blanketed. Conversely, almost a third of the continental surface, but only 8 percent of the ocean surface, is unbroken blue sky.
        https://www.giss.nasa.gov/research/briefs/rossow_01/distrib.html

        So does the amount of clouds in tropics a reason for reaching only about 35 C. I think the answer is, no.
        Less clouds [or no clouds] would increase the amount of energy the ocean absorbs. Though clear skies allow ocean surface to reach highest temperatures [about 35 C] but isnt something would cause to become much hotter.

        Another:
        This high heat capacity is the primary reason the ocean is so important in the world climate system. Unlike the land and atmosphere, the ocean stores large amounts of
        heat energy it receives from the sun. This heat
        is carried by ocean currents, exporting or
        importing heat to various regions. Approximately 90% of the anthropogenic heating associated with global climate change is stored in the oceans, because water is such an effective heat reservoir.
        http://pordlabs.ucsd.edu/ltalley/sio210/DPO/TALLEY_9780750645522_chapter3.pdf
        Anyways I didnt read the whole thing, though probably doing so would good idea. I would say [or agree] the ocean is the only place anthropogenic heating could stored is in the ocean. And if stored, one might see that effect in terms of acceleration sea level rise.
        I dont think we are seeing acceleration sea level rise, though I also would concede that measuring such anthropogenic heating is difficult.
        Anyways anything else of search: The BBC of all places:
        Humans have to maintain a core body temperature of 37 C. To ensure that we can always cool off, we keep our skin at around 35 C. This implies that a wet-bulb temperature of 35 C or above, if it was sustained for more than a few hours, would be fatal. Even if we could survive it, we would have to sit still.
        Even in the most sweltering tropical rainforests, the maximum wet-bulb temperatures recorded have never exceeded 31 C. This is because hot and humid air is unstable. It rises and cooler air sweeps in beneath, which is what causes tropical thunderstorms.

        But that could change.
        [So here comes the answer]:
        Air can only rise if the air around it is cooler and denser. So if climate change heats up the tropics, the air will have to be even hotter and more humid before it starts to rise. A study published in 2010 estimated that, with each 1 C rise in average global temperature, the maximum wet-bulb temperature will rise by 0.75 C.

        That leads to some intimidating conclusions. A 7 C rise in global temperatures, which we might well hit by 2200, will render some parts of the globe inhospitable to human life. A 12 C rise in temperature would render half of the Earths land area uninhabitable.
        http://www.bbc.com/earth/story/20151130-how-hot-could-the-earth-get

        Now, there is lots to say about this BBC kooky.
        One thing is its somehow reassuring that the the self proclaimed British elite seems to keeping their long tradition of being quite mad.
        But the other thing is it does related to the topic of the google search.
        Another thing is that Earth has been 7 C warmer. During our icebox climate, probably not. Or if we ever got average temperature of 22 C, I would say we are no longer in an icebox climate. Or the oceans should no longer be cold and not have ice caps.
        But whether Earth has ever been 27 C is more questionable, or tend to think an average global temperature of 25 C as about as hot as Earth has ever got.

        Another aspect is related to land area Even in the most sweltering tropical rainforests, the maximum wet-bulb temperatures recorded have never exceeded 31 C.
        Land area can get hotter and could have higher wet-bulb temperatures, what is relevant is the tropical ocean.
        What is the maximum wet-bulb temperature ever recorded in the tropical ocean [80% of the tropics].

        • gbaikie says:

          And try other part:

          So google it:
          http://www.purdue.edu/newsroom/research/2010/100504HuberLimits.html
          Is where BBC got the kooky:
          Although areas of the world regularly see temperatures above 100 degrees, really high wet-bulb temperatures are rare, Huber said. This is because the hottest areas normally have low humidity, like the dry heat referred to in Arizona. and:
          These temperatures havent been seen during the existence of hominids, but they did occur about 50 million years ago, and it is a legitimate possibility that the Earth could see such temperatures again, Huber said.
          Sure, if we werent in an icebox climate. Or seeing it again in next 1000 or 10,000 years is not likely.
          And:
          http://petergardner.info/2017/01/wet-bulb-temperatures-and-an-uninhabitable-earth/
          But no mention of ocean surface, yet.
          Wiki:
          At the 500 hPa level, the air temperature averages −7 C (18 F) within the tropics, but air in the tropics is normally dry at this height, giving the air room to wet-bulb, or cool as it moistens, to a more favorable temperature that can then support convection.

          Ah, I see, so I guess in general, this is all related to the mythical hotspot which no one has found any evidence of.
          Change it to maximum wet-bulb temperature tropical islands
          Try Maui, so Aug and high is 75.1 F [24 C] {Average Wet Bulb Summary]
          http://www.dwayneyamato.com/wx/wxwetbulbsummary.php
          So I am done beating this dead horse.
          What wanted to get to was habitable zone of planet with a ocean.
          Or Venus lacks ocean and not habitable at its rocky surface- if had an ocean, would be habitable at its rocky surface. Mars lack ocean and not habitable because lack air pressure and an ocean. If Mars had an ocean it would be habitable for life. Though animals [mostly land animals] need more atmosphere- or ocean alone wouldnt provide enough atmospheric air pressure [its too far from the sun].
          Which makes me wonder at what distance from the sun would an ocean alone provide say 1/2 atm of air pressure [or assuming one had enough oxygen to breath, one could breath.

          • gbaikie says:

            That worked. I omitted a link to a post on this thread- maybe that was problem.
            Or it worked cause cut it in half- or something.

          • barry says:

            gbakie,

            Convert links that don’t post to tiny urls.

            http://tinyurl.com/

            As long as the tinyurl link does not have the letters D and C adjacent to each other in that order (the spam filter rejects that sequence), those links will always work. If tinyurl gives you a link with that sequence in it, simply convert again for a new one that doesn’t.

            The reason Had-cru and NSID*C in a post prevents it being admitted is precisely the same – both have D and C adjacent to each other.

            Haven’t figured out why ‘a.b.s.o.r.p.t.i.o.n’ snares a post in the filter, but the reason D C together is rejected is because a commenter who used to post got banned – those are his initials, and one of his sock-puppets.

  56. Massimo PORZIO says:

    Hi Barry,
    No you can’t get an improved resolution average using different measutements rounded to the system resolution because any measurement collected has an unknown offset respect the resolution rounding.
    For example imagine to get 10 midnight temperature vwith a resolution of one C, 5 measurement at 25.3C and 5 at 27.6C. The true average is 26.45. But the measurement system rounded to the upper C reported 5 measutements to be 26 C and 5 to be 28C, the average computed is 27C. in this case the error is just 0.55C but it is unpredictable in the range 0 to 1C so you get a meaningless decimal value.
    I used values rounded to the upper integer because AFIK that’the way temperature datasets are rounded to remain compatible with older datasets which were limited to that resolution.
    BTW Your star example works because in that case you want get the average of the intensity value removing the uncertainties of the light path attenuation not to improves the radiometer resolution.
    The resolution remain the same.

    Have a greatt day.
    Massimo

    • barry says:

      1) 10 measurements? Do you get better averaged precision with 100 measurements, the same, or worse?

      2) And remember, it is the trend that matters to us, so if the offset is relatively constant, it won’t matter to the trend.

      • Massimo PORZIO says:

        Hi Barry
        1) I used just 10 samples to do it easy to understand, but sadly it seems it didn’t work. If the error is systematic but non constant (as per rounding the data to a discretized value) an averaging process never reduces the error. Under-resolution is a systematic non constant error, it’s not cleared by averaging.

        2) It’s not an offset. If they rounded any single measurement to the upper C then the resulting averaged value could be offset from the real averaged temperature by a value that can be from 0 to +0.9999. This is valid for any averaged value, so the trend itself has an uncertainty that could be almost 1C. That “averaged” global temperature of 1C rounded temps data, when used to evaluate trends below 1C is useless.

        The resulted averaged temperature is the true one with an uncertainty of 1C independently of how much measurements you get. A border case is when the real temperature offset to the closest integer is 0.1C. Even doing billions of measurements rounded to the upper C and averaging them, the resulted averaged temperature is always 0.9*C higher than the real averaged temperature.

        Averaging the measurements of many 1*C resolution thermometers clears only their calibration uncertainty, never increases their precision, even if they are all measuring the very same temperature at the same point and at the same time.

        Have a great day.

        Massimo

      • barry says:

        If the error is systematic but non constant

        Can you name some real-life examples for altimetry sea level data?

        I can think of satellite drift/decay, but these are corrected for. Not perfectly, of course, but the uncertainty is reduced.

        But the measurement system rounded to the upper C reported…

        Have you asked yourself if these examples actually happen? And if you have, what have you then done to find out?

        • Massimo PORZIO says:

          Hi Barry,
          This is the last time I lose my precious time with you because I’m an electronic designer and I’m busy with my own work.

          “Can you name some real-life examples for altimetry sea level data?”
          No, but can you show me where exists a satellite which has a millimetric resolution for the altitude measurement of a chaotic fluid below as the seawater it is?

          Have a great day.

          Massimo

        • barry says:

          Sorry, Masimo, it’s seems like you don’t know much about ‘systematic errors’ in altimetric sea level data, yet that’s the basis for your criticism.

          No, but can you show me where exists a satellite which has a millimetric resolution for the altitude measurement of a chaotic fluid below as the seawater it is?

          And now we’re back to square one. Resolution for a single measurement is 2-4 cm, as I’ve stated on this thread. That was the launch point for our chat about the law of large numbers, where you argued against it’s validity due to supposed systematic errors in the data – that you know nothing about.

          I agree, this has been a waste of time, but no hard feelings. Be well.

    • barry says:

      BTW Your star example works because in that case you want get the average of the intensity value removing the uncertainties of the light path attenuation not to improve the radiometer resolution.

      Again, this is beside the point. Multiple averages can’t improve altimetric resolution, but provide a better estimate.

      As n approaches infinity, the estimate gets closer to the actual value. That’s the case.

      In the case of altimeter readings, there are half a million measurements every 24 hours. Satellites easily pick out the seasonal variation, for example, and to fine approximation. And much more processing is undertaken to get better estimates.

      Massimo, could you describe, please, all the processes that are undertaken to improve sea level estimates? And thus give what you think are the true uncertainties – numerically.

      • Massimo PORZIO says:

        Hi Barry,
        “Again, this is beside the point. Multiple averages cant improve altimetric resolution, but provide a better estimate.”

        Yes, but you are always measuring the very same parameter using the measuring tool with the required precision needed.

        “could you describe, please, all the processes that are undertaken to improve sea level estimates? And thus give what you think are the true uncertainties numerically.”

        No barry, that’s not my professional field and I’m not particularly interested to know that, but let me have some doubts when someone claims millimeters resolution for global altimetric differential measurements made at different times in different places, when the measured fluid below has waves high up to tens meters.

        Statistic is the dark side of mathematics, citing Dr. Spencer “torturing data until it confessess”.

        Have a great day.

        Massimo

      • barry says:

        Doubts are fine. But they have no weight as positive statements if you don’t investigate what you’re doubting. “I can’t believe,” is the simple fallacy of argument from incredulity.

        Averaging sea level data: It’s similar to the roll-of-a die example. In this case we know the expected mean value (3.5), and the more rolls you average, the closer to that expected value you get. The ‘resolution’ is anywhere between 1 and 6, but after many trials the average will always be closer to 3.5 than 1 or 6.

        If you take half a million measurements of sea level a day, the average is always going to be closer to the mean value than any one estimate. After 10 days you’ve covered most of the globe with 5 million measurements. After a month you have 15 million measurements.

        And averaging is just one part of the processing the data go through to reduce the uncertainty.

        • Massimo PORZIO says:

          Hi Barry,
          “Doubts are fine. But they have no weight as positive statements if you dont investigate what youre doubting. I cant believe, is the simple fallacy of argument from incredulity.”
          Not true, I’ve doubt because I don’t fully know the argument, you know the answer, you give me it and I evaluate if you answer suffices for convincing me.
          “Averaging sea level data: Its similar to the roll-of-a die example. In this case we know the expected mean value (3.5), and the more rolls you average, the closer to that expected value you get. The resolution is anywhere between 1 and 6, but after many trials the average will always be closer to 3.5 than 1 or 6.”

          Very bad example, because with a dice you know before that the dice is an absolute random number generator. So you don’t need to roll the dice billion times to get 3.5 as average.
          Here you are trying to establish how much the dice rolling average number changes when you attach a very little weight (the CO2 increase) on one face of the dice (the surface temperature or the sea level as you prefer).
          The resolution of the dice is too little to establish that value, you never get that average number indeed. No matter the times you roll it.

          Have a great day.

          Massimo

        • barry says:

          The resolution of the dice is too little to establish that value, you never get that average number indeed. No matter the times you roll it.

          It seems we are not communicating very well. I never said, nor would I, that a large enough sample gives absolute precision. That’s silly. It’s a matter of indisputable fact, mathematically proven, that the larger sample produces an average closer to the expected value. You must know this.

          I only know some of the methods used to refine altimetric sea level estimates. I wouldn’t presume to know better than the experts, nor to mislead you by providing a subset as if it was all of the processes. It looks like you don’t have the time to investigate the matter, anyway.

          CO2 has nothing to do with our discussion. But we’re not getting anywhere, so let’s try again another day. May your work be productive and fruitful.

          • Massimo PORZIO says:

            Hi barry,
            this is in reply to the other message above too.

            “Its a matter of indisputable fact, mathematically proven, that the larger sample produces an average closer to the expected value.”
            Not true, or better (in case of under resolution), since you can’t establish how much is the average close to the true value then the uncertainty is always equal to the original resolution of the samples.
            Note that I used “true” instead of “expected” because in a measurement you should never “expect” a value, you should get it as close as possible to the absolute real value.

            Our problem is here:
            “I only know some of the methods used to refine altimetric sea level estimates.”
            If one doesn’t know for sure the effects of the underlying dynamics of the system, a measurement should never be an estimate.
            That resolution of 2-4cm can’t be made better by magical statistics.

            “May your work be productive and fruitful.”

            Yes as always it is, my customers don’t pay me if it didn’t.
            ; – )

            Have a great day.

            Massimo

  57. Gordon Robertson says:

    Help!!!!!!!!!! We’re having a heat wave in Vancouver, Canada. I have just been down to the water and I do believe the SLR has risen a millimetre.

    Should I sell my home which is a mere half mile from the water?

    Bindidon…note spelling of Canadian millimetre….it’s millimeter in the US. Oddly it’s millimetre in France with a little thingy over the middle ‘e’. In Italy and Spain it’s millimetro.

    Wonder what it is in Australia? Heck, in Germany it’s millimeter. Wonder what the Yanks and Germans have in common in that capacity?

    • Snape says:

      Gordon

      You’re complaining? I’m on vacation in Bellingham and the weather is wonderful! Taking a hike in North Cascade’s tomorrow.

    • dr No says:

      My god!
      “Environment Canada says temperatures will soar into the high 30s Monday to Thursday for the Fraser Valley, Howe Sound, Whistler and inland Vancouver Island.

      On Sunday it issued a special weather statement for multiple regions of B.C.’s South Coast warning about the hot weather on its way.

      “Daily temperatures [records] from Tuesday to Thursday will probably be broken in many communities,” said the statement. ”

      Gordon, get out of there!
      Quick!
      There is a boat heading for Antarctica – get on board!

  58. Massimo PORZIO says:

    Hi Barry,
    I reread my post above where I wrote:
    “This is the last time I lose my precious time with you because Im an electronic designer and Im busy with my own work.”

    I realized that it could be misunderstood, it could be interpreted as I was snobbing you (I don’t know who you are and surely I’m not entitled to teach you anything since this is not my field). I just write this message to apologize with you because in no ways snobbing you was my intention.
    It’s just that I write here during my office time-outs, Friday is the last working day before the next long summer holidays and I would like to end the current design for that day.

    Have a great day.

    Massimo

  59. I don’t know whether it’s just me or if everyone else experiencing issues with your site.
    It seems like some of the written text in your posts are running off the screen. Can someone else please comment and let me know if this is happening to them as well?
    This could be a problem with my browser because I’ve had this happen before.
    Kudos

Leave a Reply