Warming in the Tropics? Even the New RSS Satellite Dataset Says the Models are Wrong

July 14th, 2017 by Roy W. Spencer, Ph. D.

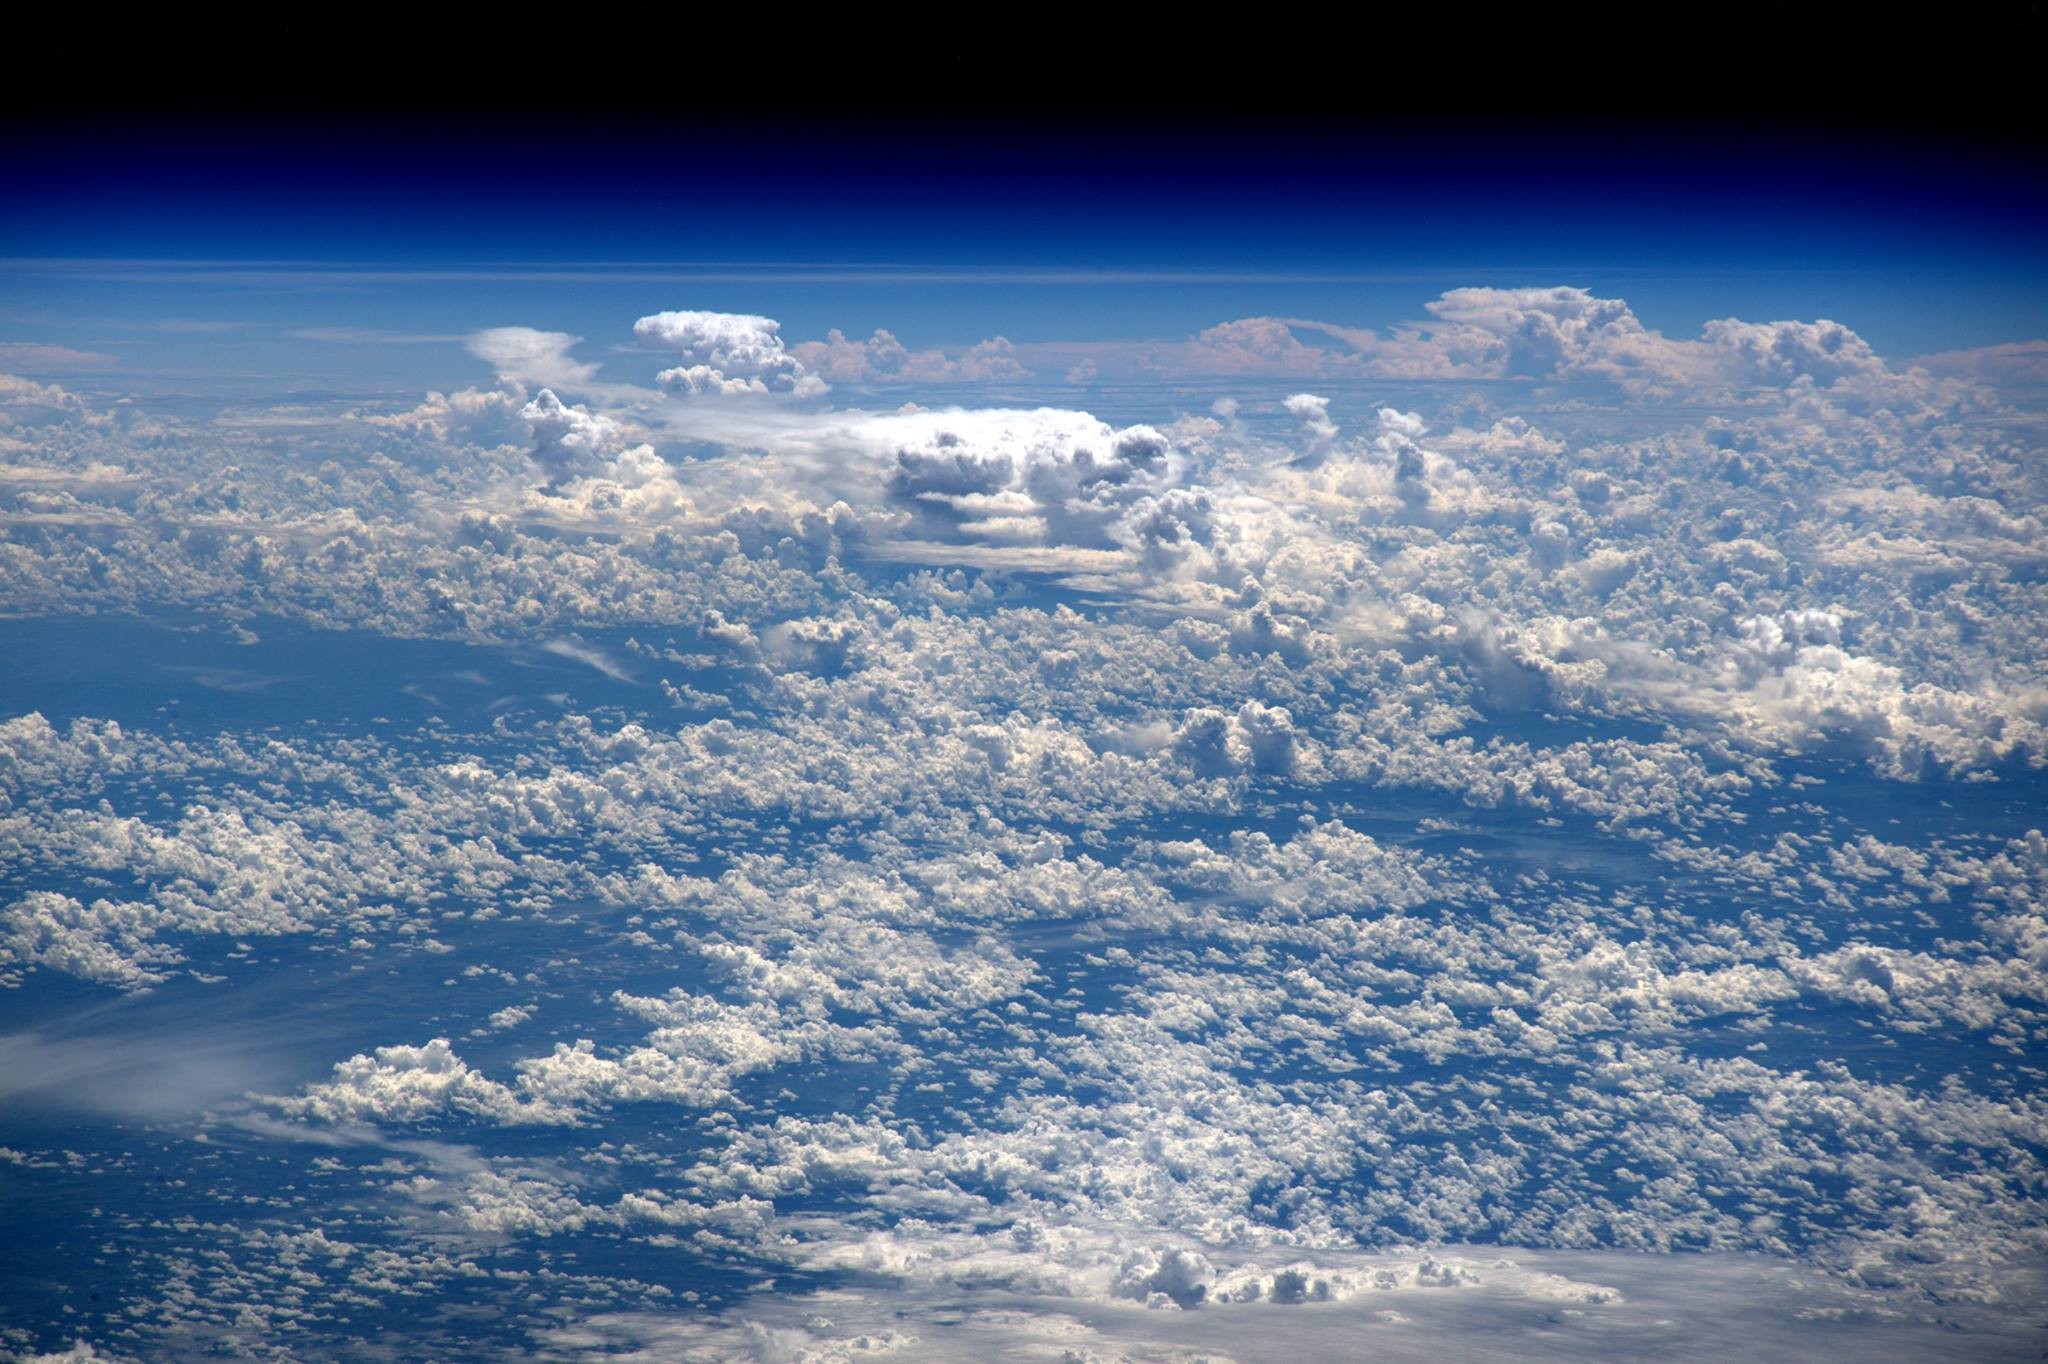
Tropical cloud systems seen from the International Space Station.

From recent media reports (e.g. the WaPo’s Capital Weather Gang) you would think that the new RSS satellite dataset for the lower troposphere (LT) has resolved the discrepancy between climate models and observations.

But the new LT dataset (Version 4, compared to Version 3.3) didn’t really change in the tropics. This can be seen in the following plot of a variety of observational datasets and the average of 102 CMIP5 climate model simulations.

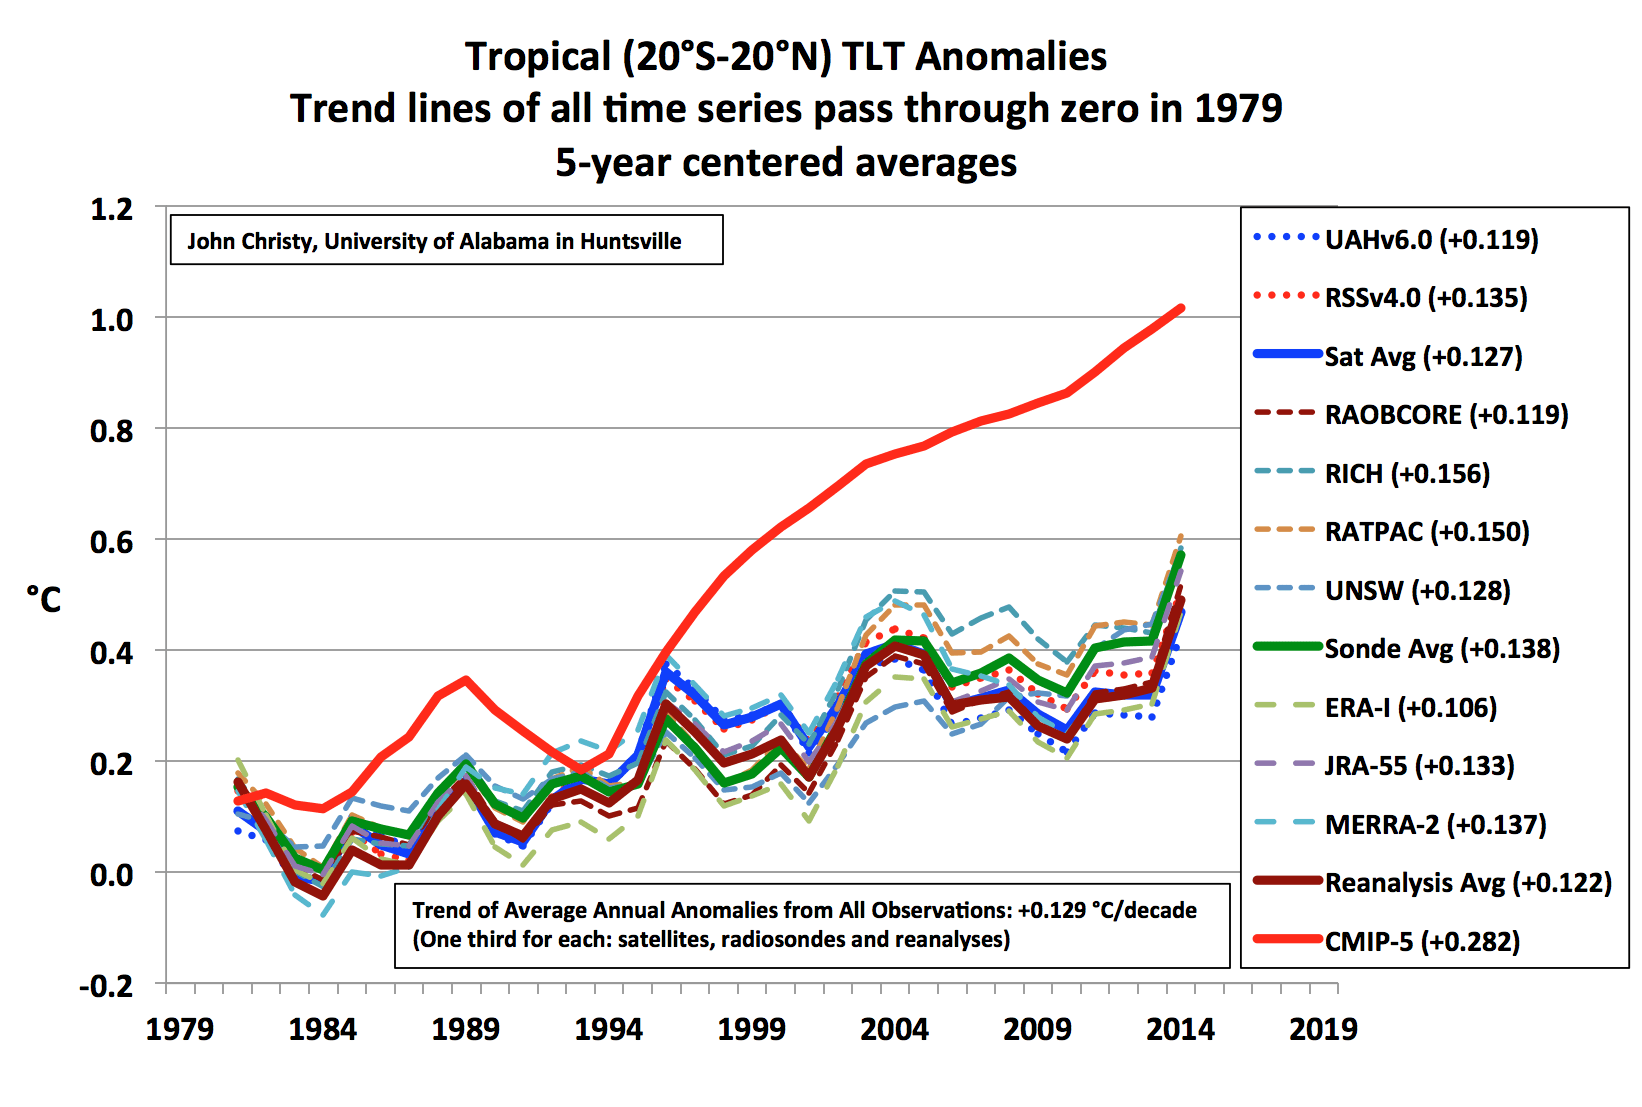
Comparison of 102 CMIP5 climate model runs (average of 32 groups) against various observations for tropical lower tropospheric temperature anomalies during 1979-2016. All yearly time series were vertically placed so that their linear trends all intersect at zero, which is the proper way to display them to compare how much warming has occurred over the entire time period. The results were then displayed as running 5 year averages.

It’s pretty clear that the models are producing too much atmospheric warming compared to satellites, radiosondes (weather balloons), and multi-observational atmospheric reanalyses. (And remember, the observations have a record warm El Nino at the end of the time series, which the model average does not. Without that, the discrepancy would be even larger).

For those who claim, But humans live at the surface, not up in the atmosphere, do those same people ignore the warming of the deep oceans, too? Or maybe they will claim, But most people don’t live in the tropics — do those people worry about Arctic sea ice melting? (The Arctic Ocean covers 2.8% of the Earth, while the tropical results in the above plot are for 35.5% of the Earth).

The fact is that how much warming is occurring in the troposphere (and in the deep oceans) tells us something about whether the climate models can be trusted. If their feedbacks are reasonably correct (which will determine how much global warming we should see in the future), the models should tell a reasonably consistent story in the atmosphere, in the ocean, at the surface, in the tropics, and outside the tropics.

Remember, the climate models are the basis for energy policy changes, and so their quantitative projections are central to the case that we must do something about our greenhouse gas emissions.


530 Responses to “Warming in the Tropics? Even the New RSS Satellite Dataset Says the Models are Wrong”

Toggle Trackbacks

  1. Ryan Shaffer says:

    Boy am I glad we withdrew from Paris!

    • Svante says:

      So we are heading for the edge of a cliff, but not as fast as CMIP-5.
      So we need the same policies, but not quite as urgently?

      • Mathius says:

        Edge of a cliff?

        Try living without using fossil fuels, you’ll be screaming to come back to your current lifestyle. The cure for the disease is far worse than the disease itself.

        • Svante says:

          We can not live without fossil fuels, but use it only when the benefit outweighs the cost *including* external effects.

          Rex Tillerson has reached a conclusion based on reality, just take his advice:
          https://www.youtube.com/watch?v=ilBFuVPQw48#t=28

          • Laura says:

            “Based on reality”. Amusing.

          • Svante says:

            OK, Laura you have a point!

            Perhaps I should have said science and risks?

            At Exxon he had an independent science team at his disposal, and his solution is based on economics.

            He explains here:
            https://www.youtube.com/watch?v=_s173XPqw8M

          • Laura says:

            Preaching to the choir, my friend, preaching to the choir.

          • Svante says:

            You are right, I’m just appealing to authority, and I have no proof.

            He could be part of the conspiracy, I just don’t think he had any reason or desire to say this to please the choir.

            The opposite message would have been much easier for both his old place of work and his new boss.

          • AaronS says:

            The Exxon brand and public opinion is more valuable than the science. There is little threat to fossil fuel industry from solar and wind or electric cars with lithium batteries. So they dont fight an unnecesary fight. Coal was the big looser- except for in countries like Netherlands and Germany where they are transitioning back to coal. Natural gas actually wins big from a global C tax. What people forget is major oil companies all experimented in alternatives before realizing they can not be scaled up and dont have the energy density need for industrialized society to function. Its not like they ha e not done the math… in industry they use numbers not emotions.

          • Svante says:

            Or did you mean us?

          • David Appell says:

            Aaron: loser, not looser.

            Amazed at how many people get this wrong.

          • AaronS says:

            Thanks. I am really bad at just posting and not pre reading.

          • Svante says:

            But you are right Aaron, natural gas made US emissions drop just like that: https://tinyurl.com/yde8b3om

            Other solutions may need more time, but the next decade will be a different story.

        • goldminor says:

          You are assuming that there is a disease which mankind needs to be concerned with. I think this is a case of mass hypochondria/delusion for those who believe that CO2 is the control knob for temperature on the Earth.

          • Svante says:

            Yes, I think Rex Tillerson is right in the video above.

            You can handle a problem in different ways:
            a) Pretend it doesn’t exist.
            b) Say it’s hopeless and do nothing.
            c) Solve it.

            Free markets and technology will do c) if you put a fair price on the risk.

          • gbaikie says:

            “Free markets and technology will do c) if you put a fair price on the risk.”

            You [or government] can’t put a fair price on risk. Markets have always put a fair price on risk.
            Markets have long track history of putting fair price on risk, government have had dreadful and unfair practice of putting a fair price on risks.
            Governments have always done the most damage to the poor, and continue to do so. Markets have always helped the poor, and continue to do so. The market aren’t “trying to help the poor”, rather they can’t fail to help the poor.
            Government trying to do market type approaches, also fail to create fairness or fair prices.
            Or socialism is precisely governments trying to to do market type approaches, and socialism has never worked as claimed to have worked. Socialism has long string of endless failure, Markets are batting 1000 in success.

            Government is capable of doing things to enable markets to work better, but they don’t do it- as it’s not “profitable” for politicians to do it.
            When need related to war, demands such things, then it’s done [proving that politician can do it, if they chose to do this].
            Many people who are utterly delusional, imagine the success related to govt and free markets, prove that if given enough control governments can do magic, that is obviously insane understanding of history.

          • Gordon Robertson says:

            svante…”You can handle a problem in different ways:
            a) Pretend it doesnt exist”.

            There’s no reason to pretend, it doesn’t exist. The IPCC was appointed by the UN to investigate anthropogenic warming and they admitted in 2012 that no average warming occurred during the 15 year period from 1998 – 2012. UAH has extended that to 18 years.

            Why are you still talking about problems?

          • Svante says:

            Gordon, CO2 forcing is weak but relentless.

            We just add and add, and it takes a million years to wash out completely.
            Other effects are stronger, but they don’t last.

            Short term: https://tinyurl.com/h8efgs5
            Long term: https://tinyurl.com/y8kyzwsk

          • g*e*r*a*n says:

            Svante says: “…CO2 forcing is weak but relentless.”

            No, CO2 forcing is zero and nonexistent.

          • Svante says:

            g*e*r*a*n says a), gbaike says b), and I say c)!

          • gbaikie says:

            Svante says:
            July 17, 2017 at 4:21 PM

            g*e*r*a*n says a), gbaike says b), and I say c)!

            I didn’t say it’s hopeless.
            Nuclear energy is obvious solution.
            Wind and solar are hopeless.
            How anyone could so stupid to think wind or solar
            could reduce CO2 emissions, is actually quite remarkable.
            Why do people want things which chop up birds?
            Why people who live in cloudy climate want to use solar power?
            Solar power in sunny areas is still a bad way to make electrical energy, but what makes people living in Seattle or Germany want to use solar power?

            Using solar power in space, is perfectly reasonable- a thousands of satellite have used solar energy. And they are not encouraged to use solar power by any government subsidy- because, it’s simply the best way to make electrical energy.

            Perhaps this strange compulsion, has nothing to do with wind or solar energy and has to do with getting money from a government

          • Svante says:

            I can agree to a lot of that, but look at the price trends in wind and solar, things are changing. There are new developments in nuclear too.

          • David Appell says:

            Gordon, I see you’re still pretending to be dense. That’s the same as lying.

          • David Appell says:

            g*e*r*a*n says:
            “No, CO2 forcing is zero and nonexistent.”

            So you think CO2 does not absorb infrared radiation?

            That’s utterly idiotic.

  2. Scott Scarborough says:

    Where people live does not seem to worry them. Most of them live in cities that are warmer than the countryside by as much as the projected warming to 2100, yet they don’t flee the cities. Obviously the direct application of heat to people is not what makes a difference. In fact, I don’t know what does.

  3. Kristian says:

    Spencer,

    Thanks.
    And not only this, but the new RSSv4 TLT dataset appears to be in complete dispute with that same version’s TMT and TTT products when it comes to the temperature evolution in the Arctic region (82.5-60N):
    https://okulaer.files.wordpress.com/2017/07/arktis-rssv4-a.png
    https://okulaer.files.wordpress.com/2017/07/arktis-rssv4-b.png

    Did something big happen in the lowermost parts of the Arctic troposphere at the transition between 1992 and 1993 that the TMT and TTT products for some reason didn’t catch? Something that all of a sudden raised the mean TLT level by 0.4K relative to the other two, with no systematic divergence to be seen either before OR after this shift?

    Is this something you could perhaps ask Mears/Wentz about? Or would you perhaps venture to provide an answer yourself?

    • Gordon Robertson says:

      Kristian…”Did something big happen in the lowermost parts of the Arctic troposphere at the transition between 1992 and 1993…”

      No…it appears RSS consulted with NOAA and re-adjusted based on fudged NOAA data.

  4. when the cornerstones of a theory are wrong in the case of AGW the failure of a lower tropospheric hotspot and the atmospheric circulation evolving into a more zonal flow due to deeper stratospheric cooling near the poles in relation to lower latitudes that theory is in serious trouble not to mention the lack of global warming as called for by this wrong theory.

    It is all going to come crashing down in the next few years as global temperatures fall.

    • Laura says:

      You’ve been saying this for quite a while. Why have temperatures failed to fall already? Just curious.

      • gbaikie says:

        Oceans are still warming.
        During most of interglacial period the oceans continue to warm, though there a number of periods in which the oceans cooled. the most recent period of ocean cooling was the Little Ice Age.
        We currently recovering from the Little Ice Age, this could continue for centuries, or it may not.
        During somewhere around ’70’s, the headlines were that we were heading for an ice age, obviously the news stories were wrong, but temperature did lower a bit, and more significant than compared to the recent “pause” in warming. But at neither time ocean did not cool or stop from continuing to warm. Maybe could call it slow down of ocean warming [but perhaps not].
        Global temperatures are always going up or down, but to continue rise, the ocean must be warming, or to continue to fall the ocean must be cooling.

      • Dan Pangburn says:

        Continued rising water vapor (which is a ghg). Water vapor (TPW) is increasing about three times that expected as feedback from rising temperature.

        • David Appell says:

          Prove it.

          • Dan Pangburn says:

            I already did prove it. The proof is in the section headed ‘Water vapor’in my analysis at http://globalclimatedrivers2.blogspot.com

          • gbaikie says:

            — Introduction
            The only way that energy can significantly leave earth is by thermal radiation. Only solid or liquid bodies and greenhouse gases (ghg) can absorb/emit in the wavelength range of terrestrial radiation. Non-ghg gases must transfer energy to ghg gases (or liquid or solid bodies) for this energy to be radiated.–
            The only way energy other than radiation, can leave earth is via evaporation of atmosphere [losing the atmosphere to space]
            which isn’t a significant loss of planetary energy.

            Only solid and liquids can actually absorb radiant energy and only liquids and solids can increase the kinetic energy of gases- if they are warmer than the gas. Or temperature of gas is average velocity of gas molecules squared times mass of gas molecules times 1/2 [of certain volume of gas]. Though gas molecule traveling at near speed of light are not warm unless they colliding with something at such speeds [then they would be very, very hot [smashing atoms apart and even creating energy via some kind of fusion process]].
            Gas can radiated, they can made to glow, but this isn’t warming atmospheric gases [not increasing their kinetic energy nor mass].

            –The word trend is used here for temperatures in two different contexts. To differentiate, α-trend is an approximation of the net of ocean surface temperature oscillations after averaging-out the year-to-year fluctuations in reported average global temperatures. The term β-trend applies to the slower average energy change of the planet which is associated with change to the average temperature of the bulk volume of the material (mostly ocean water) involved.–
            That is good way to look at it.
            Simpler version is ocean absorb heat, only oceans can absorb a significant amount of heat from the sun in terms our present condition of our planet.
            [[
            Or if land was cold and oceans were very warm, it would be different.
            [Average temperature of the surface ocean is quite warm, I mean the entire volume of ocean which quite cool and which has potential of being mixed and warmed- and is being mixed and is warming [very slowly] and was much warmer in the past].
            ]]
            — Some ocean cycles have been named according to the particular area of the oceans where they occur. Names such as PDO (Pacific Decadal Oscillation), ENSO (el Nino Southern Oscillation), and AMO (Atlantic Multi-decadal Oscillation) might be familiar. They report the temperature of the water near the surface. The average temperature of the bulk water that is participating in these oscillations cannot significantly change so quickly because of high thermal capacitance [1].

            This high thermal capacitance absolutely prohibits the rapid (year-to-year) AGT fluctuations which have been reported, from being a result of any credible forcing. According to one assessment [1], the time constant is about 5 years. A likely explanation for much of the reported year-to-year fluctuations is that they are stochastic phenomena in the over-all process that has been used to determine AGT. Volcanic activity is occasionally also a contributor. A simple calculation shows the standard deviation of the reported annual average measurements to be about 0.09 K with respect to the trend.–
            Could be about right.

            This goes on quite bit, I’ll stop here

          • Svante says:

            Ok.

          • David Appell says:

            Dan, I didn’t mean a blog post, I mean in a published paper. Beyond you?

        • Gordon Robertson says:

          Dan….”Continued rising water vapor (which is a ghg). Water vapor (TPW) is increasing about three times that expected as feedback from rising temperature”.

          That’s a neat trick considering the IPCC and UAH have seen no average warming between 1998 and 2015. We are currently waiting to see if the 2016 EN will settle right down and cool via a La Nina. If that happens, no warming for 20 years.

          I know DA will come back with some mystery warming conjured by NOAA retroactively but NOAA and NASA GISS are now both unreliable. I’m hoping the Trump admin will steer them off their alarmists course and back into observable science.

          • Dan Pangburn says:

            The only thing countering the temperature decline that would otherwise be occurring is the increasing trend in water vapor. (Otherwise results from declining net effect of ocean cycles since about 2005 and declining solar activity which has been declining since 2014 and dropped below ‘breakeven’ in early 2016.) Average global atmospheric water vapor has been measured and reported by NASA/RSS since 1988 and shows an uptrend of 1.5% per decade. WV has increased about 8% since the more rapid increase began in about 1960.

            Linear trend of UAH since Jan 1998 is 1.1 C/century. What happens next depends on whether WV or ‘otherwise’ prevails. My assessment gives ‘otherwise’ trend a slight edge as shown in Fig 15 at http://globalclimatedrivers2.blogspot.com

          • David Appell says:

            Direct measurements show that CO2 is trapping more heat. (Feldman etc all)

      • Laura says:

        Thanks guys, I’m familiar with the background. My question was to Salvatore’s predictions only.

      • David Appell says:

        Gbalkie: why are we “recovering”from the LIA?

        • gbaikie says:


          Gbaikie: why are we recoveringfrom the LIA?–

          In interglacial periods, one gets rising sea levels and the glaciers formed during glacial period, melting.
          Within an interglacial period [and also within much longer glacial periods] there periods lasting centuries of warming and cooling.
          In our present interglacial, our last cooling period, was called the Little Ice Age {LIA] and there were many cooler
          periods before this [and many warming periods before our present day, warming period.
          Around 1850 worldwide glaciers generally stopped advancing and began retreating. Or because of this broad change in glacier beginning to retreat, 1850 was the time the LIA was said to have ended- though there seems less agreement or no agreement about when LIA period began.
          One has frost fairs in England:
          The first recorded frost fair was during the winter of 1607 / 08. During December the ice had been firm enough to allow people to walk between Southwark to the City, but it was not until January when the ice became so thick that people started setting up camp on it. …
          During the Great Winter of 1683 / 84, where even the seas of southern Britain were frozen solid for up to two miles from shore, the most famous frost fair was held: The Blanket Fair.”
          http://www.historic-uk.com/HistoryUK/HistoryofEngland/The-Thames-Frost-Fairs/
          And, “By the 1800s the climate had started to warm, the severity of the winters had waned and the last ever London Frost Fair took place in the January of 1814.”

          But anyhow, some consider LIA beginning much earlier than 1600 AD.
          There two factor related to LIA, low solar activity in terms of sunspots, Ie:
          https://en.wikipedia.org/wiki/Solar_cycle#/media/File:Carbon14_with_activity_labels.svg
          from:
          https://en.wikipedia.org/wiki/Solar_cycle
          And large volcanic eruption- at least 2, which are very large compared to any we had in last century or so.

          As to recovering, I think glaciers added during LIA have returned to level prior to LIA, and not sure of sea level rising has returned to average interglacial level of rising sea levels.
          And seems we no near the level warming reached during the last interglacial period- though some reason to suspect we will do so [from natural factors] in this interglacial period [which maybe unrelated to LIA- so maybe can’t count this as recovery from LIA].

          • David Appell says:

            Problem: the LIA wasn’t global.

          • gbaikie says:

            “The Little Ice Age was a period from about 1550 to 1850 when the world experienced relatively cooler temperatures compared to the present. Subsequently, until about 1940, glaciers around the world retreated as the climate warmed substantially. Glacial retreat slowed and even reversed temporarily, in many cases, between 1950 and 1980 as global temperatures cooled slightly”
            https://en.wikipedia.org/wiki/Retreat_of_glaciers_since_1850

            Argue with the warmist at wiki

          • aaron says:

            https://www.themarysue.com/world-population-latitude-longitude/

            88% of population lives in the northern hemisphere.

          • David Appell says:

            Wikipedia is wrong.

            “There were no globally synchronous multi-decadal warm or cold intervals that define a worldwide Medieval Warm Period or Little Ice Age.”

            — “Continental-scale temperature variability during the past two millennia,” PAGES 2k Consortium, Nature Geosciences, April 21, 2013
            http://www.nature.com/ngeo/journal/v6/n5/abs/ngeo1797.html

          • gbaikie says:

            David Appell says:
            July 20, 2017 at 1:50 PM

            Wikipedia is wrong.

            Well, Dave you should fix it.
            It seems the only requirement is being obsessive and being
            a warmist.

          • David Appell says:

            Why did you use the wrong information from Wikipedia? You need to learn the science, and not just copy and paste the first thing you find.

          • Bill_W_1984 says:

            David Appell,

            You always have the talking points well in hand, don’t you?

            The current warm period is also mostly Northern hemisphere.

            The N. Pole has more sea ice melt over the last 30 years than
            the south and the anomalies are much greater in NH. Just because
            now we have a number we call the “global” temp. and back then we
            did not have one does not allow you to compare apples and oranges
            on the one hand with “global” temperature and then also compare
            apples and oranges when you say the LIA was mostly NH and ignore
            that the current warming is mostly NH. Doubly dishonest/disingenuous.

      • Because until this year solar was above the criteria which I determined would cause cooling following 10+ years of sub solar activity in general.

        Sub solar activity in general started in year 2005, and my criteria since then was only meant during the 2008-2010 period until maybe now in year 2017.

        If this present solar minimum keeps solar at/or below the solar criteria I had said would cause cooling and it does not cool I will be wrong if it does cool I think I will be correct.

      • Gordon Robertson says:

        Laura…”Why have temperatures failed to fall already? Just curious”.

        The atmosphere behaves in mysterious ways, it’s wonders to behold.

  5. ren says:

    The temperature above 80N has a downward trend this summer.
    http://ocean.dmi.dk/arctic/plots/meanTarchive/meanT_2017.png
    Now the temperature above the North Pole should be the highest.
    The temperature above the equator is also not growing.
    http://www.cpc.ncep.noaa.gov/products/stratosphere/strat-trop/gif_files/time_pres_TEMP_ANOM_ALL_EQ_2017.png

    • barry says:

      ren, the temperature above 80N in summer is bound by the surface temperature of sea ice, which is near-perennial that for North. It’s always hovered around 0C for the summer period there, with weather causing the small variation.

      Why do you have this interest in cherry-picking only those regions (or global) over a period of weeks that don’t get warmer? Month-long cooling periods are not abnormal anywhere at any time.

  6. Kristian says:

    Another funny thing, while the TTT and TMT products appear to agree well in the Arctic, and TLT is the outlier, in the tropics the TTT product is the odd one out; it sports a trend since 1979 of +0.189 K/decade, while the other two are both way more modest – TMT: +0.149 K/decade, TLT: +0.142 K/decade. In the tropics (25N-25S), it so happens that both the TLT and TMT data are weighted to heights that more or less entirely lie within the troposphere, so that there is hardly any stratospheric signal to remove even in the TMT data. Yet, this still seems to be exactly what has been done: TTT = 1.1*TMT – 0.1*TLS => (1.1*0.149) – (0.1*(-0.251) = 0.164 + 0.025 = 0.189 K/decade.

    How does this work? RSS have their maximum TLS weighting at ~16km (globally, I presume), but this cannot be the case in the tropics, where this is rather how high the troposphere reaches (15-18km).

    And why is TLT still cooler than TMT in the tropics?

    • Roy Spencer says:

      I’d have to look at the details, but I WILL tell you that ANY weighted difference between the TMT and TLS channels will have NEGATIVE weight in the stratosphere. This will “alias” stratospheric cooling into the tropospheric warming signal.

    • Nate says:

      I don’t believe you included the results of the Sherwood and Nishant paper, for completeness. They seem to find a high trend in the tropics in the radisonde data.

      With what do you disagree in their paper?

      http://iopscience.iop.org/article/10.1088/1748-9326/10/5/054007/pdf

      • Roy Spencer says:

        you can’t reliably use wind data in the deep tropics to infer temperature changes because the thermal wind relationship there is so weak. They are torturing data until it confesses.

        • Bindidon says:

          Thank you for the indispensable humor…

        • Mickey Prumt says:

          “They are torturing data until it confesses.”

          Are you speaking about your plot ?

          – Upward shift of models vs observations.
          – Hide models variability by averaging all models and hide models spread
          – Use of 5-year means, likely because it gives the “best results”.
          – what about the definition of TLT ?
          – what about correct physical interpretation ?

          • Laura says:

            Please “untorture” the data and post your chart. Thanks.

          • wert says:

            Mickey,

            I find your objections funny. But heck, please continue. John could have chosen to draw trends only. The model trends go to roof too fast. That means they are fundamentally flawed. Deal with that.

            Yeah, you are right about the model average. But, who used model average first? Not Roy. Not John. Someone who wanted to emphasize the consensus.

            So the models suck on average, the claimed consensus sucks. The whole bloody IPCC hockey stick is just a 30 year green nightmare that went out with a puff. There is some warming, but hardly nothing that would hurt more than taxes that greens want to collect.

          • Gordon Robertson says:

            wert…”But, who used model average first?”

            The IPCC, whose first co-chair, John Houghton was a modeler.

            The IPCC stated circa 2001 that future climate states cannot be predicted. Then they proceeded to use climate model probability to ‘predict’ future climate scenarios. They were forced to cease and desist when expert reviewer Vincent Gray pointed out the obvious, that unvalidated models can predict nothing.

            Henceforth, the IPCC had to change ‘predict’ to ‘project’, a reference to imaginary climate catastrophe.

            http://hockeyschtick.blogspot.ca/2014/03/ipcc-expert-reviewer-dr-vincent-gray.html

          • Mickey Prumt says:

            wert,

            I am ok with showing the model average but why hiding each model realization ? Why ?
            Also there are data before 1979. I would like to see what looks the plot before 1979. Just curious…
            And why not adding each model realization by shifting the models the same way they shift the data, and show what it looks like (from 1900) ? To convince me that this “is the proper way to display them”.

            Finally, models show too much warming here. We speak about tropical TLT, not surface (what look’s like surface?).
            Correct interpretation of this plot is not simple. And Roy Spencer is not able to comment it.

          • wert says:

            Finally, models show too much warming here. We speak about tropical TLT, not surface (what look’s like surface?).

            The tropical TLT fails to warm faster than the surface as predicted. So what this means to modelling community? Increased confidence?

          • Mickey Prumt says:

            On epoint is that if they were not hiding annual means, you would see that it is very sensitive to variability.

          • Mickey Prumt says:

            A second point is that it doesn’t change others observations. So what did we learn ?

          • An Inquirer says:

            My goodness, Mickey, you might have a point, but I surely cannot derive what it is. You seem to be blaming Dr. Spencer for what CAGW believers established as standard practice.
            If you want to see the spread of models’ projections, there are certainly opportunities to see that everyday on the internet — and in comparison to actual readings, the projections are mostly embarrassing.

          • Mickey Prumt says:

            “there are certainly opportunities to see that everyday on the internet ”

            Easy to find for a global surface temperature. But here we are interrested in tropical TLT (definition of TLT? Are results sensitive to this definition?), not surface temperature.

            Also, on the plot, observations are shifted downward based on their (short term) trend. What about each individual model simulation ?

            Also, I would like to see radiosonde before 1979.

      • Christy JR says:

        UNSW (University of New South Wales) is included which is the radiosonde dataset of Steve Sherwood. The attempt to use wind data for trends was shown to be affected by the fact the radiosondes went through a changing sampling (Christy et al. 2010, Int. J. Rem. Sens., section 3.1.3) In particular a recalculation of this quantity using a reanalysis did not show the proposed thermal-wind warming.

      • Nate says:

        My impression is wind was an output, not an input to derive temp.

        • Nate says:

          Not sure about winds. This paper is 2015, yours is 2010.

          In case, they offer a different perspective. They find trends ~ 0.25K/decade in upper troposphere.

          Hard for anyone here to judge who is more right.

        • Gordon Robertson says:

          nate…”My impression is wind was an output, not an input to derive temp”.

          If Christy JR is who I think it is, you are replying to a degreed climate scientist with considerable expertise in the field.

  7. Bindidon says:

    Mr Spencer

    I am regularly missing, in the context of such charts

    http://www.drroyspencer.com/wp-content/uploads/TLT_Trpcs_Model_trends-550×371.png

    comparing models, satellites and radiosondes, the atmospheric pressure at which the latter operate.

    Is it e.g. 700 hPa, oder the average over 850-300 hPa?
    It would be nice to communicate that “detail”.

  8. Bindidon says:

    What I do not quite understand is the shear difference between the chart presented by Roy Spencer an that presented on a previous thread by commenter Olof R:

    https://drive.google.com/file/d/0B_dL1shkWewaUzhXR0xmN3pEN0U/view

    Some explanation concerning the huge difference between the model plot in the two charts would really be welcome.

  9. g*e*r*a*n says:

    “Its pretty clear that the models are producing too much atmospheric warming compared to satellites, radiosondes (weather balloons), and multi-observational atmospheric reanalyses.”

    The models that rely on “climate forcing” from CO2 will continue to be WRONG. Because CO2 is NOT a heat source, it does NOT “produce warming”, and it does NOT “trap heat”.

    But, CO2 DOES bring in the funding!

  10. Transport by Zeppelin says:

    the observation verse model comparison graph stops at 2014. That would be the first thing an alarmist would point out.

    Is their a version up to date including the last two Elnino years

    regards

  11. dr No says:

    Which CMIP5 emissions scenarios ?
    What was the spread in the model results?

    As is stands, it appears that the CMIP5 ensemble result you have constructed has about twice the observed warming. However, the warming must lie somewhere within the spread of results – so you cannot dismiss them.

    The point here is that the observed warming is unambiguous. You are implying that because the models, as a whole, may be oversensitive, we can ignore the problem. Sorry, that is irresponsible.

    • argus says:

      No one is suggesting Models (Modelers) won’t get better, but yes we should ignore known false projections in favor of facts.

      • David Appell says:

        Everyone agrees that projections that do not, in the future, align with reality, should be rejected. That is trivial.

  12. Mickey Prumt says:

    Where is gone the multimodel spread ? Why do you hide this spead ?

    Can we see annual means? Why do you hide annual means ?

    Why do you shift upward model on the basis of a short term trend ? Why do you make people believe that short term trend is representative of long term trend ?

    What is the consequence for WV-lapse rate feedback (likely not much) ?

    Does it change observed surface warming and other observations ? (no).

    • David Appell says:

      Yes, where is the model spread? What models were used, and why? As far as I’ve seen, People have struggled to reproduce this graph, but because Christy gives no explanation at all, no one can even reproduce it. It’s almost like the hiding is a feature, not a bug.

  13. Mark Eickhoff says:

    Just curious as a member of John Q. Public, while I have seen that overall warming is much less than what has been previously predicted, is it also true that this applies to the polar ice cap regions? I have read that warning is exacerbated in these areas but want to get others views on this since this is the most sensitive area impacting rising sea levels. Also want to get others views that if measuring sea levels is a much better predictor of overall warming compared to temperatures which are inherently highly variable. Thanks for responses.

    • Nate says:

      Yes,

      Arctic sea ice volume evolution is a good measure of warming impact. It is showing record lows this year.

      http://tinyurl.com/y82oflaf

      Sea level rise is a good measure of both melting of surface ice and ocean heat content rise.

      Ocean heat content rise, measured independently, has not paused.

      http://tinyurl.com/jbf2xco

    • Bindidon says:

      If any does, the most endangering ice sheet wrt sea level rise certainly is that of Greenland (Antarctica is tremendously stable in comparison).

      https://www.dmi.dk/en/groenland/maalinger/greenland-ice-sheet-surface-mass-budget/

      Of course, many people only see that actually, the melting is at the mean’s top CI level. Some chronically misunderstand the real meaning of the pictures.

      Nevertheless…

      Satellite observations over the last decade show that the ice sheet is not in balance. The calving loss is greater than the gain from surface mass balance, and Greenland is losing mass at about 200 Gt/yr.

      Ten years ago, the same text was already there, but with a ‘1’ instead.

      In comparison with the inlandsis itself, it is a tiny volume, however.

  14. bindidon there is no AGW. Nada.

    • Bindidon says:

      Then all is well in our perfect and marvellous world, Salvatore!

      What do you need more to be lucky?

      • Bindidon until (which I seriously doubt) this period of time in climatic history becomes unique due to very high global temperatures at least equal to the Holocene Optimum your theory AGW does have much going for it.

        That is what needs to happen before this theory has any merit and with global temperatures where they are currently at you have a very long way to go.

        • does not have much going for it cor

          • David Appell says:

            Salvatore, you have been wrong so many times in the past that your present claims have no credibility whatsoever. Why are you always wrong?

        • Bindidon says:

          Salvatore, it is not my theory. It is one I can live with as a layman, not less not more.

          • Again what is unique about this period of time in the climate?

          • It is not nearly as warm as the Holocene Optimum, nor has the rate of temperature increase been anything special.

            Temperature rate increases since the end of the last ice age – present being several times faster then what occurred last century.

            So what is the deal ? Explain why this period in time in the climate is so unique? Show us?

          • barry says:

            Salvatore, can you corroborate global rates of change as fast as recent? Preferably over a 50-year period to match the modern warming rate?

            Note the bolded part. Global.

          • Bart says:

            “Salvatore, can you corroborate global rates of change as fast as recent?”

            Absolutely. The interval 1910-1945 rose at almost precisely the rate of 1970-2005.

            https://tinyurl.com/y77fxhwh

            Yet the rise of CO2 concentration in the former was less than 10%, while in the latter was over 16%. If CO2 explains the latter rise, it cannot explain the former.

            Yet, they are almost precisely the same.

          • barry says:

            Ah, you may have missed the context. Salvatore is saying the pre-instrumental period (paleo record) shows warming excursions at the same rate as the instrumental record. He referred specifically to the Holocene optimum.

            I’d considered asking for a global trend that matches that of the last century, but opted for 50 years in line with the IPCC posit re warming since mid-20th Century. 35-year trends are a bit short of the mark, and trends since 1900 are the premise, not the response.

          • barry says:

            Here’s the actual quote I’m asking Salvatore to corroborate:

            Temperature rate increases since the end of the last ice age present being several times faster then what occurred last century.

            Lest it get lost in the mix, I’m looking for global trends that corroborate what you say, Salvatore. Not regional.

          • Bart says:

            Why look far in the past, when you have an example in the near past using direct measurements instead of proxies?

          • barry says:

            Ask Salvatore.

          • Bart says:

            No, I’m asking you. Why do you seek excuses to avert your gaze from anything that might upset the AGW applecart?

          • barry says:

            If you want to change the subject start a new thread.

            I’m going to press Salvatore for an answer here.

          • Bart says:

            Run away!

          • barry says:

            Start a new thread. See you there.

            Salvatore,

            Temperature rate increases since the end of the last ice age present being several times faster then what occurred last century.

            Can you provide corroboration for this with global data?

          • Nate says:

            Bart,

            ‘Absolutely. The interval 1910-1945 rose at almost precisely the rate of 1970-2005.’

            The period 1910-1945 ended in a massive El Nino. That ok with you?

          • Bart says:

            “The period 1910-1945 ended in a massive El Nino.”

            If so, it’s not observable in the record.

            https://tinyurl.com/y7gmcpqj

          • Nate says:

            Quite obvoious in GI*ss. If it didnt have san impact, why?

          • Nate says:

            You have previously explained last couple years spike as arising from PDO spike. You see similar strong PDO spike 1940-45.

            Just looking for consistency from you.

          • Bart says:

            “Quite obvoious in GI*ss.”

            Well, I’m not using G, am I?

            “If it didnt have san impact, why?”

            I don’t know. Ask the guys at H.

          • David Appell says:

            Bart says:
            “The interval 1910-1945 rose at almost precisely the rate of 1970-2005”

            1) Wrong
            2) cherry picked
            3) Hare-brained.

            The interval from 1/1910-12/1945 has a linear trend of +0.14 C/dec.

            The interval from 1/1970 – 12/2005 has a linear trend of +0.18 C/dec.

            And you’re obviously cherry picking.

            And you continue to majorly misunderstand, thinking that CO2 is the only influence on climate change.

            3 strikes. You’re out.

          • barry says:

            There was an extended el Nino from late 1939 to mid 1942 (a 3-year Nino). No la Nina followed.

            https://www.esrl.noaa.gov/psd/enso/mei.ext/rank.ext.html

          • barry says:

            Seeing as Salvatore isn’t responding….

            Bart. Salvatore was posting about late holocene global trends (unverified) because they are completely without anthro CO2 influence. Your example has some anthro influence, though much less than recent.

            Why did you run the trend to 1970 to 2005?

            I thought you didn’t abide by linear trend analysis. Using it here seems a bit contradictory to what you’ve said in the past.

          • barry says:

            “There was an extended el Nino from late 1939 to mid 1942 (a 3-year Nino). No la Nina followed.”

            1910 was a la Nina year.

          • Nate says:

            Even had*crut shoes effect of 40s el nino if you do annual ave

          • Nate says:

            ‘1910 was La Nina year’

            And strong volcanoes bracketed 1910.

            All in all the period 1910 to 1945 is good cherry pick to find unusual warming..

  15. Solar up to 2005 despite it becoming lower since mid last century was still high and it should have caused warming which is what happened. Only since 2005 has solar activity been in an inactive mode which will promote global cooling.

    I expect global cooling to begin (I think it has ) this year not 5 years from now.

    Solar criteria is now moving to the values I had said would be significant enough to cause global cooling, following 10+ years of sub solar activity(2005-present) in general. Duration is now needed for my low average value solar parameters. I am of the opinion that if solar conditions are extreme enough it could move the terrestrial items which govern the climate to threshold values to one degree or another. This is perhaps part of the reason why abrupt climate change has occurred in the past.

    TERRESTRIAL ITEMS

    global cloud cover global

    snow cover/sea ice cover

    volcanic activity major

    sea surface temperatures

    atmospheric circulation

    LOW AVERAGE VALUE SOLAR PARAMETERS NEEDED TO CAUSE GLOBAL COOLING

    SOLAR FLUX SUB 90 IS IN PLACE

    SOLAR WIND SUB 350 KM/SEC GETTING TOWARD THIS

    COSMIC RAY COUNTS 6500 UNITS + IS IN PLACE

    AP INDEX 5 OR LOWER COMING DOWN OF LATE

    EUV/UV LIGHT- EUV 100 UNITS OR LOWER IS IN PLACE- UV LIGHT DOWN

    IMF 4.2 NT NOT REACHED YET ON A REGULAR BASIS.

    SOLAR IRRADAINCE OFF .15% not reached yet.

    All given solar effects enhanced by a weakening geo magnetic field.

    My solar /climatic play is very low sustained solar activity will result in an increase in the earths albedo ,while at the same time lowering sea surface temperatures the result is global cooling.

    • Bindidon says:

      That you predicted 6 years ago already.

    • gbaikie says:

      “My solar /climatic play is very low sustained solar activity will result in an increase in the earths albedo ,while at the same time lowering sea surface temperatures the result is global cooling.”

      So saying earth albedo will increase due to more clouds- having more droplets of water and/or particle of ice in atmosphere.

      I don’t know how much earth albedo is increased due to clouds.

      And increasing earth albedo from clouds could increase or decrease sea surface temperature, depending on where clouds are and what kind of clouds they are.
      Loosely and broadly speaking clouds in tropical region [where most of heating from sunlight is done in regards to earth] should cause a decrease in sea surface temperatures. But this also assumes the clouds are present during solar peak hours in this region [roughly 9 am to 3 pm].

      And that region is small portion of the sunlit portion of the Earth hemisphere which is facing the sun. And in the larger portion of the sun lit hemisphere, roughly speaking, could cause increase in sea surface temperatures.

      Then you have portion of earth surface which in darkness- the non-sunlit portion of the hemisphere- these cloud couldn’t affect albedo, and such clouds at night can’t cause cooling of sea surface temperature and should instead be a warming effect.

      Roughly, I am in agreement with idea that clouds cause about 50% of the warming effect of the greenhouse effect.
      But in terms of the oceans absorbing sunlight, it seems clouds restrict the amount of sunlight absorbed by the oceans, BUT another aspect is that ocean surface are different than land surfaces, in that the ocean surface will absorb both direct and indirect sunlight.

      • gbaikie says:

        re:.. in that the ocean surface will absorb both direct and indirect sunlight.”
        The ocean will absorb any kind of shortwave sunlight energy- unless it’s at low angle. [And clouds could change the angle as can the atmosphere which is also reflecting sunlight].
        Related to this is the portion of direct sunlight “blocked”
        by H20 and CO2 gas, blocked by being “absorbed” and re-radiated [same shortwave is “emitted”] and that also is absorbed by the sea surface [if not at low angle].

        Of course the other aspect, is amount long wave radiation is absorb at the skin depth of the sea surface. And such energy I would guess is largely connected to evaporation of sea surface. And this effect is uncertain [as far as I am concerned].

        • gbaikie says:

          Also, one could say, clouds are all skin [all about water skin effects- mostly mentioned in regards absorbing longwave IR [mentioned above].
          Clouds are about water in a different form [rather than state of matter- gas, liquid, solid]. So foamed aluminum is still aluminum- it’s difference of structure compared to solid aluminum. So with clouds one has a different structural characteristics of liquid water and frozen water- and so clouds have a lot of skin [curvy, flat, pointy, explosive foamy, etc skin].
          It should also be noted the liquid water and solid water of clouds have wide range of temperatures. The ice particles can colder than any surface temperature. And though probably not important, liquid water can colder than any liquid water of earth surface- supercooled water- which naturally occurs in the atmosphere

    • David Appell says:

      “…here is my prediction for climate going forward, this decade will be the decade of cooling.”
      – Salvatore del Prete, 11/23/2010
      http://ourchangingclimate.wordpress.com/2010/10/20/andrew-dessler-debating-richard-lindzen/#comment-8875

    • Entropic man says:

      Sorry, Salvatore, it doesn’t work.

      If I read it correctly the hypothesis is that warming comes as a shrinking atmosphere turns gravitational potential energy into heat.

      Unfortunately all the planets described are in a steady state. There is no shrinkage, so no conversion of GPE to heat can take place.

        • Entropic man says:

          You are confusing cause and effect.

          Your graph is showing the effect of temperature on pressure, not pressure on temperature.

      • ren says:

        CINDI and C/NOFS were designed to study disturbances in Earth’s ionosphere that can result in a disruption of navigation and communication signals. The ionosphere is a gaseous envelope of electrically charged particles that surrounds our planet and it is important because Radar, radio waves, and global positioning system signals can be disrupted by ionospheric disturbances.

        CINDI’s first discovery was, however, that the ionosphere was not where it had been expected to be. During the first months of CINDI operations the transition between the ionosphere and space was found to be at about 260 miles (420 km) altitude during the nighttime, barely rising above 500 miles (800 km) during the day. These altitudes were extraordinarily low compared with the more typical values of 400 miles (640 km) during the nighttime and 600 miles (960 km) during the day.

        The height of the ionosphere/space transition is controlled in part by the amount of extreme ultraviolet energy emitted by the Sun and a somewhat contracted ionosphere could have been expected because C/NOFS was launched during a minimum in the 11-year cycle of solar activity. However, the size of the actual contraction caught investigators by surprise. In fact, when they looked back over records of solar activity, they found that C/NOFS had been launched during the quietest solar minimum since the space age began.
        https://www.nasa.gov/topics/earth/features/outer_atmosphere.html

      • Bindidon says:

        Many thanks for having clarified this fact (the same holds for your answer to ren below).

      • wert says:

        Unfortunately all the planets described are in a steady state.

        There is a constant flow of energy in the system via sunshine, so “steady” is not the word I’d use. Dynamic, maybe. The atmosphere is partly convective. But you are right on the basic thing, pressure does not per se mean temperature, only rising pressure means rising temperature.

        On the other hand, pressure does mean temperature. If you could make the atmosphere thick enough (say 100 atm with similar composition as now), we’d boil.

  16. ren says:

    Residents of Chile’s capital city Santiago have enjoyed some unusually cold weather.
    http://www.bbc.com/news/video_and_audio/must_see/40621882/rare-snowfall-blankets-santiago

    • David Appell says:

      Off topic , as usual

      • lewis says:

        David,
        The difference between ren and you is that ren provides a link to something concerned with weather or climate that he finds interesting, while you only make snide, defensive, abusive comments. These are usually directed at those who don’t toe your political line, comments made as if you are in control of this blog. That being true, I suggest you get your own blog, where you can control all aspects of the conversation.

        Oh wait, you have one. No one visits because you’re such a donkey.

  17. David Appell says:

    Roy: it’s very suspicious that you and John have never published this graph in a peer reviewed journal.

    Why not?

    • Robert Austin says:

      David,
      You know full well that the graph is just another plot showing how the climate models diverge from the reality of data. So it hardly warrants publishing in one of your precious “peer reviewed” journals. But you know that but you couldn’t resist getting in some lame cheap shot at Dr. Spencer.

      • Nate says:

        Robert,

        The problem with it not being peer reviewed is that it allows them to cherry pick data and not include studies that disagree. It presents a biased view of the degree of mismatch.

        • Robert Austin says:

          Nate,
          Peer review is no guarantee of good science as has been demonstrated repeatedly ad nauseam.Rosanne DArrigo explained how cherry picking was an important tool in the warmist scientists arsenal. From Mann’s original hockey stick to the latest PAGES2107, climate scientists find cherries irresistable.

        • barry says:

          What is the guarantee that Dr Spencer has presented you with good science?

        • Nate says:

          Robert,

          Here is the thing. There are few experts on remote sensing here to tell us if Roy is giving the straight dope, or the whole picture.

          The track record here is one of giving a very cherry picked view. This blog is like an op-ed, it gives you the author’s view of things, with no requirement of rigor.

          As I showed above,

          http://www.drroyspencer.com/2017/07/warming-in-the-tropics-even-the-new-rss-satellite-dataset-says-the-models-are-wrong/#comment-255494

          he has left out published analyses of others who quite disagree with what he has shown. He says it was left out because they didnt do it right.

          Well who knows? Do you?

          • Robert Austin says:

            Nate,Barry,
            No, I don’t know. But I do know that there is much unadulterated crap passed off as science in the so called peer reviewed literature. And it is merely your opinion that if Dr. Spenser has a view, it must surely be cherry picked. Dr.Spencer is an expert in this field and as such is worth attending to. It has been abundantly clear from multiple sources that that the models have been deviating from the global temperature records from all sources including the latest RSS. And instead of accepting the deviation as sign of uncertainty in the science, there appears to be a desperate attempt to make the temperature sets conform to the models. It smacks of policy based evidence making.

          • barry says:

            And it is merely your opinion that if Dr. Spenser has a view, it must surely be cherry picked.

            I didn’t express that view.

            Dr.Spencer is an expert in this field and as such is worth attending to.

            Yes, he’s one of the experts I read.

            Like me, you are not expert enough to analyse at a deep level the methods and choices of various experts. Unlike me, you seem to write off those whose results you don’t like.

            It has been abundantly clear from multiple sources that that the models have been deviating from the global temperature records from all sources including the latest RSS.

            Global? Really?

            Dr Spencer’s article above is not about global modeling/temps. Deviation between current global temps and models is evident or not so evident, depending on which expert you are reading.

            Which brings us back to favouring one expert over another without the expertise to demonstrate why.

          • David Appell says:

            Robert Austin says:
            “But I do know that there is much unadulterated crap passed off as science in the so called peer reviewed literature.”

            Such as?

            -=-=-

            Peer review does not mean a paper is right. It means it isn’t obviously wrong, and it adheres to basically scholarly standards, like citing all relevant previous work.

            Every graduate student learns this. Christy and Spencer learned it too. So one has to wonder why this graph has never been submitted to a journal. It’s suspicious. (And some, like Gavin Schmidt on RealClimate, have critiqued it thoroughly.)

      • Bindidon says:

        Robert Austin on July 16, 2017 at 9:22 AM

        You know full well that the graph is just another plot showing how the climate models diverge from the reality of data.

        You seem to be perfectly informed in this domain. So you are welcome to have a look at this comment

        http://www.drroyspencer.com/2017/07/warming-in-the-tropics-even-the-new-rss-satellite-dataset-says-the-models-are-wrong/#comment-255657

        and to produce a qualified answer.

      • David Appell says:

        Robert: Good science gets peer reviewed and published in major journals.

        So it is part of the record. So the authors get credit. So readers know it’s not obviously wrong.

        Why have Christy and Spence refused to do that with this graph? It’s suspicious…..

  18. AaronS says:

    The tropics are a significant subset of global data and the PDO is a big player in their surface heat. So Im really excited to see if the PDO goes positive (warm) after this giant El Nino. It could impact the L. Trop. Temp. significantly. Maybe reduce the difference presented between measurements and models. Alternatively, a PDO flip could elucidate errors in subsurface ocean heat content gridding for thermometer data that are recent additions and have not been through a cycle yet.

  19. Bindidon says:

    I am no climate specialist at all, my knowledge about climate models is equal to zero.

    So I invite everybody to compare what Roy Spencer writes here with a paper written last year:

    Comparing Tropospheric Warming in Climate Models and Satellite Data

    BENJAMIN D. SANTER, SUSAN SOLOMON, GIULIANA PALLOTTA, CARL MEARS, STEPHEN PO-CHEDLEY, QIANG FU, FRANK WENTZ, CHENG-ZHI ZOU, JEFFREY PAINTER, IVANA CVIJANOVIC AND CLINE BONFILS

    http://journals.ametsoc.org/doi/full/10.1175/JCLI-D-16-0333.1

    On page 4 you see therein the following graphs:

    http://fs5.directupload.net/images/170716/9paznv9e.png

    Helpful comments are welcome.

    • AaronS says:

      The key is first line of the paper:
      “Updated and improved satellite retrievals”

      Are these updates valid or political? Every update to climate records seems to add warming- personally it seems fishy. The R.S.S updates used climate models and added heat in 2016. Every update i am aware of except the 2015 UAH added global warming. It makes me suspicious because the govt. funding for science is very one sided. So a group of 4 people at R.S.S may have unconcious motivation to increase warming trends and get a nature paper and more funding. The 2 data sets used to be identical.

      Figures I dont see L. Troposphere. Maybe i missed it but cant compare other layers.

      It is good u want to learn.

    • AaronS says:

      Consider a respected NOAA scientis felt the bias so strong to increase warming in thermometer data sets he retired and published this.

      https://judithcurry.com/2017/02/04/climate-scientists-versus-climate-data/

      Bates (the well respected NOAA scientist writting the letter) said: “So, in every aspect of the preparation and release of the datasets leading into K15, we find Tom Karls thumb on the scale pushing for, and often insisting on, decisions that maximize warming and minimize documentation. I finally decided to document what I had found”.

      • David Appell says:

        “However Bates, who acknowledges that Earth is warming from man-made carbon dioxide emissions, said in the interview that there was “no data tampering, no data changing, nothing malicious.”
        “It’s really a story of not disclosing what you did,” Bates said in the interview. “It’s not trumped up data in any way shape or form.””

        — Associated Press

    • AaronS says:

      For me there is a pattern. Manipulated data increases global warming through time.

      Hiatus was real in old data. The data changed to eliminate hiatus. Seems suspicious.

      http://www.nature.com/nclimate/journal/vaop/ncurrent/full/nclimate3274.html

      • David Appell says:

        AaronS says:
        “For me there is a pattern. Manipulated data increases global warming through time.”

        Wrong.

        Adjustments reduce the long-term warming trend.

        See Karl et al, Science 2015, Fig 2.

    • Bindidon says:

      AaronS,

      I expected a scientific comment, and not the usual pseudopolitical blah blah concerning “gvt funded” science.

      There are enough Gordon Robertsons already, I don’t need one more of them.

      What you wrote is incredibly irrelevant.

  20. Obama says:

    How much of the difference between global warming model projections vs. actual observed temperature is due to California’s fight against climate change? California is vigorously fighting climate change by increasing taxes, regulations, and cap/trade scheme.

    Do the model projections factor in the climate policies of California? Perhaps, this adjustment needs to be made to the models to account for the efficacy of California’s fight against climate change.

    • barry says:

      No single state or even country by itself will have much of an impact.

    • Nate says:

      How much difference does it make to our air quality for MY car to have emission control devices? Not much.

      So why require it? No point, according to you.

      • Obama says:

        What if ALL 50 states adopted the same taxes, regulations, and cap/trade scheme as California?

        What would be the impact on Global Warming?

        How much would the rate of climate change be slowed/reversed?

        Be specific, accountable, measureable.

        • Nate says:

          Why should tthe solution to a global problem, caused by all, to fall on one country? Thats the whole point of international treaties, such as Paris.

          Should contries ever make such agreements?

        • Nate says:

          Btw, the precedent for such global action was the successful treaty to limit ozone destroying chemicals producing the ozone hole.

          In that case as in this one, US action alone would not have been sufficient.

      • barry says:

        No single state or even country by itself will have much of an impact.

  21. Obama says:

    Existence of humanity rests on extending Californias cap and tax law – Governor Jerry Brown of California.

    The global warming models are not accounting for Jerry Brown’s fight against climate change.

  22. Entropic man says:

    Dr Spencer

    The site is not showing my posts.

    • Bindidon says:

      If upon sending you see the thread’s top, then your comment wasn’t accepted by the blog’s centaurus.

      Go back in the browser’s history: you find your comment again.

      Mostly it’s due to some URL the centaurus got a bit angry about. Transform them using TinyUrl and retry…

    • MikeR says:

      Entropic man,

      I thought it was just me. I have had about 1 in 10 comments get through. Even comments without links and only a few sentences long just disappear without a trace.

      With my luck this will be the only one that survives silent moderation.

      • Bart says:

        Happens to everyone. Dr. Spencer has had problems with spammers.

        I was surprised some links to particular sites started coming through last week. Thought he had turned down the filter. But, this week again, have to use tinyurl.

      • barry says:

        As far as I’ve experienced the gremlins are consistent. It’s just I don’t have a complete list of the letter sequences this site rejects (neither does Roy).

        Any of these, for example, without the full stops:

        N.S.I.D.C

        A.b.s.o.r.p.t.i.o.n

        H.a.d.C.R.U.t.4

        will activate the gremlins.

        Roy isn’t changing anything. These bugs come with the website.

      • barry says:

        Amusingly, I neglected one full stop in H.a.d.C.R.U.t.4 and my post was rejected.

        The missing full stop was between the letter D and C.

        Old-time regulars here may have an inkling why that combo will prevent posts.

      • barry says:

        And now I know why N.S.I.D.C (without the full stops) doesn’t get through.

      • barry says:

        For the regulars:

        The letters D and C placed together in any string of letters will prevent posts.

        The reason is because a certain poster has been banned here (multiple times/sock-puppetry), and those are his initials.

      • barry says:

        It’s the price of keeping out D C. I reckon it’s worth it.

  23. ren says:

    There is a strong geomagnetic storm. There is a greater threat of strong earthquakes, also in the US.

  24. Entropic man says:

    Dr Spencer

    Still struggling. I am attempting to reply to Bindidon, but any use of technical vocabulary is being blocked.

  25. ren says:

    This year, the amount of ice in Greenland will increase significantly.
    http://www.dmi.dk/uploads/tx_dmidatastore/webservice/b/m/s/d/e/accumulatedsmb.png

  26. the above shows how Greenland ice is being reported falsely by the AGW crowd.

    • barry says:

      Groan. Bastardi points out one year and makes claims about a trend. Same old trick he’s pulled for years about sea ice.

      Meanwhile, NASA is not hiding this year’s metrics.

      http://tinyurl.com/ybqacb5k

      Snowfall in eastern and southeastern Greenland through the 2016 to 2017 autumn and winter was far above average, adding 500 millimeters water equivalent to some areas. Much of this occurred during a series of storms in October, when a large persistent low-pressure pattern southeast of Greenland pushed warm moist air onto the eastern and southeastern mountains. This additional snowfall increased the overall mass of the ice sheet by about 150 billion tons more than average prior to the start of the melt season.

    • barry says:

      My bad. Bastardi is not even pointing out a whole year, just a few months of it. All before the melt season. Summertime melt is the main cause of Greenland’s annual average declining over the longer term.

    • Bindidon says:

      Salvatore: if you trust more in the misinformation of your friend Joe Bastardi than in the information of the Danish Meteorology Institute, that’s really your problem!

      • bindidon any one or any data that runs counter to what you believe you dismiss.

      • Bart says:

        But, Bastardi is just showing the same graph as the DMI site you link to:

        https://tinyurl.com/yb8g2twt

      • barry says:

        Bastardi’s tweet is a straw man. The NASA vid was about long-term trends. He’s looking at one year.

        • Bart says:

          It’s a BIG change. If it had been the other way, you may be assured the AGW proponents would be harping on it incessantly.

        • barry says:

          Anything except address the point. You’re consistent.

        • Bart says:

          What is the point? To seek comfort in assuring yourself that it’s just a one-off?

        • barry says:

          Anything except address the point. Youre consistent.

          • Bart says:

            What point?

          • Bart says:

            That’s not a point. That’s a quibble. Something at which you excel.

            The fact that Greenland has an unusually large accumulation of ice this year is certainly relevant.

          • barry says:

            It’s irrelevant to the NASA vid, was about a study finished before 2017. Bastardi erred in all sorts of ways. You could have checked the sources, seen his criticism was way off the mark and agreed, Instead, you defended Bastardi:

            But, Bastardi is just showing the same graph as the DMI site

            He posted a criticism of NASA which was (typically) unwarranted and that was my point. You answered directly beneath my post without addressing the point. Then later said “what point”. You were only interested in pushing the talking point and were blind to the conversation.

            You do this a lot. It’s tedious.

            I’d already commented on this year’s snow accumulation above.

            If this year had been significantly low in Greenland snowfall and mass balance, you would have said that it’s one year’s data point – noise.

            Stop barracking and start conversing.

          • barry says:

            I can even use your own logic against you: 2017 is an outlier for Greenland snow and mass balance, and therefore illegitimate to include it. We’ll see it drop back again soon enough.

            It’s the same basic argument you make for 2016 el Nino.

            We have to do better than slogans.

          • Bart says:

            “Its the same basic argument you make for 2016 el Nino.”

            Completely different. El Nino is a known systematic influence. Unless you can point to a specific cause for the massive overage in Greenland ice this year, and show it is a recurring process with a characteristic transient trajectory, then the two are nothing like each other.

            “Well see it drop back again soon enough.”

            Maybe it will, and maybe it won’t. You have no basis to make such a conclusion. There will, of course, be the usual summer melt, but you cannot say what the new normal will be.

          • barry says:

            They are both weather events. El Nino is short-lived (a few months to a year). The chat about Greenland is also for a period of less than a year.

            Both-ways Bart.

          • barry says:

            “Well see it drop back again soon enough.”

            Maybe it will, and maybe it won’t.

            You really don’t realize I was paraphrasing your argumentation, not making my own point? Hard to believe, seeing as you quoted me on that.

            “It’s the same basic argument you make for 2016 el Nino.”

          • Bart says:

            Your argument fails. It’s not even remotely equivalent. I have explained why. The trajectory of El Nino is predictable. Greenland ice isn’t.

          • barry says:

            El Ninos are temporary blips. You don’t like including strong ones at the end of time series because you say they give a false impression of trends The same logic applies here. Grnlnd ice mass balance for 2017 is a big excursion (depending on hos the melt season plays out), based on unusual snowfall. By your logic including it skews the long-term trend. Predictability has nothing to do with it.

            El Ninos predictable? So when is the next one coming?

          • barry says:

            I must congratulate you on doggedly avoiding the point.

            Perhaps now that I’ve entertained the diversion, you’d care to comment on Bastardi falsely conflating a long-term trend with a single (unfinished) year. The NASA report was of trend before they had 2017 data, so how can they even begin to be accused of deceit?

          • barry says:

            Here’s the linked tweet that started the conversation, Bart? What do you think?

            https://twitter.com/BigJoeBastardi/status/886563901554520064/photo/1

    • David Appell says:

      false reporting how?

  27. KTM says:

    When do you suppose all that calving ice was laid down to begin with?

    Blaming global warming for the amount of ice calving from Greenland is like blaming a Mississippi River flood on excessive gravity.

  28. ren says:

    Snow in Santiago is slightly more common than snow in Los Angeles. The two cities are at similar latitudes, surrounded by mountains and bordered by water to the west.
    https://weather.com/news/news/santiago-chile-rare-snowfall-july-2017

  29. ren says:

    Please see what the scope of cooling for the South Pacific will be now.
    http://www.ospo.noaa.gov/data/sst/anomaly/2017/anomnight.7.13.2017.gif

  30. ren says:

    Earthquake of 6.6 degrees on Bering Island.
    Strong shock in Montana.

  31. https://wattsupwiththat.com/2017/06/18/global-versus-greenland-holocene-temperatures/comment-page-1/

    BARRY in response to your claim that the fastest 50 year global temp rise took place very recently.

    • barry says:

      I asked you for global change during the holocene. I bolded global when I asked you. I then in the next line said that I’d bolded it, in order to make very clear that I wanted you to compare apples with apples.

      But you’ve provided the paleo record for Greenland.

      That’s not global, as I’m sure you will agree.

      your claim that the fastest 50 year global temp rise took place very recently.

      I made no such claim. I asked you to corroborate your claim, and recommended a time-frame (50 years). As you mentioned ‘last century’ in your original post, I’d be happy with a 100-year time frame.

      So, can you corroborate global change during the Holocene Optimum period (or any other period in the pre-instrumental record) that matches the rate of global change in the modern period?

      50 or 100 year time-frames would be good.

    • barry says:

      Actually, this is what you claimed>

      “Temperature rate increases since the end of the last ice age present being several times faster then what occurred last century.”

      Can you corroborate that? With global (not regional) data?

      • David Appell says:

        Our current rate of warming is about 30 times faster than the average after the last ice age (glacial period) ended.

        From Shakun et al Nature 2012 Figure 2a:
        http://www.nature.com/nature/journal/v484/n7392/full/nature10915.html

        global temperature anomaly in year -18,000 is -3.4 C
        global temperature anomaly in year -11,000 is +0.0 C

        so the average temperature change is 3.4 C in 7000 years, or ~ +0.005 C/decade, compared to NOAAs current 30-year trend of +0.17 C/decade

        So that’s a factor of 32 now compared to then.

        http://davidappell.blogspot.com/2015/06/current-warming-30-times-faster-than.html

      • barry says:

        That’s assuming a straight line of warming over thousands of years, when it’s variable over the period.

        Salvatore is trying to argue about global temps of a few decades to 100 years. But he’s comparing global temps to Greenland temps. That’s why I keep asking him to compare apples with apples and corroborate a global rate of change in the paleo record comparable to recent. He actually posits several times greater, (but based on Greenland only, unfortunately).

    • Svante says:

      Salvatore,
      The variation is lower because global coverage is better, so regional swings have less impact.

      The histogram is between 2008 and 2017 adjustments, not compared to raw data, which has more warming.

      There is no evidence of a formal per review.

      More here: https://tinyurl.com/yaojgmu6

    • barry says:

      Wow. Somebody went to the trouble of debunking that pile of slander. I took a look at it and groaned at the sheer number of misrepresentations. I wasn’t going to do it.

      I was going to mention that the earliest temp record relied on about 500 stations mostly located in the US and Europe, which emphasises the warmth of the 1930s/40s. 1930s/40s was the warmest period in the US temp record.

      When more data was collated it was found that the 30s/40s warmth in the US and Europe was not matched by other regions, and so the more data they accrued from elsewhere around the globe, the less warm the 1930s/40s became.

      Documenting the direction of these changes to the corrections, without explaining them, makes up a bulk of the main argument of the “study”.

      That’s the problem (speciousness) with ‘reports,’ blog posts and blog comments like this. They only ever look at the optics and never actually assess the underlying methods. This isn’t science, it’s messaging.

  32. Again show us all of the global warming. Where is it?

  33. SocietalNorm says:

    Dr. Spencer,
    It appears that the surface temperature increase stated does not align with the satellite and balloon data (to say the least).
    I have a couple of questions.
    1) How much is temperature really related to heat energy in the system? From my thermodynamics, much of the heat in a system will go to evaporating water. Does the satellite measurement measure heat (energy) or temperature?
    So, is the measurement of surface temperature within 10ths of a degree really a useful measurement of anything? Wouldn’t every temperature measurement have to be correlated to a humidity measurement.
    2) Seems that in the mid-latitudes, the temperature is primarily ruled by the jet stream. On the equatorial side of the jet stream it can be significantly warmer in just 100mi than on the other side. The jet stream rises and dips in latitude, but over a period of time that should even out as the weather fronts travel around the world and seasonal and yearly and perhaps even decadal patterns even out.
    Could a set of unadjusted temperature (and humidity) data along a line of longitude show the magnitude of the long-term trend – at least accurate enough to tell if the change is 0.4 or 1.0 degrees over a period of about 35 years?
    3) Alternatively, wouldn’t the average distance from the equator of the jet stream be an approximate measure of the hemisphere’s temperature. I would think old satellite photos and perhaps even old weather maps showing the jet stream could give an approximation to the heat in the hemisphere.

  34. barry says:

    For the regulars:

    The letters D and C placed together in any string of letters will prevent posts.

    The reason is because a certain poster has been banned here (multiple times/sock-puppetry), and those are his initials.

    • g*e*r*a*n says:

      Yes, I remember him. He actually seemed rather gentlemanly. He wrote well, but he sometimes got his physics tangled up. He started writing here to promote his book. But he soon became obsessed with writing long comments, all the time, every time! He took over the comment threads to such an extent no one else could hardly comment.

  35. Roy said:
    “Remember, the climate models are the basis for energy policy changes, and so their quantitative projections are central to the case that we must do something about our greenhouse gas emissions.”

    Thus trillions of dollars are being spent based on models that are total BS. CO2 does not drive temperature. The hard scientific evidence from ice cores says temperature drives CO2.

    I can’t get excited by the minutiae discussed in the >230 comments above. Can y’all get serious just this once?

    • barry says:

      CO2 does not drive temperature. The hard scientific evidence from ice cores says temperature drives CO2.

      Excellent logic.

      Human beings cannot cause forest fires, because there were forest fires before there were human beings.

      Human industry can’t change atmospheric CO2 levels, because CO2 levels changed before there was human industry.

      Etc.

      • g*e*r*a*n says:

        ‘Human industry can’t change atmospheric CO2 levels, because CO2 levels changed before there was human industry.’

        That’s an excellent point, barry.

        It is only “soft science” that claims humans can even raise CO2 levels. There is no way to accurately measure nature’s effect.

      • @barry,
        Please do not think I was claiming that humans can’t raise CO2 levels in the atmosphere. The Keeling curve marches monotonically upwards and it is highly plausible that humans are responsible for most of the rise, even though natural sources and sinks of CO2 are much greater than the amounts generated by humans burning fossil fuels.

        My point is that the concentration of CO2 has correlated strongly with temperature over the last 850,000 years according to the EPICA ice cores. However [CO2] follows temperature:
        https://diggingintheclay.wordpress.com/2013/05/04/the-dog-that-did-not-bark/

        I tried corresponding with several of the EPICA researchers but they “Lawyered Up”. I think of Thomas F. Stocker as the “Prince of Darkness”. He knows the truth but prefers to lie, probably because his IPCC sinecure depends on it. There is a word for selling your honor but I won’t use it here as WordPress might block me.

        • Snape says:

          Gallopingcamel

          Your logic is the problem. An increase in temperature results in an increase in atmospheric CO2. This does not mean an increase in CO2 cannot cause temperatures to rise.

          • Svante says:

            Yes, the logical error is the assumption that a feedback can not be an initial cause.

            Think of the ice-albedo feedback. If we happened spread soot over Greenland, albedo down, temps up, less ice, less albedo…

            Can’t be the albedo, it always followed temps?

          • gbaikie says:

            ” Snape says:
            July 18, 2017 at 10:20 AM

            Gallopingcamel

            Your logic is the problem. An increase in temperature results in an increase in atmospheric CO2. This does not mean an increase in CO2 cannot cause temperatures to rise.”

            Most would say doubling 400 ppm to 800 ppm of global Co2 would cause earth to warm by about 1 C.
            Now, they also tend to say this 1 C increase will what they imagine are forcing effect.

            I don’t think Earth will get to 800 ppm of CO2 anytime soon
            and I don’t think we get to 500 ppm anytime soon.
            If you think we will add on average 2 ppm per year, in 50 years we would have 500 ppm. And 50 years isn’t any time soon.
            The amount which possible within 50 years, could be beyond your imagination.
            Let’s start with some things beyond my imagination:

            Solar energy which harvested on the dim surface of earth, becomes a viable source of energy within 50 years.

            Some say we are already at this point in time, some say possible within couple decades.

            A more likely possibility, though it’s still seems unlikely to me, is the development of an operational fusion power plant within 50 year.
            Various governments [US, Japan, France] have been working on this for decades, spending billions per year, and have continued given assurance that it will possible within the next couple of decades. A relatively new “development” is some wackos are saying a private effort might actually get to this point [again, “soon”]. I doubt the wacko will actually succeed, but governments could not make working airplane, and some bicycle guys managed to do it. So I think odds favor the wackos- but still fairly dubious. I tend to think we need fusion development done on lunar surface- which doing so on lunar surface is more likely within 50 years. But put it in the bin of lunar development rather public or private fusion development.

            On topic of the Moon and likely things to happen within 50 years, we probably will have lunar water mining within 50 years. Which basically come down to will we have exploration of lunar polar regions within 50 years. What gives hope of this happening, is China and Europe being interested in the Moon [and not much interest in Mars]. The working stiffs of NASA have always been interested in exploring the Moon, but the bureaucrats think finding alien life on Mars is more important. Oh I suppose it’s possible alien life on Mars could be discovered within 50 years [which could be important because we then can ignore to dumb idea of looking for it- though downside is all governmental laws related to this new “danger”].

          • Snape says:

            gbaikie

            I was only saying camel’s logic is flawed. The abilities of a cart are not determined by the abilities of the horse.

          • Snape says:

            For example, a horse can pull a car. Does this mean a car can’t pull a horse? Of course not. Each have independent abilities.

            Temperature can influence CO2 levels. Does this mean CO2 cannot influence temperature? Of course not.

          • gbaikie says:

            –Snape says:
            July 18, 2017 at 4:06 PM

            For example, a horse can pull a car. Does this mean a car cant pull a horse? Of course not. Each have independent abilities.–
            It’s probably not a wise thing to pull a horse with a car- the “independent abilities” of the horse could be a problem

            “Temperature can influence CO2 levels. Does this mean CO2 cannot influence temperature? Of course not.”

            Increasing Co2 is not method of increasing temperature- a bunch of horses could keep you warmer. Or you can turn on the heater in the car.

          • Snape says:

            Lol!

          • barry says:

            If you think we will add on average 2 ppm per year, in 50 years we would have 500 ppm.

            If things progress business as usual, the growth rate will increase. It’s already nearing 3ppm per annum for the last 5 years.

            https://www.co2.earth/co2-acceleration (data link on that page)

            @ 3ppm per annum we’ll get to 500ppm in 3 decades. Assuming no further acceleration (which would not be business as usual).

            However, renewables are coming more into play, so the growth rate may level out.

          • gbaikie says:

            “barry says:
            July 19, 2017 at 8:11 AM

            If you think we will add on average 2 ppm per year, in 50 years we would have 500 ppm.

            If things progress business as usual, the growth rate will increase. Its already nearing 3ppm per annum for the last 5 years.

            https://www.co2.earth/co2-acceleration (data link on that page)

            @ 3ppm per annum well get to 500ppm in 3 decades. Assuming no further acceleration (which would not be business as usual).

            However, renewables are coming more into play, so the growth rate may level out.”

            There is no evidence nor rational reason that “renewables”
            other than hydropower has or will lower CO2 emission.
            Germany [also known as solar capital of the world] is increasing it’s CO2 emission- because it has a lot solar energy and because it shut down it’s nuclear powerplants.
            Though “a lot of solar”, isn’t much of the total electrical power needs. A lot of solar means it’s getting too much solar power at the wrong time of the day- and selling it cheap or simply not using it.

            As for increase in “acceleration” El Nino causes increased levels of CO2- you look at that graph and tell when there were El Ninos and/or “size” of them. So unless you think we going to have constant El Nino for 30 years, it will decrease and is currently decreasing. Or 2 ppm increase per year is probably fairly close or it could be less than this.

            As for CO2 emission, China emits twice as much as US, this is largely due to it’s enormous use of Coal for electrical power. If it used “oil” or natural gas it could lower it’s CO2 emissions significantly.
            But a stupid oppression government, so probably continue to kill it’s people with it’s excessive pollution.

          • barry says:

            The rate 60 years ago was less than 1ppm per year. CO2 rise has accelerated since then.

            What makes you think it won’t keep accelerating?

          • gbaikie says:

            –barry says:
            July 20, 2017 at 5:55 AM

            The rate 60 years ago was less than 1ppm per year. CO2 rise has accelerated since then.

            What makes you think it wont keep accelerating?–

            I don’t think China can burn twice as much coal as it’s currently burning.
            I think China and India are making nuclear powerplants.
            I think rest of world going to start fracking and using natural gas.
            And I think the world going to give up on idea of using solar and wind energy.

          • barry says:

            You could so easily have gone to the link and used the data to work out the 5 years up to 2015, excising 2016 el Nino from the data.

            2.8ppm average

            Growth rate is greater than 2ppm, whether you use 5 or 10 years, whether with recent el Nino or not.

            I dont think China can burn twice as much coal as its currently burning.

            It doesn’t have to for the growth rate to increase. All it needs is other countries to burn more.

            I think China and India are making nuclear powerplants.

            You think?

            I think rest of world going to start fracking and using natural gas.

            I’m a bit more doubtful, but that at least is a reasonable comment.

          • gbaikie says:

            “As of May 2017, the People’s Republic of China has 37 nuclear reactors operating with a capacity of 32.4 GW and 20 under construction with a capacity of 20.5 GW. Additional reactors are planned, providing 58 GW of capacity by 2020.”
            wiki

            “India now envisages to increase the contribution of nuclear power to overall electricity generation capacity from 2.8% to 9% within 25 years.[60] By 2020, India’s installed nuclear power generation capacity will increase to 20 GW”
            200809 14,921 GWh 50%
            200910 18,798 GWh 61%
            201011 26,472 GWh 71%
            201112 32,455 GWh 79%
            201213 32,863 GWh 80%
            2013-14 35,333 GWh 83%
            wiki

          • David Appell says:

            Every Chinese person has just as much right to emit as much CO2 as you do or as I do or as any American does.

            It’s the USA who are the world’s carbon pigs, not China.

            And you must include past emissions, where we lead China about 2-to-1 on an absolute basis.

        • gbaikie says:

          Even the stupid BBC sort of knows this:
          “It says carbon dioxide levels have seen a surge in recent months as a result of the El Nio climate phenomenon, which has warmed and dried the tropics.”
          http://www.bbc.com/news/science-environment-36521068

        • gbaikie says:

          “China produces and consumes almost as much coal as the rest of the world combined”
          https://www.eia.gov/todayinenergy/detail.php?id=16271

          “It doesnt have to for the growth rate to increase. All it needs is other countries to burn more.”

          Do you think the rest of world going to double there use of Coal- other than say, Germany?

          • barry says:

            Doubled? You reckoning on China completely stopping fossil fuel burning any time soon?

          • gbaikie says:

            “barry says:
            July 20, 2017 at 6:01 PM

            Doubled? You reckoning on China completely stopping fossil fuel burning any time soon?”

            No one is completely stopping fossil fuel use, that’s a fairy tale, but more relevant, China is not stopping it’s use of coal.
            But it can’t increase it’s use of coal, like it did in the last couple decades.
            It lacks the coal reserves in terms of decades time [or life of newly built coal powerplants] and it’s killing enough of people with the pollution of dirty coal use. It’s importing cleaner coal, which is expensive but it simply can’t import very much coal due to logistical and economical and political reality.
            Or the political leadership would probably want of use more coal per year, but it can’t.
            Oh, gee, I forgot about coal gasification.
            Ok, China could increase it’s Co2 emission, I forgot:
            “Chinas National Energy Administration plans to produce 50 billion cubic meters of gas from coal by 2020, enough to satisfy more than 10 percent of Chinas total gas demand. It not only makes economic sense it also allows China to exploit its coal deposits that are located thousands of miles from the countrys main industrial centers and to solve local pollution problems. In addition, transporting the natural gas to demand centers is cheaper than transporting the coal and using it directly.

            Coal gasification produces more carbon dioxide than a traditional coal plant. According to a study by Duke University, synthetic natural gas emits seven times more greenhouse gases than natural gas, and almost twice as much carbon dioxide as a coal plant. Further, coal gasification is one of the more water-intensive forms of energy production. In the western parts of China where many of these plants would be located, there are already water shortages.”
            http://instituteforenergyresearch.org/analysis/china-build-50-coal-gasification-facilities/

            So they seem to be trying to emit even more CO2 then compared just burning coal.
            It seems expensive to me.

            That’s dated 2014, but if build the pipelines is does solve logistical problems. And does do something about the pollution in the cities. But does indicate their aversion of importing energy- as that would seem the simplest and cheapest way to get the energy. Of course China has lots frackable areas, and that seems like better way to go.

        • David Appell says:

          barry says:
          “What makes you think it wont keep accelerating?”

          Global CO2 emissions have been flat now for three years in a row.

      • barry says:

        GC, temperature led CO2 during ice age transitions.

        There is no logic to say that therefore that is what is happening now. Yet that is what you said.

        CO2 does not drive temperature. The hard scientific evidence from ice cores says temperature drives CO2.

        Since you agree human industry is putting CO2 in the air, your issue must be with the physics, not bad logic.

        • gallopingcamel says:

          @barry,
          Yes, I did say it and I stand by it. Even real scientists such as Richard Lindzen talk about a sensitivity constant in terms of degrees Centigrade per doubling of CO2 concentration in deference to Arrhenius’ (1896) hypothesis even though the hypothesis is false.

          Imagine that you could replace the nitrogen in Earth’s atmosphere with CO2……that would amount to 11 doublings so according to Arrhenius you would expect a temperature rise of 4.53 * 11 = 50 degrees Centigrade.

          Nobody believes the Arrhenius estimate of 4.53 Centigrade/doubling but “Climate Scientists” suggest a sensitivity constant of ~1 C/doubling, so that would correspond to a temperature rise of ~11 C for 800,000 ppm of CO2 in our atmosphere.

          Changing the composition of a planet’s atmosphere affects the surface temperature by changing Cp (the specific heat of the atmosphere at constant pressure). The Cp for CO2 is very close to that of nitrogen so substituting one of these gases for the other has a tiny effect on temperature. My calculations suggest a linear rather than a logarithmic relationship but the bottom line is that even with 800,000 ppm of CO2 in Earth’s atmosphere the temperature would be only a couple of degrees higher.

          • gbaikie says:

            ” My calculations suggest a linear rather than a logarithmic relationship but the bottom line is that even with 800,000 ppm of CO2 in Earths atmosphere the temperature would be only a couple of degrees higher.”

            Earth’s atmosphere is 5.1 x 10^18 kg
            or 5100 trillion tonnes or .8 times this is about 4000 trillion tonnes of N2 and about 1000 trillion tonnes of O2.

            I can’t remember how much CO2 there is in atmosphere, but I doubled 3 trillion 11 times and got 6144 trillion tonnes.
            What if one added [rather than replace] CO2 so totaled
            5100 trillion tonnes.
            So had 40% N2, 10% oxygen and 50% CO2 and had 2 atm pressure rather than 1 atm pressure.
            Obviously you could not burn that much carbon as there isn’t enough O2- [most of the mass of CO2 is oxygen].
            So it’s just added, somehow.

            So this is 500,000 ppm. What does the “science” say about having less ppm but more CO2 added?

            But the more important issue, is, would soda pop still fizzle?

          • David Appell says:

            gallopingcamel says:
            “Imagine that you could replace the nitrogen in Earths atmosphere with CO2that would amount to 11 doublings so according to Arrhenius you would expect a temperature rise of 4.53 * 11 = 50 degrees Centigrade.’

            NO, the simplest guess (climate sensitivity)*(5.35 W/m2)*ln(11).

            But that’s not right either, since the logarithmic forcing equation only holds for CO2 <~ 1000 ppm. Beyond that you need different equations.

      • SocietalNorm says:

        Yes, human beings can start forest fires. What we don’t know (and probably will never know) is if human beings cause more trees to be burned in forest fires than if there were no people.
        We know from the management of Forest Service land that prevention of forest fires can cause much larger fires burning far more acres when they do start. It is possible that far more trees would be burned in forest fires without man around (without considering people’s efforts to extinguish forest fires and using intentional fires to clear land).
        It is something you could attempt to model, but you will not know if you are correct.

        Similarly, we know that humans can increase CO2 concentrations in the short term which should theoretically increase temperature slightly. However, we don’t know how much this will increase warming over the larger earth. That is the hard part to all of this. What is the forcing function parameter for human-produced CO2? What about particulates that man puts in the air (or forest fires)? What about land-use changes? What about changes in air currents or ocean currents due to changes in temperature? What about increased greening? What about urban heat-island effect – maybe this actually increases overall temperature? What about influences outside of the earth such as solar changes, orbital changes, radiation changes. What does all of this do to cloud cover? What effect does cloud cover have?
        There are so many variables that we can not know what the temperature would be without man’s influence. There are theories – crazy theories, rational theories, theories with significant evidence behind them, but there is no certainty.

        As someone who has built and used simulations for much of my long career, I can guarantee that, given enough time, I can create a simulation that can backcast temperatures as well as the current models do and then come up with future temperature predictions of any result I desire.

        Climate scientists have a good scientific body of knowledge, but they do not understand the difficulties in trying to computer-model the real world. It is extremely difficult to model correctly a defined system in a bounded area. Even simulations of bounded systems which appear to be correct for years can come up against conditions where they break down and need to be re-looked at.

        I have had billion dollar systems rely on the results of my simulations. That’s why we have rigorous independent verification and validation where every line of code is looked at and simulations are run in order to attempt to break the models. [I’ve been on both sides of this fence.]
        There is none of this in climate science. In fact, all of the real-world evidence shows that the models are broken.

        To rely on the climate simulations that we know are incorrect predicting a system where we have no idea even what all the major variables are – in order to put into place policies that we know with certainty will impoverish millions of people, reduce total wealth by trillions of dollars, reduce the amount of food and resources people of the world have, and reduce technological progress which could help make a more prosperous world – is wrong and evil.

      • g*e*r*a*n says:

        barry, Dr. Roy is a meteorologist, not a physicist. Understanding Earth’s energy balance is physics–thermodynamics, heat transfer, quantum physics, and gas laws, among others. Don’t believe that a “PhD” readily works in all sciences. Would you want Dr. Roy to perform heart surgery on you?

        I’m a “PhD”, so that should really alarm you! (Pretty Happy Drunk.)

        • Svante says:

          https://en.wikipedia.org/wiki/Meteorology

          “Meteorology is a branch of the atmospheric sciences which includes atmospheric chemistry and atmospheric physics…”

          https://en.wikipedia.org/wiki/Atmospheric_physics

          “Atmospheric physics is the application of physics to the study of the atmosphere. Atmospheric physicists attempt to model Earth’s atmosphere and the atmospheres of the other planets using fluid flow equations, chemical models, radiation budget, and energy transfer processes in the atmosphere (as well as how these tie into other systems such as the oceans). In order to model weather systems, atmospheric physicists employ elements of scattering theory, wave propagation models, cloud physics, statistical mechanics and spatial statistics which are highly mathematical and related to physics. It has close links to meteorology and climatology and also covers the design and construction of instruments for studying the atmosphere and the interpretation of the data they provide, including remote sensing instruments.”

          • g*e*r*a*n says:

            Exactly, Svante.

            And I would wager that the “atmospheric physics” textbooks teach the “greenhouse effect”.

          • Svante says:

            Absolutely, you can’t understand temperature without it.

          • g*e*r*a*n says:

            They might be able to understand basic “temperature”, but I’ve seen they get lost quickly with “heat content”.

            It’s easy to recognize pseudoscience.

      • barry says:

        Thats an excellent point, barry.

        Don’t play games.

        What are the odds you’ll tell skeptics Dr Spencer is only a meteorologist when they rely on his advice?

        Oh yeah, we already know that. Zero.

        Being drunk would explain much about your input. Happy imbibing.

        • g*e*r*a*n says:

          Dr. Roy’s value is in his research and work to make a valuable temperature record from satellite data. (Along with Dr. Christy, of course.) I have no problem pointing out his errors related to thermodynamics, as he would have no problem telling me I don’t understand cloud formation.

          As to MY “PhD”, today it’s margaritas and chicken nachos, on the veranda. Wish you could attend!

      • gbaikie says:

        “1. THERE IS NO GREENHOUSE EFFECT. Despite the fact that downwelling IR from the sky can be measured, and amounts to a level (~300 W/m2) that can be scarcely be ignored;”

        Dr Spencer is saying that greenhouse effect is the same
        as backradiation. Greenhouse effect is same as backradiation [effect].
        Is the greenhouse effect this ~300 W/m2 of IR?
        Couldn’t I chose to say the greenhouse effect is the average velocity of air molecules which are ~400 m/s.

        The greenhouse effect [theory] is why is earth warmer than it “should be”. The greenhouse effect [theory] claims that without greenhouse gases, earth would be -18 C.
        And Dr Spencer is saying that without the 300 watts of backradiation earth average temperature would be -18 C. Or perhaps that this 300 watts is important part of why Earth average temperature is 15 C [and does not agree earth would -18 C without this 300 watts].

        One could warm air so it’s average velocity becomes about ~400 m/s?
        The fact is lots of people already have variety of machines which do this, and they use such devices to warm their homes.
        Though no one [that I am aware of] has machine which increases the backradiation to 300 watts. Could such a machine be made and could it be another way to warm houses?

        Now, I would say the earth is warmer than it should be, because the tropics region warms Earth. Or the Tropics is the furnace of house, Earth.
        Or why the average velocity of gas is ~400 m/s is because the sun mostly warms the tropics and the tropics has about 80% of it’s surface area being very clear ocean water.
        Or the greenhouse effect on Earth is mostly about the tropical oceans.

        Now, I don’t know whether Dr Spencer believes that without greenhouse gases [which apparently add or are totality of
        ~300 W/m2 of IR] Earth would have average temperature of -18 C. But whether he or others actually think this, I think it’s important to examine what an Earth “looks like” if it were -18 C.
        Now, it seems most people think of Earth which is -18 C is frighteningly cold planet. Though I tend to this Earth of 15 C, is is sort of a frighteningly cold planet. If I was polar bear, 15 C is not cold enough, but since I am actually a tropical animal, it’s cold. And for planet Earth, 15 C average temperature is cold, and we call it an ice box climate. Because we aren’t Al Gore who got a D in science class.
        Obviously since I think 15 C is rather cool, -18 C is also cool, though -18 C would be very warm for Planet Mars. And one those crazies who think planet Mars which is colder than -18 is actually habitable for intelligent humans. [Though obviously not habitable for stupid polar bears, unless the bear has the assistance of human intelligence. I also think Mars would good place for dinosaurs- but I am exposing my wilder side. The more practical value of Mars is growing crops- I would like to drink Mars beer, on sunny beach of Earth.]
        Anyhow, I thin a -18 C Earth, would have a cooler tropics, but still as warm as where billions of human are currently living. Or a tropics of somewhere around 10 C {Continental US is about 11 C].
        Whereas it seems most people envision the tropics as frozen solid, but also as begin to ponder it, their brains rebel- something tell them it can’t remain at -18 C, and so one has get some runaway freezing effect or something.

        So we got people who imagine it’s possible to have snowball Earth and Earth like Venus.
        And would say this is only due to the pseudo science of Greenhouse Effect Theory.
        But we could go to Venus and have some fun, and we could also go to say Europa, which is a snowball moon of Jupiter.

        • David Appell says:

          No. Infrared radiation is not the same as the kinetic energy of molecules. Basic physics, people!

    • David Appell says:

      Dumb logic. CO2 obviously leads temperatures when we dig up carbon and immediately burn it.

  36. Darwin Wyatt says:

    I nominate algore for the Larsen iceberg. An end of the hunt moment if I ever saw one.

  37. Darwin Wyatt says:

    Clarification: ak natives called it the end of the hunt when someone got senile. They’d go gloat off on an iceberg.

  38. barry says:

    Where can I get CMIP5 LT tropical data to check the graph above?

  39. ren says:

    Tuesday July 18 2017, 02:05:20 UTC 4 hours ago Near Coast of Peru. 6.7 50.0 GeoScience Australia
    Tuesday July 18 2017, 02:05:19 UTC 4 hours ago 98km WNW of Camana, Peru 6.4 44.0 USGS Feed
    Monday July 17 2017, 23:34:27 UTC 6 hours ago Bering Sea. 7.6 15.0 GeoScience Australia
    Monday July 17 2017, 23:34:21 UTC 6 hours ago 234km ESE of Nikolskoye, Russia 7.4 48.3 USGS Feed
    Monday July 17 2017, 23:34:18 UTC 6 hours ago 233km ESE of Nikolskoye, Russia 7.4 48.0 USGS Feed
    Monday July 17 2017, 23:34:13 UTC 6 hours ago 198km ESE of Nikolskoye, Russia 7.7 11.0 USGS Feed
    http://pics.tinypic.pl/i/00919/0lfnwbs8ttr5.gif

  40. https://s19.postimg.org/vgdnb299v/Arctic-_Sea-_Ice-_Holocene-_Stein-17.jpg

    As one can see this period in time in the climate is NOT even close to being unique.

    • David Appell says:

      What a crappy graph. Doesn’t cite it’s sources, or where it came from. Doesn’t label it’s abscissa. You’ll have to do much much better than this..

  41. Geoffrey Preece says:

    The John Christy graph and methodology is questioned at Skeptical Science. A single red line is certainly not representative of the possible scenarios suggested by models.
    https://skepticalscience.com/graphics.php?g=243

    • barry says:

      I picked half of those straight off, the choices made to exaggerate the divergence.

      1979 was a warm year in the records, but a cold one in the CMIP-5 model mean. Putting them together bumps up the model mean going forward.

      A better method would have been to have baselined them over a longer period, like 10 years at the beginning, or to match them all to the bump about 1988.

      Yes, doesn’t include model ensemble range.

      Didn’t realize it was an average of the satellite and balloon data. Some radiosonde data sets run quite a bit higher than UAHv6 (eg, RATPAC).

    • barry says:

      Are the trends really only to 2014? When it is stated in the article the data run to 2016? This skeptic needs some confirmation before accepting that.

    • Gordon Robertson says:

      Geofrey Preece…”The John Christy graph and methodology is questioned at Skeptical Science”.

      Are you kidding, the same skeptical science where they dressed up as Nazis and impersonated physicist Lubos Motl?

      Note: remove the hyphen in popular-technology…Wordpress doesn’t like it.

      http://www.popular-technology.net/2012/03/truth-about-skeptical-science.html

      https://wattsupwiththat.com/2015/07/23/yes-why-does-john-cook-of-skepticalscience-and-the-97-have-to-use-identity-theft-in-his-research/

      • Gordon Robertson says:

        re link one above…in Firefox, right-click URL, hit Copy Link Location, paste in URL bar, and delete hyphen, then Enter.

        Revealing info on John Cook at skepticalscience who once claimed to be a retired solar scientist. Apparently he is a cartoonist and has no degree.

        Here’s the page from Wayback Machine where he admits it.

        https://web.archive.org/web/20080213042858/http://www.skepticalscience.com:80/page.php?p=3

        “This site was created by John Cook. I’m not a climatologist or a scientist but a self employed cartoonist and web programmer by trade”.

        Anyone who quotes this site is a fool.

        • Gordon Robertson says:

          In other words, the 97% of scientists agree that global warming propaganda comes from a cartoonist. How fitting.

          • lewis says:

            Somehow, that doesn’t surprise me.
            Then consider who those are who quote that number.

          • Gordon Robertson says:

            lewis…”Then consider who those are who quote that number”.

            The most desperate of alarmists.

      • barry says:

        I notice you didn’t deal with one skerrick of criticism about the graph. Are you a skeptic or a believer?

    • David Appell says:

      Gavin Schmidt has also thoroughly analyzed and discussed this graph at RealClimate. He says there is a reason why this graph hasn’t been peer reviewed. The silence of John and Roy on this aspect is not encouraging

  42. Scientific Method, anyone? Wrong predictions = reject failed theory.

    • gallopingcamel says:

      That is how real science is supposed to work.

      In climate science wrong predictions don’t matter.

      • Snape says:

        Meanwhile, arctic sea ice extent is near record low, and…..”According to NOAA, June of 2017 was the third hottest such month in the global climate record since temperature tracking began in 1880. For NASA, June was also the third hottest on record with June of 2016 settling in at 1st hottest, and 2015 and 1998 tied as second hottest. Overall, global temperatures were about 0.91 degrees Celsius warmer than late 19th Century averages in the NASA record and about 1.02 degrees Celsius warmer than the same time period in the NOAA record.”

        • and you believe them. All fake news.

        • mean while despite co2 increases global temperatures since June are only .23c above 30 year means.

          • Snape says:

            Salvatore

            Roughly speaking, here’s a look at UAH temperature fluctuations over the years:

            1981-2010
            – 0.35…..0…..+0.35

            2000-2017
            0…..+0.35…..+0.70

          • Snape says:

            These numbers are way too warm. Let me try again;

            1981-2010
            -0.20……0……+0.20

            2000-2017
            0……+O.20……+0.40

            My point is that it could be instructive for some people to see a range of average fluctuations, rather than just the mean.

          • lewis says:

            Snape,

            The range of fluctuations, more exactly, the difference between the two ranges of fluctuations you cite, should be what we are looking at. Then, if in 20 years it is up again, perhaps we should examine what, if anything, mankind should or shouldn’t do.

            I suggest not building in flood plains including coastal areas lying in low areas – Miami etc. But people have very short memories, and presume to know.

            Then, when they inevitably are reminded of their mistake, blame the gods or some such for their problems. In the case discussed here, CO2 made by the big bad pharmaceutical companies ( or some such)

          • David Appell says:

            And who’s going to pay for all the lost real estate around the Florida coast?

            Taxpayers, that’s who. It will be trillions of dollars.

        • barry says:

          Snape, these are snapshots – weather variation. What maters are the long-term trends. For the metrics you’ve mentioned, the long-term trends are in the direction of warming, so these short-term snapshots seem to be of a kind, but they’re not. Just in the same way that a very cold month or year doesn’t say much about the long-term trend. long-term trend.

          • Snape says:

            Barry

            You’re right, of coarse. I had just finished a tall glass of cider and couldn’t resist.

        • Snape up to this point in time AGW is not there everything thus far can be explained by natural variability.

          And I expect the case for AGW to worsen as global temperatures have likely started there decline in year 2017.

          We will see.

          • Snape says:

            Salvatore

            Here’s the general fluctuations I expect to see in the 2020’s. (UAH)

            +0.20…….+0.40…….+0.60

        • Gordon Robertson says:

          Snape…”According to NOAA, June of 2017 was the third hottest such month in the global climate record since temperature tracking began in 1880″.

          NOAA is corrupt.

        • The IPCC climate models have been wrong on the high side every year since 1950. It is time to apply the Scientific Method, and reject these models. We simply do not know what the future climate will be. See:

          http://bit.ly/2pFIDXJ

          • barry says:

            What does that even mean? Anomalies have been either side of the model mean, and recent years have been below.

            A lot of things correctly predicted and a divergence in air temperatures. The ‘scientific method’ is a process, not a conclusion.

      • David Appell says:

        What wrong predictions?

  43. ren says:

    They threaten severe thunderstorms in the Great Lakes region.

  44. uk ian brown says:

    UK met office claims June 2017 on course to be a record warm month after 2015 and 2016,so i dug out there historical records to find it is not accurate ,the warmest June was in fact 1858 when temperatures rarely dropped bellow 30c. Gravesend in Kent recorded 34c,and Greenwich a temperature of 39c,the heat lasted till September making 1858 the warmest summer of industrial Britain.it was so hot in London it was called the year of the great stink, god knows what would be said if it happened again,the large high pressure that sat over the country for three months would shut down all the wind farms,

  45. ren says:

    Increases blocking polar vortex over the Indian Ocean. This will have a big impact on the temperature drop in southern Austrailia.
    http://www.cpc.ncep.noaa.gov/products/stratosphere/strat_a_f/gif_files/gfs_t10_sh_f00.png
    https://earth.nullschool.net/#2017/07/21/1200Z/wind/isobaric/70hPa/orthographic=-250.24,-45.92,298

    • barry says:

      Not when laced with bulldust.

      Two newspaper articles and a plot of the size of the ozone hole with all the years it grew deleted from the record. Great frickin’ scientific rigour there. Stopping CFCs has stopped the growth of the ozone hole – but you won’t see it in that typically misleading graph.

      There are a few half-decent skeptic blogs out there. Heller’s is one the worst. It’s just a talking-point mill. Anthony Watts was right to bar Heller from posting articles at WUWT.

      Heller’s posts don’t survive a modicum of skepticism. People who link to his trash aren’t true skeptics.

  46. http://models.weatherbell.com/climate/cdas_v2_hemisphere_2017.png

    the global temperature . Where is all that global warming?

    Answer no where.

  47. uk ian brown says:

    anyone got any views on the threat by Mark Jacobson to take legal action against those that disagree with his views on renewables.surely it can not be right to sue people who disagree with your point of view.if that became the norm science would lose its most valuable attributes.the right to be peer reviewed.

    • lewis says:

      That, or something similar, is already going on. Those with differing opinions than that of the PC or Black Lives Matter, or Democrats or whoever, are shouted down, stopped from publishing, lose their grants or tenure, and sued. Coming soon, just plain ordinary incarceration.

      Coming soon to a theatre (street) near you.

      You think not? If the left wing gets reelected your rights will continue to disappear out the window.

      • Bindidon says:

        Oh you poor poor American righties who will soon lose all their rights.

        And this in a country where the Democrats themselves are so far from what this word actually means.

        Maybe you would prefer to live in Russia, or in China, lewis?

        I have a secret link to a person in Switzerland who knows how to bring you in Northern Korea.

        What about spending a few weeks there?

      • David Appell says:

        Lewis says:
        “Those with differing opinions than that of the PC or Black Lives Matter, or Democrats or whoever, are shouted down, stopped from publishing, lose their grants or tenure, and sued.”

        Completely untrue. And stop whining.

  48. ren says:

    Polar Blast Brings Snow, Record Low Temps to Southern Brazil

    RIO DE JANEIRO – Several cities in southern Brazil experienced record low temperatures and even snow on Tuesday with the arrival of a mass of polar air blamed for two deaths in Argentina, authorities said.

    Most towns in the states of Rio Grande do Sul, Parana and Santa Catarina woke up to sub-freezing temperatures, the National Institute of Meteorology (Inmet) said.

    The lowest reading was recorded in Bom Jardim da Serra, Santa Catarina, where the temperature was minus 7.4 C (18 F) at 6 am, with a wind chill of minus 17 C (1 F).

    Snow fell in the mountains of Rio Grande do Sul and Santa Catarina.

    Inmet’s forecast calls for the unusually cold temperatures to persist until Thursday.
    http://www.laht.com/article.asp?ArticleId=2440334&CategoryId=14090

  49. ren says:

    Now

    -58 C
    Snow flurries. Overcast.

    Feels Like: -73 C
    Forecast: -59 / -55 C
    Wind: 3 m/s ↑ from West
    https://www.timeanddate.com/weather/antarctica/concordia-station/ext

  50. One key is going to be how fast the overall sea surface temperatures change. Ocean tid bits has +.328 c Still high.

    Still albedo changes due to cloud/snow coverage is another key and then the unknown. major volcanic activity factor.

    I have said solar up to 2005 should have had a warming effect on the climate. It was not until 2005 that this reversed and I have also said in order for solar to have a cooling impact upon the climate certain low average value solar parameters have to be met FOLLOWNG 10+ years of sub solar activity.

    We have had sub solar activity post 2005.

    Since 2005 the only time my low average value solar criteria for cooling was meant was from 2008-2010 but 10+ years of sub solar activity was not present at that time.

    Now in year 2017 FINALLY it looks like my low average value solar criteria is going to be met following 10+ years of sub solar activity and this is why I am confident that some sort of global cooling will occur ,bringing global temperatures to or below the 30 year means within the next year. Let us say no later then the summer of 2018 unless a very strong EL NINO were to happen which is not likely at all.

  51. ren says:

    CME SWEEPS ASIDE COSMIC RAYS: On July 16th, a CME hit Earth’s magnetic field, sparking two days of geomagnetic storms and beautiful southern auroras. The solar storm cloud also swept aside some of the cosmic rays currently surrounding Earth. Spaceweather.com and the students of Earth to Sky Calculus launched a space weather balloon to the stratosphere hours after the CME arrived. We detected a 7% decrease in X-rays and gamma-rays (two tracers of secondary cosmic rays). Neutron monitors in the Arctic and Antarctic recorded similar decrements. For instance, these data from the Bartol Research Institute show a nearly 8% drop in cosmic ray neutrons reaching the South Pole:
    http://www.spaceweather.com/

  52. gallopingcamel says:

    @David Appell said, July 20, 2017 at 9:15 PM

    Gordon Robertson says:
    “NOAA is corrupt.”

    Why?

    Dear David,
    NOAA is corrupt for the same reason that the FBI is corrupt. Neither organization cares about truth any more. They say what (corrupt) politicians want them to say.

  53. barry says:

    Re el Nino chat upthread, ENSO neutral conditons are predicted for the remainder of the year.

    NOAA forecast:
    http://www.cpc.ncep.noaa.gov/products/analysis_monitoring/lanina/enso_evolution-status-fcsts-web.pdf

    BoM forecast:
    http://www.bom.gov.au/climate/enso/outlook/

    JMA forecast:
    http://ds.data.jma.go.jp/tcc/tcc/products/elnino/outlook.html

    El Nino thresholds have been reached in most indices very recently, but not expected to persist.

  54. Air Influence wrenches are the Mack-Daddy
    of wrenches.

    my website slideshare (http://www.slideshare.net)

  55. torrent says:

    obviously like your web-site however you need to check the spelling on several
    of your posts. A number of them are rife with spelling issues and I to find it very troublesome to inform the
    truth on the other hand I will surely come again again.

  56. Fsfvoith says:

    persuasive essay question essays titles best custom essay writing services

  57. Link exchange is nothing else but it is simply placing the other person’s
    web site link on your page at appropriate place and
    other person will also do same in favor of you.

  58. __i v_i n__c ngoi nhn vin v doanh nghi_p, c th_ l ngn hng ho_c nh
    th_u l_p mi, khng tun th_ lu_t ring
    t_ lin bang c th_ ph_i __i m_t v_i h_u qu_ php l,
    ln __n v bao g_m kho_n ti_n ph_t 500.000 _ la.

  59. Thng tin c nhn c_a b_n s_ ___c
    s_ d_ng __ t_ng tr_i nghi_m s_ d_ng web site, qu_n l
    truy c_p vo ti kho_n c_a b_n, v cho cc
    m_c _ch c_ th_ khc ___c m t_ trong chnh sch ring t_.

Leave a Reply to barry