
 Home/Blog
Al Gore has provided a target-rich environment of deceptions in his new movie.
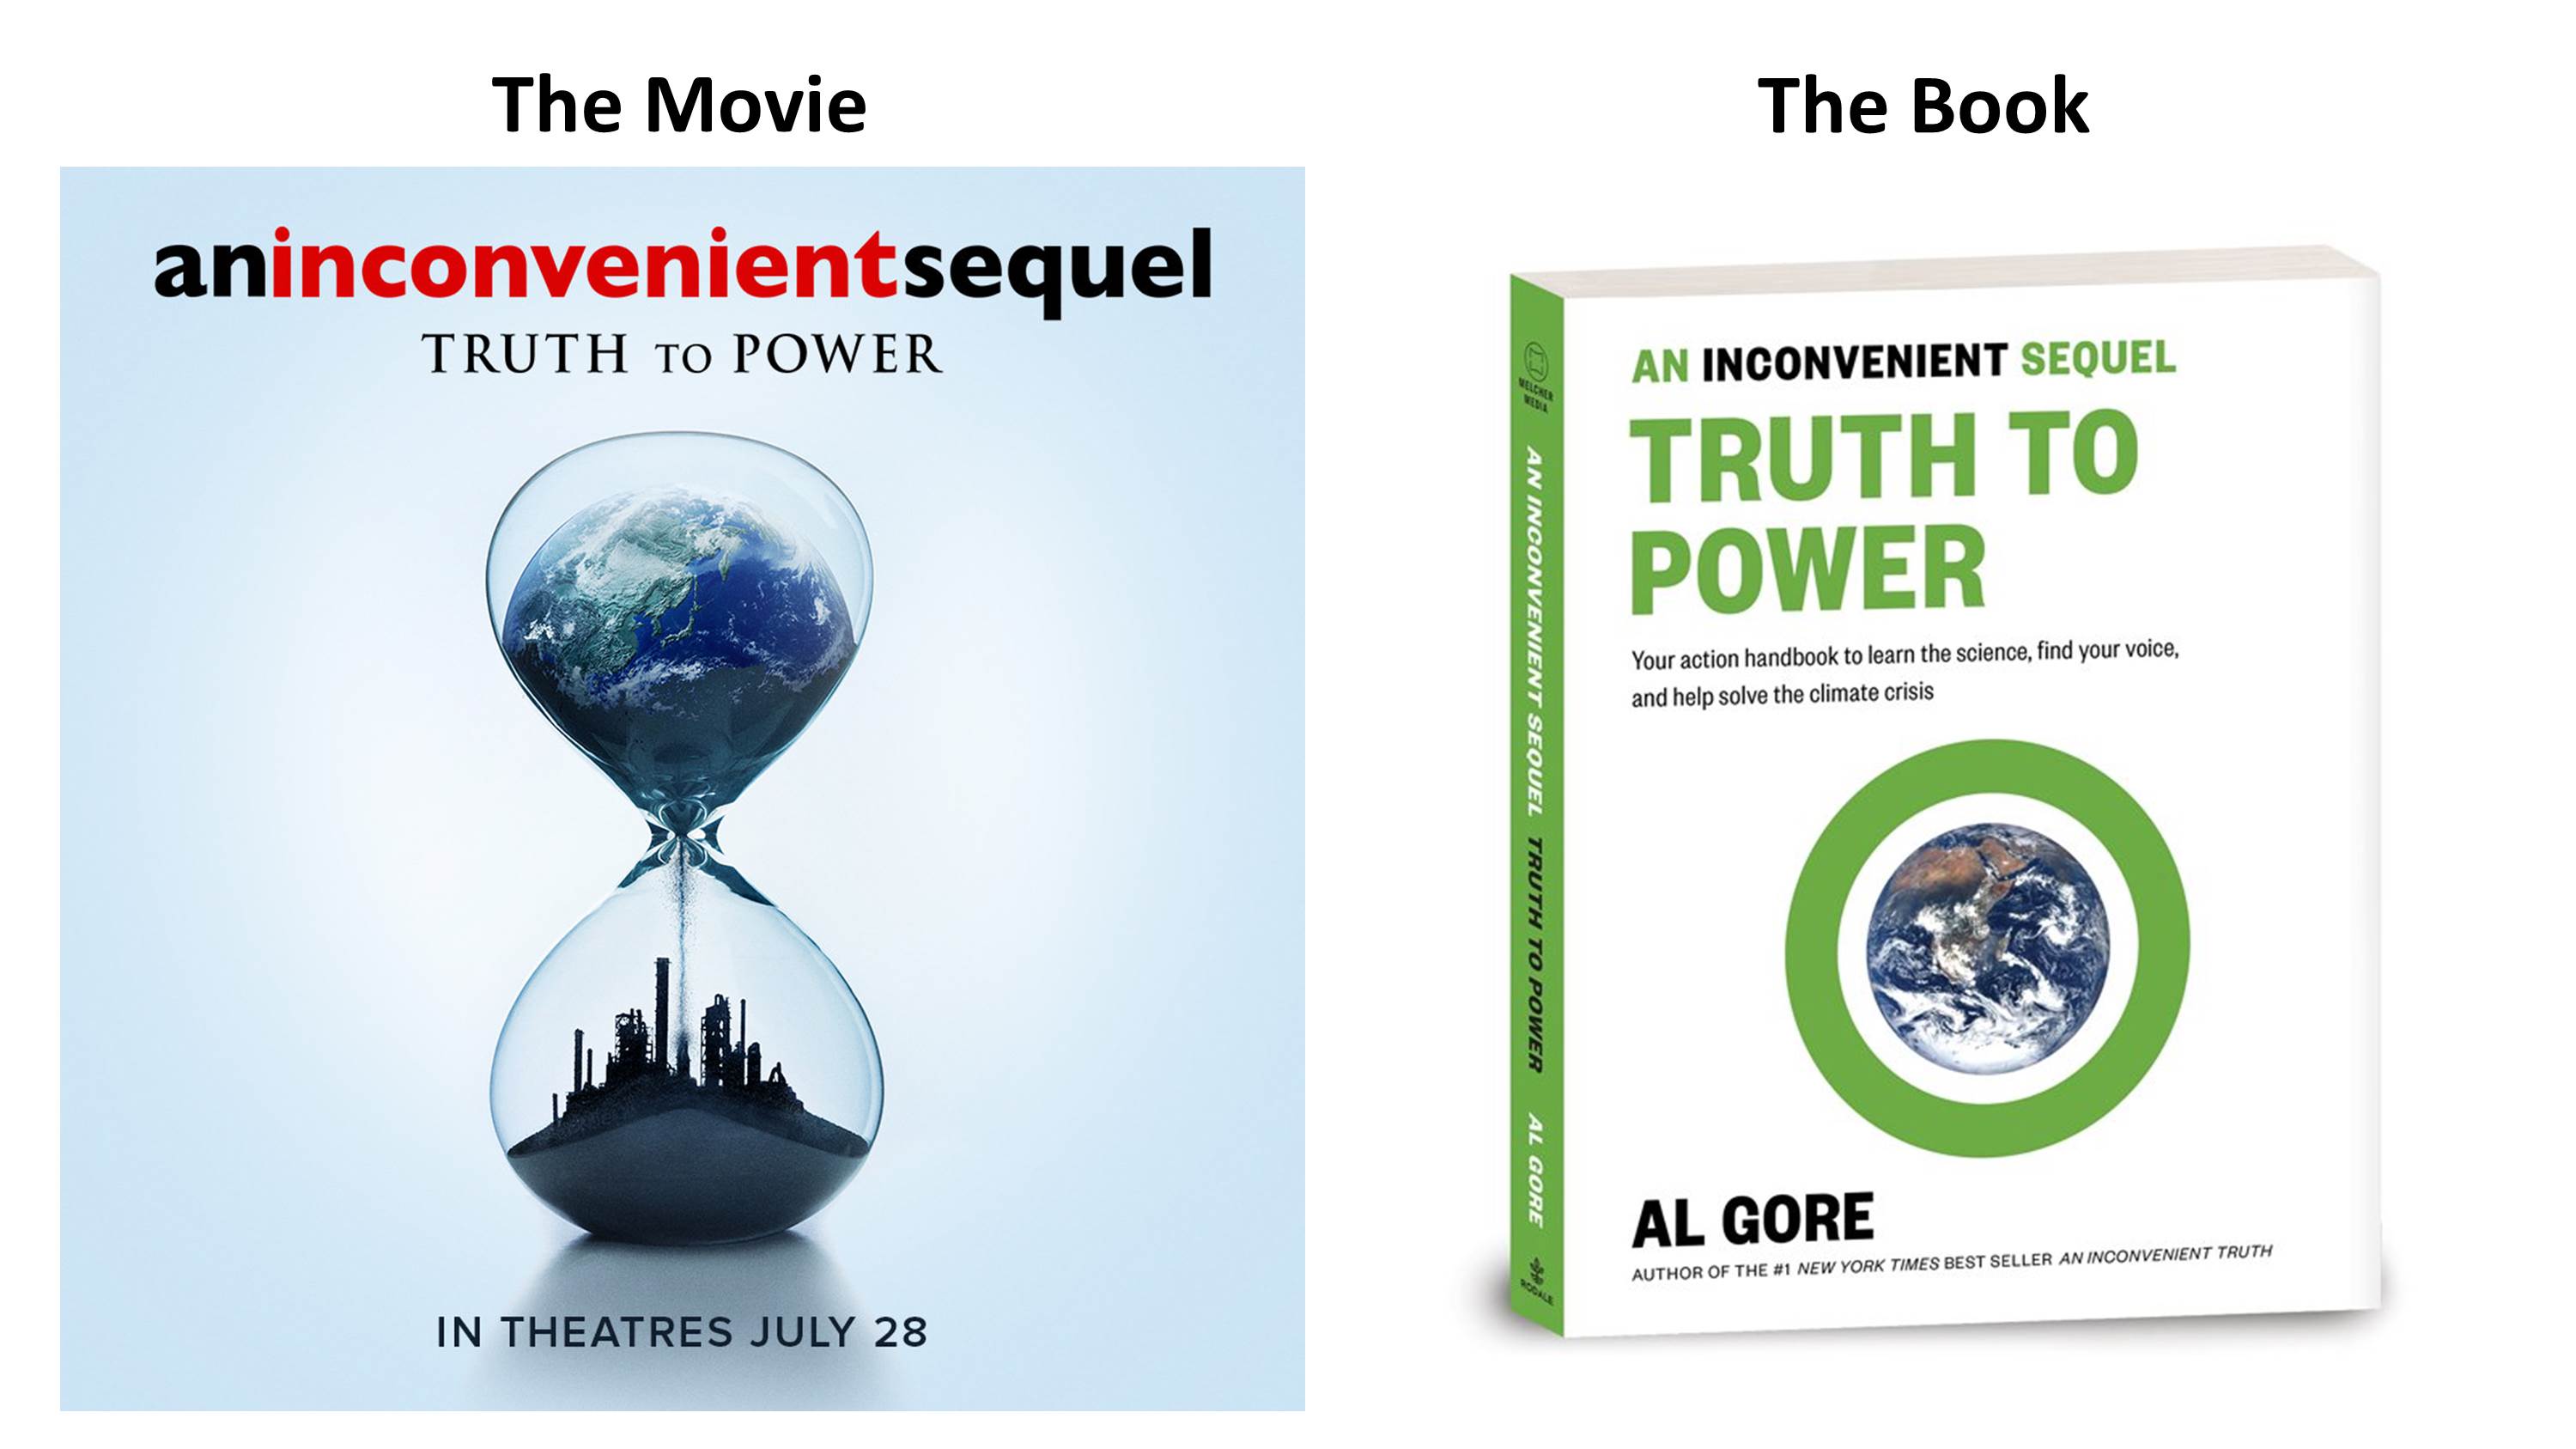
After viewing Gore’s most recent movie, An Inconvenient Sequel: Truth to Power, and after reading the book version of the movie, I was more than a little astounded. The new movie and book are chock-full of bad science, bad policy, and factual errors.
So, I was inspired to do something about it. I’d like to announce my new e-book, entitled An Inconvenient Deception: How Al Gore Distorts Climate Science and Energy Policy, now available on Amazon.com.
 After reviewing some of Gore’s history in the environmental movement, I go through the movie, point by point.
One of Gore’s favorite tactics is to show something that happens naturally, then claim (or have you infer) that it is due to humanity’s greenhouse gas emissions. As I discuss in the book, this is what he did in his first movie (An Inconvenient Truth), too.
For example, sea level rise. Gore is seen surveying flooded streets in Miami Beach.
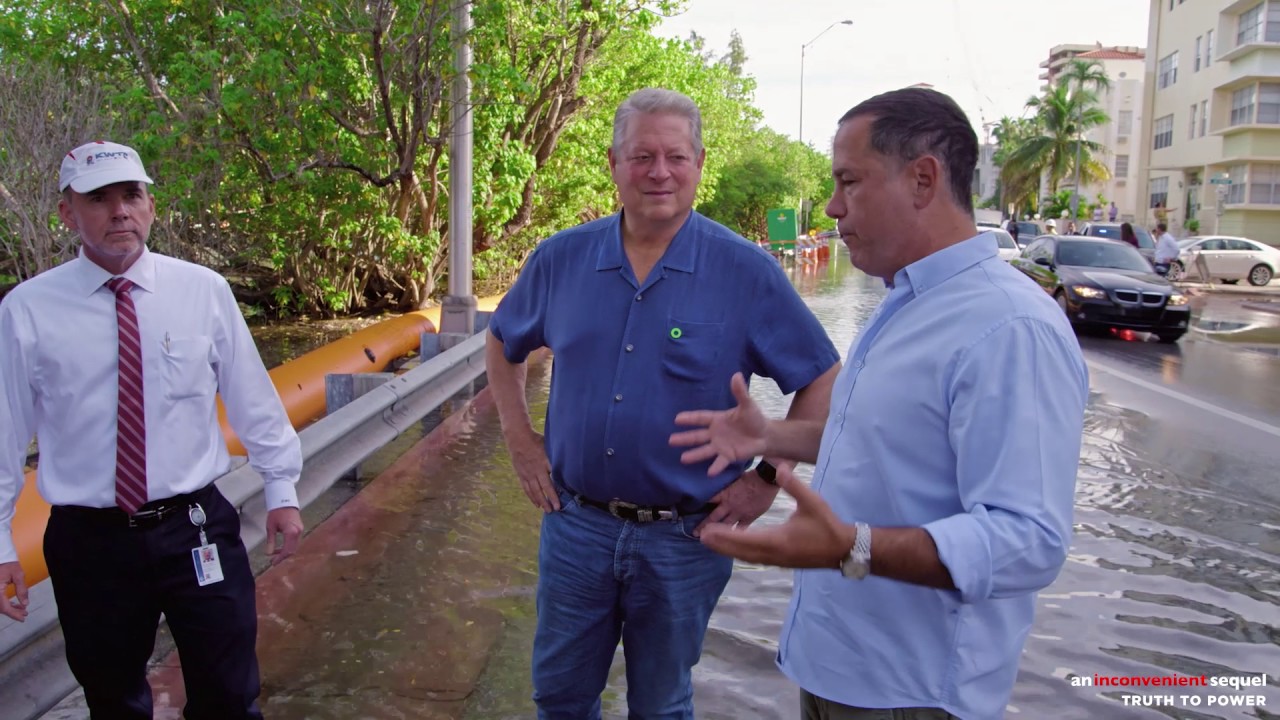
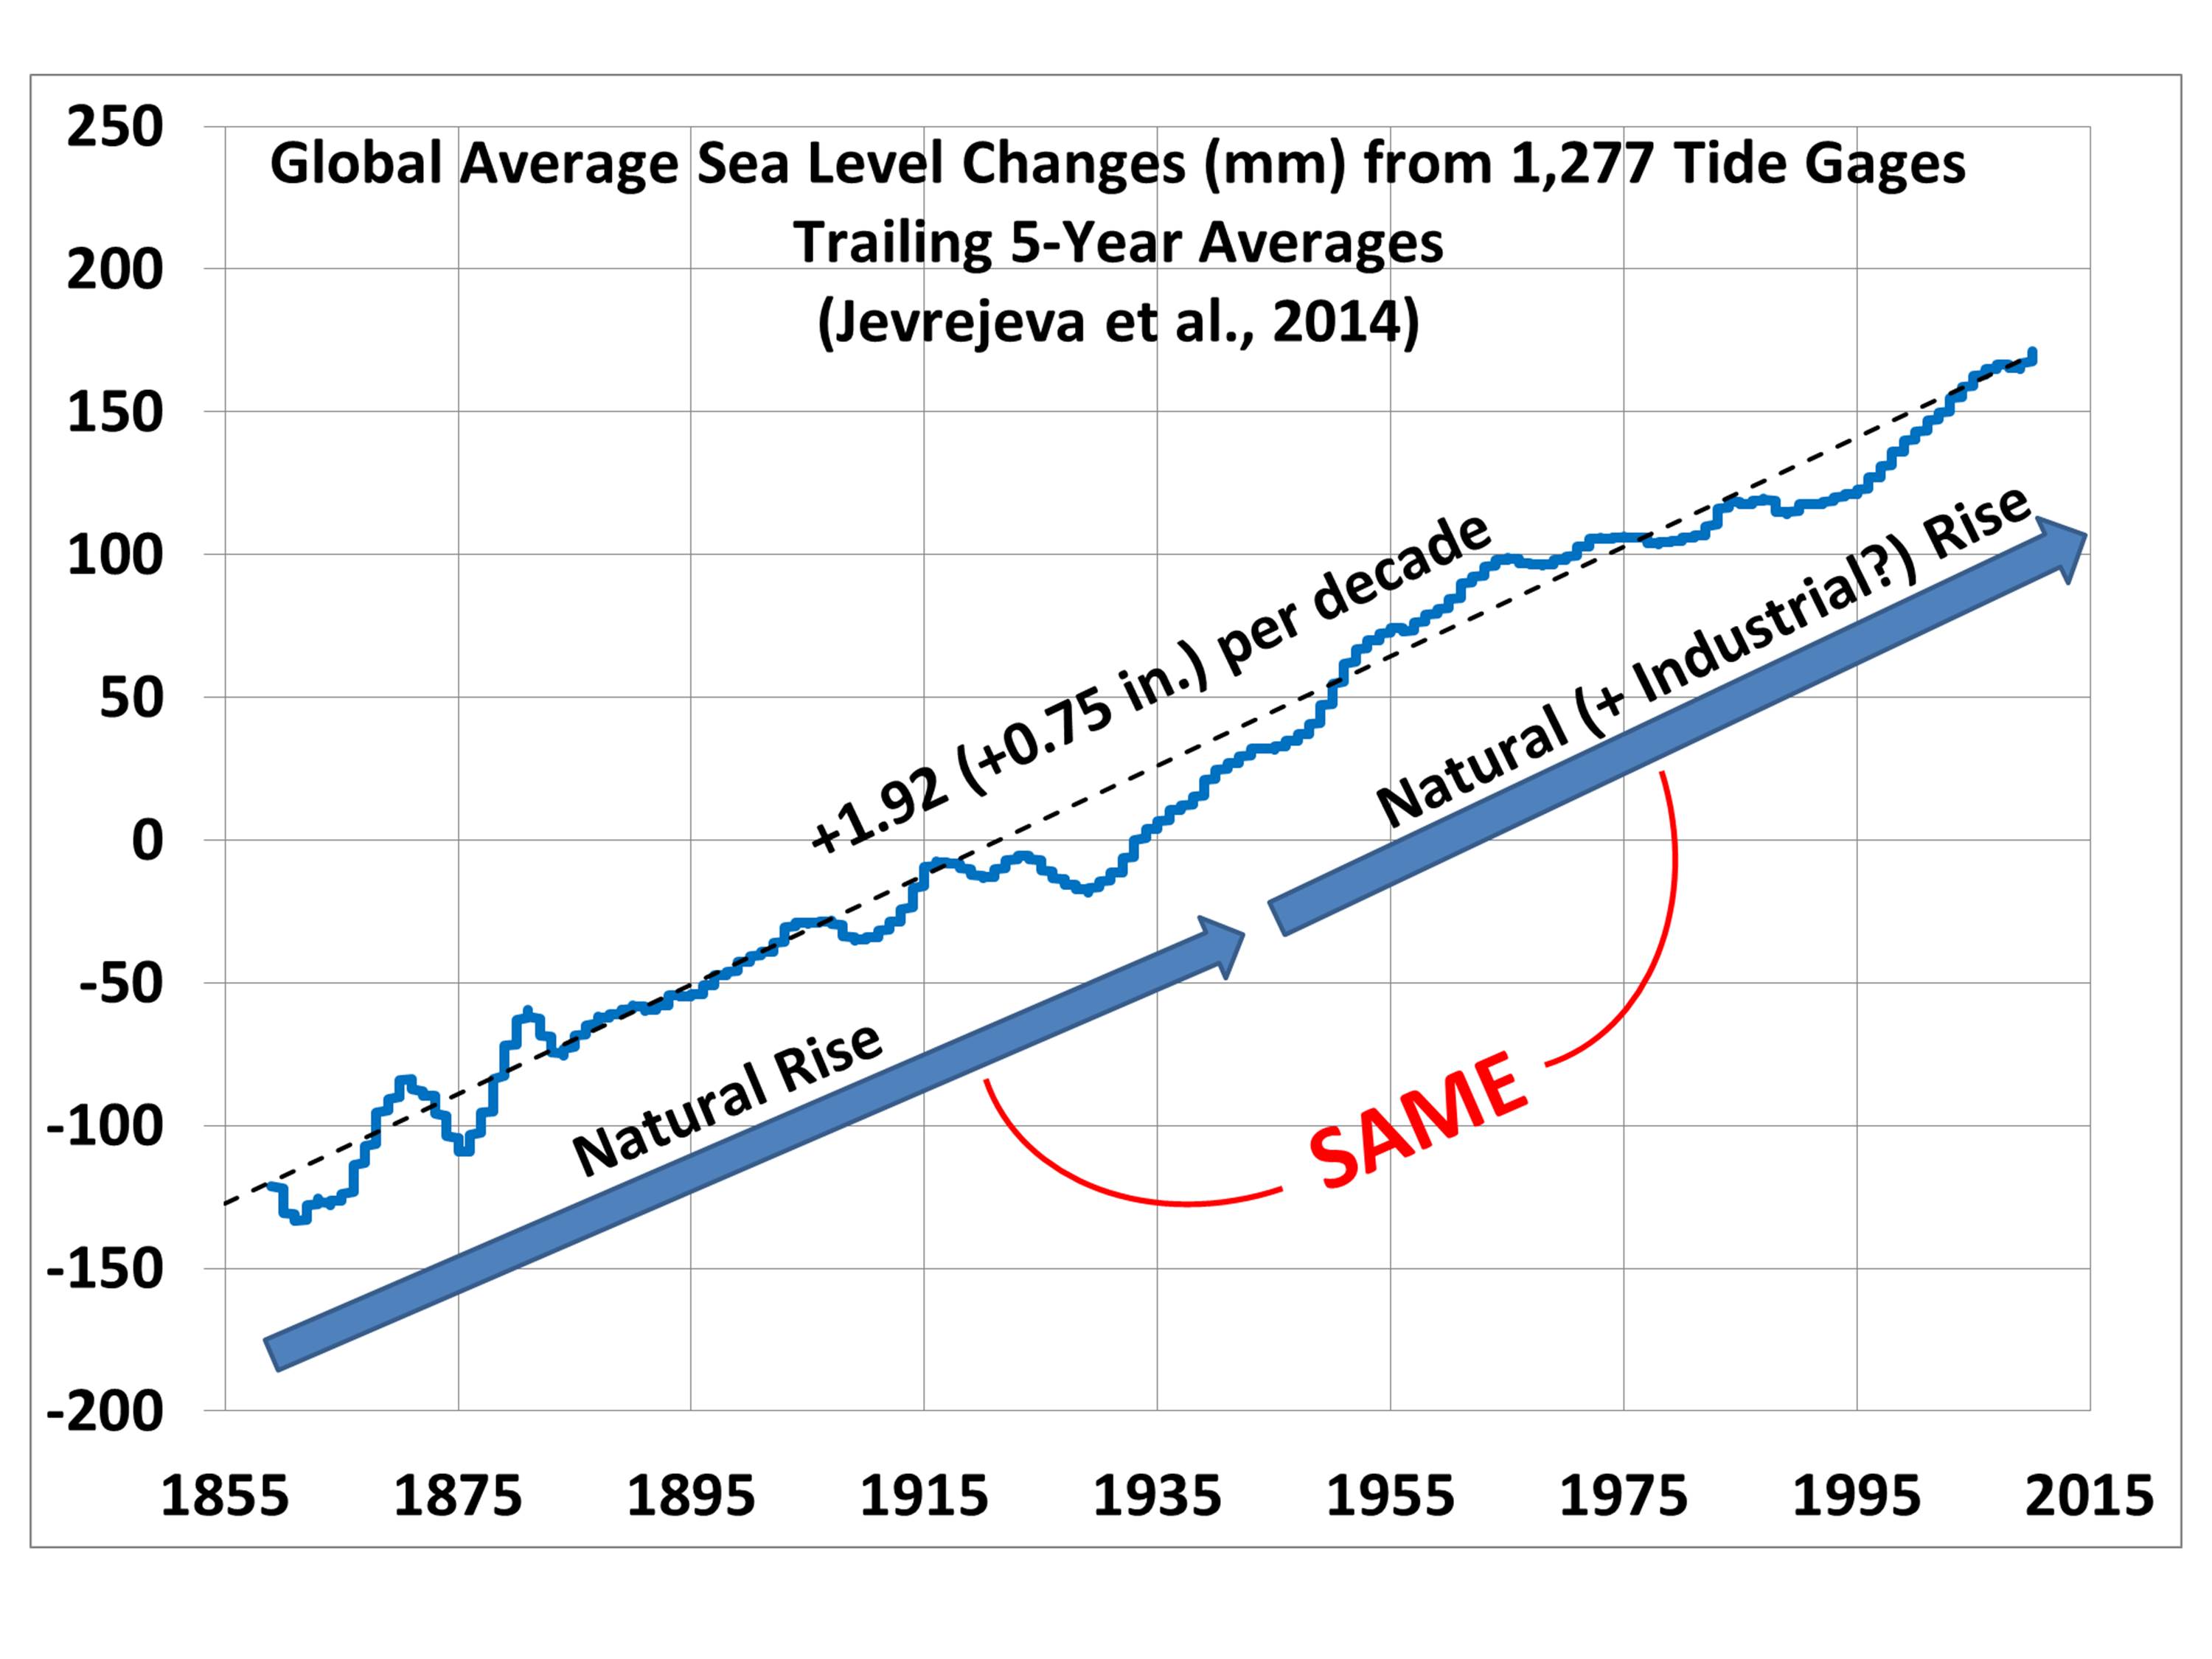
That flooding is mostly a combination of (1) natural sea level rise (I show there has been no acceleration of sea level rise beyond what was already happening since the 1800s), and (2) satellite-measured sinking of the reclaimed swamps that have been built upon for over 100 years in Miami Beach.
In other words, Miami Beach was going to have to deal with the increasing flooding from their “king tides”, with or without carbon dioxide emissions.
Gore is also shown jumping across meltwater streams on the Greenland ice sheet. No mention is made that this happens naturally every year. Sure, 2012 was exceptional for its warmth and snow melt (which he mentioned), but then 2017 came along and did just the opposite with record snow accumulation, little melt, and the coldest temperature ever recorded in the Northern Hemisphere for a July.
The fact that receding glaciers in Alaska are revealing stumps from ancient forests that grew 1,000 to 2,000 years ago proves that climate varies naturally, and glaciers advance and recede without any help from humans.
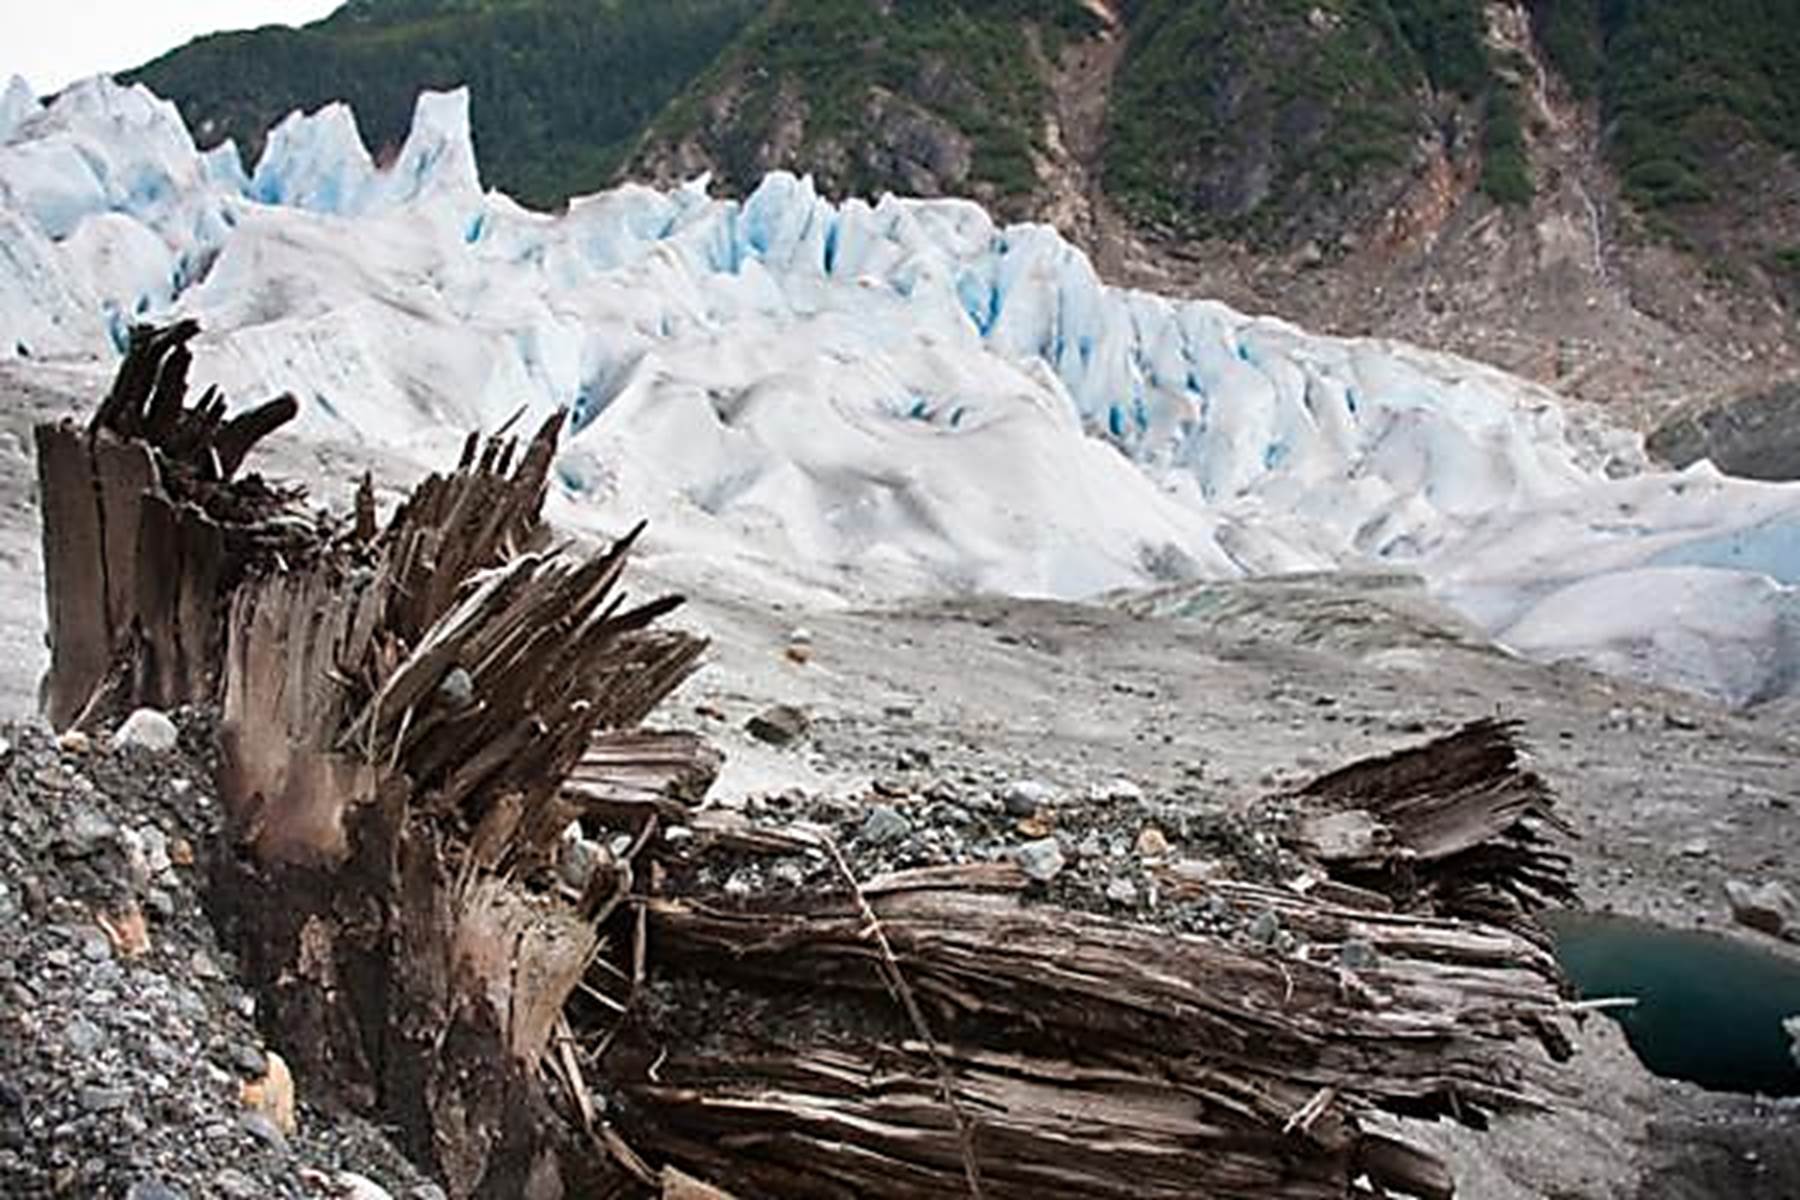
So, why is your SUV suddenly being blamed when it happens today?
The list goes on and on.
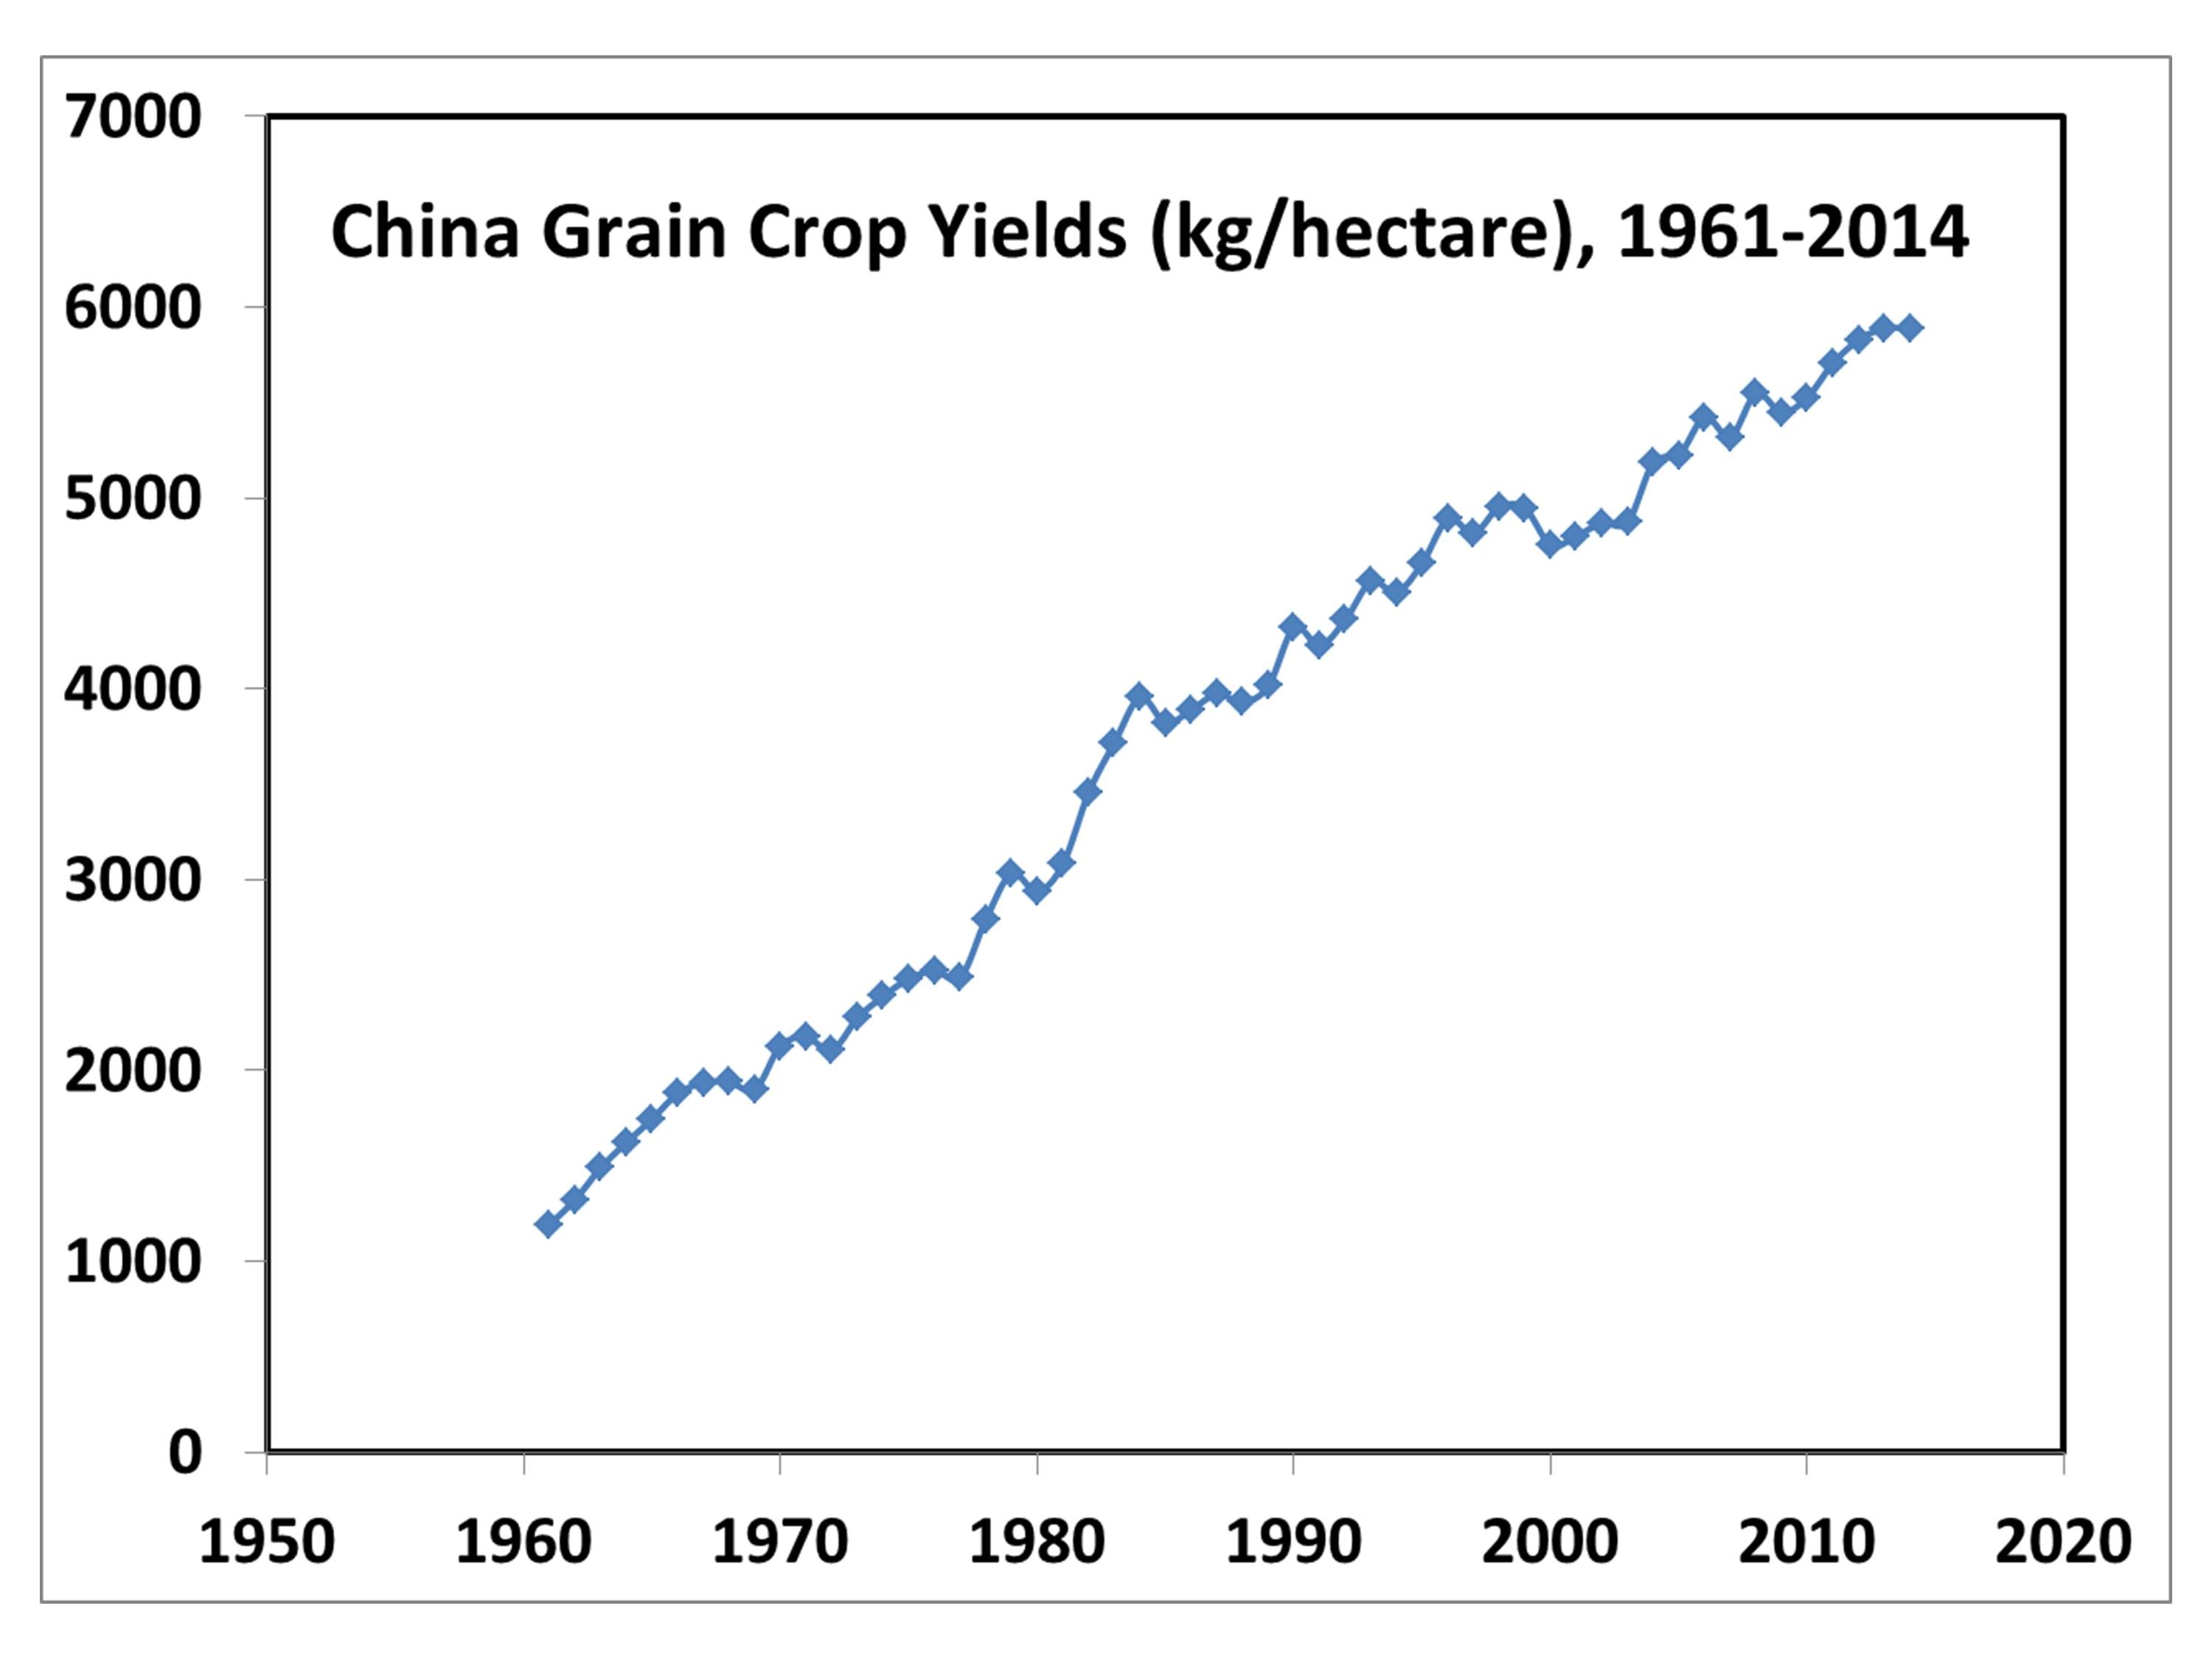
Some of what Gore claims is just outright false. He says that wheat and corn yields in China are down by 5% in recent decades. Wrong. They have been steadily climbing, just like almost everywhere else in the world. Here’s the situation for all grain crops in China:
And that lack of rainfall in Syria that supposedly caused conflict and war? It didn’t happen. Poor farmers could no longer afford diesel fuel to pump groundwater because Assad tripled the price. Semi-arid Syria is no place to grow enough crops for a rapidly growing population, anyway.
I also address Gore’s views on alternative energy, mainly wind and solar. It is obvious that Gore does not consider government subsidies when he talks about the “cost” of renewable energy sometimes being cheaper than fossil fuels. Apparently, he hasn’t heard that the citizens pay the taxes that then support the alternative energy industries which Gore, Elon Musk and others financially benefit from. If and when renewable energy become cost-competitive, it won’t need politicians and pundits like Mr. Gore campaigning for it.
To counter what is in movie theaters now, I had to whip up this book in only 2 weeks, and I didn’t have a marching army of well-funded people like Gore has had. (Too bad he didn’t have someone doing fact-checking.) Despite my disadvantage, I think I present a powerful case that most of what he presents is, at the very least, very deceptive.


Nice post
Nice post. Thanks for sharing