Total Eclipse from Center Hill Lake, TN

August 22nd, 2017 by Roy W. Spencer, Ph. D.

My family and friends drove north from Huntsville, AL the 2-3 hours to get into the path of totality. The weather was better than usual. As we drove into Tennessee, scattered cumulus and towering cumulus clouds were forming.

Our preferred destination was Hurricane Marina, 50 miles east of Nashville. This is a beautiful and rather remote spot on Center Hill Lake, and it has huge houseboats owned (I assume) by some of the wealthier people in Nashville.

Hurricane Marina on Center Hill Lake, 50 miles east of Nashville.

The two concerns driving there were traffic and the weather. Traffic was not too bad. We had previously decided to take the back roads as much as possible. Scattered clouds were forming, but I hoped that the skies would be clearer around the lake, which is large and often suppresses convection during fair weather.

When we arrived the parking lot — which is huge — was already full. We walked out on the dock to the restaurant/store, and set up folding chairs in the red tent with the blue roof in the photo, to the right of the main building. It was very warm and humid, typical for Tennessee in August.

I started setting up my two camera tripods at the lower-right corner of the platform the restaurant and shop are on. It was then that I realized the entire dock was floating (even the one with the store & restaurant) and it wouldn’t be stable enough for time lapse photography.

So, we watched the sun become covered by the moon with our eclipse glasses. The surroundings darken so gradually you barely notice the effect.

Then I suddenly realized all of the clouds were gone. The reduction in solar heating was just enough to cause the convective thermals to weaken and not penetrate the inversion that was no doubt present.

I decided to carry my equipment to the rocky shoreline in the left-center portion of the above photo. By the time I got there the landscape was getting darker by the second. I set up both tripods up the bank a ways and realized my main camera would not get both the lake surface and the sun in the frame, even at 15 mm focal length, which is very wide angle.

I quickly took one tripod to the water’s edge, set it up on three unstable rocks, inserted my intervalometer that controls the timing of the photos, and… the little button battery fell out into the water under one of the rocks.

I quickly found it, dried it, inserted it, set it to 2 second intervals and started it up. Here’s the resulting time lapse video… this is high-def, so if you watch full-screen at 1080p, you will see Jupiter at left-center.

I set the camera to a fixed exposure so you could see just how dark it gets during totality; the start of the video, even though overexposed, is when the moon has covered the sun by 97-98%, so it was already pretty dark. The video is running 30 times faster than real time.

As the sky quickly darkened, I rushed to the other tripod and placed my Nikon P900 superzoom, which I only use for video at high magnification, on it. I had already decided to not fool with the settings, and just let it run on “auto” and see what I got. The camera took video for about 5 minutes, and I learned afterward it was having difficult focusing.

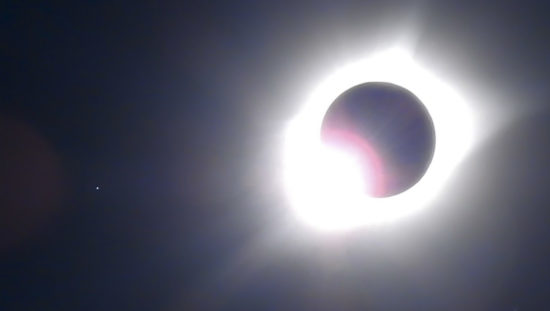
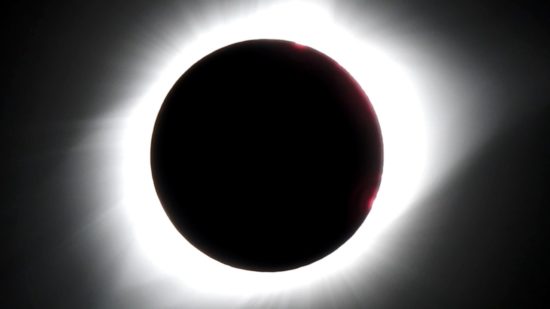
Here are a couple of screen shots from the video:

“Diamond ring” effect just before totality, with Regulus to the left.

Late in totality.

I was surprised how quickly it becomes dark as totality approaches. We had 2 minutes and 38 seconds of totality. Just as soon as totality started, fish near me jumped out of the water, and birds and crickets started chirping.

Back in Huntsville, which experienced 97% of totality, I was taking air temperatures every 10 sec in our backyard. I took ambient air temperature, as well as the air temperature in a Styrofoam cooler, painted black inside, with Saran Wrap covering it. The ambient air temperature drop during the maximum portion of eclipse was about 10 deg. F, while temperature drop in the cooler was over 100 deg. F.
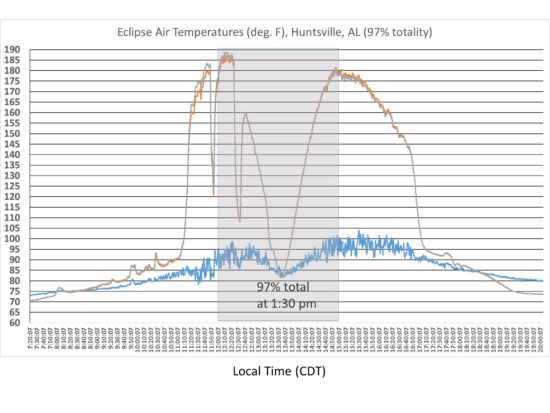
Air temperatures outside (blue trace) and inside a Styrofoam cooler (other 2 traces) during the solar eclipse in Huntsville, AL, 21 August 2017.

It was a thoroughly enjoyable experience. This was my first total eclipse, and we were indeed fortunate to have good weather for it.


123 Responses to “Total Eclipse from Center Hill Lake, TN”

Toggle Trackbacks

  1. richard verney says:

    How does that temperature profile with other temperature profiles taken at similar latitudes when CO2 was say 350 ppm, 360 ppm, 370, ppm, 380 ppm, 390 ppm.

    What we need is a data base of temperature profiles of eclipses at various latitudes including local humidity & CO2 measurements so that we can compare temperature profiles of eclipses at varying levels of CO2 concentration

    In that way we might get an insight into the effect of varying levels of CO2 in Earth’s atmosphere.

    Obviously such a data base will be difficult to compile but eclipses somewhere are a common occurrence so a suitable data base could be built up.

    • Greg Goodman says:

      Well there was ample opportunity to get some proper climate data from a wide range of different altitudes, humidity and climate yesterday.

      Hopefully we will be seeing something more interesting and informative that everyone running around like headless chickens doing nothing but posting photos to Facebook.

      If NASA had any brains and a real interest in science they will have done that instead of their feeble “outreach” school fate coverage they put out on the live feed.

      • Gordon Robertson says:

        Greg…”If NASA had any brains and a real interest in science they will have done that instead of their feeble outreach school fate coverage they put out on the live feed”.

        NASA climate news comes from GISS which is run by a mathematician/modeler and a blatant alarmist. Safer to ignore anything they output.

        • David Appell says:

          What do you mean by “alarmist?”

          • Mike Flynn says:

            David,

            Gavin Schmidt. Pretend scientist as well, I think.

            Cheers.

          • David Appell says:

            You aren’t worthy of judging him. Of course.

            Define “alarmist.”

          • Mike Flynn says:

            David,

            Are you truly dense or just pretending?

            By “alarmist” I mean the non-scientist Gavin Schmidt. Or the delusional James Hansen. Or maybe the equally deluded Michael Mann.

            Have you someone else in mind? Al “Big Buttocks” Gore, perhaps?

            Please let me know your definition of alarmist – if you can find one you think more suitable. I wait with bated breath!

            Cheers.

          • Laura says:

            @Appell

            A definition for “alarmist”? No problem.

            An alarmist is a person who will make false predictions… err, projections with your blessing.

          • alphagruis says:

            True.

            An alarmist makes fake “projections” with the blessing of a lot of tin-plated buffoons.

          • David Appell says:

            Laura says:
            “An alarmist is a person who will make false predictions”

            Plenty of great scientists have made wrong predictions, including Einstein, Bohr, Dirac, and many many others.

            So your’s doesn’t seem to be a very good definition.

          • David Appell says:

            alphagruis says:
            “An alarmist makes fake projections with the blessing of a lot of tin-plated buffoons.”

            What are “fake projections?”

          • alphagruis says:

            It’s a concept that tin-plated buffoons cannot grasp.

          • alphagruis says:

            Plenty of great scientists have made wrong predictions, including Einstein, Bohr, Dirac, and many many others.

            This might well be true and is precisely the reason why only tin-plated buffoons are dumb enough to blindly buy the predictions from climate scientists who are not even great scientists.

            Moreover, nobody, except a few other scientists, took ever notice of the “wrong predictions” or more accurately of the wrong beliefs of those great scientists.

            There were no tin-plated buffoons dumb enough to claim that humans had to and could indeed right now essentially switch to renewable energies just because Einstein believed that the universe should be static, the cosmological constant be set to zero or quantum mechanics is incomplete.

          • David Appell says:

            alphagruis says:
            “This might well be true and is precisely the reason why only tin-plated buffoons are dumb enough to blindly buy the predictions from climate scientists who are not even great scientists.”

            a) Climate scientists don’t make predictions, they make projections

            b) You misunderstand science. Einstein eventually got the right prediction for the bending of starlight around the sun. (He was off by a factor of 2 earlier.) Dirac predicted a better g-factor of the electron’s magnetic moment than did Bohr. Then Schwinger made an even better prediction using his quantum mechanics. Physicists have since extended that calculation to several more orders, and have now predicted g-2 for the electron to about 10 decimal places compared to observation.

            You see, you have to, as always, understand the context. You clearly don’t.

            You don’t get to reject a prediction (or projection) just because some other prediction in some other field in the past wasn’t perfect. That’s the height of intellectual laziness. Science keeps rolling toward every more accurate results. Same for climate science.

            But you reject any and all science if it doesn’t agree with your “feelings.” Which shows you aren’t interested in science whatsoever.

          • Laura says:

            @Appell

            Yep, ignoring what you find inconvenient about the “definition” and then taking the rest out of context indeed can be made to mean whatever you want it to mean… provided you are a child.

            Meanwhile you continue to excuse those that make outrageous claims as well as their preposterous predictions… err, projections.

            These predictions, err, projections are proven false again and again.

            And so,

            false predictions + your blessing = alarmist

            Now try again without pretending you misunderstand, as you always do… or simply post links to your exchanges with alarmists (e.g. Gore) telling them their claims are unscientific and so on. It really is that simple.

          • alphagruis says:

            You seeYou misunderstand science…

            No , I don’t and guess what ?

            I am a physicist. About 150 peer-reviewed papers.

            Obviously you are not one and at any rate you certainly never made any contribution to Physics. You just spout idiotic babble about physics.

            On several occasions before (and there with certainty are many more) I took some time to point out your obvious misunderstanding of physics.

            But you reject any and all science if it doesnt agree with your feelings. Which shows you arent interested in science whatsoever.

            Hilarious !

            You know absolutely nothing (or a shit) about the reasons why I reject question and take with a big grain of salt the ‘projections” of climate models. As I told you, tin-plated buffoons can’t grasp such things.

    • g*e*r*a*n says:

      As we like to remind the pseudoscience types so often, “It’s the Sun, stupid”.

      But, hilariously, they do not get it.

      • David Appell says:

        What is the proof it’s the Sun?

        • Joz Jonlin says:

          “It’s the sun, stupid” is a great quote from Dr. Willie Soon.

          If the sun isn’t the primary source of energy for the oceans and atmosphere, what is?

          • David Appell says:

            (Sigh.)

            How is the sun responsible for modern warming?

          • Gordon Robertson says:

            DA…”How is the sun responsible for modern warming?”

            Something happened with the Sun between 1400AD and 1850AD. The Maunder Minimum occurred during that period, called the Little Ice Age.

            During the LIA, the planet cooled 1 to 2C and winter sports came into being like ice skating in Holland. The River Thames froze solid from the ocean up past London. Circa 1600, several scientists are on record as noting the extreme cold in winters. Glaciers expanded enormously and the atmospheric CO2 concentrations seem to have dipped significantly as the colder oceans absorbed it.

            Since 1850, the Sun seems to have warmed enough to produce modern re-warming. BTW…the re-warming seems to have ended.

            Modern warming can be explained due to natural causes, why are we grasping at straws with a gas like CO2 that makes up 4/100ths of 1% of the atmosphere?

          • David Appell says:

            Gordon Robertson says:
            “During the LIA, the planet cooled 1 to 2C”

            Wrong. Europe and N.A. cooled. The cooling of the entire planet was less than 1 C. See any hockey stick.

          • David Appell says:

            Gordon Robertson says:
            “Since 1850, the Sun seems to have warmed enough to produce modern re-warming.”

            Prove it. Show me the physics that shows that the increase in solar irradiance since the Maunder Minimum, or even LIA, can account for modern warming. Give the numbers. Show your calculations.

            BTW, modern warming has certainly NOT stopped. 2016 was the warmest year in the records. Ocean heating continues getting higher year after year.

    • Gordon Robertson says:

      richard verney…”In that way we might get an insight into the effect of varying levels of CO2 in Earths atmosphere”.

      It’s already obvious there is no effect from the trace amount of CO2 in the atmosphere.

      • David Appell says:

        Then explain this:

        “Radiative forcing measured at Earths surface corroborate the increasing greenhouse effect,” R. Philipona et al, Geo Res Letters, v31 L03202 (2004)
        http://onlinelibrary.wiley.com/doi/10.1029/2003GL018765/abstract

        • AaronS says:

          Dave,
          Can you help me with my understanding. I can not access full text. What is 1.8 w/m*2 (measured cloud free) and 4.8 w/m*2 (modeled radiative forcing)? I dont get why they subtracted two thirds.

          http://onlinelibrary.wiley.com/doi/10.1029/2003GL018765/abstract

          “Model calculations show the cloud-free longwave flux increase (+4.2(1.9) Wm−2) to be in due proportion with temperature (+0.82(0.41) C) and absolute humidity (+0.21(0.10) g m−3) increases, but three times larger than expected from anthropogenic greenhouse gases. However, after subtracting for two thirds of temperature and humidity rises, the increase of cloud-free longwave downward radiation (+1.8(0.8) Wm−2) remains statistically significant and demonstrates radiative forcing due to an enhanced greenhouse effect.”

          • David Appell says:

            Aaron: Read the paper.

          • AaronS says:

            I actually did read it. But my model (pulled out of thin air) indicates that 75% of WV increase was “due to circulation changes over central Europe. On the northern hemisphere, non-uniform warming with differing decadal and marked seasonal and regional variations is often related to changes of the North Atlantic Oscillation (NAO) [Hurrell, 1995].” I added the largest el nino/ la nina couplet in recorded history that occured from 1997 to 2001.. they did not. Do you trust or fully understand the 2/3 correction? It seems to me the 2/3rd correction defines the outcome. Im not sure i fully understood the number bc I didnt do the math again, so im asking since you cite it.

          • David Appell says:

            Aaron: See the penultimate in their section 4.

            “According to the GCM calculations only one third of the
            measured water vapour increase (Figure 1b) is due to
            feedbacks of anthropogenic greenhouse gas increases.”

        • Gordon Robertson says:

          DA…”R. Philipona et al…”

          Philipona is a well know climate alarmist who dabbles in pseudo-science.

    • David Appell says:

      richard verney says:
      “In that way we might get an insight into the effect of varying levels of CO2 in Earths atmosphere.”

      That’s already well known, and it didn’t take eclipses to find out.

      • richard verney says:

        David

        Please will you point me to the standard text books (whether physics or Chemistry) that sets out the known and measured physical properties of CO2 and which detail as one of its known properties that each ppm leads to X deg C of temperature rise, or each mole of CO2 leads to X deg C of temperature rise.

        I have yet to see a standard text book provide this information.

        • Gordon Robertson says:

          richard verney…”Please will you point me to the standard text books (whether physics or Chemistry) that sets out the known and measured physical properties of CO2…”

          All you need is the law of partial pressures and the Ideal Gas Law. The atmosphere can be considered a constant volume with constant mass. Therefore, the Ideal Gas Law can be written P = (nR/V)T, where nR/V is a constant. That means T varies proportionately with P.

          Since P is dependent on mass (n) and gravity varies the mass by altitude, P varies with altitude as does T.

          Here’s the good part, with a mixed gas such as the atmosphere the total atmospheric pressure can be broken down into the partial pressures of N2, O2, Ar, CO2, etc. In a gas, the partial pressures are also related to the respective masses.

          Since N2 and O2 account for nearly 99% of the mass of the atmosphere they must provide 99% of the pressure and 99% of the temperature. CO2, at a relative mass percentage of 0.04% cannot contribute more than a tiny fraction of 1% of the warming.

          That’s ideal mind you but the reality can’t be far off that.

        • David Appell says:

          Richard, in which textbooks have you looked that you found wanting?

          The two textbooks I know best are Dessler’s and Pierrehumbert’s. Have you read either? They cover what you’re looking for, and much much more.

  2. richard verney says:

    Dr Spencer

    I take it that you did not measure surface radiation (UPLWIR) and/or DWLWIR during the eclipse.

    It would be interesting to know how that changed so we get a better insight into how DWLWIR keeps us warm,

    • those data should be available today from Goodwin Creek, MS Surfrad site..not total, but 91% total.

      • Greg Goodman says:

        Hi , I had a breif echange woth Dr Christy a couple of weeks ago, he said UAH were ‘deploying some assets” at Nashville.

        Can you tell us any more about that?

        thx.

      • Gordon Robertson says:

        Roy..”those data should be available today from Goodwin Creek, MS Surfrad site..not total, but 91% total.”

        Nothing I can see. I reckon they found no warming and suppressed the news. ☺

  3. RAH says:

    Well Doc, if we’re around in 7 years we’ll get another shot at it on April, 8, 2024.

    The path of totality will be coming pretty much over me near Indianapolis and you’ll have to travel to the west or north to catch it.

    During this one I happened to be driving my truck right up I-55 in S. IL. Stopped on the northern edge of the 100% totality band near Marion, IL then took off and kept trucking north after totality ended. That kept me ahead of the massive traffic jam on I-55 coming from the south when the event was over.

    http://thejoshuaaaronblog.com/wp-content/uploads/2016/08/Screen-Shot-2016-08-23-at-7.28.52-PM-1024×673.png

    • Steve Case says:

      …the massive traffic jam on I-55 coming from the south when the event was over.

      Oh was it ever!

      All the back roads were pretty well clogged up as well. Our Estimated Time of Arrival in Milwaukee was delayed by about three hours.

      You Tube from our viewing spot:

      Eclipse Kaskaskia, IL 2017

      • RAH says:

        Traffic was no fun going down either. On Sunday morning at 08:30 I drove to the Ball Metal Container facility in Findlay, OH to pick up a load of Mountain Dew cans bound for Dyersburg, TN for delivery at 06:30 EDST Monday. My route took me down I-75 to I-71 to I-64 to Louisville, KY then down I-65 to catch the Western Kentucky Parkway. Traffic was heavier than normal from the time I hit I-64 until I pulled into take a my break at the vicinity of the Land between the lakes off I-24. It was the last day of the Kentucky State Fair in Louisville and that didn’t help. There was more traffic on the Western Kentucky Parkway than I’ve ever seen.

  4. ossqss says:

    Nice job under the circumstances Doc.

    I spent the afternoon with my 7th grader’s class showing them how to make pinhole projectors with paper and also their fingers. I did make a binocular projector, but you still see spots after looking at the very bright image projection. You could actually see Sunspot 2671 if you zoomed and focused just right.

    I wonder how many people purchased the bootleg non-ISO glasses and now have issues. One of the local schools had 800 of them they could not use due to saftey concerns. The good glasses did quite a good job for viewing.

  5. Patrick healy says:

    Wonder what caused that temp drop? (Sarc)

  6. Michael Kelly says:

    I have been curious about the weather effects of the eclipse, and am more so now that we experienced what we did. In Manassas, VA, the weather forecast for eclipse time was “partly cloudy.” The morning was crystal clear, and nothing more than wispy stratocumulus clouds appeared as eclipse time approached. I had wondered if the drop in temperature would cause clouds to form in humid air. Well, as soon as the penumbra showed up, the clouds did as well. Great big ones, accompanied by thunder. We were able to see most of the eclipse through breaks in the clouds, but they continued to build. The wind on the ground was easterly (i.e. blowing toward the approaching eclipse), which I’ve never experienced there. Winds aloft were clearly westerly, as is normal for the area.

    As the eclipse was ending, the rain began. It was torrential, as was the thunderstorm that accompanied it. This went on for a while until the most amazing part. The rainfall was easily in the top 10 that I’ve ever experienced (including one hurricane), but the sun was shining brightly! None of that had been predicted.

    Then all of the clouds disappeared, just as quickly as they had appeared. Our greenhouse, by the way, went from an internal temperature of 101 F to 86 F (the only hard data I have).

    Did anyone else experience weird weather?

  7. jimc says:

    Totally off topic, but interesting:

    “Because after applying the latest big data technique to six 2,000 year-long proxy-temperature series we cannot confirm that recent warming is anything but natural what might have occurred anyway, even if there was no industrial revolution.”

    https://www.spectator.com.au/2017/08/big-data-finds-the-medieval-warm-period-no-denial-here/

  8. Rud Istvan says:

    We watched the half hour to max ~88% at a beach park next to our building in Fort Lauderdale, using an aluminum foil pinhole on cardboard held high and a white cardbord screen on the ground for the largest possible image. Temperature drop was noticable, but we had not thought to bring a thermometer. But we had an excellent proxy. Summer afternoons we get a good seabreeze as land to our interior heats and causes convection (the source of typical late afternoon Tstorms). For the viewing period up to about 5 minutes before max, I was struggling to hold the pinhole sheet high and at the proper angle, and for the first 15 minutes or so also had to keep a foot on the white cardboard screen on the ground to hold it down. About five minutes before max the seabreeze died completely as the exclipse shut down the interor land convection. Started up again weakly about 10 minutes after max. Qualitative, but convincing evidence.

  9. JDAM says:

    The Eclipse out blocked 1% Earths insolation.
    The energy equivalent to 2,380,952 Hiroshima bombs

    • Greg says:

      … and 1% of insolation is 13.6 W/m^2

      where does that factoid come from? 1% for 2.5 min or for 5.5 hours?

      1% average or “up to ” 1%.

      Is the existing monitoring network registering a 13.6 W/m2 change ?

      could be interesting.

    • Michael Kelly says:

      The totality spot was 60 miles in diameter, and the earth’s diameter is 7,920 miles. So the insolation completely blocked was 5.7E-5 of the total, lasting about 2 hours.

      However, even here in Virginia, the blockage was over 80%, which means that the reduction in insolation was much, much larger. It would be interesting to integrate the total energy blocked over time, and compare it to total unblocked insolation.

    • David Appell says:

      JDAM says:
      “The Eclipse out blocked 1% Earths insolation.”

      I don’t think so.

      The width of the path of totality was about 70 miles, and it was about the same in the line of its path.

      So the area of totality ~ 1e10 m2

      Half the Earths’s surface area is 3e14 m2.

      So at any given time the area of totality only blocked about 0.004% of the Sun’s irradiance.

      Solar insolation varies with the cosine of latitude, but I’m not going to go into that here.

      But what was blocked was much less than 1%, and then only for a few hours.

    • David Appell says:

      JDAM says:
      “The Eclipse out blocked 1% Earths insolation.”

      No. (It’s disappointing that my first reply to this was deleted.)

      The width of the path of totality was about 70 mi, and the distance of totality, along the path, was about the same.

      So the area of totality is about 1e10 m2.

      Half the Earth’s surface area is 3e14 m2.

      So the area of totality only blocks 0.004% of the Earth’s sunward side.

      Solar irradiance is proportional to the cosine of latitude; Salem OR has a latitude 45%. That reduces the irradiance by a factor of about 1/sqrt(2).

      So the eclipse only blocked about 0.003% of the sunlight incidence on Earth. Much much less than 1%.

  10. Gary Hemminger says:

    I flew from San Jose CA to Portland and drove to Salem to watch the eclipse. The thing that was so interesting to me was that it wasn’t until just about totality that it became noticeably darker. And the moon was so black. I can see why people in the olden days were scared of these things. They didn’t have special glasses and wouldn’t have noticed anything until the Sun was fully blocked. Must have scared them out of their wits.

    By the way Dr. Spencer, your website is full of information. I check it almost every day. I am a democrat living in silicon valley all of my life and I am a DENIER! I will eventually be imprisoned for my beliefs!!!

    • David Appell says:

      Gary Hemminger says:
      “I am a democrat living in silicon valley all of my life and I am a DENIER! I will eventually be imprisoned for my beliefs!!!”

      No, you won’t. John Coleman won’t either.

      But why do you write this kind of thing? Do you get off on considering yourself such an iconoclast that society can’t abide your existence? Does thinking that make you feel better? What is it? I’m honestly interested….

  11. Gordon Robertson says:

    Question:

    I did not have the proper eclipse glasses so I was using the vertical corners on the house to slowly approach the Sun while not staring at it directly. I could not see the Moon approaching on either side.

    I don’t even see the Moon approaching on Roy’s video. Maybe the scale is to small since the corona at total eclipse appears as a small, bright disk.

    Why not?? I would think it would appear as a back lit black orb at least. There was nothing at our latitude where the eclipse was 85%. Even at full eclipse, an instantaneous glance revealed nothing, it was way too bright.

    I’m calling this eclipse fake news. ☺ No moon, no darkness…fake news. ☺

    It did not get dark. If anything it dimmed slightly to what one might expect early in the morning when the Sun was still low above the horizon.

    • Gordon Robertson says:

      To partly answer my own question, the reason should be obvious. The side of the Moon toward us does not reflect any light, even though light from the Earth is shining on it. That renders it invisible. I was thinking that solar light would back light the rock but apparently that does not happen till the Moon is very close to the Sun’s edge.

      Apparently, as the Moon gets close to the sun, light can be reflected off the edge of the Moon closest to the Sun. That phenomenon is called Bailey’s Beads and is due to light from the Sun shining off craters on that edge of the Moon.

      I would have thought such a crescent of light would have been more prominent as the Moon approached, rendering it partially visible.

      Goes to show that we take light for granted. Visible light is a portion of the electromagnetic spectrum and carries no colour and no heat. The eye converts certain parts of the EM spectrum to colour and EM does not have heat as a property, not even IR.

      Makes me wonder what the actual planet looks like when not viewed from the human eye. It has no colour that the eye does not add to the EM it receives. So, what does a leaf we see as green actually look like with sunlight shining on it? We know what it looks like when there is absolutely no light, we cannot see it.

      • David Appell says:

        Gordon Robertson says:
        “Apparently, as the Moon gets close to the sun, light can be reflected off the edge of the Moon closest to the Sun. That phenomenon is called Baileys Beads and is due to light from the Sun shining off craters on that edge of the Moon.”

        No. They are due to sunlight shining through the valleys of lunar mountains.

      • David Appell says:

        Gordon Robertson says:
        “Visible light is a portion of the electromagnetic spectrum and carries no colour and no heat.”

        Asinine. Color = wavelenght, and energy = Planck’s constant * frequency.

        Gordon, I’m sorry, but you are beyond hope. You get EVERYTHING wrong. Amazing.

        • Gordon Robertson says:

          DA…”Asinine. Color = wavelenght, and energy = Plancks constant * frequency”.

          You are abysmally ignorant. Where, anywhere in physics, does it state that the different frequencies in EM represent colours? Where does it say that heat is a property of EM?

          EM is composed of an electric field and a magnetic field perpendicular to each other. Any electrical field generates a magnetic field perpendicular to it. An electric field is dependent on electrical charges. I suppose now you’ll tell me electric charges have colour as well as heat.

          The origin of EM is an electron in an atom. An electron has an electric charge.

          The retina in the eye has rods and cones that process the light received through the lens. The cones have receptors that convert different EM frequencies into colours.

          If you can’t understand the very basics of physics why are you commenting on climate issues that involve EM and heat?

      • David Appell says:

        Gordon Robertson says:
        “So, what does a leaf we see as green actually look like with sunlight shining on it?”

        Green.

        • Mike Flynn says:

          David,

          I’d be inclined to demand that you prove it, and demand that you define green, providing citations to peer reviewed publications, but then I’d be imitating the tactics of Witless Wayward Warmists.

          Or I could point out that your answer is meaningless to a surprisingly high percentage of the population who happen to suffer from colour blindness.

          Best, perhaps, if I resort to pointless and irrelevant one word responses generally characteristic of commenters finding themselves bereft of facts. Take your pick –

          Stupid.
          Simplistic.
          Wrong.

          Cheers.

        • David Appell says:

          You want me to prove the leaves look green??

          You just surpassed your own previous level of absurdity.

          • Mike Flynn says:

            David,

            Yes, please. Prove it. You are inferring you can, as far as I can see. How hard can it be?

            It seems you asked someone –

            ‘What is the proof its the Sun?” I understand your inability to accept that the heating of the exposed surface during the day is due to sunlight, and your subsequent demand for proof. Most people find the connection between sunlight and temperature reasonably easy to understand, but they’re probably rational.

            If you are really as thick as you pretend, why should anyone accept your assertions as fact? Why do you think the Blue Mountains in Australia are so called? Maybe because nobody knows the difference between green and blue?

            Give us proof, David!

            Cheers.

          • David Appell says:

            Please define “green.”

          • David Appell says:

            Mike Flynn says:
            “Most people find the connection between sunlight and temperature reasonably easy to understand, but theyre probably rational.”

            Explain why surface temperature doesn’t drastically plummet when the sunlight goes away.

          • Mike Flynn says:

            David,

            Somewhat predictably, you demand that I define “green”.

            As I said previously, if I followed the Witless Warmist practices –

            “. . . Id be inclined to demand that you prove it, and demand that you define green, . . . ”

            I’m not a Witless Warmist, so I left that piece of stupidity to you.

            As usual, you also demand that I explain the blindingly obvious. Remind me where you obtained your PhD in physics – I’ll try to avoid recommending it to others.

            Temperatures can plummet to around -85 C in the absence of strong sunlight in some places. Your simplistic Warmist thinking probably finds this hard to believe, but most people accept that such low temperatures are due to not enough sunlight, rather than too much!

            Keep at it David! Maybe you could relocate to France – I believe the country is seeking delusional people to boost the population. I don’t know why.

            Let me know how you get on.

            Cheers.

          • David Appell says:

            Flynn – you flake out at every question, and run away scared. You’re just a substanceless troll. Both a denier and a coward. Pathetic.

          • Mike Flynn says:

            David,

            If you think I give a tinker’s curse for your opinion, you are mistaken. Would you like some assistance to devise better epithets and aspersions? I appreciate your enthusiasm, but your implementation could use a bit of a polish-up, if you don’t mind me saying so!

            Let me know if you want help. It’s fairly obvious you need some.

            Cheers.

          • richard verney says:

            To add to the debate. Here are what leaves look like with sunlight.

            http://4.bp.blogspot.com/-y_t1knYU4tY/UGWf3k5-ACI/AAAAAAAAAQk/KH6Y-6065TQ/s1600/autumn-leaves.jpg

          • David Appell says:

            FLynn: I couldn’t care less what you think of my opinion.

            Buy you misunderstand my facts at every opportunity. That is, when you don’t avoid them altogether.

          • Gordon Robertson says:

            DA…”You want me to prove the leaves look green?? You just surpassed your own previous level of absurdity”.

            You just proved my point with the word ‘look’ which means a human is looking at the leaves. Without human vision, the leaf has no colour.

            Green is a colour produced by the retina in the human eye. The corresponding frequency that stimulated the cones in the retina to produce the colour green corresponding to that frequency (yes…there are many shades of green at different EM frequencies) has no colour.

            EM is invisible to the human eye, however, EM can stimulate the cones in the human eye as radiation and the stimulation produces a biochemical process we recognize as the colour green as the end result. No one has any idea what the actual leaf looks like colour-wise, all it does is absorb certain EM frequencies and reflect others.

            The truly sad part is that many people ‘believe’ this amazing phenomenon related to sight happened by sheer fluke when 5 basic elements happened to bond together in a primeval soup. No one can explain how the heck that could have happened, and the odds against it happening by chance are billions and billions to one, but believers like DA will fight emotionally to defend their belief system, just as they do for the pseudo-science behind catastrophic global warming theory.

            Neither theory can be proved using the scientific method but that does not stop the believers proselytizing. Same goes for IR and heat. Climate alarmists are thoroughly confused about the relationship between IR and heat. Some even call IR heat.

            Some, in their confusion, resort to calling everything energy without specifying what energy they mean. AGW looks good on the surface till someone begins applying real physics to the theory. Meantime, alarmist scientists are cashing in big time with grants offered by stupid, naive politicians.

          • David Appell says:

            Gordon Robertson says:
            “Without human vision, the leaf has no colour.”

            Duh.

            What a ridiculous answer.

            “EM is invisible to the human eye, however”

            Just what do you think your eye is seeing, anyway??

          • David Appell says:

            Gordon Robertson says:
            Without human vision, the leaf has no colour.

            Do feces stink if there is no one around to smell them?

          • David Appell says:

            Gordon Robertson says:
            “No one has any idea what the actual leaf looks like colour-wise”

            Define “looks like.”

            Can’t believe your going to deny even the color green.

          • David Appell says:

            Gordon Robertson says:
            “EM is invisible to the human eye, however, EM can stimulate the cones in the human eye as radiation and the stimulation produces a biochemical process we recognize as the colour green as the end result.”

            Then EM isn’t invisible to the human eye, as you claimed, is it?

          • David Appell says:

            Mike Flynn says:
            “Temperatures can plummet to around -85 C in the absence of strong sunlight in some places. Your simplistic Warmist thinking probably finds this hard to believe, but most people accept that such low temperatures are due to not enough sunlight, rather than too much!”

            Without Sunlight, why don’t they plummet to near zero?

        • Gordon Robertson says:

          DA…”So, what does a leaf we see as green actually look like with sunlight shining on it?

          Green”.

          Some colour blind people may not be able to see green. Why?

          You don’t suppose that has something to do with a deficiency in the eye do you?

    • David Appell says:

      Gordon Robertson says:
      “Maybe the scale is to small since the corona at total eclipse appears as a small, bright disk.”

      No, it’s the exact opposite of this — the corona appears as the brightness shining outward from the black solar disk. About 3-4 solar diameters, from what I could gauge yesterday.

  12. ren says:

    If sun activity persists, the jet stream will be parallel.
    This will increase the possibility a hurricane in the Atlantic.

  13. Massimo PORZIO says:

    Hi Dr. Spencer,
    thank you for the nice time lapse videos.

    “Just as soon as totality started, fish near me jumped out of the water, and birds and crickets started chirping”

    I really wondered about that, it’s about the opposite of what happened in 1999 when all birds and pets standed in silence.
    But thinking a little more, it could be that there were not any “noisy” nocturnal animals in Baden Baden.

    Maybe that this is a silly question (I apologize for my ignorance in the field), but how do you explain the thin luminous line around the moon visible for example in your second video (https://vimeo.com/230673030?from=outro-embed) at minute 1:00?

    The sun was shining on the opposite side, so how could that light be directed to the Earth?

    Have a great day.

    Massimo

    • Gordon Robertson says:

      Massimo…”how do you explain the thin luminous line around the moon…”

      The effect is called Bailey’s Beads.

      https://en.wikipedia.org/wiki/Baily%27s_beads

      • Massimo PORZIO says:

        Hi Gordon,
        thank you for the reply.

        What is tricking me is how that is possible, since the sun was reappearing on the right and the Moon is an almost spherical body, I wonder how that line is visible at the leftmost opposite edge.
        Since light in vacuum propagates straightly, how could it be possible that any reflector directed that light toward us?

        I mean, the sun rays are tangent to the hidden horizon on the opposite side that we can’t see from the Earth. Without any atmosphere, by which optical phenomenon are those rays spread in manner to follow the lunar curvature till the Moon horizon visible from the Earth?

        Have a great day.

        Massimo

        • David Appell says:

          Mass bends light. (Einstein.)

          But that’s not happening here.

          • Massimo PORZIO says:

            Hi David,
            Thank you for your reply,
            yes I though that but I guessed that the mass of the Moon should be too little for that.

            Have a great day.

            Massimo

          • David Appell says:

            Good question, but the mass of the Moon is too small.

            The angle of the bending of starlight varies as m/r, where m is the body’s mass and r its radius. For the Moon this is 1e-5 compared to the Sun, and for the sun the bending is already tiny: 1.75 seconds of arc.

            So bending around the Moon would be extremely tiny.

        • Bart says:

          Massimo – The angular diameter of the Sun as viewed from Earth is slightly greater than that of the Moon (by about 2 minutes of arc). You’ve also got a bit of scattering of light from lunar features, and then there are diffraction effects.

          • David Appell says:

            Actually for Monday’s eclipse the lunar obscuration of the Sun was 103%.

          • Massimo PORZIO says:

            Hi Bart,
            thank you for the reply.
            Looking to some astrophysicists blogs, I agree with David about the the Moon/Sun size ratio.
            They warned about using the the moon distance from the surface of the Earth, not its center, and for August 21 the ratio was 1.03 indeed.

            About the diffraction hypothesis, shouldn’t the incoming wave-front overhang the border?
            With that 1.03 Mon/Sun ratio and especially when the Sun was not fully covered by the Moon, I expected to see at least a brightness reduction of that border line on the opposite side, but I can’t see that, if not when the Sun is clearly rose on the other side.

            https://youtu.be/G10m2ZZRH4U?t=273

            Stop the video player to that frame.
            There is some artifacts from the camera lenses, but the shinning line seems still very bright on the size opposite to the lunar sunrise.
            I’m not convinced that multiple edge diffraction could be get that. By the way to be effective as a diffractor, the edge must be sharp, the less is sharp the less the light is diffracted, I don’t believe that the lunar horizon could be considered a good diffracting edge.

            Ok, I’m an innate skeptic, but that’s me, and of course I could be wrong and it could be just a diffraction effect as you suggest.

            Have a great day.

            Massimo

  14. AaronS says:

    Nice pics and data. The difference seems large and is something for me to think about.

  15. Scott says:

    So if the temperature inside the Styrofoam cooler reached almost 190 deg F, does that mean that there was about 950 w/m2 solar radiation upon it, or a combination of SW and downwelling IR to add up to 950 w/m2, but doesn’t it need that much radiation to reach 190 degrees?

  16. Geoff Sherrington says:

    Roy,
    Thank you from Australia for the lovely photography.
    Re your graph of ten-second backyard temperature readings incl. the Strofoam box, we see again an artefact that we here are trying to explain. The noise level in the profile seems to vary with temperature.
    We have this in our BOM data once we shifted away from LIG thermometry to ASOS or AWS or whatever acronym for electronic.
    It is unexceptional except that our BOM routinely records thus –

    “Firstly, we receive AWS data every minute. There are 3 temperature values:
    1. Most recent one second measurement
    2. Highest one second measurement (for the previous 60 secs)
    3. Lowest one second measurement (for the previous 60 secs)
    Relating this to the 30 minute observations page: For an observation taken at 0600, the values are for the one minute 0559-0600.
    Ive looked at the data for Hervey Bay at 0600 on the 22nd February.
    25.3, 25.4, 23.2 .
    The temperature reported each half hour on the station Latest Observations page is the instantaneous temperature at that exact second, in this case 06:00:00, and the High Temp or Low Temp for the day is the highest or lowest one second temperature out of every minute for the whole day so far. There is no filtering or averaging.”

    We seem to be measuring a signal+noise which seems odd.
    Any references as to the cause of the noise? Thank you Geoff.

    • Massimo PORZIO says:

      I Geoff,
      I thought the same, I really wonder if in 1996 when they switched from mercury based MIN/MAX thermometers to the electronic counterparts platinum thermistor, they accounted for the different response time of the mercury based ones, which could lead to different temperature spikes smoothing.
      I always asked myself if that couldn’t be the culprit for the supposed residual half degree step after the 1998 ENSO.

      Have a great day.

      Massimo

      • David Appell says:

        Who is “they?”

        What is the difference in response time?

      • Massimo PORZIO says:

        Hi David,
        —Who is they?—
        The WMO. Which any other met office should have comply.

        —What is the difference in response time?—
        “They” at least should know about it because :
        https://www.iso.org/obp/ui/#iso:std:iso:17714:ed-1:v1:en
        See point 2.7

        The problem is that if the response time of the new thermistor based thermometers is different from the mercury one, even after having done a calibration using both the sensors together (the old and the new one) for a period of time, it’s highly probable that under weather patterns different from the ones experienced during the calibration, the returned MAX/MIN temperature could be different.
        Especially if the temperatures are taken for evaluating so little changes.
        Some one seem had take care of it:
        http://onlinelibrary.wiley.com/doi/10.1002/joc.1536/pdf

        The graph at page 293 say all about what I’m referring to.

        Have a great day.

        Massimo

  17. 86Janeen says:

    I have noticed you don’t monetize your site, don’t waste your traffic,
    you can earn additional cash every month because you’ve got hi quality content.
    If you want to know how to make extra bucks, search for:
    best adsense alternative Wrastain’s tools

  18. don penman says:

    I live in Lincoln UK and keep a temperature record.
    I have found that if I expose my white sensors to direct sunlight they get too warm and too cold because the sensor heats up and cools down despite it being white and in theory it should reflect all solar radiation. I have a sheltered spot
    outside my flat where I take my external reading also I keep my internal sensor away from windows and direct sunlight. Recently I came home to find someone sleeping in my external sheltered spot according to what I have read later in my local paper he was a drugged zombie I did not think that at the time.
    June 2016 external max was 23.8c and external min was 8.7c
    June 2016 internal max was 27.6c and internal min was 21.3c
    June 2017 external max was 30.6c and external min was 10.6c
    June 2017 internal max was 32.9c and internal min was 18.7c
    July 2016 external max was 29.3c and external min was 10.3c
    July 2016 internal max was 32.0c and internal min was 21.0c
    July 2017 external max was 26.1c and external min was 11.4c
    July 2017 internal max was 29.7c and internal min was 21.1c
    Aug 2016 external max was 26.7c and external min was 12.1c
    Aug 2016 internal max was 29.1c and external min was 23.1c
    Aug 2017 external max was 26.2c and external min was 9.6c
    Aug 2017 internal max was 27.4c and internal min was 20.0c
    on the 19th of June the minimum temperature was 29.7c which is about 85f.

  19. Susan Sylvia says:

    I guess it’s hard for a scientist to just sit back and enjoy the show! You got a much better view than we did here in NH–it didn’t even get dark.

Leave a Reply