UAH Global Temperature Update for October 2017: +0.63 deg. C

November 2nd, 2017 by Roy W. Spencer, Ph. D.

The Version 6.0 global average lower tropospheric temperature (LT) anomaly for October, 2017 was +0.63 deg. C, up from the September, 2017 value of +0.54 deg. C (click for full size version):
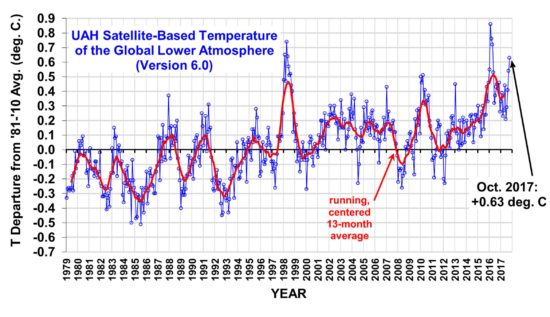
Global area-averaged lower tropospheric temperature anomalies (departures from 30-year calendar monthly means, 1981-2010). The 13-month centered average is meant to give an indication of the lower frequency variations in the data; the choice of 13 months is somewhat arbitrary… an odd number of months allows centered plotting on months with no time lag between the two plotted time series. The inclusion of two of the same calendar months on the ends of the 13 month averaging period causes no issues with interpretation because the seasonal temperature cycle has been removed as has the distinction between calendar months.

The global, hemispheric, and tropical LT anomalies from the 30-year (1981-2010) average for the last 22 months are:

YEAR MO GLOBE NHEM. SHEM. TROPICS
2016 01 +0.55 +0.72 +0.38 +0.85
2016 02 +0.85 +1.18 +0.53 +1.00
2016 03 +0.76 +0.98 +0.54 +1.10
2016 04 +0.72 +0.85 +0.58 +0.93
2016 05 +0.53 +0.61 +0.44 +0.70
2016 06 +0.33 +0.48 +0.17 +0.37
2016 07 +0.37 +0.44 +0.30 +0.47
2016 08 +0.43 +0.54 +0.32 +0.49
2016 09 +0.45 +0.51 +0.39 +0.37
2016 10 +0.42 +0.43 +0.42 +0.47
2016 11 +0.46 +0.43 +0.49 +0.38
2016 12 +0.26 +0.26 +0.27 +0.24
2017 01 +0.32 +0.31 +0.34 +0.10
2017 02 +0.38 +0.57 +0.19 +0.07
2017 03 +0.22 +0.36 +0.09 +0.05
2017 04 +0.27 +0.28 +0.26 +0.21
2017 05 +0.44 +0.39 +0.49 +0.41
2017 06 +0.21 +0.33 +0.10 +0.39
2017 07 +0.29 +0.30 +0.27 +0.51
2017 08 +0.41 +0.40 +0.41 +0.46
2017 09 +0.54 +0.51 +0.57 +0.53
2017 10 +0.63 +0.67 +0.59 +0.47

The linear temperature trend of the global average lower tropospheric temperature anomalies from January 1979 through October 2017 remains at +0.13 C/decade.

Why Are the Satellite and Surface Data Recently Diverging?

John Christy and I are a little surprised that the satellite deep-layer temperature anomaly has been rising for the last several months, given the cool La Nina currently attempting to form in the Pacific Ocean.

Furthermore, the satellite and surface temperatures seem to be recently diverging. For the surface temperatures, I usually track the monthly NCEP CFSv2 Tsfc averages computed by WeatherBell.com to get some idea of how the most recent month is shaping up for global temperatures. The CFSv2 Tsfc anomaly usually gives a rough approximation of what the satellite shows… but sometimes it differs significantly. For October 2017 the difference is now +0.23 deg. C (UAH LT warmer than Tsfc).

The following charts show how these two global temperature measures have compared for every month since 1997 (except that September, 2017 is missing at the WeatherBell.com website):
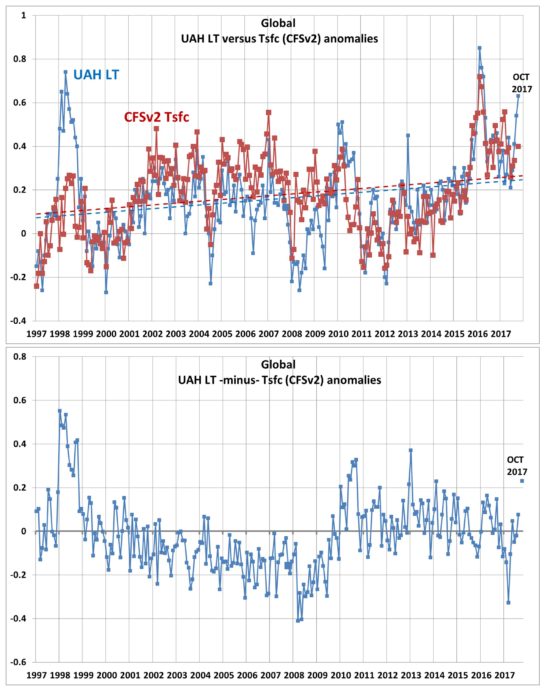
Monthly comparison since 1979 of global average temperature anomalies (relative to the monthly 1981-2010 averages) between UAH LT deep-layer lower tropospheric temperature and the surface temperatures in the CFSv2 reanalysis dataset at WeatherBell.com.

As can be seen, there have been considerably larger departures between the two measures in the past, especially during the 1997-1998 El Nino. Our UAH LT product is currently using 3 satellites (NOAA-18, NOAA-19, and Metop-B) which provide independent monthly global averages, and the disagreement between them is usually very small.

While we can expect individual months to have rather large differences between surface and tropospheric temperature anomalies (due to the time lag involved in excess surface warming to lead to increased convection and tropospheric heating), some of the differences in the above plot are disturbingly large and persistent. The 1997-98 El Nino discrepancy is pretty amazing. As I understand it, the NCEP CFS reanalysis dataset is the result of collaboration between NOAA/NCEP and NCAR, and uses a wide range of data types in a physically consistent fashion. I probably need to bring in one of the dedicated surface-only datasets for further comparison…I don’t recall the HadCRUT4 Tsfc dataset having this large of disagreements with our satellite deep-layer temperatures. Unfortunately, these other datasets usually take a few weeks before they are updated with the most recent month.

…UPDATE…(fixed)…
…the 2nd of the following two plots has been fixed)…

Here’s the comparison between UAH LT and Tsfc from the HadCRUT4 dataset, through September 2017. Note that the difference with the satellite temperatures isn’t as pronounced as with CFSv2 Tsfc data, but the HadCRUT4 data has more of an upward trend:
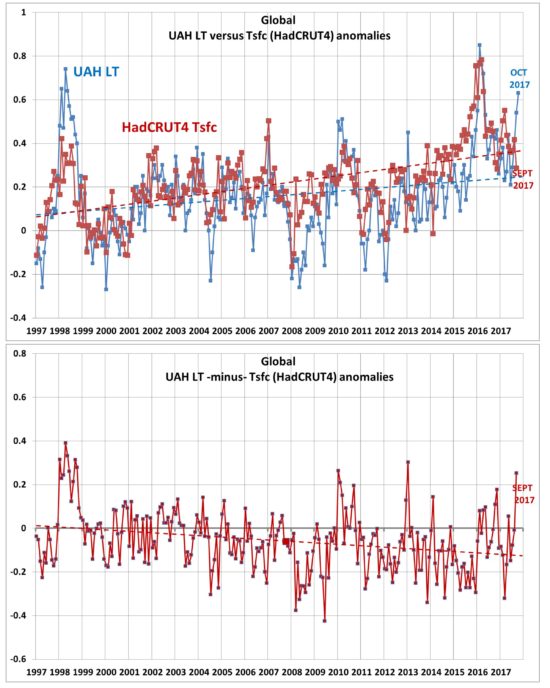
As in the previous figure, but now CFSv2 Tsfc data has been replaced by HadCRUT4 surface data (with the latter having anomalies recalculated relative to the 1981-2010 base period).

The UAH LT global anomaly image for October, 2017 should be available in the next few days here.

The new Version 6 files should also be updated in the coming days, and are located here:

Lower Troposphere: http://vortex.nsstc.uah.edu/data/msu/v6.0/tlt/uahncdc_lt_6.0.txt
Mid-Troposphere: http://vortex.nsstc.uah.edu/data/msu/v6.0/tmt/uahncdc_mt_6.0.txt
Tropopause: http://vortex.nsstc.uah.edu/data/msu/v6.0/ttp/uahncdc_tp_6.0.txt
Lower Stratosphere: http://vortex.nsstc.uah.edu/data/msu/v6.0/tls/uahncdc_ls_6.0.txt


2,640 Responses to “UAH Global Temperature Update for October 2017: +0.63 deg. C”

Toggle Trackbacks

  1. Nothing to be surprised about. Temperatures can vary majorly on a monthly basis. Long term 13 monthly average still showing downward plunge

    • barry says:

      The 13 month average hasn’t been updated for 3 months. There should be 6 months clear of the red line at the end, but there is 9.

    • mickey prumt says:

      No it is going up at the end. Look at the plot. I am sure you can make it.

      • I know that. That is why I said small upticks don’t mean anything unless the 13th month average surpasses the peak of the “Godzilla” El Nio 2015/2016. Yes it is starting to go up but it is likely and will start trending downwards soon and will not pass the peak of the 2015/2016 El Nio. the sleepers are gonna continue to sleep sleep sleep sleep sleep and the truth seekers are gonna continue to seek seek seek seek seek. Nothing you can do to change my mind nor others.

    • Brge Krog says:

      Dear mr. Spencer

      I have also been wondering about the discrepancy between satellite and ground data 97/98.

      I have recently done some research into the 97/98 el Nino satellite/ground-data discrepancy, and have found this document.:

      http://journals.ametsoc.org/doi/pdf/10.1175/JCLI-D-16-0768.1

      On page 45 of that document there’s a record of all the satellites that have been used to procure data for both the RSS and UAH temperature-calculations.

      Four different satellites were in operation in the above mentioned period ( 97-98 ) where the satellite-data differs significantly from ground-data.

      I can see three interesting incidents from that period :

      1. NOAA-11 reinstated 8/1997, withdrawn again 4/1998!(Actually two incidents )
      2. NOAA-12 withdrawn 11/1998!
      3. NOAA-15 launched 8/1998! (With new AMSU instruments )

      What really strikes me is, why was NOAA-11 retired in 1994, reinstated in august 1997 and withdrawn again 4/1998!

      And where’s NOAA-13? Well it failed! ( Don’t ever use the number 13 in space-matters 🙂 ).

      I have an idea on what happened then, excuse me if I am wrong. The temperature satellite program was “undermanned” ( 1993 ), as far as operational satellites concerned, and they just had to cope with the remaining satellites
      ( NOAA-11, 12 and later from july 1995 NOAA-14).

      NOAA-11 was retired from service in december 1994, but for some reason was “re-drafted” for a brief period from august 1997 to april 1998 .

      Why ?

      I have no idea, but my guess is that it might have something to do with the up-coming of an extreme El Nin 97/98 which they wanted to have as much data about as possible. So they decided to pull 11 “up from the dust”.

      But what about the instruments aboard 11, were they
      still fully functional and intact after almost 2 years 8 months?

      I have a clear suspicion that the data after august 97 appears faulty!

      The statement at the end of this link seems to confirm my hunch, that something might have been wrong with the instruments aboard NOAA-11 :

      http://ieeexplore.ieee.org/document/703808/

      “The visible channel on NOAA-11 was much noisier, with a detrended standard deviation of /spl sim/3%, indicating that this satellite experienced month-to-month sensitivity changes. Data processed for November 1988-February 1991 showed a linear increase in sensitivity of 0.5%/year.”

      It is also of interest that NOAA-15 ( launched august 1998 ) was equipped with a new version of the Microwave Sounding Unit, namely the Advanced MSU ( Wikipedia ).

      All in all this info make me suspect that something must be wrong with the satellite-data for this period, but I have no chance to see if I am right or not, so therefore I turn Your attention to my observations.

      Hope this is useful

      Yours truly

      Brge Krog

  2. barry says:

    A wee sweep on the October anomaly from last thread:

    MikeR: 0.51* & 0.58
    g*e*r*a*n: 0.44
    Isaac: 0.37
    barry:0.27

    Result: 0.63

    Mike gets the car, I get a goat.

    (* mean value of a range Mike gave)

    • wert says:

      Me too. It must the conspiracy or Russian hackers finally got the doctor denier. 🙂

    • g*e*r*a*n says:

      Obviously all the hurricanes had more of an effect than I estimated.

      But barry, I came in second, and you came in last, yet I get nothing and you get the goat?

      A goat has SOME value. I got nothing, and you got something!

      I want to see the rulebook. . . .

    • MikeR says:

      Barry I await anxiously for the delivery of my car. I am hoping for a Tesla S but I probably should expect a matchbox car instead.

      I did volunteer the fact that I had some inside information, so the bet wasn’t fair. The regression to the mean heuristic, which I suspect Barry used, would also have been my choice in the absence of the Aqua satellite data.

      Unfortunately this heuristic isn’t that effective with what appears to be a non stationary data set.

      • barry says:

        I just made a guesstimate based on SSTs, which dropped fairly precipitously during October.

        • MikeR says:

          Sorry Barry, I forgot you said that SST was the basis of your prediction, my bad.

          SST for some reason correlates only moderate well with UAH with,if I recall correctly, an Rsq of about 0.5, so it may not be the best metric to use as a predictor.

    • PhilJ says:

      I want to play for Nov!

      0.24

      😀

  3. D. Steven Fraser says:

    My guess… the anomaly map for the NH will show some persistent heat pockets that match the locations and paths of large, slow-moving storms.

    Looking forward to testing that idea.

  4. Frank de Jong says:

    Regarding the long and somewhat distracting disclaimer for the 13 month running average: would it not be simpler to plot the 12 month average and forego the disclaimer? With the amount of data in the plot nowadays, the half-month lag between where the 12-month average is calculated (start/end of the months) and where the monthly averages are calculated (middle of the months) probably isn’t even visible.

    My apologies in advance if you answered this question already (many times) before.

    • Then I would need a long and somewhat distracting disclaimer stating that the 12 month average doesn’t quite apply to the center month it is plotted on.

      • mickey prumt says:

        No you would not. Everybody used 12 month. Nobody care.
        Using 13 month does not change anything but illustrate perfectly that you are limited in being smart.

        • argus says:

          Advice, write what you want to say, step away for many minutes, return and delete if it’s inflammatory or name calling.

      • Frank de Jong says:

        The point I was trying to make is that you simply don’t plot the 12-month average on the center of the month.

        Should be simple to plot the 12-month running average on the start/end of the month while the monthly averages are on the center of the month? The data table might become messy (with the time axis having center-month and start/end-of-month values), but in the graph, nobody would even see it (or care)?

      • Bart says:

        Dr. Spencer:

        “Then I would need a long and somewhat distracting disclaimer stating that the 12 month average doesn’t quite apply to the center month it is plotted on.”

        That’s not quite true, because your data points are averages over months, and so represent the midpoint of each month. That is, your data represent times of 0.5/12, 1.5/12, 2.5/12, … 11.5/12, not 1/12, 2/12, 3/12,…12/12. The average is referred to the time which is the average of the sample times, and the average of the former is 0.5. So, a 12 month average of monthly averages does reflect the midpoint of the year.

        A 13 point average applies at the average of -0.5/12,0.5/12,1.5/12,…11.5/12, which is at 0.46 years, so it is actually biased from the midpoint.

        A concern is that there is a strong annual signal in the data. Let’s say I have a signal measured nominally in 30 day months that goes as sin(pi/6*t). I average this for t = 1,2,… 12, and I get zero. I tack one more month onto it, and I get an average of 0.0385. So, I am introducing a spurious annual component into the measurement.

        It is not, however, a terribly significant concern if successive years overlap by one month, because the average for t = 1,2,…13 is 0.0385, but the average of 13,15,…24 is also 0.0385. Which means that the yearly component has aliased to a bias, and we don’t care much about a bias, because the baseline is arbitrary to begin with.

        Bottom line: it’s not a big deal either way, but 12 month averaging is likely to raise fewer flags, leading to discussions like this.

    • Dave says:

      Or better still, since the stated aim (in Dr Spencer’s disclaimer) is that the “13-month centered average is meant to give an indication of the lower frequency variations in the data”, and given that this is a regularly sampled time series, why not simply use one of the numerous potential approaches used by engineers to remove high frequencies from data. e.g. a zero-phase digital filter with a corner frequency of 1/1 year. That would allow every point to be plotted at the same time as the sampled data, irrespective of what the phase of those samples is. It would also provide the benefit of having the smoothed line extend to very ends of the data set.

      • MikeR says:

        Another option is to use a Loess filter with the appropriate smoothing parameter that corresponds to a 12 month average. This has the advantage that it outputs smoothed and centered data that includes the last 6 months.

      • Sylvain Flamant says:

        Sorry, but this is wrong , zero phase filters are only non-causal filters, meaning that they need to know the future data … which means that there is no filter that you could apply for the month of October, that would be zero phase.
        And besides the 13 months moving average filter, used by Dr Spencer , shifted in time by 6 months as he did … is a zero phase filter, but only because of the 6 months delay ( and the fact that a moving average is symmetrical and “even”. )
        There is nothing wrong about using a 13 months moving average filter, except for the fact that it far from being the best filter to filter out the high frequencies, as the FFT of a moving average filter is a sinc function with a tail that decrease slowly with frequency… It would be easy to suppress the high frequencies with any good standard lowpass filter with the appropriate cutoff frequency. A very minor change to the 13 months average filter , would be to divide the values of the first and last month by 2 when doing the sum , the filter would then be more like an average over one year, while cutting the high frequencies a little better than the 13 months moving average filter ( but the filter would still need to applied with a 6 months shift.

    • barry says:

      There’s no reason to prefer a 12-month running average over 13-month. The difference is unimportant. Different institutes have made different choices (21-point binomial filter anyone?) at different times.

      Non-issue.

  5. The WxBELL GMSTA reported for month-to-date through Oct 31 was 0.39C, which is 0.24C lower than the TLT for October. The WxBELL September GMSTA was 0.284C, so October was up by 0.09C.

    There was a big high spike in the tropical Pacific temperatures in April and May with a smaller high spike in June – an almost mini El Nino event. Perhaps the TLT Sep-Oct upward spike is a delayed response to this very weak near El Nino event, similar to what we see with major El Nino events.

  6. mickey prumt says:

    There are different reason of why it is different. Calculations from satellites observation are very uncertain. They are also more sensitive to variability. More generally, they are not an estimate of the same thing…
    Interesting to see that you didn’t now that as well.

    • If satellite measurements are “very uncertain”, why do the RSS and UAH satellite measures correlate at 0.95 with each other (monthly anomalies since 1979), but HadCRUT4 and CFSv2 only correlate at 0.75 over the same period?

      • mickey prumt says:

        Ah ah you are do bad Spencer! You can get awsome correlation but not the same trend… Just compare the trend.

        Also satellite calculations comes from same data and cover samebgeographical regions.

        Nothing to say about the very strong sensitivity to variability? (And also to the method for adjusments)

        • you obviously think the satellite adjustments are bigger than the surface data adjustments. Wrong. We worry about adjustments of hundredths of a degree, the surface thermometer people deal with adjustments 10 times as large.

          • wert says:

            If I read SkS, I might end up thinking something else. But I do guess you should not put time in something as stupid as trying to debunk what Cook writes about you as we have a limited time on the Earth to work on.

          • mickey prumt says:

            No this is not what i think.

            I think satellite drift slowly so it is difficult to adjust. Also there are very few satellites (so it is difficult to adjust) but a lot of thermometers.
            Just look at difference between uah rss or different versions.

          • Yet the surface data sets are constantly tampered with and left unaccounted for to show a biased warming trend. Yeah surface data is way better then sattelite for sure! Pffft give me a break.

          • They purposely adjust it to fit there political needs and desires to support there stupid global warming agenda and you say surface data is better? Are you kidding me?!

          • Unless you had absolutely no idea I feel very bad for your lack of intelligence. Bahhhh screw it this whole generation is full of dumb turkeys. What could I say!?

          • DHMacKenzie says:

            Says the guy who doesnt know the difference between their and there.

          • Wow. Really? What does that have to do with anything? This is professional science not kindergarden grammar class. Perhaps next time you should consider making your conter arguments more scientific related.

          • And FYI I do know the difference between “there” and “their”. For example:

            Look at all those global warming shills with THEIR billions of tax dollars in THEIR tax wallet. how did they get THERE? Oh… I know! By misleading the public into thinking that THERE is global warming and we are the cause of it and by slamming us with all THEIR carbon taxes to promote THEIR fake agenda. DO YOU UNDERSTAND?

          • Bart says:

            That makes no sense, Mickey. Slow, predictable drift is the easiest thing in the world to adjust. And, having a few satellites makes the measurements more, not less, homogeneous – you don’t have to take account of variations between all the hundreds of different instruments. And, the satellite measurements cover almost the entire Earth uniformly, whereas the ground measurements are sparse.

            So, the measurement didn’t come out the way you expected. It’s only a couple of months of apparently anomalous measurements. Either the long term signal will assert itself sooner or later, or the divergence will be persistent, and a cause will have to be determined. You just have to have patience.

          • mickey prumt says:

            Just look at the difference between old and present UAH versions, between RSS and UAH : we are not able to adjust diurnal drift.

          • mickey prumt says:

            No all measurements come the way expected :
            Increasing.

          • Since 1998? Nope don’t see an increase.

          • des says:

            Roy,
            You lie. The entire satellite data set is one massive adjustment.
            Which of the surface adjustments do you believe is not statistically valid?

          • g*e*r*a*n says:

            des spouts: “Roy, You lie.”

            That’s pure DESperation, folks.

            des knows his beliefs are caving in on his head. He lashes out, helplessly.

            des-peration!

          • David Appell says:

            Roy, UAH made some huge changes going to version 6, much bigger than Karl et al’s surface changes in 2015:

            http://davidappell.blogspot.com/2015/06/noaas-data-changes-actually-smaller.html

            Several of your monthly regional changes were well over 1 C (!)

            http://davidappell.blogspot.com/2015/04/some-big-adjustments-to-uahs-dataset.html

          • SkepticGoneWild says:

            I don`t want to be the first to visit da`s blog.

          • g*e*r*a*n says:

            The origin of the Internet use of “troll” came from the action of an unknown blogger posting on a popular blog, “trolling” for viewers.

            Davie has been blogging for years and is still trolling. . . .

          • Nate says:

            ‘We worry about adjustments of hundredths of a degree’

            UAH 5.6 97-17 trend 0.160/decade

            UAH 6.0 97-17 trend 0.079/decade

            according to http://www.ysbl.york.ac.uk/~cowtan/applets/trend/trend.html

            Lots of data must have been adjusted by ~ tenths of a degree to account for this.

          • Bart says:

            The trend worshipers strike again.

          • Nate says:

            Yes, facts must be frustrating for you guys? Best to downplay them..

          • barry says:

            Point-missers strike again.

      • MikeR says:

        Roy,

        A few corrections are in order to the above. The UAH v6 and RSS TLT v4 data sets correlate at 0.92 while UAH v5.6 correlates at 0.94 with the same set.

        You did show some concern above in the main text about the discrepancy between UAH and the surface data sets. In light of the following I would be too.

        A full set of correlations between relevant data sets are shown at – https://s20.postimg.org/45cwop5fx/Correlations_UAH_Land.jpg . The regions highlighted are for correlations less than 0.7. Note these are only for UAH v6 .

        UAH v6 correlates with CFSv2 (Weatherbell data used) at only 0.61 while both UAH v5.6 and RSS TLT v4 correlates better at 0.7 and 0.71 respectively.

        Similarly with respect to H**RUT4 , UAH v5.6 (Rsq = 0.73) performs significantly better than UAH v6 (Rsq = 0.64) and RSS TLT v4 performs the best by far (Rsq=0.81).

        The other think to note is amongst the surface data sets, the Waetherbell data is the odd man out and correlates relatively poorly with the other surface data sets (0.74 to 0.81). In comparison the correlations between the other 4 data sets are much better (0.92 to 0.98) .

        No wonder Roy chose to emphasize Weatherbell data.

        Sounds like time to go back to the drawing board for Roy and work on version 7 as UAH v6 seems to be a far inferior product than v5.6 . Maybe Roy should reinstate v5.6 . The trend would also more closely match every other data set, including Weatherbell, but that may not suit his narrative.

  7. Dr. Mark H. Shapiro says:

    Thank you Dr. Roy for providing more data showing that Global Warming is real! Clearly the hottest October in your data set.

    • barry says:

      Let’s not confuse a single month’s anomaly (weather) with long-term climate.

      • Apparently Barry dr mark h Shapiro seems to be too stupid to understand

      • Graham says:

        Iare all figures higher than a flat line an anomaly. There seem to be a lot of them in the last few years. Also, 4realz opinions do not even match Roy Spensors, who believes the globe is warming, albeit by natural processes.

        • Graham, you are correct. There has been no statistically significant global warming for almost two decades now. Although the earth has been warming since then from the late 1800s it is a natural warming cycle that occurs every couple 100 years and that is why we are not warming up anymore and we are heading into a cooling trend like before the dalton minimmum back in the 1800s. The climate is changing, weather is getting weirder, seasons are getting screwed up and out of flux. I get it. But it has always been a natural cyclical pattern that man has no detectable influence over no matter how much fossil fuels we burn into the atmosphere. I believe in natural cycles. I believe the climate is changing. I believe hurricanes are getting worse and so are extreme weather events like heat waves, droughts, flood, hail, snow etc but it is not caused by us. Mother Nature is sending us a message I suggest we pull our heads out of the sand immediately and start heeding it.

          • Graham says:

            If Mother Nature is sending us a message, what is it? If the increase in the trend line is another part of a natural cycle, why would MN send us a warning (especially as you say we have no influence on global temperatures, regardless of how much carbon we release into the atmosphere)? Also, I dont understand your comment on lack of statistical warming over the last 2 decades. Are you using the peak El Nio as the initial reference point. I hope not, this would be a high level of buffoonery.

          • That the sun is going into hibernation and we are about to plunge into a grand solar minimum just like we did back in the 1800s and 1600s. Examples of this are dalton minimmum and maunder minimmum. This isn’t something that will happen over night. You still have time to prepare. Do your homework and good luck in your preparations

          • Werner Brozek says:

            Also, I dont understand your comment on lack of statistical warming over the last 2 decades.

            From:
            https://moyhu.blogspot.ca/p/temperature-trend-viewer.html

            Temperature Anomaly trend
            Sep 1994 to Sep 2017
            Rate: 0.884C/Century;
            CI from -0.010 to 1.778;

            That is 23 years and 1 month.

          • gbaikie says:

            “The Roman Warm Period or the Roman climatic optimum has been proposed as a period of unusually warm weather in Europe and the North Atlantic that ran from approximately 250 BC to AD 400”
            https://en.wikipedia.org/wiki/Roman_Warm_Period
            So about 650 years

            Medieval Warm Period
            … lasting from about c. 950 to c. 1250.
            https://en.wikipedia.org/wiki/Medieval_Warm_Period

            “The Maunder Minimum, also known as the “prolonged sunspot minimum”, is the name used for the period starting in about 1645 and continuing to about 1715 when sunspots became exceedingly rare, as noted by solar observers of the time.”
            https://en.wikipedia.org/wiki/Maunder_Minimum
            And:
            “The Maunder Minimum roughly coincided with the middle part of the Little Ice Age, during which Europe and North America experienced colder than average temperatures. Whether there is a causal relationship, however, is still controversial.”

            I could look up the dark ages or other warm periods

            But anyhow it seems to me that medieval Warm period as “counted” by wiki, is time of peak warmer times of period, and seems to me we might might not be in the peak warmer times of this present warming period.
            Or if we dive back into temperatures of LIA within 50 years, I think it would counted as never leaving LIA.
            Or in period of 1300 to 1900 I think there were a couple “failed attempts of warming” and currently at a very promising attempt to leave LIA. But haven’t reached the peak
            time of this warming period.
            Or think it will be centuries which are warmer and as warm as it is currently- though it’s possible that we are screwed.

    • Francisco says:

      Hahahahahaha!! One month hot and it is the hottest and global warming is real…. wait, it is real, so is cooling… I fail to see your point?

      I cannot identify anything out of the ordinary in the anomalies.

      Would you be as kind as to expand a little. You wouldn’t like us to think that comment is at the top of your I.Q. Doctor, now, would you?

    • Roy Spencer says:

      If by “Global Warming” you mean a modest and possibly beneficial warming rate of uncertain origin, then I agree with you.

      And, you’re welcome.

      • mickey prumt says:

        First define ”modest”.
        The impacts is a more complex question but for sure the guy who say they will be all good is at least as stupid as the guy who say there will be all bad.

        • I’ll define “modest” when Dr. Shapiro defines “Global Warming”.

          • mickey prumt says:

            Well global warming refer generally to a surface temp index.
            indeed it is good that you ask at a point view that UAH is not surface.

        • gbaikie says:

          –mickey prumt says:
          November 2, 2017 at 9:53 AM

          Well global warming refer generally to a surface temp index.
          indeed it is good that you ask at a point view that UAH is not surface.–

          There is no surface 5 feet above the surface.
          Surface temp refers to “air surface” which is not same the ground which is actually the surface.
          Though ocean surface is pretty close to ocean air surface temperatures.

          • mickey prumt says:

            Difference air surface / surface is second order in this story. This is not the case for what is (supposed to be) observed by UAH satellite.

            Your comment is not relevant.

      • Nate says:

        Roy,

        “modest and possibly beneficial warming rate of uncertain origin”

        Science from your govt, led by fellow travellers, now officially disagrees with you.

        ” U.S. Report Says Humans Cause Climate Change, Contradicting Top Trump Officials”

        https://mobile.nytimes.com/2017/11/03/climate/us-climate-report.html

        All appointees at DOE, EPA, etc and underlings had opportunity to point out flaws in the science, or conclusions of report.

        This was all they could muster:

        The only significant turbulence, according to one person familiar with the process, came from a midlevel political appointee at the Department of Energy who grilled the reports authors on changes that had been made to temperature and other climate data over the years. The authors responded by adding a more detailed explanation of their methodology and all of the agencies then gave their approval, the person said.

  8. Jimmy W says:

    The importance of how much UAH differed from other data sets during the 1998-9 El Nino cannot be understated. Without that huge spike in UAH temperatures, the favorite talking point of the anti-AGW crowd for a decade and a half would have died a much shorter death. I just heard yesterday a quote from another Trump nominee that global temperatures stopped rising over ten years ago. Ted Cruz was fond of saying that “the satellites show no warming”. The “pause” lives on in the blogosphere even though it is nothing more than cherry picking a start date of 1998 in the UAH data set for comparison.

      • George Rogers says:

        understate

        verb
        past tense: understated; past participle: understated
        describe or represent (something) as being smaller, worse, or less important than it actually is.
        “the press has understated the extent of the problem”
        synonyms: play down, downplay, underrate, underplay, de-emphasize, trivialize, minimize, diminish, downgrade, brush aside, gloss over, put it mildly;

        The importance cannot be understated ~ it is friggin important.

    • gbaikie says:

      –I just heard yesterday a quote from another Trump nominee that global temperatures stopped rising over ten years ago.–

      And the Trump nominee was and is correct.

      “Ted Cruz was fond of saying that the satellites show no warming. ”

      The satellites are suppose to accurately measure global temperature- if didn’t show warming and cooling then they would be inaccurate.
      But in terms of a trend, the satellites are not showing any significant warming trend- nothing that indicate global temperature will be 2 C warmer within a century of time or temperature projection from Climate models are over estimating
      future warming.

      • George Rogers says:

        gbaikie:

        “The linear temperature trend of the global average lower tropospheric temperature anomalies from January 1979 through October 2017 remains at +0.13 C/decade.”

        The satellite data definitely is suggesting 1.3 C for a century, which on top of the warming that already has occurred would make 2C.

        Not sure where your data is coming from, but I imagine somewhere near where you keep your wallet.

        • David Appell says:

          George Rogers says:
          “The satellite data definitely is suggesting 1.3 C for a century, which on top of the warming that already has occurred would make 2C.”

          No, it is not.

          You can’t extrapolate a 39-year trend over a century if there’s no expectation warming will remain linear. (And there’s not.)

      • gbaikie says:

        ” George Rogers says:
        November 2, 2017 at 10:22 AM

        gbaikie:

        The linear temperature trend of the global average lower tropospheric temperature anomalies from January 1979 through October 2017 remains at +0.13 C/decade.

        The satellite data definitely is suggesting 1.3 C for a century, which on top of the warming that already has occurred would make 2C. ”

        If politicians if talking about 2 C rise from the time period of Little Ice age, it should be noted that no one wants to live in one the coldest period of the Holocene- that would be psychotic to want this- though politicians have a consistent track record of wanting the wrong thing- which on numerous occasions as resulted in tens of millions of people being killed with lots of human suffering.

        No one thinks all warming since the Little Ice Age was caused by human activity- that also would be crazy.

        If average temperature were to lower by .5 C, that would kill people and cause suffering- and everyone knows this.

        Finally if simply using a trend determines future average temperature, we had no need of using expensive “supercompters”- why waste tens of billions of public monies.

        “Not sure where your data is coming from, but I imagine somewhere near where you keep your wallet. ”

        Yeah money from my wallet is related to climate models.
        More important in terms of dollars wasted, is trillions of dollars over the years related to all the unneeded laws which are paying for government corruption related to solving “global warming”

        Trillions of dollars wasted with zero wanted result other government oppression and corruption. Or the “future of the children” being flushed down a huge toilet.

        German’s measured amount is about 800 billion on wind and solar which caused a increased in electricity costs and increase in CO2 emission. Essentially, or actually, a huge tax upon the poorest majority of Germans. And graft for those involved in the corruption.
        Germany is a small country and it’s stupidity is most obvious. And I would say German accounting is better than most.

        • gbaikie says:

          re: “though politicians have a consistent track record of wanting the wrong thing- which on numerous occasions as resulted in tens of millions of people being killed with lots of human suffering.”
          https://www.wsj.com/articles/the-communist-century-1509726265

          There isn’t a huge difference between these communist politican leaders and the politicians in general.
          The difference is some politicians are restrained and these communist leaders were in charge.
          That’s the big difference,

          Their ideology even their morality is not the big difference.

        • How did Germany’s wind and solar power plants increase CO2 emissions?

          • gbaikie says:

            Because they used coal power energy to provide electrical energy when there wasn’t enough wind and sunlight.
            They also had abundance of wind and sunlight in which the electrical power generated couldn’t be used and/or requiring other electrical powerplants to run inefficiently. And coal
            power has advantage in terms dealing with fluctuating electrical power needs as compared to more efficient ways to make electrical power and to make electrical power which causes less CO2 emission per MW hour of power.
            Or wind and solar make coal more competitive as compared other ways to make electrical power with lower CO2 emission costs.

            Or quite simply, Germany is adding more coal powerplants into it’s energy mix because it makes more money compared to other ways.

          • Nate says:

            That makes no sense whatsoever. Nor does it match the facts. Show us data.

          • gbaikie: “Because they used coal power energy to provide electrical energy when there wasnt enough wind and sunlight.” As opposed to both when there isn’t as well as when there is?

            As for “Or quite simply, Germany is adding more coal powerplants into its energy mix because it makes more money compared to other ways”: The reason for more coal isn’t wind and solar (although those are more expensive and driving up Germany’s electric bills), but Germany’s wrongheaded decommissioning of its nuclear power plants.

          • gbaikie says:

            “At one point this month renewable energy sources briefly supplied close to 90 percent of the power on Germanys electric grid. But that doesnt mean the worlds fourth-largest economy is close to being run on zero-carbon electricity. In fact, Germany is giving the rest of the world a lesson in just how much can go wrong when you try to reduce carbon emissions solely by installing lots of wind and solar.”

            https://www.technologyreview.com/s/601514/germany-runs-up-against-the-limits-of-renewables/

            Read the whole article.

          • Nate says:

            “renewable sources accounted for nearly one-third of the electricity consumed in Germany in 2015. The country is now the worlds largest solar market. Germanys carbon emissions in 2014 were 27 percent lower than 1990 levels.”

            Contradicts your statement that co2 emissions higher as a result of these policies.

            Choice of coal vs gas or nuclear seems to be political or fear based, ie Russian gas, Fukushima.

          • gbaikie says:

            — Nate says:
            November 6, 2017 at 7:44 AM

            renewable sources accounted for nearly one-third of the electricity consumed in Germany in 2015. The country is now the worlds largest solar market. Germanys carbon emissions in 2014 were 27 percent lower than 1990 levels.

            Contradicts your statement that co2 emissions higher as a result of these policies.–

            The policies I am referring started a decade or so before now, and 1990 level is almost 3 decade ago. 1990 level is picked
            because it was at high level [why I will not get into] and was Germany’s Emission was dropping before these policies were invented.
            It’s rising now, because of these policies. Or if policies worked, they should be dropping and they are not.

            Wiki has two graphs of wind and solar installed capacity by year:
            https://en.wikipedia.org/wiki/Renewable_energy_in_Germany

          • gbaikie says:

            –The reason for more coal isnt wind and solar (although those are more expensive and driving up Germanys electric bills), but Germanys wrongheaded decommissioning of its nuclear power plants.–

            Well more nuclear power used, gives less Co2 emission- and we had decades proving this.
            But nuclear power has to be operated competently.

            It’s possible the German nuclear power plants were badly managed with no easy solution to improve it.
            Second if one has highly varying electrical grid, it’s going increase the costs of operating a nuclear power- and that generally makes an incompetently run nuclear power plant more dangerous.

            I would favor laws outlawing politicians from ever managing the operations of a nuclear plant plant- because they are inherently and demonstratively incompetent at doing anything.

          • Nate says:

            ‘Its rising now, because of these policies. Or if policies worked, they should be dropping and they are not.’

            I agree that CO2 emissions dont seem to be dropping rapidly as hoped–must be because of drastic reduction in nuclear–seemed like overreaction to Fukushima. No?

  9. Warm is the word no doubt about it. Can not say anything to counter that fact.

    Time will tell but if the global temperatures stay up like this, given cooling overall sea surface temperatures, given La Nina tendency if not outright La Nina coming, given very low solar coming into play, given above average snow cover, above average cosmic ray counts then rethinking would have to be done.

    It is still early but if by next summer we are still running high with the above conditions in play then my view will be in trouble.

  10. The bottom line is it is warm but still not convinced it is due to AGW.

    • gbaikie says:

      Humans are having little effect upon Ocean temperatures, ocean temperatures are global average temperatures.
      But we are recover from the cooler period of the Little ice age- a time period of cooler ocean temperatures and had periods of sea levels falling [slightly]. In last century we not had sea levels lowering and continue to recovery from LIA or continue to have warming in the Holocene period.
      No indicate that Holocene period is ending and enter a glacial period.
      Or if the Little Ice Age wasn’t “little” there would be evidence of the ending of the Holocene period.

    • David Appell says:

      Salvatore Del Prete says:
      “The bottom line is it is warm but still not convinced it is due to AGW.”

      Trust me, none of us are waiting breathlessly for your opinion — you’ve been consistently wrong all along.

      “…here is my prediction for climate going forward, this decade will be the decade of cooling.”
      – Salvatore del Prete, 11/23/2010
      http://ourchangingclimate.wordpress.com/2010/10/20/andrew-dessler-debating-richard-lindzen/#comment-8875

  11. phi says:

    About reliability and trends : https://i0.wp.com/www.skyfall.fr/wp-content/2014/12/polar2.png

    It is good to have some elements in mind, for example, that regional and global trends in surface temperature series are never confirmed by independent observations.

  12. Mickey writes in one of his replies to me:

    “Look at the real observation of surface temperature and tell me there is no warming in thw lasr years
    UAH is very uncertain (just compare with previous version and with RSS). Also tropo temp depends strongly on a small fraction of the globe so it is very sensitive to variability”

    Look at the real observation of surface temperature and tell me there is no warming in thw lasr years
    UAH is very uncertain (just compare with previous version and with RSS). Also tropo temp depends strongly on a small fraction of the globe so it is very sensitive to variabilty.

  13. Nate says:

    Average for decade of the :

    80s -.142

    90s .001

    00s .1045

    10s .230 so far

    Is it too early to sing it?

    ‘Ding-dong the pause is dead, which old pause, the 10 y pause, the 20 y pause, whatever pause you think you see…’

    • Jake says:

      1900’s: – slope
      1910’s: + slope
      1920’s: + slope
      1930’s: ++ slope
      1940’s: -slope

      Please, explain to me Nate …. what’s your point? Natural variation FTW?

      • Nate says:

        And yes, natural variations are present, some decadal, but these dont falsify the fact that there is ongoing upward trend, larger and longer than the one in the 1930s.

      • John Finn says:

        In 1958 atmpospheric CO2 levels were only around 315 ppm. This would not be sufficient to completely overwhelm natural variability – hence the fluctuations.

        However, we’re not seeing decades long negative slopes now. A pause of a few years – perhaps but no long term cooling trend. I’ve followed the AGW debate for a number of years and I think I disagree with Roy that the cause of the warming is unknown. I don’t necessarily think it will be harmful but I’m convinced it is related to the addition of GHGs to the atmosphere.

        • Jake says:

          I agree, we haven’t seen decades long negative slopes, as we saw from about the year 1000 AD to 1700 AD ……

          Men, there’s a whole forest out there, and if we’re looking at four decades of data, it amounts to staring at one tree.

          I agree that the science would indicate that, due to our rise from 280 to just a pinch above 400 ppm that some warming is due to CO2/GHG’s, but we have no idea to what degree and that warming is just buried in the noise.

          Since the Industrial Revolution the plight of humans has improved tremendously, and cheap energy in the driving force. But we, as humans, are flawed, so let’s search for the apocalypse, it’s ingrained in us as part of the human condition. Oh Noah, where art thou ……..

          We are not going backwards, that’s a fact, there will be riots in the street so that the masses can charge their cell phones …. and if we do go backwards it’s only going to hurt the peons, certainly not those well placed like Gore and DiCaprio. Renewables aren’t ready. Either give us fossil fuels, or give nuclear. Pick your poison.

          • Sir Isaac Snapelton says:

            “Men, theres a whole forest out there, and if were looking at four decades of data, it amounts to staring at one tree.”

            Nevermind four decades, skeptics stare at the years 1998 – 2014.

            More like a large branch than a tree.

        • barry says:

          I think I disagree with Roy that the cause of the warming is unknown

          Roy does not dispute greenhouse warming. He thinks it probably has little effect, making up a small part of the warming.

          • g*e*r*a*n says:

            Yes, Dr. Roy has a somewhat reasonable opinion. That’s why he’s likely, someday, to become an “extreme skeptic”.

          • gammacrux says:

            Obviously, from all the data and theory at hand it is quite reasonable to suspect that the anthropic CO2 is indeed the main culprit and it is much less reasonable to contend that the cause of GW is “unknown”.

            Yet it is quite true that the cause is not yet established and might still be of natural origin because we do not know enough about natural variability and are not capable to predict accurately enough the climate sensitivity.

            Now whenever facing a (possible) threat alarmism is almost certainly an inappropriate posture. It triggers usually just idiotic behavior.

            In fact, in present instance, we merely cannot even act and curb seriously the CO2 emissions without doing more harm than good. The laws of Physics and technology do not allow it right now and that cannot be modified by politicians or activists.

          • Norman says:

            gammacrux

            Your comment seemed very rational and an intelligent assessment of climate concerns.

            I do think maybe if we could open up fusion energy it might satisfy most. I like the polywell concept (using electrostatic repulsion rather than magnetic confinement). Bussard was the chief designer of this process, the hope given was that single proton hydrogen (quite abundant and non radioactive) and boron (also very abundant) could be fused to release energy with the byproduct normal helium and no neutrons so radioactive shielding from a neutron flux would not be needed. Also, without a neutron flux, the materials used to build the confinement would not become radioactive. Without the threat of radioactive waste, the power plants could be smaller and require less manpower and be considerably lower cost than the deuterium/tritium reactors using magnetic confinement (which also release neutrons in the reaction).

            It could be a dream too good to be true. I have read it would take about $100 million to build a prototype to test if the hypothesis is valid. I think the government could use some of the money they waste on wind energy subsidies to at least check this idea out and see if there is any hope to pursue it.

          • gammacrux says:

            Norman

            Yes, thanks. Indeed, B11 with H1 fusion is potentially promising because it would be very clean and fuel is naturally abundant. Besides polywell concept there is also the (pulsed) Z-machine (20 billions K obtained).
            http://www.sandia.gov/z-machine/

            As you point out if fusion of H2 with H3 is tamed it would not be “clean”. And that’s also because one could hardly economically resist and use the fast neutrons to initiate fast-neutron fission and breed fissionable fuel by surrounding the fusion chamber with a blanket of U238 or Th and so get 10 times more energy…

            Physics Nobel Prize laureate Robert B. Laughlin published a relevant book “Powering the future”
            http://large.stanford.edu/publications/coal/

          • gbaikie says:

            — gammacrux says:
            November 3, 2017 at 5:42 AM

            Obviously, from all the data and theory at hand it is quite reasonable to suspect that the anthropic CO2 is indeed the main culprit and it is much less reasonable to contend that the cause of GW is unknown.–

            What is obvious is the urban heat island effect are making urban environments unnaturally warmer by a very considerable amount- such as 5 C warmer.
            And what obvious is more people live in such urban environments and CO2 levels are unrelated to causing such unnatural warmer conditions.

            In terms of nature, nature has been in much warmer condition then present average global temperature.
            And in terms of nature, the tropical region has average temperature of about 27 C- and life likes it.
            And even humans, being a tropical creature, likes the warmer conditions in the tropics.
            Human evolution has been human entering regions outside of the tropics and adapting to these colder condition, and have done this using human technology.

            And much of these land regions have average temperature of about 10 C or lower.
            Much of vast land regions which has fewer people in it, are colder than 10 C.
            Canada and Russia having average of -4 C and the coldness in these largest countries, is economic barrier that even with modern technology can be difficult place to live- such regions have limited viable activities which are available- therefore less people are living there.
            The crazy Soviets had big plans of expaning settlements in such undesirable regions, and that is related to the Russia Gulag. Which didn’t work out well, in a quite few different ways.

    • Nate says:

      Dont think we had satellite measurements then….

      but if you want to look at surface measurements the recent trends are even larger and pause even less apparent.

    • Duncanbelem says:

      It’s 9:00 Am 50 degrees F, Now 10:00, and now 60. Now it’s 11:00 and now 70. By midnight we will all be melting!!!!!

  14. Bart says:

    I think this measurement, coupled with that of last month, is very anomalous, and deserves investigation. Where is the driving signal coming from? Is it at specific latitudes or zones? Or, was there a general uptick? Did anything happen to change the measurements? Did a satellite start losing thermal control? Are the ephemerides accurate? Did some floating point value in the computer code get accidentally integerized, and suddenly transition up or down a full value?

    It may just be noise, and next month will see a plunge consistent with the ground observations. But, it is worthwhile getting out ahead of the situation, and start sifting through the data for insights. I don’t mean to appear like a know-it-all, as I’m sure Dr. Spencer et al. are continuously combing through the data for quality assurance. This is directed more at the general audience as things to keep in mind when forming impressions of the data.

    • Sir Isaac Snapelton says:

      Bart

      “Just to clarify, I suggested reexamining the theory, not the observations.”

      10 minutes later you’re doing just the opposite.

      • RWturner says:

        These data are not simple empirical observation, smh.

      • Bart says:

        Observations have to be checked for consistency. These observations are odd, considering that we know La Nina conditions are developing, and the surface data sets reflect this as expected. It doesn’t mean they’re wrong, it just means they need to be scrutinized.

        • Sir Isaac Snapelton says:

          Bart

          I expect surface data sets will be up sharply as well, close to or breaking all time highs for the month of October.

          • Sir Isaac Snapelton says:

            To my point:

            “In the Moyhu NCEP/NCAR index, the monthly reanalysis average rose from 0.317C in September to 0.372C in October, 2017, making it the warmest month since May.”

          • Sir Isaac Snapelton says:

            Bart

            ?….. My prediction is for October.

          • Bart says:

            You think that line’s going to jump up higher than the peak?

          • Sir Isaac Snapelton says:

            Higher than the peak? Pay attention. I said, “close to or breaking all time highs for the month of October.”

          • David Appell says:

            Bart says:
            “https://tinyurl.com/y7c974gg”

            What an idiotic chart. You should be ashamed for trying to pass it off as meaningful.

            The monthly data (all data, not a cherry pick) show a trend, from 1/1998, of +0.14 C/decade.

            You know that. If you do, you’re being deliberately dishonest. If not, you are woefully incompetent. I don’t know which is worse.

            PS: Had_CRUT is now on v4.6, not v4.5.

          • Bart says:

            Now that’s ridiculous and dishonest.

            The trend is A) way less than projected by the models B) only up because of a temporary El Nino blip at the end.

          • barry says:

            The recent UAH October anomaly is an all-time high for the month of October in that data set.

          • Bart says:

            So, a single month’s measurement settles the argument?

          • barry says:

            Isaac is talking about Octobers. That was “the argument.”

          • David Appell says:

            Bart says:
            “The trend is A) way less than projected by the models”

            I’m sure you — especially you — can’t prove that in anything resembling an honest fashion.

    • RWturner says:

      I concur. I am having trouble finding any time in this data set when warming occurred over 4 consecutive months. There should be a clear reason why something so anomalous is happening, and if one cannot be found, errors are likely present.

      • barry says:

        I am having trouble finding any time in this data set when warming occurred over 4 consecutive months

        From May 1989
        Mar 1993
        Feb 1994 (5 months consecutive warming)
        Jan 2000
        Jun 2003
        May 2006 (5 consec months)
        Mar 2011

        https://www.nsstc.uah.edu/data/msu/v6.0/tlt/tltglhmam_6.0.txt

        • RWturner says:

          Thanks

          1. warming after La Nina
          2. warming after Pinatubo? ENSO and UAH diverged here too
          3. 3 months after minor El Nino
          4. warming after La Nina
          5. 3 month lag to moderate El Nino
          6. 3 month lag to mild El Nino
          7. warming after La Nina

          Eyeballing it, this appears most similar to the warming from June-Oct 2003 — same time of year, occurred after weak El Nino conditions. Perhaps the magnitude of warming this time around is due to how soon after the major El Nino it occurred and although short-lived, the May-July El Nino conditions were moderately strong (stronger than 2003) according to the multivariate index.

          Perhaps the September-October anomalies make more sense than at first glance.

          • RWturner says:

            And it helps when using the better fitting 3-month lag than 2-month lag that I was initially assuming.

          • barry says:

            I often see a 5-month lag posited – instead of basic it on peak-to-peak, the lag is calculated from the whole ENSO period, IIRC.

      • Werner Brozek says:

        I am having trouble finding any time in this data set when warming occurred over 4 consecutive months.

        RSS is not in for October, but they have warming over 3 consecutive months now.

        • Dave says:

          RSS is now in, with a small drop in TLT since September. Interestingly however, their TTT dataset shows a further increase – smaller, but similar recent trend to UAH 6. The UAH weighting function (i.e. with altitude) is now more similar to RSS TTT (since UAH 6 versus 5.6) than their TLT, which is affected more by surface temperatures, so this suggests that some of the recent deviation from surface temperatures results from additional heat in the upper part of the troposphere that is included in the TLT data.

    • Nate says:

      “Where is the driving signal coming from?”

      ENSO 3.4 with usual tropo delay perhaps

      http://www.bom.gov.au/climate/enso/indices.shtml?bookmark=nino3.4

      • RWturner says:

        Typically it’s a two month lag if I remember correctly. Even if the lag were delayed by a month, the amount of tropo warming doesn’t agree with how weak the midsummer 3.4 warming was.

  15. RWturner says:

    Has there ever been a consecutive 4 month increase that is not associated with El Nino? This result is very surprising to me considering the SH and tropics surface cooling.

  16. Marcel Duchamp says:

    How much did the Koch brothers pay you to lie on this website?

  17. ren says:

    Annual Antarctic sea ice extent (total area of at least 15% ice concentration) for the last 7 years.
    https://seaice.uni-bremen.de/data/amsr2/today/extent_s_running_mean_amsr2_previous.png

  18. gbaikie says:

    It appears that the 4012 replies have been entombed in High Fells of Rhudaur.
    I wonder how many blog post have had so many. The vast number seemed to slow things down.
    Looking at it, I see one of my post in still in moderation- no doubt a ghost rather possibly alive.
    And elsewhere I was asking about copper cubes and there rate of cooling. No one had answers.
    But there was reply:

    -bobdroege says:
    October 31, 2017 at 11:57 PM

    Newtons Law of Cooling.

    You Sir, have been schooled.-

    Anyways, I was wondering [related to reply] if all would agree that a cube touching another cube [of solid cooper] with temperature difference would conduct more heat than compared to amount it could radiate. Or if you separate them by 1 mm, one gets a lot less heat transfer via radiation.

  19. Ryddegutt says:

    Could this increased difference between surface and troposphere temperature tell us something about the heat flux between the surface and space?

    Intuitive I would think that this means that more thermoenergy is now transported away from the surface.

    • gbaikie says:

      — Ryddegutt says:
      November 2, 2017 at 2:18 PM

      Could this increased difference between surface and troposphere temperature tell us something about the heat flux between the surface and space?

      Intuitive I would think that this means that more thermoenergy is now transported away from the surface.–

      I would agree, but say transporting rather than finished transported.
      But rather say it indicates less energy was absorbed by the entire ocean at that time.

      • gbaikie says:

        –absorbed by the entire ocean–
        I meant absorbed within the ocean, though another possibility could more was absorbed of which was more immediately evaporated so as to increase global air temperature.

        Though might have something to due with hurricanes [as G said] drawing up tens of meters of warm ocean water and quickly dumping it atmosphere. But I don’t think the “more hurricane activity” was much of factor.

        Basically I would say we had large El Nino which is a big butterfly.
        Effects still echoing.

        • David Appell says:

          And why did we have such a large El Nino?

          • GC says:

            Because the ocean temps in the El Nio zone are higher. What made the ocean temps higher over multidecadal timescales? Increased penetration of Solar short wave electromagnetic radiation into the ocean, particularly at Tropic latitudes. What caused the increase in Solar short wave electromagnetic radiation at the surface, particularly at Tropic latitudes, over multidecadal timescales? Reduction in low level Cumulus cloud, particularly at Tropic latitudes. What caused the reduction in low level Cumulus cloud, particularly at Tropic latitudes? Unknown.

          • Svante says:

            GC, tropical cloud reduction has been predicted by multiple scientific papers.
            Ask me again if you can’t find them.

          • gbaikie says:

            re:
            — David Appell says:
            November 3, 2017 at 8:19 PM

            And why did we have such a large El Nino?–
            And:
            — GC says:
            November 5, 2017 at 10:59 PM —

            Why large El Nino? In simply terms, because
            we didn’t have much EL Nino preceding it.

            I would say the warming of El Nino [or cooling of
            La Nina] causing temperature changes isn’t “global warming”
            in similar manner that any added heat from a hurricanes
            isn’t “global warming”. Or it’s heat relaesed to the atmosphere which will radiate into space, It takes some time
            to radiate into space, but it’s basically out the door.

            Of course most imagine that warming atmosphere is global warming. I imagine warming the ocean is global warming.
            So it’s a bit of problem for me to explain it.

          • GC says:

            Svante,

            Yes, I would like to see these paper’s that you refer to. I’d be very surprised to read that they were anything but models making projections without physicality, as clouds are poorly understood. Do these paper’s make forecast for stabilisation of low level cloud coverage levels throughout 2000’s?

          • Svante says:

            GC, here’s a list, follow their references for more:
            https://tinyurl.com/ydg3bg48

            Note that there are multiple pages.

  20. des says:

    Roy
    Why do you worry about your data only when this divergence shows UAH warmer than the surface, but not when it comes out colder?

    • Bart says:

      Because the surface custodians have their thumb on the scales. So, it is expected that actuals would be lower. When they appear to be higher, it raises eyebrows.

      • des says:

        Yes – perhaps they have made too many downward adjustments to the surface data.

      • David Appell says:

        Bart says:
        “Because the surface custodians have their thumb on the scales.”

        Bias adjustments REDUCE the long-term warming trend!!

        (How would you choose to correct for the known biases?)

        • Bart says:

          Meaningless. Trends are not helpful in identifying causes. The “adjustments” eliminate characteristics which show that temperatures do not correlate with CO2.

          The question isn’t whether temperatures have gone up in the last 100 years. The question is why? And, it’s obviously not because of CO2.

          • David Appell says:

            Bart says:
            “Trends are not helpful in identifying causes.”

            Congratulations — that’s your dumbest comment yet. (Among many competitors.)

          • Bart says:

            Yours are equally valueless. Suppose I have less than a quarter cycle of a sinusoid, and fit a trend to it. Of what value is this information for projecting long term behavior?

        • Nate says:

          “And, its obviously not because of CO2.”

          In Barts unbiased opinion…

  21. Gordon Robertson says:

    The UAH data comes from NOAA. I’d like to know more about any interference NOAA may have with the data before it is handed over. Or does UAH get the data directly from the satellites?

    If NOAA has anything to do with the data before it is handed over, given their recent track record fudging data, it would not surprise me if the UAH data is fudged before passing it on.

    • des says:

      This is exactly what I predicted last month that you guys would do.

    • Mickey Prumt says:

      Gordon Robertson, how can you be that stupid ?
      how is it possible ?
      Is there any way that we can help you ?

      thank you for your response.

    • David Appell says:

      Gordon Robertson says:
      “If NOAA has anything to do with the data before it is handed over, given their recent track record fudging data, it would not surprise me if the UAH data is fudged before passing it on.”

      Baseless claims with no evidence at all.

      The sign of a man desperate to maintain his delusions.

  22. It is warm the question is does this last in the face of factors now coming into play that promote cooling.

    Those being low solar, and associated effects and overall oceanic cooling in addition to La Nina tendency now coming on.

    Snow coverage above normal, and with cosmic rays on the increase chances favor more global cloud coverage.

    That would translate to a higher albedo.

    You can’t fight the data which is very against what I am expecting thus far.

    • Krakatoa says:

      How much cooling would you expect? Because of the developing La Nina, it is very that we will see some cooler months at the beginning of 2018.

      • des says:

        One thing is certain – the anomaly can’t stay this high.
        However … I seem to recall saying that last month.
        The trend value is only +0.28. And I can guarantee that if the anomaly falls to the trend value next month then deniers will be speaking of ‘massive cooling’ instead of a ‘return to normality’.

        Even without a full-blown La Nina, the tropical Pacific IS cooling, and we should expect to see sub-average temperatures by early next year. If a non-weak La Nina develops there is the possibility of negative anomalies, and if it is a strong one we would EXPECT negative anomalies, even -0.25. However, all indications at the moment are that any La Nina will be weak.

    • barry says:

      It’s by no means certain a la Nina will develop.

      Just over a year ago people were calling a certain la Nina as the el Nino dropped. Temps didn’t dive very deep after el Nino finished. Wait and see.

    • gbaikie says:

      — Salvatore Del Prete says:
      November 2, 2017 at 4:29 PM

      It is warm the question is does this last in the face of factors now coming into play that promote cooling.

      Those being low solar, and associated effects and overall oceanic cooling in addition to La Nina tendency now coming on.

      Snow coverage above normal, and with cosmic rays on the increase chances favor more global cloud coverage.

      That would translate to a higher albedo.–

      Suppose [not say they do, just suppose] these factors mostly affect land surfaces.
      Does cooler land surfaces [which effects human land dweller the most] affect global temperatures?

      If land surface temperatures were to lower by average of 1 C that would big effect upon the already frigidly cool average land surface temperatures, but if ocean surface stays about the same, that large amount of land surface cooling doesn’t have much effect upon average global temperature.

      I wouldn’t guess you think land surfaces are going to lower by as much a 1 C, but if it was 1/2 C cooling of land surface only, it’s 1/2 as much “of not much effect upon global average temperature”. And 1/2 C or less of cooling of land surface could also have bad consequences for land dwellers.

    • David Appell says:

      Salvatore Del Prete says:
      September 5, 2017 at 8:27 AM
      “The over all trend for year 2017 is down and Sep. will not be as warm as Aug.”

      http://www.drroyspencer.com/2017/09/uah-global-temperature-update-for-august-2017-0-41-deg-c/#comment-261192

    • David Appell says:

      Salvatore Del Prete says:
      “It is warm the question is does this last in the face of factors now coming into play that promote cooling.”

      “Your conclusions are in a word wrong, and that will be proven over the coming years, as the temperatures of earth will start a more significant decline (which started in year 2002 by the way)….”

      – Salvatore del Prete, Reply to article: IC Joanna Haigh – Declining solar activity linked to recent warming, 10/8/2010
      http://climaterealists.com/index.php?id=6428

  23. barry says:

    I wonder what would happen if no one recycled arguments we’ve seen here a dozen times already.

  24. AaronS says:

    The pattern looks like a wavelet and the post cursor. Sort of like the 2016 el nino sequence was: ocean released energy, then major temp spike, then a smaller spike as a post cursor that we see now. What is interesting is this is the only major el nino without a la nina, and maybe the cool la nina dampens this signal. It is fascinating to watch such a high resolution record.

  25. See SOI at
    http://www.bom.gov.au/climate/enso/#tabs=SOI
    Global temperatures tend to lag the SOI by about 6/7 months.
    This graph shows the SOI within El Nino range for parts of May through July. I would anticipate a rapid cooling from end January on. Maybe extreme cold end March into April

    • For where we are now re climate trends and forecasts see

      The coming cooling: usefully accurate climate forecasting for policy makers.
      Dr. Norman J. Page
      Email: [email protected]
      Energy & Environment
      0(0) 118
      (C )The Author(s) 2017
      Reprints and permissions:
      sagepub.co.uk/journalsPermissions.nav
      DOI: 10.1177/0958305X16686488

      ABSTRACT
      This paper argues that the methods used by the establishment climate science community are not fit for purpose and that a new forecasting paradigm should be adopted. Earth’s climate is the result of resonances and beats between various quasi-cyclic processes of varying wavelengths. It is not possible to forecast the future unless we have a good understanding of where the earth is in time in relation to the current phases of those different interacting natural quasi periodicities. Evidence is presented specifying the timing and amplitude of the natural 60+/- year and, more importantly, 1,000 year periodicities (observed emergent behaviors) that are so obvious in the temperature record. Data related to the solar climate driver is discussed and the solar cycle 22 low in the neutron count (high solar activity) in 1991 is identified as a solar activity millennial peak and correlated with the millennial peak -inversion point – in the UAH temperature trend in about 2003. The cyclic trends are projected forward and predict a probable general temperature decline in the coming decades and centuries. Estimates of the timing and amplitude of the coming cooling are made. If the real climate outcomes follow a trend which approaches the near term forecasts of this working hypothesis, the divergence between the IPCC forecasts and those projected by this paper will be so large by 2021 as to make the current, supposedly actionable, level of confidence in the IPCC forecasts untenable.

      • John Parsons says:

        Sage Publications. Pretty much says all you need to know.

      • Sir Isaac Snapelton says:

        From Dr. Page in 2010:

        “At this time the sun has entered a quiet phase with a dramatic drop in solar magnetic field strength since 2004. This suggests the probability of a cooling phase on earth and it seems possible that Cycle 23 is more or less equivalent to Cycle 4 so that a Dalton type minimum is likely.”

        • Sir Isaac Snapelton says:

          Summary of his professional background: “International oil exploration geology and management in most of the worlds most active plays and basins including Brazil, Peru, Bolivia.Columbia Venezuela.North Sea, Algeria ,Nigeria,Gabon , Ghana Egypt Syria United Staes Gulf Coast and Offshore GOM. etc etc.”

          • From the same 4 year update.

            2. The Past is the Key to the Present and Future . Finding then Forecasting the Natural Quasi-Periodicities Governing Earths Climate – the Geological Approach.

            2.1 General Principles.

            The core competency in the Geological Sciences is the ability to recognize and correlate the changing patterns of events in time and space. This requires a mindset and set of skills very different from the reductionist approach to nature, but one which is appropriate and necessary for investigating past climates and forecasting future climate trends. Scientists and modelers with backgrounds in physics and maths usually have little experience in correlating multiple, often fragmentary, data sets of multiple variables to build an understanding and narrative of general trends and patterns from the actual individual local and regional time series of particular variables. The value of the geologists’ approach to understanding the past is proven by the trillions of dollars spent by the oil companies to find and produce the millions of barrels of oil and billions of cubic feet of gas needed daily to fuel the world economy. It works!

            Earth’s climate is the result of resonances and beats between various quasi-cyclic processes of varying wavelengths combined with endogenous secular earth processes such as, for example, plate tectonics. It is not possible to forecast the future unless we have a good understanding of the relation of the climate of the present time to the current phases of these different interacting natural quasi-periodicities which fall into two main categories.

            a) The orbital long wave Milankovitch eccentricity,obliquity and precessional cycles which are modulated by
            b) Solar “activity” cycles with possibly multi-millennial, millennial, centennial and decadal time scales.

            The convolution of the a and b drivers is mediated through the great oceanic current and atmospheric pressure systems to produce the earth’s climate and weather.
            After establishing where we are relative to the long wave periodicities to help forecast decadal and annual changes, we can then look at where earth is in time relative to the periodicities of the PDO, AMO and NAO and ENSO indices and based on past patterns make reasonable forecasts for future decadal periods.

            In addition to these quasi-periodic processes we must also be aware of endogenous earth changes in geomagnetic field strength, volcanic activity and at really long time scales the plate tectonic movements and disposition of the land masses.”
            The main deficiency of the establishment scientists is their lack of practice in correlating events in time and space. It is the main task of Exploration geologists – but their interpretations are then tested soon after they are made by drilling wells which cost sometimes hundreds of millions of dollars. Academic forecasts are only judged by how closely they follow the “consensus” or the party line.

        • My forecasts naturally are updated as data comes in.
          See eg
          https://climatesense-norpag.blogspot.com/2014/07/climate-forecasting-methods-and-cooling.html
          2014 Updates and Observations..
          “3.2.1 Updates
          a) NH Forecast- item 4. With regard to timing, closer examination of the Ap Index (Fig13) and Neutron Count (Fig.14) would suggest that the sharpest drop in activity is better placed at 2005/6 with the associated sharp temperature drop now forecast at 2017-18.
          b) Global Forecast – item1. Significant temperature drop now forecast for 2017-18.
          c) Global Forecast – item 9. Another year of flat Livingston and Penn umbral data suggests that a swift decline into a Maunder Minimum is now very unlikely.”

          • Sir Isaac Snapelton says:

            Dr. Page

            “Significant temperature drop now forecast for 2017-18.”

            You and Salvatore should get together. He regularly updates his forecasts as well.

          • des says:

            And don’t forget – there is absolutely no guarantee of a Maunder-like minimum anyway. Ice-age freaks always talk as though this is a certainty that we have the ability to predict.

          • Des I can’t guarantee it but here is what the paper says re Maunder minimum
            “3.1 Long Term.

            The depths of the next LIA will likely occur about 2640 +/-. In the real world no pattern repeats exactly because other things are never equal. Look for example at the short-term annual variability about the 50-year moving average in Fig. 3. The actual future pattern will incorporate other solar periodicities in addition to the 60-year and millennial cycles, and will also reflect extraneous events such as volcanism. However, these two most obvious cycles should capture the principal components of the general trends with an accuracy high enough, and probability likely enough, to guide policy. Forward projections made by mathematical curve fitting alone have no necessary connection to reality if turning points picked from empirical data in Figs 4 and 10 are ignored.”

          • The 4 year update made in 2014/7 says Temperature drop in 17/18
            My opening comment above says
            “Global temperatures tend to lag the SOI by about 6/7 months.
            This graph shows the SOI within El Nino range for parts of May through July. I would anticipate a rapid cooling from end January on. Maybe extreme cold end March into April” {2018}

          • David Appell says:

            In 2012 Norman Page predicted global cooling — he was, ey aw — wrong. Very wrong.

            http://davidappell.blogspot.com/2016/05/dr-norman-page-phd-still-batshit-insane.html

            Page’s 2012 prediction: “the earth is entering a cooling phase which is likely to last about 30 years and possibly longer.”

            https://wattsupwiththat.com/2012/11/19/cooling-in-the-near-future/

            wrongwrongwrongwrongwrong.

          • des says:

            Judging by Norman Page and Donald Easterbrook, a geologist must be at least 80 years old to believe this nonsense. And Salvatore looks like he is at least in his 70s – and that’s from a 5 year old photo. Global cooling is a pastime for old bored retired men who are desperate to make a difference in their remaining time. They desperately NEED to see a sign of cooling to give their life meaning. And they WILL make sure they see it – all they need is a proverbial ink blot and they can see anything they want to.

    • David Appell says:

      “Energy & Environment”

      E&E, the deniers’ journal of last resort.

      Whose editor admitted she was biased.

  26. John Parsons says:

    The positive side of the y-axis on Roys chart already has to be 40% larger than the minus side just to fit the results. You know youre in trouble when youve got to expand the axis because the warming trend no longer fits your chart.

  27. SocietalNorm says:

    I’m so happy that October had such pleasant weather this year up here in the northeast US.

  28. des says:

    I bet old “pause” t-shirts are going cheap now.

  29. ren says:

    At night, geomagnetic activity increased. Agung’s seismogram again reacted. This means that any stronger geomagnetic storm may cause an eruption.
    https://www.facebook.com/Sunclimate-719393721599910/

    • David Appell says:

      As always, ren offers a single snapshot of Canadian temperatures, which says absolutely nothing about how quickly the temperature is dropping or changing.

      At least ren is consistent.

  30. ren says:

    Ice extent is growing rapidly in Baffin Bay.
    http://files.tinypic.pl/i/00944/qo2c9df0jmtj.png

  31. ren says:

    In fact, the troposphere is a very thin layer of atmosphere. Especially over the poles.
    http://ds.data.jma.go.jp/tcc/tcc/products/clisys/STRAT/gif/zt_nh.gif

  32. cloudbase says:

    I wonder where all that heat went over the last two months. Obviously not into the atmosphere 😉 🙂
    https://www.tropicaltidbits.com/analysis/ocean/carssta.png

    • barry says:

      What is the significance of that tiny area?

      85W-65W : 10N-20N

      The Caribbean?

      • g*e*r*a*n says:

        Scientifically, there is a lot of significance. For example, it is a pretty clear evidence of how hurricanes extract energy from the oceans/seas. And that demonstrates one of the ways the Earth can cool itself. It also explains the high anomaly for Oct. UAH.

        (Please keep this info confidential. We don’t want Warmists learning any science. They believe CO2 can heat the planet, and we love their comedy.)

      • barry says:

        It also explains the high anomaly for Oct. UAH.

        Fascinating stuff.

        So there must have been more intense hurricane activity in the Gulf in October compared to September, seeing as how the hurricanes determine the monthly SSTs there.

        https://en.wikipedia.org/wiki/2017_Atlantic_hurricane_season

        • g*e*r*a*n says:

          Yes, but remember there is a lag before all the heat energy moves to space. So October satellites are “seeing” some of both September and October.

          • g*e*r*a*n says:

            No, SST’s respond pretty quickly. It’s the heat energy released by the hurricanes that requires time before being radiated to space.

        • barry says:

          Don’t know if you checked out the hurricane season timeline, but October was relatively quiet compared to an extremely active September, so I’d have expected to see very low SSTs in Sept, and higher SSTs in Oct if hurricanes were sucking the energy out.

          Is it possible other factors cause SSTs, and hurricanes respond to SSTs rather than determine them?

          • g*e*r*a*n says:

            You may be confusing SSTs with the heat energy released to the atmosphere.

            The graph you linked to is an average of SSTs, so it will lag. The SST immediately affected by an individual hurricane will not lag. The heat energy in the atmosphere can take weeks to make it to space.

            Solar energy causes SSTs to rise. Evaporation (hurricanes and El Ninos) cause SSTs to fall.

          • barry says:

            The Caribbean SST graph was in the first post in this thread, so after you commented that hurricanes sucked the energy from the ocean, I checked out the 2017 hurricane season to see if the biggest hurricanes (and the month of highest hurricane activity) had indeed sucked energy out that region. I also checked the storm tracks to see which storms had passed through the Gulf and when exactly.

            The SST chart is a daily SST chart from August to Nov.

            For almost all of the period SSTs do the opposite of what would be expected if hurricanes crossing the Gulf were sucking the energy out of it to such a degree it would impact sea surface temperatures.

            September values are mostly above 0.4C. October values are on average cooler than that 0.4, and cooled for most of that month, while there was only one hurricane that crossed through the gulf early in the month.

            SSTs rose for the period from Sept 13 to Sept 25. Hurricane Maria crossed the Caribbean during the middle of this period mostly as a Cat 5 storm.

          • barry says:

            Looking for a correlation with hurricanes depleting heat from the SST I first questioned the significance of, I found instead mostly anti-correlation.

            Check for yourself:

            https://www.tropicaltidbits.com/analysis/ocean/carssta.png

            https://en.wikipedia.org/wiki/2017_Atlantic_hurricane_season

          • barry says:

            Not to mention, the Atlantic is not the only zone where super storms occur. There’s the Pacific Ocean, too. The Caribbean is not the only place where storms track in the Atlantic, so it seems a little narrow-viewed to drill down just to there. I think it’s a bit simplistic to reckon that hurricanes hitting the Caribbean is all you need to know to account for the latest high UAH anomaly.

            (Sorry, I’ve had to cut my original single post into bits and lose some – wordpress wouldn’t post a section)

          • g*e*r*a*n says:

            barry throws out another red herring: “I think its a bit simplistic to reckon that hurricanes hitting the Caribbean is all you need to know to account for the latest high UAH anomaly.”

            Sooooo desperate.

            Now barry is “proving” that hurricanes heat the planet (anti-correlation to lowering SSTs)!

            I just love the comedy.

          • GC says:

            How does water vapor radiate energy away to space? I was under the impression that water vapor merely moves the heat to higher altitudes, the heat is exothermically released at altitude where it cools. The energy itself not leaving the system. I was under the impression that water vapor could not radiate heat energy to space unless interacting with particulates in the Tropopause.

          • Norman says:

            I will throw my support in with g*e*r*a*n on this debate. Hurricanes do cool the ocean surface directly (up to 4 C in some places, at least for a period of time, the ocean will rebound).

            Here is empirical evidence that directly supports what g*e*r*a*n is saying.

            https://earthobservatory.nasa.gov/IOTD/view.php?id=6223

          • barry says:

            barry throws out another red herring

            Just looking at the observations. And thnking of the woods instead of a tree. I have no idea if hurricanes warm or cool global SSTs/TLT, or if their impact is at all significant.

            Here is empirical evidence that directly supports what g*e*r*a*n is saying.

            That’s just one hurricane track for one period. I got inverse results looking at September/October. I wonder if hurricanes make a significant impact on the global TLT. I don’t think that link provides a definite answer (effect could be negligible). I did see the cool wakes following some of this season’s hurricanes.

          • barry says:

            A check on this would be to gather the SSTs for the Gulf over busy hurricane seasons and check the timing of temp fluctuations. Then for the same seasons, check the TLT fluctuations (allowing for lag?). Then it would probably be a good idea to see if these fluctuations could be found outside Atlantic hurricane season.

            The Pacific should probably also be included to get an idea of global influence of hurricanes on global SSTs/TLT.

            https://en.wikipedia.org/wiki/2017_Pacific_hurricane_season

          • barry says:

            For a little perspective, here is the global SST anomaly map for Sept 21. Maria (Cat 5) had just hit Puerto Rico the day before.

            http://www.ospo.noaa.gov/data/sst/anomaly/2017/anomnight.9.21.2017.gif

            Here’s the anomaly map for Oct 19, when there were no hurricanes in the region.

            http://www.ospo.noaa.gov/data/sst/anomaly/2017/anomnight.10.19.2017.gif

          • barry says:

            More global SST anomaly maps for your viewing interest.

            http://www.ospo.noaa.gov/Products/ocean/sst/anomaly/

          • cloudbase says:

            The Carribean is not the only area of ocean that has its surface cooling over the last few months. I have watched Eastern Indian, SW Pacific (all ENSO zones), North Pacific and South Atlantic all cool significantly over the last to months. I say again…where did all the heat go .
            Dr Spencer….is you data able to show significant LT warming in these areas as opposed land areas….or is the mixing to fast.

          • cloudbase says:

            Btw…some of the areas I mentioned above have warmed slightly over the past week…as can be seen in the 7 day anomaly.

            https://www.tropicaltidbits.com/analysis/ocean/cdas-sflux_ssta7diff_global_1.png

            https://www.tropicaltidbits.com/analysis/ocean/cdas-sflux_ssta_relative_global_1.png

          • barry says:

            cloudbase,

            you can get monthly regional anomalies for UAH here.

            http://tinyurl.com/y997zl7w

          • barry says:

            Looking at that I see most regions have warmed over the last few months, so maybe even if tropical seas did cool, the rest of the globe countervailed. The Arctic (NoPol) warmed by 1.3C from July to September, for example, and the extratropical regions warmed, too.

            It may be unwise to put all your eggs in the tropical ocean basket.

          • cloudbase says:

            Not all the areas I pointed out are tropical Barry. My original post was somewhat tongue in cheek…..but with huge areas of the oceans cooling so quickly you have to ask did it move into the atmosphere via evapoation and therefore has the last few months been globally cloudier those temporaily trapping heat within the LT.
            If there is a monthy global graphy of cloudiness I’d be interested in a link.
            Ren ??

          • cloudbase says:

            Typo ^ monthly global graph.

          • barry says:

            Not all the areas I pointed out are tropical Barry.

            I know, but hurricanes are generally tropical phenomena.

            Gave you the link to regional data in response to your question:

            Dr Spencer.is you data able to show significant LT warming in these areas as opposed land areas

            Includes anomalies for global, tropical, NH, SH, NH extratropic, SH extratropic, Arctic and Antarctic ocean regions.

            http://tinyurl.com/y997zl7w

    • Nate says:

      G*: “We dont want Warmists learning any science.”

      G*s idea of ‘science’ is a bit unusual. Hand-waving conjectures by a dude on a blog, lacking calculation or even estimates, are not science. Not worried about learning too much.

      2005 was a record setting hurricane year with 3 cat 5s, 1 cat 4, some cat 3s. Would expect a significant jump in UAH LT temp in Fall of that year.

      Lets check: Nope.

  33. des says:

    For those who claim that hurricanes can cause GLOBAL warming, here is an analysis of the UAH response to Atlantic hurricane clusters over the past 20 seasons. I have included all clusters of category 3-5 hurricanes that include AT LEAST TWO CATEGORY 4 OR 5s. In square brackets are the CHANGES in UAH anomaly from the previous month. As people are claiming that the October 2017 anomaly is due to a lag from September, I have included the month following the end of the cluster.

    1998
    Sep 15 Nov 5 ONE category 5, ONE category 4
    [Sep -0.08, Oct -0.04, Nov -0.28]

    1999
    Aug 18 Sep 23 FOUR category 4
    [Aug -0.05, Sep +0.12, Oct -0.06]

    2000
    Sep 21 Oct 6 TWO category 4
    [Oct +0.02, Nov -0.03]

    2001
    Oct 4 Nov 5 TWO category 4
    [Oct +0.19, Nov -0.01, Dec -0.02]

    2003
    Aug 25 Oct 7 ONE category 5, ONE category 4, ONE category 3
    [Sep +0.05, Oct +0.14, Nov -0.11]

    2004
    Jul 31 Sep 24 ONE category 5, THREE category 4, TWO category 3
    [Aug +0.13, Sep +0.12, Oct +0.13]

    2005
    Jul 4 Oct 31 – FOUR category 5, ONE category 4, TWO category 3
    [Jul +0.07, Aug -0.12, Sep +0.13, Oct +0.02, Nov -0.07]

    2007
    Aug 13 – Sep 5 – TWO category 5
    [Aug +0.02, Sep -0.08, Oct 0.00]

    2008
    Aug 25 Nov 10 – FOUR category 4
    [Sep +0.18, Oct -0.02, Nov +0.06, Dec -0.04]

    2010
    Aug 21 – Sep 20 – FOUR category 4, ONE category 3
    [Sep +0.03, Oct -0.17]

    2011
    Aug 21 Oct 3 TWO category 4, ONE category 3
    [Aug -0.04, Sep +0.01, Oct -0.22, Nov +0.03]

    2016
    Sep 28 Oct 18 – ONE category 5, ONE category 4
    [Oct -0.03, Nov +0.04]

    Average of all CHANGES in UAH anomaly for the months under consideration …. a massive +0.0005 degrees. In other words there is NO effect, and any year that APPEAR to show an effect (eg. 2004) are just random noise.

    Now 2017:
    Aug 17 – Oct 16 – TWO category 5, TWO category 4, TWO category 3
    [Aug +0.12, Sep +0.13, Oct +0.09]

    I predict that certain people here will point to 2004 as the “perfect example” of what they are talking about, while completely ignoring the rest.

    Time to find another excuse.

    • g*e*r*a*n says:

      That’s a good start, des. But to be meaningful, you would also have to correlate with each hurricane location and duration.

      Otherwise, your results could easily be skewed.

      I encourage you to continue. Who knows, maybe you can prove hurricanes help cool the planet. . . .

      • Mickey Prumt says:

        Do you defend the idea that hurricanes can cause GLOBAL warming ?
        Is it possible to defend such an stupid idea ?

      • des says:

        So tell me what work YOU have done to “correlate with each hurricane location and duration” that leads you to believe that hurricanes can alter global climate.

        • des says:

          Oh – and try to avoid another one of your meaningless throw away lines. Something that ADDS to the discussion would be appreciated,

        • g*e*r*a*n says:

          des, I don’t waste time trying to prove the obvious. My time is much better spent canceling out pseudoscience.

          • des says:

            Yet you spend all your time SPREADING pseudoscience. How can it possibly be ‘obvious’ based on what I have shown you?

          • g*e*r*a*n says:

            “Obvious” comes from an understanding of the thermodynamics of evaporation. The subsequent condensation (rain) releases enormous amounts of heat energy into the atmosphere, which later gets radiated to space. The end result is a net cooling of the planet.

            The data you assembled was a good start, as I indicated. But, you must correlate the heat content involved with the satellite data, to find exact influence. For example, the eye pressures might be a good way to compare hurricanes. A reasonable assumption might be that lower pressures cause more evaporation.

            Then, you would need to include how long the pressures are maintained. A good check would be to also estimate the amount of rainfall, from each hurricane.

            The end result of such a massive study would show the obvious, that hurricanes move ocean/sea heat energy to space. But, the exact details and effects on UAH anomalies would be interesting.

          • des says:

            The fact that heat gets dumped into the atmosphere is indeed obvious. That they produce the amount of heat required to cause significant GLOBAL warming is NOT. As no serious meteorologist (INCLUDING Dr Spencer) believes that this anomalous warming is caused by hurricanes, it is up to you and your ilk to prove them wrong. Unless you do that, these claims are mere conjecture.

          • g*e*r*a*n says:

            des states: “That they (hurricanes) produce the amount of heat required to cause significant GLOBAL warming is NOT (obvious).”

            des, you keep using the wrong terminology. I never said hurricanes cause “global warming”. They result in global cooling.

          • Norman says:

            Maybe this information will help.

            https://en.wikipedia.org/wiki/Orders_of_magnitude_(energy)

            One day of rainfall energy release from an average hurricane is 5×10^19 joules according to the chart in the link. Latent heat seems about 400 times more energy than that in the winds of a hurricane.

            An average hurricane could move that much energy into the atmosphere via latent heat of condensation.

            On this graph:
            https://www.quora.com/What-is-the-total-heat-content-of-the-Earths-atmosphere-partitioned-between-its-various-layers

            They show that it would take about 5×10^21 joules to raise the temperature of the atmosphere by 1 C. This would be the whole atmosphere but most the mass is in the troposphere (around 80%).

            Hurricanes would have some effect on troposphere temperatures as recorded by UAH but it would not appear to be too great an effect, regional could be large, global would be much smaller.

          • Sir Isaac Snapelton says:

            Norman

            How much solar energy would be reflected by a 300 mile wide cloud in the tropics?

            I think this would need to be studied and then subtracted from any heat added by the ocean.

          • Norman says:

            Sir Isaac Snapelton

            I found that the low thick clouds could reflect up to 90% of the incoming solar flux.

            I used your 300 mile cloud. It would be 483,000 meters across. The area of the cloud would be around 7.33×10^11 m^2.

            Using this chart you get around 400 w/m^2 flux at equator (night and day cycle)

            http://www.physicalgeography.net/fundamentals/6i.html

            That would give you a total of 2.64×10^14 watts of energy that is reflected by the cloud. In 24 hours you would lose around 2.28×10^19 joules which is also in the range of the latent heat transfer. It would cause some cooling.

          • Sir Isaac Snapelton says:

            Norman

            Interesting!

            On a side note, I’m a little jealous of people like you who enjoy/are good at math. That’s not me, and is why I chose not to pursue a career in science, even though I loved it otherwise.

          • des says:

            The opening comment of my original post: “For those who claim that hurricanes can cause GLOBAL warming”. Have you not been reading the comments of your fellow deniers? They are blaming the recent high anomalies on hurricanes. It seems we now have to combat deniers with diametrically opposite viewpoints. I am only trying to show that this month’s anomaly cannot be blamed on hurricanes. I am not using ‘global warming’ in the long-term climate change sense.

          • Sir Isaac Snapelton says:

            Des,

            I agree. This time around, skeptics can’t blame el nino or an increase in solar activity. The hurricane argument, despite being totally ridiculous, is all they can come up with.

          • Sir Isaac Snapelton says:

            I’m only agreeing that hurricanes cool SST’s. (Read about it at Moyhu).

          • Sir Isaac Snapelton says:

            “Totally ridiculous” is probably overkill. I should just say implausible.

          • PhilJ says:

            Hi SIS,
            Actually thete was a significant spike in solar activity in september which jyst recently trailed back off to 0 SSN..
            Whether that had any effect on the Oct UAH anomoly is hard to say …

          • g*e*r*a*n says:

            Norm, calculates the area of a circle: “I used your 300 mile cloud. It would be 483,000 meters across. The area of the cloud would be around 7.3310^11 m^2.”

            WRONG.

            Norm used the formula for the area of a sphere, so he’s off by a factor of 4.

            Then, the 12-year-old chimes in:

            “On a side note, Im a little jealous of people like you (Norman) who enjoy/are good at math. Thats not me, and is why I chose not to pursue a career in science, even though I loved it otherwise.”

            Hilarious.

          • Norman says:

            g*e*r*a*n

            More like I did the diameter instead of the radius. Easy to correct.

            Would you accept an energy loss in 24 hours of 6.3×10^18 joules of solar input?

          • gammacrux says:

            As to the hurricane discussion:

            Hurricanes as a spectacular phenomenon of general deep convective activity in atmosphere undoubtedly cool the sea surface and transport heat into the upper troposphere near tropopause.

            Estimated (temporary) power of a typical hurricane is about 1 PW (according to Wikipedia)
            Estimated (average) power of deep convection (sensible+ latent heat) is about 50 PW (from Trenberth diagram)

            And tropical cyclone season in SH is not september-october but january-march.

            Now there is no doubt that hurricanes (as deep convection in general) do exist only because there are enough GHGs and a greenhouse effect in earth atmosphere.

            So it is particularly funny to see that GHE deniers nevertheless readily invoke them in order to explain away the high UAH october anomaly.

          • des says:

            Funny how someone couldn’t detect the OBVIOUS reason for being out by a factor of 4.

          • g*e*r*a*n says:

            des, BOTH using the diameter, instead of the radius, AND using the formula for a sphere would throw the answer off by a factor of 4.

            That probably wasn’t obvious to you.

    • Mickey Prumt says:

      I personnaly think that global warming is due to hailstorms.

      • g*e*r*a*n says:

        It’s kumquats, mostly. Bananas also contribute.

        • Mickey Prumt says:

          Please stop making fun of these stupid skeptics who denie greenhouse effect please.

          • g*e*r*a*n says:

            You figured out how to get your misspelled “deny” through spellcheck.

            No one can say you’re completely inept.

          • Mickey Prumt says:

            I let you correct. At least, you are able to do one thing (that is maybe) useful.

            So still denying greenhouse effect ?

          • g*e*r*a*n says:

            The IPCC/CO2 “greenhouse effect” is a hoax.

            (Thanks for asking.)

          • Mickey Prumt says:

            Greenhouse effect was known well before IPCC.

          • g*e*r*a*n says:

            It was known to be a hoax back then also.

          • SkepticGoneWild says:

            Dear Mickey Mouse,

            Even Gavin Schmidt realizes the GHE is an unobservable thought experiment.

          • Sir Isaac Snapelton says:

            SkepticsGoneWild

            Are you telling me DWLWIR is invisible? I was worried I needed glasses.

          • Mickey Prumt says:

            Dear SkepticGoneWild

            First, I don’t care about Gavin Schmidt.
            Second, only extremely stupid person deny greenhouse effect.

          • des says:

            SGW
            So perhaps you’d care to explain why satellites can’t
            ‘see’ the surface of the earth in the band around 15 microns. Then explain why this band has been increasing.

          • g*e*r*a*n says:

            sis asks: Are you telling me DWLWIR is invisible? I was worried I needed glasses.”

            DWLWIR is indeed invisible, snake. But, you may need more than glasses. . . .
            ***

            des addresses SGW: ‘So perhaps youd care to explain why satellites cant see the surface of the earth in the band around 15 microns. Then explain why this band has been increasing.”

            des do you have a link to the satellite spectra you mention?
            ***

          • DearSkepticGoneWild says:

            Dear 3 stooges,

            When one believes something that cannot be scientifically observed, it`s called faith-based science, which is not scince at all. Just a religion.

          • David Appell says:

            DSGW:

            Radiative forcing measured at Earths surface corroborate the increasing greenhouse effect, R. Philipona et al, Geo Res Letters, v31 L03202 (2004)
            http://onlinelibrary.wiley.com/doi/10.1029/2003GL018765/abstract

            “Observational determination of surface radiative forcing by CO2 from 2000 to 2010,” D. R. Feldman et al, Nature 519, 339343 (19 March 2015)
            http://www.nature.com/nature/journal/v519/n7543/full/nature14240.html

          • SkepticGoneWild says:

            I believe, sistuh!
            I believe, brother!

            Wooooohoooo! The GHE is r e a l!

            Lmao!

          • SkepticGoneWild says:

            The alleged 33C is figment of your imagination.

          • g*e*r*a*n says:

            Davie is STILL trying to sell DWIR as a heat source!

            Hilarious.

          • David Appell says:

            SkepticGoneWild says:
            “I believe, sistuh!
            I believe, brother!
            Wooooohoooo! The GHE is r e a l!
            Lmao!”

            Keep playing the clown — your inability to offer a scientific argument says it all.

            Meanwhile, here’s the (very obvious) evidence of the greenhouse effect:

            https://www.giss.nasa.gov/research/briefs/schmidt_05/curve_s.gif

          • SkepticGoneWild says:

            A graph is not thr GHE, you idiot.

          • des says:

            The difference between the emission curve and the abso….n curve (apparently the full word gets blocked here for some reason) IS due to the greenhouse effect. It is radiation which is not making it from the earth’s surface to the top of the atmosphere. Don’t call someone an idiot until you have some idea what you are talking about.

          • SkepticGoneWild says:

            g e*r a n,

            Try this experiment. Get large block of ice and magnifying glass. Hold magnifying glass next to ice block, and piece of paper next to magnifying glass. (Ice block-magnifying glass-paper, in that order) The paper will burst into flames From the concentrated IR from the ice!!

          • SkepticGoneWild says:

            I was talking to the other idiot. A graph is not the GHE Einstein. That graph does not define anything, and does not prove anything. The GHE is an unobservable thought experiment.

          • des says:

            So you’ve never seen an blackbody emission spectrum OR a top of atmosphere abso…..n spectrum then, let alone know how to interpret them. How’s my simple dynamics question going? You don’t have a clue how to start it do you. The biggest lie here is that you have studied ANY physics.

          • Mickey Prumt says:

            SkepticGoneStupid

            You say :
            “The alleged 33C is figment of your imagination.”

            In fact a simpe two-line calculation give you that results.
            I guess, with some time, everybody should be able to understand the underlying assumptions.

          • SkepticGoneWild says:

            Dear Mickey Mouse,
            A calculation is not an observation, Einstein.

          • Mickey Prumt says:

            But you don’t even need the calculation.
            Just compare upward IR radiation at surface and that at TOA.
            there are not the same so there is necessary something that trap IR.
            Don’t you think ?

          • Mickey Prumt says:

            That’s say, the calculation we speak about (but you woud not be able to explain what it is) is ok. It’s based on very basic physics.

          • des says:

            “A calculation is not an observation”

            What observation have YOU made that negates the greenhouse effect?
            I’m NOT talking about a CHANGING greenhouse effect here, just the greenhouse effect per se.

          • David Appell says:

            SkepticGoneWild says:
            “A calculation is not an observation”

            But you already rejected the observations.

            Let’s see you answer des’s question.

          • gammacrux says:

            The IPCC/CO2 greenhouse effect is a hoax.

            As are hurricanes.

            Since as 1 + 1 = 2, no GHGs and no GHE implies no hurricanes.

            Ask the people in St Martin I. or Texas, the hurricane phenomenon is a hoax.

          • SkepticGoneWild says:

            Mickey Mouse stated:

            “Its based on very basic physics”

            What he really meant to say:

            “Its based on very basic alchemy”

    • barry says:

      There’s some onus on those making the claim that hurricanes heat the lower trop to demonstrate it with observational data – with a nominated lag, it would seem.

      • g*e*r*a*n says:

        barry, check Oct. 2017 UAH global.

        You’re not a “denier”, are you?

        • des says:

          I believe that increased media coverage of Robert Mueller’s investigations are responsible for this spike in anomalies. Don’t believe me – check Oct. 2017 UAH global.

        • barry says:

          barry, check Oct. 2017 UAH global.

          As well as that I’ve checked,

          UAH ocean data for globe and tropics
          Hurricanes in Pacific and Atlantic basins
          Their cycle of intensity per date
          Daily SSTs for those regions and global

          A proper job would be to compare a range of periods from 1979 to see if these things correlate, and if they do, how often.

          Then I could say I have a moderate handle on what impact if any hurricanes have on SSTs regional, global, and TLT response.

          Anything less would be uninformative.

  34. Eric says:

    Dr. Spencer,
    Thanks for what you do and for your contributions to the science. I know that you work hard to ensure the best satellite temperature data set regardless of the politics surrounding the CAGW debate. Keep up the good work and may your skin forever be thick enough to ignore the ignorance, political bias, and petty arguments that have invaded your blog.

    • argus says:

      The whole climate debate is primarily about deep-seated beliefs, God or a Prime Mover. Fix the issue? None of us will throw ourselves off rocks to cut emissions anytime soon. I too appreciate Dr Spencer’s efforts to find the actual truth of the issue, no matter where it takes us.

      • David Appell says:

        (Almost) all scientists are working to find the actual truth of the issue. That’s what scientists do and why they go into science as a career.

        • g*e*r*a*n says:

          Davie surmises: “(Almost) all scientists are working to find the actual truth of the issue.”

          But Davie, I thought the “science” was settled.

        • DearSkepticGoneWild says:

          Wow da! Did you miss Climategate?

        • Eric says:

          David,
          Wouldn’t that be nice if it were true. Did you by chance read the “Diversity and Inclusion” principles for the March for Science? So tell me, and do try to be honest, does this sound like scientists trying to find the truth or scientists trying to push a left wing political agenda? Doesn’t this left wing political agenda also demand support for alarmist policy changes in the name of global warming?

          • Nate says:

            Eric,

            As he says, scientists are interested in finding truth and facts. Some facts do have a liberal bias. Of well, so sorry.

            Examples:

            Fact: tax cuts do not lead to more tax revenue. They just dont. See Kansas. See Bush W. See Reagan.

            Fact: more guns in a country or state leads to more gun deaths, and more mass shootings, not less. See US vs every other country. See states vs states.

          • Eric says:

            Nate,
            Thanks for proving my point. You are obviously left of center.
            Facts aren’t politically biased, they are facts. The alarmism over CAGW is speculative and politically biased and this also effects the skeptics as well. Climate science has been and is polluted by the politics.

          • Nate says:

            My point was that some facts are just that, facts, independent of politics.

            Most scientists are interested in finding the facts, in my experience.

            On the other side you have the backing of profit-driven industries. For them, facts are secondary. I have some personal experience with that.

          • Svante says:

            Tax cut feedback is like climate change, it works on decadal time scales so you’d better balance your budget short term.
            How’s that for a right wing fact?

          • Nate says:

            Svante,

            Which parts are sarc or not sarc?

          • Svante says:

            Don’t know, sorry to confuse the issue.

            I think your views are sound, but facts with liberal bias? Maybe at first glance.

            We can have different opinions, but not different facts.

            The difference should be in the solutions.
            The problem here is that people try to fix the facts. There are plenty of solutions, right left and center.

          • Nate says:

            good points.

            Some facts, like climate change science, shoulnt be labelled liberal. But are for some reason. Denying these facts has become a conservative meme. Seems quite ridiculous.

            Climate policies could be liberal or conservative, fine.

            Denying the science, attacking scientists, is used as a means to achieve policy goals.

            This is why there was a march for science.

    • PhilJ says:

      That it doesand has been damn cold here for the last week

      • des says:

        Ahhhh …. the classic “it’s cold out” cry.

        • PhilJ says:

          Lol is it classic for soneone to say its cold out ?
          More classic is that Canadians are for the most part such sheeple .. That they can be convinced to pay more for gas to heat their homes , wih the supposed intent to keep it from getting warmer outside … Lol

  35. ren says:

    Let’s see how the stratospheric polar vortex works in the troposphere.
    http://ds.data.jma.go.jp/tcc/tcc/products/clisys/STRAT/gif/zu_nh.gif

  36. Steven Adams says:

    I haven’t gone back and tried to figure it out, but from casual observation, it seems as if the divergence between northern and southern hemispheres is less than it used to be.

    Steve

  37. ren says:

    Another tropical storm attacks the Indochina Peninsula.
    http://tropic.ssec.wisc.edu/real-time/mtpw2/product.php?color_type=tpw_nrl_colors&prod=indo&timespan=24hrs&anim=html5
    How much latent heat will be released to the upper troposphere?

    • Sir Isaac Snapelton says:

      I contend a warmer object can make a colder object even colder.

      • Sir Isaac Snapelton says:

        And here’s a thought on the “do hurricanes heat the atmosphere?” conversation:

        If so, every October in the 39 record would show some amount of temperature bump from tropical storms. These would get averaged into the October baseline. Only the departure in hurricane activity would be noticeable.

        • Sir Isaac Snapelton says:

          Correction:

          Only hurricanes seasons from 1981-2010 would be part of the October baseline temperature.

          • Sir Isaac Snapelton says:

            In other words, if you were looking for a bump in global temperature following an average hurricane season, you’d be wasting your time.

          • gbaikie says:

            -Sir Isaac Snapelton says:
            November 3, 2017 at 3:10 PM

            In other words, if you were looking for a bump in global temperature following an average hurricane season, youd be wasting your time.-

            Yes but 2017 after fairly long lull in preceding years, wasn’t average.
            Or as wiki says:
            The 2017 Atlantic hurricane season is an ongoing event in the annual formation of tropical cyclones in the Atlantic basin. The season has been hyperactive, featuring both the highest total accumulated cyclone energy (ACE) and the highest number of major hurricanes since 2005.
            https://en.wikipedia.org/wiki/2017_Atlantic_hurricane_season

            And every one higher than Cat 3 got into Sept and lot them going near end of Sept and into Oct.

            Or in terms of Sept and Oct temps, getting up to possibly being “measurable” on global scale.

          • Sir Isaac Snapelton says:

            gbaikie

            2005 was also a monster year for hurricanes, featuring 4 category fives. These included Wilma and Katrina, two of the most powerful ever recorded.

            And what did we see from UAH?
            Well, according to Des:

            [Jul +0.07, Aug -0.12, Sep +0.13, Oct +0.02, Nov -0.07]

          • gbaikie says:

            –Sir Isaac Snapelton says:
            November 3, 2017 at 7:30 PM

            gbaikie

            2005 was also a monster year for hurricanes, featuring 4 category fives. These included Wilma and Katrina, two of the most powerful ever recorded.

            And what did we see from UAH?
            Well, according to Des:

            [Jul +0.07, Aug -0.12, Sep +0.13, Oct +0.02, Nov -0.07]–

            And what conclusion should I draw from this?

            So Katrina was before Wilma and don’t it’s track- google it:
            Wiki:
            August 23 23:00 UTC Tropical Storm Warning Central and northwest Bahamas
            03:00 UTC Tropical Storm Watch

            Going to
            August 30 03:00 UTC Tropical Storm Warning discontinued All
            So in week time starts and ends as tropical storm

            And: The storm strengthened into Tropical Storm Katrina on the morning of August 24. The tropical storm moved towards Florida, and became a hurricane only two hours before making landfall between Hallandale Beach and Aventura on the morning of August 25. The storm weakened over land, but it regained hurricane status about one hour after entering the Gulf of Mexico, and it continued strengthening over open waters. On August 27, the storm reached Category 3 intensity on the Saffir-Simpson hurricane wind scale, becoming the third major hurricane of the season.”

            And check out Wilma, wiki:
            Hurricane Wilma was the most intense tropical cyclone in the Atlantic basin on record, with an atmospheric pressure of 882 hPa (mbar, 26.05 inHg). Wilma’s destructive journey began in the second week of October 2005. A large area of disturbed weather developed across much of the Caribbean Sea and gradually organized to the southeast of Jamaica. By late on October 15, the system was sufficiently organized for the National Hurricane Center to designate it as Tropical Depression Twenty-Four.”
            ???
            At its peak intensity, the eye of Wilma was about 2.3 miles (3.7 km) in diameter, the smallest known eye in an Atlantic hurricane. After the inner eye dissipated due to an eyewall replacement cycle, Hurricane Wilma weakened to Category 4 status, and on October 21, it made landfall on Cozumel and on the Mexican mainland with winds of about 150 mph (240 km/h).

            Wilma weakened over the Yucatn Peninsula, and reached the southern Gulf of Mexico before accelerating northeastward. Despite increasing amounts of vertical wind shear, the hurricane re-strengthened to hit Cape Romano, Florida, as a major hurricane. Wilma weakened as it quickly crossed the state, and entered the Atlantic Ocean near Jupiter, Florida. The hurricane again re-intensified before cold air and wind shear penetrated the inner core of convection. By October 26, it transitioned into an extratropical cyclone, and the next day, the remnants of Wilma were absorbed by another extratropical storm over Atlantic Canada.

            So lasted as a named storm until Oct 27. Start mid Oct made two landfall then ended Oct 27 with a notable feature of developing a small and fast eye. [And being hard to predict- apparently- doing *crazy* stuff].

            Anyways, Main article: Timeline of the 2017 Atlantic hurricane season:
            Aug 18: Potential Tropical Cyclone Nine organizes into Tropical Storm Harvey roughly 250 miles (400 km) east of Barbados.
            Ends: Sept 1: Tropical Depression Harvey transitions into a post-tropical cyclone approximately 30 miles (50 km) northwest of Nashville, Tennessee
            Harvey was C-4 and Aug 26: 06:00 UTC (1:00 a.m. CDT) at 28.2N 97.0W Hurricane Harvey weakens to a Category 3 hurricane and makes its second landfall on the northeastern short of Copano Bay, Texas, with winds of 125 mph (205 km/h)” And day before [Aug 25] goes from 2 to Cat 4
            3 weeks, about.
            On Aug 30, “Tropical Storm Irma develops from an area of low pressure approximately 420 miles (675 km) west of Cabo Verde”

            Irma becomes a cat 5: “September 5 Hurricane Irma strengthens to a Category 5 hurricane, located roughly 270 miles (440 km) east of Antigua, and about 280 miles (445 km) east-southeast of Barbuda”
            and on September 9: “Hurricane Irma restrengthens to a Category 5 hurricane as it makes landfall over the Camagey Archipelago of Cuba.”
            September 12 “Tropical Depression Irma transitions to a post-tropical cyclone about 65 miles (110 km) southwest of Atlanta, Georgia, and about 100 miles (165 km) east-southeast of Birmingham, Alabama”
            Irma about 2 weeks.

            Katia September 6: Tropical Storm Katia intensifies into a Category 1 hurricane approximately 185 miles (300 km) north-northeast of Veracruz, Mexico”
            And only a cat 2, and ends:
            September 9: Tropical Storm Katia weakens to a tropical depression about 115 miles (185 km) west-northwest of Veracruz, Mexico.

            September 5: “Tropical Storm Jose develops from an area of low pressure roughly 1,505 miles (2,420 km) east of the Lesser Antilles.”
            Jose becomes a Cat 4
            and Sept 12: Hurricane Jose weakens to a Category 2 hurricane approximately 255 miles (410 km) northeast of Grand Turk Island
            And ends, September 14: “Hurricane Jose weakens to a tropical storm roughly 520 miles (840 km) south-southwest of Bermuda”
            Less than 2 weeks.
            Got Lee in here about Cat 3 [I can’t find description

            September 16: “Tropical Depression Fifteen intensifies into Tropical Storm Maria about 620 miles (1000 km) east-southeast of the Lesser Antilles.”
            September 18 become cat 5
            September 20: Hurricane Maria weakens into a Category 2 hurricane about 25 miles (45 km) north-northwest of Aguadilla, Puerto Rico
            September 24 Hurricane Maria weakens into a Category 2 hurricane about 290 miles (465 km) north-northeast of Great Abaco Island.” [ends description of it]

            Anyhow seems like a lot hurricanes which quite strong within an short time period.
            Or seems like 6 named hurricanes within month of Sept.
            And Cat 3 Hurricane Ophelia in oct
            “Hurricane Ophelia (known as Storm Ophelia in Ireland and the United Kingdom while extratropical) was the easternmost Atlantic major hurricane on record. The tenth consecutive hurricane and the sixth major hurricane of the very active 2017 Atlantic hurricane season”
            https://en.wikipedia.org/wiki/Hurricane_Ophelia_(2017)

    • gbaikie says:

      I was going to say a bit more compared, because it’s near out season. But then realize I had no clue of that region’s hurricane season, So looked it up, wiki:

      Season lengths and averages
      North Atlantic June 1 November 30
      Eastern Pacific May 15 November 30
      And others:
      Western Pacific January 1 December 31
      North Indian January 1 December 31
      South-West Indian July 1 June 30
      South hemisphere:
      Australian region November 1 April 30
      Southern Pacific November 1 April 30
      https://en.wikipedia.org/wiki/Tropical_cyclone
      They also note average number per region

      Another thing wondered about, does it matter if they
      make land fall [other than reducing their strength and
      duration].
      Or related widespread rainfall on land area in summer months [time of most sunlight]. Generally thinking of Monsoon weather. hmm: https://www.tripsavvy.com/traveling-during-the-monsoon-season-1458706

      Anyhow, generaly I think it’s not much affect on global temperature or at most hundredths of C.
      Or I think anything to do with land areas, of course with hurricane you have these huge paths going thru ocean areas and going thru warmest part of our world- tropical oceans.
      And many don’t reach land, or if few hit US, it tends to many many more don’t hit US.
      Or in this case, Vietnam

      • gbaikie says:

        Also:
        Map of all tropical cyclone tracks from 1945 to 2006.:
        https://en.wikipedia.org/wiki/Tropical_cyclone#/media/File:Tropical_cyclones_1945_2006_wikicolor.png

        And what causes all those cyclones somewhat near the Philippines?

      • des says:

        And considering there are so many regions with hurricanes/cyclones/typhoons, how certain are you that 2017 has had more than normal? How you looked at the TOTALS?

        • gbaikie says:

          ” des says:
          November 3, 2017 at 8:43 PM

          And considering there are so many regions with hurricanes/cyclones/typhoons, how certain are you that 2017 has had more than normal? How you looked at the TOTALS?”

          You mean totals for Sept and Oct- no.
          I don’t think they are available- but internet vast and I didn’t check it.

          It should be noted I am talking about two months not yearly average global temperature and yearly average “amount of hurricane’s energy”.
          And saying could have measurable amount- hundredth of a degrees difference in a month’s average temperature.
          And it’s normal to have tenths of degree differences
          in monthly average global temperatures.
          So possibly measurable but not saying easily measurable.
          But in terms of a year, probably not measurable- or similar to rising CO2 level which so far hasn’t been measurable [despite CO2 having a yearly fluctuation- or perhaps if CO2 had more fluctuation within year maybe someone could actually measure it’s effects]

          • des says:

            So again, this suggestion that the recent high anomalies are caused by hurricanes is no more than that – a suggestion.

          • gbaikie says:

            Here’s an suggestion:
            “It turns out that the vast majority of the heat released in the condensation process is used to cause rising motions in the thunderstorms and only a small portion drives the storm’s horizontal winds.

            Method 1) – Total energy released through cloud/rain formation:

            An average hurricane produces 1.5 cm/day (0.6 inches/day) of rain inside a circle of radius 665 km (360 n.mi) (Gray 1981). (More rain falls in the inner portion of hurricane around the eyewall, less in the outer rainbands.) Converting this to a volume of rain gives 2.1 x 1016 cm3/day. A cubic cm of rain weighs 1 gm. Using the latent heat of condensation, this amount of rain produced gives
            5.2 x 10¹⁹ Joules/day or
            6.0 x 10¹⁴ Watts.

            This is equivalent to 200 times the world-wide electrical generating capacity – an incredible amount of energy produced!

            Method 2) – Total kinetic energy (wind energy) generated… “[boring]
            http://www.aoml.noaa.gov/hrd/tcfaq/D7.html

          • des says:

            That is 0.3% of the total solar power that strikes the earth’s surface. And when it’s all done, you have a cold patch of ocean that takes about a fortnight to warm up, absorbing heat back out of the atmosphere in the process.

            Did you also notice the part of that article where he describes “giving off a cold exhaust in the upper levels of the troposphere”?

          • gbaikie says:

            -des says:
            November 4, 2017 at 1:40 AM

            That is 0.3% of the total solar power that strikes the earths surface. And when its all done, you have a cold patch of ocean that takes about a fortnight to warm up, absorbing heat back out of the atmosphere in the process.-

            Do remember the “record breaking” amount rainfall the occurred in southern part of Texas? Was it more than 3 inches over large region. And reason for it was hurricane didn’t pass quickly thru the region?

            And you think that more 10 meter of water depth warms by the sunlight by a few degree within a fortnight of time.
            Or take typical swimming pool and and make it 3 to 4 times deeper and having sunlight warmed entire pool by few degrees within 2 weeks.

            -Did you also notice the part of that article where he describes giving off a cold exhaust in the upper levels of the troposphere?-

            Upper levels of troposphere is what temperature and how much colder than this was the moist “cold exhaust”.
            And what does colder air do if in the upper levels of troposphere, do think it could fall down?

          • des says:

            You seem to have suddenly gone NESB.

  38. Werner Brozek says:

    RSS4 TLT for October just came out. After a 3 month rise, the anomaly dropped from 0.843 in September to 0.802 in October. It is the warmest October on record for RSS4. If the present 10 month average is maintained, 2017 would come in second place.

  39. gbaikie says:

    If had two solid copper cubes which are 100 meter cubes.
    Which are in space and far enough away from the Sun that it’s not significantly warming them [such orbit distance of Saturn]

    And 1 cube is 100 C and other is 0 C
    And always facing other on only one of there 6 sides
    and they 10 meter apart [and in orbit with each other so don’t get closer to each other due to their small gravity]

    Does the 100 C cube warm the 0 C cube [and if so how much]
    Does the O C cube warm the 100 C [and if so how much]

    These cubes are not being heated by power source.
    And due to their thermal mass, I figured that a 0 C
    100 meter cube would not cool below -100 C within 1 year- and
    a 100 C cube by itself should likewise not cool to 0 C within
    one year.

    All surfaces of cooper cubes are coated to be like a blackbody surface and this surface thermally conducts the same amount as copper does [it conducts heat pretty good- though not as good as diamond].

    • David Appell says:

      “And due to their thermal mass, I figured that a 0 C
      100 meter cube would not cool below -100 C within 1 year- and
      a 100 C cube by itself should likewise not cool to 0 C within
      one year.”

      Why?

      They’re in a 3 K near-vacuum.

      • gbaikie says:

        100 meter cube have a lot of thermal mass.
        100 x 100 x 100 = million cubic meters of solid copper
        Gross mass 8960 million kg.

        Cooper has high thermal conductivity.
        Allowing cooper to radiate far more energy than a rock, and it’s denser and has more thermal mass for it’s volume than a common rock.
        So a rock surface would cool fairly quickly, but despite have less thermal mass [of same size] it’s interior would remain warmer for a longer period than compared to the copper cube.
        Or copper cube will uniformly cool and a common rock won’t.

        Copper per kg has 385 kilojoules per K or C degree

        Steel is 490 kilojoules per K or C degree
        Steel’s density is 8,050 kg per cubic meter
        8,050 times 490 is 3,944,550 KJ
        Copper per cubic meter is:
        8960 times 385 is 3,448,600 KJ
        Or copper has less thermal mass per volume, but copper
        conducts heat a lot better than steel.
        http://hyperphysics.phy-astr.gsu.edu/hbase/Tables/thrcn.html

        Though generally all metals conduct heat better than non metals- except for diamond [and other stuff].

      • gbaikie says:

        Corrections:
        O C cube takes about 1 year to cool to -100 C
        100 C cube takes about 40 days to cool to 0 C
        And:
        “Copper per kg has 385 kilojoules per K or C degree”
        should be:
        Copper per kg has 385 joules per K or C degree

        And the KJ are wrong and should be joules.

        • Norman says:

          gbaikie

          I did try your challenge. First on the most simple solution of a single cube of copper with dimensions and mass you describe at 100 C (373.15 K). The total solution is fairly complex. I looked at the view factors for what you describe and according to the plot on this link, the view factor between the two faces would be around 0.8.
          http://tinyurl.com/y8thsgcp

          With the 100 meter cube of copper that has a painted surface so it emits like a blackbody rate, I wrote a simple qbasic program to figure it out. I came up with 117 days to cool to 0 C (273.15 K). You had 40 days.

          I would have to write a program to figure out the total solution to your problem.

          • Norman says:

            gbaikie

            I think I have a flaw in my program that I have to work out. I will see if I can get it right and try to come up with an answer.

          • Norman says:

            gbaikie

            I might actually have my program correct.

            Here is how I broke it down.

            I used grams and joules in my program.

            copper has a density of 8.96 grams/cm^3

            1 meter = 100 cm. 100 m = 10,000 cm.
            You get 10^12 cm^3 in a cube 100m x 100m x 100m.

            8.96×10^12 grams/10^12 cm^3

            8.96×10^12 grams x 0.385 joules/gram-K. The temperature change is 100 K so the total amount of joules that need to be lost from the copper is 8.96×10^12 x 0.385 joules/gram-K * 100K = 3.4496 x 10^14 joules.

            You have 6 surfaces that radiate. Each surface is 100 meters x 100 meters or 10000 m^2. Your total radiant surface is 60,000 m^2.

            At 100 C or 373.15 K and set up as a blackbody the total loss at peak temperature is 6.5958 x 10^7 Watts (Joules/second).

            To make it easier multiply this by an hour (3600 seconds/hr)
            to get 2.37 x 10^11 joules/hour.

            At this rate it would take 3.4496 x 10^14 joules/2.37 x 10^11 joules/hour = 1455 hours or 60.6 days. But as it cools it radiates less (which is what my program was calculating for, I was doing it in hourly chunks of time…doing it in seconds takes too long and does not change the answer by any large degree). It will take longer than 40 days for sure and much longer than 60 days since it won’t continue to radiate at that rate as the surfaces cool.

            If you check the radiant amount at 0 C (272.15 K) it would take
            3.4496 x 10^14 joules/6.8 x 10^10 joules/hour = 211 days. The answer is somewhere between 60 and 211 days. I think my 117 days may be the correct answer for the cooling of a 100 meter cube of copper with blackbody surface emission properties.

            I am not sure I will work on your more complex problem at this time. It is interesting though but time consuming.

          • Norman says:

            gbaikie

            I modified my program for the cube at 0 C to reach -100 C. In my program the process to 562 days.

            Download qbasic (free) and try the program to see what you get and you can examine my work for flaws.

            Temp=273.15
            MassCopper=8.96*10000*10000*10000
            HeatContent=MassCopper*0.385*Temp
            For Day=1 to 600
            For Hour=1 to 24
            HeatLoss=HeatContent-(Temp^4 * 0.0000000567 * 60000 *3600)
            HeatContent=HeatLoss
            Temp=HeatContent/(0.385 * MassCopper)
            Print Day; Temp
            Next Hour
            If Temp <=173.15 Then end
            Next Day

          • gbaikie says:

            Norman thanks for looking at it.
            And in general to replies:
            My number of 40 day for hot to get to 0 C
            And 0 C cube to -100 C in year.
            Was a rough guess and I thought had to take more time
            than 40 days and more than year.
            Or allowed for it be to perfectly radiating

            It seems to me your numbers are probably more accurate.
            And I was taking about the cube(s) by itself.

            The question is the radiant interaction between
            the two cubes, one being 100 C and other starting at O C.

            So now got a baseline how how separately they cool, so as to
            compare and quantify the effect of when the two are near each other.

            And the cooling separately [or together] is complicate due to the fact that bodies are cubes and will end up radiating as spheres- with corners in them [cooler corners which act as insulating effect]

            But in the first week or so this complicating factor should not significant factor.

            So you can eliminate such complication by just looking the first week or so [before it gets more complicated].
            Or in a week time period how much warming effect is there
            on the hot cube from cool cube.

            And wanted cubes, because I thought it would be easier then using spheres.
            And using the big cubes to provide more time and “better resolution”.

        • David Appell says:

          gbaikie: you try to overwhelm and impress and distract with numbers, while keeping your argument anything but clear.

          Instead of showing us how smart (you think) you are, let’s see you answer a simple question:

          Take you copper cube of whatever volume and temperature it is, put it in a 3K near-vacuum, and calculate its average temperature after one year.

          Your answer should be one number, in units of Kelvin.

          • gbaikie says:

            “Take you copper cube of whatever volume and temperature it is, put it in a 3K near-vacuum, and calculate its average temperature after one year.”

            If it’s 1 meter cube, it will cool fairly rapidly [regardless of starting temperature, say 1000 C]. But getting it’s temperature close to cosmic background temperature should take longer than a year.
            The reason is copper is not conductive enough- though very cold copper might conduct a lot better as compared to room temperature copper. I don’t know.
            But you could use material which conduct heat better and get it to being very close to background temperature in a year.
            Though just having 1 cm cube could do in much less time.

    • gbaikie says:

      It seems others aren’t finding the question be very interesting.

      So I am going to add a greenhouse, because it seems people find greenhouses interesting.

      So have two large very large cubes orbiting each other at distance of 10 meter.

      And 10 meter gives me more than enough space to put greenhouse
      between on either the hot cube or cold cube.
      And obviously those living in cold world, probably prefer the cold cube to have the greenhouse.

      So it’s going to an 8 feet [2.4384 meters] high greenhouse, which 100 meter by 100 meter [a couple of football fields].
      Made from from 2 by 4, 2 by 8, 1/4″ plate glass, assorted hardware, and put dirt on the copper floor. Oh might as well use plywood for exterior perimeter walls. Though not going to add any plants, but some air.

      Now if added enough air so the pressure was 1 atm, it would be 10 tons of force upward upon 1 square meter of glass- probably breaking it or it would need small windows and lots of 2 by 4 and 2 by 8 lumber attached to very strong copper floor. The total area is 10,000 square meter = 100,000 tons of force. So it’s only going to be for 1/20th of 1 atm pressure. Which about 5 times more pressure of Mars and the 100,000 tons become 5,000 tons. Though there is not much weight due to lack of gravity, I guess the building materials etc would have mass of + 1000 tons.

      So have greenhouse and about 7 1/2 meters above the glass roof is the 100 C cube shining it’s 1000 watts per square IR into the greenhouse.
      One could have many question, what air temperature, what’s temperature of the dirt, etc.
      You need a pressure suit to be in the greenhouse. Put on spacesuit [and spacesuit are designed to keep you cool enough in space and should work without any modification in greenhouse- though the “A/C” would need to be turned up a bit.
      So go into greenhouse and kick away say the 6″ of dirt, and copper floor is 5 C.
      The top of dirt should quite hot and there will be heat gradient of the dirt hot surface to 5 C copper cube surface.
      Since dirt is hot, the air will be hot and glass ceiling will be hot [though none of it can be hotter than 100 C].

      Let’s change things, lets have 100 C cube and 0 C cube and bring them together so there no space between them.
      But first, we will keep the greenhouse and bring the the 100 C cube 5 meter closer to greenhouse roof. That should increase the temperature of dirt, air, and glass roof.
      One debate how much, but it will increase the temperature by some amount.

      Or delete whole greenhouse thing, and move the hot and cold cube so they touching each other.
      What happens.
      Does bringing the two cube so they in contact increase the average temperature of both cube?

      Now said that in roughly 40 days the hot cube [100 C] by itself will approach somewhere 0 C.
      So if bring 100 C cube and 0 C together, in 40 days will the hot cube be warmer.
      Or can cold warm hot?

      • gbaikie says:

        Still nothing.
        Going back to greenhouse and roof being about 7 1/2 meter from 100 C cube face.
        Don’t add dirt.
        Then copper floor will be about 5 C, and air [due to low gravity] will be about 1/2 the temperature of copper floor and whatever glass roof temperature is- which should be warmer than the copper floor. So average air temperature might be + 6 C.

        • David Appell says:

          Your “problems” are incomprehensible. And usually meaningless.

          • gbaikie says:

            ” David Appell says:
            November 4, 2017 at 10:10 PM

            Your problems are incomprehensible. And usually meaningless.”

            This “problem” relates to issue of does a cold object “warm”
            a hot object in terms of radiant transfer.

            A significant factor is how close the objects are.

            A hot 100 meter cube at distance 1 km from cold meter cube will have a small effect.

            And if have the two object close together, how much is the effect.

            The amount transferred is the amount cold warms hot.

            Via conduction heat transfer one can have a lot energy transferred in short period of time.

            If you imagine using material with extremely high heat conductivity, then a hot and cold object instantaneously
            average their temperature.

            With copper 100 meter cubes which are 100 C and 0 C, since copper has fairly high heat conductivity, if cube are touching, this heat transfer can take a few days, giving one object which roughly has average temperature of 50 C.

            The hot object is warmed in sense that it will stay warm longer. Or if less than 0 C is cold, and more than 0 C is warm, then it’s warmer.
            Though not warmer in sense that 100 C cube “somehow” becomes 101 C.

            So if separated the cubes so can’t transfer heat as quickly as conduction can, it’s less of “warming effect” but question is how much is the “warming effect”?

            Of course if used two small cube, copper is quite adequate in transferring heat via conduction in minutes rather than days.
            And also small copper cube would cool quicker via radiation.

            Of course universe is not full of copper, rather it’s full of rocks. But seems to me that two rocks would radiate less and have less “warming effect”.

        • Norman says:

          gbaikie

          I wrote a program for both cubes as you describe. I used 0.8 for the view factor as that seemed close looking at the graph of view factors for parallel plates.

          Both the cubes will cool. The rate of cooling for the hot cube is reduced after the same 117 days. Without the cooler cube in the vicinity the hot cube reached 273 K in that time frame. With the cold cube present, the Hotter cube was at 278 K after the 117 days. In the semantic debate you might make the claim the colder cube warmed the hotter one since its temperature is higher after 117 days than without the cold cube present.

          Both cubes cooled. Because of the other sides the colder cube still cooled even though receiving heat from the hotter cube, it was not enough to offset the loss from the other 5 sides not facing the hotter cube.

          Does this answer your question? I can post the program if you want to see it. It does not copy and paste so I have to manually type it in.

          • gbaikie says:

            –Does this answer your question? I can post the program if you want to see it. It does not copy and paste so I have to manually type it in.–

            Yes answers my question.
            But does anyone dispute it.

            And basically that is “the warming” I mean when I say CO2 has some warming effect.

          • gbaikie says:

            Though for fun, put 100 meter cube at sun distance and have one face of cube always face the sun.

  40. David Birch says:

    LA Nina will solve the up spike it will be called soon, the + will soon become the -, why do people jump all over a data set that shows a small temp spike Jesus ever heard of cyclic temperature variations? Cone back in 13 months and then say ooh ooh what happened why are we STILL confused!

    • David Appell says:

      In 13 months the long-term trend — the one that includes ALL of the data — will be little different from the current +0.13 C/decade.

    • des says:

      And if that happens, when we get back to ENSO neutral conditions we will again be above average.

      • Dave says:

        >LA Nina will solve the up spike

        Arguably the current temperatures are still UNDER influence of the brief La Nina in late 2016 and neutral prevailing conditions since. If we consider that the UAH temperatures correlate best with Nino 3.4 surface temperatures with a 4 month lag, the 10 months of UAH data in 2017 so far would be most strongly influenced by the Nino 3.4 average Sept 2016-June 2017, which is -0.24C…. i.e. we have already been in ENSO neutral/ mild La Nina conditions during the relevant period. And we are already well above average…..

        • des says:

          The effect of ENSO doesn’t last that long.

        • barry says:

          Of the various institutes monitoring ENSO, only one (NOAA) called a la Nina for the latter months of 2016. It was the weakest on that record since 1950.

          It’s impact, if any, on global temps through 2017 would have lasted no longer than to mid-year, and would have been negligible.

          This is borne out by comparing 2016/2017 monthly global temp evolution with other la Nina/post la Nina periods.

    • barry says:

      LA Nina will solve the up spike it will be called soon

      That’s exactly what people were saying last year about what would happen at the end of 2016.

      It was wishful thinking then. It remains so. Wiser option is to assume less and discover more.

    • barry says:

      Also, la Nina conditions have to persist for 5-6 months before a full la Nina is called. Only one monitoring system has exceeded this threshold for the last 2 months, so we’ll be waiting until at least February for the announcement of a la Nina, as long as the threshold is not crossed back in the next 3 months.

      Latest forecasts:

      http://www.bom.gov.au/climate/enso/
      http://www.cpc.ncep.noaa.gov/products/analysis_monitoring/lanina/enso_evolution-status-fcsts-web.pdf
      http://ds.data.jma.go.jp/tcc/tcc/products/elnino/outlook.html

    • barry says:

      What does “solve” mean, anyway? Is there some kind of problem?

    • SkepticGoneWild says:

      DB,
      The simple answer to your questions: It`s what fear mongers do. The constant crying of “wolf!”, or “the sky is falling!”.

    • Mickey Prumt says:

      Thought it would be neutral conditions that would “solve” the up spike.

      • barry says:

        If anomalies were around 0C from next month to 2020, the pause since 1998 could return. I’m guessing that’s the ultimate meaning of “solve.”

        IOW, anomalies have to be at or lower than they were in the 3-year period 1994-96 from now to 2020. You can eyeball the graph at the top to guesstimate the probability of that happening.

      • barry says:

        Did a bit of work:

        For the UAH trend to go flat by 2020, the average monthly anomaly from next month to Dec 2019 would have to be no higher than

        -0.06 C

        So imagining temperatures plummet over the next 2 months, the last time we had a 24-month av anomaly of -0.06 or lower was…

        May 1993 – Apr 1994.

        You can see what that looks like here:

        http://www.drroyspencer.com/wp-content/uploads/UAH_LT_1979_thru_October_2017_v6-1.jpg

      • barry says:

        Talking about the trend from Jan 1998.

      • barry says:

        Tsk.

        May 1995 – Apr 1995 av anomaly was -0.07. That’s the average monthly anomaly we’d need from about now to Dec 2019 to see a ‘return’ of the flat trend since 1998.

  41. Duncanbelem says:

    If the .13C is constant then there is no man made global warming. It has to increase. Co2 is increasing and not decreasing anytime soon. So if it is constant the it isn’t man made. Also We all know .13 Trend isn’t constant. The climate changes Naturally. We know it fluctuates, and isn’t 0. So what is high and what is low. Is .05 degrees per decade normal? So what is a Normal rate of change per decade. Can anyone Tell me what the rate of change of temperature per decade was 1 million years ago, with any sort of accuracy. NO! what about 1000 years ago. No! What about 200 years ago No! not within tenths of a degree and not for decade trend. Maybe after 1850 we could do that and certainly after 1950. Wait… Thats when the anomaly is happening. The anomaly of .13 degrees per decade. How do we know that’s an anomaly? and not within the normal natural cycle. Now tell me what is normal. what is the range. And dont look at temperature charts of millions of years ago. They probably have a slow rate of change and obviously can’t determine the change per decade.

    • des says:

      Please explain WHY a constant trend implies no AGW.

    • barry says:

      If the .13C is constant then there is no man made global warming. It has to increase. Co2 is increasing and not decreasing anytime soon. So if it is constant the it isnt man made.

      The latest version of UAH has changed from 0.11/decade in early 2015 to 0.13 now.

      I don’t think that’s especially meaningful, but if you’d made the same comment 2 and a bit years ago, what would you be saying now?

      • Mickey Prumt says:

        UAH trend on its own is not interesting.
        Because satellittes calculations are not reliable.
        Just compare the different trend of RSS, UAH or different version.
        Also they are not observations of surface temperature and are much more sensitive to variability.

        At a point, people need to try to stop being stupid.
        Good luck with that.

        • des says:

          Did you mean to make that reply to Barry?

          • Mickey Prumt says:

            In fact, it is destinated to the guys who spend their time showing UAH only (or RSS, when warming was less in RSS).

        • Gordon Robertson says:

          mickey…”UAH trend on its own is not interesting.
          Because satellittes calculations are not reliable”.

          And you’re opinion is reliable…because???

          The UAH trend has little or nothing to do with anthropogenic warming.

          • Mickey Prumt says:

            Because everybody can check that RSS, UAH calculations and their different versions differ from one to each other, whereas they use same data.

          • des says:

            So you challenge what you believe to a mere opinion by stating your own mere opinion.

          • lewis says:

            Gordon,

            It is much ado about almost nothing. What is measured is 100ths of degrees.

            So it is going to fluctuate. More clouds, less clouds, cyclones, volcanoes. Hopefully it will continue to stay or get warmer.

            Do I believe that is a result of mankind’s actions. No. But neither do I care.

            Warmer is better. So, being on the side of safety, burn more coal and oil.

          • Gordon Robertson says:

            lewis…”It is much ado about almost nothing. What is measured is 100ths of degrees”.

            I agree with you, I just don’t like politically-driven scientific institutions like NOAA fudging data. They will ultimately look might stupid when we have another winter like 2008 and they are showing a record warming year.

          • Gordon Robertson says:

            des…”Because everybody can check that RSS, UAH calculations and their different versions differ from one to each other, whereas they use same data”.

            If the data is fudged before UAH or RSS receive it, what good is that? I am asking if NOAA get their hands on the data before handing it over to UAH/RSS.

          • barry says:

            Gordon, RSS October anomaly is lower than September. Your concern about NOAA fudging the data nehind a warm Oct anomaly is completely misplaced. The reason for the high UAH Oct anomaly is because of UAH processing.

          • David Appell says:

            lewis says:
            “Warmer is better.”

            Lewis is narcissistic, unable to separate his concerns from the other 7.3 billion people in the world and the next several hundred generations.

            A lack of empathy and morals.

    • David Appell says:

      Duncanbelem says:
      “If the .13C is constant then there is no man made global warming.”

      Another hayseed pulls in here, just off the turnip truck.

      • Duncanbelem says:

        What about my other point. How do we know .13C is not normal?

        • des says:

          If it were possible to sustain this rate, in another million years we’d be 13000 degrees higher. Does that sound “normal”?

          There is no “normal” here, merely “beneficial, detrimental, neutral”.

    • gbaikie says:

      — Duncanbelem says:
      November 3, 2017 at 10:56 PM

      If the .13C is constant then there is no man made global warming. It has to increase.–

      A common expression was accelerated warming rate. That what’s you referring to.
      And basically the 20 year pause, made using the term less popular.
      It still a bit popular to talk about an accelerating rate in sea level rise. But Nature isn’t really cooperating.
      One could say Nature is Mrs Clinton trying to be president, and messing up the message.

      “Co2 is increasing and not decreasing anytime soon. So if it is constant the it isnt man made. Also We all know .13 Trend isnt constant.”
      Not too long ago [decades] the trend was much higher.
      I would advise not having heart attack if CO2 levels do drop, but not going to happen if .13 trend continues, but it doesn’t mean it *has to* have a negative trend. Or having a pause in “accelerating rate of CO2 increase” would be the first indication, and could see that, soon.
      Note that CO2 levels are wavy up and down and EL Nino add more, and not having el nino [the present time] will reduce the rate of increase- I mean more than this factor, in terms of pause. Or I mean, getting to extant of having news headline saying “unexpected”.

      “The climate changes Naturally. We know it fluctuates, and isnt 0. So what is high and what is low. Is .05 degrees per decade normal?”
      I don’t think in time we had temperature records it’s ever been that high- though you don’t pick the lowest and highest
      in 10 years, call it decade trend. Or some like to use 17 year average if talking about decade trend, But longer is better or more meaningful.

  42. Gordon Robertson says:

    No alarmist has answered my question. Is NOAA getting the sat data before UAH and adjusting it as they do the surface data before passing it on to the likes of NASA GISS, who adjust it further?

    There is no apparent reason why October 2017 should have been this warm. It’s time to look for fudging from NOAA.

    • Mickey Prumt says:

      I am not alarmist, but what you say is so stupid…

      I guess they invented the hiatus as well, just for the fun to watch the stupid deniers reaction when it warms again…

      Seriously, I find it very difficult to believe that some people can be as stupid as you.
      How can we help ?

    • des says:

      Why don’t you ask Mr Spencer? But has a habit of not correcting nonsense from deniers – any denier nonsense is good nonsense.

    • barry says:

      There is no apparent reason why October 2017 should have been this warm. Its time to look for fudging from NOAA.

      If indeed the UAH Oct anomaly is a problem, are you so biased you can’t consider that there is an issue with the processing at UAH? That seems to be an open inquiry for Roy.

      FYI, RSS is out just now, and the October anomaly is lower than the Sept anomaly.

      Sep: 0.8434
      Oct: 0.8020

      NOAA’s fudge?

      • Gordon Robertson says:

        barry…”If indeed the UAH Oct anomaly is a problem, are you so biased you cant consider that there is an issue with the processing at UAH? That seems to be an open inquiry for Roy”.

        Roy and John have had the integrity to fly in the face of the alarmist scientists based on their data. NOAA has been steered by a dishonest president who ran around trying to root out ‘climate deniers’.

        NOAA is corrupt and now I fear they have gotten to the sat data.

      • barry says:

        Gordon,

        There is no apparent reason why October 2017 should have been this warm. Its time to look for fudging from NOAA.

        RSS

        Sep: 0.8434
        Oct: 0.8020

        The RSS Oct anomaly was lower than September – the opposite of the UAH result.

        It seems NOAA have not ‘fudged’ the data to get a warm result. The difference here is purely due to the processing at UAH and RSS.

        Your bias is astonishing.

    • Dr No says:

      Sorry Gordon.
      Time for you to give up and go to your nursing home.

  43. barry says:

    RSS October anomaly is released.

    Sep: 0.8434
    Oct: 0.8020

    • barry says:

      RSS month to month anomalies are not always a change in the same direction, so no need to over-analyse it.

      The surface monthly anomalies take a few weeks to roll in.

    • Mickey Prumt says:

      One cannot exclude the possiblity that Spency and Christer spent some much time tuning their UAH model to get the lowest warming as possible, that strange things will happen in the future UAH data due to the use of an unphysical set of parameters.

    • barry says:

      That’s akin to skeptics saying other records are fudged because they’re higher. Purely speculative, based on tribal politics. It’s a go-nowhere conversation.

      Demonstrating problems with the actual process would be something. The rest is gossip.

      • Mickey Prumt says:

        I agree but it has to be said at least one time.

        Because it can be the true.

        And the true has to be said.

      • barry says:

        If that’s so then it’s just as “true” that NOAA could be fudging surface data and GISS ramp up their trends. The ‘logic’ works both ways.

        It’s tribal schtick. Guttersnipery.

        • Mickey Prumt says:

          Yes, I still do agree,

          but you cannot do that kind of misleading comparison :

          http://www.drroyspencer.com/2017/07/warming-in-the-tropics-even-the-new-rss-satellite-dataset-says-the-models-are-wrong/

          and then ask people to take your work seriously :).

        • Mickey Prumt says:

          Also, don’t you think there is much more room for tuning for RSS / UAH calculations than for surface observation ?

          • Gordon Robertson says:

            mickey…”Also, dont you think there is much more room for tuning for RSS / UAH calculations than for surface observation ?”

            You mean the surface ‘observations’ by which NOAA slashes 75%+ of their data set then reconstructs it using a climate model using less than 25% of the data? Gives a new meaning to observation, as in virtual observation and reconstruction.

          • barry says:

            You mean the surface observations by which NOAA slashes 75%+ of their data

            You are a liar, Gordon.

        • barry says:

          Whatever gave you that idea?

          All the data sets will continue to be revised in the future. I don’t belong to any tribe.

          • Mickey Prumt says:

            Well because there is more hypothesis behind UAH and RSS calculations view that you need to convert the remote measurement of a very few drifting Sun-synchronous orbit satellites in a temperature field.

            I belong to the science tribe. I also think that website like SkS, realclimate are very bad for climate science.

          • barry says:

            Surface and satellite temp estimations have different and multiple challenges. The largest revisions (by trend) have occurred in the satellite records, but that’s also partly because the record is short. Too difficult to say which is less problematic. And this is another conversation that gets nowhere. They’re measuring different things in different ways. No one here but the blog owner is across the specifics of the challenges facing the sat record. Everyone else is gossiping. The best gossip is based on reading the technical papers and updates, but even then it’s only scratching the surface.

            Skepticism starts at home.

          • Mickey Prumt says:

            Yes, theyre measuring different things. The blog owner don’t get that simple fact view that he put these different things on the same plot.

          • Gordon Robertson says:

            mickey…”I belong to the science tribe”.

            Could have fooled me when you write off state of the art satellite telemetry as out of control bots drifting in a temperature field.

            I presume you feel the same about GPS sats. They are just as prone to orbital drift and they have to be synced to land stations running on a different time system. Therefore, according to you, GPS is unreliable.

            Go tell that to someone using a GPS receiver. Meantime, you might try educating yourself on the accuracy of AMSU units and their 95% surface coverage, as opposed to the 30% coverage of surface stations.

            I should add that NOAA discards over 75% of the data from surface stations and uses less than 25% of the data in a climate model to manufacture the rest. That’s why I think NOAA is interfering in the sata data. It’s their sats UAH gets their data from.

          • Gordon Robertson says:

            barry…”Theyre measuring different things in different ways”.

            Yes, the sat coverage is 95% as opposed to 30% for surface stations. Better amend that. Since NOAA discards 75% of the surface data the ‘real’ surface coverage is more like 10% coverage.

            Furthermore, the AMSU scanners scan bazillions of O2 molecules in one stationary position of their scanners. Overall, the sat telemetry is infinitely more accurate than the surface system with far greater coverage.

            It helps to know something about communications systems and telemetry before trying to digest the hard theory on AMSU units.

            With regard to the length of the record, the sat record is approaching 40 years. That’s twice the accepted length required for significant change.

          • barry says:

            Strange that with this incredible accuracy there have been numerous large changes with various revisions to both RSS and UAH.

            Your blinders are incredibly opaque.

          • David Appell says:

            Gordon Robertson says:
            “Yes, the sat coverage is 95% as opposed to 30% for surface stations. Better amend that. Since NOAA discards 75% of the surface data the real surface coverage is more like 10% coverage.”

            More f-ing lies.

            Gordon can’t type a word anymore but that it’s a lie.

          • Mickey Prumt says:

            Gordon Robertson

            you are a stupid person.
            First just look at difference between the two last UAH version. No doubt that diurnal drift correction is a problem for these calculations.

            Second, from what you tell me, all satellite measurements should be correct view that GPS work.
            But I guess you would tell me that sea level is not rising as shown by satellite observations.
            You are so stupid.

            What should we do with stupid people like you ?
            How can we help you ?
            Thank you for your response.

      • Gordon Robertson says:

        barry…”Thats akin to skeptics saying other records are fudged because theyre higher. Purely speculative, based on tribal politics. Its a go-nowhere conversation.”

        Come on, barry. Since when is it acceptable to eliminate over 75% of a database and use less than 25% of the data in a climate model to reconstruct the missing data?

  44. SkepticGoneWild says:

    Guy Callendar was GHE believer too. Published a paper in 1938 saying temps were going to rise with increasing CO2. What happened? Global temps cooled for over 40 years, while CO2 levels rose. Ouch! As Agent 86 would say, “missed it by that much”.

    • barry says:

      It’s warmer now than in Callendar’s time. Ultimately his prediction came true.

      • SkepticGoneWild says:

        That`s like saying a broken clock is right twice a day. He was eventually right??! Everyone is eventually right with climate predictions given enough time.

        So Callendar gets a break for beig totally wrong for over 40 years, but Salvatore de Prete gets scorned for being wrong for what…7 years is it?

        It`s fitting that one of the fathers of the GHE was such a scientific loser.

      • barry says:

        Do you feel heroic writing this stuff?

      • Gordon Robertson says:

        barry…”Ultimately his [Callandar] prediction came true”.

        If he’d have been a bit smarter and studied the Little Ice Age cooling, he could have come to the right conclusion. Instead, he looks somewhat stupid blaming the warming on a trace gas.

        • David Appell says:

          Gordon Robertson says:
          “If hed have been a bit smarter and studied the Little Ice Age cooling, he could have come to the right conclusion. Instead, he looks somewhat stupid blaming the warming on a trace gas.”

          Gordon, Guy Callendar is a giant. You’re a pipsqueak at best.

          Have some respect.

    • Mickey Prumt says:

      And there is no warming since 2016, while CO2 rise.

      • SkepticGoneWild says:

        And Callendar was wrong for another 15 years during the pause.

        That`s almost 60 years of being totally wrong. Lmao.

        • Ball4 says:

          SGW 5:59am: “Callendar was wrong for over 40 years..for another 15 years during the pause. That’s almost 60 years of being totally wrong.”

          It is SGW that is easily proven totally wrong.

          G. Callendar 1938 made no ~60 year or 40 year or 15 year predictions. Table VI shows century length predictions for 20th, 21st, 22nd centuries. With the data for known CO2 emissions, properly baselined, Callendar’s anomaly predictions turned out remarkably accurate, and counting.

          • SkepticGoneWild says:

            Callendar specifically stated at the conclusion of his paper:

            “The course of world temperatures during the next twenty years should afford valuable evidence as to the accuracy of the calculated effect of atmospheric carbon dioxide”

            After 1938, world temperature COOLED. They cooled for over 40 years.

          • Nate says:

            Skeptic: if a scientist 80 y ago didnt understand everything about the earth that we know today, then he must have been an idiot. His work was pointless.

          • Ball4 says:

            SGW gets it wrong yet again by not doing the proper comparison work.

            SGW’s Callendar clip is not any sort of 20yr. anomaly prediction, see Table VI for the proper century predictions.

            Using appropriate Callendar 1938 comparison based anomaly baselines, world temperatures WARMED. They warmed for over 40 years with actual CO2 emissions & right in line with his overall 20th century predictions properly baselined & with subsequent known CO2 emission data.

          • SkepticGoneWild says:

            Strike3 can’t seem to understand the plain English written by Callendar. As Callendar stated in the sentence immediately preceding the quote I gave, he was referring to Earth temperature curves shown in Figure 4. Callendar was very specific in what he stated, and you are ignoring it.

            The “course of world temperatures” DECLINED after 1938.

            Why do you lie so much?

          • Ball4 says:

            Earth to SGW: You are so confused; Callendar’s Fig. 4 is historical world temperature anomaly (“departures from the mean”) records not predictions.

            And you are wrong about the decline in temperatures after 1938, you have to properly compute anomaly using baseline years Callendar used for an accurate plot of future anomaly vs. actuals to evaluate his published work predictive skill.

            This work is obviously above your level of accomplishment.

          • barry says:

            SGW is correct that Calendar mentioned that the next 20 years (from 1938) should provide evidence of the calculated effect of CO2 increase.

            He also provided centennial predictions of temperature, though his CO2 predictions for those were way too low. We passed the mark for what he expected in the 22nd century in 1995.

            Callendar figured global temps at 360ppm would be 0.57C above the 19th century.

            According to Had.CRU, the change was about 0.5C.

          • Ball4 says:

            “..SGW is correct that Calendar mentioned that the next 20 years (from 1938) should provide evidence..”

            SGW did not write 5:10am about “evidence” so could not possibly be correct, SGW wrote about Callendar’s predictions “temps were going to rise with increasing CO2”. SGW got the time periods (60,40,15) wrong for these predictions then obfuscated to show another paragraph discussing future “evidence” and Fig. 4 historical anomaly records.

            And barry needs to adjust the baselines presently used to those used by Callendar to compare his future anomaly predictions to actuals. When that is done properly with actual CO2, Callendar’s Table VI predictions are remarkably accurate. They are NOT wrong as SGW wrote about Callendar “bei(n)g totally wrong for over 40 years”.

          • SkepticGoneWild says:

            B4 states:

            “Callendars Fig. 4 is historical world temperature anomaly (departures from the mean) records not predictions.”

            WRONG! B4 does not pay attention to details. The World temperature graph in Fig. 4 has a dashed line which is the “calculated” CO2 effect. The calculated effect and the actual temperature anomalies match pretty well, HOWEVER, after 1938 global temperature cooled:

            http://tinyurl.com/y8g33fce

            So the calculated effect and global anomalies would start to diverge after 1938…..for a long time, making Calendar’s prediction, by his
            criteria, erroneous.

          • Ball4 says:

            SGW: “HOWEVER, after 1938 global temperature cooled:”

            SGW, as I already informed you, Callendar made no prediction for YOUR selected 1938 to 1978 period. In fact, according to your chart, if you had cherry picked start dates 1942 or 1945 global temperatures cooled even more through 1978.

            That might be interesting, but has no effect on Callendar’s predictions being proven wrong as you incorrectly attempt.

            Draw your WFT graph 1900 to the end of the 20th century for which G. Callendar did make a prediction. Then adjust for HIS T baselines for correct anomaly calculations and add in actual CO2 emissions (to the historical dotted line noted in your comment) and find his future 20th century prediction came out remarkably accurate.

          • SkepticGoneWild says:

            The course of world temperatures during the next twenty years should afford valuable evidence as to the accuracy of the calculated effect of atmospheric carbon dioxide

            You can spin all you want, but you are simply making yourself look real stupid.

            The “course of world temperatures” cooled after 1938, not just for twenty years, but forty years. Callendar’s “calculated effect” showed warming temperatures, Einstein.

          • SkepticGoneWild says:

            Callendar SPECIFICALLY tells you to look at the course of world temperatures for the twenty year period following 1938, but Ball4 puts his hands over his ears and shouts la la la la. Quite comical.

            Callendar specifically states this 20 year period (1938-1958) will give valuable evidence as to the accuracy of his predictions of the calculated effect of increasing CO2.

            Table 6 DOES cover the period from 1938 to 1958 Einstein. I suggest laying off the booze and drugs.

          • Ball4 says:

            And yet Callendar’s 20th century predictions remain remarkably accurate SGW.

          • barry says:

            And barry needs to adjust the baselines presently used to those used by Callendar to compare his future anomaly predictions to actuals.

            I derived the results by working with trend (from 1850), which is independent of baseline. Then it was a simple matter of figuring out when CO2 levels were at 360ppm (1995), and comparing observed rise against the temp response given by Callendar (relative to 19th century) for that level of CO2.

            Callendar’s figure may have been different had he got the timing of CO2 right, owing to thermal lag in the Earth’s system (oceanic lag). Hard to know for sure, because such calculations are not in the paper, and no way of knowing if he included this factor (he was aware of CO2 millennial overturning in the oceans, but did he apply the same thinking to thermal overturn?).

          • barry says:

            And yet Callendars 20th century predictions remain remarkably accurate

            Only in that it would be warmer in the 20th century. He figured CO2 20th century levels would average 292 ppm. Atmospheric content reached that level around 1900.

            Solving for his lowball estimates of CO2 concentrations, his figures are fairly accurate.

          • barry says:

            Table 6 DOES cover the period from 1938 to 1958

            No it doesn’t. The intervals are relative to 19th century, and they are:

            1910-1930
            20th century (average)
            21st century (average)
            22nd century (average)

            Table 6 does not cover the specific period 1938-58, nor indeed the period 1930-2000. His only reference to the 38-58 period comes in the comment near the end of the paper.

          • SkepticGoneWild says:

            B4,
            When you find yourself in a hole, stop digging.

            You are truly delusional, which explains your affinity for pseudo-science.

          • SkepticGoneWild says:

            Barry,
            1938 to 1958 is in the 20th century last time I checked.

          • Nate says:

            SGW, callendar in 1930s got some things right and some wrong. So what?

            Same could be said for Newton, Einstein, Darwin.

            Does not invalidate their accomplishments. Callendars main ideas proved prescient.

          • SkepticGoneWild says:

            Nate,
            Callendar thought twenty years would be sufficient to give an answer as far as the accuracy of the calculated effect of CO2. Twenty years did give an answer. He was wrong. 40 years even gave a better answer; he was doubly wrong. And you call his ideas prescient?

          • Nate says:

            ’40 years even gave a better answer; he was doubly wrong.’

            So what happened after that 30 (not 40) years of flat temp? Best to ignore those 40 + years.

            Do you honestly think that ALL temp variation should be explained by CO2? That is a strawman.

            Or should we consider other mechanisms for change, and try to fully account for the temp history? This is what has been done in the 80 y since Callendar.

            The reality was that CO2 levels began to rise more sharply in last decades of 20th century. Aerosols were dominant in mid century, and ocean cycles played a more significant role. He was not aware of all these processes (eg El Nino!) going on in the climate, that we have since learned (not so surprising).

            If you would be interested in reading and learning from his paper, you would see that his ideas are remarkably close to what we find and believe today, even though he had no computer and his model was more rudimentary. Yes, extremely prescient.

          • SkepticGoneWild says:

            Where are your measurements for aerosols in the mid 20th century?

            You give excuses for when he was wrong for 40 years, and then praise him when perhaps only dumb luck was involved in rising global temperatures.

          • Nate says:

            Again, whats your point picking on a low-information guy from 80 y ago? Waste of time.

          • SkepticGoneWild says:

            Nate,
            Those are not real measured amounts. They are fictitious assumed amounts.

          • SkepticGoneWild says:

            Callendar without fail is always referred to with pride as one of the fathers of the GHE. This is why it’s important to carefully examine his work, and to see his erroneous predictions.

          • Nate says:

            SkepticGoneWild

            ‘Ficticious assumed amounts”

            Not at all. Show me where it says so.

            It is calculated from global emissions.

          • Nate says:

            SGW,

            “Callendar without fail is always referred to with pride as one of the fathers of the GHE”

            Yes, indeed, he was an important pioneer of this idea. BTW, there was no political agenda when he did the work. No computer models. No measurements from space.

            “important to carefully examine his work, and to see his erroneous predictions”

            It might make you feel better, to attack someone who did not have all of today’s knowledge, but nobody else cares.

            More important to judge work of people who have the benefit of decades more data and theory at their fingertips.

            For example, Joe Postma. He has textbook physics available to him, yet his statements contradict it, repeatedly.

            His erroneous ideas cannot explain this well known technology:

            https://en.wikipedia.org/wiki/Multi-layer_insulation

          • Svante says:

            SkepticGoneWild “Ficticious assumed amounts”.

            You need to read the article again and find the GISP2 measurement. It looks like a hockey stick:
            https://tinyurl.com/ybpngy5m

            And please explain the multi layer insulation above. It follows the same principle as the GHE, complete with “cold warming hot”.

    • des says:

      I always find it amusing that deniers continually talk of climate variability, yet demand all variability should disappear in the presence of an increasing greenhouse effect.

      • SkepticGoneWild says:

        So when it warms, it`s the GHE, when it cools it`s natural variability. Hilarious. Can yoy say dumb@$$?

        • Bindidon says:

          You primitive, impolite person just gave yourself the perfect name: dumb ass. That is what so perfectly fits to you.

        • des says:

          When it varies over the short to mid-term in EITHER DIRECTION from the baseline it is natural variation, which is really just a catch-all term for all the NON long-term climate factors. It is the BASELINE which is increasing slowly but surely over the long term. Which is precisely why we should NOT be comparing temperatures at the height of El Nino or La Nina, and we should NOT be using this month to claim this is where the climate now sits.

          Please point me to any comment I have made where I said anything like “when it warms, it`s the GHE, when it cools it`s natural variability”. Does it even enter your tiny Trump-sized brain that you are making straw man arguments.

      • Gordon Robertson says:

        des…”yet demand all variability should disappear in the presence of an increasing greenhouse effect”.

        You mean the fictitious greenhouse effect which alarmists admit is a metaphor and behaves nothing like a real greenhouse? Then you have greenhouse gases acting as a roof on the fictitious greenhouse.

        Show me how the subtle trend over the past 30 years has in any way been affected by greenhouse gases.

      • barry says:

        So when it warms, it`s the GHE, when it cools it`s natural variability.

        Meaningless without specifying time-scale. Everyone agrees that el Ninos cause temporary warming of surface and TLT temps, for example. You’re hacking at the conversation with a blunt instrument.

    • Gordon Robertson says:

      skeptic…”What happened? Global temps cooled for over 40 years…”

      The IPCC loves the kinds of sci-fi stories represented by the likes of Callandar.

      • des says:

        “Represented by”??? Surely you meant PRESENTED. Your vocabulary choices are always rather odd, to say the least.

  45. Until/if global temperatures start to at lest fall below +.30c then at 30 year means by summer there is not much for me to say.

    This is the test. Not going very well for my point of view thus far.

    • Mickey Prumt says:

      How is going your model ?

    • RW says:

      Salvatore,

      The problem is you’re trying to make predictions as to which way the climate will go. No one knows, as there are just too many variables and potential influences (natural and anthropogenic). Moreover, we’re dealing with such spectacularly small changes in temperature here. It’s silly to make predictions regarding tenths of degrees of change, especially when the margin of error of the data is at least a couple tenths of degree.

      The climate may warm this century or it may not. No one knows.

      • Mickey Prumt says:

        In fact, it will warm. No doubt about that.

        • Bindidon says:

          Ooops?! How do you know that?

          It might very well warm until the thermohaline circulation in the northwest Atlantic experiences a beakdown due to lack of salinity at ocean surface, and then… switch to a harsh cooling within one or two decades which lasts for a few centuries at least.

          • Mickey Prumt says:

            Oh that’s an easy one.
            It’s because GHG won’t decrease, and even will keep increasing, so it’s gonna keep warming for sure.

            Any other question ?

          • des says:

            Most climate scientists now agree that there will not be a global cooling from such an event, merely a moderation of warming in western Europe.

          • gammacrux says:

            How do you know that?

            Some idiots “know” everything about anything.

            They even “know” that there won’t be any supervolvano eruption in the forthcoming centuries.

          • Mickey Prumt says:

            Well few volcanoes in the future won’t prevent future warming.
            You will need more…

            In particular, a volcano has very small effect few years after the eruption. Just a temporary cooling. It’s like putting something 2 min in the freezer, and looking at its temperature 5 minutes after putting it back to ambiant temperature : no effect. Don’t you think ?

          • Bindidon says:

            Mickey Prumt on November 4, 2017 at 10:37 AM

            Maybe you did not perfectly understand what gammacrux wrote.

            The effect of a supervolcano with a Volcano Explosivity Index of 7 or even higher is all but ‘like putting something 2 min in the freezer’.

            The explosion of Mt Rinjani on Indonesia’s Lombok island near Bali in 1257 was simply tremendous.

          • des says:

            gammacrux
            Nobody claims to know that. But it is very unlikely. They occur on average once every 100000 years. We have been unlucky enough to have had two in the past 100000 years.

          • Mickey Prumt says:

            Guys,
            you would not counteract a long term 2 degrees climate change with a volcano.
            Whatever the volcano.
            GHG have longer lifetime than stratospheric aerosols.

          • gammacrux says:

            Nobody knows what the temperature and climate will be in a century from now.

            It’s certainly not because we know that CO2 has a warming effect on climate that anybody with serious scientific background would dare to tell.

            Climate is a complex system and as such there are many emergent phenomena (life is one of them) that are definitively unpredictable.

            In more popular terms of climate science, besides all poorly known or unknown feedbacks what about the following “feedback” of biological origin; A “nice” nuclear winter as a result of a global conflict due to economic collapse, resources scarcity ( energy and metals), growth of poverty etc… triggered by a forced march towards a mythical “carbon free” civilization of 7+ billion people…

          • des says:

            Mickey Prumpt
            I’m afraid I have to challenge that one. Toba 75000 years ago dropped global temperatures by at least 10 degrees for about a decade. And when the aerosols went away the ice sheets had already grown by enough to set the ice feedback effect into motion. I believe it took about 1000 years to recover.

            And the volcano in the Siberian Traps that set off our greatest ever extinction 250 million years ago was on a different scale altogether. The VEI scale does not begin to describe it. Of course the chance of one of those in the coming centuries is almost zero, but if it came then human global warming would be off the agenda forever.

          • Mickey Prumt says:

            Ok interesting.
            I read it led to a drop of global temperature of 3–5 °C (or more or less) for few decades and may have accelerated the transition to last glacial cycle (it coincided with the onset). It is not thought to have trigger the transition.

            Ok for a potential global impact few 100 yr after the volcano, but I strongly doubt it would be enough to cancel most of the GHG induced warming (except of course during the few decades following the volcano).

          • Mickey Prumt says:

            (read drop of 3 to 5 degrees).

        • SkepticGoneWild says:

          Callendar thought it would warm too. Mother Nature made a fool of him.

          • David Appell says:

            Callendar was right — the surface has warmed +0.8 C since his 1938 paper, ice has melted, the seas have risen and the ocean has gained massive amounts of heat.

          • SkepticGoneWild says:

            Callendar specifically stated at the conclusion of his paper:

            The course of world temperatures during the next twenty years should afford valuable evidence as to the accuracy of the calculated effect of atmospheric carbon dioxide

            After 1938, world temperature COOLED. They cooled for over 40 years, not just 20.

          • barry says:

            Which demonstrates only that Callendar did not conceive that near-term factors could overwhelm the CO2 effect. His longer-term predictions per CO2 concentration proved fairly accurate. His global temp predictions for CO2 concentrations @ 330ppm and 360ppm is within 0.1C of observed, for example.

      • David Appell says:

        RW says:
        “The climate may warm this century or it may not. No one knows.”

        Everyone knows — it will warm, baring some extremely improbable event like a massive volcanic eruption or asteroid/comet strike.

    • Dave says:

      Salvatore,

      I’ve been reading your predictions here for years. Personally if the difference between my stated predictions of dramatic cooling being just about to happen and the empirical evidence that the temperature is gradually and persistently creeping upwards had been as large as they have been with your own, I would have cut my losses long ago. But I’m heartened that you are at least entertaining the idea that you may well be wrong. Others commenting on this site could also do well to just look at the actual observations. It actually matters very little which dataset you place faith in – they generally correlate strongly with one another except for the strength of their response to ENSO events (which seem to have a stronger influence on the satellite data) and the differences in slope of the upward trend. But even then, the absolute range in empirical observations from the last 40 years is not huge – from ~1.3 to 1.8 degrees per decade.

    • RW says:

      Salvatore,

      The monthly anomaly can jump as much as 0.4-0.5C in either direction. Jumps of 0.2-0.3 from month to month are fairly common. By next month, it could be back down to 0.2C and temps could continue to fall from there. Or not.

      I suggest you stop making predictions! No one knows what’s going to happen. Any trend, warming or cooling, will only be known in hindsight. By dumb luck alone, someone’s prediction will be right.

      I liken this to be analogous to an old saying about the stock market, which is all investors can be put into 2 categories: Those who know they don’t know where the market is going, and those who don’t know they don’t know where the market is going.

      • David Appell says:

        Good points. And, if there are 2^10 investors/analysts on Wall Street, on average one of them will call the right market direction 10 times in a row, just from dumb luck. The industry will elevate her to a genius.

  46. ren says:

    CFSv2 SST forecast anomalies with 1982-2010 climatology

    Nov 2017 to Jul 2018 (Updated: Sat Nov 4 11:36:17 UTC 2017)
    http://www.cpc.noaa.gov/products/people/wwang/cfsv2fcst/images3/nino34Monadj.gif

  47. ren says:

    Weather summary
    for British Columbia
    issued by Environment Canada
    at 9:31 p.m. PDT Friday 3 November 2017.

    Many new record low maximum temperatures were set on November 3rd in
    southern BC..
    http://weather.gc.ca/warnings/weathersummaries_e.html

  48. Kristian says:

    Spencer,

    Global TLT, 01/2000 – 10/2017, RSSv4.0 vs. UAHv6.0:
    https://okulaer.files.wordpress.com/2017/11/rssv4-vs-uahv6.png

    The RSS team adjusted their data up by ~0.15 K between 1999 and 2003. The light green vertical line marks the approximate end of that period.

    • barry says:

      I believe there was quite a big adjustment for UAH satellite between v5.6 and v6, especially from 2000. Have you checked that out?

      • Bindidon says:

        barry,

        it seems that one more time commenter Okulaer aka ‘I know everything better than any specialist’
        – feels the need to teach Roy Spencer about what Mr Spencer certainly will be aware of since many years,
        but
        – without explaining wrt what the claimed adjustement took place.

        And yes: the differences between UAH6.0 and UAH5.6 were here and there quite impressive, even higher than the anomalies themselves.

        I remember also a stupid polemic at WUWT last year about ‘huge adjustements’ made on RSS3.3 TLT which in fact looked infinitesimal when compared with the differences between the UAH revisions.

        I’m not at home and don’t have the data at hand, otherwise I would publish the corresponding graphs.

      • Kristian says:

        barry says, November 4, 2017 at 10:15 AM:

        I believe there was quite a big adjustment for UAH satellite between v5.6 and v6, especially from 2000. Have you checked that out?

        Yes, I have:
        https://okulaer.wordpress.com/2015/03/08/uah-need-to-adjust-their-tlt-product/

      • barry says:

        Thanks, Kristian. I wonder what the next revisions will bring.

  49. Bindidon says:

    About this absurd, malicious polemic against Callendar:

    In 1938, Callendar compiled measurements of temperatures from the 19th century on, and correlated these measurements with old measurements of atmospheric CO2 concentrations.

    He concluded that over the previous fifty years the global land temperatures had increased, and proposed that this increase could be explained as an effect of the increase in carbon dioxide.

    These estimates have now been shown to be remarkably accurate, especially as they were performed without the aid of a computer.

    Source: Wikipedia

    Callendar’s work

    Callendar, G. S. (1938) “The artificial production of carbon dioxide and its influence on temperature”, Quarterly Journal of the Royal Meteorological Society

    unluckily is behind paywall.

    • Gordon Robertson says:

      binny…”About this absurd, malicious polemic against Callendar:”

      Why don’t you publish the findings of Kreutz, another fine German scientist. He took over 25,000 readings of CO2 concentrations in the atmosphere over Germany that showed CO2 concentrations in excess of 400 ppmv back in the 1930s.

      Callandar was a lightweight in comparison.

      • ren says:

        ALLAN MACRAE November 4, 2017 at 3:41 am
        Sorted atmospheric cooling will resume soon. See the plot below of the UAH LT TROPICAL Anomaly vs the East Equatorial Upper Ocean Temperature Anomaly and the situation becomes more clear.

        This is a typical pattern after major El Ninos, in which atmospheric (LT) temperature diverges above the level predicted by the long term relationship with the East Equatorial Upper Ocean Temperature Anomaly. The pattern will converge again soon, and atmospheric cooling will resume. WHY this happens after major El Ninos is still to be explained.
        https://www.facebook.com/photo.php?https://scontent-frx5-1.xx.fbcdn.net/v/t1.0-0/s552x414/23172720_1483830358361188_7035410597183781895_n.jpg?oh=4319b2b8341bda2cce4a1e8d7a6a60c7&oe=5AADE579

      • Bindidon says:

        As usual, the dumb and naive troll produces nonsense coming from Harry G. Olson, an extremist in climate denialism.

        • SkepticGoneWild says:

          Bin thinks its OK to insult people by calling them dumb, naive, and troll, but as long as you don’t say “dumbass”. it’s OK. What a freakin’ hypocrite.

          • Bindidon says:

            I only insult back, GoneDumb: people calling me an idiot, like did the Robertson troll, or calling other people dumb asses, like you did.

      • barry says:

        He took over 25,000 readings of CO2 concentrations in the atmosphere over Germany that showed CO2 concentrations in excess of 400 ppmv back in the 1930s.

        Local measurements in an era of industrial expansion. Kreutz was not the first or last to take measurements in CO2 dense areas. It would be another 25 years before researchers located a pristine site to get the background measurements of CO2. Meanwhile, the ice records have been checked for background levels.

        What should give anyone a clue about CO2 concentrations pre 1958, is that since good measurements have been made there have been no wild annual swings, but a very stable increase. Otherwise one would have to be at peace with an incredible coincidence that, just as CO2 background measurements were taken from the Antarctic and Mauna Loa, the atmospheric content miraculously stabilized, and stayed that way ever since.

      • David Appell says:

        Gordon Robertson says:
        “Why dont you publish the findings of Kreutz, another fine German scientist. He took over 25,000 readings of CO2 concentrations in the atmosphere over Germany that showed CO2 concentrations in excess of 400 ppmv back in the 1930s.”

        The data were contaminated by urban and industrial machines.

    • SkepticGoneWild says:

      Bin,

      You should not rely on the Wikipedia.

      Callendar gave specific criteria to evaluate his claims. At the conclusion of his 1938 paper he stated:

      “The course of world temperatures during the next twenty years should afford valuable evidence as to the accuracy of the calculated effect of atmospheric carbon dioxide

      After 1938, world temperature COOLED. Not only for 20 years, but for over 40. By his own criteria, he was wrong.

      Do your homework. The paper is not behind a paywall at other sites.

      • Bindidon says:

        As usual, dumb stuff.

        1. All skeptics aka ‘the true believers and followers’ pretty good rely on Wikipedia whereever it fits to their narrative.

        2. People like you and other trolls, basing their ‘knowledge’ on Goddard, Notrickzone etc etc, never will understand yet accept that
        2.1 there is no direct correlation between CO2 and temperatures, at best over a whole century, due to the ocean storage capacity of both CO2 and temperatures
        2.2 everybody knows that the period before, during and following WW II led to a tremendous in crease of aerosols.

        Do your homework.

        That you should do first, GoneDumb!

        The paper is not behind a paywall at other sites.

        I have that paper since years somewhere, but being 3,000 km away from home, I feel no interest in looking for it again.

      • SkepticGoneWild says:

        The usual bs from Bin. You did not do your homework and were left looking stupid. If you have a computer, you can perform a bing search. It’s not that hard, Einstein. I easily found a copy of the original study. I’m not doing the work for you.

        Callendar SPECIFICALLY said the next 20 years would give evidence of the accuracy of his calculations. The following 20 years proved him wrong, and 20 years beyond that as well.

        Please show me the data for measured aerosols.

    • barry says:

      Yeah, people were saying the same last year. Based on similar data. Guess what?

      • des says:

        Not quite the same time. I think by this time we already knew it would be weak.

      • barry says:

        Point is, they were calling a definite la Nina (and many presumed a strong one) as early as February, then in May, June, July, August, September, October. ONI values crossed the la Nina threshold in August, which made people even more convinced (if that was possible). The timing of premature celebrations now relative to ENSO thresholds is similar enough.

        Amusingly, the only institute that actually called a 2016 la Nina based on their metric is the one that skeptics despise the most.

        And whenever a la Nina comes, as it will inevitably, we will see the inevitable fist-pumping because global temps went down for a few months.

        Perhaps then we will be allowed to run trends through the 2016 el Nino year, but I suspect the skeptics will come up with a new fudge to try and wipe it out of analysis.

  50. Greven says:

    With September and now October, the top 10 hottest monthly temperature anomalies are:
    2016 02
    2016 03
    1997 04
    2016 04
    1997 02
    1997 05
    2017 10
    1997 06
    2016 01
    2017 09

  51. des says:

    A question I posted earlier for Roy which he chose not to answer. Here it is again:

    “Which of the surface adjustments do you believe is not statistically valid?” (And Why?)

    If anyone else chooses to answer this question, please answer with MATHEMATICS, not rhetoric/bluster.

    • barry says:

      In what specific way are you asking about statistical validity? Could you give an example? Might help people better focus on what you’re querying. Do you mean spatial weighting, statistical analyses and eradication of spurious break points in weather station data, comparative trend results, or…?

      • des says:

        This is not an attempt to seek information – I already understand how the adjustments work. It it an attempt to find out whether Roy and other people who claim there is a problem with the surface adjustments have the ability to properly explain what they see as the issues with each adjustment, or whether they are simply reciting mantra. Not sure about Roy, but for most of the others here I am pretty confident it is the latter.

        • Gordon Robertson says:

          des…”It it an attempt to find out whether Roy and other people who claim there is a problem with the surface adjustments have the ability to properly explain what they see as the issues with each adjustment…”

          I have already explained the NOAA scientific misconduct. They receive data from 6000 surface stations globally, discard 75% of it and plug less than 25% of the data into a climate model where it is interpolated and homogenized to synthesize the data they discarded.

          Eureka!! We have a warming trend where the IPCC and UAH found none.

          • des says:

            Interesting. Now answer my question.

          • barry says:

            They receive data from 6000 surface stations globally, discard 75% of it

            Again and again, you lie about this.

            Each time, calmly, you will be reminded what a liar you are.

          • des says:

            I see your comprehension issues are still troubling you.
            My question was about the ADJUSTMENTS. The two main adjustments are TOB and PHA. Please explain why either of those two adjustments are statistically invalid.

          • phi says:

            des,

            “The two main adjustments are TOB and PHA. Please explain why either of those two adjustments are statistically invalid.”

            TOB is significant only for USHCN and not for global indices, BEST does not even care at all.

            Still not understood that one could not hope to derive valid long-term trends by abutment of homogenous segments and ignoring the evolution of actually measured temperatures?

          • barry says:

            Still not understood that one could not hope to derive valid long-term trends by abutment of homogenous segments and ignoring the evolution of actually measured temperatures?

            Raw temps are also used. The result is a higher centennial trend.

            Skeptics Jeff Condon and Roman M did their own global analysis using raw data and got higher trends than Had.CRU. BEST did too.

            There are analyses using non-GHCN data (eg, GSOD): similar results.

            The raw data has been available for years for anyone to do the same. Do you know of alternative results using all the data (rather than cherry-picked stations?).

            I actively seek pout this kind of analysis, especially from skeptics. For some strange reason, no skeptic (apart from Jeff and Roman) has rolled up their sleeves and done it.

          • phi says:

            barry,

            If you want to make a correct analysis of the effect of the adjustments, you must use only long series (short series or homogeneous segments have the same effect).

            You will find compatible analyzes for example here:
            http://www.homogenisation.org/files/private/WG1/Bibliography/Applications/Applications%20(A-B)/begert_etal.pdf

            or there :
            http://onlinelibrary.wiley.com/doi/10.1002/joc.689/pdf

            And as a reminder for USHCN :

            http://berkeleyearth.org/wp-content/uploads/2015/04/Figure5.png

            I do not know of a counterexample.

          • barry says:

            Phi,

            You responded as if I’d asked a completely different question.

            These are not global analyses, for example. In what way can I ask for a global record that would help you to understand I mean global?

            USHCN – TOB adjustment in the largest, and even Anthony Watts thought that was necessary in his paper (Fall et al 2011).

            As an aside, Fall et al corroborated biases in mean/max temps at poorly sited weather stations, and came up with a mean trend very similar to NOAA for the US.

            I’ll repeat my question, so there can be no mistake.

            With raw data being available for many years, where are the GLOBAL surface temp records made by skeptics? The ones that, apples to apples, demonstrate problems with adjustments to GLOBAL surface records?

            I’ve shown you one, with trends higher than Had.CRU. I’ll take it as read you won’t accept BEST under the skeptic rubric of Mueller being a sell-out etc. So I linked to the one done by Jeff Condon and Roman M, whose skeptic credentials are not in doubt.

            https://noconsensus.wordpress.com/2010/03/24/thermal-hammer/

            Do you have anything to say about this? I hope you are not one who ignores information inconvenient to their view.

            Do skeptics just have no interest in doing this work after years of carping about adjustments and demanding the raw data?

            It should be straightforward to show that adjustments for the GLOBAL surface temp records are spurious. Take the raw data and do the analysis the way one thinks best. I’ve been waiting some years for more of the critics to do this. What is stopping them?

          • phi says:

            barry,

            Projection crisis ? The question concerns the validity of adjustments. This question is decided only at the stations level, at the local level and possibly at the regional level but not at all at the global level.

          • barry says:

            Of course it counts at the global level – this is a prevailing metric regarding global change.

            It is well known that there is less certainty at regional or local level than global. Some regions, for example,have poorer coverage than others. Perhaps this is why you are emphasising regional/local?

            Should I take your disinterest in global analyses that you agree adjustments have an insignificant impact at the global level?

          • phi says:

            Adjustments correct events that appear individually in the stations. It is therefore primarily at this level that you can judge the relevance of adjustments and not at all at the global level.

            “Should I take your disinterest in global analyses that you agree adjustments have an insignificant impact at the global level?”

            Not at all. The global level should also be considered but based on what is learned from the individual data.
            One of the lessons is that short series on average or homogenized series have the same characters. It is therefore not surprising that global calculations using short series on average are consistent with local calculations using adjusted long series.

      • barry says:

        I understand. I’ve asked much the same in the past.

    • barry says:

      (or… all of the above and more?)

    • Gordon Robertson says:

      des…”Which of the surface adjustments do you believe is not statistically valid? (And Why?)”

      First you might explain why someone like Roy would fancy responding to someone like you. Why would a scientist who expresses skepticism about catastrophic global warming/climate change, based on nearly 40 years of satellite data, want to engage with someone trying to bait him with pseudo-scientific nonsense?

      A US Senate committee is currently investigating NOAA for fudging the historical record.

      • des says:

        Bait? Asking for details about an assertion is ‘baiting’ is it? Thanks for admitting that these assertions are only BELIEF.

    • barry says:

      Two days later and no one has a substantive, maths-based reply to des’ question.

      I’ve asked the question many times. This is always the result. Nada.

  52. ren says:

    Geomagnetic activity is very low. Clearly meridional jet stream.
    http://images.tinypic.pl/i/00944/4cmw5l272rak.png

  53. phi says:

    des,

    “Roy and other people who claim there is a problem with the surface adjustments have the ability to properly explain what they see as the issues with each adjustment”

    It’s pretty simple to understand. Surface temperature adjustment methods rely entirely on short-term trends while absolute values are ignored.

    Such a technique is obviously not reliable for long-term trends. We are talking about a difference between methods of about 0.1 C per decade.

    • des says:

      You’ll have to explain precisely WHICH adjustments you are talking about. For starters, explain what you are talking about with reference to the following description of pairwise homogenisation.

    • Bindidon says:

      Its pretty simple to understand. Surface temperature adjustment methods rely entirely on short-term trends while absolute values are ignored.

      Wow. What a quick shot.

      The difference between ‘simple’ and ‘simple-minded’ seems here so tiny that a deeper, more consistent explanation would be welcome.

      Btw: did you ever have a look at the UAH5.6-6.0 adjustments when compared with those for GISS?

      I guess you didn’t.

  54. phi says:

    All techniques used for building global or regional indices operate on the same basic principle:

    1. Search for singular discontinuities in individual series.
    2. Assembling segments based on slopes without taking into account absolute values.

    As a result, long-term trends are meaningless.

    • des says:

      Why do you keep starting a new thread. Go back to the old one and tidy up your room before you go outside to play.

    • Bindidon says:

      As I told you in earlier RS threads: your personal meaning is here of no interest. You claim and pretend things without any proof.

      Typical skeptic / warmist attitude (both clans have inverse meanings but behave quite similar).

      Please show references and/or examples.

      • gammacrux says:

        … your personal meaning is here of no interest. You claim and pretend things without any proof.

        Indeed, when urged to substantiate his beliefs, phignoramus invariably adopts the same laughable trick ( =amusante ficelle, grosse comme une maison)

        – either he (rarely) first makes an attempt and dares to go into some technical detail and when (systematically and invariably) shown to be plain wrong and fail miserably he readily switches back and just spouts an other part of his general babble, beliefs and ridiculous unsubstantiated indictment against GHE, AGW and scientists.

        -or he (mostly) does not even make an attempt, cowardly stays away from fight and just switches to a different part of his general unsubstantiated drivel.

    • Bindidon says:

      As I told you in earlier RS threads: your personal meaning is here of no interest. You claim and pretend things without any proof.

      Typical skeptic / warmista attitude (both clans have inverse meanings but behave similarly superficial).

      • phi says:

        It does not matter. What I write is for those who have the means to understand. And I have nothing to add here. Goodbye.

        • Bindidon says:

          It seems that you by far overestimate both the difficulty to understand you and the will to trust in what you so pretty smugly pretend.

          Indeed: goodbye!

        • des says:

          phi
          You are certainly running true to gammacrux’s description of you above. By ‘means to understand’ I assume you are referring to some kind of mental condition.

    • gbaikie says:

      So stuff like some year having 38% chance of being warmest
      ever!

  55. What is happening are the oceans are cooling now +.260c for global temperature deviation.

    This is what I will be watching- the source ocean tid bits.

  56. Eli Rabett says:

    The Green Plate Effect, the movie by Izen

    https://youtu.be/DFC3DOEyoz0

    • g*e*r*a*n says:

      Pseudoscience.

      • Tim Folkerts says:

        … and yet no evidence is offered. No counter argument is provided.

        What specifically do you disagree with? What violates any basic law of physics? Or perhaps all of physics is also pseudoscience in your view.

        • g*e*r*a*n says:

          The blue plate reaches its S/B equilibrium temperature. No problem.

          Then the green plate is added. The green plate warms. But, the “back-radiation” from the colder green plate can NOT raise the temperature of the blue plate.

          The green plate warms until it is the same temperature as the blue plate. Both plates then radiate 200 Watts out of the system.

          Claiming the “back-radiation” from a cooler surface can raise the temperature of the blue plate just means “someone” doesn’t understand physics.

          • Tim Folkerts says:

            “The green plate warms. But, the back-radiation from the colder green plate can NOT raise the temperature of the blue plate.”

            You keep stating things like this as if they are laws of physics. As if this was the 2nd Law of Thermodynamics. The calculations (supported by a century of real-world testing) show that the green MUST raise the temperature of the blue.

            “The green plate warms until it is the same temperature as the blue plate. Both plates then radiate 200 Watts out of the system.”

            It is pretty obvious from SB equation that the “standard textbook answer” (supported by a century of real-world testing) would be
            P = sigma A (T(blue)^4 – T(green)^4)
            = sigma A (244^4 – 244^4)
            = 0 W/m^2
            If both plates are at 244K, then there is no heat from the blue to the green plate.

            Kindly show the equation and the calculations for how one plate at 244K can radiate 200 W/m^2 to another plate also at 244K.

          • gammacrux says:

            The green plate warms until it is the same temperature as the blue plate. Both plates then radiate 200 Watts out of the system.

            The most formidable fake physics I’ve ever seen.

            It readily violates even the first law of thermodynamics..;

            If both green and blue plate end up at the same temperature there cannot be any heat flow between them. And if there is not heat flow from blue to green plate and the latter at constant temperature nevertheless manages to “radiate 200 W out of the system” it means that perpetual motion exists at last and that in green plate 200 W are created out of thin air.

            But course the GHE denying crackpots might prefer to violate rather the second of thermodynamics and claim that 200 W flow spontaneously from blue to green plate at same temperature.

            Hilarious !

          • g*e*r*a*n says:

            Tim, I love your comedy.

            Tim offers: “The calculations (supported by a century of real-world testing) show that the green MUST raise the temperature of the blue.”

            Tim, if you don’t know how to apply an equation, and your result violates the laws of thermodynamics, you may need to review your “learning”. A colder surface can NOT radiatively raise the temperature of a warmer surface. That is why you can NOT heat your home in winter with a bowl of fruit.

            Tim muses: “If both plates are at 244K, then there is no heat from the blue to the green plate.”

            The ONLY heat transfer is from blue to green.

            Tim, in his confusion, requests: “Kindly show the equation and the calculations for how one plate at 244K can radiate 200 W/m^2 to another plate also at 244K.”

            Tim, once again, you confuse “radiate” with “heat transfer”. At equilibrium, both plates are radiating 200 Watts, in both directions, but the blue plate is constantly receiving 400 Watts. Consequently, it MUST radiate 200 Watts from both surfaces.

            If you are so enamored with “back-radiation”, are you willing to heat your apartment with a bowl of fruit this winter? (Remember, it’s “supported by a century of real-world testing”!

            Hilarious.

          • g*e*r*a*n says:

            gamma brings in more comedy: “If both green and blue plate end up at the same temperature there cannot be any heat flow between them. And if there is not heat flow from blue to green plate and the latter at constant temperature nevertheless manages to radiate 200 W out of the system it means that perpetual motion exists at last and that in green plate 200 W are created out of thin air.”

            Indeed, it is hilarious.

          • Tim Folkerts says:

            “both plates are radiating 200 Watts, in both directions”

            Yes, so the net transfer from blue to green is zero. Blue radiates 200 W to the right to green, while green simultaneously radiates 200 W to the left to blue. There is no net transfer from blue to green. Glad you agree.

          • g*e*r*a*n says:

            When Tim loses the argument, he tries to “re-describe” my words. It’s a “badge” of pseudoscience.

            Me: “The ONLY heat transfer is from blue to green.”

            Tim: “Yes, so the net transfer from blue to green is zero.”

            It’s called “desperation”.

            (So Tim, did you agree to heat your apartment with a bowl of fruit this winter?)

          • Tim Folkerts says:

            Sigh … OK G, which line do you disagree with?

            1) both plates are radiating 200 Watts, in both directions
            2) therefore, Blue radiates 200 W toward the right
            2a) therefore Green radiates 200 W toward the left
            3) Blue absorbs the 200 W mentioned in line (2a)
            3a) Green absorbs the 200 W mentioned in line (2)
            4) Combining 2&3, the right side of blue both absorbs and emits 200 W
            4a) Combining 2a&3a, the left side of green both absorbs and emits 200 W.
            5) The net radiation out of the right side of Blue is 200W-200W = 0W.
            5a) The net radiation into the left side of Green is 200W-200W = 0W.
            6) Since there is no net radiation entering blue from green or entering green from blue, the overall net transfer from blue to green is zero.

          • g*e*r*a*n says:

            “1) both plates are radiating 200 Watts, in both directions”
            At equilibrium, yes.

            “2) therefore, Blue radiates 200 W toward the right”
            At equilibrium, yes.

            “2a) therefore Green radiates 200 W toward the left”
            At equilibrium, yes.

            “3) Blue absorbs the 200 W mentioned in line (2a)”
            NOPE!

            “3a) Green absorbs the 200 W mentioned in line (2)”
            At equilibrium, yes.

            “4) Combining 2&3, the right side of blue both absorbs and emits 200 W”
            NOPE!

            “4a) Combining 2a&3a, the left side of green both absorbs and emits 200 W.”
            Yes, but the net gain is 200 W. The 200 W emitted is returned. Net is 200 W gain.

            “5) The net radiation out of the right side of Blue is 200W-200W = 0W.”
            NOPE! Net is 200 W. Remember, 400 W incoming.

            “5a) The net radiation into the left side of Green is 200W-200W = 0W.”
            NOPE! Net is 200W (incoming).

            “6) Since there is no net radiation entering blue from green or entering green from blue, the overall net transfer from blue to green is zero.”
            NOPE! 200W is being transferred from blue to green.

            (What was the “sigh” about? Are you not happy having to push pseudoscience?)

          • Tim Folkerts says:

            2a) therefore Green radiates 200 W toward the left
            At equilibrium, yes.
            3) Blue absorbs the 200 W mentioned in line (2a)
            NOPE!

            So you agree that 200 J of radiation leave the left side of the green plate every second heading toward the left — ie heading toward the left side of the blue plate. Where do you think those joules of energy go? They don’t leak out the sides. They don’t disappear into thin air.

            “The 200 W emitted is returned. Net is 200 W gain.”
            Ah! it seems you are postulating that the 200W leaves green, gets reflected perfectly by blue, and then bounces back to green where it gets absorbed. Is that really your position?

          • g*e*r*a*n says:

            TIm queries: “Where do you think those joules of energy go?”

            Tim, all the energy is accounted for. 400 Watts into the system, 400 Watts leaving the system. You’re grasping at straws.

            Tim, more grasping at straws: “Ah! it seems you are postulating that the 200W leaves green, gets reflected perfectly by blue, and then bounces back to green where it gets absorbed. Is that really your position?”

            Nope. Your postulating is a FAIL.

            Now, it’s time for you to answer my questions. Can you warm your apartment with a bowl of fruit this winter? If so, how many windows must you leave open so that your furniture does not catch fire?

          • Tim Folkerts says:

            “Tim, all the energy is accounted for. 400 Watts into the system, 400 Watts leaving the system. Youre grasping at straws.”

            You are avoiding the space between the plates!

            It is not enough to have 400W in and 400W out. The 400W has to work its way through the system is a way that is consistent with the laws of physics. You have 400W enter the blue but only 200W leave the blue (to the left). You have 0W enter the green but 200W leave the green (to the right).

            “Now, its time for you to answer my questions. Can you warm your apartment with a bowl of fruit this winter?”
            No. But that has nothing to do with the problem at hand. The green plate works because it is interposed between the warm blue plate (with an independent external power source) and the cold surroundings.
            *Your fruit is not powered, so it is not like the blue plate.
            *Your fruit is not interposed between a heated object and the cold surroundings, so it is not like the green plate.

          • Ball4 says:

            “Your fruit is not interposed between a heated object and the cold surroundings, so it is not like the green plate.”

            Actually, IF anger were smart enough to actually use his bowl of fruit interposed between the furnace and the cold surroundings as several inches of added insulation (R value 1) THEN, yes, his house would warm at same thermostat setting. Just like the blue plate does by experiment when the green plate with a bowl of fruit painted on is added to the experiment.

            But obviously anger is not that smart in experimental or applied theoretical physics.

          • g*e*r*a*n says:

            Tim grasps again: ” You have 0W enter the green but 200W leave the green (to the right).”

            Tim, your reading comprehension is as bad as your physics:

            In answer to your 5a) “Net is 200W (incoming).”

            In answer to your 6) “200W is being transferred from blue to green.”

            And you tried to avoid dealing with the bowl of fruit question, because you know it DOES have something to do with the problem at hand. The green plate receives energy. A bowl of fruit receives energy, from your body. You claim the green plate can heat the blue plate, but you run from the fact that your bowl of fruit can NOT heat you.

            You’ve trapped yourself again, and it’s fun to watch.

          • g*e*r*a*n says:

            Does anyone else smell cabbages burning?

          • Ball4 says:

            “you tried to avoid dealing with the bowl of fruit question”

            So I dealt with it, and, yes, anger if you were smart enough to use your bowl of fruit appropriately as added R value insulation, you can warm your apt. this winter at the same cost of fuel for your furnace.

            However anger demonstrates little aptitude in these matters so I expect no advance in understanding or application of basic thermodynamics. I do expect anger will live up to all my expectations.

          • Norman says:

            Tim Folkerts

            I spent many posts on another thread with g*e*r*a*n over the same issue. I am starting to see more clearly the mentality of both g*e*r*a*n and SkepticGoneWild. They are disciples of the Cult leader Joe Postma.

            When you posted a simple point on his blog he attacked you with a fury unfounded. I would think Postma was a lunatic for his unwarranted outburst but that would not be the case. He attacks people who bring real physics to the table. You threaten his power and control of his loyal disciples. He is in it for power and is a skilled manipulator. His material seems plausible until you think it through. He puts up a bunch of smoke and mirror to deceive his gullible followers. They love him too much to see how phony he is and just uses them for this manipulative power.

            Here is his response you your intelligent and reasonable post on his blog.
            https://climateofsophistry.com/2017/10/19/the-steel-greenhouse-in-an-ambient-temperature-environment/#comment-31737

            This is your rational comment and he attacks it with fury it makes him seem insane. Not so, he is attacking you to show his followers his power and control over those who dare show his phony nature.

            g*e*r*a*n is Joe Postma’s bulldog. His goal and purpose is to look at climate blogs, find rational physics presented, and then attack it with his various programmed mentality. The goal is to discredit those showing actual physics. First his uses Joe’s word “pseudoscience” often (not that he actually know what it means or how to use it properly). Then he makes fun of things with his patented “hilarious” (I think Postma also uses this against those who might show his blind followers the truth…Postma is in it for power and control and has little interest in truth or science).

            g*e*r*a*n also is super tuned to any spelling error or a math error. He will jump on these to try and discredit the poster. It is all manipulation.

            Neither g*e*r*a*n nor SkepticGoneWild are the least bit interested in the truth or science or physics. They have one goal and that is to find disciples on various climate blogs to grow Joe’s Cult. That is why you will never get anywhere with these two. They have a completely different motive.

            By interacting with them you speak to the choir. We already know the real physics. They work to discredit you to find disciples.

            Not much you can do about it. Keep posting real physics. The people that follow Postma don’t know physics anyway.

            Both the recruiters have to be nicer on this blog as they might get banned if they go full “Postma” type attacks. It is there but subdued.

          • gammacrux says:

            The ONLY heat transfer is from blue to green.

            So our beloved hilarious buffoon finally made a decision: He violates the second rather than the first law of thermodynamics.

            So sounds the latest news from clown fissics: heat flows between two bodies at same temperature. How does the heat know which direction it has to flow ? Simple it has to ask our
            clown fissicist. Depends on his mood.

            Clausius is flabbergasted in his grave.

            gamma brings in more comedy

            I’m jealous. Our hilarious buffoon sounds so hollow and does a so much better job in this respect.

          • g*e*r*a*n says:

            Hey the con-man showed up.

            Norm, if I’m a “bulldog”, that makes you an emasculated three-legged yelping chihuahua.

            I laughed at the 500-word ramble, but as I’ve indicated before, always throw in some pseudoscience.

            That’s when you’re really hilarious.

            @Gamma, I did like your errors regarding the laws of thermo–classic pseudoscience.

          • Norman says:

            g*e*r*a*n

            The really sad thing is that you believe yourself to be knowledgeable of physics but make up your own ideas and push them as fact and call real science pseudoscience to manipulate the uninformed.

            I asked you on another thread (you won’t answer except for you foolish taunts and the use of the word pseudoscience and hilarious). You said the radiant heat transfer equation does not apply to powered systems. What? Where do you dredge up your phony misleading ideas from.

            HERE YOU STATE: The common mistake here is trying to use equation 1, in this situation. Equation 1, often called the radiative heat transfer equation, fails in this case where a constant power source is involved. Thats why the solution ends up with the temperature of the sphere being a factor of the fourth root of 2 (1.189) higher than the temperature of the shell.

            That violates both 1LoT and 2LoT!”

            Very stupid but might convince some scientific illiterates. You are a phony person and that is what I wrote to Tim Folkerts about. If I see you posting your false and misleading cult physics, I will correct all your flaws and intentionally distortions. You are the Con-Man

            It seems you “skeptics” all need to make up your own physics and peddle it on the few sights that allow your material to be presented. A good skeptic would use real and correct physics (they would also know it, which you do not and are not able to learn the truth)

            I like how you are an Orwellian double writer. You twist the truth so you label Real Science as pseudoscience (Freedom is Slavery) and you the biggest of all Con-Man call me a con-man when I am most open with the science I post and link to the sources I get it from (which is something you do not do because you are a complete fraud and phony). Hopefully the more you post the more people will see how much a Real con-man you are and how much of a fraud you are.

          • g*e*r*a*n says:

            Another rambling rant from the trembling chihuahua!

            Hilarious.

          • Nate says:

            Norman,

            I just had the Postma experience myself. Wow! And he even changed my comment to agree with him!

            http://www.drroyspencer.com/2017/11/uah-global-temperature-update-for-october-2017-0-63-deg-c/#comment-272683

        • SkepticGoneWild says:

          Tim,
          Thought experiments are not science. Hello! McFly!

          • Tim Folkerts says:

            SGW, This is simply a “homework problem”. Apply standard textbook physics to a simple situation and get an answer.

            What answer do you get? Show your work!

          • des says:

            Tim
            This guy has already shown a willingness to boast about his supposed understanding of science, but an unwillingness (read that as INABILITY) to demonstrate this ‘knowledge’ by answering questions with simple calculations that he can’t simply copy/paste from some denier website. Instead he comes up with pithy throw away lines like “hello McFly” to disguise his shortcomings.

        • Norman says:

          gammacrux

          https://www.youtube.com/watch?v=6Z8ZQ3kTSK0

          Here is a video representation of g*e*r*a*n. Maybe not the one and same person but when I watch this I think I am seeing g*e*r*a*n with his attitude of being so damn funny, so funny he can’t even tell us about it because he would die from laughing. Similar to his knowledge of physics, if he told us about it he would zap his brain from his brilliance (not!).

          I guess he provides amusement on what could be a useful science blog and exchange of rational ideas and concepts.

          • g*e*r*a*n says:

            Finished washing the dishes early today, huh Norm?

          • Norman says:

            g*e*r*a*n

            Have you been able to come up with new material? You have used that line already numerous times. Maybe you should take some time to study real physics and see why your arguments are not valid.

            An object at 100 C radiates based only upon its own temperature. If you have two plates in a vacuum at 100 C you can’t magically have one radiating heat while the other does not. There is no mystic communication between the two surfaces that informs them that one plate has an energy input and the other does not. Magic physics that you just make up. Nothing in real physics even comes close to your absurd notions of reality. Just like Gordon, you make up your own physics. You both are delusional as you think your made up physics is real and the actual physics is false. Awesome delusional abilities. You can sustain such a state for very long periods of time and even after many people have clearly explained why your thought processes are flawed.

          • g*e*r*a*n says:

            Yup, Norm finished early. He’s a speedy dishwasher.

          • Norman says:

            g*e*r*a*n

            And you still won’t explain how you came up with this thought.

            YOU: “The common mistake here is trying to use equation 1, in this situation. Equation 1, often called the radiative heat transfer equation, fails in this case where a constant power source is involved.”

            Where do you get this nonsense from? You just made it up and call it good.

            Why do you feel compelled to make up physics and pretend you know what you are talking about. You may be 65 years old but your mental age is considerably lower.

          • g*e*r*a*n says:

            Con-man, it is not my job to teach you physics. But if you ever get to actually study physics someday, you will learn that if some equation gives a result that violates the laws of thermodynamics, then you have made a mistake somewhere. It is your job to find your mistake. It’s a learning experience.

            In this blue/green plate scenario, the ONLY incoming energy is the 400 Watts to the blue plate. That’s it. There ain’t no more.

            And the MAXIMUM temperature the 400 Watts can raise the blue plate to is 244K. That’s it.

            So, trying to claim that the “back-radiaton” from the colder green plate can somehow raise the blue plate higher than the S/B value is PSEUDOSCIENCE.

            You’re WRONG. I’m RIGHT. Nothing new.

            Now, more rambling, ranting, yelping insults, please.

          • Norman says:

            g*e*r*a*n

            You do not know physics as much as you think you do. You are a pretender and will always be such until you study real physics.

            YOUR STATEMENT: “And the MAXIMUM temperature the 400 Watts can raise the blue plate to is 244K. Thats it.”

            Complete ignorance of the laws of thermodynamics. You just can’t comprehend them. You are good at pointing out typos and math errors (surface things) but you are unable to comprehend concepts.

            Your statement is completely flawed and not based upon any understanding of the physics of heat transfer. When you rely on your own made up science it will eventually not work for you.

            So if you put thick insulation on the opposite side of the blue plate in your understanding of thermodynamics it would not matter, the surface of the blue plate would still only reach 244 K. You have no clue of just how ignorant you and Postma’s cult are.

            If only a trickle of energy left the back side because of insulation the front surface would approach 289 K depending upon how good your insulation was. You cannot understand the surface temperature is not some fixed item in a dynamic system (one with continuous input energy). The temperature can rise to many different temperatures.

            The only thing your post proves is you really are ignorant about science. You are not right about much on your posts. Sometimes you get lucky and will say a correct comment but it is rare and I would think accidental on your part.

          • Norman says:

            g*e*r*a*n

            This would be a good theme song for Postma Cult

            Voice of the Cult by Chastain
            https://www.youtube.com/watch?v=Oc88DU8dzQg

          • g*e*r*a*n says:

            Norm, you proved me right again!

            And, enjoyed the “rambling, ranting, yelping insults”.

            Hilarious.

          • David Appell says:

            Some people will deny that a blanket keeps you warm at night.

            But you can be sure they all use them.

          • g*e*r*a*n says:

            Davie, who denies that blankets help keep you warm?

            You’re not just making things up, are you?

          • Norman says:

            g*e*r*a*n

            Can you clarify your statement: “Norm, you proved me right again!”

            I would think I proved you are clueless about how heat transfer works and you make up stuff about it that is not rational or based upon logical thought process.

            So what are you right about. I have not seen anything yet except for you yapping. Did Joe Postma give you a doggie treat?

          • Norman says:

            g*e*r*a*n

            I am reading some more of your Master’s crap physics. You are wrong, he uses pseudoscience quite often. Even in his testimony about himself.

            Your Boss: “Q between the Earths surface and Earths atmosphere is positive, meaning that heat is flowing from the warmer surface to the cooler atmosphere. Their other argument attempting to explain the mechanism of back-radiation is that making Q less positive will increase the temperature of the warmer surface. This is a complete fabrication and pseudoscience of thermodynamics, and here is where their argument reduces to Zenos Paradox. Q is supposed to become less positive, in fact it is supposed to go to zero, but if in doing so this increased the temperature of the warmer object, then this would also increase the temperature of the cooler object, and then you effectively have Zenos Paradox or a variation on it (you never reach the end because the finish line of Q = 0 is itself running away from you).”

            Note the pseudoscience. He is lame. He is unable to understand that the atmosphere is radiating in two directions. Toward the surface and out to space. It won’t continue to warm indefinitely, the surface will warm to a point that the energy it is receiving equals the amount that is leaving.

          • Norman says:

            g*e*r*a*n

            Here is how your Master twists physics into a tangled loop of nonsense.

            JOSEPH: “As for the shells interior emission, it cannot act as heat and thus warm the sphere since the sphere is always producing more power or at most (at equilibrium) an equal amount of power that the shell emits. To raise the spheres temperature from emission from the shell would require positive heat flow from the shell to the sphere, but this is never possible because at most the shell emits the same power as the sphere, and never more than the sphere. To raise an objects temperature requires either work performed on it or heat transferred into it, and the shell doesnt perform work on the sphere and it can never send a net difference positive balance of power as heat to the sphere.”

            If the outer shell prevents heat flow from the surface of the sphere (which it would) because of back radiation it does not have to heat the sphere to warm it. The sphere has a heat source. He absolutely demonstrates his inability to understand the GHE. He just can’t do it, neither can his faithful dog (you).

            So the shell is not adding heat to the sphere. We all get this, no one disputes it. But the backradiation prevents heat from leaving the sphere (it radiates the same but now is absorbing more energy from the shell…not heat just energy…Heat is NET energy). The energy supply to the sphere is what raises its temperature when the amount of energy that is leaving the sphere is reduced.

            You can understand it with insulation but your mind goes blank when radiation achieves the same effect as insulation would do. Lower the amount of energy that is leaving the sphere surface.

          • gammacrux says:

            Norman,

            You can lead a donkey horse to water but you can’t make it drink.

            And don’t bother, when our hilarious buffoon talks about dishwashing, be sure that for once he knows what he talks about. His mother in law wouldn’t tolerate the buffoon not doing tamely the donkey work.

          • g*e*r*a*n says:

            Wow Con-man, you must have worked all evening composing your three vapid comments!

            All that pounding on the keyboard, and nothing to show for it. Reminds me of “The Shining”. The worms in your head are definitely taking over.

            And, you still can’t seem to figure out why “you’re WRONG, and I’m RIGHT”!

            Hilarious.

          • g*e*r*a*n says:

            gummycrud, that’s still somewhat lame. You need to study Norm’s technique more to get to the hilarious level. Keep trying.

          • Kristian says:

            Norman says, November 6, 2017 at 10:06 PM:

            If the outer shell prevents heat flow from the surface of the sphere (which it would) because of back radiation it does not have to heat the sphere to warm it.

            You STILL don’t get it, Norman!

            It doesn’t prevent heat flow “because of back radiation”. That is tantamount to saying that the addition of “back radiation” directly raises its U and T, exactly equivalent to what the addition of heat from its heat source does.

            THIS is what g*e*r*a*n objects to. And rightfully so. You cannot DESCRIBE the thermal (thermodynamic) process of insulation as one of ADDING energy. That’s a DIFFERENT thermal (thermodynamic) process, called HEATING.

          • Norman says:

            Kristian

            Yes that is exactly what I am saying it does. Same thing all textbooks say. Backradiation is an energy source to a surface.

            The process of absorbing radiant energy and emitting it are two different events. They do not have to occur at the exact same time, only overall will there be a macroscopic flow both ways.

            Molecules at higher vibrational energy will be the ones emitting the IR away from the surface. Molecules at lower energy levels will absorb IR hitting the surface and translate it into kinetic energy of the objects molecules to be distributed throughout.

            You have made up your own physics based upon your own understanding and you never support it with any outside material. I have asked you to support it numerous times and to date you have not.

            Here is another example to show how flawed your ideas are (not that you can accept this as proof).

            At night I was looking at a tree illuminated by a streetlight. The light was behind me. The energy of the light struck the tree and was reflected backwards toward me against the gradient of the light. There is no coupling of photons into a gas or cloud. There are two macroscopic detectable flows, the flow from the light that hits the tree and the flow of photons that bounce off the tree moving against the original flow and reaching my eyes to be detected. Same with IR. Take an FLIR instrument and have a heated object in the room (powered) that is warming all the other objects. You can stand between the heater and the other objects and point the FLIR at the objects and the energy they are emitting will be detected by the FLIR. There is no merging of photons into a one way cloud that flows only from hot to cold. Each object is emitting its own radiant energy away from it, each object produces its own macroscopic energy flow away from it that is most easily detected by multiple methods. If you were a snake you could see the objects directly.

          • Norman says:

            g*e*r*a*n

            A challenge for you. I do not think you are able to accept it.

            YOU STATE: “And, you still cant seem to figure out why youre WRONG, and Im RIGHT!

            So inform me since I can’t figure it out. I know you won’t be able to because you are dealing in Postma’s made up physics and it is not supported by any real physics.

            Good luck convincing me I am wrong. I doubt you will be able to since I base my ideas on real and valid physics.

          • Kristian says:

            Norman says, November 7, 2017 at 11:32 AM:

            So inform me since I can’t figure it out.

            You have been informed, Norman. Again and again and again and again. But like you say, you just can’t figure it out, no matter how many times it’s explained, no matter how many times it’s spelled out for you. Your obvious full-blown mental block on this particular subject simply prevents you from ever getting there …

          • Kristian says:

            Norman says, November 7, 2017 at 11:32 AM:

            (…) I base my ideas on real and valid physics.

            No, you don’t. That’s precisely what you DON’t do. You THINK you understand the physics. But you don’t. You simply lack the basic understanding needed to enable you to connect the dots, Norman. I’m sorry, but you’re one of the more persistently and stubbornly confused human beings I’ve ever come across.

          • Ball4 says:

            “The energy of the light struck the tree and was reflected backwards toward me against the gradient of the light.”

            Instruments can detect the spectrum of the reflected light emitted at high T and the spectrum of the light emitted at the T of the tree going into your eye.

            Those instruments then detect the amount of emitted and reflected light reaching your eye. For natural objects measured this way order of 95% will be found emitted (emissivity) by the tree and order of 5% reflected (reflectivity) from the tree.

            For more reading on the terms: William L. Wolfe, 1982: A proclivity for emissivity. Applied Optics, Vol. 21, p. 1. Wolfe’s parting shot is “On reflection, I like reflectivity and emissivity”.

            For the usual contrarians around here, yes, there is a contrary view: see Joseph C. Richmond’s follow-up to Wolfe’s letter. If the term emittance is to be used at all it is best reserved as an abbreviation for emitted irradiance (or radiance).

            Note that radiometric and photometric dimensional quantities(radiance, irradiance, luminance, etc.) all end in ance, and hence in the same spirit emittance ought to be emissivity times the Planck function.

          • Norman says:

            Kristian

            You have not given any supporting evidence for your view. You have stated your opinion many times. You have never linked to an established science source that makes the claims you do. The established science says exactly opposite of what you say.

            Established science: Every object with a temperature emits radiant IR. The rate of emission is based only upon its temperature and emissivity and area of surface, nothing else. It does not matter what else is around it, only its own internal temperature determines its rate of energy flow. You have created this merging photon cloud and believe it to be true. It is your own invention. If your idea had even the slightest reality you would not be able to see any objects at all as the photons from any object would not have a unique macroscopic flow that is visible.

            Support your claims with established science. Your opinion is pointless and is not believed. I want actual proof of your claims. You have NOT done this at all. You link to your own blog. You have no experimental evidence to support your claims. My ability to see individual objects in a room rejects your claims completely.

          • Nate says:

            G* and SGW might find this helpful.

            https://www.youtube.com/watch?v=bVV2Zk88beY

  57. ren says:

    “High temperatures in the 20s and 30s F across the Dakotas and Minnesota will fall into the single digits and teens at night.
    Anyone spending time outside, especially in the evening or early morning hours, will need to bundle up to avoid the risk of cold-related illnesses. Pets should not be left outside for long periods of time.”

  58. Werner Brozek says:

    Hello des

    Partly due to the fact that RSS was really late last month, that article is much later than I expected it to be. But if all goes as planned, it will appear on WUWT on Tue Nov 7th at 8:00 AM Mountain Time.
    Now that October is in, were you by any chance planning to do a Top 10 first-10-months-of-the year?

  59. des says:

    Warmest 10 UAH Octobers on record:

    1. 2017 (+0.63)
    2. 2015 (+0.43) … EL NINO
    3. 2016 (+0.42) … EL NINO affected
    4. 1998 (+0.40) … EL NINO affected
    5. 2003 (+0.28)
    6. 2005 (+0.27)
    7. 2014 (+0.25)
    8. 2012 (+0.23)
    9. 2006 (+0.22) … El NINO
    10. 2010 (+0.20)

    October 2017 was 0.35 second warmest non-El-Nino-affected October

    Warmest 10 first-10-months-of-the-year:

    1. 1998 (+0.542) … EL NINO
    2. 2016 (+0.541) … EL NINO
    3. 2010 (+0.375) … EL NINO
    4. 2017 (+0.371)
    5. 2015 (+0.238) … EL NINO
    6. 2002 (+0.224) … EL NINO
    7. 2005 (+0.211) … EL NINO
    8. 2007 (+0.191) … EL NINO
    9. 2003 (+0.169) … EL NINO
    10. 2014 (+0.168)

    Jan-Oct 2017 was 0.203 warmer than second warmest non-El-Nino-affected first-10-months-of-the-year

    Average for last 5 years (Nov 2012 Oct 2017): … +0.285
    Average for last 5 years at same point after 97-98 El Nino (Nov 1994 Oct 1999): … +0.109
    NO PAUSE

  60. gbaikie says:

    I will give it another go.

    I think that oceans covering 70% of the Earth surface, warm the rest of the world. And I think the land surface cool the rest of the world.
    Ocean surface have higher average temperature, about 17 C, as compared to land surfaces, about 10 C.

    The tropical ocean which gets more sunlight, does most of the ocean warming of the rest of the world.

    Other than ocean are warmer and must warm what is cooler, and cooler doesn’t warm warmer, just as starting point. Another thing is the warmer oceans since they are averaged with land temperature cause number of what is the earth average temperature to be 15 C.
    Or ocean dwellers are living in a “world” of average temperature of about 17 C, and land dwellers are living in a “world” of average temperature of about 10 C.
    Or dweller of the tropical zone, are living in world of average temperature of about 27 C. And rest of world is living close to an average temperature pretty close to freezing- and would well below freezing if not warmed by the oceans, especially the tropical ocean.

    So what I am saying so far isn’t why oceans are warmer or why land is colder.
    So tropics have higher average temperature than rest of the world, tropics is 40% of earth surface, that warmer region increases the entire class’s average score- or increase the average temperature.
    And of course simply because tropics is warmer, it will warm cooler regions, and cooler region aren’t going to warm the tropics- or if “doing anything” to tropics they are cooling it. But generally tropics isn’t cooled much by colder regions- just like a furnace isn’t cooled by the cold rooms it’s heating.
    Now, it is rather amusing that Europeans could imagine their “life style choices” could be warming the tropics.
    I am laughing too much, I will stop here.

    • des says:

      Yes your comment was funny wasn’t it.

      • gbaikie says:

        Yes.
        The ocean is warm because the ocean absorbs about 90% of all sunlight coming to earth.

        Were ocean not absorbing more energy than land or absorbed
        an equal amount, simply due to ocean being 70%, the ocean would absorb about 70% of all sunlight coming to earth- assuming land and ocean was equally distributed.
        And ocean and land are not equally distributed. The ocean cover about 80% of the tropics, and tropics receive more sunlight than the rest of the world.
        The oceans also dominate the southern Hemisphere, and southern
        hemisphere due to the axis tilt when Earth is closest to the sun [Jan 4] gets more sunlight. At top of atmosphere the difference is 1,413 watts vs 1,321 watts:
        https://en.wikipedia.org/wiki/Sunlight

        It should be noted that very significant feature of the southern hemisphere is the continent of Antarctica which has average temperature of about -50 C.
        The cooling effect of Antarctica is well known and this continent’s location is major factor of why our current climate is called an icebox climate.
        To be dramatic, it’s a giant vortex sucking heat from the rest of the world [nearest being the rest of the southern hemisphere]. How it does this is topic of quite a few scientific papers. But quantity of papers should make you assume that the mechanism is well understood. Or you should assume the opposite- it’s a bit of mystery- needing further study, etc. There is general agreement that if Antarctica is cold, the rest of world is warm. Or the opposite, if Antarctica is warming, the rest of world is cooling.
        Or the continent itself has no way to warm it’s itself, it must take heat to warm. Or one look at in sense that because it’s so cold, it doesn’t radiate much heat into space so it’s coldest is a global “warming mechanism”.

        But really the antarctic is not an oddity, all land surface do this, it’s just Antarctic does it best among all other land masses.

        • Gordon Robertson says:

          gbaikie…”The ocean is warm because the ocean absorbs about 90% of all sunlight coming to earth”.

          That inconvenient truth is omitted from the thought experiment perpetuated by climate alarmists when they espouse their metaphorical theory of the GHE. It’s obvious that the oceans are supplying the heat credited falsely to the GHE.

          Without the oceans, even the alarmists admit the world should be 33C cooler. Unfortunately they have gotten hung up on gases that average out to 0.3% of the atmosphere while ignoring fluids that account for over 70% of the surface area.

          If the data is solid that October 2017 was as warm as declared, it was the oceans causing the warming, nothing else.

          • David Appell says:

            And what is causing the oceans to warm? What is their heat source?

            https://is.gd/H9wXag

          • g*e*r*a*n says:

            Davie, “It’s the Sun, stupid”.

          • gbaikie says:

            –g*e*r*a*n says:
            November 6, 2017 at 7:53 PM

            Davie, Its the Sun, stupid.–

            That is the most obvious.

            I think in the past there could have been, a significant
            geothermal component and I wouldn’t at the present time, rule out some degree of minor effect from geothermal heat.

            But in term of the big picture, it has been and is the Sun.

            What other source energy could it be?

            In regards to possible minor effect from geothermal heat. I say in terms average ocean of about 4 C, it’s likely less than 1/10th of degree, and in terms average surface temperature of 17 C, less than 1/2 degree.

            Or similar to CO2, probably not enough be measurable, in terms of global temperature, but unlike CO2, the geothermal warming of a large chunk of the ocean could be measured. If large fluctuation of the increase or decrease geothermal heat output.
            [I had to look, and something like the Juan de Fuca Ridge seems to have such fluctuation:
            https://en.wikipedia.org/wiki/Juan_de_Fuca_Ridge
            http://www.divediscover.whoi.edu/expedition8/
            And btw, Vents around the world:
            http://www.divediscover.whoi.edu/vents/vent-world.html

            Also thinking that Juan de Fuca Ridge could be site to harvest geothermal energy. It’s fairly to population which use the energy harvested.

          • Kristian says:

            David Appell says, November 6, 2017 at 7:13 PM:

            And what is causing the oceans to warm? What is their heat source?

            g*e*r*a*n says, November 6, 2017 at 7:53 PM:

            Davie, “It’s the Sun, stupid”.

            Yes, this is getting stupid. It is SOOOOO obvious what’s behind the warming of the oceans. Look at the DATA, people!

            Heat INPUT (ASR) to the Earth since 2000:
            https://okulaer.files.wordpress.com/2017/10/asr.png

            Heat OUTPUT (OLR) to the Earth since 2000:
            https://okulaer.files.wordpress.com/2017/10/olr.png

            Earth’s net flux (ASR minus OLR) since 2000:
            https://okulaer.files.wordpress.com/2017/10/net.png

            Heat IN has gone steadily up. Heat OUT has not simultaneously gone steadily down, but up as well. The net has increased. Gee, I wonder what might be the cause …?

          • David Appell says:

            No, it’s not the sun. For the Nth time, the total energy the sun delivers to the Earth has been slowly decreasing since the 1960s. Look at the data, people:

            http://spot.colorado.edu/~koppg/TSI/TIM_TSI_Reconstruction.png

          • PhilJ says:

            DA,
            You are mistaken that solar activity decreased after 1960
            In fact the latterhalf the 20thcentury had extremely high solar activity as measured by SSN..
            It is now referred to as a grand solar maximum … Unsurprisingly global temps rose as a result ..
            We have just recently (last 15 years or so) returned to SS levels not seen since the early 20th century ..

          • Svante says:

            Kristians graph had the ASR, not the TSI.

            Are we looking at feedbacks?

            Sir Isaac had a good explanation here:
            http://www.drroyspencer.com/2017/10/uah-global-temperature-update-for-september-2017-0-54-deg-c/#comment-267830

            “shortwave radiation takes over the heavy lifting in global warming”

          • Kristian says:

            Svante says, November 7, 2017 at 5:03 PM:

            Are we looking at feedbacks?

            No, we’re not looking at feedbacks. We’re looking at the driver of global warming.

            Sir Isaac had a good explanation here:
            http://www.drroyspencer.com/2017/10/uah-global-temperature-update-for-september-2017-0-54-deg-c/#comment-267830

            “shortwave radiation takes over the heavy lifting in global warming”

            No, he did not have a good explanation. My responses back then:
            http://www.drroyspencer.com/2017/10/uah-global-temperature-update-for-september-2017-0-54-deg-c/#comment-267927
            http://www.drroyspencer.com/2017/10/uah-global-temperature-update-for-september-2017-0-54-deg-c/#comment-267934

          • Svante says:

            “The finding was a curiosity, conflicting with the basic understanding of global warming”

            “I think the default assumption would be to see the outgoing longwave radiation decrease as greenhouse gases rise, but that’s probably not going to happen”

            “We would actually see the a*b*s*o*r*p*t*i*o*n of shortwave radiation increase. Will we actually ever see the longwave trapping effects of CO2 in future observations? I think the answer is probably no.”

          • Kristian says:

            Svante says, November 8, 2017 at 1:29 AM:

            “The finding was a curiosity, conflicting with the basic understanding of global warming”

            “I think the default assumption would be to see the outgoing longwave radiation decrease as greenhouse gases rise, but that’s probably not going to happen”

            “We would actually see the a*b*s*o*r*p*t*i*o*n of shortwave radiation increase. Will we actually ever see the longwave trapping effects of CO2 in future observations? I think the answer is probably no.”

            Yes, far into the future. Read the paper. Up until today, the positive radiative imbalance at the ToA is claimed to derive ENTIRELY from reduced OLR (-0.8 W/m^2) while ASR is rather assumed to have contributed negatively (-0.2 W/m^2).

            You need to actually read ALL of what is written, Svante, before jumping to conclusions.

            And again, the “hypothesis” says that we shouldn’t actually observe a positive imbalance at the ToA from an “enhancement of the GHE”. This would only occur in the event of an abrupt immense increase in the atmospheric content of IR-active gases, like from some huge pulse being injected overnight, the classic scenario being a doubling of CO2. This, however, isn’t what is happening in the real world …

          • Svante says:

            Kristian,
            You were right, I hadn’t read the paper. Now I have and you are right again.

            OLR recovery could have taken one or a few decades if it hadn’t been for aerosols.

            Still:
            “global energy accumulation dominated by enhanced ASR could occur with only 0.5 K global warming above present” (that was 2014 – look at the graph at the top of the page).

            Is it possible that both ASR and OLR are going up now in pursuit of this future state, i.e more imbalance before, less now?

          • Svante says:

            Like year 20 or 58 in figure 1D.
            A negative OLR anomaly, OLR is rising, and so is ASR.

        • gbaikie says:

          Things which I think are interesting [or not properly measured as far as I am aware]:
          The amount of indirect sunlight.

          Wiki says at noon clear skies when sun is near zenith there is about 1050 watts of sunlight and if include indirect sunlight
          about 1120 watts of sunlight.
          By itself 70 watts per square meter of indirect sunlight isn’t going to warm a blackbody by much.

          Or lets increase the amount of indirect sunlight to 700 watts per square meter- this also isn’t going to warm a blackbody surface by much. Or without doubt 700 watts of direct sunlight will warm a blackbody. In vacuum – 333.3 K [60 C].
          So 700 watts of indirect sunlight in vacuum will not warm a blackbody to 60 C, nor 50 C.
          Nor can the diffused or indirect sunlight be magnify like direct sunlight can be.
          But I would argue that 700 watts of indirect sunlight would warm water as much as direct sunlight does.
          And apparently solar panel can absorb energy from indirect sunlight and make electrical power or solar panel do work a bit if day is cloudy. Plus when cloudy where solar panel are pointing towards doesn’t matter as much as it does as compared with direct sunlight.

          In tropics on clear day and the sun is near zenith for 6 hours and would roughly would get about 1000 watts of direct sunlight and roughly 70 watts of indirect sunlight.
          And when sun is further than 45 degree away from zenith- before 9 am and after 3 pm, one starts getting significant less direct sunlight- because sun is going thru more atmosphere and diffusing more sunlight, so one gets a higher percent of indirect sunlight compared direct sunlight.
          And this also applies when it’s cloudy in the tropics- less direct more indirect sunlight as compared to direct sunlight.

  61. barry says:

    Found a nice page of recent hurricane ACE values.

    http://tropical.atmos.colostate.edu/Realtime/index.php?loc=northatlantic

    Atlantic hurricane ACE values for Sept and Oct.

    Sep: 178.1
    Oct: 20

    You can do a global account, too, by totting up NH and SH ACE for Sept and Oct:

    http://tropical.atmos.colostate.edu/Realtime/

    What you’ll find is that Sept had a much higher ACE than Oct.

    The energy transferred from the ocean to the lower trop occurs in real time. It seems that hurricanes can’t explain the high October anomaly. September should have been much higher if hurricane ACE has a noticeable impact on globall temps.

    • g*e*r*a*n says:

      barry states: “The energy transferred from the ocean to the lower trop occurs in real time.”

      Yes, but that energy can take weeks/months to move to space. Hence October sat temps would reflect the higher values. It was predictable.

    • barry says:

      Predictable?

      g*e*r*a*n: My “best guess” range is 0.35 to 0.45 C. I chose the upper end of the range (+0.44 C) knowing that all the hurricanes would have a slight effect.

      Last month it was a “slight effect”, and you predicted a lower October anomaly than September (0.54). Your prediction went the wrong way (so did mine).

      Where did the heat hide from TLT in September?

      You may note from the above article that tropical temps went down from Sept to Oct. Soon we will have the regional temps for October and we’ll see which parts of the globe were hot.

      • g*e*r*a*n says:

        barry, the fact that the hurricane season would boost troposphere temps was predictable. I under-estimated that effect. But, the fact the the effect was so large is evidence of that effect.

        You are desperately trying to close your eyes to that fact.

        • Mickey Prumt says:

          But hurricane season is … every year.
          And your favorite dataset tell us there is a record high this month.

          So hurricane activity was a record high too ?

          Please, show us how smart you are.

        • des says:

          It’s funny how Roy the meteorologist is perplexed over the latest anomalies but hacks with no background in the subject matter claim it was predictable. He has already stated that it is extremely unlikely that hurricanes have this kind of effect.

          • Sir Isaac Snapelton says:

            Remember, this is coming from someone who believes cosmic dust is responsible for sea level rise.

          • Sir Isaac Snapelton says:

            (Talking about g*e*r*a*n)

          • gbaikie says:

            –Sir Isaac Snapelton says:
            November 6, 2017 at 1:55 PM

            Remember, this is coming from someone who believes cosmic dust is responsible for sea level rise.
            Sir Isaac Snapelton says:
            November 6, 2017 at 2:04 PM

            (Talking about g*e*r*a*n)–

            That tells me that G is secret believer that CO2 causes some
            warming. Or if billions of tonnes of “cosmic dust” can raise sea level, then billion of tons of CO2 can warm Earth.

          • g*e*r*a*n says:

            That’s not an accurate statement, snake. But then, who would expect accuracy from a 12-year-old?

          • David Appell says:

            Your need to insult everyone shows insecurity and a lack of confidence.

        • barry says:

          But, the fact the the effect was so large is evidence of that effect.

          Circular reasoning in one sentence.

          • g*e*r*a*n says:

            barry, it’s okay with me if you want to disregard the heat energy released by the hurricanes.

            It’s just funny how much you must disregard, to keep your belief system alive.

          • des says:

            grangran
            Does Roy Spencer ‘disregard’ this?

          • barry says:

            its okay with me if you want to disregard the heat energy released by the hurricanes

            Warm air in a hurricane rises up through the troposphere, causing cold air to be sucked inwards at the bottom, which creates winds and the gyre. Hurricanes release their heat to the troposphere up to the stratosphere continuously after they’ve formed. The heat transfer from ocean to the lower and upper trop occurs near-instantaneously.

            What I’m disputing is that:

            1) there is a lagged response in tropospheric temps.

            2) the effect is a significant addition to the global tropospheric average.

            I’ve done some preliminary investigation on your claim. My provisional conclusion is that it doesn’t stack up.

            In reply, your defense of your position amounts to, “it’s obvious.” Do you have more to corroborate what you’re claiming than assertion?

            Have you figured out how much energy would be required to heat the atmosphere by, say, 0.1C, and then checked the global ACE figures for September against that?

            That would be something.

            Can you explain with some physical mechanics why there would be a lag, and how long it should be?

            You may be interested in temperature readings by altitude in the core of a hurricane.

            http://citeseerx.ist.psu.edu/viewdoc/download?doi=10.1.1.395.2491&rep=rep1&type=pdf

            Hurricanes are warmest at an altitude of about 5.5 km. That’s ear the middle of the altitude range captured by UAH lower trop. (Image created by Dr Spencer)

            How can there be a lag if a hurricane is putting the heat directly into the lower trop while it’s active?

            Do you have anything concrete – studies, reports, expert opinion – to back up what you’re saying?

            How will you turn your speculation into fact?

          • g*e*r*a*n says:

            barry, what a well thought-out comment. It’s my pleasure to respond.

            You’re interested in:

            1) Is there a lagged response in tropospheric temps?

            2) Is the effect a significant addition to the global tropospheric average?

            The vast majority of heat energy, that a hurricane “pulls” from the water, is latent heat. The latent heat is not released into the atmosphere until condensation occurs. So, yes, there is a lagged response, just to when condensation happens. At that time, the heat energy is still in the atmosphere. It must then get to space. The current “consensus” appears to be that heat energy, in the Northern Hemisphere is transported toward the pole by the Ferrel cell. This process is largely convection, but conduction and radiation are also occurring simultaneously. The end result is that the bulk of heat energy that was removed from the tropical waters gets radiated to space at a much higher latitude. (Of course, the same action (only geographically reversed) happens in the Southern Hemisphere, for the cyclones that occur there.)

            I have seen some evidence that this total transfer time can take up to 3 months, depending on where the hurricane moved, and all of the subsequent winds. So, if you have several hurricanes, close in time, their total heat capacities could definitely affect temperature averages.

            Again, you don’t have to believe any of this. I just wanted to take the time to respond to someone that is not behaving like a 12-year-old. That’s rare.

          • barry says:

            Thanks for taking on point 1).

            The vast majority of heat energy, that a hurricane pulls from the water, is latent heat. The latent heat is not released into the atmosphere until condensation occurs. So, yes, there is a lagged response, just to when condensation happens.

            Condensation is continuous from the time the storm forms, until the storm dissipates over land, cut off from its source of energy. The major hurricanes of September dissipated by the end of the month (Maria dissipated by Oct 3), and that heat was already in the lower troposphere.

            At that time, the heat energy is still in the atmosphere. It must then get to space.

            The heat energy is in the lower and upper troposphere by this time (some in the stratosphere). By the time the storms dissipate, that energy has already been transferred to the atmospheric zone measured for temps by MSUs. I can’t see a month-log (or 3-month long) lag here WRT to TLT.

            The end result is that the bulk of heat energy that was removed from the tropical waters gets radiated to space at a much higher latitude.

            UAH TLT is not measuring temps at the point of escape of radiation to space. It is an attempt to measure temps at the lowest possible zone of tropospherc atmosphere, centred around 4km altitude.

            You can see this zone and its weighting by altitude in the graphic provided by Dr Spencer (dotted line).

            http://www.drroyspencer.com/wp-content/uploads/MSU2-vs-LT23-vs-LT.gif

            You briefly touch on point 2…

            So, if you have several hurricanes, close in time, their total heat capacities could definitely affect temperature averages.

            From what I’ve gathered reading around, the total energy fueling a hurricane, even 10 hurricanes, is several orders of magnitude smaller than what it would require to raise the temperature of the lower troposphere by 0.1C.

            Have you read anything – with some actual values pertaining to this matter – to lead you to believe that the energy transferred by hurricanes from the ocean to the atmosphere is a significant fraction of what it would take to raise global TLT?

            This would be a first order requirement to corroborate your view.

          • g*e*r*a*n says:

            barry, let me correct some of your misconceptions:

            “Condensation is continuous from the time the storm forms, until the storm dissipates over land, cut off from its source of energy.”

            Nope. The condensation continues until it stops. Check rainfall totals over Houston area after Harvey. Then follow those totals all the way to Tennessee. The latent heat is being released all during that time.

            “By the time the storms dissipate, that energy has already been transferred to the atmospheric zone measured for temps by MSUs. I cant see a month-long (or 3-month long) lag here WRT to TLT.”

            Nope. The heat energy will be measured by the MSUs, again and again, until it moves out. As heat energy leaves the surface, it warms the atmosphere. It continues to warm the atmosphere until it moves to space. The sats just measure the temps they “see”.

            “UAH TLT is not measuring temps at the point of escape of radiation to space.”

            Nope. I never indicated as such. I hope you are not trying to be tricky.

            “From what Ive gathered reading around, the total energy fueling a hurricane, even 10 hurricanes, is several orders of magnitude smaller than what it would require to raise the temperature of the lower troposphere by 0.1C.”

            One kg of water releases about 2,200,000 Joules, upon condensation. Estimate all the rainfall, and convert to energy released. Then realize that that heat energy must then be transferred to space. That transfer is not instantaneous. Before the energy can move on, more heat energy, from subsequent hurricanes, adds.

            “Have you read anything with some actual values pertaining to this matter to lead you to believe that the energy transferred by hurricanes from the ocean to the atmosphere is a significant fraction of what it would take to raise global TLT?”

            What do you consider “significant”? From the October UAH global value, it is easy to believe the hurricanes had close to a 0.2C effect. (Remember there was not just Atlantic/Caribbean activity.) Consequently, I have no problem with the UAH results. We just don’t have enough data to accurately predict the exact effect of hurricanes.

            “This would be a first order requirement to corroborate your view.”

            I’m not trying to “corroborate” my view . I’m trying to help you if you are sincerely trying to understand. At the very start of this post, there were people that seemingly denied hurricanes have ANY effect on UAH results. I know too well about trying to talk someone out of their belief system. How do you help someone that fervently believes CO2 can “heat the planet”?

          • barry says:

            The condensation continues until it stops. Check rainfall totals over Houston area after Harvey. Then follow those totals all the way to Tennessee. The latent heat is being released all during that time.

            Heat is released by condensation (visible as clouds), not by rainfall. Maria, the last big storm of September, dissipated by the first few days of October. The vast majority of of the heat transferred to the lower trop occurred before the end of October, with very little afterwards.

            Harvey’s rainfall finished early September. Maria’s rainfall finished in the first few days of October, so even if we measured heat by the timing of rainfall, this activity was done by Oct 3.

            The heat energy will be measured by the MSUs, again and again, until it moves out. As heat energy leaves the surface, it warms the atmosphere. It continues to warm the atmosphere until it moves to space. The sats just measure the temps they “see”.

            Hurricanes achieve heights of 15 km altitude. While they are running, they are constantly releasing heat into the altitudinal swathe of the atmosphere measured by MSUs as the TLT layer, centred on 4km.

            You asked if I was being ‘tricky’ saying that the TLT layer is not measuring energy moving out to space. I’m saying it because you have said a few times that the energy stays in the atmosphere until it leaves to space, implying (as far as I can tell), that the supposed lag is associated with the time at which energy leaves the atmosphere to space.

            To repeat, the TLT is measuring the heat of the lower troposphere. It doesn’t matter when the energy leaves to space, because the TLT measurements are measuring heat of the lower atmosphere in real time, and hurricanes are releasing their heat at that level constantly in real time. The point at which this energy is released to space is somewhat irrelevant to the question.

            One kg of water releases about 2,200,000 Joules, upon condensation. Estimate all the rainfall, and convert to energy released.

            The conversion seems reasonable, but the timing isn’t right. Heat is released at point of condensation, not precipitation.

            What do you consider “significant”? From the October UAH global value, it is easy to believe the hurricanes had close to a 0.2C effect.

            When you criticise people for having ‘beliefs’ about scientific notions, I’m with you. But it seems that on the question of exactly how much energy from hurricanes translates to a change in the lower tropospheric temperature globally is lacking numerical facts.

            Specifically, what total energy was transferred from oceans to atmosphere by hurricanes in September, and how does that stack up against the heat capacity of the total atmosphere, and what effect September hurricane energy would have on the atmosphere.

            Remember there was not just Atlantic/Caribbean activity.

            I noted the Pacific season was relatively quiet upthread. Also, the Atlantic region, on average, contributes less than a quarter of global hurricane activity. So there’s more math to consider regarding what this means for the global TLT monthly anomaly (with or without lag).

            Consequently, I have no problem with the UAH results. We just dont have enough data to accurately predict the exact effect of hurricanes.

            We have:

            * Hurricane ACE values – regional and global
            * Rainfall values, if you want to go by that metric
            * Heat capacity of the global atmosphere, and of the swathe measured for TLT temps
            * Monthly TLT anomaly values
            * Methods to convert energy (joules) to temperature for a given volume

            If this is not enough and we “don’t have enough data to accurately predict [post-dict] the exact effect of hurricanes,” on what do you base your confidence that hurricanes have a significant effect?

            IOW, if I said that hurricanes have a tiny effect, barely noticeable, what mathematical analysis would you counter with? Are you saying it is not possible to do this because of lack of data (and therefore neither of us can demonstrate our views with empirical analysis), or is it indeed possible to get a reasonable estimation? If yes, to the latter, can you show anything to help?

            there were people that seemingly denied hurricanes have ANY effect on UAH results.

            The comments I saw did not deny that hurricanes transferred heat into the atmosphere. I saw a few that remarked the effect would be insignificant, including an attempt upthread that dwelt on comparative values in joules.

            Such calculations on the effect of hurricanes on the global tropospheric energy balance are otherwise notably absent. Which means the idea that September hurricanes raised the TLT by 0.1C (supposing there is a lag) remains speculative, rather than a reasonably identified fact, backed by actual, numerical values.

            I’ll hold you to your criticism of ‘beliefs’ and ask again if you have the requisite data to corroborate the notion that September hurricane energy had a significant effect on global TLT.

            To answer your question on “significant,” I would accept as a significant effect from hurricanes on global TLT a value of 0.02C or more. That would be nearly one fifth of the total change from Sept to Oct.

            From what I can gather, you are saying that hurricanes are responsible for at least half that increase (0.05C), and possibly all of the increase, seeing as you predicted a drop in temperature, even allowing for hurricane activity. But it’s difficult to tell, as you have not put any values forward.

          • g*e*r*a*n says:

            barry, I thought you were sincerely wanting to learn. Now I know.

            Which takes me back to my original comment:

            “barry, its okay with me if you want to disregard the heat energy released by the hurricanes.

            Its just funny how much you must disregard, to keep your belief system alive.”

          • barry says:

            As I’ve made it clear several times that hurricanes move energy from the ocean to the atmosphere, and am instead querying lag/amount, I think it is you who have become tricksy by avoiding a comprehensive answer to these specific points and reverting to rhetoric.

            I am going to take it, seeing as you haven’t given figures for hurricane energy and global tropospheric energy, that you don’t have any information on these values. I see no reason to ‘believe’ that September’s hurricane season added more than a tiny amount of heat to the global TLT. I’m comfortable allowing for the possibility that hurricanes had a significant impact (such as would account for a 0.1C rise in TLT one month to another), but nothing you’ve offered makes that speculation any more solid than when we started this conversation.

          • David Appell says:

            g*e*r*a*n says:
            “One kg of water releases about 2,200,000 Joules, upon condensation. Estimate all the rainfall, and convert to energy released.”

            Can’t do math?

            27 T gal of water rained on Texas and Louisiana:

            https://www.vox.com/science-and-health/2017/8/28/16217626/harvey-houston-flood-water-visualized

            That comes to 1e11 kg.

            energy released via condensation = 2e17 J

            Assume it’s released over one week.

            so energy per time released ~ 4e11 W

            Given the surface area of the Earth, that comes to 0.001 W/m2.

            Trivial and inconsequential.

          • g*e*r*a*n says:

            Davie! So, you’re no longer ignoring me, huh? Just couldn’t keep yourself away, I guess.

            Anyway, it’s nice to see the return of your comedy. And, no less with your hilarious attempt at math.

            You’re off by a factor of 1000, just by the time you got to the “kg” figure. I was laughing too hard to finish checking everything!

            But, if that’s the only mistake you made, the final number comes to 1 Watt/m^2. And that’s probably in the ballpark for just one hurricane. Of course, Harvey produced much more rain than just over TX and LA. And other hurricanes add to the heating effect, within a reasonable time period.

            (Don’t let barry see this. His belief system tells him hurricanes don’t warm the atmosphere. So he’s not open to any facts, or logic, to the contrary.)

          • David Appell says:

            Yes, I made a mistake of 1000. And thanks for reminding me why I ignore you — you’re invariably an a-hole to everyone.

            I don’t think hurricanes have much, if any, impact on atmospheric temperatures, because most of resulting heat will quickly be reabsorbed by the ocean. There’s no support in UAH’s LT data; here are the average monthly anomalies, 1979-present, Jan-Dec:

            0.03 0.03 0.02 0.03 0.03 0.04 0.03 0.03 0.05 0.05 0.03 0.01

            But the standard deviations are large:

            0.27 0.27 0.26 0.25 0.23 0.21 0.22 0.22 0.24 0.23 0.18 0.21

            so any differences in monthly averages are not going to be statistically significant.

            Now, back in the graveyard for you.

          • g*e*r*a*n says:

            Davie makes another mistake and gets mad at mewhat a clown.

            But, he was only off by a factor of 1000. That’s better than the “800,000 K” which is off by 10,000!

            Now he tries again with “statistics”.

            What is the statistical probability that he will ever get anything right?

          • David Appell says:

            You’re lying about the 800 kK:

            Calculation of Pierrehumberts 800,000 K:
            http://www.drroyspencer.com/2017/07/uah-global-temperature-update-for-june-2017-0-21-deg-c/#comment-253922

            You had no idea how to do any of the physics.

          • g*e*r*a*n says:

            Davie, the Sun has the effective radiating temperature of about 5800K. It can NOT heat the Earth to anything close to 800,000K.

            You are lost in your pseudoscience, and it’s hilarious.

          • David Appell says:

            g*e*r*a*n says:
            “Davie, the Sun has the effective radiating temperature of about 5800K. It can NOT heat the Earth to anything close to 800,000K.”

            Dummy doesn’t even understand the word “if.”

            “In a single second, Earth absorbs 1.22e17 joules of energy from the Sun. Distributed uniformly over the mass of the planet, the absorbed energy would raise Earth’s temperature to nearly 800000 K after a billion years, if Earth had no way of getting rid of it.”

            Pierrehumbert RT 2011: Infrared radiation and planetary temperature, Physics Today 64, 33-38.
            http://geosci.uchicago.edu/~rtp1/papers/PhysTodayRT2011.pdf

          • g*e*r*a*n says:

            I understand the word “if”, Davie.

            For example: “If” you had anything going for you, then you would be able to get a job.

            “If” you knew anything about radiative physics, then you would know the Sun can NOT heat the Earth beyond it’s effective radiating temperature, even “if” the Earth lost no energy.

          • David Appell says:

            You have been lying here about this word “if” for months.

            And you know it, because your only response here is a weak and meaningless personal insult. No science.

    • Gordon Robertson says:

      ren…”In four days the arctic air will reach the northeastern United States”.

      We’ve already got it in Vancouver, BC. It was snowing the other day.

  62. Gordon Robertson says:

    tim…”The green plate warms. But, the back-radiation from the colder green plate can NOT raise the temperature of the blue plate.

    You keep stating things like this as if they are laws of physics. As if this was the 2nd Law of Thermodynamics. The calculations (supported by a century of real-world testing) show that the green MUST raise the temperature of the blue”.

    **************

    No, they don’t. Stephan of Stephan-Boltzman acknowledged that their equation could not be supported by experiment. The S-B equation has never demonstrated two way heat transfer between bodies of different temperatures.

    Could we put this stupid thought experiment to bed and stop feeding the troll Eli Rabbett? He was proved wrong by two experts in thermodynamics, Gerlich and Tscheushner, who replied to his rebuttal of their paper in detail. It’s painfully obvious that Rabbett does not understand the difference between thermal energy and electromagnetic radiation.

    Sadly, it seems you don’t either, otherwise you would not be trying to pass off the S-B equation as being related to heat transfer and the 2nd law. The equation is about radiation density and it was written at a time before it became clear that electrons radiate EM while converting thermal energy to EM.

    S-B did not know that but they had the sense to admit their equation could not be verified experimentally. There is no inference in S-B of two way heat transfer between two bodies of different temperature radiating to space.

    • David Appell says:

      Gordon Robertson says:
      “Stephan of Stephan-Boltzman acknowledged that their equation could not be supported by experiment.”

      It’s “Stefan,” not “Stephan.” And “Boltzman” has two n’s.

      I suspect your claim is another of your lies. (You make so many.) Wikipedia says “the law was deduced by Josef Stefan (18351893) in 1879 on the basis of experimental measurements made by John Tyndall and was derived from theoretical considerations, using thermodynamics, by Ludwig Boltzmann (18441906) in 1884.”

      https://en.wikipedia.org/wiki/Stefan%E2%80%93Boltzmann_law

      Thus it seems unlikely Stefan would say that, since he used experimental numbers to derive the law in the first place. As usual, you didn’t provide any evidence to support your claim.

      Are you aware this is the same physics that guide heat-seeking missiles? Do you see them crashing all over the place, because the S-B equation is wrong?

      No, me either.

        • David Appell says:

          I don’t see anything there that said Stefan rejected the SB Law.

          • Kristian says:

            Exactly. As I stated in the first sentence.

          • David Appell says:

            And the opposite of what Gordon claimed.

          • Kristian says:

            Yup.

            But take careful note of what he DOES say:

            “The absolute amount of energy radiated by a body can not be determined by experiment. Experiments can only give the excess of the body’s emitted radiation over that simultaneously absorbed by it, the latter dependent on the energy radiated to it from its surroundings. If you, however, have the relationship between temperature and heat radiation established in a formula, you can use this to derive a value for the absolute amount of the body’s emitted energy. But such an absolute amount is only hypothetical in nature.”

          • David Appell says:

            Kristian says:
            “The absolute amount of energy radiated by a body can not be determined by experiment. Experiments can only give the excess of the bodys emitted radiation over that simultaneously absorbed by it”

            Simple – Stefan was wrong about this, if that’s really what he claimed.

            Just measure the outgoing radiation — which is exactly what the Planck law describes.

        • Svante says:

          Nice translation Kristian.

    • Norman says:

      Gordon Robertson

      You need to quit being so biased. Here read this

      https://www.scribd.com/doc/98425246/determination-of-stefan-boltzman-law-by-experiment

      There are experiments on YouTube verifying Stefan-Boltzmann Law. Maybe you should spend some time looking into it before you post you made up physics. You peddle false science a lot. It would be nice if you actually tried to learn something. You won’t, but it would be nice. You are still so wrong about your understanding of the generation of IR radiant energy. It is not from electrons changing orbitals. That is UV, visible, and near infrared. Mid-Infrared (the energy from Earth’s surface) is not created by electrons moving up and down orbitals or changing energy levels. YOU ARE WRONG ABOUT THIS! The whole atom, within the molecule, is moving in an electric field. The electrons are all moving with the atom in their same energy levels. They are not moving up and down energy levels when mid-IR is generated. Your false and misleading physics is tiresome.

      I have led you to the actual physics multiple times. Yet you are unable to learn. Why is it? What can we do to help you learn? Why do you reject learning true information. Why do you cling to your made up science?

    • Bindidon says:

      Norman

      Why do you answer to this troll’s eternally repeated nonsense? It is so useless.

      • Norman says:

        Bindidon

        There is always hope he might change and learn. I know it is a lot to hope for. I just want him to get the most basic one right, Mid-IR is not created by electrons changing energy levels. This is the one I hope for. If maybe one item can be corrected, the sky is the limit then.

    • Tim Folkerts says:

      “No, they dont. Stephan of Stephan-Boltzman acknowledged that their equation could not be supported by experiment. The S-B equation has never demonstrated two way heat transfer between bodies of different temperatures.”

      First off, “appeal to authority” is always a weak argument. Simply being smart or being the first to propose a new idea does not guarantee that the person is right. Science generally progresses (despite claims by many that science moves backwards), and thermodynamics is understood MUCH better toady than is was 150 years ago.

      I suspect that they acknowledged something like ‘state-of-the-art experiments available at the time could distinguish between net energy flow and two one way energy flows’. It would be interesting to see exactly what they said.

      • Kristian says:

        How would you go about physically distinguishing between a net energy flow and two macroscopic one-way “energy flows” hypothetically making up the one that you actually observe?

        And, no, I’m not talking about detecting photons, Tim. I’m talking about detecting two oppositely moving macroscopic fluxes (W/m^2) inside ONE and the same radiative heat transfer.

        • Sir Isaac Snapelton says:

          Kristian

          Point a thermal imaging device at a an object, even one that’s very cold. The device will detect a steady flux of LWIR recieved specifically from the target (this is a one-way flow of energy, as opposed to a net flow).

          Depending on the device, this information can be used to produce an image or calculate the object’s temperature.

          https://en.m.wikipedia.org/wiki/Thermography

          • phi says:

            Sir Isaac Snapelton,

            “The device will detect a steady flux of LWIR recieved specifically from the target (this is a one-way flow of energy, as opposed to a net flow).”

            No, for the nth time, only the net flux is directly measurable. The irradiance is then calculated taking into account the temperature of the sensor.

            By the way, has someone already started to regulate his heating using the notions of backconduction and conductive forcing?

          • Sir Isaac Snapelton says:

            Phi

            The murcury in thermometers responds to net flux (heat) It emits and receives energy, and the net result causes it to either warm or cool (expand or contract).

            Thermal imaging devices have sensors that are sensitive to certain wavelengths of IR. This is light, not heat.

          • Ball4 says:

            Kristian can also look at the classic test equipment used in Tyndall’s experiments and the experimental equipment used in the tests Planck references in his 1912 Treatise p. 199 (1). All easily found on the internet.

            This equipment was physically detecting two macroscopic one-way “energy flows”. The equipment calculated the net of the two opposing separate “energy flows” in two different ways.

            “I’m not talking about detecting photons…I’m talking about…radiative heat transfer.”

            Not sure how one is NOT talking about detecting photons and IS talking about detecting radiative heat transfer.

          • Kristian says:

            Sir Isaac Snapelton says, November 7, 2017 at 11:16 AM:

            Point a thermal imaging device at a an object, even one that’s very cold. The device will detect a steady flux of LWIR recieved specifically from the target (this is a one-way flow of energy, as opposed to a net flow).

            No.

            As always, people sorely need to read up on how such instruments actually work. You obviously don’t have a clue, Snape.

          • Ball4 says:

            “No, for the nth time, only the net flux is directly measurable.”

            No, for the nth+1 time, the net flux was directly calculated by the classic equipment from the flux of the two opposing macro energy flows (which were the sum of the micro flows). If phi would take the time to look into the classic measuring equipment then maybe, just maybe, phi would not go to the nth+2 time. But I doubt this will happen.

          • Kristian says:

            Ball4 says, November 7, 2017 at 12:33 PM:

            … gobble, gobble …

            Go away, troll.

          • Ball4 says:

            As always, Kristian and phi sorely need to read up on how such classic instruments actually work.

          • David Appell says:

            Kristian says:
            >> Point a thermal imaging device at a an object, even one thats very cold. The device will detect a steady flux of LWIR recieved specifically from the target (this is a one-way flow of energy, as opposed to a net flow).<<
            "No."

            Kristian, it's time for you to do this experiment, instead of spouting misunderstood theory.

            Give us your results.

          • barry says:

            I looked at infrared photos of Pluto taken from a ground-based telescope the other day.

            How is it ‘seeing’ infrared Pluto if the radiation comes from a body far cooler than the instrument?

            If such instruments can only see the NET flow of energy, wouldn’t that make infrared Pluto invisible to ground equipment?

          • gbaikie says:

            — barry says:
            November 7, 2017 at 8:47 PM

            I looked at infrared photos of Pluto taken from a ground-based telescope the other day–

            Are sure they are from ground based telescopes.

            And they aren’t a few pixels rather than photos.

            There lots of New Horizon photos.

          • barry says:

            Are sure they are from ground based telescopes

            Fig 3, for example.

            https://www2.mps.mpg.de/en/projekte/kkiss/index_print.html

          • barry says:

            That was from an observation system in Chile. The following is from a telescope in Hawaii.

            http://pluto.jhuapl.edu/Participate/learn/What-We-Know.php?link=Pluto-and-System-Family-Album

          • barry says:

            Point is, how can ground-based observing systems ‘see’ infrared Pluto when Pluto is far cooler than the temperature of the instrument?

            The mirrors at the Keck observatory (second link) are kept at around 273 K (freezing point of water). The av temperature of Pluto is 44 K.

            If infrared observing instruments can only see the NET radiation between them and another object, how do these instruments see Pluto? It should be invisible to them.

          • gbaikie says:

            “The mirrors at the Keck observatory (second link) are kept at around 273 K (freezing point of water). The av temperature of Pluto is 44 K.”

            The mirrors are reflectors, what important is to keep them a constant temperature so don’t deform due to temperature differences.
            The detector for IR are cooled:
            “The spectrograph is housed in a vacuum vessel, with its optics cooled to ~65K and the detectors to ~25K. The main characteristics of CRIRES are summarized in Table 1.”
            https://www.eso.org/sci/facilities/paranal/instruments/crires/overview.html
            https://www.eso.org/public/teles-instr/paranal-observatory/vlt/vlt-instr/crires/

          • gbaikie says:

            But I believe they are cooled to improve detection, they are not collecting many photons, and may use quite long exposure time to also improve the resolution.
            Years ago Hubble image of Pluto was 35 pixel also- the diameter of pluto was 35 pixels. It was pretty impressive for that time.

          • barry says:

            Observations of infrared Pluto have been made with cryogenic boxes at temps higher than Pluto (eg 70K and up).

            http://irtfweb.ifa.hawaii.edu/~cshell/manual_v2.pdf

            As you’ve noted, this is not to read low-temperature radiation, but to improve detection. The low temps allow for sharper resolution radiation spectroscopy against the background noise of space and prevent local thermal noise interfering with the instrument. In any case, the ground-based instruments are generally at a higher temp than Pluto (10-100 K higher), so if they can only read NET radiation, infrared Pluto should be invisible to them.

        • Tim Folkerts says:

          Kristian, I can never quite figure out why you are so hung up on this minor point. Mathematically, EVERYTHING comes out the same whether you model thermal radiation as a single flux from hot to cold @ P = sigma A (Th^4 – Tc^4), or model thermal radiation as 2 opposing fluxes @ P = sigma A (Th^4) in one direction and P = sigma A (Tc^4) in the opposite direction. The final answer in EVERY CASE is identical.

          As for measurement, get a cold IR sensor, point it at a hot object, and measure the spectrum. When it matches the Planck curve for temperature Th, then I have measured the power (as a function of wavelength no less!) of the one way flow of energy. And when I turn the instrument around, I measure the spectrum corresponding to the Planck curve for Tc. That seems sufficient to me.

          • phi says:

            Tim Folkerts,

            “The final answer in EVERY CASE is identical.”

            No difference in a system at equilibrium for the calculation of the energy balance.

            Everything changes out of equilibrium because backradiations depend on the temperature profile which is likely to evolve. Backradiations are therefore not at all comparable to solar flux except to assume the hypothesis of a fixed gradient.

          • Kristian says:

            Tim Folkerts says, November 7, 2017 at 1:57 PM:

            Kristian, I can never quite figure out why you are so hung up on this minor point.

            Because it’s not a minor point. It’s THE point. Not the two-way vs. one-way thing itself, but how people tend to TREAT the two mathematically defined hemifluxes in the two-way model – like real, separate thermodynamic entities with real, separate thermodynamic effects. You know this, Tim. So why the feigned puzzlement?

          • Sir Isaac Snapelton says:

            Kristian

            The rate of heat transfer between two objects is determined by their difference in temperature. But how is this possible? Neither object “knows” it’s own temperature nor the temperature of the other.

            The answer is obvious. Every object radiates energy (not heat) according to its temperature. Heat transfer, then, is just a natural result of two opposing, differing, fluxes of energy.

          • Sir Isaac Snapelton says:

            If a person stands next to a 300 F wall, he would feel heat (difference between the energy emitted by his body and that of the wall).

            Replace the person’s body with a 600 F. object, the object would “feel” a cold chill (net loss of energy) rather than heat.

          • Norman says:

            Sir Isaac Snapelton

            Yes what you describe is exactly what the textbooks on heat transfer state. They never state or imply anything like Kristian is saying.

            As you stated look at a thermal image in an FLIR camera. I have done so many times and posted links to such. It is all IR, the lens will not even allow visible light in. You can see distinct and separate objects clearly indicating that each object is an independent radiator with its own macroscopic flux of energy that hits the array and form an image unique to the object emitting that IR. You can see multiple objects clearly indicating each object has its own flux moving away from the object and toward the camera.

            Kristin ignores this reality. I even suggested to him to go in a cold room and then turn on a heater. Face opposite of the heater and monitor the objects as the heater warms them. They will start to have a backradiant flux back toward the heater that you can see in your FLIR. They will go from the cold blue color to the warmer red and orange and indicate higher temperatures. Kristian is wrong and you are right. Evidence supports your view, nothing to date but his blog cartoons support his notions. No textbook I have read to date supports his opinions. He calls me stubborn, I don’t think so. I will change if he provides explanation of individual objects seen in FLIR instruments. If he can link me to textbook material from established science that confirms his view I can accept it. I am not changing because he makes his claims strongly and calls me stubborn nor will I change from links to his own blog.

          • David Appell says:

            Sir Isaac Snapelton says:
            “If a person stands next to a 300 F wall, he would feel heat (difference between the energy emitted by his body and that of the wall). Replace the persons body with a 600 F. object, the object would feel a cold chill (net loss of energy) rather than heat.”

            Yes, but not as much as it would be if the 300 F wall wasn’t there.

          • Kristian says:

            Sir Isaac Snapelton says, November 7, 2017 at 3:52 PM:

            The answer is obvious. Every object radiates energy (not heat) according to its temperature. Heat transfer, then, is just a natural result of two opposing, differing, fluxes of energy.

            Yeah, that sounds obvious, doesn’t it? Indubitable.

            So the only conclusion to draw, the only way to explain Earth’s elevated T_s, then, beyond pure solar equilibrium, is through the addition to the solar heat flux of a separate macroscopic flux of energy (W/m^2) down from the cooler atmosphere to the already warmer surface …!

            The warmer surface absorbs this separate macroscopic flux from the cooler atmosphere and, as a direct consequence, its average steady-state temperature rises all the way to ~289K. IOW, you add a macroscopic flux of energy to a thermodynamic system and thereby increases its U and T. Not relative to some other value, but in absolute terms.

            How is this NOT “extra heating by back radiation”!??

            You simply don’t get this, Snape.

          • Sir Isaac Snapelton says:

            Kristian

            In theory, backradiation is not energy added to earth’s surface, it is energy conserved (remember the sphere/shell)?

            Therefore, the solar flux, rather than just replacing energy lost to space, overlaps (joins) energy that has been conserved.

          • Tim Folkerts says:

            Kristian,

            “… how people tend to TREAT the two mathematically defined hemifluxes… “
            1) The fact that some novices make mistakes is not sufficient reason to choose one approach over the other. A better criterion is if experts actually get the right answer with the method.

            “… like real, separate thermodynamic entities with real, separate thermodynamic effects. “
            I would say that (within thermodynamics) every flow of energy has a REAL effect, and no energy flow has a separate effect. Only when ALL ‘real’ effects (all real energy flows) are consider, then the effect can be determined. There is a real effect of the energy from the sun to the ground, but this is not separate from the effect of energy from the ground to space. There is a real effect of the thermal IR from the sky to the ground, but this is not separate from the effect of the thermal IR from the ground to the atmosphere. Each energy input adds to the ground’s internal energy, and, once absorbed, the effect of 1 J of sunlight is identical to the effect of 1 J of incoming thermal IR.

          • David Appell says:

            Sir Isaac Snapelton says:
            “In theory, backradiation is not energy added to earths surface, it is energy conserved”

            Of course it is — all radiation carries energy. It *is* energy.

            Backradiation’s energy can be, and has been, measured:

            Radiative forcing measured at Earths surface corroborate the increasing greenhouse effect, R. Philipona et al, Geo Res Letters, v31 L03202 (2004)
            http://onlinelibrary.wiley.com/doi/10.1029/2003GL018765/abstract

            “Observational determination of surface radiative forcing by CO2 from 2000 to 2010,” D. R. Feldman et al, Nature 519, 339343 (19 March 2015)
            http://www.nature.com/nature/journal/v519/n7543/full/nature14240.html

          • Sir Isaac Snapelton says:

            David

            You and I agree on the science, and that’s what matters. My comment was only about semantics. I think it’s odd to say the atmosphere “adds” energy to the earth.

            If I hand you two nickels, and you simultaneously hand one of them back, are you adding a nickel or taking a nickel?

            Or about this. A juggler continuously tosses balls into the air. Does the air “add” balls to his hand when they come down?

          • Sir Isaac Snapelton says:

            My main point, though, is from a big picture point of view. Backradiation is energy that has not left the earth system, rather than energy added.

            The solar flux joins in.

          • Ball4 says:

            Q: “How is this NOT “extra heating by back radiation”!??”

            A: Simple, this is extra energy by back radiation

            …causing T to be increased in surface water over surface water not exposed to the extra energy from night atm. radiation. As demonstrated by Dr. Spencer’s night time experiment.

          • David Appell says:

            Sir Isaac Snapelton says:
            “I think its odd to say the atmosphere adds energy to the earth.”

            The atmosphere in effect redirects energy downward that would otherwise leave the Earth.

            What’s odd about that?

            Like all objects, the atmosphere absorbs energy and it emits energy. Why wouldn’t some of these emissions go downward toward the surface?

          • Sir Isaac Snapelton says:

            David

            I’m not arguing the physics, just the words we use. (Of course the atmosphere radiates energy to the earth)

            Answer this question: if every minute I give you three nickels, and every minute you hand one back to me, are you adding to my net worth or am I adding to yours?

          • phi says:

            Tim Folkerts says (November 7, 2017 at 5:24 PM) :

            “Each energy input adds to the grounds internal energy, and, once absorbed, the effect of 1 J of sunlight is identical to the effect of 1 J of incoming thermal IR.”

            At the macroscopic level, the Joule of backradiations is a coooling reduction and not an heating increase.

            Once again, the distinction makes sense out of equilibrium because backradiations depend totally on the thermal profile. The equilibrium is recovered by modifying this thermal profile and, therefore, backradiations are modified throughout the process which leads to balance. Backradiations are therefore not assimilable to energy entering the system.

          • barry says:

            Sorry if I misunderstood you, Kristian. I thought you had said that IR detectors (the telescopes I’m referring to are IR detectors) cannot see discrete radiation from an cooler object, because IR detectors can only see the NET exchange of radiation.

            That’s why I brought up Pluto. The Earth emits more radiation to Pluto than it emits to Earth. So we can “see” the discrete radiation of Pluto.

            If you’re saying something other than what I think you’ve said, my mistake.

            Do you agree then, that IR measuring devices can “see” the distinct radiation of objects cooler than them?

          • barry says:

            Tsk, meant for the inline thread below this one.

          • Kristian says:

            Tim Folkerts says, November 7, 2017 at 5:24 PM:

            “… how people tend to TREAT the two mathematically defined hemifluxes …”
            1) The fact that some novices make mistakes is not sufficient reason to choose one approach over the other.

            If you want to call the IPCC and NASA “novices” of climate science, go ahead.

            You should set THEM straight, not ME. Because THEY’RE the ones using this confusing language, not me.

            “Back radiation” (the atm DWLWIR) is an apparent radiative EFFECT of the actual physical mechanism forcing the surface of the Earth to be warmer with an atmosphere than without, just like the sfc UWLWIR is an apparent radiative effect of the actual physical mechanism forcing the surface of the Earth to be warmer with an atmosphere than without.

            None of them IS the warming mechanism …

            It’s a simple case of confusing cause and effect.

          • Kristian says:

            Tim Folkerts says, November 7, 2017 at 5:24 PM:

            “… like real, separate thermodynamic entities with real, separate thermodynamic effects. ”
            I would say that (within thermodynamics) every flow of energy has a REAL effect, and no energy flow has a separate effect.

            But “back radiation” ISN’T a macroscopic/thermodynamic “flow of energy”, Tim. Only the radiative flux is.

          • Svante says:

            I don’t suppose it helps if we acknowledge that back-radiation would drop to zero real quick if it was on its own.

          • David Appell says:

            Kristian says:
            “But back radiation ISNT a macroscopic/thermodynamic flow of energy, Tim. Only the radiative flux is.”

            The backradiation *IS* the radiative flux.

            Jeez.

        • David Appell says:

          Kristian says:
          “How would you go about physically distinguishing between a net energy flow and two macroscopic one-way energy flows hypothetically making up the one that you actually observe?”

          Simple – You set up one detector pointed in one direction, and the other pointing in the opposite direction.

          • Kristian says:

            Then you measure TWO SEPARATE HEAT TRANSFERS, Appell. How thick are you?

          • Sir Isaac Snapelton says:

            Kristian

            OMG, it’s you who are thick. Thermal imaging devices respond to light, not heat transfer!

          • David Appell says:

            There ARE two separate energy transfers, one in each direction.

          • Ball4 says:

            Kristian 5:18pm, that experiment really does measure two separate fluxes of energy, as Tim writes & as did Tyndall’s apparatus. Look it up.

            From which the net (heat transfer and direction) is calculated as Norman, DA & Tim et. al. are trying to inform you (without success). Heat can not be directly measured as heat does not exist in nature except in your et. al. heads as a definition.

            The earth surface receives two fluxes of energy DW, one LW shining from the atm. in a hemisphere of directions* all the time and one SW shining from the sun only across the sun face during daylight.

            *This flux increasing T of surface water was demonstrated in Dr. Spencer’s night time experiment.

          • David Appell says:

            Here’s what Kristian is claiming:

            If he were in a spaceship between the Earth and the Sun, he thinks he could look toward the Sun and see it, but if he turned around and looked to the Earth it would be invisible to him, since the “net” energy flux is from the Sun to the Earth.

          • Sir Isaac Snapelton says:

            David

            I think you have it right. His argument is not just about semantics, it’s fundamental flawed.

          • Sir Isaac Snapelton says:

            Fundamentally

          • barry says:

            Kristian may argue that you see solar radiation reflected rather than terrestrial energy emitted (but he can correct me here).

            I’m more interested in how we are able to see the infrared coming from Pluto with ground-based telescopes when the instrument and its surrounding atmosphere is much warmer than Pluto. In this case, shouldn’t infrared Pluto be invisible to ground-based instruments if they can only ‘see’ the NET radiation?

          • David Appell says:

            barry, maybe, maybe not.

            The Earth’s albedo is 0.3, so it reflects albedo*S/4 of the sunlight incident upon it, = an average of 102 W/m2.

            But the Earth’s brightness temperature is 255 K, meaning it emits an average of 240 W/m2. Mostly in the infrared.

            So instead of his eyes, Kristian can use a meter that records incident energy. He either thinks the Sun is invisible or the Earth is invisible. I wonder which.

          • Kristian says:

            David Appell says, November 7, 2017 at 6:06 PM:

            There ARE two separate energy transfers, one in each direction.

            Hahahahahaha!

          • Kristian says:

            barry says, November 7, 2017 at 9:59 PM:

            I’m more interested in how we are able to see the infrared coming from Pluto with ground-based telescopes when the instrument and its surrounding atmosphere is much warmer than Pluto. In this case, shouldn’t infrared Pluto be invisible to ground-based instruments if they can only ‘see’ the NET radiation?

            Yes, that’s the level we’re at, isn’t it? Think it through, barry. Is the telescope and Pluto involved in a separate heat transfer? What does a telescope do? Have I ever claimed that photons do not exist and do not fly in all directions?

          • gammacrux says:

            Barry,

            The IR detector is usually a narrow gap semiconductor device such as HgCdTe that has to be cooled to liquid H2 ( 20 K) or liquid He ( 4.2 K) to operate properly. And such a device detects photons, not heat. The photon in converted directly into electric current, not thermalized into heat. Bolometers that convert incident energy into heat may also be used but must of course be cooled too.

            Otherwise the dark noise of the instruments prevents any detection.

            Moreover the telescope focuses on the detector a specific bundle of incoming radiation in a very narrow solid angle around the direction of the heavily body which excludes most of the diffuse thermal radiation from ambient.

            And finally emission (and a.b.s.o.r.p.t.i.o.n) from atmosphere of course still perturbs the detection and that’s why air and satellite borne instruments are launched and preferred.

            https://en.wikipedia.org/wiki/Wide-field_Infrared_Survey_Explorer

            So even cold bolometers (a detector where the heat concept is appropriate) may readily detect directly a one-way incoming radiation flux Ei since the outgoing radiation flux Eo is quite negligible so that the incoming heat flux Q = Ei – Eo = Ei is indeed a positive quantity as required by second law of thermodynamics.

          • barry says:

            Sorry if I misunderstood you, Kristian. I thought you had said that IR detectors (the telescopes Im referring to are IR detectors) cannot see discrete radiation from an cooler object, because IR detectors can only see the NET exchange of radiation.

            Thats why I brought up Pluto. The Earth emits more radiation to Pluto than it emits to Earth. So we can see the discrete radiation of Pluto.

            If youre saying something other than what I think youve said, my mistake.

            Do you agree then, that IR measuring devices can see the distinct radiation of objects cooler than them?

          • barry says:

            gamma,

            I’ve been reading up on ground-based infrared telescopes. I’ve seen operating temps of the cryo units that cool detectors observing infrared Pluto at anywhere between 30 and 170 K (Pluto is 44 K av).

            I think we’re not disagreeing. The cryo units housing the detectors are there to reduce background noise and local thermal noise.

            I know we’re not talking about heat transfer. Just about whether IR devices can see the discrete radiation of objects cooler than the instrument. IE, that ground-based IR instruments can see downwelling IR.

          • gammacrux says:

            Barry,

            From your link above, the detector of the telescope is InSb ( 1-5 um, O.23 eV ) which operates typically at 30 K.

            At any rate it’s not easy and for ground based images the “bad photons from sky” must be subtracted.

            https://www.noao.edu/meetings/gdw/files/Joyce_IR.pdf

            I know were not talking about heat transfer. Just about whether IR devices can see the discrete radiation of objects cooler than the instrument. IE, that ground-based IR instruments can see downwelling IR.

            They can and it’s much easier than Pluto. They can exactly as we can “feel” the cold walls in a unheated room in winter.

          • Kristian says:

            barry says, November 8, 2017 at 5:20 AM:

            I thought you had said that IR detectors (the telescopes Im referring to are IR detectors) cannot see discrete radiation from an cooler object, because IR detectors can only see the NET exchange of radiation.

            There are two kinds of radiometric detectors.

            THERMAL detectors cannot see the radiation from objects cooler than themselves. QUANTUM detectors can. However, the former kind operates within the MACROscopic realm, i.e. they observe radiative FLUXES, while the latter kind operates within the MICROscopic realm, detecting individual photons.

            So again you’re invoking a MICROscopic (quantum) phenomenon to argue the existence of a MACROscopic (thermodynamic) phenomenon, a phenomenon which is fundamentally different in nature.

          • Kristian says:

            Again, claiming TWO opposite macroscopic (net) flows of energy within one and the same thermal radiative exchange rather than just the ONE that is actually observed (the radiative (heat) flux), is purely a geometrical/mathematical constraint imposed on the radiation field by the person analysing the exchange.

            Here’s a typical BB radiation enclosure:
            https://okulaer.files.wordpress.com/2017/11/hulromsstrc3a5ling-1.png

            As you can see, individual photons of course fly everywhere, in all directions, within the cavity, and they are also all the time being emitted AND absorbed by the surrounding walls. The evacuated cavity itself is filled by what is commonly called a “photon gas” or ‘cloud’ (Bose, Einstein).

            Now, if I wanted to, I could mentally/conceptually split this spherical hollow into two halves, two hemispheres, and then simply define all photons within the cavity flying in the general direction from the first hemisphere to the second one as part of a separate macroscopic (net) flux moving ‘en bloc’, so to say, across the cavity, from one side of the wall to the other; and likewise all photons flying in the general direction from the second hemisphere to the first one as part of an opposite – and equally separate – macroscopic flux, moving the other way.

            Like this:
            https://okulaer.files.wordpress.com/2017/11/hulromsstrc3a5ling-2.png

            Mathematically, conceptually, such a directional partition of an inherently integrated radiation field, a photon gas or cloud, might indeed make a lot of sense. It simplifies things. Calculations. Analyses.

            But it is, first and last, AN INVENTION OF THE HUMAN MIND. It is not an intrinsic condition of the radiation field itself …!

          • Sir Isaac Snapelton says:

            Kristian

            You: “Again, claiming TWO opposite macroscopic (net) flows of energy within one and the same thermal radiative exchange rather than just the ONE that is actually observed (the radiative (heat) flux), is purely a geometrical/mathematical constraint imposed on the radiation field by the person analysing the exchange.”

            What? Who would say there are two opposing net fluxes? That would make no sense.

            Please show a comment where someone said that.

          • Sir Isaac Snapelton says:

            Kristian

            You are seriously misunderstanding the hemisphere thing. It’s a physical reality, not at all conceptual.

            If I am standing in a room, I am emitting and receiving radiation in every direction. OTOH, the floor of the room (a surface) is only emitting/receiving energy to one hemisphere, the “upward” one. The other hemisphere is subterranean! Radiation doesn’t fly around underground.

            Another point. Place a small object (with a distinct temperature) on the side of the enclosure opposite the viewing hole. Now, from the viewing hole, try to take a picture of the object using a thermal imaging device. Based on your diagram, all the energy between the object and camera would be broken and scattered. If that were accurate, how would an image be possible?

          • Sir Isaac Snapelton says:

            To be clear, I’m not saying radiation isn’t scattered and chaotic. Just saying it also travels long distances in straight lines (as demonstrated by devices like FLIR)

          • Gordon Robertson says:

            barry…”IE, that ground-based IR instruments can see downwelling IR”.

            If you are trying to measure IR using thermal means the receiver must be cooler than the source. However, it’s not necessary to detect IR thermally since it’s electromagnetic energy within a specific frequency range. IR can be detected simply as light, by counting the oscillations.

            If IR is detected by frequency measurement, it is possible to set up a look-up table in the receiving device in which frequency has already been established against temperature. Detect the frequency, look up the table, find the best fit, and you have the apparent temperature. No thermal measurement required.

            I would guess that most hand held radiometers use a look-up table that is programmed with frequency versus temperature. Remember, this is colour temperature not actual temperature. Colour temperature is the apparent temperature a device would give off when heated till it glowed a certain colour.

            The radiation frequency is measured using some kind of photoelectric device that varies its resistance with the frequency of received radiation.

          • Sir Isaac Snapelton says:

            Gordon

            I’m flabbergasted. From what little I’ve read on the subject, your description actually sounds right.

          • Kristian says:

            Sir Isaac Snapelton says, November 8, 2017 at 3:55 PM:

            You are seriously misunderstanding the hemisphere thing. It’s a physical reality, not at all conceptual.

            LOL! You’ve officially turned into Norman.

          • Sir Isaac Snapelton says:

            Kristian

            I take that as a compliment.

            Norman would agree that the earth beneath our feet is not an invention of the human mind. No need to calculate radiative transfer through bedrock!

          • Sir Isaac Snapelton says:

            Kristian

            The surface temperature is based on energy received and emitted.
            A photon can’t strike the earth without moving in a somewhat downward direction. A photon can’t be emitted into the atmosphere without moving in a somewhat upward direction.

            How is this an invented concept?