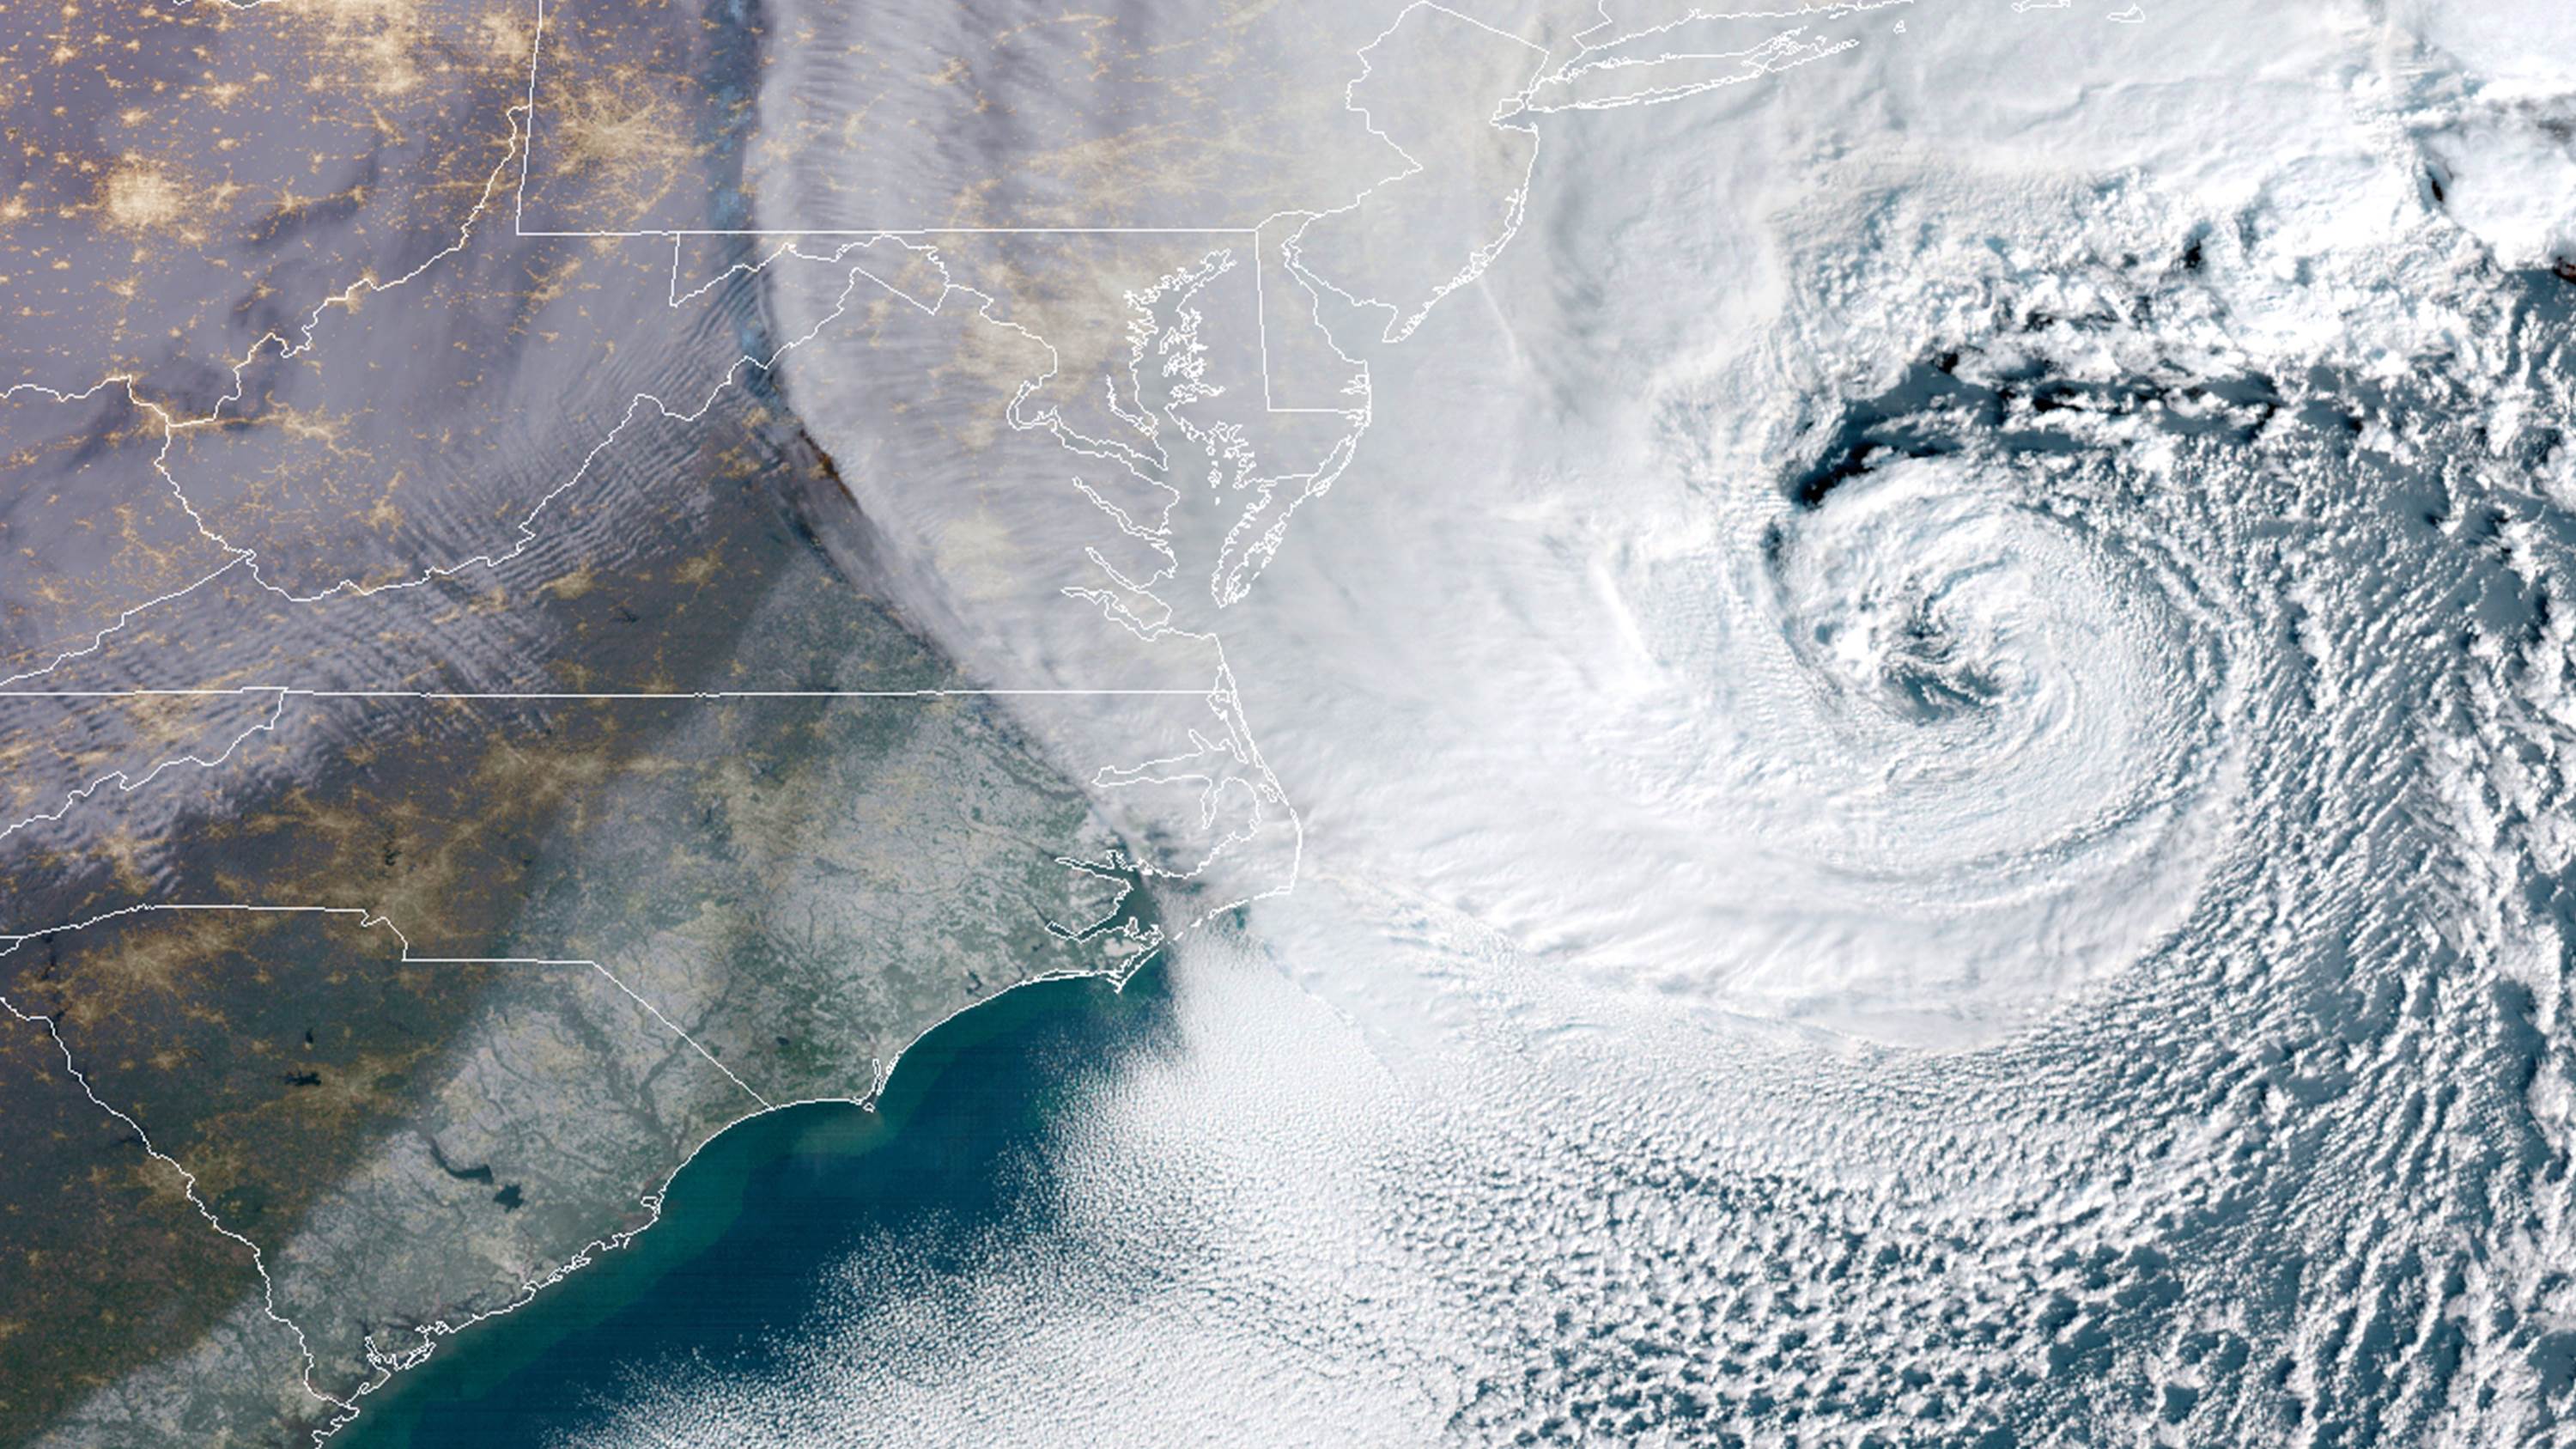
The rapidly intensifying non-tropical cyclone producing heavy snow and blizzard conditions over the mid-Atlantic and New England is meeting expectations, with localized snowfalls of over 6 inches already this morning.
The latest NAM model forecast of additional snowfall after 7 a.m. this morning until tomorrow morning shows up to 12-18 inches of snow over portions of Massachusetts, Connecticut, Rhode Island, Vermont, and Maine (graphic courtesy of Weatherbell.com):

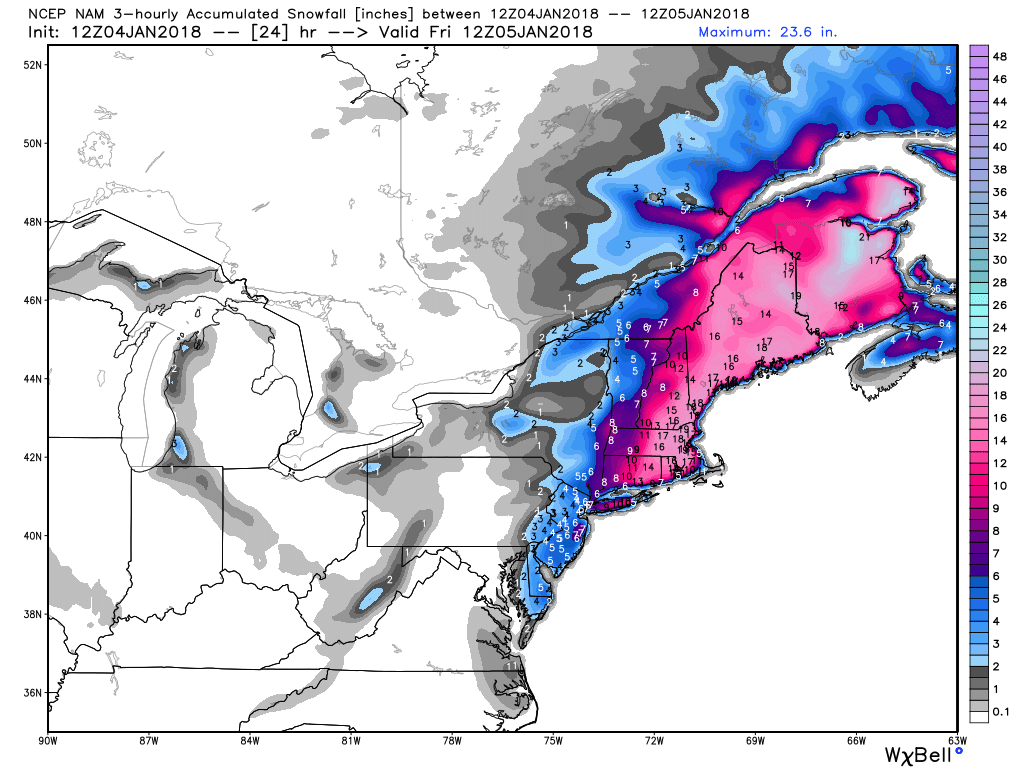
Maximum additional snow accumulations from 7 a.m. Thursday Jan. 4 to 7 a.m. Friday, from the NAM weather forecast model.
As of 9 a.m. EST, all 5 NWS reporting stations in Rhode Island have heavy snow falling.
The term “bomb” was coined by meteorologist Fred Sanders in 1980 to refer to a non-tropical low pressure area that intensifies at least 24 millibars in 24 hours. They happen every year, and are usually centered offshore in the winter where cold continental air masses meet warm oceanic air masses, providing maximum energy to the intensification process.
Still to low for coastel CT which will get well over a foot.
Joe Bastardi is one of the few that called this storm pretty good.
Dr. Spencer I was wondering what you thought of new study showing ocean temperatures for the entire ocean have rose 0.1 degrees celcius in last 50 years. Would you expect this temperature change ?
well, I’m not aware of a “new” study, but the warming of the oceans since the 50s has been known for many years. The rate of warming varies greatly with depth (more in the upper layers) and the total warming is around half of would be expected if the climate models are, on average, correct. I think the validity of the deep-ocean warming is susect…it’s a tiny signal, and the deep oceans have only been reasonably well sampled for the last 12 years or so.
I am not sure if this is a new technique. Study claims technique can measure temperature of oceans going back in history. Apparently using this method shows oceans warmed faster during a period 12000 years ago than the warming rate of last 50 years.
https://wattsupwiththat.com/2018/01/04/an-instant-global-ocean-thermometer-from-antarctic-ice-cores/
12,000 years ago sea level was lower, land ice was melting, . . ., and lots of other changes were in progress.
I am not surprised that ocean waters warmed then.
Were clouds fewer? Shortwave reached Earth’s surface more? Albedo changes as ice decreases and surface greening as plants colonize previously darkened surface?
Were humans moving into forested areas in cooler regions and using wood to keep their caves warm? Can we call it the Early Human Cave Heating (EHCH) effect?
Has a nice sound: the EHCH effect.
“ the area was home to humans as long ago as 11,230 years ago”
Marmes – Washington State
“previously darkened surface”
or — lighter !?
Roy, your claim about climate models is only half true, I think. Its true for models of intermediate complexity, but for CMIP5 models. See the 5AR WG1 Fig 9.17.
There is a mistake in that figure – the CMIP5 heat uptake is the same for 0-700m and 0-2000m, which cannot be true.
https://www.ipcc.ch/pdf/assessment-report/ar5/wg1/WG1AR5_Errata_11122015.pdf
I can’t seem to find the “Errata Figure 9.17” the IPCC mentions. In any case, the question is not whether the models estimate ocean heat uptake well; the question is whether they estimate ocean heat uptake well using forcings as realistic as possible. If their OHU is the same as reality but their net forcing is smaller they will overestimate climate sensitivity.
A small overestimate in temperatures, another small underestimate in forcings, and a small overestimate in OHU can all add up to a big overestimate in sensitivity.
Googling for this problem gave
https://wattsupwiththat.com/2016/02/29/climate-models-are-not-simulating-earths-climate-part-3
Move down to fig. 1-24-8.
https://bobtisdale.files.wordpress.com/2016/02/figure-1-24-8.png
See also Nic Lewis’ comment on that thread.
Low he will direct the Arctic air to the eastern US.
http://images.tinypic.pl/i/00954/li55wh87anfg.png
This one low in the north-west Atlantic promises to change weather in Europe. In the far north high pressure will dominate.
“This new wave of cold air will be about 5-10 degrees lower than the one that froze the Northeast during the final few days of December and start of January, according to AccuWeather Meteorologist Kyle Elliott.”
The pressure difference is huge, which is why the wind will be strong.
The Great Lakes will freeze at an accelerated pace.
https://accuweather.brightspotcdn.com/dims4/default/ce96f45/2147483647/resize/590x/quality/90/?url=http%3A%2F%2Faccuweather-bsp.s3.amazonaws.com%2F8d%2F02%2F6c576837411d9470a55c4cef1caa%2Fbrutal-ne-cold-1-4.jpg
The pattern of the polar vortex in the lower stratosphere does not change.
http://www.cpc.ncep.noaa.gov/products/stratosphere/strat_a_f/gif_files/gfs_z70_nh_f00.png
The temperature in the lower stratosphere has dropped sharply.
http://www.cpc.ncep.noaa.gov/products/stratosphere/temperature/70mb9065.png
The magnetic activity of the solar wind is very low.
http://services.swpc.noaa.gov/images/satellite-env.gif?time=1515084365000
The animation shows how low moves north along the coast and pulls cold air in the southeast US.
http://www.ssd.noaa.gov/goes/east/eaus/flash-ir4.html
ren, We know from physics that a gas can not “pull” or “draw” the cold air into the area of lower pressure as only pressure forcing is possible. Gravity does the “pulling’, which moves the densest air to the bottom of the ocean of gas we call the atmosphere.
Consider the classic example of sucking a liquid from a cup thru a straw into your mouth. Sucking on the straw creates a lower absolute pressure in your mouth and the static pressure of the atmosphere pushes the liquid up the straw for you to enjoy. It’s amazing how many meteorologist (including those who work for the NYT, the WaPo and the Weather Channel) get this wrong when they pontificate about storms.
The southward flow of cold air from the Arctic meets with the northward flow of warmer air and the storms form along the boundary. The flows are the result of the massive transfer of energy from the tropics toward the poles and the cold, dry, dense air is the return portion of the circulation loop.
Nice description.
Thank you. I was rather talking about the air movement in the vortex.
All true, but I’m still happy to call it pulling. Even though ropes are better at pulling and really lousy at pushing. 🙂
OTOH, if you want to sell me a rope for three times less than Roy would, you might have a deal!
Except that you cannot replace pull or draw with an analogy that sucks!
You have to increase the volume in your mouth or lungs against external pressure to produce the lower pressure that causes the pressure gradient that overcomes gravity as a net force to push the liquid up the straw:-)
An increase, or decrease in the volume in your mouth produces the suction, or draw?
Hi John, we are saying that with a gas there is no such thing as pull or draw or suction. The gas (or liquid] moves down the pressure gradient unless opposed by an equal or greater other force, like gravity perhaps.
Also, a decrease in the volume of the air in your body increases the pressure above external air pressure and so the gas moves out of your mouth or nose towards the lower pressure.
Yes, but the increase in pressure comes externally (from the muscles), decreasing the volume in the mouth and decreasing the internal pressure, effectively pulling the air/substance up the straw.
John, think of an internal combustion engine. The piston moves down as the inlet valve opens. This increases the volume of the chamber and reduces the internal pressure. As a random process the higher external pressure molecules preferentially work their way in through the valve against those attempting to leave. The molecules in a gas have no mechanism to pull on each other. They are not electrically charged and their associated gravity is effectively zero. They move randomly but predictably down gradients of number density at rates set by mean kinetic energy. They can only transfer energy and information by impulse as they collide. This impulse is always a push not a pull. Liquids do have some weak bonding forces and so one molecule moving away does exert a draw on its immediate neighbours. The action of pressure of a gas upon a liquid is one of absolute positive pressure by collisional impulse. This pressured containment of a gas or solid container is the only thing that keeps liquids from becoming gases.
You used the term effectively pulling (text editor is eating quotation marks!) which is exactly what this pedantic rant is about. The effects are easily confused wth a pull or a draw or suction, but these mechanisms are physically unavailable to a low temperature gas with small masses.
Back more on topic, teleconnected, small absolute pressure differences transmitted molecule to molecule by collision at the speed of sound set air masses in motion down the pressure gradient in a manner that attempts to reduce the gradient. Gradients being responsible for all spontaneous exchanges.
This is the current circulation over North America.
http://images.tinypic.pl/i/00954/ikzhif0ult42.png
Roy,
Tell me about it. I’m home from work in a blizzard that was only supposed to be not more than 6 inches 18 hours ago. I live in central NJ on the coast. We’re predicted to get up to 18 inches here.
It’s worth watching. Snowstorm in New York.
http://www.earthcam.com/cams/newyork/timessquare/?cam=tsstreet
New York Radar
https://www.accuweather.com/en/us/new-york-ny/10007/weather-radar/349727
Current situation. The blow goes north.
http://pics.tinypic.pl/i/00954/djyl9vtihugy.png
Obviously (following the logic of the alarmists) the beginning of cooling for the entire planet! Uh oh! Start hoarding. Rice beans make a complete protein. Just saying. hashtag100,000yearsofice.
The center of low is now on New Brunswick. The pressure in the center dropped to 957 hPa.
https://scontent-frt3-2.xx.fbcdn.net/v/t31.0-8/26197824_757569757782306_6257867039412013057_o.png?oh=60a75b7fe28933d1de429f00cb16dfda&oe=5AFA2522
The temperature drops very strongly over the Great Lakes.
http://images.tinypic.pl/i/00954/g8ulam6hqq8b.png
The temperature on the Peninsula of Michigan.
http://pics.tinypic.pl/i/00954/ujmckaxyr1f2.png
Another cold night in the south of the US.
http://images.tinypic.pl/i/00954/rgj1ky3eoova.png
Crane Lake, Minnesota
Current Conditions – C As of 1:52 AM on Friday 5 Jan 2018 (Local Time)
M Cloudy Mostly Cloudy
-36C
Feels Like: -36
Wind Chill: -36 Ceiling: 5730.2
Heat Index: -36 Visibility: 16.09k
Dew Point: -39 Wind: 0kph
Humidity: 80% Direction: 220SW
Pressure: 1036.91mbar Gusts: NA
Low will move in the direction of the Labrador Sea.
https://earth.nullschool.net/#2018/01/06/0300Z/wind/surface/level/overlay=mean_sea_level_pressure/orthographic=-88.50,61.16,519/loc=-91.879,49.200
Ren’s new record: 63% of comments so far.
So the ren trend is strongly positive.
The Gulf Stream is very warm.
http://www.ospo.noaa.gov/data/sst/anomaly/2018/anomw.1.4.2018.gif
Frozen Boston. Temperature -12 C and will drop.
In 5 days there is a chance to increase the temperature in the US and fall in Europe.
http://www.cpc.ncep.noaa.gov/…/gif…/gfs_z100_nh_f120.png
Sorry.
http://files.tinypic.pl/i/00954/jwpg5282zwdl.png
Roy: Santer (2005) claimed to show that short term changes in Ts are amplified in the upper tropical troposphere (T2). He actually merely showed that the standard deviation of T2 was 1.3-1.5 bigger than Ts. Given that Ts is in contact with an ocean of high heat capacity, this finding has been misinterpreted. I can only find three temperature changes (without volcanos perturbing T2) in his [smoothed] data large enough to measure, two with significant amplification and one without. You have occasionally posted graphs here comparing changes in T2 to Ts. To my eye, the recent El Nino looks very different than the 97/8 one in this regard, but I am not looking at data from the tropics. There are some other strong signals since Santer’s work. I would be interested in anything you might post.
There may be some big game here. The absence of amplified warming on decadal time scales is already a major problem, but everyone believes the MALR is in control on shorter time scales and Santer (2005) is a key reference. The importance of the ocean at minimizing the variability in Ts compared with T2 could be assessed by looking at the zonal variation in this ratio. Models presumably don’t predict much amplification outside the tropics.
I would love to see Al Gore explaining all the snow falling on the USA, didn’t he say it would be a thing of the past?
Did he? I doubt it.
It wasn’t Gore. The Independent headline said that, paraphrasing (incorrectly) David Viner from CRU:
https://wattsupwiththat.files.wordpress.com/2015/11/snowfalls-are-now-just-a-thing-of-the-past-the-independent.pdf
Gore said the entire north polar ice cap to be completely ice free by 2013.
Cite?
And even if he did, that makes him wrong, but hardly invalidates the existence and seriousness of AGW.
I find it difficult to take you seriously when you dismiss all scientific research that does not support ACO2.
What research is that?
What happened with the cite for Gore saying the Northern ‘polar ice cap’ would be gone by 2013?
There isn’t one. Gore didn’t say it.
Fixating on Gore (and especially mistaking other people’s words for what he says) only establishes that it’s a political, instead of scientific interest in the discussion, and a 2 dimensional one at that (if it isn’t automatically).
Soon La Nińa will cut off the inflow of water vapor from the tropics to the north of the Atlantic.
http://tropic.ssec.wisc.edu/real-time/mtpw2/product.php?color_type=tpw_nrl_colors&prod=natl×pan=24hrs&anim=html5
Eyeballing the years covered in UAH record, I see about 1.4 total degrees warming anticipated for a century of duration. It looks like it is linear (or more specifically a combination of a linear trend with oscillations–PDO, etc.–which produces a step-up shape) and not accelerating.
layman…”Eyeballing the years covered in UAH record, I see about 1.4 total degrees warming anticipated for a century of duration. It looks like it is linear…”
It rises pre-1997 with a re-warming trend then flattens out for 18 years. The trend quoted of about 0.12C/decade is based on number crunching. It fails to acknowledge real, physical events like you have cited and perhaps mysterious events that are not yet understood.
Am I also right to think that periods of extensive (even record) cold and snow are to be expected in certain locations with a warmer climate: the warmth means more energy into the system thereby moving the cold air from the polar regions to a greater global extent? This makes sense to me anyway.
I’m reading some climate scientists saying this cold blast could be an Arctic air breakout due to a weakening jet stream. But there still seems to be a lot of uncertainty. I thought this article did a good job of discussing them:
https://www.nytimes.com/2018/01/03/climate/cold-climate-change.html
ren says:
November 4, 2017 at 3:24 PM
Sorry.
I do not know why Americans are worried about CO2 when them will face harsh winter?
Lots them winter like.
Brainerd, Minnesota
Current Conditions – C As of 11:38 AM on Friday 5 Jan 2018 (Local Time)
P Cloudy Partly Cloudy
-22C
Feels Like: -28
Wind Chill: -28 Ceiling: NA
Heat Index: -22 Visibility: 11.27k
Dew Point: -27 Wind: 6kph
Humidity: 80% Direction: 340NNW
Pressure: 1038.61mbar Gusts: NA
Probably in January, there will be more snowstorms on the east coast.
http://pics.tinypic.pl/i/00954/ges3apq5zo01.png
The sharp decline in the AO index.
http://www.cpc.ncep.noaa.gov/products/precip/CWlink/daily_ao_index/ao.obs.gif
The image of the storm also shows snow on the southeast coastal plain — from Georgia to the northeast until it is lost under the edge of the clouds.
Nice.
Perhaps it is worth seeing the polar vortex at the height of 45 km, at the top of the stratosphere?
http://www.cpc.ncep.noaa.gov/products/stratosphere/strat_a_f/gif_files/gfs_o3mr_01_nh_f00.png
La Nińa directs water vapor along the equator to the west.
http://tropic.ssec.wisc.edu/real-time/mtpw2/product.php?color_type=tpw_nrl_colors&prod=epac×pan=24hrs&anim=html5
down 59% now trend is
Index Nińo 3 has fallen below -1.5 degrees.
https://www.tropicaltidbits.com/analysis/ocean/nino3.png
I understand prof, when you are watching your belief system circling the bowl all you have left is irrational sarcasm
Thanks. This is the case when there are no arguments.
Don’t you get fed up sculling past all this gibberish?
I certainly do. ren is like a virus who comes into a cell and takes it over for his own purposes.
DA…”I certainly do. ren is like a virus who comes into a cell and takes it over for his own purposes”.
As one of my Scottish compatriots once claimed about people like you:
O wad some Power the giftie gie us
To see oursels as ithers see us!
…Robert Burns
Loosely translated:
Oh, would some power the gift to give us,
To see ourselves as others see us.
He was speaking to a louse.
I don’t regard ren as anyone other than someone who is genuinely trying to share good, on-topic information. Why he irks you is a mystery.
Could it be that the real world weather he provides contradicts your AGW version of the world?
High pressure will remain in the east of the US. There will be a lot of snowfall in Greenland.
https://earth.nullschool.net/#2018/01/07/0600Z/wind/isobaric/1000hPa/overlay=mean_sea_level_pressure/orthographic=-92.55,42.55,519/loc=-82.358,40.315
Current pressure in the northern hemisphere.
https://earth.nullschool.net/#current/wind/isobaric/700hPa/overlay=mean_sea_level_pressure/orthographic=-129.66,93.39,342/loc=-34.850,76.318
30-day average SOI index has fallen from +11 to -4.
What’s it to be? The end of La Nina?
The impact of the weather in the United States has both the state of the stratospheric polar vortex and La Nia.
http://pics.tinypic.pl/i/00954/s8rdk4iybdwa.png
Low temperature in the south-eastern Pacific enables continuous high pressure. So the wind blows west.
http://www.ospo.noaa.gov/data/sst/anomaly/2018/anomp.1.1.2018.gif
High pressure is visible in the south-eastern Pacific.
http://files.tinypic.pl/i/00954/he9mz5cg6z7p.png
Climate Crisis? Al Gore and Michael Mann Fail Science 101
In this post I will address Michael Manns assertion that record cold temperatures are the result of man-made CO2 as detailed in a recent Climate Reality Project article, mentioned by Al Gore in his Tweet. Before I go any further, without addressing any of his claims, the important take home is that even if Al Gore and Michael Mann are 100% correct in their analysis and conclusion, the solutions they offer will only make matters worse.
If CO2 causes more draught, biofuels like Ethanol are idiotic solutions as best.
If CO2 causes more rain, then solar is an idiotic solution at best.
https://co2islife.wordpress.com/2018/01/05/climate-crisis-al-gore-and-michael-mann-fail-science-101/
Extremely low minimum temperatures in the east US.
http://images.tinypic.pl/i/00954/abuww498ve3o.png
ren, those temperatures are in Celsius, not Fahrenheit. I live in the middle of your map at 3,000 ft elevation and my morning low was 1.6 F. Not so unusual for this time of the year…
Sorry. You know better.
Minimum temperatures in the south of the US.
http://pics.tinypic.pl/i/00954/2qdo41kk0qur.png
In the center of the high pressure the pressure reaches almost 1040 mbar.
Erie, Illinois
Current Conditions – C As of 6:50 AM on Saturday 6 Jan 2018 (Local Time)
View 1 Active Weather Alert
P Cloudy Partly Cloudy
-26C
Feels Like: -26
Wind Chill: -26 Ceiling: NA
Heat Index: -26 Visibility: 16.09k
Dew Point: -29 Wind: 5kph
Humidity: 73% Direction: 310NW
Pressure: 1038.94mbar Gusts: NA
Raw METAR from closest station (KCWI):
The pace of freezing of Lake Erie.
https://coastwatch.glerl.noaa.gov/statistic/ice/gif/e2017_2018_ice.gif
Solar activity falls. The solar wind speed is extremely low.
The jet stream will fall far to the south.
http://files.tinypic.pl/i/00954/jjw9fsi9i9rr.gif
Climate Change Double Standard Double Speak Proves Slimate Clience is a Fraud
Climate Expert Al Gore then Tweeted about Climate Guru Michael Manns new article about how the record cold is in fact evidence and the expected outcome of global warming, sorry climate change. I cover that article in another post. Liberals didnt attack Al Gore or Michael Mann, they just believe it when Al says it, and dont believe it when President Trump says it. They are like unthinking Pod People, blindly obeying a central authority, never really thinking about their actions, they just follow instructions.
https://co2islife.wordpress.com/2018/01/06/climate-change-double-standard-double-speak-proves-slimate-clience-is-a-fraud/
I think the extremes of both sides being given the loudest voices is not good for science. Unfortunately with the media the most extreme voices are given the most air time.
Media Mantra: Be afraid, be very afraid. (We’ll tell you what of)
Got in from the road early this Saturday morning and was curious what the conditions were at the summit of Mt. Washington. Went to the official weather observatory site and these were the conditions.
Current conditions:
Summit Conditions
Temperature -32F
Gust 102 mph
Wind 90 mph
Wind Chill -85F
Direction 290(WNW)
Last Updated Saturday, January 6 2018 3:06 AM
The summit of that mountain is subject to radical changes in weather/temperature at about any time since the jet stream tends to dip down over it. It really is a pretty amazing place and especially so because as mountains go, it’s really just a baby.
It was one heck of a storm. That is for sure. Joe Bastardi, Dr. Roy Spencer, and a few others covered the storm really well with no hype. I am glad winter has made a comeback this season! 🙂
Weak low not penetrate the southeast US.
http://files.tinypic.pl/i/00954/ai8z7fgtwrzp.png
Ren, could you please put all your reports in one thread instead of starting a new thread every time?
This applies to the current situation.
Low temperatures in the state of New York.
http://images.tinypic.pl/i/00954/jl18gek6x2pw.png
What will happen now with the stratospheric polar vortex?
1. A weak solar wind increases the galactic radiance.
2. Galactic radiation is focused on magnetic poles.
3. Cosmic radiation breaks down the ozone particles.
4. Magnetic field in the Arctic regions. In fact, there are now two maxima, one over central Canada, the other over Siberia.
http://www.geomag.nrcan.gc.ca/images/field/fnor.gif
As a result, the stratospheric polar vortex will form two centers – one over Canada, the other over Siberia.
Galactic radiation is focused over the magnetic pole.
http://sol.spacenvironment.net/nairas/Dose_Rates.html
This is the forecast of stratospheric polar vortex.
http://www.cpc.ncep.noaa.gov/products/stratosphere/strat_a_f/gif_files/gfs_z100_nh_f72.png
Visible effect of the magnetic field on the polar vortex.
https://i2.wp.com/images.tinypic.pl/i/00954/9esniqzpz2rf.png
The temperature in the morning in New York.
http://images.tinypic.pl/i/00954/opesbk04repm.png
Very high pressure on the US east coast to 1038 mbar.
http://pics.tinypic.pl/i/00954/k6gw7xnvglfq.png
Currently, the magnetic activity of the Sun is minimal.
http://pics.tinypic.pl/i/00954/uk8l4z4zjjgp.gif
Strong snowfall on the Erie and Ontario lakes.
Erie International Airport
http://www.yourerie.com/skycam-cameras/erie-international-airport-tom-ridge-field-skycam
The great snowstorm is moving northeast US.
http://images.tinypic.pl/i/00954/8efizkabpu8m.png
In the following days, high pressure over Scandinavia will strengthen. In the US, temporary warming.
http://www.cpc.ncep.noaa.gov/products/precip/CWlink/blocking/real_time_nh/forecast_1_nh.gif
Increase in solar wind speed and geomagent activity. The power of the jet stream will increase.
Sorry. Increase in solar wind speed and geomagnetic activity.
The polar vortex forecast shows a severe winter attack in North America.
https://earth.nullschool.net/#2018/01/15/0600Z/wind/isobaric/70hPa/overlay=mean_sea_level_pressure/orthographic=-99.15,81.40,342
Severe winter storm moves east the US.
https://www.facebook.com/719393721599910/photos/a.720324898173459.1073741829.719393721599910/760273947511887/?type=3&theater
Extremely low temperatures in the Canadian province of Ontario.
http://files.tinypic.pl/i/00955/770myufbd7zk.png
Forecast pressure on January 14.
http://pics.tinypic.pl/i/00955/ngqmwj4zl100.png
First rain, then freezing rain, then snowstorm and frost in the northeast of the US and Canada.
http://images.tinypic.pl/i/00955/wxrlnfahi3qv.png
Temperature in Minnesota before dawn.
http://images.tinypic.pl/i/00955/73tmcimf4w0d.png
Wow, she is one of the most beautiful girls I have seen
https://www.youtube.com/watch?v=xNa58FQbCfc
The magnetic activity of the Sun since 2015 was quite high for this solar cycle. It particularly increased in September 2017. This allowed La Nińa to develop and activate hurricanes. In December 2017, a large drop is already visible. This activity was mainly associated with coronal holes. Coronal holes in front of Earth send fast streams of solar wind.
http://services.swpc.noaa.gov/images/solar-cycle-planetary-a-index.gif?time=1515376202000
The minimum temperature in North America on 01.19.2018.
http://pics.tinypic.pl/i/00955/h8xb0ciw2rmi.png
The extent of snow cover in North America has reached the upper level of normal.
https://www.ccin.ca/home/sites/default/files/snow/snow_tracker/na_sce.png
The polar vortex is a little stronger. It becomes more compact. This will allow the inflow of warm air to the south of the USA.
http://www.cpc.ncep.noaa.gov/products/stratosphere/strat_a_f/gif_files/gfs_z70_nh_f00.png
Low that will form in the central US will bring heavy snowfall on its northern and western sides.
https://www.facebook.com/719393721599910/photos/a.720324898173459.1073741829.719393721599910/763698043836144/?type=3&theater
In North America low that which brings snow on the west side, it will move towards the Great Lakes.
http://virga.sfsu.edu/gif/18012200_jetstream_h24.gif
Current situation. A very strong wind from the northwest.
http://pics.tinypic.pl/i/00956/qixqvz5radee.png
A large drop in temperature in Alaska.
http://files.tinypic.pl/i/00956/vgksgzv40no6.png
Earthquake 7.9 on the Richter scale off the coast of Alaska.
http://files.tinypic.pl/i/00956/68q21nirdqo2.png
In North America, the temperature returns to normal.
http://pics.tinypic.pl/i/00956/am7jakeig6jy.png
At the beginning of February 2018 the temperature in central North America may drop as many a dozen degrees C below normal.
https://scontent-frx5-1.xx.fbcdn.net/v/t1.0-9/19260619_181456019114563_6205769843991330345_n.jpg?oh=e525a140f60f1d9c3f3b4e5c9fc8df2c&oe=5B25B3AC
The frost returns to eastern Canada and northeast US.
http://pics.tinypic.pl/i/00956/2tzofgmix1s3.png
Nińo 3,4
2017 -0.34 -0.01 -0.09 0.22 0.30 0.22 0.22 -0.18 -0.56 -0.52 -0.84 -99.99
-99.99
5N-5S 170W-120W
HadISST
Anomaly from 1951-2000
The forecast for January 28 is very winter for North America. High pressure in the center will pull arctic air, and low in the east means snow.
http://pics.tinypic.pl/i/00956/nzyl2q3l35c7.png
What temperature will be in North America at the beginning of February 2018?
http://images.tinypic.pl/i/00956/lvn8hz3its82.png
Monthly Nio-3.4 index
2017 1 26.12 26.45 -0.33
2017 2 26.68 26.66 0.02
2017 3 27.33 27.21 0.12
2017 4 28.04 27.73 0.30
2017 5 28.30 27.85 0.45
2017 6 28.06 27.65 0.41
2017 7 27.54 27.26 0.28
2017 8 26.70 26.91 -0.21
2017 9 26.29 26.80 -0.51
2017 10 26.15 26.75 -0.60
2017 11 25.74 26.75 -1.01
2017 12 25.62 26.65 -1.03
http://origin.cpc.ncep.noaa.gov/products/analysis_monitoring/ensostuff/detrend.nino34.ascii.txt
Looking at many different sources is good.
While MEI confirms a bit
https://www.esrl.noaa.gov/psd/enso/mei/ts.gif
https://www.esrl.noaa.gov/psd/enso/mei/table.html
Japan’s Met Ag has a more differentiated view on the stuff, with a longer range of evaluation:
http://ds.data.jma.go.jp/tcc/tcc/products/elnino/elmonout.html#fig2
SOI growth and heavy rainfall in Australia.
https://www.longpaddock.qld.gov.au/seasonalclimateoutlook/southernoscillationindex/30daysoivalues/
http://pics.tinypic.pl/i/00956/f5oj9dix0zv0.png
What counts are the facts and wind.
http://www.ospo.noaa.gov/data/sst/anomaly/2018/anomp.1.25.2018.gif
Americans get ready for the polar vortex.
http://pics.tinypic.pl/i/00956/d53xsk5836dt.png
Volcano Mayon has been under Alert Level 4signifying that a hazardous eruption is imminent, possibly within dayssince Monday.
Let’s analyze the current polar vortex pattern in the lower stratosphere. Please see that in the west the isobars from the Western Arctic reach the north of the USA. That is why the Arctic air already starts to reach to the Northen USA. The circulation in the stratosphere has an impact on the jet stream. The difference between these levels is 100 hPa. However, the high speed of wind in the polar vortex and the stability of the circulation pattern in the stratosphere force the circulation in the tropopause. In the tropopause, the influence of water vapor (warmer air) is mixed with the influence of stratospheric ozone. Ozone particles are heavier than air and they fall from the upper layers of the stratosphere near the polar circle. Water vapor as lighter than air rises to the tropopause above the equator.
http://files.tinypic.pl/i/00957/79bhpp1pc2hh.png
http://files.tinypic.pl/i/00957/xeeroe8l6tvx.png
Arctic Blast is coming to the Great Lake.
http://pics.tinypic.pl/i/00957/gohi1vm4s3zd.png
I’m sorry: to the Great Lakes.
http://www.cpc.ncep.noaa.gov/products/stratosphere/strat_a_f/gif_files/gfs_z70_nh_f00.png