UPDATE(2/23/18): The previous version of this post had improper latitude bounds for the HadCRUT4 Tsfc data. I’ve rerun the results… the conclusions remain the same. I have also added proof that ENSO is accompanied by its own radiative forcing, a controversial claim, which allows it to cause multi-decadal climate change. In simple terms, this is clear evidence the climate system can cause its own, natural, internally-generated climate changes. This is partly what has caused recent warming, and the climate modelling community has assumed it was all human-caused.
Executive Summary
A 1D forcing-feedback model with two equivalent-ocean layers is used to model monthly global average surface temperatures from 1880 through 2017. Reflected shortwave (SW) and thermally emitted longwave (LW) forcings and feedbacks are included in an attempt to obtain the closest match between the model and HadCRUT4 surface temperatures based upon correlation and long-term trends.
The traditional radiative forcings included are RCP estimates of volcanic (SW), anthropogenic greenhouse gases (LW), and anthropogenic direct aerosol forcing (SW). The non-traditional forcings are ENSO-driven SW radiative forcing based upon the observed lagged relationship between CERES satellite SW radiative flux and the Multivariate ENSO Index during 2000-2017, which shows radiative accumulation (loss) during El Nino warming (La Nina cooling), and a non-radiative forcing of surface temperature proportional to ENSO activity since 1871 (MEI “ext” index).
Heat is pumped into the deep ocean in proportion how far the surface layer temperature deviates from energy equilibrium, with the proportionality constant chosen to match the observed average rate of heat accumulation in the 0-2000m layer between 1990 and 2017 from NODC data.
LW and SW feedbacks are adjusted in the model to optimize model agreement with observations, as is the model surface layer depth, and the ENSO non-radiative forcing strength. By incrementally changing the adjustable parameters, the model and observed surface temperature trends are matched and (using monthly running 12-month averages) a correlation of 0.88 is achieved from 1880-2017. The optimum effective depth of the surface mixed layer is 38 meters (equivalent to 54 m ocean, 0 m land in the global average), and the resulting model equilibrium climate sensitivity is 1.54 deg. C, which is less than half the average IPCC AR5 model sensitivity of 3.4 deg.
Curiously, the model surface temperature trend during 1979-2017 (+0.113 C/decade) is a much closer match to our UAH LT data (+0.128 C/decade) than it is to the HadCRUT4 data (+0.180 C/decade), despite the fact the model was optimized to match HadCRUT4 during 1880-2017.
It is also demonstrated that using either the model-generated, or the CERES-observed, radiative fluxes during 2000-2017 to diagnose feedbacks results in a climate sensitivity that is far too high, consistent with the published papers of Spencer & Braswell on this subject. Thus, CERES-derived radiative feedback, while useful for model comparison, should not be used to diagnose feedbacks in the climate system.
Background: CERES Radiative Fluxes Cannot be Used to Diagnose Global Feedbacks
I recently revisited the CERES-EBAF dataset of top-of-atmosphere (TOA) radiative fluxes, a multi-satellite best-estimate of those fluxes updated for the period March 2000 through September, 2017. When I examined the feedback parameters (regression coefficients) diagnosed from the new, longer data record, the result for the Net (thermally emitted longwave LW + reflected shortwave SW) was clearly unrealistic. The plot of monthly global radiative flux variations are shown in Fig. 1, for LW, SW, and Net (LW+SW) fluxes compared to global average surface temperature variations from HadCRUT4.
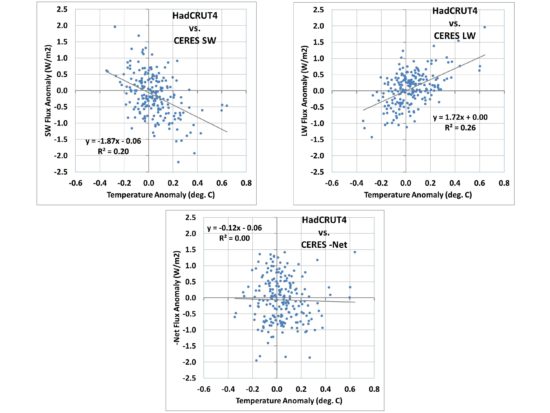
FIG. 1. Scatterplots of monthly global average anomalies in CERES SW, LW, and Net (LW+SW) radiative fluxes versus HadCRUT4 surface temperatures, March 2000 through September 2017. The negative sign of the regression result in the bottom plot is physically impossible if interpreted as a net feedback parameter in the climate system.
Significantly, the Net flux regression result in Fig. 1 (-0.12 W/m2 K) is physically impossible as a feedback interpretation, with the wrong sign. It would suggest that as the climate system warms, it traps even more radiative energy, which would produce an unstable climate system with runaway warming (or cooling).
The SW and LW regression results in Fig. 1 are at least possible in terms of their signs… at face value suggesting positive SW feedback, and for the longwave (compared to a temperature-only “Planck effect” value of 3.2 W/m2 K), the 1.72 W/m2 K value would suggest positive LW feedback, probably from water vapor (maybe high clouds).
As I will demonstrate, however, the regression coefficients themselves are not well related to feedback, and thus climate sensitivity. (The equilibrium climate sensitivity is computed by dividing the theoretically-expected radiative forcing from a doubling of atmospheric CO2 [2XCO2], 3.7 W/m2, by the Net feedback parameter, which must be positive for the climate system to be stable [all IPCC models have Net feedback parameters that are positive]).
We have published a few papers on this subject before, and it was the theme of my book, The Great Global Warming Blunder. I have, quite frankly, been disappointed that the climate research establishment (with the exception of Dick Lindzen) has largely ignored this issue. I hope that the work (in progress) I post here will lead to some renewed interest in the subject.
After spending some time (once again) trying to come up with some way to convincingly explain why the regression coefficients like those in Fig. 1 aren’t really a measure of feedback (without gnashing of teeth in the climate community, or journal editors resigning after publishing our paper), I decided to code up a simple 1D forcing-feedback model that would allow me to (1) explain the temperature variations since 1880 in a physically consistent way, and then (2) use the radiative output from the model during the CERES period (2000-2017) to show that the model-diagnosed feedback parameters indicate a much higher climate sensitivity than was actually specified in the model run.
In the rest of the post below, I believe I will convincingly demonstrate what I am saying… while also providing both an estimate of climate sensitivity from the last 137 years of climate variability, and explaining features like the pre-1940 warming trend, the post 1940 warming hiatus, and the post-1997 warming hiatus.
The 1D Energy Balance Forcing-Feedback Model
While striving for maximum simplicity while still explaining the observed data, I finally realized that the 20-layer ocean used in the model of Spencer & Braswell (2014) was needlessly complex, and the resulting criticism of our ocean heat diffusion scheme was a distraction from the core conclusions of the paper.
So, I’ve now convinced myself that all that is required is a 2-layer model, where the rate of deep ocean storage is simply proportional to how warm the surface layer gets compared to energy equilibrium. While not necessarily totally representative of how the ocean works, it does meet the IPCC expectation that as global temperatures warm, the deep ocean also warms, and allows a sink for a portion of the energy that accumulates in the surface layer. The proportionality constant for this is set to produce the same amount of average 0-2000m warming from NODC ocean heat content (OHC) during 1990-2017. We couldnt do this in our original work because estimates of 0-2000m OHC were not yet published (I contacted Sid Levitus at the time, and he said they were working on it).
The depth of the model top layer is an adjustable parameter that can be tuned to provide the best agreement with HadCRUT4 observations; it is assumed to represent a global average of an ocean mixed layer of constant depth, and assumed no net storage (or loss) of energy by land during warming (or cooling).
The model is based upon the commonly used forcing-feedback energy budget equation for the climate system, assuming temperature deviations are from some state of energy equilibrium (I know, that’s debatable… bear with me here):
ΔT/Δt = [F(t) – λ ΔTsfc]/Cp
This equation simply says that the temperature change with time of a system with heat capacity Cp is related to the time-varying forcings F (say, excess radiative energy forced into the system from anthropogenic GHG accumulation) minus the net radiative feedback (radiative loss by the system proportional to how warm it gets, with λ being the net feedback parameter with units W/m2 K). The net feedback parameter λ implicitly includes all fast surface and atmospheric feedbacks in the system: clouds, water vapor, lapse rate changes, etc.
In our case, there are two model layers, the forcings are several, and there is a transfer of energy between the two ocean layers. Importantly, I also separate out the LW and SW forcings (and feedbacks) so we can ultimately compare the model results during 2000-2017 with the CERES satellite measurements during the same period of time.
The model radiative forcings include the RCP6.0 anthropogenic GHGs (assumed LW), volcanic aerosols (assumed SW), and anthropogenic aerosol direct forcing (assumed SW). The indirect aerosol forcing is excluded since there is recent evidence aerosol forcing is not as strong as previously believed, so I retain only the direct forcing as a simple way to reduce the total (direct+indirect) anthropogenic aerosol forcing.
As Spencer and Braswell (2014) did, I include an ENSO-related SW radiative (and a little LW) forcing, proportional to the MEI extended index (1871-2017). I use a total value of 0.23 W/m2 per MEI index, initially calculated as 0.20 by regression from how much average CERES SW energy accumulation (loss) there is averaged over the 1 to 3 months before El Nino (La Nina) during the updated CERES data record (March 2000-September 2017). The SW and LW forcing values were adjusted slightly as the model was run until the model lag regression coefficients of MEI versus radiative flux matched the same metrics from CERES observations. I have added the following intermediate figure to demonstrate this controversial claim: that ENSO involves not only a change in the vertical temperature structure of the ocean (non-radiative forcing of surface temperature), but that radiative changes precede ENSO; that is, ENSO provides its own radiative forcing of the climate system:
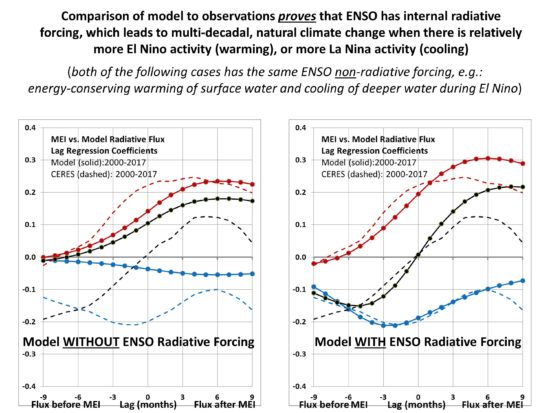
Intermediate Plot A: The CERES observed relationship between radiative flux and ENSO activity can ONLY be explained by invoking radiative forcing prior to ENSO. This significantly impacts the “feedback” interpretation of CERES radiative fluxes, decorrelating their relationship to temperature, thus giving the illusion of an excessively sensitive climate system if one interprets the regression slopes as only due to feedback.
The ENSO non-radiative forcing (e.g. warming of the surface layer during El Nino, with an energy-equivalent cooling of the deeper layer, due to a global-average reduction in the rate of ocean overturning) is directly proportional to the MEI index value, with no time lag. It is tuned to help maximize the match between modeled and observed ENSO warming and cooling episodes in surface temperatures.
Significantly, I have adjusted the MEI values by a constant so that their sum during 1871-2017 is zero. This is to avoid expected criticism that the MEI index could be inadvertently driving a net gain or loss of energy by the model climate system over this time because it has a net high bias. (This is indeed a possibility in nature; I note even that with the mean removed, there is a small upward linear trend in the MEI, corresponding to a radiative forcing of -0.08 W/m2 in 1871, linearly increasing to +0.08 W/m2 in 2017 using my CERES-derived coefficient; I have not looked at how much this trend affects the results, and it might well be that La Nina activity was more prevelant in the late 1800s and El Nino more prevalent in the last 20th Century). Here is what the MEI time series looks like, on an expanded scale so you can see how the 10-year trailing averages of MEI reveals interdecadal variations, which are an important component of global temperature variability:
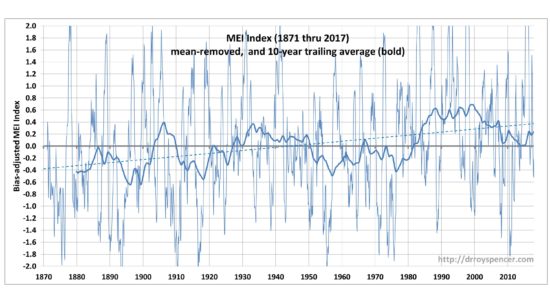
Intermediate Plot B. The merged and biased-adjusted extended MEI time series, 1871 through 2017, revealing decadal time scale variability in the trailing 10-year averages. This decadal variability, combined with both radiative and non-radiative forcing of surface temperatures related to MEI causes much of the multidecadal temperature variations we have experinced in the instrumental record.
As mentioned above, the rate of deep-ocean heat storage is simply assumed to be proportional to how far the surface layer temperature departs from energy equilibrium… the warmer the surface layer gets, the faster heat is pumped into the model deep ocean. The proportionality constant is tuned until the model produces an average deep-ocean (0-2000m) heating rate of 0.51 W/m2 over the period 1990 through 2017, matching NODC data after being modified by the global coverage by ocean (71%), and assuming the land does not store (or lose) appreciable energy.
The model is entered into an Excel spreadsheet with each row being a one month time step. It is initialized in the year 1765, which is when the RCP radiative forcing is initialied to zero. Correspondingly, the model temperature is initialized at zero departure from energy equilibrium in 1765 (this is not necessary if one believes the climate system was in the Little Ice Age at that time, but for now I want to make assumptions as similar to IPCC climate model assumptions as possible).
The adjustable parameters of the model are changed to improve the model fit to the HadCRUT4 data in real time in the Excel spreadsheet. For example, one parameter (say, the surface layer thickness) is adjusted until maximum agreement is reached. Then another parameter is adjusted (say, the LW feedback parameter) in the same way until further improvement is achieved. But then the other parameters must be re-adjusted. This iterative process is rather brute-force, but within a few hours one converges on a set of adjustable parameter values which produce the best results in terms of correlation and matching temperature trends between the model and HadCRUT4 observations.
Model Results
Fig. 2 shows one of many model realizations which comes close to the data, in terms of correlations (here about 0.88) and the same temperature trends. Note that the observed temperature time series has a 12-month smoother applied (click for large version).
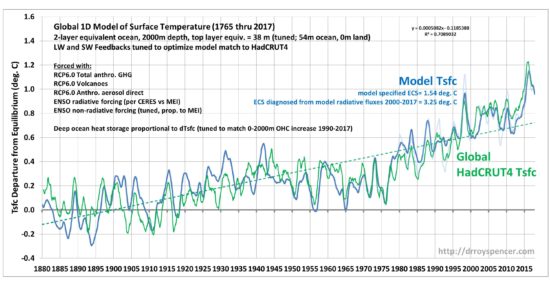
Fig. 2. One-dimensional time-dependent model of global average equivalent-ocean surface layer temperature departures from energy equilibrium (dark blue), using RCP6 radiative forcings, ENSO-related radiative and non-radiative forcing, and deep ocean storage of heat proportional to the surface layer temperature departure from equilibrium. HadCRUT4 surface temperature anomalies (12-month smoothed, red) are adjusted vertically on the graph to have the same average values as the model. The temperature trends lines (1880-2017, dashed) of the model and observations coincide, since part of the feedback tuning is to force the trends to match. The UAH LT temperature variations are shown in light blue.
Following are several significant findings from this modeling exercise:
1. the specified model feedback parameters correspond to an equilibrium climate sensitivity of only 1.54 deg. C. This is less than half of the IPCC AR5 model average of 3.4 deg. C, and in close agreement with the best estimate of 1.6 deg. C of Lewis and Curry (2015). As we already know, the IPCC models tend to overestimate warming compared to what has been observed, and the current study suggests their excess warming is due to the models’ climate sensitivity being too high.
2. Note that the ENSO activity during the 20th Century largely explains the anomalous warmth around the 1940s. In fact, this feature exists even with the anthropogenic aerosol forcing removed, in which case a warming hiatus exists from the 1940s to the 1980s. This is the result of the ENSO radiative forcing term (0.23 W/m2 per MEI index value) combined with stronger El Ninos before the 1940s and weaker ones from the 1940s until the late 1970s.
3. The warming hiatus from 1997 to 2016 is evident in the model.
4. The model trend during the satellite temperature record (1979-2017) shows much better agreement with the UAH LT (lower troposphere) temperatures than with HadCRUT4, even though HadCRUT4 was used to optimize the model (!):
Here are the 1979-2017 trends, and correlation with model:
Model: +0.113 C/decade
UAH LT: +0.128 C/decade (r=0.81)
HadCRUT4: +0.180 C/decade (r=0.85)
Compared to the model, the UAH LT trend is only 0.015 C/decade higher, but the HadCRUT4 trend is 0.067 C/decade higher.
5. We can take the model output radiative fluxes, which include both forcing and feedback, during the CERES satellite period of record (March 2000 through September 2017) to see if the “feedbacks” diagnosed from regression are consistent with the actual feedbacks specified in the model. What we find (Fig. 3) is that, just as Spencer & Braswell have been arguing, the feedback parameters diagnosed from the radiative flux and temperature variations lead to regression coefficients quite far from those specified:
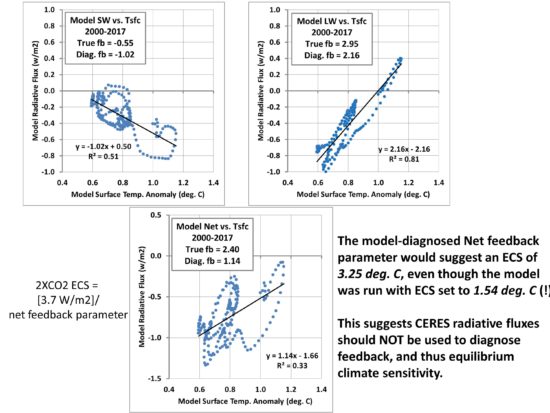
Fig. 3. Model diagnosed feedback parameters for the same period as the CERES satellite radiative flux record (March 200 through September 2017) shown in Fig. 1. Significantly, the model-diagnosed feedback parameters (regression slopes) are far from those specified in the model, leading to a gross overestimation of climate sensitivity if interpreted as feedback parameters.
The ECS thus (incorrectly) diagnosed from the model radiative fluxes is 3.25 deg. C, even though the feedbacks specified in the model have an ECS of 1.54 deg. C! This supports our contention that use of CERES radiative fluxes to estimate ECS will lead to overestimation of climate sensitivity (e.g. Spencer & Braswell, 2011). The cause of the problem is time-varying radiative forcing internal to the climate system contaminating the radiative feedback signal.
Note that there is less scatter in the model plots (Fig. 3) that in the observations (Fig. 1). This is mainly due to the observations in Fig. 1 having far more sources of internal radiative forcing than the one specified in the model (only ENSO-related). Contrary to what the IPCC seems to believe (and what Andy Dessler has argued to me before), there are all kinds of non-feedback radiative variations in the climate system, internally generated by chaotic variability not caused by temperature changes. Cloud (and thus SW radiative flux) variations are NOT simply a response to surface temperature changes; some of those temperature changes are due to cloud variations caused by any number of atmospheric circulation-related changes.
Put more simply, causation works in both directions between temperature and radiative flux; if causation is assumed in only one direction (temperature change => radiative flux change), then diagnosing feedback parameters from the data will lead to a bias toward high climate sensitivity.
Conclusions
The 1D model fit to the HadCRUT4 data is quite good, despite the simplicity of the model. The model climate sensitivity of only 1.54 deg. C is just within the IPCC’s likely ECS range of 1.5 to 4.5 deg. C, and well below the AR5 model average ECS of 3.4 deg. C.
I believe this is some of the strongest evidence yet that (1) the real climate system is relatively insensitive, and (2) feedbacks diagnosed from TOA radiative fluxes cannot be used to diagnose feedbacks, and thus climate sensitivity.
The above must be considered as a work in progress. Publication (if it is ever allowed by the IPCC gatekeepers) will require demonstration of the sensitivity of the model results to changes in the adjustable parameters. I do posts like this partly to help guide and organize my thinking on the problem.
It is also worth noting that one can do all kinds of experiments with such a simple model, such as exploring the effect of the inclusion or exclusion of various forcings on the model results. Some of this was done by Spencer and Braswell (2014) who found that inclusion of ENSO effects substantially reduced the model’s climate sensitivity.
References
Lewis, N., and C.A. Curry, 2015: The implications for climate sensitivity of AR5 forcing and heat uptake estimates. Climate Dynamics, 45 (3-4), 1009-1023.
Spencer, R. W., and W. D. Braswell, 2011: On the misdiagnosis of surface temperature feedbacks from variations in Earths radiant energy balance. Remote Sensing, 3, 1603-1613; doi:10.3390/rs3081603
Spencer, R.W., and W.D. Braswell, 2014: The role of ENSO in global ocean temperature changes during 1955-2011 simulated with a 1D climate mode. Asia-Pacific Journal of Atmospheric Sciences, 50(2), 229-237.
Very interesting, roy. I guess one immediate question is how do we know 1d model is adequate? It is ignoring all circulation of heat from tropics to arctic, correct?
The 1D model does not have to be fancy. Think of it this way: In nature, there ARE global averages of temperatures, radiative flux variations, OHC changes, etc. To the extent that basic global-average changes can be modeled with a simple 1D model, then that provides a useful constraint that can guide 3D model development. The main finding here (similar to our 2014 paper) is that including the observed effects of ENSO dramatically changes the inferred climate sensitivity. Using the observed history as a forcing (based upon its observed effect on the CERES-observed radiative budget) explains the periods of no warming, and more rapid warming. The IPCC models, as far as I know, have not done such things…they merely look at ENSO as “noise”, when in fact it can explain multi-decadal changes in global temperature trends.
You start simple, then get more complex as needed. Instead, the IPCC went, from the start, right to full-blown $100 million complex models requiring a marching army of experts to run. After billions of dollars of investiment and 30 years, they STILL say the ECS range is 1.5 to 4.5 deg. It’s time to take a step back and examine why there is still so much uncertainty. Use more observations as a GUIDE to what is happening in nature.
Ok, thanks much.
“Its time to take a step back and examine why there is still so much uncertainty.”
Past temperature uncertainty.
Scatterplots are not very useful for diagnosing feedback because they depend on the phase relationship between input and output. Phase lags can produce positive, negative, or neutral slopes, depending upon the dominant input/output components, regardless of whether the steady state response is positive or negative.
Dessler had an awful paper in which he proclaimed positive feedback this way. He was basically assuming zero phase lag, despite the fact that time series of the data had obvious input formations repeated in the output that were separated by months.
Things can be more precise but at the same time less accurate.
like for example, if you try to approximate noisy trend with a polynomial. if u take higgher order polynomil u’ll get better fit, but in most cases all u’d be doing is just measuring noise
Re: “Publication (if it is ever allowed by the IPCC gatekeepers)”
There’s no need to resort to that sort of paranoia. There’s no conspiracy against you; you’ve published your ideas before in the peer-reviewed literature, and your ideas been suitably responded to, both in the peer-reviewed literature and in the blogosphere.
I’d recommend people check out previous rebuttals to your line of reasoning. The following sources cite some of the relevant literature:
“Misdiagnosis of Earth climate sensitivity based on energy balance model results
[…]
For instance, M15 cite (Spencer RW, Braswell WD 2011), which was shown to have made four errors which invalidated the conclusions (Trenberth KE, Fasullo JT, Abraham JP 2011; Dessler AE 2011).”
http://engine.scichina.com/doi/10.1007/s11434-015-0806-z
“Climate variability and relationships between top-of-atmosphere radiation and temperatures on Earth
[…]
Spencer and Braswell [2010] highlighted some challenges for feedback diagnosis as they explored covariations between global TOA radiative flux and temperature, both at the surface and in the troposphere, and noted how most results have yielded generally low correlations. They found that the dominant source of the low correlation is the presence of time-varying radiative forcing generated internal to the climate system. The latter is really internal climate variability and weather fluctuations, as we explore more rigorously here. They conclude that cloud cover plays a key role, further emphasized in Spencer and Braswell [2011]. Their methods have been tested by several research groups [Murphy, 2010; Murphy and Forster, 2010; Dessler, 2011; Trenberth et al., 2011b] and found to be without merit. In particular, Spencer and Braswell confuse causality and fail to recognize the appropriate relations between El NioSouthern Oscillation (ENSO) and energy balance [see Trenberth et al., 2011b].”
http://onlinelibrary.wiley.com/doi/10.1002/2014JD022887/full
Oh, I’m fully aware of the past criticisms. I stand fully behind what we have done. There is no way they could have honestly looked into what we have and found it to be “without merit”. Our results are consistent with observed data, including lagged correlations between radiative fluxes and other variables…their interpretations cannot explain the observed data.
Read my post, rather than resorting to copying and pasting what supports your preconceived notions. If you don’t understand the basic physics, I suggest you ignore my blog entirely.
Re: “Read my post, rather than resorting to copying and pasting what supports your preconceived notions. If you dont understand the basic physics, I suggest you ignore my blog entirely.”
Oh, I’m already familiar with your debunked ideas, your long history of conveniently under-estimating tropospheric warming with the UAH team, your appalling curve-fitting with no concern for physical plausibility (as Barry Bickmore pointed out), how your ideas conflict with lots of evidence (including numerous paleoclimate estimates of climate sensitivity), etc.
But I still don’t think you’re as bad as John Christy. I think you honestly believe what you’re say, even if what you’re saying fits you’re ideologically-motivated, pre-conceived bias. In contrast, I don’t think John Christy believes much of what he says.
Anyway, can you explain your results in the context of a recent paper? That paper showed:
1) Evidence of climate responses predicted by climate models.
2) Changes in clouds predicted to occur from forcing by man-made greenhouse gases.
3) Evidence of clouds changing in the ways predicted with positive feedback.
Here’s the paper:
“Evidence for climate change in the satellite cloud record
[…]
Here we show that several independent, empirically corrected satellite records exhibit large-scale patterns of cloud change between the 1980s and the 2000s that are similar to those produced by model simulations of climate with recent historical external radiative forcing.
[…]
The primary drivers of these cloud changes appear to be increasing greenhouse gas concentrations and a recovery from volcanic radiative cooling. These results indicate that the cloud changes most consistently predicted by global climate models are currently occurring in nature.
[…]
Our results suggest that radiative forcing by a combination of anthropogenic greenhouse gases and volcanic aerosol has produced observed cloud changes during the past several decades that exert positive feedbacks on the climate system.”
You are 100% wrong in your thinking and this will be proven in the next few years as the warming which was natural ends.
Atomskas
I can hear you thumping the keys on your computer from way down under. Hope you put out your rubbish recycling out before you went to work
Regards
Ad hominem tirades like that have the opposite effect to what the author intended.
I’m a casual reader of this blog. A skeptic yes, but still open minded enough to consider intelligent comments by either side of the AGW discussion.
As for: “Ad hominem tirades like that have the opposite effect to what the author intended.”
I couldn’t agree more. Such remarks should be banned Dr. Spencer, before they even get published here. They only take away from the quality of your site.
The true temperature trend was has been at the top of UAH predictions. Not a shock climate sensitivity is at the bottom of IPCC predictions. Both sides will be surprised at the truth. The science has barely even started.
atomsk…”Oh, Im already familiar with your debunked ideas, your long history of conveniently under-estimating tropospheric warming with the UAH team, your appalling curve-fitting with no concern for physical plausibility (as Barry Bickmore pointed out), how your ideas conflict with lots of evidence (including numerous paleoclimate estimates of climate sensitivity), etc”
Enough said, you’re an eco-weenie climate crank. Nothing to see here folks, move on. Roy and John from UAH have real, physical data, what have you got except a sour disposition and believing the social science in your unvalidated models?
I don’t know who you are, but your crack about John Christy tells me you are about as biased as they come, and uninformed as well. I’ve known John for 25 years, and your comment about him just got you banned. Bye.
Claims to be Atom—,
Atoms make up everything.
(Sorry. Couldn’t resist.)
Anyone who honestly believes John Christy is not at least sincere in his professional beliefs is surely boarder-line psychotic, and not worthy of serious consideration.
md mill..”Anyone who honestly believes John Christy is not at least sincere in his professional beliefs is surely boarder-line psychotic, and not worthy of serious consideration”.
You are describing Hillary Clinton. During a senate hearing in which John testified, she sat absolutely glaring at him with folded arms. That’s the reason I hooted with delight when Trump beat her, even though I don’t support his brand of politics.
I would have thought a politician of her stature would have taken an interest in the data being presented by a guy like John, considering his total integrity. Compared to types like Gavin Schmidt and Michael Mann he’s an absolute gem of a scientist, and unlike both of them, John has an actual degree in climate science.
Why does the debate have to be ad hominem? Stick with verifiable facts and constructive ideas.
Hear, hear. The old debate club adage “They will call you names when they have nothing intelligent left to say” is very true.
“Stick with verifiable facts and constructive ideas.”
And predictions that can be falsified. And on that very subject what does this model predict for the next 5-10-15-20 years?
Dr. Spencer is correct, my only difference with him is I think the climate is all solar driven he does not.
Salvatore, do you think the Earth doesn’t emit any infrared radiation, or do you think CO2 doesn’t absorb it?
David,
A repetitious irrelevant gotcha. Obsessive compulsive possibly?
Cheers.
“…including lagged correlations…”
This is key. The papers I saw from Dessler et all assumed essentially instantaneous response. It is ridiculous to expect instantaneous response from such a massive system.
Except in your CO2 derivative plot.
The derivative match indicates a 90 deg phase lag between temperature and CO2 level.
How do you convert degrees to time?
Three months I guess, isn’t that quite instantaneous?
How do you convert degrees to time?
Divide by frequency.
Three months I guess, isnt that quite instantaneous?
No.
atomsk…”Their methods have been tested by several research groups [Murphy, 2010; Murphy and Forster, 2010; Dessler, 2011; Trenberth et al., 2011b]”
Why would that surprise anyone? Trenberth interfered in a peer review process so strongly over the paper that an editor felt forced to quit.
Trenberth was caught in the Climategate emails admitting warming could no longer be detected then he proposed a cockamamey theory that the ‘missing’ heat was being absorbed by the oceans.
Dessler lives in another dimension. He’s an uber-alarmist of the anal kind.
BTW, the energy budget of Kiehle-Trenberth is a crock. They have as much as admitted they made it up without physical evidence to back it.
Gordon again lies about Trenberth, despite being corrected several times. That’s pure dishonesty.
Kevin Trenberth:
“In my case, one cherry-picked email quote has gone viral and at last check it was featured in over 107,000 items (in Google). Here is the quote: “The fact is that we can’t account for the lack of warming at the moment and it is a travesty that we can’t.” It is amazing to see this particular quote lambasted so often. It stems from a paper I published this year bemoaning our inability to effectively monitor the energy flows associated with short-term climate variability. It is quite clear from the paper that I was not questioning the link between anthropogenic greenhouse gas emissions and warming, or even suggesting that recent temperatures are unusual in the context of short-term natural variability.”
http://www.cgd.ucar.edu/staff/trenbert/emails/
DA…”Gordon again lies about Trenberth, despite being corrected several times. Thats pure dishonesty”.
Corrected by whom, a wannabee science writer who interviews only climate alarmists? Talk abuout bias and dishonesty.
Corrected by Trenberth himself.
Are you going to deny even that, Gordon?
—
Wannabee science writer?
http://www.davidappell.com/publications.html
Wow, and Trenberth would have no vested interest in
putting his quote in a more favorable light?
Yes, he was worried about the short-term pause and
why they had no explanation for it so he came up with
one. No one claimed he was saying that CO2 did not
affect climate of that the GHG effect was not real. So,
this is a red herring. Many others came up with their own different
reasons for the pause. Then some decided there was
no pause and anyone who said there was should be
denigrated (while sparing those on the team who had
published papers trying to explain the pause). Now,
it is ok, if one is a climate scientist in favor to admit
there was a pause and that it may continue as soon as
temps from the latest El nino go back down.
I find Trenberth’s defense of his statement to be a diversion… a strawman defense.
In it, he does not refute what I understood his original statement to be.. that it was a travesty that they could not explain the influence of NATURAL climate variations which interfered with their desired interpretation that the system is always in stable equilibrium, unless HUMANS meddle with it.
So, all he is saying is he wasn’t admitting any doubts global warming theory..of course not…I wouldn’t expect Kevin to have any doubts.
But to the extent NATURAL climate variations exist, it confounds our interpretation of climate sensitivity.
David Appell, I wish you were unbiased enough to understand that. That is largely what my blog post is about!
Gordon Robertson says:
BTW, the energy budget of Kiehle-Trenberth is a crock. They have as much as admitted they made it up without physical evidence to back it.
Where did they say that? Citation please….
David Appell does not suffer from delusional psychosis?
Citation please . . .
Cheers.
AH. MATH!!!
It is all going to fall apart as we move forward and global temperatures start a significant decline.
This is about the past when solar activity was very high now things have changed.
“…the temperatures of earth will start a more significant decline (which started in year 2002 by the way)….”
-Salvatore del Prete, Reply to article: IC Joanna Haigh – Declining solar activity linked to recent warming, 10/8/2010
http://climaterealists.com/index.php?id=6428
Well spotted. I thought Salavatore has been consistently wrong for only 5 years.
Will 8 succesive failed predictions teach him some caution? I don’t think so.
There’s no evidence I know of to suggest that….
DA…”-Salvatore del Prete, Reply to article: IC Joanna Haigh ”
How have the models been doing, or the ridiculous predictions of AGW since 1988? I imagine you’ll want to sidestep that one.
Gordon, models don’t make predictions, they make projections.
Do you understand the difference?
Meanwhile:
http://blogs.reading.ac.uk/climate-lab-book/files/2014/01/fig-nearterm_all_UPDATE_2018-panela.png
http://www.realclimate.org/index.php/archives/2007/05/hansens-1988-projections/
https://tamino.wordpress.com/2014/03/21/hansens-1988-predictions/
DA…”Gordon, models dont make predictions, they make projections.
Do you understand the difference?”
Of course. The models are unvalidated, meaning they cannot predict anything. That does not stop stupid humans from making predictions based on their projections.
Actually, the IPCC were using them to make predictions till expert reviewer, Vincent Gray, pointed out the difference.
David,
From the Oxford dictionary, synonyms for projection –
estimate, forecast, prediction, calculation, prognosis, prognostication, reckoning, expectation
Maybe your invisible climatological dictionary contains different words. I can’t tell, because the climatological dictionary doesn’t seem to,exist, except in the fevered fantasies of Warmist fools.
Or maybe there is a completely different set of rules which apply to models and language, where Warmist fools are involved. What do you think?
Cheers.
I believe this is some of the strongest evidence yet that (1) the real climate system is relatively insensitive, and (2) feedbacks diagnosed from TOA radiative fluxes cannot be used to diagnose feedbacks, and thus climate sensitivity.
Agree with that and let me clarify when I said in the previous post it is all going to fall apart, I meant in regards to AGW theory.
Already overall oceanic temperatures are down from around +.35 c this summer to now +.145c.
Next item is albedo , the slightest of increases will wipe out all of the warming.
Again lower overall sea surface temperatures due to less UV light and an increase in albedo due to an overall more meridional atmospheric circulation, an increase in cloud/snow coverage and major volcanic activity all tied into very low sustained solar parameters which are now coming on should bring about global cooling and year 2018 should be the transitional year to this.
The test is on and we shall see.
Salvatore,
I hope only that you are wrong. Warm is good. Ice ages are bad. (subjective homo sapiens opinion, that)
About 3B people live in the tropics today. About 40% of humanity. How is warming good for them?
David,
You state 60% of people don’t live in the tropics.
How is warming good for them?
Cheers.
The tropics are not predicted to warm as much.
Have you been to tropics lately?
Just asking, because most of those places have single glazing, cold floors, and freaking cold nights with people wearing knit hats and thick coats.
We imagine tropics is day-time Sahara or jungle just before torrential rains. Most of it (in spacetime) is so cold my home with -20C outside is a heaven, because it is warm.
Perhaps we’ll evacuate Thailand to Siberia. I suspect Thais like Thailand more and won’t go.
The first sign of change was the increase in ice in Antarctica, related to changes in the polar vortex. It must have had an impact on the cooling of the southern ocean.
http://pics.tinypic.pl/i/00959/9kpwssryjac4.png
There is a visible relationship between the range of sea ice in Antarctica and the magnetic activity of the Sun.
https://services.swpc.noaa.gov/images/solar-cycle-planetary-a-index.gif?time=1517795403000
An 18-day graph is too short to say anything about anything.
As is 40 or 50 years.
Centuries from now, which records have been made and kept, then we can talk. Unfortunately we won’t be able to listen to David apologize for his wrong opinions.
Why is 40-50 years of data not indicative of climate change, Lewis?
David,
Another foolish Warmist attempt at a gotcha, I see.
The climate has been changing for four and a half billion years. Continuously. Are you like Michael Mann, who has apparently only become aware of this quite recently?
In any case, what’s your point?
Are you foolish enough to believe that you can predict the future by examination of the past?
Maybe you could consider the methods used by the Oracle of Delphi, Nostradamus, or Mother Shipton. Michael Mann uses bits of woods but they don’t seem to work terribly well. How about chicken entrails or sheep livers?
Do let me know how you fare, I’m sure many people would pay handsomely for the ability to predict the future. I don’t believe any Warmist fool can, of course, but I’m prepared to change.
Cheers.
Ren
Interesting graph!
The graph I found interesting was the first one:
http://pics.tinypic.pl/i/00959/9kpwssryjac4.png
Dr Spencer, the 800lb gorilla is the living room is the fact that the oceans are warming. How does CO2 warm the oceans? I can explain how warming the oceans drives higher CO2 (Henry’s Law) but I can’t explain how 13 to 18 micron LWIR can warm the oceans. If CO2 can’t warm the oceans, why is CO2 in the model?
CO2…”If CO2 cant warm the oceans, why is CO2 in the model?”
Because they have no other explanation, mainly because they refuse to look for one. There’s no money in natural processes.
If the air just above the sea surface increases in temperature, why wouldnt the ocean warm?
DA….”If the air just above the sea surface increases in temperature, why wouldnt the ocean warm?”
Because the oceans warmed the air?
No. First of all, the ocean surface is generally cooler than the surface air. And secondly, if the ocean is warming something, why is the ocean itself still warming?
DA…”if the ocean is warming something, why is the ocean itself still warming?”
It’s currently cooling.
I was swimming in the Pacific off the west coast of Vancouver Island on a rainy, cold, summer day. It was warmer in the water than the air was above it.
Makes no sense that the air would be warmer than the water since the atmosphere gradually cools with altitude. Are you confusing direct radiation on your skin with ambient air temperature?
Gordon Robertson says:
“Its currently cooling.”
No, the ocean is certainly not cooling. Data here:
http://tinyurl.com/dbjrlr
Visible radiation warms the oceans. To understand warming you have to understand why the oceans are warming. Only visible light warms the oceans, and if that is the case, you have to look at the sun and cloud cover.
David,
Because the oceans have an average depth of some 3500m, and denser water displaces less dense.
Anyone who believes that less dense warmer water sinks through denser cooler water, possibly slept through their physics classes,
NOAAS brightly coloured diagrams notwithstanding, solar radiation does not travel through 1000 m of ocean, to magically heat water at that depth.
Maybe it’s the new climatogical physics.
Cheers.
mike…”NOAAS brightly coloured diagrams notwithstanding, solar radiation does not travel through 1000 m of ocean, to magically heat water at that depth”.
When NOAA can fudge the North American temperatures to ignore the freezing weather this winter they are capable of any outright lie.
Gordon,
In what way did NOAA “fudge” anything? Where did they ignore freeing weather?
Present your evidence, or shut up.
David,
And if he does neither what then?
Will you unleash your awesome invisible powers of Warmist foolishness upon his sorry head?
Only joking. Maybe you could have a tantrum, or run to your mother. She can kiss it better for you, I’m sure.
Maybe you could follow your own exhortation to present your evidence or shut up. I would never say such a thing, of course. I’m far too polite.
Just a thought.
Cheers.
Take a gallon of water and blow a hair dryer on it and you won’t warm the water, you will cause evaporation and surface cooling. Also, warm air isn’t all due to CO2. CO2 can be blamed for the warming due only to the 13 to 18 micron LWIR. Those wavelengths are associated wtih -50 to -110 degree C temperatures. The oceans take vast amounts of energy to warm them, far more than the atmosphere can provide. Only the continual supply of energy from the sun can maintain or even warm the oceans. The only other source of warming would be geothermal. The atmosphere can’t warm the vast oceans, and the minuscule part of the LWIR spectrum associated with CO2 is even less likely. Once again, the only mechanism by which CO2 can cause warming is through the thermalization LWIR between 13 and 18 micro. Once again, there is very very very little energy between 13 and 18 micros, certainly nowhere near the energy needed to warm the oceans. If the oceans are warming, explain that warming and you explain the global climate and temperature. ONly the sun and geothermal warm the oceans.
Leave a gallon jug of cool water in a room and it will very gradually reach equilibrium in temperature with the air.The Earth appears to have warmed quite abruptly at the end of the last glaciation.The oceans are such a vast volume of water, could it be that they are still warming in response.
CO2isLife says:
February 23, 2018 at 11:07 AM
I previously performed experiments like the above and measured the water temperature. The water DID warm up. I reported it here in an argument and got nothing but excuses. The main excuse was that the warming went through the vessel, which was a good insulator, via conduction. I showed from simple heat-transfer considerations that the outside of the container would have had to have melted in order to transfer such an amount of heat…crickets. The other excuse was that the experiment was designed to be advantageous to heating the water by using a small amount of water. Yet nothing about the purported mechanism for being unable to heat the water changes with small volumes of water.
Instead, that complaint shows how the above version of the experiment is biased. 1 gal of water requires ~8.8 kJ of energy to warm 1 F. The energy transfer efficiency between the hair dryer and the water is probably poor, maybe a few percent. So a 1.5-kW hair dryer with 50% operation efficiency and 3% heat-transfer efficiency to the water would take ~13 min to heat the gallon to an easily measured warmer temperature with a low-tech thermometer like 2 F. Did the people making these claims about not warming the water consider these incredibly simple calculations and run their hair dryer that long? I think not, particularly when the normal version of the above experiment is described as a bathtub of water, which was take several hours to warm.
I disagree with much of what people like DA say, but this hogwash about not warming water from above is so easily debunked both theoretically and practically it’s not even funny. Yet when it’s done, results or just ignored or excuses are made. I’ve done it multiple times and in multiple ways. At this point, not even worth responding to beyond this.
-Scott
Nice experiment Scott. I would also suggest to CO2isLife, or others, to try the experiment with just a heat lamp. Preferably the kind that emits only or mostly IR. Shine it down on the gallon of water. Will it heat up? According to CO2islife, it won’t, maybe he should try it.
Scott, in nature the ‘hairdryer’ pushes cold or lukewarm air into cold of lukewarm water.
Around my place, the air temp is determined by sea water, but which gives heat to which is rather opaque. I’d say the major heat flow is from the Sun to water, from water to air, from air to the intergalactic space. It is just true that warmer dry air takes less heat from the water by conduction, but evaporates more.
So how hot was your hairdryer? You should be measuring a minimal effect from minimal warming (slowdown of coolingl of air, with humidity and wind speed of the nature. Not easy to debunk really. Theoretically much easier.
Last time I saw, the ocean was solid but if you insist, I’ll dig a hole and measure it to see if it is warmer ice than last year.
why, just because IR exchange with a water body is only in an extremely thin surface layer? Well, so is evaporation…and that’s the primary way most water bodies lose heat. If you reduce the evaporation the water heats up. After the Deepwater Horizon spill, a sheen of oil covered the NE Gulf of Mexico, reducing water evaporation. The buoys there showed a sharp increase in water temperature.
Dr Spencer,
Re the oil sheen.
Ocean oil sheen reduces evaporation, warming, decreases albedo, warming, reduces mixing by suppressing waves (see Kipling’s Knights of the Joyous Adventure and google Benjamin Franklin Clapham pond), reduces salt aerosol production by suppressing wave breaking which reduces low level stratus thickness, warming. Reduces surface mixing, increases stratification, reduces nutrient stirring and thus alters phytoplankton populations — damned if I know what this would do, but if I had to bet I reckon it would lead to less CO2 pull-down with the less discriminatory carbon fixation systems being preferentially selected*. Result, more CO2 with a C12 excess in the atmosphere which it would be easy to attribute to fossil fuel burning.
I posted on Professor Curry’s blog about this and she tried to get an aircraft to sample the atmosphere above the Deepwater Horizon spill, but the a/c was otherwise occupied. One of the great missed opportunities. With the fond eye of a crackpot theorist I can see the lack of aerosols devouring the clouds around the Gulf spill, but then I would, wouldn’t I? Maybe someone should have a look.
People don’t see oil sheen although it is everywhere. Having spent a lot of time over the water — I flew Vulcans from Cyprus (the Med is covered in sheen) and on maritime strike Buccaneers I saw it all around the UK. Most can be explained by river run-off (see https://seawifs.gsfc.nasa.gov/OCEAN_PLANET/HTML/peril_oil_pollution.html ) but some is deliberate. We reported one tanker which was washing its tanks in the middle of the North Sea.
I have one observation that I cannot explain. Flying down to Madeira (Airbus passenger, I’m long retired) I saw a smooth that covered literally thousands of square miles. It was sufficiently robust to stop wave breaking in a wind I estimated as Force 4. Gyre? But if so, how did the sheen last without being oxidised? What happens with an oil/synthetic surfactant mix, is it resistant to degradation? Does the Atlantic ridge leak light oils? Would synthetic surfactants which bacteria have found difficult to metabolise last long enough to form such a smooth? Dunno.
Anthropogenic warming by ocean surface pollution explains a lot – for example, Wigley’s ‘why the blip?’ is simple. There was a war on and there was a lot of oil about. It might also pay to check oil pollution during the first 20th century warming episode.
I just wish someone would have a look.
JF
*Some species respond to low nutrient levels by switching to C4 carbon fixing from their normal C3. C4 is less discriminatory against the light isotope.
Dr Spencer, the atmosphere immediately above the oceans that would drive that effect is saturated with H2O which also absorbs 13 to 18 micron…and far more of the LWIR spectrum. The fact that H20 and CO2 are present nullifies any impact of CO2. The problem with blaming CO2 is that H20 already traps all the LWIR between 13 and 18. With or without CO2 the same amount of LWIR would be trapped and thermalized. The marginal impact of CO2 above the surface of the water is negligible. Even if we assume CO2 causes the initial evaporation, the evaporation itself replaces the CO2 in a very short period. Evaporation is by definition H20 in the atmosphere, and that H20 traps the LWIR that CO2 traps. Also, as you pointed out, stopping evaporation causes warming. CO2 causes evaporation, and cooling. In this case, an increase in CO2 would cause cooling, not warming.
“Even if we assume CO2 causes the initial evaporation, the evaporation itself replaces the CO2 in a very short period.”
Perfect illustration of positive feedback.
CO2,
The ocean surface is a decent blackbody. If @ 20C, at night it is radiating ~ 400 W/m^2.
With no GHG in the atmosphere, this would be the net heat lost to direct to space, at 3K. With GHG, the sky is much warmer, so the net heat loss will be reduced < 400 W/m^2.
So GHG reduce cooling of the ocean at night, following its heating during the day.
Increase GHG, the oceans warm.
Nate,
No. A reduction in the rate of cooling is not heating. The temperature is falling, not increasing.
Maybe you cannot understand why oceans under ice (frozen water) do not freeze. Or why glaciers and ice caps are warmer at the bottom than the top.
Increase GHGs between the Sun and a thermometer, and the temperature of the thermometer falls. Deny all you like – it’s an inconvenient fact, I know.
Foolish Warmist. Try another tack? Magic, perhaps?
Cheers.
Do_ug._.Cot__ton – are you writing under the name “John._.Turner,” and assuming an education (PhD) you do not have?
“No. A reduction in the rate of cooling is not heating. The temperature is falling, not increasing.”
Ha!
Mike fails at first law of thermodynamics, again. Mike is not good at sciency stuff, like conservation of energy.
Mike, leave your house windows open this winter, you should still be cozy warm.
A reduction in the rate of cooling is not heating.
That’s why extra blankets on you bed cannot make you warmer – oh, wait a moment …
Nate, where does the heat under your blankets come from? Radiative forcing from above? The blankets reduce the loss of heat, they don’t heat.
Sorry my above comment was rather aimed at Steve.
Ben,
Indeed the human is the source of heat under the blankets, not the blankets. Nevertheless, having the blankets results in the person ending up warmer.
Similarly the sun is the source of heat for the Earth, not the GHG, Yet having the GHG results in a warmer surface.
That assumes all the heat is radiative. The warming in the atmosphere can also be due to conduction and convection. Radiation is very fast, whereas conduction and convection is very slow, so the radiative transfer of heat may actually work to cool the atmosphere. Everything is built to pull heat away from the earth, and radiation is the fastest way to cool the earth. CO2 only thermalizes 13 to 18 micron, so its temperature is between -50 and -110 degree C. You can see its impact about 15 K up where the temperature cools to that level, there is no H20, and those wavelengths get thermalized. You don’t even find a CO2 signature until you are up 3 or more km, and H20 starts precipitating out. Where you find CO2 in the atmosphere you can’t find a CO2 signature. There is no argument CO2 warms the atmosphere up where it is thermalizing 13 to 18 microns, but that is way up in the atmosphere, no where near the surface.
“That assumes all the heat is radiative.”
No, but without any GHG, all heat loss from the surface to space would be radiative.
As it is, radiative loss is a significant part of the ocean heat budget.
“CO2 only thermalizes 13 to 18 micron, so its temperature is between -50 and -110 degree C.”
Not sure how that follows.
This shows CO2 and water reducing OLR for clear sky over tropical ocean measured at a satellite, with useful discussion.
https://tinyurl.com/y6wqgf2m
It seems that effective Temp of CO2 is 215 K, at highest effective radiating level in atmosphere.
I think that there would be layers of CO2 also at lower levels with higher temperatures that the ocean would be seeing.
“The ocean surface is a decent blackbody. If @ 20C, at night it is radiating ~ 400 W/m^2.”
CO2 only traps 13 to 18 microns, a very very narrow band consistent with -50 to -110 degree C. There is no real energy in that band, certainly not enough to warm water. Test it is a lab.
“There is no real energy in that band, certainly not enough to warm water.”
Not sure what that means, that band contains a significant fraction of the total peak, many W/m^2.
nate…”So GHG reduce cooling of the ocean at night, following its heating during the day”.
1% of the atmosphere represented by GHGs can control the loss of heat from the oceans???
You represented the oceans as a blackbody, meaning S-B applies as Q = ebA(T^4 – To^4). Q represents the rate of cooling therefore it is dependent on the difference between T and To, where T = ocean temperature and To = atmospheric temperature.
Since when did gases making up 1% of the atmosphere become the controlling factor? 99% of the atmosphere is nitrogen and oxygen and they can scavenge heat directly from the ocean by conduction.
Methinks you alarmists make far too much of trace gases and cooling via radiation.
Gordon, “Since when did gases making up 1% of the atmosphere become the controlling factor? ”
Ive specifically answered this question a dozen times. Each time you have ignored it. Others have debunked it dozens of times. Every time you ignore these, and keep bringing it up. You have no interest in seeing counterfactual information.
GR is wrong again. The heat transfer from the oceans to the atmosphere above occurs via convection within the boundary layer as the air flows across the surface. Thermal energy gained by the atmosphere can not be radiated to deep space via O2 or N2, as they are not able to produce IR emissions in the spectrum corresponding to the temperature. Only radiationally active gases and surface emissions can produce the TOA emissions measured from space. Those measurements demonstrate the strength of the emissions from those greenhouse gases.
“So GHG reduce cooling of the ocean at night, following its heating during the day.”
The only GHG that matters in the lower atmosphere is H2O, so yes, GHGs do trap heat, but the only one that matters is H2O. You don’t even see a CO2 signature until you are up above where H2O precipitates out.
“With no GHG in the atmosphere, this would be the net heat lost to direct to space, at 3K. With GHG, the sky is much warmer, so the net heat loss will be reduced < 400 W/m^2."
Just take a look at the amount of energy invisible radiation vs what you get out of LWIR, they are log scale apart. A 1/1,0000 change in incoming visible radiation is more than you get from back radiation. A simple cloud cover dwarfs what CO2 provides. On a grand scale, that 400 W/m^2 is a drop in the bucket.
The EM spectrum
EM radiation spans an enormous range of wavelengths and frequencies. This range is known as the electromagnetic spectrum. The EM spectrum is generally divided into seven regions, in order of decreasing wavelength and increasing energy and frequency.
Infrared
Infrared is in the range of the EM spectrum between microwaves and visible light. IR has frequencies from about 30 THz up to about 400 THz and wavelengths of about 100 μm (0.004 inches) to 740 nanometers (nm), or 0.00003 inches. IR light is invisible to human eyes, but we can feel it as heat if the intensity is sufficient.
Visible light
Visible light is found in the middle of the EM spectrum, between IR and UV. It has frequencies of about 400 THz to 800 THz and wavelengths of about 740 nm (0.00003 inches) to 380 nm (.000015 inches). More generally, visible light is defined as the wavelengths that are visible to most human eyes.
“On a grand scale, that 400 W/m^2 is a drop in the bucket.”
No, that is completely wrong. Where from?
Ave solar input in tropics: 400 W/m2.
CO2isLife says:
“…but I cant explain how 13 to 18 micron LWIR can warm the oceans.”
Why can’t it?
Those wavelengths don’t penetrate the oceans, they only cause surface evaporation. Only visible radiation penetrates and warms the oceans. That is the smoking gun of AGW. To explain the global temperature you have to explain the ocean temperatures, and if CO2 is the cause, you have to explain how LWIR between 13 and 18 can warm the oceans. They can’t. Only the continual bathing of the oceans with visible light warms them. Explain the oceans and you explain the warming, and it has nothing to do with CO2.
“To explain the global temperature you have to explain the ocean temperatures, and if CO2 is the cause, you have to explain how LWIR between 13 and 18 can warm the oceans. They cant.”
Again, if you agree that the ocean has high IR emissivity (you can look it up), then it must radiate ~ 400 W/m2.
The temperature of the sky matters in the NET radiation from the ocean ~ Tocean^4-Tsky^4 .
How can that not affect the energy budget of the ocean?
DA…”CO2isLife says:
but I cant explain how 13 to 18 micron LWIR can warm the oceans.
Why cant it?”
1)2nd law…heat cannot be transferred from a cooler atmosphere to a warmer surface.
2)there is simply not enough GHGs in the atmosphere.
This is the best article I’ve read about why the uncertainty on climate sensitivity isn’t being reduced — “the feedback factors for individual processes are linearly additive, but the temperature
changes, or gains, from individual processes are not”:
Why Is Climate Sensitivity So Unpredictable?
Gerard H. Roe, Marcia B. Baker
Science 26 Oct 2007:
Vol. 318, Issue 5850, pp. 629-632
DOI: 10.1126/science.1144735
http://science.sciencemag.org/content/318/5850/629
https://pdfs.semanticscholar.org/c519/834ee79934b32f6f87a37767b24ca2d9c1d7.pdf
Translation: I have no idea how to object to this, and am waiting for some talking points. In the meantime, read this tangentially related item.
Old hat David, 11+ years old, and predating most all empirical estimates. The Roe paper doesn’t add much to our understanding…. an argument that ‘it’s too hard to figure out’ contributes nothing useful. Empirical estimates rule the roost.
Their argument was certainly NOT that “it’s too hard to figure out.”
Read their argument before commenting.
“We show that the breadth of the distribution and, in particular, the probability of large temperature increases are relatively insensitive to decreases in uncertainties associated with the underlying climate processes.”
.
Sounds to me like a very fancy way of saying it is too hard to figure out. There is a real climate sensitivity; if you can’t determine within a narrow range what it actually is based on models of the many involved processes, that means you can’t figure it out. Perhaps empirical estimates are more useful than you thought? By the way, narrowing the range of uncertainty remains an active area of research, and with good cause: rational public policy depends on reliable estimates of sensitivity.
Steve Fitzpatrick says:
“Sounds to me like a very fancy way of saying it is too hard to figure out.”
You’re wrong. B&R show explicitly how factor uncertainties fold into the uncertainty of ECS.
Have you read their paper?
David,
In this blog post: http://rankexploits.com/musings/2016/human-caused-forcing-and-climate-sensitivity/
I show how the probability density function responds to a reduction in uncertainty in aerosol forcing. The impact on the high sensitivity “fat tail” of the probability distribution is large for even a modest reduction in uncertainty.
That’s what Baker & Roe wrote in 2007, but generalized it to all climate factors.
David,
So if Roe and Baker conclude you can reduce the fat tail by reducing uncertainty (and that is clearly true) then why do they say it is difficult to reduce the fat tail? Maybe because they think it is hard to do? The dominant uncertainty is in aerosol effects. Reduce these, and you most certainly do reduce the fat tail. In addition, simple critical analysis helps: we know the Earth’s sensitivity is not very high based on the relative stability of Earth’s climate over a couple hundred million years; outlandish sensitivity values (e.g. >4.5C per doubling) are inconsistent with geological history. Those super high values do however make for nice scare-stories…. which may be the whole point.
I can tell that you still haven’t read the paper.
Or, if you did, you didn’t understand it.
Did you *actually* read the paper?
David,
Questions, questions, questions!
You obviously don’t know much do you? Do you make any attempt at all to learn anything at all, before demanding that more knowledgeable people provide answers?
It doesn’t matter, I suppose. I try to practice *tough love* where you are concerned (for your benefit, not mine, of course), but if set your mind to being obdurate, there is not much I can do about it, is there?
Keep posing gotchas, if it makes you content.
Cheers.
Years ago. I most certainly do understand it. I am not so sure about you.
BTW David, the Roe and Baker paper is nothing more than an excuse for the failure to narrow the uncertainty in climate sensitivity. To paraphrase: the reason there has been no progress in 30 years is cause the system is so complex… and so we don’t think it is possible to make progress. As unimpressive a paper as there can be. If true, the taxpayers have been wasting their money for several decades.
Steve wrote:
“So if Roe and Baker conclude you can reduce the fat tail by reducing uncertainty (and that is clearly true) then why do they say it is difficult to reduce the fat tail?”
Answer your own question: why do they conclude that?
PS: the word “aerosol” appears nowhere in their paper.
I was quoting what you said, not the paper. The reference to aerosols was not to the silly Roe paper but to what the real sources of uncertainty are (see AR5). Did you not understand my blog post? Or did you not read it?
This thread is about Roe and Baker.
If you’re going to bring in other science, then be decent and make that clear.
Roe and Baker is a decade plus old. You brought up this old paper, one that I think makes no contribution to narrowing the uncertainty range… and indeed itself suggests any narrowing of that uncertainty range is unlikely. Please spare us. Excuses for lack of progress on the most important climate issue, over multiple decades, are a waste of everyone’s time. With the inevitable rise in GHG forcing over the next few decades, the actual sensitivity will become more clearly defined, in spite of the inability of climate science to do so, based only on facts on the ground.
Why does the age of Baker & Roe’s paper matter?
David,
Why does it not? Citation please!
Cheers.
D__C: If you’re lying about your very identity, everyone here will (and should) write you off immediately. There is no acceptance of lying here.
Just look at the amount of back radiation and compare it to the incoming radiation. They are different by log factors. Why the focus on the smallest amount of energy. Energy is a flux, a flow, so once you take out a previous low, all that energy that was trapped is gone and you have to reset the model. IMHO this focus on the trapping of heat is a distraction from the main issue, the incoming radiation that reaches and warms the oceans. Fill the atmosphere with CO2, add a cloud layer that blocks sun reaching the oceans, and you have an ice age.
DA…from your link…”We show that the shape of these probability distributions is an inevitable and general consequence of the nature of the climate system, and we derive a simple analytic form for the shape that fits recent published distributions very well. We show that the breadth of the distribution and, in particular, the probability of large temperature increases are relatively insensitive to decreases in uncertainties associated with the underlying climate processes”.
This is the best article David Appell has ever read and it’s about the probability climate will change. So climate has gone from being the average of long term weather to a simple probability.
Duh!!!
Wow…at lot of detailed work and analysis here Roy. I don’t know if I have the ability to sort through it!
I’m not sure I agree ECS of 1.6C is ‘relatively insensitive’ though, as it still suggests a modest warming this century.
Maybe more than ‘modest’ since it would be about twice the amount of warming in the last century. Not a very compelling case for ‘no action’, IMO.
“Relatively” is a relative term
Haha.
The ECS applies to a much longer time frame than this century, as I understand it.
The TCS is likely to be about half that (maybe?).
Yes; it’s reached only after several centuries, at least. In some ways, like the carbon content of the atmosphere, it isn’t reached even after 100,000 years (David Archer of Univ Chicago did a lot of this work last decade; see his Web site for papers). Archer’s research finds that sea level rise (lowering) is ultimately 10-20 meters for every 1 deg C of warming (cooling), a consistent factor throughout history.
I’m I the only one that thinks a clear atmosphere allows SW energy to enter the ocean?
No.
No.
John, you would need Sun overhead to get your SW.
You put Nicholas and Curry.
Oops, thanks. Fixed.
I am not a scientist, but as a layman I have mulled over many times why the climate models overestimate warming, and my conclusion has always been that the IPCC figure for sensitivity is way too high. The model runs appear to be the right shape but tilted up too much. However I still think 1.6 is too high for the reason that there is a close correlation between solar geomagnetic activity and GMT. That must surely mean that a proportion of the warming is natural, and the sensitivity to CO2 forcing is thus less than 1.6.
Where here are models overestimating warming?
http://blogs.reading.ac.uk/climate-lab-book/files/2014/01/fig-nearterm_all_UPDATE_2018-panela.png
David,
What happens if he doesn’t bother following your suggestion? Maybe he will avoid wasting time?
Try another deny, divert, and confuse attempt, if you wish.
Still no GHE, is there?
Cheers.
Derek, models that incorporate CO2 forcing will fail.
As CO2 forcing is a “fail”.
From the NASA website –
Model development is an ongoing task. As new physics is introduced, old bugs found and new applications developed, the code is almost continually undergoing minor, and sometimes major, reworking. Thus any fixed description of the model is liable to be out of date the day it is printed. Understanding this, we will endeavor to maintain the web version of the document as closely as we can to the current release, however in is inevitable that some discussion here will on occasion fall behind development.”
Good excuse for avoiding any possible criticism. Blame it on new physics. Does this mean that model outputs produced with the old physics are unreliable?
Or just that the new physics makes no discernible difference, but keeps people of the unemployment rolls?
Looking at the excuse for not having a manual was just as entertaining. New bugs discovered, fixing old bugs meant the manual would be out of date as soon as it was written. What a farce. Oh well, amateurs masquerading as professionals were ever thus.
Cheers.
Off topic and another “deny, divert, and confuse attempt”.
p,
Others might consider a comment about so called *climate models* relevant. Apparently, the outputs of these models have been referred to as *experiments* by Warmist fools.
Dr Spencer’s post refers to models, global temperatures and more . . .
I am sure you believe you have read Dr Spencer’s mind, and established what *more* means. I don’t believe you.
Nor would any rational person.
Foolish Warmist. Carry on.
Cheers.
mike…”Model development is an ongoing task. As new physics is introduced…”
New physics??? What exactly does that mean? Like creating a positive feedback in the models representing the atmosphere where none exists and assigning an arbitrary warming factor of 9% to 25% to a gas that makes up 0,04% of the atmosphere?
Let’s not overlook the other new physics, consensus. If enough people agree it overrides real observational physics. Oh, yeah, and if you want to set a temperature record, just keep lowering the confidence level in the model till the year is a record.
Still off topic.
p,
I can’t believe I’m doing this, but –
How so?
Darn. Foolish Warmism may be infectious! Watch out!
Cheers.
Gordon Robertson says:
“Like creating a positive feedback in the models representing the atmosphere where none exists and assigning an arbitrary warming factor of 9% to 25% to a gas that makes up 0,04% of the atmosphere?”
Two more lies from Gordon.
Gordon, don’t you get tired of being exposed as a liar? Do you not have any shame?
—
1) Feedbacks clearly exist: water vapor feedback, ice-albedo feedback, cloud feedback.
2) CO2’s warming is calculated, not “assigned.”
David,
Maybe you could clear up a small query. You say that CO2 *warming* is calculated. What is the value of this warming? Has it ever been experimentally verified, or are you just dredging stuff from the depths of your foolish Warmist fantasy?
Are your feedbacks also of the climatological variety – invisible and non quantifiable?
The world wonders.
Cheers.
DA…”1) Feedbacks clearly exist: water vapor feedback, ice-albedo feedback, cloud feedback.”
Positive feedback of the type insinuated must meet
G = A/(1-AB). where G = overall gain, A = the amplifier gain, and B = feedback factor.
Where is the A in the atmosphere? Every feedback you described above is negative feedback.
“2) CO2s warming is calculated, not assigned.”
Show me how it’s calculated then show me how CO2 with an atmospheric mass of 0.04% meets the criterion of Dalton’s Law whereby heat contributed to mixed gases is proportional to the mass (pressure) of each gas.
GR again displays his lack of understanding by assuming that the atmosphere acts like an electrical circuit. In his model, the “A” is an amplifier, which provides the energy to the down steam load. But, there are no wires in the atmosphere, only physical processes. The snow/sea-ice albedo feedback is an obvious example, where warming melts more snow, which reduces the local albedo which allows more SW energy to be absorbed in the surface or ocean. How is it that GR continues to ignore this reality?
Gordon,
I was wrong last time around when I said A was the input:
https://tinyurl.com/yao5vcv6
A and B are arbitrary causal functions, so A can be an amplifier if you like.
https://tinyurl.com/y7nzwhly
You said the climate system can’t have positive feedback because there is no amplifier, so B must subtract as much as it adds to the output.
That is wrong because the sun is the power supply, and anything that increases a*b*s*o*r*p*t*i*o*n draws more energy from it.
Roy Spencer estimates G to 1.6 here:
https://tinyurl.com/y7tp5dkk
Caveat: As E.Swanson pointed out before, the climate system is not linear.
Roy wrote:
“The proportionality constant for this is set to produce the same amount of average 0-2000m warming from N.O.D.C ocean heat content (OHC) during 1990-2017.”
How much error is introduced by ignoring ocean heat increase below 2000 meters?
For example, Kouketsu et al JGR 2011 estimated a warming of 0.1 W/m2 below 3000 meters for 1985-2006:
DOI: 10.1029/2010JC006464
That still leaves the 2000-3000 meter region to contend with. It would likely be at least as large as 0.1 W/m2, so your assumption of a heating rate of 0.50 W/m2 over the period 1990 through 2017 could be off by at least 40%.
David,
You said previously that ocean heat content had been measured by the Argo floats, and berated me for disagreeing.
Are you now saying that ocean heat content is only estimated? Has the physics relating to the properties of sea water at maximum density magically changed?
Foolish Warmist. Twist and turn, commit to nothing, and keep posing silly gotchas.
Still no GHE.
Cheers.
Please keep quiet and let the scientists discuss the relevant issues.
p,
I’ll ignore your advice, as usual
Foolish Warmist. Next thing you’ll be trying to convince people that the undistinguished mathematician, Gavin Schmidt, is actually a climate scientist, or a climatologist, or some other diverting humorous comment.
Keep it up.
Cheers.
How many times have you made this same comment?
Please stop boring us.
p,
If you choose to be bored, then that is your affair. Im not sure why you would dwant to blame me for your uncontrollable emotional state.
Do you burst into tears for no reason? Fly into uncontrollable rages? Believe in fantasies such as CO2 heating thermometers?
Ah, the rich tapestry of life! You have my sympathy.
Cheers.
And please calm down.
“Better to keep quiet and let people assume you are a fool than open your mouth and confirm it.”
As Dr Spencer pointed out, the CO2 induced global warming due to the GHE stopped working between 1997and 2016.
Maybe the GHE is wearing out. What proof is there that it isn’t! Does anybody have the faintest idea why weather (and hence climate), changes.
All very mysterious – a GHE which cannot be described, which sometimes overcomes Nature, and sometimes doesn’t, by some unmeasurable amount, unpredictably.
All very odd. This is supposed to be science?
Cheers.
“All very mysterious.”
Yes – it will seem that to you. If you don’t understand what’s going on, please keep quiet.
p,
Unlike yourself, or Warmist fools, I do understand what’s going on.
Thanks for supporting me – you agree that there is no need for me to keep quiet, it seems.
Cheers.
Huh? If you understand, why is it all very mysterious?
You are digging a hole for yourself.
p,
You are doing good initiation of a foolish Warmist chap, arent you?
You imply I dont understand something, and tell me to keep quiet if this be the case. Then you complain that I do understand the same thing.
All very mysterious, wouldnt a normal person agree?
Not you of course, foolish Warmist.
Cheers.
That sure is a deep hole you have dug.
Jolly good of you to give us another falsifiable hypothesis of the greenhouse effect due to CO2.
“As Dr Spencer pointed out, the CO2 induced global warming due to the GHE stopped working between 1997and 2016. ”
So, it was working before 1997 and after 2016.
What made it stop?
Roy,
congratulations on presenting your draft paper for scrutiny.
I have a question:
You have tuned the model based on maximising (correlation =0.90) the fit to the 1865 and 2017 temperatures.
What happens if you use a more recent window (say 1950 to 2017)?
I suspect the results would be different since it appears the fit over the second half is not as good as the first half.
Similarly, if (hypothetically) temperature data existed from the year 1700 (say), would you still try and optimise the fit using all that data?
i.e. how sensitive is the sensitivity to choice of window?
p,
Are you really offering advice on how to cherry pick the data which fits the model best?
Surely not. That’s the sort of caper Warmist fools indulge in.
Cheers,
What a stupid comment.
p,
Surely you are not the same Warmist fool who wrote –
However, I love this bit:
Maybe natural variation varies, and is variable.
YES you said it and it is hilarious!
and this –
. . .how sensitive is the sensitivity . . .
Youre right. Mine was intentionally hilarious, as you acknowledged. Your foolish Warmist attempt to emulate me, maybe not quite so hilarious.
Do you think you might do better finding a testable GHE hypothesis, or is that too scientific for you?
Keep going.
Cheers.
Stop digging.
The difference is that my question is legitimately serious.
It’s answer may even strengthen the conclusions.
P: There is no point engaging with pure trolls.
They won’t debate you. They run from all questions. They exist only to taunt — they somehow find this personally gratifying. (Your guess is as good as mine.)
Ignore them.
Yes David:
I’ve personally not come across a more “Trolling” Troll anywhere else in the ClimateBall arena. Most at least say something – some pseudo nonsense (much on here) or cherry-pick the science they like distorted from the usual Blogs. Not Flynn. A deffo straight-jacket jobbie.
toneb…”Yes David:
Ive personally not come across a more Trolling Troll anywhere else in the ClimateBall arena”.
That’s because you don’t recognize the Mother of All Trolls when your addressing David Appell. You have no idea what a troll is.
A typical from the “rabbit-hole” statement.
The person that is referring to science on a science-based website is not the Troll.
The person who does not use it to advance an argument, but instead just mindlessly ridicules it and the people who do – most certainly IS the Troll.
Please find me an example of Fynn’s posts on this thread that is not precisely the above.
Not one on here (out of 20+).
Just mindless denial and ad hom, and not one referrence to any science that may back him up.
That’s pure Trolling (and I’ve been there with him)
He’s been doing it for years and still his psychosis is unresolved.
The Troll is now doing it with PP.
Like I said a strait-jacket jobbie and a Troll.
Not enuf data to go back that far in time. Today I checked the 1950-2017 trends and correlations after optimizing the model for 1880-2017, and they also agreed.
Thanks for your response.
I suppose I am curious about the effect of optimising the model by including relatively old and less certain temperature and MEI data compared to more certain modern day values. I think that what you found indicates that this may not be an issue but am not sure.
i.e. if optimised using 1950-2017 you may find the same trends and correlations but the model parameters (and sensitivity) could well be different?
profp…”I suppose I am curious about the effect of optimising the model by including relatively old and less certain temperature…”
But you’re fine with NOAA using a time series starting back in the 1800s then applying it to a baseline from 1950 – 1990.
And you don’t mind NOAA claiming 2014 as the warmest year ever with a confidence level of 48%. UAH had it rated in 4th place using real, comprehensive data and a 90% CL would have put it there. But NOAA used a 48% CL to move it into first place.
Gordon, trend results are independent of the choice of baseline.
Yes Gordon, 2014 did not stand out like later years did:
https://tinyurl.com/ycwunbya
W,
There is no need to read the papers you link to if they will become common knowledge in 10 or 20 years time, really. Just wait for a while, and all will be revealed.
Maybe you could speed up the process by setting out your testable hypothesis, whatever it is.
Would anyone actually benefit if your hypothesis was true? I believe you mentioned that ordinary physics explains everything your new hypothesis covers, so I’m not sure what would be gained.
I wish you well in your efforts to convince others to read your secret papers. I’ll just have to suffer the indignity of not wasting my time not reading something that you say is irrelevant and unnecessary.
Cheers.
The Arctic Has Been Astonishingly Warm:
http://davidappell.blogspot.com/2018/02/that-arctic-is-astonishingly-warm.html
You have no idea about the polar vortex.
http://files.tinypic.pl/i/00959/f1wwfkrb5nfq.png
ren, I’m talking about surface temperatures, not high up in the atmosphere.
Get a clue.
The circulation in the lower stratosphere is consistent with the jet stream in the tropopause.
http://images.tinypic.pl/i/00959/w4vs82pyclyk.gif
Are you only capable of writing random words that have nothing to do with the original point being made?
Seems so.
Best you stick to cutting-and-pasting.
DA…”ren, Im talking about surface temperatures, not high up in the atmosphere.
Get a clue.”
What is there at the surface level that controls the weather like the Polar Vortex can from ahigh? You’re the one who needs to get a clue.
ren…”You have no idea about the polar vortex.”
DA doesn’t even know where the Arctic is. He is likely looking at Brazil.
DA…”The Arctic Has Been Astonishingly Warm”
So warm that it froze the ocean at the North Pole to a depth of 10 feet in January. Yes, David, that is astonishingly warm. [sarc/off].
GR fails to understand that AGW won’t cancel winter at the Poles and the warming is relative to the long term averages. Sure, the surface will continue to freeze, but this year, we see a remarkable decline in extent and the maximum freeze extent is expected to be reached in about 3 weeks. So far this winter, the extent is running well below the 2 sigma range for the satellite era. There’s your positive feedback at work.
https://tinyurl.com/ydxc4xn
The temperature in Europe in the following days will drop significantly below the norm.
http://files.tinypic.pl/i/00959/g0305f1bew7j.png
Your map is, as usual, for a single point in time, and says nothing whatsoever about any past or future temperatures.
The frost at the beginning of next week will be a shock for Western Europe.
In what way?
How does your chart imply that?
Or are you just cutting-and-pasting again, willy nilly?
David thank you for the question.
http://files.tinypic.pl/i/00959/tmfbh2t16l4d.png
Just another useless chart for a single moment in time.
Say it to people who will need much more energy than usual.
I have no idea what your reply is supposed to mean. Do you?
It means Europe is going to experience weather more like the US is used to next week. They aren’t going to like it.
How do you not understand that?
The only thing that is really shock is there there exist idiots who don’t know what they talk about.
Temperatures in northern France or Germany used to drop routinely to much lower -10 or -20 C values for many weeks in February in the 1960-70’s. That was just normal weather before GW.
Nothing like that is even remotely predicted and even if it were and happened it is now a very rare occurrence.
Why do you keep spouting so much bullshit ?
Exactly since started GW in Europe? So perhaps a matter of changes in circulation and the condition of the winter polar vortex?
And what about North America?
http://files.tinypic.pl/i/00959/9wboqy76a8ii.png
“Snows are less frequent and less deep. They do not often lie, below the mountains, more than one, two or three days, and very rarely a week. They are remembered to have been formerly frequent, deep and of long continuance. The elderly inform me the earth used to be covered with snow about three months in every year. The rivers, which then seldom failed to freeze over in the course of the winter, scarcely ever do now. This change has produced an unfortunate fluctuation between heat and cold in the spring of the year which is very fatal to fruits.”
Thomas Jefferson, “Notes on the State of Virginia.” -1799
Please, please ren!
We are facing here a tiny bit of winter and you tell us about a shock?
Coldest night predictions for the next two weeks
– Germany feb 27 to feb 28
https://www.wetteronline.de/?pid=p_city_local&sid=Pictogram&diagram=true&fcdatstr=20180227&daytime=night&iid=DL
– France feb 28 to mar 01
https://www.wetteronline.de/?pid=p_city_local&sid=Pictogram&diagram=true&fcdatstr=20180228&daytime=night&iid=FR
In 1986 we had in Berlin a few days below -20 C. And that was ‘warm’ compared with really harsh winters in the 1940/1950’s.
Snowfall this year in the Northern Hemisphere is above the norm.
https://www.ccin.ca/home/sites/default/files/snow/snow_tracker/nh_swe.png
When in March the temperature in Germany fell below -10 C?
The Baltic Sea begins to freeze.
http://images.tinypic.pl/i/00959/1k1plh3juco6.png
ren says:
February 23, 2018 at 10:58 AM
When in March the temperature in Germany fell below -10 C?
Download GHCN V3 unadjusted, extract the german station data out of it, and look at the march values…
binny…”We are facing here a tiny bit of winter and you tell us about a shock?”
NOAA has ignored the extreme cold in North America this winter, it’s no surprise a NOAA groupie would regard this winter as a tiny bit of winter.
We are supposed to be under the effect of global warming the past 30 plus years and we are setting records for cold in North America.
GR and ren, Global Warming is, like, you know, global. Nobody claims that local conditions will always be warmer and it’s probable that some regions will experience colder conditions during Winter. As more warm air pushes further toward the poles, the result must be an increase in cold air flowing back toward the tropics to complete the circulation loop.
swannie…”Global Warming is, like, you know, global. Nobody claims that local conditions will always be warmer and its probable that some regions will experience colder conditions during Winter.”
Sounds similar to the reasoning in your experiments where you claimed a cookie sheet 6″ above a heated plate was back-radiating heat to the plate and warming it.
I am beginning to understand how alarmists think….or don’t think.
Gordon, stop your lying. NOAA didnt make up anything, or ignore any Data, And you have absolutely no proof that they did; youre just making things up in and lying because you wont face reality. Its pathetic.
GR, I’m beginning to understand how so-called “engineers” think. Given evidence which disproves their world view, they spout lots of non-science and claims of conspiracies to obfuscate any rational discussion. BTW, aren’t engineers in Canada supposed to be licensed? Show us evidence of yours or your published results of your engineering works, else you should be dumped in the ash can along with all the other liars and con men.
DA…”Your map is, as usual, for a single point in time, and says nothing whatsoever about any past or future temperatures”.
If you have been following ren he has been talking about the effect of the polar vortex and it’s effect on local weather.
The map he offered one is for a single point in time.
Why is someone names “John Turner, PhD” linking to essays written by “CAN’T_BE_NAMED, no PhD?”
Roy, you still have to submit this paper and battle it out in the peer reviewed literature. A blog is not a substitute.
*EVERYONE* thinks their paper is right and the reviewers, editors and readers are wrong. That doesn’t make the authors wrong.
And the editor of Remote Sciences didn’t resign based on your results, but because he (after hearing from many others) concluded that you snuck your paper into his journal where it had no business being submitted or published. His resignation was a drastic step, and a mark on his career, and should have given you pause.
David, on the face of it the paper looks sound – I can’t spot any fundamental errors at this stage. I would still like to see if/how the window of observed temperatures affects the derived sensitivity. Otherwise, I assume Roy will submit it to the usual peer review process in which case it is brave of him to put up a draft for all to see and comment.
Yes. I meant Roy’s earlier paper, published in Remote Sensing,
“On the Misdiagnosis of Surface Temperature Feedbacks from Variations in Earths Radiant Energy Balance,”
Roy W. Spencer and William D. Braswell
Remote Sens. 2011, 3(8), 1603-1613
doi:10.3390/rs3081603
because of which the editor resigned:
https://phys.org/news/2011-09-editor-remote-journal-resigns-citing.html
http://www.drroyspencer.com/2011/09/editor-in-chief-of-remote-sensing-resigns-from-fallout-over-our-paper/
Here was the editor’s final editorial:
http://www.mdpi.com/2072-4292/3/9/2002/pdf
DA…from your link…”Unfortunately, as many climate researchers and engaged observers of the climate change debate pointed out in various internet discussion fora, the paper by Spencer and Braswell [1] that was recently published in Remote Sensing is most likely problematic in both aspects and should therefore not have been published….”
What unmitigated arrogance. Peer review was designed initially to keep armchair scientists from publishing nonsense. It was never meant to prevent professionals like Roy Spencer and Danny Braswell from publishing.
Peer review has become anti-science and is no longer relevant. It is controlled by vested interests and anyone trying to interfere with the publication of a paper by any scientists should be prosecuted.
The fact that you support the current circus reveals what a pompous ass you really are.
DA…”Here was the editors final editorial:”
After reading the rest of this article I think the editor should have been fired before he quit. He comes across as a biased twit. In his editorial whine, he asserts the Spencer/Braswell paper should have been rejected because it represented a minority view and did not include the views of it’s opponents.
Cripes, has peer review sunk to this kind of mindless bias? PR has failed, time to scrap it altogether.
Thanks David.
I was not paying much attention back when the Remote Sensing paper caused such a furore.
However, going back through your links and reading up on the issue, with hind-sight I must confess that I think Roy and co-authors may have grounds to feel aggrieved at their treatment. Much of the criticism directed at them seemed more political than scientific (even when reading up on this at one of my favourite sites -Skeptical Science).
I am sure there are plenty of scientific criticisms and debates to be had over his work and I am sure that I could list quite a few more with a bit more time- but that does’nt detract from the worth of his study or the right to have his papers treated equitably and published (given that there no major errors etc etc).
Roy can look after himself, but it seems a bit PC by some to dismiss his work without engaging in a rigorous (but fair) debate about the scientific issues at hand. It may be provocative, and may even have serious flaws, but the exciting challenge is to pin-point these. I dont’t think you can accuse him of ignoring them.
So, surprisingly, I can see now how Roy (and some skeptics) can feel badly done by.
(Good heavens ! am I turning into skeptic? Answer: never, if only because I coul’nt stand being associated with GR or MF)
Gordon Robertson says:
What unmitigated arrogance. Peer review was designed initially to keep armchair scientists from publishing nonsense. It was never meant to prevent professionals like Roy Spencer and Danny Braswell from publishing.
Ha Ha! Professional scientists gets articles rejected ALL THE TIME. The best journals, like Science and Nature, reject over 90% of the articles submitted to them.
profp…”(Good heavens ! am I turning into skeptic? Answer: never, if only because I coulnt stand being associated with GR or MF)”
I understand, it will take time for you to catch up.
Kudos to you for acknowledging the dreadful treatment of good scientists like Roy, John, Willie Soon, and Richard Lindzen who have faced undeserved scrutiny on peer review because they expressed skeptical views.
This kind of ostracizing and peer review bias must be eliminated from science. I don’t care how outrageous a scientist’s claims may be, if he/she follows scientific protocol and acts in good faith, no one should be allowed to ostracize him/her, or to reject their papers via peer review.
To put it more strongly, no paper should be rejected outright for the simple reason that no body should be able to set itself up as an authority. True peer review is what the name claims, a review by peers. As it stands, the review is done by one person appointed by a journal editor.
I think it was Roy who pointed out that on one occasion the PR referee did not seem to understand what his paper was about. If a paper is on cutting edge science, how could one person make that decision? The paper must be published so all scientists can review it, and prove or disprove it using the scientific method.
If a paper gets stopped by an idiotic journal editor, or an equally incompetent or biased referee, what good does such peer review serve other than upholding a paradigm?
DA…”Ha Ha! Professional scientists gets articles rejected ALL THE TIME. The best journals, like Science and Nature, reject over 90% of the articles submitted to them”.
Then those journals should be abolished and/or the publishers prosecuted. We cannot afford to have Neanderthals in charge of science, or what people can read in scientific circles.
That’s an very uninformed comment, Gordon.
Journals exist precisely to sort the wheat from the chaff, and publish the wheat. That’s how they get a readership and a reputation. No one has an inherent right to have a paper published in the journal of their choice.
“Roy, you still have to submit this paper and battle it out in the peer reviewed literature. A blog is not a substitute.”
The problem with that theory is that any valid climate research would be rejected by the Pal-Review process. Only climate science repeatedly publish nearly identical research with always the same conclusion. If CO2 isn’t the cause, don’t bother applying. That raises the question however if CO2 is settled science, why are we continuing to spend so much money proving a know outcome? We don’t keep spending money to prove gravity exists.
That’s a convinient excuse for you. But that’s all.
Spencer & Braswell *did* get published in a peer reviewed journal. So what’s your problem?
DA…”Roy, you still have to submit this paper and battle it out in the peer reviewed literature. A blog is not a substitute”.
I guess you must have missed it. Your buddies in the climate alarm world…you know, those you interview exclusively…have taken over the peer review process, virtually making it impossible for Roy to publish a paper.
Your buddy Trenberth went out of his way to interfere with the publishing of one of Roy’s paper and the Climategate emails noted the head of Had-crut threatening to block another UAH paper from IPCC review.
Are you really this stupid?
Gordon, what evidence do you have for your Trenberth claim? If none, your comment is libelous and legally actionable. Perhaps someone will send him the link to your comment.
DA…”Your buddy Trenberth went out of his way to interfere with the publishing of one of Roys paper and the Climategate emails noted the head of Had-crut threatening to block another UAH paper from IPCC review”.
Do you think I’d be saying it if I could not reference it? The Climategate emails are still available if you care to see it for yourself. As for Roy’s paper, the Trenberth interference is openly available. You just quoted the whine of an editor who resigned over Roy’s paper being published. It was Trenberth’s interference caused the resignation.
http://www.sciencemag.org/news/2011/09/journal-editor-resigns-over-contrarian-climate-paper
“The journal “really deals with remote sensing used by geographers rather than by atmospheric scientists,” says Trenberth. “I only recognized one name on the editorial board.” That could explain why none of the three reviewers noticed any fatal flaws in the paper, he says”.
Here’s Trenberth offering a heavyweight ‘opinion’ that Spencer and Braswell are wrong. It was the pressure he brought to the situation that forced the editor to resign.
Roy and Danny are offering a cutting edge opinion based on real data and Trenberth is telling them they are wrong. As I see it, Trenberth et al have been wrong the past 30+ years. What do they know?
In his paper with Kiehle, Trenberth had the gall to claim nearly as much heating by back-radiated energy from GHGs, proving he does not understand the 2nd law nor does he understand the difference between EM and heat.
To balance his budget, he threw physics out the window.
more….
https://wattsupwiththat.com/2011/09/02/breaking-editor-in-chief-of-remote-sensing-resigns-over-spencer-braswell-paper/
“Dr. Roger Pielke Sr. continues his discussion at his blog: Hatchet Job on John Christy and Roy Spencer By Kevin Trenberth, John Abraham and Peter Gleick”.
In his paper with Kiehle, Trenberth had the gall to claim nearly as much heating by back-radiated energy from GHGs, proving he does not understand the 2nd law nor does he understand the difference between EM and heat.
Notice again how you provided no science and critiqued no science. Because it’s beyond your abilities. So you resort to the personal.
You misstated Trenberth and Kiehle’s finding: GHGs contribute about *twice* as much heat to the surface than does sunlight:
https://scienceofdoom.files.wordpress.com/2013/02/trenbert-fasullo-kiehl-2009.png
You comments on the 2nd law and EM are ignorant nonsense. It’s the truly ignorant who think they know more about something than everyone else in the world, and especially the experts.
You specialize in such nonsense.
The previous such a strong jump in temperature in the stratosphere occurred during the previous solar minimum in 2009.
http://images.tinypic.pl/i/00959/28uz50x9clo2.gif
“A remarkable major SSW in January 2009 led to stronglydisturbed stratospheric dynamics which manifested in both accelerated polar descent and tropical upwelling. During thefollowing 2 weeks up to the end of January, this transien signal of cross-isentropic transport propagated down fromaround 1 to 100 hPa. The radiative relaxation of this anomalyin diabatic heating was relatively fast (∼10 days) in the up-per stratosphere, but took more than a month in the lowerstratosphere, which resulted in accelerated polar descent andaccelerated tropical upwelling through late March (Fig. 2).”
https://www.researchgate.net/publication/307722532_Impact_of_the_2009_major_sudden_stratospheric_warming_on_the_composition_of_the_stratosphere
Sorry,
“The radiative relaxation of this anomalyin diabatic heating was relatively fast (∼10 days) in the up-per stratosphere, but took more than a month in the lower stratosphere, which resulted in accelerated polar descent andaccelerated tropical upwelling through late March (Fig. 2).
I have once again blocked Doug Cotton, primarily because he was passing himself off as “John Turner, PhD (physics)”.
+1
Instead of the “brute force” solution method, why not use the Solver Add-In in Excel, which should quickly (within seconds) finds an optimal set of parameters, assuming it converges. It would be useful to know if a different set of initial guesses (from a random number generator) of the parameters, consistently converge to the same minima. And if not, what is the range of parameter values at the local minimum.
David Appell, I just wanted to point out that the LW and SW “feedbacks” I arrived at in the 1D model (in the climate sense, that is, excluding the climate-stabilizing Planck effect) are positive.
Somewhere in your 40+ comments I seem to recall you defending positive feedbacks; well, ECS=1.6 deg. is evidence of positive feedback. Negative feedback would have ECS below 1 deg. C.
Thanks for clarifying.
Roy, your blog, for better or worse, has become not so much a comment section as a discussion forum. Many other people here post dozens of times too. If you’re paying for Web traffic by the byte, let me know and I’ll stop discussing climate science here. Otherwise, what’s the harm?
…and unfortunately, 90% of the comments here contain nonsense or bad science. Someone has to correct them. I find it good practice to defend the science with evidence.
2. Note that the ENSO activity during the 20th Century largely explains the anomalous warmth around the 1940s. In fact, this feature exists even with the anthropogenic aerosol forcing removed, in which case a warming hiatus exists from the 1940s to the 1980s. This is the result of the ENSO radiative forcing term (0.2 W/m2 per MEI index value) combined with stronger El Ninos before the 1940s and weaker ones from the 1940s until the late 1970s.
3. The warming hiatus from 1997 to 2016 is evident in the model.
David what is your answer to points 2 and 3?
#2. A few things seem likely for the warming, period before 1940: clearing out of LIA volcanic dust, GHGs, and a more radiant sun.
#3.No it isnt.
Many thanks to Roy Spencer for this very informative and educative article. That is just how I love the most to read about (not only climate) science.
1. I have a little remark concerning your sentence:
Curiously, the model surface temperature trend during 1979-2017 (+0.133 C/decade) is a much closer match to our UAH LT data (+0.128 C/decade) than it is to the Had-CRUT4 data (+0.203 C/decade)…
I am wondering about this because the trend computed out of the Had-CRUT4.6 data by Excel’s linest function for this period is
0.173 +- 0.005 C / decade
what is confirmed by Kevin Cowtan’s Trend Computer:
http://4gp.me/bbtc/15193928111.jpg
{ Only the 2 sigma amount differs, maybe due to KC taking autocorrelation better into account than does Excel. }
Of course, Had-CRUT4.6 still is, with 0.04 C / decade, way above model and UAH6.0; but nevertheless, Had-CRUT has a linear estimate lower than that of RSS4.0 TLT (of inbetween 0.191 C / decade).
2. Despite your explanation, I could not manage to understand the necessity of adjusting ENSO from 1871 till today in order to get it neutral in the sum.
Anticipating a possible critique certainly is meaninful; but it is imho something one might better solve by showing the difference in an extra computation and the resulting additional chart.
Thank you / Danke
Rose J. Koelm
Yes, you are correct…I just downloaded the monthly HadCRUT4.6 (global), and I get +0.180 C/decade (maybe you used yearly data?). I must have used improper latitude bounds when I poriginall subsetted the data.
Rerunning the model with the correct HadCRUT4 data, I get ECS = 1.54 C, and the new trends, 1979-2017 are:
Model +0.113 C/decade
UAH LT +0.128 C/decade
HadCRUT4 +0.180 C/decade
For the period 1880-2017:
Model: +0.061 C/decade
HadCRUT4: +0.061 C/decade
As I discussed in the text, the MEI time series from 1871-2017 does not average quite to zero…the zero line depends upon what period of time was used in calculating the MEI. If the period of time has more El Nino activity than La Nina (compared to the full 1871-2017 record), it will not be representative of the whole record. I forced it to average to zero so I couldn’t be accused of using a positive-mean MEI to put extra energy accumulation in the model from radiative forcing. The difference is small.
Thanks Mr Spencer for the quick reply.
… maybe you used yearly data?
No I didn’t. Here is their monthly text source:
https://tinyurl.com/ycxz3kfb
And Kevin Cowtan surely uses monthly data as well :-))
{ Excel’s 1979-2017 linear estimate for your own data’s yearly averaging is, with 3 digits atdp, the same as for the monthly original: 0.128 C / decade.}
Thus I don’t know where the 0.180 might arise from.
{ Did you download gridded data instead? My friend Bindidon had consistency problems when trying to obtain monthly anomalies out of your 2.5 degree data because he first choosed a latitude weighting differing from yours. The difference was amazing here and there. }
*
The difference is small.
That is for us lay(wo)men the important statement I guess.
Simply look at the El Nino La Nina Charts, look at the Satelite temperatures and look at the CO2 trend. The Correlation between CO2 and temperatures is non existent, the correlation between ocean temperature and atmospheric temperatures is extremely high. Explain the oceans and you explain the climate. CO2 can’t warm the oceans. No way no how.
CO2 cant warm the oceans.
Why?
This Blog Posting explains why CO2 can’t warm the oceans.
Climate Science on Trial; CO2 is a Weak GHG, it has no Permanent Dipole
The best way to argue for the science, and against the climate alarmists is to simply go back to the basic physics of the greenhouse gas effect (GHG) and how CO2 contributes to it. Stated simply, the GHG effect is the trapping/absorbing of outgoing infrared (IR) radiation by various greenhouse gasses in the atmosphere. These Continue reading
https://co2islife.wordpress.com/2017/01/30/climate-science-on-trial-co2-is-a-weak-ghg-it-has-no-dipole/
CO2 doesn’t play any role everywhere H2O is present.
Above a certain altitude, H2O precipitates and disappears.
That is the place where CO2’s [very tiny] activity begins, exactly as you describe in your blog.
“That is the place where CO2s [very tiny] activity begins, exactly as you describe in your blog.”
Thanks for that comment. If people would simply study the physics of the CO2 molecule, the answers become apparent.
No. CO2 absorbs at some wavelengths that water vapor does not. And there is little water vapor in the polar regions.
CO2isLife…from your link….”H2O, on the other hand, is a much more potent GHG that totally dominates the temperature of the troposphere…”
How? The average concentration of water vapour in the troposphere is about 0.3%. Dalton’s Law for a mixed gas requires each gas to contribute heat based on it’s relative pressure/mass. Even at 1%, WV could not contribute more than 1% to atmospheric heat.
It’s obvious, according to Dalton, that N2 and O2 at 99% of the atmosphere contributes nearly all the heat.
Again Gordon pretends that radiation transfer doesnt exist. Which is very dishonest.
DA…”Again Gordon pretends that radiation transfer doesnt exist. Which is very dishonest.”
I have never claim radiative heat transfer does not exist, I have merely claimed it is overblown as a mean of transferring heat at atmospheric temperatures. It’s not till temperatures are very high that radiative transfer becomes effective and only over a limited distance.
The current fetish related to surface radiation as a heating mechanism is misguided.
How high, and over what distance?
CO2…in other words, you are telling me that when I am a home in the Canadian prairies at -30C outside, and the relative humidity is around 10%, that CO2 at 0.04% will warm the room by absorbing radiation from a heater and spreading it to other gases?
Sorry…there’s something scientifically wrong with that.
If in the same locale, same environment, a hot air furnace blows heated air into the room, the hot air is 99% nitrogen and oxygen. If heating is by an electric baseboard heater, the elements heats N2 and O2 in the air directly and the warmed air is spread to the room.
It’s no different in the atmosphere. The 99% N2/O2 mix collects heat directly from the surface and spreads it by convection. Radiation is really a poor form of heat transfer due to the inverse square law. According to Wood, 1909, an expert on IR, it is ineffective more than a few feet above the surface.
How exactly does a nitrogen or oxygen molecule capture infrared heat from surface?
DA…”How exactly does a nitrogen or oxygen molecule capture infrared heat from surface?”
I said they gather it through heat transfer by direct contact.
There is no such thing as infrared heat. There is infrared energy which consists of an electric field and a magnetic field within a certain frequency range. That is not heat.
Heat is the kinetic energy in the molecules of water that transfers to the air molecules in direct contact. Like you sitting in a bath of hot water. I hope you don’t think your body is warming through infrared absorp-tion. If that were the case you’d feel might cold in your bath.
Gordon Robertson says:
“There is no such thing as infrared heat.”
Ever heat of a heat-seeking missile?
They operate by detecting IR. That is, by detecting heat.
Analysis: NOAA Continue To Pump Out Arctic Lies
Climate analyst Paul Homewood:
Arctic sea ice extent has stabilized in summer and has slightly increased since 2007.
Ice has also got considerable thicker in the last decade as well
In fact, Arctic temperatures have varied little in the last decade
Temperatures recently are no higher than in the 1930s and 40s. The cycle we can see is connected to the AMO.
The claim that the Arctic is warming at twice the rate of the rest of the world, is simply a reflection of the upward part of the cycle. Changes in Arctic temperatures are invariably amplified, either warming faster or cooling faster.
The situation is very interesting because the sudden warming of the stratosphere is at the same time as La Nina.
Salvatore: why do you trust in ‘climate analyst’ Homewood?
Arctic sea ice extent has stabilized in summer and has slightly increased since 2007.
http://4gp.me/bbtc/151941988692.jpg
Ice has also got considerable thicker in the last decade as well
http://psc.apl.uw.edu/wordpress/wp-content/uploads/schweiger/ice_volume/SPIOMASIceVolumeAnomalyCurrentV2.1.png
The claim that the Arctic is warming at twice the rate of the rest of the world, is simply a reflection of the upward part of the cycle.
Nobody ever pretended that the Arctic is warming all the time at that rate. People ‘knowing about’ mention here the satellite era:
UAH6.0 Globe 1979-2017: 0.13 C / decade
UAH6.0 Arctic 1979-2017: 0.25 C / decade
RSS3.3 Globe 1979-2017: 0.14 C / decade
RSS3.3 Arctic 1979-2017: 0.35 C / decade
Ooops I forgot to mention the ice extent data’s source:
ftp://sidads.colorado.edu/DATASETS/NOAA/G02135/
salvatore…”Analysis: NOAA Continue To Pump Out Arctic Lies”
They get away with it because politicians are just plain ignorant of science. We need scientists with integrity to speak up.
Wrong, Salvatore. Arctic sea ice extent is at a record low.
No:
http://ocean.dmi.dk/arctic/icethickness/images/FullSize_CICE_combine_thick_SM_EN_20180222.png
Oops, extent yes.
Arctic temps. have been above average since September, but crazy warm lately.
http://ocean.dmi.dk/arctic/plots/meanTarchive/meanT_2018.png
Look at
https://tinyurl.com/y8y6x73u
and you will see how sea extent actually looks like, and not only in the Arctic.
This year global sea ice extent just set another record low.
Salvatore Del Prete says:-2.4
“Ice has also got considerable thicker in the last decade as well”
Where’s your evidence?
I keep a spreadsheet of average Arctic sea ice thickness by dividing the monthly PIOMAS sea ice volume by N.S.I.D.C’s sea ice area. (Area, not extent.)
The 10-year trend is -2.4 cm/yr.
The annualized moving average was a record low in October 2017. (Now it’s just 1.4 cm higher.) The long-term trend is down & down — half what the average thickness was in 1979.
The main thing is that La Nina is still working.
http://www.ospo.noaa.gov/data/sst/anomaly/2018/anomnight.2.22.2018.gif
https://www.longpaddock.qld.gov.au/seasonalclimateoutlook/southernoscillationindex/index.php
Yes but how long?
http://ds.data.jma.go.jp/tcc/tcc/products/elnino/elmonout.html#fig2
Recent westerly wind bursts have occurred in the west. These often accompany a switch to El Nino-ish conditions.
https://www.pmel.noaa.gov/tao/drupal/disdel/
Dr Spencer, consider backing into a model. Isolate the impact of CO2 on the atmosphere. Identify the significant RAW UNADJUSTED data sets, and then run Stepwise on the data sets. The computer will build the model for you.
Isolating the Contribution of CO2 on Atmospheric Temperature
In any serious scientific experiment, efforts are made to control for as many exogenous factors as possible. The whole purpose is to isolate the impact of the independent variable on the dependent variable. ΔWeightloss = ΔCaloric Intake + ΔExercise + ΔBase Metabolism + error. To minimize the error of the model (maximize explanatory power), variables outside Continue reading
https://co2islife.wordpress.com/2018/02/14/isolating-the-contribution-of-co2-on-atmospheric-co2/
Yes, that’s part of what I do in this whole process. But with about 8 input variables, there are many possibilities.
CO2…”Isolate the impact of CO2 on the atmosphere”.
How???
CO2isLife says:
In any serious scientific experiment, efforts are made to control for as many exogenous factors as possible.
We can’t do experiments on the climate, because there is no control Earth — with no rise in GHGs, land use, etc — to compare our climate change to. Climate science is an observational science — which means we have to take the measurements and attempt to control though mathematics and models.
DA…”Climate science is an observational science which means we have to take the measurements and attempt to control though mathematics and models”.
Until those models can be validated there is no reason to pay them any heed. It’s enough to observe and pose questions, no need to project incorrect answers using unvalidated models.
More ignorance. Climate models are validated all the time. Modelers aren’t idiots.
FACT: The longest chapter in the IPCC AR5 WG1 is on model evaluation.
Roy,
I am a bit puzzled with your comparison between the scatter plots in figures 1 and 3.
The data in figure 3 is clearly horribly serially correlated. The loops are a dead give away.
Serial correlation can give you massive increases in correlation coefficients so the comparison between the two is most likely inappropriate.
Also I am in agreement with MikeF’s statement that using Excel Solver would be sensible, instead of what was presumably a brute force search, just in case you have just found a local minimum. There have been a range of methods for finding the global minimum such as steepest descent, simulated annealing etc. These have been known methods since the early days of Fortran. See
https://www.nag.co.uk/numeric/fl/nagdoc_fl23/xhtml/E05/e05intro.xml.
“Terribly serially correlated” is a good thing in this case, because it is evidence of the underlying physical processes. The loops were discussed at length in Spencer & Braswell (2011). If you connect the dots in sequence, you have a phase space plot. The loops are proof of radiative forcing from ENSO leading the resulting temperature response, as we showed in that paper (It also showed up in old ERBE measurements of Pinatubo). Those loops also exist in the CERES data, it is just masked by all of the other random fluctuations in radiative flux. I’ve covered all of that before, and didn’t want to again… but it does need to be mentioned.
Yes, there are methods for optimizing input variables…as I said, this is a work in progress.
I’m not sure what “serially correlated” means, and I need to read Spencer & Braswell (2011) with regard to the loops, but in my experience with data analysis I observed loops when I cross-plotted two data sets that had been smoothed.
Yes MikeF, smoothed data exhibits this phenomenon. It is also the reason why the uncertainties in the slope are massive and the values are notoriously unreliable when you smooth. It is usually the last thing you want to do if you are trying to establish a correlation.
It is poor practice even when you smooth just one variable and becomes a bit ridiculous when both variables are smoothed.
If this material is to be published then the uncertainties in the correlations need to be accounted for and stated. Even accounting for them via a simple AR1 model would be a good start (see Foster and Rahmstorf 2011 ).
I am not sure how the uncertainties are handled when both variables are serially correlated. Are the correction factors for the reduction in degrees of freedom, multiplied or added (perhaps in quadrature)?
Maybe a competent statistician or someone like Nick Stokes or Tamino would be able to help to get this material into a form that would allow it to survive peer review.
MikeR,
uncertainties in the slope are massive and the values are notoriously unreliable when you smooth.
First, let me be clear on the origin of the loops I observed in data sets. Consider a simple step function consisting of 20 samples. The first 10 have a value of 0 and the last 10 have a value of 1. A second data set also has the first 10 samples with a value of 0, but the last 10 have a value of 2. If I cross-plot them, you obviously get ten points at (0,0) and 10 points at (1,2), slope is 2, R-squared is 1. If I then smooth both of these with a 5-point box-car filter, the cross-plot then has 8 points at (0,0) and 8 points at (1,2) and the remaining 4 points are equally spaced on the line that connects the two clusters, meaning the slope of the cross-plotted data is exactly 2, R-squared is 1. So based on this very simple example the smoothing did not change the slope estimate, however, this example didnt create loops either, but rather just a straight line march from one cluster to the other.
I can create loops in two different ways. First if I smooth the data sets with different length filters. This is also a situation that could come about by having different sensor responses for different data sets. In the sample above, when I filter one with a 5 point filter and the other with a 7 point filter, instead of a straight line march I get a curved line. The slope calculation changes to 1.89, with r2 is .986. The other way I can generate them is first add noise (e.g., 50% random) to the data sets, and then smooth both of them with the same length filter. When I did this, the slope calculation of the noisy data was poorest, and slightly improved for the smoothed version because it removed some of the scatter at the clusters.
So when I have seen data loops in cross-plots I have interpreted them as an artifact of smoothing noisy data, perhaps combined with having different instrument responses, and represents a wobbly path from one data cluster area to another. As visually annoying as they are, I didnt conclude that it always rendered the data unreliable. What seems to matter more is the signal/noise.
MikeF,
I think the other point to note is that these loops are characteristic of cyclic phenomena as per Lissajous figures.
Removing the high frequency “noise” reveals the quasi periodic nature of the CERES and model temperature signals and their corresponding phase differences which clearly are not totally random. This is unsurprising as influences such as ENSO and PDO which affect both signals have periodic aspects.
By the way, the loops are not described in the 2011 paper by the authors but in the 2010 paper by the same authors, which I am trying to wade through. I do note that they have smoothed the data over 72 days to account for orbital characteristics of the CERES satellite.
This is a significant amount of smoothing and without providing the range of uncertainties in the slopes, the high correlation coefficients in figure 5 make me suspect the authors might be “gilding the lily” somewhat.
This would possibly a minor quibble if the author were not making specific claims based on the magnitude of the slopes but it appears the slope of the scatter plot of the net flux is crucial to the argument.
In this case it would make the material presented credible if the authors intend to make the model data accessible to the readership along with paper. The “p-hacking” fiascos in medicine, biological and social sciences have resulted in reputable journals requiring access to the data.
Roy,
I greatly appreciate keep it simple models (and dont pretend to be an expert in modeling so I hope I communicate this clearly). We dont get the causal forcing of ENSO variability or how to predict it for forecasting. The general view is the PDO and ENSO conditions are related but the PDO remains a mystery (1), but has been modelled (2) as driven by ENSO and the PDO is a quasi periodic patter that can potentially be extrapolated. Im curious if adding a similar relationship and shifting from ENSO to PDO as a feedback would enrich the model by reducing noise and allowing projections (crops nat gas trading or whatever) since the PDO typically is decadal scale.
1.
https://link.springer.com/article/10.1023/A:1015820616384
2.
https://journals.ametsoc.org/doi/abs/10.1175/1520-0442(2003)0162.0.CO;2
the PDO is considered by many to be a low-frequency expression of ENSO. I’ve looked at this some, and ENSO dominates the model skill… PDO adds very little skill, but improves the low-frequency behavior of the model somewhat, but does not change the model climate sensitivity at all. I’m trying to keep model input variables to a minimum at this point.
Temperature in Spain and France will continue to fall.
http://files.tinypic.pl/i/00959/dqzexx8hjepb.png
The frost attack will last about 2 weeks.
And while homeless people get more endangered, our joung children all are happy to discover a little piece of winter.
This ‘frost’ attack’ is a lame duck compared to 1956/57 and 1986/87.
60 years ago, most olive trees in the Provence died.
Do you want to go back to the extreme temperatures and weather events that we had in the past?
No. I just want to reassure Ren.
Siberian frost reaches Poland and Germany.
binny…”This frost attack is a lame duck compared to 1956/57 and 1986/87.”
You have to put that in perspective. The difference in temperature is a fraction of a degree C. I seriously doubt that anyone living through those eras would notice much of a difference compared to today.
The difference or the global mean surface temperature for the deepest icy years of the ice ages and the balmy years is only 5 C.
Measurements of shortwave radiation at the top of the atmosphere only show albedo changes. They say nothing about the processes taking place in the dense troposphere.
Everything that affects reflected sunlight affects SW measurements from space…cloudiness, aerosols, land use changes, snow, ice, everything. And that which isn’t reflected is absorbed, which is the solar energy input into the system. Along with emitted LW, you basically have the radiative components of the climate system’s energy budget.
The problem is that the measurements back to space do not reflect all. The measurements only reflect the IR.
That’s NOT science.
If Earth [or a planet] absorbed all the sunlight- absorbed 340 watts and emitted 340 watts on average- would it be warmer.
By definition any body or planet which absorbed all sunlight and emits as blackbody is blackbody.
But something which absorbs all sunlight and doesn’t emit as blackbody would be warmer as compared to a body which it did emit as blackbody.
Or anything which emits as blackbody is cooler than a non blackbody.
If have a cube which had a side facing the sun being reflective and other 5 sides have blackbody surface- that a cool cube. If side facing sun is blackbody surface, and the 5 sides have reflective surfaces- that’s a hotter cube.
Any planet with a significant atmosphere will reflect sunlight.
Would any planet with any significant atmosphere have a higher average global temperature as compared to same planet lacking atmosphere.
If add nitrogen gas to the Moon- say 20 trillion tonnes- the Moon would reflect a bit more sunlight [though that’s not really, a significant atmosphere- more mass than Mars, but Mars requires a spacesuit- and with the Moon’s lower gravity it would have less pressure than Mars. But also with such low pressure the N2 wouldn’t liquidity/freeze].
Anyhow does the slight increase in reflected sunlight cause the Moon to cool slightly or does warm significantly due to having such a non-greenhouse gas atmosphere.
It seems that the half of the atmosphere facing the sun would warm up and side on night side would cool. So absorb more energy and be slightly more reflective.
“Non-Scanning ERB instruments have a similar design to the TSI radiometers, e.g., the Earth Radiation Budget Experiment (ERBE) NS ERB instruments are a derivative of the ACRIM TSI radiometer (see Barkstrom and Smith [26]). The main difference is in the opening angle which is 120◦ foraWFOVradiometerwhileitisafewdegreesforaTSIradiometer. WFOVERBradiometersmeasure the true radiative flux at satellite altitude. The reflected solar radiation with wavelengths shorter than 4 microns is also called ShortWave (SW) radiation. The emitted thermal radiation with wavelengths longer than 4 microns is also called LongWave (LW) radiation. A black radiometer without front window measures the total (TOT) radiation, which is the sum of the SW and the LW radiation. A SW radiometer is obtained by putting a quartz window in front of a TOT radiometer. LW radiation can be measured as TOT minus SW. The size of the Field Of View (FOV) of a WFOV radiometer is several thousand kilometers, which prohibits, for example, the discrimination between clear sky and cloudy scenes. Higher spatial resolutionisobtainedwiththeNFOVinstruments,withaspatialresolutionoftheorderof10to100km. In order to capture the Earths radiation at all viewing zenith angles, these radiometers are scanning.”
“Measurement of the Earth Radiation Budget
at the Top of the AtmosphereA Review
Steven Dewitte * and Nicolas Clerbaux”
Thank you Roy; I would have thought that ENSO, with positive phases dominating negative ones in both number and asymmetry, could explain most if not all of the temperature during the 20thC.
But – the record temperatures keep coming irrespective of ENSO.
Did’nt you notice we have just been through a La Nina but the record temperatures keep coming, the glaciers keep melting, the sea ice keeps disappearing, sea levels keep rising, etc etc.
I am afraid you cannot hide behind ENSO as an explanation. It is just a fig leaf.
Glaciers have been melting for a couple of hundred years; their melting has revealed higher temperatures in the past. The rise in sea levels started a long time ago; when considering what is happening at tide gauges and what adjustments are made in the satellite measurements, I am not worried; the supposedly islands at risk are actually growing in size; there is less sea ice than 40 years ago, but there is no certainty at what is the right level of sea ice — much less that there has been negative consequences from the decrease; etc. etc.
Negative consequences for whom?
An Inquirer says:
The rise in sea levels started a long time ago….
When did it start?
…when considering what is happening at tide gauges and what adjustments are made in the satellite measurements
How do you feel about the adjustments to UAH’s monthly data?
inquirer…”Glaciers have been melting for a couple of hundred years”
Since 1850 anyway. That’s when the Little Ice Age ended. During the LIA, glaciers grew immensely. One in the French Alps grew across a valley and wiped out a town.
It takes time to recover when each winter more snow gets piled on the glaciers.
Akasofu claims about 0.5C/century.
What warming is causing the glaciers to melt? What is(are) its source(s)?
Ice doesn’t just melt for no reason….
Right, prof. So far in this season, UAH LT is at a record high for a La Nina. The last El Nino season (July-June) was a record high, and the last neutral season (2014-2015) was a record high.
profp…”the record temperatures keep coming, the glaciers keep melting, the sea ice keeps disappearing, sea levels keep rising, etc etc.”
Only in your NOAA induced dreams. Any records these days come from fudged NOAA data. I fear they are contaminating the sat data before UAH gets it.
Even if there are records, it’s by a fraction of a tenth of a degree C. The exceptions are 1998 and 2016 where records exceeded other records by several tenths of a degree for a very brief period. Even at that 1934 is still the hottest year in US history.
As far as all glaciers retreating, maybe you could point that out to Everest climbers on the southern approach where they camp at the foot of the Khumbu icefall. That’s the termination of the glacier through the Western Cwm that begins at the Lhotse face.
The foot of the glacier has not gone anywhere since at least 1953 when Everest was first climbed. Same on the northern approach and for every one of the major glaciers in the Himalaya chain such as K2, Annapurna, etc.
Gordon Robertson says:
“Any records these days come from fudged NOAA data. I fear they are contaminating the sat data before UAH gets it.”
And your evidence for these claims are…what? Sprites? Fairies? A superhero in your bedroom?
Let’s see you provide some evidence for your obnoxious claims. Like g*, you never can.
Gordon Robertson says:
“Even at that 1934 is still the hottest year in US history.”
Why do you keep lying about this?
I mean, what’s in it for you, lying like this, over and over? What do you get out of it?
davie, why to you keep sucking up to nonsense like the 800,000K?
What do you get out of it?
About 90% of glaciers are shrinking worldwide.
Now, we all know what you will say next:
“the data is fudged..whine whine whine”
“they are retreating because of the end of the Little Ice Age . whinge whinge whinge..”
“it is only a short term phenomenon they will advance again soon b.s. .. b.s.. b.s..”
etc etc
profp…”Now, we all know what you will say next:
the data is fudged..whine whine whine
they are retreating because of the end of the Little Ice Age . whinge whinge whinge..
it is only a short term phenomenon they will advance again soon b.s. .. b.s.. b.s..”
************
Yes, but your explanation is that a trace gas making up 4/100ths of 1% of the atmosphere is responsible. You and your alarmist crowd claim that trace amount of gas is trapping heat and/or back-radiation IR from a cooler part of the atmosphere to super warm the surface.
I have pointed out to you using basic physics/chemistry that Dalton’s Law states clearly that the heat contributed to a mixed gas by a component gas is proportional to it’s mass-percent (pressure) in the mix.
You have no response to that. You have no response to the fact that heat cannot be transferred from a cooler part of the atmosphere to a warmer surface that warmed it in the first place. You have no response to the fact that heat cannot be trapped by other gases, especially not one representing 0.04% of the atmosphere.
On the other hand, NOAA has admitted fudging even though they glossed it over by claiming it’s for the better that we discard 75% of the available data and re-manufacture it in a climate model.
Recovery from the LIA supplies a sound scientific explanation for why the atmosphere is warming and to the degree it is warming.
The first half of the UAH record was dominated by el nino, the second half by la nina. This suggests the ENSO influence on the trend has been towards cooling, not warming.
Lets see some data on this. Like the MEI or ONI.
Also, El Nio years and La Nia years keep getting warmer. Why?
David wants to know,
“El Nio years and La Nia years keep getting warmer. Why?”
This should give you the general idea:
“While natural processes continue to introduce short term variability, the unremitting rise of CO2 from industrial activities has become the dominant factor in determining our planets climate now and in the years to come.”
OK, thanks. I see now that I probably misinterpreted your post above. My apology.
David
No problem. Here is what found looking at the historical ONI chart:
First half of UAH record:
72 el nino months
37 la nina months
Second half of UAH record:
50 el nino months
80 la nina months
http://www.cpc.noaa.gov/products/analysis_monitoring/ensostuff/ensoyears.shtml
Good point, and since enso produces stronger variation in troposphere temp, then at surface, its effect should be greater in uah trend.
Alright, thanks. I was thinking more of the averages.
For UAH LT’s first half (Dec78-Jun98), =0.60, and for the second half, =0.12
For the ONI, first half =0.21, and second half =-0.12.
So, yes, the first half seems influenced by El Ninos (and I’ve seen people mention that regarding its relatively high trend, such as Trenberth), with a not-so-clear signal in the 2nd half.
Skeptics will try to use ENSO to explain the TLT warming trend. I think they have it backwards. The trend could have been even greater had the early part of the record not been dominated by el nino.
snake, you obviously didn’t eat your vegetables at supper.
Or, maybe you did. …
snape…”Skeptics will try to use ENSO to explain the TLT warming trend.”
Even your guru Trenberth lamented he could see the warmingdue to EN/LN. Did not seem to occur to him, or you apparently, that maybe ENSO is causing all the warming.
Of course there has to be an underlying explanation like the recovery from the Little Ice Age.
Gordon, la ninas have a cooling influence on the atmosphere. No need to bring up Trenberth, just look at the data:
First half: 37 la nina months
Second half: 80 la nina months
That doesn’t count the current la nina “conditions” …..likely to bring the second half total to 85.
At this time the North Pole goes to zero degree again!!
The current temperature in southern California.
http://pics.tinypic.pl/i/00959/9w5h2cu6804q.png
Polar vortex in the lower stratosphere.
https://earth.nullschool.net/#2018/02/25/1200Z/wind/isobaric/70hPa/orthographic=-101.97,91.49,342
There is no denying that arctic winter warming is a bit too big.
The previous such a strong jump in temperature in the stratosphere occurred in 2009, in the period of the previous solar minimum.
http://files.tinypic.pl/i/00959/recvuuun9a59.png
The question is why does the sea ice change so dramatically if you approximate it, as you can see from the picture?
Data from the national snow and ice center will not be falsified.
How do you explain that?
This is due to the stratospheric polar vortex pattern since the beginning of winter.
http://pics.tinypic.pl/i/00959/xly4fdbl4sgp.png
http://pics.tinypic.pl/i/00959/hthq2h77wgok.png
What do you think is the impact of CO2 on the stratospheric polar vortex?
http://pics.tinypic.pl/i/00959/dh80m4r4tkz8.gif
ren…”What do you think is the impact of CO2 on the stratospheric polar vortex?”
none…nada…nic…niente…lutho…nichts…nane at awe ….rien…
caoy…”The question is why does the sea ice change so dramatically if you approximate it, as you can see from the picture?”
Bugs Bunny…well, ya see, Doc….in da winter der ain’t no sun…crunch, chomp.
Foghorn Leghorn…Ah, say, boy, pay attention…ah said…pay attention (nice boy but built way too close to the ground, went ova, ah said, went right ova his head).
It’s that darned…ah said that darned sun…never around in the winta when ya need it.
How would we know what is the correct amount of warming? There is a lot of similarities of the current warmth to what the Arctic had in the 1920s.
Do you have specific data on the arctic in the 1920s?The only thing I can see right now is that the Washington post in the 1920s has the corresponding report,no data
There is no “correct” amount of warming. The ideal temperature is the temperature a species has adapted to. Adapting to new temperatures, especially ones changing as fast as today’s, can be difficult.
inquirer…”How would we know what is the correct amount of warming? There is a lot of similarities of the current warmth to what the Arctic had in the 1920s”.
1934 still holds the temperature record for the US, even though GISS has tried to change that based on fudged data. The dust storms during that decade are related to searing heat.
Are you sure, Inquirer?
Here is a chart showing NOAA land+ocean in the 60N-90N Arctic region, with anomalies wrt 1981-2010:
http://4gp.me/bbtc/151950906061.jpg
The top 25 of all them:
1981 | 1 | 3.61
1934 | 2 | 3.09
2017 | 3 | 2.69
2016 | 2 | 2.68
2007 | 1 | 2.61
2016 | 1 | 2.56
1989 | 2 | 2.48
2007 | 4 | 2.44
1930 | 1 | 2.44
1990 | 3 | 2.42
2017 | 12 | 2.23
1995 | 2 | 2.21
1935 | 2 | 2.19
2010 | 11 | 2.07
2016 | 3 | 2.02
2011 | 3 | 1.93
1937 | 1 | 1.88
2006 | 12 | 1.87
2015 | 2 | 1.83
1942 | 1 | 1.82
2016 | 4 | 1.82
1955 | 1 | 1.81
2005 | 11 | 1.77
2014 | 3 | 1.75
2003 | 12 | 1.75
I guess you’ll mean the 1930’s. Of 25 anomalies, 15 belong to the 2000’s, and 9 to the 2010’s.
Far more interesting is the fact that in these 25, not one anomaly comes from a month between may and october.
That is something you can’t discover when you look at absolute data. You see there only summer months at top.
Pang/Bin, you’re not even in the same time period.
Your blatant bias is hilarious.
Gordon Robertson says:
“1934 still holds the temperature record for the US….”
A lie that Gordon repeats again and again, without shame.
In fact, the 1934 annual average for USA48 is only the *seventh* highest.
Top 6 are, in order, 2012, 2016, 2017, 2015, 2006, 1998.
2012 was 1.2 F warmer than 1934.
Gordon Robertson says:
“1934 still holds the temperature record for the US….”
Gordon, seriously: why do you keep claiming this when the data show it’s wrong?
http://www7.n&c&d&c.n&o&a&a.g&o&v/CDO/CDODivisionalSelect.jsp
[Remove the ampersands.]
The plots show maps with sea ice thickness, and seasonal cycles of the calculated total arctic sea ice volume. The mean sea ice volume and standard deviation for the period 2004-2013 are shown with gray.
http://ocean.dmi.dk/arctic/icethickness/anim/plots_uk/CICE_combine_thick_SM_EN_20180223.png
ren…”The plots show maps with sea ice thickness…”
Has anyone every explained to alarmists why it gets so low in summer, with full solar radiation, then returns to 3 metres thickness during winter, with little or no solar radiation?
Is this one of those difficult problems to visualize, like the flat trend on the UAH graph from 1998 – 2015?
Even the average at the North Pole is 1.5 metres.
Gordon Robertson says:
Has anyone every explained to alarmists why it gets so low in summer, with full solar radiation, then returns to 3 metres thickness during winter, with little or no solar radiation?
Are you really asking why there’s more ice when it’s colder?
No clown, he’s just pointing out “natural variation”.
Learn it, love it, live it.
I’ve noticed a pattern: when you can’t respond to the science, you resort to insults. It’s a huge tell.
caoy…”There is no denying that arctic winter warming is a bit too big”.
It’s only big in small locales which move around month to month. It’s behaves more like weather patterns than climate change.
Compare these patterns:
January 2018
https://www.nsstc.uah.edu/climate/2018/jan2018/JANUARY%202018.png
May 2017
https://www.nsstc.uah.edu/climate/2017/may/MAY_2017_map.png
August 2016
https://www.nsstc.uah.edu/climate/2016/august/August2016_globe.png
Look at the blue spots as well.
For UAH LT v6.0, the total warming in their North Pole region is 2.0 times the warming of the entire globe.
Yes. Arctic temps. are ridiculous:
http://pamola.um.maine.edu/wx_frames/gfs/arc-lea/t2anom/2018-02-24-12z/00.png
The really weird thing………in a few months they will be almost exactly average.
That was in response to CAOYIFEI’s comment upthread:
“At this time the North Pole goes to zero degree again!”
No idea why it appeared down here.
snake, you have a lot to learn.
Snape says:
“The really weird thingin a few months they will be almost exactly average.”
Because (as I told you before), the Arctic summer air temperature won’t rise much above freezing until all the ice is melted.
The sunlight and IR received goes into melting ice. Then it can raise air temperature.
It’s not “weird” at all, just physics.
David
I agree that’s part of the explanation, but not all.
In winter we see warm air masses swirl in and out of the Arctic. Nothing of the sort seems to happen in the Arctic summer.
There certainly is weather in the summer Arctic. In the summer of 2012, a cyclone contributed to breaking up the sea ice, leading to a record low extent.
Is the negative gap between the model temperature trend — which is for surface temperature — and the UAH LT trend consistent with what one would expect from GHG heating at an equilibrium climate sensitivity of only 1.54 deg. C?
Peter, only if you believe CO2 is a heat source.
No one believes CO2 is a “heat source.”
Nor do they believe blankets are a heat source, or jackets, or attic insulation.
Correct, davie!
You’re learning.
That’s why CO2 can NOT heat the planet.
Keep learning.
How does a winter jacket — which is not a source of heat — keep you warm?
davie, are you now claiming you do not understand the difference between “insulation” and a “heat source”?
If you ever had a college level physics course, you may be able to get your money back,
You still think CO2 is a heat source….
After all this time. Sad.
I have moved this down here in response to David Appell’s insistence that I give evidence of my alleged libel of Kevin Trenberth. Here’s a beauty:
https://pielkeclimatesci.wordpress.com/2011/09/04/hatchet-job-on-john-christy-and-roy-spencer-by-kevin-trenberth-john-abraham-and-peter-gleick/
“There is an opinion article at Daily Climate that perpetuates serious misunderstandings regarding the research of Roy Spencer and John Christy. It also is an inappropriate (and unwarranted) person attack on their professional integrity. Since I have first hand information on this issue, I am using my weblog to document the lack of professional decorum by Keven Trenberth, John Abraham and Peter Gleick”.
********
“I am using my weblog to document the lack of professional decorum by Keven Trenberth, John Abraham and Peter Gleick”
***********
Pielke points out that the editor who resigned over the publication of the Spencer/Braswell paper sent a letter of apology to Kevin Trenberth. Both Pielke and his son, another prominent climatologist, found that very odd.
No kidding!! Trenberth, Abraham, and Gleick brought undue pressure to bear on a journal editor by severely criticizing his publication of a paper from skeptics.
Trenberth is a Coordinating Lead Author on IPCC reviews and carries considerable weight in climate circles. In the Climategate email scandal, the head of Had-crut, Phil Jones, who is partnered with Trenberth as a CLA, claimed something to the effect that he and ‘Kevin’ would see to it that certain skeptical papers would not make it to IPCC review.
The brings corruption at the IPCC level into focus. I have continually claimed the IPCC is a political process designed to feed politicians one side of the climate equation. In other words, to tell politicians what they want to hear.
If I recall correctly, one of those papers involved Roy or John at UAH.
I mean, this is not a matter of scientists writing a paper trying to prove the Earth is flat. This is cutting edge science based on new technology that is proving the old technology lacking. Trenberth et al had no business sticking their noses where they did not belong provided science that has integrity.
Gordon, you wrote that Trenberth interfered with the publication of Spencer & Braswell. You still haven’t offered any evidence for that claim.
So your claim is still libelous.
It looks to me that Trenberth took action AFTER the article was published. Any scientist is free, of course, to contact a journal and its editors with thoughts and comments on a published paper.
You complaint seems to be that Trenberth commented on a published paper. Any scientist is free to do that. The editor’s resignation and apology speaks for itself.
PS: Trenberth is not my “buddy.” I don’t know him personally — I interviewed him once over the phone, and had lunch with him at a science journalism workshop — but I admire his scientific accomplishments. He is very highly respected in the climate science community.
davie, do you still claim that the Sun can heat the Earth to 800,000K?
It would if the Earth had no way of getting rid of heat.
—
Pierrehumberts claim: “In a single second, Earth absorbs 1.22e17 joules of energy from the Sun. Distributed uniformly over the mass of the planet, the absorbed energy would raise Earth’s temperature to nearly 800 000 K aftar a billion years, if Earth had no way of getting rid of it.”
– Physics Today, January 2011, pg 33
– https://geosci.uchicago.edu/~rtp1/papers/PhysTodayRT2011.pdf
Proof:
dT = dQ/mc
Given: (dQ/dt)_net = 1.22e17 J/s in => dQ = 3.85e33 J over 1 Gyrs.
m = mass of Earth = 6.0e24 kg
c = specific heat of Earth = about 850 J/kgK (Table 2.6, http://link.springer.com/chapter/10.1007%2F978-3-642-34023-9_2) for both mantle and outer core (together they comprise over 99% of the Earths volume).
=> dT = 760,000 K
Q.E.D.
http://www.drroyspencer.com/2018/02/diagnosing-climate-sensitivity-assuming-some-natural-warming/#comment-288547
That comment is wrong.
There’s no science to support it, no experimental evidence either. It’s just an unproven claim.
What do you think happens to sunlight (photons) if they arrive at Earth and T(Earth) >= T(sun). How do they know the temperature of their source, and where do they go?
No clown, the comment is NOT wrong. You are wrong.
But, you know so little physics you cannot figure it out.
Hilarious.
Then show me the science that supports your claim. The evidence.
Tell me how photons know the temperature of their emitter.
davie, have you never studied physics?
Do you not know how photons are absorbed?
Are you one of the cultists that believe ALL photons are absorbed ALL of the time?
Does that not translate to your apartment would be in flames?
Can you not think for yourself?
Hilarious.
You’re still not providing any evidence to back up your claims.
Just your usual rants.
Let’s see your science. Let’s see you tell us what happens to photons emitted from the Sun when they reach the Earth.
g*e*r*a*n says:
“Are you one of the cultists that believe ALL photons are absorbed ALL of the time?”
That was Pierrehumbert’s assumption in his thought experiment.
Do you know what a “thought experiment” is? Seriously….
davie, you just keep finding new ways to believe your pseudoscience.
It’s hilarious.
You won’t accept actual science, but you will swallow the “thought experiments” of your hero, without any questioning.
It’s fun to watch.
More sputtering and insults.
Everything but disproving the claim, using science.
That’s the only thing you have to do, and the one thing you seem unable to do.
http://www.drroyspencer.com/2018/02/a-1d-model-of-global-temperature-changes-1880-2017-low-climate-sensitivity-and-more/#comment-289404
Still no science or evidence. How lame.
You clearly don’t have any. You try to get by here on insults and trolling. By being a bully.
Your curtain has come down.
davie, it’s embarrassing to fall off your homemade pedestal.
But, based on your building expertise, it’s not that far to fall.
I’m sure no one will laugh. ..
Look at you, all you have are insults.
No scientific responses at all. You’re very easy to see through.
Clown davie, the only “science” you will accept are used bird-cage liners.
Where do you want them sent?
More insults in lieu of science.
This is very typical of you. That’s why I mostly avoid you — you have nothing interesting to say, and nothing scientific to say. You’re just here to try to bully others with name calling and rants.
You’ve failed to offer any science for any of the claims you’ve made here today. None. You literally have no cogent responses.
There is no point in responding to you any longer.
Okay, davie, not a problem. Maybe when you learn some physics we can continue.
In the meantime, where do you want the bird-cage liners sent. Probably many readers would like to know.
See what I mean? More dumb insults, trying to cover up the fact that you have no scientific arguments.
Gordon Robertson says:
I have continually claimed the IPCC is a political process designed to feed politicians one side of the climate equation. In other words, to tell politicians what they want to hear.
Claim what you want — you never have evidence for anything.
Much like Trump, you create your own reality by rejecting facts and knowledge. You’re not fooling anyone.
davie you never have evidence for anything. All you offer is your papers, suitable for lining bird cages.
You create your own reality, devoid of the laws of physics.
You’re not fooling anyone.
You’re not providing any evidence.
Here is some of the evidence for the GHE:
https://www.giss.nasa.gov/research/briefs/schmidt_05/curve_s.gif
Even Jo Nova’s blog knows there is a greenhouse effect:
http://joannenova.com.au/2011/10/there-is-a-greenhouse-effect-on-venus/
Clown, we’ve been here before. That is not evidence of the IPCC/AGW/CO2/GHE. It is only evidence of your belief system.
But to you, a dead bug is evidence of your belief system.
Hilarious.
Now all you’re doing is sputtering and name calling. You’re not providing any science or any evidence.
Explain why the Jo Nova post is wrong.
Explain how the Sun can heat Earth to 800,000K.
When you can’t, then explain why you swallowed that nonsense so readily.
Next, we will move to questions about your income. Maybe you don’t want to go there. ..
I’ve explained that to you many, many times, with a detailed calculation.
What do you find wrong with my calculation?
http://www.drroyspencer.com/2018/02/diagnosing-climate-sensitivity-assuming-some-natural-warming/#comment-288547
Your other comment says:
“The Sun, radiating at an effective temperature of 5800K, could NEVER heat the Earth beyond that temperature.”
What were Pierrehumbert’s assumptions? What came after his “if….”
Clown, you don’t need to get to “if” before you know it’s pseudoscience.
What Pierrehumbert is doing — a thought experiment, not describing reality — and why, has gone completely over your head.
WHOOSH!
Klteste Nacht des Winters steht bevor
Der Montag wiederholt im Wesentlichen das Wetter vom Sonntag: Hchstwerte zwischen minus fnf und minus ein Grad und ein paar Schneeschauer aus wechselnder Quellbewlkung. Die Wolken verdichten sich in der Nacht und sorgen hier und da fr ein paar Schneeschauer. Fr die Temperaturen bildet die Wolkendecke allerdings keine wirkungsvolle Schranke – und erneut sacken sie auf bis zu minus zwlf Grad herab.
Das ist allerdings erst der Anfang: Ab Dienstag ist die Schleuse arktischer Luft weit geffnet. Die Hchstwerte steigen nirgendwo in unserer Region mehr ber minus zwei Grad an. Vor allem im Norden fllt aus wechselnder Bewlkung etwas Schnee. Und die Nacht wird voraussichtlich die klteste dieses Winters: bis minus 14 Grad betragen nunmehr die erwarteten Tiefstwerte in unserer Region.
Quelle: https://www.berliner-zeitung.de/29775580 2018
Dr Spencer, I’m not a climate scientist, but I’ve observed that real science isn’t practiced in that field. In most fields of science, you attempt to “control” for as many factors as possible. That isn’t the case in client science as far as I can see, other than statistical controls in regression models. Dr. Soon is the only one I’ve seen attempt to address the issue.
https://co2islife.wordpress.com/2017/02/18/a-tale-of-two-cities-cherry-picking-locations-to-manufacture-warming/
This may be an approach worth considering:
Isolating the Contribution of CO2 on Atmospheric Temperature
In any serious scientific experiment, efforts are made to control for as many exogenous factors as possible. The whole purpose is to isolate the impact of the independent variable on the dependent variable. ΔWeightloss = ΔCaloric Intake + ΔExercise + ΔBase Metabolism + error. To minimize the error of the model (maximize explanatory power), variables outside Continue reading
https://co2islife.wordpress.com/2018/02/14/isolating-the-contribution-of-co2-on-atmospheric-co2/
4 Graphs That Demonstrate Why The IPCC Climate Models Will NEVER Be Accurate
Y = mX + b One of the most basic statistical techniques used in science is the linear regression. The linear regression defines the relationship between the independent variable (cause) and the dependent variable (effect). The mathematical relationship is Y = mX + b, where Y is the dependent variable, m is the slope of the Continue reading
https://co2islife.wordpress.com/2017/05/13/4-graphs-that-demonstrate-why-the-ipcc-climate-models-will-never-be-accurate/
The mistake you keep making is to attach the “GHE” to science. The GHE is pseudoscience. Atmospheric CO2 can NOT heat the planet.
Why can’t atmospheric CO2 increase the atmospheric temperature of a planet?
Show your evidence.
Contrary to your beliefs, davie, CO2 is NOT a heat source.
Sorry.
NO ONE claims CO2 is a heat source.
Is your winter jacket a heat source? No. So why do you wear it?
davie, you admit that CO2 is not a heat source.
Do you now claim that your winter jacket is a heat source?
As I wrote above, your winter jacket is not a heat source.
So how does it keep you warm?
How does CO2 heat the planet?
Have you seriously not tried to understand how CO2 warms the planet?
There has been a moon-load of papers, books, videos, etc on this. Have you really not spent a half-hour learning?
You’re so sure AGW is wrong, but you’ve never taken any time to learn the evidence? Why not?
Clown, I have even had to explain the pseudoscience to you. You did not understand your own pseudoscience.
Sorry, but “science” supersedes “pseudoscience” every time it’s tried.
Want to try again?
(Hilarious.)
Again, you choose not to have a serious discussion or answer basic questions, and instead fall back on rant and juvenile name calling.
SMH.
davie, you are unable to have a “serious” discussion. You believe you know physics, based on your bird-cage liners.
Hilarious.
So prove my physics wrong.
Why can’t you do that?
davie, you don’t know any “physics”.
You prove yourself wrong by using the word.
It’s fun to watch.
I gave you my calculation. Where is it wrong?
You are all talk and no action.
davie, 5800K warms to 800,000K?
What part of 2LoT do you not understand?
Why do you think the 2nd law invalidates Pierrehumbert’s example?
How does a photon from an 5800 K Sun know what the temperature of its emitting body is?
What happens to it if, as you claim, the Earth rejects it. Where does it go?
You have avoided answering both these questions.
davie, I’m not avoiding your questions, I’m just laughing at them.
You clearly have no understanding of physics.
You’re a climate clown!
Where does a reflected photon go from clouds? Where does a reflected photon go from flora?
Hilarious.
(This is going to be a great year in climate comedy!)
“Hilarious.
(This is going to be a great year in climate comedy!)”
Only if you are a half-wit. You don’t live in an asylum perhaps?
Along with inmates who laugh hysterically at anything anybody says?
You have my sympathy.
g*e*r*a*n,
Why would it stop at 5800K if the earth had no way of getting rid of it?
“No way” must include reflection, right?
https://atmos.washington.edu/2002Q4/211/notes_greenhouse.html
Then we need to multiply by the factor 0.70, which takes into account the fact that 30% of the incident solar radiation is reflected back to space by clouds, snow and ice, the light colored sands of the deserts, and even just a bit from the daisies. 342.5 x 0.7 = 239.7 watts per square meter. The 0.70 is equivalent to the factor (1-A) in the formula in the text.
Energy flux absorbed by the Earth = 1370 x (1-0.3) / 4 = 239.7 W/m2
J: They then go on to convert this to 255 K using Stefan-Boltzmann. If they had not multiplied by 0.7 (so, no reflectivity) they would have been converting 342.5 W/m2 instead. Svante, do you think that would convert to infinity K? Or some finite number of K?
P.S: This was funny (also from their notes):
Solar radiation incident on the Earth’s disk
Or perhaps you are just discussing what would happen if the Earth were a black hole (not a black body)? If so…what was the point in discussing that? It isnt a black hole, thankfully. Or a black body.
Yes Halp-less, if the earth absorbed everything like a black hole.
The only point is to get g*e*r*a*n past that hypothetical 3rd sentence and get him to the 4th that says it will not happen.
He will then hopefully sail through the remaining pages, and understand everything about the earths energy imbalance.
halp…”Then we need to multiply by the factor 0.70, which takes into account the fact that 30% of the incident solar radiation is reflected back to space by clouds, snow and ice, the light colored sands of the deserts…”
So I take it that if I wander through the Sahara desert wearing a white suit, I should be cool and impervious to heat? We both know that’s not the case so how does the air above the desert become stifling hot? The sand absorbs the solar IR, right? Then it conducts the heat from the sand to the air.
So, what’s to stop the SW solar radiation from warming the water droplets in clouds, or even CO2 molecules? The alarmist propaganda claims SW solar IR sails straight through, ignoring molecules in the atmosphere. I find that to be a bit of a stretch. How do they prove that premise?
DA…”How does a photon from an 5800 K Sun know what the temperature of its emitting body is?”
It can tell by its energy intensity and frequency.
Gordon Robertson says:
“It can tell by its energy intensity and frequency.”
Really? How?
Give me the mathematical relationship between a photon’s properties and the temperature of its emitter.
g*, you pretend to laugh only because you can’t come up with an intelligent response.
A big high above Europe.
http://www.sat24.com/h-image.ashx?region=eu&time=201802250730&ir=True
Sorry.
http://pics.tinypic.pl/i/00959/15o73a6irpqz.png
The increase in solar wind speed in the coming days will cause a drop in the temperature in the stratosphere and an increase in the energy of jet streams.
They start snowfall in Italy.
Sorry.
The snowfall in Italy has begun.
ren…”The snowfall in Italy has begun.”
Which part of Italy, ren? Part of the Alps are in northern Italy and snowfall is common there. If it’s in Rome, the Pope may need to don long-underwear.
On Tuesday, February 27, pressure above the Scandinavia may increase to 1056 hPa.
http://images.tinypic.pl/i/00959/fohwovm2ql5c.png
It is obvious that the pressure at the surface of the Earth does not depend on the troposphere’s height (latitude).
ren…”It is obvious that the pressure at the surface of the Earth does not depend on the tropospheres height (latitude)”.
It’s obvious to me that surface pressure is directly proportional to the force of gravity at the surface. This simple fact gets lost in the weather-related jargon of the lapse rate, which cannot explain why the atmopsheric gas pressure at the top of Mt. Everest (~30,000 feet) is 1/3 the pressure at the surface.
Lapse rate obviously operates superimposed on gravity, not in place of it.
re Everest and air pressure. Recently, a weather station was setup at 8000 metres, which is the level of the South Col between the Everest peak and the adjacent Lhotse peak.
The temperature in May 2008 was -21C and the air pressure was 38.21 kPa. At the peak of Everest the pressure drops even lower to 33.7 kPa. Sea level pressure is 101.3 kPa. That means the peak of Everest at nearly 30,000 feet is about 1/3 what it is at sea level. At the 8000 metre level it is about 0.38 the pressure at the surface.
Even though the gravitational acceleration only drops from 9.8 m/s to about 9.7+ m/s, the reduction has that much effect on air pressure.
Katmandu, where people congregate for Everest climbs at 1400 metres is in the high 20C range in May. I know this is not a scientific comparison but over 6600 metres in altitude, the temperature drops from the high 20C range to -21C between Katmandu and the Everest-Lhotse Col.
see Environment
https://en.wikipedia.org/wiki/Mount_Everest
Gordon Robertson says:
“Its obvious to me that surface pressure is directly proportional to the force of gravity at the surface.”
Everyone knows this and has for a few centuries.
avg surface pressure = (mass of atmosphere)*g/(surface area of Earth)
DA…”Gordon Robertson says:
Its obvious to me that surface pressure is directly proportional to the force of gravity at the surface.
Everyone knows this and has for a few centuries.”
************
That’s my point, apparently some people have forgotten, like NASA GISS, realclimate, and a host of other alarmists. Atmospheric temperature is basically controlled by gravity and it involves the warming effect of mainly N2 and O2. Of course, solar energy is the vital driver but gravity forms a temperature gradient with warmer air at the surface, gradually cooling with altitude.
N2/O2 absorb heat directly from the surface and carries it aloft. Lindzen has explained that in lieu of the lame CO2-based GHE.
In this wiki article on lapse rate they credit gravity for creating a lapse rate then they go off on a tangent, claiming it is adiabatic expansion and convection as the root cause.
https://en.wikipedia.org/wiki/Lapse_rate
Adiabatic expansion of rising air is a product of the pressure gradient caused by gravity. As denser air rises into thinner air it has to expand….and cool.
The point is, rising air cools naturally as its pressure drops. The lower pressure is a product of gravity.
Gor, as Roy explained, without a GHE, there would be no temp gradient in atmosphere. There would be no way for rising heat to be radiated at TOA, so it is only radiated from surface.
reposting this down here since it’s getting buried above:
profp…”Now, we all know what you will say next:
the data is fudged..whine whine whine
they are retreating because of the end of the Little Ice Age . whinge whinge whinge..
it is only a short term phenomenon they will advance again soon b.s. .. b.s.. b.s..”
************
Yes, but your explanation is that a trace gas making up 4/100ths of 1% of the atmosphere is responsible. You and your alarmist crowd claim that trace amount of gas is trapping heat and/or back-radiation IR from a cooler part of the atmosphere to super warm the surface.
I have pointed out to you using basic physics/chemistry that Dalton’s Law states clearly that the heat contributed to a mixed gas by a component gas is proportional to it’s mass-percent (pressure) in the mix.
You have no response to that. You have no response to the fact that heat cannot be transferred from a cooler part of the atmosphere to a warmer surface that warmed it in the first place. You have no response to the fact that heat cannot be trapped by other gases, especially not one representing 0.04% of the atmosphere.
On the other hand, NOAA has admitted fudging even though they glossed it over by claiming it’s for the better that we discard 75% of the available data and re-manufacture it in a climate model.
Recovery from the LIA supplies a sound scientific explanation for why the atmosphere is warming and to the degree it is warming.
Gordon,
If you mix a hot and a cool gas they will not stay at different temperatures.
If some molecules absorb energy it will be shared.
So the mass percentage is irrelevant, only the absorbed energy matters.
svante…”So the mass percentage is irrelevant, only the absorbed energy matters”.
In my comment I referenced Dalton’s Law. Why don’t you become familiar with what it means first before telling me mass-percent does not matter?
Basically, Dalton’s Law is called the law of partial pressures. When several gases mix in a constant volume they contribute to the total gas pressure as the sum of their individual pressures. The pressure is proportional roughly to their mass percent.
In a constant volume, temperature is directly proportional to pressure. That means clearly that the temperatures contributed by each gas is proportional to the mass-percent of each gas.
This is not magic. If a gas molecule shares it’s energy with another molecule it does not retain the energy so it can pass it on to other molecules endlessly. If CO2’s mass percent in the atmosphere is roughly 0.04% of the molecules it can only share heat with 0.04% of other molecules, not the entire gas as alarmists seem to presume.
The notion that only CO2 and WV can heat the atmosphere is ludicrous.
Gordon, how do N2 and O2 absorb the heat given off by the Earth? (Remember, you claim you’re an expert in atomic physics.)
And why do you ignore radiative transfer?
DA…”Gordon, how do N2 and O2 absorb the heat given off by the Earth?”
The same way any gas absorbs heat from the walls of a container…by conduction. When you sit a pot of water on an electric stove ring, how do you think the heat gets into the water? You surely don’t think it radiates off the walls and ceiling and gets into the water. The heat is conducted straight through the steel in the pot bottom and sides.
When N2/O2 molecules contact the Earth’s surface, heat is transferred to the molecules. The heated molecules rise and cooler air rushes in to take its place. Through conduction and convection you get heat transferred into the atmosphere.
Gordon, you have misunderstood Dalton’s law.
It is about partial pressures, not heat.
What you mean to say is that if you add a small amount of hot gas it will make a small contribution to a larger mass (depending on heat capacity, not mass).
That is true if you do it once, but in this case there is a continuous flow of energy. What matters is the magnitude of that flow.
svante…”Gordon, you have misunderstood Daltons law.
It is about partial pressures, not heat”.
Time to review the Ideal Gas Equation:
PV = nRT
Consider the atmosphere a constant volume, even though gravity complicates the matter by stratifying pressure with altitude. Also, consider n = mass (number of atoms essentially) as a constant.
P = (nR/V)T
You can see immediately, with (nR/V) a constant that P and T are directly proportional and that is clear in the atmosphere where, with increasing altitude, temperature reduces with pressure.
So, temperature and pressure are directly related. Temperature is a relative measure of heat. There you have it, pressure and heat are directly related.
That makes sense at an atomic level. If you increase pressure in a constant volume you must increase the mass, or in the case of the Earth, have a force like gravity actin to vary the pressure with constant mass. When atoms are packed closer together (higher pressure) they collide more and the kinetic energy rises (heat).
The Earth is a unique situation whereby you can keep the volume constant, keep the mass constant, yet vary pressure and temperature with an external force that affects mass (gravity).
Therefore, if the sum of partial pressures equals the total gas pressure then the partial temperatures related to the partial pressures should sum to a total temperature as well. Ergo, CO2 at a negligible partial pressure would barely contribute any heat at all (a few hundredths C).
Gordon,
You misunderstand the Ideal Gas Equation too.
It is not the recipe for a perpetuum mobile that will keep delivering heat by virtue of its pressure.
Once you have compressed a gas it will go back to thermal equilibrium with its surroundings.
Gordon Robertson wrote:
“On the other hand, NOAA has admitted fudging….”
You are a filthy, rotten liar.
DA…”You are a filthy, rotten liar”.
Now, that’s libel. Good thing I don’t take myself seriously and have a good sense of humour.
NOAA freely admits going back in the historical record and changing temperatures to what they think better reflect the record. I just posted a link for you from climateaudit with the proof. In the Climategate emails, Phil Jones, of Had-crut admitted to doing the same thing. Why else would he be so terrified of Steve McIntyre getting his data and revealing the extent of his fudging?
I have also posted a link where NOAA admit to slashing over 75% of the data they receive. They have admitted to recreating the missing data in a climate model by interpolating and homogenizing the 25% of real data.
You call it what you want, I call it fudging, when I am being nice.
David Appell…”Pierrehumberts claim: In a single second, Earth absorbs 1.22e17 joules of energy from the Sun. Distributed uniformly over the mass of the planet, the absorbed energy would raise Earths temperature to nearly 800 000 K aftar a billion years, if Earth had no way of getting rid of it.”
Based on anything I have read from Pierrehumbert I have questioned whether he has the slightest idea what he is talking about with regard to climate science. The paper to which you link is full of assumptions and errors.
****placeholder for URL to be supplied later*********
In the first place, he poses a stupid thought experiment in which Earth is an absorber of solar energy which cannot rid itself of heat. That has to stand as one of the most stupid comments I have ever read. Where in the universe does that apply? Nowhere, so why bring it up, and why do you trot the idiotic notion out as the good, little recipient of authority you are?
Then he reveals the only way for the planet to rid itself of heat is primarily in the IR range. That means all other atoms/molecules that would radiate outside that range are not allowed to cool via radiation. It further implies that nitrogen and oxygen cannot warm because they cannot cool, either that or they warm and never cool.
In that case, why have N2 and O2 not been utilized in heating systems? You simply heat them up in a room and they either don’t cool or they cool very slowly. However, we know that when the furnace is turned off on a cold winter’s day, the room cools rapidly. You can’t put that down to just conduction through wall surfaces, there must be some other way for the N2/O2 to cool that quickly.
Then he implicates Fourier in his alarmist propaganda when what Fourier actually said was the opposite.
Then he offers the astounding inference that the atmosphere is a gaseous mix of molecules and photons. What utter rubbish!!! There is no such thing as a photon gas other than in a totally theoretical cavity resonator (blackbody), yet here we have a physicist freely mixing sci-fi with reality.
The next few paragraphs feature scientific mesmerism at it’s best. He very loosely equates Planck to Boltzmann and the totally theoretical blackbody reaching the amazing conclusion that “The fourth-power increase of flux with temperature is the main feedback allowing planets or stars to come into equilibrium with their energy source”.
Feedback?????? Where the heck did he get feedback from that assertion? I mean, this guy is blowing out pseudo-science and all the good little alarmists like David Appell are eating it up like Quakers at a Sunday sermon.
As if he hasn’t shot his wad of pseudo-scientific jargon, he carries on: “At planetary energy densities, photons do not significantly interact with each other; their distribution evolves only through interaction with matter. The momentum of atmospheric photons is too small to allow any significant portion of their energy to go directly into translational kinetic energy of the molecules that absorb them. Instead, it goes into changing the internal quantum states of the molecules”.
Duh!!!! Photons are definitions, no one knows if they exist, yet her we have Pierrehumbert telling us how they can and cannot interact physically. Then he lays the nonsense on us that it is their momentum that causes photons to crash into a molecule, but that they lack that momentum therefore the mysterious quantum aspects must take hold.
Bohr was never that mysterious. He claimed the criterion for absorp-tion was that the photon have the correct intensity and frequency to match the requirements of the ELECTRONS in the atoms and molecules.
Why don’t I have any problem understanding Bohr, Clausius, Planck, Feynman, Einstein, and Bohm, yet I cannot recognize even a semblance of physics in Peirrehumbert?
More pseudoscience…” An IR photon absorbed by a molecule knocks the molecule into a higher-energy quantum state…”
More rubbish. Bohr made it clear it is the electron that is moved into a higher quantum level, molecules per se do not have quantum level. It appears our friend Pierrehumbert does not understand the basics of atomic theory.
Then he introduces Kircheoff with his emissivity proportional to absorp-tion. He does not emphasize that Kircheoff did all his work at thermal equilibrium but he does steal a slice of the absorp-tion/emission layer at a surface and try to interpolate such layers throughout a flux field between a hotter and a cooler object.
Absolute pseudo-science!!!!
He is trying to get around the 2nd law using smoke and mirrors and that is the MO of realclimate where he is the resident physics guru.
More scientific conjecture…”An atmospheric greenhouse gas enables a planet to radiate at a temperature lower than the grounds, if there is cold air aloft. It therefore causes the surface temperature in balance with a given amount of absorbed solar radiation to be higher than would be the case if the atmosphere were transparent to IR”.
Earlier he quoted Boltzmann. The S-B equation makes it absolutely clear that the rate of cooling at the surface depends only on surface temperature and the temperature of the air immediately above it. There is no way that GHGs can affect the cooling or warming of the surface.
Now for the final insult to physics….”The foundations of radiative transfer were laid by some of the greatest physicists of the 19th and 20th centuries – Fourier, Tyndall, Arrhenius, Kirchhoff, Ludwig Boltzmann, Max Planck, Albert Einstein, Schwarzschild, Arthur Eddington, Milne, and Subrahmanyan Chandrasekhar plus many more whose names are not well known, even among physicists, but probably deserve to be ”
Has anyone noticed who is missing here?…Clausius, the scientist who wrote the 1st and 2nd laws of thermodynamics and defined entropy. Why do you suppose Clausius has not been mentioned? Is it not obvious, his 2nd law quashes the GHE and AGW?
In conclusion, after reading this exercise in pseudo-science, I think Pierrehumbert is even further off base than I thought he was previously.
now for the tough part, getting the URl fixed so WordPress will accept it.
https://geosci.uchicago.edu/~rtp1/papers/Phys-Today-RT2011.pdf
remove 2 hyphens in Phys-Today-RT2011.pdf
There you go again, taking Clausius and his 2nd Law out of context. Clausius began by analyzing CLOSED SYSTEMS, that is, systems which are reversible. The 2nd Law does not apply when there is an external source of energy, which is fundamental to the climate system in which the Sun is continually flooding the Earth with high energy, short wave light.
I cannot believe that you are (were?) actually an engineer. The first thing an engineer would do is define the system to be analyzed, which you are apparently incapable of accomplishing. Do you ever have an engineering license from Canada? If not, why not?
Gordon wasn’t/isn’t an engineer. He’s an electronics technician. Lots of soldering. Maybe too much inhaling.
DA…”Gordon wasnt/isnt an engineer. Hes an electronics technician. Lots of soldering. Maybe too much inhaling”.
If what you claim is true, which it’s not, it’s even more sad that an electronics technician would know more about physics than the guru at realclimate.
Do you really honestly believe that about yourself?
DA…”Do you really honestly believe that about yourself?”
In this case, yes!!! I would gladly debate Gavin Schmidt or Pierrehumbert on the science if I could do it in front of a neutral panel of scientists who had a good grasp of basic thermodynamics and atomic theory.
There would have to be rules of course, like no hiding behind convoluted math or climate model jargon. I’d want to debate raw, fundamental physics on a subjective basis.
Gavin Schmidt has already avoided a one on one debate with Lindzen. Of course, he would smugly regard me as a pushover and find out quite another situation when it came to discussing real physics in front of real physicists.
swannie…”There you go again, taking Clausius and his 2nd Law out of context. Clausius began by analyzing CLOSED SYSTEMS, that is, systems which are reversible. The 2nd Law does not apply when there is an external source of energy, which is fundamental to the climate system in which the Sun is continually flooding the Earth with high energy, short wave light”.
I am relegating you to idiot status, along with binny. Your ignorance of physics is unprecedented.
In the first place, a closed system in thermodynamics is a system that does not allow matter to leave or enter the system, not thermal energy.
Have you read Clausius on entropy? He defined the term as follows, ‘entropy is the sum of infinitesimal changes of heat in a system at a temperature T’. He went on, ‘if the process is reversible, the entropy is 0, if the process is irreverseible, the entropy is positive’.
In all cases, Clausius was careful to distinguish reversible from irreversible. He did not quality the 2nd law as a law applying only to those systems or to closed systems.
Gordon Robertson says:
“In the first place, a closed system in thermodynamics is a system that does not allow matter to leave or enter the system, not thermal energy.”
Completely, stupidly wrong.
In thermodynamics a close system is one that is “adiabatic” — doesn’t exchange heat with it surroundings.
Gordon Robertson says:
“He did not quality the 2nd law as a law applying only to those systems or to closed systems.”
That’s because it isn’t! The 2nd law applies to everything in the universe.
When Clausius wrote about energy transfer from a cold body increasing the temperature of a warm body, I think he was referring to closed, i.e., reversible systems, such as refrigerators and heat pumps. The climate system results in the low entropy energy from the Sun being converted to high entropy, long wavelength IR energy emitted to space. The chain of processes within the climate system do not violate 2nd Law.
I appreciate your linking to Pierrehumbert’s 2011 paper, which I had not seen. He shows how the basic physics is deeply embedded within several scientific disciplines, which makes your objections appear to be far out of the current scientific understanding. Note also that the paper appeared in a mainstream publication in physics and that if a reader found it to be in error, there would have been a critique. He also presented the paper at an AIP conference.
Infrared Radiation and Planetary Temperature
AIP Conference Proceedings 1401, 232 (2011);
https://doi.org/10.1063/1.3653855
Raymond T. Pierrehumbert
But, we knew you’ve been having trouble with engineering reality, as you clearly don’t understand the difference between conduction and convection.
http://www.drroyspencer.com/2018/02/a-1d-model-of-global-temperature-changes-1880-2017-low-climate-sensitivity-and-more/#comment-289312
swannie…”When Clausius wrote about energy transfer from a cold body increasing the temperature of a warm body, I think he was referring to closed, i.e., reversible systems, such as refrigerators and heat pumps”.
Of course, but he made it clear that at the same time heat was being transferred from a cooler body to a warmer body the process had to be compensated. The transfer cannot happen on its own. Therefore, something external has to be supplied to make it happen.
In a refrig.era.tor, a complex system of external power, a compressor, a refrig.erant, a condenser, and an evaporator must be employed. A refrig.erant gas at low pressure/low temperature is compressed to a high pressure/high temperature liquid. The latter then passes through a condenser, a radiator-like device exposed to the atmosphere. In the condenser, the HP gas releases heat to the atmosphere.
After the condenser the HP liquid is atomized before entering an evapourator, another radiator-like device, where it expands back to a low pressure/low temperature gas. As it loses pressure it absorbs heat, cooling a location where it is installed.
The evapourator extracts heat from a cooler region and transfers it to a hotter atmosphere but that process cannot take place on its own.
“I appreciate your linking to Pierrehumberts 2011 paper, which I had not seen. He shows how the basic physics is deeply embedded within several scientific disciplines, which makes your objections appear to be far out of the current scientific understanding”.
David Appell posted it, I copied his link for my post. Once again, you are appealing to authority, suggesting an academic must be right and a layman in climate science wrong. I have not merely claimed Pierrehumbert is wrong, I have included reasons why I think he is wrong and those reasons can be corroborated. In fact, I cited Bohr and Boltzmann.
If both of them are wrong and Pierrehumbert is right, that’s another matter. However, I am confident his study of mathematics with its related highly-theoretical physics has mislead him into wrong-headed thinking with regard to thermodynamics and radiative heat transfer.
I am not exactly a layman with atomic theory. The discipline I have followed my entire career in electronics relies on it strongly, especially in semiconductor theory. In fact the electron is the basis of electronics and electrical theory. I find it extremely odd that Peirrehumbert would make reference to quantum level in molecules when they do not exist as such.
A lot of posters in this blog have objected to me taking quantum theory down to electrons but my sources such as Bohr are totally sound. If Pierrehumbert wants to generalize about molecules he stands the chance of being regarded as lacking in his understanding of atomic structure, hence what is really going on with regard to radiation.
As it stands, he seems to think it’s perfectly normal for heat to be transferred both ways in a process, completely ignoring the conundrum presented by cooler GHGs transferring heat to a warmer surface.
Peirrehumbert and realclimate have been in the forefront of spreading that kind of incorrect, alarmist science.
GR, I must point out that your description of the action of a refrigerator (or A/S unit) is incorrect. In the closed circulation loop, the compressor takes working fluid from a reservoir, compresses it to a high pressure and temperature which then flows thru a condenser where it is cooled and liquefied by releasing heat to the surroundings. The cooler fluid is pushed thru a valve or small orifice, after which the fluid expands to a lower pressure, which cools the fluid. The cold gas then passes thru the evaporator, where it is warmed by removing heat from the local area. The output of the evaporator is connected to the original reservoir, so it then enters the compressor at a low pressure, allowing the cycle to continue.
That sort of system is a closed system in which mechanical energy is input, causing the apparent transfer of “heat” from a source at lower temperature to to a sink at higher temperature. The climate system and the radiation heat transfer involved has nothing to do with that type of device. In the climate system, the “source” is the solar energy and the “sink” is deep space at 2.7K. It’s all downhill from the Sun to Space.
As for my “appeal to authority”, one might call it that, but my point was that his explanation has not been questioned by others who are considered experts in physics. You, of course, give no argument against the data upon which his presentation is based. It’s the data, not the man (or is it men).
swannie…”The climate system and the radiation heat transfer involved has nothing to do with that type of device”.
Exactly!!! There is no such compensation available in the atmosphere therefore HEAT CAN NEVER BE TRANSFERRED FROM A COOLER REGION OF THE ATMOSPHERE TO A WARMER SURFACE.
Thanks for confirming that for me, in your own words.
BTW…Stefan-Boltzmann confirms it for radiation. The crux of S-B is in the temperature differential and it can only be one way. If the atmosphere is cooler, energy transfer is from the surface to the atmosphere, not from atmosphere to surface.
GR shouts again
I disagree and I demonstrated a transfer of energy from a colder to a warmer body with my Green Plate demo. Of course, you have refused to consider the data I provided as evidence and you still refuse to consider the data in Pierrehumberts paper either. In the Green Plate demo, the energy does in fact flow from the higher temperature (low entropy)level of the electric element to the cooler (high entropy) surroundings of the building. It’s just that along the way, adding the cookie sheet will change the system description in a way which causes the plate on the element to warm to a higher temperature than that without the cookie sheet.
Here it is again. Please take the time to study the data.
https://app.box.com/s/al1duvn2aq3blkyqecivh5y3yyvlno4i
E. Swanson is, of course, right. Gordon is, as always, wrong.
Gordon refuses to learn the 2nd law.
Gordon Robertson
You get your terms confused. You are correct on some points and totally incorrect on others and you are not willing to correct your flaws. Sad.
This is your correct statement: “HEAT CAN NEVER BE TRANSFERRED FROM A COOLER REGION OF THE ATMOSPHERE TO A WARMER SURFACE.”
That will not change and I most will not disagree with you no that point.
But then you have to state a false point with the correct one.
YOU: “If the atmosphere is cooler, energy transfer is from the surface to the atmosphere, not from atmosphere to surface.”
Your own made up garbage that you need to post. Why I do not know.
No, energy will transfer from both all the time. Energy flow is always taking place as long as both bodies have temperature. You are just totally full of it with this garbage made up science. Can’t you stop making up your crap and stick to real science? Forever have to make up stuff. Like you can’t stop doing it.
Gordon Robertson says:
“In the first place, he poses a stupid thought experiment in which Earth is an absorber of solar energy which cannot rid itself of heat.”
It’s a thought experiment, made for heuristic purposes, to illustrate a point.
I’m not surprised it went — WHOOSH! — right over your head, and g*’s. Neither of you has a clue what RP is trying to do.
The thought that you, Gordon, a circuit analyst, can critique a scientist like Pierrehumbert is ridiculous and bizarre. You are the best living example of the Dunning-Kruger effect.
DA…”The thought that you, Gordon, a circuit analyst, can critique a scientist like Pierrehumbert is ridiculous and bizarre”.
What’s even more remarkable is you swallowing everything he says. You don’t have the ability to see the multiple errors in his analysis which makes you a dupe.
realclimate is unique with its interpretation of physics and it’s all wrong. Gavin Schmidt, a mathematician, tried to produce an equation for positive feedback that was completely wrong. He had to be corrected by one of my fellow engineers, Jeffrey Glassman.
You live with the delusion that a Ph.D in a field makes someone automatically correct.
Here’s his CV:
He has a degree in aeronautics and astrophysics with a minor degree in mathematics and theoretical physics, much like Gavin Schmidt.
Neither of them have obviously learned a lot about real physics, as we apply it in engineering. It’s scary that a mathematician who cannot write out the correct formula for positive feedback, but incorrectly guesses at it, could be the head of NASA GISS.
I didn’t swallow anything. I did my own calculation, and found that his claim was true.
That’s the opposite of what you do.
—
An circuit analyst doesn’t get to insult professionals of that class. Well, you can try, but even you know an intelligent critique of them is way beyond your abilities.
Gordon Robertson says:
“You dont have the ability to see the multiple errors in his analysis which makes you a dupe.”
What errors? (In your expert opinion….)
DA…”What errors? (In your expert opinion.)”
The multiple errors I listed above. Plain errors based on a faulty interpretation of radiation and the atmopshere.
Again: do you really and truly think you know more about fundamental physicists than professional scientists with PhDs from vaunted universities?
David,
Appeal to authority much?
But, if it’s Pierrehumbug you’re talking about, yes.
Do you think he’s smarter than Schmidt or Mann? Does he believe he can boil water by surrounding it with ice?
Bumbling dimwit, if he does!
Cheers.
DA…”Im not surprised it went WHOOSH! right over your head, and g*s. Neither of you has a clue what RP is trying to do”.
That’s exactly the point that evades you. Why is someone talking about such a hypothetical situation? And how is he going to prove it?
It’s akin to sitting an absorbent object under a heat lamp. How do you stifle it’s ability to radiate while allowing it to absorb energy from the lamp. When the object reaches thermal equilibrium it WILL radiate. What is Pierrehumbert blabbering about?
His entire article is little more than blabbering his peculiar philosophy of science.
Gordon, you have yet to answer this simple request from DA:
“Give me the mathematical relationship between a photons properties and the temperature of its emitter.”
profp…Gordon, you have yet to answer this simple request from DA:
Give me the mathematical relationship between a photons properties and the temperature of its emitter.”
DA is always asking dumb question but I must have missed this one.
A photon (singular) has no properties other than frequency. No one even knows if a photon exists, it is a definition of a particle of EM with momentum but no mass.
I still think in waves and wavefronts. An EM wave is an electric field with a perpendicular magnetic field. It is defined by it’s frequency and the frequency is determined by the temperature of the body that emitted the EM.
If you think of EM as a wavefront then the wavelength is the distance between wave peaks. The frequency is the inverse of the wavelength.
I don’t buy the argument about photons being emitted as singular, discrete packages. Obviously there are bazillions of electrons radiation EM at the same time and their radiated fields add up to a wave front.
When an electron orbiting an atom emits EM it does so by giving up heat as kinetic energy as it drops from a higher energy level to a lower energy level. The emitted EM is defined as E = hf, where E is the difference in eV between the energy levels through which the electron transitioned. The ‘f’ is the frequency of the electron at that particular time.
The frequency of the electron is determined solely by the temperature of the atom, which is its kinetic energy. It’s obvious on the EM spectrum that frequency increases with temperature. If you heat an iron bar with an acetylene torch it gradually changes colour with temperature, the colour representing visible EM.
“I dont buy the argument about photons being emitted as singular, discrete packages”
Then how do you understand the many devices that rely on this fact to function? LEDs, lasers, solar cells, ccds, etc
Gordon Robertson says:
“The frequency of the electron is determined solely by the temperature of the atom, which is its kinetic energy.”
Give us the formula that relates the two: f(T) or f(kinetic energy)
“No one even knows if a photon exists, it is a definition of a particle of EM with momentum but no mass.”
Yes, we do — Einstein was the first to demonstrate this. He won a Nobel Prize for doing so.
Gordon Robertson wrote:
When an electron orbiting an atom emits EM it does so by giving up heat as kinetic energy as it drops from a higher energy level to a lower energy level.
Sorry, no.
Electrons don’t actually orbit the nucleus. That’s the Bohr Model and one of its great deficiencies. I’m surprised a great expert in atomic physics wouldn’t know this.
Atomic electrons exist as wave functions — whose (complex) square gives the probability of the electron being in a certain place or having a certain momentum at a certain time.
Gordon, what is your evidence that 1934 was the warmest year in the US records?
DA…”Gordon, what is your evidence that 1934 was the warmest year in the US records?”
It’s all here in NOAA’s fudging of the historical record. It began with James Hansen at GISS and now NOAA has taken up the cause.
https://climateaudit.org/2007/02/15/ushcn-versions/
Big Brother (aka NOAA) has deemed that certain recorded temperatures in the past could not possibly be correct, therefore they have taken it upon themselves to amend them.
I don’t understand how you could be so negligent/biased as a science writer and sit back while this chicanery goes on. A real science writer with integrity would not go along with this blatant scientific misconduct.
Solder fumes obviously lead to paranoia, delusions of grandeur and a tendency to repetitiveness.
profp…”Solder fumes obviously lead to paranoia, delusions of grandeur and a tendency to repetitiveness”.
Why do you feel good about butt-kissing to cheaters like NOAA? They have bypassed any semblance of a scientific method by admitting to slashing real data by over 75% then reconstructing the slashed data in a climate model using less than 25% of the data.
They have blatantly lowered the confidence levels in recent years to promote them to the hottest year, dropping as low as 48%. They have admitted to going back in the temperature record and arbitrarily changing temperatures they deemed to be wrong.
Given that evidence, and a direct admission by NOAA that they commit such chicanery, why do you so zealously defend them? What is it about authority that has blinded you to this scientific misconduct?
More repetition. Sad.
profp…”More repetition. Sad”.
More denial, much sadder still.
Gordon has never offered evidence for his claim, and barry has proven him wrong time and time again.
But Gordon keeps lying anyway.
The reality is, one cannot both deny AGW and be an honest person at the same time.
David Appell says earlier:
“Completely, stupidly wrong.
In thermodynamics a close system is one that is adiabatic doesnt exchange heat with it surroundings.”
DA, how stupid can one get when you criticize Gordon for getting it right? Refer to the net:
In thermodynamics, an adiabatic process is one that occurs without transfer of heat or matter between a thermodynamic system and its surroundings. In an adiabatic process, energy is transferred to its surroundings only as work.
The walls of a closed system allow transfer of energy as heat and as work, but not of matter, between it and its surroundings
All of the systems on Earth are classified as open systems. However, the Earth system as a whole is considered a closed system because there is a limit to how much matter is exchanged.
That together with the Pierre-humbug 8000,000K earth again proves DA’s incompetence in this field. This DA wanna be physicist just redefines established physics to suit his warmista predilection.
Clausius need not have developed the 2LOT if he believed the 1LOT sufficed; I guess he wasted his time.
Silly idea that a sun at 6000K could increase the T beyond that attenuated T. But then I believe Clausius; you believe Pierre baby. Clausius you have been surpassed; Pierre and David have rolled you. Out with 2LOT. Entropy consideration is obviously crap ala Apple-Pierre or rather Apple-Pear. We have found a new way to heat the sun; it’s called back radiation after a few billion years.
Now he squirms and says its heuristic in nature. Heuristics is supposed to find ready solutions not create BS impossible contradictions.
Mirriam-W: Heuristic: involving or serving as an aid to learning, discovery, or problem-solving by experimental and especially trial-and-error methods
But do try and conduct an actual experiment. Start with a piece of iron or whatever at a T you wish say 100C. Insulate it in whatever manner you want spacecraft technology. Now let the sun shine in! Tell us the T it reaches! Do it in space and keep the sun on it 24/7/365. Keep going back as often as you want. Stay there if you wish; that way you won’t contaminate this site with your wonky physics ideas.
TonyM
“Pierrehumbug’s” premise was a situation where the Earth could not rid itself of heat.
If a piece of iron was constantly heated by the sun, but was unable to rid itself of that heat, what would cause the piece of iron to stop getting hotter?
snape…”If a piece of iron was constantly heated by the sun, but was unable to rid itself of that heat, what would cause the piece of iron to stop getting hotter?”
How would the Sun radiate if that were the case?
With regard to the iron, if it could not dissipate the heat it would melt. It would fall apart into its constituent atoms of iron, the atoms would stop vibrating so hard, and the heating would end. Of course, given that premise, the entire universe would melt.
Gordon
The iron would obviously melt, but why would the constituent atoms stop “vibrating so hard”, and what would prevent them from continuing to absorb solar radiation?
Also, the premise was directed at a specific piece of iron, not all iron and not the whole universe.
snape…”The iron would obviously melt, but why would the constituent atoms stop vibrating so hard, and what would prevent them from continuing to absorb solar radiation?”
The reason they vibrate in iron in the first place is because they are bound in a lattice. They are like a spring-mass system with the nucleus being the mass and electrons supplying the springs. They can vibrate in a 3-D space within the iron mass and all the atom are bound to each other by electrons.
If you increase the electron energy enough they will fly off and break the bonds, hence melting occurs.
It’s the same in a molecule like CO2.
O===C===O
The dashes are electrons binding the C to the Os. The system can vibrate along the axis shown or the Os can develop a slight moment of torque tangential to the ==== bonds.
Obviously this molecule, as part of a gas, can absorb energy through collision as well whereas that can’t happen WITHIN an iron mass. Neither can the atoms in iron rotate, unless of course, the iron melts and forms a liquid puddle.
BTW…David Appell will be along shortly to deny all this so please be advised I got all this from the back of a cereal box. My particular cereal supplies weekly seminars on nuclear physics.
Gordon
You think molten iron is unable to absorb solar energy and get hotter?
Yep, pretty sure David Appell will disagree.
Gordon finally admits the existence of molecular quantum states.
Gordon Robertson
You are wrong again. You should really read some Chemistry to find out reality instead of just making up whatever pops into your head.
I would not mind so much if you realized you don’t know what you were talking about and changed and learned.
Here you get it totally wrong:
YOU: “If you increase the electron energy enough they will fly off and break the bonds, hence melting occurs.”
No the electrons do not fly off to produce melting. The energy of ionization (removing an electron) is considerably above melting energy. The bonds energy is still present, only the atoms have enough energy to overcome the bond energy and move about. If you remove the energy source the iron solidifies again.
Here is a link to energy of ionization and melting of iron.
http://www.gordonengland.co.uk/elements/fe.htm
The energy needed to melt iron is 14,900 joules/mole
The energy to ionize the first electron from iron is
759,000 joules/mole
You would need to add 51 times more energy to reach the energy necessary to ionize the first electron from iron. The next electron takes even more energy.
Even the energy to vaporize iron: 351,000 joules/mole is still half the energy it takes to ionize the first electron.
You have a long way to go. It would be really nice it you finally admit you are wrong about your Chemistry knowledge and open your mind to learning. Please do not be another Mike Flynn or g*e*r*a*n. Two posters with zero learning ability but arrogance through the roof. Worst combination possible. If you get like them I will have to quit responding to your posts as well. I hope you are not in that low mental state yet. Show some ability to learn, the first step is knowing when you are totally wrong about something.
The temperature that iron heats to is the temperature of the sun.
The temperature of the sun depends upon the distance from the sun if the sunlight is not magnified. If sunlight is magnified the maximum temperature obtainable is the temperature of sun when nearest to the sun and magnification of sunlight can increase the temperature above the temperature which emits the radiant energy.
Can not
tony m…”Clausius need not have developed the 2LOT if he believed the 1LOT sufficed; I guess he wasted his time”.
There’s an interesting story behind this. Carnot did stellar work on heat engine theory circa the 1820s but he insisted there were no losses in a heat engine. That got the attention of Clausius who thought that did not sound right.
I don’t know if Clausius developed the 1st law on his own but he did contribute the U for internal energy. It makes sense that the rest of it, equating heat and work to internal energy, was his idea but there were other scientists of the time doing similar work, like Thompson.
Unlike the modern atmosphere where scientists on opposing sides of debate get nasty, scientists like Clausius, Thompson et al collaborated for the betterment of science. If one of them came up with a good idea, the rest applauded and tried to further the science.
The point is, Clausius noted that the 1st law could allow perpetual motion in certain cases. Apparently modern climate alarmists are still not aware of that since AGW allows for perpetual motion while re-writing the 2nd law to justify it.
Clausius closed the loophole re perpetual motion and Carnot’s no heat loss by creating the 2nd law. He did not simply think it up, he reasoned it solidly through going through the steps of a heat engine and noting that certain steps could never be reversed regarding heat.
Clausius was nothing short of brilliant but he also had the knack of explaining his work subjectively.
Apparently modern climate alarmists are still not aware of that since AGW allows for perpetual motion while re-writing the 2nd law to justify it.
Wrong. And wrong.
Gordon Robertson says:
Carnot did stellar work on heat engine theory circa the 1820s but he insisted there were no losses in a heat engine.
If Gordon says something, you can be rock sure the opposite is true.
In fact, Carnot is famous for specifying the MAXIMUM EFFICIENCY of a heat engine, and showing it wasn’t 100%:
https://en.wikipedia.org/wiki/Carnot_heat_engine#Carnot's_theorem
Silly idea that a sun at 6000K could increase the T beyond that attenuated T.
Whoosh — that’s the sound of Pierrehumbert’s problem going straight over your head too.
His problem has NOTHING to do with the Sun. He could have written it was a candle, or a supernova, or a laser beam.
Likewise, it has nothing to do with the Sun’s temperature, or the candle’s temperature, etc.
The problem simply said, if the Earth had no way to get rid of the heat it receives, and heat is continuously poured into it, what will be its temperature?
Nor does it have to be the Earth, except to give a specific mass and specific heat to the problem. It could have been any hypothetical closed system.
It’s amazing how so many people here fail to grasp the essence of the problem/argument. Really amazing.
David,
No problem, so no argument.
Pour in as many squillion watts from ice into as much mass as you want.
Pierre Dumbass would calculate millions of degrees, just like Al Gore.
Give me a lever long enough, and a fulcrum on which to put it, and I can heat anything to any temperature, using nothing at all.
It’s a Pierre Dumbass thoughtless experiment.
Cheers.
GR from above:
“Recovery from the LIA supplies a sound scientific explanation for why the atmosphere is warming and to the degree it is warming.”
Hang on. Wait a minute there.
Did I read that correctly?
You mean that the atmosphere is actually warming ?
That the data is correct?
That there has not been fudging?
If so, why all the fuss?
P,
Yes.
Yes – more or less.
No.
Yes/no.
Indeed, why all the fuss?
No GHE. No fuss. Groupthink writ larger.
Cheers.
profp…”You mean that the atmosphere is actually warming ?
That the data is correct?”
Did I ever say it’s not warming, or that there has been no warming since 1850? All I have claimed is that CO2 could not cause such warming.
The UAH data is correct and it is showing little or no ‘TRUE’ warming over nearly 40 years. My argument is with the fudged NOAA data that has retroactively erased the flat trend admitted to by the IPCC between 1998 and 2012.
NOAA developed their current technique specifically to erase the trend and to segregate stations showing cooling from those showing warming.
Tell me why anyone would throw out 75% of their data and remanufacture the discarded data in a climate model.
Come on, prof, surely you are not that naive.
Sorry guys.
Either there has been a warming – in which case the data is correct.
Or not, in which case the data has been fudged.
You cannot have it both ways.
Either the UAH “correct” data shows a warming trend of about +0.12 deg per decade or it does’nt.
You have painted yourselves into a corner (again).
p,
So why do you think any raised temperatures have anything thing to do with CO2?
Cheers.
Whoops. Fat finger again.
Cheers.
profp…”Sorry guys.
Either there has been a warming in which case the data is correct.
Or not, in which case the data has been fudged.
You cannot have it both ways”.
What do you mean by ‘THE’ data. Typical alarmist, THE data is data associated with AGW according to you.
There is good data and bad data. UAH = good data, NOAA = bad data. The irony is that both sets come from NOAA, one via fudged surface data and the other via, so far, unfudged satellite data. I suspect NOAA has found a way to fudge the sat data before giving it to UAH.
NOAA data was not initially bad, it came from thermometers. That was not good enough for NOAA, they discarded 75% of the good data and manufactured bad data from the remaining 25%.
The question arises as to why NOAA is so intent on fudging the data and rewriting the old data. Is it not obvious they are playing a political game?
Shorter Gordon:
good data = gives the results I want.
bad data = gives results I don’t want.
“My argument is with the fudged NOAA data that has retroactively erased the flat trend admitted to by the IPCC between 1998 and 2012.”
Why did’nt they erase the trend over the full record?
See how ridiculous you appear?
profp…”Why didnt they erase the trend over the full record?
See how ridiculous you appear?”
Was the trend flat over the entire record? No…so why would alarmists want to erase it? They only wanted to make the flat trend from 1998 – 2012 disappear, same as Mann et al made the Little Ice Age and Medieval Warm Period disappear to get a straight shaft on their hockey stick.
It’s obvious from your dumb questions that I am not dealing with a real professor, unless you’re a professor of fine arts or economics.
Gordon
You’ve got it backwards, my friend. Mann et al INVENTED the mediaeval warm period to show less warming today by comparison. Truth be known, the hockey stick should be at a 90 degree angle.
Gordon
“They only wanted to make the flat trend from 1998 2012 disappear”
The opposite is the truth. 1998 – 2012 was a period of intense warming. NOAA, NASA, and other “science” institutions were ordered by government to make sure everything looked normal, and to keep the temperature trend as flat as possible.
People began to notice how hot it was getting and grew suspicious. The aforementioned agencies therefore “added back” a little warming to hide their deception.
Who “erased” anything, and how is that even possible.
Mann et al’s reconstruction found only a very small NH MWP. That’s what the data and reconstruction say.
PS: The MWP wasn’t global.
David,
Show us your proof.
More models and reconstructions using Pierre Dumbass hypotheticals?
Cheers.
p,
Why did the Australian BOM declare all official temperatures prior to 1910 unreliable, and banish them?
To get rid of inconvenient data.
Why did the BOM fudge/alter/change data after 1910?
To get rid of inconvenient data.
Who’s looking ridiculous now?
Cheers.
MF
I’m glad someone else sees the truth. You and I know that temperatures in Australia, prior to 1910, were much, much colder than today. The BOM has been fudging data to hide the true extent of global warming.
If the public knew the truth, panic, mayhem, and economic chaos would rule the day.
Gordon Robertson says:
“The UAH data is correct and it is showing little or no TRUE warming over nearly 40 years.”
Another lie.
UAH themselves calculate the trend in the LT data to be +0.12 C/decade. The total warming comes to +0.50 C.
Gordon is a truth indicator — whatever he says, you can be sure that the truth is the opposite.
Morning temperature in Southern Europe.
http://files.tinypic.pl/i/00959/5kalqqhjx787.png
Flood fears rise as wicked storm system tears across southern, central U.S.
https://www.usatoday.com/story/weather/2018/02/25/kentucky-tornadoes-flooding-severe-weather/371063002/
Spring is only 2 days away—unless you live in Europe and the Atlantic thermal mass delays things.
Gordon Robertson it seems to me that snow has not reached Rome, but there is a chance.
“After the flakes the great frost is scary.”
http://www.gazzettadiparma.it/video/tg-parma/496649/dopo-i-fiocchi-fa-paura-il-grande-gelo-e-la-neve-tornera-giovedi-video.html
A bit further south.
http://images.tinypic.pl/i/00959/9t4flk4hw3xo.png
http://corrieredisiena.corr.it/sezioni/584/home
Sorry, snow in Rome.
Neve a Roma: Burian imbianca la Capitale, scuole chiuse e strade imbiancate. Mezzi pubblici ridotti.
http://roma.corriere.it/notizie/cronaca/18_febbraio_26/maltempo-burian-porta-neve-roma-scuole-chiuse-strade-imbiancate-2a126120-1abb-11e8-b6d4-cfc0a9fb6da8.shtml
Frost in the Apennines: – 17th in the Tomarlo pass. Schools closed in many municipalities.
Sorry.
Frost in the Apennines: 17 C in the Tomarlo pass. Schools closed in many municipalities.
Cannot deny that winter temperatures above 80 degrees north latitude has been more and more not normal, this is a data prove, I have said not to come out of crisis, a crisis feeling there will be a big disaster occur, and should be very fast, this is my personal view
видео про экскурсии в паттайе
[url=https://thailandi.info/pattayya/ekskursii-v-pattaye.html]экскурсии в банкоке и в паттайе [/url]
?
Look at the anomalies of the geopotential height in the stratosphere over the polar circle.
http://www.cpc.ncep.noaa.gov/products/stratosphere/strat-trop/gif_files/time_pres_HGT_ANOM_JFM_NH_2018.png
Until tomorrow, high above Scandinavia will be strengthened.
http://files.tinypic.pl/i/00959/oddvvpw4d6m3.png
Dr Spencer
You dive a possible ENSO forcing into non-radiative and radiate components.
The non-radiative forcing sounds conventional, moving energy from the deep ocean to the surface.
The radiative forcing is more unusual. I am unclear where the energy is coming from.
Is it from an energy imbalance at TOA retaining extra energy by some unspecified mechanism, or have you something more exotic in mind?
The mechanism is anthropogenic greenhouse gases.
David,
Is your stupidity due to lack of intelligence?
Cheers.
How does a low climate sensitivity explain recent ice ages/interglacial transitions, with a <1% change in solar insolation and global surface temp change of 5 – 6 C?
barry,
It doesnt. Climate sensitivity is a nonsense term. Climate is the average of weather. The atmosphere acts chaotically. By definition, minute changes of anything can have completely unpredictable effects, without any external interference.
The weather has always changed. My assumption is that it will continue to do so. All the worrying in the world is unlikely to have any quantifiable effect.
So – why worry? If you think it will get too hot, move somewhere colder.
Cheers.
MF
“The weather has always changed.”
I’m disappointed, Mike. Where did you learn such nonsense? At a university I suppose?
The weather has NOT always changed. Climate was stable as a rock until the 20th century.
Ice ages, warm periods – a bunch of sciency gobbledygook.
C,
Of course you’re right. I look forward to the day when Mann and Schmidt can stop the climate changing.
No more hot, no more cold.
Too easy.
Cheers.
” I look forward to the day when Mann and Schmidt can stop the climate changing.”
I admire your optimism and courage. Sadly, it’s much easier to hide the change than to stop it.
Hard to put a genie back in the bottle.
How did you manage to mistake weather for climate?
Both have always changed. But that talking point doesn’t respond to the question one bit.
Perhaps Dr Spencer, who believes climate sensitivity is a valid concept, will answer instead.
barry,
How did you manage not to know that climate is onlly the average of weather?
Do you have some function to stop the climate changing without affecting the weather?
Dr Spencer probably already knows that climate is the average of weather.
Cheers.
Hey mike, you still have not explained how weather models work so well, even though they incorporate a GHE?
nate…”Hey mike, you still have not explained how weather models work so well, even though they incorporate a GHE?”
They don’t always work well. A meteorologist at one station will often call another meteorologist at another location to confirm what he is seeing on a model.
That’s the way it should be, models are tools to assist forecasts not entities unto themselves. Besides, weather models are programmed with real and current data which can be verified on the fly. That is not the case with climate models.
With a weather model they can offer a forecast and see how close they came. Then they can analyze further to see what may or may not have gone wrong. They are not programmed with gibberish like an inflated warming factor for CO2 or stupidity like positive feedback in an atmosphere that cannot support PF.
GR, weather forecast models certainly include the effects of water vapor on night time cooling, else they could not come close to the actual morning temperatures. Their forecasts into the future would be thrown way off almost immediately, as the next day or two would be wildly incorrect, which they are not. The only gibberish is your erroneous, unproven physics. You can’t even get the difference between atmospheric convection and conduction.
http://www.drroyspencer.com/2018/02/a-1d-model-of-global-temperature-changes-1880-2017-low-climate-sensitivity-and-more/#comment-289312
Gordon,
I think you know how good weather models are, compared to 30-40 y ago. They are amazingly accurate, sometimes out to almost a week in advance.
How is it possible? Obviously they understand the atmospheric physics very well, which must include the GHE, or as Swanson says, they will be wrong by the next morning. And they use massive computing power.
Mike Flynn is of course unwilling to take on this challenge, as he knows he will fail.
Nate,
A 12 year old kid can do better with a ruler and pencil.
You didnt know that, did you?
You must be confused about the difference between weather and climate.
And everything else.
Cheers.
How did you manage not to know that climate is onlly the average of weather?
It is. And it’s not the same as weather. Climate is easier to predict, being more stable.
You can never roll 3.5 with a die. But you can predict very close to that average with a large number of rolls. A single roll is weather; 1 to 6. 3.5 is the climate.
Do you have some function to stop the climate changing without affecting the weather?
A change in climate DOES affect the weather. Eg, Summer and Winter.
Seems in the fight to win a point you tend to make stupid ones. Why not slow down and talk like it doesn’t matter?
And there we have it.
Mikes oft repeated catch phrase “Still No GHE” has nothing to back it up!
And his challenge “Still no GHE, nor testable GHE hypothesis”, having been met, he has no rebuttal. Nada, zilch, an empty vessel..
Sorry Mike, weather models incorporate GHE, weather models work very well. GHE tested every day, and it passes every day.
“You can never roll 3.5 with a die. But you can predict very close to that average with a large number of rolls. A single roll is weather; 1 to 6. 3.5 is the climate.”
Nice way of explaining it. And AGW slightly weights the die.
Barry,
How does a high climate sensitivity explain 100,000 year glaciations etc?
That would be problematic if glaciation periods (and glacial transitions) were flat.
https://wattsupwiththat.files.wordpress.com/2014/09/ice_age_temperature.png
With relatively symmetrical influence from orbital cycles, glaciation periods lasting longer than interglacials suggests that the world responds faster to warming influences than cooling over long time scales.
So perhaps some function that responds (feeds back) to the small orbital forcing arises quickly during warming and subsides more slowly during cooling.
You answered the question with a question. Do you have an answer to the question?
barry,
*So perhaps some function . . . *
You’re absolutely correct. Perhaps it does. A great pity that no climate scientist knows of such a function.
So perhaps you don’t know what you’re talking about?
Cheers.
barry…”So perhaps some function that responds (feeds back) to the small orbital forcing arises quickly during warming and subsides more slowly during cooling”.
You certainly excel with gobbledygook. Feedback as a function in a real atmosphere? Orbital forcings in a real universe?
You are talking climate model mumbo jumbo and applying it to a real time situation. Then again, modelers and their supporters tend to live in a separate universe.
Do you really deny that climate feedbacks exist???
David,
Do you really deny that they don’t?????
Cheers.
Youre absolutely correct. Perhaps it does. A great pity that no climate scientist knows of such a function.
CO2 fits the bill pretty nicely for ice age transitons. Fast to outgas, slow to sink. You should check out the literature on it. And other feedbacks (like albedo changes from changing surface ice cover etc).
How does a low climate sensitivity explain recent ice ages/interglacial transitions, with a <1% change in solar insolation and global surface temp change of 5 6 C?
barry,
Maybe some function is involved.
Cheers.
barry
The amount of solar energy reduction that reaches the Northern Hemisphere during ice age in summer is considerable. This causes ice extent to grow enormously greatly increasing the albedo in the North. I have seen that the amount of dust in Antarctic ice cores goes up drastically during ice ages. This can be explained that with a super high temperature gradient between North and equator the winds get much stronger picking up dust and lowering the energy that reaches the surface considerably like Nuclear Winter (just not as extreme). This can explain why the whole globe gets cooler and not just the North pole. The increase in dust in the air reduces the solar energy from reaching the surface of the Southern Hemisphere and the whole globe cools off.
I did some research in the past on this issue, you might want to look up some of the factors and see for yourself.
This would mean the climate sensitivity to CO2 can still be small and the large changes are the result of increased dustiness which would have a strong cooling effect on Earth’s surface.
norman…”This would mean the climate sensitivity to CO2 can still be small and the large changes are the result of increased dustiness which would have a strong cooling effect on Earths surface”.
That amount of dust would contaminate ice cores and render them useless as proxies for past CO2 concentrations. As the ice compressed at deeper levels the dust would conglomerate into solids.
I have never seen mention of that with Antarctic ice core samples. Do you have a link that addresses such an issue?
Gordon Robertson
I do not think your idea about dust in ice cores is valid.
I am not sure of my original link I was using for research but his one should satisfy you.
https://icecores.org/indepth/2014/spring/getting-dusty-in-the-name-of-science.shtml
Well, that link was hilarious!
They believe they can trace iron molecules in mixed dust from isotopes of other elements mixed in with the same dust? How many things are wrong with this?
Translation: They can get any results they want.
Pure pseudoscience.
It’s fun to watch.
g*e*r*a*n
Stupid moron. I like to avoid your complete stupidity. You are not capable of learning anything and dumber than a box of rocks. Leave me be dunce. Your posts are a waste of time. I quit reading yours like I do the other moron Mike Flynn. Go away and bother the other posters.
Gordon Robertson this would be for you not the dunce g*e*r*a*n.
https://tinyurl.com/yb4td5af
Dunce please quit responding to my posts. I do not want your input. Go away and drink you booze. Your thoughts are not worth a penny.
The newsletter has stopped production.
What a surprise! Did anyone care?
Cheers.
con-man, your rabies vaccine appears to be wearing off.
Maybe go for a double dose next time.
Glad to help.
Con man,
Are you as dumb as David Appell, or not?
The world wonders!
Cheers.
Mike Flynn
I like to ignore you. Your posts are totally vacuous and you possess no useful information. You post the same stupid points hundreds of times and think you are clever or something.
I come here more to engage in useful exchange of valid science information concerning the climate. You and g*e*r*a*n pollute this site with incredible stupidity and horrible physics.
I am posting to you now hoping I do not read your trolling crap anymore. You and g*e*r*a*n are disruptive trolls.
I ignore you most easily. Once in many posts I might read one of your posts hoping that you actually say something reasonable or valuable. I hope, but you never supply even the slightest bit of useful information. Get lost and bother someone else. I do enjoy communicating with you even a little.
Norman,
The amount of solar energy reduction that reaches the Northern Hemisphere during ice age in summer is considerable.
The leading orbital variation for highest to lowest global temp is the 100 k yr eccentricity variation. Of 240 W/m2 insolation on the Earth, the change at high latitudes is 0.45 W/m2. Much less than a percent. The other orbital variations can cause greater insolation changes, but they’re relatively short-lived. The warmest and coldest global temps are set by the long 100 k yr cycle.
A variety of fast and slow feedbacks (negative and positive) moderate/augment the solar forcings. It’s fascinating stuff. Ice sheet and vegetation change (albedo), GHG increase and decrease, changes in the sinks. One of the things that convinced me that GHGs had a significant role was the anti-phased insolation changes (more in NH Summer – less in NH Summer) but in-phase temp change at both hemispheres. Why would Antarctica warm up if it was getting less sunlight? GHG concentration changes were global (also relatively co-phased in the glacial records), so it makes sense that GHGs had enough impact to cause warming in the hemisphere that received less insolation.
Hence my question on how low sensitivity could explain global temps changes between glacial and interglacial periods.
This was one of the first topics I scoured the literature on years ago. I read about 100 papers on orbital forcing and theories of global changes due to them, including feedbacks.
Norm believes: “I come here more to engage in useful exchange of valid science information concerning the climate. ”
No con-man, you come here to pound on your keyboard. Just look at your two previous comments. You have a belief system, and you try to push it. You have no meaningful knowledge of science, yet you pretend you do. You cannot deal with facts or logic.
You failed with the blue/green plate nonsense. You have claimed that a horse is “rotating on its axis”, as it runs an oval race track. You have tried to claim that “cold” can warm “hot”. You have no problem mis-representing the truth.
You have no interest in learning or correcting your false beliefs.
It’s fun to watch.
barry states: “One of the things that convinced me that GHGs had a significant role was the anti-phased insolation changes (more in NH Summer – less in NH Summer) but in-phase temp change at both hemispheres.”
barry, you believe in the GHE. So, EVERYTHING you see is “proof” of what you believe. That is NOT science. The Earth maintains its temperature with numerous natural processes. The fact that insolation varies by about 7% annually, yet the Earth average temperature does not reflect that much change, should tell you the GHE nonsense is invalid.
But, I predict nothing will convince you the GHE is invalid, ever!
It’s fun to watch.
barry
This chart shows a 100 watt/m^2 difference in summer solar insolation at 65 North.
https://upload.wikimedia.org/wikipedia/commons/thumb/9/90/InsolationSummerSolstice65N.png/500px-InsolationSummerSolstice65N.png
From
https://en.wikipedia.org/wiki/Milankovitch_cycles
Norman,
You’d have to pretty stupid to believe that Watts are related to Kelvins or degrees Celsius, wouldn’t you?
How many degrees is 100 Watts? 1000 Watts?
Never underestimate stupidity. When you think people couldn’t possibly get more stupid, they’ll surprise you. You won’t, of course.
Cheers.
Troll Mike Flynn
I am responding to you to see how you respond back. I think it is interesting to analyze and understand the behavior of different trolls and their tactics. It will be useful information as I continue to use the Internet and your type is everywhere on the NET.
YOU: “Youd have to pretty stupid to believe that Watts are related to Kelvins or degrees Celsius, wouldnt you?”
NO you would have to be braindead dumb to believe there was not any type of relationship.
Temperature is the average kinetic energy of molecules in an object. Kinetic energy is in joules. Watts are joules/second of energy flowing into and object. So yes Watts and temperature would have a direct correlation depending upon other variables and factors.
barry says:
“How does a low climate sensitivity explain recent ice ages/interglacial transitions, with a <1% change in solar insolation and global surface temp change of 5 6 C?"
Where did you find the <1% number?
CO2 did augment the warming from the last interglacial, but AFAIK the warming came from Milankovitch factors.
Various places. This refers to the insolation change from the 100 k yr cycle – eccentricity. This, the longest Milankovitch cycle, is the pace maker for the highest and lowest global temps in ice aghes/interglacials, and is accompanied by a 0.45 W/m2 change in insolation out of 240 W/m2 total. Eg, less than 1%.
The other orbital variations are less than half the peridicity of eccentricity changes, and can have much larger forcings at relevant latitudes (clearly seen in the ice core temp reconstructions – and the GHG reconstructions), but the changes are relatively short-lived. The highest and lowest global temps (and GHGs) of the interglacial/ice ages is set by eccentricity.
https://tinyurl.com/yav6fecv
That’s only a blog post. Too lazy to re-search the papers I read it in years ago.
This article presents a difficult explanation of the low sensitivity of global warming to CO2 levels. It’s a type of correlation.
An easier and more definitive explanation is to examine fundamental gas properties, Greenhouse Gases in particular.
The AGW conjecture can be shown easily to be not true with simple logic.
It goes like this.
Anthopogenic Global Warming (AGW) proponents proclaim that because carbon dioxide, methane, etc can absorb infra-red (IR), that only such gases absorb heat; they call these – even define incorrectly – the “Greenhouse Gases”. The majority (99.9%) of atmospheric gases nitrogen, oxygen and argon do not absorb IR. Somehow, absurdly, AGWers then infer these majority gases are unable to become warmer and contribute to Earth’s warming (by capturing Earth’s radiating heat) – that they cannot warm!! I’m sure that you’ve noticed that all the air about you is the at same temperature! Talk about the Emperor’s new clothes!
All the gases in the air must have absorbed heat in some manner. They do; like all substances, all gases absorb heat by conduction and/or convection, and some by IR as well … otherwise they could never get heated! But that is what is implied by AGW – but never stated outright as it would reveal it is a daft theory.
Therefore, all gases are Greenhouse Gases.
And so, the amount of heat absorbed by air is more or less in proportion to the amount of each molecular species in the air. At about 0.04%, carbon dioxide is a very minor contributor to global warmth, and its effect via level changes on climate are even less – immeasurably small. Methane is an even tinier percentage and therefore, so is its effect.
I’m not saying climate changes do not occur; they do – naturally, but with no association to IR gases. The well established ice-core data obtained at eg Vostok in Antactica, suggest Global Temperatures may rise a further 1°C naturally – regardless of carbon dioxide levels (eg Chapter 1, fig 1). The AGWers don’t mention this either when they say their models “predict” confidently that Global Temperatures will rise. Further, Vostok suggests that within centuries, Global Temperatures will then plummet by some 10°C in just a few thousand years, ending the current stable-temperature Holocene Epoch in which human civilisation flourished. That will be THE challenge to civilisation.
One more crackpot.
So funny.
Aha. One more face of the legendary Delta Charlie, huh :-))
La P,
Do you envy the intelligence of your nom-de-plume?
I dont blame you at all.
Cheers.
And it’s not like we have a desperate shortage. More than enough to go around.
Yes indeed – gases heat up without IR! The boiling point of CO2 for example is -78.5C.
You’re missing the point.
No David, I’m not missing the point at all.
Peter Carson is saying that gases warm up without IR. Of course they do – these warm gases are all part of the atmospheric air circulation. They form thermals, which typically rise at 1-3 metres per second.That includes CO2, along with the other gases such as nitrogen and oxygen. They rise to about 1OO to 2OO metres at night, and grow to 5OO to 2OOO metres during the day.
As an aside, CO2 is routinely pumped into cell cultures in incubators that biologists use – the CO2 will of course warm in the dark incubator without any IR light present.
I find it amazing that kinetic studies seem to be missing from so much of what gets discussed. How long does a CO2 molecule retain extra energy for? If it’s an infinitesimally tiny fraction of a second, then it seems to me that heat will be dissipated very quickly indeed, and that the effect of CO2 will be negligible. Factor in water, transverse air currents, and of course it gets complicated. I find the way that CO2 is discussed very limiting – it doesn’t just sit there in a fixed position, and it certainly can’t be thought of as a ‘blanket’.
Peter Carson says:
February 26, 2018 at 11:29 PM
1. ‘Anthopogenic Global Warming (AGW) proponents proclaim that because carbon dioxide, methane, etc can absorb infra-red (IR), that only such gases absorb heat…’
*
Even an alarmist like David Appell wouldn’t proclaim such a nonsense in Roy Spencer’s threads.
Above all that has nothing to do with AGW; the effect of gases like H2O and CO2 probably exists since they stay around in the atmosphere, quite a lot of time before mankind appeared, I guess.
What is true is that 99.9 % of the atmosphere (78 % N2, 21 % O2, 0.9 % Ar) absorb only tiniest amounts of solar and terrestrial radiation:
– N2 and Ar are completely transparent to them;
– solely O2 (luckily) absorbs part of the short wave solar radiation in the UV frequency range.
That’s all:
http://4gp.me/bbtc/1519741745164.jpg
Please compare these absor-ption lines (despite a scaling by atmospheric abundance of weak intensity, in the 10^-5 range) with quite a few more lines by H2O and CO2 (of far higher intensity, in the 10^-2 range):
http://4gp.me/bbtc/1519742180815.jpg
Methane in the actual concentration indeed might be inoffensive:
http://4gp.me/bbtc/1519752930185.jpg
But its amazing set of absorp-tion lines should not be underestimated:
– is absorbs both solar and terrestrial radiation;
– its terrestrial absorp-tion lines are all located in the atmospheric window.
Nobody< needs to be an alarmist when just bookmarking such things for later.
2. 'Therefore, all gases are Greenhouse Gases.'
*
No.
Nevertheless you are right: terrestrial IR radiation is only one of the two possibilities for Earth to evacuate heat caused by solar radiation reaching its surface.
But conduction certainly is not the other one: air is one of the worst conduction media, what is the reason for it to be a good insulator instead.
The second possibility indeed is convection (together with poleward advection).
But… how is that initiated, Mr Carson? Any fruitful idea?
binny…”What is true is that 99.9 % of the atmosphere (78 % N2, 21 % O2, 0.9 % Ar) absorb only tiniest amounts of solar and terrestrial radiation…”
So what??? The 99% of atmospheric gases represented by N2/O2 get their heat through conduction and convection.
Radiation is a minor player but it suits climate model differential equations and modelers have amplified the importance of radiation.
Wood, circa 1909, an expert on IR radiation, claimed IR from the surface would be ineffective more than a few feet above the surface due to the inverse square law.
When contractors insulate homes by putting insulation in walls and ceilings they are cutting down heat loss via conduction. Most don’t care about radiative losses because they are minimal. Radiation goes straight through insulation and walls and straight through clothing. Homes and bodies simply don’t cool significantly via radiation.
Wood also explained the GHE quite well. He claimed that once gases like N2/O2 scavenge heat from the surface via conduction, they are poor radiators. They retain the heat for long periods of time.
Of course, as N2/O2 rises due to the buoyancy produced by heating, they rise. As the air density decreases with altitude, the gases expand and cool naturally.
He claimed that once gases like N2/O2 scavenge heat from the surface via conduction, they are poor radiators. They retain the heat for long periods of time.
How does the surface get warmer?
What is a “long period of time?” How long?
David,
How stupid are you?
How did this happen? How long is a piece of string?
Have you any more dumb questions?
Cheers.
See how you refuse to address scientific questions.
(Now let’s see you go pout and whinge.)
DA…”How does the surface get warmer?
What is a long period of time? How long?”
Is this a trick question? Solar radiation, how else?
Long enough to create the warming you alarmists call a GHE.
binny…”But conduction certainly is not the other one: air is one of the worst conduction media, what is the reason for it to be a good insulator instead”.
We are talking at the boundaries of the air mass above the surface. The individual molecules contacting the surface experience a rise in kinetic energy if the surface is warmer. The molecules in contact with the surface transfer the heat to those above by collision then the entire heated air mass rises via convection. The warmed air is replace by cooler air from above and the cycle repeats.
That’s how a real greenhouse warms. Solar radiation heats the soil and the soil heats the N2/O2 in the air. That heated air rises but it is trapped by the glass. The cycle repeats and gradually the air temp in the GH rises.
That heating mechanism is not available in the atmosphere. As Joe Postma put it, we build greenhouses to do what the atmosphere cannot do.
Why is the surface getting warmer?
Wood is ancient. So old as to be irrelevant. (He was also wrong.)
Try reading some modern work for once. Do you need suggestions?
“Old” science beats new pseudoscience, every time.
David,
Wood was smarter than you. Almost anybody over the age of 12 is probably smarter than you.
Try reading less kindergarten fiction. You can probably graduate to juvenile standard, if you read slowly.
Cheers.
Maybe Wood _was_ smarter than me. Maybe not. But I am certainly more knowledgeable than he, given the benefit of 110 years of advancements in physics and climate science, that I have studied and understood.
David,
Your studies have been wasted, or you were too stupid to understand.
Study fact, not fictitious, and you may actually learn something.
Pierredumdum has written some entertaining fiction. You certainly appear stupid or gullible enough to have been sucked in.
Cheers.
DA…”Wood is ancient. So old as to be irrelevant”.
Like Isaac Newton, Einstein, Faraday, Boltzmann, Planck, Arrhenius, and all the thousands of scientists who preceded him.
DA…”Maybe Wood _was_ smarter than me. Maybe not. But I am certainly more knowledgeable than he, given the benefit of 110 years of advancements in physics and climate science”
Yeah…like Neils Bohr would consult you for your expertise on IR. I wouldn’t consult you for advice on anything.
La P,
Do you have to try hard to be stupid and ignorant, or does it just come naturally?
Were you dropped on your head as a child? How many times?
Cheers.
binny and your idiot friend….could you provide a scientific rebuttal to peter Carson rather than your typical ad homs and sneers?
No!!! I did not think so. You know what he is claiming is correct.
All the gases in the air must have absorbed heat in some manner.
By what mechanism do N2 and O2 absorb the IR given off by the Earth?
David,
And you claim to have a PhD! In your case, it must have meant Piled Higher and Deeper.
Are you sure nobody hit you with a stupid stick, or dropped you on your head as a child?
Cheers.
By what mechanism do N2 and O2 absorb the IR given off by the Earth?
David,
Are you so stupid you don’t know? Really?
Did you sleep through all your lectures on your par way to your PhD? Or was Pierredumdum your lecturer?
Learn some physics.
Cheers.
Whoops. Fat finger again. Apologies.
Cheers.
DA…”By what mechanism do N2 and O2 absorb the IR given off by the Earth?”
They don’t need IR they scavenge it directly from the surface through conduction.
Gordon: Now you need a bit of a refresher.
N2 and O2 DO absorb radiant energy, just not much. Nothing has an emissivity of ZERO.
Mostly, N2 and O2 gain energy from collisions with more energetic molecules. Which, by the way, is also a factor in what we call “conduction” (as is radiant transfer, when in close proximity; or did you have a method for isolating radiant transfer from measurement of “conduction” events?)
And those collisions? When they collide with water vapor and CO2, or with other radiantly-active gases, they are second-hand recipients of the radiant energy previously captured by those molecules.
Chaos is the order of the day. Lots of interactions, of varying sorts, for all heat entering and departing the earth system.
**********
Anybody know what happened to Joe Postma? Seems like he sort of fell off the edge of the earth. Listing on staff of Univ/Calgary has expired, blog ClimateOfSophistry untouched since before Christmas, no lead page stuff at “Principia Scientific”
Awwwwww, he disappeared? Maybe he realized he had it all wrong…
The current temperature in the south of Europe.
http://pics.tinypic.pl/i/00960/nmll0kztdrzx.png
Dr. Roy W. Spencer, in what percentage the temperature of the Arctic is counted to the global average temperature?
To make it simple: let us take the UAH example.
Their Globe average encompasses 66 latitude bands of 2.5 degrees, from 82.5S up to 82.5N (in UAH6.0, the three lowest and the three highest bands are not taken into account).
The Arctic zone is defined at UAH as 60N – 82.5N, and is thus 9 bands high.
By ignoring the latitude weighting (a minor factor), the Arctic temperatures therefore account for about 14 % in the global average in the UAH6.0 time series.
The Arctic zone is defined from the Arctic circle — 66.5622 deg north latitude — northward.
It’s defined variously. That is the most common geographical definition.
As the question was put to Dr Spencer, seems reasonable to choose the latitudes as selected for UAH.
If ren doesn’t want the Arctic defined thus, he/she’s at liberty to say so.
La P,
You are joking, I hope.
Only a stupid person would believe that averaging dissimilar numbers is meaningful. Are you stupid, or just gullible?
Cheers.
The ratio of polar caps surface to total earth surface is ( 1 – cos ( theta ) ) where theta is the colatitude of polar circles about 23. 5 .
This yields 0.083 or 8.3 %
With the convention of theta= 30 instead of 23.5 as in UHA data one gets indeed 13.4 % because lower latitude bands contribution is of course dominant.
Thank you!
If you’re referring to only one polar cap, it is 13.4%. But, if you are talking about BOTH polar caps, it is 26.8%. (Assuming 30° colatitude.)
The surface area above the Arctic circle is 4.1% of the Earth’s total surface area.
= 2*pi*R^2 * [1-sin(66.56 deg)]
where R is the radius of the Earth.
Including the Antarctic, the caps come to 8.3% of the Earth’s surface area.
David,
The Earth is not a sphere. Copying formulae isn’t making you any smarter, is it?
Try learning about reality. It will be a novel experience.
Cheers.
I multiplied by 2!!!
CORRECTED VERSION: If youre referring to only one polar cap, it is 6.7%. But, if you are talking about BOTH polar caps, it is 13.4%. (Assuming 30 colatitude.)
(Thanks, davie.)
It’s close enough for these purposes.
David,
The Earth is not a sphere. You’re really careless, stupid, or both, and that’s close enough for theses purposes.
Cheers.
The surface area above the Arctic circle is 4.1% of the Earths total surface area.
https://en.wikipedia.org/wiki/Arctic_Circle#Geography
MF: And your calculation using a nonspherical Earth gives what?
David,
Don’t be ridiculous . You’re sloppy and stupid. Don’t blame me if you can’t work things out for yourself.
Too hard for you? Worried people will see how dumb the little bully really is?
Cheers.
I didn’t think you had a calculation, just more trolling and more mouthing off. The only thing you bring here.
‘The Earth is not a sphere.’
And one more time, the Flynn genius confuses, diverts and denies.
https://en.wikipedia.org/wiki/Earth_radius#Location-dependent_radii
Earth’s average radius difference is about 21 km i.e. 0.335 %.
W.r.t. the discussion about Arctic’s temperature supply to a global average, it is at best negligible.
Write such nonsense at WUWT, Flynn. There you will experience harsh reactions by people not at all appreciating your daily pollution.
Nice. But trolls never respond to comments like this… because they’re not here for the science.
La P,
The stupid has burnt you.
You can’t see the forest for the trees. David has been sloppy and stupid. He blames me.
You can’t stand somebody finding fault with stupidity. What does this make you?
Cheers.
ren…”Dr. Roy W. Spencer, in what percentage the temperature of the Arctic is counted to the global average temperature?”
That’s a good point, ren. I have wondered the same at times.
If certain spots in the Arctic, which are quite small,and which move around month to month, reveal that spot to be +5C above average, when the temperature is -50C, should that be regarded as global warming?
It’s equally obvious that if the global average is about 1C above ‘normal’ (whatever that may be) when you have spots with +5C above normal it’s obvious there must be spots at nearly -4C below normal (see Antarctica) to arrive at a 1C above average warming.
I don’t like numbers for the sake of numbers. Very misleading and the global average is just a number with no physical significance.
It has recently been revealed that the North Pole rose to nearly 0C, about 40C above normal for that time of year. It was explained as a sudden influx of warmer air from the Greenland area. That’s weather and has nothing to do with global warming or CO2.
Furthermore, why is the Arctic and the Antarctic behaving so dramatically differently? One is warming and one is cooling. Is that the effect of the Arctic Ocean versus the Antarctic ice cap?
When the stratospheric polar vortex is strong, warm air can not reach the pole.
Compare the polar vortex in the north and south.
http://www.cpc.ncep.noaa.gov/products/stratosphere/strat-trop/gif_files/time_pres_UGRD_MEAN_ALL_SH_2017.png
http://www.cpc.ncep.noaa.gov/products/stratosphere/strat-trop/gif_files/time_pres_UGRD_MEAN_ALL_NH_2017.png
Gordon Robertson says:
Furthermore, why is the Arctic and the Antarctic behaving so dramatically differently? One is warming and one is cooling. Is that the effect of the Arctic Ocean versus the Antarctic ice cap?
Antarctic LT is warming — +0.28 C, according to UAH’s data.
[Not allowed to link to UAH’s own data. Brilliant.]
But the Arctic and Antarctic have very different geographies — the first is an ocean surrounded by land, the second is land surrounded by an ocean. In particular, winds matter more in Antarctica, and also the Southern Ocean. Also, much of Antarctica is at a high elevation.
David,
Are you just dumb, or even dumber? Who’s dumber – you or Michael Mann?
Get a haircut and a real job. If you can!
Cheers.
Clearly you can’t address the science. Such as, what do you think Antarctic temperature is? That’s be an honest answer.
David,
Cold. No doubt you can provide a stupid alculation to show it would be 760 000 K if it was.
Just more stupidity.
Cheers.
Gordon Robertson says:
“If certain spots in the Arctic, which are quite small,and which move around month to month, reveal that spot to be +5C above average, when the temperature is -50C, should that be regarded as global warming?”
Roy doesn’t calculate “global warming.”
He models the lower troposphere’s temperature, whatever that is.
David,
You certainly don’t know *whatever that is*, do you?
You just pretend you do. Or do you just love giving your stupid opinion about things you know nothing about? Do you think that makes you look smarter than a box of hair?
Dumb or dumber?
Cheers.
More trolling.
No appropriate response, just more trolling.
David,
Are you really trying hard to set new stupidity standards, or is it just coming naturally?
Cheers.
DA…”Roy doesnt calculate global warming.
He models the lower tropospheres temperature, whatever that is.”
How does he model it using real satellite data from real telemetry?
You see the difference between Roy and the UAH gang and the wannabees is they have REAL data whereas your NOAA surface types and modeler wannabees have fudged data and fictitious data respectively.
Ergo, UAH time series are the only one’s you can trust.
Falling AO means snowfall in the south of Europe.
http://www.cpc.ncep.noaa.gov/products/precip/CWlink/daily_ao_index/ao.obs.gif
The pressure over the Gulf of Bothnia has increased to over 1057 hPa.
http://pics.tinypic.pl/i/00960/txpagcyeco7t.png
Germany is shock-frozen – in the night on Tuesday there was a new cold record. At the Zugspitze incredible 30.5 degrees minues were measured. It will continue frosty in the next few days.
https://www.abendzeitung-muenchen.de/inhalt.deutschland-bibbert-minus-30-5-grad-neuer-kaelterekord-auf-der-zugspitze.2703738e-de6d-4e40-9f3d-d3eb5d80752b.html
ren, Zugspitze is at 2,962 m altitude. -30 C is really unusual, but
Around Berlin, we experienced last night (just in front of february’s end) -10 C for the first time in this third (non)winter in sequence.
A few years ago, we had -10 C as well, but… during the entire february.
That’s weather ren…
Let’s start talking about climate when Greenland’s ice sheet balance reaches say -500 km/year (we are actually around -300).
Where do they “talk” about Greenland “ice sheet balance” in “km/year”?
How is it possible that hilarious pseudoscience megagenius g*e*r*a*n doesn’t understand that something was written but not displayed?
How is that possible? Never heard about UTF8?
How many km³ of ash did Bárðarbunga spit?
But ridiculous cowards like Robertson and Flynn call me idiot and dumb.
Dang Pang, most people would just admit they made a typo.
La P: ice is measured in km3.
You made a typo/mistake. Instead of defending the indefensible, just admit it and move on. Nobody will think less of your…. For God’s sake….
La P,
I can’t recall calling you an idiot and dumb, but maybe I’m wrong. Maybe you’re stupid enough to believe I did. Dumb and stupid, perhaps.
Maybe people call you an idiot and dumb with good reason. I can’t say.
Stupid and sloppy, certainly. That’s self evident.
Cheers.
g*e*r*a*n says:
February 27, 2018 at 9:45 PM
Dang Pang, most people would just admit they made a typo.
David Appell says:
February 27, 2018 at 11:18 PM
You made a typo/mistake. Instead of defending the indefensible, just admit it and move on. Nobody will think less of your. For Gods sake.
*
Well here we see that g*e*r*a*n and Appell are like two faces of the same useless medal.
A pseudoskeptic and an alarmist sharing in lack of understanding even simplest matters :-))
So for you both: no, it wasn’t a typo. It seems that you need some explanation.
The ‘km’ instead of ‘km³’ was due to the fact that
– while typing in a ‘³’ on the keyboard results in that character be made visible by your browser,
– this character is suppressed at Mr Spencer’s web site input and therefore is not displayed back.
To make that understandible even for you two equally hilarious megageniusses, below you see
– a little statement using UTF8 encoding of characters accepted by the site but not displayed back:
Wieviele km³ Asche stößt der Bárðarbunga jährlich?
– and the same statement without encoding:
Wieviele km Asche stt der Brarbunga jhrlich?
Did you get it now?
Mannomann, seid Ihr anstrengend!
La P,
Excuses, excuses. It wasn’t my fault – it was Dr Spencer’s! I could have checked, but I was too stupid!
If you are both stupid and sloppy, you keep blaming everyone else.
If you are even more stupid, you start tallking in German, trying to appear less stupid than you are.
If you didn’t have the brains to figure out the problem before you caused it, you’re stupid. Even more stupid to claim it’s everybody else’s fault.
You’re casting aspersions on the superior intelligence of pangolins.
Cheers.
binny…”But ridiculous cowards like Robertson and Flynn call me idiot and dumb”.
You have complicated matters by claiming to be a woman. We skeptics tend to be respectful to ladies. However, since you changed your nym from Bindidon to la pangolina and claimed binny has been replaced by a female, it makes me wonder what can be trusted about you, including your science.
La P,
Maybe you are just as dumb as anyone else who refuses to believe that climate is just the average of weather.
Greenland? Younger Dryas event? CO2?
Dont be any more stupid than Schmidt or Mann!
Cheers.
Gordon, where is the data showing that 1934 was the warmest year in the US?
DA…”Gordon, where is the data showing that 1934 was the warmest year in the US?”
Go play your dumb games elsewhere. I posted a link for you to climateaudit in which they listed the actual NOAA claim.
In fact, here it is again for anyone interested:
https://climateaudit.org/2007/02/15/ushcn-versions/
There is even a quote from James Hansen, the former director of GISS:
“But even the USHCN V1 data shown here has already been adjusted substantially from contemporary reports. First here is a report from August 1999 on the 1998 annual results. Hansen stated:
The U.S. has warmed during the past century, but the warming hardly exceeds year-to-year variability. Indeed, in the U.S. the warmest decade was the 1930s and the warmest year was 1934”.
And below that quote is a graph showing 1934 half a degree warmer than 1998.
When did Hansen say that?
1999!
https://www.giss.nasa.gov/research/briefs/hansen_07/
Since then a lot of warm years have happened.
You have to present ALL the data, not just what you prefer.
Let’s see you do it.
Gordon, McIntyre’s blog post was from 2007. Since then several years have come in warmer (which you conveniently ignore). Their ranks:
1. 2012
2. 2016
3. 2017
4. 2015
continuing:
5. 2006
7. 1934
data: NOAA USA48 monthly
[link not allowed. Amazing.]
6. 1998
2012 was 1.2 F warmer than 1934.
[Link to data not allowed.]
David,
You’d believe anything, wouldn’t you? How did you get to be so gullible?
Cheers.
What is(are) your problem(s) with that data?
What does your data show?
David,
What are you raving about? Is this more of your pseudo-science?
Oh look – some data! How exciting!
Oh look – a brightly coloured diagram – it must be true! NASA said so!
Both gullible and stupid, are you?
Cheers.
Again, no science.
[Link to data not allowed.]
For crying out loud, use tinyurl like everyone else and stop complaining about what can’t/won’t change.
https://tinyurl.com/
Appell
how many decades will you need to discover
https://tinyurl.com/
Is that really soooo complicated?
Nothing wrong with posting actual links. IF they’re too long, I’ll use tinyurl, but most of my links are to long to highlight and “Paste and go.”
You STILL did not understand.
Intelligent persons here do not use the tiny guy just because it converts long URL in shorter ones, but above all in order to circumvent the delta charlie problem caused years ago by Do-ug Cot-ton.
Why can’t you get that?
I have no idea what problem you’re talking about.
If you don’t like my links, don’t follow them. Otherwise, leave me alone.
La P,
For David, many things are too complicated. Hes too busy being stupid.
Are you claiming to be brighter than David? It wouldnt be hard. Maybe you could get up to the level of a pangolin with considerable effort. Maybe not – Im probably in danger of insulating the intelligence of pangolins.
Cheers.
Flynn: if he can’t insult, he can’t reply.
He shuns science completely. (And it shows.) So much easier to be a cyberbully.
David,
Wrong again. Just as stupid.
Keep whiny and seeking sympathy. Poor David.
Cheers.
DA…”Since then several years have come in warmer (which you conveniently ignore)”.
That’s around the time NOAA began fudging the surface data and using low-ball confidence levels to fudge the rankings.
I’ll stick with 1934 as the warmest year evah in the US…since it was a good half a degree warmer than 1998. NOAA has even fudged 1934 to move it down the list.
David,
Who cares?
Are you trying to be even dumber than Pierredumdum?
Going to try heating your coffee by surrounding it with ice?
Don’t cold things make warmer things hotter?
Stupid, stupid, stupid. Just like you.
Cheers.
More diverting and name calling. Can’t provide any science, though.
David,
How are you going with the ice heater? Thats pretty scientific, isnt it?
Thats what you claim – colder heats hotter. Jus like you heat the Earth to 760000 K, with a 5800 K source.
What an idiot! Just how gullible are you? No answer, David? Cat got your tongue?
Cheers.
J”us like you heat the Earth to 760000 K, with a 5800 K source.”
What if the Earth can’t rid itself of any heat?
David,
What if you got even more stupid than you are now?
Impossible.
Cheers.
See Flynn in action: incapable of science, capable only of name calling.
David,
What if, what if.
What if you were even more stupid than I assumed?
What then?
Cheers.
Gordon Robertson says:
The frequency of the electron is determined solely by the temperature of the atom, which is its kinetic energy.
Give us the formula that relates the two: frequency(T) or frequency(kinetic energy)
David,
Give you nothing, take you nowhere.
Too lazy to learn? Or too stupid?
Cheers.
Piss off, bully. All you do here is troll and insult people. Go find some real people to bully, say down at your local pub or tavern. But youre too frightened to do that, arent you, so you spend your time at home, here, like g*, night after night, in front of your computer, abusing people virtually.
That is sad and pathetic, but more than that youre a grown but little man who has nothing better to do than taunt people over the Internet. All while being afraid to identify yourself. (Arent you brave!) Thats a sad situation. Its incredibly juvenile, and you realize that even if you wont admit it here. This is a science blog, but you two never have any science to offer just name calling, insults, degradations and bullying.
Piss off.
David,
Language, David, language. Don’t you know any better?
Cheers.
davie, you are the biggest “bully” here. You want to dominate the blog with your pseudoscience.
If you can’t take the heat, get out of the kitchen.
So prove my science wrong.
You never can.
David,
You havent got any science , David. You just pretend youve got a box full of it, but its super secret. Is it the sort of science that heats the Earth to 760 000K using Sunlight?
Oh, how we laughed!
Even funnier was your ice powered turkey cooker. Some science.
Dimwit.
Cheers.
Yes, you can’t prove my science wrong.
All you can do is issue insults, all while hiding your identity. That’s very very weak.
David,
Your pseudo science is maginary. Cooling is heating, and weather is the average of climate, no doubt.
Just stupid. No wonder nobody pays you compliments on your brilliance.
Tell me David, how did you measure the climate of California? What sort of picture did you draw?
Was the climate bigger or smaller than 100 years ago? Can you prove it, oh stupid one?
Cheers.
Still yet again, you can’t prove my science wrong, and are left with sputtering and ranting about anything BUT the science.
You are very easy to deal with, Mike.
David,
Only a really stupid person would think that *dealing* with someone had anything to do with science.
Are you sure you’re not really stupid? Or maybe just really gullible, and not terribly bright?
Maybe you should check my calculation, and prove that if the Earth reaches a temperature of 760 000 K after 1 billion years, then after 4 billion years it should be at least 3 000 000 K?
Can you prove my pointless and irrelevant calculation wrong? How stupid would you appear for even trying?
Are you just dumb, or dumber?
Cheers.
Roy, please.
David,
Maybe you should beg harder. Grovel, perhaps?
It’s only stupid until it works. If it doesn’t . . .
It’s just stupid.
Cheers.
David,
You haven’t answered.
Are you too lazy to learn, or too stupid?
What science have you ever offered? Real science, of course – not pseudo science.
Cheers.
Just a small part of the science I’ve offered:
https://www.giss.nasa.gov/research/briefs/schmidt_05/curve_s.gif
David,
Another dumb moment from you. How stupid do you think that makes you look?
As stupid as a mathematician like Gavin Schmidt pretending to be a scientist?
Or are you even stupider?
Cheers.
Mike Flynn: afraid of scientific measurements.
Also, spiders and earthworms.
David,
What is the measurement of your gullibility? Are you just stupid, or completely witless? What percentage?
Do you understand what science is? Do you know the difference between science and pseudo-science?
Of course you dont. Youre too thick.
Cheers.
Yet again — no science, no intelligence, just insults from an anonymous boy.
He makes this so easy….
David,
How many Watts required to raise there temperature of 1 g of water by 1 K?
Youre just stupid! Go on, consult Ray Pierrhumberts silly book. Show us your calculation.
Is it the same one that showed how you could raise the temperature of the Earth to 760 000 K using the Sun?
Must be Appell science. Nothing to do with reality.
Cheers.
I get it — RP’s problem is above you.
But there’s always room to call everyone names, isn’t there?
David,
No problem. Just stupidity trying to appear sciency.
If my bicycle had three wheels, it would be a tricycle!
If Pierredumdum suspended the laws of physics anything could be anything else!
Only the gullible or stupid, or both, fall for such ridiculous nonsense.
Cheers.
DA…”Give us the formula that relates the two: frequency(T) or frequency(kinetic energy)….”
I have already given it to you, E = hf. E means E2 – E1 where E is the orbital energy. That also means the frequency is proportional to the energy, which is proportional to temperature.
E also represents the kinetic energy which is the heat, measured by temperature. If an electron drops from E2 to E1 the atom cools. For it to warm, the electron has to absorb more energy.
If you are asking me to write out the quantum wave equation, forget it. It’s an ordeal in differential equation theory and a lot of guessing through experience. I don’t have that ability at the moment, but the day is still young.
E can also be defined as p^2/2m where p = momentum and m = mass. Remember, heat is defined by this value therefore it represents temperature as well. Since p = mv you can derive the KE from that. That is p^2/2m = (mv)^2/2m = 1/2mv^2 = KE.
The temperature of an electron or atom makes no sense, however, So the Maxwell-Boltzmann distribution is used:
f = e^(−E/kT)
There you have it. E = hf and there’s a T in the denominator of the exponential. Just pull out the T and you’re away.
Flynn
You are the most ridiculous commenter I have ever seen.
And I repeat: you are such a coward to spout your insults here on a site which is not at all moderated.
Go and drop your BS at Anthony Watt’s WUWT site, you miserable coward.
Feigling!
La P,
Not my fault if you’re stupid and gullible, is it?
Follow your advice, anonymous dumdum. Who’s too scared to use their own name? You? Why is that?
Cheers.
Flynn
Your and Robertson’s comments are so ridiculous that I do not believe that any of you two uses his real name here.
Imagine a member of your family, a neighbour, a colleague discovering the hilarious and insulting nonsense you write here all the time!
Rose J. Koelm
Yes — they’re both anonymous, afraid to reveal their identity. GR too.
That is how bullies work. They are cowards at heart.
davie, did you ever supply all your credit card numbers, SSN, bank account, and all passwords and PINs, as requested?
Full disclosure, you know.
A coward afraid to reveal his identity. Because, you know, it’s so much easier to insult people when you can hide behind mommy’s skirt.
davie, you should count the insults you spout, as opposed to the ones you take.
The ol’ pot-kettle thing.
Right on cue, he proves my point.
David,
You would be an expert on cowardice, right?
How about lying and bullying? Or are you better at practical stupidity?
Cheers.
See how the bullies operate. If the can’t think of a response, they, like D Trump, accuse you of doing the same thing they’re doing.
All while avoiding any discussion of the science.
That’s just not in them.
Keep hiding, g*.
It’s the only thing you’re good at.
Little Davie,
Oooooh! See how the bullies operate!
You know all about that, dont you?
Make a few stupid demands – then cry when nobody takes any notice. Hows the 760000 K Earth going? Not scientific enough?
How about some irrelevant percentages of something? Got any more? How about a slew of citations?
How about more examples of how sloppy and stupid you can be without really trying?
Cheers.
Ha. I’m not a coward. Everyone here knows exactly who I am.
http://www.davidappell.com
But you……
David,
I know youre stupid – claiming that the Earth is 760 000 K!
Or maybe you said it would be in an alternative universe? Thats just as stupid.
Carry on.
Cheers.
What’s wrong with my calculation?
Stop your juvenile name calling and start addressing the science.
David,
Your calculation is stupid, just like you. The Earth is not 760 000 K.
How many Watts in a Kelvin? Calculate that, dummy.
Cheers.
What’s wrong with my calculation?
David,
Your calculation is stupid. It has no meaning. The Earth is not 760 000 K. You cannot cook a turkey with the power emitted by ice, no matter how many Watts there are.
Just stupid. As stupid as any pseudo scientific calculation which ignores reality.
Cheers.
Mike Flynn says:
“The Earth is not 760 000 K.”
Is that really what you think this problem means?
That is just plain stupid.
Roy, please block these trolls.
David,
It is not a problem. Stupid people like you might be considered a problem. Making stupid assertions based on suspending the normal laws of physics.
Only a stupid person would expect to get away with that sort of nonsense for any length of time.
Are you stupid?
Cheers.
Rose,
have some sympathy for these two retired crackpots. This is how they amuse themselves in between meals and bingo at their nursing homes.
And then you have the perennial teenager g* who suffers from hysteria.
Don’t forget that young child ren who seems perpetually in awe that he can access weather information.
What a sad bunch of losers.
p,
You havent managed to convince anybody rational that youre not as deluded as the dimwits you admire, have you?
How are you going with the delusion that cold things can heat hotter things? Are you really stupid enough to believe you can heat your coffee with an ice powered stove?
Probably.
Cheers.
Another great illustration of how Flynn has no scientific reply, just lots of name calling and bullying.
This is how an actual adult man spends his time — refusing to discuss science, satisfied to only taunt and call people juvenile names.
David,
If you ever rise to the level of a juvenile, youll be worthy a spot of juvenile name calling.
Not even a small child would accept your stupid assertion that the Earth is 760000 K, or that Pierrehumbug has the faintest idea what he is talking about.
Tell us all about heating water with ice – you know, how cold things make hot things hotter!
Super scientific, Im sure! In your gullible mind, anyway.
Cheers.
Not even a small child would accept your stupid assertion that the Earth is 760000 K, or that Pierrehumbug has the faintest idea what he is talking about.
Why?
David,
A four year old child keeps plaintively asking *Why?*
Or someone with a mental age of a four year old.
Cheers.
Asking “why” is the very essence of science. Doesn’t embarrass me a bit.
But I’m not surprised you don’t understand that, being the bully that you are.
David,
The four year old is obviously more of a scientist than you are. Smarter too.
Cheers.
Another sad insult from MF, who will clearly say anything to shift focus away from the science.
Ha.
La P,
What you believe is of no consequence, is it? You believe complete imaginary nonsense on a regular basis.
Why dont you go to a true believer blog? Realclimate, say. What a joke.
That should suit you – dumb and dumber. You could all sit in a circle, agreeing with each other.
Cheers.
Since you’re so in to a nonspherical Earth, what is the percentage of the Arctic’s area for such a planet?
David dumdum,
Youre so stupid. Get caught being dim witted and sloppy, and blame me.
Ask yourself in the mirror. Maybe youre gullible enough to believe yourself.
Go and ask your stupid questions on a true believer site – if you dare.
Cheers.
More of Flynn’s inability to response with science.
Mike, at what age did you come to understand that you could only bully someone if you were anonymous? Did you Mommy protect you at first? Is she protecting you now, too?
Davie,
Dont blame me because youre so stupid you think that youre being bullied!
Get some backbone, lad. Take some responsibility. Accept that you are not terribly bright.
Maybe you could try bullying someone. Dont be surprised if nobody takes much notice. They might think you are both ineffectual, and stupid.
Cheers
More bullying, from an anonymous coward.
Can’t respond with any science. Finds name calling much more thrilling.
David,
No use playing the victim card. It wont work.
Maybe you could convince people that lies are truth, and that you are only pretending to be stupid. You certainly ask a lot of stupid questions.
Ive told you before, David, youre just not very bright. Thats probably why you cant get a real job. Do you still live at home? You should get out more.
Cheers.
See how cyberbullies respond?
No explanations, no addressing anything specific, just being vague and irrelevant.
They know no science, and can’t call it up when they need it.
All while hiding behind mommy.
David,
Ooooh! Cyberbullies now! How sciency!
Try harassment allegations. Maybe Ill cry – what do you calculate the PDF of that to be?
I keep thinking you couldnt appear any more ridiculous.
You keep proving me wrong.
Oh well, you are an erratic little scamp, arent you? Just full of surprises!
Cheers.
Another example, Roy.
PLease do something, before your blog is useless.
What percentage of the nonspherical Earth’s surface is the Arctic circle?
Come on, you made a big deal of this. Don’t wimp out now.
David,
I pointed out you were stupid and sloppy. Blaming me won’t help.
I’m not going help you overcome your stupidity. You did it, you wear it.
Don’t be so stupid next time.
Cheers.
binny…”Go and drop your BS at Anthony Watts WUWT site, you miserable coward”.
Anthony has no sense of humour. Roy is cool. That’s why UAH is at the top of the heap climate science-wise. John’s cool too.
All this ice and snow seems to be getting a few people down
P…off now there’s an excellent scientific term often takes place shortly after “I told you so” and why blame Dr Spencer
Regards
https://www.aftonbladet.se/nyheter/a/e1Oy4l/beast-from-the-east-skordar-dodsoffer-i-europa
Means what?
David,
Are you admitting that you dont know? Its quite clear to me.
Can you not read?
Cheers.
More bullying, no science.
David,
Play the poor persecuted scientist. What a load of rubbish! Oh dear, oh dear, not getting your own way? Not getting the respect you demand?
Its just because youre stupid. Complaining that people have the temerity to mention it wont make you any smarter.
Keep moaning.
Cheers.
MF: Unless you can elevate your game above juvenile name calling, I can’t spend much more time here.
Please try to address the science.
David,
Promises. Promises.
Go away then. Do you think Ill cry? You are definitely stupid if you do.
Cheers.
Roy, can’t you please do something about these people here who have no interest in discussing the science?
They are here instead only to taunt people, call names, insult everyone. They avoid all discussion of the science. They are polluting your blog and ruining it.
Can’t you please do something, Roy, like block them, like [you_know_who]?
David,
Diddums.
Poor David. Boo hoo.
Cheers.
davie calls for censorship of those that criticize his pseudoscience and bullying. He wants full control of the blog, to push his belief system on others.
And, when he is challenged, he cries “foul”.
It’s fun to watch.
Strong snowfall in the Pyrenees and southern France.
http://images.tinypic.pl/i/00960/5hy5y15jr8zc.png
So what? What does that have to do with climate change?
ren, please leave this blog to those who want to discuss AGW — please go set up your own blog somewhere and blog to your heart’s content….
David,
Why don’t you could set up your own blog? Then you could tell ren what do. Only a stupid person like yourself would be silly enough to issue demands which they couldn’t enforce.
Are you that person?
Cheers.
Just another example of bullying from davie.
Only davie gets to decide what comments are made.
The polar vortex in the lower stratosphere begins to shift towards Siberia.
http://images.tinypic.pl/i/00960/g8ryoycb9hnq.gif
Thanks to the current circulation in the north, Greenland in a short time got a lot of ice.
http://www.dmi.dk/uploads/tx_dmidatastore/webservice/b/m/s/d/e/accumulatedsmb.png
Flynn, stop wasting our time.
If you can’t respond seriously, if you can’t respond to the science but only have name calling and diversions, then don’t respond at all. You just wasting the time of those of us who are here to discuss science.
Same for g*.
David,
Stop being stupid – see, you can’t do it!
Keep giving stupid commands. You look even more ridiculous than you are.
Cheers.
No science. Ignorable.
David,
Maybe you are too stupid to realise you could ignore me?
You just can’t accept that I don’t care, can you?
Keep at it. You’ve tried to ignore me before – and failed dismally. Some stupid people just don’t learn.
How many Watts does it take to raise the temperature of 1 g of water 1 K? Scientific enough for you to refuse to answer?
Cheers.
No science. Ignorable.
David,
So raising temperatures with Watts is only science if Pierredumdum says it?
How stupid is that?
Come on David. Practice what you preach. Ignore me. You can’t? Too stupid foresee the consequences, eh?
Cheers.
La Pangolina, in Berlin minus 10 C, the perceived temperature minus 14 C.
http://images.tinypic.pl/i/00960/lugs9iq14yfc.png
Why does this matter on a blog about climate change?
David,
Are you stupid?
Don’t you know that climate is the average of weather? Do you think climate just magically appears from nowhere?
Cheers.
More trolling.
Flynn is useless and gets no more responses.
Roy, please ban him for abuse.
David,
Don’t you realise you just responded?
If that’s not stupidity, what is it?
You still haven’t told me how many Watts are needed .to raise I g of water 1 K. Too scientific, or not scientific enough?
You’re afraid that you and Pierrehumdrum will look stupid, aren’t you?
Cheers.
David Appell
Yes both g*e*r*a*n and Mike Flynn are trolls. Just take your own advice and ignore them. It becomes quite easy after awhile. One thread may have over 1000 posts about the Moon’s rotation. g*e*r*a*n split into J Halp-less to generate even more posts on this topic. Who knows g*e*r*a*n might actually be a group of trolls posting and taking turns.
If you look at any post from these two it is the SSDD.
One uses the pet phrase “foolish warmist” to try and bait the unsuspecting.
The other uses “hilarious” and “It’s fun to watch”
DNFTT. Banning trolls does not work it just attracts more. They see it as a challenge. A troll’s goal is to generate the most responses. I think they get actual money on who gets the most responses. That is why they like to use derogatory language and insults. This helps generate responses. If you see posts from them, don’t even read them. Waste of time and you might be tempted to respond. Just stick to responding to people who like science and are interested in seeking the Truth. There will always be trolls. Ignore them or if you choose to respond you get the thousands of posts that devolve into “you’re stupid! No you are stupid! No you are more stupid! No you are the stupidest!” This behavior does not do much to advance the goals of science or help in understanding the complexities of Climate Change.
con-man, you’re still yelping uncontrollably. You might want to go to a triple-dose of the rabies vaccine.
Best of luck.
norman…” Banning trolls does not work it just attracts more”.
You don’t have the concept of trolls down yet. You claim we are trolls yet we are defending UAH and its down to Earth science. UAH has the data yet you and you’re fellow alarmist pseudo-scientists are contradicting everything UAH has proclaimed regarded a serious lack of catastrophic warming.
It’s amusing to hear a real troll invade a site with pseudo-science and suggest those defending the site are trolls. Then again, you have your science backwards as well.
John Christy of UAH has stated that skepticism is the hallmark of science, and I agree. Some of us here commenting are skeptical of the GHE but we do not refute that warming has happened or that climates change.
I for one follow the UAH global maps and I acknowledge warming in spots throughout the planet. I also note the blue spots of cooling and note that it tends to cancel much of the extreme warming in localized hot spots. I also note the vast white regions where there has been no warming.
We support UAH and Roy on the fact that what warming we’ve had is not catastrophic nor will it be catastrophic. I think we are all in agreement with Roy that no one really knows what underlies the warming, be it natural causes or CO2.
The low climate sensitivity Roy claims in this article raises lots of questions.
How can you be a troll when you agree in principal with what the site stands for?
Oh, just a minute, I get it. We don’t agree with you and other alarmists therefore we are trolls. Amusing!!
Gordon Robertson
I have no objection with you supporting Roy’s blog. My objection to you is your terrible science that is made up.
You should read g*e*r*a*n’s and Mike Flynn’s posts. They are not defending anything nor do they provide rational or logical scientific thought process. They just make fun of other posters and try to get responses. When people respond to them you can see that it goes no quite some time and is 99% nonsense. Nothing of value in any material presented by those two. As I stated SSDD over and over for years now.
Neither could read a textbook on science if you put it in front of them. They are trolls and are here for that purpose only. Are you one of them or will you rise to a higher standard?
I also want you to support your claim here: YOU: “Oh, just a minute, I get it. We dont agree with you and other alarmists therefore we are trolls. Amusing!!”
What post have I put up that makes you think I am an “alarmist”. I am a scientific minded person and like the value of this discipline. When I see it tortured with made up garbage it compels me to post. My posts against you have nothing to do with your position on Climate Change. My posts against yours are the terrible science you think is valid. Hard for me to take the made up nonsense you post often and without shame. You have to know you are just making most of the stuff up. Other than that I don’t think I would have a problem with your posts. If you posted real science and physics I think that would be awesome. Force yourself to do a little work and research and learn the science BEFORE posting a cobbled scrambled notion that you mixed up like a witches brew. I think you have potential to be a valuable contributor. At this time you are not valuable at all. Made up science stinks!
Con-man, the only one you are conning is yourself.
Your long rambling tirades are filled with mis-information and your perverted opinions. YOU are the one with all the pseudoscience. You constantly claim that I do not know physics, but you cannot present even one example. You claim that I haven’t studied physics, but you ran from my suggestion that we make a sizable wager.
You’re a con-man.
But, you’re hilarious.
The temperature in Paris is not much higher.
http://images.tinypic.pl/i/00960/gr1imh0ykrry.png
More bullying by davie.
g,
Bullying? David?
Surely not – people are scared of bullies aren’t they? Who could scared of someone as stupid as David!? Give him a shotgun, and he’d probably check it by looking down the barrels and pulling the trigger!
Stupid, but instant Darwin Award!
Cheers.
Yeah, with davie, I should use the phrase “attempted bullying”. Obviously he doesn’t scare anyone.
Is it warmer in London?
http://images.tinypic.pl/i/00960/kv1b06mz0im5.png
Who cares? If I wanted the temperature in London, I certainly would not wait for you to post the link.
That is to say, your links here are useless and you’re ruining the blog and detracting from its purpose, which is to discuss climate change.
Can’t you be decent, ren, and respect that?
David, when do you expect spring in Oregon?
David,
If you were the blog administrator, your question might be reasonable. But you’re not. Just stupid enough to think that you can bend people to your will.
Ask another plaintive question. Maybe you could attempt some emotional blackmail – use the term denier, and hope that people might be terrified you’ll think they are anti-Semitic – the Holocaust association!
Won’t work. Stupid people have tried – their targets have developed immunity. The stupid people don’t seem to have realised yet.
Cheers.
davie wants to control who says what.
It’s called “OCD” in adults. It’s called “spoiled brat” in children.
But ren… I live no more than little 25 km away from there.
What you write here I see every day… on our thermometers :-))
Życzę ci słonecznego dnia!
La P,
Have you some objection to English?
Are you stupid enough to believe that using a foreign language on a site using English makes you appear intelligent?
It seems so.
Cheers.
Roy, your unpoliced blog has turned into a troll swamp with meters of insipid mush and bullies who get off on calling people names, while hiding their own identities. That’s pure cowardice.
It’s too bad you won’t do anything about it. I know you don’t like me personally, but I am the one person here above all who has tried to inject science into the discussion, whether you liked it or not.
You block links to your own data (hard to believe, but true), but won’t block the deniers, trolls, and plain old assholes.
You can have these runts, Roy. I’m done with them; your blog has turned into a cesspool and just doesn’t have enough return in it anymore.
Do snowfall in the northern hemisphere (excluding Greenland) are climate or weather?
https://www.ccin.ca/home/sites/default/files/snow/snow_tracker/nh_swe.png
David,
There you go again. Not my fault if you’re too dumb to find me on the internet. Only a stupid person would think that it makes any difference anyway.
Promises, promises!
Off you go then. Not enough return for you, eh?
Cheers.
You block links to your own data (hard to believe, but true)
No, David, that is not true. The UAH links that include N.C.D.C. in the string are blocked because of the D..g C….n ban. Other words are binned for reasons not understood, not even by Roy.
And there’s no favouritism in it. Both sides labour under the curlicues equally. We all learn to put up with it and figure out workarounds. You’re smart enough. Spend the time you’d complain about it figuring out solutions instead. Most have already been supplied over the years.
barry,
Are you saying that David uttered a falsehood? You aren’t as stupid as I thought.
On the other hand, saying that David is smart enough, shows that your standard of smart is stupidly low.
Cheers.
barry advises davie: “Spend the time you’d complain about it figuring out solutions instead.”
Great advice, barry. But for people to accept, and follow good advice, they have to have a certain level of maturity and responsibility.
Otherwise, it’s called “falling on deaf ears”.
It’s still fun to watch, however.
Its like watching a train wreck in sliw motion… I cant look away ..
davie, you won’t be able to stay away. You are obsessed with trying to control the world, one blog at a time.
A job would be helpful in forcing you to face reality.
I agree. As climate warming dawns on them, they react like inmates in an asylum at full moon. They are barking, incoherent, and sometimes vicious. Time to leave them be I suspect.
p,
You’d have to be stupid to believe that somebody could say climate warming, and expect any rational person to take any notice.
You’re stupid enough, obviously.
Cheers.
Woof! woof! to you too.
p,
A dog might be less stupid than you. Do you agree?
Cheerd,
It’s a common problem in the blogosphere DavidA but particularly in the climate area. Just look at ATTP for example and you will find virtually ALL anonymous ideologues who engage in the same insults and trolling you complain about here.
My guess is that Roy doesn’t have the time to go through these comments individually but it is probably true that banning certain trolls would improve the quality a lot. If some sites like HotWhopper and ATTP banned anonymous trolls, they would get very few comments at all.
David young…again you misinterpret the meaning of ‘troll’. If you read the comments carefully you will see that your so-called trolls are not here to interfere with rational comments. They will engage in proper scientific discourse when the topic is rational.
A real troll does not care about the content of the commenting, he/she has the sole purpose of p***ing people off for the sake of it.
I have been attacked with troll-like behavior by posters who have not the slightest idea how science works. They set themselves up as authority figures and dismiss my comments without even an attempted explanation based on science. That’s because they don’t have one, so they call me a troll.
People who offer pseudo-science, or rush off to Google for instant answers, are about as bad as trolls. I get fed up with it and respond with sarcasm.
I have made claims against NOAA and the IPCC which I have backed up with direct links. Still, the alarmists have no intention of hearing that, they just don’t like their authority figures attacked, even if it is justified.
The same alarmists who have supported NOAA, GISS, and the IPCC, are the same one’s who have gone out of their ways to discredit the UAH data. I am not into that kind of persecution so excuse me if I get a bit nasty responding to such innuendo.
Gordon Robertson
Don’t pat yourself on the back for your scientific skills or your ability to research. You have horrible science in almost everyone of your posts which is easily disproved with any valid science text. You have little ability to process actual science so you make up a bunch of stuff and I spend many posts explaining in detail why your posts contain awful science. It does not deter you from making up more of this garbage.
You are also wrong about g*e*r*a*n and Mike Flynn. Neither of those trolls has the slightest interest in science or logical debate. Both just are here to annoy and see who can generate the most posts with absurd comments. You are delusional about that as well as your science.
Gordon the only ones who offer pseudoscience are you, g*e*r*a*n and Mike Flynn. You all make up physics. Make declarations that are not founded on any physics. Refuse to acknowledge you are in error.
Read the definition of pseudoscience. You use it all the time and purposefully. You know you are wrong but pretend you know what you are talking about hoping to lure some nonscientific people to your delusional side.
“Pseudoscience consists of statements, beliefs, or practices that are claimed to be scientific and factual, in the absence of evidence gathered and constrained by appropriate scientific methods.”
This is exactly what you do. Above you say an electron flies off breaking a bond and then iron melts. Compete crap, made up pseudoscience. You are a shameless pseduoscientist and I am starting to accept you are a troll as well.
norman…”You are also wrong about g*e*r*a*n and Mike Flynn”.
Each has his own approach. Mike keeps asking for proof that the GHE exists and no one supplies the science.
g*r just exposed you alarmists on your faulty thinking re the Moon not rotating on its axis. Alarmists went to great lengths to argue a moot point, just as they do with catastrophic warming theory. The notion that a trace gas is responsible for projected catastrophic warming and climate change is, to me, a moot point.
Their method is not my method but it’s effective. Both have you alarmists gnashing your teeth and pulling out your hair because you cannot supply sound scientific arguments.
With regard to my so-called pseudo-science, I have been applying it for decades, and guess what, it works. You keep telling me I don’t know what I’m talking about but I must be doing something right if the science I have learned can be applied.
I suggest you don’t apply for any jobs that require you to apply your understanding of science.
ps. on second thought, you could likely get a job as a climate modeler.
Gordon Robertson
Mike Flynn has been supplied this information numerous times by numerous posters.
His favorite tactic is to describe a molten surface that cooled as proof no GHE exists. He believes the surface continues to cool. I have explained to him many times this is faulty logic. I explained you still have molten rock on Hawaii. It cools to ambient temperature but when the Sun shines it during the day it warms up and does not continue to cool. It reaches an average temperature between a night and day cycle. He also can’t grasp averages even when explained to him hundreds of times.
I am starting to believe you also lack logical thought process.
YOU: “g*r just exposed you alarmists on your faulty thinking re the Moon not rotating on its axis.”
He did no such thing, he posted hundreds of times the moon does not rotate on its axis. He proved nothing except he is an idiot devoid of logical thought and can’t see real evidence when presented to him.
Here is a simple and very clear demonstration that the Moon must rotate on its axis. I am hoping you are not as devoid of thought process as g*e*r*a*n.
https://www.youtube.com/watch?v=VKTQx8IySBk
Also because you do or did electronic work does not mean you can understand correctly all physics or Chemistry with no study in these areas.
The reason I am so much smarter than you in heat transfer is because I actually read the material and work to understand it. You reject all science you are not able to understand and think there is a conspiracy behind it all. You think Big Bang is just a made up fantasy but you don’t have a clue of any of the evidence behind it. You don’t work to understand it but reject based upon your own false ideas that you have made up.
GR, Yes, you’ve been promoting the false claims of G&T for almost a decade. But, they were wrong, back radiation can result in a temperature increase, as I demonstrated in my Green Plate model. In spite of the obvious facts presented, you continue to shout and stamp your feet claiming that your physics is correct. You claim that you have decades of experience applying your science, yet you have refused to provide any support for these claims. Are/were you really an engineer and do/did you hold a professional engineering license? If so, give us some evidence and put your life where your mouth is, so to speak. If you again ignore my request for validation of your claim, then we must conclude that you are a liar.
norman…”he [g*r]posted hundreds of times the moon does not rotate on its axis”.
And you still don’t get it. Read my lips: THE MOON DOES NOT ROTATE ON ITS AXIS!!!!!!!!!
It’s this kind of convoluted thinking has you believing everyone is illogical except for you.
So, you are smarter than me with heat transfer??? What you are is a legend in your own mind. You and your alter-ego Swannie, if not one and the same, are wasting time trying to disprove the 2nd law of thermodynamics. You cannot even apply the Stefan-Boltzmann equation properly, distorting it to claim a two-way heat transfer.
swannie…”GR, Yes, youve been promoting the false claims of G&T for almost a decade. But, they were wrong, back radiation can result in a temperature increase, as I demonstrated in my Green Plate model….”
So let me get this straight. You, a layman, who offered an experiment lacking in controls, hence suffered an erroneous conclusion, are an expert, while two scientists who work directly in the field of thermodynamics don’t understand the principles of thermodynamics.
G&T had to point out the obvious to Eli Rabbett, who posed the blue plate/green plate lack-of-thought experiment, that electromagnetic energy cannot be summed and claimed to satisfy the 2nd law. They rightly pointed out that the 2nd law applies to heat, not EM, which seems a no-brainer, since Clausius developed the 2nd law in relation to heat and work, not EM.
Still, Eli Rabbett does not get it even though he allegedly has a degree in physics. Nor, it seems, do you get it, or any of the climate alarmists who claim heat can be transferred from a cooler atmosphere to a warmer surface.
GR, FYI, I have 2 engineering degrees and have been a member of AAAS for 41 years. You are a fool to think I’m a layman.
As for the Green Plate model, it can be demonstrated to be true and I did so with my cookie sheet demonstration. I have also demonstrated the same effect in a partial vacuum, though I’m not finished with that demonstration. Of course, like a fundi suffering from the G*O*D Delusion, you will probably ignore that result as well, as you have ignored my earlier, less sophisticated, demo and the hard evidence that the Moon rotates. Stay tuned…
Gordon Robertson