Warming to 2100: A Lukewarmer Scenario

February 28th, 2018 by Roy W. Spencer, Ph. D.

My previous post dealt with a 1D model of ocean temperature changes to 2,000m depth, optimized to match various observed quantities: deep-ocean heat storage, surface temperature warming, the observed lagged-variations between CERES satellite radiative flux and surface temperature, and warming/cooling associated with El Nino/La Nina.

While that model was meant to match global average (land+ocean) conditions, I more recently did one for oceans-only (60N-60S). I changed a few things, so the models are not directy comparable. For example, I used all of the RCP6.0 radiative forcings, but with the land use and snow albedo changes removed (since the model is ocean-only). For SST observations, I used the ERSSTv5 data.

The resulting equilibrium climate sensitivity (ECS) is 1.54 deg. C (coincidently the same as the previous, global model).

What I thought would be fun, though, would be to run the model out to 2100. This requires an estimate of ENSO activity (I used the MEI index). After examining the history of MEI, including it’s low-frequency variations (which are somewhat related to the Pacific Decadal Oscillation, PDO), I made the February 2018 MEI values onward equal to the Feb. 1929 values up to the present.

The resulting forecast shows global average SST almost reaching 1.5 C above pre-industrial times by the end of this century:

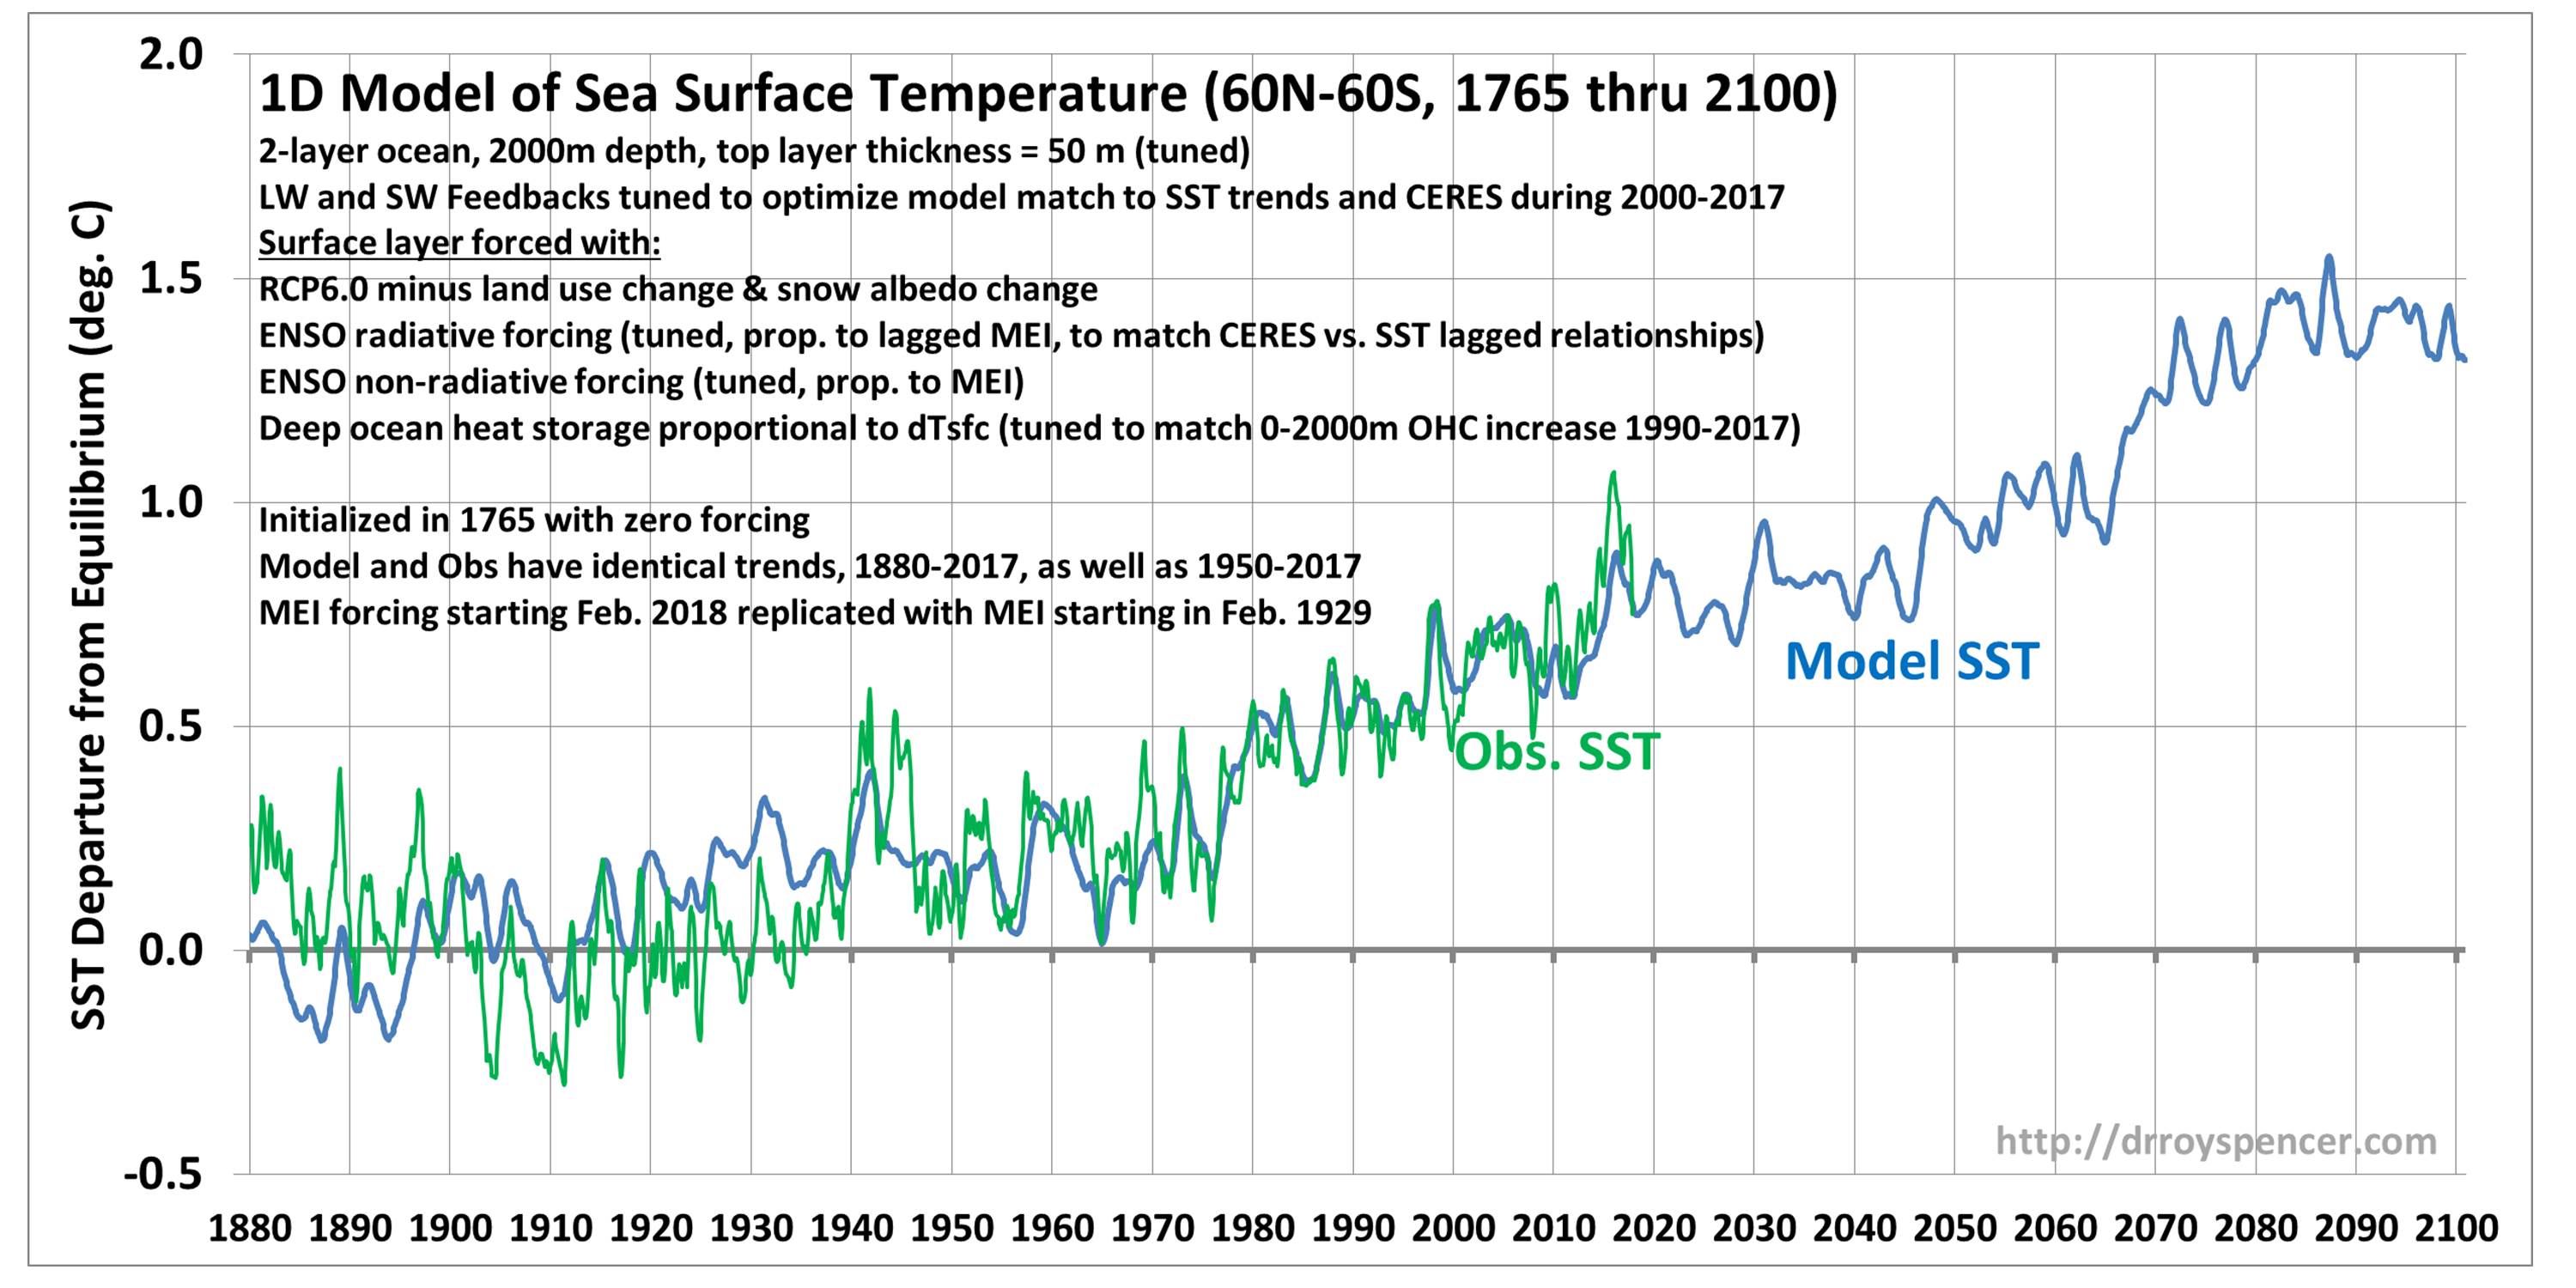
2-Layer ocean model sea surface temperature variations. See the figure inset for model assumptions and how it was tuned.

Because I used past MEI data for the future, the lack of significant warming until the late 2040s is due to reduced El Nino activity that was observed from about 1940 to the late 1970s. The enhanced warming after 2040 is analogous to the enhanced warming from stronger El Nino activity that existed from the late 1970s to the late 1990s.

Of course, this whole exercise assumes that, without humans, the climate system would have had no temperature trend between 1765-2100. That is basically the IPCC assumption — that the climate system is in long-term energy equilibrium, not only at the top-of atmosphere, but in terms of changes in ocean vertical circulation whcih can warm the surface and atmosphere without any TOA radiative forcing.

I don’t really believe the “climate stasis” assumption, because I believe the Medieval Warm Period and the Little Ice Age were real, and that some portion of recent warming has been natural. In that case, the model climate sensitivity would be lower, and the model warming by 2100 would be even less.

What would cause warming as we came out of the Little Ice Age? You don’t need any external forcing (e.g. the Sun) to accomplish it, although I know that’s a popular theory. My bet (but who knows?) is a change in ocean circulation, possibly accompanied by a somewhat different cloud regime. We already know that El Nino/La Nino represents a bifurcation in how the climate system wants to behave on interannual time scales. Why not multi-century time scale bifurcations in the deep ocean circulation? This possibility is simply swept under the rug by the IPCC.


79 Responses to “Warming to 2100: A Lukewarmer Scenario”

Toggle Trackbacks

  1. jimc says:

    Enjoy reading (and trying to understand) your thinking. Its great to know someone is looking at the rationally and scientifically (as opposed the hype and hysteria). Thanks

    • jimc says:

      Does your observation (previous post) about El Nino/La Nina affecting the trend lend credence to the idea that they help cool by opening up a hole for heat escape in the western Pacific?

      • This is an interesting question. It is difficult to tell if El Nino represents a net loss of total energy by the climate system or not. From just the reduction in ocean overturning, I would say yes because the surface and atmosphere get warmer and have enhanced loss to outer space. But there is the offsetting effect of more radiative energy (especially SW) coming into the system as El Nino is forming. That would be a net increase. So, maybe it’s a wash.

        • Des says:

          “more radiative energy (especially SW) coming into the system as El Nino is forming”

          What? The formation of an El Nino (at least on the oceanic side of the coin) is the result of heat already present in the ocean spreading itself more evenly over the ocean surface, thus allowing the heat to interact with the atmosphere over a greater surface area. It is not about the ocean acquring more total heat.

    • TopTuna says:

      Here, here!

  2. Bob Weber says:

    “You don’t need any external forcing (e.g. the Sun) to accomplish it, although I know that’s a popular theory. ”

    El Ninos are solar driven, so you are completely wrong Roy.

    • My, so much confidence in such a contrived theory.

      Don’t you think it’s ironic you want to explain something (ENSO) that can just be an internal oscillation, with the solar cycle, which is itself an internal oscillation?

      • Bob Weber says:

        There’s nothing contrived about my work. It was built one step at a time, successfully, upon observations & data.

        Roy I like you and so on but when push comes to shove, it has to be said that lukewarmers with tendencies to put internal variability and ‘CO2 warming’ above solar activity are completely missing a real lesson, in fact I would go so far as to say it is really the lukewarmers who have the ‘popular’ but wrong theory. Ironical.

        The climate *is varying right now* from the sun’s current internal variability, it’s cyclic magnetic field changes.

        Did you know that sunspot activity has slowed down recently to the earliest lowest level of all 24 numbered cycles?

        We aren’t having historic cold and snow records this winter because of internal variability – it’s from low TSI during this recent historic solar slowdown, and longer term low solar activity overall since the end of the modern maximum, post-2003. The solar max driven 2015-2016 ENSO is history, because TSI has declined and is much lower now.

        Did you know a SSN-TSI bump last fall drove up UAH 4Q 2017?

        The present La Nina is occurring from insufficient TSI now. It looks like a repeat of the mid 1950s La Nina is in our future, also driven by low solar activity during those solar minimum years.

        The next El Nino will start like the ’09-10 ENSO from the increase in solar energy, TSI, at the start of the next solar cycle.

        The real climate responds in real-time to real potent TSI changes *and* from lagged heat accumulation or depletion in the ocean from the changing level of TSI over time.

        Solar effects are therefore layered and time-dependent, as TSI varies up and down over time.

        Those are my conclusions since 2014, and since then a fair number of peer-reviewed papers were published independently that also unknowingly support various parts of my solar work, my TSI-Insolation solar theory of weather and climate.

        When you attribute ENSOs and SSTs to solar activity and solar cycle changes, its called ‘the solar cycle influence’.

        The solar cycle influence varies for each solar cycle with the magnitude and phase of the change in the solar magnetic field from the start to end of the cycle, and is unique for each cycle like each cycle’s sunspot activity is unique.

        The climate lags and is bounded by the solar changes, while CO2 accumulates in the atmosphere via Henry’s Law, added to by human emissions, are a product of these solar changes, yet have a very insignificant impact compared to the real deal, TSI-Insolation ocean heat accumulation/depletion.

        • Give a time series of such indirect solar forcing, either in W/m2, or in arbitrary units, and let me compare it to observed temperature variability and ENSO.

          By the way, TSI variations are included in the above plot…the effect is tiny, of course, since it’s 1 part in 1,000 of average radiative fluxes for the solar cycle, and the RCP has an additional very slight upward trend in it during the 20th Century.

          • Bob Weber says:

            I think you and most everyone else has misjudged the solar influence. The so called tiny TSI variations matter far more than huge increases in CO2.

        • Laura says:

          Bob Weber

          Since you cite anecdotal weather reports I would like to add that Japan, where I live, has had seriously mild winters (and summers, btw) for years now.

          Having said this, I favor theories that front (or at least account for) solar influence and would like to see either a more sophisticated framework in place or a stronger correlation. Granted, the antihuman climate alarmist offer witchery so the standard for the latter is pathetically low.

          I’m actually betting on you guys so keep up the good work.

          • Bob Weber says:

            Thank you Laura, and keep up your interest. I’ll have something available on the subject in about a month.

        • I think you are correct Bob.

          I wish something definitive would happen with the climate sooner than later to give more credence to yours and my thoughts.

          It is like limbo for the climate since it has been and still is essentially unchanged, for several years or even decades.

        • Frank says:

          Bob wrote: “I think you and most everyone else has misjudged the solar influence. The so called tiny TSI variations matter far more than huge increases in CO2.”

          Both solar and CO2 forcing can be compared at the TOA in terms of W/m2 or energy per unit time. Temperature is proportional to energy. On this basis, TSI variation is TINY.

          So, one needs to discard TSI are your basic measure of solar activity, replace it with something new measure (sun spot number for example), and then find some way to convert that new measure to a forcing at the TOA. Then you need to explain why the new metric for the solar cycle doesn’t produce a large changes in Ts with an 11-year period. Mathematically, 1 W/m2 of forcing at the TOA is capable of producing warming a 50 m mixed layer at an initial rate of 0.2 K/yr and Pinatubo was roughly compatible. The initial rate is reduced by Planck feedback relatively quickly, but this gives you an order of magnitude assessment of the size of the warming expected from if a larger solar forcing is associated with an alternative measure of solar activity.

          As best I can tell, the “It’s the sun, stupid” hypothesis is no where near producing a consistent picture of ia major role in climates.

  3. Jim Donne says:

    Hi Dr. Roy,
    If the oceans warm as you predict, how much sea level rise should we expect?

    JD

    • depends on how glacial ice changes. My first guess would be to just extrapolate the trend over the last 100 years forward.

      • Steve Case says:

        My first guess would be to just extrapolate the trend over the last 100 years forward.

        The current reports of acceleration of sea level rise is an extrapolation of a 25 year, recently corrected, time series.

        • Frank says:

          Steve wrote: “The current reports of acceleration of sea level rise is an extrapolation of a 25 year, recently corrected, time series.”

          To reach roughly 1 meter of SLR by 2100, one needs 1 inch/decade/decade of acceleration on top of the roughly 1 inch/decade current rate of SLR. Inches/decade are easy to remember. The amount of acceleration detected over the last 25 years is 0.041 0.058 mm yr−2 by Chen (2017) not quite statistically significant. In a century, that will be 10 inches of linear rise over a century and 8 inches of additional rise from acceleration.

          https://polarice.geo.arizona.edu/papers/Chen.etal.AcceleratingGMSL.NClimate.2017.pdf

          Nerem (2018) is claiming a statistically significant acceleration of 0.084 0.025 mm/y2 or 0.33 inch/decade or 0.33 inch/decade/decade. That would be 16 inches of accelerated SLR over a full century.

          http://www.pnas.org/content/early/2018/02/06/1717312115

          Both of these are consistent with the IPCC’s low and mid-range projections for SLR by 2100. The amount of acceleration being reported is small to modest and doesn’t change anything.

  4. Christopher Hanley says:

    As an interested layman and current victim of the GW / CC rent-seeking scam, the general shape of the model looks to me like Dr. Akasofu’s earlier sine wave:
    https://wattsupwiththat.files.wordpress.com/2009/03/akasofu_ipcc.jpg

    • Gordon Robertson says:

      christopher…”the general shape of the model looks to me like Dr. Akasofus earlier sine wave:”

      Akasofu is one smart cookie. He pioneered in studies of the solar wind and his book on it is worth the read. He’s the type of scientist who would notice items many of the rest miss, like recovery from the Little Ice Age explaining warming since 1850.

  5. bit chilly says:

    Dr. Roy ,
    Could you expand on your idea re ocean circulation changes ? For me tidal cycles over decades, centuries and longer periods have the potential to alter the amount of water by a huge amount in the various ocean basins. This in turn could influence in/out flows of those basins affecting change on ocean circulation patterns .

    I also believe the above to be linked with the amo and arctic sea ice levels ,whether a driver or driven i have no idea.

    • Roy W. Spencer says:

      tidal forcing is known to be the dominant mode of deep-sea mixing through flows over bottom topography. I would not be surprised if some theory of tidal forcing of century time-scale changes in ocean vertical circulation end up being involved in long-term climate change.

      • Mike Flynn says:

        Dr Spencer,

        Just a sample –

        Another neglected energy source is the geothermal heat flux through the sea floor. This trickle of heat, which is due to the slow cooling of the solid earth, is estimated to have a typical value of 50 mW m−2 (1 mW = 10−3 Watts) on abyssal plains and up to 200 mW m−2 on mid-ocean ridges [Sclater et al., 1980; Kadko and Baross, 1995; Stein et al., 1995; Murton et al., 1999].

        You are probably aware that Edward Lorenz was a meteorologist, and working on convection problems when he *discovered chaos*. Obviously, given the physics involved, energy needs to enter at the bottom of the column for convection to occur.

        Observations of abyssal and other currents show that currents can flow in opposite directions at different depths, and appear to show chaotic convective behaviour. A pretty problem in fluid dynamics, as yet insoluble.

        The fluid interior of the Earth appears to also contain chaotic three dimensional currents, moving vast quantities of energy here and there – chaotically and unpredictably.

        Net result – good luck with predicting the future state of the lithosphere, aqua sphere, tor atmosphere in any useful way. The finest models cannot be shown to perform any better than a naive persistence forecast.

        Your work might help to explain how everything fits together. Good luck.

        Cheers.

        • lewis says:

          Mike,
          Along the lines of “fluid interior of the Earth appears to also contain chaotic three dimensional currents, moving vast quantities of energy here and there chaotically and unpredictably.”

          What then would explain the existence of ‘hot spots’? There are a number of them. Hawaii and Yellowstone being two. They appear to remain in the same place as the plates move over them.

          Lewis

          • Mike Flynn says:

            lewis,

            Some hot spots seem persistent, many wander. Hot spots are thought to be surface expressions of mantle plumes, but the mechanism is not settled, as far as I know.

            However, the moving plates you mention are probably driven by convection within the interior. So the Earths interior, being fluid, acts similarly to the aquasphere and the atmosphere.

            The magnetic poles wander erratically, as do the continents laterally, and to a lesser degree, vertically. In essence, trying to predict movement in fluids with more precision than naive persistence forecasts might not be possible. Not just weather, but also ocean conditions, currents, volcanic eruptions, earthquakes, and even perturbations in the rotational period of the Earth.

            I can’t come up with anything that I can’t explain generally in line with the above. Mind you, it only takes one thing that I can’t explain, and I’ll have to change my view. Maybe you can come up with some observation to that effect.

            Cheers.

        • gbaikie says:

          If it was commercially viable to harvest the geothermal heat from the ocean floor, then that would lead to predicting future geothermal activity.

  6. Susan Fraser says:

    Dr Roy,

    … We already know that El Nino/La Nino represents a bifurcation in how the climate system wants to behave on interannual time scales. Why not multi-century time scale bifurcations in the deep ocean circulation? …

    Just asking if you have read Ian Wilson on external drivers of El Nino?
    http://astroclimateconnection.blogspot.co.nz/2014/11/evidence-that-strong-el-nino-events-are.html

    Its all over my head but questions of what drives oceanic circulation fascinate

    All the very best with your work and thank you for making your work available to all

    • Bart says:

      I will have to read through this when I have time. I think it may be on to something. Some years ago, I noticed that modulation of the 11 year solar cycle by the 9.3 year tidal precession angle could produce harmonics at 5 years and 60 years, and those periodicities, or close to them, do appear to manifest in the temperature data.

    • Gordon Robertson says:

      susan…”Its all over my head but questions of what drives oceanic circulation fascinate ….”

      The article to which you link is based on the LOD (length of day) variability supposedly caused by tidal forces from the Moon. I don’t see anything in the article giving the difference in the LOD. What is it, something like 0.1 milliseconds?

      If the Moon is in such a position as to cause drag on the Earth’s angular momentum it would do so in one hemisphere only, meaning it would be accelerating the angular momentum while acting on the other hemisphere. One should pretty well cancel the other.

      Not sure that LOD is a viable scientific theory. If it was, we’d be eternally adjusting clocks to compensate. How such a minuscule effect could affect ENSO is beyond me, especially since the Moon acts monthly and ENSO does not.

  7. AaronS says:

    “You dont need any external forcing (e.g. the Sun) to accomplish it, although I know thats a popular theory. My bet (but who knows?) is a change in ocean circulation, possibly accompanied by a somewhat different cloud regime.”

    Just a note that as Christensen and Svensmark and later Kirkby and many others have pointed out galactic cosmic rays likely seed high albedo clouds by ionizing the atmosphere (also creating radiogenic C14). Since solar activity includes magnetic field strength variability (along with TSI), and solar magnetic field strength is (can see in C isotopes) a factor in deflecting galactic cosmic rays, then it is likely that cloud cover is also related to solar activity. So there is potentially more to the sun than TSI included in your model and IPCC models. This is not to say internal ocean circulation patterns dont also influence cloud cover, but there could be a complicated interplay. The other elephant in the room is the unknown role of galactic cosmic ray flux. Either by a more active source or less deflected by the sun’s magnetic field there is potential that: More cloud seeds from GCR, more albedo from dense clouds, and cooler temperatures.

    And we see this relationship in paleoclimate studies.
    http://www.nature.com/articles/srep05159

    GCR solar link.
    https://www.sciencedirect.com/science/article/pii/S1364682697000011

    • pochas94 says:

      “This is not to say internal ocean circulation patterns dont also influence cloud cover, but there could be a complicated interplay.”

      Not only that, but the same thing that causes internal ocean circulation changes (gravitational forcing from the moon, sun, and planets) is probably also affecting solar activity which, (the evidence is now overwhelming)contributes to the small changes in climate we find so alarming, and which provides a profitable opportunity for scoundrels.

    • aaron says:

      Don’t forget that changes to magnetic fields and rate and location of ionized molecules in fluids, both ocean and atmosphere, can affect circulation too.

    • aaron says:

      Magma as well.

  8. MikeF says:

    With regard to changes in ocean circulation since the little ice age contributing to part of the observed warming, is it you sense that it’s caused by an increased number/intensity of short term (El Nino/La Nina?) patterns that cause warming or a some longer term pattern.

  9. Nate says:

    Roy, do you have a feel for how the obtained climate sensitivity would change with the number of ocean layers? Why is two sufficient? Because diffusion of heat into the ocean changes the lag time(s) of the response.

  10. AaronS says:

    For the model, is there an opportunity to do a low case (with natural forcing 1800 to 2000) and also a high case where there are positive warming feedbacks (could simple as albedo from ice loss at high latitudes)?

    I just think ranges are preferable in academic circles and you are more likely to be correct and not embarrass your great great grandkids when 2100 roles around.

  11. mikeR says:

    Roy,

    I was wondering how sensitive your model to its input parameters and assumptions? Many of the parameters may have significant associated uncertainties. Accordingly , can you perhaps provide an upper and lower limit for your model trend? How much difference would these bounds make to your long range projection?

    Extrapolating over 10 years is fraught enough but doing so over 80 years is very brave, some might say foolhardy.

  12. gbaikie says:

    –I dont really believe the climate stasis assumption, because I believe the Medieval Warm Period and the Little Ice Age were real, and that some portion of recent warming has been natural. In that case, the model climate sensitivity would be lower, and the model warming by 2100 would be even less.–

    I agree.
    I believe it’s more warming than we will see by 2100, but if extend it to 2200, it’s more possible.
    Or if extend to anytime within thousands of years, it almost getting to be likely.

    But were the ocean to warm by this much, what would the results be. Or it’s going from an ocean of about 17 C to ocean of about 18 C average temperature.

    It seems most of warming of ocean has occur outside of the tropics. And it seems one will get summertime ice free arctic sea ice, so ice free lasting a few weeks during the summer.

    Globally one should get more rainfall- and more snowfall near polar regions. Canada and Russia should have increase of their average temperature by couple of degrees, going from average of -4 C to -2 C or warmer. And their treelines should extend significantly more pole ward.

    And seems possible one might get some greening of Sahara Desert.
    What you won’t get is record breaking highest daytime temperatures, though one will getting recording breaking winter night time high temperatures

  13. professorP says:

    Roy,
    your value of a warming of +1.5 by end of century sounds plausible.
    Correct me if I am wrong but the IPCC projections for 2100 for RCP6.0 are about
    +2.0 to +3.7 relative to pre-industrial values and for RCP8.5 about +3.2 to +5.4.
    Can we guesstimate that your luke-warm model response to RCP8.5 would be about
    1.5+1.2 = +2.7 deg ?
    (i.e. adding the difference from the lower IPCC estimates).
    It would be useful to see the results for all 4 RCPs.

  14. ren says:

    Children in England will see some snow.
    http://oi68.tinypic.com/k06i39.jpg

  15. CAOYUFEI says:

    I don’t think we have 2100, we should be the last generation on this planet.

    • lewis says:

      You are welcome to lead the exodus.

    • wert says:

      The end is nigh?

      Cao Yufei sounds a Chinese name. I’d ask my ancestors whether we’re doing well or not. My great-grandfather didn’t have a chimney. His wife didn’t have a real surname.

      My grandfather didn’t have modern medicine, or electricity.

      My father had central heating, destistry, and was saved by antibiotics after being pierced by Soviet grenades.

      I’m living better life than any of my ancestors.

      Yet my children have it easier with modern spectacles, day-care, excellent schools, quality food etc.

      It must be the end is nigh.

      • CAOYUFEI says:

        The earth is a great natural treasure, in our accelerated plunder, the world’s population is growing, resources are falling, even without climate change , do you think of your children, your descendants forever can live with you?We will soon run out of fossil fuels on earth. If the new energy does not develop well, who will give you the energy, sun?The sun does give us energy. How much can we use?There are metals, accelerated mining, not recycling, how many resources are there enough topeople?and it is accelerate。

        • wert says:

          the worlds population is growing

          Not here, mate. Not in Japan. Not at Russia. Not in any Western country. Not in Oz. China is facing death spiral and can’t avoid it. India – not even there, because the fertility rate has dropped.

          The place where population grows for real is in Central Africa, and there is only one country with significant population. You want to blame it, or blame us for not fixing it yet?

          Off you go to Nigeria, give them contraceptives, electricity, atheism, education, uncorrupt politicians, employment. It works. You may start now. I’ll return to this drivel after you’re fixed your error one.

          • Snape says:

            Wert

            A decline in population is much different than a decline in population GROWTH rate.

            The world’s population has been increasing by around 80 million people a year for the past HALF CENTURY.

            India by far the most (15 million). China second (5.5 million).

            US, among the top at 2.5 million
            Australia: ~ 200,000

            “Population in the world is currently (2018) growing at a rate of around 1.09% per year (down from 1.12% in 2017 and 1.14% in 2016). The current average population increase is estimated at 83 million people per year.

            Annual growth rate reached its peak in the late 1960s, when it was at around 2%. The rate of increase has nearly halved since then, and will continue to decline in the coming years. It is estimated to reach 1% by 2023, less than 0.5% by 2052, and 0.25% in 2076 (a yearly addition of 27 million people to a population of 10.7 billion). In 2100, it should be only 0.09%, or an addition of only 10 million people to a total population of 11.2 billion.”

          • Snape says:

            (The figures for India, China, US and Australia are the predicted increase In 2018)

        • Ron Hayes says:

          In regards to running out of fossil fuels, you are incorrect. With the current proven reserves (what can be economically extracted with current technology) and based on current usage rates, the world has a greater than 500 year supply. There is MUCH more fossil fuel than this out there. Extraction technology will almost certainly improve and when the day comes that fossil fuels actually do start to be in short supply other forms of energy will be more economically feasible and fill the gap.

          In regards to a predicted population explosion, you are also incorrect. The current theories on this are increasing predicting the world population to max out within the next few generations.

          https://www.youtube.com/watch?v=FACK2knC08E

      • CAOYUFEI says:

        The future of humanity is sustainable. Is it sustainable now?In addition to food, trees.Is there anything else that we can give back to this nature?We do not see our earth as a mother.

        • Bart says:

          If the Earth is our mother, she’s kind of an Andrea Yates type. Nature is not kind. It tries to kill off the weakest so that the strongest survive. It has been trying to kill us inter alia with fires, storms, plagues, and predators since the first day we opened our eyes.

      • CAOYUFEI says:

        Man, wake up. We’ve been destroying our homes for a long time. Your ancestors didn’t have as many people as they do now.Look at the world. If technology doesn’t develop quickly, sooner or later, we’re going to die together.

    • Des says:

      Caoyufei,
      AGW is real, and Mr Spencer is greatly understating the problem, but we don’t need any Guy McPherson BS here. Try to stick to the scientists, not the attention-seekers.

      • PhilJ says:

        Spoken like a true believer…

        A warmer world is much better than a cooler one

        There is no evidence of any problem that Dr Spencer may or may not understating..

        I believe you and most of the other alarmists here probably have no idea what the moral of the story of Chicken Little is …

  16. wert says:

    Roy,

    Assumption that the ACC is the only factor affecting climate change is deeply rooted, but we can’t overrule (or can we?) the possibility that climate was naturally out of balance due to a regime shift, and would be cooling by itself without human intervention. This could mean higher sensitivity, the most scary option were that human CO2 has undone a lot of natural cooling by accident.

    That would mean a lot of uncertainty in future.

    I tend to think a rough balance is a much more probable option though, but I lack knowledge on how on Earth you could know?

  17. As I have said this year is the transitional year as very low solar will have it’s effects namely in bringing down overall sea surface temperatures and increasing the albedo slightly.

  18. The sun drives the climate therefore any change in it has to effect the climate.

    Lag times have to be accounted for.

  19. gammacrux says:

    We already know that El Nino/La Nino represents a bifurcation in how the climate system wants to behave on interannual time scales.

    It’s indeed expected that complex systems such as climate system may exhibit natural fluctuations at all time scales.

    Yet, technically, the concept of “bifurcation” is not appropriate to describe this phenomenon. The concept of bifurcation is not internal variability. It’s related to the behavior of the system and what happens when parameters change in chaos theory, that is here external forcings for instance.

  20. Gordon Robertson says:

    Roy…”I dont really believe the climate stasis assumption, because I believe the Medieval Warm Period and the Little Ice Age were real, and that some portion of recent warming has been natural”.

    Based on the LIA alone, there’s a good chance most of the RE-warming since 1850 is natural. According to scientist Syun Akasofu, that is.

    How about this scenario. The re-warming is almost finished and we are seeing a few burps near the end.

  21. ossqss says:

    Dr. S, has any work been done to evaluate the influence of deep water brine currents on ocean circulation and or climate?

  22. gbaikie says:

    Re: harvesting oceanic geothermal heat.

    The massive nature of the Gulf Stream despite it’s slow speed
    means it has a lot of kinetic energy, but it’s slow speed
    makes it uneconomical to use it as power source for some kind of powerplant.
    But thousands of tonnes water moving at say 60 mph, though having less energy than a trillion of tonnes moving 1 mph, could harvested economically with a powerplant.

    So, one way harvest geothermal heat of the ocean “might” be related using warm water to cause thousands of tons of water
    to move at around 60 mph.

    Hydro dams are using gravity to create energy. Mars having about 1/3rd of Earth’s would get about 1/3rd the energy per
    meter height of water behind the dam, as compared to a dam on
    Earth. More gravity more energy, no gravity, no energy.

    Warmer water is less dense compared to colder water and lower density allows one to use buoyancy. And this force is due to
    gravity- one has 1/3rd the force of buoyancy on Mars as compared to Earth.

    Related to this, is the question, how fast can something travel through water due to the force of buoyancy?
    This is a topic, I thought about quite a bit, but for this
    issue, it can said the main issue has to with the drag losses
    of water.
    If put water in pipe it can travel over 60 mph- garden hose can go pretty fast and have go into a bucket or pool of water
    and quickly slows down.

    With a garden hose one has some fixed amount of pressure, say 60 psi or it’s fixed speed or speed limit.
    And with buoyancy it’s acceleration. And the acceleration would become limited by drag losses of water. But as I said in a pipe one can have less drag losses- and the larger the pipe one can get less drag losses.
    And if one dealing with thousands of water, very big pipes.
    10 meters diameter pipe has area 78.5 square meters and if water traveling at 30 meters per second (65 mph) 23550 tons water pasts thru a point per second.
    And what is that it term of KE= mass 1/2 times velocity Squared?
    235550 / 2 =16775 tons or 16775000 kg times 900 is 1.448 x 10^10 joules per second. Or 1.4 x 10^10 watts times efficiency of .5 or 7 x 10^9 watts.

    And is this possible? As said water has to accelerate or is not entering pipe at 65 mph and means the intake would be larger diameter.
    So, conic nozzle was 20 meters that area of 314 or 4 times area or water could 1/4 of velocity.
    If reverse this- pushed water down 10 meter diameter pipe at 30 m/s and when got 20 meter wide cone it travels at 1/4 speed.
    And now Wondering where water goes (and perhaps how’s does it all float). It could have cone at top and bottom.
    Say the same size and roughly water enters and leaves at same
    speed. And to continue the fun let’s the water temperature enters and leaves at same temperature.
    Now add load which takes energy from it, that should mean the velocity lowers at the top.
    And need same amount of water entering as leaving. And generally that means I need larger cone at the top – and not sure if this irritates me.
    Another possible option his have the same diameter, but have top have a taller cone.
    So say cone is non ridge material – plastic tube. So not cone just 10 meter diameter plastic tube say 100 meters long.

  23. Year 2018 is going to be telling

  24. J. Seifert says:

    The natural upward forcing of temperatures since 1610 AD is demonstrated
    in detail in the part 8 paper of our entire Holocene study, and the calculation proceedures are consistent for a over 10,000 year period….. see
    http://www.knowledgeminer.eu/climate-papers.html,
    ….. questions welcome. JS.

  25. Frank says:

    Roy: Most measure of ENSO rely on temperature and global warming is changing temperature. Using the MEI to correct for the effects of ENSO could be inherently circular: the MEI is inflated by GW and then used to explain GW.

    One measure of ENSO involves pressure difference (Tahiti and Darwin?) Surface pressure isn’t changing with GW. Why don’t researchers use this ENSO metric which can’t be biased upward by GW?

Leave a Reply