Midwest’s April chill most unusual on Earth

April 16th, 2018 by Roy W. Spencer, Ph. D.

If you thought the cold April weather in the U.S. was exceptional, you are correct.

In terms of temperature departures from average so far this April, the U.S. Midwest, Northern Plains, and much of Canada have been the coldest on Earth (graphic courtesy of Weatherbell.com):

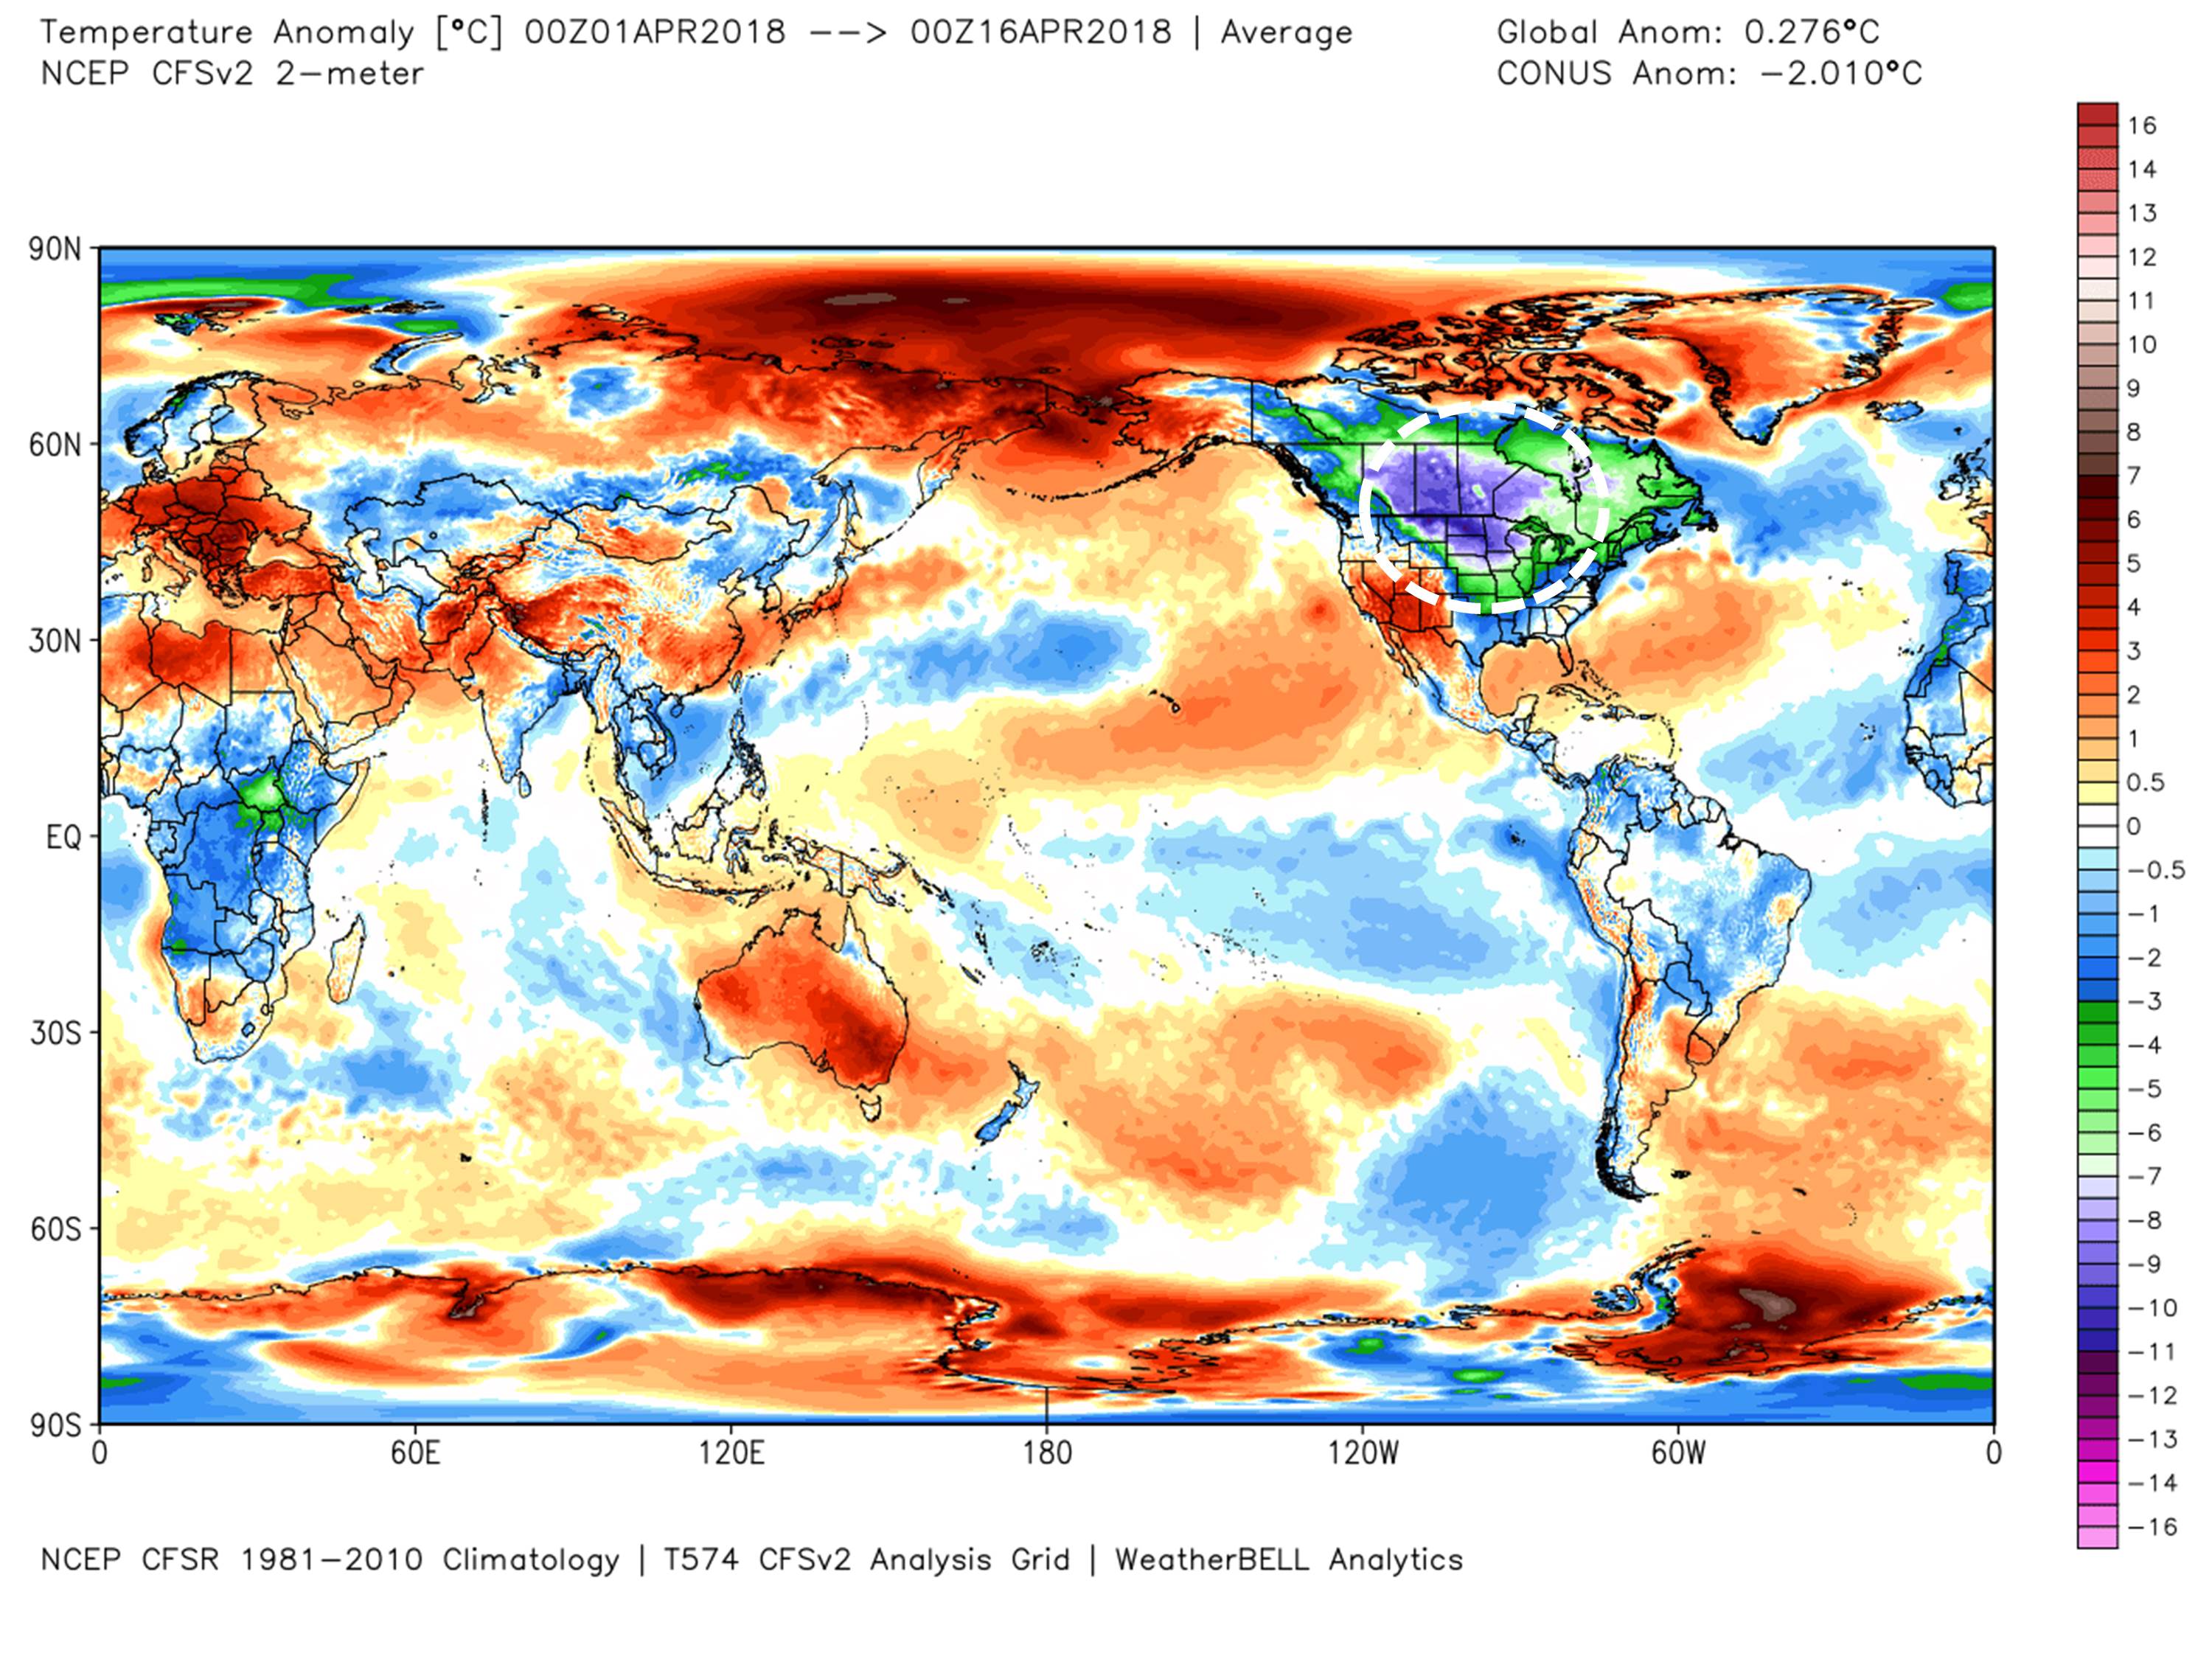
Surface temperature departures from normal for April 1 through April 15, 2018.

The areas of green have averaged at least 6 deg. F below normal, the areas in purple have been at least 13 deg. F below normal, and spots in North Dakota and Montana have averaged close to 20 deg F below normal over the last 2 weeks. In contrast, the global average temperature has been running 0.5 deg. F above the 1981-2010 average.

Snow flurries were experienced as far south as Russellville, Alabama yesterday, and flurries are still falling in portions of Tennessee. Green Bay, WI received 2 feet of new snow from the slow-moving snow and ice storm still affecting the Great Lakes region. Northern Michigan is still experiencing heavy snow, with whiteout conditions this morning at the Mackinac Bridge, which connects Michigan’s Upper and Lower Peninsulas:


307 Responses to “Midwest’s April chill most unusual on Earth”

Toggle Trackbacks

  1. RAH says:

    Flurries here at my place south of Anderson, IN for the last several hours. It’s not sticking but it sure is coming down like it means it. Just four days ago we had our bed room window open listening to the tree frogs and crickets at night.

    It is looking like at least for us in the eastern half of the US, this cold is going to continue right to the end of this month! April snow showers do NOT bring May flowers.

    Joe Bastardi says it’s looking like the winter weather will end late and come back early this year for the US. Or IOW we in the US are in for an attenuated growing season.

    • Ross Retterer says:

      Just received a promo from NOVA for ‘Decoding the Weather Machine.’ I assume Dr. Spencer is not interviewed on this series. Are there any ‘denier’ points of view expressed? I hope Dr. S will comment on the program.

  2. Bob Weber says:

    The anomaly map doesn’t show it’s as cold today elsewhere too:

    https://earth.nullschool.net/#current/wind/isobaric/850hPa/overlay=temp/orthographic=-90,90/loc=0,90

  3. PhilJ says:

    Dr. Spencer,

    Thats because co2 is cooling the planet.

    Temp inversions at the poles raise the anomolies in those regions

    As the solar cycle declines cooling temps first appear in the center of large land masses…

    • David Appell says:

      How would more CO2 cooll a planet, in theory?

      • PhilJ says:

        because its a radiator it thermalizes energy to the atmosphere.. both incoming and outgoing, boosting the energy of the other molecules it slams in to…

        its one of the worst radiators so will be one of the last to be blown off…

        hello Mars

        • David Appell says:

          First of all, CO2 doesnt interact with incoming sunlight.

          • PhilJ says:

            it absolutely does.. in fact above the tropopause, except where ozone exists it is the prime absorber of incoming solar energy

            the ozone holes at the poles increase when the planet is heating and decrease when it is cooling

            at the ozone holes a counter vortex to the cold descending polar vortex is pumping warm air into the stratosphere

            (the appearance of random ‘hot spots. in the polar regions would be the eye of the storm…)

            at the mesopause it starts to sublimate at its critical point releasing some energy to the thermosphere… its final boost to the molecules/atoms present there

          • David Appell says:

            Ive never heard that CO2 ab.sor.bs sunlight. Whats its ab.sorp.tion spectrum in sunlights primary range, say, the visible?

          • PhilJ says:

            hunh? how many times have you seen its a*b*s*o*r*p*t*i*o*n spectrum on this blog… do a google search and find it quite quickly

            youll find it between about 2 and 15 microns

          • PhilJ says:

            And my mistake i should have said mesosphere and not tropopause…

          • David Appell says:

            Between 2 and 15 microns is the infared spectrum, not the solar spectrum.

          • PhilJ says:

            David,

            it is absorbing both sunlight from above and terrestrial radiation from below. it then thermalizes some of that radiation, INCREASING the energy of other molecules and atoms in the mesospere… H + O primarily boosting them into the thermosphere as it sublimates out…

            You find mainly H O and N in the thermosphere because CO2 is sublimating out…

            as the planet cools (by ejecting mass and energy) the altitude of the mesopause decreases

            lower drag on satellites (which has been observed) is proof of this cooling

          • David Appell says:

            Phil, I do not see how carbon dioxide is ab.sorb.ing sunlight. Where is it ab.sorp.tion spectrum that shows that? The fact that it doesnt is fundamental to the existence of the greenhouse effect.

          • PhilJ says:

            David,

            Maybe this will help you: http://jvarekamp.web.wesleyan.edu/CO2/FP-1.pdf

            and dont forget the 15 micron band of upward terestrial energy either…

            Entropy rules!

            The Earth (or any planet) has some internal energy ‘U’ ..

            (mostly) empty space has very little in the vicinity of a planet…

            entropy dictates that energy flows downhill…

            ALL outgoing energy reduces U

            Mass= Energy (c2) .. thus all outgoing mass and radiation reduce U cooling the planet

            delta U = mass and radiation incoming – mass and radiation outgoing

            you can tell how much a planetary body has cooled from its molten/gassey beginning by the upper layer of its atmosphere…

            hottest:
            Jupiter Saturn

            next
            uranus neptune

            next in order

            Io
            Titan
            Venus
            Earth
            Mars

            mercury, moon, other bodies with no atmosphere (end state)

          • PhilJ says:

            p.s.

            co2 is the worst radiator so last to go…

          • David Appell says:

            Phil, your link looks like a college book report, not a scientific paper.

            The near infrared isnt in the solar spectrum. Perhaps you are confusing microns and nanometers?

            In any case, you are confused. Greenhouse gases like carbon dioxide, water vapor and methane do not absorb much at all of sunlight. They do absorb a lot of infrared radiation. This is why there is a greenhouse affect.

          • David Appell says:

            Phil, how much mass is leaving the top of the atmosphere?

          • PhilJ says:

            If we assume that the Earth is now cooling more slowly than it did when it was like Venus,

            then ..less than Venus but more than Mars…

            of course the solar cycle will have an effect on the rate of mass loss in the thermosphere… during the day the rate would increase dramatically and lessen at night..

            which is why I put the TOA at the top of the mesopause..
            at this point co2 reaches its critical point and sublimes out. the rest of the atoms molecules at this point would be on average boosting outsystem in daylight and falling back in system at night

            at the peak of the solar cycle more mass is being ejected and the TOA shrinks and the bottom it expands…

          • PhilJ says:

            DA

            ‘Greenhouse gases like carbon dioxide, water vapor and methane do not absorb much at all of sunlight. They do absorb a lot of infrared radiation.’

            methane goes first water goes next co2 last

            how much atmosphere lost determines chemisty…

            when the top layer is all gone or solid on the surface the next best radiator is at the TOA

            altitude a gas will reach is directly proportional to its absortivity and indirectly proportional to its atomic weight and critical point

          • David Appell says:

            Phil, do you have an ab.sorp.tion spectrum for CO2 in the solar range, or not? Thats really all that matters here.

          • David Appell says:

            PJ wrote:
            methane goes first water goes next co2 last

            What is this supposed to mean???

          • TedM says:

            You are not aware that thye sun also radiates both above and below the visible spectrum DApell. I wonder what else you are not aware of.

    • mick9 says:

      No. CO2 does very little. Its effects are negligible

      • Guy says:

        Certainly at these levels.. a couple extra molecules CO2 in 10000 of air is not going to have any significant impact on global temps either way.

        It does have a measurable positive effect on plant growth and drought resistance though..

      • PhilJ says:

        Indeed water vapour is much more effective at boosting the altitude of other molecules.

        A blessing for us that it condenses out and rains at the altitude it does…

  4. Nate says:

    You said exceptional. Exceptional usually means in terms of historical records for those areas.

    • bilybob says:

      My understanding is exceptional is usually applied to a two standard deviation departure of the average. Some may have a different definition. In this case, if this situation occurs less than 2.5% of the historic past April 1-15 time this would be 2 or more standard deviations and be exceptional. But it does assume a normal curve. My guess is Dr. Spencer is correct, if not statistically, at least figuratively.

    • RAH says:

      Nate there are all kinds of records for extended cold weather and snow coverage being set.
      https://globalnews.ca/news/4140452/edmonton-winter-weather-record/

      https://www.sootoday.com/local-news/workweek-outlook-latest-spring-in-recorded-history-894130

      Heck on April 13th there were 7 states of the contiguous 48 with Blizzard warnings in effect somewhere.

      The thing is it’s part of longer term trend according to Rutgers University Snow Lab which keeps track of global snow extent.
      https://climate.rutgers.edu/snowcover/chart_seasonal.php?ui_set=nhland&ui_season=1

      Now I’m not one of those buying into a coming Mini ice age. I think that assessment is as extreme as the claims we’re going to burn up or drown due to 400 ppm CO2. But what I am seeing in my travels here in N. America over the last few years sure reminds me of the way I remember winters were when I was a kid back in the 60’s and 70’s.

      • Nate says:

        Does look like an exceptionally cold winter for Edmonton region.

        Since these records started, I think that the 1 degree C added globally is not in any way sufficient to make winter cold episodes disappear locally.

        But arctic warming may be sufficient to change regional weather PATTERNS, ie climate, in various ways.

  5. Jim Clarke says:

    Along the lines of “If a tree falls in the forest…”

    If the planet warms but not where the people live and grow food, is warming still a problem?

    • Svante says:

      Think sea level rise and collapsing eco systems?

      • g*e*r*a*n says:

        Sleazy, how about actually thinking, for a change?

      • Mike Flynn says:

        S,

        There are marine fossils found at altitudes > 6 000 m.

        Sea level obviously has a long way to go. You demonstrate stupidity and ignorance, not to say unwarranted fearmongering.

        Carry on with the predictions of doom. Do you need more sackcloth and ashes?

        Cheers.

        • AaronS says:

          Mike. There are fossils at really high elevation, but from tectonics that pushed them up there. There are marine fossis in Colorado from Cretaceous sea level and cretaceous interior sea way from 60m of sea level rise. Never 1000m

          • g*e*r*a*n says:

            Marine fossils have been found on Mt. Everest.

            That’s why it’s always hilarious when clowns pretend to know what the “proper” sea level is supposed to be.

          • PhilJ says:

            Interesting.. if you could calculate the volume of that sea level drop you would be able to aproximate how much water has been blown off to space since the cretaceous

          • Mike Flynn says:

            A,

            Exactly. Just as coal, oil and gas are found thousands of meters below present sea levels in some cases. The loonie AGW proponents refuse to believe that we live on a ball of viscous fluid, in constant chaotic motion.

            Land masses rise and fall, subduct, and generally act like unpredictable whirligigs.

            Sea level rise? Don’t make me laugh! Alternatively, I’ll laugh long and loud at the stupid and ignorant GHE crowd, who couldn’t find their backsides with both hands!

            Pseudo-scientific wannabes.

            Cheers.

          • Nate says:

            Both MF and G are silly enough to have believed that sea level was up high in the mountains, rather than mountains having risen. Hilarious indeed.

          • David Appell says:

            Tectonic processes are far slower than the present rapid pace of AGW. They are relevant to it.

          • Mike Flynn says:

            DA,

            You obviously have no concept of chaotic systems.

            Even the IPCC as a whole is not as stupid and ignorant as you.

            You can’t even define the GHE, so blathering about AGW is pointless, isn’t it?

            Your grandiose assertions are symptomatic of delusional thinking – have you any facts to back you up? No? Just models, proxies and fantasies?

            I thought so. Try telling people that climate is anything than the average of weather, and has always changed. Be prepared for derisive laughter.

            Cheers.

          • David Appell says:

            FLynn, lets stick with the tectonic processes. What influence do you think they have on decadal climate change?

          • Mike Flynn says:

            David,

            Lets not. Lets stick with chaos. Why are you so determined to avoid discussing science?

            Why do think a chaotic system has a minimum initial input variation which will result in indeterminate outputs?

            You have no clue, do you? Future climate states are not predictable, except to a few lunatic true believers, in their fantasies!

            Read the IPCC reports. Its even in there.

            Cheers.

          • David Appell says:

            Lets stay on your comments about tectonic process, and sea level.

            What effect do you think tectonic processes will have on the planets climate over the next few centuries? Compare that to the effect of mans emissions of greenhouse gases.

          • Mike Flynn says:

            DA,

            Lets stick with chaos. What is the minimum change to a chaotic system which can results in indeterminate outcomes?

            Given that the Australian continents is motoring along at around 7 cm per annum, prove that this movement cannot trigger completely unpredictable effects on weather, and its average, climate.

            Stop trying to pose silly gotchas. You are not terribly good at it.

            Try understanding science, if you can.

            Cheers.

          • David Appell says:

            Again, Tectonic processes are far too slow to have any affect on decadal climate change

            If you think otherwise, prove it

          • Mike Flynn says:

            DA,

            You are just stupid and ignorant.

            You admit you know nothing about chaotic systems, and then claim that you can predict the outcome of a chaotic system.

            Your demands to prove that future climate states are unpredictable is just pointless and silly. You seem to believe that you can predict future climate through some magical CO2 mechanism, but of course are unable to demonstrate how this amazing feat may be achieved!

            Unless you can accept that there is no minimum change to initial conditions of a chaotic system which may result in chaotic and unpredictable outcomes, you are doomed to a life of failure and misery. I suspect you are well on the way to achieving this outcome.

            You cant even define this wondrous GHE of yours, let alone come up with a testable GHE hypothesis! All the gotchas in the world wont make up for the fact that you remain stupid, ignorant, and blindly fanatical. Good luck, David. Youll need it.

            Cheers.

          • Nate says:

            Mike,

            Weather, beyond a week or so is unpredictable.

            Climate-the conditions in summer in Iowa are right to grow corn-is predictable.

            An example with chaos. A pot of water is heating on the stove on low. The temperature measured at a single point is fluctuating due to chaos, but the average temp is stable.

            Now put a lid on it. The average temperature of the water rises, by a predictable amount. Yes?

            That is like a climate prediction.

          • Nate says:

            I see Mike has no answers. Not surprising.

          • g*e*r*a*n says:

            Nut spews: “Both MF and G are silly enough to have believed that sea level was up high in the mountains, rather than mountains having risen. Hilarious indeed.”

            Nut must be silly enough to believe the Himalayas can be pushed under the ocean surface without raising sea levels. Another “Warmist” unaware of basic physics.

            Hilarious.

          • Svante says:

            Someone pushed the Himalayas under water, and let it up again when there were enough fossils? Please elaborate.

          • Nate says:

            Yes G, please do tell how you think the sea level got up in the himalayas. This should be interesting.

  6. ren says:

    Meanwhile, the temperature at the North Pole sticks to the average from 1958-2002.
    http://ocean.dmi.dk/arctic/plots/meanTarchive/meanT_2018.png

    • Svante says:

      Peaked at 20 C above the 1958-2002 average!

      • g*e*r*a*n says:

        sleazy never heard of the polar vortex.

        • Svante says:

          You mean it’s weakened by global warming and polar amplification?

          • ren says:

            Do you know what is the sudden stratospheric warming and what temperature drop causes in average latitudes in winter?
            http://pics.tinypic.pl/i/00963/5c22tlsfkmzn.png

          • g*e*r*a*n says:

            sleazy svante, do you believe you can have a strong, well-defined PV without heat energy?

            That’s probably what you were taught in clown school.

            It’s funny, but inaccurate.

          • RAH says:

            The global weather pattern in 1962 is the most similar on record to what we have seen so far this year! Atmospheric CO2 levels then were at 320 ppm.

          • Svante says:

            Yes, looks like 1962 was cold:
            https://tinyurl.com/y7vpyjvh

          • Nate says:

            RAH, The ‘pattern’ same as 1962?? How so?

          • PhilJ says:

            In fact global cooling leads to increased temperature inversions at the poles..

          • RAH says:

            Nate says:
            April 16, 2018 at 3:07 PM
            RAH, The pattern same as 1962?? How so?

            In both the general over all pattern and in the results. 1962 saw repetitive strong Nor Easters blasting the Eastern seaboard just as we saw this year. It saw exceptionally cold Siberian air seep back and forth into W. Europe just as we saw this year. It saw continued blasts of winter weather come into the US well into April, just as we are experiencing this year. Etc, etc, etc. Thus the closest analog for the first four months of global weather for this year is 1962. It has been the year that Joe Bastardi has mentioned the most for months now when forecasting the weather we have experienced this year. Joe and the guys at weatherbell rely heavily on analogs in making forecasts. One of the reasons why Joe is so good is because he can look at the current data and say ‘hey that looks a lot like what happened before this year or that year’! He doesn’t just rely on the models and when they don’t agree with the analogs and antilogs, and other data he is looking at his forecast will reflect that.

          • David Appell says:

            RAH, Care to explain why Joe Bastardi went on national television and said CO2 is not a well mixed gas in the atmosphere??

          • RAH says:

            No I don’t David because what I care about are accurate results and Joe and the guys at weatherbell produce them far more consistently than any others I’ve found. That is the ONLY measure that counts in my book. No cherry picking of a phrase or statement, academic credentials or titles, or aggregation of supposed scientific minds such as at the IPCC can make up for the lack of real world results in the projections or forecasts. No forecaster or prognosticator of climate or weather is going to be correct 100% of the time. But based on the record of performance and the willingness to lay out his forecasts and stand by them and admit when they blew it without equivocation and without a plethora of weasel words, I go with people like Joe. I tend to trust people that minimize the shades of gray and will stand accountable for their work and not trust those that won’t.

          • Gordon Robertson says:

            DA…”RAH, Care to explain why Joe Bastardi went on national television and said CO2 is not a well mixed gas in the atmosphere??”

            The only reason anyone would think it is a well-mixed gas is that uber-alarmists like Gavin Schmidt and Pierre Humbug claimed it to be so. Their alarmist pseudo-science depends on it.

            Has anyone ever tried to verify it?

    • Svante says:

      Great image ren, it updates automatically.

      Now the red line has left the average green line:
      http://ocean.dmi.dk/arctic/plots/meanTarchive/meanT_2018.png

      Will it spend more time below or above the average?

      Place your bets!

  7. gbaikie says:

    As I said before, I think solar min and lower solar activity
    will effect the weather. But tend to think it require a long period, before it could affect global temperatures.
    Or the farmers are correct.

  8. ossqss says:

    Per Mr. Tisdale’s famous word!

    BUURRRRRRRR! and a low of 52 at SRQ too!

  9. Norman says:

    Roy Spencer

    Since you are a meteorologist, do you have an explanation for this extreme cold in this region? Are ocean currents responsible?

    Is there a high pressure in the North Atlantic that keeps the cold air sitting over the US and Canada the keeps it from moving around?

    • RAH says:

      I’m no meteorologist but it sure seems to me that when we go into times of lower solar activity the “polar vortex” gets loopier or IOW we are more likely to see a switch from a zonal flow to the meridional flow as we have been experiencing this whole year so far it seems.

      Joe Bastardi has been emphasizing that it is normal for years where an El Nino is going to form or when one is ending for it to be colder than average for the Eastern US. I have noticed one of the most important tools he constantly refers to when making his medium to long range forecasts is the MJO (Madden-Julian Oscillation). http://www.bom.gov.au/climate/mjo/

      • David Appell says:

        Except were not in an El Nino, nor is one expected anytime soon. In fact, we are presently in a La Nia.

        I gave up on Joe Bastardi when he said, on national television, that carbon dioxide isnt a well mixed gas.

        • RAH says:

          I didn’t say we were in one! I said that the cold is common in the years when one is going to form. Comprehend much?

          I gave up on you long before that. Joe has a fantastic record forecasting weather. Thus a demonstrated skill that only comes from a deep understanding of what causes is. You have demonstrated no such skill or knowledge.

    • g*e*r*a*n says:

      Norm, your questions indicate you know as little about pressure systems as you do about physics.

      But, Dr. Roy may be waiting to answer until he sees that your rabies vaccinations are up to date. He probably doesn’t want another of your immature rants:

      http://www.drroyspencer.com/2018/03/uah-global-temperature-update-for-february-2018-0-20-deg-c/#comment-293405

      • Norman says:

        g*e*r*a*n

        Completely had enough of your childish stupidity. You are the most useless poster on this blog. You should notice I totally avoid replying to any of your juvenile posts that contain zero useful information and mostly just provoking someone to respond to your silly and childish posts.

        Why don’t you go away for awhile. I do not think even one poster on this blog wants to read your posts and the current one is just designed to provoke a response (which you got, are you all tingly now?).

        I ask a scientific question and the fool that you are must respond. You haunt this blog.

        Look g*e*r*a*n. You are not interesting, funny or useful in any fashion. I have not seen even a slightly scientific post from you ever.

        • g*e*r*a*n says:

          Norm says: “I have not seen even a slightly scientific post from you ever.”

          Norm, it’s good to see you finally admit you don’t recognize science when you see it.

          With your weak background, science is hard for you. That’s why you are so confused about a black body. You believe it is a “heat shield”! The list is long: the Moon/axis, 2LoT, photons, fluxes don’t add, on and on and on.

          There’s so much beyond your understanding. But, at least you have your comedy career.

          • Norman says:

            g*e*r*a*n

            I knew you have obsessive compulsive disorder and a super need for attention and could not refrain from responding to my posts.

          • Norman says:

            g*e*r*a*n

            You are obviously attempting to elicit a response. The baby needs more attention. No you don’t know any science at all. You never have and you never will.

            You just make false, misleading declarative statements and refuse to support any one you make.

            You have yet to prove the Moon does not rotate on its axis. To date you bring up a toy train (which is a poor analogy) and your ignorant understanding of tidal locking. You have yet to explain what you think a heat shield is. I have linked you already to valid physics explaining the term. You are unable to respond and pretend you know physics. You have zero understanding of the 2nd Law of Thermodynamics and you will still not support your made up version of it, even when it is easy to show you don’t have a clue about what you are claiming about it. You have zero evidence supporting your claim that fluxes don’t add. Just something you declare with zero evidence to support such claims. I am not sure why you bring up photons.

            Mostly just the same old misleading and false narrative you employ. Pretending you understand these ideas but offering zero evidence that you do.

            You have stated exactly why I wish you would leave me alone and quit jumping in on my conversations. You offer nothing. You pretend you have knowledge that you do not. You are a phony person and I have zero interest in your made up ideas and useless posts which only have the purpose of creating long chains of mindless reactionary posts.

          • g*e*r*a*n says:

            I just mentioned your deficits in science. So thanks for also providing an example of your poor writing ability.

            It’s fun to watch.

          • Norman says:

            g*e*r*a*n

            Done, I won’t feed your appetite for attention.

          • g*e*r*a*n says:

            No con-man, you aren’t “done”. You can’t control yourself. You will be back, pounding on your keyboard, peddling your pseudoscience, until they carry you off to the funny farm.

            It’s fun to watch.

          • Norman says:

            g*e*r*a*n

            I have given up any hope that you might turn into a rational human. You need to observe reality. You have many stupid unscientific posts that I do not respond to. You have too little science understanding to hope for a rational conversation. Your mind is but childish. It needs constant attention. Since you won’t leave me be I need to give you your milk bottle from time to time. Not what I want, it seems as if you need it more than anything.

            Really too bad you can’t use your compulsive need to seek attention and use this to learn actual science instead. Something that will never happen.

          • g*e*r*a*n says:

            See Norm, I predicted you would be back, and you proved me right.

            I’m not really sure what to recommend for your obsession. Maybe purchasing one of my T-shirts would help.

        • Mike Flynn says:

          Norman,

          I’m bitterly disappointed. Why don’t you think that I am the most useless poster on this blog, any more?

          Have you changed your criteria, while I wasn’t looking?

          Do I get a prize for being most useless?

          Will you give me a testable GHE hypothesis as a prize, or am I asking for the impossible?

          Please let me know.

          Cheers.

          • g*e*r*a*n says:

          • Norman says:

            Mike Flynn

            I find you easier to ignore than the g*e*r*a*n. Your posts are redundant and boring. You don’t know any science at all.

            I usually skip over yours. I only respond to g*e*r*a*n because he will always jump in on my posts. I don’t have the slightest interest in yours or g*e*r*a*n’s posts. I am kind of sad the two of you destroy this blog. You with endless boring posts that contain nonsense, and g*e*r*a*n’s unrelenting need for attention at any cost.

            I have to scroll through several posts by you or g*e*r*a*n to hopefully find some thought stimulating posts based upon valid and real science.

            Many people have explained the GHE to you. You are not smart enough to understand it. You have zero science background and it would take more time than anyone here has to educate your simple mind. Plus you demonstrate an antithises to learning.

          • Mike Flynn says:

            Norman,

            You haven’t answered my questions.

            Are you perhaps confused more than usual?

            Cheers.

          • Norman says:

            Mike Flynn

            Not confused at all. Just more bored with your posts than usual.

          • Mike Flynn says:

            N,

            So who is the most boring? Why?

            What are your qualifications for objectively assessing third party boringness?

            Have you considered you may be suffering from personal attention deficit syndrome, resulting in extreme boredom when you find the subject beyond your limited comprehension?

            Why do you allow yourself to be bored? Sounds like you suffer from some mental affliction. Choose not to be bored, and you will enjoy life more!

            You don’t need to thank me.

            Cheers.

          • Norman says:

            Mike Flynn

            It is not that complicated. You are a dull and boring person. Even the questions you just asked are neither stimulating of thought nor interesting.

            The problem is not my limited comprehension. It is that my understanding is so far above yours that your posts are not very interesting. I will admit my science knowledge is far below a lot of geniuses. I am just saying my knowledge of science is so much above your own that I find your posts boring. It does not equate I find all life boring and uninteresting. Just people like you and g*e*r*a*n. You would put a roomful of people to sleep.

            The only thing I can think of that I might thank you for is a good night of sleep. If I have insomnia I just have to read your posts and I am bored. You might be one of the most uninteresting people around. You have value in boring people and helping them sleep.

          • Mike Flynn says:

            Norman,

            Why do you choose to be bored? Do you find it brings you happiness?

            If not, why do you do it? It sounds like a symptom of some bizarre mental affliction related to Masochism – choosing to make yourself unhappy, and then blaming your action on somebody who doesn’t care whether you choose boredom or not!

            You are a strange lad, Norman. I don’t get bored, and I sleep well. Maybe you have an undiagnosed mental illness?

            Cheers.

          • Norman says:

            Mike Flynn

            I think the more obvious answer, evidence it your latest post, you are just a dull and boring person.

            You do not possess enough intellect to generate and interesting point. Nothing in your posts is able to stimulate thought. That is why your posts are dull and boring.

            You don’t have even close to enough science knowledge to ask interesting questions that might create a potential for some type of thought.

            I guess I could spend my time watching paint dry or grass grow. They would be more interesting than choosing to reply to your boring and uninteresting posts.

            If you took time to learn some science there is a potential you could be interesting but I don’t see that happening.

          • g*e*r*a*n says:

            Norm refers to me 5 times, in his comment above.

            “Obsessed” would be two or three.

            Hilarious.

          • Norman says:

            g*e*r*a*n

            I had to give you some baby food. You require to see people talk about you. Even though the comment was to Mike Flynn you needed to read about yourself.

            Attention is what you demand and require. You have an unlimited desire for it. If I don’t reply to you 50 times about pure junk (usually some trading of pointless derogatory comments…You falsely accuse me of being a con-man and I tell you that you are a stupid troll) you will have this insane demand for attention that you search the blog for all my posts and then reply with some childish comment hoping to get a long string going.

            I look back at posts I made to see if the person I posted to responded. Nope, just g*e*r*a*n making some fool statement to try and get a long string of stupidity going.

          • g*e*r*a*n says:

            Norm, just keep pounding on that keyboard.

            Your obsessed rambling is fun to watch.

      • Norman says:

        g*e*r*a*n

        The post you linked to describes you completely. No immature rant at all. You really are like an infant that poops his diaper and cries for attention. Your pattern now would be to respond to this post because you got some attention. Then if I continue on with your infant demand for attention, you will go on indefinitely with some silly childish provocations that I am not interested in.

        It is not just me that you require attention from. It seems you live to have someone pay attention to you at all costs. The baby who poops his diaper. I really do not see you as much more interesting that that. I changed my children’s diapers many years ago. With you on the blog it is like I have to change an adult diaper.

        • g*e*r*a*n says:

          I just knew you would try to justify it.

          Hilarious.

          • PhilJ says:

            Hey G,

            Just an idea, change your plate diagram by removing all internal arrows with a ‘U’

          • PhilJ says:

            Sorry replacing not removing lol

          • Nate says:

            G* has asterix to remind you that there are footnotes.

            * The opinions expressed in this post are opposite of scientific conclusions.

            *Mother nature does not endorse the opinions expressed in this post.

            * The opinions expressed in this post do not match any known reality.

            *Comedians do not endorse the poor attempts at humor in this post.

            *The management ridicules this poster, so feel free to do so.

            *

          • g*e*r*a*n says:

            Sorry Nut, but the asterisks represent something else. I get a “star” for every 10 climate clowns I identify.

            You were already counted, so thanks.

          • Gordon Robertson says:

            g*r…”Sorry Nut, but the asterisks represent something else”.

            Noted. I had Schroding*e*r rejected the other data. You are not Shroddy, are you?

          • Nate says:

            I don’t G* could be a dead person. A person’s posts would be more logical than G*’s.

          • Nate says:

            Arggh

            A dead person’s posts

  10. ri says:

    To cold all my bees died in January and i ordered new ones to be delivered march 20th. Thy now tell me the deliver is delayed until may 8th. Queen production is delayed more then a month in Georgia. stock up on honey now prices are going up.

  11. ren says:

    The volume of sea ice in the Arctic has increased significantly since the beginning of March.
    http://images.tinypic.pl/i/00963/ojt667az4p0b.png

    • RAH says:

      Volume is the metric to pay attention to if your going to pay any attention to sea ice at all. In my view sea ice is a terrible proxy for temperature. Too many other variables effecting it and wind and wave action cause the most dynamic changes in the short term to extent and area. Since I don’t sail, live, or work in the area, I’ll start paying attention sea ice extent about the time I threatens to surround Iceland as it actually did a couple times during the LIA. And I won’t lose any sleep over the fate of polar bears either since they seemed to have survived the HCO, RWP, and MWP just fine.

      • David Appell says:

        RAH: I disagree. Sea ice extent, not volume, is what is important for the ice-albedo feedback.

        • RAH says:

          If albedo were nearly as important at effecting the energy balance at the pole as what you and the other warmists have claimed then the Arctic would already be “virtually ice free”. It isn’t, is not close to being so, and there is no indication that it is heading that way. Besides, in case you hadn’t noticed, the spikes in temperatures have come when the sun is either not in evidence or very very low on the horizon. Exposed water releases heat! And at the pole it is releasing it’s energy at the point where there is less atmosphere for it to pass through to get to space. How many have predicted that the Arctic would be ice free by now and how many have been correct? They have a perfect record of failure. The claim of the “death spiral” is dead due to the lack of evidence to support it.

          • David Appell says:

            RAH: Thats a lot of speculation with no proof. Got any real science?

          • David Appell says:

            RAH: you asked a good question-how many have predicted that the Arctic would be ice free by now? Whats your tally?

          • g*e*r*a*n says:

            Jelly, the Arctic sea ice is doing just fine. All of the dire “projections/predictions/forecasts have been wrong.

            But your desperate denial of reality is fun to watch.

          • Gordon Robertson says:

            DA…”RAH: you asked a good question-how many have predicted that the Arctic would be ice free by now? Whats your tally?”

            Do you mean during the one month of Arctic summer or during the Arctic winter when solar energy disappears altogether for months?

            There will never be an ice-free Arctic unless the Earth loses it’s tilt and/or drastically changes its orbit to move it closer to the Sun.

      • Gordon Robertson says:

        RAH…”Volume is the metric to pay attention to if your going to pay any attention to sea ice at all”.

        The wind and current move it around, piling large volumes of it vertically as the sections collide. Those pressure ridges of ice can be 40 feet high and they are literally everywhere closer to shore. They begin to recede near the North Pole.

        Captain Henry Larsen of the RCMP cutter St. Roch, was the first with his crew to sail the Northwest Passage both ways in the early 1940s. On the way east from Vancouver to Halifax, they became ice bound for two years. He explained it as due to wind and currents.

        On the way west, circa 1944, they sailed straight through in 87 days. Just made it, mind you, as they approached the Bering Straits the ice was moving in quickly.

    • Nate says:

      RAH,

      I think that an issue is what happens in the Arctic doesnt stay in the Arctic. As Roy has stated, all the warming and open water in the arctic affects weather at lower latitudes. E.g. polar vortex. Now we are hearing about the gulf-stream legitimately slowing down as a result of fresh water runoff in the arctic.

    • David Appell says:

      It always does. Ho hum.

  12. Mike Flynn says:

    The lithosphere, aquasphere, and atmosphere appear to act chaotically.

    What we see is chaos in action.

    Assuming that tomorrow will be more or less the same as today is as good as anything, and is surprisingly accurate for weather phenomena.

    In the meantime, good luck with peering int othe future, or even trying to explain the reasons for things like cold snaps, hot spells, stock market collapses and all the rest – in any useful way, of course.

    Cheers.

    • David Appell says:

      On the contrary, there is clearly some sort of pattern in the climate of the Pleistocene.

      • Mike Flynn says:

        DA,

        What sort of “some kind of pattern”? You have no clue, have you? You’re just stringing irrelevant words together, hoping it sounds sciency enough that no one will bother to ask you what you are blathering about!

        It is hardly my fault that you are stupid, ignorant, and deluded, is it?

        You can’t even bring yourself to say what it is you disagree with! Foolish – and sad, some might say.

        Cheers.

        • David Appell says:

          The pattern of the glacials and interglacials that characterize the Pleistocene.

          • Mike Flynn says:

            DA,

            Looks like chaos in action to me.

            You still can’t say what you are disagreeing with, can you?

            What’s your point, oh confused one?

            Do you believe you can predict the future from your “patterns”? If not, why are you obsessed with irrelevant assumptions about the past?

            It’s because you can’t actually provide anything of use – like a testable GHE hypothesis, for example.

            Keep providing irrelevant links. It gives you something to fill those lonely and bitter hours, I suppose.

            Cheers.

          • David Appell says:

            Why does the Pleistocene look like chaos to you? Does it not have regular and periodic oscillations in temperature, CO2 and sea level?

          • Mike Flynn says:

            DA,

            Why do you care?

            In any case, no, it doesn’t have “regular and periodic” oscillations. You can’t state a “period” which is “regular”. You see chaotic action at work, but you attempt to impose non-existent order and regularity so you won’t feel so impotent.

            You are probably just as convinced you can predict the future of the stock market or climate states by examining past “regular and periodic” oscillations!

            If you are essentially poor and largely unemployed, it is simply because your bizarre beliefs prevent you from accepting the reality of chaos. Even the IPCC accepts the chaotic nature of the atmosphere. Gavin Schmidt initially refused to accept the concept, and I assume Michael Mann is deluded enough to still believe that future climate states are predictable.

            So you are wrong, as usual. Still ignorant, stupid, and attempting foolish gotchas, rather than trying to understand the mysteries of Nature.

            Go on, David. Demonstrate more intellectual vacuity. Keep us amused. Others will learn from your silliness, I’m sure.

            Cheers.

          • David Appell says:

            Mike F: I care because I want to understand climate science.

            Why do you care?

            From what Ive read, the Pleistocene ice ages agree pretty well with the sum of the three Milenkovitch orbital factors. Not perfectly. But enough to see that they clearly have a significant influence on the Pleistocene climate.

            It is clearly more than just the chaos, as you claimed wrote.

          • Mike Flynn says:

            DA,

            Climate is the average of weather – no science in calculating an average, is there?

            Pretty easy to understand – or cant you understand it?

            Agree pretty well, not perfectly, significant influence, are all waffle words.

            You haven’t the faintest idea what the weather was like during the Pleistocene, have you?

            Just more assumptions, based largely on wishful thinking – covering a very few locations. What is your point? Are you agreeing that future climate states are not predictable or not? If you disagree with the IPCC, what is your reasoning?

            Try harder, David. Learn some real science. It will help.

            Cheers.

          • David Appell says:

            MF: you keep trying to change the subject. You started of writing about chaos. Thats what I responded to. So why are you now no longer discussing that?

          • Mike Flynn says:

            DA,

            Im happy to discuss chaos. I obviously know more about it than Gavin Schmidt, Michael Mann, or you!

            You cant even say what minimum input variation is required to produce a chaotic and unpredictable output!

            Give it a try, and then admit Im right and youre wrong.

            Cheers.

        • Nate says:

          David,

          At this point Flynn and G* are just buzzing gnats that keep coming back after we swat them.

          Maybe we should try to ignore them until/unless they’re ready to legitimately debate the science, which seems unlikely.

          • g*e*r*a*n says:

            Nut, you have two major problems here: 1) You can’t “ignore”, you always have to jump in; and 2) You wouldn’t know “science” if it slapped you. You only know pseudoscience.

            But, it’s fun to watch.

          • Nate says:

            So, G*, you are delighted simply to get attention. That appears to be your aspiration in coming here. I get it, science, not your thang.

          • Norman says:

            Nate

            You will find g*e*r*a*n requires constant attention. I largely ignore the idiot but he intrudes when no logical person wants to talk to him. The poster has been reduced to the most childish of states. One that always needs attention. It would be great to ignore this childish troll but they will not let you.

            As you can see with your interactions with this one, they are totally without any valid science background. They just make up stuff. The reason is they are not interested in science or truth. They just need constant attention.

          • g*e*r*a*n says:

            Con-man, it’s hilarious how you keep “ignoring” me.

    • Des says:

      The word is *HYDROSPHERE* lame brain. “Aquasphere” is a brand of pool cleaner.

  13. This year is the year and I think very low solar conditions will continue to show up in the climate of the earth by causing the jet stream to be more meridional, lowering overall sea surface temperatures and causing a slight increase in albedo due to an increase in global cloud/snow coverage and major silica rich volcanic activity.

    By summer global temperatures should be near average and this is just the start.

    Global warming will not be continuing.v

  14. donald penman says:

    I calculate from my temperature readings In Lincoln UK that the mean temperature was 8.17 degrees c which is close to the 8.2 degrees c given by the met. office for the CET for April so far which corresponds to 1.3 degrees c above seasonal averages for the CET so far so that the mean seasonal temperature must be 7 degrees c. The daily mean temperatures I recorded are ( 4.6) (5.6) (10.2) (9.4) (6.8) (8.1) (10.25) (10.1) (9.4) (7.7) (6.95) (6.35) (7.6) (11.25) (10.65) (11.4). We have had some very cloudy days when the daily mean temperatures were reduced despite the night time minimum temperatures staying high and if every day had had a mean temperature of 4.6 we would be 2.2 degrees c below 7degrees c therefore the hypothesis that temperatures can be reduced by more cloud cover is shown in spring and summer where I live although not in winter where the opposite effect occurs. We are told that maximum temperatures will increase this week for a few days as warm air moves up from the south and decrease later in April as it becomes more unsettled.

  15. ren says:

    Galactic radiation reaches levels typical of the solar minimum.
    http://cosmicrays.oulu.fi/webform/monitor.gif

    • Snape says:

      Is galactic radiation the same as galactic cosmic rays? Sounds pretty cool.

      • Mike Flynn says:

        S,

        From Wikipedia –

        “Cosmic rays are high-energy radiation, mainly originating outside the Solar System and even from distant galaxies.”

        Are you unable to find such information for yourself, or are you just trolling?

        Have you a genuine reason for asking your strange question?

        Cheers.

        • David Appell says:

          MF: I am really curious. Why do you come here every night only to insult people? Is insulting people really that important to you? I honestly cannot understand this. What do you get out of these insults? What do you get out of mocking people? I have never encountered anyone like you, and I would like to understand more about where youre coming from.

          • ren says:

            David Appell
            Do you have something to say about the solar cycle?
            You’d better say something about the temperature in Oregon on April 17, 2018.
            http://pics.tinypic.pl/i/00963/23648gdenx14.png

          • David Appell says:

            ren, When are you going to learn that the temperature on a particular day in some small region is completely irrelevant to climatic global warming? Why cant you understand this?

          • David Appell says:

            By the way, ren, April 17 hasnt happened here yet. Do you live in the future?

          • ren says:

            Wait till morning and put on a warm jacket.

          • David Appell says:

            Ren, again, what do you think a couple of days in my little neck of the woods says about man-made global warming?

          • ren says:

            How much warming have you caused?

          • g*e*r*a*n says:

            Jelly appelly doesn’t know the weather outside because he never leaves his basement apartment.

          • Mike Flynn says:

            DA,

            I admit I have no idea why people choose to take offense or feel insulted.

            I can only surmise that people with little power and low self esteem hope others might take pity on their self inflicted plight.

            Are you looking for sympathy by claiming you feel insulted or offended? Do you want somebody to hug you, and stroke your battered ego? Good for you! I hope you and your support team feel less miserable after such an exercise.

            Your lack of understanding is quite understandable to me. You perceive yourself to be stupid, ignorant and inadequate, and therefore seek to play the poor oppressed victim of the evil Mike Flynn. Learn to stand on your own two feet, David! Learn some science!

            Gather your facts, write down your testable GHE hypothesis, and take on all comers!

            Or blubber like a spoiled child, and complain that nobody appreciates your brilliance!

            The choice is yours.

            Cheers.

          • PhilJ says:

            Says the guy who thinks how a paper LOOKS determines the quality of its content

          • Gordon Robertson says:

            mike flynn…”I can only surmise that people with little power and low self esteem hope others might take pity on their self inflicted plight”.

            Ego, self, and image are nothing more than aggregations of thought. To bad some people get hung up on their own thoughts. I find it much easier to ignore them, or poke fun at them. Nothing quite as cathartic as having a hearty laugh at oneself.

  16. ren says:

    The snow will now fall in the northeast of the US.
    http://files.tinypic.pl/i/00963/xxao73wyqaw0.png

    • RAH says:

      Yes and this truck driver that will truck across I-70, 76, and 81/78 today heading to Breinigsville with a load of Nestle’s ‘Boost” will most likely only see snow along the highest elevations of the PA Turnpike. After delivering in Breinigsville Wed. morning I go further east to Pottstown, PA on the other side of Allentown, to pick up a load of catalyst as used in automobile catalytic converters which I will bring back to the yard in Anderson, IN. I’ve driven the PA turnpike so much my truck should know the way on it’s own by now.

  17. Don says:

    I can recall removing plenty of April snow from our driveway in the early 1970s.

  18. Des says:

    Why does “coldest on earth” equate to “exceptional”?
    Every day, somewhere on earth is the “coldest on earth”.

    • Mike Flynn says:

      D,

      And every day, somewhere on Earth, there is presumably the hottest place on Earth.

      I am not sure what your point is, if any.

      Do you feel like elucidating? No? As you wish.

      Cheers.

    • goldminor says:

      Not sure why the headline was written that way, but the cooling in the Central US and Canada is certainly out of the ordinary.

      • Des says:

        It’s good to see someone can reply without bluster. My problem is only with Mr Spencer’s parochial (non-scientific) attitude to posting comments.

        • Gordon Robertson says:

          des…”My problem is only with Mr Spencers parochial (non-scientific) attitude to posting comments”.

          Non-scientific??? Roy has a degree in meteorology and his partner at UAH, John Christy, has a degree in climate science. They have the data to back such claims.

          You are not talking about real science, you are talking about alarmist-based pseudo-science. Roy and John do real science. Roy has every right to write these article that keep the public informed as to the real science.

    • Gordon Robertson says:

      des…”Why does coldest on earth equate to exceptional?
      Every day, somewhere on earth is the coldest on earth.”

      We’re supposed to be headed for catastrophic global warming, remember? Instead, we’re setting records for cold.

  19. Mark says:

    What I find more interesting is the very high temperatures in the Arctic and Antarctic as well as the record high temperatures in Australia. I wonder if Dr. Roy has any comments about those data.

    • Guy says:

      thing is, as a form of insulation, an enhanced GH effect would show up at the lower end of the scale first- i.e. higher minimums more than higher maximums.

      record shattering cold, anywhere, means that heat is somehow still finding a way to escape past that extra molecule CO2 we introduced per 10000 of air… hardly surprising!

    • ren says:

      A “dry” winter is approaching Australia.
      http://pics.tinypic.pl/i/00963/3hhzihkyziij.png

      • Des says:

        Are we supposed to guess what the numbers on your map refer to?

        And how does a map of less than 5% of the Australian continent allow you to make 3-month predictions about the entire continent?

        And why did you put “dry” in quotes? Is there some esoteric way of interpreting this word that I am not aware of?

        • Gordon Robertson says:

          des…”And why did you put dry in quotes? Is there some esoteric way of interpreting this word that I am not aware of?”

          Is Australia not considered a hard drinking country? Whether it’s deserved or not, Aussie men tend to live off the image they are hard drinking, womenizers. Having worked with a few of them, and been privy to their humour, I find that image quite amusing.

          Maybe ren has put one way over your head and you have missed it.

    • Gordon Robertson says:

      mark…”What I find more interesting is the very high temperatures in the Arctic and Antarctic as well as the record high temperatures in Australia. I wonder if Dr. Roy has any comments about those data”.

      Roy may not reply this far into an article. I am wondering where you get the ‘very high’ temperatures in Antarctica. The only temperatures there that are above average are found at the northern tip of the Antarctic Peninsula.

      In this March 2018 contour map, you can see a +5C warming area approaching Antarctica but the mainland of Antarctica is not available to satellites. It is late summer in the Southern Ocean.

      Look at the dark blue blob in the Arctic at -4.5C BELOW average.

      https://www.nsstc.uah.edu/climate/2018/march2018/MARCH%202018%20map.png

      Look at July 2017, mid-winter in Antarctica.

      https://www.nsstc.uah.edu/climate/2017/july/JULY_2017_map.png

      Last March 2017. You can see these systems moving around.

      Roy mentioned in a post recently that Arctic warming locales are likely due to the effects of the North Atlantic Ocean.

  20. ren says:

    Snowstorm in the northeast of the US will expand at night.
    http://images.tinypic.pl/i/00963/4zsama2uhdnq.png

  21. Mike Flynn says:

    Sorry for any confusion.

    The gods have decreed that apostrophes and quotes are beyond my reach, yet again.

    I will try on another computer. I will prevail!

    Cheers.

  22. Bill F says:

    David Appell. Wow. Just wow You are truly a piece of work.

    You say

    MF: I am really curious. Why do you come here every night only to insult people? Is insulting people really that important to you?

    I cant beleive you actually wrote that. You are one the biggest bullies on this board and show your ass every time Dr. Spencer submits a post.

    You and a few other users need to be banned from this board because the ONLY thing you guys do is distract from actual conversation.

    Do you people realize how unenjoyable you are making things on this board? Its gotten pretty old.

    • Des says:

      Tell me Bill – do you think there are any deniers on this site who should be classified as bullies? Or are you extremely one-eyed?
      A clue … one of them will almost certainly reply to this comment of mine with abuse.

      • Gordon Robertson says:

        des…”one of them will almost certainly reply to this comment of mine with abuse”.

        Oh wad the power o God tae gee us
        tae see oorselves as ithers see us.
        R. Burns.

        I normally reply to you with fact then take a few counter shots for abuse you’ve sent my way. When I tried to engage you in an intelligent conversation about the UAH trend, you replied, talking down your nose to me.

        You still don’t understand what I am talking about with regard to contexts in statistics and how the UAH average of 0.13C/decade explains a 17 year re-warming trend and another 18 year flat trend. You have failed to state whether you think that trend is caused by AGW.

        You don’t have a clue what I’m talking about yet you pontificate freely while playing the victim.

    • Gordon Robertson says:

      bill f…”Why do you [MF] come here every night only to insult people?”

      He doesn’t, he normally has something useful to say and throws out a challenge to any taker who can offer a testable hypothesis to prove the GHE. Of course, people take shots and Mike gives as good as he gets.

      I am still waiting for anyone to take up Mike’s challenge to provide a testable hypothesis for the GHE.

  23. ren says:

    COSMIC RAYS IN THE ATMOSPHERE
    A variety of neutral and charged particles are produced in a cosmic ray shower (Figure 2). During a collision between an air molecule and a high energy cosmic ray, protons and neutrons and other secondary particles are released. Pions are particles with more mass than an electron, but less than a proton. They quickly decay in two ways. Charged pions decay into muons, and neutral pions decay into photons. Muons, produced by the charged pions are then also charged. The decay occurs so quickly that it often occurs before any other process can take place. At the point of decay the new muon jets off in another direction. Muons decay into an electron or positron (the antiparticle of the electron), and a neutrino. A neutral pion, as mentioned above, decays into two photons. Photons with enough energy can transform into an electron and positron. If a positron or an electron meets a nucleus in its path then another photon is created.

    The more energetic the primary cosmic ray, the deeper into the atmosphere the cosmic ray penetrates. Since cosmic ray particles lose energy in the atmosphere, not all secondary cosmic rays make it to the ground.
    http://neutronm.bartol.udel.edu/listen/main.html#who
    In the southern hemisphere, ozone is produced by galactic radiation in the region of the southern magnetic pole south of Australia.
    http://www.cpc.ncep.noaa.gov/products/stratosphere/strat_a_f/gif_files/gfs_t50_sh_f00.png

    • ren says:

      Because additional ozone accumulates in winter over northern Canada during low solar activity, you can expect heavy winters in North America.
      Water vapor will mix with ozone and enter the stratosphere.

  24. ren says:

    If secondary galactic radiation increases the number of condensation nuclei for water vapor, the amount of water vapor in high and medium latitudes may decrease.

  25. ren says:

    Snowstorm in South Dakota and Nebraska.
    http://files.tinypic.pl/i/00963/5yimv3q6n5ps.png

  26. ren says:

    Currently in Iowa, snowstorms and thunderstorms.

  27. ren says:

    The storm with snowfall will shift to the northeast of the US, following the previous one.

  28. Des says:

    Here is the map Mr Spencer presents in this post:
    http://www.drroyspencer.com/wp-content/uploads/Early-April-cold-2018.jpg
    Hasn’t anyone noticed how much more heat there is GLOBALLY that cold.

    • bilybob says:

      Northern/Southern pole areas are distorted due to cartographic projection being used. Plus this is an anomaly map, may be more helpful to use actual temperatures to get a better idea of how warm it is globally.

      • Svante says:

        bilybob says:

        “Plus this is an anomaly map, may be more helpful to use actual temperatures to get a better idea of how warm it is globally.”

        !?

        • bilybob says:

          Anomalies are departures from a baseline. A temperature map shows where the heat is globally. The north and south poles are not warm.

          • Svante says:

            You are right, the equator is warmer than the poles.

            You are right about the cartographic projection as well by the way.

        • bilybob says:

          Poor choice of words on my part. Should have said in addition to the anomaly map a temperature map would be helpful. Did not mean to imply anomaly may was not useful. Just the projection they were using. Perhaps an equal area map would be more helpful.

      • Des says:

        MR Spencer has told you how warm it is globally … 0.24C above the 1981-2010 mean.

        • bilybob says:

          I think we agree then, drawing conclusions from the map would have been difficult. 0.24 C, I think that is within 1 standard deviation of the baseline data. Yes?

          • Des says:

            You confuse how standard deviation is used.

            If ONE score has a z-score of 1 then nothing is special.

            When 30 of the past 32 months have a z-score greater than 1, and 11 of those have a z-score greater than 2, then a significant change has taken place.

            z>1 … predicted relative frequency 16% … actual frequency 94%
            z>2 … predicted relative frequency 2.5% … actual frequency 34%

            At the other extreme, only 8 of the past 300 months have a z-score less than -1. The predicted number of months is 48.

            You would have to be blind not to see the massive asymmetry in the data.

          • bilybob says:

            I do not think I am the one who is confused. You asked a question, I gave an answer. The anomaly map has a cartographic distortion that does not easily allow one to see “how much warmer it is globally” without trying to adjust the areas in the north and south that appear larger. You are not one of those that actually thinks Greenland is larger than Brazil are you?

            You then respond by saying the number is 0.24 C. I agreed and asked what the standard deviation was based on the baseline used. I believed it to be under 1. Not sure about your statistic lesson though, was that a yes or a no? Your not trying to suggest it is not warmer now than the 70’s are you?

          • Des says:

            And I agreed that the map was not representative, which is why I gave you the summary statistic for the entire globe.

            Of course it is warmer than the 70s.

    • Gordon Robertson says:

      des…”Hasnt anyone noticed how much more heat there is GLOBALLY that cold.”

      no…

      https://www.nsstc.uah.edu/climate/2018/march2018/MARCH%202018%20map.png

      Most of the action recently has been no warming. See the white regions.

      Also, look at that nice deep blue spot in the Arctic showing about 4C below average.

  29. It is still warm globally but that is going to change in my opinion as we move forward. When it changes I think it will be more abrupt rather then a slow gradual change which is what takes place when the climate shifts into another mode.

    This could happen if solar stays very low and duration is long enough.

    On the other hand overall global temperatures have failed to make any additional progress on the upside this year and if anything are lower then last year while overall sea surface temperatures have shown a slight decline.

    I think this year and the next few will be telling and we will have a better idea as to where the climate is going.

    As of now I say the climate is neutral and still on the warm side.

    • Des says:

      Sounds to me like you’re pulling out of your mid-year commitment to zero anomalies.

      And a month ago you claimed that the drop would be punctuated, not sudden. (My word, not yours.) Your claims seem to blow with the wind.

  30. I have not changed my views. I still say this year is the transitional year.

    • Des says:

      No Salvatore, you already claimed that last year:
      http://www.drroyspencer.com/2017/08/uah-global-temperature-update-for-july-2017-0-28-deg-c/#comment-259267
      You don’t get to make that claim every year. If last year was the transitional year, we must now be POST-transition.

      Your claim was that UAH would be averaging zero or below by August this year. Are you sticking with that claim?

      • Yes I am sticking by the claim that by Aug global temperatures will be 0 or less according to UAH data.

        • Des says:

          An remain there (on average) of course.

          • Des says:

            And …

          • Yes they remain there while you are projecting increasingly warmer temperatures as we move forward.

          • Svante says:

            Remain for how long?

          • Gordon Robertson says:

            salvatore…”Yes they remain there while you are projecting increasingly warmer temperatures as we move forward”.

            Try not to be so hard on Des, he’s an Australian. He gets his math and climate science from ruminations while he shepherds his flock of sheep. I think there are times when he debates with them and gets ideas from them.

          • Des says:

            You seem to be confusing me with Jesus and his ovine followers.

          • Gordon Robertson says:

            des…”You seem to be confusing me with Jesus and his ovine followers”.

            Not a chance. Jesus spoke sense, he had compassion for the poor and disenfranchised and urged others to help the poor.

            Your mob of climate idiots as Hell-bent on making life for the poor miserable by ramming through legislation to deprive them of affordable fossil fuels.

            As far as his disciples are concerned, equating them to sheep is typical of an arrogant alarmist. It’s also ironic since you alarmists demonstrate a similar quality of blindness by following your uber-alarmist leaders…more like lemmings than sheep, actually.

    • Gordon Robertson says:

      salvatore…”I have not changed my views. I still say this year is the transitional year”.

      No harm done even if you have to change course. Alarmists do it all the time.

      They began in 1988 when James Hansen made a fool of himself on national TV claiming catastrophe if we did not cut back on GHGs immediately. Ten years later he retracted his extremism, claiming his climate model had made a mistake. Silly Hansen for teaching his model to think independently and to program itself.

      • Svante says:

        Yes, his estimates did not match observations:
        https://tinyurl.com/7zmwoqp

        • Gordon Robertson says:

          svante…”Yes, his estimates did not match observations:”

          Svante joins the Royal Order of Climate Idiots.

          Anyone who considers himself/herself a serious student of science and uses a GISS series as a comparison to model guesses deserves to be called an idiot. You should be able, like me, to call yourself an idiot.

          Then again, GISS programs models, what would you expect a GISS series to look like? Gavin Schmidt has claimed CO2 has a warming factor of 9% to 25%. Easy to see he’s a mathematicians and not someone who has studied science in-depth.

          When GISS used a 38% confidence level to claim 2014 as the warmest year in the temperature record, it completely lost any credibility it may have had. 2014, was not even warmer on average than years from 2002 – 2006, and they were miles behind 1998.

          Hansen admitted in 1998 that his predictions had been wrong. He was the head of GISS at the time and now that GISS is run by Gavin Schmidt it should be ignored outright.

          • Svante says:

            GISS gives the same picture as all other serious temperature records, and 20+ proxy data records.

            They all show that 2014 was warmer than 2002-2006, but close to 2005 and 2010. You calculate the probability here:
            https://tinyurl.com/ycwunbya

            I wish I could give you your pause. You might get a thirty year pause in the future, it would mean that other forcings went in the opposite direction.
            Completely irrelevant in the long term.
            The CO2 input has been measured and we can see how it creeps up and up.

            I used to say warming might be natural. I was an idiot.
            You have to be very ignorant to say that now.

          • Gordon Robertson says:

            svante…”They all show that 2014 was warmer than 2002-2006…”

            I posted the UAH record for you, it does not show that. It shows a spike in 2013 with 2014 in a very normal range. Like I said, NOAA had to use a 48% confidence level to get 2014 into first place.

            So, you were sane at one time. You thought the warming was natural. We can only hope you recover your sanity, put away your calculator and whimsy, and return to the God-given intelligence and awareness with which you were born.

            You might abandon it, but it never abandons you. While you’re off on your Crusade to save the planet, your intelligence and awareness keeps your body functioning, despite the rantings of your conscious mind. Ironic, isn’t it?.

          • Svante says:

            Gordon,

            I said all show that 2014 was warmer than 2002-2006

            I was wrong and you are right when you say:

            “I posted the UAH record for you, it does not show that. It shows a spike in 2013”.

          • La Pangolina says:

            Svante says:
            April 25, 2018 at 12:37 AM

            *

            Svante, the only way to compare UAH TLT and NOAA surface is to have a look at their respective anomalies wrt the same baseline (here: 1981-2010):

            http://4gp.me/bbtc/1524689834603.jpg

            The rest is useless blah blah.

          • Gordon Robertson says:

            binnie…”Svante, the only way to compare UAH TLT and NOAA surface is to have a look at their respective anomalies wrt the same baseline (here: 1981-2010):”

            One…we were not comparing UAH to NOAA, which would be akin to comparing reality to sci-fi. We were comparing 2014 to other UAH data to show NOAA’s claim of 2014 as the warmest year ever, at the time, is completely false. It’s not even close to being a record.

            NOAA used statistical nonsense, by reducing the confidence level to 48%, to move 2014 into first place. The question is…why???

            OK, I am claiming 1950 was the warmest year ever, based on a 19% confidence level. There is less than 1 chance in 5 that I am right. NOAA is claiming there is a 50/50 chance they are right. Capice???

            Two…there is no way to use a 1980 – 2010 baseline on data gathered over more than a century from which that data’s baseline was formulated. That’s especially true when the longer series has been royally fudged to show warming where no warming exists, and dampening warming where it exceeded modern warming in the US.

          • Gordon Robertson says:

            binny…”(here: 1981-2010):

            http://4gp.me/bbtc/1524689834603.jpg

            That graph is an utter fabrication. Have you alarmists no shame?

          • La Pangolina says:

            Gordon Robertson says:
            April 25, 2018 at 3:26 PM

            http://4gp.me/bbtc/1524689834603.jpg

            That graph is an utter fabrication. Have you alarmists no shame?

            *

            You are unable to download data available to anybody, let alone to enter it into an Excel spreadsheet and to produce a graph out of it.

            Even till today you don’t understand what anomalies and baselines exactly are, and how we have to properly handle them.

            Here are the sources for the ‘utter fabrication’:

            UAH6.0

            https://tinyurl.com/y997zl7w

            NOAA

            https://tinyurl.com/yakjhzon

            *

            Robertson: every time you write such a discrediting, denigrating comment based on your absolute lack of knowledge, I will call you an ignorant, incompetent and above all persistently lying boaster.

          • Gordon Robertson says:

            binny…”You are unable to download data available to anybody, let alone to enter it into an Excel spreadsheet and to produce a graph out of it”.

            Yes, anyone can download UAH data and apply it to an Excel spreadsheet. Not everyone can do it professionally, as can Roy and John at UAH. Your rendition of the UAH data is utter fantasy. You have fudged it to match NOAA surface data and the two are not even close.

          • La Pangolina says:

            Gordon Robertson says:
            April 26, 2018 at 6:38 PM

            Your rendition of the UAH data is utter fantasy. You have fudged it to match NOAA surface data and the two are not even close.

            You could pretend that if you were able to do the same job and compare the results. But that you aren’t at all.

            Again you show how ignorant, uneducated and incompetent you really are. All you can do is to discredit and denigrate.

  31. RAH says:

    Asked ‘who is projecting an El Nino” earlier. Well, just about everybody’s model it seems.

    https://iri.columbia.edu/our-expertise/climate/forecasts/enso/current/?enso_tab=enso-sst_table

    • Gordon Robertson says:

      RAH…”Asked who is projecting an El Nino earlier. Well, just about everybodys model it seems”.

      Given my faith in models, I’ll wait and see what develops. Are there no ENSO groundhogs that stick their heads out of their burrows to indicate what is what?

      • Des says:

        So you have no faith in the Ideal Gas Model?

        • Gordon Robertson says:

          des…”So you have no faith in the Ideal Gas Model?”

          I have never implied there is anything wrong with models. I am simply opposed to so much climate science being based on unvalidated climate models that are programmed with faulty science and math. In my reference to models above, I was referring to climate models.

          You need to distinguish between a model and a law that can be tested. A model is an example, or an imitation. Once the model is proposed, the real thing must be built or demonstrated.

          The Ideal Gas Law is a melding of several other laws (Boyle, Charles, Avogadro) and it has been tested and proved ad infinitum. The only way you could equate it to a model is through it’s reference to an ideal gas. Even at that, it’s a matter of applying the real gas parameters which are close to an ideal gas anyway.

          We have to keep in mind that a scientific law or equation is a human representation of real phenomena. Calling our observations ‘laws’ is arrogant, it implies real phenomena obey human laws. All sorts of stupid nonsense can be inferred from such a notion, such as time as a reality and the Big Bang theory.

          The phenomena actually interact as described in the IGL and that interaction is not a model. In the truest sense of the meaning of the word ‘model’ in science, a law or an equation is not a model, rather they are direct descriptions of reality as opposed to the hypothetical inference of a model.

          Electrons orbiting a nucleus are a model.

          When I applied the IGL and Dalton to the atmosphere, I meant it only as a very rough description of the atmosphere. However, in science (especially applied science), it is sometimes useful to ballpark a system to get a rough idea of what is going on. Although that vision is not a fully accurate description it serves as the model.

          BTW, climate modelers could have applied the IGL and Dalton as well had they not been so hell bent on building models that reflected an implausible theory. There was no need for them to guess at a warming effect for CO2 unless they were trying to affirm their theories by brute-forcing them.

          Even if my description is a model that leaves a lot to be desired, it offers far more of a reality to the heating effect of CO2 than pulling a number out of a hat such as 9% or 25%. There is no getting away from the fact that the atmosphere is a relatively constant volume that must basically satisfy the IGL and Dalton.

          Gravity throws a wrench in the works by stratifying pressure, hence temperature. All the same, the IGL and Dalton should apply to each stratum and when integrated as a whole should reveal the same minute contribution of CO2 to warming.

          That means CO2 could never supply more of a warming factor to the atmosphere than is represented by its mass percent, which is in the neighbourhood of 0.04%.

    • La Pangolina says:

      And the Japanese Met Agency, manager of the coldest surface record (0.14 C /decade for the satellite era) seems to have a similar opinion:

      http://ds.data.jma.go.jp/tcc/tcc/products/elnino/elmonout.html#fig2

  32. La Pangolina says:

    bilybob says:
    April 19, 2018 at 10:02 AM

    1. Northern/Southern pole areas are distorted due to cartographic projection being used.

    No bilybob…

    Temperatures are computed with latitude cosine weighting.

    2. Plus this is an anomaly map, may be more helpful to use actual temperatures to get a better idea of how warm it is globally.

    Again: no, bilybob… because we do not consider only where it is warm or cold but also where it gets warmer or colder.

    Even for the ‘cold’ UAH6.0 TLT record, the 40 year trend for the North Pole is much higher than that for the Tropics, which in turn is much higher than that for the South Pole.

    • Gordon Robertson says:

      binny..”Plus this is an anomaly map, may be more helpful to use actual temperatures to get a better idea of how warm it is globally”.

      How would you do that using surface temperatures binny? You need an average of all global temps and NOAA only uses 1500 reporting stations globally.

      The earth’s surface area is about 510 million square kilometres. With 1500 stations that’s one thermometer to cover 340,000 square kilometres. Germany has an area of about 357,000 square kilometres so that means one thermometer to cover Germany.

      OK, so let’s be fair to NOAA, the 1500 only cover land area, which is about 150 million sq km. So that’s 1 thermometer every 100,000 sq km. That’s a square with 316 km per side. In actuality, they have stations up to 1200 km apart.

      Where I live, on the west coast of Canada, within such a square, temperatures vary in summer from 20C on the coast to 40C in an area 150 miles NE inland. In winter, it’s the opposite. On the coast it can be 10C while it’s -20C in the inland locale.

      There’s a decent chance that some parts of the world have warmed while others have not. Such is the bane of averages. In small spots in the Arctic, that move around month to month, the temps are 5C above the UAH 1980 – 2010 average. Meantime, in Antarctica, temps are about 4C below the average. The tropics have barely warmed at all.

      Remember that anomalies are relative variations from a norm but they are actually based on absolute temperatures. With land surface temperatures those averages are seriously questionable due to games played by NOAA, GISS, and Had-crut.

      • Bindidon says:

        Gordon Robertson says:
        April 25, 2018 at 4:24 PM

        How would you do that using surface temperatures? You need an average of all global temps and NOAA only uses 1500 reporting stations globally.

        In small spots in the Arctic, that move around month to month, the temps are 5C above the UAH 1980 2010 average. Meantime, in Antarctica, temps are about 4C below the average.

        *

        Recently I extended my temperature time series processing software up to GHCN V4 daily:

        https://tinyurl.com/y9reywwk

        Among other regions I generated averages out of all the GHCN V4 Arctic stations (60N-82.5N) having been active between 1881 and 2018:

        http://4gp.me/bbtc/1524779716450.jpg

        Oh yes, Robertson, everything there ‘moves around month to month’.

        http://4gp.me/bbtc/1524779992444.jpg

        If you want to think all that is fudged data, as you all the time pretentiously write: your problem.

        *

        At the beginning of last year I computed the linear trends in all 66 latitudes of the UAH 6.0 grid data for the period 1979-2016.

        Today I added the period 1998-2015. You certainly understand why I did, don’t you?

        Maybe you exceptionally try to think half an hour about this

        http://4gp.me/bbtc/152478038774.jpg

        before you write as you always do: like a dog seeing a tree.

        • Gordon Robertson says:

          binny…”At the beginning of last year I computed the linear trends in all 66 latitudes of the UAH 6.0 grid data for the period 1979-2016″.

          I have no interest in your amateur computations I am only interested in the work done by the professionals at UAH. Roy and John Christy of UAH are the only remaining professionals reporting global temperatures who have integrity. They rest are corrupt.

  33. Gordon Robertson says:

    binny…”bilybob says:
    April 19, 2018 at 10:02 AM

    1. Northern/Southern pole areas are distorted due to cartographic projection being used.

    No bilybob

    Temperatures are computed with latitude cosine weighting.”

    ***********

    I think you missed the context in which bb made that statement. When you look at the map it shows a very large relative swath of high temps at the North Pole. That swath is totally distorted due to the Mercator projection.

    BTW…why do we need to COMPUTE temperatures? I thought they were measured with a thermometer, or a sensor on satellites.

    • La Pangolina says:

      Gordon Robertson says:
      April 25, 2018 at 4:32 PM

      BTWwhy do we need to COMPUTE temperatures? I thought they were measured with a thermometer, or a sensor on satellites.

      1. Robertson, you should learn to carefully read instead of writing.

      Temperatures are computed with latitude cosine weighting.

      http://4gp.me/bbtc/1524761679792.jpg

      2. Are you really so dumb?

      How, do you think, does the information contained in this file arise?

      https://tinyurl.com/y92yznkq

      Maybe directly from the sensors?

      You are such an ignorant and unexperienced boaster.

      • Gordon Robertson says:

        binny…”Temperatures are computed with latitude cosine weighting”.

        Again…why do you need to COMPUTE temperatures? They should be measured with instruments and the data used directly. That’s how science is normally done.

        I am not so naive as to think no adjustments are necessary but such adjustments are required to allow for error in the measuring instruments. That’s far different than NOAA discarding 75% of its real data then re-manufacturing fudged data using a climate model.

        You cannot trust surface data, and now RSS. They are all messing with the data to show a warming that is not there.

      • Gordon Robertson says:

        binny…”You are such an ignorant and unexperienced boaster”.

        I could give you better insults to use on me, if it interests you. We have some real good ones in English vernaculars that might not reach you there in Germany.

  34. Weather Guy says:

    It was certainly a cool April here in Texas. Anomalies were as much as 8-10*F in parts of the state by mid-April.

Leave a Reply