UAH Global Temperature Update for June, 2018: +0.21 deg. C

July 2nd, 2018 by Roy W. Spencer, Ph. D.

The Version 6.0 global average lower tropospheric temperature (LT) anomaly for June, 2018 was +0.21 deg. C, up a little from the May value of +0.18 deg. C:
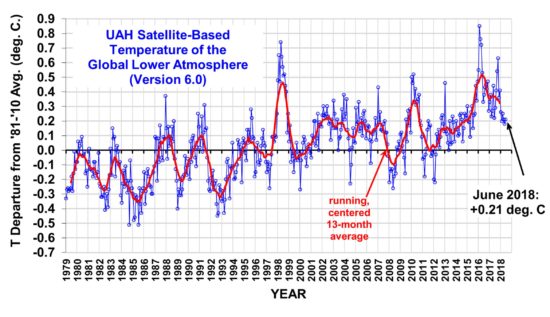
Global area-averaged lower tropospheric temperature anomalies (departures from 30-year calendar monthly means, 1981-2010). The 13-month centered average is meant to give an indication of the lower frequency variations in the data; the choice of 13 months is somewhat arbitrary… an odd number of months allows centered plotting on months with no time lag between the two plotted time series. The inclusion of two of the same calendar months on the ends of the 13 month averaging period causes no issues with interpretation because the seasonal temperature cycle has been removed, and so has the distinction between calendar months.

Some regional LT departures from the 30-year (1981-2010) average for the last 18 months are:

YEAR MO GLOBE NHEM. SHEM. TROPIC USA48 ARCTIC AUST
2017 01 +0.33 +0.31 +0.34 +0.10 +0.27 +0.95 +1.22
2017 02 +0.38 +0.57 +0.20 +0.08 +2.16 +1.33 +0.21
2017 03 +0.23 +0.36 +0.09 +0.06 +1.21 +1.24 +0.98
2017 04 +0.27 +0.29 +0.26 +0.21 +0.89 +0.23 +0.40
2017 05 +0.44 +0.39 +0.49 +0.41 +0.10 +0.21 +0.06
2017 06 +0.22 +0.33 +0.10 +0.39 +0.51 +0.10 +0.34
2017 07 +0.29 +0.30 +0.27 +0.51 +0.61 -0.27 +1.03
2017 08 +0.41 +0.40 +0.42 +0.46 -0.54 +0.49 +0.77
2017 09 +0.54 +0.51 +0.57 +0.54 +0.29 +1.06 +0.60
2017 10 +0.63 +0.67 +0.59 +0.47 +1.21 +0.83 +0.86
2017 11 +0.36 +0.33 +0.38 +0.27 +1.35 +0.68 -0.12
2017 12 +0.41 +0.50 +0.33 +0.26 +0.44 +1.37 +0.36
2018 01 +0.26 +0.46 +0.06 -0.11 +0.58 +1.36 +0.42
2018 02 +0.20 +0.24 +0.16 +0.03 +0.92 +1.19 +0.18
2018 03 +0.25 +0.40 +0.10 +0.06 -0.32 -0.33 +0.59
2018 04 +0.21 +0.31 +0.10 -0.13 -0.01 +1.02 +0.68
2018 05 +0.18 +0.40 -0.05 +0.03 +1.93 +0.18 -0.40
2018 06 +0.21 +0.38 +0.04 +0.12 +1.19 +0.83 -0.55

The linear temperature trend of the global average lower tropospheric temperature anomalies from January 1979 through June 2018 remains at +0.13 C/decade.

The UAH LT global anomaly image for June, 2018 should be available in the next few days here.

The new Version 6 files should also be updated in the coming days, and are located here:

Lower Troposphere: http://vortex.nsstc.uah.edu/data/msu/v6.0/tlt/uahncdc_lt_6.0.txt
Mid-Troposphere: http://vortex.nsstc.uah.edu/data/msu/v6.0/tmt/uahncdc_mt_6.0.txt
Tropopause: http://vortex.nsstc.uah.edu/data/msu/v6.0/ttp/uahncdc_tp_6.0.txt
Lower Stratosphere: http://vortex.nsstc.uah.edu/data/msu/v6.0/tls/uahncdc_ls_6.0.txt


414 Responses to “UAH Global Temperature Update for June, 2018: +0.21 deg. C”

Toggle Trackbacks

  1. La Pangolina says:

    Keep on running Salvatore! It’s only 0.03 C up.
    Maybe next month it cools again :-))

    • Way to warm for what I want.

      • Dan Pangburn says:

        Sal,, Long term water vapor trend is up, short term trend is down. IMO it is too soon to tell if long term warming trend is over.

        https://pbs.twimg.com/media/DhIMgNQVMAA4k76.jpg

        • That’s why I said now-next few years.

          • Svante says:

            Short term predictions are hard, look at all this noise:
            https://tinyurl.com/yck2o849

          • Gordon Robertson says:

            svante…”Short term predictions are hard, look at all this noise…”

            The word noise is inappropriate. Noise is an unwanted signal in something like a radio receiver. The noise is produced by shot noise, which is caused by electrons colliding, or by EMI, which is interference due to electromagnetic radiation.

            There is no noise in your graphic, just valid data. Of course, the presentation of BEST could be termed noise since it is an unwanted signal to an intelligent mind that can see past the chicanery of BEST.

          • David Appell says:

            “Noise” is indeed an appropriate term, when you’re looking at/for the AGW signal.

            Or call it “natural fluctuations” if you want. They don’t disappear with AGW.

          • Nate says:

            What my parents called noise, they now call classic rock.

            But I agree, noise is fine to use in this context.

          • Gordon Robertson says:

            DA…”Noise is indeed an appropriate term, when youre looking at/for the AGW signal”.

            That’s what I figured, noise, like forcing, is a climate alarmist term related to CO2.

            You’re trying to tell me that real data does not matter, that it’s noise, as long as it blocks a fictitious AGW signal? In that light, all data from Feb 2016 till present is noise since it shows an anti-AGW signal.

          • David Appell says:

            Gordon Robertson says:
            Youre trying to tell me that real data does not matter, that its noise, as long as it blocks a fictitious AGW signal? In that light, all data from Feb 2016 till present is noise since it shows an anti-AGW signal.

            Don’t pretend to be so dense, Gordon.

        • Dan why do you think it turned down of late?

          • Dan Pangburn says:

            Could be merely still coming down from the 2015-2016 el Nino. Local area in the equatorial Pacific succumbing to the rest of the oceans.

            Interesting trivia for the cherry pickers, reported TPW in May, 2018 is the same as it was in Jan 1988.

            Nino3.4 has been in an uptrend since Jan 2018.

        • David Appell says:

          Dan, what’s the source for that water vapor graph? Thanks.

    • Gordon Robertson says:

      binny…”Keep on running Salvatore! It’s only 0.03 C up.
      Maybe next month it cools again :-))”

      At least Salvatore can be optimistic that he is right. You alarmists are desperately trying to find an AGW signal in the series and it is simply not there.

      Since February 2016, we have been on a fairly steep cooling curve. It has taken its time and the cause is known only to Mother Nature. There is no way that CO2 is playing any part whatsoever.

        • Richard M says:

          No David, there is no visible AGW signal. All we see are continued ups and down following natural ocean cycles. Doesn’t mean there isn’t a small AGW signal, it’s just not visible.

          • Gordon Robertson says:

            Richard…”No David, there is no visible AGW signal. All we see are continued ups and down following natural ocean cycles. Doesnt mean there isnt a small AGW signal, its just not visible”.

            I have been trying to tell him that. The alarmists call all the ups and down noise as long as they don’t see an AGW trend in it.

          • Richard M says:

            David, which version of the data? It’s pretty clear the surface data sets are worthless these days and UAH is pretty much the only valid data set. It’s agreement with radiosonde data is clearly the best. Given the latest divergence with surface data it is pretty obvious that surface data is poor.

            The data published in the 1970s shows a lot of cooling in the 1960s and 1970s. This matches up perfectly with the -PDO and -AMO. Then the PDO went positive and temperatures started up slightly until the AMO also went positive. This raised the temperatures even more.

            Next, the PDO went negative and temperatures leveled off (aka the pause) because we still have a +AMO. When the AMO goes negative in the 2020s then we will repeat the 1960s and 1970s cooling and no one will be able to adjust it away.

            Keep in mind to we also have the millennial cycle which has kept a small underlying warming influence since it went positive around the 1500s. How long this influence remains is a question that is answerable but is not being studied by anyone.

          • David Appell says:

            Richard M says:Its pretty clear the surface data sets are worthless these days

            Aha.

            And why is that?

          • Richard M says:

            David, what part of “divergence” didn’t you understand?

          • David Appell says:

            Richard M says:
            Given the latest divergence with surface data it is pretty obvious that surface data is poor.

            Why?

            Why especially when U.A.H is the lone outlier among all of RSS, NO_AA, GISS, Had.CRUT, JMA and BEST?

          • David Appell says:

            Richard M says:
            Keep in mind to we also have the millennial cycle which has kept a small underlying warming influence since it went positive around the 1500s.

            Cycles upon cycles upon cycles.

            Epicycles.

            You sound like Ptolemy.

          • Richard says:

            David, is denial your middle name? Your comments are laughable as they are full of cherry picking and outright denial.

            I do get a chuckle that you tried to debate. Your knowledge of climate is abysmal.

          • David Appell says:

            A complete nonresponse.

            I accept your surrender.

          • Richard M says:

            David, you already surrendered with your comment about Ptolemy. I did get a good laugh at your denial of climate cycles. I guess the there’s no such thing as days and nights or summer and winter in your little fantasy world.

      • David Appell says:

        Gordon Robertson says:
        Since February 2016, we have been on a fairly steep cooling curve. It has taken its time and the cause is known only to Mother Nature. There is no way that CO2 is playing any part whatsoever.

        CO2 didn’t suddenly stop being a GHG in February 2016.

        The biggest error made by some here is confusing natural variations with AGW. They exist together, with AGW increasing all the time, but natural variations do too. In the last two years, two weak La Ninas have led to some lower temperatures.

        Just like all the times before, AGW will again make itself obvious for those who doubt it. After that we can go through all this yet again.

        IRI at Columbia University is forecasting a 65% chance of an El Nino this northern hemisphere winter. Get your excuses ready now.

        • David this time is different not meaning the temperatures are going to go down necessarily (which I think they will)but meaning this time all of the natural factors to cause cooling are in place and this time unlike other times is a true test because this time if it is the natural factors the temperature trend is going to be down and stay down.

          On the other hand this time (now over the next few years)unlike other times if the global temperatures do not fall AGW I will have to say will be on sound ground. I might have to reconsider.

          El Nino has nothing to do with this, it is transient.

        • David I am not going to fight the data, and you should take the same stance.

          I think you will if need be.

        • Gordon Robertson says:

          DA…”CO2 didnt suddenly stop being a GHG in February 2016.”

          How do you explain 2 1/4 years of gradual cooling? Unless of course you know of some magical properties of GHGs that could explain the 2016 EN spike followed by 2 1/4 years of cooling.

          Natural variations are better explained by 400 years of cooling during the Little Ice Age followed by 170 years of gradual re-warming. Only myopic scientists would overlook such glaring evidence and attribute the warming to GHGs from the Industrial Era onward.

          • David Appell says:

            Gordon Robertson says:
            DACO2 didnt suddenly stop being a GHG in February 2016.
            How do you explain 2 1/4 years of gradual cooling?

            Back-to-back weak La Ninas, mostly.

            Why do you think natural variations disappear in an AGW-world?

        • Richard M says:

          David, for the last 5 months the equatorial Pacific has had above average temperatures. In fact, it is just about equivalent in energy to the La Nina that preceded it. The 2016-17 La Nina did not affect global temperatures because much of the equatorial Pacific stayed above average.

          http://www.cpc.ncep.noaa.gov/products/analysis_monitoring/enso_update/heat-last-year.gif

          Your excuse simply is a non-starter. All that has happened is the El Nino energy pump got shut off. This has lowered global temperatures right back to where they were previous to the El Nino. And, it has put us right back into the same temperature range as the pause.

          Essentially, we’ve been here every since the AMO effects started to be felt. Yes, that is your natural climate cycle currently keeping global temperatures elevated. When it goes negative the global temps will fall just like they did in the 1960s and 1970s.

          Get your excuses ready now.

          • David Appell says:

            The 2016-17 La Nina did not affect global temperatures because much of the equatorial Pacific stayed above average.

            Why did it stay above average if there was a La Nina??

          • Richard M says:

            David, the NOAA definition of ENSO is far from perfect. They claimed it was a La Nina because of the Nino 3.4 temperature. However, while Nino 3.4 was cool, Nino 1-2 was quite warm.

            http://www.cpc.ncep.noaa.gov/data/indices/sstoi.indices

            The atmosphere doesn’t care about arbitrary definitions. If you thought it did ….. face-palm.

          • David Appell says:

            The NINO34 region is the most watched when considering ENSOs.

          • Richard M says:

            David, but we are not talking about ENSO. We are talking about global temperature.

            It appears you really aren’t interested in understand what affects it. Why am I not surprised. This is exactly what I’d expect from a religious follower.

          • David Appell says:

            Again, why did the 2016-17 La Nina above average if there was a La Nina??

            La Ninas are cold equatorial Pacific temperatures.

          • Richard M says:

            Again David, La Nina is cold Nino 3.4 area. it says nothing about the equatorial Pacific as a whole. I provided you with all the data you need to understand. Why are you ignoring it?

          • David Appell says:

            I still want to know why temperatures stayed “above average” if there was a La Nina?

            Perhaps La Ninas themselves are getting warmer? (They are.)

          • David Appell says:

            Richard, do you think CO2 doesnt absorb infrared radiation, or do you think the earth doesnt emit it?

          • Dave says:

            Richard, “I provided you with all the data you need to understand. “. Here’s a digest of the data you linked, most recent 24 month averages: Nino 1+2=0.0063; Nino 3=-0.2796; Nino 3.4=-0.3050; Nino 4=0.0096;

            From that I would have to conclude that the overall picture is of 2 years of neutral to weak La Nina, just as David suggests

          • Dave says:

            “La Ninas themselves are getting warmer?”

            David, of course note the baseline periods NOAA use for defining the current anomaly is a 30 year period that is itself shifted forwards every 5 years to allow for longer term changes. The most recent reference period is 1986-2015.

            http://origin.cpc.ncep.noaa.gov/products/analysis_monitoring/ensostuff/ONI_change.shtml

          • Richard M says:

            Dave, I was referring to the 2016-17 La Nina. Your comment was a meaningless distraction.

          • Richard M says:

            David, CO2 absorbs and emits IR radiation. So does water vapor and that is why the CO2 can’t get the planet to warm.

            Feldman et al 2015 shows added CO2 increases DWIR in the CO2 specific bands. Gero/Turner 2011 shows that overall there was no increase in DWIR thus supporting the view that water vapor is a negative feedback which cancels out any warming from CO2.

      • Emeritus says:

        There is no way that CO2 is playing any part whatsoever.

        Mit dem Angriff Steiners wird das alles in Ordnung kommen.

  2. ren says:

    Above Australia – 0.55 degrees is a serious warning against winter in the northern hemisphere, especially in North America.

    • Bobdesbond says:

      Yes – ABOVE Australia. We know from Mr Spencer’s admission after April in the US that this figure has little to do with surface temperatures in Australia.

      • Gordon Robertson says:

        bob…”this figure has little to do with surface temperatures in Australia”.

        Have not heard you crowing about temps in Oz lately. See it’s 9C in Sydney and -2C in Canberra. There will be a lot of Aussies cuddling up to their sheep in that cold.

        Heck it’s a mild 20C in Darwin.

  3. ren says:

    Where will the impact of low solar activity be the greatest? Where the strongest galactic radiation will be. A dry summer is a harbinger of a harsh winter.
    http://sol.spacenvironment.net/raps_ops/current_files/rtimg/cutoff.gif

  4. ren says:

    The volume of sea ice in the Arctic is above the average from 2004-2013.
    http://polarportal.dk/fileadmin/polarportal/sea/CICE_curve_thick_LA_EN_20180701.png

    • Rob Mitchell says:

      It looks like the Arctic sea ice extent minimum for 2018 will end up being close to the 2014 extent because of the current volume. The volume curve is running right along 2014.

      • Gordon Robertson says:

        svante…”A few more years:”

        Most of them show an average ice thickness of at least 1 metre even through the warming spots.

        • Rob Mitchell says:

          David, are you the same Dr. David Appell who debated Chuck Wiese on the Lars Larson radio show?

        • RichardM says:

          David,gGosh, the temperature has been going up all day, by midnight we will all roast to death.

          Using a linear trend in a cyclic world is a fool’s errand.

        • David Appell says:

          What type of trend should be used?

          • Richard says:

            David, the problem is all the noise in the temperature data. No trend will work on very noisy data as anyone with any real science credentials would know.

            The only way to understand a trend is to remove the noise. Unfortunately, that is where bias can be introduced. I do get a chuckle that all you true believers now want to keep in the noise. It really gives away your anti-science views.

      • Rob Mitchell says:

        I predict that the Arctic ice minimum for 2018 will easily close above 4,000,000 km2 again this year. I know that I am not going out on a limb with that prediction. But if it verifies, that will make 6 years in a row that the sea ice extent annual minimum has closed higher than the 2012 minimum. I think the evidence is beginning to mount that what we are witnessing is a multi-decadal cycle turning the corner. The sea ice minimum has bottomed out. If human-caused global warming is real, and is melting the Arctic ice, the sea ice minimum will eventually have to drop below 3.387 X 10^6 km2 at some time in the near future. How many years in a row will it take for the global warming alarmists to realize the Arctic ice is not melting away to oblivion? 10 years? 15 years? 20 years? So far we are on year number 5, going on 6 for 2018.

        • Svante says:

          Thirty years, like the temperature decline starting in the early forties.

          It also happens to be half an AMO cycle.

          • David Appell says:

            One complete AMO cycle is about 60 years, right?

            NO.AA’s 60-year trend for the global mean surface temperature is +0.15 C/decade.

            That’s not far from the 30-year trend of +0.18 C/decade.

            How can that be if GMST is controlled by the AMO?

          • Richard M says:

            David, as I explained elsewhere there is an underlying warming that has been going on for 400 years (see Akasofu). If you detrend the data from this cycle then you will clearly see the AMO cycle and it’s strong influence.

            In addition, the ocean warming trend is only .08 C / decade (HadSST3 1954-2014).

            Akasofu estimated the millennial cycle at .05 C/decade. It may be this AMO cycle is a little stronger or the .03 C/ decade could be due to CO2. Not enough data to know.

          • David Appell says:

            NO.AAs 60-year trend for the global mean surface temperature is +0.15 C/decade.

            How can that be if GMST is controlled by the 60-yr cycle of the AMO?

          • Richard M says:

            David, the NOAA data diverges from the far superior satellite data. Been over this already. The NOAA data is garbage.

        • David Appell says:

          2012 was an anomalous year due to a big summer cyclone that broke up the ice. NS.ID_C’s value for Arctic sea ice for June this year was the same as June 2012. On an annual basis Arctic SIE was lowest in 2016.

          THere is no scientific reason to expect the trend to reverse.

          • Richard M says:

            David, sounds like denial to me. The scientific reason is called the AMO. Been the subject of many peer reviewed papers. Maybe you should read up.

          • David Appell says:

            What is the effect of the AMO on global temperatures? For a given AMO(month), specify how that equates to a global temperature or temperature anomaly. Or give the difference in global temperature between an AMO_max and an AMO_min.

          • Richard M says:

            David, there is no index that tells you the exact effect of the AMO. The reason is the warm AMO removes a lot of NH sea ice extent which then allows warm ocean water to warm the Arctic air. This is then carried all over the NH. However, it is obvious if you look at this CFSR data.

            https://oz4caster.files.wordpress.com/2018/07/d6-gfs-grta-daily-2013-2018-07-01.gif

            Notice the warming that occurs every NH winter. This is the energy from the open water. This is why Salvatore will be wrong. Until the sea ice returns we will continue to have this extra energy raising the GASTA every NH winter.

            The reason it doesn’t affect the summer temperatures near as much is because the average temperature is close to the freezing mark with or without the ice.

            Finally, because the Arctic is so cold this increase in temperature is far greater than if the same amount of energy were released in the tropics. Hence, it has a large influence on the global average. Just another reason why the global average is such a poor metric.

            I realize you will deny the ice loss is driven by the AMO. You will get to learn the hard way.

          • David Appell says:

            Richard, so you can’t say quantitatively how much the AMO affects temperatures, but you’re sure it’s responsible for high temperatures.

            That’s problematic.

          • Richard M says:

            David, not problematic at all. It is well understood that water does a far better job of melting ice than does air. It’s that old heat capacity thingy added to the 90% below water thingy. The only question is why you appear to be unaware of basic science.

            Once again your response smacks of denial. Ever notice how your initial reaction to anything that doesn’t support your “beliefs” is denial?

          • David Appell says:

            Richard, you still offered nothing quantitative — just more hand waving.

            Very weak.

          • David Appell says:

            One complete AMO cycle is about 60 years, right?

            NO.AAs 60-year trend for the global mean surface temperature is +0.15 C/decade.

            Thats not far from the 30-year trend of +0.18 C/decade.

            How can that be if GMST is controlled by the AMO?

          • Richard says:

            David, all you have to claim the melting is from AGW is hand waving. I think I’ll take the hand waving that grounded in solid physics. Sorry you won’t.

          • David Appell says:

            Richard says:
            I think Ill take the hand waving that grounded in solid physics.

            That’s an oxymoron, Einstein.

            The entire world is warming. Arctic amplification is happening. Hene the fast melting of Arctic ice.

          • David Appell says:

            NO.AAs 60-year trend for the global mean surface temperature is +0.15 C/decade.

            How can that be if GMST is controlled by the 60-yr cycle of the AMO?

          • Richard M says:

            David, the NOAA data is diverging from the satellite data. That is why you see the .15C/decade. Satellite data only shows .11C/decade from 1979 up to the recent El Nino (and all that heat has already been lost) and we know it cooled from 1958-1979 at -.06C/decade.

            Once you factor that in you are right back to slightly above the Akasofu warming of .05C/decade.

            What it really gets down to is which data is superior. You want to use data collected from devices that were never maintained and with poor global coverage. I prefer the latest technology with 95% global coverage.

        • David Appell says:

          By the way, Arctic SIE for Jan18 and Feb18 was a record low for their month.

          • Richard M says:

            David, so how are winter record lows that meaningful given even those record lows are still higher than any of the other 10 month? It is what is known as propaganda. It may fool those who don’t understand science.

          • David Appell says:

            Richard M says:
            David, so how are winter record lows that meaningful given even those record lows are still higher than any of the other 10 month?

            You can’t compare January’s Arctic SIE to that of May’s or October’s.

            8 of 12 months have had record low Arctic SIE since 2012.

            January and February of this year saw record low SIE’s for their month.

            How can all this be happening if 2012 was the low point?

          • Richard M says:

            David, much of the Arctic sea ice is wind and storm dependent. That’s why is varies so much. Finding an occasional “record” is to be expected when you are at an AMO driven low point in the 60 year cycle. If we had data from the 1940-1950s we probably would have seen the exact same thing.

            You are simply cherry picking again. I see you do that a lot. Trying to claim a winter ice value is meaningful is hilarious nonsense.

            What’s more important is the ice minimum hasn’t seen any continued loss in over a decade. This is the point where the most melting occurs. If it’s not going down, then some arbitrary point when there was twice to 3 times as much overall ice is meaningless.

          • David Appell says:

            Richard M says:
            Finding an occasional record is to be expected when you are at an AMO driven low point in the 60 year cycle. If we had data from the 1940-1950s we probably would have seen the exact same thing.

            For 20th century Arctic sea ice extent, see Figure 2a here:

            “History of sea ice in the Arctic,” Leonid Polyak et al, Quaternary Science Reviews 29 (2010) 17571778.
            http://research.bpcrc.osu.edu/geo/publications/polyak_etal_seaice_QSR_10.pdf

          • David Appell says:

            “Early 20th century Arctic warming in retrospect,” Wood and Overland, Intl J Climatology (2009)
            http://onlinelibrary.wiley.com/doi/10.1002/joc.1973/abstract

            “Reconstructed changes in Arctic sea ice over the past 1,450 years,” Christophe Kinnard et al,
            Nature 479, 509512 (24 November 2011)
            http://www.nature.com/nature/journal/v479/n7374/abs/nature10581.html

  5. Rob Mitchell says:

    Looks like the USA48 and the Arctic have the lion’s share of the globe’s heat right now.

    Ren, what do you think is going on in Australia? Making up for the heat “excess” we are having in the NH?

  6. +.21 c more of the same . Oceanic temperatures have to cool down to get a serious drop off in global temperatures.

    On the other hand no further warming but temperatures are already at high levels so that takes away from that to some extent.

    As I have said now- next few years will tell much. If global temperatures do not cool from now-next few years AGW theory will be stronger then ever. True or not.

    If they do drop then AGW theory will be in trouble. Wait and see, the data will lead the way.

  7. gbaikie says:

    ‘If global temperatures do not cool from now-next few years AGW theory will be stronger then ever. True or not.”

    Lukewarmer AGW will continue to supported by the data.
    But crazy AGW will continue to be wrong, and have a longer and more amusing track record of being hopeless clowns.

    • Laura says:

      A big factor is the identification of a new “problem” for the anti-humans to rally behind. The sooner they do, the sooner they will stop criminalizing the weather.

  8. The North Atlantic and the whole adjacent areas harbors promise for cooler times ahead in my opinion.

    • Laura says:

      From a pro-human perspective, cooling is a very bad thing at least for the next few decades. Humanity is just about able to eliminate absolute poverty. Let’s hope nothing gets in the way of that.

      • I hope the cooling comes the sooner the better to get rid of AGW theory.

      • Gordon Robertson says:

        Laura…”Humanity is just about able to eliminate absolute poverty. Lets hope nothing gets in the way of that”.

        It comes down to intent, Laura. If we humans had the intent we could eliminate poverty tomorrow. We could also stop our abysmal treatment of animals.

        Climate alarmists in the UN have perverted science through AGW as an excuse to fund poorer nations. They refuse to do anything about ruthless dictators and humans who are brain washed by male chauvinist dogma, much of it disguised as religion.

        • Laura says:

          Gordon Robertson says:

          “It comes down to intent, Laura. If we humans had the intent we could eliminate poverty tomorrow.”

          Poverty cannot be eliminated tomorrow.

          The fact is that the intent is forthrightly there, which is the reason why it is happening at all and why the end is near.

          Importantly, however, the obstacles are no longer practical. It comes down to local politics. Consider the governmental policies of many African countries and, of course, North Korea or Venezuela.

          “We could also stop our abysmal treatment of animals.”

          It is unclear what you mean by “abysmal”. There is a lot of fanaticism regularly being put out by alleged “animal rights” groups.

          Having said that, I do not see our relationship with other animals changing significantly in the foreseeable future. In addition to political obstacles, there remain significant practical obstacles.

          • LouMaytrees says:

            Laura, AGW has not helped the US, one of the richer countries, with its poverty problem. 43+ million Americans live below the poverty line with 18+ million living in ‘deep poverty’. With 1/4 of the world living in ‘absolute poverty’ your hopes seem more than impossible, esp when rich countries like the US can’t even find a way to feed their own.

          • Laura says:

            Take a look at the data, LouMaytrees.

            https://ourworldindata.org/

          • LouMaytrees says:

            Laura, so your source is The World Bank and the various United Nations organizations Max Roser uses? Interesting choice. Their claim is that people living on less than $1.90 per day only can qualify as living in ‘extreme poverty’. Ridiculous. No wonder Roser claims poverty is going down, just make the lowest common denominator so miniscule that it makes $2 a day grandiose living.

            By his definition, no one in America lives in poverty, which of course is again, ridiculous.

            So your link still does not explain why 43 million+ plus people in the US, a little more than 1 in 7 people here, live in poverty.

            Also, the World Bank in 2016 spent $16 Billion on fighting climate change.

          • Laura says:

            You misunderstand, LouMaytrees. In order to prove your claim, you must provide data that says people had more yesterday than today.

            And since a single variable can be tortured to mean anything, please do not stop at income. Quality of live implies many things.

            So, for example, you must also provide data that shows that the number of infant deaths is increasing rather than decreasing or that life expectancy is lower rather than higher and so on.

            It is that simple.

      • Nate says:

        “cooling is a very bad thing at least for the next few decades. Humanity is just about able to eliminate absolute poverty.”

        No comprende.

        Given that most of the worlds impoverished countries are in or near the tropics. I don’t see how warming helps them.

    • Nate says:

      Wind and solar: their energy and jobs they produce are one way to avoid poverty.

      • JDHuffman says:

        Anonymous Nate likes killing birds.

        What other animals do you like to destroy, nameless Nate?

        • David Appell says:

          “[This] study estimates that wind farms and nuclear power stations are responsible each for between 0.3 and 0.4 fatalities per gigawatt-hour (GWh) of electricity while fossil fueled power stations are responsible for about 5.2 fatalities per GWh. Within the uncertainties of the data used, the estimate means that wind farms killed approximately 20,000 birds in the United States in 2009 but nuclear plants killed about 330,000 and fossil fueled power plants more than 14 million.”

          “The avian benefits of wind energy: A 2009 update”
          Benjamin K.Sovacool
          https://doi.org/10.1016/j.renene.2012.01.074

          • JDHuffman says:

            David Appeal, keep believing.

            Beliefs are easier than facts.

          • Bart says:

            A) Hand waving estimates with no solid data

            B) The usual ploy of lumping all birds together, and ignoring the wind farms’ particular devastation of rare, slowly breeding, and ecologically critical raptors and carrion fowl, not to mention insect controlling bats

          • Nate says:

            ‘A) Hand waving estimates with no solid data’

            As expected, all unsupportive data is unreliable..

          • Bart says:

            No, but all unreliable data are unsupportive.

            Sorry. You can’t just make up numbers and expect me to buy them.

          • Svante says:

            I bet many of those killed raptors suffered from lead poisoning, from lead ammunition and fishing tackle.
            https://tinyurl.com/y8dk4w7v

          • Bart says:

            Tell that to this guy:

            https://tinyurl.com/yd6zu6td

          • Svante says:

            Hand it in for analysis and find out. Lead poisoning is common among birds of prey, it makes them fly badly and affects their eyesight etc.

          • Bart says:

            Wow…

          • Svante says:

            Yeah, your picture shows a Red Kite killed in Navarre. Here’s a study from the Pyrenees:
            https://tinyurl.com/y79j9zlw

            Highlights:

            – 8 Years of surveillance of avian scavengers in the pyrenean mountains in France (2005–2012).

            – 170 Birds of prey collected, necropsied and analyzed systematically for pesticides (insecticides), trace elements (Pb, Cd) and rodenticides.

            – Acute poisoning accounted for 24% of all mortality events.

            – Lead poisoning was recorded in several birds.

            – There was an association between the presence of lead shots in the carcasse and increased liver and kidney Pb concentrations.


            – There was also a significant positive association between collision/electrocution/trauma and higher levels of lead in the liver or kidney.

            – Isotopic analysis confirmed that lead originated from lead shots.

            “Lead isotopic signature could be associated primarily with ammunition. Last, a positive association between trauma and lead contamination was detected, indicating that lead could be a significant contributor to different causes of death. These results urge for severe restrictions on the use of lead ammunition to prevent scavengers from detrimental exposure.”

            Of course there are other types of poising as well.

          • Bart says:

            Oh, for crying out loud. Look more closely at the picture. See those structures in the background, and the base of one reeaal close?

          • Svante says:

            You misunderstand. They collide because their brains don’t work.

            They have put trackers on birds, and they fly lower, slower and shorter in correlation with lead levels.

          • Bart says:

            Standard MO – let’s think of a relationship we’d like to be true, then seek out some data which appear consistent with it, and proclaim it truth.

            That’s how the war on fat was born, which led directly to the obesity epidemic.

            And, it wouldn’t change the final instrument of death in any case.

          • Svante says:

            That’s exactly what you did, you thought of a relationship that you would like to be true.

            Learn a bit more, some fat is good for you and some will clog your veins.

          • Nate says:

            ‘Standard MO’

            Any science that goes against Barts narratives must be labeled, smeared, maligned, unreliable, many things. Just never correct.

            Very convenient.

          • Svante says:

            It’s the wrong mindset:
            -There’s a problem, we must give up.
            Vs
            -There’s a problem, let’s solve it.

            Raptor lead poisoning is just one of those things to fix.

          • Bart says:

            Classic red herring.

        • Drewski says:

          Ordinary house and building windows kill tens ot thousands times more birds than wind farms.

          • Bart says:

            Not the same birds. Small, rapidly reproducing, and plentiful songbirds are not endangered.

          • Nate says:

            As expected, goal posts moved, issues narrowed, as needed, to support the narrative.

            Meanwhile deleterious effects of FF always negligible.

            Green energy simply must be a net negative, relative to FF, says the FF propaganda minister.

          • Bart says:

            The one moving the goal posts is you. It has always been about the rare and endangered birds that are threatened by the windmills.

          • Nate says:

            Meanwhile deleterious effects of FF are always negligible.

          • Nate says:

            ‘ Hand waving estimates with no solid data

            Bart, the data for birds killed by wind turbines are also estimates.

            But you find these data are reliable enough for you.

          • Bart says:

            Honest estimates based on tangible evidence are better than agenda driven ones based on speculation, yes.

          • Nate says:

            ‘agenda driven ones based on speculation, yes.’

            Which ones agenda driven, which not?

            Why are only the studies that counter your narrative agenda-driven?

            Bart, you wear your biases like a tattoo on your forehead. You might consider laser removal..

          • Bart says:

            And, you will cling to the tiniest shred to assert your version of reality against concrete and overwhelming evidence to the contrary.

      • Gordon Robertson says:

        nate…”Wind and solar: their energy and jobs they produce are one way to avoid poverty”.

        Poverty is a complex issue, it is not about supplying jobs and handing out money.

        In the Northern Hemisphere, especially in the northern part of North America and northern Europe, we have an ambition that drives us to succeed. Not all people have that ambition and begin life behind the 8-ball. We also have capitalist idiots who thrive on maximizing profits, which translates to underpaying workers. There is one running the US at the moment.

        What makes you think that the green industry will treat workers any differently than present capitalists?

        In Africa, and similar countries, ambition is not a concept they understand. Their lives are fraught with customs and cultural nonsense based on male chauvinism. You need to take care of that ignorance before the question of poverty can be realistically addressed.

        We have the same issues here in Canada with our aboriginal peoples. Their cultural beliefs and male chauvinist leaders have them thinking in terms of 13th century England. Poverty is rampant, and rather thabn changing their world views, they mire themselves in ancient cultural beliefs and whine about their plight.

        • David Appell says:

          And here Gordon’s racism comes out front and center.

          I’m not surprised, really. In my experience, every pure denier I’ve ever come across eventually reveals themself to be lousy human being.

          • JDHuffman says:

            David Appeal, not that your opinion affects your perceptions of reality, huh?

          • Nate says:

            JD

            Insults like Ger*an

            Talks like Ger*an

            Annoys like Ger*an

            Just as dumb as Ger*an

            reminds me of that old joke about poo. (Sure glad I didnt step in it)

            Must be Ger*an.

          • JDHuffman says:

            Anonymous Nate, you sure talk big for someone anonymous.

            Do you find that people laugh at you in real life?

      • Nate says:

        I dunno.

        But watching amazing Planet Earth 2 series,

        https://www.bbcearth.com/planetearth2/

        The planet has so many incredible and weird creatures, especially in the ocean.

        To paraphrase David Attenborough, I hope we don’t F it up.

      • Nate says:

        Poverty is all cultural–right–just ask North/South Koreans.

  9. Tim says:

    Absolutely fantastic across in the UK, reminds me so much of 1976 when we had a fantastic summers. Bring on the global cooling, warm summers and cold winters.

  10. RW says:

    Thanks for the report, Roy.

  11. La Pangolina says:

    JDHuffman says:
    July 1, 2018 at 7:18 PM

    A surface, with area of 1 m^2 and receiving 960 Watts/m^2, would have an equilibrium temperature of about 88 C, as described here:

    http://www.drroyspencer.com/2018/06/antarctic-ice-sheet-collapses-nobel-prizes-and-the-psychology-of-catastrophism/#comment-309963

    Now, divide the surface into 4 equal parts. In your pseudoscience, you now have to divide the flux by 4. So you have 240 Watts/m^2, producing an equilibrium temperature of 255K = -18 C.

    That is the nonsense you have swallowed, and now you must attack me for educating you.

    Why would I attack you? What would that be for, Huffman?

    You seem very inhabited by the notion that we all do pseudoscience and have to divide your wonderful 960 W/m^2 by 4.

    But we do not divide anything by 4, Huffman.

    And above all, you should not use a flat blackbody but a half sphere instead, where the radiant flux densities are integrated using a cosine weighting scheme.

    *

    Please read for example both Arthur P. Smith (American Physical Society), see

    https://arxiv.org/abs/0802.4324

    and his main contradictor, ret. prof. Gerhard Kramm (formerly at U Fairbanks, AK), see

    https://arxiv.org/abs/0904.2767

    Though skeptic hardliner Kramm criticised GHE fan Smith in many points, both share a lot of views based on a common acceptance of

    An Introduction to Atmospheric Radiation, second edition by K.N. Liou (2002)

    *

    The energy balance at Earth’s surface in the very simple case of a non-rotating Earth with a non-absorbing atmosphere (as proposed by Gerlich & Tscheuchner) requests Sun’s incoming radiant energy be equal to Earth’s outgoing radiant energy.

    The incoming radiant energy E-in is calculated by integrating the radiant flux densities over Earth’s sunlit half; the outgoing radiant energy E-out is calculated using the S-B law over the entire sphere, as Earth does not radiate only out of its sunlit half.

    E-in = π * R-Earth^2 * S * (1 − a)
    E-out = 4 * π * R-Earth^2 * σ * e * T-Earth^4

    As E-in is here equal to E-out, we have

    π * R-Earth^2 * S * (1 − a) = 4 * π * R-Earth^2 * σ * e * T-Earth^4

    S is solar constant, σ is the S-B constant, a is albedo (0.3), e is emissivity (here 1).

    You see that we can eliminate ‘π * R-Earth^2’ on both sides, obtaining

    S * (1 − a) = σ * T-Earth^4

    Thus I repeat: you have

    1370 * (1 − 0.3) = 4 * 5.67 * 10^-8 * T-earth^4
    960 = 4 * 5.67 * 10^-8 * T-earth^4

    T-earth = 4th-root-of((10^8 * 960) / 4 * 5.67) = 255 K

    I kept this time the ‘960 W/m^2’ alive till end to make clear that the ‘4’ arises from ‘4 * π * R-Earth^2’ and is not an arbitrarily chosen division factor as you pretend.

    • JDHuffman says:

      La Pangolina, another off-topic, disjointed, rambling comment, to seemingly prove your fascination with pseudoscience.

      If you had a valid point, you should be able to present it in 50 coherent words or less, no?

      • Norman says:

        JDHuffman

        Yes indeed Nate has you figured out. You are another sock puppet of the most annoying troll I have encountered. Ger*an! He/She used pseudoscience in nearly every post, used clowns often but the key is the “50 coherent words or less, no?” The only time I ever saw this on this blog was from the disruptive troll. You are identical in goals. The only word you are currently avoiding is the big giveaway, “hilarious”. I think if you keep posting then “hilarious” will have to be posted by you at some point.

        You never desired to learn science as Ger*an and you still don’t want to learn it as JDHuffman or your other sock puppet JHalpless.

        Good job Nate for uncovering the troll. He/She is back to disrupt.

        • JDHuffman says:

          Norman Grinvalds, why do you not use your full name? Are you ashamed of it? I think it is a cool last name. Of course, it’s not as cool as “Huffman”….

          Yeah, follow anonymous Nate down his dark path, if you choose.

          Reality will always be here, if you can return.

          • Norman says:

            Ger*an (JDHuffman)

            Whatever you say.

          • Norman Grinvalds says:

            Ger*an (J*D*H*u*f*f*m*a*n)

            You are slipping in disguising your identity as the banned poster.

            Here you use this term: “rambling comment”

            You used this same choice of words dozens of times in your previous identity.

            I still think you will mess up can put a “hilarious” in a future post. You are careful now but old habits are hard to change. Now you are guarded. If you keep posting the truth will come out.

            Hilarious!

          • JDHuffman says:

            Grinvalds, you’ve been learning from Mike Flynn, I see. He sets a good example for those that are not comfortable thinking for themselves.

            Start by copying him, until you feel you’re ready to try it on your own.

            Just repeat “Yes I can. Yes I can. Yes I can.”

          • David Appell says:

            Norman, don’t feed the trolls.

          • JDHuffman says:

            Good advice.

            David is already about 70 pounds overweight.

            He certainly doesn’t need anymore to eat.

          • Norman says:

            Ger*an

            I see you are also posting as J Halp-less again on the other thread mixing up the pseudo identity with the JDHuffman creation to get back on the blog and annoy people with disruptive troll tactics and awful physics.

            How many identities do you have on this blog? Are you the goofy “Dr Roys Emergency Moderation Team”?

            Hilarious!

            So anonymous JDHuffman, does the Moon rotate on its axis?

          • JDHuffman says:

            Norman Grinvalds, you forgot to use you full name, again. Why so scared?
            Are you paranoid? Or is it because you can’t get anything right?

            You, Ms Snape, La Pangolina, and Bobdesbond have a great deal in common. None of you seem to ever get it right. But, you just keep entering comments, like there is no tomorrow.

            Are all 4 of you really the same person?

          • Norman says:

            JDHuffman

            Ger*an It is more likely we all get it right and you are the odd ball on the blog that cannot comprehend simple physics even when explained to you.

            So Ger*an. Now that E. Swanson has performed Eli Rabbet’s thought experiment do you still believe the green plate and the blue plate will reach the same temperature? Do you think the photons will just bounce off the blue plate from the green plate? Let us know we are all anticipating your reply.

          • JDHuffman says:

            Norman Grinvalds, you forgot to use your full name again.

            I’m sorry that you miss your instructor, ger*. There is some good news, however. I say him commenting last week, on a major skeptic site. So, he’s still around. If you miss him so much, you should look for him.

            Your attempting to distract obviously means you concede another discussion.

          • Nate says:

            So Ger*an,

            ‘ I say him commenting last week, on a major skeptic site. So, hes still around.’

            You’re fine being anonymous here for years, and elsewhere now, but find it unacceptable here and now.

            Weird.

          • Dr Roys Emergency Moderation Team says:

            Norman and Nate, please stop trolling.

        • Nate says:

          His giving people nicknames was another giveaway.

          50 coherent words or less, no? Good catch, Norman.

          Well then.

          QED

      • La Pangolina says:

        JDHuffman says:
        July 2, 2018 at 9:38 PM

        None of you seem to ever get it right.

        Interesting, Huffman!

        What does let you think that you got it right?

        Some proof that e.g. Arthur P. Smith is wrong?
        Are you able to give us that proof right now right here?

        I’m not sure.

        Because until now you didn’t manage to produce more than redundant antiscience like

        … another off-topic, disjointed, rambling comment, to seemingly prove your fascination with pseudoscience.

        { Please, Huffman!
        Don’t paste your 960/240 blah blah again.
        Zweimal reicht.}

    • David Appell says:

      E_in is distributed over an area of 4*pi*R2 — there’s the factor of 4.

    • Gordon Robertson says:

      binny…”A surface, with area of 1 m^2 and receiving 960 Watts/m^2, would have an equilibrium temperature of about 88 C, as described here:”

      The new thread has barely got going and binny is dragging over alarmist crap from an older thread.

      • La Pangolina says:

        Gordon Robertson says:
        July 2, 2018 at 4:34 PM

        The new thread has barely got going and binny is dragging over alarmist crap from an older thread.

        As usual, Robertson proves he is the dumbest of all pseudoskeptics.

        He isn’t even able to see that what he pasted has been written by… pseudoskeptic Huffman!

        Dumm wie die Nacht.

    • Norman says:

      La Pangolina

      Despite Ger*an’s inability to understand your post and follow the logic, I think you did a great job and would encourage this level of posting to clarify the science.

      The only point Ger*an might be correct on would be that the temperature may not be the 255 K. That depends upon the albedo. I am not sure what a frozen Earth albedo would be. It might be a lot higher than the 0.3 that it is at now (ocean’s absorb a lot of radiant energy and keep the number down, if they are frozen you might have a much higher global albedo and the temperature might be even colder).

      https://upload.wikimedia.org/wikipedia/commons/thumb/1/18/Albedo-e_hg.svg/330px-Albedo-e_hg.svg.png

      • La Pangolina says:

        Norman says:
        July 2, 2018 at 7:51 PM

        I do not think that the difference would be very high.

        We are talking here about a trace gas free atmosphere. No clouds, no water vapor, no carbon dioxide, etc.

        There is thus no water at all, let alone snow or ice. Deserts and naked rocky mountains all around the planet.

        The Moon’s surface albedo is around 0.13, that of Mars is around 0.15.

        Taking such values as a guideline would give an average temperature of about 268 K.

        The presumed warming effect of trace gases would then indeed be reduced by about 40 %. So what!

    • David Appell says:

      LaPag wrote:
      You see that we can eliminate π * R-Earth^2 on both sides, obtaining

      If, after setting E_in=E_out, you check your algebra, you’ll see that the resulting equation should be the same as the one I quoted:

      (1 − a)S/4 = σT_Earth^4

      • La Pangolina says:

        I was sure you wouldn’t understand why I shifted the ‘4’ out of the E-in computation.

        The reason might be that you emit here about 100 times more stuff than you absorb.

    • Bart says:

      This calculation has problems. There is no justification for treating the spatially averaged instantaneous insolation as a constant input. In fact, the average of a half-wave rectified signal is 1/pi of the full amplitude, so it could be argued that you should have

      E-in = 4 * R-Earth^2 * S * (1 − a)

      That would bump up the average temperature to about 270 K, which is 0 C.

      Then, you have the heat capacity of the Earth, which will retain some warmth from one daily cycle to the next, so that would bump up the average effective input a bit as well. The result should obviously be frequency dependent – you’d clearly have a much different reading if the Earth were spinning at 1 RPM versus once per day.

  12. gbaikie says:

    –Laura
    July 2, 2018
    A big factor is the identification of a new problem for the anti-humans to rally behind. The sooner they do, the sooner they will stop criminalizing the weather.–

    I hope they oppose space exploration, because they always lose and lose badly.

  13. Cloudbreak says:

    It has defintely cooled down here. Note that our BOM is putting out false data as they got caught out using instantaneous temperatures rather then averaged temperatures. I would believe Roy’s nos. before Australia’s BOM.

  14. Snape says:

    Laura

    “The number of people employed by Tesla came to 37,543 in 2017. This figure is still considerably lower than that of other vehicle manufacturers: General Motors employed around 213,000 people in 2012. The California-headquartered automaker manufactures and sells electric cars, electric vehicle power train components, energy storage, and solar panel manufacturing”

    • Gordon Robertson says:

      snape…”The number of people employed by Tesla came to 37,543 in 2017″.

      What kind of wages and benefits do they offer? I am visualizing hippies working for the minimum wages, wearing Earth shoes and sporting pony tails while flashing the peace sign intermittently with glazed eyes.

      Has anyone considered the impact on the environment of batteries spewing sulphuric acid onto road surface when batteries explode during a head on crash?

    • Nate says:

      ‘people employed by Tesla came to 37,543’ How many cars we talking?

      Context??

  15. Simple terms

    If the temperatures continue to rise now through the next few years David, will have a very good case.

    If the temperatures fall now moving forward I will have a very good case.

    • Richard M says:

      Salvatore, you are thinking that one of you is right. Sadly, I suspect both of you are wrong.

      It’s not the sun or CO2. It is ocean cycles which have the biggest impact on climate. Now, some of the ocean changes are driven by the sun but many of them are Earthly. CO2 does have a small effect, but it doesn’t control the climate.

      If you read Thirumalai et al 2018 you will see how closely the ocean SSTs match historic temperature cycles. The atmosphere’s temperature is primarily driven by the ocean SSTs.

      It is unlikely the ocean cycles will turn to strong cooling for another 5-7 years (assuming a ~60 year AMO). However, the global temperature should not rise either. The pause will lengthen and this alone destroys climate models and AGW.

      • David Appell says:

        The 60-yr trend for NO.AA global mean surface temperature is +0.15 C/decade.

        If 60-yr ocean cycles control temperature, should that trend be near zero?

        • Richard M says:

          The 60 year cycle affects the relative temperature (Akasofu nailed it). You also need to factor in the millennial cycle which has been warming the SSTs for 400 years. You can clearly see it in Thirumalai et al 2018.

          Add that to the questionable data adjustments and what you have is still a rising temperature, just not as much as David wants to believe.

          The HadSST data is much better and it shows only .08 C/ decade (1954-2014). The question you should be asking is why your surface data is so bad.

          • David Appell says:

            “1954” sounds weirdly arbitrary, viz. cherry picked.

            What is questionable about the data adjustments?

            * they reduce the long-term warming trend.

            * last UAH’s adjustments were about 3 times larger than last NOAA adjustments.

            I think you use adjustments as an excuse.

            And I don’t think you have any evidence that SST increases are due to any natural factors.

            Happy to be proven wrong, though.

          • David Appell says:

            Richard M says:
            The 60 year cycle affects the relative temperature (Akasofu nailed it). You also need to factor in the millennial cycle which has been warming the SSTs for 400 years. You can clearly see it in Thirumalai et al 2018.

            Where is that heat coming from?

          • Svante says:

            The AMO is +/- 0.15 C on the global scale.

            https://tinyurl.com/yb8ubyca

          • La Pangolina says:

            Richard M says:
            July 2, 2018 at 6:56 PM

            The question you should be asking is why your surface data is so bad.

            It seems to me that for you, data is automatically bad if it shows a higher trend than you expect.

            Why did you stop HadSST in 2014?

            Which HadSST did you choose?

            NOAA ocean 1954-2018: 0.11 ± 0.002 °C / decade
            HadSST3 1954-2018: 0.10 ± 0.002 °C / decade

          • Richard M says:

            La P, why would you include the big El Nino noise from 2014-2018 when it has already dissipated?

            http://www.woodfortrees.org/plot/hadsst3gl/from:2013.57/to

          • Richard M says:

            David asks: “Where is that heat coming from?”

            The heat is coming from the sun. Here’s a little experiment for you.

            Fill two identical pots with an identical amount of water at exactly the same temperature. Hold a blow torch over one for 10 minutes and the other one for 15 minutes. Which one is warmer?

            Of course, you already know the answer.

            The millennial cycle is driven by changes in the speed of the MOC.

      • ren says:

        Richard M some phenomena are related to each other. For example, the Humboldt current temperature may be related to the ice condition in Antarctica and the melting rate of the ice.
        https://www.tropicaltidbits.com/analysis/ocean/nino12.png

  16. Darwin Wyatt says:

    I’m more concerned CO2 long term causes ice ages than warming.

    • David Appell says:

      How would CO2 cause an ice age?

    • Richard M says:

      Darwin, more CO2 leads to warmer nights and winters along with cooler days and summers. The net effect is very small. However, it will have a moderation effect on higher latitudes which should reduce the chances for re-glaciation.

        • Richard M says:

          David, one wonders why you wouldn’t already know this.

          https://wattsupwiththat.files.wordpress.com/2018/05/clip_image016.png

          • David Appell says:

            I don’t know that because I don’t pay attention to dumb deniers who people like you believe every time they throw up a graph about…anything.

            Got any real science, i.e. peer reviewed journals or databases maintained by real science organizations, not people who take money from the Heartland Institute?

          • Bobdesbond says:

            Where is the description of the data used?
            What is meant by ‘warmest month’? Why is only one month used?
            Why only 1067 stations, and what methodology was used in choosing them?
            Were the stations merely averaged, giving a bias to urban areas, or were they given an area-weighting, as is done by NOAA, NASA, etc?
            If it really is global data, why are the minimum temperatures higher than the global average temperature of 15 degrees?

            I suspect your answer will be that you don’t care, because you have no interest in risking spoiling your message by digging too deeply.

          • La Pangolina says:

            Bobdesbond says:
            July 3, 2018 at 6:27 AM

            Why only 1067 stations, and what methodology was used in choosing them?

            Des, when you see such a strange picture and don’t know where it comes from, the best is to let Google search for a web site containing the picture’s link address.

            https://wattsupwiththat.com/2018/05/02/giss-global-land-ocean-temperature-index-vs-ghcn/

            It is located within one of the worst guest posts at WUWT, written by a guy called Mark Fife.

            He doesn’t have a bit of a clue of how to evaluate GHCN station data.

            The guest post evidently restricts his ‘arguments’ to the USA.

            And yes Des: GHCN daily has data coming from many more US stations than Fife has presented.

          • Svante says:

            The graph shows reduced diurnal range, evidence of an enhanced GHE.

          • Dr Roys Emergency Moderation Team says:

            David, please stop trolling.

          • Richard M says:

            It says right on the graph where the data comes from. While I’m not a fan of GCHN surface data it is all we have for looking at high temperatures vs. low temperatures.

            The reason for the reduced number of stations is that it only uses ones with 100 years of data.

            As usual we see David’s typical response …. denial.

          • Richard M says:

            Svante, that was what I said in my comment.

            “more CO2 leads to …”

            LOL.

  17. Eben says:

    For the last ten thousand years the CO2 and temperature went in the completely opposite directions ,
    but this time is different , this time CO2 will cause something it didn’t cause before.

    https://goo.gl/pPBUHx

    • JDHuffman says:

      It will cause more hot bikini-clad chicks in my backyard?

      Thanks for the warning….

    • David Appell says:

      Eben says:
      For the last ten thousand years the CO2 and temperature went in the completely opposite directions

      What data show that?

      • Eben says:

        You can’t find Holocene CO2 charts ?
        You don’t have them already ?
        You don’t have the Holocene temperatures
        What kind of climate scientist are you ?

        • David Appell says:

          CO2 and temperature both increased from the last glacial maximum to the Holocene. They didn’t move in “completely opposite directions.”

          • Eben says:

            Nice try spinning the subject but yes

            “CO2 and temperature both increased from the last glacial maximum to the Holocene”

            And you do not know that the temperature raise was long before the CO2 rise and and CO2 followed and the cause is completely backwards ?

            Dude I have one advice for you – stop embarrassing yourself with idiotic statements like this.

          • David Appell says:

            “Global warming preceded by increasing carbon dioxide concentrations during the last deglaciation,” Jeremy D. Shakun et al, Nature 484, 4954 (05 April 2012).
            http://www.nature.com/nature/journal/v484/n7392/full/nature10915.html

          • Eben says:

            I have charts showing temperatures changes lead CO2 changes , you have nothing,
            https://goo.gl/wHJ7L9

          • David Appell says:

            Nothing? I just gave you a paper from one of the most prestigious journals in the world.

            You gave…and uncited, unsourced graph published on a site no one has ever heard of.

          • crakar24 says:

            DA,

            You provide a link to an abstract, stop wasting my time.

          • La Pangolina says:

            crakar24 says:
            July 2, 2018 at 9:43 PM

            You provide a link to an abstract, stop wasting my time.

            I guess you needed more time to write that than I did to find

            http://www.atm.damtp.cam.ac.uk/mcintyre/shakun-co2-temp-lag-nat12.pdf

            by pasting the title in Google’s search window.

          • Nate says:

            Eben,

            Re: CO2 lags temp. I don’t get your point.

            In effect, you are showing lots of examples of chickens causing eggs.

            That somehow proves eggs can’t cause chickens?

            We know that the primary driver of ice-ages is orbital changes.

            And of course CO2 levels are sensitive to temperature (ie pressure in soda bottles left in a hot car).

            Both true, but does not preclude an unprecedented CO2 rise from causing warming, by a different mechanism, GHE.

  18. Snape says:

    Huffman has a rather bizarre misconception. He believes that if one side or portion of an object receives a particular radiant flux, then that value should be applied to the object’s entire surface area.

    Me: “Imagine a one meter high cube, where one side absorbs 960 w/m^2 and the other five sides get nothing.
    How much power per unit surface area (in watts/m^2) is absorbed by the cube?”

    JDHuffman
    July 2, 2018
    “Yes, Ms Snape, you are definitely struggling.

    How much Watts/m^2 does it absorb if it absorbs 960 Watts/m^2?

    How about 960 Watts/m^2!!!

    (Possibly you had the same math and physics classes Bobdesbond had. He cant get anything right either.)”

    *****

    He apparently does not see a difference between one side absorbing 960 w/m^2 and SIX sides absorbing that amount.

    *******

    BTW, the argument began with this nonsensical comment:

    “JDHuffman
    June 29, 2018
    The AGW clowns are out frolicking this morning, I see.

    Theyre reporting Earth only gets 161 Watts/m^2 from the Sun. They must then believe the Sun has a temperature of -42 C! (Thats the corresponding S/B temperature.)”

  19. Eben says:

    “one meter high cube” is a good analogy – if you live in Bizarro World

  20. gbaikie says:

    David Appell
    July 2, 2018
    Who is they?

    Exactly my point. They need funding to have their voices heard.

  21. gbaikie says:

    They think humans are a plague.
    Some want to be dolphins.

  22. David Appell says:

    “A place in Oman recorded the highest night temperature in the world,” Times of Oman, Jul 1, 2018

    http://timesofoman.com/article/137337/TimesTV/Oman/Videos/A-place-in-Oman-recorded-the-highest-night-temperature-in-the-world

  23. Mike Flynn says:

    All the argy-bargy is a bit pointless, isn’t it?

    Nobody is able to actually describe the wondrous GHE, so pointing out facts of any nature in support of the indescribable GHE is an exercise in futility!

    Meanwhile, no doubt the universe is unfolding as it should.

    Cheers.

  24. Drewski says:

    401 straight months of warmer-than-average temperatures (based on 20th century averages).

    The odds of that happenening NATURALLY are greater than winning lotto every week for yor 10 years.

  25. crakar24 says:

    DA states

    Gordon Robertson says:
    DACO2 didnt suddenly stop being a GHG in February 2016.
    How do you explain 2 1/4 years of gradual cooling?

    Back-to-back weak La Ninas, mostly.

    Why do you think natural variations disappear in an AGW-world?

    So DA thinks two weak la ninas is all it takes to knock the stuffing out of CO2 induced AGW but yet simultaneously claims CO2 will drive temps so high we are doomed doomed i tells ya.

    What a joke you are DA

  26. barry says:

    Salvatore,

    I remind you of your prediction, and of the force you put behind it.

    “I still say according to satellite data global temperatures by next summer [2018] will be at or below 30 year means. 1980-2010.”

    http://www.drroyspencer.com/2017/08/uah-global-temperature-update-for-july-2017-0-28-deg-c/#comment-258853

    And this was your commitment.

    “If solar stays low and year 2018 is not the year I will say this time I am wrong.”

    I said I would hold you to that, Salvatore, and you agreed to be held to it.

    I am now seeing you post that we will have to wait even longer.

    I held you to this prediction and your commitment to it because David keeps posting old predictions of yours that didn’t turn out and I was willing to accept that the conditions had not been right, and give you another chance.

    I hope you are not backing out of the commitment you gave.

    “If solar stays low and year 2018 is not the year I will say this time I am wrong.”

    • Barry you must understand if the global temperatures rise from this point in time on I will say I am wrong.

      If they keep trending down as they are I am going to say I am correct.

    • barry says:

      You said that if

      “according to satellite data global temperatures by next summer [2018] will be at or below 30 year means. 1980-2010.”

      failed to occur, you would say you were wrong.

      You have verified it this specific position a few times when I’ve asked you to re-confirm in the last year.

      I will hold you to this statement, not some other.

      • Midas says:

        Waiting for the deniers to complain that you can’t just pick the start of your graph at the low point, after doing exactly the same in reverse to “prove” that the climate had cooled from 2016 to 2018.

        (Of course, unlike them your graph is not an attempt to make a statement about climate change, but is merely proving this person’s claim to be nonsense.)

  27. gbaikie says:

    What maintains Earth average temperature is the surface of the ocean and surface of the lands temperature.

    Earth is 70% ocean surface and it’s average temperature is about 17 C [62.6 F].

    If instead of average temperature, were earth ocean temperature to have a uniform temperature of 17 C, Earth land temperatures would be much warmer than the they are currently, and currently, the average temperature land temperature is about 10 C [50 F].

    If Earth ocean surface had uniform temperature of 17, the tropical ocean would not be the heat engine of the world. Or the tropical ocean is the world’s heat engine because it has a much higher temperature than 17 C. The average tropical ocean surface is about about 26 C. And tropical ocean is about 40% of surface area of entire ocean, and due to tropical being a significant fraction of entire ocean is increases the average temperature of entire ocean.
    Or if exclude the tropical ocean increase the average, the rest of ocean average is about 11 C.

    To increase or decrease the average ocean surface temperature, one is mostly talking about increasing the 60% of the ocean which is not tropical waters. So if these waters average surface temperatures decrease or increase by 1 C, this would have large effect upon average land temperature. And would be making a more uniform ocean temperature.

    What controls the surface temperature of ocean outside the tropics, is the average volume temperature of the entire ocean, which has average temperature of 3.5 C.

    Also if entire volume temperature of ocean was a uniform temperature [excluding the top surface of ocean] of 3.5 C that would cause an increase the surface water temperature outside of the tropics. But if include the surface water and uniform temperature of entire was 3.5 C, that crash global average temperature [until such time as surface waters warmed back up- which could take months].
    But the ocean having volume average temperature of 3.5 C has little effect upon average surface temperatures of tropics, or it’s large effect is upon waters outside of the tropics, not the tropics.
    What does effect tropical ocean temperatures is the temperature of the tens of meters of warm water near the surface, rather temperature of water say 1000 meters below the surface. And tropics has about 100 to 200 meters slab of warmed water, and this warmed surface water is mostly relate to how much tropics is capable of warming the rest of the world rather than merely keeping tropics warm.

    So one could say the amount or way that ocean water is mixed is important factor related to global average temperature.

    • I say it is the overall oceanic surface waters that influence the climate and it is the sun which determines those surface oceanic temperatures.

      Already the cooling of the surface ocean waters has been underway if one looks over the past 12 months and I expect this to continue.

  28. gbaikie says:

    “Salvatore Del Prete
    July 3, 2018
    I say it is the overall oceanic surface waters that influence the climate and it is the sun which determines those surface oceanic temperatures.”

    I would say is a the overall oceanic surface water, make the global average temperature.
    The entire volume of ocean average temperature, determines global climate, and determines overall oceanic surface temperature and having this average temperature be about 3.5 C makes Earth be in a icebox climate.
    If this average increases from 3.5 C to more than 5 C, then Earth climate could move out of icebox climate. Also if decreases to below 3 C, it could begin to enter a glacial period of our icebox climate.

    • Your wrong GBAIKIE and the historical climatic record proves it. Climate changes are much faster and abrupt then what your process calls for which is slow and ever so gradual.

      • gbaikie says:

        “Your wrong GBAIKIE and the historical climatic record proves it. Climate changes are much faster and abrupt then what your process calls for which is slow and ever so gradual.”

        Where have said the ocean surface temperature can’t change fast.
        It occurs monthly, yearly and over decades

        If ocean volume average temperature was cooler than 3.5 C, one has a greater potential for faster cooling of ocean surface, if warmer than 3.5 C one could have higher potential of warming ocean surface temperature and less potential of cooling the surface ocean temperature.

        I believe there has been thermal expansion of ocean over last couple centuries, or average volume of ocean has warmed by tenths of degree, or obviously less than 0.5 C and more than 0.0, maybe about .1 to .2 C.
        If that as much as .2 C of added ocean heat, is that going stop it from getting colder- yes to some extent, but average land temperature might drop by .5 C or more.
        But that is weather or global temperature variation
        And something even possible if the ocean [volume and/or surface] is warming.

        In high latitudes the average global land temperatures lowering by .5 could be more than 1 C [or more] lowering of average temperatures in high latitudes- would be not good for farming [bad winter, and/or spring weather].

        But if want a global change in temperature [not just yearly fluctuation of global temperature] one will have something which lower the temperature of average volume temperature of ocean.

        That is needed to have warmer average global temperature or colder average global temperature.

        Or basically a lowering of sea levels will indicate we going to get colder, and rising sea level indicate future warming.
        Sea levels have risen 7 inches over the last hundred years with about 2″ of that from from a warmer ocean.

        Anyhow, I don’t think we have stopped the recovery from the Little ice age- we have had a pause, and likely to have more pauses [or return to The Pause]. We could get what we had in 1970’s, and this time, it might even continue, but so far no evidence of it. But even if return to condition which could have an ice age scare, we are now, further from Little ice Age and need much more than what occurred in 70’s before saying we are anywhere close to returning to something close to resembling conditions of LIA.

        A volcano or two might be helpful, but so far no volcanos, and current conditions not as cold and when there were some big volcanos.
        And no other major events, to note.
        It seems we should get something weird, reported, that is something providing some clue.

        And we still can’t predict what the sun will do.
        We presently got a streak of 6 spotless, are we going to have 50 days streak?
        Seems possible, maybe even 100 day streak. Or say 100 days in total for rest of year?
        Or can we exceed the 260 days of 2009, this year?
        If combine 2018 and 2019 are going to get more than 300 or 400 spotless days?

        You have theory, not proven yet, warmist have theory not proven and will not be.
        And I am quite happy if the world warms, but without a volcano, or something, I think it would be hard to find rapid global cooling in the historical climatic record.
        Or land cools ocean, but it seems to take a while.

  29. gbaikie says:

    “Already the cooling of the surface ocean waters has been underway if one looks over the past 12 months and I expect this to continue.”

    I think, you have to explain, why we recently got a “super” El Nino – why got in it “the beginning” of solar min that is expected to last a while.

    Or what do expect to happen in regards to El Nino (which are one part of the tropical heat engine of the world).

    • I can’t predict ENSO gbaikie.

      What I can predict is when solar is very weak I think overall oceanic temperatures fall.

      • gbaikie says:

        Well, I believe a small drop in ocean surface temperatures will have significant effect [will be measurable].
        And perhaps exceeds any warming effect from higher levels of CO2.
        And would be quite significant if the lower solar activity can be measured [unlike the effects of CO2].

    • Bobdesbond says:

      El Nino is NOT a “heat engine”. It does not produce heat. It redistributes already present ocean heat over a greater ocean surface area, making it more accessible to the atmosphere.

  30. https://www.tropicaltidbits.com/analysis/ocean/natlssta.png

    N. Atlantic is a big climatic factor. See how fast it changed. In addition how do you explain Dansgaard Oeschger events,the YD, the 8200 cold event, the cold Dark Ages, the sudden start and end of the Little Ice Age, to name a few.

    The climate when it changes does it fast not slow and gradual. Look at the Ice Core data if you do not believe it.

    ENSO is a natural climatic factor which varies from El Nino to La Nina. Transient in nature will not change the climate to much or for to long.

  31. http://users.clas.ufl.edu/rrusso/gly6932/Steffensen_etal_Science08.pdf

    How do you reconcile slow gradual climate change because of the oceans being so vast and so slow to change with the reality ?

  32. La Pangolina says:

    Cloudbreak says:
    July 2, 2018 at 4:04 PM

    It has defintely cooled down here. Note that our BOM is putting out false data as they got caught out using instantaneous temperatures rather then averaged temperatures. I would believe Roys nos. before Australias BOM.

    http://4gp.me/bbtc/1530653339748.jpg

    All GHCN V3 AUS data comes from BOM.

    Linear estimates in °C / decade for 1979-2018:
    – GHCN V3 AUS: 0.20 ± 0.02
    – UAH6.0 TLT AUS: 0.18 ± 0.02

    Feel free to look in the chart at all months where UAH’s anomaly was good above that of the surface.

  33. gbaikie says:

    “N. Atlantic is a big climatic factor. See how fast it changed. In addition how do you explain Dansgaard Oeschger events”

    Yes, N Atlantic is, and particularly for Northern hemp.
    Dansgaard Oeschger events are during glacial periods, rapid warming is possible in glacial periods.
    I imagine it is possible average volume temperature of Ocean during glacial period can vary a fair amount. Does get to 1 C, but leaving, or almost leaving, a glacial “might” get as high as 4 C, though 3 C should be a fairly common high ocean volume average temperature during a glacial period.

  34. Joel says:

    http://www.bom.gov.au/climate/updates/articles/a027.shtml

    Overnight minimums are about average. Daytime maximums are way above average – especially considering the weak La Nina in the last 12 months.

  35. Frank Kenneth Olsen says:

    Hello there. Someone showed me this:
    https://www.carbonbrief.org/major-correction-to-satellite-data-shows-140-faster-warming-since-1998
    What is th most reliable, this or UAH ?
    Regards, Frank

    • Krakatoa says:

      Its difficult to say. RSS does seem to be more in agreement with the Surface station data sets.

      Both satellite sets had a big update in the recent years and needed to do quite large adjustments. Only for UAH this meant that the trend decreased, while in RSS the trend went up. I think this shows that its very difficult to use satellite data to make reliable multi decacal global temperature data set.
      Its definitely very useful, but I don’t think satellite data only should be used as the best and most reliable data we have.

      • I think satellite data is the only dependable data to use. That is what I will use to verify if I am correct or not.

      • Bart says:

        “RSS does seem to be more in agreement with the Surface station data sets.”

        That’s not an accident. RSS and UAH used to be substantially in agreement. Then, RSS got “adjusted”.

        Of course the satellite data are the best and most reliable we have, when dealing with an honest broker. We spent hundreds of millions to put them up there for that very reason. There are no siting issues, and coverage is far, far more extensive. The only logical reason to prefer the surface data is that they are more malleable, and can be fudged to tell the story one wants to tell.

        • barry says:

          Thats not an accident. RSS and UAH used to be substantially in agreement. Then, RSS got “adjusted”.

          UAH used to be much closer to the surface records that to RSS, then UAH was ‘adjusted’ to be significantly cooler.

          So what was your lesson, exactly?

          • Bart says:

            That is actually true. There was a time that I thought RSS was better than UAH, because it matched the CO2 rate of change proxy better. But then, v6 closed the gap with the old RSS, and RSS went off the rails.

            http://woodfortrees.org/plot/esrl-co2/derivative/mean:12/from:1979/plot/uah6/offset:0.6/scale:0.22/plot/rss/offset:0.6/scale:0.22

          • Kristian says:

            I’m sorry, barry, but you’ve got it all wrong.

            The UAHv6 gl TLT curve agrees very well with the surface data that isn’t adjusted to be significantly warmer post 1997.

            UAHv6 looks cooler simply because the others have been adjusted UP, systematically and over time. Not the other way around. UAHv5.6 was simply wrong in that its land portion had a huge upward jump in 2005 where its ocean portion didn’t, and it stayed spuriously elevated like that over the following years. Such an uncoupling of land and ocean data isn’t to be observed in any other dataset, significantly not even in the RSSv4 TLT dataset.

        • barry says:

          Something about “not an accident”?

    • gbaikie says:

      Said:
      “The new data actually shows more warming than has been observed on the surface, though still slightly less than projected in most climate models.”

      It has been a lot less than projected, even including that “revision”

      Or UAH over it’s time period is +0.13 C/decade.
      Which if use per century is 1.3 C per century and most climate projection don’t predict 1.3 C or less per century or even 1.3 increase by 2100.

      Or I think it will be less than 1 C by 2100 or governments want spend tens of trillions to reduce global temperature so less than 2 C rise, and it would less than 2 C, without spending any money to prevent it.
      And all money spent so far has done nothing to reduce global warming- and unlikely trillions of dollars more would do anything.

      If they ever bring up idea of using nuclear energy to reduce CO2, one could imagine they might be vaguely serious about reducing CO2 emission [but they want the opposite].

  36. Frank Marella Olsen says:

    Which means that you think UAH is the most accurate of them ?

  37. The on that is least biased that is what it means.

  38. Krakatoa says:

    In what way are the guys at RSS where Dr. Spencer isn’t.?

    Are you sure you don’t say UAH is the most reliable because it shows the least amount of warning?

    • Krakatoa says:

      In what way are the guys at RSS *biased* where Dr. Spencer isnt.?

    • Bart says:

      UAH provides a better match with the CO2 rate of change proxy. Despite matching in the early part of the record, RSS deviates in the latter part.

      http://woodfortrees.org/plot/esrl-co2/derivative/mean:12/from:1979/plot/uah6/offset:0.6/scale:0.22/plot/rss/offset:0.6/scale:0.22

      RSS used to provide a somewhat better fit with the proxy, before they “adjusted” it into oblivion.

      • barry says:

        Wiggle fixing.

        Lookit. Met Office rocks the rate of the rate of the rate of CO2 change.

        https://tinyurl.com/yd8b5gn7

        I only needed 3 parameters, same as you.

        Lookit: GISS

        https://tinyurl.com/y7utgrcq

        Lookit: RSS

        https://tinyurl.com/ydgpmkqp

        The correlation can easily be explained by minute variation in the annual background CO2 concentration led by the biosphere – on the order of a 10th of a part per million. That’s why you need to gin up the rate of the rate of the rate of CO2 concentration – you won’t get that large-looking annual fluctuation otherwise.

        However, this chart does not explain the annual rise of CO2 an order of magnitude larger than the change in acceleration.

        The source for that is blindingly obvious, but you use this graph to blind yourself.

        When anthro emissions are twice that of the annual increase over time – over decades – then it takes some weird mental contortions to dismiss that as the cause of the rise.

        • Bart says:

          Yes, they are all somewhat affinely similar, as you would expect. But, UAH is the best fit.

          And, you are otherwise just wrong. The match with the surface data goes all the way back to the beginning of MLO records, and includes both the variation and the long term trend. The odds of getting that kind of a match by happenstance are minuscule.

          “When anthro emissions are twice that of the annual increase over time over decades then it takes some weird mental contortions to dismiss that as the cause of the rise.”

          It really doesn’t. For anyone marginally acquainted with the way feedback systems work, it’s pretty unremarkable.

        • Bart says:

          Take a look at emissions versus concentration since 2000. Emissions didn’t stop rising, but temperatures did, and so did the rate of change of the concentration.

          http://oi63.tinypic.com/11gniqg.jpg

        • barry says:

          Yes, they are all somewhat affinely similar, as you would expect. But, UAH is the best fit.

          You’d have to provide some numerical evidence of that rather than an assertion.

          But after scaling and offsetting to normalize you’ve removed any chance to do a proper correlation. As the author of woodfortrees says:

          “…we normalise the signal so it fits cleanly on the same graph. We can still compare the peaks and troughs of the signals, but the relative sizes are meaningless.”

          Take a look at emissions versus concentration since 2000. Emissions didnt stop rising, but temperatures did, and so did the rate of change of the concentration.

          You’re just curve fitting. Just picking whatever parameters help you tell a story.

          Here’s your derivative graph with the period you’ve just selected.

          http://woodfortrees.org/plot/esrl-co2/derivative/mean:12/from:1979/plot/esrl-co2/derivative/mean:12/from:2002/to:2016/trend

          The rate of acceleration increases for the period.

          But these are tiny amounts, easily influenced by ENSO.

          The bulk change has been an increase in emissions over the period, and an increase in concentration. The ratio has been fairly constant, with a little play in it from ENSO interactions and other smaller scale stuff. This is what your derivative graph is tracking.

          For anyone marginally acquainted with the way feedback systems work, its pretty unremarkable.

          There is no way around a fairly stable relationship of increase in the atmos at half the anthro output per annum over time.

          That correlation is excellent, and requires no graph doctoring.

          • Nate says:

            Indeed.

            And given that the ‘natural’ CO2 fluxes must come from the surface, wouldnt surface temp make so much more sense to use rather than LT?

            But then, the ‘match’ shows:

            https://tinyurl.com/y7o9ksde

          • Nate says:

            and of course with unbiased filtering:

            https://tinyurl.com/yathprkj

          • Bart says:

            “That correlation is excellent…”

            It isn’t.

            http://oi63.tinypic.com/11gniqg.jpg

            “But then, the match shows:”

            By that logic, the temperature sets are themselves invalid, as they do not match one another.

            But, they are all roughly affinely similar.

            “and of course with unbiased filtering:”

            This is comparing apples and tennis balls. Your signals are representing a point on the globe and a global average. Those are not 1-1. But, a global spatial average is equivalent to a yearly temporal average.

            You guys are in a tizzy to shut your eyes and ignore the evidence. It won’t work out well for you.

          • Nate says:

            ‘unbiased filtering’, even without, it fails to fit surface data or RSS. Again surface data should be used- LT is not where the natural CO2 sources are.

            In science, if you have a notion, and it doesn’t fit the observations, oh well, you have to move on. You can’t alter and cherry data pick until it fits.

          • Bart says:

            It fits very well. Virtually every nook and cranny. Short term. Long term. It’s a lock. There is no doubt about it.

          • Kristian says:

            Nate says, July 7, 2018 at 10:17 PM:

            In science, if you have a notion, and it doesn’t fit the observations, oh well, you have to move on. You can’t alter and cherry data pick until it fits.

            This is uncannily ironic coming from you, Nate, who openly and insistently defends people who specialise in doing the exact opposite of what you’re describing here, like Richard P. Allan. His notion specifically and conspicuously DOESN’T fit the observations, but does that make him ‘move on’? No, rather he ALTERS the data until it fits with his notion.
            http://oi64.tinypic.com/123pcud.jpg
            http://oi66.tinypic.com/29qcu4o.jpg
            http://oi65.tinypic.com/2z5omm9.jpg

            But as long as you’re bowing to the reigning climate paradigm of the day (model before observation), this is of course still counted as “good science”.

          • Nate says:

            K,

            I don’t know you closely followed the Bart CO2 saga.

            Allen and Loeb: ‘rather he ALTERS the data until it fits with his notion.’

            Its not even clear a-priori what their expectation for OLR is?

            I think your are referring to what you are doing.

            In contrast you have a very clear belief about what OLR should do.

            It should accurately track LT temperature.

            And you made adjustments to achieve this result. Then, afterwards you’ve worked hard to justify these adjustments.

          • Nate says:

            Bart responds to criticism of his methods and conclusions with:

            ‘Its a lock. There is no doubt about it.’

            Kristian titles his article:

            ‘Verifying my near-global 1985-2017 OLR record–It appears I was right:>–33y TLT→OLR connection confirmed!’

            Guys, this is just not how scientists describe their results. Real scientists are never so certain.

          • Kristian says:

            Nate says, July 8, 2018 at 7:37 PM:

            Allen and Loeb: ‘rather he ALTERS the data until it fits with his notion.’

            No, not Loeb. Allan. Loeb’s part in this paper was to ensure that the CERES data was handled properly and that the 1999-2000 calibration offset agreed with his findings from 2012 (Loeb et al., 2012). It was, and it did. Loeb never had a hand in the production and validation of the ERBS dataset. This simple yet crucial point continually seems to elude you.

            Allan et al., 2014, don’t have ANY members – old or new – of the ERBS team on their list of contributors. And they clearly didn’t consult any of them either; there is no mention whatsoever in the acknowledgements. One that IS prominently acknowledged as an advisor, however, is none other than Kevin Trenberth. Go figure!

            The new ERBS Ed4 dataset (Shrestha et al., 2017) is out, and it does NOT agree with Allan et al., 2014, Nate. There is NO 1993-1994 adjustment (below). Already Wielicki et al., 2002b, concluded that Trenberth’s concern about the ERBS Ed2 1993 data gap was unwarranted, and when Wong et al., 2006, heavily corrected the data to produce the ERBS Ed3_Rev1 dataset, it was found that the problem with Ed2 specifically did NOT involve the 1993 data gap. I discussed all this at length in my blog post, Nate. It very much looks like you haven’t really read that section at all.

            ERBS Ed4 (2017) vs. Ed3_Rev1 (2006), near-global:
            http://oi65.tinypic.com/2nqs2de.jpg

            ERBS Ed4 vs. Ed3_Rev1, tropics:
            http://oi63.tinypic.com/sq13du.jpg

            Calibrated ERBS Ed4 + CERES EBAF Ed4 vs. my calibrated record (ERBS Ed3_Rev + CERES EBAF Ed4), tropics:
            http://oi67.tinypic.com/34g0g9h.jpg

            (Watch how they raise the ERBS data by 3.47 W/m^2 to create the appropriate calibration offset. And how their result fits perfectly with mine!)

            Its not even clear a-priori what their expectation for OLR is?

            Yes, it is. It’s in their MODEL, Nate. They go by their own model and expect it – a priori – to be correct (since, according to themselves, it is so “realistic”, after all), thereby ending up adjusting the observational DATA to fit with the model rather than the other way around, which would be the SCIENTIFIC thing to do, as you yourself pointed out above.

            How bloody hard is this, Nate!?

            I think your are referring to what you are doing.

            In contrast you have a very clear belief about what OLR should do.

            Nate, are you really this slow?

            My “belief” about what OLR should do is BASED ON THE AVAILABLE OBSERVATIONAL EVIDENCE!!!!

            I look at the data and THEN I conclude. As opposed to you “CO2 heads”, who first conclude that more CO2 must and will create warming by reducing the OLR at any given T_s/T_tropo, and then, when the observational data doesn’t agree with your idea, you change the DATA, to make it agree with your idea, rather than change your IDEA to make it agree with what the data shows.

            That last part is called the SCIENTIFIC METHOD, by the way.

            It should accurately track LT temperature.

            It DOES accurately track LT temperature over time, Nate. That is what the DATA shows. And it makes perfect sense. IF there’s no “enhanced GHE” in effective operation in the Earth system. If everything is just working normally, in accordance with the null hypothesis. And you (and Allan et al., and Trenberth) clearly see this as a big problem. Because it IS. So you feel the need to change the data … Temps are adjusted UP. And OLR is adjusted DOWN. To make it all conform to the “AGW” narrative.

            And you made adjustments to achieve this result. Then, afterwards you’ve worked hard to justify these adjustments.

            What!!?? I’ve made exactly ZERO adjustments to the data, Nate. All I’ve done is to qualify and quantify the calibration OFFSET between the two separate datasets. An offset which is robustly corroborated by other radiation flux datasets, by Loeb et al., 2012, AND by Allan et al., 2014.

            So where is your real problem? It’s in your own bias alone, Nate … You simply cannot accept my result. Because reasons.

          • Nate says:

            ‘Yes, it is. Its in their MODEL, Nate. They go by their own model and expect it a priori to be correct (since, according to themselves, it is so realistic, after all)’

            Nope already been thru this in my initial response to you, and you ignored it. I explained, just as they explained, that the model was used to fill the small gaps. The model is NOT used to replace or determine the long-term data trend.

            They have simply tried their best, given the uncertainties in the data gaps, to produce an accurate OLR and ASR record. And like you, by publishing it, they have opened themselves up to critique from all other experts. Yet I don’t see any such published critiques among their 60-odd cites.

            Again, they have no stated prediction or model for what the long-term trend in OLR should be doing, while you DO.

            So your insistence that they are forcing the data to fit their model makes no sense.

            ‘ Loebs part in this paper was to ensure that the CERES data was handled properly’

            So you think Loeb would allow his name to be on a paper whose analyses and conclusions he disagrees with? How do you know? Weird.

          • Nate says:

            Argghh ‘And UNlike you, by publishing it…’

          • Nate says:

            K:
            ‘It DOES accurately track LT temperature over time, Nate. That is what the DATA shows. And it makes perfect sense. IF theres no enhanced GHE in effective operation in the Earth system. If everything is just working normally, in accordance with the null hypothesis.’

            ‘That the DATA shows. And it makes perfect sense.’

            This is a point I was trying to make about scientists never being so certain about their findings.

            One cannot fall so much in love with ones hypotheses, that you stop being objective.

          • Kristian says:

            Nate says, July 10, 2018 at 1:26 PM:

            One cannot fall so much in love with ones hypotheses, that you stop being objective.

            Take a good look in the mirror, Nate. That’s you in there.

            I don’t have a hypothesis. If anything, I go by the NULL hypothesis (of the idea of an “anthropogenically enhanced GHE”). What I do is describe and explain WHAT THE DATA SHOWS, Nate. I did have one specific hypothesis. I wrote about it in my blog post. It proposed that the mean level of the All-Sky OLR at the ToA (translated, via the S-B equation, into temp anomalies) would follow the rise in the mean level of tropospheric temperatures (TLT) across from the last half of the 90s to the first half of the 00s, based on the simple fact that – again, according to the DATA – it did so BOTH between 1985 and 1999 (ERBS) AND between 2000 and 2017 (CERES). And as it turned out, IT DID! The OLR did indeed follow the TLT also across the 1999-2000 ERBS-CERES data gap. As verified by Loeb et al., 2012, and Allan et al., 2014. After that I rested my case. There is nothing more to say, nothing more to debate. If you want to keep insisting that my composite record is somehow wrong and Allan et al.’s OBS reconstruction is somehow right, well then I’m afraid you will have to take it with the ERBS team, not with me. Because then, all that remains of your argument – you, after all, originally argued that my 1999-2000 offset was also wrong, just made up and conveniently adjusted simply to fit with my predispositions, remember? I have the quotes – is your apparent certainty that their dataset is incorrect and needs a huge blockwise adjustment across its 1993 data gap. Because … reasons. Or, should I say, because Allan and Trenberth say so.

            And as I’ve told you now probably a half dozen times, they (the people working on the ERBS dataset) won’t agree with you. Just like they don’t agree with Allan. Just like they don’t agree with Trenberth. Rather, they will most likely wonder ‘Are they STILL on about that one!?’ Already back in the day, they explained Trenberth carefully how there was no discernible problem with the calibration across the data gap. No major one-time adjustment was or is needed. They gave more than one reason for this. Did you even read the quotes from the papers where this was explained, Nate!? Should I bring them here?

            Is any of this starting to sink in by now? Or do we have to go yet ANOTHER round on this issue?

          • Kristian says:

            Nate says, July 10, 2018 at 12:24 PM:

            “Yes, it is. Its in their MODEL, Nate. They go by their own model and expect it a priori to be correct (since, according to themselves, it is so realistic, after all)”

            Nope (…)

            So they DON’T a priori expect it to be correct because it’s so “realistic”? And they DON’T therefore adjust the observational data (that is, the ERBS dataset) to make it fit with what the MODEL says rather than the other way around?

            Do you seriously not see how stubborn and foolish you appear? You come off as a clown. You’re just making up arguments to gainsay whatever evidence I present. Simply in order to have “the last word”. So that, when I at some point grow tired of responding to your endless strings of nonsense, you can come back later and boast about how I ducked your ‘poignant criticisms’, ran away with my tail between my legs.

            It’s petty behaviour.

            They (Allan et al.) simply decide for themselves that the data is unreliable and then let the MODEL determine the outcome instead. That’s what they do, Nate. That’s what they STATE in their own paper.

            They have simply tried their best (…)

            Yes, to make the observations fit with the theory. Rather than the other way around. Which is the exact OPPOSITE of real science. As you yourself pointed out above, Nate.

            And [UN]like you, by publishing it (…)

            Dear me. I don’t have to publish anything to understand that Allan et al., 2014, argues AGAINST the people actually responsible for the ERBS data, Nate!

            Because the people actually responsible for the ERBS data have themselves published on this very subject. As I have mentioned several times now.

            You appear to play stupid just to avoid coping with the reality of this issue.

            In psychology it’s called a method for “cognitive dissonance reduction”. You basically ARE Dr. Leon Festinger’s “man with a conviction”. There is NO WAY any kind of evidence, argument or logic is going to convince you that there’s something wrong with your belief system. More CO2 in the atmosphere MUST make the world warmer, and therefore it IS making it warmer. Because … it must! Right?

            “A man with a conviction is a hard man to change. Tell him you disagree and he turns away. Show him facts or figures and he questions your sources. Appeal to logic and he fails to see your point.”

            Hahaha! That is SO you, Nate.

            (…) they have opened themselves up to critique from all other experts. Yet I don’t see any such published critiques among their 60-odd cites.

            As I already explained to you, when you cite a paper, you aren’t thereby compelled or required to agree with everything that paper says. You don’t even have to care about its main conclusions. It simply means that you have found (at least) one particular item therein that fits into YOUR paper and that might back up what YOU’RE trying to say. A scientific (?) paper says a lot of things, not just one. Got it?

            The only ones that are really in a position to critique a major change of an officially published observational dataset like the one Allan et al., 2014, made … are the ones that publish that dataset. And as you should know by now, Nate, those people, rather than spending time, money and effort critiquing papers that in some way or another do their dataset injustice, have been busy over the last few years updating and reprocessing the very dataset in question.

            ERBS Ed4 is out, Nate. 2017. It does NOT include Allan’s 1993-1994 adjustment. That’s ‘critique’ enough, don’t you think? From the ‘experts’ themselves.

            “Loeb’s part in this paper was to ensure that the CERES data was handled properly”

            So you think Loeb would allow his name to be on a paper whose analyses and conclusions he disagrees with?

            How do you know he has a clearly defined “opinion” on the ERBS data at all? I think he leaves that to the people actually on the ERBS team.

            But if you feel so strongly about this, if you’re so certain that Allan et al., 2014, must be correct about the ERBS dataset simply because the name of Norman Loeb of the CERES team is there, why don’t you ask him yourself about this whole thing? I’m sure you’ll be able to find his email somewhere and write him …

            What I said, Nate, was that he is NOT responsible for the ERBS data. Which is the specific data that was tampered with. The data that he IS responsible for, the CERES data, was not tampered with. As you well know.

            So again I have to ask, what is your REAL problem here …? You appear to be fighting your own monsters, Nate.

        • barry says:

          Ignoring evidence? You overlooked this.

          http://woodfortrees.org/plot/esrl-co2/derivative/mean:12/from:1979/plot/esrl-co2/derivative/mean:12/from:2002/to:2016/trend

          How come we get an increased rate of acceleration on the graph you yourself continually post for the period you selected? Yet the chart you post just recently shows a flat line? Is acceleration constant or not?

          With enough noise in the signal anyone can find a flat period if they are selective. Then you have to rate that against the variability, which, I think you probably know, is to great to be making a call of any kind of trend. And if you don’t know that you have no business discussing trends in any kind of data.

          There is no exposition of uncertainty or any other rigour applied to your wiggle matching. It’s the visual equivalent of assertions made without substance. That smells like snake oil to me.

          So can we dig further into what you’re trying to lay out (and not side step onto something else) and get some answers on:

          1) Why the ratio between emissions and atmospheric accumulation is remarkably steady.

          2) Why your derivative CO@ chart shows an upward trend for the period you selected, but not the graph you most recently supplied?

          • Bart says:

            Jeez, Barry. You know, I used to have some respect for you.

            Stop putting all your eggs in the El Nino basket. It’s a transient event. Stop at 2015, and you’ll repeat my calculation. That’s 13 years with essentially no acceleration at all, at a time when emissions rose 43%.

            Why are you so desperate to deny what your eyes can clearly see?

          • barry says:

            Ok, you went only to Dec 2014.

            http://woodfortrees.org/plot/esrl-co2/derivative/mean:12/from:1979/plot/esrl-co2/derivative/mean:12/from:2002/to:2015/trend

            Barely a trend at all.

            What happens if we drop back a a year?

            http://woodfortrees.org/plot/esrl-co2/derivative/mean:12/from:1979/plot/esrl-co2/derivative/mean:12/from:2001/to:2015/trend

            The trend is back.

            Demonstrating just how carefully you have selected.

            The trends – or lack of trend – for a period this short is meaningless. And YOU are talking about the trend here.

            You won’t provide any rigour, so I will. What is the uncertainty of ‘trends’ of this length with this much variation?

            For UAH global temps 2002 to 2014 (Dec), the trend and uncertainty is:

            -0.037 C/decade (+/-0.256)

            When matched as you scale it to UAH to get the best possible fit, the acceleration CO2 data is just as variable, so will have similar uncertainty.

            Perhaps you could close the loop by giving an actual figure of CO2 acceleration over the period 2002 to 2014 (Dec), including uncertainty?

            Or else explain in what forum a result without that rigour would be acceptable.

          • barry says:

            “Why are you so desperate to deny what your eyes can clearly see?”

            Said the snake oil salesman to the rube.

            Numbers, Bart. Rigour. Discussion of uncertainty. Testing of the hypothesis in order to break it.

            These are mandatory actions in good science. Why do you not perform them?

          • Bart says:

            Are you really barry? Cuz you’re an idiot.

          • Berynn Schwerdt says:

            Did you check to see if the correlation worked on other 13-year periods? Because if it doesn’t, would you learn something from that or dismiss it?

            Did you check growth against emissions and derive the correlation? And if it was a stronger correlation than the rate of acceleration vs global temp, would you learn something from that or dismiss it?

            Stop putting all your eggs in the El Nino basket. It’s a transient event. Stop at 2015, and you’ll repeat my calculation. That’s 13 years with essentially no acceleration at all

            Your chart is of the rate of acceleration, isn’t it? In which case the level trend would represent steady, continued acceleration.

            Your chart also shows us that there are minute variations in the rate of increase, and AS YOU YOURSELF implied in the quote above, these fluctuations are greater when there are ENSO events.

            But these are minuscule effects compared to the fairly steady annual accumulation. Fluctuations in acceleration are an order of magnitude smaller than the annual increase over time, and cannot possibly account for the increase of CO2 over the decades.

            All your chart shows is that global temps have a tiny influence on annual variation in atmospheric CO2, most clearly seen with ENSO events. Which is already known. You can see the correlation with any of the global temp records and derivative CO2.

            But this in no way demonstrates that GST is responsible for the increase of over a 100 ppm over the last 100 years.

            Not even close. The fluctuations you are charting are in the tenths and hundredths of parts per million every year. Tiny fluctuations in the acceleration.

            100 ppm is a large change, like the ones led by ice age GST changes – of 5 to 6 C. Which took a few thousand years to peak. Where is the global temperature precedent for the current, rather sharp rise? There isn’t one.

            And if you’re going to argue that CO2 can fluctuate wildly interannually, then why did concentration suddenly become a rock steady curve from the year we first took measurements at Mauna Loa?

            Because CO2 concentrations don’t fluctuate wildly – historic measurements were improperly done, and we have 60 years of evidence of very stable background levels.

            Meanwhile human endeavours pump about twice as much C02 in the atmos over time than accumulates over time.

            The source is obvious. You just don’t want to admit it, and rely on a murky ‘feedback’ announcement to paper over this simple arithmetic.

            You don’t even want to test your hypothesis to break it. That has to be done for you. Sad.

            http://scrippsco2.ucsd.edu/graphics_gallery/mauna_loa_record/mauna_loa_seas_adj_fossil_fuel_trend

          • Bart says:

            “All your chart shows is that global temps have a tiny influence on annual variation in atmospheric CO2, most clearly seen with ENSO events. Which is already known.”

            When the data are scaled to match the variation, there also is a match in the long term trend. Both the short and the long term rate of change match remarkably well. Emissions also have a long term trend. As there is little to no room to fit them in as well, it follows that they are not having a significant impact.

            “Meanwhile human endeavours pump about twice as much C02 in the atmos over time than accumulates over time.”

            And, most of it is removed in short order by sink activity. The argument that the fact that the rise happens to be roughly half of the total accumulated anthropogenic input is in any way dispositive is deeply flawed, and would never be suggested by anyone with even a meager grasp of feedback dynamics.

            “That has to be done for you.”

            A curve fit has been performed, in the low information domain of the absolute level. You have two series that are vaguely quadratic. It is easy to create an apparent affine similarity between the two – just perform a linear regression of the one against the other.

            It is in the rate of change domain that the fingerprint of the culprit becomes apparent. The emissions do not match in the short term variation. The temperature data match in both the short term and the long. Ergo, the temperature relationship is clearly the dominant factor.

          • barry says:

            You’re simply repeating yourself and refusing to do the work.

            We agree about the short-term fluctuations in acceleration in the tenths and hundredths of a ppm, but this in no way accounts for the annual rise an order of magnitude larger.

            You’ve presented no correlation figures, just graphs and “look at this.”

            You don’t have any mathematical substance behind your argument, just rhetoric about ‘affineness,’ based on wiggle matching by manipulating a few parameters until you get the result you want.

            This is even more selectivity than deriving a ratio from a linear fit, done by SCRIPPS, with a much better correlation than your graph.

            Or at least I assume from visual inspection. You refuse to supply values of any kind.

            Is it because you are unable?

            How then do you know whether the correlation for UAH v CO2 mean 12 derivative is better than any other?

            You’ve not even tested that??

          • barry says:

            Out of curiosity I ran the derivative function for UAH.

            http://www.woodfortrees.org/plot/uah6/mean:12/derivative/plot/uah6/mean:12/derivative/trend

            The trend is a virtually flat line.

            No increase in acceleration. Temps have risen in a linear fashion for the whole period.

            Unlike the profile for CO2 derivative.

            http://www.woodfortrees.org/plot/esrl-co2/mean:12/derivative/plot/esrl-co2/mean:12/derivative/trend

            How is it that the acceleration rate has increased for CO2 when it hasn’t for temps, if there is supposed to be a correlation?

            Whenever I test your hypothesis, it doesn’t hold up.

            And you don’t test your hypothesis. Just repeat it.

            Same problem as Kristian – no honest discussion of drawbacks, uncertainties with your results, or of evidence that conflicts with it, like much of the above.

            You’re doing sales, not science.

          • Bart says:

            “…but this in no way accounts for the annual rise an order of magnitude larger.”

            YES. IT. DOES.

            It unequivocally does. Both the short term variability AND the long term trend match magnificently.

            “You don’t have any mathematical substance behind your argument…”

            I do. I’ve shared it before here.

            “Unlike the profile for CO2 derivative.”

            This just shows you’re not even remotely following the argument. It is the CO2 rate of change that is proportional to appropriately baselined temperature anomaly, NOT the absolute level. If you want to compare the derivative of temperature, you have to compare it to the 2nd order derivative of CO2.

          • barry says:

            This just shows you’re not even remotely following the argument. It is the CO2 rate of change that is proportional to appropriately baselined temperature anomaly, NOT the absolute level. If you want to compare the derivative of temperature, you have to compare it to the 2nd order derivative of CO2.

            Circular logic? The function looks god to you so you MUST use the function? And using the function – hey isn’t the fit looking good?

            Nowhere in your explanations (or calcs as far as I can tell) have you accounted for a cause of the overall rise, except with some handwaving.

            Your argument is premised on background CO2 levels fluctuating much more wildly than is understood – that is, quite stable, with very long-term ups and downs.

            You didn’t answer my point – which I bolded – above.

            “…if you’re going to argue that CO2 can fluctuate wildly interannually, then why did concentration suddenly become a rock steady curve from the year we first took measurements at Mauna Loa?

            Because background levels are very stable.

            You have no physical explanation for the overall rise, but you do have a fairly good correlation of acceleration changes WRT temps. Minute fluctuations.

            Which I’ve commented on and agreed with and pointed out that this has been discussed.

            I did a derivative for temps to see if, like CO2, there was an acceleration. Is there correlation there?

            No one has to compare that with a second order derivative for CO2. That’s just your assertion based on you liking the fit.

            CO2 increase has accelerated. You say CO2 is tied to temps over the long term – that the absolute concentration is temperature dependent – so it is entirely reasonable to look for correlation of acceleration. It’s not there.

            Because CO2 rise is not tied to temps in the modern period. Only the small fluctuations.

            You have no physical mechanism for the overall rise, just handwaving about ocean equilibration.

            Whereas anthro emissions is a well-justified physical cause.

            The last time CO2 changed by this much, the global temp changed by 5 to 6 degrees and ice sheets came and went from Northern Europe and America.

            The atmospheric CO2 background level doesn’t jump around. We have 60 years of very stable background levels steadily rising and accelerating. Same as anthro CO2.

            Link me to the post where you discuss the holes in your own hypothesis.

          • barry says:

            Changes in wind direction and speed affect the velocity of your car, therefore the wind powers your car.

            That’s what your argument looks like to me.

          • barry says:

            I’d not seen that link before, but your comments rely on that magic mechanism that distinguishes anthro CO2 from natural, somehow swallows anthro CO2 and emits only natural.

            You say the oceans do it: that the oceans absorb all the anthro CO2 and are outgassing about half as much annually as is emitted.

            Never mind that this is not buttressed by the isotopic change in oceanic CO2 over time, nor is it buttressed by the change in isotopic ration in atmospheric CO2 (which shows an anthro increase), it doesn’t occur to you that in this model that anthro CO2 is displacing natural from the oceans.

            The source of increased CO2 is still anthro emissions, even in this fantastical scenario.

            Because it definitely isn’t temperature. Your chart only models the tiny fluctuations.

            And there is no accelerating temperature evolution to match accelerating CO2 buildup.

          • Bart says:

            barry – you are rambling incoherently, casting for excuses to ignore what your eyes can plainly see.

            It’s not a close call. It is very clear that CO2 concentration and temperature anomaly are related in a manner and to an extent that disqualifies human inputs as being a major driver. Watch and see what happens.

          • Bart says:

            “Id not seen that link before, but your comments rely on that magic mechanism that distinguishes anthro CO2 from natural, somehow swallows anthro CO2 and emits only natural.”

            Quite explicitly, no. It is the attribution of the rise to humans that necessarily treats the two species differently. My formulation treats them both identically.

          • barry says:

            This is where the magical thinking happens:

            Since r is small, the bulk of both the source H and the temperature constricted outflow k*T goes into the oceans. Suppose, e.g., that r = 0.01. Then, 1% of the integrated H goes into that atmosphere, not 50%, and the great majority of the anthropogenic input goes into the oceans.

            The oceans take up and emit a few ppms worth of atmospheric CO2 annually. Of 410 ppm total, 6ppm on average is turned over. That’s 1/68th of the entire atmospheric content.

            The ratio 1/68 should be equivalent for anthropogenic content emitted annually, as anthro CO2 is mixed with the rest, but in your mind model, the oceans somehow manage to swallow nearly 100% of the anthro emissions, rather than a proportion consistent with the atmospheric whole.

            This clever targeting is magical thinking on your part.

            And there is nothing rambling about noting that the isotopic ratio of CO2 from oceanic and atmospheric measurements corroborates an anthropogenic source for the increase. Rather, your failure to respond in any way to a range of points is a case of someone avoiding a proper look at the issue.

            Its not a close call. It is very clear that CO2 concentration and temperature anomaly are related in a manner…

            that shows that global temps are correlated with tiny fluctuations of atmos CO2. Or, as you said it:

            “However, temperature dependence of r does not lead to a buildup of CO2, merely a small change in proportionality.”

            …and to an extent that disqualifies human inputs as being a major driver.

            Nope. Magical thinking gets you this answer. As I’ve always said, your view relies on the biosphere somehow preferentially soaking up anthro CO2 above the rest. That’s a fictional (and ludicrously convenient) mechanism.

            Watch and see what happens.

            We’ve seen it.

            https://scripps.ucsd.edu/programs/keelingcurve/wp-content/plugins/sio-bluemoon/graphs/mlo_full_record.png

            Remarkably stable background levels on a long curve for 60 years, with a regular annual turnover.

            No wild jumps. Atmos CO2 doesn’t fluctuate erratically year to year. It changes smoothly over the long term.

            And the rise is accelerating, as is anthro emissions. Unlike temperature, which has followed a linear rise.

            You don’t have a long-term correlation with temps – only the short-term fluctuations, which for some reason you seem to imagine I’ve not noticed or confirmed.

          • Bart says:

            “The oceans take up and emit a few ppms worth of atmospheric CO2 annually. Of 410 ppm total, 6ppm on average is turned over.”

            Circular reasoning. That is basically the anthropogenic attribution hypothesis stated in different words.

            “And there is nothing rambling about noting that the isotopic ratio of CO2 from oceanic and atmospheric measurements corroborates an anthropogenic source for the increase.”

            The isotopic ratio also changes with temperature. It isn’t really evidence one way or another. It’s just a random bit of information that has been dragooned into supporting the anthropogenic attribution argument.

            “However, temperature dependence of r does not lead to a buildup of CO2, merely a small change in proportionality.”

            The temperature dependence of r does not lead to the buildup. The temperature dependence of tau2 does.

            “As I’ve always said, your view relies on the biosphere somehow preferentially soaking up anthro CO2 above the rest.”

            It doesn’t. The human attribution hypothesis does.

            “Remarkably stable background levels on a long curve for 60 years, with a regular annual turnover.”

            Doesn’t match in the rate of change domain.

            “And the rise is accelerating, as is anthro emissions.”

            The rise in concentration has not been accelerating since the advent of the “pause” in temperatures. Anthro emissions definitely are.

            “You don’t have a long-term correlation with temps – only the short-term fluctuations, which for some reason you seem to imagine I’ve not noticed or confirmed.”

            Nope. Integrating the temperature relationship leads to a close agreement in the long term.

            http://i67.tinypic.com/29ps1z4.jpg

          • Bart says:

            “Nope. Integrating the temperature relationship leads to a close agreement in the long term.”

            Sorry, that was the wrong picture. It shows, indeed, that there is a superficial resemblance between CO2 concentration and accumulated emissions. But, the long term match with the integrated temperature anomaly is just as good, and it provides a much better match in the rate domain:

            http://i66.tinypic.com/jgnl6o.jpg

          • barry says:

            Your replies are swinging some big misses there.

            Me: “The oceans take up and emit a few ppms worth of atmospheric CO2 annually. Of 410 ppm total, 6ppm on average is turned over.”

            You: “Circular reasoning. That is basically the anthropogenic attribution hypothesis stated in different words.

            What on earth…? The annual turnover is seen clearly in the Keeling curve.

            http://scrippsco2.ucsd.edu/assets/images/mlo_record.png

            This isn’t an attribution hypothesis, this is the fact that the planet ‘breathes’CO2 in and out each year as NH biota grows in the Spring taking up CO2 and dies off in the Autumn, releasing it.

            Your argument is that the ocean soaks up the anthro contribution entirely, instead of it’s equivalent proportion of the amount of whole-atmosphere CO2.

            IOW, if the oceans soak up 1 % of atmospheric CO2 per year (I made that up for ease of comprehension), then it is going to soak up 1% of emitted anthro CO2 – not 100%.

            There is no reason the oceans would prefer anthro CO2 over non-anthro. This is your magical mechanism.

            The isotopic ratio also changes with temperature. It isnt really evidence one way or another. Its just a random bit of information that has been dragooned into supporting the anthropogenic attribution argument.

            You’re just making up soundbytes here. Isotopic ratio dependent solely on temperature is minute compared to the change since the IR.

            The temperature dependence of r does not lead to the buildup. The temperature dependence of tau2 does.

            You don’t have a physical basis for tau2. It’s fashioned out of thin air.

            “As I’ve always said, your view relies on the biosphere somehow preferentially soaking up anthro CO2 above the rest.”

            It doesnt. The human attribution hypothesis does.

            No it doesn’t, and this is becoming Pythonesque. There is no meachanism whereby the ocean soaks up a larger ratio of anthro CO2 than the ratio of the rest of atmos CO2. They are equivalent.

            “Remarkably stable background levels on a long curve for 60 years, with a regular annual turnover.”

            Doesnt match in the rate of change domain.

            Which only accounts for tiny fluctuations. You’re simply asserting that what happens in the derivative also happens in bulk. you just don’t have it, and asserting so doesn’t get us there.

            “And the rise is accelerating, as is anthro emissions.”

            The rise in concentration has not been accelerating since the advent of the “pause” in temperatures. Anthro emissions definitely are.

            Now you have to be very selective. Even so:

            http://www.woodfortrees.org/plot/esrl-co2/from:1998/derivative/mean:12/plot/esrl-co2/from:1998/derivative/mean:12/trend

            This cherry-picking of time spans is tiresome. Look at the noise. There is not enough data to make a call on rising trend, dropping or flatlining. It’s too uncertain.

            When will people give up this basic deception with time series data?

            You don’t have a long-term correlation with temps – only the short-term fluctuations, which for some reason you seem to imagine I’ve not noticed or confirmed.

            Nope. Integrating the temperature relationship leads to a close agreement in the long term.

            http://i66.tinypic.com/jgnl6o.jpg

            Inverting the derivative and scaling at will could make things look nice.

            But:

            http://www.woodfortrees.org/plot/uah6/integral

          • Bart says:

            “Your replies are swinging some big misses there.”

            You are not even in the ballpark. Seriously. This isn’t just a jibe. There are unlikely but potential weaknesses in my argument. You aren’t anywhere close to them.

            “The annual turnover is seen clearly in the Keeling curve.”

            The annual net turnover is seen clearly in the Keeling curve. There is a whole other dimension of variability here which you have implicitly assumed. It’s like saying y – x = 6, therefore y = 6.

            “Your argument is that the ocean soaks up the anthro contribution entirely, instead of its equivalent proportion of the amount of whole-atmosphere CO2.”

            No, it totally isn’t. The argument is that the ocean soaks up both anthro and natural in proportion to their contributions. It is only by assuming that uptake is disproportionate to their contributions that one can arrive at a verdict for human attribution, and that is an invalid assumption.

            You are the one appealing to magic, not I.

            “Isotopic ratio dependent solely on temperature is minute compared to the change since the IR.”

            It isn’t.

            “You dont have a physical basis for tau2. Its fashioned out of thin air.”

            Hardly. The physical basis for tau2 is exchange with the deep oceans. It is necessary for an equilibrium to even exist.

            “Which only accounts for tiny fluctuations.”

            No, it doesn’t. The long term trend matches.

            “This cherry-picking of time spans is tiresome.”

            Thirteen years is not a cherry pick. That’s a long time for CO2 rate of change to stall while emissions increase 30%.

            http://oi63.tinypic.com/11gniqg.jpg

            “Its too uncertain.”

            If it’s too uncertain, then you have no basis for your claims, and must at least concede that my model is equally viable.

            “You don’t have a long-term correlation with temps – only the short-term fluctuations…”

            Again, no. I have a long term correlation with the trend. You keep claiming this, and you are clearly wrong.

            But:”

            You have to take account of the temperature anomaly baseline. It is arbitrary, so your integral has no meaning. What we want is the baseline against the temperature that would produce an equilibrium in CO2. This provides an excellent fit:

            http://woodfortrees.org/plot/esrl-co2/mean:12/from:1979/plot/uah6/scale:0.175/offset:0.142/integral/offset:337

            It is the fact that the curvature matches, when the data are scaled to match the variation between the rate of change of CO2 and the temperature anomaly, that establishes the validity of this model.

          • barry says:

            The argument is that the ocean soaks up both anthro and natural in proportion to their contributions. It is only by assuming that uptake is disproportionate to their contributions that one can arrive at a verdict for human attribution, and that is an invalid assumption.

            The only way the oceans could take up total anthro emissions is if the oceans soaked up (overturned) the total atmospheric CO2 content in a very short period of time – days instead of years. 4-5 years is the average lifetime of a CO2 molecule in the atmosphere, accounting also for the vegetation turnover.

            Otherwise the oceans (and vegetation) are soaking up a fraction of the total atmos CO2 content at varying rates and capacities, and anthro CO2 is soaked up in proportion to the whole, with the results that we see. There is no need for disproportionality.

            We should be losing CO2 from a natural reservoir if the rise is not due to the anthropogenic injection. Where is the observed physical evidence for that? Not from the oceans, where CO2 has increased. Not from biota, where we’ve observed a slight ‘greening’.

            You don’t have a verified source.

            I doubt you could come up with another (temp based?) isotopic match to observations that fits with the changes in 13 AND 14 isotopes that show a linked progression from the beginning of the industrial revolution.

            There are multiple lines of observational evidence for anthro attribution. There are not for your hypothesis.

            I can cite numerous papers on each line of evidence. You can cite Beck, whose work is comprehensively refuted by the modern CO2 record: Jaworowski, who never worked on the modern ice cores drills with modern equipment: and probably a paper on leaf stomata – of which there are several that come up with totally different time series and have huge (50ppm) error bars.

            If none of the above presents serious problems for your hypothesis, then I’m curious what you think the bigger problems are.

          • barry says:

            http://woodfortrees.org/plot/esrl-co2/mean:12/from:1979/plot/uah6/scale:0.175/offset:0.142/integral/offset:337

            That’s incredible.

            http://woodfortrees.org/plot/esrl-co2/mean:12/from:1979/plot/rss/scale:0.155/offset:0.122/integral/offset:337

            Wow.

            The only thing that links these is the similarity of parabola in the curves. You could make a match between ANY slightly accelerating rise in ANYTHING and CO2 simply by tweaking the scale and offsets (twice for the offset) as you have done.

            Elephants and parameters come to mind. You could do the same with the surface data, but not as neatly because the acceleration is a bit greater than for the sat records.

            But let’s have a go anyway for the full CO2 record.

            First attempt without tweaking much:

            http://woodfortrees.org/plot/esrl-co2/mean:12/from:1959/plot/gistemp/from:1959/scale:0.06/offset:0.14/integral/offset:315

            Now let’s see if I can make the elephant wiggle his trunk…

            http://woodfortrees.org/plot/esrl-co2/mean:12/from:1959/plot/gistemp/from:1959/scale:0.05/offset:0.11/integral/offset:315

            Little bit of a twitch there…

            http://woodfortrees.org/plot/esrl-co2/mean:12/from:1959/plot/gistemp/from:1959/scale:0.137/offset:0.089/integral/offset:314.5

            Gee, the GISTEMP record must be A1, eh! See how it matches CO2 under your hypothesis? By my eyeball reckoning, that is at least as good a fit as with UAH. And the tails are much better fit than the UAH record. How could anyone complain about GISTEMP?

            Dr Doolittle eat your heart out

          • barry says:

            Thirteen years is not a cherry pick.

            The ‘pause’ is canonically from 1998.

            Of course you’ve cherry-picked. Your ‘pause’ (how many have there been?) is even more selective than the usual.

            The derivative magnifies tiny fluctuations. Acceleration is on the order of several hundredths of a part per million per annum over the long-term – barely significant. The ‘noise’ is an order of magnitude greater. Even if it was a fact that acceleration continued (God’s eye view), you would still get 13 year periods – and longer – that would have a flat trend. That’s because the noise overwhelms the trend on short time scales.

            And we know how cherry-picked your period is, because expand it by a year or more, or move the 13-year window forward or back and you get acceleration.

            You can’t make an argument out of a normal statistical artefact. You haven’t even begun to test the statistics. There’s no null here, even, not in the formal sense.

          • barry says:

            [edit] I mean, of course, increased acceleration where I say “acceleration.”

      • Nate says:

        ‘UAH provides a better match with the CO2 rate of change proxy’

        Oy.

        Whatever better matches my debunked speculation is the ‘correct’ one.

        Reassuring.

  39. Krakatoa says:

    They are in line with the mainstream scientific consensus, but I don’t know what that has to do with the reliability of their data.
    Roy Spencer also gave presentations at Heartland congresses, where he went very much against the theory of AGW. I wouldn’t call that neutral, but I don’t think that should or does anything to their data.

  40. barry says:

    Cloudbreak says:
    July 2, 2018 at 4:04 PM

    It has defintely cooled down here. Note that our BOM is putting out false data as they got caught out using instantaneous temperatures rather then averaged temperatures. I would believe Roys nos. before Australias BOM.

    These critics don’t check anything, do they?

    UAH 1979 to 2017 trend for Australia : 0.18 C/decade
    BoM 1979 to 2017 trend for Australia : 0.16 C/decade

    Roy thinks Australia has been warming faster than BoM thinks it has.

    UAH records a 1C drop in Australian temps April to May
    BoM records a 2C drop in Australian temps April to May

    “It has definitely cooled down here.”

    Could it be that we’re just about at the middle of Winter?

    Australia is a big place, and “down here” could be any part of it. We’ve just had 2 unseasonably warm days in Sydney. Big frickin’ deal.

    When will some buggers learn the difference between weather and climate, and the difference between a region/the globe and their back yard?

  41. UAH is the gold standard when it comes to global temperatures.

  42. David Overton says:

    I wonder if the global temperature data series is what Dr. Spencer was expecting when he started this project. His writing shows him to be a climate change skeptic, arguing that models overestimate, and that the science is far from settled. But his data is showing what climate scientists would expect – a clear warming trend (as Dr. Spencer states, with a slope of .13 degrees C per decade). At what point does Dr. Spencer accept the implications of his own data?

  43. Svante says:

    No, it was a Red Kite. Sorry that the windmills killed your herring. Perhaps it can be pickled?

    • Svante says:

      That suggestion was for Bart up thread.

      • Bart says:

        This is surreal. It’s like you’re insisting he’s just pining for the fjords.

        • Svante says:

          Yes Bart, you say your bird is dead.
          I say it would have been better if you didn’t put lead in its food.
          You say that’s surreal.

          • Bart says:

            When he was clearly and obviously killed by a windmill, yes, that is surreal. Do you really think you are making any headway by just blatantly denying reality? This is like that other Monty Python skit:

            M: An argument is a connected series of statements intended to establish a proposition.

            O: No it isn’t!

            M: Yes it is! ’tisn’t just contradiction.

            O: Look, if I *argue* with you, I must take up a contrary position!

            M: Yes but it isn’t just saying ‘no it isn’t’.

            O: Yes it is!

            M: No it isn’t!

            O: Yes it is!

            M: No it isn’t!

            O: Yes it is!

            M: No it ISN’T! Argument is an intellectual process. Contradiction is just the automatic gainsaying of anything the other person says.

            O: It is NOT!

            M: It is!

            O: Not at all!

            M: It is!

          • svante says:

            I say lead poisoning is an issue here.

            Do you say a) there is no raptor lead poisoning, or b) lead poisoning does not affect their flying ability?

          • Bart says:

            I say lots of majestic and ecologically critical flying creatures are being killed by windmills, and the problem will only get worse as more of the useless things are put into service.

  44. I like the way it is going thus far this year. Global temperatures and overall sea surface temperatures both continue to be lower.
    July is looking quite cold in particularly in Antarctica.

    One has to predict BEFORE it happens if it has any meaning. I say 2018 is the transitional year. I much rather be early then late when predicting. Late has no meaning it is after the fact.

    Of course it is still to early to celebrate and more months have to go by but it has to start sometime if it is going to occur.
    The climate when it does really shift or go to another regime does so abruptly not slow and gradual. Ice Core data shows this to be the case

    The climate post Dalton shifted to the present climatic regime in a period of 10 years and has been in the same climate regime other then the climatic shift in the late 1970s which was all natural and accounts for all of the rise in temperatures from the Little Ice Age.

    If I turn out to be correct I will be on pretty firm ground because I would not have only pin pointed the transitional year(before it happened) but also the reasons why and how and my website climatebusters.org backs this up.

    My website being done some 5 years ago way in advance of this potential change.
    Reply

    • barry says:

      For global temps to be “at or below 30 year means 1980-2010” over the NH Summer, the average UAH anomaly for the next two months must be:

      -0.1 C

    • Bobdesbond says:

      Salvatore
      You really sound as though you are looking for a medal.

  45. Bobdesbond says:

    Here is a YT playlist showing the regional temperature percentiles in the US for each of the first six months of 2018:
    https://tinyurl.com/USTempPlaylist

  46. Kristian says:

    Nate:
    http://www.drroyspencer.com/2018/05/uah-global-temperature-update-for-april-2018-0-21-deg-c/#comment-300166

    Nate says, May 2, 2018 at 9:52 AM:

    This 33 y global plot that you are so fond of is suspect for several reasons

    1. You start with your premise “So could we possibly merge our two OLR datasets (ERBS & CERES) by simply letting them track Ttropo (as represented by UAHv6 TLT) all the way from 1985 to 2017?

    Lets try it.”

    Then all adjustments you make after that turn out to make this occur. You mention trying to avoid confirmation bias, which is admirable, but it seems clear that you have not avoided it.

    Ouch! And then my hypothesis turned out to be spot on. OLR did and does track TLT also across the 1999-2000 data gap, not just from 1985 to 1999 and from 2000 to 2017, only for some reason not from 1999 to 2000.

    2. I may have missed it, but I dont see in the published literature, the same offset you give to the post 2000 data, in order to try to match it up with pre 2000 data.

    And then just a little bit later you found Allan et al., 2014. But of course without acknowledging the fact that they specifically CONFIRM my 1999-2000 offset as correct!

    4. The offset you give to the post 2000 data adds ~ 1W/m^2 to OLR for the entire post 2000 period relative to the 1990s. This is extremely unlikely to be correct.

    And yet it IS. As shown by Allan et al., 2014, Loeb et al., 2012, ISCCP FD, HIRS and AVHRR. AND my ERBS+CERES composite record.

    Arguments from personal incredulity, Nate, never constitute valid objections to reality. And now you know.

    * * *

    Nate:
    http://www.drroyspencer.com/2018/05/uah-global-temperature-update-for-april-2018-0-21-deg-c/#comment-300188

    Nate says, May 2, 2018 at 11:06 AM:

    Kristian,

    “We dont need a linear trend line to spot such a tendency. We have 32-33 years of data:”

    Data manipulated to make conform to your belief.

    [Referring to the above comment of yours.]

    Do you still stand by this claim, Nate? That I have “manipulated data” (basically, the 1999-2000 offset) to make them “conform to my belief”.

    * * *

    Nate:
    http://www.drroyspencer.com/2018/05/uah-global-temperature-update-for-april-2018-0-21-deg-c/#comment-300238

    Nate says, May 2, 2018 at 3:06 PM:

    “I know why? Because you cant accept what the data itself is telling you. So you feel a natural urge to do something about it. Manipulate the data. Smooth it. Massage it.

    Somehow force it to comply with YOUR preconceived idea of what they SHOULD say.”

    Perfect description of what you appear to have done to get your 32 y graph to tell you what you wanted.

    [Again referring to the above comment of yours.]

    What I “appear to have done”, Nate? That isn’t your inherent bias speaking, is it?

    • Kristian says:

      Nate:
      http://www.drroyspencer.com/2018/05/uah-global-temperature-update-for-april-2018-0-21-deg-c/#comment-301433

      Nate says, May 9, 2018 at 10:57 AM:

      Kristian,

      Re: stitching together different TOA flux data sets. Here is a paper that tries to do that for 1985-2012. They use a different approach than you, and get a different result.

      Hahaha! That’s exactly what they DON’T do. They use a different approach than me, and get the EXACT SAME RESULT, regarding the specific issue we’ve been discussing this entire time: The 1999-2000 offset between the two observational datasets of ERBS and CERES. But somehow you just cannot get yourself to admit and acknowledge it.

      The ONE thing that separates my record from Allan et al.’s is that THEY (not me) take it upon themselves to change one of the observational datasets used IN ADDITION TO making the stitch. I don’t touch either. I stitch the two together, and that’s it. They stitch them together as well, and we very much agree on the resulting stitch offset. But they also tamper with the ERBS dataset. To produce an overall flatter-looking OLR curve than mine …

      * * *

      Nate:
      http://www.drroyspencer.com/2018/05/in-defense-of-the-term-greenouse-effect/#comment-304668

      Nate says, May 27, 2018 at 10:57 AM:

      What is stupid and cowardly is how Kristian refuses to confront the reality that the experts disagree with him about what we actually OBSERVE.

      What experts are you referring to here, Nate? The people responsible for the ERBS dataset? Or people that are NOT (!!!) “experts” on the ERBS dataset opining about it and making arbitrary changes to it to make it fit with their own model simulations …?

      The real experts, Nate, agree with ME, not with Allan et al. As you might’ve noticed, but still fail to acknowledge.

      Allan et al. do not disagree with me “about what we actually OBSERVE”, Nate. They CHANGE the observational data. Without justification. To make it agree with their models.

      That’s quite a different thing.

      Kristian, you have tried to draw conclusions from 33 y of data that you’ve stiched together by making various choices about offsets between the sets.

      But as I showed you, and you ignored, Loeb and collaborators have made different choices to produce a continuous set.

      NOT (!!!) when it comes to the relevant offset, Nate. The 1999-2000 one. Which is the ONLY offset that I’ve made. Got it? It’s MY ONLY OFFSET! And regarding that, they come to the EXACT SAME CONCLUSION as I do.

      And do not draw your conclusions.

      Of course they don’t. Because THEY tamper with the observational data itself. Without support from any of the radiation flux dataset teams. I don’t. Because I go by what the EXPERTS on the data have to say about the data. So Allan and me naturally conclude differently, yes.

      But MY conclusion IS supported by and agrees with the ERBS team’s conclusion, as with the ISCPP team’s conclusion, the HIRS team’s conclusion, and the AVHRR team’s conclusion. They all agree. Among themselves. And with me.

      Allan et al.’s conclusion is cheered on – of course – by Distinguished Expert Scientist on all things climate, Kevin Trenberth, that had a ‘concern’ back in 2002, one that he refuses to let go of even to this day, even though it was immediately refuted, already in 2002, by the very people responsible for the dataset he raised ‘concerns’ about [Wielicki et al., 2002b]. Plus, it’s ‘backed’ by model simulations. And that’s it. That’s it, Nate. They don’t have or provide any kind of empirical or physical justification for their
      decision to adjust … Only the words of Trenberth (who notably contributed as ‘assisting reviewer’ and ‘evaluator’ on this paper, after all), and the models.

      • barry says:

        Because THEY tamper with the observational data itself. Without support from any of the radiation flux dataset teams.

        They all collaborate. Loeb’s name is on many of the papers in question.

        Stop selling one version as correct and the others ‘tampered’. They’re all estimates, and even the authors of CERES and ERBS qualify their work similarly.

        YOU are far more partial than the people who make this stuff.

        You’re not alone in that, but you seem to be most familiar with the background papers, so it’s surprising you don’t reflect uncertainties and caveats that the authors and compilers themselves mention.

        Where’s your skepticism?

        • Kristian says:

          barry,

          You basically take exception to my use of the expression “tamper with”.

          Ok, if you find that a tad too loaded, a wee bit too subjective on my part, simply swop it with “change”.

          If you only put “change” in where I wrote “tamper with”, then my comment becomes objectively true:

          Nate: “And do not draw your conclusions.”

          ME: Of course they don’t. Because THEY [change] the observational data itself. Without support from any of the radiation flux dataset teams. I don’t. Because I go by what the EXPERTS on the data have to say about the data. So Allan and me naturally conclude differently, yes.

          But MY conclusion IS supported by and agrees with the ERBS team’s conclusion, as with the ISCPP team’s conclusion, the HIRS team’s conclusion, and the AVHRR team’s conclusion. They all agree. Among themselves. And with me.

        • barry says:

          Fixating on a word, you missed the point.

          Because THEY [change] the observational data itself. Without support from any of the radiation flux dataset teams.

          No – they do collaborate. Loeb is on the Allan 2014 paper, for example.

          Different groups – often with co-authorship from the compilers of CERES and ERBS – approach the problems with the data differently.

          And – why do you not admit get this point – they ALL qualify the the work they do. No group claims to have cornered the truth – only you.

          And you wax a narrative to make it seem like the compilers of the data are the keepers of the truth, only present in other groups to safeguard the truth (TM) while the other scientists working with the data are errant and/or mischievous.

          Loeb doesn’t think the CERES series he constructs is flawless. He works with others and gets different results with them. He can admit the uncertainty of all these records. He doesn’t claim the CERES times series are *the truth*. That’s your schtick.

          As someone said to you on another thread:

          “Guys, this is just not how scientists describe their results. Real scientists are never so certain.”

          You’re doing sales, not science. The long-winded rhetoric doesn’t bridge the gap.

          • Kristian says:

            barry,

            As usual there’s nothing but irrelevant blather coming from your direction.

            Rather than just going on complaining for the sole sake of complaining, can you please for once address what I’m actually saying?

            What is it specifically about my quoted comment above that is factually incorrect?

            Is this part incorrect: “Because THEY [change] the observational data itself.” ?

            Or is it this part: “Without support from any of the radiation flux dataset teams.” ?

            Or maybe this: “But MY conclusion IS supported by and agrees with the ERBS team’s conclusion, as with the ISCPP team’s conclusion, the HIRS team’s conclusion, and the AVHRR team’s conclusion. They all agree. Among themselves. And with me.”

            I don’t know, barry. You tell me.

            * * *

            As an illustration of how little you tend to pay attention to what I actually write on this topic, here’s a comment of yours (totally pointless, of course, just for making noise) from a couple of threads ago (my responses interposed):

            barry says, June 29, 2018 at 4:12 PM:

            Loeb of CERES worked on the Allan paper. Kristian seems to pit the ‘teams’ against each other, that Allan et al contradict CERES, the true, original rightest record, when in fact they collaborate.

            Where exactly do I say that Allan et al. disagree with the CERES record?

            Allan et al. specifically “correct” (change) the ERBS record, barry. Not the CERES record.

            Norman Loeb is not a member of the ERBS team. He’s never been on that project at all. He’s responsible for the CERES dataset. That’s his role in Allan’s paper.

            And, in this particular regard, it is very much worth noting that there wasn’t a single person from the ERBS team included in this study. Not one on the authors list, no mention in the acknowledgements. Even when it was THEIR dataset that was on the line, conspicuously targeted for large-scale adjustment.

            There are also caveats that CERES apply about the long-term record, and particularly about the uncertainty with the data gaps.

            Er, no barry. 1) There are no data gaps in the CERES record, and 2) the CERES EBAF dataset (just like the ERBS dataset) is distinctly described as a “climate(-quality) data record (CDR)”, because of its stability and precision over time:
            https://climatedataguide.ucar.edu/climate-data/climate-data-records-overview

            These notes could do with some honest airing, too.

            So do us all a favour and honestly air them, barry. Let’s see what you find. Don’t just assume (and assert) that there’s a – relevant – problem before you’ve found out that such a – relevant – problem actually exists. Just throwing out vague allegations without support, as you have a strong tendency of doing, won’t cut it.

          • barry says:

            Thanks for the multiple choice, but you don’t get to set the agenda.

            Specifically – you avoid acknowledging the uncertainties in these data that the authors openly mention in their publications. You’ve had 2 posts now to me to pick up on and acknowledge that point. And you haven’t, which corroborates my point.

            But MY conclusion IS supported by and agrees with the ERBS team’s conclusion

            Conclusion?

            Great – I was about to ask: you purport that climate changes have been driven largely by the amount of solar radiation reaching the surface, right? And that GHG forcing is minimal to non-existent. Do I have that right?

            And you use specific data products to argue your case.

            So – where do ERBS and/or CERES compilers (or the ISCPP or HIRS) agree with you that greenhouse forcing is minimal to non-existent? Where do they posit the cause of climate change over the last 30-40 years being driven by surface insolation?

            If their products tell the tale, can you please quote them on the recent causes of climate change?

            Or if that doesn’t accurately reflect you “conclusion” – then state it and quote the compilers of ERBS and/or CERES saying the same thing.

          • barry says:

            So do us all a favour and honestly air them, barry. Lets see what you find. Dont just assume (and assert) that theres a relevant problem before youve found out that such a relevant problem actually exists.

            A good place to start would be the CERES main document cited at the NCAR/UCAR website you linked to. A few pages in…

            “The CERES Science Team notes several CAUTIONS and HELPFUL HINTS regarding the use of CERES_EBAF_Ed2.8:

            A marked trend of -0.6 W m-2 per decade is observed in LW Cloud Radiative Effect (CRE) between March 2000 and February 2013. The CERES team suspects at least part of this trend is spurious…

            …While the all-sky LW TOA flux is fairly immune to the GEOS-4 to GEOS-5 change, clearsky LW fluxes are not, as they depend strongly upon the cloud mask… This problem will ultimately be resolved in Edition4 (expected to be available in early 2015)…

            The CERES team has significantly reduced the impact of geostationary instrument artifacts in CERES_EBAF_Ed2.7 and Ed2.8 compared to earlier versions (see Section 4.0). However, users are cautioned that in the SW, CERES Terra observations are used for the period from March 2000-June 2002, while both CERES Terra and Aqua are used from July 2002 onwards. Consequently, uncertainties are slightly larger prior to July 2002….

            Clear-sky TOA fluxes in EBAF Ed2.7 and Ed2.8 are provided for clear regions within CERES footprints from MODIS pixels identified as clear at 1-km spatial resolution. This definition differs from what is used in the standard CERES data products (SSF1deg and SYN1deg), which only provide clear-sky fluxes in regions that are completely cloud-free at the CERES footprint scale….

            … Users should be aware that both of these definitions of “clear-sky” used for CERES observations might differ from what is used in climate model output… Sohn et al. (2006) note that differences in how clear-sky is defined in model output and observations can lead to regional LW TOA flux differences of up to 12 Wm-2…

            When the solar zenith angle is greater than 90, twilight flux (Kato and Loeb 2003) is added to the outgoing SW flux in order to take into account the atmospheric refraction of light. The
            magnitude of this correction varies with latitude and season and is determined independently for all-sky and clear-sky conditions. In general, the regional correction is less than 0.5 W m-2, and the global mean correction is 0.2 W m-2. Due to the contribution of twilight, there are regions near the terminator in which outgoing SW TOA flux can exceed the incoming solar radiation. Users should be aware that in these cases, albedos (derived from the ratio of outgoing SW to incoming solar radiation) exceed unity.”

            And the clearest caveat comes in the latest update:

            “Uncertainties in absolute calibration and the algorithms used to determine Earths radiation budget from satellite measurements are too large to enable Earths energy imbalance to be quantified in an absolute sense. Rather the CERES data products are more useful for providing its spatial and temporal variability. The absolute value of global and regional mean net TOA flux is nevertheless important in many applications that use ERB data (e.g., climate model evaluation). To produce a globally complete representation of ERB while at the same time providing representative absolute values, the EBAF data product uses an objective constrainment algorithm to adjust SW and LW TOA fluxes within their range of uncertainty to remove the inconsistency between average global net TOA flux and EEI as inferred from in situ data. According to Johnson et al. (2016), Earths energy imbalance during July 2005June 2015 is 0.71 0.10 W m−2 (uncertainties at the 95% confidence level).”

            The introduction begins with this:

            “When the climate system is forced by natural or anthropogenic factors (e.g., changes in solar output, volcanic eruptions, and human activities), an imbalance in the TOA ERB results (Hansen et al. 2011; Loeb et al. 2012; Trenberth et al. 2014; von Schuckmann et al. 2016).”

            https://journals.ametsoc.org/doi/10.1175/JCLI-D-17-0208.1

            I ask again, can you cite me the conclusions that agree with yours, from CERES, or ERBS (are they still publishing??) or ISCPP or HIRS or AVHRR (whoever the last is), that corroborate your view that the cause of surface warming over the last 40 years is mainly a result of the amount of sunlight reaching the surface?

            Or is the “conclusion” that you all agree on something else?

          • barry says:

            Because I can quote Loeb and his CERES colleagues saying that the Earth is gaining energy because of increased GHGs.

            That seems to be their ‘conclusion’.

            Time for a new conspiracy entry?

          • Svante says:

            Kristian explanation is increased ASR, isn’t it?
            No root cause as far as I’ve seen.

          • barry says:

            I understand his view to be that the main cause of warming is the (increased) amount of solar radiation reaching the surface, which can depend on clouds, albedo and solar intensity. As I understand it, he does not ascribe the change to increased solar radiation, but rather to Earth-side changes (ie, clouds) that have modulated the insolation.

          • Kristian says:

            barry,

            You say (July 15, 2018 at 8:41 PM):

            A good place to start would be the CERES main document cited at the NCAR/UCAR website you linked to. A few pages in …

            “The CERES Science Team notes several CAUTIONS and HELPFUL HINTS regarding the use of CERES_EBAF_Ed2.8:

            A marked trend of -0.6 W m-2 per decade is observed in LW Cloud Radiative Effect (CRE) between March 2000 and February 2013. The CERES team suspects at least part of this trend is spurious …

            … While the all-sky LW TOA flux is fairly immune to the GEOS-4 to GEOS-5 change, clearsky LW fluxes are not, as they depend strongly upon the cloud mask … This problem will ultimately be resolved in Edition4 (expected to be available in early 2015) …

            The CERES team has significantly reduced the impact of geostationary instrument artifacts in CERES_EBAF_Ed2.7 and Ed2.8 compared to earlier versions (see Section 4.0). However, users are cautioned that in the SW, CERES Terra observations are used for the period from March 2000-June 2002, while both CERES Terra and Aqua are used from July 2002 onwards. Consequently, uncertainties are slightly larger prior to July 2002 …

            Clear-sky TOA fluxes in EBAF Ed2.7 and Ed2.8 are provided for clear regions within CERES footprints from MODIS pixels identified as clear at 1-km spatial resolution. This definition differs from what is used in the standard CERES data products (SSF1deg and SYN1deg), which only provide clear-sky fluxes in regions that are completely cloud-free at the CERES footprint scale …

            … Users should be aware that both of these definitions of “clear-sky” used for CERES observations might differ from what is used in climate model output … Sohn et al. (2006) note that differences in how clear-sky is defined in model output and observations can lead to regional LW TOA flux differences of up to 12 Wm-2 …

            When the solar zenith angle is greater than 90, twilight flux (Kato and Loeb 2003) is added to the outgoing SW flux in order to take into account the atmospheric refraction of light. The magnitude of this correction varies with latitude and season and is determined independently for all-sky and clear-sky conditions. In general, the regional correction is less than 0.5 W m-2, and the global mean correction is 0.2 W m-2. Due to the contribution of twilight, there are regions near the terminator in which outgoing SW TOA flux can exceed the incoming solar radiation. Users should be aware that in these cases, albedos (derived from the ratio of outgoing SW to incoming solar radiation) exceed unity.”

            That’s Ed2.8, barry, not Ed4. And that’s LW CRE (Ed2.8) and LW Clear-Sky, not All-Sky OLR. Didn’t you read this part (?): “While the all-sky LW TOA flux is fairly immune to the GEOS-4 to GEOS-5 change, clearsky LW fluxes are not, as they depend strongly upon the cloud mask … This problem will ultimately be resolved in Edition4 (expected to be available in early 2015).”

            You continue:

            And the clearest caveat comes in the latest update:

            “Uncertainties in absolute calibration and the algorithms used to determine Earths radiation budget from satellite measurements are too large to enable Earths energy imbalance to be quantified in an absolute sense. Rather the CERES data products are more useful for providing its spatial and temporal variability. The absolute value of global and regional mean net TOA flux is nevertheless important in many applications that use ERB data (e.g., climate model evaluation). To produce a globally complete representation of ERB while at the same time providing representative absolute values, the EBAF data product uses an objective constrainment algorithm to adjust SW and LW TOA fluxes within their range of uncertainty to remove the inconsistency between average global net TOA flux and EEI as inferred from in situ data. According to Johnson et al. (2016), Earths energy imbalance during July 2005June 2015 is 0.71 0.10 W m-2 (uncertainties at the 95% confidence level).”

            That’s ABSOLUTE VALUES, barry, not anomalies. Accuracy vs. precision/stability. Didn’t you read this part (?): “Uncertainties in absolute calibration and the algorithms used to determine Earths radiation budget from satellite measurements are too large to enable Earths energy imbalance to be quantified in an absolute sense. Rather the CERES data products are more useful for providing its spatial and temporal variability.”

            Word of advice, barry: Make sure you understand the contents of the argument you’re objecting to BEFORE you object to it …

            I’m ONLY discussing the ‘ToA All-Sky OLR (LW) Anomaly’ product of the CERES EBAF Ed4 dataset, nothing else. Not the absolute OLR. Not the Clear-Sky OLR. The caveats you have listed here do NOT (!!) relate to the product I’m using! OK?

            Why are you only sceptical to the CERES (and ERBS) data, barry? Why aren’t you applying some of that scepticism to the results of Allan et al., 2014?

            I’ll tell you why: Confirmation bias. And cognitive dissonance.

            Dr. Leon Festinger:
            “A man with a conviction is a hard man to change. (…) Show him facts or figures and he questions your sources.”

            You only question the data sources I use, barry, ERBS and CERES, because you don’t like what they’re telling you. Because they stir your cognitive dissonance. So you use the method of data/evidence denial/dismissal in order to reduce it. Classic.

            Allan et al., 2014, however, tell you EXACTLY what you (and Nate) want to hear …!

            So you gladly choose “theory”, the “words of experts”, and “model results” over actual observational data.

          • Kristian says:

            barry says, July 15, 2018 at 9:16 PM:

            Because I can quote Loeb and his CERES colleagues saying that the Earth is gaining energy because of increased GHGs.

            That seems to be their ‘conclusion’.

            Time for a new conspiracy entry?

            Unlike you, barry, I don’t care about the conclusions drawn by the “experts”. Nullius in verba. I don’t care about their opinions. All I care about is their DATA. And their data clearly shows us that the Earth is gaining energy because of an increase in the solar heat input to the system (+ASR), AND that the massive increase in the atmospheric content of IR-active gases is NOT observably affecting the All-Sky OLR at the ToA.

          • Kristian says:

            Svante says, July 16, 2018 at 7:49 AM:

            Kristian explanation is increased ASR, isn’t it?

            No, that is not “MY explanation”. That is what the DATA is unequivocally telling us, Svante.

            No root cause as far as I’ve seen.

            Didn’t know I needed one. So somehow the obvious reason why the Earth is gaining energy is ‘wrong’ because no “root cause” is indicated …?

            Large-scale changes in Earth’s own internal circulation (ocean-troposphere) is the “root cause” of the increase in ASR, Svante. As I’ve told you before.

            What in turn caused the ‘Great Pacific Climate Shift’ of 1976-77 and all the other abrupt regime/phase shifts in the general circulation of the Earth system that occur, however, is anyone’s guess, even though I think that Willis Eschenbach of WUWT fame has come up with a fairly good (reasonable-sounding) suggestion, that it’s all about maintaining overall balance, on different spatial and temporal scales, that the Earth system will ultimately simply adjust back and forth whenever the (im)balance is tipping or leaning too far in one direction. I think he’s on to something. But I don’t know. We have way too little good, consistent data available. Historically.

          • barry says:

            Didnt you read this part (?):

            Yes, I quoted it and bolded a part of it. Let’s try again.

            “Uncertainties in absolute calibration and the algorithms used to determine Earths radiation budget from satellite measurements are too large to enable Earths energy imbalance to be quantified in an absolute sense. Rather the CERES data products are more useful for providing its spatial and temporal variability.”

            Do YOU know what that means?

            “CERES data products are more useful for providing [EEI] spatial and temporal variability.”

            Less useful for long-term trends. That’s why there are many efforts, some of which you have referenced, that wrestle with the data to get a better climate record. And the CERES members co-author these efforts.

            Unlike you, barry, I dont care about the conclusions drawn by the “experts”.

            Oh, really?

            But MY conclusion IS supported by and agrees with the ERBS teams conclusion, as with the ISCPP teams conclusion, the HIRS teams conclusion, and the AVHRR teams conclusion. They all agree. Among themselves. And with me.

            Do you have a new definition for the word conclusion, or are you going to share what this mutual ‘conclusion’ is?

          • barry says:

            I do not know how it is that Loeb et al from CERES have the same data as you but different conclusions on what is responsible for Earth’s overall energy imbalance.

            If you’re going to accuse them of bias, then you are impugning the integrity of the compilers of the very data you use. That’s problematic.

            Or possibly they have a better understanding of the data – and Earth’s energy imbalance – than you do.

  47. Bobdesbond says:

    Salvatore says:
    “The guy that heads RSS is strongly biased toward AGW.”

    Please explain how he is “biased” while Mr Spencer is not similarly “biased” in the opposite direction. Would you describe a christian as being “biased” towards their religion? Was Newton “biased” towards his laws of motion?

  48. barry says:

    I was curious about a decadal comparison.

    Fitting in the 1998 el Nino and the 2016, so they are in each 10-year bucket, these are the results of the most recent and the previous decadal average.

    1998-2007
    0.15 C

    2008-2017
    0.19 C

    Roy puts the annual uncertainty for lower trop temps at about 0.1C, so the decadal uncertainty would be, I guess, about a tenth of that at 0.01C.

    But better math boffins could correct me on that.

    https://www.nsstc.uah.edu/data/msu/v6.0/tlt/tltglhmam_6.0.txt

  49. Neal says:

    It’s interesting to note that, despite recent short-term cooling, the running average (RA)in June 2018 is the higher than the RAs of the entire data-set, except for a brief period around the exceptionally strong 1998 El Nino. The June 2018 RA is higher than the RAs of the all El Ninos between 1979 to 1995 and the 2010 El Nino.

  50. ren says:

    The jet stream in the Atlantic currently prevents the formation of a hurricane. You can see a very strong convection over Florida.
    https://www.tropicaltidbits.com/sat/satlooper.php?region=nwatl&product=ir

Leave a Reply to JDhuffman