While the wind, storm surge, and freshwater flooding from Category 1 Hurricane Florence will no doubt cause massive damage, we should remember that – historically speaking – major landfalling hurricanes were more frequent in past decades.
Contrary to popular perception, the number of major hurricanes making landfall in the U.S. has dropped by an average of more than 50% since the 1930s:
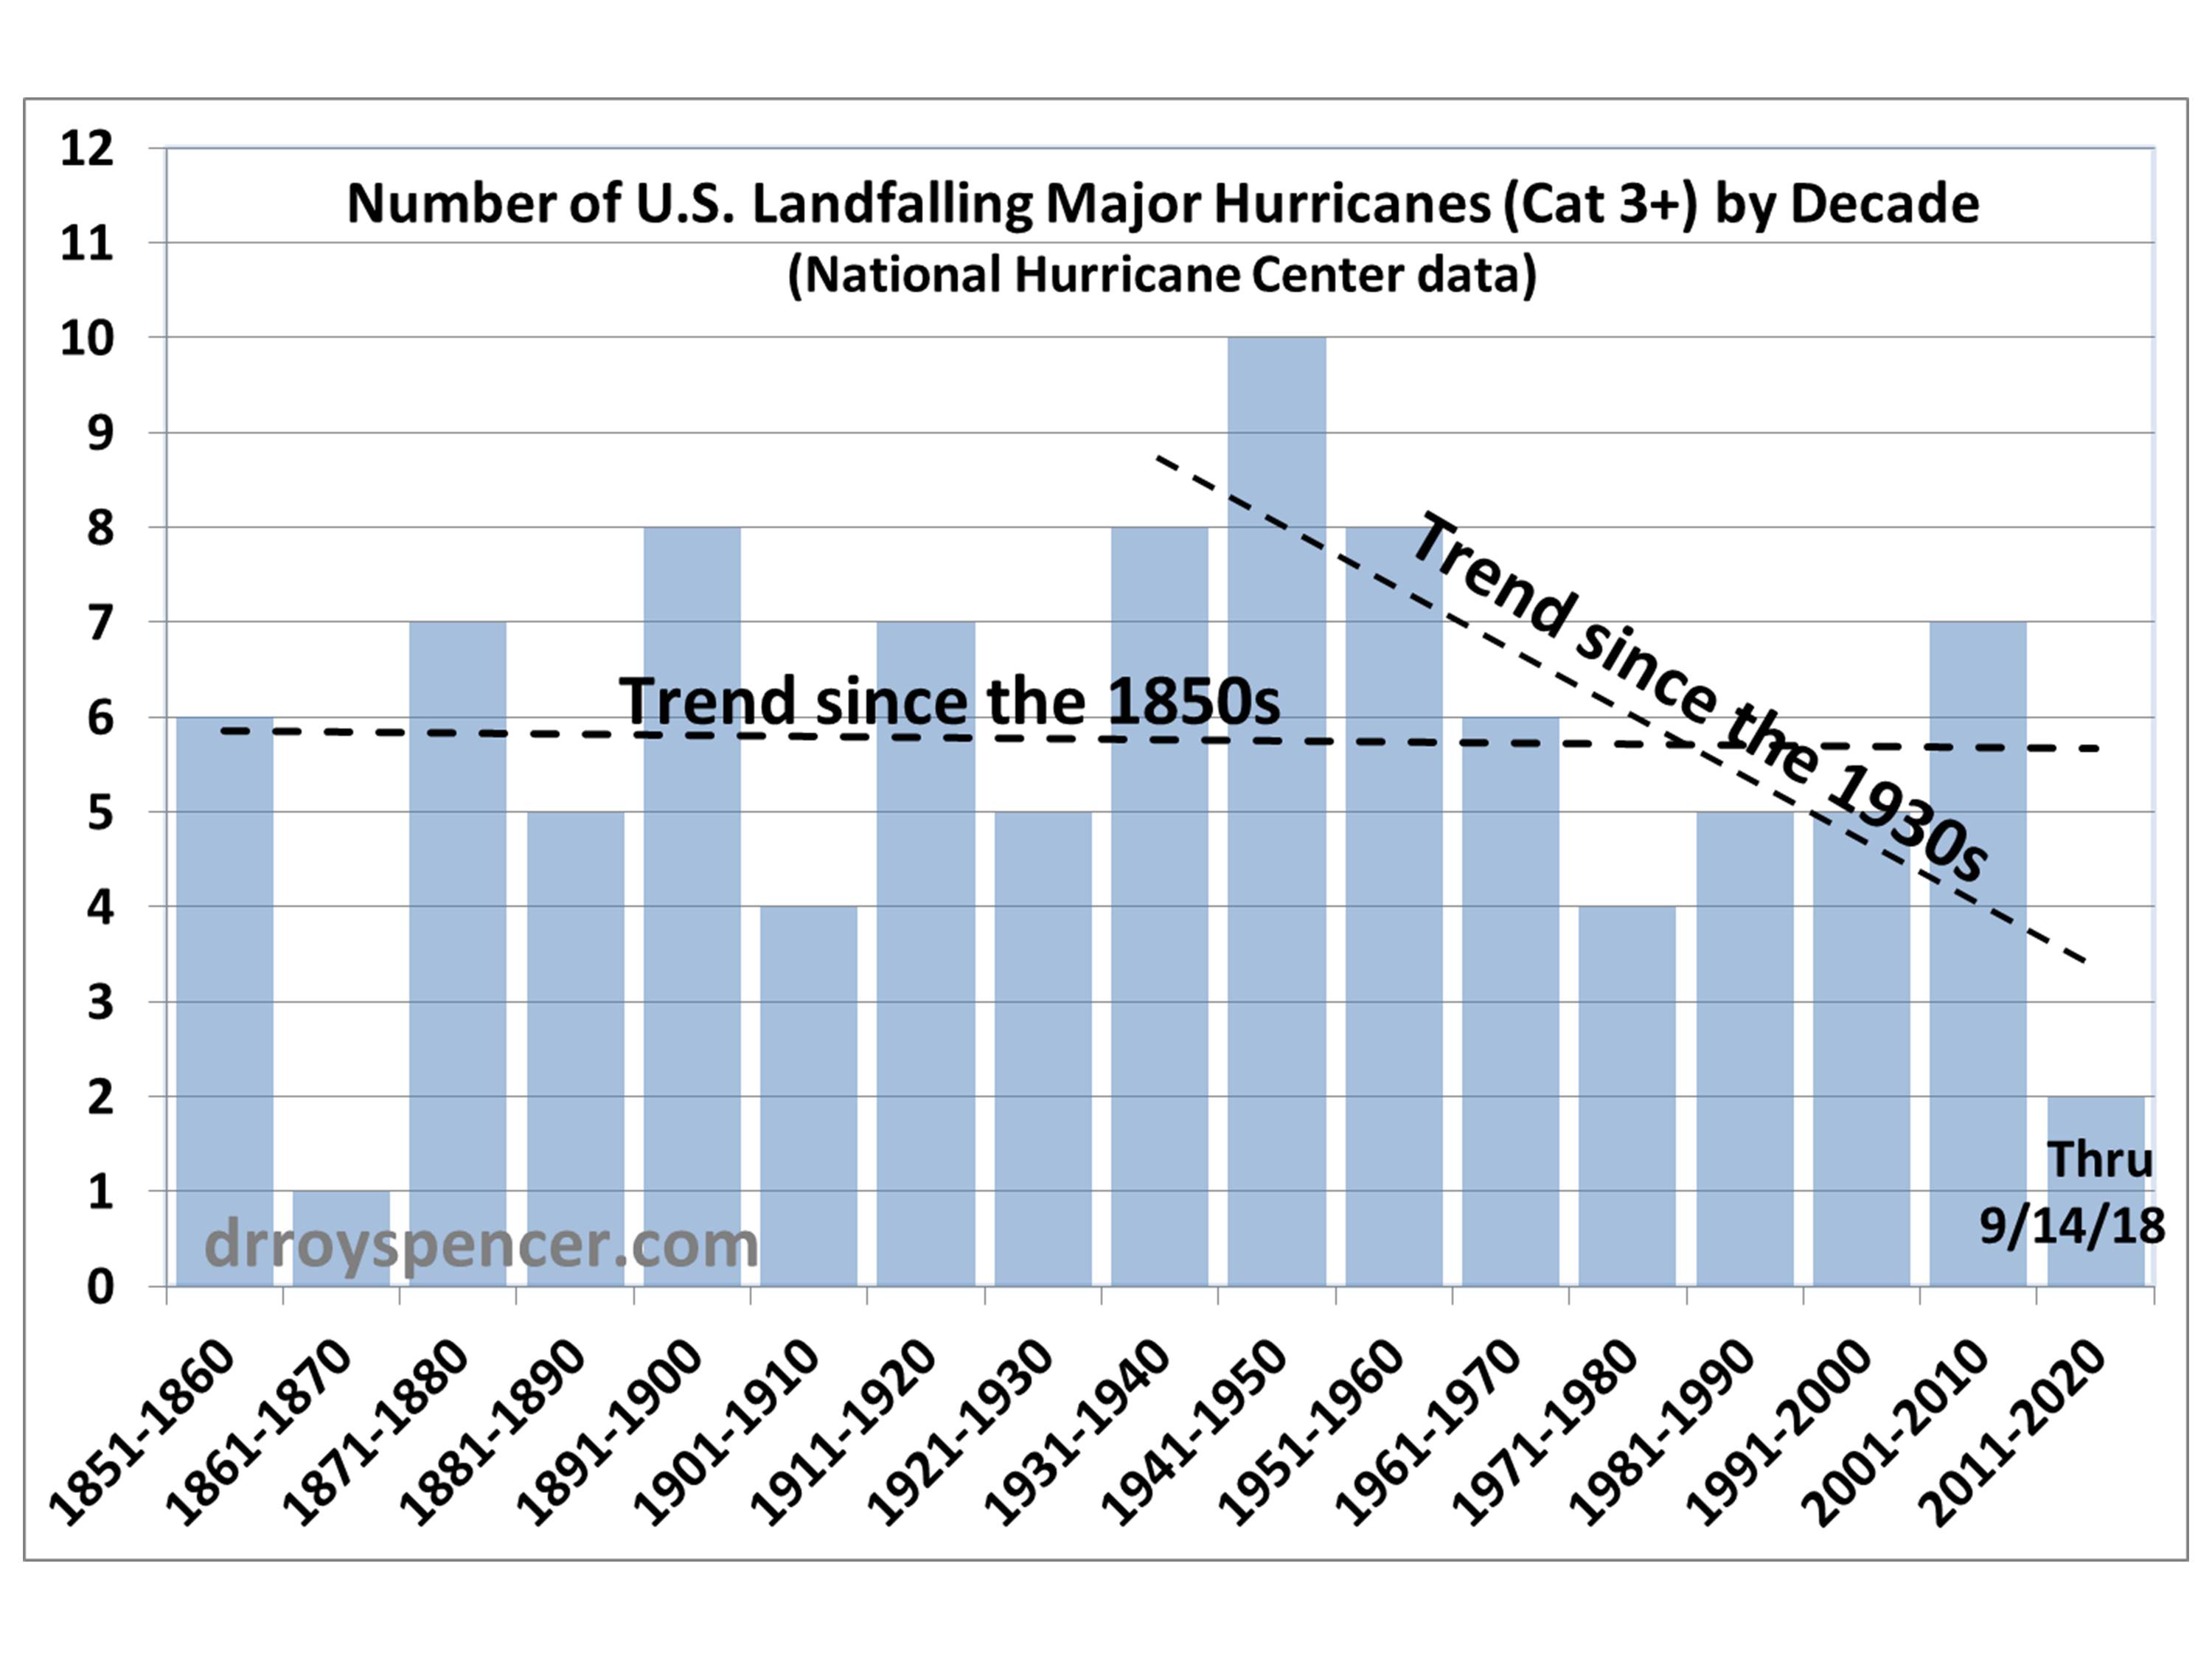
While you might object that the current decade isn’t over with yet, if we assume the long-term average of 6 storms per decade continues for the remaining 2.5 hurricane seasons, the downward trend since the 1930s will still be a 50% reduction.
Why did I pick the 1930s as the starting point?
Because yesterday I presented U.S. Government data on the 36 most costly hurricanes in U.S. history, which have all occurred since the 1930s. Since the 1930s, hurricane damages have increased dramatically. But, as Roger Pielke, Jr. has documented, that’s due to a huge increase in vulnerable infrastructure in a more populous and more prosperous nation.
It’s not due to stronger hurricanes hitting the U.S. or to global warming.
Is there data for Tornado’s and other storm’s too. What about drought and other predictions of the climate change models.It would be nice to have 1 chart with the predictions and the reality of these things.
ri….”What about drought and other predictions of the climate change models.It would be nice to have 1 chart with the predictions and the reality of these things”.
There is no reality to them, the IPCC was forced to change the word ‘prediction’, to ‘projection, to reflect the fact climate models are unvalidated hence can predict nothing.
Thus far, since 1988, there is no evidence of climate change that can be related to anthropogenic causes.
About 5 years ago, hurricane expert Chris Landsea claimed there is no evidence to connect the severity and frequency of hurricanes to anthropogenic causes.
Another hurricane expert, Bill Gray, didn’t go much for the CO2/hurricane con either.
https://en.wikipedia.org/wiki/William_M._Gray
Gordon Robertson says:
…the IPCC was forced to change the word prediction, to projection,
Explain how any climate (or economic) model could do a prediction.
Maybe you should ask the IPCC, DA.
Not limiting to land-falling in CONUS, these are the numbers of majors by decade (starting year). The last decade scaled by 10/8.7 to account for 8.7 instead of 10 seasons.
1930 22
1940 20
1950 29
1960 28
1970 16
1980 17
1990 25
2000 36
2010 30
The trend is positive with slope 1.0/decade.
Data from wikipedia.
Nate, I bet if you charted the decadal hurricane count with trans-oceanic air traffic you might find a correlation. A lot of historical data changes follow along with technological change.
Just guessing though.
No, the trend is not positive. There is no trend. Nor is there a trend in Roy’s data.
Of course I use “trend” to mean “meaningful trend” because that is the only sense that has meaning.
nate…if there was an upswing in the frequency post-2000 it was due to satellite coverage and a deeper interest in tracking hurricanes. No one would take much note of a hurricane that did not reach land and caused no damage or fatalities at sea.
Between 1930 and 1960, there was no means of tracking hurricanes.
Gordon Robertson says:
Between 1930 and 1960, there was no means of tracking hurricanes.
There were ships at sea, very interested in what other ships were reporting re: hurricanes. And increasing amounts of air traffic. I doubt any Cat 3+ hurricanes went unnoticed.
Citations?
David wasn’t referring to tracking, although that was the comment he quoted as if he was referring to it. But I’m sure it was relevant, to him.
Nate says:
September 14, 2018 at 10:20 AM
The trend is positive with slope 1.0/decade.
________________________________________________
If I didnt miscalculate, trend is even more: 1.44/decade
https://preview.tinyurl.com/Major-hurricanes
We will of course forget about Puerto Rico, Japan, Philippines, Fiji, Windstorm Friederike, Cyclone Marcus, etc., etc. These obviously just do not count since they are Non-USA and only killed non-USA people, and only USA counts for climate.
A lovely bit of “Whataboutism” there. Your AGW scam is collapsing around your ears.
Yes. Even the president can’t acknowledge the devastation in Puerto Rico. And there have been some massive typhoons in the NW Pacific in recent years. Mangkhut, hitting the Philippines right now, is being called a “super typhoon” with winds up to 260 kph.
David
There have been major typhoons hitting SE Asia since time immemorial – not just recent years. The populations of those areas have increased significantly so both the death toll and cost of damage will have increased. Has the size or frequency of the typhoons increased? If not, they are just weather for those unfortunates in their path.
I have monthly data on ACE for the Western Pacific from Jan 1970 to May 2017:
http://models.weatherbell.com/global_ace_monthly.dat
In order to smooth out seasonal fluctuations, I’ll use the 12-month moving sum of WPAC ACE.
The average over that time period is 290.
The trend is +5.8 per decade, or about +2.0% per decade (slope/avg).
This YTD, NW PAC ACE is 35% ahead of average:
http://tropical.atmos.colostate.edu/Realtime/
YTD global ACE is 65% ahead of average.
David
If your data shows it going up, then somewhere else is missing out as Ryan Maue shows no trend for Northern Henmisphere and he shows a different worldwide YTD to you
http://wx.graphics/tropical/
But then what would he know? He has only got a PhD and still works in the subject.
Chris, Maue’s data and the one I cited from colorado.edu don’t differ by much — it looks like perhaps one is being updated faster than the other.
Still, the data you cited show that YTD ACE is above average in almost all basins. And by a good bit in the NH, WPAC and global.
I don’t disagree it is above average so far this year, but there is no trend, either in numbers or energy. That is why it is called weather.
Chris, a trend:
“Intensification of landfalling typhoons over the northwest Pacific since the late 1970s,” Wei Mei & Shang-Ping Xie, Nature Geoscience volume 9, pages 753757 (2016).
https://www.nature.com/articles/ngeo2792
This page cites peer reviewed papers that found:
* The fingerprint of global warming has been identified in the accumulated cyclone energy (ACE) in 2015 in the Northwest Pacific.[1]
* There has been a global increase in the observed intensity of the strongest storms.[2]
http://www.climatesignals.org/climate-signals/intense-northwest-pacific-typhoon-frequency-increase
There’s also this:
“Intensification of landfalling typhoons over the northwest Pacific since the late 1970s,” Wei Mei & Shang-Ping Xie, Nature Geoscience volume 9, pages 753757 (2016).
https://www.nature.com/articles/ngeo2792
Pielke Jr’s methodology has a flaw in it, because the costs don’t include all the money spent to reduce hurricane damage — seawalls, jetties, levies, projects like the MRGO — better built houses and buildings, monitoring satellites, other money spent on hurricane monitoring and reporting, etc., plus money spent to counter sea level rise and the drop in coastal housing values ($14 B already, by one recent study).
If it occurred today, would the 1938 New England Hurricane (Cat 3 when it entered Connecticut) kill 682 people and damage or destroy more than 57,000 homes? Very unlikely. Why not? Because we’ve spent a lot of money to be better prepared. RPJr doesn’t count that money.
DA, your methodology has a flaw in it. You ignore the hundreds of billions wasted on the AGW hoax.
Better built houses are incremental in cost. What is the right number? Perhaps 10% increase in cost, but compared to the increase in spending on new housing, more footage, higher value interiors etc, that number decreases to insignificant.
Satellites are an amusing idea to attribute costs – I don’t believe that is warranted. Hurricane monitoring in general is a sunk cost, no different than monitoring whales and snail darters.
“drop in coastal housing values”…. Where. Not in Wrightsville Beach where a duplex is valued at close to $3,000,000 and Florence is still visiting.
Anyway, David, do you make it up as you go along? (A rhetorical question)
Axios 8/23/18: “According to a new report by the nonprofit First Street Foundation, housing values in New York, New Jersey and Connecticut dropped $6.7 billion from 2005 to 2017 due to flooding related to sea level rise. Combined with their prior analysis of 5 southeastern coastal states with $7.4 billion in lost home value, the total loss in 8 states since 2005 has been $14.1 billion.”
https://www.axios.com/sea-level-rise-costing-billions-in-home-prices-7920a7a8-8db4-45b1-ad21-357c4d522fcb.html
If accurate, that is really an insignificant amount.
an example for comparison.
The value of property in Charlotte, NC – all real estate – is approximately $100,000,000,000. For NY, Ct and NJ, the 6.7 billion would be a rounding error.
In other words, so what.
They should stop building on the coast.
Flood plains in general.
Hardly insignificant if you’re a homeowner who is losing money. Eventually coastal homes will be uninhabitable due to sea level rise — mortgage companies won’t loan for them, and insurers won’t insure them. Water supplies will be ruined by ocean intrusion.
The value of those homes will be lost. Guess will make the homeowners whole? Taxpayers, mostly.
This is already happening in NJ, Miami Beach, Tangier Island (MD), Louisiana…. Taxpayers have so far paid $750 M to help these people out — or, as in Louisiana, move them ($48 M for 500 people).
And sea level rise is still in its infancy…. Keep watching, Lewis. Sea level will ultimately rise by 10-20 meters per degree C of global warming, though it will take millennia.
https://davidappell.blogspot.com/2018/09/sea-level-rise-is-already-starting-to.html
More on the costs of sea level rise here:
https://davidappell.blogspot.com/2018/09/sea-level-rise-is-already-starting-to.html
Mike M.
Agree, neither trend has much significance. Both have large error.
But with smaller event numbers, Roy’s is less significant. But no one looking for confirmation of biases cares.
I posted this last night on Tamino’s blog:
A lot of variables need to come together in order for a hurricane to be steered towards land. How does warming affect those variables? Seems like it could go either way..fewer landfalls just as likely as more.
http://www.hurricanescience.org/science/science/hurricanemovement/
Perhaps even something related to AGW itself is causing fewer landfalls. Speculation.
DA believes AGW cause both more landfalls and fewer landfalls.
He loves his pseudoscience….
I’ve said very little about landfalling hurricanes. I don’t care either way, and am happy to take the data as it is.
David is a true believer. When he is told what to think by Mann et al, he’ll let us know what he believes.
Yes, Lewis, AGW is real, it’s happening, with scientific certainty. It will keep happening, until even extreme deniers like you will have to admit you were wrong.
“AGW is NOT real”.
“It’s NOT happening”.
(Just helping you, DA, until you can learn some physics.)
Right! That’s the ticket!
The reason the alarmists started talking about costs is because the numbers on the intensity of land falling hurricanes don’t support their narrative. Unlike temperatures, they have not found a way to systematically change the records minimize the super storms of the past. It appears that Florence will be an expensive storm even though it was not a particularly powerful one at landfall. So let’s talk financial costs despite the fact that it is highly dependent on where a particular storm makes landfall.
So much misinformation out there now days in the general media.
Don’t think Florence comes close to “The Great Atlantic hurricane” that struck the east coast in Sept. 1944.
This is the sort of thing I’m talking about. Could there be a trend?
“It was almost like we had a hurricane repellent over the U.S. East Coast and Gulf Coast. The storms were out there, but they just didn’t approach the U.S.”
*******
Lots of Hurricanes, Few U.S. Landfalls:
“During the early part of the 2010 season in June and July, upper-level winds known as wind shear hindered the development of tropical storms.
Wind shear diminished as the hurricane season reached its peak in mid-August, and a flurry of storms formed. But low-pressure systems kept the storms at sea.
This year was the first time in recorded history that as many as 12 named hurricanes formed in the Atlantic without at least one of them making a U.S. landfall, said forecasters Phil Klotzbach and William Gray at Colorado State University.”
https://relay.nationalgeographic.com/proxy/distribution/public/amp/news/2010/11/101130-2010-atlantic-hurricane-season-science-environment
A pre-event attribution study from Stony Brook (my graduate school alma mater!), found
“Compared to a world w/o climate change:
– Florence will have 50% heavier rainfall
– 50mi wider at landfall, boosting storm surge”
via https://twitter.com/EricHolthaus/status/1040007537234530304
Press release:
https://you.stonybrook.edu/kareed/2018/09/12/estimating-the-potential-impact-of-climate-change-on-hurricane-florence/
DA, maybe you could get a refund from your alma mater.
Obviously you didn’t learn much.
DA should get damages, not only refund.
Oh dear –
“Modified Forecast: With observed initial conditions modified to remove the estimated climate
change signal from the temperature, moisture, and SST fields to represent a world without climate change. This is a counterfactual forecast of Hurricane Florence if it were to occur in a world without human induced global warming.”
More stupid and delusional modelling. “Climate change signal”?
These peanuts have no clue at all. A “pre-event” attribution of a guess to another guess. A “counterfactual forecast” indeed!
They never learn, do they? Back to reading tea leaves, fellas. You can’t prove you won’t get better results than using all your nonsensical pseudoscientific posturing, can you?
Cheers.
DA…”A pre-event attribution study from Stony Brook (my graduate school alma mater!)…”
I thought Stony Brook was a penal colony.
The whole conversation is biased towards those storms that make US landfall.
Strongest hurricanes:
1) Patricia
2) Wilma
3) Gilbert
All struck Mexico
*Wilma later struck the US as a much weaker storm
Ms Snape was unable to understand the title:
U.S. Major Landfalling Hurricanes Down 50% Since the 1930s
Is this number statistically significant?
If so, what’s causing it?
Who cares if you can blame it on Trump? /sarc
Ranked by wind speed instead of barometric pressure:
1) Patricia
2) Allen
3) Irma
4) Wilma
5) Gilbert
None made initial landfall on US mainland
https://www.google.com/search?q=strongest+hurricanes&ie=UTF-8&oe=UTF-8&hl=en-us&client=safari#imgrc=YV0f-hunpEHAQM:
* Patricia was a Pacific hurricane
Huffy,
From the title, some readers might conclude that hurricanes are not getting stronger or more frequent.
Like Nate, I’m trying to add some perspective.
S,
Complete nonsense. Trying to pretend you have a clue impresses only the sublimely stupid and ignorant.
Carry on. Maybe you can create some intense destructive hurricanes by invoking the magic of CO2. Only joking. The atmosphere behaves chaotically. Perspectivate that, all you wish.
Have you found a useful description of the amazing GHE yet? Apparently, it has nothing to do with greenhouses, nor is it a scientific effect, so describing it should be a piece of cake to a perspectivicator like you. Maybe Nate could help, do you think? Mutual perspectivication might assist enormously!
Cheers.
As usual, Mike offers illuminating, insightful, fact-laden commentary.
Ignore him. Nothing annoys him more.
Eye of tropical storm Florence is now on the coast of South Carolina. It moves to the west at a speed of just 7 km / h. The wind is blowing at speeds up to 100 km / h.
Better information is available at a number of web sites. Your snippers are too late and out-of-date, ren. As usual. No one is looking to you for the latest information.
Is that really so, David? Are you fracking aspergernerds all?
DA…”Your snippers are too late and out-of-date, ren. As usual. No one is looking to you for the latest information”.
The latest Appell whine, as if anyone pays any attention to it.
The increase in the activity of hurricanes occurred at the same time as the increase in the activity of the solar wind (geomagnetic storms). That is why several hurricanes were created at the same time.
https://files.tinypic.pl/i/00971/7embytied358.png
Geomagnetic activity increased already in August 2018.
https://services.swpc.noaa.gov/images/solar-cycle-planetary-a-index.gif?time=1535943002000
Another strong jump in the speed of the solar wind.
https://images.tinypic.pl/i/00971/s6c4keq4ytef.png
ren…”Another strong jump in the speed of the solar wind”.
Whatever it is, ren, this is the coldest, wettest overall September we’ve had in Vancouver, Canada for a long time. It’s still comfortably warm on sunny days but night time temps have dropped to 10C range.
On my late night walks I now have to wear a toque (knitted, wool head hat) and gloves.
Strong downpours in North Carolina.
https://pics.tinypic.pl/i/00971/79va1j2d54pa.png
“As Super Typhoon Mangkhut continues to sweep across the island of Luzon in the Philippines, it appears that the massive eye of the storm has collapsed in on itself. Even after making landfall and losing its eye though, the storm is still a massive Category-5 strength, shooting out rain, thunder, and lighting across thousands of square miles. In other words, if Hurricane Florence was Loki, joyfully spreading disaster and chaos, then Mangkhut is definitely Thor. Or, maybe it’s simply the Hulk. Actually, it’s more like a typhoon angel and a mutant pirate missing an eye had a baby, that baby was an avenging pirate/angel, then the angel baby grew up, it exposed itself to gamma radiation, gained incredible size and strength, stole Thor’s hammer, and used it to attack the Philippines.”
https://www.facebook.com/Okinawatyphoonpics/
The jet stream in the Atlantic will now push Florence to the west.
Similarly, the typhoon in the Pacific is heading west towards China.
And the rain in Spain will fall mainly on the plain. Or something.
At least you didn’t use “plane”, as before. Maybe you are not yet too brain dead to learn.
Now try to learn some physics.
Brane!
The mainstream media featured an excellent article on hurricane Florence/climate change:
https://amp.usatoday.com/amp/1289272002
Contrary to popular perception, the number of major hurricanes making landfall in the U.S. has dropped… since the 1930s
Is this ‘popular perception’ something that can be verified, or is it a handy rhetorical device akin to news reporters using the diaphanous phrase “Some say…”?
Is there any reason to think that Atlantic hurricanes specifically hitting the US says anything about overall change?
The number of US land-falling hurricanes is going to be essentially random, owing to the large area storms may travel in the Atlantic. Consequently, I wonder why this specific metric is of interest. Doesn’t seem to be about the well-being of Americans who might endure such storms, and it isn’t about IPCC forecasts of hurricanes, which doesn’t predict increased frequency.
The center of Florence is on the South Carolina coast. It will turn west.
Looks depression to me.
https://www.nhc.noaa.gov/
Well, with Michael, the bar for the current decade just increased by 50%.
And your ‘trend’ just changed significantly. Illustrates how dumb this chart is. It reflects the high variability of a small number of dice rolls, and not much else.
Its like me going bowling: lots of high velocity gutter balls, and rarely, some spares and strikes.
So for 8 decades, you’re taking the numbers (8,10,8,6,4,5,5,7) and claiming that there’s a negative trend.
If you’d done a chi-squared test, you’d have found that you can expect data at least as variable as this about 75% of the time from a zero trend background.
There’s no evidence here for a negative trend. Even including the low value in the current decade. There’s also no evidence for a drop from the 1851-1930 mean.
This is pre-undergraduate statistics. You’re supposed to be a professional. It’s a bit pathetic.
Wikipedia is NEVER used a legitimate source of information by professionals, DA.