Dangerous, Record-Breaking Cold to Invade Midwest, Chicago

January 24th, 2019 by Roy W. Spencer, Ph. D.

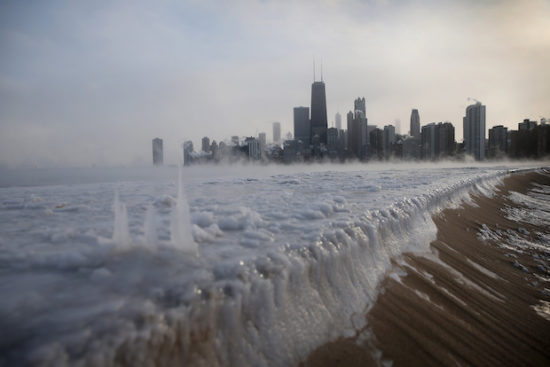
Lake Michigan ice as temperatures plunged to -16 deg. F in Chicago, IL on Jan. 6, 2014. The low temperature on Wednesday, January 30, 2019 could approach -30 deg F in the Chicago suburbs. (Getty Images)

A “Siberian Express” weather disturbance currently crossing the Arctic Ocean will meet up with the semi-permanent winter “polar vortex” over Canada, pushing a record-breaking cold air mass into the Upper Plains and Midwest U.S. by Wednesday.

Chicago All-Time Record Low?

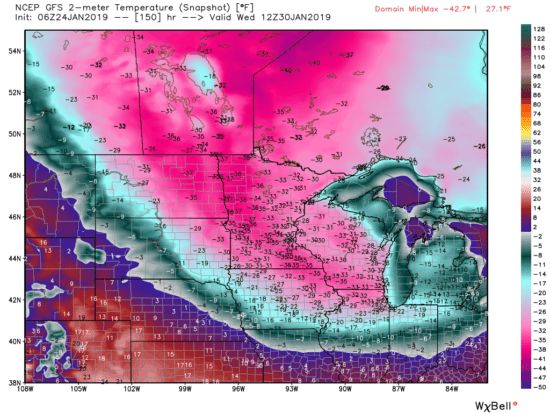
Both the European (ECMWF) and U.S. (GFS) weather forecast models are in agreement that by Wednesday morning temperatures in the Chicago suburbs will be approaching -30 deg. F. The all-time official record low for the Chicago metro area was -27 deg. F (O’Hare) on January 20, 1985, and that 34 year old record could fall as the ECMWF model is forecasting -32 deg. F for Thursday morning while the GFS model is bottoming out at -26 deg. F on Wednesday morning. Of course, these forecasts will change somewhat in the coming days as the cold wave approaches.

Dangerous Wind Chills

Like the record-breaking event of January 1985, the frigid temperatures will be accompanied by strong winds — gusting to 20 to 30 mph — with wind chills plunging to -60 deg. F at times. This is dangerously cold, and I suspect schools will close, water lines will freeze, and travel will be discouraged. Again, this event is still several days away, but the public should be aware of the potential severity of this cold wave.

Not Just Chicago

The GFS forecast temperatures for Wednesday morning shows most of the upper Midwest will be well below zero, and temperatures might not get above -20 deg. F even at midday on Wednesday as far south as northern Indiana. Again, the strong northwest winds will be pushing this air southeast, and Thursday morning will also bring record-breaking cold into the Ohio River Valley.

Forecast temperatures Wednesday morning, January 30, 2019 from the GFS model. (Graphic courtesy of WeatherBell.com).


245 Responses to “Dangerous, Record-Breaking Cold to Invade Midwest, Chicago”

Toggle Trackbacks

  1. ren says:

    The weather in the east of the US will not be boring.
    https://pics.tinypic.pl/i/00978/y5kvt3dvagkl.png
    After heavy rainfall to the east US, frost will return.
    https://images.tinypic.pl/i/00978/y4n9dhshwjyp.png

  2. James M. Thompson says:

    Not news I wanted to hear. I live about 50 miles NW of Chicago so I expect it will be a bit chilly here. I’m hoping my heater can handle it!

  3. ren says:

    Forecast of the polar vortex in the lower stratosphere on 30/01/2019.
    https://images.tinypic.pl/i/00978/bpdu0a58qh4m.png

  4. RW says:

    This is to be blamed on global warming.

  5. Entropic man says:

    Don’t worry.

    This forecast is based on computer models and it is an article of faith here that computer models are always wrong.

    /Sarcoff

    • depends on the model, and what it’s being used for. At least weather forecast models have a long history of testing and we know how accurate they are, on average.

      • John F. Hultquist says:

        The question to ask of a model is: Are you useful?
        I just sent this post on to friends and relatives that are east of Chicago, in Mich, Oh, & PA.
        I suggested they stock up, stay in, and stay warm.
        I’m too far away to help if they get in trouble.
        I say this is useful.

        Thanks Roy.

      • Gordon Robertson says:

        Roy…”At least weather forecast models have a long history of testing and we know how accurate they are, on average”.

        Not to mention they are programmed with real data from real time weather scenarios and all the experience garnered from previous forecasts.

        Patrick Michaels is known for predicting future climate from past trends, and as far as I know he has been far more accurate than climate models. It seems to me weather forecasting models use the same technique.

        It would be wrong to claim weather models are 100% validated because even meteorologists admit they are not always dead on. However, one could argue a high percentage of validation based on the overall accuracy of their predictions.

        Climate models, on the other hand, are programmed with questionable physics, such as a warming factor expected from CO2 and a positive feedback action that remains unexplained in mainstream physics.

    • coturnix says:

      Correct me if i’m wring, but weather models and climate models generally are very different from one another, with weather models being high resolution but limited scope, while climate models are of pure resolution supplemented by widely speculative ‘parametrizations’ and ‘adjustments’ while at the same time everything everywhere. Weather models have proven domain and rangewhere they are valid, climate models are just computer games, which may or may not be a good suppoting tools for qualitative reasoning about nature, but instead they’ve become a new deus-ex-machina oracles whose word bearsh jesus-quality weight to the followers of those new religions.

      • barry says:

        UK Met Office use the same machines for weather and climate modeling. I think they are the only group that has so much in common between their climate and weather modeling.

        • coturnix says:

          I think, that’s not that important. The scope is much more significant. The weather model is well-tested but only on the very short timescales and it only needs to predict a limited set of variables – all the others are given to it from the actual measurements. In principle, i think that means that the model may even be severely erroneous overall as long as the error grows slowly enough not to show up in 5 to 10 days it actually gives correct predictions for, and yet still be useful. Thus i’m not convinced that the fact that the model used gives correct short-term predictions necessarily means that it would give better long-term predictions. The task of long-term climate model is much harder and there is no way to verify it… one may just either believe it or not. And that is why it is ok to believe weather predictions while at the same time expressing a distrust to the least of climate model exercises in GIGO. Because, as i see it, problem of climate predictions is that even if they are correct – we cannot know that.

    • Stephen P Anderson says:

      If the model is based on sound science it has a good chance of being correct.

      • rah says:

        Eventually. The US and European models a month ago were showing higher than average temperatures for the very regions in the US for this period, they are now showing extremely lower than average temps now. The Canadian was the first model to catch on and start showing what Joe Bastardi and his team at Weatherbell this cold he had been forecasting long before. The US and European didn’t start catching up until two weeks ago.

  6. Bindidon says:

    Indeed: it’s not just Chicago…

    Here you see Illinois, Iowa, Wisconsin and Minnesota for thre night of Jan 29-30

    https://www.wetteronline.de/?pid=p_city_local&sid=Pictogram&diagram=true&fcdatstr=20190130&daytime=night&iid=MN

    And here Dakota

    https://www.wetteronline.de/?pid=p_city_local&sid=Pictogram&diagram=true&fcdatstr=20190130&daytime=night&iid=ND

    All you see of course is based on forecasting models.

    But as Entropic man said, models are for many people good if and only if they predict cooling – even if it is just for a couple of days.

    • ren says:

      A few days in the middle of winter?

      • hmm says:

        I must have missed his post about Australia’s record-setting high temperatures last week.

        • An Inquirer says:

          hmm,
          Australia had record-setting temperatures if you ignore some parts of history.
          The MSM insures we have plenty of coverage — often misleading coverage — of warm events. It is okay if Dr. Spencer talks about events that MSM ignores or misconstrues.

        • Gordon Robertson says:

          hmmm…”I must have missed his post about Australias record-setting high temperatures last week”.

          You can’t believe anything out of Australia since its Bureau of Meteorology are climate alarmists intent upon exaggerating the actuality.

          • Myki says:

            Idiot. Try blaming the massive fish kills on the BoM.

          • crakar24 says:

            The fish kills are triggered by a cold “snap” whatever that means and the BOM are not to be trusted

          • Svante says:

            Cold snap in the summer?
            Are you to be trusted?

          • Myki says:

            “The fish kills are triggered by a cold snap ” !!!!

            All right, have it your way idiot number 2.
            The BoM has fooled the entire nation (and the fish) into believing that we are experiencing heat waves rather than cold snaps.
            Gee, they must be clever. Maybe as clever as the Russians who conned the gullible into voting for Trump!

          • An Inquirer says:

            Myki and Svante,
            If we are all talking about the same fish kills, the New South Wales government reported that the massive January fish kills were caused by an 18 degree (C) drop in temperature. Yes, that drop occurred in Austrailia’s summer.
            If one follows widespread deaths of water life — whether sea turtles, or manatees, or dolphins or the perch, or cod — cold temperatures or drop in temperatures is often the cause.

      • barry says:

        So… temp records are suspicious for record hot temps but not for record cold temps?

        And the MSM is not covering the frigid weather in the US?

        That’s some interesting ‘reality’ there.

    • rah says:

      Indeed it looks like Indiana will get some of that also. They were showing -30 for Chicago but I doubt it will get much below -20 there. There may be some new record lows in Indiana but the all time state low of -36 F set at New Whiteland 1/19/94 appears to be safe for now.

  7. ren says:

    “From this Thursday night through late next week, it will be a very cold stretch and high energy draw from the Plains to the East Coast,” according to AccuWeather Lead Long-Range Meteorologist Paul Pastelok.
    https://accuweather.brightspotcdn.com/dims4/default/d2bccc7/2147483647/resize/590x/quality/90/?url=http%3A%2F%2Faccuweather-bsp.s3.amazonaws.com%2Ff2%2F92%2Ff1c3a1cb4d11a86b2f234a692e05%2Farctic-outbreak-jan-24.jpeg

  8. ren says:

    This is the forecast of stratospheric polar vortex on January 30, 2019.
    https://images.tinypic.pl/i/00978/b78nroggujns.png

  9. Nate says:

    Its 58 and raining where I live in New England. All the outdoor hockey rinks are now puddles.

    In fact, the outdoor rinks, a long tradition here, have become quite impractical in recent years.

  10. I just checked the GFS and the GFS FV3 models at cod.edu. They disagree with each other for Chicago’s temperature at 12Z-15Z Wednesday. As I see, the GFS is predicting -28 F, the GFS FV3 is predicting -16 F. I’ll be interested in seeing what these two models predict once they agree with each other.

    • I see that these two models are now agreeing with each other. GFS shifted to make Philadelphia less cold (staying above zero, the Thursday 1/24 12Z GFS predicted Philly getting below zero), but the news is not good for Chicago. GFS FV3 shifted to agree with GFS that the Wednesday morning temperature will be around -30 F at or near O’Hare Airport.

    • 12Z and 15Z Wednesday are now close enough for the NAM to have forecasts for these times. The 12Z Sunday GFS run is currently predicting -30 and -29 F for these times respectively for someplace in or near Chicago, the 12Z Sunday NAM run is currently predicting -21 F for these times.

      The 12Z Sunday run of the GFS FV3 is predicting -37 and -35 F for these times. I wonder if this model is any good? So far, the GFS has been steady in its forecasts up to 6 days.

    • As of the 12Z model runs of Monday 1/28, the 48 hour forecast (6 AM CST Wednesday 1/30) for a point in/around Chicago is:

      NAM: -19 F (Maybe -22 F near O’Hare)
      GFS: -29 F (Maybe -30 F near O’Hare)
      GFS FV3: -36 F

      The model disagreement continues – but that seems to be confined to the temperature 2 meters above the surface. At the 925 mb/hP level, forecast by GFS to be ~1700 feet above the official elevation of O’Hare Airport, all three of the above models agree at -34 C, about -29 F.

      Meanwhile, as of ~9:30 PM CST Monday 1/28, the National Weather Service is predicting the low Wednesday morning to be -22 F at O’Hare, -21 at Midway.

    • The Tuesday 12Z model runs are in. Their 24 hour forecast 2m temperature at some point in/near Chicago is -22 F for the NAM, -27 for the GFS, -29 for the GFS FV3.

    • The 0Z Wednesday GFS and NAM models are in. For the point in/near Chicago shown in the default sector view (Continental US) of https://weather.cod.edu/forecast/

      The 12-hour forecast for 6 AM CST is:
      -25 F according to GFS
      -22 F according to NAM

      As of a few minutes before 10 PM CST Tuesday 1/28,
      readings and forecast by the National Weather Service:

      Midway airport was -6 F, forecast low -22 F
      O’Hare Airport was -7 F, forecast low -24 F

    • Thursday morning 1/30 lows were -21 F at O’Hare, -20 F at Midway, not quite as cold as on Wednesday 1/30.

  11. steve case says:

    We are just north of Milwaukee and bitter cold has been a thing of the past for over 20 years.

    Lowest temperature by year Milwaukee, WI since 1870:

    http://www.aos.wisc.edu/~sco/clim-history/stations/mke/MKE-LOW-T-ANN.gif

    I will be surprised if we get close to -20F this winter.

  12. ossqss says:

    And all this time I thought it was just a figure of speech……

    https://i0.wp.com/i.pinimg.com/originals/06/39/0d/06390d1552f2438632b730b653d6967f.jpg

  13. Tommy says:

    Roy,
    How does this relate with natural and man change in climate. Or is it just that sometimes climate goes through this extreme events? I am not part of the climate hysteria, in fact i relate more with your opinion on the matter. I just want to know your opinion on this one.
    Salute
    Tommy

    • John F. Hultquist says:

      The continental location of the north-central U.S. provides for a mix of both cold and warm-moist air masses. Thus, weather extremes are part of the climate. The first European to visit North Dakota (Pierre La Verendrye) did so in 1738. After that there are some reports of severe weather. The climate is the same as then. The reporting of it has improved.

      Snow storm, cold not so much ( -10 C ):
      https://en.wikipedia.org/wiki/1967_Chicago_blizzard

      For cold -40s and lower, see this one:
      https://en.wikipedia.org/wiki/Great_Blizzard_of_1899

    • Ric Werme says:

      I like to tell people the midwest has the most extreme weather and the east coast has the most variable weather.

      The continental location of the midwest exposes it to weather that has had a long time to chill in Canada or a long time to heat up coming from the Gulf of Mexico.

      New England gets air masses (typo: asses!) from all sorts of regions and often multiple regions at once, e.g. raw, moist air from the Atlantic Ocean overriding cold air from Canada while a coastal storm feeds off that to bring up warmer moister air from the southeast to add to the mix.

      OTOH, our thunderstorms are rather disappointing outside of the mountains.

      • Erik Aamot says:

        I have a farm in rural southwestern Uganda, on the equator at 1500m elevation. Most thunderstrikes in the world, rain so hard for up to 2 hours you can hardly see the front of your car. Occasional hailstorms with near tornados that rip roofs off houses .. can kill cattle

      • John F. Hultquist says:

        RE: thunderstorms

        We lived in Iowa City for 7 years.
        Interestingly, Iowa City managed to be tornado free, and I think has never been hit.
        All the rest of the nasty weather did come, from cold to hail. An old Ford convertible I owned was shredded; repaired with duct tape — same color as the old cloth.

  14. steve case says:

    Andrew Stout
    … what happened in 1996 …

    Here’s a Link.

  15. But what we care about is global temperatures as a whole.

    I expect overall oceanic sea surface temperatures to fall sooner rather then later.

    On a positive note it looks like all those predictions of a pending El Nino are wrong. They were so sure along with their useless models which do not incorporate the real climatic drivers.

    Those being the sun/geo magnetic field.

  16. Aaron S says:

    A different region of the US, but this link is an article on my google news feed today indicating NE major winter storms will not decrease from global warmimg but smaller NE storms will. Of course this research is based on models that rely on models of global warming for inputs. I have low confidence in climate models so I guess very low confidence in weather models that build on climate model outputs.

    My point for sharing this example of “Science” is to highlight the scientists behind this paper would not have funding and likely no jobs without the social fear of global climate change. Even here on this blog we see the attempt to relate weather events to climate change after only 29 comments. I dont see how bias to support global warming by the community that study it is an avoidable outcome of the current set up. Consider the understanding of human psychology and likelyhood for bias and group think in combination with the uncertainty of complex computer models of layered turbulent fluid systems and data created from an ever changing amount of thermometers. There is no way science can avoid human bias.

    The solution could be artificial intelligence that is allowed to be unbiased (not like google that creates bias layers to AI to avoid the taboo outcomes- search american inventors or american mathmaticians for proof of deliberate google bias). At work we are moving more and more to AI snd it is exactly what society needs for 1 reason- it can avoid bias (unless biased intentionally).

    So my question is have 1. Computer model predictions vs satellite data been evaluated with AI to determine the best models and climate sensitivity? And 2. Why havent raw thermometer data along with satellite data been calibrated and gridded to extrapolate back into time? The AI would find all sorts of relationships that could remove human bias as we reconstruct paleo climate in an ever decreasing density of data going back in time. Of course the experts could override the process and put in a CO2 warming bias… so better not let google influence. Haha.

    https://www.eurekalert.org/pub_releases/2019-01/ncfa-mns012419.php

    • Lewis guignard says:

      I would add that bias influences everything we do – emotions.
      Curiosity leads to research about climate. Then beliefs – more exactly wishful thinking- influences what is researched. The current example is CO2. Why, because man produces much CO2 and thus those who wish to believe man is an influence on his environment, for good or ill, must research CO2. …..

  17. R2Dtoo says:

    Thought I would throw in a real time report. The cold air mass is already here (SW Manitoba- 3 hrs north of Minot ND). It is -28C now with a wc of -38C. We are heading for a low of -33C tonight with wc in -40sC. Same tomorrow. On Sunday a clipper is due to drag warm moist Pacific air from BC to collide with this cold air. The jet is meridional and splitting the prairies in half through Saskatchewan. Calgary will be above freezing on the weekend. That clash is predicted to bring 15-30cm of snow along the frontal boundary, with 50-70km winds. The usually uneventful clipper will become a monster owing to this contrast, and a major blizzard is expected. This whole mess is heading south-southeast, so the view from the north end looks very similar to what Dr. Spencer has reported. I’ve lived here for 50 years. One never gets used to these extreme events.

  18. ren says:

    The stratospheric intrusion will move over the Great Lakes.
    https://pics.tinypic.pl/i/00978/sn69imrchit2.png

  19. Tommy says:

    Perfect, do you have information about extreme weather in australia and in chila? Thank you so much for the response

  20. Tommy says:

    Chile*

  21. ren says:

    Currently, the temperature in Chicago has fallen below -20 degrees C.
    https://pics.tinypic.pl/i/00978/df0lchmq33dw.png

  22. Stephen P Anderson says:

    You guys don’t understand. According to Global Warming theory that while it is a record low in Chicago, the polar bears are on the beach at the North Pole.

  23. Ilya says:

    The only problem with that is the Arctic is simultaneously pretty much frozen shut with near-record sea-ice volume gain.

  24. ren says:

    Extremely dry air over Eastern Canada shows where the core of the polar vortex is located, around which the air circulates.
    https://files.tinypic.pl/i/00978/smacvy6h1xnn.png

  25. Stevek says:

    Off topic but are there other El Nio like phenomena in other parts of the world but on a smaller scale ?

    Im trying to find out what information would be needed to actually be able to back into the mean temperature of the earth for a given year. If we had El Nio plus cloud cover plus the North Atlantic oscillation how close would that get us ?

  26. Crakar24 says:

    Yes it got hot just like you are getting cold…..I wonder if there is s connection beyond the carbon pollution religion?

    Anyway as expected power prices went through the roof $14.50/kWh (au) and the now obligatory load shedding. Welcome to the brave new world of renewable energy, peak stupid has arrived in Australia.

  27. Neville says:

    Here’s a question for Roy if he has the time. At Dr Cowton’s York uni tool the trend from 1910 to 1950 is 0.125/decade and the trend from 1950 to 2019 is also 0.125c/decade.
    This is using IPCC’s preferred HAD Crut 4 Krig global. Co2 levels in 1910 were about 310 ppm and perhaps 315ppm by 1950. But this had increased to about 350ppm by 1990 and now about 409ppm by 2019.
    So how does anyone make sense of this data since 1910 and 1950? Of course since 1850 to 2019 the trend is much lower at 0.056 c/decade.
    Can Roy or anyone offer an opinion about this data? Here’s the York Uni tool link.

    http://www.ysbl.york.ac.uk/~cowtan/applets/trend/trend.html

    • Bindidon says:

      Neville, it seems that you are by far not the only person having problems with a clear relation between CO2 and temperatures (regardless which one of the two lags the other).

      Here is a WFT graph, you don’t need Kevin Cowtan’s super-accurate data, and Paul Clark moreover enjoys us with the possibility of viewing all the stuff in one picture, even when using many temperature series at a time:

      https://tinyurl.com/y7486t65

      Be careful when combining many of them: they mostly have different reference periods! Paul explains that pretty good in his notes.

      • Neville says:

        Bindidon I’ve looked at WFTs for years and it clearly shows you what I’m showing from the Cowton site.
        But the ice-cores clearly show that co2 always follows temp whether entering a full glaciation or exiting into a inter glacial period.
        And Antarctic cores now go back some 800,000 years.

        • Svante says:

          Neville says: “co2 always follows temp”

          Except when it is first.

          • JDHuffman says:

            Svante, that’s like saying you always say something dumb, except when you say something smart.

            We’re still waiting for you to say something smart.

        • Bindidon says:

          Neville

          “… whether entering a full glaciation or exiting into a inter glacial period.”

          Could you show some real data concerning that?

          • Entropic man says:

            Bindidon

            I dont have data to hand, but IIRC he’s half right.

            When he says that temperature precedes CO2 whether entering a full glaciation or exiting into a inter glacial period. he’s right.

            Under natural conditions deglaciations begin with an increase in NH temperatures due to Milankovich cycles, followed soon after by an increase in CO2 which acts as an amplifying feedback.

            Over 10,000 years the Holocene went from 9C to 14.3C.

            Of that 1.2C was due to Milankovick, 0.68C due to increased CO2 and 3.42C due to other feedbacks.(incidentally, that gives a climate sensitivity of 2.8)

            When he says ” co2 always follows temp he is wrong.

            I can think of five examples in which CO2 changes caused temperature changes.

            The Permean extinction and the PETM were triggered by CO2 from volcanic activity

            The end of both the most recent Snowball Earth events was triggered by accumulating CO2 from volcanoes.

            Finally, CO2 released during the Industrial Revolution has caused a reversal from a cooling trend to a warming trend.

          • crakar24 says:

            Really EM…..just really? Your theory is a volcano or at least a number of volcanos erupted spewing enough CO2 into the atmosphere to cause the planet to warm (co2 leading temp) and i was thinking based on the warmist mantra that volcanos dont emit much co2 it all comes from us selfish pricks.

            You dont suppose all these volcanos produced a large amout of dust etc which dropped the temps by blocking sunlight and you are just dazed and confused about cause and effect?

            So have volcanos of the last 200 years contributed to the co2 rise or are we back to the original thesis that its produced by man?

            Make up your mind, make a decision and stick with it instead of flip flopping all over the place.

          • Svante says:

            Yes really! Higher amounts during the Permian, longer time spans for snowball earth. Aerosols settle much faster than CO2.

          • crakar24 says:

            What a fascinating theory Svante, are you suggesting everytime a Volcano erupts the Earth gets warmer and there is evidence to support such a thing in the Permian epoch? If true then Volcanos must have a very large impact on CO2 levels and hence global average temps.

            To produce a warming rate so large we can see it in the fossil record would suggest volcano effects must be massive and yet here we are in South Australia enduring blackouts because we have destroyed our coal fired generators in the (now obvious) futile persuit of reducing CO2 emissions.

            Of course on the other hand you could be completely wrong?

          • Svante says:

            That’s right, it covered by about seven million km^2 and went on for two million years.

            https://tinyurl.com/yc8s3752

  28. .
    ❶①❶①❶①❶①❶①❶①❶①❶①❶①❶①❶
    ❶①❶①
    ❶①❶① . . . A climate fairy tale – (but it might be true) . . .
    ❶①❶①
    ❶①❶①❶①❶①❶①❶①❶①❶①❶①❶①❶
    .

    Once upon a time, a long long time ago, in a distant galaxy, there lived 2 twins. There were originally 3 twins, but the 3rd twin was a contradiction in terms, and had to be “put down”. The twins’ names were Sheldon Sky-Walker, and Leia Sky-Walker. Leia was often referred to by her nickname, “Princess”.

    [ please insert a $1 coin to continue reading … ]

    Sheldon sighed. I wish that I knew what snow was, said Sheldon. [ Ironically, when Sheldon was older, and he was trapped on Hoth the ice planet, he would wish that he DIDNT know what snow was. ]

    A smile suddenly appeared on Sheldons face. I know what to do, he said. I am going to use the dark side of the force, to prove that there was a recent slowdown.

    No, Sheldon, cried Leia, dont do it. It is too dangerous. What if the Empire finds out?

    Sheldons smile disappeared, but a look of determination took its place. I dont care if the IPCC does find out. Dad (Darth) will protect me. I know that there is still some good, deep down inside him.

    [ please insert another $1 coin to continue reading … ]

    https://agree-to-disagree.com/a-climate-fairy-tale

  29. ren says:

    Another visible front over Wisconsin will bring record cold air to Chicago.
    https://images.tinypic.pl/i/00978/tv9w98ta6z5y.png

  30. Neville says:

    Perhaps China is trying its hardest to emit more co2 from new coal fired stations to help with some of the very cold forecasts for parts of the NH countries this winter.
    Just incredible numbers from this latest report on China’s plans via the GWPF.

    https://www.thegwpf.com/coal-isnt-dead-china-proves-it/

    • Bindidon says:

      Neville

      I think China would prefer nuclear, they just started two French EPR plants.

      But nuke plants take a lot more time for building than do coal-based plants, even in China.

  31. Bindidon says:

    Roy Spencer’s head post’s title sounds quite a bit dramatic:

    “Dangerous, Record-Breaking Cold to Invade Midwest, Chicago”

    A look at the (more or less recent) past shows this (the 25 coldest minima in Illinois):

    USC00111836 IL CONGERVILLE 2NW 1999 1 5 -37.8
    USC00112745 IL ELIZABETH 1996 2 3 -37.2
    USC00115901 IL MT CARROLL 1930 1 22 -37.2
    USC00112745 IL ELIZABETH 2009 1 16 -36.7
    USC00115079 IL LINCOLN 1927 1 15 -36.7
    USC00112745 IL ELIZABETH 1996 2 4 -36.1
    USC00112745 IL ELIZABETH 1999 1 5 -36.1
    USC00112745 IL ELIZABETH 2009 1 15 -36.1
    USC00113290 IL FULTON L&D #13 2009 1 16 -36.1
    USC00115901 IL MT CARROLL 2009 1 16 -36.1
    USC00116661 IL PAW PAW 2S 1996 2 3 -36.1
    USC00116661 IL PAW PAW 2S 1996 2 4 -36.1
    USC00117354 IL ROCHELLE 1985 1 19 -36.1
    USW00004808 IL CHICAGO AURORA MUNI AP 2009 1 16 -36.0
    USC00110286 IL ASHTON 1905 2 13 -35.6
    USC00112348 IL DIXON 1W 2009 1 16 -35.6
    USC00112348 IL DIXON 1W 2009 1 17 -35.6
    USC00112745 IL ELIZABETH 1999 1 6 -35.6
    USC00116897 IL POLO 5NW 2009 1 16 -35.6
    USC00111836 IL CONGERVILLE 2NW 1999 1 6 -35.0
    USC00113335 IL GALVA 2009 1 15 -35.0
    USC00115901 IL MT CARROLL 1910 1 7 -35.0
    USC00110072 IL ALEDO 1905 2 13 -34.4
    USC00112745 IL ELIZABETH 1994 1 19 -34.4
    USC00113940 IL HAVANA 1999 1 5 -34.4

    The states at the borderline to Canada certainly show even lower minima. CONUS is a mix of warm and cold!

    • Gordon Robertson says:

      binny…”A look at the (more or less recent) past shows this (the 25 coldest minima in Illinois):”

      What’s your source? Is that the NOAA fudged (adjusted0 temperature series or the historical record before NOAA amended it?

      • Bindidon says:

        As usual: Robertson, instead of proving his claim, simply discredits, denigrates, and… lies.

        Would Flynn not be your adlatus in pseudoskepticism, he would name you “stupid and ignorant”.

        • Mike Flynn says:

          Bindidon,

          You should know I accord the award of “stupid and ignorant” only to those who truly excel.

          You should take pride that I have bestowed this honour on you. Not everyone qualifies.

          By the way, throwing random German words around might not help others think you are really, really, intelligent and clever. Are you trying to elevate your “stupid and ignorant” status?

          Im happy to help out.

          Cheers.

  32. ren says:

    Extremely cold air moves as a cold front to Lake Ontario.

  33. ren says:

    Within a few days, the core of the polar vortex will move towards the northeast US. There will be a strong wind along the coast.
    https://images.tinypic.pl/i/00978/oojgj4v0n2pr.png

  34. Dan Pangburn says:

    The current (since about 2002-2005) apparent plateau/eventual downtrend and two previous 30+ year downtrends in temperature with relentlessly rising CO2, demonstrate that CO2 has little if any effect on average global temperature. It is disturbing that so many (but not all) climate experts got it wrong. I wonder how much wider the separation between the rising CO2 and not rising temperature will need to get to open their eyes. The lack of influence of CO2 on average global temperature is demonstrated graphically at https://pbs.twimg.com/media/DxjCZUoU0AAf06-.jpg

  35. Svante says:

    Dan Pangburn says:

    “I wonder how much wider the separation between the rising CO2 and not rising temperature will need to get to open their eyes.”

    It depends on the reason. Most thought temperatures would rise during the 30 year pause.

    https://tinyurl.com/yck2o849

  36. ren says:

    A dangerous storm moves from North Dakota to Illinois.
    https://files.tinypic.pl/i/00978/ae3blvve5agw.png

  37. .
    ❶①❶①❶①❶①❶①❶①❶①❶①❶①❶①❶
    ❶①❶①
    ❶①❶① . . . Curry versus Tamino . . .
    ❶①❶①
    ❶①❶①❶①❶①❶①❶①❶①❶①❶①❶①❶
    .

    I don’t have time for a full article about this debate now. I don’t even know the exact details (but that has never stopped me from giving my opinion).

    The debate seems to be about the size of the Early 20th Century Warming, compared to the Late 20th Century Warming.

    By my reckoning, the Early 20th Century Warming was about 0.30 degrees Celsius.

    The Late 20th Century Warming was about 0.77 degrees Celsius.

    So the Late 20th Century Warming was about 2.5 times bigger than the Early 20th Century Warming.

    But before Tamino begins celebrating, he should think about this.

    The Early 20th Century Warming took place over about 30 years.

    The Late 20th Century Warming took place over about 50 years.

    So the warming rates, were approximately equal.

    Did Judith Curry say whether she was talking about “temperature change” size, or “warming rate” size?

    Because a case can be made for the claim that the warming rate of the Early 20th Century Warming, was of a similar size to the warming rate of the Late 20th Century Warming.

    See the 2 following graphs.

    https://agree-to-disagree.com/curry-versus-tamino

    • Entropic man says:

      “The Early 20th Century Warming took place over about 30 years.

      The Late 20th Century Warming took place over about 50 years.

      So the warming rates, were approximately equal.”

      The rate of CO2 concentration increase is exponential.ie the curve steepens over time

      The forcing due to CO2 increases logarithmically.ie the curve becomes less steep over time.

      A linear rate of temperature increase, ie a straight line, fits neatly between them.

      • JDHuffman says:

        E-man, your desperation steepens over time.

        • Entropic man says:

          Thank you, Mr Huffman.

          I always regard an insult from you as a quality control stamp on a good comment.

          • JDHuffman says:

            E-man, my intent was to bring some reality to your comment.

            Being insulted by reality is your choice.

      • Dan Pangburn says:

        ent,, Water vapor (TPW) increase leads lower troposphere temperature increase and both ignore CO2. https://pbs.twimg.com/media/DxYl0-fUcAALEW2.jpg WV increase correlates with irrigation increase.

        • Bindidon says:

          Dan Pangburn

          I’m all but a gullible follower of the CO2-maniacs, BUT… keep equally away from their opposites.

          Nevertheless, even simple laymen like me at least know that if CO2 does anything, then sure it does that where water vapor is absent due to precipitation, and not at Earth’s surface where it is overabundant.

          How thick, do you mean, is the WV column above the tropopause?

          Let us compare, using HITRAN2016, WV and CO2 at surface:

          https://drive.google.com/file/d/1vTinzxphaAyNaRNq38DuQMu9eHa92E35/view

          and at an altitude of 15 km:

          https://drive.google.com/file/d/1bshOggQrPQaIbiUCoFzqK_OFoOOo60bD/view

          Of course, the absorp-tion and emission intensity drop by a factor of 100; but that is not the problem.

          The problem is that the IR reemission temperature gradient increases with CO2’s concentration increase. Tiny bit by tiny bit.

          That is what some people try to explain., e.g. here:

          https://tinyurl.com/yaquf7tc

          (Sorry: it is written in French. Google’s translator is a good help.)

          Wether or not the conclusions they draw out of that are correct I don’t know, but never would I unconditionally support their ideas, let alone religiously denigrate them, as is done so often on this blog.

          But at least we should view it as something we can’t simply ignore just because dumb ignorants do.

          An interesting point was for me that according to the two Frenchies, WV is able to penetrate the atmospheric window (CO2 isn’t that much, see Fig. 6 and 7). I didn’t know that.

          Regards, J.-P. D.

          • Dan Pangburn says:

            Bin,, I got pretty excited about Hitran a while back because the ordinate units are intensity but have abandoned it, partly because it does not appear to be doing what I originally thought. Apparently it can only be meaningful when combined in or with another program.

            Modtran and Modtran6 appear useful but are misleading below about 10 km as discussed in Section 5 of my blog/analysis (click my name) and at http://energyredirect3.blogspot.com .

            Some fundamental things to consider:
            1. The only way that energy can significantly leave the planet is by radiation.
            2. What comes down must have gone up and carries about 78 W/m^2 with it from heat of vaporization
            3. All absorbed radiation is thermalized (shared with surrounding ghg and non-ghg atoms). All absorbed energy flux is eventually reverse-thermalized to ghg for eventual radiation to space. Thermalization, reverse-thermalization, radiation takes place continuously throughout the atmosphere.
            4. Average elapsed time that energy stays in a molecule (relaxation time) is about 5 microseconds. Average time between molecule collisions is about 0.0002 microseconds.
            5. The declining population of WV and other ghg molecules with altitude favors outward radiation.
            6. Progressively with increasing altitude, radiation from WV molecules does not encounter other ghg molecules and goes directly to space.
            7. Clouds consist of particles of water or ice which radiate essentially full spectrum so some of the radiation energy from clouds exits through the atmospheric window.
            8. The notches in TOA graphs of radiation demonstrate that energy has been redirected from ghg-other-than-WV to WV.
            9. The concentration of CO2 in the atmosphere in parts per million is about the same all the way up. The ratio WV/CO2 molecules declines steadily (on average) with altitude but most of the radiation from WV molecules is the wrong wavelength to be absorbed by CO2 and goes directly to space.

            These and other factors are discussed more completely in my b/a.

      • Bindidon says:

        Entropic man

        Walker didn’t talk about this damned CO2 here. He merely pointed out
        this below:

        https://tinyurl.com/ybyly9xm

        As you can see, the trend for 1950-today is equal to that for 1910-1950.

        Grant Foster is a great mathematician and statistician, despite the disgusting insults that some stupid ignoramuses throw at him, especially here on this blog.

        But sometimes he gets crazy & silly about dumb skepticism, and looses control.

      • Bart says:

        The response to CO2 is hypothesized to increase logarithmically.

        The rate of increase in CO2 concentration has not been exponential. Since the onset of the “pause”, for about 20 years now, it has been increasing essentially linearly.

        http://woodfortrees.org/plot/esrl-co2/mean:12/plot/esrl-co2/from:2000/trend

        Emissions, in the meantime, have been accelerating.

        http://oi63.tinypic.com/11gniqg.jpg

        • barry says:

          Why did you select only 13 years out of a possible 60+? And when you said 20? Because that particular selection gave you the answer you wanted?

          Here is observed atmos CO2 increasing exponentially since 1957.

          https://tinyurl.com/ycdqsm9j

          You said CO2 has not increased exponentially for about 20 years.

          https://tinyurl.com/yd8wy9gz

          Yep, that’s exponential over 20 years, not linear. I put a linear trend in there to see if there was a curve in the data. Yup.

          Comparing concentrations and emissions since 1970.

          https://tinyurl.com/ycaac948

          Both exponential increase.

          And here’s a longer term view.

          https://tinyurl.com/y7xotfrr

          And let’s look at atmospheric increase observed since 1957.

          https://tinyurl.com/yacxksfc

          Once you do an integral on the CO2 data, it becomes extremely noisy – monthly rate changes, while small compared to yearly increase, are large one month compared to the next.

          That level of noisiness can make it seem that the growth is linear if you pick your period carefully enough. And you did, Bart, and it was not 20 years, it was 13.

        • barry says:

          “Once you do an integral”

          Derivative, rather. Derivatives magnify minute fluctuations.

  38. ren says:

    After a dangerous snowstorm, the Arctic air will reach Illinois.

  39. ren says:

    The Arctic air over the Great Lakes is moving east.

  40. ren says:

    The next wave of Arctic air will reach Illinois today at night.
    https://images.tinypic.pl/i/00978/wvik8p6kt5fj.png

  41. rah says:

    Not a big surprise for me. This on call truck driver was informed that today (Monday)AT 16:00 I will depart for a run that starts in Clinton, IA with two other stops in N. Illinois. Seems the regular driver doesn’t like cold and snow. I drive up to a truck stop and take a 10 hour break then begin the run tomorrow morning then bring the freight back to the terminal in Anderson, IN tomorrow night. Low for Clinton forecast to be -26 F Tuesday. Low forecast for Tuesday night in Anderson, IN is -13.

    This is what my job entails. Take up the slack of the weak sisters. So on goes the underarmor and the polypro inner socks I still have from the Army’s extreme cold weather package. When I get back to the terminal in Anderson on Tuesday night I will fill up the truck, purge any moisture from the air tanks, drain the water trap in the primary fuel filter, top off the DEF, check the whole thing out, hit the brakes hard several times while moving to try and dry them if needed, then park it and leave it running with the flashers on. If I don’t leave it running in such temps odds are despite the fuel having cold weather treatment in it, it will gel enough in the primary fuel filter.

    • Bindidon says:

      rah

      Thank you for this refreshing message, it’s good to read that some people can do better than scold and discredit others for thinking differently.

  42. ren says:

    Stratospheric intrusion over the Great Lakes.
    https://pics.tinypic.pl/i/00978/1wrju2n56vj2.png

  43. .
    ❶①❶①❶①❶①❶①❶①❶①❶①❶①❶①❶
    ❶①❶①
    ❶①❶① . . . The Upside-down Comb of Death . . .
    ❶①❶①
    ❶①❶①❶①❶①❶①❶①❶①❶①❶①❶①❶
    .

    What, you may be wondering, is the Upside-down Comb of Death?

    In simple terms, it is like the Right-side-up Comb of Death, but upside-down.

    Right-side-up Combs of Death became an overnight success. Even bigger than Furbys. We have had people working around the clock, trying to keep up with demand.

    Many people have complained to me, that standing on their head, and looking at the Right-side-up Comb of Death, was giving them a headache. I dont like to see people suffer needlessly. So I turned my computer screen upside down, and took a screenshot of the Right-side-up Comb of Death. When I turned my computer screen back up the right way, I had created an Upside-down Comb of Death. Nobody needs to get a headache any more.

    There is only one problem. The Upside-down Comb of Death makes global warming look so insignificant, that people are getting eye-strain, trying to see the global warming.

    The Upside-down Comb of Death displays temperature ranges, for more than 24,000 real locations on the Earth. And I am talking about REAL, ACTUAL, ABSOLUTE temperatures. Not those weak, pale, temperature anomaly things. But real, actual, absolute temperatures.

    https://agree-to-disagree.com/the-upside-down-comb-of-death

  44. Entropic man says:

    I mentioned that the forcing due to CO2 is logarithmic, that the amount of forcing, and therefore warming, decreases as the concentration ofCO2 increases. This would be expected to partly cancel the increase in warming rate due to increasing rates of CO2 production, evening out any difference in warming rate between the 1930s and the 1980s.

    If you do the calculation, an increase from 280ppm to 290ppm would produce

    5.35ln(290/280)3/3.7=0.15C.

    A similar 10ppm increase from 400ppm to 410ppm produces

    5.5ln(410/400)3/.7=0.11C

    • JDHuffman says:

      That’s some funny pseudoscience, E-man.

      But it gets even funnier if you include bananas. For example, the current temperature at Chicago airport is -16C. The corresponding temperature at Summit Camp, Greenland is -46C.

      World production of bananas is about 150 million metric tons, annually. So,

      To = Ts + 33 – (CO2/BB) + ST= -46 +33 – 2.73 + 0.3 = -16C

      BB = Big Banana
      FAT = Forcing Adjustment Term

      • Mike Flynn says:

        JDH,

        Do you deny that bananas absorb and emit IR?

        Didn’t take that into account, I bet! You deniers are all the same.

        You won’t be able to cope when the climate stops changing, will you?

        Rotten denialist scum! Bananas are radioactive you know, because GHE.

        Cheers.

  45. Bindidon says:

    Bart

    You make often enough pretty good comments, the last one having explained how to accurately compute the total incoming radiation over an hemisphere, by integrating cos^2(x)dx.

    But in your comment concerning the CO2 Mauna Loa stuff unfortunately you come back (and – alas, down) to trivial statements.

    Simple is good, trivial is bad. It’s like saying “The Moon doesn’t rotate about its axis because you see the same face of it all the time”.

    The best way to see how ‘linear’ CO2 concentration increases, is to put the stuff into a spreadsheet, and to let compute the estimates for consecutive, smaller periods.

    In ppm/decade:

    1958-2018: 15.5
    1979-2018: 17.9
    2000-2018: 21.4
    2010-2018: 24.1

    Your ‘rate of change’ graph in

    http://oi63.tinypic.com/11gniqg.jpg

    sounds like a bad joke. Somebody simply has drawn a straight line above the graph. Typical pseudoskeptic trick…

    2012-2015: 20.8 ppm/decade

    Bart, I have no idea of CO2’s contemporary influence on climate! But that is no reason for me to accept such simple-minded, completely biased information.

    Sorry.

      • Bindidon says:

        Nate

        You are right: one does not need to download series supported by WFT, if the only goal is to obtain their trend: a click on ‘Raw data’ is enough. I forget that all the time.

    • Bart says:

      Bindidon:

      I didn’t say CO2 concentration was linear. I said it has been essentially linear since 2000, and the onset of the pause in temperatures, and I showed a trendline demonstrating it. But, this is of a piece with the fact that the rate of change of CO2 concentration is proportional to appropriately baselined temperature anomaly:

      http://woodfortrees.org/plot/esrl-co2/derivative/mean:12/from:1979/plot/uah6/offset:0.73/scale:0.2

      Typical pseudoskeptic trick…

      Hardly. There is nothing magical about a least squares fit. When you do not know the error distribution, there is no basis upon which to proclaim it “best”. Eyeballing the graph and drawing a line through the data is just as rigorous as applying least squares willy-nilly.

      All you have to do is look at the emisssions, which increased over 40% in that interval. If concentration were tied tightly to emissions, you would see something happening in that time.

      Nate:

      I specifically specified the era since 2000. This is ignoratio elenchi.

      • Bindidon says:

        Bart

        “Hardly. There is nothing magical about a least squares fit. When you do not know the error distribution, there is no basis upon which to proclaim it “best”. ”

        Sorry, thiis is ridiculous.

        At least you should perfectly know that Mauna Loa time series have unusually small standard deviations and hence a small standard error.

        Every linear estimate function shows that, even for an excessively short period like 2012-2015, usually giving huge 2 sigmas, and therefore statistically insignificant and meaningless estimates.

        For 2012-2015 it looks like this:
        20.85 +- 0.06 ppm / decade.

        Try to do that with a tropospheric time series a la UAH or RSS, and you will wonder! Especially when you apply the estimate function on polar data.

        Thus no, Bart! The straight line across the time series in your chart example, showing a zero increase, has ne scientific value, and is a simple-minded manipulation.

        Moreover, that the emissions grow so much more than the concentration is simplest evidence: all the stuff is stored by the oceans, what is known since at least 2 decades.

        • Bart says:

          Groan… You guys are so far beneath me on this topic. You have no idea what you are talking about. You learned all about round holes in your rote studies, and you’re going to shove that square peg in no matter what.

          No, no, no, no, no! There is NOTHING special about an OLS. It is, very specifically, an optimal linear estimator for INDEPENDENT

          • Bart says:

            … sample errors. It is NOT generally applicable to ANY stochastic model.

            “Moreover, that the emissions grow so much more than the concentration is simplest evidence…”

            Virtually meaningless, as far as attribution is concerned. It is a necessary condition, but not a sufficient one.

        • Bart says:

          An example: You have data which adhere to

          x = cos(2*pi*t)

          for t = 0 to t = 2.5. You apply an OLS, which gives you a slope of -0.048 and an intercept of 0.06. Using that, you project that x will be -4.7 at t = 100. Eyeballing the data, you project it will be 1. Which is more accurate?

          Math should always be your servant, not you its servant. These mathematical tools like OLS were devised for very specific scenarios. If you do not have such a scenario under consideration, your eyes can generally do a better job.

  46. ren says:

    Stratospheric intrusion over the northeast of US.
    https://images.tinypic.pl/i/00978/wx1au6urh622.png

  47. ren says:

    The current temperatures (C) in the Midwest US.
    https://scontent-frt3-1.xx.fbcdn.net/…/51337004…

  48. ren says:

    Where is El Nio?
    Highest flood levels in 118 years | Nine News Australia
    https://youtu.be/4g7KD3lMdNE

  49. E. Swanson says:

    As the Arctic cold air marches South, we have an analysis by Jennifer Francis to add to the confusion;


    How frigid polar vortex blasts are connected to global warming

    Satellite measurements show that the Tropics experience a surplus in energy flow and the polar regions a deficit, to use an economic analogy. That difference means that there are large scale energy flows moving the thermal energy toward the poles. The flows are in both atmosphere and oceans and as global warming proceeds, those flows will change as a result.

    Conventional wisdom is that the greater warming projected in the Arctic will counter these flows, however, in Winter, with little sunlight, another possibility is that the warming will be the result of increasing poleward flows of warm air, which would be the opposite situation. An increase in warmer air flowing toward the North must result in an increase in cold dense air returning back toward the South on the surface, balancing the movement of air masses. As Francis points out in her piece, there’s quite a bit of warmer air moving North toward the Arctic, so we shouldn’t be too excited that there’s lots of cold air returning South.

  50. Nate says:

    The old eyeballs are better than OLS meme. A non-starter.

    Eyes are certainly better at cherry picking peaks and valleys to start and end, such as your selected 13 y.

    OLS is objective, we know exactly how its calculated, and its limitations. With eyeballs, not so much.

    ‘I specifically specified the era since 2000. This is ignoratio elenchi.’

    Not at all. 1999 or 2000, no difference

    Slicing the 60 y into 3 even 20 y periods is unbiased. 20 y is the bare minimum length needed to resolve a statistically meaningful trend amongst strong multi-year variation.

    • Bart says:

      What a stupid comment. On what basis do you declare OLS better?

      OLS is not objective. It is repeatable and replicable, but that is not the same thing as objective. It simply minimizes the sum of squares difference between the linear model and the data.

      What if your underlying process is not linear? What if you have non-stationary or cyclo-stationary noise? It’s potentially far worse than eyeballing in those cases.

      In this case, we have a transient El Nino rearing up near the end of the data record. It has nothing to do with the long term. If you include it in a trend calculation, your estimate of the slope will be biased.

      “Slicing the 60 y into 3 even 20 y periods is unbiased.”

      Ignoratio elenchi means you are not addressing the argument with anything relevant. I specifically said CO2 rate of change has been linear since 2000. Pulling out figures from years before 2000 are therefore completely irrelevant.

      “…20 y is the bare minimum length…”

      A completely arbitrary threshold, but this is 20 years:

      http://woodfortrees.org/plot/esrl-co2/mean:12/plot/esrl-co2/from:2000/trend

  51. Pft says:

    What you describe in terms of heat exchange of the troposphere with warm air from the south moving north forcing cold air south is not the main driver of this event.

    Heating of the stratosphere which is independent of warming in the troposphere has weakened and split the stratospheric polar vortex . This has disrupted the tropospheric polar vortex causing a blockage in the jet stream , and that has forced cold arctic air south

    https://weather.com/forecast/national/news/2019-01-10-the-polar-vortex-has-fallen-apart-and-that-could-unleash-a-much

  52. Nate says:

    Bart,

    You’re bonkers, and in deep denial.

    Bart’s cherry-picking eyeball is NOT objective. It cannot be expressed mathematically. No one will use this method in a published scientific paper. Stop saying it is better!

    OLS is ‘It simply minimizes the sum of squares difference between the linear model and the data.’

    And what is the problem with that?

    It is an objective method of determining linear trend of data over an interval. It does not require that the data be linear. The data could be, over a longer interval, curving, as this data is.

    So what?

    To understand ERROR in the trend that requires knowing about correlation etc. That is a separate issue.

    By using OLS over successive equal intervals, we can objectively measure how the trend is changing. This approach has been used to look at sea level rise acceleration, for example.

    And we find that the trend IS increasing over the 60 year period. It is entirely consistent with the ‘accelerating emissions’ over the period.

    ‘I specifically said CO2 rate of change has been linear since 2000.’

    As you have pointed out, noisy data can be fit to a line over a short interval, but that doesnt make it linear.

    • Bart says:

      “And what is the problem with that?”

      It’s completely arbitrary. It’s not objective. It’s just a canned routine.

      You can’t let computers do your thinking for you, Nate. Computers don’t think. They’re just machines. An OLS routine doesn’t discern anything about the properties of the data stream you feed into that. It just spits out a number.

      It appears you are a rote learner, and not a thinker. Too bad.

      “As you have pointed out, noisy data can be fit to a line over a short interval, but that doesnt make it linear.”

      Complete and utter gibberish to talk yourself into rejecting inconvenient facts.

    • Bart says:

      An example: You have data which adhere to

      x = cos(2*pi*t)

      for t = 0 to t = 2.5. You apply an OLS, which gives you a slope of -0.048 and an intercept of 0.06. Using that, you project that x will be -4.7 at t = 100. Eyeballing the data, you project it will be 1. Which is more accurate?

      Math should always be your servant, not you its servant. These mathematical tools like OLS were devised for very specific scenarios. If you do not have such a scenario under consideration, your eyes can generally do a better job.

      • Nate says:

        No, just no. Nonsense example. Only an idiot would do that.

        Math is a tool, like a soldering iron, you need to how and when to use it.

        Lets cut to the chase.

        The 3 20 y intervals, that I used OLS for, and found slopes of 1.0 1.49 and 2.14.

        What method would you use, and what slopes do you find for them?

        • Bart says:

          Yes, that is exactly what is going on. I drew a straight line through a bunch of cyclical hash, and you guys think an OLS will somehow give a better result. That’s just stupid.

          But, it’s like I’m arguing with Huffman over the Moon rotating with you guys. Really, it’s that dumb, and ultimately futile.

          You’re still not addressing the topic at hand. I don’t care, for the purposes of this discussion, what was happening before 2000. Since 2000, concentration rate of change has stalled, while emissions have accelerated dramatically.

        • Nate says:

          Bart,

          Ok, Im as dumb as JD?

          You’re arguing with yourself on these issues, so I guess you are equally dumb.

          YOU use OLS to show us the data are definitely linear since 2000.

          -But argue that use of OLS is dumb.

          -And argue that fitting a line to noisy data does not make it linear!

          YOU claim that the rate of change is not following emissions, but refuse to look at how the rate-of-change has evolved over the 60 y.

          Only look at my 13y or 18 y, whichever works for me!

          When data counters your narrative you just refuse to look at it!

          Again, IF, you cared to look at how trends have evolved over the whole 60 y, what method would you use, and what trends do you get?

          If you have a method better than OLS, show it! Put up or shut up.

          • Nate says:

            “Yes, that is exactly what is going on. I drew a straight line through a bunch of cyclical hash, and you guys think an OLS will somehow give a better result. Thats just stupid.”

            Here’s a look at that:

            https://tinyurl.com/y87kju3a

            You want to claim that the little green 13 y OLS line should really be horizontal. And that is significant.

            You want to claim that post 2000 should be horizontal. And that is significant. (OLS has it even steeper than 60 y line).

            Its obvious just from looking (yes!) at the noisy data, that neither horizontal line is BETTER than the long-term trend line.

            In fact, neither of your claims have actual statistical significance. It is just thoroughly stupid to make these claims.

          • Bart says:

            Two points:

            1) I am arguing that the rate of change in that interval is NOT equal to the emissions. Emissions increased 43% in that interval. Where is the comparable increase in CO2 rate of change?

            2) The CO2 rate of change matches the temperature anomaly over the entire range. It stalled precisely when the temperature anomaly stalled. This is not coincidence.

            You’ve got one possible driver that is not changing consistently with the output, and one that is. Which do you choose? Well, the former of course, because you want it to be so. It is completely irrational.

            You are failing the earliest child’s game: fit the round peg into the round hole. You are simply bound and determined to shove that square peg in.

          • Nate says:

            ‘1) I am arguing that the rate of change in that interval is NOT equal to the emissions. Emissions increased 43% in that interval. Where is the comparable increase in CO2 rate of change?’

            Again, your horizontal line is committing the oldest sin of fitting noise.

            Emissions were: 4, 6 and 9 Gtons/y in 1970, 1990, 2010

            https://www.epa.gov/ghgemissions/global-greenhouse-gas-emissions-data#Trends

            As shown above the 20 year trends in CO2 concentration, centered on these years were:

            1.0, 1.49, 2.14 ppm/y in 1970, 1990, 2010

            The ratio trends/emissions are:

            0.25, 0.25, and 0.24 for 1970, 1990, 2010

          • Nate says:

            ‘It stalled precisely when the temperature anomaly stalled. This is not coincidence.’

            Yep. It is already established that ENSO and CO2 are correlated.

            This and your #2 are changing the subject.

          • Bart says:

            “Again, your horizontal line is committing the oldest sin of fitting noise.”

            It’s not fitting anything. It’s showing that the mean level did not show any systematic increase over that timeline, while emissions increased more than 40%.

            “Emissions were: 4, 6 and 9 Gtons/y in 1970, 1990, 2010”

            We’re not talking about 1970, 1990, and 2010. We are talking about the 2000’s exclusively.

            “It is already established that ENSO and CO2 are correlated.”

            As is the entire temperature record since reliable CO2 measurements became available. Emissions are not the driving force.

          • Nate says:

            ‘Its not fitting anything. Its showing that the mean level did not show any systematic increase over that timeline”

            Again, no it does not show that.

            You seem to not understand statistical significance.

          • Nate says:

            Just to illustrate my point, here are fits to 13 y periods 1 year before and after your selected period.

            https://tinyurl.com/ybv5a3mf

            As you can see, the ‘trends’ are wildly different.

            Why? Because the uncertainty in the trend is very large for such short intervals and such large noise.

            Use of eyeball fitting cannot overcome this fundamental statistical limitation.

          • Bart says:

            You seem not to understand that, with an arbitrary and unverified statistical model, talk of statistical significance is just so much mathturbation blather.

            Your cherry picks obviously depend upon the cycles of the data. This is exactly why eyeballing is better. You can see at a glance here that your fits are poorly representative:

            http://www.woodfortrees.org/plot/esrl-co2/from:2000/to:2019/derivative/mean:12/plot/esrl-co2/from:2001/to:2013/mean:12/derivative/trend/plot/esrl-co2/from:2003/to:2015/mean:12/derivative/trend

          • Nate says:

            You really dont seem to understand statistical error, and that you cannot defeat it.

            My 13 y trends are not specially selected. They illustrate the actual errors in trends of that length.

            I think you are looking beyond the 13 y and deciding the fits are bad for 18 y.

            But even 18 y trends have large error, just a bit smaller than 13.

            You cannot defeat that error either, and be certain about your flat trend (not really flat over 18 y). As I said, not with significance.

  53. gbaikie says:

    So, what will be January global temp?

  54. steve case says:

    Dr. John Holdren from January 2014:

    The Polar Vortex Explained in 2 Minutes
    https://www.youtube.com/watch?v=5eDTzV6a9F4&t=

    Coming up on 9:30 PM and it’s -7°F And -21° is predicted by 9:00AM in the morning. Well I’ll believe it when I see it. 12 hours to go.

    • steve case says:

      Midnight and the local temperature is -12 deg F.

    • steve case says:

      I’m a believer, 6:00 AM and it’s -20F according to thermometers here at the house and most internet sites. Nearest airport KMWC says -19

      • steve case says:

        Just checked Chicago 9:00AM temp minus 20F not the -27 or even -30 that had been talked about on various web pages. My thermostat outside temp here in the house says -20 at 9:00AM

    • Nate says:

      Is Holdren correct, in your opinion?

      • steve case says:

        Nate says:
        January 30, 2019 at 6:45 AM
        Is Holdren correct, in your opinion?

        No, he’s not correct. Why? Because if what he claims in that You Tube is true:

        “The odds are that what we can expect as a result of global
        warming is to see more of this pattern of extreme cold.”

        Then we should be seeing more patterns of extreme cold as the globe warms up. And are we? No we’re not. As the IPCC says:

        Page 750 – Chapter Ten – Executive Summary – IPCC AR4
        https://wg1.ipcc.ch/publications/wg1-ar4/ar4-wg1-chapter10.pdf
        “…in a future warmer climate. Almost everywhere, daily minimum temperatures are projected to increase faster than daily maximum temperatures, leading to a decrease in diurnal temperature range.”

        It doesn’t say an increase in patterns of extreme cold.

        My own observations agree with the IPCC that the daily minimums have increased. Cold snaps are less frequent and less extreme. Dr. Holdren is wrong.

        If you can find somewhere in the IPCC reports that it says there will be more patterns of extreme cold or anything that approximates that, please educate me. And then show me where local temperature records bear that out.

        Next year this chart
        http://www.aos.wisc.edu/~sco/clim-history/stations/mke/MKE-LOW-T-ANN.gif
        will get a spike down to -20F after a hiatus of such things of over two decades. That Chart doesn’t show it, but some of the cold snaps in the ’60s & ’70s were weeklong affairs. I know that because I have a 1944 DOB and I remember it.

        • Nate says:

          Ok, IMO the jury is still out on this idea.

          But, Roy agreed with me that with the Arctic warming faster than mid latitudes, weather patterns down here could be expected to change. They have instability.

          I dont think the rising mins you mentioned and cold snaps are mutually exclusive.

          An aside, I experienced -24 in Minneapolis in 1990. Interesting that 1990 wasnt a cold year on your Milwaukee chart.

          • steve case says:

            Minneapolis is a good deal colder than Milwaukee. This This Page (pdf)
            Has this chart
            https://i.postimg.cc/YqLLnqr8/image.png
            which tells Minneapolis is darn cold in winter. So -24F wasn’t out of the ordinary and the pattern of extreme cold has been a feature as far back as that record goes. Although it looks like the two decade hiatus was in operation in Minneapolis just as it was in Milwaukee. It’s just that overall, Minneapolis is colder, and colder by a wide margin.

          • Nate says:

            Good stuff. Thanks.

    • JDHuffman says:

      Holdren appears to have confused “polar vortex” with “jet stream”.

      Maybe he should have taken longer than 2 minutes….

  55. .
    ❶①❶①❶①❶①❶①❶①❶①❶①❶①❶①❶
    ❶①❶①
    ❶①❶① . . . Sou from HotWhopper called me a “spineless wuss” . . .
    ❶①❶①
    ❶①❶①❶①❶①❶①❶①❶①❶①❶①❶①❶
    .

    Before you leap to my defence (you were going to leap to my defence, weren’t you?), I am a big boy, and I can stick up for myself.

    Since Sou from HotWhopper wrote an article about me, I have returned the favour.

    Here is a small sample from my article.

    Sou from HotWhopper said:
    I dont know why deniers take offense at being called deniers.

    I said:
    “I am also confused by this.”

    “I also dont know why Alarmist arseholes take offense at being called Alarmist arseholes.”

    “Perhaps science will provide the answers to these perplexing questions.”

    If you want to read more, click this link:

    https://agree-to-disagree.com/hotwhopper

    • agentprovocateur says:

      Dear Sir, I found your comments, as well as your blog most entertaining, albeit (the blog) a bit over-elaborate. I sincerely admire your Enthusiasm, but I think Father Time will take care of this Prostitution of Science in the most beautiful and poetic way. I am clicking on the Link RIGHT NOW.

    • ren says:

      This is not the end of low temperatures in the Midwest.

      • Gordon Robertson says:

        ren…”This is not the end of low temperatures in the Midwest”.

        To show you the schizophrenic nature of the atmosphere, here on the southwest coast of Canada, in Vancouver, we have only been below zero during this winter a few times, at night.

        No snow whatsoever.

  56. ren says:

    During solar cycle minimum you can not count on El Nino.
    https://www.tropicaltidbits.com/analysis/ocean/nino3.png

  57. agentprovocateur says:

    The humiliation will be unbearable!the NOA and NASA will be moved to the CNN weather forecast for the rest of the freezing.

  58. agentprovocateur says:

    the AGW computer model shall be displayed in the snow in front of the musea as an example of quack science.

    Tesla cars shall be used as super-conductors.

  59. agentprovocateur says:

    The solubility of the CO2 in cold water markedly increased, aided by the carbonation of the concrete in the Great Wall of America, shall drive down the co2 concentration.

  60. ren says:

    This is the forecast of stratospheric intrusion on 31/01/2019.
    https://pics.tinypic.pl/i/00978/4mbnbimmihmi.png

    • Bindidon says:

      “This is the forecast of stratospheric intrusion on 31/01/2019.”

      Based on the ozone mixing ratio?
      Please explain!
      I will enjoy.

      • ren says:

        In satellite imagery, Stratospheric Intrusions are identified by very low moisture levels in the water vapor channels (6.2, 6.5, and 6.9 micron). Along with the dry air, Stratospheric Intrusions bring high amounts of ozone into the tropospheric column and possibly near the surface. This may be harmful to some people with breathing impairments. Stratospheric Intrusions are more common in the winter/spring months and are more frequent during La Nina periods. Frequent or sustained occurances of Stratospheric Intrusions may decrease the air quality enough to exceed EPA guidelines.
        https://www.cpc.ncep.noaa.gov/products/stratosphere/strat_int/

      • Gordon Robertson says:

        binny…”Based on the ozone mixing ratio?
        Please explain!
        I will enjoy.”

        You are missing the point. At this time of year in the Arctic, with no solar radiation, the extremely cold stratospheric air descends into the Arctic.

        That’s what is blasting people in the midwest right now, stratospheric air.

        • Bindidon says:

          As usual, Robertson urges to write without having read the context.
          You will never come out of your mental darkness.

          A hint: try to understand ren’s answer.
          It is exactly as interesting as yours is redundant and useless.

  61. ren says:

    Daytime temperature in the Midwest. How much will it be in the morning of 31/01/2019?
    https://images.tinypic.pl/i/00978/bolj8clbrkmg.png

  62. agentprovocateur says:

    gentlemen, reading your posts (about ozone mixing ratio, daily temps.. ninas, vortexes and such), besides borring me, awakens an urgent need in my inner being to analyze you. Your talent for discussing the daily trivia with admirable dilligency in a pseudo-learned manner impresses me and your passion amazes me. I myself am very learned in the world of trolls and paid writters and your modus operandi and excessive use of verbeage indeed reminds of the now legendary internet experts and their belonging expertise, acquired at The Internet University; because, other than that being the case, I see no need for two supposed experts (that seem to know each other) to engage in a public chit-chat using their secret language, exchanging no original content whatsoever, simultaneously utterly failing to educate the unsuspecting public, except perhaps impressing teenage green activists with some nice buzz words and your presumed/implied Vast Knowledge Of The Subject.
    Please do not take Offense at my Constructive Criticism, which I would like to expand upon with an observation of fact that meteorology/climate study is not really scientific, and that it basically only exist because of the invention of the AGW Theory.

    Take into account that thmy knowledge of tghe subject is modest, but my logic fails me not.

    • Bindidon says:

      I am really impressed!

      Some people are perfect at hiding the degree of redundancy of their thoughts behind well-balanced, cloudy sentences.

      More of that stuff, please!
      C’est si bon de rire.

  63. agentprovocateur says:

    nothing personal.. and thank you for the info 😉

    My ill-mannered little composition is a result of the Fact that you are actually discussing the most disproven Theory ever in a serious manner. The case is closed.

  64. Rah says:

    Up at the terminal in Romulus, MI. waiting for others to do their jobs so I can do mine and head for Ajax, ON with a load. It’s 21:30 and despite the engine heat and Detriot UHI effect the truck thermometer reads -17 F to

  65. ren says:

    The current polar vortex pattern in the lower stratosphere.
    https://pics.tinypic.pl/i/00978/op4jfeq13h2d.png
    The current polar vortex pattern in the central stratosphere.
    https://pics.tinypic.pl/i/00978/te6hmsnejzqa.png

  66. Bobdesbond says:

    Mr Spencer,

    Meanwhile, Sydney has just recorded its hottest ever month in its 160 year record, beating January 2017.

    Looking at the warmest three months on record for each of the 12 months of the year (a total of 36 months), 18 have occurred in the past 5 years, the other 18 spread out over the previous 155 years.

    At the other end of the spectrum, there has been only one month in the 2010s which sits below the lower quartile in the data (Dec 2011).

    Is there any reason you highlight cold temperatures, while at best making grudging acknowledgements of warm temperatures typically accompanied by a tirade of apologetics, and usually making no mention of them at all?

    • Bobdesbond says:

      Correction: Past 6 years

    • harnas says:

      Australia is a very small continent

    • Mike Flynn says:

      B,

      Are you really claiming that increasing the amount of CO2 between the Sun and a thermometer in Sydney makes the thermometer hotter, but doing the same thing in Chicago makes it colder?

      Complete nonsense. I won’t bother asking you to formulate a testable hypothesis, because you can’t.

      Dream on.

      Cheers.

      • Bobdesbond says:

        You know what the claim is Mikey. No response from me is going to alter your desire to fight straw men.

        • MIke Flynn says:

          B,

          Really? I say I don’t, but obviously you don’t care.

          You don’t know either, do you?

          What a fool you are.

          Cheers.

  67. harnas says:

    Australia is a very small continent

    • Vincent says:

      But a huge island. So huge that global sea levels stopped rising for 18 months due to heavy rain in Australia that filled inland lakes, such as Lake Eyre, in 2010/11.

  68. steve case says:

    Coming up on 5:00 AM this Thursday morning and the local internet temperature here just north of Milwaukee is -22F the house says -20 the nearest airport says -22 and O’Hare 92 miles south of us says -17F.

    The local airport predicts a steady warm-up to above freezing by Saturday morning.

  69. ren says:

    Current temperature anomalies (C) in North America.
    https://images.tinypic.pl/i/00978/5an46td6vyyr.png

  70. Vive le CO2! says:

    Ladies and Gentlemen!

    After thirty years of intensive research, I am finally proud to announce the result!

    If you put a thermometer between the Sun and CO2, CO2 gets darker!

    I recently heard that I should be nominated for the Nobel Prize for Physics in 20 years!

    Oh banana.

    • Bobdesbond says:

      Perhaps next time you could try to inject some humour into your comment.

      • Bindidon says:

        I was just joking a bit, and believe me, it was not at all my intention to be humorous. You should know why, in fact…

        • Bobdesbond says:

          This was you?? How was I to know that?

          • Mike Flynn says:

            B,

            Are you now claiming that your mindreading abilities come and go, or that you have only learnt how to read the minds of intelligent, rational people?

            You now see the advantages of addressing facts, rather than preconceived fantasies.

            Cheers.

  71. Rah says:

    Less than a month ago the US and European weather models were forecasting most of the Midwest and Eastern US to have higher than average temps during this period. But we are to believe that climate models projecting what conditions will be years and decades out are accurate and base policy decisions having huge effects on the fate of our nation and people on their projections? I think not.!

    • bobdroege says:

      Back in the 40s F for the weekend, so on average for the period, may be higher than normal.

      Grew up in Chicago area, it was know to go for a month without going above freezing.

      And climate models and weather models are apples and oranges.

      • rah says:

        bobdroege says: “And climate models and weather models are apples and oranges.”

        Both exist to attempt to project or forecast future conditions accurately. That’s apples and apples PERIOD!

        And I don’t care what the average in Chicago will be for “the period” because it is irrelevant to my point.

        The point of my message was that if weather models can be so terribly wrong when forecasting less than 30 days into the future then climate models which are projecting much further into the future are much more likely to be terribly inaccurate. After all climate is just the prevailing weather conditions of a particular area or region over a longer period of time.

        Thus it is foolish to make public policy based on the output of climate models.

Leave a Reply