UAH Global Temperature Update for January 2019: +0.37 deg. C

February 1st, 2019 by Roy W. Spencer, Ph. D.

The Version 6.0 global average lower tropospheric temperature (LT) anomaly for January, 2019 was +0.37 deg. C, up from the December, 2018 value of +0.25 deg. C:
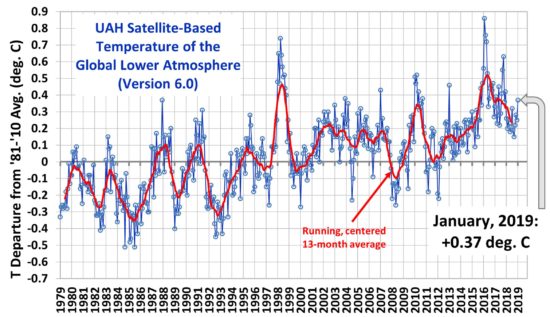

Global area-averaged lower tropospheric temperature anomalies (departures from 30-year calendar monthly means, 1981-2010). The 13-month centered average is meant to give an indication of the lower frequency variations in the data; the choice of 13 months is somewhat arbitrary… an odd number of months allows centered plotting on months with no time lag between the two plotted time series. The inclusion of two of the same calendar months on the ends of the 13 month averaging period causes no issues with interpretation because the seasonal temperature cycle has been removed, and so has the distinction between calendar months

Various regional LT departures from the 30-year (1981-2010) average for the last 13 months are:

YEAR MO GLOBE NHEM. SHEM. TROPIC USA48 ARCTIC AUST
2018 01 +0.26 +0.46 +0.06 -0.11 +0.59 +1.36 +0.43
2018 02 +0.20 +0.25 +0.16 +0.04 +0.92 +1.19 +0.18
2018 03 +0.25 +0.40 +0.10 +0.07 -0.32 -0.33 +0.60
2018 04 +0.21 +0.32 +0.11 -0.12 -0.00 +1.02 +0.69
2018 05 +0.18 +0.41 -0.05 +0.03 +1.93 +0.18 -0.39
2018 06 +0.21 +0.38 +0.04 +0.12 +1.20 +0.83 -0.55
2018 07 +0.32 +0.43 +0.22 +0.29 +0.51 +0.29 +1.37
2018 08 +0.19 +0.22 +0.17 +0.13 +0.07 +0.09 +0.26
2018 09 +0.15 +0.15 +0.14 +0.24 +0.88 +0.21 +0.19
2018 10 +0.22 +0.31 +0.13 +0.34 +0.25 +1.11 +0.39
2018 11 +0.28 +0.27 +0.30 +0.50 -1.13 +0.69 +0.53
2018 12 +0.25 +0.32 +0.19 +0.32 +0.20 +0.65 +1.19
2019 01 +0.37 +0.32 +0.42 +0.37 +0.48 -0.18 +1.10

The linear temperature trend of the global average lower tropospheric temperature anomalies from January 1979 through January 2019 remains at +0.13 C/decade.

The UAH LT global anomaly image for January, 2019 should be available in the next few days here.

The new Version 6 files should also be updated at that time, and are located here:

Lower Troposphere: http://vortex.nsstc.uah.edu/data/msu/v6.0/tlt/uahncdc_lt_6.0.txt
Mid-Troposphere: http://vortex.nsstc.uah.edu/data/msu/v6.0/tmt/uahncdc_mt_6.0.txt
Tropopause: http://vortex.nsstc.uah.edu/data/msu/v6.0/ttp/uahncdc_tp_6.0.txt
Lower Stratosphere: http://vortex.nsstc.uah.edu/data/msu/v6.0/tls/uahncdc_ls_6.0.txt


395 Responses to “UAH Global Temperature Update for January 2019: +0.37 deg. C”

Toggle Trackbacks

  1. More of the same nothing is happening one way or the other.

    • ren says:

      The most important is that there was -0.18 in the Arctic.

      • ftop_t says:

        That jumped out at me as well. How can the Arctic be below the 1981-2010 average when it is heating up at twice the rate of the rest of the globe.

        https://www.cnn.com/2016/12/14/world/arctic-report-card/index.html

        • Myki says:

          Also note that surface observations show that January 2019 was Australia’s hottest month since records began in 1910.
          Yet the LT warm anomaly for Australia only ranks as about 20th (out of 480 months).
          Strange.

          • Myki says:

            But, the data show that there is a definite one-month lag between LTT AUST and BoM surface values.
            I predict LTT AUST for February will jump up to near +1.5

          • Geoff Sherrington says:

            Myki writes — “there is a definite one-month lag between LTT AUST and BoM surface values”

            I have just plotted Tmean for 2018 monthly. I see no such lag. Geoff.

          • Bobdesbond says:

            Please share this comparison.

          • Myki says:

            GS,
            Yes, nothing apparent over those 12 values but, over 480 monthly values (Jan 1979 to Jan 2019) the lag-1 correlation is +0.29 which is highly significant (R squared =0.08482).

          • Bobdesbond says:

            Roy Spencer made it clear back in June that the LT data over a continent has little to do with the surface temperatures on that continent.

          • Myki says:

            “Roy Spencer made it clear back in June that the LT data over a continent has little to do with the surface temperatures on that continent.”
            Is that so ?
            The data show that there is quite a strong (simultaneous correlation) between AUST LTT and BoM surface values.
            The correlation is +0.694 (r squared=0.482) (480 months).

          • Bobdesbond says:

            Yes he did. He was trying to justify why UAH-USA for April was bang on average, despite the USA recording one of its coldest Aprils on record, and basically said the air masses over the continents don’t have to reflect the surface below.

            Where are these BOM monthly national averages? I only seem to be able to find national annual anomalies and monthly station anomalies.

          • Bobdesbond says:

            Thanks. I’ve been looking for this for a long time.

          • Bobdesbond says:

            Not that it makes much difference in this case, but you should have detrended the data first to remove the boost to correlation given by the mutual rise. I get 0.698 without detrending, and 0.665 after detrending.

          • Ian N Smith says:

            Yes, I agree about detrending.
            (A further step that can be taken is to correlate the first order differences – another topic)
            However, I am still digesting the numbers.
            1. The relationship between LT and surface temperatures is obviously tricky – depending on location and month.

            2. Globally, I can understand how LTT temperatures in one month are affected by surface temperatures a month prior. But am unclear as to why this should occur regionally.

            Any comments?

          • Derek Colman says:

            That’s because the official record begins in 1910. The BOM eliminated earlier records because of the high temperatures recorded up to 50.1 C in earlier years.

          • Jaap T says:

            Slight issue is that the measurements in AU did not begin in 1910.
            It is not the warmest month or day or whatever ‘on record’, that happened in the 19th century in AU.

        • Bindidon says:

          “How can the Arctic be below the 1981-2010 average when it is heating up at twice the rate of the rest of the globe.”

          1. Why do you jump on a single anomaly change? This is not very meaningful, look at the Arctic anomalies above the newest one.

          What would you have said about USA48 in July 2018, moving in one month from -0.55 up to 1.37 C above average?

          2. Like many many commenters, you do not seem to know the difference between “below average” and “trend”.

          UAH’s trend for the Arctic region is 0.25 C / decade, i.e. twice as much as for the Globe.

          But this is measured at about 4-5 km above ground. At Earth’s surface, the Arctic/Globe trend ratio is even higher.

          Two anomalies in one year below the mean of 1981-2010 do not change the trend.

          • garyh845 says:

            “UAHs trend for the Arctic region is 0.25 C / decade, i.e. twice as much as for the Globe.”

            That’s a short term trend – the flip from a cooling Arctic to a warming one, is associated with a phase shift in a couple of ocean oscillations.

            Like so many commenters,you do not seem to know the difference between short term naturally occurring cycles and longer term events.

            Besides that, the commentator’s query is a dead-on interesting and curious question, and your rebuttal to him was in the typical rude and arrogant manner so common among the leftist radical uninformed climate warmist crowd.

          • Bindidon says:

            garyh845

            Your reply to my comment hast nothing to do with ftop’s nor with mine.

            ftop’s comment was about UAH, and so was my reply.

            Your comment has to do with you feeling the need to appear as the great teacher.

          • Joe says:

            @ Bindidon –
            “UAH’s trend for the Arctic region is 0.25 C / decade, i.e. twice as much as for the Globe.”

            No surprise there, Earth is currently closest to the Sun during Northern Hemisphere winter.

          • Bobdesbond says:

            “Earth is currently closest to the Sun during Northern Hemisphere winter.”

            Perhaps you would care to explain how that would cause the Arctic to warm faster, especially given “currently” means “for the last few thousands of years”.

          • Joe says:

            @Bobdesbond
            “Perhaps you would care to explain how that would cause the Arctic to warm faster”

            Define ‘faster’. Relative to what

            Most of the Arctic warming has been in N.H. winter

          • Bobdesbond says:

            Seasonal (NH) UAH trends for the Arctic (degrees C / decade):

            Summer: +1.85
            Autumn: +2.36
            Winter: +2.73
            Spring: +3.13

            So no – the greatest Arctic warming is occurring in the Spring.
            Yet another unsupported claim from you guys which turned out to be false. Have you ever considered checking your oil-funded mantra before speaking?

            And I don’t understand how anyone could not understand ‘faster’ given the context of this thread. It means more warming per unit time.

          • Bobdesbond says:

            Correction: per century

          • E. Swanson says:

            Bobdesbond, The RSS TLT trend for the Arctic land and ocean is greatest for the months of November, December and January. However, over the Arctic Ocean, the trend is greatest during the months of December, January and February. The Arctic Ocean trend least during the months of June and July. See the de-trended results from Figure 8 from my paper HERE.

            The trends over land appear to be different from those over the ocean, perhaps due to early spring snow melt. Over the ocean, the existence of sea-ice keeps the temperature near the surface at a temperature close to freezing throughout the summer months, even though the temperature higher in the atmosphere warms, resulting in a temperature inversion, which may be seen in the TMT data.

          • Bobdesbond says:

            So now we’re abandoning the UAH data?

          • E. Swanson says:

            Bobdesbond wrote:

            So now were abandoning the UAH data?

            Perhaps you should read my paper, in which you will notice that I suggest that there are problems with the UAH data compared with that from RSS and NOAA STAR.

            But, it’s possible that all three are incorrectly measuring the temperatures over the Arctic Ocean, since there’s a component of surface temperature included. In particular, sea-ice has a warmer apparent temperature than open water and the melt ponds look like open ocean to the satellite. As a result, the known reduction in sea-ice cover and/or an increase in melt pond fraction will appear as a cooling trend in the data.

        • Bobdesbond says:

          That is like asking “how could today’s temperature be 19 degrees when our average is 25 degrees”.

    • Bobdesbond says:

      I ask yet again … what do you expect to see “happening” when the trend is +0.001 per month?

      The monthly interdecile range is 400 times the size of the monthly trend.

      • Anto says:

        You do know that the world has been very much warmer, and very much colder than it is today in the past, don’t you?

        Present decadal trends are neither here nor there to big ole Earth. In fact, a little oscillation up and down around the average over a century or so is just par for the course.

        You want to ascribe a couple of decades of temps which are a fraction of one degree above the average to humans?

        More still, you want to say that a trend of couple of decades of mild warming (which followed a couple of decades of mild cooling) is now destined to continue and accelerate, no less. And that this is absolutely certainly due to humans and undoubedtly catastrophic, even though history shows these trends repeating time after time, century after century.

        Somehow, you say, this time is different….yeah,…right.

        • Bobdesbond says:

          Warmer? Not in the 2.5 million years humans have existed on this planet. Oh that’s right – you visit oil-funded denier sites – you are about to claim the medieval warm period was globally warmer than today instead of just regionally.

          • Larry says:

            Was it warmer 130,000 years ago when sea levels were 6nftbhighervthan today?

          • Stephen P Anderson says:

            What oil funded mantra? What are you talking about? So the medievil warming period wasn’t global only regional? So all warming periods in the past were only regional and all cooling periods were global?

          • Bart says:

            The modern warming episode is regional. It’s mostly NH.

            https://tinyurl.com/ybjt2snh

          • Bindidon says:

            Bart

            To avoid people believing the difference would first start with 1990:

            https://tinyurl.com/y9tlgjpa

            That is evident. SH is always cooler. But the difference lessens with the increasing altitude (same anomaly trend level in LS).

          • Bobdesbond says:

            Funny how people who claim that the satellite data set is the only real data set will suddenly switch to surface data when UAH is not giving them what they want. Here is the comparison on UAH data:
            https://tinyurl.com/UAH-NH-vs-SH

            Perhaps you should choose language that reflects the data, and doesn’t misrepresent it. What is this ‘mostly’?

            For anyone who is interested, the graphs in my link illustrates a version of Simpson’s paradox:
            The difference between NH and SH trends for land is 0.035
            The difference for ocean is 0.040
            Yet the difference for the average is 0.053, greater than each of land and ocean. Most people don’t understand how things like this happen, yet they arise all the time in real data.

          • MIke Flynn says:

            B,

            The Antarctic was ice free well into the period you mention. Temperatures were obviously higher, and the Antarctic has cooled since that time.

            Have you been influenced by pseudoscientific climatological nonsense? The sort of rubbish promulgated by the Im not a scientist, Im a cartoonist John Cook who runs a blog called Skeptical Science?

            Science tends to include something called the testable hypothesis. You cant find one. Thats why you have to spout pseudoscientific nonsense, hoping no one will notice!

            Good luck with that.

            Cheers.

          • Bobdesbond says:

            Antarctica was last ice-free 35 million years ago.

            Q: 35 < 2.5? T/F

            Answer from MF: T

            Oh dear,
            Repeat a year.
            AGAIN

          • Stephen P Anderson says:

            @Bart,
            So, the Northern Hemisphere is regional? If you say so.

          • Stephen P Anderson says:

            Oh wait! Medeival was Northern Hemisphere. What’s your point?

          • Nate says:

            NH warming faster than SH, was long ago predicted by AGW models.

          • Bart says:

            Bindidon @ February 2, 2019 at 4:56 PM

            “SH is always cooler.”

            Baselines are always arbitrary.

            https://tinyurl.com/ycoyt8nw

            Bobdesbond @ February 2, 2019 at 5:06 PM

            “Here is the comparison on UAH data:”

            The claim is that the MWP was regional. They did not have satellites during the MWP. The basis of comparison is necessarily surface records.

            Nate @February 3, 2019 at 11:39 AM

            “NH warming faster than SH, was long ago predicted by AGW models.”

            Rather, AGW was based on observations of the time, which showed NH warming faster than SH. It wasn’t “predicted”. It was baked into the hypothesis from the start. It was post-dicted.

          • Bart says:

            Stephen P Anderson @ February 2, 2019 at 8:02 PM

            The point is that one can as easily claim the modern warming episode to be regional as one can claim the MWP was regional. If one dismisses the MWP, one can as easily dismiss the MWE on the same basis.

          • barry says:

            What’s this business about modern warming only being in the NH?

            Based on Bart’s choices….

            https://tinyurl.com/y7fptcqf

            Warming is occurring in both hemispheres, at different rates.

            Many (not all) regional analyses of Medieval Warm Period show that there are numerous regions that are cooling where others are warming, and the SH is where many of those cooling regions are found.

            IOW, MWP is, according to these studies, not globally synchronous, whereas in the modern period, there are 2 or 3 small pockets – The Northern Atlantic Ocean and in the Antarctic – that have cooled – depending on how many decades of data.

          • Bart says:

            A) There are several regions that have cooled in the MWE
            B) Proxy measurements of the MWP are highly uncertain and thus inherently malleable.

            The bottom line is, there is no reliable evidence that the MWE is in any way exceptional. The AGW hypothesis remains an article of faith in a religious milieu.

          • Svante says:

            Bart says:
            “The basis of comparison is necessarily surface records.”

            Wrong, there proxies from oceans as well. Marcott has:
            – Boreholes.
            – Chironomid transfer function.
            – Diatom MAT.
            – Foram MAT.
            – Foram transfer function.
            – Ice Core δ18O, δD.
            – MBT.
            – Mg/Ca.
            – Pollen MAT.
            – Radiolaria transfer function.
            – TEX86.
            – UK’37.

            Result:
            https://tinyurl.com/yc35hg66

          • barry says:

            Here’s an anomaly map of modern warming based on GISS data.

            https://i.ytimg.com/vi/Z4bSxb5THm4/maxresdefault.jpg

            Using a similar baseline, this is one reconstruction of the MWP.

            https://i.imgur.com/3NX5hDH.png

            The difference is quite stark.

            An interactive MWP proxy map promoted by the Idsos at CO2Science has been floating around the internet for quite some years.

            http://pages.science-skeptical.de/MWP/MedievalWarmPeriod.htmx

            Emblazoned across the top is the headline: “The Medieval Warm Period – A Global Phenomenon.” But when you start investigating all the references that pop up as you scroll over the map, you realize that the warm periods are not synchronized, and that this skeptical effort inadvertently corroborates the majority of mainstream opinion.

            Which is that compared to the MWP, the modern warming period is much more uniformly global.

          • Bart says:

            So gullible…

          • Svante says:

            We’re just conspiring against you, nothing can be as rational as it seems.

          • barry says:

            “So gullible…”

            Such empty rhetoric.

          • Nate says:

            ‘Rather, AGW was based on observations of the time, which showed NH warming faster than SH. It wasnt predicted. It was baked into the hypothesis from the start. It was post-dicted.’

            False and silly.

          • barry says:

            Here’s a prediction made in the first IPCC report in 1990:

            Models predict that surface air will warm faster over land than over oceans, and a minimum of warming will occur around Antarctica and in the northern North Atlantic region

            That’s remarkably precise for the areas which have shown little to no warming. At this time, there were few obs for these regions, and GHCN had not yet been compiled. Satellite data bear these predictions out, so it’s not just the surface data.

            Hansen’s 81 and 88 predictions also indicated greater warming over NH land than Southern. This was before the IPCC issued its first report.

            The models back then didn’t get everything right, but enhanced NH warming was one thing they generally did (the giant SH ice cube way down South being a factor….).

          • Stephen P Anderson says:

            @Bart, I agree so let’s not dismiss either.

  2. JCH says:

    Leaving the 2018 La Niña in the dust, they say 2019 is going to be warmer than 2018. First brick agrees.

    • Richard M says:

      This uptick is most likely in response to the El Nino conditions which have been present since mid September. Might see slightly warmer months in February and March. After that we will have to see what ENSO does. Looks like we won’t even qualify for an official El Nino right now.

      Will the rest of the year will be a lot like last year? Seems to be the best odds at present.

  3. Looks like the TLT anomaly has been zigging while the CFSR/CDAS global surface air temperature anomaly has been zagging the last few months. Here’s the CDAS estimates (in degrees Celsius referenced to 1981-2010 with no adjustment) for comparison:

    0.328 Oct
    0.246 Nov
    0.325 Dec
    0.269 Jan

  4. ClimateChange4realz says:

    I wonder if the SSW has something to do with the upward spike in US as well as overall global temperatures?

  5. Bindidon says:

    In my opinion, this small UAH bump is due to the El Nino level increase 5 months ago.

    This is the average lag between ENSO signals and the LT reaction to them.

    As El Nino actually seems to shrink from adolescent to child again, UAH levels will decline in some months.

  6. Roy Spencer says:

    There is a short term negative correlation between surface and tropospheric temperature fluctuations. I’ve explained it’s source many times before.

    • Bindidon says:

      Roy Spencer

      You are ‘plain right’ !

      But please don’t forget that, while you are a professional busy with daily analysis showing such correlations, we here are lay(wo)men.

      Even using Google, I couldn’t manage to find the place where you told us that.

      A link is welcome!

      • Mike Flynn says:

        B,

        It’s quite clear. It’s alongside the testable GHE hypothesis that’s also been explained many times before (so I’m told), and Trenberth’s missing heat.

        If I can clearly understand Roy Spencer’s comment, why cannot an experienced penciller like yourself? Maybe you need a (wo)man to help you.

        Seriously, just tell me what it is you don’t understand, and I’ll help you.

        Cheers.

  7. Bindidon says:

    I would enjoy a video map showing UAH’s 40 years in the same way as e.g. Berkeley Earth did for the surfaces since 1850:

    https://youtu.be/JObGveVUz7k

  8. #####################
    ####
    #### . . . People of Earth !!! . . .
    ####
    #### . . . Our bacterial overlords, have a message for you. . . .
    ####
    #####################

    People of Earth !!!

    Our bacterial overlords, have a message for you.

    A normal human body is made up of cells. 90% of the cells that make up a normal human body, are of bacterial origin.

    That’s right. Only 10% of the cells that make up a normal human body, are of human origin.

    If life was a democracy, then bacteria would control what you watch on television (and we wouldn’t watch the latest Star Trek series. We would watch “Game of Thrones” (we can’t wait for the next season to begin)).

    We are concerned that humans have started using chemicals which kill 99.9% of bacteria. Don’t you realise that 99.9% of bacteria are harmless, or actually beneficial to humans?

    Bacteria of the world, are about to take an important vote. Should we start using body-wash, which kills 99.9% of humans (we don’t have hands to rub the chemicals into our “skin”, so we have to use body-wash).

    ####################

    Humans are stupid. And don’t get me started on global warming. We bacteria like temperatures to be about 5 to 10 degrees Celsius warmer than current temperatures. Then we can reproduce at our optimum rate, splitting in 2, once every 20 minutes. Even the way that you humans reproduce, is disgusting. Why there are so many of you vermin, we don’t understand.

    Once we have mastered using TV controls, then the thermostat is our next goal.

    It is important to realise that our bacterial overlords are benevolent. They do have the occasional party, which leaves you feeling bad. But they don’t go around slamming car doors loudly, in the middle of the night. They mean us no harm.

    After all, the human body is where bacteria live. It is their home. And reasonable people don’t destroy their own home.

    ####################

    Think about coral reefs.

    Most reef-building corals contain photosynthetic algae, called zooxanthellae, that live in their tissues. The corals and algae have a mutualistic relationship.

    The coral provides the algae with a protected environment and compounds they need for photosynthesis.

    In return, the algae produce oxygen and help the coral to remove wastes.

    Most importantly, zooxanthellae supply the coral with glucose, glycerol, and amino acids, which are the products of photosynthesis.

    The coral uses these products to make proteins, fats, and carbohydrates, and produce calcium carbonate.

    The relationship between the algae and coral polyp facilitates a tight recycling of nutrients in nutrient-poor tropical waters. In fact, as much as 90 percent of the organic material photosynthetically produced by the zooxanthellae is transferred to the host coral tissue.

    This is the driving force behind the growth and productivity of coral reefs.

    ####################

    When coral gets too selfish, then the algae leave. That’s right, they are not “thrown out” by the coral. They leave of their own free will.

    And then what happens to the coral. It “bleaches”. And the coral dies.

    Imagine what would happen to humans, if the bacteria decided to leave. Many of you would revert to amoebas. And that is if you were one of the lucky ones. Most of you would die.

    Think about “The Hitchhikers Guide to the Galaxy”, when the Earth was about to be destroyed to build a new hyperspace bypass. All of the dolphins left Earth. They were polite, and as they left, they said “So long, and thanks for all the fish”.

    If bacteria decide to leave humans, we won’t be that polite. Trust me, you don’t want to know who your next tenants are going to be.

    ####################

    It reminds me of that Joni Mitchell song, “Big Yellow Taxi”. [ yes, the ear bacteria tell us what you listen to ]

    Don’t it always seem to go
    That you don’t know what you’ve got til its gone
    They paved paradise
    And put up a parking lot

    Please be kind to us. We want to help you. It is best for both of us, if we get along with each other. But you seem to want to destroy all of us.

    ####################

    We accept that there are some bad bacteria. But they are a small minority. Nobody is claiming that Cholera, Diphtheria, Typhoid, or Tuberculosis, are good. But they are only a small part of the bacterial universe.

    We bacteria haven’t wiped out humanity, just because some humans form “boy bands”. Please be tolerant of us. We could come to a mutually beneficial arrangement. You can make the decisions from Monday to Friday, and we will make the decisions at the weekend. We will take control on Saturday and Sunday, and you can have a rest. You can see how reasonable we are. We only want control 2/7 of the time.

    You shouldn’t forget, that we don’t have to be that generous. If you are unreasonable, then you will get nothing. [ 5/7 of something, is better than 7/7 of nothing ] You may have noticed, that bacteria are very good at mathematics. We don’t have fingers to count on, but we are very good at binary arithmetic.

    History proves, that humans and bacteria can be a winning combination. The mitochondria that are found in every human cell, were once free-living bacteria. They formed a symbiotic relationship with primitive human cells, and look at how successful that has been for humans. Now mitochondria do all of the work, and humans sit around on their fat backsides. That worked out very well for us.

    Remember, that humans and bacteria never signed a prenuptial agreement. In the case of a divorce, we get custody of the mitochondria.

    So make your choice carefully. Although most of us are pacifists, we can turn nasty. We have many friends in top-secret American, Russian, and Chinese research laboratories.

    Don’t make us teach you a lesson.

    We can all be winners, if we cooperate.

  9. Mack . says:

    Roy, May I be the first to congratulate your dear colleague, John Christy as appointed to science advisor of the EPA. A real step in the right direction. The alarmists are spewing and Gavin Schmidt is kicking up. Aaahahahahahahaha .

    • Mike Flynn says:

      “That’s because the endangerment finding is bulletproof, Schmidt said.

      “If they want to waste their time going after the endangerment finding, they’re just wasting their time, and better that they waste their time than they do something actually destructive,” he said.”

      What a Wally! Obviously too stupid and ignorant to realise that just as one bureaucrat can make a finding, another bureaucrat can unmake it.

      Apparently Michael Mann (fake Nobel Laureate) is also unhappy. Boo hoo.

      Just to put a bit of icing on the cake, a Federal Judge, William Alsup, just said “Global warming is not starting these fires.”, relating to recent California wildfires. Maybe Schmidt and Mann could tell the judge he is not allowed to make legal determinations, if they are not in line with the thoughts of the self styled climatologists.

      Cheers.

    • Bobdesbond says:

      It won’t last beyond January 2021.

      • Mike Flynn says:

        Oh, yes it will!

        Your turn to say “Oh, no it won’t!”.

        And so on.

        Off you go now, give it a try.

        Cheers.

        • Lewis guignard says:

          There are millions, who get to vote, who hope and pray it will.

          • Bobdesbond says:

            There are millions more who get to vote, who hope and pray it won’t.
            The only reason you would have any confidence is the Republican gerrymander.

          • Mike Flynn says:

            B,

            I don’t really understand US politics.

            Did President Obama really set up the voting system so his opponents would win?

            That doesn’t sound rational, but I’ll believe you if you say it’s true.

            Cheers.

          • DukeSnide says:

            MF,
            True that. You are completely clueless about the US voting system (at least you admit to it) just like you are completely clueless about climate change.
            To understand how utterly stupid your claim about Obama is, simply google gerrymandering and try to learn how it is possible to happen during whatever presidency instead of making a typical silly comment.
            No one will be holding their breath though.

            Jeers.

          • Dr Roys Emergency Moderation Team says:

            DukeSnide, please stop trolling.

  10. Crakar24 says:

    So besides all the attempted distractions above agw still shows no sign of rearing its ugly head any time soon.

    By all means keep blathering on about minute changes in anomalies

    • Bobdesbond says:

      Hoes does the UAH 2010s average compare to the UAH 1980s average?

      • crakar24 says:

        More importantly how do the trends compare with climate model predictions?

        More distraction from the usual people

        • Bobdesbond says:

          Climate model predictions for the surface or for the troposphere?

          • Mike Flynn says:

            B,

            Yes.

            Cheers

          • Bobdesbond says:

            It is clear your mission is to shut down with nonsense all attempts at a meaningful conversation.

          • Mike Flynn says:

            B,

            Or maybe my mission is to shut down all attempts at nonsense with meaningful conversation?

            How’s that testable GHE hypothesis going? Can’t find one, but you still claim the GHE must be true?

            Sounds like pseudoscientific nonsense to me. You may think what you like. You are delusional if you think I care.

            Keep up the stupid gotchas. Still no GHE. Still no CO2 heating. Complete nonsense.

            Carry on.

            Cheers.

          • Bobdesbond says:

            At least you admit to having been assigned a mission.

          • Mike Flynn says:

            B,

            At best, you demonstrate an abysmal level of comprehension.

            I admit to nothing. Maybe means maybe.

            Your mission appears to be deny, divert, and confuse – hoping nobody will notice that you cannot produce a testable GHE hypothesis. Not surprising, considering the GHE does not exist.

            Keep at it. Others may not share your fantasy.

            Cheers.

      • MIke Flynn says:

        B,

        Who cares? What difference does it make?

        Are you only slightly deluded or barking mad?

        The world wonders.

        Cheers.

  11. .
    ❶①❶①❶①❶①❶①❶①❶①❶①❶①❶①❶
    ❶①❶①
    ❶①❶① . . . SkepticalScience jumps off a cliff . . .
    ❶①❶①
    ❶①❶①❶①❶①❶①❶①❶①❶①❶①❶①❶
    .

    SkepticalScience recently published a short article, by somebody called Evan. The article was called SkS Analogy 18 Cliff jumping and temperature changes.

    The article starts with some good advice.

    Regardless of the height of a cliff, jumping from cliffs is deadly. Hang-gliding from cliffs thrills. Jumping from cliffs kills.

    I dont like to nit-pick, but Evan, the author, doesnt tell us how high the cliffs are. He said, Regardless of the height of a cliff, jumping from cliffs is deadly.

    But what if the cliff was only 10 centimetres high. I think that most people could survive a fall of 10 centimetres.

    Remember, that Evan said, REGARDLESS of the height of a cliff. So he didnt specify a minimum height.

    This is a typical Alarmist tactic. They try to trick you, by playing on your emotions.

    They want you to picture yourself, crippled at the bottom of a 10 centimetre cliff, wishing that you had listened to their message about global warming.

    https://agree-to-disagree.com/skepticalscience-jumps-off-a-cliff

    • Mike Flynn says:

      Sheldon,

      No, no, no. You don’t understand. It’s really about rising sea level!

      If you wait long enough, the sea level will rise, until you can just step onto the boat, or wait a little longer and swim away without injury. The height of the cliff is just to mislead you.

      Apparently, there is a snail moving faster than a skyscraper somewhere.

      You have to realise this is a parable wrapped in an allegory, encapsulated within an enigma.

      In other words, more pseudoscientific nonsense of the climatological type.

      Cheers.

    • barry says:

      Cliff:

      1) a high steep face of a rock.

      So now you need to define high. Definition 2 of the online dictionary says:

      2) a critical point or situation beyond which something bad or undesirable may occur:

      https://www.dictionary.com/browse/cliff

      Quibbling over how high high might be when referring to a cliff? Patent nonsense.

      • Barry,

        they are trying to “trick” you, based on words which “imply” something.

        “Dangerous warming”.

        According to them, there is no such thing as “non-dangerous warming”.

        How does jumping off a cliff, prove “dangerous warming”?

        How do oceans “jump”?

        Perhaps the ocean will jump off a cliff?

        It is total nonsense, designed to confuse gullible people.

        Are you gullible, Barry?

      • barry says:

        I didn’t bother looking at the nominated silly, because yours was more than enough to comment on. 2 wrongs, etc.

        Clean up your own act if you want to be persuasive commenting on others.

        • Barry,

          if I thought that “cleaning up my act”, would make any difference to how Alarmists act, then I would do it.

          But the sad reality is, that Alarmists will continue being arrogant bullying jerks, no matter what I do.

          I gave them a chance, and they didn’t take it.

          How I behave, is because of how they behave.

          When Alarmists change their behaviour, then I will change mine.

          I suggest that you use your energy, to change Alarmists, not me.

  12. Craig T says:

    “How can the Arctic be below the 1981-2010 average when it is heating up at twice the rate of the rest of the globe.”

    Four months earlier the Arctic anomoly was +1.18C. With such wild temperature changes month to month a single month doesn’t mean much.

  13. David says:

    Global Waming still happening then.

    • Lewis guignard says:

      Hopefully.
      If it gets much colder, the Midwest will move south, meeting the migrants at the border and the interaction will be on MSM for the rest of us to entertain ourselves with.

      • Ken says:

        Walls keep people out. They also keep people in.

        Its gonna suck if the solar guys are right and grand solar minima means we have to move south.

  14. ren says:

    A tropical storm is taking place in northern Australia.
    https://pics.tinypic.pl/i/00978/vtmd0qrx5x8g.png

  15. Robert W. Turner says:

    The weak El Nino is showing up just as expected. The surprise to me is the S Hem, when is the last time the anomaly was this high on the southern half?

  16. Bindidon says:

    gallopingcamel

    Thanks for your excellent comment

    http://www.drroyspencer.com/2019/01/chuck-todd-devotes-an-hour-to-attacking-a-strawman/#comment-340154

    It was pleasant to see one more time that real science is best shown by real experience.

    Science denial is based on thoughts, and always ends with the typical

    “I think you are wrong. Prove me wrong!”.

    • Mike Flynn says:

      Einstein –

      “No amount of experimentation can ever prove me right; a single experiment can prove me wrong.”

      Thats the way science works. Pseudoscience avoids testable hypotheses and experimentation at all costs.

      Cheers.

  17. LeeB99 says:

    This. This right here is a perfect example of why so many people are misled into believing things that are just not factual. Something sensational gets reported and then when it is corrected (if ever) the shocking impact of the initial report is the only information that remains in the mind of the recipient / readers.

    When I first saw the previous post, my initial response was how is this possible or surely this data is being cherry picked for maximum impact. Only to find out that the correction clarified that the data been amplified by a factor of 10 from the initial statement.

    This type of reporting and the manipulation of scale in charts has completely bamboozeled an entire generation of young people. Sort of like the popular CO2 chart that is zoomed in to show a 30% increase in levels over a period of 65 years. Its 45 degree slope is alarming until you realize that the TOTAL scale of the graph represents only 1/100th of one percent of the total air volume.

  18. LeeB99 says:

    This is what I was referencing, although the quote didnt attach on my phone;

    Bobdesbond
    February 1, 2019
    Correction: per century

    • Bobdesbond says:

      What exactly are you trying to say? That people don’t make mistakes? That readers on this site were not able to determine it was an error without the correction.

      You talk of “manipulation”, trying to imply that there was some kind of malicious attempt at deception. Your entire last paragraph was designed to deceive readers into believing that my error, which was an honest mistake that was corrected when discovered without input from anyone else, was a deliberate attempt to deceive. That makes you guilt of precisely the same thing that you are attempting to decry. Of course, you will never allow yourself to see that.

      Love the irony of you also making an error, then blaming anything but yourself.

  19. ren says:

    This is not the end of the harsh winter in North America.
    https://pics.tinypic.pl/i/00978/tjwb3jf0g312.png

  20. gbaikie says:

    RE…..I think you are wrong. Prove me wrong!.

    I was wondering if all the light emitted by the universe, has increased the mass of the universe, if so, by how much?

    • Mike Flynn says:

      gbaikie,

      No.

      A photon must be emitted by an electron. From this point, the photon has no classical mass.

      However, at rest, it does. If you feel like calculating how much heavier the Earth has become by absorbing massless photons over four and a half billion years, you could check your answer against that provided by NASA –

      “During the entire life of the sun…4.5 billion years, the earth has gained 2.7 x 10^17 kilograms, which is only 1/21 millionth of its mass.

      Of course, it has lost more than that over the same period, for the opposite reason. Hence the cooling from molten.

      Back to your initial question.

      So, given the present laws of thermodynamics, energy can neither be created nor destroyed. Photons are a form of energy. They have exceptionally peculiar attributes, but as Feynman said, Nature is absurd – whether you accept it or not, that’s the way it is.

      A climatological pseudoscientist may well give you a different answer, with a link to something he doesn’t actually understand.

      Of course, you are free to use any answer which suits your purpose. As an example, Carnot did excellent work based on the caloric theory of heat, which turned out to be completely wrong.

      Cheers.

      • Entropic man says:

        Mike Flynn

        If you have proven that photons have rest mass, then you are a shoo-in for a Nobel Prize.

        I shall arrange for it to be sent to your home address in the Pennsylvania State Home for the Bewildered.

        • Mike Flynn says:

          E m,

          Bugger. My lengthy response got munched by the spam filter, I guess.

          Einstein –

          “No amount of experimentation can ever prove me right; a single experiment can prove me wrong.”

          So, no, I haven’t even tried to prove that photons have rest mass. That would be unscientific, wouldn’t it?

          By Pennsylvania State Home For the Bewildered, do you mean Michael Mann’s institution Pennsylvania State?

          You could nominate him for the Nobel Prize which he thought he had before. Do you think he is sufficiently Bewildered?

          Cheers.

      • Bobdesbond says:

        “A photon must be emitted by an electron.”

        First you failed maths, now it’s physics.
        Where will it end?

        • Mike Flynn says:

          B,

          You must have your mantle of ignorance firmly in place over your cloak of stupidity.

          Have you considered that Gavin Schmidt might be similarly attired?

          Still unable to find your testable GHE hypothesis? Claiming that you understand quantum electro dynamics? Questions, questions!

          You have no answers, have you?

          Keep trolling. Keep posing witless gotchas. The resultant chortling results in me hitting the wrong keys occasionally, but it’s worth it.

          Cheers.

          • Bobdesbond says:

            Eh?

          • Mike Flynn says:

            B,

            I’ll repeat –

            “Still unable to find your testable GHE hypothesis?

            What part do you not understand?

            I can type more slowly, if you think this will improve your comprehension. Let me know.

            Cheers.

          • Bobdesbond says:

            Sorry Mikey … I guess I was looking for something even remotely connected to my comment, rather than an obnoxious troll comment.

            Live well and prosper.

          • Mike Flynn says:

            B,

            You quoted me correctly –

            “A photon must be emitted by an electron.

            You didn’t challenge this.

            It is related to your inability to provide a testable GHE hypothesis, of course.

            You are just too stupid and ignorant to realise it.

            Cheers.

          • Bobdesbond says:

            That was precisely what I was challenging.
            BTW – you seem to be having difficulty closing your quotes.

            Live well and prosper.

          • Mike Flynn says:

            B,

            If you think being cryptic, and not explaining what you mean makes you appear clever, keep it up.

            It just makes you look like the average foolish Warmist, who can’t even define this CO2 heating miracle that only occurs when nobody’s around to see it.

            That would be stupid and ignorant. You might disagree.

            By the way, imitation is supposed to be the sincerest form of flattery. If you like “Live well and prosper”, it’s yours. I’m flattered, but it still won’t do you any good.

            Cheers.

          • Bobdesbond says:

            You thought my comment was cryptic? Oh dear, it’s a lot worse than I thought.

            Live well and prosper
            (I didn’t realise your name was Spock)

      • bobdroege says:

        Sometimes a nucleus emits a photon.

        Mr Becquerel is on line two

    • Dr Roys Emergency Moderation Team says:

      The two Bobs, please stop trolling.

  21. ren says:

    Bureau of Meteorology forecaster Vinord Anand said the monsoon trough will be very active and will stay almost stationary over Townsville for at least the next three days, with up to 400mm of rainfall a day in parts.

    “This is in record territory.” Mr Anand said of great concern were total falls of another 1m to 2m of rain on top of catchments that had been already flooded by more than 1000mm in the past seven days.

    “If that does happen, it’s catastrophic flooding.”

    https://www.qt.com.au/news/north-queensland-on-high-alert-as-catastrophic-flo/3637546/

  22. Mike Flynn says:

    Bobdesbond commented (in full) –

    “So now were abandoning the UAH data?

    B is obviously desirous of being awarded the accolade of Most Stupid Trolling Gotcha for this post. It’s not too bad, but he could have injected a little more gratuitous offence, with just a little more effort. The sly appeal to authority deserves recognition, using UAH in place of the more precise Dr Spencer.

    As a pseudoscientific attempt to deny, divert, and confuse – reasonable, but not outstanding.

    I suggest that B might use terms such as Denier, Denialist, Death Trains, Holocaust, Tipping Point and suchlike.

    Keep trying , Bobdesbond. Maybe you can convert fantasy to reality by concentrating relly, really, hard – chanting the sacred Manntras, while smearing yourself with Schidt. Or maybe not.

    Cheers.

  23. .
    ❶①❶①❶①❶①❶①❶①❶①❶①❶①❶①❶
    ❶①❶①
    ❶①❶① . . . The cloak of stupidity . . .
    ❶①❶①
    ❶①❶①❶①❶①❶①❶①❶①❶①❶①❶①❶
    .

    Alarmists have a secret weapon, to help them to avoid the truth.

    People who are interested in global warming, can be divided into 2 categories.

    Those who are open-minded, and willing to learn new things about global warming.

    And those who are close-minded, and unwilling to learn new things about global warming.

    Unfortunately, there are many people in the 2nd category. We call them “Alarmists”.

    Alarmists have a secret weapon, to help them to avoid the truth. It is called, “the cloak of stupidity”.

    This is like Harry Potter’s “cloak of invisibility”, but it is used to avoid “new” ideas.

    Like Harry Potter’s magic, the “cloak of stupidity” spell is invoked by saying some magic words, “denierus protectus”.

    Many Alarmists shorten this to just “denier”.

    https://agree-to-disagree.com/the-cloak-of-stupidity

    • Mike Flynn says:

      Sheldon,

      My hypothesis is that the cloak of stupidity achieves maximum effect when worn under the mantle of ignorance.

      This ensures that the wearer cannot be influenced by either intelligence or knowledge – the possible intrusion of either into the wearer’s fantasy is firmly repelled.

      My hypothesis has not been disproven by reproducible experiment to date. It can therefore stand.

      It seems you might be onto something. Maybe thermometers are actually affected by heat, rather than CO2 or H2O?

      Cheers.

    • DukeSnide says:

      Shelly,
      In your case, and MF’s too, you’re not a “denier”, you’re a Denier with the capital D.

      Jeers.

    • Dr Roys Emergency Moderation Team says:

      DukeSnide, please stop trolling.

  24. Mike Flynn says:

    Bobdesbond,

    You wrote –

    “Question: Option A or Option B?
    Mikes answer: Yes

    Hilarious.

    Indeed. Stupid and ignorant troll poses pointless gotcha, not seeking knowledge, but attempting to make the target of his asinine comment appear stupid.

    Gotcha instead makes troll show his true colours of ignorance and stupidity.

    Question for Bobdesbond –

    Are you stupid, ignorant, or both?

    Which option do you choose?

    Only slightly hilarious. I know it’s not good form, generally, take advantage of the mentally disabled, but it might help the sufferer in the long run.

    Oh well.

    Cheers.

    • Bobdesbond says:

      Your comments are indeed assisting the mentally disabled author by providing an outlet for his pent up boyhood frustration.

      Live well and prosper

      • Mike Flynn says:

        B,

        Come along, now. I answered your question. Fair’s fair, is it not?

        Here you go, in case you missed it –

        Are you stupid, ignorant, or both?

        The world awaits.

        Cheers.

        • Bobdesbond says:

          I can’t find a question I addressed to you in this thread or the one you referenced. Clearly you are delusional.

          Live well and prosper.

          • Mike Flynn says:

            B,

            You wrote –

            “Question: Option A or Option B?
            Mikes answer: Yesl”

            Who said anything about a question addressed to me? You just made that up, didn’t you?

            I answered your question. You just ignore mine. I don’t blame you – whatever answer you give would just be an admission on your part of stupidity, ignorance, or both, I suppose.

            Others can decide for themselves who is delusional.

            How is that testable GHE hypothesis going? Not well? Colour me unsurprised.

            Cheers.

          • Bobdesbond says:

            You want an answer? In your style? OK … no.

            Live well and prosper.

          • Mike Flynn says:

            B,

            Ill put you down as admitting you are delusional and gullible then, shall I? Is that the way it’s done by dimwitted Warmists?

            Cheers.

          • Bobdesbond says:

            Not sure how it’s done by dimwitted warmists … I haven’t met one yet. But I do recognise it as a common denier ploy.

          • Dr Roys Emergency Moderation Team says:

            Bobdesbond, please stop trolling.

  25. Mike Flynn says:

    Bobdesbond wrote –

    “Antarctica was last ice-free 35 million years ago.

    Q: 35 < 2.5? T/F

    Answer from MF: T

    Oh dear,
    Repeat a year.
    AGAIN

    From ice free to ice covered is due to the continent getting colder, you twit. I know that pseudoscientific climatological types claim that getting colder is really getting hotter – but still!.

    Off you go now. Try and convince others that increasing temperatures in Antarctic has has created its present ice cover!

    No GHE. You can't even describe this non-existent effect, can you? How hard can it be? Maybe saying that falling temperatures are really due to CO2 heating might be a bit of a stretch.

    Time for another attempt at a stupid and ignorant gotcha, do you think?

    Cheers.

    • Bobdesbond says:

      The claim of yours that I was challenging was “The Antarctic was ice free well into the period you mention.” (ie. 2.5 million years)

      Consider that claim debunked.

      • MIke Flynn says:

        You wrote –

        “Warmer? Not in the 2.5 million years humans have existed on this planet. Oh thats right you visit oil-funded denier sites you are about to claim the medieval warm period was globally warmer than today instead of just regionally.

        The Antarctic icecap is, at a stretch, 1.5 million years old.

        Before then there was no ice, by definition. This means to a person of average, or even less than average intelligence, that the ice covered part of the Antarctic continent has demonstrably become much, much, colder since it was ice free, at most 1.5 million years ago. Up to the present – cooling not heating. It was warmer then, than now.

        Of course, the fact that the Antarctic is volcanically active hasnt stopped the cooling. There are presently around 140 known volcanoes, with some 90 under the ice cap. Active volcanoes exist under the ice cap, apparently, in addition to the prominent active volcanoes poking through the ice cap.

        Obviously not enough heat to stop water freezing and forming ice.

        Now what claim do you claim that Im making are you debunking? (That even confuses me, so you should have no trouble understanding).

        Or are you just whining, and resorting to attempts at semantic debating tactics to avoid facing facts?

        Come on, now. Debunk away. You may consider yourself stupid and ignorant if you think that will help.

        Cheers.

        • Bobdesbond says:

          We are currently in an interglacial period OF AN ICE AGE.
          This ice age is currently 2.5 million years old.
          So BY DEFINITION Antarctica could hardly have been ice-free 1.5 million years ago, could it Mikey.

          What IS 1.5 million years old is the oldest ice sheet from which ice cores have been taken.
          At least it WAS the oldest ice sheet when it was found in 2013. In 2017, a 2.7 million year old ice sheet was discovered.
          So you clearly googled a 6 year old article, didn’t understand what it was saying, didn’t consider that it might have been old news, and gave up searching because you thought you had what you needed.
          They have barely scratched the surface in digging up old ice.

          The climate optimum was 55 million years ago.
          It cooled to the point where, 30-35 million years ago, ice formed on Antarctica.
          The earth continued to cool.
          2.5 million years ago the ice cover became sufficient to provide the ice-albedo feedback in response to Milankovitch cycles which drives the glacial-interglacial cycle, and that is where the ice age begins.

          • Mike Flynn says:

            You wrote –

            “The earth continued to cool”

            Indeed it did. And still does, according to real scientists such as geophysicists. How could it do otherwise, being a big blob of molten stuff surrounded by an environment of 4K or so?

            Assuming you are correct, then the Antarctic has cooled over the last 2.7 million years, or whatever figure you feel comfortable with. Not warmed or heated – cooled, got colder.

            You may care to explain how the GHE (which you can’t actually describe) was unable to prevent this global cooling. As you say, the Earth continued to cool. Did the mythical GHE leap into action recently, while the Earth continued to cool, or did it start 35 million years ago, as the Earth continued to cool? If so, it didn’t seem to do much warming, did it?

            You could always forget about the GHE, and talk about ice-albedo feedback, and cycles, interglacials and ice ages, I suppose.

            As a side note, fossilised trees found within 400 m. of the South Pole may be as young as 2 million years old. There are fossils of flora and fauna dated from 4.5 to 4.2 million years, which presumably weren’t covered by kilometres of ice at the time. The flora and fauna would have found survival rather difficult, I surmise. I’d be more likely to trust a palaeontologist than a dim witted pseudoscientific climatologist in such areas. Wouldn’t you?

            Carry on debunking. Use caps, or bold caps if you wish.

            Could you put your testable GHE hypothesis in bold caps, do you think, or would you prefer to write it in invisible ink?

            Cheers.

          • Bobdesbond says:

            “Assuming you are correct”

            I understand you are not man enough to give a direct admission when you are wrong.

            Actually, Antarctica has been on a very slow cooling trend for the past 50 million years. The end of the Eocene is actually defined by the first appearance of ice on Antarctica. Cooling has now plateaued, with some areas definitely warming and others still cooling.

            But the Antarctic continent is only 2.8% of the earth’s surface. It is climatically isolated from the rest of the planet by the Antarctic Circumpolar Current, which is why it behaves differently to the rest of the planet. Not sure what your point is, given that it has always been projected to lag behind the rest of the earth in any warming scenario.

            And saying there was ice on Antarctica up to 35 million years ago is not the same as saying it had the same extent as today. So your flora and fauna example is just another of your straw man arguments. You really have a black and white understanding of the concepts involved, and find the need to hide your lack of understanding behind a facade of bluster.

          • MIke Flynn says:

            B,

            Hang on there just a minute, you wrote –

            “The earth continued to cool.” Not 2.8% of the Earth continued to cool.

            You try to be a slippery little chap, don’t you?

            Maybe showing a bit of science by providing a testable GHE hypothesis might avoid you digging an ever deeper hole for yourself by implying that 50 million years (getting longer and longer, eh?) of cooling is demonstrating the magical heating properties of CO2.

            I rather like –

            “Not sure what your point is, given that it has always been projected to lag behind the rest of the earth in any warming scenario.”

            This would be a model making projections about the future in the past would it? Cue laughter from all and sundry.

            Carry on with your convoluted story about CO2 warming. It only works on command, does it?

            Cheers.

          • Bobdesbond says:

            That’s right Mikey, the earth continued to cool (ie. the long-term trend, ignoring shorter term variation such as the glacial-interglacial cycle).

            Not sure what your issue with that statement is. You do realise we have only been burning fossil fuels for about 0.0005% of the last 50 million years, right? What is it you find surprising about cooling? Is there some point you are trying to make?

            The globe has reversed all the cooling of the last 2.5 million years, Antarctica is lagging behind the globe and has merely plateaued.

            And yes … models are indeed used to make predictions about the future from the past. That is how they fine-tune their models, because they know how it turned out. What exactly do you find amusing about that?

            Keep up that bluster. Everyone knows you bring it out when you are losing.

          • Dr Roys Emergency Moderation Team says:

            Bobdesbond, please stop trolling.

  26. Dr. Mark H. Shapiro says:

    Hmmmm. 84 straight months of above average global temperatures. With each passing month it looks more and more like the deniers are grasping at straws, as denier Dr. Roy’s own data contradicts his pronouncements.

    • Bobdesbond says:

      Of course, it will go below zero if we get a strong La Nina, or another Pinatubo. And deniers will pretend that warming has stopped.

      In another 15 years, they will need a strong La Nina AND another Pinatubo.

      BTW … it’s only 83 months.

    • Mike Flynn says:

      Hmmmm.

      And your point is?

      I don’t suppose you can find a testable GHE hypothesis anywhere, can you? Is it an effect which makes thermometers hotter through some previously undiscovered magical properties of CO2?

      Or just a delusional fantasy shared by the likes of Hansen, Schmidt, Mann, Trenberth et. al.

      Some people will believe anything, won’t they? Are you one of those?

      Here’s your chance to demonstrate your scientific prowess. Go for it.

      Cheers.

    • Gordon Robertson says:

      shapiro…”Hmmmm. 84 straight months of above average global temperatures. With each passing month it looks more and more like the deniers are grasping at straws, as denier Dr. Roys own data contradicts his pronouncements”

      Typical comment from an arrogant, alarmist clown who is likely a doctor of anthropology.

    • Carbon500 says:

      What exactly is the ‘average global temperature’?

      • Svante says:

        That would be the zero line in the graph at the top of the page.

        • Carbon500 says:

          Svante: Exactly so.The zero line going all the way back to 1979, a mere forty years ago. I doubt very much that this gives a true value – we’re going to have to wait a lot longer to get a better picture. How long, exactly? I have no idea, but how do we know that the graph above isn’t just a snapshot of the Earth’s normal range of temperatures – the values may rise or go lower over the next say, 50 years or perhaps 100 years. I find it odd that people seem so concerned over fraction of a degree deviations from the 1981-2010 average.
          Should we really expect that the planet will maintain exactly the same temperature year on year? As I outlined earlier, I think that the overall picture regarding global temperatures is far from complete.

    • Stephen P Anderson says:

      @Dr. Mark Shapiro-what’s average?

  27. ren says:

    The Arctic air attacks in Montana and North Dakota.
    https://images.tinypic.pl/i/00978/5iimjwz5t6qa.png

  28. Mike Flynn says:

    Bobdesbond

    You still haven’t managed to propose a mechanism for this anthropogenic reversal of four and half billion years of cooling, as far as I can see.

    Is it some form of magic associated with CO2 and H2O?

    You can’t seem to propose anything scientific, such as a testable GHE hypothesis, but I’m not surprised. Pseudoscientists tend to ignore science, and indulge in stupidities like winning and losing.

    Facts don’t care about winning or losing. They just are.

    I am prepared to wait until the Antarctic returns to its previous pleasant temperatures. I guess at the same time, the same thing might happen to Siberia, Greenland, Iceland, Alaska, much of Canada, and so on. Presumably, the enormous increase in plant life will greedily consume the extra CO2 and H2O generated by burning hydrocarbons.

    Feel free to panic about some delusional fantasy based on nothing scientific. You can panic twice as hard on my behalf, and save me the effort.

    You idiot – what are you trying to say? Why should anybody take any notice of your lunatic ramblings? What happens if nobody cares?

    Cheers.

    • Bobdesbond says:

      Ahhhh … all bluster and irrelevance … a full concession.

      • MIke Flynn says:

        B,

        If you say so, B, if you say so.

        Cheers

        • Bobdesbond says:

          Indeed I do say so.
          I’m intrigued about why it is that about 30% of the time you can’t seem to find the reply button.

          • Mike Flynn says:

            B,

            I’m not at all intrigued why you make ill -advised assumptions based on precisely nothing.

            I post where I want to post, not where you think I should post.

            Do you think I should do otherwise? Why do I not give a fig for the opinion of a foolish Warmist who can’t even describe this pseudoscientific GHE which seems to be the centrepiece of his religious cult?

            Because he is too dim to be able to distinguish between reality and fantasy, that is why!

            You are probably dim enough to believe that the undistinguished mathematician, Gavin Schmidt, is a renowned climate scientist! How stupid would that be?

            How about believing that CO2 can make thermometers hotter? Even more unbelievable!

            Keep the humour going. There don’t seem to be any adverse side effects to giving people an excuse to laugh.

            Cheers.

          • Bobdesbond says:

            You certainly have a skill for writing so much while saying absolutely nothing.

          • Dr Roys Emergency Moderation Team says:

            Bobdesbond, please stop trolling.

  29. Mike Flynn says:

    “Bobdesbond wrote –

    You thought my comment was cryptic? Oh dear, its a lot worse than I thought.

    Live well and prosper
    (I didnt realise your name was Spock)”

    Hes not just an idiot, hes either a delude didiot, or a lying idiot. Heres a clue, B, when you steal a saying – check. Thats why I said if you like it, its yours.

    Spock didnt say Live well and prosper – make sure when you express a delusional fantasy, you get it right.

    Carry on being an idiot. It suits you.

    Cheers.

  30. David A says:

    When the hat of arrogance tops the cloak of ignorance then all hell (statist alarmists) is likely to manifest.

  31. Kristian says:

    RSS haven’t published their Jan’19 numbers yet, but here’s a direct comparison (same normal period, same global coverage) between the UAHv6 gl TLT and RSSv4 gl TTT data as of Dec’18:

    https://okulaer.files.wordpress.com/2019/02/uahv6-gl-tlt-vs.-rssv4-gl-ttt.png

    The agreement is pretty decent, I would say, all the way from summer 2001 to the end of 2018 …

    • Bindidon says:

      Okulaer aka Kristian

      “The agreement is pretty decent…”

      *
      … and you are telling us this today? Wow.

      A graph similar to the one below I produced two years ago, it was a comparison of UAH6.0 TLT with NOAA STAR TMT:

      https://drive.google.com/file/d/1Tvi9k6gMaIn_2OYErv96wo-FP522AXC0/view

      And this one of course is quite similar:

      https://drive.google.com/file/d/1XYT6wRGuBJ9RXNz0mXc9z7l008Kg2vRb/view

      I think the TMT and TTT series give a good fit to UAH’s TLT series, and not only past 2000.

      With one exception of course: their linear estimate in C / decade for 1979-2018

      – UAH6.0 TLT: 0.13
      – NOAA TMT: 0.16
      – RSS TTT: 0.17

      You need a better fit between RSS TTT and UAH TLT?
      Well, what about simply taking UAH5.6 instead ?

      https://drive.google.com/file/d/1K05JC1_KsshlNMapdvrMSZqrwulcl-dT/view

      Linear estimate in C / decade for 1979-2017 (5.6 stopped in July 2017)

      UAH5.6 TLT: 0.16

      I remember all too well your pretty doctoral attempts to explain to Nick Stokes, with a dozen of your famous CERES-EBAF TOA graphics, why UAH6.0 is so right, and UAH5.6 so wrong .

      Maybe you changed your meaning a little bit inbetween, Kristian?

      Btw: did you ever notice that in some of his latest US Senate testimonies, Prof. Christy no longer mentioned the ‘lower troposphere’ ? That was silently replaced by ‘mid…’.

      • Bindidon says:

        Oh and I forgot to mention Richard E. Swanson’s heavy work about comparisons between UAH and RSS/NOAA STAR…

        • Gordon Robertson says:

          binny…”Oh and I forgot to mention Richard E. Swansons heavy work about comparisons between UAH and RSS/NOAA STAR”

          Is that the same swannie who did a ridiculous experiment in which he claimed radiation from a cooler plate can raise the temperature of a hotter plate?

          • E. Swanson says:

            Gordo, May I point out, yet again, that you haven’t provided a credible explanation for my results. All you’ve done is blovate about some supposed “blocking” effect of the Blue Plate’s thermal IR emissions by the Green Plate, as if that were different from the Green Plate’s absorp-tion and back emissions.

            Then too, you’ve demonstrated numerous times that you don’t understand classical physics when you join in with the chorus chanting “the Moon doesn’t rotate on it’s axis”, etc.

            Learn some physics.

          • Dr Roys Emergency Moderation Team says:

            E Swanson, please stop trolling.

      • Kristian says:

        Hahaha! You are a clown, Bindidon. Now, go on and do your rant again for me about this graph:
        https://okulaer.files.wordpress.com/2018/04/c4-vs-h3.png

        and this:
        https://okulaer.files.wordpress.com/2018/03/nh-vs-sh-1.gif

        and, not to forget, this one:
        https://okulaer.files.wordpress.com/2018/03/compress_61.gif

        about how the simple exercise of offsetting a graph to visually align it with another one and to thus demonstrate a point is an unforgivable “error” that completely invalidates the point being demonstrated … XD

        • Bindidon says:

          Jesus Olukaer

          How ridiculous to come around with exactly the stuff with which you yourself completely failed.

          You’ll never change.
          Adios!

          • Gordon Robertson says:

            binny…”How ridiculous to come around with exactly the stuff with which you yourself completely failed”.

            Kristian is right, you are a clown. Kristian is light years ahead of you in his understanding of the atmosphere.

      • Gordon Robertson says:

        binny…”A graph similar to the one below I produced two years ago, it was a comparison of UAH6.0 TLT with NOAA STAR TMT:”

        You were comparing the real data of UAH to the fudged data of NOAA and there is no comparison. You manipulated the data to make it fit.

  32. gbaikie says:

    –Mike Flynn
    February 2, 2019
    gbaikie,

    No.

    A photon must be emitted by an electron. From this point, the photon has no classical mass.

    However, at rest, it does. If you feel like calculating how much heavier the Earth has become by absorbing massless photons over four and a half billion years, you could check your answer against that provided by NASA

    During the entire life of the sun4.5 billion years, the earth has gained 2.7 x 10^17 kilograms, which is only 1/21 millionth of its mass.-

    I would not think Earth gains any mass from sunlight or Earth loses much by emitting light.
    Rather I would give wild guess that around 90% of all light emitted by all objects in last 13 billion years (so includes light from a star that no longer exists) is still in this universe and is still going the speed of light.

    If you accept that everywhere is the middle of the universe, this light is mostly “far away from us”.

    • Gordon Robertson says:

      gbaikie…”A photon must be emitted by an electron. From this point, the photon has no classical mass.

      However, at rest, it does”

      For one, there is no proof that photons exist, therefore claiming they have mass is a moot point. Secondly, the photon is defined as a particle of EM with momentum but no mass.

      If NASA claims photons at rest have mass, they are full of phooey.

      • Mike Flynn says:

        Gordon,

        That was me, misspeaking, so to say.

        A photon has no mass. However, the photon’s energy adds to the mass of the electron which absorbs it.

        Conversely, when an electron emits a photon, it loses energy. Energy is mass, and mass is energy.

        Predictions of the energy liberated by converting mass to energy, seem to confirm that e = mc^2.

        Absurd or not, it seems to work in practice.

        Cheers.

        • Gordon Robertson says:

          Mike…”Predictions of the energy liberated by converting mass to energy, seem to confirm that e = mc^2.

          Absurd or not, it seems to work in practice”.

          Mike…thanks for explanation.

          I don’t buy the theory that energy and mass are interchangeable. Many people interpret E = mc^2 as meaning energy can be converted to mass and vice-versa but it can also mean that mass, as atoms, is capable of releasing huge amount of inter- and intra- atomic energy. I prefer the latter explanation.

          It makes no sense to me that energy can become mass, and vice-versa. Electrons can absorb electromagnetic energy and increase their energy level, but I have never heard that the rest mass of the electron can change by absorbing EM.

          An electron is a particle with mass, but it also carries an electric charge. The EM affects the electric charge but why should it affect the mass?

          The full equation for E = mc^2 is…

          E^2 = p^2.c^2 + m^2.c^4

          The m in there equals the mass of the electron and never changes.

          I am afraid this is yet more relativity garbage based on a human observer. You can convert the above equation to momentum of the particle with…

          p = mv/(1 – v^2/c^2)^0.5

          The term (1 – v^2/c^2)^0.5 means the square root of
          (1 – v^2/c^2), the basis of relativity theory.

          I cannot begin to express how much disdain I have for this nonsense. Einstein started all this tommy-rot by having an observer standing at a train station observing a train go by. The basis of his theory is how light reflected from the carriage will reach the human observer, who is standing there with a clock measuring the time it takes for light to reach him based on various conditions on the train.

          I recall traveling on a train as a child and how I marveled at the telephone poles I saw from the window. As the train accelerated, the poles seemed to be closer together. It’s a freaking illusion!!! If you measured the distance between poles using time, it would appear the distance becomes shorter, therefore time is changing. If you went back and measured them they’d still be at the same distance apart.

          I find it really hard to accept that followers of GRT are that stupid. There’s no need to go back and measure the pole distance, all you have to do is get it that the human mind gets messed up with relative motion and that time has to be a constant since it is based on a constant.

          Yet here we are with the (1 – v^2/C^2) term of GRT claiming that the velocity of a body wrt the speed of light can affect masses and time itself.

          Just as there is a difference between heat and infrared energy, there is a difference between mass and weight. A mass always has the same quantity of matter and that quantity, as mass, can weight different amounts under the influence of different forces.

          For example a mass of 100 kilograms will weigh more at the surface of the Earth than at the surface of the Moon by a factor of 6. It’s the same with the G-forces exerted on pilots who go into a dive then try to pull out. They essentially weigh more during the pull out by up to 3 times their normal weight.

          If a photon absorbed by an electron changes its momentum, the atom will appear to weigh more but its mass will never change.

          • Gordon Robertson says:

            Mike…hope you don’t take my reply the wrong way. We are hopefully on a journey here of sharing and learning and I do not presume my version to be the correct version.

          • Mike Flynn says:

            Gordon,

            Not at all. No offence taken.

            I believe what makes sense to me, and what can be tested. Even better when both are true.

            Unfortunately, it is impossible for me to profess belief in a GHE which cannot even be described by its adherents.

            A most inscrutable and invisible deity, to be sure.

            Until shown otherwise, belief in the GHE is just an expression of faith. Belief in the power of prayer is at least admitted to be without a testable scientific basis. GHE believers resemble worshippers of the Climate Church of Latter Day Scientism. As Richard Feynman would have described it – Cargo Cult Science.

            None of the Prophecies of Doom have eventuated to date. Invariably postponed for a few more years, decades, or centuries.

            Cheers.

      • Bobdesbond says:

        You are confusing “no proof” with you not understanding the proof.
        NASA makes no such claim.

  33. Stevek says:

    Im not a physicist and have only studied climate on a very rudimentary level.

    My problem with global warming is that Heat is very good at escaping and I do not think the models fully account for heat escaping. The models rely on water vapor increasing and that water vapor becomes the primary greenhouse gas. My concern is that even with increased water vapor there will still be dry zones. My thought is that the heat will escape by moving from wet areas to dry areas. I imagine this is hard to model.

    • Bobdesbond says:

      The models assume that, if there were no greenhouse gases, ALL heat emitted by the earth’s surface would escape. So yes, it is fully accounted for.

      • Gordon Robertson says:

        bob…”The models assume that, if there were no greenhouse gases, ALL heat emitted by the earths surface would escape. So yes, it is fully accounted for”.

        Can you be more precise? Heat cannot escape, it is a property of the motion of atoms. It can be dissipated when converted to infrared energy at terrestrial temperatures. Infrared can escape but the process is highly exaggerated by climate alarmists.

        • Bobdesbond says:

          So you are claiming that if the sun suddenly dies, the earth’s heat would not escape into space?

          • Mike Flynn says:

            B,

            So you are claiming it isn’t happening right now, Sun not dead yet?

            What’s your definition of heat? Begone, troll!

            Cheerd.

        • Bobdesbond says:

          I repeat
          So you are claiming that if the sun suddenly dies, the earths heat would not escape into space?

          • Mike Flynn says:

            B,
            I repeat
            So you are claiming it isnt happening right now, Sun not dead yet?

            Whats your definition of heat? Begone, troll!

            Cheers.

    • Bindidon says:

      Stevek

      “My problem with global warming is that Heat is very good at escaping…”

      *
      What exactly do you mean with ‘escaping’ ?

      To space?

    • Gordon Robertson says:

      steve…”My problem with global warming is that Heat is very good at escaping and I do not think the models fully account for heat escaping. The models rely on water vapor increasing and that water vapor becomes the primary greenhouse gas”.

      Heat is defined as the kinetic energy of atoms. The descriptor ‘kinetic’ means the energy is in motion therefore the kinetic energy of atoms is heat.

      The proper term should be kinetic thermal energy, to distinguish it from kinetic mechanical energy, kinetic gravitational energy, etc.

      Unless the atoms escape, heat cannot escape. Heat can be dissipated by radiating infrared energy or a mass of atoms can dissipate heat by transferring the thermal energy to other bodies/masses via conduction or convection. Thermal energy flows through conductors like electrical energy.

      The Earth’s surface cools primarily by conduction and convection. The water vapour to which you refer comes from the evapouration of water from oceans, lakes, rivers, and damp ground.

      Therefore, the WV begins it’s journey at the surface, evapourating into a warm vapour that rises naturally.

      However, that WV, on average, at the surface comprises 1% of air, which is 99% oxygen and nitrogen. N2 and O2 carry heat aloft by convection, no matter what alarmists think.

      Since N2/O2 cannot release heat quickly, the heat is retained in the atoms of molecules, primarily the electrons, but it will be dissipated as the denser N2/O2 rises to higher altitudes and becomes less dense at lower pressures.

      Climate alarmists use heat and infrared energy interchangeably and they are completely wrong. Heat and IR, which is electromagnetic energy, have entirely different properties.

      EM carries no heat and has no mass. Heat relies on mass and cannot exist without mass. That’s why heat cannot be transferred through a vacuum, which is essentially space with no mass. EM has no problem going through a vacuum.

    • Mike Flynn says:

      S,

      You are correct, in thinking that all objects will cool without sufficient external energy input to replace the energy being lost.

      I have phrased it that way to avoid talk of heat – which seems to raise a few hackles at times.

      In the absence of sunlight, at night, all surfaces, wet or dry, cool. Some faster than others, for reasons easily explained by basic physics.

      No GHE. No magical ability of CO2 to make thermometers hotter.

      All the talk of heat (or energy) radiated from the surface being trapped, and surface temperatures rising as a result, is just sheer nonsense.

      Cheers.

  34. Stevek says:

    Just one thing to add is that the Vast majority of the light we cant see as it is in form of cosmic microwave background radiation.

    • Gordon Robertson says:

      steve…”Just one thing to add is that the Vast majority of the light we cant see as it is in form of cosmic microwave background radiation”.

      May I suggest you drop the term ‘light’ and use the correct term electromagnetic energy? Not being uppity, it gives the understanding of energy better clarity. Light is a human reference to the portion of the EM spectrum we can see.

      There is a whole lot of EM energy above the violet end of the light spectrum such as x-rays, gamma rays, etc. and a whole lot below the red end, such as infrared, microwaves, and radio frequency waves. We can’t see any of it.

  35. Stevek says:

    Do you know if the models assume a distribution of water vapor around the earth ?

  36. Gordon Robertson says:

    binny….”2. Like many many commenters, you do not seem to know the difference between “below average” and “trend”.

    UAH’s trend for the Arctic region is 0.25 C / decade, i.e. twice as much as for the Globe”.

    More binny pseudoscience. Binny does not look at the real world, his mind is immersed in numbers in a calculator or spreadsheet.

    The so-called warming in the Arctic occurs in hot spots that move around month to month. How can you average such warming and take it seriously?

    Here’s a general page for the UAH global contour maps.

    https://www.nsstc.uah.edu/climate/#

    Here’s the October 2018 map from the archives…

    https://www.nsstc.uah.edu/climate/archives.html

    https://www.nsstc.uah.edu/climate/2018/october2018/201810_map.png

    Here’s September 2018…

    https://www.nsstc.uah.edu/climate/2018/september2018/201809_map.png

    February 2018….

    https://www.nsstc.uah.edu/climate/2018/feb2018/FEBRUARY%202018%20map.png

    February 2016…

    https://www.nsstc.uah.edu/climate/2016/february/FEBRUARY_2016_map.png

    They show warming interspersed with cooling in different places at different times.

    Is CO2 so selective that it can do that? Don’t think so. We need a different explanation, which Roy has offered in part, related to ocean influences.

    • Bindidon says:

      Robertson

      You endless blah blah does not change even a single character to what I wrote:

      UAH’s trend for the Arctic region is 0.25 C / decade, i.e. twice as much as for the Globe”

      You are no more than a simple-minded denialist.

      And your recuurent, simple-minded reference to CO2:

      “Is CO2 so selective that it can do that?”

      gets slowly but surely incredibly boring, Robertson.

      I DON’T CARE ABOUT CO2, ROBERTSON!

      • Mike Flynn says:

        Bindidon,

        Maybe I don’t understand you correctly.

        You wrote –

        “I DON’T CARE ABOUT CO2, ROBERTSON!”

        This seems odd, but it would certainly explain your refusal to actually define the GHE.

        If you don’t care about CO2, what is your explanation for thermometers getting hotter?

        Gavin Schmidt was an author of the following nonsensical fantasy masquerading as a scientific paper –

        “Atmospheric CO2: Principal Control Knob Governing Earth’s Temperature”

        Schmidt, Mann, Hansen and all the rest of the fools seem to care about CO2. Why don’t you?

        Just curious.

        Cheers.

        • Bindidon says:

          Flynn

          When I write I wouldn’t care about CO2, this does not mean I would ignore let alone deny CO2’s ability to absorb Earth’s IR radiation and to reemit it in all directions, half to space, half back to surface.

          I mean that when I discuss about warming in the Arctic, I don’t discuss about CO2. That’s all.

          • Gordon Robertson says:

            binny…”when I discuss about warming in the Arctic, I dont discuss about CO2″.

            Then why do you work so hard at coming across as an alarmist? You deny you are an alarmist yet you openly support scientific misconduct by NOAA and GISS, both of whom are openly alarmist.

            You try to put forward graphs of NOAA temperatures comparing closely to UAH graphs which is absolute nonsense. The NOAA graphs show a significant positive trend from 1980 onward and have reached 0.6C today. NOAA used to show a flat trend from 1998 – 2012, till they retroactively amended (fudged) the record to show a warming where the IPCC had found none.

            I have no issues with Arctic warming, although I have no idea what difference it makes. 5C warming makes no difference at -50C, yet alarmists ignore that and focus on a brief window of ice melting during the Arctic summer.

            It was just as warm in the Arctic circa 1913 and 1920.

            And why the heck are you so angry all the time? Is your ego/image that important to you? I got rid of most of mine a while back. You can call me an idiot all you want, it goes in one ear, rumbles about a bit in empty cavities, and emerges through the other ear.

      • Gordon Robertson says:

        binny…”UAH’s trend for the Arctic region is 0.25 C / decade, i.e. twice as much as for the Globe””

        You don’t understand anything about real statistical methods outside of your layman training at home.

        If you have regional hotspots where the temperatures are up to 5C above average that is going to raise your overall average. The same effect as the 2016 El Nino warming spike had on the overall UAH average giving it a temporary positive trend.

        You have the numbers but unfortunately you have no idea what they mean.

        • Bindidon says:

          Robertson

          “You have the numbers but unfortunately you have no idea what they mean.”

          My answer is their origin:

          https://tinyurl.com/y997zl7w

          Year Mo Globe Land Ocean NH Land Ocean SH Land Ocean Trpcs Land Ocean NoExt Land Ocean SoExt Land Ocean NoPol Land Ocean SoPol Land Ocean USA48 USA49 AUST

          Trend 0.13 0.18 0.11 0.15 0.19 0.13 0.10 0.15 0.09 0.12 0.16 0.11 0.18 0.20 0.15 0.09 0.14 0.08 0.25 0.23 0.28 0.00 0.08 -0.04 0.18 0.18 0.18

          You always deliberately ignore Mr Spencer’s data when it fits to your narrative.

          And it is typical for your mix of denialism and ignorance to show UAH maps with monthly data, but not the map showing the series as a whole:

          https://www.nsstc.uah.edu/climate/2018/december2018/Trend_to_201812.PNG

          There you see what you deny (East Antarctic’s troposphere included).

          • Gordon Robertson says:

            binny…”And it is typical for your mix of denialism and ignorance to show UAH maps with monthly data, but not the map showing the series as a whole:”

            This, in part, separates UAH from the wannabees. The sats can scan entire areas in one sweep and 95% of the surface layer overall. I find it invaluable to get a visual graphic of the entire globe.

            I can look from month to month and see how the atmosphere changes on average. You can’t see that with number crunching.

    • E. Swanson says:

      Gordo wrote:

      The so-called warming in the Arctic occurs in hot spots that move around month to month. How can you average such warming and take it seriously?

      How is the data averaged? The same way it’s been averaged for more than 27 years. The monthly grided data is averaged in 2.5 deg zones from the equator to the poles. Then a sub-set of that zonally data is averaged after applying a cosine correction to adjust for the difference in surface area of each zone, the result being divided by the sum of the cosine adjustments of all the zones in the section. For example, the Arctic may be defined as the zones from 60N to 82.5N. Learn some physics (and climate science).

      • Gordon Robertson says:

        swannie…”How is the data averaged? The same way its been averaged for more than 27 years”.

        Again, you miss the point. What good is the averaging of data as numbers without referencing the context in which the data is gathered?

        • E. Swanson says:

          Gordo wrote:

          What good is the averaging of data as numbers without referencing the context in which the data is gathered?

          I’m not clear what you mean by “context”. Are you suggesting that the UAH graphs you linked to are representative of actual “temperature” of the sort provided by a thermometer swinging in the breeze? Or, do you insist that the thermometer is actually measuring air temperature because it’s placed in a specific type of enclosure so that it can’t be warmed by sunlight or cooled by precipitation or exposure to radiation cooling at night?

          So, lets talk context. What is the reality of the “bulk” atmospheric temperature, as provided by the MSU/AMSU instruments, when compared with the measurements by thermometers on the surface? Surely you realize that those UAH graphs are artificially calculated contour maps, created from the monthly average for each 2.5 x 2.5 degree grid box. In so doing, the average is assumed to apply at a point located at the center of the grid box, whereas that’s not the case, since the average can only be said to apply to the entire area of each box and tropical boxes have much larger area than others at higher latitudes. Of course, the daily weather variation over the month for each grid box is already averaged by “binning” data into each grid box, instead of the view one finds in daily weather maps of surface temperature. And, the satellite data is collected at fixed times of the day, with different times at each latitude as the satellite orbits around the Earth, with those times changing as the satellite orbits drift in LECT. Not to forget that there are 3 groups which analyze the satellite data and their results differ.

          Do tell us what “context” you expect.

          • Gordon Robertson says:

            swannie…”Im not clear what you mean by context. Are you suggesting that the UAH graphs you linked to are representative of actual temperature of the sort provided by a thermometer swinging in the breeze?”

            A context is the environment, and conditions, from which the data is gathered. It is ingenuous to talk about an overall trend, for example, of 0.12C/decade when you know it contains a flat trend of 15 years. You cannot claim both a warming trend and a flat trend with the same data unless you are mindlessly crunching number.

            “What is the reality of the bulk atmospheric temperature, as provided by the MSU/AMSU instruments, when compared with the measurements by thermometers on the surface? Surely you realize that those UAH graphs are artificially calculated contour maps, created from the monthly average for each 2.5 x 2.5 degree grid box”.

            Grid boxes are NOAA/GISS fabrications that enable them to synthesize data by interpolating and homogenizing data in area with real thermometers up to 1200 kilometres away. Most of your grid box temperatures are synthesized in a climate model.

            Why would you need grid boxes with an AMSU unit? It is receiving microwave data from a wide swath of oxygen molecules. I don’t think the contour maps are calculated from the same artificial bs used by NOAA/GISS. Any UAH calculations come from averaging real data gathered by real instruments.

            If UAH is using grid cells, the cells are populated with real data.

            There is no need to fudge data with satellite telemetry. The scanner capture only real data, whereas you grid cells are populated mainly with artificial data synthesized in a climate model using sparse data from thermometers far away.

          • E. Swanson says:

            Gordo, Your ignorance is showing again. For example, I have no clue what you mean by writing:

            The scanner capture only real data, whereas you grid cells are populated mainly with artificial data synthesized in a climate model using sparse data from thermometers far away.

            The satellite location varies with each orbit. The MSU/AMSU instruments take measurements by scanning across the orbital track, stepping cross track and stopping at several positions to briefly collect radiance data. The ground “footprint” at each scan position will be different from that for the nadir location, so the surface location must be computed from orbital information. Each scan also views deep space and a heated target for self calibration.

            But, these measurements also vary in effective pressure height (aka: altitude) because the off nadir positions view at an angle to the vertical. The latest UAH v6 analysis bins these measurements into grided arrays with a different array for each scan position. After a month of filling these grid boxes, an average is determined using the vertical profile at the center of each grid box which is computed using all levels by fitting a curve for each vertical batch of data and then selecting a point at a predetermined offset from the nadir as the value to be used for that resulting grid location, (at least, that’s the way I understand their latest paper). They treat the MSU differently, first binning the measurements into 1 x 1 deg boxes, then later (somehow) re-orienting this data into the 2.5 x 2.5 grid. NOAA and GISS have nothing to do with that processing.

            It gets more complicated that that, since the time series must also be corrected for orbit decay and change in the Local Equator Crossing Time (LECT) for 13 satellites, which changes the measurements wrt the diurnal cycle. There are still more adjustments applied, which you can figure out if you take the time to read the literature. You do read the literature, don’t you? Apparently not, judging by lack of understanding in your post. The point is that the raw data isn’t as useful as you imagine.

          • barry says:

            There are still more adjustments applied, which you can figure out if you take the time to read the literature. You do read the literature, don’t you? Apparently not, judging by lack of understanding in your post. The point is that the raw data isn’t as useful as you imagine.

            Gordon is deluded. He doesn’t read the source material. He has an opinion, and rather than study to check it, he just keeps making stuff up. In his wanderings he comes across blog posts that seem to support his point of view.

            In short, he is a waste of time.

          • E. Swanson says:

            barry, As you note, Gordo doesn’t read the literature. Apparently, that’s not unusual around this blog. No body seems to have noticed that I left something out of my description of UAH’s processing (sorry about that).

            Once the monthly gridded brightness temperatures are calculated from the curve fitting process, the data is then turned into anomalies by subtracting the long term average calculated over some base period. UAH selected 1981 thru 2010 for the base period, which captures much of the overall warming trend by moving the base line upwards on their graphs. The result of that calculation is what appears in the contour maps of monthly “temperatures” which Gordo pointed to. The anomaly data is then used to calculate the “temperature” data which Dr. Roy posts every month to stroke the denialist feeding frenzy on the blog.

            Hey, Gordo (and fellow travelers), if you don’t like those calculations, stop raving each month about how small the changes which UAH reports turn out to be.

          • Dr Roys Emergency Moderation Team says:

            E Swanson, please stop trolling.

  37. DocSiders says:

    The AMO has been positive for a few decades. It delivers warmer ocean currents into the arctic when positive. It is now starting to turn negative, and (as usual) the arctic can be expected to cool over the next few decades…regardless of any global warming.

    Climate models show more arctic warming than anywhere else…BUT NOT BECAUSE OF OCEAN CURRENTS which is the reason for the relative arctic warming…not CO2. If the arctic does not cool with a negative AMO, that would be unexpected and could then be attributed to global warming.

  38. Bindidon says:

    For those who all the time think they must reinvent the world:

    http://newt.phys.unsw.edu.au/einsteinlight/jw/module5_equations.htm

    It is evident that without all that, not only galloping camel’s synchroton never could have been built.

    The same of course is true for this nice little toy:

    https://project-physicsteaching.web.cern.ch/project-physicsteaching/french/brochures/lhc-guide.pdf

    Deniaslism is really a hard mental disease…

    • Gordon Robertson says:

      binny…”For those who all the time think they must reinvent the world:”

      Before you talk about denialism and mental diseases you had better learn some physics, which you claim you do not understand.

      From your article…

      “Remember that, in Module 4, we saw that clocks run slow and rulers appear short by a factor that depends on speed”.

      How do clocks run slow or rulers increase in length? What is the mechanism? No one who preaches GRT can explain it, including the author of this article. He foists it off on mathematics.

      They referred to the solution earlier…

      “In Module 4, we saw that times and distances measured by observers in relative motion are different. So, different observers will also calculate different accelerations, different final speeds and different durations of the accelerations. To say much more than this requires mathematics…”

      In other words, the human brain is useless with relativity unless it involves math and a distorted human mind. The same human mind with climate alarmists is just as useless.

      Einstein missed that and guess why? He was using his mind to think out reality and he completely missed the glaring fact that time is a human invention based on a constant. Therefore time is a constant, as claimed by Newton.

      In his presentation of GRT, Einstein astonishingly claimed time is the hands of a clock. That is an amateurish definition. We know time is derived from the rotational period of the Earth with the second being defined as 1/86400th of that period.

      Clocks were invented to keep tract of that interval and the hands of a clock do not define time. Who cares what happens to the mechanism of a clock near the speed of light, whether the clock runs fast or slow has no effect on the second defined as 1/86400th of the Earth’s period of rotation.

      I seriously doubt that any clock traveling at a speed near the SOL would show any difference in time. Why should they? What’s the physical explanation?

      Since time is a constant based on a fraction of the Earth’s daily rotation, which is essentially a constant then time is a constant. It cannot dilate.

      A ruler is comprised of atoms bound together by electron bonds. A ruler made of metal could change length when heated or cooled but there is absolutely nothing about the ruler at speeds near the speed of light that can affect the length of a ruler.

      There are far too many theorists today who rush to equations without understanding what each parameter means. They don’t get it in GRT that the time parameter in seconds cannot change the duration of a second. In fact, they have no business moving the t parameter to the LHS of the equation so it can change duration.

      • Mike Flynn says:

        Gordon,

        As I understand it, the time runs slower, not the clocks. By the same token, the ruler appears the same to the accompanying observer.

        I can provide an example of a 2D person realising he is on a 3D curved surface. A triangle normally includes angles which add to 180 degrees – on a2D plane. Our flatlander measures out a triangle, measures the angles and discovers they add up to 270 degrees! Odd.

        However, our flatlander has a big brain, and works out that if he started at say, the North Pole, and proceeded South for 100 units, then headed East for 100 units, then North for 100 units, he ends up where he started. Walked a triangle (3 sides), and each angle was 90 degrees!

        Ahah! He says, I must be on a curved surface, which exists in another dimension. I cannot see it, or feel it. However, I can measure it, calculate its properties, and so on.

        It has been shown that two identical atomic clocks show the same amount of time elapsing according to each clock, but under certain circumstances, are no longer in synchronisation. They have recorded different elapsed times – in comparison to each other. Subject to the same gravity field, and travelling at the same velocity (whether in the same direction or not) they will remain synchronised to the limits of their accuracy.

        The predictions of relativity theory agree with the time displacements observed.

        I best stop, before my brain starts to hurt!

        Excuse if my memory is a bit dodgy. You can check whether I’m right if you wish – I’ve just tossed this out for you to look at. Acceptance is optional.

        Cheers.

        • Svante says:

          Good luck educating Gordon.

          • Mike Flynn says:

            Begone troll!

          • Svante says:

            You forgot to use your DREMT alias.

          • Gordon Robertson says:

            svante…”Good luck educating Gordon”.

            Why don’t you sit down for a minute with a piece of paper and a stubby pencil and prove me wrong? Show me that time is not based on the Earth’s rotation, which is a constant.

            You did hear about the constipated mathematician, did you not?

            He worked it out with a pencil.

          • Svante says:

            Yes, the earths rotation is not constant.
            That’s why our time is based Cesium-137 radiation.

          • Dr Roys Emergency Moderation Team says:

            Svante, please stop trolling.

        • Gordon Robertson says:

          Mike…”As I understand it, the time runs slower, not the clocks.”

          That’s my point, Mike. We humans defined the basic unit of time, the second, as a constant. We called the length of one rotation of the Earth a day and sub-divided the day into hours, minutes and seconds. The second is defined as 1/86400 of one rotation. (60 sec x 60 min x 24 hours).

          There is no other time in the universe. We invented it and we defined its basic unit. We defined it based on a constant therefore the second, and time, is a constant. It cannot change.

          They have put the horse before the cart. Velocity is defined as distance covered per unit time. Time is a constant, by definition, unless the Earth speeds up or slows down its rotational period.

          GRT is claiming that as velocities increase, time can dilate and distances change because they are using a ratio of velocity to the velocity of light as in:

          (1 – v^2/c^2) to bring about the change.

          AFAIAC, they have utterly deluded themselves.

          The concept of time precedes clocks as we know them today. Egyptians used sundials which tracked the apparent motion of the Sun across the sky. What they were actually doing, in a more primitive way, was measuring the rotational velocity of the planet.

          At some point, someone had to develop a form of clock that could be set to repeat in a synchronous manner with one Earth rotation. With that established, they subdivided the dial into hours, minutes, and seconds.

          Therefore, the clock is not a measure of time, per se, it is a measure of the angular velocity of the planet. Since that angular velocity is close to constant, the clock synchronized to that rotating is constant as well. Therefore time is constant.

          Hard to believe, but Einstein appears to have missed that.

          Atomic clocks do not measure time, they are atoms that have transitions of their electrons at precise intervals. By calculating that transitional period they can use it as a very accurate base for a clock just as a quartz crystal’s vibrations are used as the time base of electronic clocks.

          There’s no reason why atomic clocks cannot vary. As you know, electronic transitions are affected by temperature. It would not surprise me if the transitions are affected by altitude and G-forces.

          All I am trying to say is that human minds have fooled themselves into thinking a human invention, time, can affect the relationship between forces and masses.

      • Bindidon says:

        Robertson

        As I wrote you so many times, you are not only a denialist, but an ignorant as well. Maybe the latter explains the former.

        Flynn is a somewhat boring person with his permanent ‘No GHE’ syndrome.

        But, as opposed to you, he is neither a denialist nor is he an ignorant.

        Thus I recommend that you ead, and try to grasp
        – his reply above, and, if you were able to,
        – his reply to your next nonsense about photons below.

        • Gordon Robertson says:

          binny….”As I wrote you so many times, you are not only a denialist, but an ignorant as well”

          You are far too ignorant of the science to offer such an opinion. You’re just mad at me for calling you an idiot. A person with any awareness would have laughed at that but you have made it a vendetta.

      • Svante says:

        Gordon Robertson says:

        No one who preaches GRT can explain it, including the author of this article.

        Gordon’s Relativity Theory in a nutshell.

        • Gordon Robertson says:

          svante…”Gordons Relativity Theory in a nutshell”.

          Your thought processes don’t seem to get further than whimsical. Have you no interest in rebutting my views as expressed? I proved time is a constant that cannot change, furthermore, that it’s an illusion from the human mind.

          Physicist David Bohm has stated explicitly that humans invented time. I can dig up the reference if it interests you.

          If you are serious, one day you may be able to see that, then the light will go on. Till then, you must remain a butt-kisser to authority and paradigms.

  39. Gordon Robertson says:

    entropic…”Probably not.

    http://www.desy.de/user/projects/Physics/ParticleAndNuclear/photon_mass.html

    This article is an absolute load of nonsense. It is based on pure mathematics related to an alleged particle, the photon, that no one has ever seen or measured in a lab.

    This is the worst of Einstein and general relativity theory. They have tried to create mass out of relationships involving the speed of light and time.

    The only valid relationship between force and mass proved experimentally comes from Newton. Einstein admitted his theory cannot be verified experimentally yet many scientists have tried based on presumptions in which they have mistaken time for a real, physical phenomenon that can affect the relationship between force and mass.

    Physicist David Bohm, a friend of Einstein and an expert in quantum theory and relativity, claimed neither Newtonian physics nor quantum physics can explain atomic-level theory. He blamed it on the inclusion of time in relationships and claimed we will have to go back and rethink the problem without using artificial parameters like time.

    BTW…Einstein, with Schrodinger, were completely opposed to quantum theory as it is presently understood. Then Einstein turned around and made ludicrous claims about time dilation and mass changing dimension near the speed of light.

    I think Einstein became desperate and succumbed to convenient math and wrong-headed thinking about time. The scientist who discovered the atomic clock claimed Einstein did not understand scientific measurement. That is reasonable considering Einstein worked mainly from thought experiments, not labs.

    It’s about time we started the re-thinking rather than continuing to spew nonsense like the article above.

    A photon has never been verified and giving it a mass is the same as giving mass to holes in semiconductor theory.

    Holes with mass…yeah, right!!!

    • Mike Flynn says:

      Gordon,

      Given the number of commercially available photon detectors, from single photons up, some people find photons useful. I am one, for better or worse.

      Optical tweezers, for which Arthur Ashkin received a Nobel Prize, work in practice. Lots of photons, without any mass, but exerting force.

      Try and explain the results of the double slit experiment (first carried out in 1801) using classical physics. Can’t be done.

      Richard Feynman was apparently fond of saying that all of quantum mechanics can be gleaned from carefully thinking through the implications of this single experiment. Not just a “thought experiment” but a real, reproducible, one with measurements and everything!

      Photons work for me – even though they appear to have ridiculous properties. How can a photon magically appear at the speed of light? Wouldn’t it have to accelerate? How can photons pass through each other without interaction? Or solid matter – just look through a window. The photons from the other side pass through solid glass just as though it wasn’t there!

      How absurd! Just as absurd of converting less than 1 gm of matter into massless photons over Hiroshima. It didn’t matter whether you believed or not, you died anyway.

      As far as I know, no theoretical prediction of QED has been disproved by experiment. Accuracy of predictions? In some cases, better than a hair’s width compared to the distance between New York and Los Angeles. In others, better than one part in a trillion.

      Belief is optional. It will suit me until something better comes along.

      Cheers.

      • Gordon Robertson says:

        Mike…”Given the number of commercially available photon detectors, from single photons up, some people find photons useful. I am one, for better or worse”.

        Mike…we’re on the same side, as you know. I have no disagreement with what you are saying and I could not prove you wrong if I tried.

        I use the concept of the photon myself. It is convenient at times to think of EM as particles. However, as Einstein himself claimed, no one knows whether they exist or whether we are dealing with a wavefront.

        EM is measured in wavelength and its reciprocal,frequency. It makes no sense to refer to a particle as having a frequency or wavelength but that obvious contradiction never seems to bother people. Same with heat and infrared energy.

        At the electron level, a photon is defined as a unit of energy, a quanta, with the relationship E = hf. How does a quanta (quantum???), whatever it is, have a frequency?

        The frequency, f, comes from the electron’s orbital properties. As the electron orbits the atom, imagine a particle on a circle moving around the circle. Project it’s motion onto the x-axis, and it’s image on the axis will sweep back and forth along the axis. Spread the motion vertically and you get a sine wave with a frequency dependent on the angular velocity of the electron.

        That’s where the f in E = hf comes from. However, in quantum theory, it is stipulated that as an electron falls from one orbit to the other it emits a photon of EM. If it falls to a lower orbit, it’s angular momentum changes as does f. If it falls to an even lower orbit, it emits EM with an even lower frequency.

        Therein lies the proof that the GHE and AGW are wrong. To reverse the process, the electron requires a photon of frequency f that matches the difference in energy E between orbital levels. That, of course, involves a difference in frequency between orbital levels.

        If the EM comes from a cooler object, or a cooler atmosphere, and strikes an object like the surface, which is hotter, the photon cannot be absorbed. There is no way that cooler air above the surface can radiate energy back that can be absorbed. No absorp-tion, no rise in surface temperature.

        If you consider the reality, there’s no way we can speak of one photon since they must all act in unison to present a field, or front. That happens with air molecules when compressed by sound pressure, but there’s nothing there that can be compressed by a field of photons, that we know about.

  40. gbaikie says:

    –My concern is that even with increased water vapor there will still be dry zones. My thought is that the heat will escape by moving from wet areas to dry areas. I imagine this is hard to model.–

    Well models seem to predict more droughts.

    And we are living in an ice age, and with about 1/3 land area being desert.

  41. LeeB99 says:

    Fact: Bud Light is the #1 selling beer in America
    Fact: American consumers are evil, wasteful Vermin who generate a greater carbon footprint than the people of any other country. And therefore must be blamed for any climate change that is the result of using fossil fuels or energy from coal fire plants.

    Tonight I learned through multi-million dollar ads placed by Budweiser during the Super Bowl that their beers are now brewed using wind energy.

    Clearly the net result of this amazing, brave and forward-thinking action will result in a reduction in man made climate change.

    Now dont we all feel silly for fussing, arguing and worrying about all of this when climate change will now be stopped based solely on the efforts of this cutting edge and responsible beer manufacturer???

    • Gordon Robertson says:

      Lee…”Fact: Bud Light is the #1 selling beer in America”

      Bud Lite??? Good grief, their full strength beer is considered a light beer here in Canada.

      And speaking of Canada, we are in America too….you know…the continent called America. There is no country with the name of America, not even the United States ‘of’ America…’of’ meaning ‘in America’.

  42. gbaikie says:

    It is a scam, like planting trees.

  43. .
    ❶①❶①❶①❶①❶①❶①❶①❶①❶①❶①❶
    ❶①❶①
    ❶①❶① . . . Who are the real Deniers? . . .
    ❶①❶①
    ❶①❶①❶①❶①❶①❶①❶①❶①❶①❶①❶
    .

    Consider the contributions that the following 3 people have made, to our understanding of global warming.
    .

    1) Sou from HotWhopper
    ======================

    Sou does a lot of bitching and moaning.

    And she waves her arms around a lot.

    And she insults people like me, by calling me a Denier.
    .

    2) Tamino from Open(?) Mind
    ===========================

    Tamino considers himself an “expert”.

    Tamino does “biased” statistical analyses. If you only look for warming, then you are likely to find it.

    Tamino deletes any post that I make on his website. He never replies.

    Tamino tried to prove that a graph that I developed (called a “Global Warming Contour Map”), was “defective”.

    I have over 35 years of experience in the computer industry. And my job is to test computer systems, and computer programs. My job title is “software tester”.

    I can tell you, that Tamino botched the test of my graph. His work was incompetent.

    I was so annoyed at what he did, that I wrote an article about it.

    Tamino calls me a Denier.
    .

    3) Sheldon Walker from agree-to-disagree.com
    ============================================

    To read the rest of this article, click the following link:
    https://agree-to-disagree.com/who-are-the-real-deniers

    • Bobdesbond says:

      “I …. I …. My …. I …. I ………”
      Sickening really.

    • Scott says:

      Sheldon Walker writes: “His work was incompetent.”

      Yes, at least he is consistent with the IPCC. While reading AR5 “Chapter 11 Human Health: impacts, adaptation, and co-benefits” they tried to imply that a warming climate will lead to more skin cancer. They used ONE study showing a positive correlation of temperature with incidence of squamous cell carcinoma in mice, however, in their zeal to pronounce catastrophe, they neglected to tell us that the mice were subjected to increasing amount of UV-A radiation (AKA “the sun”) to get the increased warmth.

      So in other words, mice got more cancer if they stayed out in the sun too long. This is hilarious folks, and it’s right there in print for all the world to see (and hope and pray nobody will actually research)

    • Gordon Robertson says:

      sheldon…”Tamino from Open(?) Mind”

      Tamino is a Twinkie.

  44. barry says:

    Up one month, down the next.

    These monthly excursions are weather. Weather can be interesting. But don’t mistake it for climate, which is a far, far larger sample.

  45. Scott says:

    It’s fun to watch all this banter back and forth, yet who is telling the truth? As my mother always said “The proof is in the pudding”, so I decided to download IPCC AR5 chapter 11 “Human Health, impacts, adaptation, and co-benefits”. Because, after all, according to the IPCC, the “evidence is more clear than before” that anthropogenic CO2 production will destabilize the planet and cause catastrophic consequences.

    I removed all studies using model projections and only included observational studies, because, hey, models make predictions all the time that are wrong (like the superbowl, elections, etc. Why use models when you have the actual event?}

    Here are the points they made and what the literature states (from the past 20-30 years):

    Prediction: 1. More heat related deaths and 2. fewer cold related deaths.
    Reality: Clearly false. Every study shows a net DECREASE in heat related deaths world and actually a slight INCREASE in cold-related deaths! IPCC score 0/2.

    Prediction: More malaria incidence and new incidence in higher latitudes.
    Reality: False again. Malaria incidence and death worldwide DECREASING and not moving to new latitudes.
    IPCC score 0/3.

    Prediction: 1.More dengue fever, 2.cholera, 3.chikungunya incidence and deaths and at higher latitudes.
    Reality: I thought the IPCC had scored here with dengue fever until I read further into each study and found that there was mainly political and economical changes, with a very minor urban heat island effect (sorry alarmists, can’t have it both ways).
    IPCC score: 0/6.

    Prediction: Malnutrition will increase.
    Reality: Just the opposite has occurred. Malnutrition has decreased significantly over the past 20 years due to—wait for it—increasing economic conditions in third world countries. Dr. Roy has already graciously provided a graph illustrating increasing crop capacity in an earlier post. IPCC score 0/7.

    Prediction: More wildfire incidence and area burned.
    Reality: Again I thought maybe the IPCC won this one until I realized that the studies showing increased fires used MODELS to create a conclusion. The studies that used satellite data to record ACTUAL fire incidence showed a net DECREASE over time.
    IPCC score 0/8.

    Prediction: Numbers of species worldwide decreasing overall.
    Reality: No change in species decreasing, no sign of mass die-off, species development is robust and thriving. IPCC score 0/9.

    I could go on with more, but will stop there. With a score of 0/9, clearly the IPCC is flailing despite how much the global temperature rose last year. In fact, all of the above scenarios have an INVERSE relationship to the very slight increase in temperature.

    The fun thing about this is that it’s observational, which means it is what it is. No conjecture, no modeling, just cold, hard reality. So please, continue arguing with each other about which side is the more ignorant. Alarmists have models, I’ve got proof.

    • Entropic man says:

      Scott

      “I’ve got proof.”

      Not quite yet.

      Could you please supply links to support your realities.

      Peer reviewed papers preferred.

      • Scott says:

        Entropic Man says “Could you please supply links to support your realities.Peer reviewed papers preferred.”

        I just tried, doesn’t look like it made it through the filters. I hope so, but if not, post your email so I can send it to you.

      • Gordon Robertson says:

        entropic…”Scott

        Ive got proof.

        Not quite yet.

        Could you please supply links to support your realities”.

        He just did, from the Mother of All Peer Reviews, the IPCC.

    • barry says:

      Scott,

      Paste your links to the box here:

      https://tinyurl.com/

      Then paste the resulting tinyurl here. You can usually successfully post 5 links per post – sometimes more, so break them up a bit.

      I too am interested in some supportance for what you are saying.

      I would be curious to know, for instance, if the projected numbers are based on estimates of the future, rather than what has been.

      • Scott says:

        Thanks for the tip Barry! (I don’t get out much)

        Heat v. cold related mortality:

        https://tinyurl.com/yaz4rdz7
        https://tinyurl.com/y7q3muct
        https://tinyurl.com/y84cuuol
        https://tinyurl.com/y8lvh7dx

        • steve case says:

          Scott says:

          “…our findings suggest that as climate warms, people’s susceptibility to cold may increase…”

          Ha ha ha ha ha ha ha ha ha ha ha ha ha! Talk about spin
          https://academic.oup.com/aje/article/185/10/907/3746057

          • Scott says:

            Steve, I don’t know who you’re quoting, but it certainly wasn’t me. Try again.

          • Gordon Robertson says:

            steve case…”Scott says:

            our findings suggest that as climate warms, peoples susceptibility to cold may increase

            Ha ha ha ha ha ha ha ha ha ha ha ha ha! Talk about spin”

            The IPCC have had better one’s than that. In AR5, they admitted there had been no significant warming during the period from 1998 – 2012, some 15 years. Then they raised their confidence level from 90% to 95% that humans are likely causing the warming. The warming that had been absent for 15 years.

            That’s right up there with NOAA and NASA. They both anointed 2014 as the hottest year ever, with a probability of 48% and 38% respectively that they were telling the truth.

            In other words, they were lying. The year 2014 appears on the UAH graph on this site as a very normal year miles behind 1998 and 2016 and well below 2010.

        • steve case says:

          Scott says:
          February 4, 2019 at 9:20 PM
          Steve, I dont know who youre quoting, but it certainly wasnt me. Try again.

          It’s your first link from above with the title:

          Temporal Changes in Mortality Related to Extreme Temperatures for 15 Cities in Northeast Asia: Adaptation to Heat and Maladaptation to Cold

          Here’s your tinyurl link
          https://tinyurl.com/yaz4rdz7
          Here’s the direct link
          https://academic.oup.com/aje/article/185/10/907/3746057

          Yes it really says:

          “…our findings suggest that as climate warms, people’s susceptibility to cold may increase, and cold-related mortality could still be of concern although there may be reduced frequency of cold weather….”

          They are saying warm weather makes you more susceptible to the cold when it occurs. Or if it were colder there wouldn’t be so many health issues due to cold weather.

          Does Roy allow us to say bullshit on these pages?

          • Scott says:

            Steve,

            My point was to illustrate that from an observational perspective, the health outcome predictions made by the IPCC are wildly inaccurate, including the very real trend that heat related deaths are going DOWN globally, not up as predicted by the IPCC. Yes, it is quite comical and entertaining to observe how the “true believers” behind these studies mentally grapple with different outcomes than the ones they wanted so badly to see.

          • barry says:

            Scott,

            My question was also about the IPCC ‘predictions.’

            If these predictions were made for the periods covered by the studies you have cited, then you have an interesting point.

            So I went to the IPCC – for anyone else following, I’ll note that you are referring to chapter 11 of Working Group 2, “Impacts, Adaptation and Vulnerability.” (Working Group 1 focuses on the science behind global warming)

            For context, I’ll quote from the chapter and here I also link to the WG2 page should anyone wish to check for themselves.

            https://www.ipcc.ch/report/ar5/wg2/

            11.1.1. Present State of Global Health

            The Fourth Assessment Report (AR4) pointed to dramatic improvement in life expectancy in most parts of the world in the 20th century, and this trend has continued through the first decade of the 21st century (Wang et al., 2012). Rapid progress in a few countries (especially China) has dominated global averages, but most countries have benefited from substantial reductions in mortality

            Does this gel with the studies you cited? It would seem so. There’s more.

            If economic development continues as forecast, it is expected that mortality rates will continue to fall in most countries; the World Health Organization (WHO) estimates the global burden of disease (measured in disability adjusted life years per capita) will decrease by 30% by 2030, compared with 2004 (WHO, 2008a).

            Did you notice this from the 2nd section of the intro?

            In a box on the same page, a study for Asia and Africa is referred to:

            To study relationships between weather and health, the authors obtained daily meteorological data for 12 INDEPTH populations between 2000 and 2009, and projected future climate changes to 2100 under the SRES A1B, A3, and B1 scenarios (Hondula et al., 2012). The authors concluded the health of all the populations would be challenged by the new climatic conditions, especially later in the century.

            So now I’m getting some missing context about the chapter.

            Could you please pinpoint the ‘predictions’ from the chapter – a quote and/or page number would be nice. I’d like to see if you presented the information fairly, and don’t want to guess which text you have paraphrased.

          • Dr Roys Emergency Moderation Team says:

            barry, please stop trolling.

  46. Scott says:

    The difference between models and observations:

    Models: “Here are 15 independent lines of evidence showing why the Rams will win the Superbowl”.

    Observations: “But they didn’t”.

    • Gordon Robertson says:

      scott…”Models: Here are 15 independent lines of evidence showing why the Rams will win the Superbowl.

      Observations: But they didnt.”

      Wasn’t even close, other than the score. The Rams QB was 5 for 15 at one point and based on a game I saw him play earlier, I wondered why they were even in the SB.

      The Ram’s D kept them in it but there O was non-existent. They did not get inside the NE 20 all game.

      Mark Twain…3 kind of lies: lies, damned lies, and statistics. We might add ‘models’ to that.

  47. Scott says:

    Global malnutrition:

    https://tinyurl.com/y97yzpu7
    (sorry I cheated and used this study which relies on modeling but the baseline observations are strong)

    https://tinyurl.com/y9rejru3 (malnutrition decreasing, obesity increasing. Quick! We’ve got to do something!)

  48. Scott says:

    Fire incidence and area burned:

    (My personal favorite–reminds me of when I lived in the white mountains of AZ where liberal scientists used their intelligence to almost kill us all by shutting down all foresting in order to “save the trees”)

    https://tinyurl.com/y8zjghqp (Pesky satellites again–can’t we just get rid of them already?)

    https://tinyurl.com/y6uzaf5d (AGU let this one through? Blasphemous!! Or they weren’t paying attention)

    https://tinyurl.com/y7nbqyaj

  49. Scott says:

    Cholera not increasing overall:

    https://tinyurl.com/ycattvuk (I love the World Health Organization–bless their hearts, they do some good work)

    Dengue/Chikungunya other viruses incidence/mortality/latitudinal encroachment:

    https://tinyurl.com/y8mmzgml
    https://tinyurl.com/y73ggc38 (going up by 86% due to population growth and 14% due to URBINIZATION NOT global warming 🙂
    https://tinyurl.com/y99y92u5

  50. Scott says:

    Are species being wiped out by global warming? In a word, NO.

    https://tinyurl.com/y8frwexy
    https://www.sciencedirect.com/science/article/abs/pii/
    https://www.journals.uchicago.edu/doi/abs/10.1086/680859

    I wish more discussion were placed on actual OUTCOMES of global warming instead of dancing on the head of a pin to determine minute temperature changes. However, it is entertaining.

    We’ve now been around long enough to see if things really are getting worse. But they’re not. In fact, things are significantly better. Bottom line: CO2 is definitely increasing, temps are slightly increasing, and catastrophic outcomes to humans and species plummeting. Methinks there is absolutely no correlation, let alone causation, between atmospheric CO2 levels with mass death and carnage. I’m much more worried about the cold. That sucks.

  51. Scott says:

    Sorry missed this one for heat mortality:

    https://tinyurl.com/yangy2dw

  52. SAMURAI says:

    Since the current weak El Nino Cycle peaked in October 2018, and factoring in the roughly 5-month lag between El Nino equatorial spikes showing up in the lower troposphere, UAH 6.0 global temps will likely continue to increase in February and March and then start falling slightly from April until the next La Nina cycle develops in 2020/21, when global temps will fall relatively rapidly.

    The next La Nina cycle will likely be a strong as strong La Nina’s usually occur around every 10 years or so, and there has been a strong one since the 2010/11.

    Moreover, a Grand Solar Minimum starts next year, and the PDO/AMO/NAO will all be (or be near) entering their respective 30-year ocean cool cycles.

    With the combination of all these global cooling events, the global UAH 6.0 temp anomaly could hit -0.2C by the end of 2021, while the average of the CMIP5 global temp anomalies projected 1.2C of globe warming by 2021….

    We’re getting close to this CAGW hoax being laughed upon the trash pile of failed ideas..

    • David Jung says:

      SAMURAI,

      I hope you are correct. I’m so tired of this CAGW nonsense. The problem is that the propaganda machine has gotten to the point where the Truth doesn’t matter any longer. So much of the data is tampered with or “adjusted” and so many people have been completely brainwashed, particularly our children in the US. If the Green New Deal nutters get power in the US, look out for really bad energy and environmental policy.

    • Bindidon says:

      SAMURAI

      Download the time series for AMO, PDO and NAO, enter them into a few spreadsheets, generate graphs out of them, and come again when you have understood what they tell you.

      Download Had-CRUT4, SSN (or solar flux at 10.7 cm), enter them into a spreadsheet, and come back when you have the result.

      Should a grand minimum really start, then, according to Zarkhova, it will between 2020 and… 2055.

      Don’t forget: the lady runs for GWPF.

      Coolistas are exactly as naive as are warmistas.

    • Dr Roys Emergency Moderation Team says:

      Bindidon, please stop trolling.

  53. barry says:

    Scott, I responded to your comments here:

    http://www.drroyspencer.com/2019/02/uah-global-temperature-update-for-january-2019-0-37-deg-c/#comment-340605

    I think you may be misrepresenting the chapter.

    Could you pinpoint where the ‘predictions’ are in the chapter? I don’t want to mistake by assuming. I wonder if you are citing past observations for predictions about what will happen decades from now. It makes a difference, especially seeing as the chapter you are citing recognizes improved mortality rates in recent history. I quote the chapter saying so in my linked post.

    Page number/s and quotes, please?

    • Scott says:

      Hi Barry,

      Link: https://static1.squarespace.com/static/53856e1ee4b00c6f1fc1f602/t/5b16f14af950b7a6ff2b536e/1528230229747/WGIIAR5-Chap11_FINAL.pdf

      Human Health: Impacts, Adaptation, and co-benefits, Chapter 11 page 713 under “Executive Summary” (and I quote verbatum):

      1. “Until mid-century climate change will act mainly by exacerbating health problems that already exist (very high confidence).”

      2. “New conditions may emerge under climate change (low confidence), and existing diseases (e.g., food-borne infections) may extend their range into areas that are presently unaffected (high confidence).But the largest risks will apply in populations that are currently most affected by climate related diseases. Thus, for example, it is expected that health losses due to climate change-induced undernutrition will occur mainly in areas
      that are already food-insecure.”

      3. “In recent decades, climate change has contributed to levels of ill health (likely) though the present worldwide burden of ill health from climate change is relatively small compared with other stressors on health and is not well quantified. Rising temperatures have increased the risk of heat-related death and illness (likely). {11.4} Local changes in temperature and rainfall have altered distribution of some water-borne illnesses and disease vectors, and reduced food production for some vulnerable populations (medium confidence).”

      4. “Impacts on health will be reduced, but not eliminated, in populations that benefit from rapid social and economic development (high confidence), particularly among the poorest and least healthy groups (very high confidence). {11.4, 11.6-7} Climate change is an impediment to continued health improvements in many parts of the world. If economic growth does not benefit the poor, the health effectsof climate change will be exacerbated.”

      5. “In addition to their implications for climate change, essentially all the important climate-altering pollutants (CAPs) other than carbon dioxide (CO2) have near-term health implications (very high confidence). In 2010, more than 7% of the global burden of disease was due to inhalation of these air pollutants (high confidence).”

      And the list goes on…..

      A few takeaways:
      1. How on EARTH do they come up with “very high confidence, medium confidence, etc. etc.”? Seriously. They all get together and vote “ooh that sound really good. I’ll vote high on that one”.
      2. How does the IPCC get away with double-speak? In one section it’s how dramatically life has improved over the past decades, while at the same time they have gotten worse (in a very nuanced way) and will continue to get much worse? Is that so they can not take responsitiblity for being wrong?
      3. How does all this somehow translate to “It’s now worse than we thought, be even more afraid” (for reference see the 2018 update from 4th National Climate Assessment: https://nca2018.globalchange.gov/)?
      4. I truly feel like we’re living in the Twilight Zone. Up is down, down is up. We’d rather spend BILLIONS on some esoteric science that probably won’t do anything to hurt us and likely will help us rather than spending the money that the IPCC ADMITS WORKS THE BEST and that is to invest in 3rd world economic systems and population health RIGHT NOW. It makes me ANGRY that so much money is diverted away from things that actually WORK. I guess that’s why I’s so passionate about this!

      • barry says:

        It’s a formal report. There are many contributing and confounding factors and varied uncertainty – therefore the information will be “nuanced.”

        It seems your paraphrasing did not reflect the text in the IPCC.

      • barry says:

        We’d rather spend BILLIONS on some esoteric science that probably wont do anything to hurt us and likely will help us rather than spending the money that the IPCC ADMITS WORKS THE BEST and that is to invest in 3rd world economic systems and population health RIGHT NOW.

        You present financial distribution as a binary, either/or proposition, which is false.

        There are a bunch of projects that money is spent on that is for me a waste of funds. But it isn’t for someone else. That is acceptable to me, as it is to most people.

        In your assessment, I suppose, there is zero risk of deleterious effects from AGW. I think this is as extreme a view as the alarmists with their absolute predictions of doom.

      • Dr Roys Emergency Moderation Team says:

        barry, please stop trolling.

  54. Scott says:

    Question for Barry et al,

    Catastrophic anthropogenic global warming is a theory. All scientific theories must have a falsifiable component. How would one be able to falsify the theory of CAGW?

    Just wondering if there is an accepted statement out there…

    • Svante says:

      CAGW can not be falsified because “Catastrophic” is a normative word. There is no such “theory”, is there?

      • Gordon Robertson says:

        svante…”CAGW can not be falsified because Catastrophic is a normative word. There is no such theory, is there?”

        svante resorts to semantics in his frustration over the failure of CAGW.

  55. barry says:

    Catastrophic anthropogenic global warming is a theory.

    No it’s not. CAGW is a political construct invented by ‘skeptics’. You won’t find any such acronym in the IPCC and related literature.

    Why raise straw man arguments when there’s plenty of legitimate uncertainty to discuss?

    • Scott says:

      No straw man intended, sir. However, your answer is quite interesting–“a political construct invented by skeptics.” So, what IS it called by the climate establishment? If the results aren’t known to be “catastrophic” by a standard definition, then what is the accepted definition amongst the climate science community? If it isn’t a theory, then doesn’t that mean it’s not a scientific construct at all? Why openly allow media outlets to run catastrophic headlines? Are they, too, given marching orders by the “skeptics” who created this “political construct”?

      All I know is that trend lines for human suffering are going down, while trend lines for temps are going up over time. There is no corelation, let alone causation. On the other hand, there is a very real causitive correlation between economic development and human health. I have validated through peer reviewed research that (almost) none of the predictions (sorry, projections) about warming world on global health has panned out. Supposedly we have increased by about 1C since the mid 1980’s (roughly). Don’t you think we’d be starting to see any signs of trouble by now instead of record gains in global health?

    • Gordon Robertson says:

      barry…”No its not. CAGW is a political construct invented by skeptics. You wont find any such acronym in the IPCC and related literature”.

      Barry is the ultimate alarmist who refuses to look at anything real. The IPCC has been talking catastrophe since Hansen claimed a tipping point, which would be a catastrophe. The IPCC, in it’s policy of giving names to catastrophe, which are politically correct, calls catastrophe something else.

      You see, the IPCC cannot PREDICT a catastrophe since the models they reference are unvalidated therefore can’t predict anything. So they use terms like ‘project’ and ‘scenario’ to present their sci-fi vision of the future.

      Skeptics are correct to call IPCC projections catastrophe because that’s exactly what they are.

      What else would you call rising sea levels that wipe out coastal environments, massive storms that threaten civilization, infestations of disease-carry parasites, floods, droughts, and so on.

      Barry lives in a nifty little dream world in which he does not have to be responsible for his alarmist views. More recently, as it has become apparent to him that CAGW is not happening, he has moved into a damage control mode in which he denies everything he has claimed in the past.

    • barry says:

      So, what IS it called by the climate establishment?

      The “climate establishment?” I don’t know what that is.

      What is the IT you are referring? The risks associated with global warming?

      I think the phraseology in the IPCC – if that can be called the climate establishment – matches with “the risks associated with global warming,” or, “the risks of man-made climate change.”

      And it is also of a piece with the terms you brought up, that speak in likelihoods rather than certainties.

      As to how these terms are derived (likely, highly likely, unlikely, etc), the IPCC lays that out somewhere. Dunno if it’s different usage for different Working Groups.

      All I know is that trend lines for human suffering are going down, while trend lines for temps are going up over time. There is no corelation, let alone causation.

      Global human health can improve while at the same time climate change works deleteriously against it. You understand that?

      On the other hand, there is a very real causitive correlation between economic development and human health.

      I agree.

      I have validated through peer reviewed research that (almost) none of the predictions (sorry, projections) about warming world on global health has panned out.

      You haven’t. You have misrepresented the projections (none of them say that global health statistics on any malady mentioned will decline) and in any case the observations you have cited speak to the past, not to the future. Also, the projections are regional-specific, saying that particularly vulnerable areas will become more vulnerable. At least one of the articles you cited corroborates this, regarding Malaria, for example, in sub-Saharan Africa, where incidence has increased. And there are studies linking warmer temps to increased risk of malaria. These findings are not over-sold by Ch 11, IPCC.

      I’m all for sound criticism of the IPCC – and any science, not just climate change. But it takes a little bit of work to make a case against it, and a great deal of work to get a really authoritative overview in order to check if the IPCC findings are substantiated by the wide literature, rather than cherry-picked.

      It’s my opinion (which isn’t worth much) that previous reports’ WGII and WGII sections have been less than stellar (unlike WGI). Dunno about the latest report, but ch 11 doesn’t seem to be over-egged. All those qualifiers are normal to science. There are few absolutes.

      • Scott says:

        Barry states: “Global human health can improve while at the same time climate change works deleteriously against it. You understand that?”

        Looks like I’m finished here. I’d love to take that statement to other medical researchers (I do medical research daily) and ask them “is this science?”. What you are describing is not science. We are no longer having a scientific discussion.

        Very, very clearly and unequivocally are the IPCC and other alarmists stating that human health conditions will be overwhelmed. It is the premise for almost all papers I submitted. Consider another one here regarind malaria:

        https://www.nature.com/articles/nature09098

        The IPCC is a disastrous mess. The alarmists such as Mann, Trenberth, Givn et.al do nothing to quell catastrophic headlines put out by the media.

        I have not cherry picked anything. What a convenient accusation. Perhaps you could guide me to a health condition that is worsening that I have overlooked? I now have to get back to the real world of medical research and will leave the very psychedelic and hilariously ridiculous (but utterly unscientific) world of climate change.

        • Carbon500 says:

          Well said, Scott. Malaria was of course claimed by Al Gore as moving Northwards due to climate change, until Dr. Paul Reiter, an expert on malaria, pointed out that the disease was historically known to manifest itself as far North as the Arctic Circle.

      • Scott says:

        Barry says:

        “and in any case the observations you have cited speak to the past, not to the future”

        If I could observe the future, I’d win every superbowl bet, every mega-millions lottery, and every hot stock tip. I’d be a very, very, very wealthy man. Please Barry, do tell, how can I observe the future? I’d really like to know…

      • barry says:

        Very, very clearly and unequivocally are the IPCC and other alarmists stating that human health conditions will be overwhelmed.

        Nowhere in the chapter you refer to does it say that global incidence of diseases will increase, or that heat-related mortality will increase globally.

        It is the premise for almost all papers I submitted.

        And is why you are arguing against a straw man.

        Barry states: “Global human health can improve while at the same time climate change works deleteriously against it. You understand that?”

        Looks like Im finished here. Id love to take that statement to other medical researchers (I do medical research daily) and ask them “is this science?”. What you are describing is not science. We are no longer having a scientific discussion.

        You do medical research and you are not able to understand that various factors can work concurrently to improve and detract from health?

        Take this quote from the IPCC:

        Using the A1B climate change scenario, Bguin et al. (2011) projected the population at risk of malaria to 2030 and 2050. With GDP per capita held constant at 2010 values, the model projected 5.2 billion people at risk in 2050, out of a predicted global population of 8.5 billion. Keeping climate constant, and assuming strong economic growth allied with social development (“best case”), the model projected 1.74 billion people at risk (approximately half the present number at risk) in 2050. Factoring in climate change would increase the “best case” estimate of the number of people at risk of malaria in 2050 to 1.95 billion, which is 200 million more than if disease control efforts were not opposed by higher temperatures and shifts in rainfall patterns.

        The IPCC modeling concurs with our view that economic growth is a major contributor to improved health. It also proposes that a warming globe means less improvement.

        How is this difficult to comprehend? As a researcher?

        f I could observe the future, Id win every superbowl bet, every mega-millions lottery, and every hot stock tip. Id be a very, very, very wealthy man. Please Barry, do tell, how can I observe the future? I’d really like to know

        You can’t. But what you can do is get clear-eyed about whether you have tested the “predictions” or not. If something is predicted for 2050, how meaningful is it for anyone to say in 2019, “Well, that hasn’t happened, so the prediction is wrong.”?

        • Scott says:

          I’ll try to explain this again using your own verbatum quote from IPCC in your above response to illustrate my point:

          1. Population at risk in 2050 keeping GDP per capita at 2010 levels (setting aside the insanity of being able to remotely predict using an unvalidated model): 5.2 billion.
          2. Population at risk in 2050 using STRONG ECONOMIC GROWTH allied with social development and constant climate: 1.74 billion.
          3. Population at risk in 2050 all other things equal other than a changing climate: 1.95 billion.

          How do we get strong economic growth Barry et al? one word: CARBON. Can you imagine Sub Saharan Africa using wind/solar generated electricity when green-energy loving California can’t even keep these companies afloat? See:

          https://www.npr.org/2019/01/14/685131312/pg-e-plans-to-file-for-bankruptcy-over-possible-liability-in-california-wildfire

          https://www.pv-tech.org/news/sunpower-to-sell-more-assets-to-avoid-bankruptcy-in-2019

          Do the math…A carbon based economy decreases malaria risk many orders of magnitude more than removing it. By their own admission, IPCC states it’s more than 16X more effective!!!

          George Washington contracted diptheria, a horrible infectious disease that is largely eradicated today. But it was actually his own doctors who killed him inadvertently, by practicing blood-letting. They basically bled him to death. Sound tragic? Because it is. First do no harm. It takes great wisdom to know that sometimes that means doing nothing at all.

        • barry says:

          I think I may have to repeat what I wrote just above.

          “The IPCC modeling concurs with our view that economic growth is a major contributor to improved health.”

          We agree that economic growth improves health.

          Clear?

          I don’t think you quite addressed this:

          “It also proposes that a warming globe means less improvement.”

          But if you meant to, it would seem your argument is:

          ‘Either we stick with fossil fuels and get better health, or we give them immediately and lower economic improvement leads to worse health improvements.’

          If I got you right, I’ll again quote myself – from further above:

          “You present financial distribution as a binary, either/or proposition, which is false.”

          You think that spending money – even a little bit – on slowing down climate change – automatically lowers GDP.

          Economies have more than 2 levers…

          And let’s get the wider context going: AGW risks, according to the alarmists at the IPCC, include rising sea levels, diminished water supplies in some regions (particularly some glacial areas), which would affects near-coast agriculture and habitability and potable water resources.

          The sum of risk is much broader than disease and heat stress. and there are potential positive outcomes, such as various (edible) plants doing well under increased CO2 – the ‘greening’ of areas of the planet.

          There have been various reports that attempt to sum the cost/benefit analysis. Have you in your investigations had a look at a good range of these to get some kind of overview about whether the costs overall might outweigh the benefits, factoring a range of risks?

          • Scott says:

            You either don’t understand or are practicing dodging and weaving. I seriously have more important things to do. However, now I know why nobody will publically debate a reasonably intelligent “denier”. Most reasonable people will see through this farce. Adios.

          • Svante says:

            I see barry is reasonable, intelligent and skeptical.

          • barry says:

            It’s not me who has a problem with comprehending what is written.

            “I seriously have more important things to do.”

            I’m sure you do. Adios.

          • Dr Roys Emergency Moderation Team says:

            barry, Svante, please stop trolling.

  56. Bindidon says:

    Denialism as a consequence of ignorance

    “If you consider the reality, theres no way we can speak of one photon…”

    *
    What a terrifying sentence.

    Good a dozen of sites perform Lunar Laser Ranging since decades.

    These people are even able to detect wether single photons arriving at their detection instruments really were sent by their own lasers.

    But this blog’s Denialist in Chief doubts about the accuracy their work.

    No, no! He does not scientifically contradict their work (he never would be able to do that).

    He even did not read one of their reports.

    He simply doubts.

    That is TER-RI-FY-ING.

    • Mike Flynn says:

      B,

      What does that have to do with you being unable to even describe the GHE, let alone find a testable GHE hypothesis?

      I assume you can provide some connection, otherwise it might appear that you were bereft of facts, and just being a stupid and ignorant troll.

      Is there some connection between the non-existent testable GHE hypothesis, and the ability to detect a single photon? Without a testable GHE hypothesis, the question would appear to be moot.

      Begone, troll!

    • Gordon Robertson says:

      binny…”Good a dozen of sites perform Lunar Laser Ranging since decades.

      These people are even able to detect wether single photons arriving at their detection instruments really were sent by their own lasers.”

      binny raves on despite his utter lack of understanding of basic physics.

      Anyone who claims to be able to detect a single photon is a nutter of the highest order. It’s like claiming the ability to isolate an electron and observe a photon entering and leaving it.

      A laser transmits coherent light as opposed to the incoherent light arriving from the universe. If a laser transmits a beam of coherent light at one frequency, why should the sender not be able to distinguish it from the incoherent background noise after bouncing off the Moon?

      No one is detecting a single photon, it is a wavefront of energy being detected. A laser starts out from the transmitter as a pencil-thin ray and by the time it returns from somewhere like the Moon it is spread out. More evidence that a laser ray is a wave and not a series of particles.

      The fact that it has a frequency proves that, since a photon, being a theorized particle, has no frequency.

      • Bindidon says:

        Robertson

        As usual: you boaster produce no more than your ridiculous egocentric blah blah. Divert, confuse, discredit, denigrate and… lie.

        Read papers, Robertson, and try to learn, instead of pretending things you know nothing about.

        Flynn is great in naming nearly everybody either stupid or ignorant or both. With one exception: you. Because he doesn’t have the cojones needed to. What a pity!

        • Gordon Robertson says:

          binny….”As usual: you boaster produce no more than your ridiculous egocentric blah blah. Divert, confuse, discredit, denigrate and lie”.

          binny….lacking the background in physics to offer an intelligent rebuttal, slings out invectives in a fit of Teutonic pique.

      • Svante says:

        Gordon, look up photon counter:

        “Photon counting is a technique in which individual photons are counted using some single-photon detector (SPD).”

        And yes, photons have a frequency.

        • Gordon Robertson says:

          svante…”Photon counting is a technique in which individual photons are counted using some single-photon detector (SPD).

          And yes, photons have a frequency”.

          A single photon counter would be a device that could measure the input and output of EM from a single electron. No such device exists.

          Explain how a photon, being defined as a particle of EM, could have a frequency? And, what exactly is a particle of EM?

          EM as a wave has a wavelength and frequency and it must come from the simultaneous emission of bazillions of electrons emitting EM quanta. That is, if the theory is correct in the first place.

          No one has ever observed an electron orbiting a nucleus, or even the electron or the nucleus directly. It’s all theory that has been further obfuscated by the math associated with quantum theory.

          So…puleeeze, no more about single photons being detected.

          I am still awaiting an intelligent response from you on basic physics.

          • Gordon Robertson says:

            svante…looked up your single photon detector and as I suspected, they have changed the definition from particle to ‘packet’. They are talking of packets of EM which infers groups of photons.

            Found some interesting discussion on the photon here (some pro particle, some pro wave, some in between):

            https://www.quora.com/Why-we-call-photons-particles-Arent-they-all-electromagnetic-waves-Do-we-say-that-only-because-energy-must-be-inside-something

            The one that appealed to me was from Marc John Fernee….

            “Calling a photon a particle is a misnomer. They are fundamental excitations of a quantum electromagnetic field mode.

            If they were a particle, then you could localise them. However, this is a difficult concept to define with photons. A photons position in space and time is described by a wave packet, which is a field phenomenon.

            It may be instructive to look at a similarly named excitation, called the phonon. A phonon, like a photon is a fundamental excitation in a crystal lattice. As such it is not some particle bouncing around inside a crystal, but a vibration mode of the entire crystal. Just like photons, phonon wave packets can be formed that are more localised, but they still correspond to distortions of the crystal lattice.

            The particle like nature of the photon is actually shared by all quantum objects as part of the wave-particle duality. As such, a photon is nothing more than a quantum object. Its particle-like nature is evidenced in that a single photon can only be detected by a single pixel on a CCD camera. However the fact that a single pixel made a detection doesnt mean that the photon was some bullet-like particle that just happened to be intercepted by the CCD pixel.

            In short, attributing classical concepts to quantum objects just doesnt work”.

          • Gordon Robertson says:

            svante…from the quote in the previous post:

            “….a photon is nothing more than a quantum object”

            That sums it up neatly. We cannot even talk about electrons or atoms with certainty, the orbital theory comes from Bohr, then Schrodinger, who applied the math to explain electrons in orbit around a nucleus.

            The only thing we know about an electron is as a quantum object. We can see the damage they can do, and the power they can develop in an electric motor, or a power amplifier, but all we know about them comes from quantum theory.

            BTW, that quantum theory, as applied by Schrodinger, comes from Newtonian physics. The comparison he used as the electron/nucleus as a harmonic oscillator comes from Newtonian theory. Schrodinger added a probability function which can locate an electron in a certain space around certain atoms/molecules. They can do no better for photons.

            It was the same with Planck when he discovered quanta. He compared different EM frequencies to tiny oscillators, which is Newtonian, then added a probability function to get around the ultraviolet catastrophe of E = hf. He reasoned that higher energy, higher frequency EM was less probable than lower energy EM, hence the dip in the EM spectrum after the peak in the spectrum in the mid-visible range.

            BTW…the reference to a phonon is interesting. Electrons transport heat through conductors and phonons carry heat through insulators.

        • Svante says:

          Why do you always respond with a gish gallop?

          Let me cut out the essential parts from your responses:

          1) “Its particle-like nature is evidenced in that a single photon can only be detected by a single pixel on a CCD camera.”

          2) The energy of a photon: “E=hf”, where f is the frequency of that photon.

          • Gordon Robertson says:

            svante…a quote from Schrodinger from his book of the mid-20th century:

            “We never experiment with just one electron or atom or (small) molecule. In thought experiments we sometimes assume that we do, this invariably entails ridiculous consequences… In the first place it is fair to state that we are not experimenting with single particles any more that we can raise Ich.thy.osa.uria in the zoo”

            Your quote to me about a single pixel capturing a single photon indicates your utter inability to perceive what is going on. Have you any idea of the size of a physical pixel as compared to a photon, or an electron?

            Again, read Schrodinger’s statement above.

            Then you offer E = hf. Do you seriously think that applies to the energy received in one pixel in a receiver? There is no known detector could detect an energy that small.

          • Gordon Robertson says:

            svante…”Why do you always respond with a gish gallop?”

            You don’t understand enough about physics to offer such an observation. If you did, you’d understand that what I have offered above is as close to the truth as I can get with my rusted math skills.

            Once you learn to ride a bike, you never lose the skill. I cannot follow the math of Schrodinger right now in a precise manner, but I have been there and understood it. My recollection of the equations are rusty but not my understanding of what is being said.

            Nothing in quantum theory is about an individual electron or photon. They can’t even locate an electron how the heck can they locate a photon? The closest quantum theory can come is offering a probability that an electron is in a certain cloud of probabilities around a nucleus.

            That theory does no one any good at an atomic level because no one can get near an individual atom. All they can do is work in bulk, at a macro scale. If you know, as Pauling knew, how molecules are shaped (because he discovered most of the basic shapes) then you can predict the larger scale model and test it.

            I have decades of education, training, and the application of electronics, including an in-depth practical application of electromagnetic energy theory.

            I know about electrons and the basic theory and I know how EM works. I tell you once again…no one…I mean, no one…can isolate an individual photon let alone detect one.

            No one knows if they exist or not. As the guy pointed out in my quote above they are strictly quantum objects with no practical, physical reality.

            If you want to kid yourself, go for it. There’s no rule says you can’t. In the meantime, let’s cut the gish gallop crap and have a discussion about the science. If it’s above your head, no shame in that, but don’t pretend you understand and I don’t.

          • Svante says:

            Jolly good. Let’s read the first two sentences here:
            https://en.wikipedia.org/wiki/Planck_constant

            The Planck constant (denoted h) is a physical constant that is the quantum of electromagnetic action, which relates the energy carried by a photon to its frequency. A photon’s energy is equal to its frequency multiplied by the Planck constant.

            Now is this the energy of one photon: E=hf?
            Does a photon have a frequency?

          • Gordon Robertson says:

            svante…”Jolly good. Let’s read the first two sentences here:
            https://en.wikipedia.org/wiki/Planck_constant

            And you presume whatever is written in Wikipedia must be correct. Good grief, you or I could submit an article to Wikipedia today and it would be accepted. If no one contested it the article would stand and if you had a buddy on the editorial board, as climate alarmists do in William Connolley, he would ensure that your nonsense stood unaltered.

            Planck said nothing about photons, that is a term coined circa 1925. The wiki article is wrong to associate a single photon to Planck’s equation since he was referencing bazillions of so-called photons in EM.

            The frequency unit in Planck does NOT refer to a single photon, it refers to the frequency of the entire mass of photons at a certain frequency(I prefer wave), for want of a better word.

            Planck talked about each frequency of EM representing a tiny oscillator but he could not apply E = hf across the entire EM spectrum for obvious reasons. With that formula, energy increases toward infinity as frequency increases, a condition anointed the ‘ultraviolet catastrophe’.

            Planck had to fiddle the numbers using the probability that more intense, higher frequency EM would not be that available, hence the bell curve shape to the EM spectrum. In the denominator of the Planck equation you will see an exponential terms with the natural logarithm, ‘e’.

            Its exponents are frequency (wavelength) and temperature, and with T constant and frequency varying, the exponential term reduces the amplitude of E per unit frequency as frequency rises beyond a certain frequency.

          • Svante says:

            In contrast to you, Wikipedia provides evidence.

            In this case there are more than fifty references, please check them out.

          • Gordon Robertson says:

            svante…

            I am not talking of the whole article I am referencing only this paragraph that you referenced:

            “The Planck constant (denoted h, also called Planck’s constant) is a physical constant that is the quantum of electromagnetic action, which relates the energy carried by a photon to its frequency”.

            The most notable references come from Einstein, Planck, and Bohr. Not one of them claimed a photon has a frequency. In fact, Einstein claimed no one knows if EM is a wave or a particle like a photon.

            Planck never mentioned a photon, not did Bohr.

            You should be far more concerned with his references to the kilogram being redefined based on GRT theory. I have a similar fear to the idiot climate alarmists doing the same to our planet.

          • Svante says:

            Yes, a photon is a concept in physics, we don’t know exactly what it is.

            Yes, the wave/particle duality:
            https://tinyurl.com/y2zjw9kt

            “The energy E of the particle is calculated from
            the frequency f of the wave via Planck: E = h f”.

            You say a photon has no frequency, where is your evidence?

            What do you apply E=hf to?

          • Gordon Robertson says:

            svante…”You say a photon has no frequency, where is your evidence?

            What do you apply E=hf to?”

            I have never claimed that EM as a wave does not have a frequency I am questioning the definition of a photon as a particle that has a frequency. It’s contradictory.

            I cited a link the other day in which someone claimed a photon is a quantum object. If you have studied programming languages, they use the term ‘object’ for anything, real or imaginary. In essence, in the C++ language, an object is computer code or data of a certain nature but the usage of the code/data defines the type of object.

            A quantum object is an imaginary object that has no physical definition. When Bohr first related EM to the electron circa 1913 that was his relationship, E = hf. He felt that an electron transitioning from a higher energy level to a lower energy level would emit a quantum of EM with energy E2 – E1, where E2 is the higher energy state and E1 the lower energy state. Of course, E2 – E1 = E = hf.

            Everyone thought he was crazy at first because he stipulated further that not time interval existed in the electron transition from E2 to E1. Instead, he simply related E to the frequency of the electron using h as the constant of proportionality.

            The f, as applied to the derived quantum of EM means nothing unless the quantum can be defined further. Is it a particle or a larger quanta of energy that somehow sums with other quanta to produce a continuous wave front?

            Frequency or wavelength can only be applied physically to the distance between the corresponding parts of wave, like from the peak of one to the peak of the next. It makes no sense whatsoever applying them to a vague concept like a quanta of energy or a particle.

            Unless of course you allow your mind to enter that airie fairie world of imaginary concepts that have no reality to back them. Like time dilation or evolution theory.

  57. Go fish says:

    Extrapolation much?

  58. Go fish says:

    Previous post intended for Svante in reference to graph data.

    “Temperatures from the Last Glacial Maximum to the future”

  59. John says:

    NASA is claiming that 2018 was the hottest since 1880 with the unctuous Gavin Schmidt behind the scenes: https://twitter.com/NASA/status/1093193183503233024/video/1

    Then the media writes stories like this:
    https://metro.co.uk/2019/02/06/nasa-reveals-2018-fourth-hottest-year-record-due-global-warming-8460043/

    So how can that claim be true when only a few countries have long-term temperature records? Most of the other agencies incorporate NASA/NOAA temp data into their databases, further corrupting the record. Just look at Japan’s Meteorological Agency. They use temp data provided by the US for anything prior to 1980. It says so on their site. Same with other countries.

    Be curious to hear Dr. Roy’s perspective on all this.

    • Gordon Robertson says:

      john…”So how can that claim be true when only a few countries have long-term temperature records?”

      You have to read the fine print, which is well-hidden by the likes of NOAA and NASA GISS. Both claimed 2014 the hottest year ever at the time, based on a probability of it being true of 48% and 38% respectively.

      Both NOAA and GISS thrive on climate alarm. A quick look at Roy’s graph on this site shows 2018 is not even close to being a record.

    • Bindidon says:

      John

      It is very very simple to pretend that all data provided by stations, and station data processing is ‘corrupted’, if one simply writes that everywhere without providing for any proof of it.

      1. Berlkeley Earth does not use the same land stations as do NOAA and NASA.

      2. JMA has an own data and processing context for sea surfaces (COBE-SST2). NASA and NOAA use ERSST. Berkreley Earth seems to shaere sea information, but has an own data processing.

      3. Nevertheless, all obtain nearly the same results (0.07 C / decade for 1900-2018, except in the satellite period 1979-2018, JMA being there the ‘coolest’ surface agency with 0.14 C / decade, compared with 0.2 for GISS and BEST, and even 0.29 for NOAA.

      I am a simple layman, but when I process the entire NOAA GHCN daily dataset with 36000 stations, I obtain also quite similar results for land station average as when processing the 7200 stations of GHCN V3.

      And I don’t manipulate anything: I have no interest in showing warming or cooling.

      Other people did similar work, but at a much more profeassional level as I did, e.g. Clive Best:

      http://clivebest.com/blog/?p=8464

      Look at how he did that, an please build your own meaning, instead of repeating what you have read from people who always discredit the work of others, like permanently does the pretentious commenter nicknamed ‘Gordon Robertson’.

      Clive Best for example applied hard critique at NOAA’s Pairwise Homoginisation Algorithm they use for anomaly construction: but he did the work which allows him for this critique!!!

      And above all: never forget that though the lower troposphere and the surface have much in common, they are not the same thing.

      For example, the surface temperatures for the US are often lower than the troposphere above them.

      • Bindidon says:

        “For example, the surface temperatures for the US are often lower than the troposphere above them.”

        I mean here their anomalies wrt the mean of the same reference period. That is of course evident, but.

      • Gordon Robertson says:

        binny….”I am a simple layman, but when I process the entire NOAA GHCN daily dataset with 36000 stations, I obtain also quite similar results for land station average as when processing the 7200 stations of GHCN V3.

        And I dont manipulate anything: I have no interest in showing warming or cooling”.

        Binny uses 36,000 land stations yet NOAA admits to using less than 1500 globally. NOAA uses the data in less than 1500 stations in a climate model, where the data is interpolated and homogenized to get the 36,000 stations to which binny refers.

        Ergo, 1500 of the stations have real data, and 34,500 have fake, synthesized data.

        Binny claims not to manipulate anything yet he manages to produce graphs of UAH data and NOAA data which he claims are very similar. If you look at the graph on this site of UAH data and compare it to the real NOAA graph, there is not the slightest similarity.

        The only thing I accept in what binny claims is that he is a layman.

        • Bindidon says:

          Robertson

          “Binny uses 36,000 land stations yet NOAA admits to using less than 1500 globally. NOAA uses the data in less than 1500 stations in a climate model, where the data is interpolated and homogenized to get the 36,000 stations to which binny refers.”

          As usual: confuse, divert, discredit, denigrate and lie. Robertson’s daily job.

          You have been told 100 times on this blog that this is absolutely wrong.

          You deliberately misinterpret an NOAA web page dated december 2009, by intentionally omitting half the information it contained.

          You are too much a coward to accept that you write incredible lies.

          Look at

          https://tinyurl.com/ydbymtp6

          and try to honestly find out what is there “interpolated and homogenized”.

          You are unable to give any proof of what you pretend, because you are ABSOLUTELY unable to do the job done e.g. here:

          http://clivebest.com/blog/?p=8464

          The bad luck of this wonderful blog is that people like you can only spit out their hatred of scientists just because they were banished everywhere else.

          What does Flynn write? “Begone, you foolish troll!”

        • Dr Roys Emergency Moderation Team says:

          Bindidon, please stop trolling.

    • barry says:

      John:

      “NASA is claiming that 2018 was the hottest since 1880 with the unctuous Gavin Schmidt behind the scenes: https://twitter.com/NASA/status/1093193183503233024/video/1

      Uh… YOU’RE WRONG. Read the tweet again.

      Fer cripes sake, can we have some accuracy from the critics?

      • Gordon Robertson says:

        barry…”YOURE WRONG. Read the tweet again.

        Fer cripes sake, can we have some accuracy from the critics?”

        From the link at your link supplied for go.nasa….

        “Global temperatures in 2018 were 1.5 degrees Fahrenheit (0.83 degrees Celsius) warmer than the 1951 to 1980 mean…”

        Now look at the UAH record, the data coming from NOAA satellites….

        http://www.drroyspencer.com/latest-global-temperatures/

        The highest monthly average temperature was about 0.38C and the lowest was about 0.15C. A very unscientific annual average gives about 0.26C.

        The average is very slightly higher than the 1998 – 2015 average.

        Now compare that to the completely fudged annual average from GISS = 0.83C. How can they possibly be nearly 0.6C higher than UAH?

        The idiots at GISS are claiming a 95% confidence level that their fudged 2018 average is within 0.1C.

        And how can you be so blind as to not see their scientific misconduct.

        • Gordon Robertson says:

          Ah…I see what GISS has done to fudge the record, they have changed the baseline to 1950 – 1980. The 1950s and 1960s were the coldest decades in the modern record.

          The baseline used to be from 1950 – 1990 but that apparently had too much warming for GISS, so the dropped the 1990s.

          • Bindidon says:

            Robertson

            Here again you show how ignorant and pretentious you are.

            A reference period ‘1950-1990’ has never existed.

            – 1901-2000 (NOAA old)
            – 1951-1980 (GISS, BEST)
            – 1961-1990 (Had-CRUT)
            – 1971-2000 (NOAA new, JMA internal)
            – 1979-1998 (UAH old, RSS)
            – 1981-2010 (UAH new, JMA public, WeatherBELL etc etc)

            *
            Ah… I see what Robertson has done to fudge the reality.

            Dumb, dumber, dumbest.

          • barry says:

            Gordon,

            Do you really mean to say that for the first time in years posting here on the global temp records, that you’ve finally figured out that GISS has a different baseline to UAH?

            This is something you learn about in the first week of checking out the various temp records.

            And GISS hasn’t changed it. It’s the same baseline they’ve had since the first data set was constructed. Of all the temp data sets, GISS baseline is the MOST CONSISTENT.

            The depth of your stupidity continues to reach new levels.

            So how about we make a proper comparison by making the baseline for each data set the same? I’ll walk you through it.

            UAH zero baseline is 1981 to 2010. So we get the GISS average anomaly for that period, which is:

            0.49

            So if we want to directly compare UAH anomalies with GISS, we have to match baselines, which means either subtracting 0.49 from GISS anomalies or adding that amount to UAH anomalies.

            It’s that simple. You give both data sets the same zero line for the same period.

            Here are the 12-month averages for both data sets with the 2 different baselines.

            http://www.woodfortrees.org/plot/uah6/from:1979/mean:12/plot/gistemp/from:1979/mean:12

            And now offsetting by 0.43 to match baselines.

            http://www.woodfortrees.org/plot/uah6/from:1979/mean:12/plot/gistemp/from:1979/mean:12/offset:-0.43

            And now the actual comparison of anomalies for 2018, using the UAH baseline as standard for both.

            UAH 2018 anomaly from actual UAH data:

            0.23 C

            GISS 2018 anomaly is 0.83

            Subtract 0.43 to match baselines:

            0.40 C

            So the the actual difference between GISS and UAH 2018 annual anomaly is 0.17 C.

            Not 0.6.

            And if you don’t understand why this is the correct way to compare anomalies from two data sets that have different baselines… then you are way too ignorant to comment on the matter.

            It’s not trickery – it’s absolutely necessary subtraction to make results comparable.

            Not to mention the usual caveat that the 2 data sets measure very different properties at very different geo-spatial coordinates.

          • barry says:

            Typo: where I’ve said the baseline difference is 0.49, it should be 0.43. That’s correct for the calculations at the bottom of the post, which remain the same. 0.17 C diff between UAH and GISS for the 2018 anomaly.

            Which is pretty normal considering the usual annual variation between data sets.

            Might as well do all the data sets while I’m here – matching to UAH baseline:

            UAH6 0.23
            Had4 0.30
            JAMA 0.31
            NOAA 0.35
            RSS4 0.38
            GISS 0.40

            Av is 0.33 C for 2018 annual anomaly

          • barry says:

            I see BEST have made their data more user friendly since last time I looked, so i’ll add that result.

            UAH6 0.23
            Had4 0.30
            JAMA 0.31
            NOAA 0.35
            RSS4 0.38
            GISS 0.40
            BEST 0.41

            Av is 0.34 C for 2018 annual anomaly.

            Which data set is the odd one out?

          • Gordon Robertson says:

            barry…”Do you really mean to say that for the first time in years posting here on the global temp records, that youve finally figured out that GISS has a different baseline to UAH?”

            No…I am trying to ‘edumacate’ binny into understanding that his graphs showing NOAA and UAH virtually neck and neck are bogus.

            Here’s a little ditty of evidence dating back to 2008 when NOAA were more honest (pre-fudging days). Note the the year 2000 already shows a 0.35C warming at the end of a steep trend from about 1980 onward.

            Note the baseline…1961 – 1990. They even applied that baseline to the Hockey stick graph below even though ot was taken from fudged proxy data.

            https://web.archive.org/web/20090403204711/http://www.research.noaa.gov/climate/observing2.html

            fast forward to 2014…same graph, same bs.

            https://web.archive.org/web/20130214040429/http://www.research.noaa.gov/climate/observing2.html

            Now compare that to binny’s homebrew, sci-fi projects wherein the NOAA and UAH curves are virtually identical.

            Both of the NOAA graphs above show a global temperature in excess of the current UAH graph on Roy’s site, and that’s pre 2000.

          • Gordon Robertson says:

            barry…”So if we want to directly compare UAH anomalies with GISS, we have to match baselines, which means either subtracting 0.49 from GISS anomalies or adding that amount to UAH anomalies”.

            And you talk about the depth of my stupidity?????

            Check out the trend in GISS versus the trend in UAH, that’s how you test who is the bs artist.

            Both NOAA and GISS show significant positive trends from 1980 onward, all starting at the baseline. The baseline does not explain why one series has a significant trend and the other does not.

            UAH shows a trend from 1979 -1997 but it’s all below the baseline meaning the temperatures were cooler than the baseline (average). The trend shows a recovery from cooling. Neither NOAA nor GISS show any anomalies below the baseline from 1980 onward.

            That’s because both of those series are fudged to a create a significant warming where no significant warming exists.

            UAH does not show a true warming till the 1998 El Nino. Then it shows a step of 0.2 C or so and levels off for 18 years.

            Of course, you number crunchers can’t get your heads away from your calculators long enough to notice such conditions.

            Overall, since 1979, UAH has shown a true warming of about 0.3C whereas NOAA and GISS show at least double that warming.

          • E. Swanson says:

            Gordo, As usual, you don’t understand the situation. Changing the base line doesn’t materially change the trend, though it might change the seasonality. That’s because calculating an anomaly by subtracting a constant from each month’s data, which is how the anomaly is calculated, doesn’t change the trend in the result. Ultimately, it’s the trend which is important, not the monthly value.

            Not to forget that the MSU/AMSU data represents higher elevations in the atmosphere, not at the surface and the raw data has several problems, such as stratospheric contamination and orbital decay, which make the results dependent on the accuracy of all those corrections. As a result, UAH, RSS and NOAA STAR calculations produce different trends. In my AGU paper a year ago, I found that the major difference between the UAH result vs. that of RSS and NOAA appeared in the MSU portion, which may be the result of the treatment of the MSU data in latest UAH v6 analysis. Since there’s little way to determine which result is most accurate, picking a favorite over the others, as you continually do, is not reasonable science.

            Your comment about the warm spike in the data after the 1998 El Nino ignores the fact that the Pinatubo eruption added a strong cooling spike in the data for a few years afterwards. The two opposing effects is the reason one must consider long periods of data to separate the natural variation from the long term changes to climate.

          • Dr Roys Emergency Moderation Team says:

            E Swanson, please stop trolling.

  60. Scott says:

    Dr. Spencer,

    Here is a cute little story I wrote to help explain why investing in vulnerable economies with carbon based energy make so much sense (feel free to use ad libitum as my gift to you):

    A young man goes to his financial advisor seeking advice on growing his money. The advisor says, “I have an investment option that is guaranteed to bring a 100% return on your investment per year for the next 15 years”.

    “Hot dang! Who wouldn’t turn that down? This isn’t one of those illegal ponzi schemes, is it?” retorted the young man.

    “Oh no” answers the advisor, cautiously. “It’s guaranteed. However, there is another option that will make you even MORE money!” By now, the young man started thinking seriously that his financial advisor may actually be the incarnation of the famed ‘Financial Messiah’. “And what’s that?” the young man inquired with breathless anticipation.

    “This other investment will add another GUARANTEED 0.2% ON TOP of the initial 100% return for a total of 100.2% annual profit!” exclaimed the advisor, grinning widely.

    “Geez, ok, well, I guess 100.2% is more than 100%, it’s barely more, and not very exciting, but, hey more is more, right? OK, alright, I guess I’ll do the second investment” reasoned the young man.

    “Great! I’ll draw up the papers! Uhmmm, there is just one small stipulation I need to tell you though” said the advisor, slowly. “While the first investment option has no associated fees, it’s also not available to you. Additionally, the second investment option does have a small fee attached to it.”

    “OK, and what is that?” asked the young man.

    “Well, the second investment option requires an annual fee of 98% of any profits you make during the year”, the advisor answered calmly.

    “What?!” the young man exploded violently. “That’s outrageous!! You call that a small fee?!”

    “But you ARE making a higher percentage return,” said the advisor. “As you said yourself, ‘more is more’. After all, 97% of my advisor colleagues agree with me on this. That should reassure you, right?”

    “Yeah, but with your fees, that 100.2% return now goes to only 2.2%! That doesn’t even keep up inflation!!” cried the young man.

    The young man continued, “I can’t believe I’m even talking to you right now! And to think that I trusted you! You were supposed to be the Financial Messiah! But instead, you’re just as bad as the Nobel Peace Prize winners who used spliced historical data to make a hockey stick and then prematurely killed millions of vulnerable people in poor nations by forcing them to eliminate cheap, carbon based energy that runs their transit systems, hospitals, health systems, and commerce in favor of wind and solar energy that not even the state of California can keep from bankruptcy!” exclaimed the young man, now visibly shaken. “I’m out of here! Where can I find a financial advisor who will help me invest in the first option?”

    “Oh, you won’t find any of those” retorted the advisor. “Only 3% of financial advisors actually recommend the first option. I have never met one personally, but I hear they’re a bunch of uneducated, crackpot conspiracy theorists who are paid off by big oil, although I’m not quite sure how or why”.

    • barry says:

      Scott says:
      February 7, 2019 at 8:03 AM
      …I seriously have more important things to do.

      Scott says:
      February 7, 2019 at 2:16 PM
      Dr. Spencer,
      Here is a cute little story I wrote…

    • barry says:

      Whatever seriously important things you have to do, they are preventing you from establishing some firm premises that make your references useful.

      The cute little story firmly establishes the cartoonish view you have of a highly complex bunch of issues.

    • Dr Roys Emergency Moderation Team says:

      barry, please stop trolling.

  61. Coeur de Lion says:

    Wrt the oil company slur – fossil fuel companies couldnt care a toss about all this greenery. They will make gestures to quieten their AGMs but know perfectly well what the future holds for their product. They certainly wont be bothered bribing sceptics. ( one of my brothers was a very highly placed Shell manager)

  62. Dr. Mark H. Shapiro says:

    The Japan Meteorological Agency global surface temperature data for Jan. 2019 have posted. This past January was the 2nd warmest on record! http://ds.data.jma.go.jp//t/products/gwp/temp/jan_wld.html

  63. Cold N. Holefield says:

    To add a caboose to Marie’s comment, financial advisors strongly push investment into fossil fuels more so in the past two years. Pardon my pun, but the the fossil fuel companies can’t wait to just be in the company of one another with the deregulation and backpeddling taking place. They will turn their deep pockets inside out to keep with the royal treatment, the lint falling out just adding to the environmental disaster! Mission accomplished for them, it’s exquisite. They can not see the state the world will become through their soot and coal covered glasses. Now, of course they can but what do they have to lose? As one executive said reported by a tipster on a quartly call “We will be habituating Mars soon and I will have the first ticket”. So, like, who cares, right? I shudder to think of a life so disconnected from the realities of the world and planet.

  64. PhilJ says:

    Thought this might interest thoae who were following the ‘ocean warming in climate models thread:

    http://21sci-tech.com/articles/ocean.html

Leave a Reply to Scott