A near-repeat of March’s “bomb cyclone” will bring up to 30 inches of snow this week to portions of Minnesota and South Dakota, with blizzard conditions and a threat of severe thunderstorms.
Roughly the same area that experienced flooding rains in March — and still trying to dry out enough to plant corn and soybeans — will see another round of heavy rain and heavy snow. The forecast location of the intense cyclone as of Thursday morning April 11 shows it taking a similar path to the record-setting March storm:

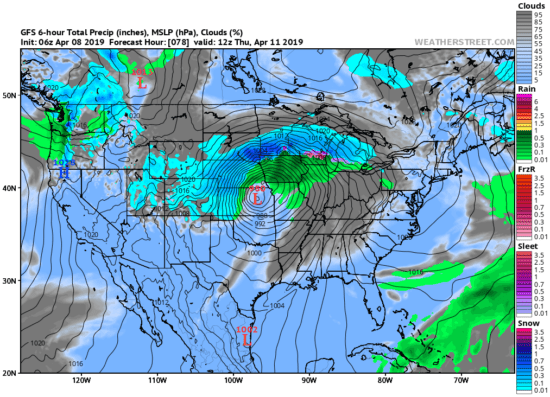
Forecast locations of strong low pressure and precipitation patterns Thursday morning, April 11, 2019 (Weatherstreet.com).
Forecast snowfall totals by midday Friday April 12 indicate the heaviest snowfall (up to 30 inches) over southern Minnesota, with 12-16 inches for Minneapolis:

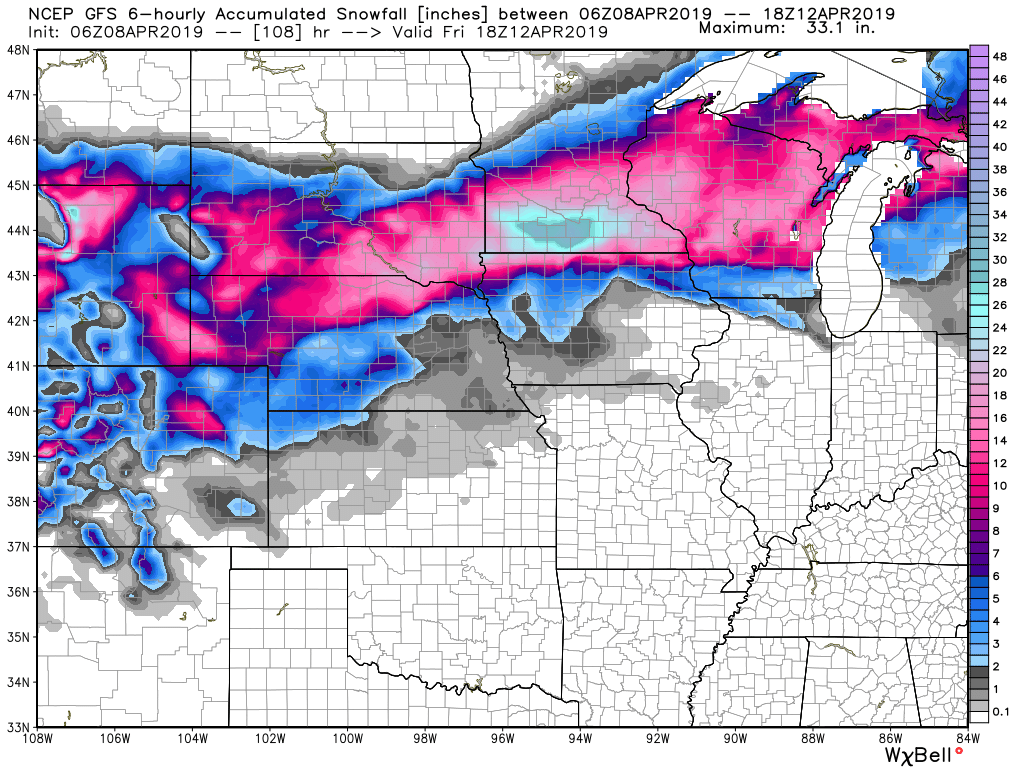
Forecast total snowfall from the GFS model by midday Friday April 12 (graphic courtesy of Weatherbell.com).
The European ECMWF forecast model adds similarly heavy (~30 inches) snow totals in eastern South Dakota. Much of Wisconsin and northern Michigan are forecast to receive 6 to 12 inches.
The energy for such intense cyclones comes from the strong temperature contrast between two air masses. For example, by late Wednesday the temperatures in Nebraska will range from the 70s in the southeast to the 20s in the northwest, simultaneously feeding both blizzard conditions and a severe thunderstorm threat within the state.
Alarmists are going to say that this is exactly what the global warming hypothesis predicts. More blizzards later in the year.
Yes, along with Dr. David Viner’s “Children just aren’t going to know what snow is.”
Shame on you Dr. Spencer for taking Dr. Vines quote out of context. Dr. Vines was speaking about the children of Great Britain only, nowhere else.
Lou Maytrees: I think you might find this entertaining!
https://notalotofpeopleknowthat.wordpress.com/2017/12/10/david-viners-thing-of-the-past-comes-back-to-haunt-him-again/
Carb, Propaganda as entertainment? Uh no I don’t.
Dr. Viner was specifically speaking about the British Isles unique climatological region that they inhabit and to the children of Britain. Not of the whole world.
Taking a scientists words out of context and adding pictures is what the media, like the Telegraph, does for ratings. You should do some research on the story behind your silly article before posting.
Dr. Spencer, of all people, should know what Dr. Viner was referring to. Shame on him for abusing that.
But maybe Roy W. is not Dr. Roy.
That would also explain his farcical comment.
Lou Mattress, when I saw your first comment I smiled because I thought you were attempting humor. But then I saw your followup and realized you were serious.
That’s when I laughed out loud!
Obviously you didn’t realize all the photos in Carbon500’s link were from England.
It’s always amazing how many people are repelled by reality.
Gullible JDPuffman,
Obviously you believe every picture you see on the internet, esp if its from a silly blog called ‘Noteveryonesgullibleenoughtobelievethisbutyouare’, so I understand this’ll be hard for you but here’s an article for you w facts and figures. Its detailed, yet good luck. Snow In Britain: the historical picture and future projections by Alison L Kay February 2016.
Here’s a quote for you from reality of English snowfall:
“An analysis of gridded data shows significant decreases in the number of days of lying snow, from 1961/62 – 2004/05, in all regions of the UK.”
Which in reality is what Dr Viner was referring to in 2000 when he made his comment and which Roy W Spencer and you seem to need to know.
Lou, Viner made that statement almost 20 years ago. He’s been wrong every year since. But, in your head he is right, because he “prediction” was about the “future”. And the “future” won’t be here until Viner is right.
Got it.
Lou Maytrees: I don’t know where you reside, but you need to be aware that the climate of the British Isles varies considerably according to location – and yes, that’s where I live.
Here’s a link to the Met Office website which gives plenty of information:
https://www.metoffice.gov.uk/climate/uk/regional-climates/nw#snowfall
The example I’ve posted takes you to data for the NW of England. You can also access information for other regions and Scotland.
You will have to decide for yourself after looking at all this whether or not you still think that David Viner’s comment was sensible.
I think that you need to adopt a much more questioning stance and start looking deeper when comments such as those of his are reported.
Carbon500,
Your link to the annual/monthly snowfalls of GB shows nothing except annual/monthly precipitation and has little to do with what Dr. Viner was speaking about.
Since you live there you should know that Britain, esp the lowlands, lies mostly right at the snow/rain temperature line.
Even Dr. Spencer’s 2 mile high Lower Troposphere graph shows the planet is steadily warming, along with every other global temp graph on the planet, so eventually even Great Britain will warm above the snow/rain line which means there will be less snow. Its a quite simple concept.
That’s what Dr. Viner was referring to.
It took me all of 4 minutes to find this link for you and Roy W Spencer. Learn something before adopting a stance you seem to know little about even though you claim to live there.
https://nerc.utri.org/research/partnerships/ride/lwec//report-cards/watersource11/
Lou Maytrees:
In The Independent (a UK newspaper) on Monday 20th March 2000 David Viner was quoted as saying that ‘Within a few years winter snowfall will become a very rare and exciting event.’
Moreover, he was also reported as stating that ‘Children just aren’t going to know what snow is.’
It’s now April 2019.
Obviously he was wrong.
In the same article he also said “Snow will probably cause chaos in 20 years time”.
I have no idea what kind of time frame Viner was imagining or how to reconcile his other quotes, but assuming it was before 2100 then his statement that children won’t know what snow is has little if any evidence backing it up. In fact, there are lines of evidence that suggest the United Kingdom could be positioned in one of few areas of Earth that could actually experience net cooling due to the slowing of Atlantic ocean currents which might lead to more snowy weather; not less.
JDHuff, Carbon550, bdgwx,
So why don’t you put context to the date of Dr. Viners comments also instead of taking ‘everything’ out of context?
You all mention the 2000 date of the comment, so some context.
!998-99 was an El Nino where the planets UAH Troposphere rolling temp jumped +.7*C over 1979 when UAH started. That’s in twenty years time. That is +.7*C rolling average, +1.1*C in real time. And that’s just 2 miles high in the troposphere.
No one expected that or knew where global temps were headed.
Dr. Viner’s comments were made during that time period.
By late 2000 temps had relaxed back to once again over the high 1990’s UAH rolling average except then they started rising immediately again and by 2002 the UAH Troposphere graph shows almost another +.3*C warming.
So a little context goes a long way. And your hindsight needs it obviously.
And you still have not challenged the fact that Roy W Spencer deliberately took all context out of that statement or to the fact that, as in the link supplied, since 1938 snowfall on the British Isle has decreased significantly in all areas and continues to do so as the planet warms.
The “context” of Viner’s quote is Viner’s quote!
It is well documented, from many different sources. So it is YOU that is somehow trying to change the context.
Viner has been wrong EVERY year, now approaching 20 years, and you are denying that reality.
JDHuffman,
YOU are still missing the point.
The context is Dr. Spencer’s US storm post, not Great Britain.
Dr. Spencer’s post was about a snowstorm in the US Upper Midwest ONLY.
Dr. Viner’s quote is about Merry Olde England ONLY, not the US.
Roy W Spencer took it out of context slyly indicating it had to do with the US.
Roy is still WRONG, morally and scientifically.
Wrong again, Lou.
The context was Dr. Spencer replying to Dave O.
http://www.drroyspencer.com/2019/04/mid-april-blizzard-to-clobber-the-upper-midwest/#comment-348427
Try to keep up.
How does all this moisture get into the atmosphere?
Evaporation!
Adam
and what causes evaporation
witches!
Wait, we’re not doing that scene in the Holy Grail?
Nothing new:
Mar 8-9, 1892, one of Duluth’s worst blizzards. 70 mph winds, blinding snow piled drifts over 20 ft high, blocking second story windows in some buildings.
Mar 14-15, 1941, terrible blizzard in western counties, 85 mph winds at Grand Forks, 75 mph winds at Duluth, 32 deaths
Mar 1-4, 1966, smaller scale blizzard with 37 inches of snow near International Falls.
John F. Hultquist
What you found is the same thing I find when doing research.
Local papers were claiming the flooding in Nebraska from the previous bomb cyclone were because of Climate Change/Global Warming.
I did some quick searches on the worst floods in Nebraska an the time frames were all over the map. I did searches on flooding for the Missouri and it has had frequent catastrophic flooding in the last 100 years.
Also from 1960 to 2019 the US has gained over 100 million new people with new homes and covering more area. Omaha Nebraska has increased in land area considerably since I have been alive. All these new homes and people greatly increase the odds a damaging weather event will cause some damage.
We have much more news coverage and many more people that you are bound to hear more about weather related damage than before so it makes it seem the weather is continuously getting worse. But if you look at past weather you see all types of extremes. I would need really solid evidence that weather is actually getting worse than previous.
The difference between the saturation vapor pressure of the water and the actual vapor pressure present in the air?
And why does all this moisture fall from the atmosphere ? Cooling !
More specifically cold air pushing into warm, moist air.
https://climatereanalyzer.org/wx/DailySummary/#t2anom
Dr. Roy Spencer
Question for the one with a PhD in meteorology.
The media will probably blame this and the previous “bomb cyclone” on global warming. From what I remember in my studies on the subject were that more severe weather was caused by a higher temperature gradient between the subtropics and the Canadian plains (for US weather).
This year Canada plains were very cold because of the Polar Vortex. You get a steeper gradient which produces more intense winds and storms. In Omaha, the forecast is for temperatures in the 80’s during the early part of this week dropping down to the 40’s on Friday. A 40 F temperature difference.
I would think these storms could be chalked up to just the fact that Canada plains were colder than normal and nothing more. I could be wrong.
It is possible that there is an element of WACCy (warm arctic cold continent) and/or QRA (quasi resonant amplification) phenomenon. As the Arctic warms at ~2x the rate of the global mean this may lead to more frequent displacements of the Arctic air mass. Afterall, on short chaotic time scales the NH mean temperature is still mostly a zero sum game; warm here, cold there kind of thing. And as the mean temperature homogenizes between low and high latitudes this will cause the jet stream to slow down a bit. To conserve angular momentum it will slide down the latitudes and spread out. Because there is more space in the mid latitudes for the Rossby waves to undulate in there could be higher recurrence rates of troughs and ridges which is often associated with stormy weather.
Of course as with any individual weather event it is difficult to quantify the impact that the various modes or manifestations of climate change had on it. At the end of the day chaos means that anomalous events will occur regardless.
And I agree. The media does seem way too eager to erroneously link individual weather events to global warming.
bdgwx
I have read on this idea. In the recent Scientific American issue Michael Mann talks about a wavier Jet Stream leading to more severe weather. The problem is I have not seen valid evidence to support this notion. I don’t consider it a scientific theory since the articles I have read on it have zero supporting evidence. The articles remind me of some skeptics on this blog. Declarations made with no support.
I would like to see trended studies of the actual measured waviness of the jet stream over an extended period of time.
I look at past weather events and there was always extremes. I have no evidence to support that any weather events are getting worse now because the Jet Stream is wavier based upon a tiny change in temperature.
I would like a lot more evidence to go with this idea before I would even start to consider it a scientific theory. At this time it is nothing more than a conjecture trying to link extreme weather events to climate change in order to generate fear in the general population to try to push left wing agendas.
The polar vortex is always present. Simon Clark explains it in better detail:
https://www.youtube.com/watch?v=6_VJXHfMevM
and maybe
https://www.youtube.com/watch?v=BkvJd_3thg4
Norman, are you still reading “Scientific American”?
Most people that respect science gave up on that rag about 20-25 years ago.
Oh….
We’ve never had a blizzard in April.
Stephen P. Anderson
What region do you live in? Are you in the US or Australia?
There have been heavy snow storms in April.
https://weather.com/storms/winter/news/march-april-snowiest-month
.
❶①❶①❶①❶①❶①❶①❶①❶①❶①❶①❶
❶①❶①
❶①❶① . . . What is the best kept secret in Climate Science? . . .
❶①❶①
❶①❶①❶①❶①❶①❶①❶①❶①❶①❶①❶
.
Climate scientists want people to know how much they have warmed by.
But they don’t want people to know what real absolute temperature they live at.
Why would that be?
Real absolute temperatures are more fundamental than temperature anomalies.
Climate scientists have to use real absolute temperatures, to calculate temperature anomalies.
But the real absolute temperatures are never shown to the public.
Why would that be?
Could it be, that real absolute temperatures make global warming look less catastrophic?
Will many people discover that they actually live in cold countries? And that global warming might make their country nicer?
That couldn’t possibly be true, could it?
There is only one way to find out. Read the following article:
https://agree-to-disagree.com/real-absolute-average-temperatures
“Could it be, that real absolute temperatures make global warming look less catastrophic?”
No, it’s because anomalies more clearly show the change. Without anomalies you would have to always give an average temperature to compare to. Talking about the anomaly in Alaska versus Alabama can be done with two values not four using anomalies.
“Will many people discover that they actually live in cold countries? And that global warming might make their country nicer?”
I think people know when they live in a cold country.
Craig T: Also with anomalies, for propaganda purposes you can stretch the vertical axis of a graph lots more to make a trivial and fractional claimed temperature change look much more impressive than it really is.
Would that not be equally possible if using absolute temperature?
When the average Jan temp rises from 267K to 269K in course of decades, you need some pretty creative streching to make that look bad, but yes, it is possible if less justified.
On the other hand anomaly makes it easy to trick. Or use color coding, red for disaster.
wert, how would a y-axis of 267K to 269K being materially different than one labeled 0K to 2K? And wouldn’t performing an unreasonable stretch of the y-axis make any trend appear less since the perceived slope is lower?
If the whole point was simple propaganda, why ever update the 30 year average? Changing from the 1971 – 2000 climate normal to the current 1981 – 2010 made the anomalies smaller.
America has an average temperature of about +12.1 degrees Celsius.
But the winter average temperature is about -5.4 degrees Celsius.
And the summer average temperature is about +30.5 degrees Celsius.
These are NOT the most extreme temperatures.
The winter temperature is the monthly average low temperature.
The summer temperature is the monthly average high temperature.
Because they are AVERAGES, there are temperatures higher and lower.
If you have a normal temperature range of -5.4 to + 30.5 (a range of 35.9 degrees Celsius), how important is a +1.5 or +2.0 degrees Celsius temperature anomaly?
Some of the datasets do include the absolute temperature. Berkeley Earth is one such dataset that does include it.
http://berkeleyearth.lbl.gov/auto/Global/Land_and_Ocean_complete.txt
b,
From your link –
“This file contains a detailed summary of the changes in Earth’s global average surface temperature estimated by combining the Berkeley Earth land-surface temperature field with a reinterpolated version of the HadSST ocean temperature field.”
I am particularly impressed with one of the BEST adjustments –
“Pairwise Homogenization Algorithm (PHA) Adjustments” – how sciencey is that?
Why accept rubbishy old actual temperature records, when you can get estimated temperatures, adjusted, reinterpreted, kriged, readjusted, reinterpolated, normalised, infilled, homogenised and all the rest?
Responsibility for the BEST effort seems to taken by a guy with a BA in English – Stephen Mosher.
Even less of a scientist than the undistinguished mathematician Gavin Schmidt.
Is that really the best data you can find?
Cheers.
“Why accept rubbishy old actual temperature records, when you can get estimated temperatures, adjusted, reinterpreted, kriged, readjusted, reinterpolated, normalised, infilled, homogenised and all the rest?”
Have you looked at the mathematical gymnastics that have to be done to turn raw satellite data into temperature values? In 1998 the UAH data was corrected to the point that a cooling trend became a warming trend. That didn’t mean that Dr. Spencer was in the pocket of the Warmists, it was fixing found errors in the data.
BEST is but one example. Most people are pretty open to it because of their history, openness, and skeptical stance on AGW.
Here is a paper on pairwise homogenization.
https://journals.ametsoc.org/doi/pdf/10.1175/2008JCLI2263.1
BEST is founded and lead by Richard Muller. Steven Mosher is critical of climate scientists in general so that might be a commonality you two have in common. I definitely agree that he is not a scientist.
If you have another dataset in mind that publishes a global mean temperature which you feel is acceptable for discussion then by all means present it to blog.
I get my real absolute temperature data from a commercial weather website.
Guaranteed to be untouched by climate scientists.
They sell weather and climate data to people. If they were wrong, then nobody would buy their data.
Capitalism works.
Climate scientists get paid, no matter how incorrect and alarmist their data is !!!
In fact, climate scientists are guaranteed more funding, if their data is alarmist. To pay for more investigation/research.
I wish that I had a job like that.
https://agree-to-disagree.com/real-absolute-average-temperatures
Is it possible that there is a wilder jetstream, due to weaker solar magnetic field during the solar minima, that is causing wilder weather?
https://earth.nullschool.net/
Set it for 250 hPa to get jet stream.
It’s possible. I have seen some studies that link solar minimum to a slower jet stream which like quasi resonant amplification tends make it wander slightly further south and undulate a bit more. Though the mechanism is related more to the change in TSI than with the magnetic field. As with things related to weather and climate there are a lot of factors involved and it’s rarely if ever one thing. Nevermind that individual weather events are chaotic so random chance is still a significant if not dominating factor.
I thought the average path of the NH polar front jet stream was moving northward as a result of global warming with Arctic amplification caused by regional positive feedback.
Then again, if manmade global warming is supposed to make that jet stream undulate more (from the Arctic warming more than the rest of the world), having more meridional flow path and less zonal flow, then why don’t I hear about this jet stream flowing in a way less zonal, more meridional in the summer than in winter and early spring?
You do.
https://advances.sciencemag.org/content/4/10/eaat3272
It is not at all clear that we are having wilder weather. You certainly cannot point to hurricanes or tornadoes to say that we have having wilder weather. Droughts and heat waves were definitely more of a problem eighty years ago. In my community, we reach 100 degrees less than half as often as we used to. The only meteorological phenomenon that may be getting wilder is blizzards and ice. Although April blizzards have happened before, we seem to be getting more of them in the last decade or so. And ice on the Great Lakes is measurably up. Yet in the overall view of things, I hesitate to say that the weather is wilder.
I guess I should be careful using subjective words such as ‘wilder’.
Certainly there is no evidence of more severe or more frequent extreme events … but more unusual events such as this blizzard … not in and of itself extreme … but capable of causing disruption.
Sometimes memory is faulty, and one should be careful in relying upon it, but I thought of something noteworthy about April blizzards. In the twelve years of hiding Easter eggs for my kids recently, I have hid them in snow three times. When I grew up, Easter eggs were never hid in the snow. In my twenties, there was one snowstorm on Palm Sunday. I do recall a couple of April blizzards over the subsequent decades, but the Easter Egg facts post 2005 is a fact that is not endangered by faulty memory.
Or you could buy a copy of the 2019 Old Farmers Almanac for $16 or so. It has been around since 1792, and sold lots of copies. It must be accurate if people are still buying it, wouldn’t you think?
Only joking. Any forecast is accurate – until it’s wrong. And you won’t know it’s wrong until it is too late. That’s the problem with predictions when the future is involved.
All part of the rich tapestry of life!
Cheers.
No, no, no MF this is all caused by AGW the Arctic is warming at a X2 rate as stated by bgdwx up thread causing warm artic air to mix with cold air (cooled by AGW) to cause floods and other stuff mentioned in the bible.
I remember being told once by a very important person from the IPCC long before most people here new what AGW was we would get droughts.
The reason why would be all the surface moisture would be evaporated up into the sky and would not fall back down as rain and logically the extra WV would cause the planet to warm.
Some very important man whos name now escapes me said “even the rain that falls will not be enough to fill our rivers and dams”.
But yet here we are two decades later i am being told by the resident experts here that hot artic air is mixing with cold air to cause severe storms, ergo if all the WV is now falling out of the skies on our heads and not being suspended above means the planet cannot….could not get any hotter but yet apparently it is.
The explanation of how CO2 placed between the sun and a thermometer is obviously so complex no one can explain it however the effects of this complex theory are so simplistic and obvious for all to see. I find that extremely hard to accept and call BS on the usual suspects.
Low it will follow the stratospheric intrusion.
https://www.cpc.ncep.noaa.gov/products/stratosphere/strat_int/gif_files/gfs_toz_NA_f72.png
https://www.cpc.ncep.noaa.gov/products/stratosphere/strat_int/gif_files/gfs_hgt_trop_NA_f72.png
The current pattern of stratospheric polar vortex.
https://earth.nullschool.net/#2019/04/09/1500Z/wind/isobaric/10hPa/orthographic=-50.71,60.33,340
Dangerous weather.
http://oi68.tinypic.com/ka2r9g.jpg
South of this cyclone, extreme fire weather conditions will be present. Not atypical this time of year for Oklahoma, West North Texas, and New Mexico!
I noticed the SPC has issued an Extreme Fire Risk outlook for Wednesday. It’s the first one for 2019.
Anyone know is there a scenario that snow this late in the year at this low an elevation impacts solar insolation significantly enough from albedo to be a negative feedback? My guess is that only permanent glaciers at mid latitude can significantly impact global insolation but by April Earth is certainly in the sunny half of the year for Northern mid latitude regions. If I take 2 million km2 area covered by snow, for 5 april days, and 10 hours each day with an average of 100 kw hr/ m2 (from a solar calculator in Minnesota for april) x .9 for albedo of snow. I get about 9 x10^12 mW of lost energy in a very quick high case assesment. What I dont know is does this amount of heat come close to impacting global climate?
To me it sounds extremely unlikely, and we would likely see it in monthly satellite data and we dont as far as I know. However our model friends indicate vanishing sea ice at much higher latitudes in arctic cause about 25% of global warming from 1979 to 2011 so about 30 yrs time .13 C/ decade or about 0.1 deg Celcius warming. So maybe through the magic of climate models this could be a negative feedback if it kept increasing frequency and creeping later in the year?
https://www.pnas.org/content/111/9/3322
Look at the subsurface temperature at the Equatorial Pacific.
http://www.bom.gov.au/archive/oceanography/ocean_anals/IDYOC007/IDYOC007.201904.gif
The map, animation and graph illustrate the sea ice thickness in the Northern Hemisphere, excluding the Baltic Sea and the Pacific.
http://polarportal.dk/fileadmin/polarportal/sea/CICE_map_thick_LA_EN_20190409.png
What happened to the bomb cyclone?
The pressure over southern Colorado fell to 987 hPa.
A “bomb cyclone” is generally one that deepens 24mb in a 24 hour period. However, this is generally in reference to cyclones around 60 degrees latitude. Sanders and Gyakum (1980) introduce a normalization formula sin(L)/sin(60) * 24 where L is the latitude of the cyclone to define a bergeron unit. At 45N this would yield 19mb. If a cyclone deepens at a rate of >= 1 bergeron units then it is a “bomb cyclone”.
A warm front from the south will meet the Arctic air in Nebraska.
http://oi65.tinypic.com/ekgaic.jpg
The wind speed increases in the northern blizzards.
The pressure in the center of the low is now going to fall quickly.
The IPCC must have been involved in the prediction.
Started snowing HEAVY WET SNOW here on Milwaukee’s north side about 4:00 PM CDT and maybe 1/4 mile or less visibility. The local airport KMWC
http://www.usairnet.com/cgi-bin/launch/code.cgi?Submit=Go&sta=Kmwc&state=WI
says snow right through to 1:00 AM Friday.
And local overnight weather means what exactly?
Oh right! It’s local weather.
It is +7*F over norm where I live. What does that mean? That you simply picked a dumbass place to reside lol?
Network for Lightning and Thunderstorms in Real Time
http://en.blitzortung.org/live_lightning_maps.php?map=34
Wundermap.
http://oi65.tinypic.com/vd349x.jpg
ren, you are a true Wunder with your meaningless local overnight weather forecasts.
Begone troll!
The upper low moves very slowly.
https://earth.nullschool.net/#current/wind/isobaric/700hPa/orthographic=-112.83,39.78,591
Low from Texas, it will cause heavy rains in the south of the US.
https://earth.nullschool.net/#2019/04/13/1500Z/wind/isobaric/850hPa/overlay=precip_3hr/orthographic=-97.33,30.90,2365/loc=-97.358,33.290
Heavy thunderstorms in the south of the US are a harbinger of great floods. The rivers have already reached a high level as a result of melting snow.
The circulation of the tropical Atlantic is consistent with the conditions of La Nia.
http://tropic.ssec.wisc.edu/real-time/mtpw2/product.php?color_type=tpw_nrl_colors&prod=natl×pan=24hrs&anim=html5
https://www.tropicaltidbits.com/analysis/ocean/nino12.png
Another dangerous low will attack in Texas on April 17.
http://www.lightningwizard.com/maps/North_America/gfs_cape_usa54.png