
 Home/Blog
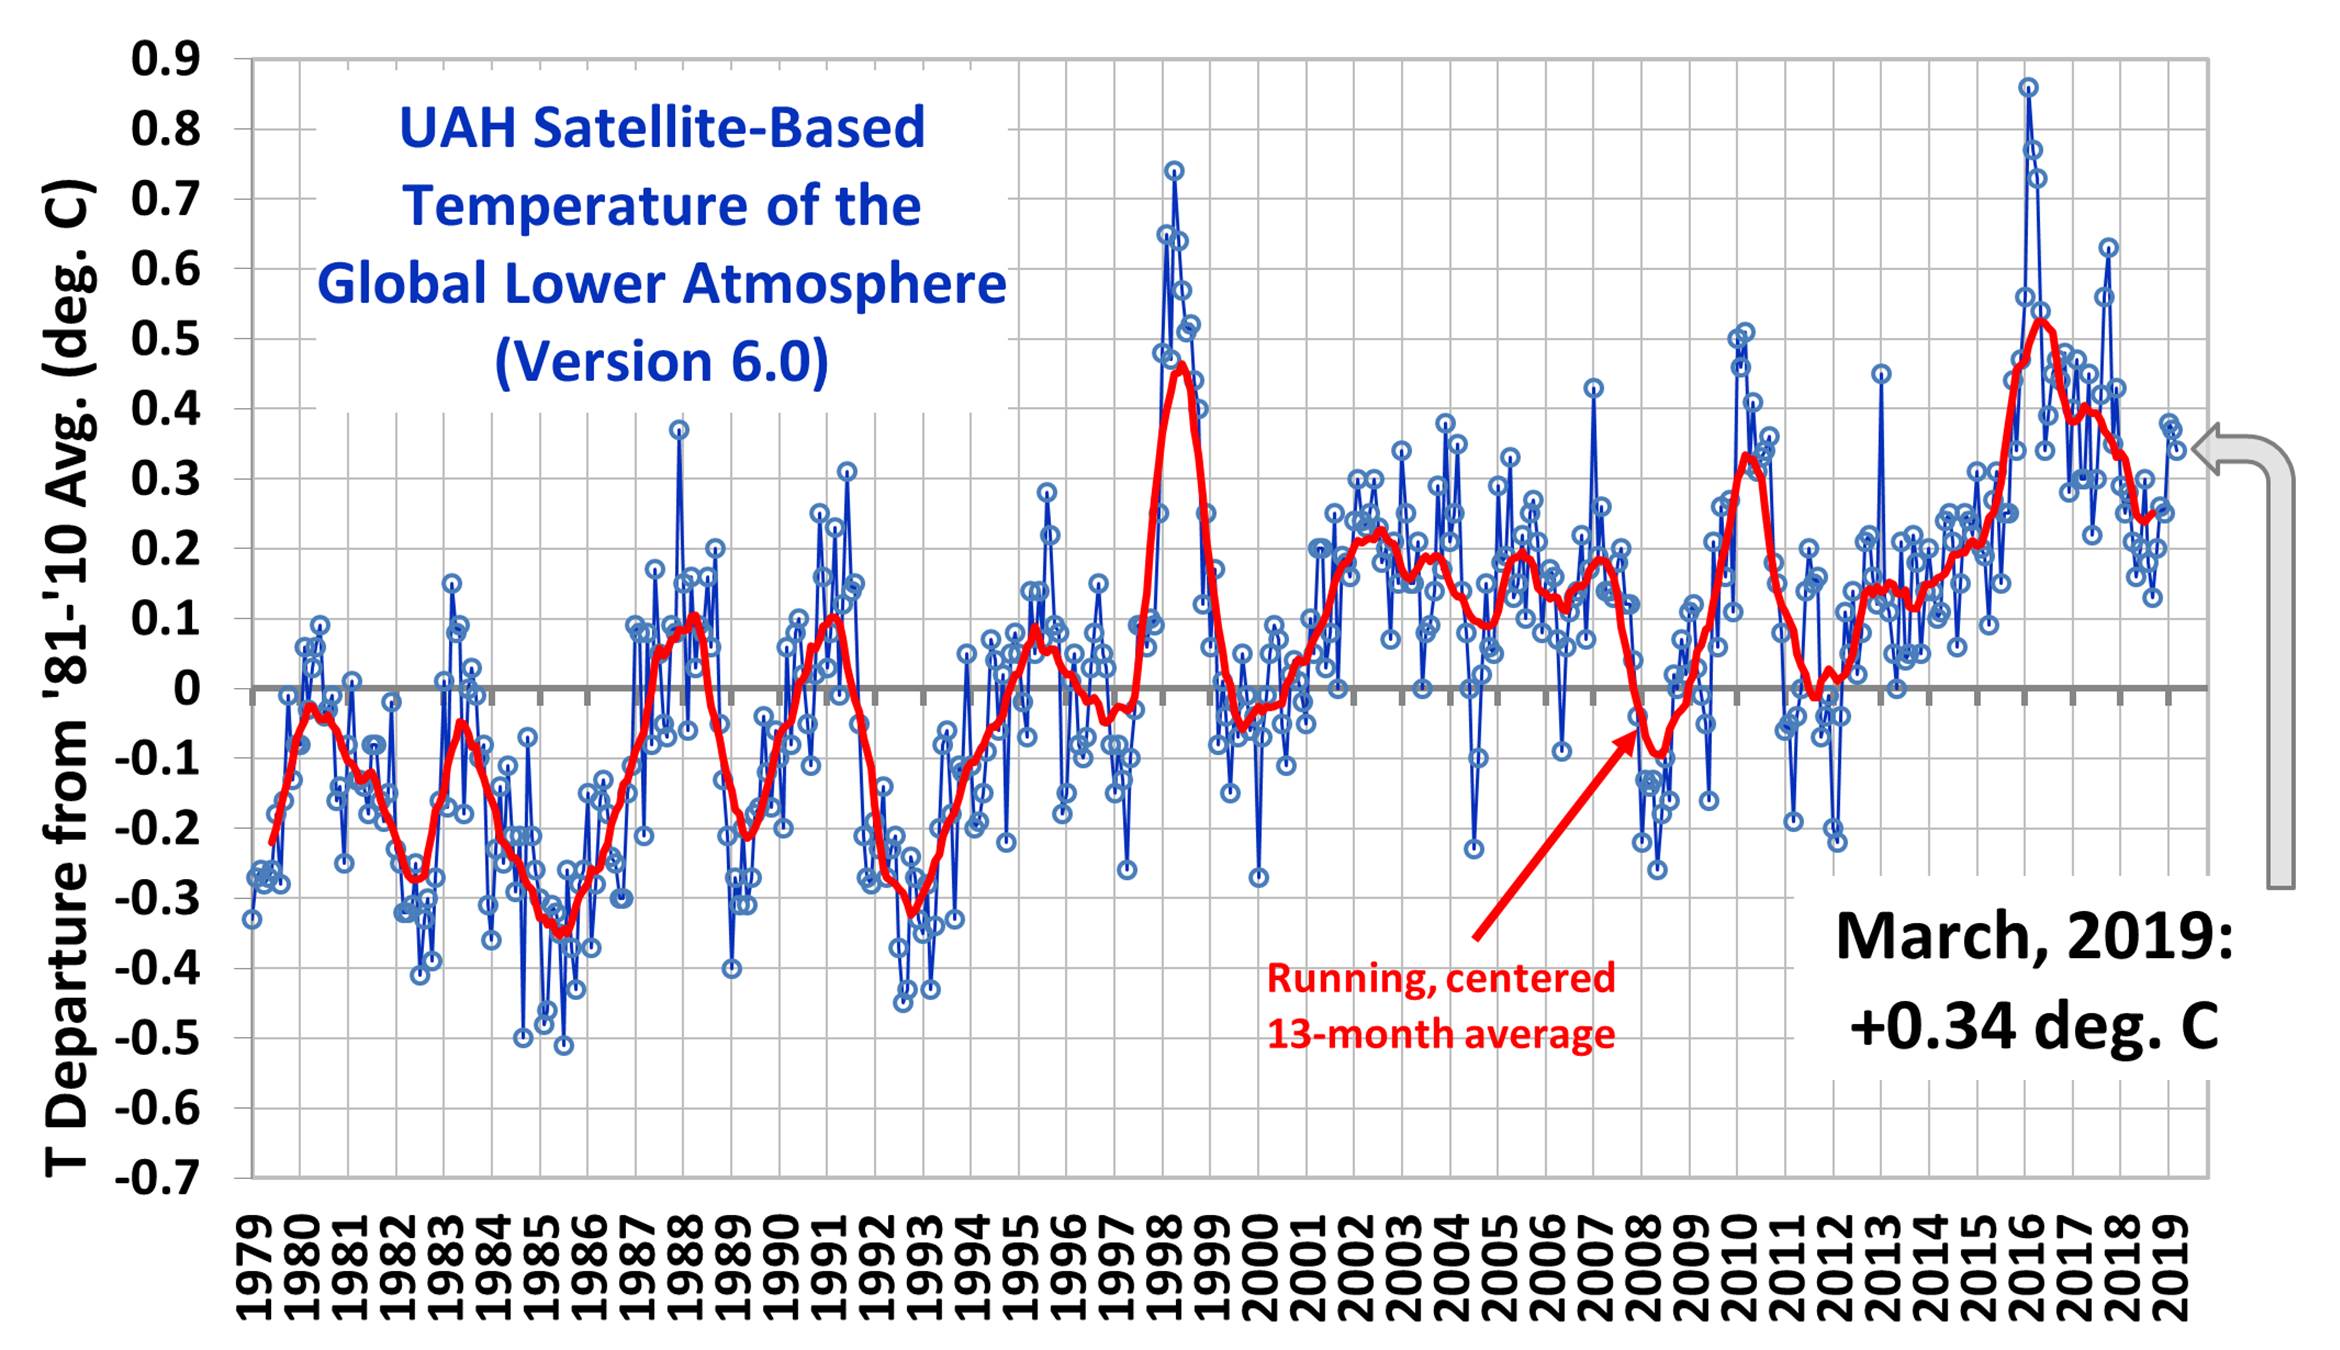
The Version 6.0 global average lower tropospheric temperature (LT) anomaly for March, 2019 was +0.34 deg. C, down slightly from the February, 2019 value of +0.37 deg. C:
We have made two changes in satellite processing starting with the March 2019 update. First, we have decided to stop processing of NOAA-18 data starting in 2017 because that satellite has drifted in local observation time beyond the ability of our Version 6 diurnal drift correction routine to handle it acccurately, as evidenced by spurious warming (not shown) in that satellite relative to the Metop-B satellite (which does not drift). By itself, this change reduces the trends very slightly. Secondly, we have applied a diurnal drift correction to NOAA-19, which previously did not need one because it had not drifted very far in local observation time. By itself, this increases the trends slightly.
The net effect of these two changes is virtually no change in trends (the global trend for 1979-2019 remains at +0.13 C/decade). However, individual monthly anomalies since January 2017 have changed somewhat, by amounts that are regionally dependent. For example, the standard deviation of the difference between the old and new monthly anomalies since January 2017 is 0.03 deg. C for the global averages, and 0.07 deg. C for the USA48 averages.
Various regional LT departures from the 30-year (1981-2010) average for the last 15 months are:
YEAR MO GLOBE NHEM. SHEM. TROPIC USA48 ARCTIC AUST
 2018 01 +0.29 +0.51 +0.06 -0.10 +0.70 +1.39 +0.52
 2018 02 +0.25 +0.28 +0.21 +0.05 +0.99 +1.21 +0.35
 2018 03 +0.28 +0.43 +0.12 +0.08 -0.19 -0.32 +0.76
 2018 04 +0.21 +0.32 +0.10 -0.14 +0.06 +1.01 +0.84
 2018 05 +0.16 +0.38 -0.05 +0.02 +1.90 +0.13 -0.24
 2018 06 +0.20 +0.33 +0.06 +0.12 +1.11 +0.76 -0.41
 2018 07 +0.30 +0.38 +0.22 +0.28 +0.41 +0.24 +1.49
 2018 08 +0.18 +0.21 +0.16 +0.11 +0.02 +0.10 +0.37
 2018 09 +0.13 +0.14 +0.13 +0.22 +0.89 +0.22 +0.28
 2018 10 +0.20 +0.27 +0.12 +0.30 +0.20 +1.08 +0.43
 2018 11 +0.26 +0.24 +0.28 +0.45 -1.16 +0.67 +0.55
 2018 12 +0.25 +0.35 +0.15 +0.30 +0.25 +0.69 +1.21
 2019 01 +0.38 +0.35 +0.41 +0.36 +0.53 -0.15 +1.15
 2019 02 +0.37 +0.47 +0.28 +0.43 -0.02 +1.04 +0.06
 2019 03 +0.34 +0.44 +0.25 +0.41 -0.55 +0.96 +0.59
The UAH LT global anomaly image for March, 2019 should be available in the next few days here.
The new Version 6 files should also be updated at that time, and are located here:
Lower Troposphere: http://vortex.nsstc.uah.edu/data/msu/v6.0/tlt/uahncdc_lt_6.0.txt
Mid-Troposphere: http://vortex.nsstc.uah.edu/data/msu/v6.0/tmt/uahncdc_mt_6.0.txt
Tropopause: http://vortex.nsstc.uah.edu/data/msu/v6.0/ttp/uahncdc_tp_6.0.txt
Lower Stratosphere: http://vortex.nsstc.uah.edu/data/msu/v6.0/tls/uahncdc_ls_6.0.txt


