
 Home/Blog
I present comparisons between both the UAH and RSS global lower troposphere (LT) temperature variations and LT computed from the vertical temperature profiles retrieved from the NASA AIRS instrument flying on the Aqua satellite. This follows up on the recent newsworthy announcement by NASA researchers, Recent Global Warming as Confirmed by AIRS published in Environmental Research Letters in which it was claimed the AIRS surface skin temperature retrievals validated the GISTEMP record of surface air temperatures during 2003-2017.
The data I use are the AIRS Version 6 monthly average gridpoint retrievals covering September 2002 through March 2019 (16.6 years, NASA registration required). To compute LT from the AIRS profiles I have taken into account the somewhat different vertical profiles of sensitivity in the UAH and RSS LT weighting functions, as well as the different southern extent of the “global” domains (UAH extends to 82.5 deg. S, while RSS is to 70 deg. S) in the global averages.
First up is the comparison of UAH LT versus LT computed from the AIRS profiles:
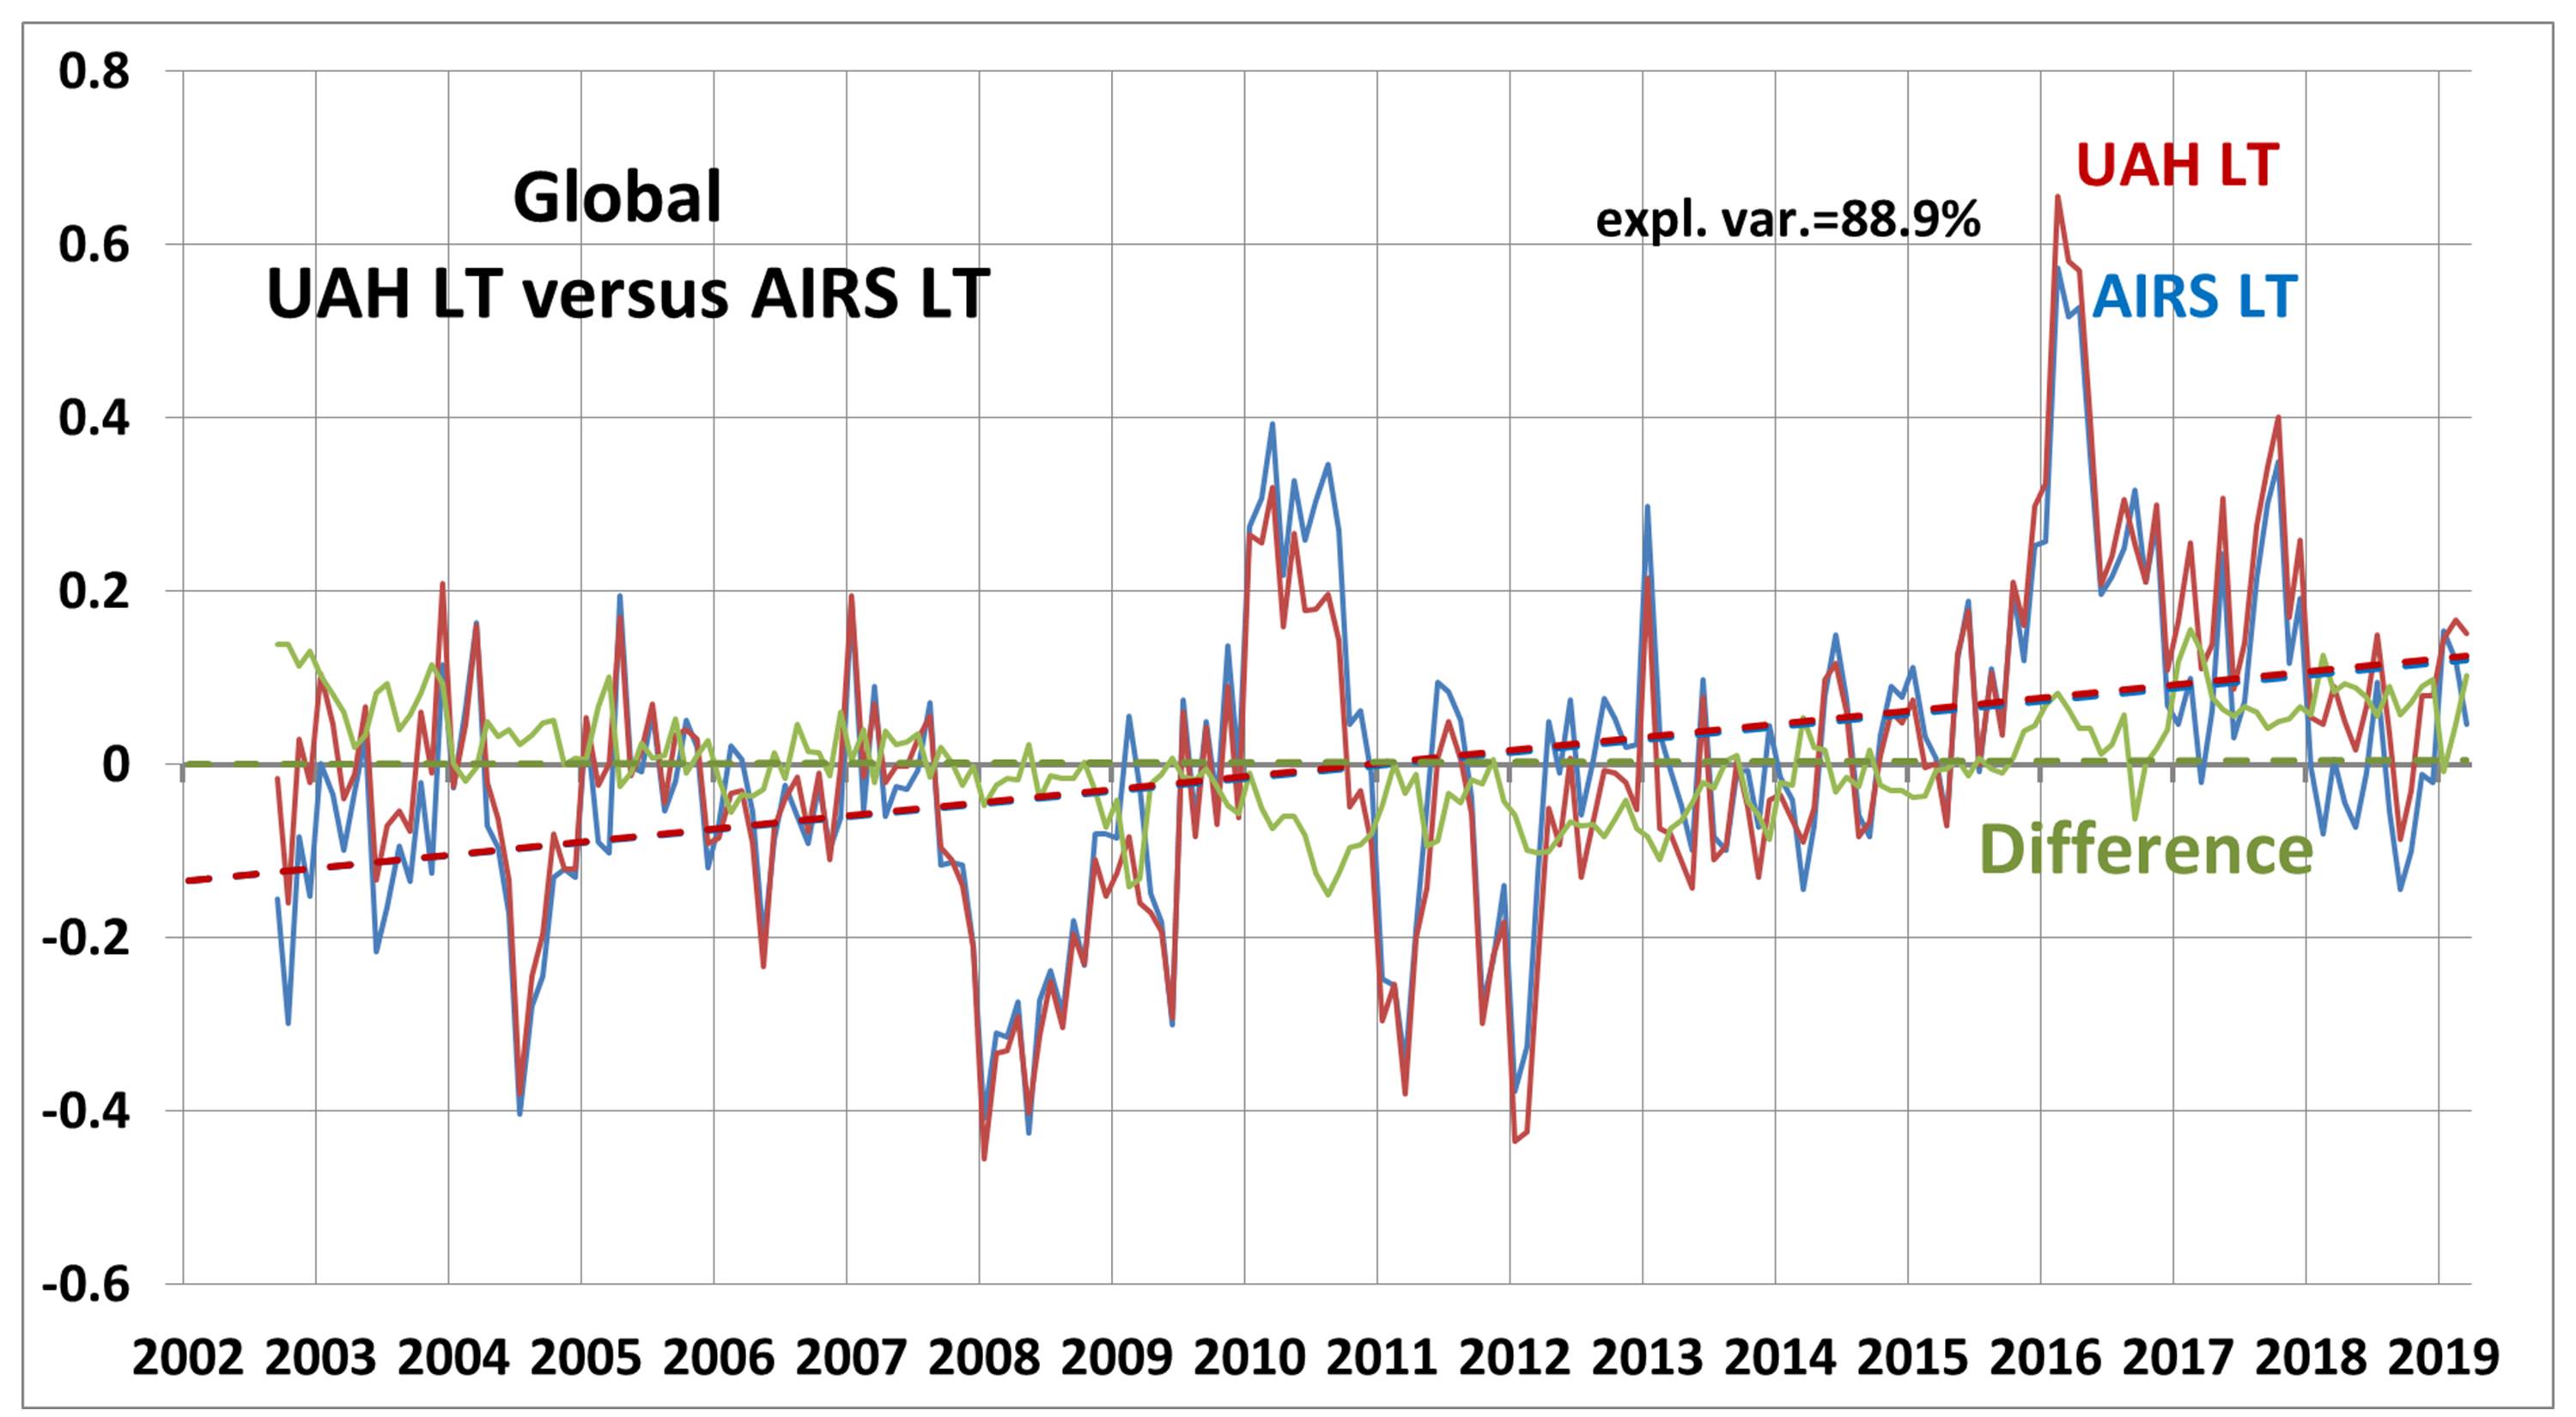
Note that El Nino and La Nina variations dominate this short period of record, and much of the warming trend (+0.15 C/decade) is due to this activity. The agreement is very good, with nearly identical trends in UAH and AIRS and an explained variance of 88.9%.
The agreement is rather remarkable given that the AIRS is an infrared instrument with much more serious cloud contamination effects than the UAH LT which is totally microwave-based from the Advanced Microwave Sounding Units (AMSUs) flying on 5 different satellites during this period. The AIRS cloud effects are removed in processing through a “cloud clearing” algorithm when scattered clouds are present, but temperatures in the lower troposphere cannot be measured in extensive cloud regions.
Next let’s look at a similar comparison for the RSS LT product. It also shows very good agreement with AIRS (87.3% explained variance), but with a somewhat greater trend compared to AIRS (by 0.07 C/decade). Again, the record is rather short (16.6 years) and so this trend difference should not be assumed to apply to the whole 40-year satellite record of RSS LT:
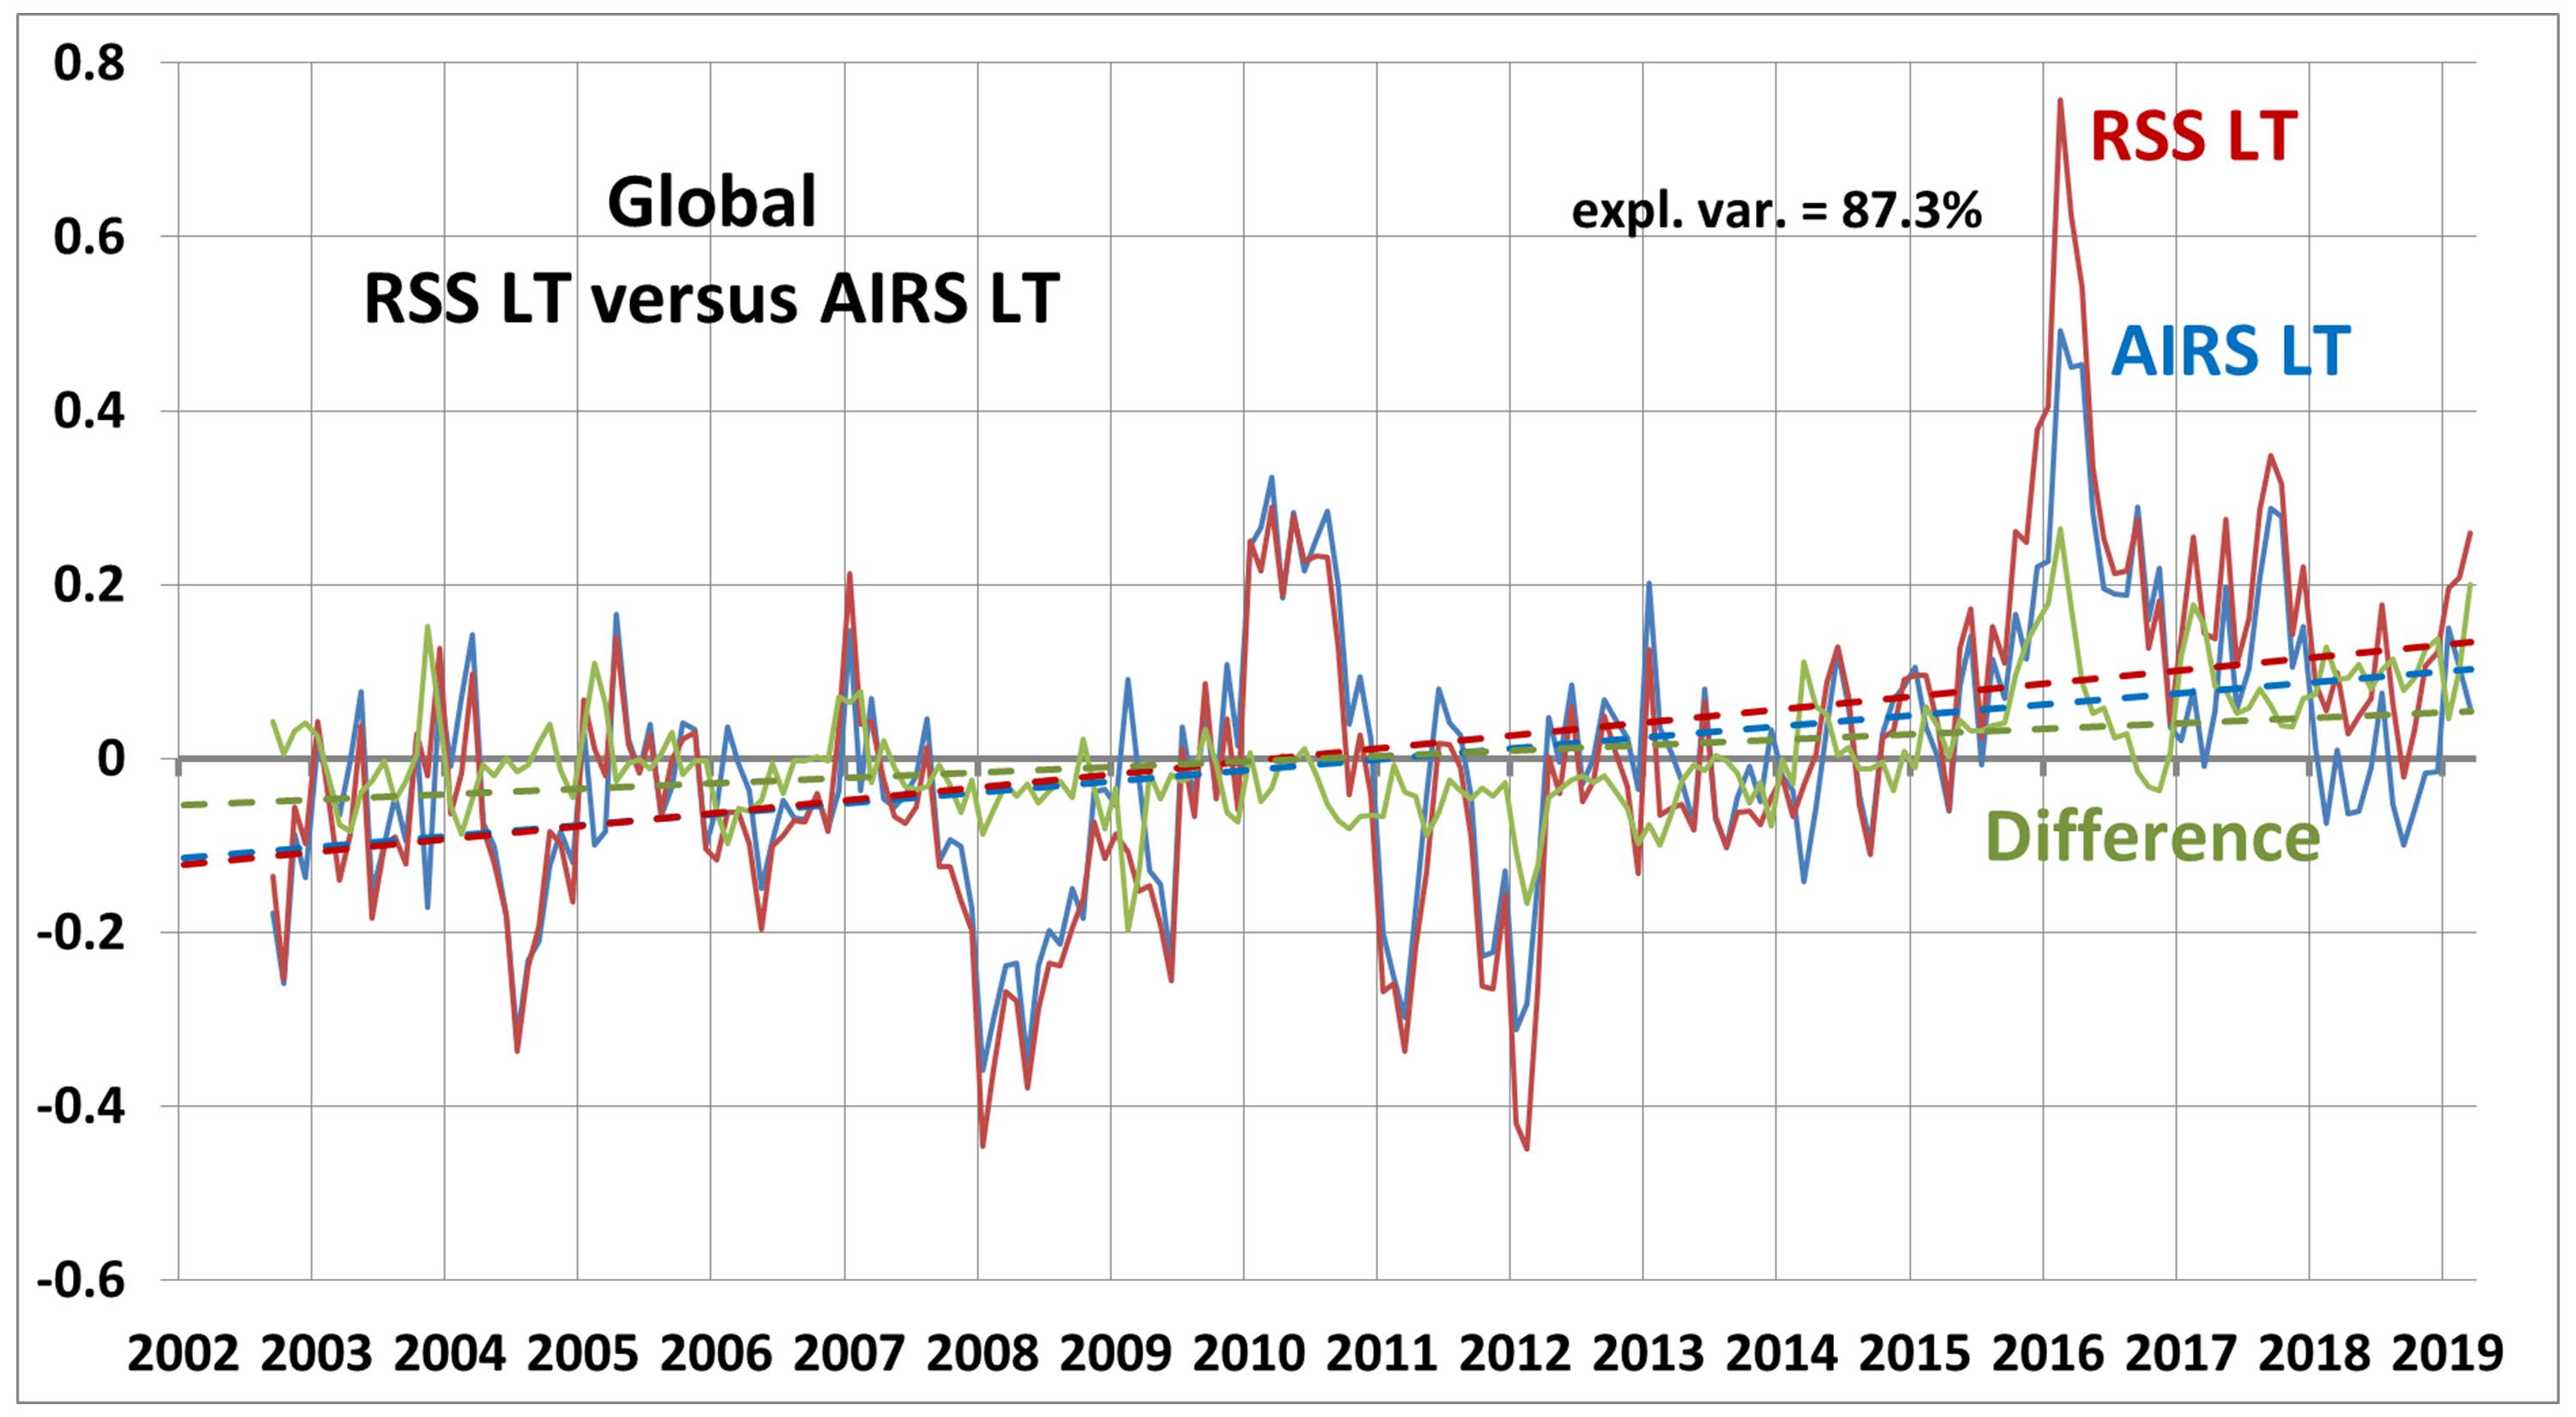
Fig. 2. Global (82.5N-70.0S) lower tropospheric temperature variations (deg. C) about the 2003-2018 mean annual cycle for RSS Version 4 LT and Version 4 LT computed from the NASA AIRS temperature profiles over the same region.
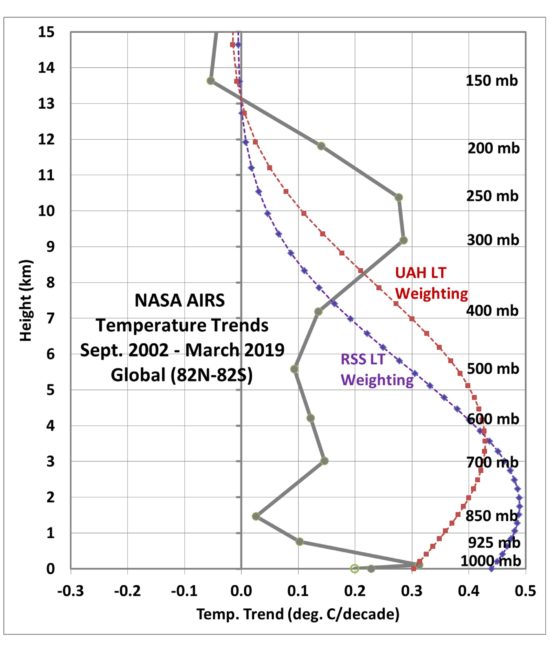
Again, the LT layers measured by UAH and RSS are somewhat different. The UAH LT layer is deeper, and so it picks up more of the enhanced warming in the 250-300 mb layer, as seen in the vertical profile of AIRS global temperature trends:
Given the rather high level of agreement between the microwave and infrared measures of global-average tropospheric temperatures, I see no reason why the AIRS data should not be used as a way to do periodic checks on the UAH and RSS LT global temperature variations.
Finally, since J. Susskind and Gavin Schmidt have proclaimed AIRS as confirming the GISTEMP record of substantial surface warming (“Recent Global Warming as Confirmed by AIRS”), I am similarly going to proclaim Fig. 1 as evidence that AIRS also validates the UAH LT record of only modest tropospheric warming.
So there.


