The Version 6.0 global average lower tropospheric temperature (LT) anomaly for June, 2019 was +0.47 deg. C, up from the May, 2019 value of +0.32 deg. C:
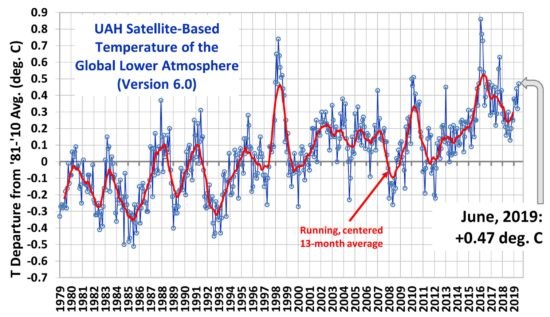
The linear warming trend since January, 1979 remains at +0.13 C/decade.
Various regional LT departures from the 30-year (1981-2010) average for the last 18 months are:
YEAR MO GLOBE NHEM. SHEM. TROPIC USA48 ARCTIC AUST
2018 01 +0.29 +0.51 +0.06 -0.10 +0.70 +1.39 +0.52
2018 02 +0.24 +0.28 +0.21 +0.05 +0.99 +1.21 +0.35
2018 03 +0.28 +0.43 +0.12 +0.08 -0.19 -0.32 +0.76
2018 04 +0.21 +0.32 +0.09 -0.14 +0.06 +1.01 +0.84
2018 05 +0.16 +0.38 -0.05 +0.01 +1.90 +0.14 -0.24
2018 06 +0.20 +0.33 +0.06 +0.12 +1.11 +0.76 -0.41
2018 07 +0.30 +0.38 +0.22 +0.28 +0.41 +0.24 +1.49
2018 08 +0.18 +0.21 +0.16 +0.11 +0.02 +0.11 +0.37
2018 09 +0.13 +0.14 +0.13 +0.22 +0.89 +0.23 +0.27
2018 10 +0.20 +0.27 +0.12 +0.30 +0.20 +1.08 +0.43
2018 11 +0.26 +0.24 +0.27 +0.45 -1.16 +0.67 +0.55
2018 12 +0.25 +0.35 +0.15 +0.30 +0.25 +0.69 +1.20
2019 01 +0.38 +0.35 +0.41 +0.36 +0.53 -0.15 +1.15
2019 02 +0.37 +0.47 +0.28 +0.43 -0.02 +1.04 +0.05
2019 03 +0.34 +0.44 +0.25 +0.41 -0.55 +0.96 +0.59
2019 04 +0.44 +0.38 +0.51 +0.54 +0.50 +0.92 +0.91
2019 05 +0.32 +0.29 +0.35 +0.39 -0.61 +0.98 +0.38
2019 06 +0.47 +0.42 +0.52 +0.64 -0.64 +0.90 +0.35
The UAH LT global anomaly image for June, 2019 should be available in the next few days here.
Lower Troposphere: http://vortex.nsstc.uah.edu/data/msu/v6.0/tlt/uahncdc_lt_6.0.txt
Mid-Troposphere: http://vortex.nsstc.uah.edu/data/msu/v6.0/tmt/uahncdc_mt_6.0.txt
Tropopause: http://vortex.nsstc.uah.edu/data/msu/v6.0/ttp/uahncdc_tp_6.0.txt
Lower Stratosphere: http://vortex.nsstc.uah.edu/data/msu/v6.0/tls/uahncdc_ls_6.0.txt
Thanks Dr Spencer. Second warmest June in the UAH global record. Where’d that come from?!
Almost a year with weak El Niño.
But unfortunately it’s fading fast:
http://www.bom.gov.au/climate/enso/monitoring/nino3_4.png
JDHuffman
“Almost a year with weak El Niño.”
Sure, but we recently had a June (2016) preceded by a very strong El Niño, yet temperatures in June 2016 were just +0.34 above the norm.
How then can we say that a relatively weak El Niño accounts for +0.47C above the average for June; the second warmest June on the UAH record?
What we’re seeing is the weak El Niño, on top of the natural warming trend from the 1970s.
We do NOT want to see a cooling trend coupled with a La Niño.
“La Niña”, of course.
(Proofread BEFORE, not after, JD!)
A “natural” warming trend, huh? I wonder what natural mechanism could be causing it.
barry, do you really wonder about understanding Earth’s oscillations, or do you just wonder about how you can pervert reality?
JDH so what drives the “Earth’s oscillations”? And when does this oscillation turn downward again after the last century of extreme warming?
“Extreme” warming, for 300+ years you mean… LOL.
TheFinalNail, how do you account for May anomaly at .32 compared to 2016 when it was .54? According to your logic this means the planet must be cooling.
Or, maybe it is because there are other factors involved. These work there way out over a few months. Let’s see where we end up when the effects of the El Nino are gone in about 3 months.
“According to your logic this means the planet must be cooling.”
What “train of logic” are you talking about? I don’t see any comment from TFN that resembles your remark.
barry, TFN was attempting to imply June meant something. Richard just pointed out a problem with such thinking.
You just got ran over by the train….
This corresponds well to a delay of 3-4 months for the troposphere tempearure maximimum, after the peak surface temperature in March/April during the present Nino.
Exactly, based on the surface data we should now see drops for the next 3-4 months.
Lovely. My feet are freezing in below 70F temps. So could you send some tropospheric warming to us instead of the Mediterranean. In the mean time, I’m gonna cling on some old good traditional grid power. You may wish for colder. Well I don’t. I could certainly take 1.5K more, at the moment +10K would not make things worse.
In case you feel bad in warmth, there’s still room in Alberta, Fairbanks, and even Trondheim. I’d choose Canary Islands. Bon voyage.
I’ll tell those Syrian refugees.
Svante, please stop trolling.
According to some here we are well on our way to a new ice age.
I suppose this could just be a high glitch on a negative slope!!!!
There would have been an ice age already were it not for ACW.
Hi Dr Spencer. This may have been discussed several times before but what does UAH +0.47 deg. C mean in relation to 0 deg. C. ? What is the temperature “The Version 6.0 global average lower tropospheric temperature (LT) anomaly” shows?
‘Zero’ deg. C here means the global average June temperature in the UAH data set between 1981 and 2010. June 2019 was +0.47C warmer than the 1981-2010 UAH global average temperature for June.
I understand that. Perhaps the question was tricky. What I mean is, if it is possible to answer, what is the measured temperature in C deg ??
Curious
“What I mean is, if it is possible to answer, what is the measured temperature in C deg ??”
Sure! No one measures anomalies, these are computed out of the departures of absolute data from a given mean, here a vector of montly means within 1981-2010.
The absolute mean temperature for that period is around 264 K, i.e. -9 C.
Here are the monthly averages in degrees Kelvin.
http://www.drroyspencer.com/2016/03/uah-v6-lt-global-temperatures-with-annual-cycle/
Subtract 273.15 to get the answer for each monthly average in Celsius.
Ah, Bindidon has already provided the link below.
barry, please stop trolling.
Curious, last I saw, global corresponded to about -9 °C.
Ok thanks. Are there any open sources for that information?
I think Dr. Spencer mentioned it in a discussion here, but I don’t remember where. I just remember the -9 C, which is about 264 K.
Maybe someone else knows the exact source.
Curious
“Are there any open sources for that information?”
Yes.
On the one hand, Roy Spencer published a head psot about that some years ago:
http://www.drroyspencer.com/2016/03/uah-v6-lt-global-temperatures-with-annual-cycle/
On the other hand, anybody interested can compute all that on the base of information present in
https://www.nsstc.uah.edu/data/msu/v6.0/tlt/tltmonacg_6.0
which contains UAH6.0 LT’s climatology.
It’s a somewhat tedious format, but easy to process.
Thanks! Thats the one!
It would be nice UAH put the baseline temperature in the text files like what other providers do.
If you’re curious about the absolute global mean at the surface then Berkeley Earth uses the average from 1951-1980 which is 14.184C +- 0.046. UAH does not measure surface temperature though. They measure pretty high up so their baseline will lower. Sorry I know that wasn’t exactly your question, but I can at least give you the answer for the surface temperature.
http://berkeleyearth.lbl.gov/auto/Global/Land_and_Ocean_summary.txt
See answer to Curious above…
Summer hasnt started in the Uk June was a washout
But Europe is scorching hot. This must be because you’re rowing away from the EU. /s
No seriously it is not only the UKthat’s justcolder than the mean. Nor is Paris hot any more.
The current El Nino was one of the weakest since 1950, its NINO 3.4 SST will fall below 0.5C next week and will officially end by September 2019.
UAH 6.0 will fall relatively quickly from next month. and then remain stable during ENSO neutral conditions (0.1~0.3C) until a strong La Nina starts from the fall of 2020, where it could fall to as low as -0.2C following the peak low of the strong La Nia cycle.
The next strong La Nina cycle will negate most of the warming spike from the 2015/16 Super El Nino, and a flat/falling 30-year Hiatus trend could reappear between mid-1996 to 2026.
CMIP5 average model global temp projections are 1.2C by 2025, but when observed global temps are stuck at around 0.2C, CAGW advocates will have an impossible time trying to explain the huge disparity..
When the Pacific, Atlantic and Arctic oceans are all soon in their respective 30-year cool cycles, and when additional cooling is observed from a 50-year Grand Solar Minimum event, CAGW will become a laughingstock.
Do you have a source? I would like to read about it.
Ken-san:
There are many peered-reviewed papers on the global cooling effects of 30-year PDO, AMO, and NAO ocean cycles.
Regarding low sunspot activity (Grand Solar Minima) and global cooling, Dr. Svensmark has written many peer-reviewed papers on the subject.
There is also the CERN CLOUD Experiment which hypothetically showed galactic cosmic rays can nucleate inorganic compounds in the lower troposphere, which can lead to increased cloud cover, increased albedo, and global cooling.
Cheers!
Ken, Samurai’s main source is wishful thinking, at least as far as his confidence in significant future cooling goes.
On the other hand, the belief in a continued and gradually increasing divergence between the modest warming of the actual climate vs. the much greater warming projected by the models (CMIP5) is a good bet. Even without cooling, this will have to eventually reduce the estimates of climate sensitivity to CO2 and therefore the projections of future warming.
For the time being, it seems that some of the heat of the large El Nino of 2015-16 has stayed around, just as some of heat of the 1997-98 El Nino has never left.
Eli Mi
“For the time being, it seems that some of the heat of the large El Nino of 2015-16 has stayed around, just as some of heat of the 1997-98 El Nino has never left.”
Where was this missing heat hiding? Where was it stored without detection?
TFN:
“Where was this missing heat hiding? Where was it stored without detection?”
It isn’t missing and it wasn’t hiding. I’m not sure what in that sentence you quoted could have given you that implication. All I meant was that temperatures after those two big El Ninos were over continued to be higher than they had been before them.
The only implication was that perhaps this is how longer-term temperature increases sometimes appear to happen in our non-linear climate system: with a step-change associated with an El Nino, rather than a constant, gradual increase. That still shouldn’t obscure the fact of the divergence between the actual warming and the significantly greater warming of the models.
Eli,
“The only implication was that perhaps this is how longer-term temperature increases sometimes appear to happen in our non-linear climate system: with a step-change associated with an El Nino, rather than a constant, gradual increase.”
If you are proposing that el Ninos cause the system to warm in steps, then working backwards the Earth would have been 10C colder 1000 years ago.
Do you realize that if there was definitively a gradual increase, it would still look like step-changes just because there ARE el Ninos?
Here’s Roy Spencer with a good graphical demonstration of that.
http://www.drroyspencer.com/2013/11/the-magical-mystery-climate-index-luis-salas-nails-it/
barry,
I’m not proposing that El Ninos are the ultimate cause of any sustained warming. That wouldn’t be much of an explanation, anyway, since there would then need to be an explanation for the relative numbers or intensity of El Ninos. That is why I used the terms “sometimes appear to” and “associated with” in what you quoted, rather than just saying “caused by”.
So I’m basically on board with the implication of the rest of your comment, and of Dr. Spencer’s old post that you linked, that the fact that the warming might take place in what look like step-changes doesn’t necessarily tell us much. (It certainly doesn’t rule out that a more gradual and continuous increase in CO2 might be contributing to the warming.) What is important is: first, whether the warming is sustained, i.e. not reversed, and last but not least, what the rate of warming is.
The only caveat I would add to that post you linked, showing different harmonic and linear curves being added together, is that we should keep in mind that the only thing “real” is the plot of actual temperatures or other data. Any component curves we might try to separate the plot of actual data into are purely hypothetical, (except perhaps for the annual cycle assuming that it’s very well established for a very extended period of time).
I hope this response gets posted in the right place in the comments thread.
One thing to be wary of is discontinuities. Eg,
http://www.woodfortrees.org/plot/uah6/mean:12/plot/uah6/from:1979/to:1998/trend/plot/uah6/from:1998/to:2020/trend
That’s a plainly unphysical break. Temperature evolution is continuous.
Linear regressions only give you an estimate of how much change there has been throughout the period regressed. But there are methods to ascertain the best kind of fit to data – that is, to test whether a line, a curve or a sine wave best fits the data.
Eg, https://en.wikipedia.org/wiki/Akaike_information_criterion
barry,
I hear you regarding the limitations and difficulties of linear regression, and of separating a curve into components. Of course, part of the reason that there’s so much emotional heat in the discussion of climate change is that, of course, this is not just an academic exercise.
So the advocates of dramatic policy changes insist that, limitations and difficulties with the data and it’s analysis notwithstanding, we don’t have time to wait for the degree of certainty that we might ideally like to have, or assert that we already have it, or some combination thereof. The other side of the argument asserts that there isn’t sufficient evidence of the likelihood of a catastrophic degree of climate change to justify the interventions proposed or enacted. And that’s where things get heated.
Furthermore, the pro-dramatic-intervention side asserts that their opponents are intentionally refusing to accept the evidence, even as the peril increases, while the other side asserts that the interventionists are intentionally overhyping or even fudging the evidence. So the argument maintains a thoughtful and scientific tone, until it doesn’t. Which is pretty quickly.
I prefer to stick to obs, facts and inference, and dislike politics interfering in the discussion. I can get irritated by dishonesty. I thought we were doing well just here.
Five days late on a dead thread? Come on barry, please stop trolling.
There ain’t no law against that.
Svante, please stop trolling.
The global mean surface temperature relative to the standard 1951-1980 average was last below +0.2C in the 1980’s. It would likely take a VEI 7 or a bunch of VEI 6 eruptions to get the annual mean down to that level again.
People have been predicting cooling for decades and it keeps not happening. Why should we think this time will be any different?
Actually, according to UAH6.0 global temp data, the global temperature trend from June 1996 to June 2015 was 0.00C/decade, despite 30% of all manmade CO2 emissions since 1750 being made over those 19 years…
The 2015/16 Super El Nino event caused a one-off global temp spike anomaly , but it will soon be almost entirely negated from next years strong La Nina event.
Also, the 30-year PDO, AMO and NAO cool ocean cycles are only now just getting ready to start, and it looks like the NAO 30-year cool cycle may have already started this year.
The trend from 2008 to the present is almost 0.4C/decade. We have almost 11 years now of the “super anti-pause” aka “sutaih” (hiatus backwards).
Do a google search on “no warming since 1998” and limit the time frame to 2008. Back then, 10 years of cherry picked data was enough to declare global warming dead. What about 11 years of “sutaih”!!
Since the end of the Little Ice Age (LIA) in 1850, weve enjoyed about 0.85C of beneficial global warming recovery (0.05C/decade) for which we should ecstatic.
Since 1979, (during PDO/AMO/NAO 30-year ocean warm cycles) weve enjoyed 0.13C/decade of beneficial global warming recovery. The last time this occurred was from 1913~1945 when temp trends were 0.14C/decade and CO2 emissions were insignificant, so there is absolutely nothing catastrophic about the warming Eecovery weve enjoyed from ocean warming cycles and LIA recovery.
Moreover, from 1933~1996, the strongest sunspot activity in 11,400 years occurred, which also contributed to LIA recovery and 30-year ocean warm cycles.
In a few years, all this changes when the 30-year ocean cool cycles start, and a 50-year Grand Solar Minimum that already started this year.
CAGW is the biggest and most expensive Hoax in human history.
CO2 perhaps has an ECS of around 0.6~0.8C logarithmic warming per doubling, which is a joke.
In about 5 years or so CAGW will be laughed at.
I don’t see much 0.02/year, let alone 0.04. But you seem to enjoy it. Just please send more warming here. I’m still using coal to keep warm.
“The next strong La Nina cycle will negate most of the warming spike from the 2015/16 Super El Nino, and a flat/falling 30-year Hiatus trend could reappear between mid-1996 to 2026.”
I will bet anyone here, based on looking at the data quite a bit since 2016, that this will not happen. I’ll be a large sum of money, and will honour the bet, too.
But no one will take up the bet, sadly.
We’ve had this prediction ever since just before the el Nino spike of 2016. It keeps being repeated, and keeps being wrong. It is nothing more than wishful thinking.
No barry, sadly, you wouldn’t honor the bet. You would find some way to weasel out.
That’s what you do.
Your trolling is as ceaseless as your turgid insults multiply.
How do you manage to be so repugnant and continue to live? I would have thought you’d have choked on your own toxicity.
barry, please calm down and stop trolling.
Sorry, misread you.
The question was inexplicit. My bad.
Shouldn’t that be .013C/decade?
The linear regression is still 0.13C/decade. That’s what I get in Excel with the LINEST function as well.
Sorry! My bad! I read it as per year!!!!
#ClimateChange is real, and it’s here now. #GoreWasRight
Funny how it only shows up during El Nino.
Yes, and during La Nina.
https://tinyurl.com/y2sqa7mq
Svante, please stop trolling.
Funny how often El Nio say hello nowadays.
This is exactly what it looks like when the dead cat makes a salto on top of the dead cat bounce
Curious
The lower troposphere is the altitude band from sea level to 5km.
The atmosphere cools by 9C per kilometre as you gain altitude.
The surface datasets have baselines around 14C, so the equivalent for the middle of the lower troposphere at 2.5 km would be 14-(2.5*9) = -8.5C.
On that basis JDHuffman’s remembered baseline for UAH of -9C sounds about right.
Isn’t the average lapse rate about 6.5 C per km?
https://www.britannica.com/science/lapse-rate
Here’s the absolute UAH graph again:
https://tinyurl.com/y6ylbnn4
Dry adiabatic lapse rate is 9.8K/km, whick is what I remembered.
ICAO ISA lapse rate is 6.5K/km.
Using the ISA figure the expected baseline temperature at 25km becomes 14-(2.5*6.5) = -2.5C.
This is much warmer than JDHuffman remembered. Perhaps Dr Spencer can help.
Damn. That should be -2.5C at 2.5km.
Svante
The IAS lapse rate, surface temperature and UAH actual temperatures match if the UAH Lower Troposphere temperature is measured at 3.5km.
barry, please stop trolling.
Thanks!
UAH lower tropospheric temperatures are a wide swathe of the vertical atmosphere, from 0 to about 12km altitude, weighted most heavily at about 4km altitude. You’re not going to get an accurate result for UAH absolute temps by pinning the lapse rate to a particular altitude.
Here is the answer from Dr Spencer.
http://www.drroyspencer.com/2016/03/uah-v6-lt-global-temperatures-with-annual-cycle/
barry, see instructions above.
Curious
You might find this post by Clive Best useful.
http://clivebest.com/blog/?p=7960
Is there any seasonality in the global anomaly? I mean, does the fact that that June19 is the warmest June since June 1998 vs the 1981-2010 average mean anything, vs the fact that it is a relatively normal month when you look at all the months in the series? Many thanks
There is a seasonal cycle. You can see it in the GISS data here.
https://data.giss.nasa.gov/gistemp/graphs/
The significance of the similarity between June 2019 and June 1998 is that June 1998 was part of an extreme El Nino, while June 2019 was ENSO neutral.
Since the difference in global average between El Nino and neutral conditions is about 0.3C we can deduce that we have warmed by about 0.3C +/-0.2C in the thirty years since 1998.
Dr Spencer quotes an overall warming rate of 0.13C/decade. That would be 0.39C in 30 years.
Entropic man, the 98 El Nino had already ended by May 98. I have -0.41 for May 98 El Nino. (HADSTT3) It literally went from strong El Nino to La Nina over night. On the other hand, we just now got to neutral within the last week.
My point is, we arguably had more warming wind at our backs in this June’s reading than in 98, and we still couldn’t take it out. So no effect from Co2 since 98 still. Who knows… maybe the 98 highs will hold for the next 50-100 years until after the next grand min ends, and we resume the natural uptrend on the millennial timescale. It will most definitely hold for 35 more years.
“the 98 El Nino had already ended by May 98”
I think you mean it had already peaked.
But in June it was only slightly below its quite high peak, with still quite a way to fall over the rest of the year.
If my eyes haven’t failed me, Nino 3.4 was at -0.93 in June 1998.
https://www.cpc.ncep.noaa.gov/data/indices/sstoi.indices
Already peaked in the UAH record, I mean.
Pablo
You ask: “Is there any seasonality in the global anomaly?”
My answer is no, because anomalies, as understood by Roy Spencer and all other specialists busy in the field, are not simply a departure from the global mean of a given reference period, here for example 1981-2010.
Instead, for a monthly time series, a mean is built for every month in the reference period.
Then, for every month in the whole time series, the corresponding montly mean is subtracted from the month’s absolute value.
{ If it was a daily time series, a mean would be built for every day in that period, like e.g. in the Arctic sea ice extent data
ftp://sidads.colorado.edu/DATASETS/NOAA/G02135/north/daily/data/N_seaice_extent_climatology_1981-2010_v3.0.csv }
This number confirms that we are still feeling the effects of the 3.6 year El Nino harmonic off the late 2015 peak. The peak El Nino was basically October of 2015. If you add 3.6 years to that, you get May 2019. We have seen a large drop in El Nino over the last week, so basically this drop was right on schedule. Note in 2016, UAH temperature data recorded it’s peak in February 2016, 4 months after the El Nino peak. It has not been 4 months since El Nino has ended, it’s only been a week. We therefore may get a few more monthly readings like this one before the atmosphere cools off to reflect the cooling ocean conditions.
El Nino:
https://www.tropicaltidbits.com/analysis/ocean/nino34.png
Global:
https://www.tropicaltidbits.com/analysis/ocean/global.png
Global ocean temperatures have dropped from +.32 deg C to 0.15 deg c in 1 month.
I still think we will see -0.2 deg C for UAH on the next La Nina.
Bingo, a huge drop in global ocean temperatures in June and there’s only one place for that energy to go. The value was going to be relatively high anyway from the lagged effects of El Nino but this pushed it up even more.
I realize the true believers haven’t had much to support them since the super El Nino ended. It is humorous to watch them jump on this now.
What I’m more interested in is what caused the big loss of heat from the oceans?
Richard M,
What has caused the sudden drop in ocean temperature is massive upwelling near South America. (in the usual place) You can see this on the tropicaltidbits maps. Perhaps this was aided by a couple of especially cold weeks in Antarctica… perhaps it was aided by the Pacific hurricane. Perhaps solar cycle 24 has ended, and there is a connection to the El Nino cycle and the sun. One thing is for certain… we always get a strong la nina following the beginning of every solar cycle. We have a sun spot in the southern solar hemisphere indicative of SC 25 beginning. Not coincidentally, we also had an uptick in earthquake activity recently. When the trade winds pick up this winter (speaking from a NH point of view), we should see another leg down on global ocean temperatures, and global air temperatures.
“One thing is for certain we always get a strong la nina following the beginning of every solar cycle.”
Except in 1945, 1965, and 1977…
Regarding the absolute temperatures (not anomalies), I’ve addressed this before: http://www.drroyspencer.com/2016/03/uah-v6-lt-global-temperatures-with-annual-cycle/
Thats the one! Thanks!
You can’t simply look at tropicaltidbits for a few months and decrete El Nino being this or that.
El Nino is the Southern Oscillation, and is computed out of quite a bit more than a trivial SST averaging of the Nino3+4 region. You have to considder at least the pressure difference between Darwin and Tahiti as well.
The most valuable El Nino evaluation is that designed 30 years ago by Klaus Wolter at NOAA, called ‘Multivariate ENSO Index’. The V2 revision has been released this year.
When you look at the MEI graph
https://www.esrl.noaa.gov/psd/enso/mei/img/meiv2.timeseries.png
you see that in clear contradiction to claims at WUWT and here, the 2015/16 was – yes – a bigger El Nino than usual, but can by no means be depicted as a Super El Nino.
This title should be left to the 1982/83 and 1997/98 editions which were both by far stronger than 2015/16.
The best way to have a closer look at their differences in power is to download the data
https://www.esrl.noaa.gov/psd/enso/mei/data/meiv2.data
and to compute, for the respective El Nino periods, the departures from each start, thus letting each period start at zero:
https://drive.google.com/file/d/1F6xQbe_l5j6Ih_A-BrZQKcQ3qeVQtnRZ/view
You clearly see here who was ‘strong’. And the average anomaly for the three periods confirms the eye-balling of their main phase (usually accepted: Jan x – Aug x+1):
– 1982/83: 1.61
– 1997/98: 1.59
– 2015/16: 0.75
The reason for this misinterpretation of the El Ninos certainly is due to the fact that most people imagine or claim a one-to-one correspondence between El Nino and UAH’s lower troposphere temperature record.
Wener Brozek at WUWT for example needed years of patient teaching by several people to get rid of this blind-alley.
The best way to get out of it is
– to look at how UAH behaved during 1982/83 in comparison with the two other El Nino periods;
– to inspect the UAH record in the same way as done above for MEI, by letting all three UAH periods start at zero.
They adjusted the baseline SSTs upward in MEIV2. It is now worthless. I can see why you love it. Now all La Nina events look stronger and all El Nino events look weaker. It helps feed your delusions.
If you have a look at Roy Spencer’s anomaly data
http://www.drroyspencer.com/wp-content/uploads/UAH_LT_1979_thru_June_2019_v6-550×317.jpg
you immediately have the impression that
– (1) the El Nino influence during 2015/16 was stronger than during 1997/98;
– (2) we stay in front of a strong cooling phase.
While the latter point might be disputable, the former one isn’t at all.
(1) To get convinced of this, the best is to look at a graph showing for UAH 6.0 LT the two periods
– Jan 1997 – Jun 2001;
– Jan 2015 – Jun 2019.
But like for the El Nino comparison, we let start the anomalies at zero by subracting for both periods the first anomaly from all of them:
https://drive.google.com/file/d/1ZNxySq1EfCOl4t9-l4MIpoFdAQZEQ0OG/view
We see that like for the El Ninos in the MEI record, the 2015/16 UAH LT edition was less strong than the 1997/98 one.
*
(2) But what now concerns a supposed upcoming cooling, I invite everabody to show how similar 2015/16 and 1997/98 behaved after the corresponding El Nino peak.
Would not anybody who claims about some imminent cooling, have said the same in June 2001, and have been ‘plain wrong’ at that time?
binny…”Would not anybody who claims about some imminent cooling, have said the same in June 2001, and have been plain wrong at that time?”
The trend was flat from 1998 – 2015. A flat trend is close enough to cooling. An unusual EN in 2016 and a weak one in 2019 is keeping the average elevated. We are due a good La Nina as in 2008.
Bindidon,
You are correct in that 1 week, or 1 month of observing tropicaltidbits El Nino data is not going to be useful for data analysis going forward. My go to is the HADSTT3 data set. It does however offer some opportunity to forecast what is coming. I have noticed changes in US in the past week. The 98 El Nino was a very unique event. I actually agree with you that it was the strongest one in the last 40 years. I’m basing that on integrating the area under the 5 year moving average wave. The Mt. Pinatubo eruption in 1991 was right before what should have been the down beat for the El Nino cycle in early 92. Instead, it was suppressed. My theory is that this caused the energy from that down beat to be transferred to what should have been just a harmonic in 1998. It also explains the sharp drop right after the 98 El Nino. That is why the offset of the 11 year El Nino cycle is not consistently offset from the solar 11 year cycle. (if that makes any sense) Even the global temperature on a short term responds on an inconsistent delay to El Nino. It is far too complex a system for that with far to many forcers to use an exact mathematical relationship, sin curve, anything like that. I see it more like technical analysis of a stock to be honest.
Scott R
1. “My go to is the HADSTT3 data set. ”
You wrote something incredible about HadSST3 SH in Roy’s heat wave thread. Look at my reply, you won’t enjoy it, sorry: that’s your problem.
https://drive.google.com/file/d/1gNHlhA5S29xYd28dI__gIic55qTwk1T2/view
2. “The 98 El Nino was a very unique event. ”
No it wasn’t.
“I actually agree with you that it was the strongest one in the last 40 years. ”
Nowhere did I write that.
Is it so difficult to read a graph?
https://drive.google.com/file/d/1F6xQbe_l5j6Ih_A-BrZQKcQ3qeVQtnRZ/view
1982/83 was at least as strong as 1997/98.
3. Where is your 11 year El Nino cycle?
https://drive.google.com/file/d/1AWhf55plFrWHF9MjFeSRdorgS10GzJC9/view
Is that also an invention of your mind, like the inexistent 40 year decline in the southern ocean temperatures since 1979?
Bindidon you looked at and posted the SH HADSTT3 data. I was talking about the southern ocean portion of that. That is what has a 40 year down trend. Apply a 5 year moving average. You’ll see it.
You were saying the 98 El Nino was stronger than 2016 before I did. Are you now retracting that claim? Read what you wrote.
Scott R
Sorry, but you become really boring.
1. “HadSST” is Hadley Centre’s Sea Surface Temperature record.
2. “SH” is “Southern Hemisphere”.
Thus HadSST3 SH is Southern Oceans, Scott R.
Did you get it now?
Sorry Bindidon, you are wrong. I’m using the Southern Ocean data to get the 40 years of decline. This is for south of 50S only. To see the data, go here and download the HadSST.3.1.1.0.time_series. There are 100 realizations there, so you can get a good feel on error. You don’t need to worry about that to see this trend. Just grab any realization you want. Then apply a 5 year moving average to it. Like magic, the Southern ocean 40 year down trend appears.
https://www.metoffice.gov.uk/hadobs/hadsst3/data/download.html
Bindidon
I’ve already told you to apply a 5 year moving average to that El Nino data to see the 11 year cycle. If you don’t do that, the harmonics cloud the data. Try it.
Bindidon,
The volcanic eruptions, and a host of other factors DO in fact make each El Nino a unique event. Air temps, trade winds, sea surface temps, it’s all related as you know. Why would you claim El Ninos are not all unique except to just be disagreeable? You really don’t think the 98 was interesting? How high it went? The speed it dropped?
Scott R
I have shown where you can the official MEI ENSO data, and produced a graph showing a compariosn of the 3 major El Ninos of the recent past (Nr 4 is that El Nino having occured in… 1877/78).
Here is the graph again:
https://drive.google.com/file/d/1F6xQbe_l5j6Ih_A-BrZQKcQ3qeVQtnRZ/view
You clearly see that both the 1982/83 AND the 1997/98 editions were stronger than 2015/16.
Please stop telling superficially about your pretended 5 year averages and other magic harmonics, that is useless.
SHOW US YOUR DATA, Scott R, with a graph representing it.
Bindidon,
FYI my company is blocking your google drive links. I can only see them from my home computer, and I can’t post my data unless I’m at home with my 7 year old and 4 year old, and wife telling me to stop obsessing over climate stuff. To be honest, I’m a little frustrated with the antiquity of this blog. I should be able to just take a snap shot, screen shot of my data and post it here but I’m blocked all the time. I suppose it is in my company’s best interest to do that. Why don’t we move the discussion to a Roy Spencer facebook page or something? I can than use my mobile device to share screen shots of my charts as needed. There are other options as well, I remember back in the day using word press and being able to post charts from my work computer.
Bindidon I looked at your chart on my mobile again. HADSTT3 data when I apply a 5 year moving average to it clearly shows the 98 El Nino 3.4 region as the strongest. 83 was the weakest out of the last 4. 2007, the current wave are about equal. I will try to figure out a better way to share data here from work. For me, there are only 4 El Nino cycles since 1980. Everything else is just harmonic action.
Jesus, Scott R.
I try for the last time to show you for UAH6.0 LT and for HadSST3 SH, graphs with superposed plots for the periods
– 1982-1986
– 1997-2001
– 2015-2019
like I did above for MEI.
1. UAH
https://drive.google.com/file/d/1jyBdu_O5xMGh8BkupBiX64WXkRkHlPsB/view
2. HadSST3 SH
https://drive.google.com/file/d/1eTqJ4O12Eh0Foc-rr6oQRjn89zPtv00T/view
You see that in both graphs, the red line tops, and the green line (1982/86) has hard to compete with the blue line (1997-2001).
But in the Multivariate ENSO Index, 1982-86 is a the top:
https://www.esrl.noaa.gov/psd/enso/mei/img/meiv2.timeseries.png
Why? Because while temperatures time series at Earth’s surface and in the lower troposphere are highly affected by volcanic eruptions, the way ENSO time series are constructed makes ENSO more independent of volcanoes.
In 1982, there was a big eruption (VEI 5) in Mexico (El Chichon). The volcano was not as strong as Pinatubo, but strong enough to cool the entire Globe for a little while.
Thus you CANNOT use either UAH or HadSST to measure ENSO.
If you don’t accept this, fare well…
Bindidon,
You still didn’t find the data set. See how UAH has global data, NH data, SH data? If you download the data, additional regional data is also available including the south pole region. Well, HADSST3 also has that, and in addition, it has southern ocean data by itself south of 50 deg.
Sorry, my preference is for data that HAS NOT been adjusted. I therefore will take HADSST3 data for my El Nino 3.4 analysis. Hey, you can make arguments that even HADSST3 data has been adjusted higher.
Honestly, all of these adjustments will haunt man kind for hundreds of years. When people try to use data from the late 20th century, and early 21st century, to study the grand solar minimum and magnetic field reversal (TBD), they will have to make downward adjustments to erase a period of time where science became corrupt and political. That’s really too bad. So how can we be sure we are even getting good data? Well, the only way I know of is using actual recorded data from weather stations as proxy for the globe. Looking at the base NOAA data, I don’t see any run away global warming at all. Just choppy sideways data in line with El Nino cycles with some upward bias due to heat islands growing.
Bindi, in 2001 we weren’t in the midst of weak solar cycles. The claimed cooling hype was/is because of the weak sun, particularly SC24. At long last, we solarphiles are about to see if we are right or we are wrong. (hopefully)…
Sorry fonzie, but…
https://drive.google.com/file/d/1AWhf55plFrWHF9MjFeSRdorgS10GzJC9/view
But what, Bindi? (what’s your point?)
Jesus fonzie!
The point is that any correlation between ENSO and SSN (same with F10.7 for the more recent past) is a PURE INVENTION.
What has Jesus got to do with it, Bindi? (☺️) For that matter, what’s enso got to do with it either? After 2001 we had a still strong SC23, but after 2019 we’re likely to be headed for our second weak solar cycle in a row. If the solarphiles are correct we should anticipate imminent cooling this go round. There in lies the difference between then and now…
Spotless Days
Current Stretch: 4 days
2019 total: 113 days (62%)
2018 total: 221 days (61%)
Thermosphere Climate Index
today: 3.39×10^10 W Cold
Max: 49.4×10^10 W Hot (10/1957)
Min: 2.05×10^10 W Cold (02/2009)
http://www.spaceweather.com/
Spotless Days
Current Stretch: 7 days
2019 total: 125 days (64%)
2018 total: 221 days (61%)
Thermosphere Climate Index
today: 2.83×10^10 W Cold
Max: 49.4×10^10 W Hot (10/1957)
Min: 2.05×10^10 W Cold (02/2009)
Getting colder.
When [or if} will it equal 02/2009
I say less than 6 months.
(hopefully)… should read (hopefully… 😖)
Warmest June on record in the Coperinicus data.
https://climate.copernicus.eu/record-breaking-temperatures-june?fbclid=IwAR1plPu-R5uKHlQu9nKMLQOg98gviXe6BqfhO6WiFr71OG9rMBjfJyDMT_A
No wonder people want to leave the EU.
Mark…”Warmest June on record in the Coperinicus data”.
A number is a number, especially a number fudged by NOAA et al.
To what degree was the record broken, 0.01C?
Copernicus is maintained by the ECMWF.
Oh and the record was broken by 1C. It says it right at the top.
bdgwx, please stop trolling.
Javier has been trumpeting the fact that solar minimums are associated with el nino events. It’s interesting to note that this current el nino’s anomaly is right about where the last one (occuring at a solar min) was. Javier’s also forcasting a la nina event as we leave the solar min, also a recurring occurrence. So, life could get pretty interesting here in climate land. i certainly hope so (’cause it’s been dullsville for quite some time)…
Implied by the Warming Exaggerationists in all of these El Nino related discussions is the assumption that general global average temperature (GAT) increases following El Nino events is driven somehow by increased back IR from increasing atmospheric CO2 concentrations.
How is CO2 “greenhousing” OVER THE ENTIRE GLOBE “held off” for many years prior to an El Nino event and then suddenly released LOCALLY in the Pacific equatorial region during the El Nino event?
That makes no sense. What possible mechanism would explain this magical energy transfer from the whole world to the Western Pacific?
A common sense (and also probably wrong…but likely less wrong) reading of the last 30 years of GAT’s is that El Nino’s cause “almost all” or perhaps “all” of the warming and La Nina’s cause “all” or “almost all” of the cooling. And the trends in warming (or cooling) are mainly due to the balance between El Nino and La Nino effects over short (50 year) time periods. CO2 seems to be a very small bit player.
Filter out the ENSO activity, and not very much alarming (actually not very much at all) seems to be happening to GAT’s the last 50 years…and absolutely nothing the last 20 years.
DocSiders
I propose to carefully read
https://dspace.mit.edu/bitstream/handle/1721.1/89054/solomon%206%20Santer_etal_NatGeo_Article_File_22jan2014.pdf?sequence=1&isAllowed=y
You will see that the residual temperature increase for RSS3.3 between 1979 and 2013 was, after extraction of ENSO & volcanic effects, 0.086 C / decade, i.e. about 70% of the 0.124 C for the original time series.
https://drive.google.com/file/d/1fb6AKV_JP3vF63jGylqytpBOf9QZ_-o6/view
But maybe you think that Ben Santer, Celine Bonfils and colleagues produced rubbish? In that case, please come around with a valuable scientific contradiction…
But alarming? Here you are right: it isn’t.
binny…”But maybe you think that Ben Santer, Celine Bonfils and colleagues produced rubbish?”
Exactly!! Especially Santer. And you’re still an idiot for thinking it’s not rubbish.
As usual: insults instead of arguments.
Robertson still is the dumbest, most ignorant commenter!
And that is not about to change.
El Nino is a dead horse, but I’m sorry to agree on Santer. Intelligent man, but evil.
“Implied by the Warming Exaggerationists in all of these El Nino related discussions is the assumption that general global average temperature (GAT) increases following El Nino events is driven somehow by increased back IR from increasing atmospheric CO2 concentrations.”
Not true. This is not being implied at all. However, your language is so tortured (“Implied by the Warming Exaggerationists”) that it’s way too much effort to unpack the nonsense.
barry, who are you trying to kid?
You thrive in nonsense. Just like your comment you just made–pure nonsense.
doc…”Filter out the ENSO activity,…”
Plot the so-called global warming on a scale of the alleged 15C global average and you have trouble finding it compared to the axis. It’s that flat.
The warming rate has nothing to do with the scale of a graph. It will be the same regardless of whether the Y-axis has a large range or a small range.
What you mean is correct of course, but I suspect the genius to rumble about a different point:
– the difference between absolute data and anomalies out of which the seasonal information was removed, combined with the fact that
– minima increase faster than maxima, what results in anomaly estimates becoming a bit higher than the original stuff out of which they were computed.
Sorry, but what? Went right o’er my head. (i’m pretty short)…
testing…
Stuck in mobile (all comments show up at the bottom… ☹️)
(ah, finally… ☺️)
The referenced 89-20 mean is -9.2C
doh, 89-10…
doh again, 81-10…
But… 263.955 K = -9.2 C, perfect.
Was trying to bve first to comment in order to predict that wishfully thinking ‘skeptics’ would lay out how things are going to cool. But I was too slow and that’s already happened severally upthread.
So, getting in early this time: next global update will be dotted with comments about the coming cooling. And that is going to happen for every update, because the poor skeptics had their pause since 1998 taken away from them. Sorry guys and gals, it’s not going to come back. But hey – there always the pause since 2016. You’ll have that for a few years to come.
barry, do you have anything worthwhile you could be doing?
You remind me of some uneducated, frustrated typist.
barry…”the poor skeptics had their pause since 1998 taken away from them…”
No pause, it was the end of global warming as we know it. The ‘re-warming’ since the Little Ice Age is fizzling with a couple of bangs.
What is “re-warming” and what causes it to fizzle or turn off?
bdg, you should learn some physics. Then maybe you won’t be asking dumb questions.
Or, you can just head for the backdoor, as usual.
“Re-warming” and “fizzling” are terms skeptics might console themselves with when they haven’t any science on their side.
Says barry, who believes a cold sky can warm the ground:
Overhead –> 22.1 °F
Ground –> 81.1 °F
barry, your beliefs, imagination, and denial are NOT science. You need to learn some physics.
Inside with heater 18C
Outside 10C
Close window – it is colder than the room and the heat source
Now inside is 24C
Placing cold object between warm environment and cold one made warm environment warmer
Because that slowed the rate of heat loss
Physics
barry, your example was somewhat nebulous, but nevertheless, I was able to figure out you don’t have a clue about thermodynamics.
If I’m wrong, perhaps a more lucid example….
UAHv6 TLT
1998 to 2017
0.052 (+/- 0.186) C/decade
1998 to present
0.084 (+/- 0.151) C/decade
Looks like another ENSO denier.
Looks like another drive-by comment with zero substance.
The substance is right in the comment. It appears you are too dense to understand simple words.
Don’t pretend to be brain dead. Explain what you mean. Pointing back to your empty comment doesn’t improve it.
barry, please stop trolling.
Thanks, Binbidon. Very helpful
Pablo
You’re welcome… ¡De nada!
2019 is almost a mirror image of 2010.
Nothing to write home about.
We went from a record high El Nino in 1998 to a not so high EN in 2010, to another record high EN in 2016 to another not so high EN in 2019.
Same old, same old. All natural ENs, no sign of CO2 warming.
You really think warming from 1979 to 2019 is El Nino? CO2 is a background trend, you seem to be blind on the background. EOM
My periodic model predicts that the red line will not turn down until the end of 2020. It means that till the middle of 2021 the blue circles will be mostly above the blue circles 13 months before. I humbly think that any changes to the average rate of warming (slightly under 1.3 deg per century) are so slow that they will probably not influence this comming peak in the graph, even if the grand solar minimum comes.
Robertson
“The trend was flat from 1998 2015.”
As usual (but exceptionally without insult, so you don’t get insulted back here) you show a mix of ignorange and urge to manipulate.
Trend UAH6.0 LT, for 1998-2015, in C / decade:
-0.004 +- 0.003
Indeed!
Your manipulation is so easy to detect, Robertson. Only people as ignorant as you fall into such a simple trap.
You start a period with a very high value, and end it with a low one, ha ha ha! So the trend is obviously low.
*
Now I do the inverse manipulation, start with a low value and end with a high one, and what does happen, Robertson?
Trend UAH6.0 LT, for 1999-2016, in C / decade:
+0.128 +- 0.02
Ha ha ha haaa!
Bindidon, you seem to be quite frustrated that no one is interested in your data manipulation. Maybe you should give it a rest, so you can chill out.
The 2010 El Nino is classified as “strong” while this year had a weak one.
Krakatoa
Exactly, this is clearly visible here:
https://www.esrl.noaa.gov/psd/enso/mei/img/meiv2.timeseries.png
But 2010 in turn was a lot less strong then were 1983/83, 1997/98 and 2015/16.
The teens so far averaging 0.246
Heres all the decades:
teens 0s 90s 80s
0.246 0.105 -0.0002 -0.145
Another new record for 5 year average: 0.343
beats old non-overlapping record by 0.176
Nature is quite variable. Maybe that’s why it’s called “natural variability”.
But, even nature can’t violate the law of physics:
Overhead blue sky, bright sun –> 16.7 °F
Cloud, nearly overhead –> 69.8 °F
Ground –> 85.4 °F
Sun heats the surface; surface heats the atmosphere; and atmosphere radiates to space.
Nothing new.
JD said…”and atmosphere radiates to space”
And to the surface. Don’t forget that.
And it cannot warm the surface. Don’t forget that.
But it can slow down its cooling. Dont forget that.
Yes, and that helps moderate surface temps. But “slowing down the cooling” is NOT warming. The atmosphere can not raise surface temperatures, in toto.
+1
-1
0
Any object that receives constant heat is at a certain temperature. If then the rate at which the object loses heat slows down, then that object must perforce become warmer.
The surface of the Earth receives constant heat from the sun. The atmosphere moderates the rate of heat loss to space of the surface. If the properties of the atmosphere change, such that the rate of heat loss from surface to space slows down, then the surface must perforce become warmer.
Deny that and you deny the most basic laws of physics.
barry, what “law of physics” states that adding another molecule of CO2 warms the surface.
All you have is your pseudoscience. You have NO understanding of the relevant physics. You must have been taught in your typing class that if you can type it out, it becomes true.
Like many other clowns, you have been misled.
Nothing new.
barry says:
July 4, 2019 at 10:42 AM
…
The surface of the Earth receives constant heat from the sun.
…
A fact free assertion if ever there was one (-:
Even our very good friends atSkeptical Science say that solar fluctuations contribute to temperature changes.
They go on to imply that it doesn’t amount to a hill of beans, but they certainly don’t claim that the Earth receives constant heat from the sun.
Groan Ok, Steve, continuous, then. Nitpickers succeed in distracting from the main point. That’s what skeptics do.
I take it you have no issue with the simple physics I outlined above.
barry, you didn’t offer any “simple physics”. You offered veiled pseudoscience.
CO2 does not heat the surface.
You’re welcome to try again….
Yes, CO2 does not heat the surface, that’s why barry didn’t say that.
barry says:
July 4, 2019 at 7:49 PM
Groan … I take it you have no issue with the simple physics I outlined above.
Yes,
If the properties of the atmosphere change, such that the rate of heat loss from surface to space slows down, then the surface must perforce become warmer.
That’s what the simple physics says. And since the 1850s where most of the time series begin we’ve seen warming, cooling, warming, cooling and warming but mostly warming to the tune of about a degree in all that time. How much of that is due to CO2? Some, all or none? Why have summer afternoons in the eastern half of the United gotten cooler since the 1800s? Did excess CO2 cause hurricanes Katrina, Harvey & Sandy? Precipitation since 1895 in the United States has trended up is that a artifact of increased CO2? Sea level has been going up since the early 1800s is that caused by CO2?
It really is ridiculous, floods, droughts, cold snaps and heat waves are all said in the popular press to be caused by “Climate Change” (increased CO2). I could go on.
Steve,
‘Why have summer afternoons in the eastern half of the United gotten cooler since the 1800s? Did excess CO2 cause hurricanes Katrina, Harvey & Sandy? Precipitation since 1895 in the United States has trended up is that a artifact of increased CO2? Sea level has been going up since the early 1800s is that caused by CO2?’
Science first needs to answer the simplest questions, like is CO2 causing GLobal Warming and how much.
We need to know that.
All your issues seem to be in the ‘what about all these unexplained details?’ category, which distract from the main question.
Nate says:
July 5, 2019 at 9:41 AM
Science first needs to answer the simplest questions, like is CO2 causing GLobal Warming and how much.
barry says:
July 4, 2019 at 10:42 AM
If the properties of the atmosphere change, such that the rate of heat loss from surface to space slows down, then the surface must perforce become warmer.
Barry leaves out the fact that the warming that ensues is caused by the sun. Barry didn’t say back radiation from CO2 warms the surface, but a lot of people get that impression if you don’t spell out exactly where the warming energy comes from.
That is a great question. The Earth is accumulating 10e21 joules/year mainly in the ocean. Where does that energy come from?
bdgwx, please stop trolling.
Steve, you didn’t respond to what I wrote, you said a bunch of other stuff.
If an object at certain temperature, receiving continuous heat supply, then becomes less efficient at losing heat, it will perforce become warmer. Basic physics – right?
If the atmosphere slows the rate at which energy leaves the surface to space, then heat loss is less efficient, and the surface, receiving continuous energy from the sun, will get warmer.
Forget AGW, just say if there is anything wrong with that premise.
barry, please stop trolling.
barry says:
July 10, 2019 at 10:38 PM
Steve, you didn’t respond to what I wrote, you said a bunch of other stuff.
If an object at certain temperature, receiving continuous heat supply, then becomes less efficient at losing heat, it will perforce become warmer. Basic physics – right?
If the atmosphere slows the rate at which energy leaves the surface to space, then heat loss is less efficient, and the surface, receiving continuous energy from the sun, will get warmer.
Forget AGW, just say if there is anything wrong with that premise.
There is nothing wrong with that.
The continuous heat supply at 5000k that does the warming is the sun. If the efficiency at losing heat went to zero the sun would warm the place right up to 5000K. Some people are led to believe that it’s the back radiation does the warming and there’s not a whole lot of people on your side of the coin that try to dissuade them from that notion.
The issue isn’t whether or not the world has warmed, or why it has warmed, but is some warming a problem. Making the case as you just did that there is or should be some warming doesn’t make the case that it’s a problem that requires me to change the way I live my life.
I just read that Berkeley, CA here in the U.S. is considering a requirement that new construction may not have a natural gas hook up. So the people you run with really are planning to tell me how I shall and shall not run my life. It will happen and just like the California ban on plastic straws it will reach my neck of the woods in short order.
‘There is nothing wrong with that.
The continuous heat supply at 5000k that does the warming is the sun. If the efficiency at losing heat went to zero the sun would warm the place right up to 5000K. Some people are led to believe that it’s the back radiation does the warming and there’s not a whole lot of people on your side of the coin that try to dissuade them from that notion.’
Steve, fine. You understand it one way, which I agree with BTW, others use different words, to explain the same thing, which I also think is fine.
Just semantics, no change in outcome.
The back-radiation way of describing it comes from Meteorology, where since the dawn of time, DWLWR has been measured and considered a USEFUL parameter in weather prediction.
I believe it is considered useful because, when you have an atmosphere with multiple layers at different temperatures, and an IR window, various GHG, and clouds, the DWLWR captures all of these atmospheric effects in a single number.
That number affects energy balance and temperature of the surface, and of parcels of air. Thus NET IR surface radiation is described as UWLWR minus DWLWR.
I think this is simply the most convenient way of parameterizing radiation for the purpose of modeling weather, and climate.
I just don’t see a big problem with that.
Nate says:
July 12, 2019 at 10:26 AM
…
Thus NET IR surface radiation is described as UWLWR minus DWLWR.
And there is nothing wrong with that either.
What’s unsaid is that it’s the Down Welling Short Wave Radiation from the sun that does the warming. The issue is the balance between energy in and energy out of the system. Trenberth’s original heat budget diagram
http://www.cgd.ucar.edu/cas/papers/bams97/fig7.gif
showed that energy in and out balanced. I have always been amused that a few years later he must have realized that didn’t support the notion of a warming world and so it was revised:
https://i.postimg.cc/tCwt8L81/image.png
to show an imbalance of 0.9 w/m² as if the all the values in that diagram:
Reflected by clouds
Reflected by aerosols
Reflected by atmospheric gases
Reflected by surface
Absorbed by the surface
Absorbed by the atmosphere
Thermals
Evaporation
Transpiration
Latent heat
Emitted by clouds
Emitted by atmosphere
Atmospheric Window
AND
Back radiation
were accurately measured to five places or better for the 0.9 Wm² imbalance to be true. But as an ordinary person, I look at those diagrams and note that Back Radiation at 324 or 333 w/m² is more than the incoming solar radiation at only 161 or 168 w/m². It sure looks like that diagram says that it’s the back radiation that does the warming. I find that confusing and I bet I’m not alone. Especially since an example of a black body that radiates at 15 microns which is the ir band in the back radiation that CO2 affects would be a block of dry ice.
But yes, as you say, “NET IR surface radiation is described as UWLWR minus DWLWR.”
I keep forgetting that this forum doesn’t handle special symbols very well (-: etc.
I converted it to heat here:
http://www.drroyspencer.com/2019/07/record-high-temperatures-in-france-3-facts-the-media-dont-tell-you/#comment-363646
Pardon a couple of sloppy mistakes, others will correct it soon.
‘What’s unsaid is that it’s the Down Welling Short Wave Radiation from the sun that does the warming.’
Its in the diagrams also.
“The issue is the balance between energy in and energy out of the system”
Agree, and ALL fluxes must be counted to get a balance, or to get warming.
Svante, Nate, please stop trolling.
Steve,
Good, so we are agreed that the sun can be completely constant, and that the change in surface temperature can come about because of changes in the efficiency of heat loss from the surface.
So saying that the sun is the “cause” of warming is a semantic trick.
In the notion we both agree on, the sun is the source of heat, but not the cause of the temperature change. The cause of the surface temperature change in this example is the thing that reduces the efficiency of heat loss from the surface.
“Back radiation” is an actual physical thing that occurs. The atmosphere radiates in all directions, including groundward and spaceward. The ground absorbs some of this “back radiation” from the atmosphere, which adds to the sum of all incident radiation at the surface, including direct solar. If the atmosphere radiates more (in every direction), the ground will receive more – and radiate more, as the whole system must remain in equilibrium with its primary source of energy, the sun.
When I close my window in Winter, my radiant heater only has one setting, and the resulting room temp change comes from the new configuration of the environment, not from a change in the heater.
There are various analogies we could use, but the physics is the same. The atmosphere is many-layered, and incoming solar energy is modulated by it, and outgoing thermal radiation is also modulated by it. The constituent gases play a part in the modulation of net radiation (and convection in the lower troposphere) through the atmosphere. CO2 is a strong absorber of infrared, and a very weak absorber (near zero) of solar radiation. More CO2 has a stronger modulating effect on upwelling radiation than incoming solar, which is why the global average surface temp is warmer with these GHGs than it would be without them. And it is intuitive to figure out that an increase in the atmospheric “greenhouse” effect results in warmer temps at surface. It is also borne out by physics and multiple observation strands.
Most of the informed skeptic community have moved on from denying the greenhouse effect (Roy Spencer and John Christy never did deny it, Anthony Watts has stated he thinks its stupid to deny it). There are more interesting things to talk about than the semantics of the atmospheric greenhouse effect.
#2
barry, please stop trolling.
Barry says:
July 18, 2019 at 8:11 PM
…saying that the sun is the “cause” of warming is a semantic trick….
What I wrote earlier was:
“Barry leaves out the fact that the warming that ensues is caused by the sun. Barry didn’t say back radiation from CO2 warms the surface, but a lot of people get that impression if you don’t spell out exactly where the warming energy comes from.”
Barry goes on to say:
The ground absorbs some of this “back radiation” from the atmosphere, which adds to the sum of all incident radiation at the surface, including direct solar.
So we’re back to implying that back radiation causes warming. So, Barry, I will remind you that the 15 micron band which the back radiation from CO2 mostly consists of would be consistent with the radiation produced by a brick of dry ice.
Then Barry says:
If the atmosphere radiates more (in every direction), the ground will receive more – and radiate more, as the whole system must remain in equilibrium with its primary source of energy, the sun.
Not only is the sun the primary source of energy, it is the only source of energy.
This is mostly a bait and switch discussion. The total greenhouse effect keeps us some 33 degrees warmer. And if you point your infrared thermometer at the night sky it will register way more than that brick of dry ice. That’s the bait. The switch is then to imply that all that back radiation is from CO2, especially the anthropogenic portion of it. Followed by headlines in the press that the heat wave here in the U.S. these last few days is due to Climate Change from man-made CO2 pollution:
Can The Current U.S. Heat Wave Be Linked To Climate Change? NPR
Even JD cant violate a law of physics, like the radiative heat transfer law.
But he keeps trying!
Nate, please stop trolling.
What a feeding frenzy. Guess it keeps people happy. Changes in one month are an important element in the long haul, but alone statistically meaningless. Emotional stabilities, civilities and general psychological health of the gang would be much better if we just sit back, take a breath and see where the future unknown leads. Words from a searcher anticipating and waiting for resumed downturn in the trends.
Bill Rudd
“Words from a searcher anticipating and waiting for resumed downturn in the trends.”
Wow.
Im quite a bit impressed, to say the least.
People are vested in the circular debates trying to convince the other side they are right, so they are clutching to every monthly uptick and down-tick like a drowning to a straw.
One month Warmistas feel like winners next month coolistas celebrate the victory, all the while the temperature is just going sideways well withing the noise range.
Not me, these short term fluctuations are irrelevant, zoom out and all you have is this thick black line:
http://berkeleyearth.org/wp-content/uploads/2015/03/results-plot-volcanoes.jpg
It will take millennia or geoengineering to bring it down.
Svante, is there ANY pseudoscience you won’t swallow?
Yes, yours.
Well, that explains it. You can’t tell the difference between pseudoscience and physics.
Nothing new.
It is confusing because of your inverted lunatic reference frame:
– science is pseudo-science.
– pseudo-science is science.
Yes Svante, you have been terribly confused by your addiction to false religions.
I can only present reality, I can not make you accept it.
Translated: I keep things clear by adhering to science when JDHuffman presents fantasies.
Svante, you wouldn’t know science if it fell on your head. If you knew any physics at all, you could find several things wrong with pseudoscience like this:
https://en.wikipedia.org/wiki/Earth%27s_energy_budget#/media/File:The-NASA-Earth's-Energy-Budget-Poster-Radiant-Energy-System-satellite-infrared-radiation-fluxes.jpg
But, you can’t!
Translated:
“Svante, you know science and physics well, and this is a good illustration of the average Earth energy budget.”
Svante, please stop trolling.
Thought I’d remind everyone what I posted here 3-1/2 years ago (https://www.drroyspencer.com/2016/01/uah-v6-global-temperature-update-for-dec-2015-0-44-deg-c/#comment-205770):
As to the future, while I am generally reluctant to make predictions for a system as chaotic as the climate, I’m here for fun and can’t resist. Based on the somewhat short dataset in the graph above and the ONI history, my ‘eyeball and gut’ estimation is that, following the next La Nina interval, the LT will stabilize somewhere in the neighborhood of 0.3 deg. above the ’81-’10 average in the early 2020’s and monthly readings below the ’81-’10 0 line will be rare, if not non-existent. I’ll have a better feel for this after we see the monthly temperatures in the next few months. Of course, if another significant El Nino occurs during the next five or six years, all bets are off and we are likely well and truly in trouble.
After a few months, I revised my prediction to closer to 0.4.
Looks like my ‘eyeball and gut’ method, informed by years of systems analysis, is a bit more effective than that of the cherry-picking, linear extrapolators who frequent this site.
Climate isn’t chaotic. Weather is. It is because climate is relatively stable that we have seasons.
No barry, we have seasons because of Earth’s axial tilt.
Whether you’re being a smartass or just stupid, you’ve missed the point. Axial tilt is not responsible for the fact that weather is chaotic and climate is stable. Climate (like seasons) is stable because it is a parameter rather than a point. An average rather than an anomaly. Climate is predictable, weather much less so.
Slipstick may or may not know this, and your contribution adds nothing of value to that topic. Your MO.
barry, you can argue with your own words as much as you like, but we have seasons because of Earth’s axial tilt.
Barry, while the climate is generally more predictable than the weather, it is not stable. Investigate the Younger Dryas.
I said ‘relatively stable’ for a reason. It’s much more stable than weather, much more predictable. Because climate is parametric conditions rather than individual events.
Climate is not ‘chaotic’ as you said, but I wonder if you meant weather when you typed that.
barry, please stop trolling.
Nice to see you slip…
And you, as well, fonzie. Been busy.
Weather arises in a system called the climate, which includes both linear and non-linear inputs and feedbacks such as variations in input energy, i.e., solar fluctuations, volcanism, and ice melt, with varying degrees of coupling, some of those couplings being conditional. Now, change the conditions, say by dumping carbon-dioxide into the atmosphere to reduce the outflow of energy while simultaneously reducing the sink for that carbon dioxide through deforestation. Such a system will react chaotically.
Slipstick, if you believe that CO2 reduces the outflow of energy, you need to study more.
But, if you believe that we should plant more trees, then you are correct. Every house I have owned now has more trees then when I acquired it. I don’t know the exact count, but it pales with the thousands of trees a planted in my youth, working with volunteer groups.
I often wonder how many trees the phony Warmists have planted….
The reduction of the rate of outflow of energy by an increase in CO2 in the atmosphere is basic physics. You might want to look into the work of Svante Arrhenius and those that succeeded him.
Tyndall’s thermopile experiments actually quantified CO2’s ability to return energy back to the source 30 years before Arrhenius began looking at it. But yeah, Arrhenius is credited with predicting that the Earth would warm due to human behavior, that the warming would be more pronounced in polar regions, that the warming would be more pronounced at night, and that the ocean would buffer a significant portion of human emissions.
bdgwx, please stop trolling.
I stopped visiting climate blogs much, and pop into this one every now and then mainly to check on the monthly update.
I keep coming back to see if the skeptics’ predictions of imminent cooling is panning out yet, and particularly of the “return” of the pause since 1998. It’s been 3 years of that claim and still waiting. They’ve been so confident. It aint gonna happen.
Come back in 3 years
Thanks for all your sensible posts here barry.
Now Svante, there’s no need to be sarcastic.
Translated from JD’s inverted lunar reference frame,
sarcastic means realistic.
Keep translating, Svante.
Why grow up when you can pretend behind a fake name?
Svante
You are dealing with a half-deck with the JDHuffman poster.
Dumb as a brick but that doesn’t stop this one from posting
Norman, I see you are unable to ignore me, again.
It’s not really about me, it’s about the fact that you have revealed yourself as just another incompetent nobody.
Your deadend job at MidAmerica Energy in the Omaha/Council Bluffs area is all we need to know. You have wasted many hours, typing on their time.
Warren Buffet would likely not be amused.
But, I am….
JDHuffman
I do ignore you. The problem is not me, it is clearly you. When I post to someone else you jump right in. Since you can’t leave me be I might as well let everyone know what a phony pretender you are.
You have your trolling. It is all you are good at. You suck at science. Dumb as a brick.
99% of your posts are trolling posters. Most posters know you are this blog’s troll.
You suck at science and are a mediocre troll. Good trolls are able to troll without other poster knowing that they indeed are trolls. Your tactics are so poor most have come to see you as a troll.
You love to get reactions from posters so you work to find their buttons and weak spots and then push them. Mostly you call them stupid over and over. Like telling people they don’t understand a link. You have a few tactics that you use over and over. It seems to still work.
Your big one with me is to invade a comment I am making to someone else. Hard to ignore that type of trolling. Guess I just have to do it.
I know he’s a troll Norman, I don’t even think he believes in what he says. No point giving him a serious response.
Norman, are you aware you are trolling me?
You “invaded” with your immature insults.
http://www.drroyspencer.com/2019/07/uah-global-temperature-update-for-june-2019-0-47-deg-c/#comment-361414
JDHuffman
It was you who wished to invade my post to PhilJ with your incompetent cartoon physics. If you leave my posts alone I will not invade your troll posts to others. If you choose not to leave me be then expect me to call you a troll (which is quite truthful). Leave me be, I will gladly ignore all your silly pointless comments. If you choose to invade mine, I will do likewise with yours. It is your choice. I hope never to need to respond to you. I doubt you have the discipline to refrain from invading my posts. I can only hope.
Thickman, please stop trolling.
Barry, unfortunately we have to wait til all this el nino crap gets out of the way before we see anything. That’s just the way the ball bounces with planet terra. Cooling’s either on the way or it ain’t. We’re all not going anywhere for a while. (so, grab a snickers and stick around)…
“Barry, unfortunately we have to wait til all this el nino crap gets out of the way before we see anything”
Mainstream people were pointing out the influence of el Nino ever since the “pause since 1998” meme arose. Skeptics were completely silent about the ‘pause’ period commencing with a super el Nino. Just ignored it.
Once WUWT called the pause off via Monckton in 2016, skeptics *suddenly* discovered that el Ninos have an impact.
The opportunism reeked. The history demonstrates a complete lack of intellectual integrity.
I contributed to a couple of articles at WUWT just after the 2016 el Nino, and skeptics promising a soon return to the pause. In the articles are calculations of how temps would have to evolve for the pause to return.
https://wattsupwiththat.com/2017/02/19/how-imminent-is-the-uah-pause-now-includes-some-january-data/
https://wattsupwiththat.com/2017/03/14/how-imminent-is-the-rss-pause-now-includes-january-and-february-data/
It’s not going to happen. Not in 3 years. Not in 5. And beyond that is pure wishful thinking from the skeptics.
And we don’t have to wait for el Ninos to finish. The so-called pause from 1998 started with a super el Nino. Peak to peak, we needed another one to offset the bias. And we’ve had la Nina conditions since. ENSO is going to keep happening, and talk of waiting for it to “get out of the way” is mindless claptrap.
“The history demonstrates a complete lack of intellectual integrity.”
Yes barry, your history is not that good. You promoted the “plates” nonsense, only to find out it was inaccurate. Now, you won’t even admit you started it here.
Denying your own words and actions is not exactly “intellectual integrity”.
Nothing new.
Oh please link to where I denied that, you lying piece of snake’s crud.
Well barry, do you deny you introduced the plates nonsense on this blog?
Thanks for the tacit admission that your lied, but not for the demonstration of your repulsive MO.
As far as I know I was the first to link the Green plate exercise at Rabbett Run to this blog. Unfortunately, dunces like you are ineducable.
barry, you had to fess up, because the record is here, and clear.
It’s a bitch when the evidence is undeniable, huh?
What on Earth are you raving about? This is the first time anyone asked me whether I initiated that conversation. I’ve been busy the last few months, so if you’ve been wittering on about it I haven’t seen your posts. Did you or someone else ask me directly?
You’re really quite a poisonous little worm, aren’t you.
I do hate mendacious worms. This lie:
“Denying your own words and actions is not exactly ‘intellectual integrity’ ”
came from you, JD. Here’s the link.
http://www.drroyspencer.com/2019/07/uah-global-temperature-update-for-june-2019-0-47-deg-c/#comment-361338
No requested link to me doing that, and no rescinding of the insult. Lying seems to come easily to you.
Lying low-life. You are in a rare place in my life, as the only person I know of that truly deserves this description. What a varied world it is.
barry, it was my BELIEF that you would try to deny that you brought the “plates” nonsense here. My statement was based on my BELIEF.
You proved my BELIEF wrong, by fessing up.
I don’t get angry and belligerent when someone corrects my BELIEF. I don’t respond with ad homs, and vitriol. In fact, I usually respond postitively, as in “Thanks barry, for taking responsibility for your actions”.
People that refuse to admit they are wrong are refusing to learn.
And JD never admits being wrong.
Troll Svante can’t wait to misrepresent me.
Nothing new.
fonzie, sorry about the JD troll. I’d be interested in your response. I find it hugely ironic that some ‘skeptics’ are now telling realists that el Ninos have a marked influence on the temp record and short-term trends. They’re only 12 years late to the table!
barry, the fact that you have to resort to name-calling just indicates you know your beliefs are wrong.
It’s so hard to give up a false religion, huh?
Barry, i’m one of those who agree that ’98 is a cherry pick for the start of the pause. i also believe it’s futile to use trend lines in determining the pause. i’d tell you that the pause began in 2002 and any return to that anomaly would constitute a return of the pause (albeit sometimes for a brief duration). Should we go below the 2002 anomaly, that would constitute cooling relative to the pause. If we’re about to see cooling due to prolonged low solar activity, then it will have to wait until these el ninos are over. AND, for that matter, the ensuing la nina which may soon be upon us (insofar as determining whether or not the weak sun might be the cause of cooling). Javier posted a nice piece over at watts’ with regard to enso and the solar minimum. Half of his prediction has proven correct. Now we’re awaiting the predicted la nina:
https://wattsupwiththat.com/2018/07/05/solar-minimum-and-enso-prediction/
Werner Brozek February 20, 2017 at 6:52 am
If temps return to where they were in the 2000s (and stay there) then the hiatus would have returned EVEN THOUGH TREND LINES WOULD INDICATE OTHERWISE (!)
Excellent point! Perhaps we need new definitions.
Barry, the above is werner quoting me and then adding his own comment there from the post on uah that you both did. In the comments also, you took issue with my use of 2002 as the start of the pause (as opposed to ’98) being another cherry pick. BUT, the pause had to start somewhere, right? At some point it stopped warming. We’ll all have something to chew on once we get there, assuming cooling ever arrives. (in the mean time, grab another snickers… ☺️)
fonzie,
i’d tell you that the pause began in 2002 and any return to that anomaly would constitute a return of the pause
So even if the trend was steeply positive after a few more years, and statistically significant, it would take only a single month anomaly below the 2002 annual anomaly? Even if, including that single month, the trend was still positive and statistically significant?
Perhaps we need new definitions.
You’re suggesting we abandon linear trend analysis in favour of judging whether there has been cooling or warming or not over a given period by seeing if a single month’s anomaly is above or below a certain mark.
The ‘pause’ was based entirely on a linear trend analysis and also one without error bars. The ‘pause’ was always not statistically significant.
When the mean trend went positive, skeptics discovered the importance of ENSO and statistical significance. Skeptics moved the goalposts to try to keep the pause alive (“No STATISTICALLY SIGNIFICANT warming since X”).
Are you suggesting the goalposts be moved again?
barry, please stop trolling.
In reality, the pause/hiatus/plateau has never gone away. It appears you just can’t accept that ENSO exists and affects the global temperature. However, when we look at the month with the least ENSO effects we see a pattern.
September 1996 .15 C
September 2003 .14 C
September 2006 .14 C
September 2007 .12 C
September 2011 .16 C
September 2014 .15 C
September 2018 .13 C
There are several more at .1 C vs. these years.
So, what is it about AGW that it can’t seem to prevent the GAT from falling back to the same value when ENSO effects disappear?
I thought it might be useful to add in the ENSO index (3 months prior) to avoid people claiming these are cherry picks.
September 1996 .15 C / -0.3
September 2003 .14 C / -0.2
September 2006 .14 C / -0.0
September 2007 .12 C / -0.4
September 2011 .16 C / -0.4
September 2014 .15 C / +0.2
September 2018 .13 C / +0.1
All these months occurred during ENSO neutral conditions.
Cherry picks, all of them. You haven’t allowed for the 4-5 month lag of temps to ENSO.
But let’s ignore the lag. Here are some more “ENSO-neutral” temps.
September 2005 0.25
September 2012 0.21
September 2013 0.22
September 2017 0.56
And those are just Septembers. You can get higher and lower values with other “ENSO-neutral” months.
Or you could just do 10-year averages. Each is higher than the last in the UAH record.
Or you could do 5 year averages, with the same result.
So, what is it about AGW that it cant seem to prevent the GAT from falling back to the same value when ENSO effects disappear?
What is it with AGW ‘skeptics’ that they need to cherry-pick so much?
Best idea is to use all the data and just run a regression. There’s no way it is being biased upward by el Nino when starting in 1998 commences with one of the strongest el Ninos in the record.
2007 and 2011 Septembers are during la Nina, NOT ENSO-neutral.
https://origin.cpc.ncep.noaa.gov/products/analysis_monitoring/ensostuff/ONI_v5.php
So you picked rotten cherries, too.
barry, are you still playing with numbers?
The GHE is nonsense.
Get over it.
Richard M is playing with numbers and I’m pointing out he is cheating. Are you so completely unable to positively contribute to a conversation, or is trolling really all you are capable of?
Rhetorical question. We all know the answer.
barry, some reality for you to deny:
* CO2 can not warm the planet.
* You are obsessed trying to “prove” the GHE, when you have NO knowledge of the relevant physics.
* Your “plates” nonsense is a complete fail, but you can’t let it go because you are willing to go down with your cult.
When you finish denying that, I’ll try to have some more for you.
JDHuffman
I like barry’s intelligent thought provoking posts. I do not like any of yours. They are just stupid and annoying. Your points about barry really lame.
YOU: “* CO2 can not warm the planet.
But it can lead to a higher steady state temperature than if the gas was not present in the atmosphere.
* You are obsessed trying to prove the GHE, when you have NO knowledge of the relevant physics.
barry has tons of relevant physics. You have zero. And you are unable to learn any physics. To date you still don’t understand the anything about heat transfer. You think the fundamental heat transfer equation is “bogus” What a moron you are! Yet you tell barry he has none.
* Your plates nonsense is a complete fail, but you cant let it go because you are willing to go down with your cult.
The plates is NO fail. You just are too stupid or lazy to do your own experiments. What has failed? Only you fail on all your points. Proving over and over you have not studied any actual heat transfer physics and can’t learn what you don’t know.
Norman, as I indicated to barry, that’s reality for clowns to deny.
You did a great job denying reality.
Barry, your comment is nonsense. As I stated and documented the ENSO value for 3 months prior to the values I listed. That is the proper lag time. Turns out the Nino 3.4 value is highest in the last two years I mentioned.
Then you run off and try to use the current Nino 3.4 value instead of using the lag. That gave away the fact that you are being dishonest.
Why is it you feel the need to lie? Is it because the data doesn’t support the narrative you want to believe?
Richard,
Typical lag time is 4 to 5 months, documented in the scientific literature.
If we run with your lag time, you STILL omitted Septembers from your list that lag ENSO neutral conditions by 3 months, and that DON’T confirm with your conclusion.
By your convention:
September 2005 0.25 / 0.1
September 2012 0.21 / 0.1
September 2013 0.22 / -0.3
September 2017 0.56 / 0.4
Why did you omit these values from your list?
barry, please stop trolling.
Svante,
“Isnt the average lapse rate about 6.5 C per km?”
A lower lapse rate means a cooler surface…
If the TOA is 10 km at a temp of -50 C:
then at a lapse rate of 10/km the
Surface is 50C…
And at a rate of 5C/km the surface is 0C.
Just one more proof that water cools the surface….
Yes, that’s right.
Glad you agree.
Kinda of blows h20 is the strongest ‘greenhouse gas’ out the window doesn’t it?
No, it’s still a greenhouse gas.
–PhilJ says:
July 3, 2019 at 9:21 PM
Svante,
Isnt the average lapse rate about 6.5 C per km?
A lower lapse rate means a cooler surface
If the TOA is 10 km at a temp of -50 C:
then at a lapse rate of 10/km the
Surface is 50C
And at a rate of 5C/km the surface is 0C.
Just one more proof that water cools the surface.
Reply
Svante says:
July 4, 2019 at 3:27 AM
Yes, thats right.–
No, it’s wrong.
Earth is warmed at surface. Or more specifically, Earth is mostly warmed at the ocean surface.
So if lapse is about 10 C per 1000 meters, then at 1000 meters above sea level, the air is 10 K cooler. As compared to lapse rate of 6.5 C where at 1000 meters elevation it’s 6.5 C cooler.
Say have ocean surface which is 20 C, air surface of 20 C and lapse rate of 6.5, so at 1000 meter elevation the air temperature is 13.5 C.
Then got land surface with air surface temperature of 20 C, and at 1000 elevation it’s 10 C.
So in the column of air in elevation between 0 and 1000 meter there is about 1 ton of air per square meter.
With lapse rate of 10 C, the ton of air is cooler than compared to lapse rate of 6.5 C. Or the measure air temperature is measuring the amount of kinetic energy of the air- the lapse rate of 6.5 has more kinetic energy in the ton of air per square meter in the 1000 meters of air.
Now, one has lapse rate of about 6.5 C because you have a gas which can condense. The air is having water vapor condense and the liquid water in the air is evaporating- and they are in balance. To evaporate liquid water requires kinetic energy and condensing water vapor into water, yields kinetic energy.
Or very small “droplets” of say 1 million molecules are unstable, or they can’t grow to a more stable amount of molecules and they can’t shrink to say 1000 molecules and be stable. They are in state which is some kind stable chaos. And seems unlikely that anyone has accurately modeled it.
Maybe it’s mostly as simple as the water vapor and liquid water in the air has more energy in terms of specific heat and latent heat.
But in simple terms, the measuring in terms of temperature of the 1 ton of air in the 1000 meters has more energy.
Now with Venus, the cloud top is the heated surface, and having greater difference of 10 C per 1000 meter, would make the rocky surface hotter.
Yes, that’s more or less right.
gbaikie,
“No, its wrong.
Earth is warmed at surface. Or more specifically, Earth is mostly warmed at the ocean surface.”
While I could argue with you about the amount of solar input at the surface, its immaterial to this discussion.
The lapse rate is not dependent on the temperature of the surface.
The altitude of the TOA IS dependent on the surface temp and the lapse rate…
It follows then that if I know the surface temp and lapse rate I can calculate the altitude of the TOA.
It further follows that if I know the altitude of the TOA and the lapse rate, then for that given altitude:
A lower lapse rate means a cooler surface.
Moist air has a lower lapse rate than dry air
water cools the surface!
The difference of course is that the atmosphere has a higher heat content with water in it than dry air does
Water has moved heat from the surface to the atmosphere, cooling the surface…
–PhilJ says:
July 5, 2019 at 4:35 PM
gbaikie,
“No, its wrong.
Earth is warmed at surface. Or more specifically, Earth is mostly warmed at the ocean surface.”
While I could argue with you about the amount of solar input at the surface, its immaterial to this discussion.
The lapse rate is not dependent on the temperature of the surface.
The altitude of the TOA IS dependent on the surface temp and the lapse rate…
It follows then that if I know the surface temp and lapse rate I can calculate the altitude of the TOA.–
When say TOA, are referring to top of troposphere or some air density like, .2 kg per cubic meter [somewhere around 15,000 meter] or what?
–It further follows that if I know the altitude of the TOA and the lapse rate, then for that given altitude:
A lower lapse rate means a cooler surface.
Moist air has a lower lapse rate than dry air
water cools the surface!
The difference of course is that the atmosphere has a higher heat content with water in it than dry air does
Water has moved heat from the surface to the atmosphere, cooling the surface–
Ok, but I think cooling the surface [without it being cooled by radiating the energy into space, would be a warming process.
Or roughly, it is “global warming”.
Global warming in my opinion is largely about warming most of the global surface.
Tropics is 40% of Earth surface, outside tropics is most of global surface- 60% of surface.
Now to save some time, I am guessing you think a lot cooling occurs somewhere around the TOA.
This seems like widely accepted view [I find it, a strange idea].
And I guess you think water vapor is cooling, because it rises and gets somewhere near TOA and there it can radiates a lot of energy into space.
Is that, roughly, the idea?
gbaikie,
“When say TOA, are referring to top of troposphere or some air density like”
As I said below, ” if we’re talking solely adibiatic lapse rate, the TOA temp and pressure are constant, the altitude of the TOA expands or contracts as the atmosphere (as a whole) warms or cools…”
so when I say the TOA, im referring to an altitude where the pressure and temp are stable, this altiude rises and falls as the pressure below it rises and falls but the TOA pressure and temp are constant…
I suggest the mesopause as a good place to identify as the TOA.
Then you can view the Earth system as basically a giant co2 bubble…
everything inside that bubble is internal energy..
If the internal energy rises, the pressure will increase and the bubble will expand..
If the internal energy decreases, the pressure will decrease and the bubble will contract…
but the pressure and temp at the surface of the bubble will remain stable…
so then if our bubble is 155K at .oo1 mb then we can determine the surface temp based on the altitude where we find that temp and pressure…
why that temp and pressure? because at that temp and pressure co2 sublimates…
g: “Ok, but I think cooling the surface [without it being cooled by radiating the energy into space, would be a warming process.
Or roughly, it is “global warming”.
Global warming in my opinion is largely about warming most of the global surface.”
cooling the surface is a cooling process for the surface and a warming process for the atmosphere…
a temp inversion, where say some warm moist air flows over a colder surface will indeed transfer heat from a warmer atmosphere to a colder surface… (ahhh a nice southerly flow from the Gulf in Feb…. sweet…)
but overall the surface is always transferring heat to the atmosphere…
g:”Now to save some time, I am guessing you think a lot cooling occurs somewhere around the TOA.”
I would say rather, that the LAST of the radiative cooling of the atmosphere happens at this layer of the atmosphere…
after co2 condenses out (or cools enough to fall back into the atmosphere), there are not enough ‘greenhouse’ gasses available to cool the other atoms and molecules (mostly O and N) and prevent them from being boosted outsystem by solar energy…
“I suggest the mesopause as a good place to identify as the TOA.”
Ah. Ok. So you actually mean TOA of atmosphere.
I was imagining that you meant something else.
–g:”Now to save some time, I am guessing you think a lot cooling occurs somewhere around the TOA.”
I would say rather, that the LAST of the radiative cooling of the atmosphere happens at this layer of the atmosphere…–
Like I said, I was imagining you meant something else.
I will read all it over again.
–so when I say the TOA, im referring to an altitude where the pressure and temp are stable, this altiude rises and falls as the pressure below it rises and falls but the TOA pressure and temp are constant–
I don’t know enough about atmosphere to say if or where this is.
I do know it’s a common complaint regarding the lack knowledge/data of atmosphere above statosphere.
But also it has studied a fair amount.
I also think this region has significant military “value”.
And I think too many things are classified.
–after co2 condenses out (or cools enough to fall back into the atmosphere), there are not enough ‘greenhouse’ gasses available to cool the other atoms and molecules (mostly O and N) and prevent them from being boosted outsystem by solar energy…–
That CO2 condenses in Earth’s atmosphere is an interesting aspect.
“The mesosphere is difficult to study, so less is known about this layer of the atmosphere than other layers. Weather balloons and other aircraft cannot fly high enough to reach the mesosphere. Satellites orbit above the mesosphere and cannot directly measure traits of this layer. Scientists use instruments on sounding rockets to sample the mesosphere directly, but such flights are brief and infrequent. Since it is difficult to take measurements of the mesosphere directly using instruments, much about the mesosphere is still mysterious.”
https://scied.ucar.edu/shortcontent/mesosphere-overview
And:
“Temperature decreases with height throughout the mesosphere. The coldest temperatures in Earth’s atmosphere, about -90° C (-130° F), are found near the top of this layer.”
It seems the atmosphere has to be colder than -90 C to freeze CO2 and it seems the the atmosphere does get a lot cooler than -90 C.
Sounding rockets are cheap and launched a lot by US and other countries.
Sub-orbital travel is going to occur at and above mesosphere.
So Virgin Galactic and Blue Origin are getting much closer to commercial space travel [traveling briefly to edge of space- 50 miles or the other target of 100 km {which is internationally regarded as edge of space.
Germany before 1945 had V-2 going up this high as well as cannon shooting shells this high.
X-15 planes traveled this high [before Apollo].
I imagined balloon could go this high, but they can go to the beginning of lower range of mesosphere.
But anyhow, I think the freezing out of CO2 in our atmosphere could have something to do with global climate.
PHilJ
I think your have the logic of the lapse rate backwards. The surface temperature of an air parcel is what determines what its temperature will be at when it reaches a certain height in the atmosphere (cooled adiabatically by expansion against the surrounding air).
Both air parcels start at the same temperature at the surface. Let us say the 50 C you used. As they rise the parcel with a lapse rate of 10 C/km will be at -50 C. The other parcel will be at 0 C at the same height. You would not take the temperature at the TOA and work backwards unless you wanted to see how much it would warm moving from height back to the surface.
http://www.metlink.org/wp-content/uploads/2013/11/iop_atmospheric_stability.pdf
Water does cool the surface via evaporation. But it warms the surface when it is vapor in the atmosphere. It has competing rolls.
Scientists are very well aware of the competing effects. They have done detailed analysis of clouds. Different types of clouds can either warm the surface or act to cool it.
Norman continues his nonsense:
“Water does cool the surface via evaporation. But it warms the surface when it is vapor in the atmosphere. It has competing rolls [sic].”
Poor uneducated Norman believes energy leaving can somehow warm the planet.
JDHuffman
No dumb dork. That is not at all what I believe. I have corrected your moronic posts several times but you go right on posting the same stupid points. Endless in stupid ideas and mindless posts.
Too bad you like wasting your time posting stupid comments. You could read and learn some actual science. I forgot, you can’t focus on material more than 10 seconds. More than 10 words confuses your limited attention span.
Norman, when you are finished with your adolescent name-calling rant, you should learn some physics.
Energy leaving can NOT warm the planet.
JDHuffman
Since you won’t leave me be.
Not that you will understand what I am saying, but I can try.
What you state I do not dispute nor is it what I am saying.
YOU: “Energy leaving can NOT warm the planet.”
That would be obvious. With water vapor, part of the energy emitted by the water vapor will leave the planet. Part returns to the surface where over 90% is absorbed by the surface.
https://www.researchgate.net/profile/Michael_Town/publication/260504538/figure/fig2/AS:671518371635216@1537113864972/Clear-sky-spectrum-of-downwelling-infrared-radiance-as-modeled-by-LBLRTM-for-Jan-2001.ppm
This one shows a measured amount of IR returning to the surface from the atmosphere. You laughed when I said your IR thermometer could pick up ozone. Maybe look at this spectrum and IR from ozone is part of the returning energy to the surface.
Norman found another link he can’t understand.
Nothing new.
JDHuffman
A better post (more truthful) would be why can’t you understand the information. I understand it fine. I do not know why it is so difficult for you to understand. This is probably because you can’t read physics textbooks. You lack the attention span to read more than 10 seconds. This post is already too long for you and all you will see is rambling.
Norman, you have found another link that you can’t understand:
” Part returns to the surface where over 90% is absorbed by the surface.”
That chart indicates the flux measured at the surface. That does NOT mean the flux was 90% absorbed!
PhilJ, I think you (and others in this thread) don’t understand the term “TOA”. What you apparently are referring to is the height of the tropopause, i.e., the boundary between the troposphere and the stratosphere. There’s still quite a bit of atmosphere above the tropopause which is also involved in the process of radiating IR EM to space. And, measurements from satellite altitudes are routinely given as “TOA” values, that is to say, above almost all of the atmosphere.
If you are going to talk about the height of the tropopause, please be aware that measurements in the tropics have indicated that the tropopause height is increasing with time, an indication of a warming Earth. Also, tropopause heights vary seasonally at higher latitudes, another factor to consider, as a consequence, the UAH “TP” product may be measuring at (or below) the tropopause in summer but above it during the winter months.
ES,
“What you apparently are referring to is the height of the tropopause, ”
Actually you could use what Im referring to at any boundry layer.. you just have to measure energy in and out at that layer…
I sugggest the mesopause is a much better choice for TOA than the tropopause because there’s less variablility in mass in/out…
one could make the case for the magnetopause as the TOA in which case there’s probably a relation between the mass lost through reconnection events, mass into the sytem (from solar plasma etc..)and the heat lost from the core…
E: “If you are going to talk about the height of the tropopause, please be aware that measurements in the tropics have indicated that the tropopause height is increasing with time,”
every layer of the atmosphere sits on every other layer… if the tropopause altitude is increasing then it must be lifting the upper atmosphere… if the mesopause is contracting even as this happens, then the total internal energy of the system is decreasing… in other words the upper atmosphere is cooling FASTER than the lower atmosphere is warming…
” theres less variablility in mass in/out”
that should read less variability in mass and energy in/out
but my assertion that if the TOA is expanding more energy (and/or mass) MUST be being added to the atmosphere and if it is contracting then more energy (and/or mass) MUST be leaving the system..
for example, if the Yosemite caldera exploded and pumped a large amount of heat (and mass!)into the atmosphere the TOA would expand…
“No, its still a greenhouse gas.”
Well then i guess the ‘greenhouse gases’ cool the surface….
Exactly, PhilJ.
How else could the planet cool?
Norman,
” You would not take the temperature at the TOA and work backwards ”
I suggest that you MUST start at the TOA:
Because if we’re talking solely adibiatic lapse rate, the TOA temp and pressure are constant, the altitude of the TOA expands or contracts as the atmosphere (as a whole) warms or cools…
Thus , i will point out (again):
Observed reduced drag on satelites is evidence the TOA is contracting…
PhilJ
No not quite right.
Here:
https://www.space.co6m/18430-global-warming-carbon-dioxide-space-junk.html
Only the upper atmosphere is contracting. Not the whole thing. This is reducing the drag on satellites.
You still do not get the situation. The surface will cool much faster with no GHG than with GHG. The surface DOES radiate. The GHG return energy to the surface that would not be there without them.
The Net result of GHG is that the surface has a lower Heat Flow. You have the loss from the surface emission but you have the gain from the GHG emission back to the surface. The heat flow is decreased. With the same solar input the surface temperature will rise to new levels until a new steady state is reached. The surface has to be emitting average of 390 W/m^2 so that the TOA emission is 240 W/m^2.
Empirical data collection clearly shows this.
Here have a look:
https://www.esrl.noaa.gov/gmd/webdata/tmp/surfrad_5d1e89cbefc36.png
The UPIR is greater than the DWIR. You get a NET of about 100 W/m^2 lost at night and 200 W/m^2 lost during the day. But without the DWIR the UPIR directly to space would be 600 W/m^2 average rather than between 100 and 200.
GHG will cool the atmosphere but NOT the surface. They will cause the heated surface to reach higher steady state temperatures then in a case without such gases.
I am not sure what physics you use to come up with a different view. I have empirical science on my side. What do you have on your side?
Norman links to that same site he can’t understand.
Nothing new.
Norman,
“I am not sure what physics you use to come up with a different view”
now don’t get nasty… lol
I use the laws of thermodynamics and newton… now granted my formal physics training ended long ago, so maybe those have been overturned? Funny I think I woulda heard about that… lol
N: “Only the upper atmosphere is contracting. Not the whole thing. This is reducing the drag on satellites.”
Every layer of the atmosphere sits on top of every other layer…
By my definition the TOA has constant temp and pressure…
if the total energy in is in perfect balance with the energy out, the altitude of the TOA does not change…
if temps change at the bottom of the atmosphere they lift that thermal barrier up or down… just as changes at any and all layers below the TOA do as well…
so unless the input from outside the TOA is larger than the output the total energy of the system does not change… and thus the altitude (overall) doesnt change..
but entropy dictates that the Earth MUST cool, so energy MUST move from below the surface and out the TOA.
How that energy flows to the TOA will be a matter of physics and chemistry but over planetary time scales the altitude TOA MUST decrease (barring a mass injection or some other additional input)
N:” The surface will cool much faster with no GHG than with GHG.”
Let me rephrase: The surface will cool faster (at night!) with less h20 in the atmosphere.
Agreed, for a time…!
And that will lower the pressure, decreasing the altitude of the TOA… this happens at the poles..
But as the h20 precipitates out and the ocean surface freezes… the rate at which the surface cools falls far below the rate at which humid areas cool…
then the decending supercooled air will flow across the surface until it gains enough energy to start rising again… (ugh… arctic high in Feb…. brrrr…
something similar happens to supercooled water as it decends to the ocean bottom in Antarctica…
N: “But without the DWIR the UPIR directly to space would be…”
Check out how much upward IR there is from the middle of the Arctic ice pack in Feb…
Now for a little speculation…:
If the mesopause occurs at the temp and pressure that Co2 sublimates..
and Co2 deposition has a role in the formation of notulecient clouds..
then perhaps these clouds, (like the polar sea ice), get larger or smaller as the atmosphere below (or ocean below) get warmer or colder…
Norman, you need to let go of the broken paradigm that the atmosphere warms the surface… it does not.. it cools the surface at varying rates….
less cooling is not warming
PhilJ
It is not a “broken paradigm”. Less cooling is warming if you have a continuous heat source.
Less cooling means a warmer temperature. It is not “warming” so you are correct. But with less cooling, the object that cools at a slower rate will be at a higher temperature than a similar object that is cooling at a faster rate.
Norman, tries his scam, again.
He’s frantic to make “slower cooling” into “raising the temperature”.
His failed pseudoscience continues to amuse.
JDHuffman
Slower cooling will raise the temperature of a heated object. Not sure why you think this obvious reality is pseudoscience.
Also if you have two unheated objects. Both cooling but one faster than the other, at time intervals, the slower cooling object will have a higher temperature until they both reach a steady state with the surroundings.
JDHuffman
Why not let a more intelligent poster discuss the points I bring up. Your stupid posts waste time and answer nothing. I would much rather hear from PhilJ than you. He seems to do some research on the topic. You do nothing except make unwanted comments.
Norman, you are fooling yourself again. If an object is cooling, its temperature is dropping. If something is done to slow the cooling, then its temperature just drops slower. Objects cool naturally. They do NOT warm naturally. Outside energy is required to raise the temperature of a system.
Quit trying to pervert reality.
JD, and less cooling necessarily results in a higher starting temperature on each diurnal cycle. Mean temperatures go up as a result.
Norman,
“Also if you have two unheated objects. Both cooling but one faster than the other, at time intervals, the slower cooling object will have a higher temperature until they both reach a steady state with the surroundings.”
This is demonstrably false. The moon is now cooling more slowly than the Earth is.
I can solve this riddle for you, but I think you’re capable of figuring it out. Just remember that as an object cools, the rate it cools at decreases exponentially…
bdgwx,
“JD, and less cooling necessarily results in a higher starting temperature on each diurnal cycle. Mean temperatures go up as a result.”
Again, demonstrably false. See my reply to Norman.
bdg says: “less cooling necessarily results in a higher starting temperature on each diurnal cycle. Mean temperatures go up as a result.”
Wrong again, backdoor guy. You are confused about what “diurnal” means. The solar flux does not stop just because the Earth is rotating. The same energy is still incoming to the system. You are confusing daytime/nighttime temperature differences with “global warming”.
Phil, note that I did not say that the peak temperature necessarily goes up due to insulation. I said the mean temperature goes up. It’s also important to note that the Moon’s mean temperature is higher than that on Earth even though both receive roughly the same amount of radiation from the Sun. So I don’t think Moon is an adequate rebuttal to my statement.
bdgwx,
“I did not say that the peak temperature necessarily goes up due to insulation. I said the mean temperature goes up. Its also important to note that the Moons mean temperature is higher than that on Earth”
lol… that just made my list of knee slappers…
it’s self-contradictory on its face…
p.s, the mean surface of the moon that the astronauts stood on, is LOWER than the mean surface of the Earth that you are standing on…. lol
oh, in case you don’t believe me,
“The mean temperature at the equator is 215.5 K ”
as taken from :https://www.sciencedirect.com/science/article/pii/S0019103516304869
Phil, thanks, yes. That was a typo. The mean temperature of the Moon is lower. That was my point.
By the way, I’ll use this a learning opportunity. I’ll try to proof read my posts a lot closer and not rush the submit button and bolt out the door in the future. I’ll own that. It was big gaff and totally unacceptable. For that I apologize for the confusion it caused.
bdgwx,
“Phil, thanks, yes. That was a typo. The mean temperature of the Moon is lower. That was my point.”
correction noted and accepted. And I , for my part, apologize for getting snarky (it was pretty funny!)
But don’t you see that proves my point?
The insulation above protects us from the heat source (the sun) and the insulation below protects us from the heat source (the core)
and yet entropy dictates the Earth MUST cool, without additional input..
so then are we increasing or decreasing insulation when we replace o2 with co2 and h20?
PhilJ
YOU: “But as the h20 precipitates out and the ocean surface freezes the rate at which the surface cools falls far below the rate at which humid areas cool”
That is not because of the lack of water vapor. It is because of the temperature. The rate of radiation loss is based upon the 4th power of temperature. There is a huge difference in radiant energy loss between warm humid surface at 90 F vs a cold ice surface at -30 F.
Here:
A 90 F surface would (if blackbody). Earth surface is given at above 0.9 for IR emissivity, ice is almost a blackbody IR radiator.
90 F (305 K) radiates around 490 W/m^2
-30 F (238.7 K) radiates around 184 W/m^2
The warm surface would lose rate at over 2.5 times faster than the colder area if there was no GHE.
Wrong Norman, surfaces emit based on their temperature, not the temperature of other objects.
Learn some physics.
JD, and their temperature is modulated by the net exchange of energy between other objects.
Norman,
“That is not because of the lack of water vapor. It is because of the temperature”
It’s both! see my reply above and you’ll figure it out
Wrong again, bdg. When your cup of coffee cools to room temperature, you can’t warm it with ice cubes.
Learn some physics.
JD, you can certainly bring a hot cup of coffee to a lower temperature faster by placing ice cubes in the cup though. It’s a demonstration of how one body can effect the temperature of another. Is that what you’re disagreeing with?
No clown, what I am disagreeing with is your constant attempt to pervert the laws of physics. Ice can cool a hot cup of coffee, but it can’t warm it. “Cold” does not warm “hot”, no matter how many ways you try to corrupt that simple truth.
You know where the backdoor is.
Huffingman wrote:
Your example fails to recognize the physics of a thermal radiation shield, which would “warm” said cup of coffee. Your red herring claim regarding ice ignores the fact that ice melts when placed near the hot cup, whereas other materials which also function as radiation shields would keep the coffee warm for a longer period of time, relative to a similar cup without a shield.
I presented evidence that ice would warm a heated plate, as long as the ice were kept below the freezing point, which is a result also exhibited by other materials. As usual, you continue to ignore hard evidence which refutes your bogus physics.
Swanson, maybe you missed the last sentence: “Cold” does not warm “hot”, no matter how many ways you try to corrupt that simple truth.
Huffingman continues to ignore reality, refusing yet again to discuss my latest experimental demonstration. One may wonder why this is so, though it’s obvious by now that Huffingman isn’t the least interested in objective truth, just trolling for fun (and profit??).
Swanson, you’re really having a hard time facing reality: “Cold” does not warm “hot”, no matter how many ways you try to corrupt that simple truth.
Maybe if you could find a good thermodynamics professor….
Huffingman, We’ve been round and round with your games for months and you have yet to prove my results wrong. A radiation shield will slow the cooling rate of a hot body in a cool environment. If that body is supplied with energy from an external source, adding a radiation shield will cause the steady state temperature to increase above that w/o the shield. Yet, you continue to display your ignorance of the basics of heat transfer, which are easily demonstrated in the lab, or even in your home, if you cared too.
Swanson. a properly designed radiation shield works. But, that does NOT prove that “cold” warms “hot”.
You keep trying the same old “bait and switch”.
Nothing new.
Huffingbot continues to ignore reality, even as it now agrees that thermal radiation shields can increase the temperature of a body relative to that without the shield. In so doing, it continues to misrepresent the facts regarding the physics of greenhouse gasses, which act as radiation shields in the atmosphere, but only at specific wavelengths, not broad ranges of IR as may be emitted by solid bodies.
No Swanson, that is NOT what I am agreeing to.
You clowns can’t win, based on reality. You must always twist, spin, distort and misrepresent. I’ve known some incompetent MEs in my career, but I don’t remember any being dishonest….
Learn some physics, and clean up your act.
Huffingbot wrote:
AS usual, you can’t take the time to offer a proper rebuttal to my statement, that is, if you can. Instead, you immediately denigrate me, calling call me “incompetent” and “dishonest”. So, Mister Wizzard, give us a proper reply to my posts, if you can. Don’t throw up that 3 plate cartoon again, the one with the magic green arrows from the Blue plate toward the 2 Green ones, which is clearly bogus.
Wrong Swanson, we have spent a lot of time explaining to you. You haven’t learned one thing. You want to believe “cold” can warm “hot”, so you will deny any facts and logic to the contrary.
You are the one making yourself incompetent and dishonest. Don’t try to blame others for your actions.
As explained to you, you don’t have to understand the simple diagram. It is just an easy teaching method that doesn’t violate any laws of physics. That’s different for your “incorrect solution” which increases enthalpy and decreases entropy, without adding new energy.
Here is the correct solution, in case you’ve lost the link:
https://postimg.cc/KKx5hx4H
Huffingbot’s reply is to post the 3 plate cartoon yet again, claiming that: “As explained to you, you dont have to understand the simple diagram. It is just an easy teaching method that doesnt violate any laws of physics.”. No, Huffingbot, your cartoon just shows those extra green arrows from the Blue Plate toward the Green plates. You have offered no other evidence or references which explain these, without which, you have NO PROOF. Learn some science, won’t you?
Swanson, the “extra” green arrows explain what is happening. The fact that you can’t understand demonstrates your incompetence.
Please continue.
Huffingbot wrote:
Oh Wise One, your gracious posting of the 3 plate cartoon provides a clear example of your interest in sharing your great knowledge with those of us with admitted limits in our understanding of some very complicated relationships hidden deep within modern theoretical physics. It would be most deeply appreciated if you would be so kind as to provide a physical explanation of those “Magic Green Arrows”, so that we all might also attain the necessary deep understanding to appreciate this most revealing graphic. Please also provide some peer reviewed references to back up your reply, or, better yet, some text book reference(s) so that we might be guided to see the light.
Now Swanson, you haven’t shown you have any understanding of the relevant physics. You seen dedicated to proving “cold” can warm “hot”. You clearly don’t understand photon absorp.tion or thermodynamics.
When I asked this simple question of some other clowns, they bailed. See how you do: What does the spectrum from a perfect homogeneous black body look like, at constant temperature?
Huffingbot replies to my query with another red herring. It’s said that there are no “perfect” black bodies, so a better question would be: “What does the spectrum from a homogeneous body with emissivity of 95% look like, at constant temperature?”. I suppose even you could answer that real world question, MR. Wizzard.
Anyway, you must explain your “Magic Green Arrows” in you cartoon, if you really want to be believed.
Swanson’s busted again.
Since Huffingbot / DRsEMT are a little slow on the draw, allow me to present the current physics reply to the previous question:
https://quantummechanics.ucsd.edu/ph130a/130_notes/node48.html
It’s not my field, so you all will need to refute that stuff by your selves. I’ve got a truck to work on…
#2
Swanson’s busted again.
See: Planck’s Law
No “Magic Green Arrows” allowed.
#3
Swanson’s busted again.
Thanks for admitting that this is not your field, Swanson.
Honesty is good.
Hope you get your truck fixed. I drive a Tundra, so it never needs fixing….
JDHuffman
I guess you could not ignore my comments. As I stated you scour the blog looking for my good empirical post and then you post something that resembles a person taking a dump and wanting everyone to look at what they accomplished.
Take your dump and then announce it and hope people come over to see what you did in the toilet.
You really are a dumb person. Hopelessly stupid and stuck there.
Can you at least attempt to understand what the empirical data is saying or are you just content to dump your load and move on looking for another poster to leave your mess on.
Norman, that load I dumped on your head might just be reality.
JDHuffman
No your dumps are not reality. You make up stuff and think it is real. You can’t support any of your claims. If you did any experiments your flaws would be obvious.
When you feel like discussing reality that would be interesting and different. Not waiting for this to happen. You will continue to peddle your unfounded junk science.
Norman, that load I dumped on your head might just be reality.
JDHuffman
The inner child emerges…when you are hopelessly defeated in debate you go about repeating yourself.
When logic and reason are not your best assets, why not just repeat yourself. Try to fake your way through your muddled mess of pretending to understand physics.
I think most people know you are a phony. Some still play with you.
Norman, that load I dumped on your head might just be reality.
The Amish: a model to prevent AGW. Perhaps we are looking at the wrong data.
https://www.alansfactoryoutlet.com/a-guide-to-the-amish-way-of-life
More facts for clowns to deny:
Morning partly cloudy, directly overhead –> 21.3 °F (well below freezing)
Cloud, almost overhead–> 37.9 %deg;F
Ground –> 78.6 °F
“It is not a broken paradigm. ”
Of there’s one thing I’ve learned from Copernicus:
It’s that even if all your math and physics is correct…
If your model is built on a flawed assumption….
All of your ‘epicycles’ wont make it work…
I dont understand how the temp for June can be +.47 when Climate Reanalyzer has been showing it +.3 to even -.1 daily. I dont think it ever cracked +.4. Anyone please explain. Is Climate Reanalyzer untrustworthy?
Do you mean this?
https://climatereanalyzer.org/wx/DailySummary/#t2anom
This is
– 2 m above surface, and not 4-5 km above it
– relative to the mean of 1979-2000, and not 1981-2010.
ES,
” which also function as radiation shields would keep the coffee warm for a longer period of time, relative to a similar cup without a shield.”
Bingo!
Now instead of ice, but the Sun outside that insulated container….
More insulation means cooler surface..
“Now instead of ice, but the Sun outside that insulated container….”
** crickets **
PhilJ wrote:
Not if the insulation doesn’t effect the incoming short wave radiant energy from the Sun. The Greenhouse gases are most effective in the long wave region of IR EM spectrum. That’s the difference.
ES,
“Not if the insulation doesnt effect the incoming short wave radiant energy from the Sun.”
But it does!! oxygen is your insulator! and its limiting factors are the supply of atomic oxygen from above and o2 from below; as well as uvb and uvc input from above….
Increasing co2 at the mesopause INCREASES the atomic oxygen falling back to the stratopause
by the way… co2 levels are rising faster at the mesopause than at the surface… im sorry dont have the link handy..,.
PhilJ
The UV energy in the solar input is not that much. 10%. Of that about 3% still reaches the ground.
Of the 1367 W/m^2 UV makes up a total of 136.7 W/m^2 Less than the DWIR.
https://ag.tennessee.edu/solar/Pages/What%20Is%20Solar%20Energy/Sunlight.aspx
The Climate Scientists have not ignored what you bring up. It is included in the energy absorbed by the atmosphere.
https://upload.wikimedia.org/wikipedia/commons/thumb/b/bb/The-NASA-Earth%27s-Energy-Budget-Poster-Radiant-Energy-System-satellite-infrared-radiation-fluxes.jpg/450px-The-NASA-Earth%27s-Energy-Budget-Poster-Radiant-Energy-System-satellite-infrared-radiation-fluxes.jpg
Norman,
“The UV energy in the solar input is not that much. 10%. Of that about 3% still reaches the ground.”
Ah, but that percentage changes with changing ozone levels…
N: “Of the 1367 W/m^2 UV makes up a total of 136.7 W/m^2 Less than the DWIR.”
3% of 136 is about 4w/m2 if this value rises to 5% we’re up to 6.8…. if it drops to 1% we’re down to 1.4 … (note DWIR is immaterial)
Thats a swing of over 5 w/m2 of solar insolation at the surface….
N: “The Climate Scientists have not ignored what you bring up. It is included in the energy absorbed by the atmosphere.”
on the contrary, they have ignored it almost completely…
while there are lots of studies on the effects of increased UV exposure on life there are none (that I can find) on its effect on ocean temps. The only thing I can find that even hints at this connection is the work by Dr. Ward on ozone depletion…
Phil, the IPCC considers ozone in their physical science basis report. They conclude that it does contribute to the warming, but the magnitude is not enough to explain all of it.
bdgwx,
” the IPCC considers ozone in their physical science basis report. They conclude that it does contribute to the warming, but the magnitude is not enough to explain all of it.”
no , no no no…
I am not saying that ozone warms/cools the surface but that UV does!
More specifically uvb, as uvc is completely absorbed in the stratosphere…
the concentration of ozone in the stratosphere determines how much uvb is absorbed at the surface and how much by the atmosphere… wherever that uvb is absorbed, there will be heating…
I’ll continue in my response to you on the other thread..
Say you had 1 meter diameter spherical rock. And it was warmed by radioactive decay- it had radioactive material within the rock.
The amount of heat generated will measured by putting in a room with 1 atm of air was 10 C and temperature of the surface of rock was 26 C.
If rock was completely insulated, surface of rock could become much hotter [hundreds of degrees or thousands of degrees- there is no practical limit- and depends on particular details of how it’s made, etc].
And roughly if put rock in say 26 C water, the rock surface surface would be about 26 C. And if put in 10 C water, rock surface would be about same temperature of water.
So what saying is rock surface is 26 C when air is 10 C- and not saying, yet, how warm it can warm the air up to.
Or if air was 0 C, the rock surface would be cooler than 26 C and if air was 20 C, rock surface would warmer than 26 C.
So put the rock in a big room. It will crazy room, which 10 meter radius sphere. And rock going in the middle, so it’s 9 1/2 meters from the walls of room. It’s not going to float, so resting pillar which 9 meter high and resting on the floor. And top of pillar one has some cradle to hold the rock sphere. Room has two doors. One in ceiling directly above the rock and door on side with walkway [or catwalk] leading to the rock from the door. But otherwise it is a large empty room. And room going to insulated enough so the air is kept about 10 C and the rock surface is kept at 26 C.
And the air outside the room is somehow always about 0 C.
And if you open the ceiling and side door, the air inside the sphere will cool so it’s lower than 10 C. And shut both the doors and the air warms back up to 10 C.
Now, one can insulate this room a number of different way. One way might be to mainly having room sealed- or don’t have door at the top, open. But you might able to have it insulated enough, that you could leave a small door opened in the ceiling. And could insulate it enough so as to make the air temperature in the room higher than 10 C.
Or perhaps can make air in room be 100 C [and rock surface would higher temperature than 100 C- unless you are imagining some ideal or magical insulation could heat everything up to 1000 C.
Say, we going to insulate the walls of sphere by using double pane windows.
Now one could ask, if we want air to be 10 C, could it be single pane, or do we need triple pane windows. And does it matter how thick the glass is or is some plastic a better window pane.
Perhaps we should a coating to reflect IR light.
Let’s start by have 1/2 of sphere buried. So looking at as you approach, you see a hemispheric dome. Burying 1/2 of it, will give it pretty good insulation [and any windows down there would be silly].
Anyhow if upper dome is equally insulated, one should expect warm air the rise and cooler air to go lower. Warmer air is more buoyant- and I didn’t specifically mention it, but the sphere is in 1 gravity [the buoyancy force doesn’t exist in zero gravity, and is stronger in 2 gees, and weaker if 1/3 gee].
If top part of upper dome is better insulate than rest of hemisphere, there will be more difference of warmer air being higher. So you could consider only putting the double or tripe panes in upper part of hemisphere.
Anyhow a point of this is, do you have any significant radiant energy reaching the wall of the dome from the heated sphere.
Also another interesting question is if air is cooler or warmer than 10 C, does that effect how radiant energy from the sphere is reaching the walls.
And/or does the air itself less than 1 meter from walls cause much radiate energy to reach the walls [and/or pass thru the windows].
–“The hypothesis, however, has a big catch,” explains Friedhelm von Blanckenburg of GFZ. “If the atmosphere had actually lost as much CO2 as the weathering created by erosion would have caused, it would hardly have had any CO2 left after less than a million years. All water would have had frozen to ice and life would have had a hard time to survive. But that was not the case.”
That these doubts are justified, was already shown by von Blanckenburg and his colleague Jane Willenbring in a 2010 study, which appeared in Nature likewise. “We used measurements of the rare isotope beryllium-10 produced by cosmic radiation in the Earth’s atmosphere and its ratio to the stable isotope beryllium-9 in ocean sediment to show that the weathering of the land surface had not increased at all,” says Friedhelm von Blanckenburg.–
https://wattsupwiththat.com/2019/07/06/more-reactive-land-surfaces-cooled-the-earth-down/
And ends:
“However, a geological process is needed to rejuvenate the land surface and make it more ‘reactive’,” says Friedhelm von Blanckenburg.”This does not necessarily have to be the formation of large mountains. Similarly, tectonic fractures, a small increase in erosion or the exposure of other types of rock may have caused more material with weathering potential to show at the surface. In any case, our new hypothesis must trigger geological rethinking regarding the cooling before the last ice age.”
That Co2 levels were reduced by weathering seems disproven.
I got to remember that so I don’t make that mistake again.
So, why are global CO2 levels so low, if not from millions of years of increased weathering?
The obvious to thing to point to is your cold oceans.
But maybe it had to do with how cold our ocean got,
Or in last couple million years our reach average temperature of 1 C. In terms tens or hundreds of millions of years, an ocean getting average volume temperature being as cold as 1 C, seems extraordinary.
So is anything about such an extraordinary circumstance which would cause the entrapment of vast amounts of CO2?
Maybe something like vast regions in deep ocean which have methane hydrates deposits.
Or there less potential value of deeper hydrates deposits. Plus they say 90% of ocean remains not mapped and unexplored. Or if interested in possible methane hydrate deposits the economic value favors looking in shallower ocean, but it doesn’t mean Nature only puts methane hydrate deposits in a small region of ocean which is shallower. Or the shallower methane hydrate deposits have a lot CO2 trapped with them, perhaps deep deposits have less methane and more CO2?
Then of course, we have some lakes of CO2 at the ocean floor and maybe having very cold ocean is related to increase production as compared to a ocean which was 3 C or warmer.
link:
“The thought of liquid CO2 conjures up different things to different folks: perhaps the decaffeination of coffee beans, perhaps the recently popularized green method for dry cleaning, or even phase diagrams that occupied a part of one’s life in past chemistry classes. What it does not conjure up is a subsurface lake at the bottom of the ocean, a lake with abundant living microbes, as reported in this issue of PNAS by Inagaki et al. (1). These authors discovered such a place near the Yonaguni Knoll in the Okinawa Trough at a depth of ≈1,400 m. The description in both words and video (see supporting movie 1 in ref. 1) is quite striking. First, because liquid CO2 at this depth is less dense than water (2, 3), so that such a lake should not be present. Second, because this is a phenomenon that few of us have ever seen, movie 1 in ref. 1 reveals a flowing stream of liquid CO2 that seems almost surreal.”
https://www.ncbi.nlm.nih.gov/pmc/articles/PMC1599885/
thanks for the link! That’s some neat stuff…
Agreed. That is pretty cool.
gb,
“That Co2 levels were reduced by weathering seems disproven.
I got to remember that so I dont make that mistake again”
Co2 levels were reduced by LIFE!!
Good thing too or would have run out of oxygen long ago…
–PhilJ says:
July 6, 2019 at 4:03 PM
gb,
That Co2 levels were reduced by weathering seems disproven.
I got to remember that so I dont make that mistake again
Co2 levels were reduced by LIFE!!
Good thing too or would have run out of oxygen long ago—
Well, we have 5.1 x 10^18 kg of atmosphere
about 20% is O2, or about 1.0 x 10^18 kg or
1.0 x 10^15 tons or 1000 trillion tonnes of Oxygen.
And few trillion tonnes of CO2 in our atmosphere.
The problem with LIFE doing it, is that millions of years we had
less LIFE.
Or you get less life in an Ice Age as compared to most of time in last couple hundred million, of not being in an Ice Age.
Our Ice Age makes a lot land area deserts and grassland. Trees apparently are large biomass and they store a lot CO2- or wood is carbon. So our Ice Age has killed a lot ancient forests.
Or our most ancient forests are in the tropics, and our Ice Age doesn’t have much effect upon our tropics {except parts of Africa and Aussieland.
Though killing all those trees may have lowered CO2 levels. Or Forest store lots of carbon and is exhaling CO2 at night. If get rid of the reservoir, it goes elsewhere [like the bottom of the ocean].
“Trees apparently are large biomass and they store a lot CO2- or wood is carbon. So our Ice Age has killed a lot ancient forests.”
Indeed! and a lot of the sequestered carbon is now coal, oil and gas….
(although I have read that some of the oil and gas may be inorganically produced as well… coal though is definitely biomass…)
How much co2 is sequestered in coal?
“How much co2 is sequestered in coal?
Of course that should be ‘how much carbon is sequestered in coal… The o2 was released…
This is interesting article on the Moon/Apollo program:
https://www.smithsonianmag.com/science-nature/what-you-didnt-know-about-apollo-11-mission-fifty-years-ago-180972165/
In my opinion it gets a lot things right.
Which would summarize as Apollo was a stunt, PR and it was weapon or tool used in the Cold War. And it was a cheap and effective means of winning the Cold War.
And Cold War was very costly. The Soviets caused global poverty, which one the worst things the Soviet did, and they did some really horrible things [murdering tens of millions of people, and etc, etc. And their damage is still lingering or effecting the present world].
So it was very good thing to end the Cold wars, despite the new problems, we might not have had, if it continued.
Anyhow, the smell of lunar dirt:
“No one has quite figured out what caused the odor to begin with, or why it was so like spent gunpowder, which is chemically nothing like Moon rock. Very distinctive smell, Apollo 12 commander Pete Conrad said. Ill never forget. And Ive never smelled it again since then.
And:
As they repressurized the cabin, they watched to see if the dirt started to smolder. If it did, wed stop pressurization, open the hatch and toss it out, Aldrin explained. But nothing happened.
Well I would say that lunar dirt was highly oxygenized, so would not burn in oxygen environment.
But it might react to a nitrogen environment.
Oh, this story was linked:
https://pjmedia.com/instapundit/
And I see Rand Simberg also talking about it:
http://www.transterrestrial.com/
Who says:
–I’m reading Roger Launius’s new book, in which he talks about four perspectives of Apollo. I noted to him privately that there was a fifth, that he didn’t address:
I felt a little left out. I think I represent a fifth perspective, in that I believe that Apollo was both necessary and not a waste of money for what it accomplished (a major non-military victory in the Cold War), but that it set us back in human spaceflight for decades (and continues to do so, as witness the current ongong Artemis fiasco).
He didn’t disagree.–
I agree Apollo had a unwanted side effect of delaying space exploration after Apollo.
And Apollo was not really about exploration, but it did have great results from the exploration that Apollo did.
Apollo caused confusion and pushed NASA down a wrong path.
Apollo was great success, but as analogy, a great success can also “ruin your life”. Or tends to make you focus on the wrong things.
Where is all this warm weather after 10 warm some very warm summers we are having a cool summer here in the Pacific northwest
For the month of June it was in Alaska, Europe, Siberia, and the Arctic region at least in the NH. Those regions had the highest positive 2m temperature anomalies. Arctic sea ice is at a record low right now.
dc
the is Roget war
no