Record High Temperatures in France: 3 Facts the Media Don’t Tell You

July 2nd, 2019 by Roy W. Spencer, Ph. D.

News reporting of the recent heat wave in France and other European countries was accompanied with the usual blame on humans for causing the event. For example, here’s the CBS News headline: Record-breaking heat is scorching France. Experts say climate change is to blame.

While it is possible that the human component of recent warming might have made the heat wave slightly worse, there are three facts the media routinely ignore when reporting on such “record hot” events. If these facts were to be mentioned, few people with the ability to think for themselves would conclude that our greenhouse gas emissions had much of an impact.

1. Record High Temperatures Occur Even Without Global Warming

The time period covered by reliable thermometer records is relatively short, even in Europe. Due to the chaotic nature of weather, record high and record low temperatures can be expected to occur from time to time, even with no long-term warming trend.

The question is, are the number of record high temperatures increasing over time? At least in the U.S., the answer is ‘no’, as the number of days over 100 and 105 deg. F have not increased (see Fig. 5 here). One would need to study the data for Europe to see if the number of record highs is increasing over time.

Then, even if they are increasing, one needs to determine the cause. Most of the warming since the Little Ice Age (up to about 1900) occurred before greenhouse gases could be blamed. We have no temperature measurements during the Medieval Warm Period of 1,000 years ago. How hot were some of the summer days back then? No one knows. Weather changes, which leads me to my next point.

2. Summer Heat Waves are Weather-Related, and Unusual Cold is Usually Nearby

The recent excessive heat in Europe wasn’t caused by summer air sitting there and cooking in a bath of increased human-emitted carbon dioxide. It was caused by a Saharan Air Layer (SAL) flowing in from that gigantic desert to the south.

This happens from time to time. Here’s what the temperature departures from normal looked like at ~ 5,000 ft. altitude:

Fig. 1. GFS model depiction of the 850 hPa level (about 5,000 ft. altitude) temperature departures from normal at midday 29 June 2019, showing a hot Saharan air mass that had flowed north over western Europe, as a cold arctic air mass flowed south over eastern Europe. (Graphic courtesy of WeatherBell.com)

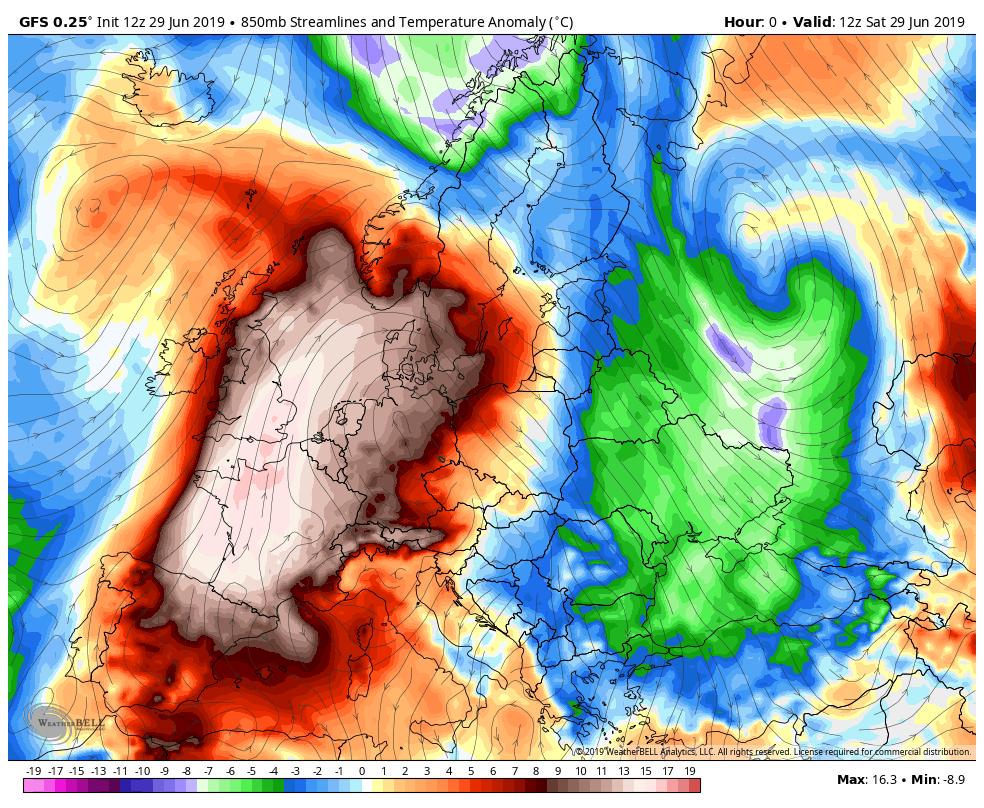
The SAL event flowed north from the Sahara Desert to cover western Europe while a cold air mass flowed south over eastern Europe. As evidence of just how large natural weather variations can be, the full range of temperature departures from normal just over this small section of the world spanned 25 deg. C (45 deg. F).

Meanwhile, the global average temperature anomaly for June (from NOAA’s Climate Forecast System, CFSv2 model) at the surface was only +0.3 deg. C (0.5 deg. F), and even for one day (July 1, 2019, from WeatherBell.com) remains at +0.3 deg. C.

Do you see the disparity between those two numbers?: weather-related temperature variations of 45 deg. F versus a climate-related global average “warmth” of only 0.5 deg. F.

Here’s what the situation looked like at the surface:

Fig. 2. As in Fig. 1, but for surface air temperature.

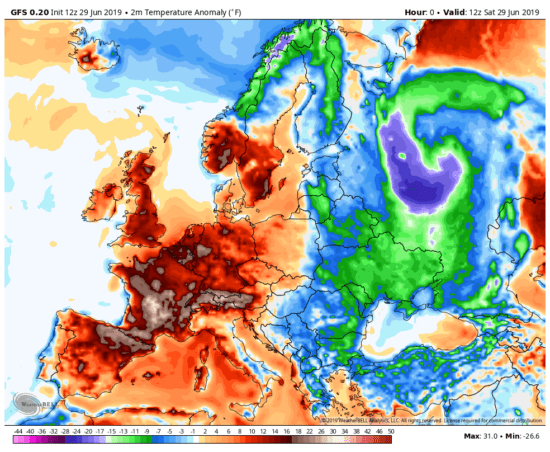
The range in surface air temperature departures from normal was was 32 deg. C (about 58 deg. F), again swamping (by a factor of 100) the global “climate” warmth of only 0.5 deg. F.

Thus, when we talk of new temperature records, we should be looking at normal weather variations first.

3. Most Thermometer Measurements Have Been Spuriously Warmed by the Urban Heat Island Effect

I am thoroughly convinced that the global thermometer record has exaggerated warming trends due to the Urban Heat Island (UHI) effect. When natural vegetation is replaced with buildings, pavement, and we add spurious heat sources like air conditioning units, cars, and ice cream trucks, the microclimate around thermometer sites changes.

Many of us experience this on a daily basis as we commute from more rural surroundings to our jobs in more urban settings.

For example, Miami International Airport recently set a new high temperature record of 98 deg. F for the month of May. The thermometer in question is at the west end of the south runway at the airport, at the center of the Miami-Ft. Lauderdale metroplex. Only 120 years ago, virtually no one lived in Miami; in 1896 it had a population of 300.

The UHI effect is so strong and pervasive that it is now included in the GFS weather forecast model, and in the case of Miami’s recent hot spell, we see the metroplex at midnight was nearly 10 deg. F warmer than the rural surroundings:

Fig. 3. GFS surface temperature analysis for around midnight, 28 May 2019.

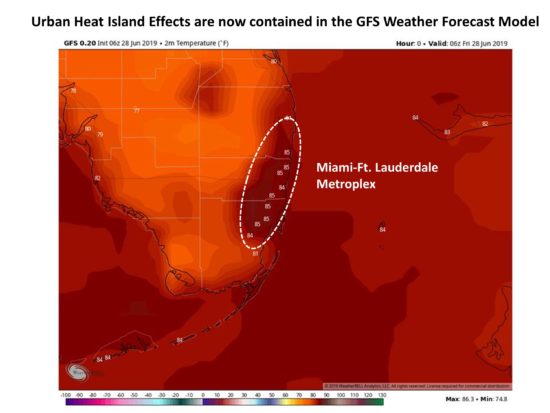
When a thermometer site has that kind of spurious warming at night, it’s going to produce spuriously warm temperatures during the day (and vice versa).

The most thorough analysis of the UHI effect on U.S. temperature was by Anthony Watts and co-authors, who analyzed the siting of hundreds of thermometers around the U.S. and showed that if only the best (most rural) sited thermometers are used, U.S. warming trends are roughly cut in half. Curiously, they found that the official NOAA-adjusted temperature data (which uses both urban and rural data) has even more warming than if no UHI adjustments were made, leading many of us to conclude that the NOAA UHI adjustment procedure has made the rural data look like urban, rather than the other way around as it should be.

How does this impact the recent record high temperatures in France? There is no question that temperatures were unusually hot, I’m only addressing the reasons why high temperature records are set. I’ve already established that (1) record high temperatures will occur without global warming; (2) weather variations are the primary cause (in this case, an intrusion of Saharan air), and now (3) many thermometer sites have experienced spurious warming.

On this third point, this MeteoFrance page lists the temperature records from the event, and one location (Mont Aigoua) caught my eye because it is a high altitude observatory with little development, on a peak that would be well-ventilated. The previous high temperature record there from 1923 was beat by only 0.5 deg. C.

Some of the other records listed on that page are also from the early 20th Century, which naturally begs the question of how it could have been so hot back then with no anthropogenic greenhouse effect and little urban development.

The bottom line is that record high temperatures occur naturally, with or without climate change, and our ability to identify them has been compromised by spurious warming in most thermometer data which has yet to be properly removed.


1,595 Responses to “Record High Temperatures in France: 3 Facts the Media Don’t Tell You”

Toggle Trackbacks

  1. Olof Reimer says:

    Yes, new temperature records would occur in a non changing climate also, but with gradually rising average temperature this happens more often. Hundred year events events become 30 year events and later 10 year events..
    I also believe that spurious heat records were more likely to occur in the old days. The sitings were not always carefully chosen, and the equipment more prone to spurious solar heating.

    Copenicus climate change service has a good piece on the recent European heat. According to the ERA5 reanalysis is it the hottest June on record in Europe and globally. Is this June the hottest on record in the TLT layer as well?
    https://climate.copernicus.eu/record-breaking-temperatures-june

    • Olof,

      I think you are correct about spurious heat records in the old days, although I’m not sure they were more likely in the past because there are many more monitors now. Thus, even if the rate per site was higher in the past, the total number will be much larger now because of the huge number of sites now versus then.

      Also, in thinking about frequency of extreme events, it seems to me that if you follow 1,000 widely spread locations around the globe you will see a 1 in 1,000 year event at one location, a 1 in 500 year event at two locations, a 1 in 200 year event at five locations, a 1 in 100 year event at ten locations, a 1 in 50 year event at 20 locations, and a 1 in 20 year event at 50 locations, almost every year. And this includes temperature as well as precipitation extremes. Consequently, very extreme events should happen somewhere around the globe every year and this is perfectly normal. To statistically determine a trend in extreme events with good confidence could take many decades with many well sited monitors.

    • Olof, this June was 2nd warmest globally in UAH TLT, behind 1998.

      BUT in the U.S., May/June 2019 was the 4th coldest of the last 41 years.

      1) Your claim about increasing number of high temperature records, I already showed that it’s not true for the U.S. Has a similar analysis been done for Europe? (and have the data been adjusted for UHI?)

      2) Your claim about spurious warming in old temperature data is just an assertion, while I pointed you to actual observational evidence of spurious warming in modern temperature measurements due to UHI.

      3) Your claim about “hottest” June on record is qualitative…I’ve already addressed the *quantitative* value, which is tiny compared to weather variations such as a Saharan Air Layer intrusion, as happened in France. Here’s the June map from CFSv2 showing the wide range of positive and negative anomalies from around the world: http://www.drroyspencer.com/wp-content/uploads/ncep_cfsr_t2m_anom_062019.png . Furthermore, it’s not obvious that any of the reanalyses (or operational global analyses) have corrections for the urban heat island effect over time.

      You seem to have ignored the main points of my post which makes me wonder whether you actually read it.

      • Dr Myki says:

        Roy, you will have to do more than claim that US days over 100 or 105 have not changed. Meehl et al. (2009) found that currently, about twice as many high temperature records are being set as low temperature records over the conterminous U.S. (lower 48 states) as a whole.

        Meehl, G.A., C. Tebaldi, G. Walton, D. Easterling, and L. McDaniel, 2009: Relative increase of record high maximum temperatures compared to record low minimum temperatures in the U.S. Geophysical Research Letters, 36, L23701, doi:10.1029/2009GL040736.

        • Dr Myki says:

          “In the United States, the most recent decade (2000-2010) was the nations warmest on record. Record-breaking high temperatures are now outnumbering record lows by an average decadal ratio of 2:1. Record highs are occurring more often than record lows due to climate change.”

          In a stable climate, the ratio of new record highs to new record lows is approximately even. However in our warming climate, record highs have begun to outpace record lows, with the imbalance growing for the past three decades. This trend is one of the clearest signals of climate change that we experience directly.”
          https://www.climatesignals.org/data/record-high-temps-vs-record-low-temps

          • Dr Myki believes in the unicorn of stable climate when we live in a world of ever changing climate.

            Are you so naive you believe that there is the same attention to events that oppose climate alarmism as to events that support the narrative.

            My guess is that you do not have an open mind that would allow you to spend time on the climate realist sites to learn what is and what is not going on.

            Since you are a true believer I would like your take on since the entire theory that CO2 effects the temperature is based on the relationship between temperature and CO2 levels in ice cores. The theory is based on the premise that CO2 leads the temperature. The ice core data ALL say CO2 lags temperature by 300 to 500 years.
            Why do you believe in the hoax, except that the sources you trust are playing you for a gullible fool. Try real science sites!

            Start with “watts up with that” and from there you will find links to other science sites.
            Your entire belief is based on appeals to authority and has nothing to do with science.
            In science you pay scientists to prove your theory wrong and if no one can, it is considered science. In climate change , like all propaganda, you pay scientists to prove your theory right.

            Lastly issues of science do not fall along political lines.

            You may have a Phd, but you clearly have not put on your thinking cap on this subject.

            Have you though about when the halcyon warming we are in will end??? We are 12,000 years into the current warming period. previous warmings historically have lasted an average of only 10,000 years.

            Look at a chart of the last 1.8 million years and consider what you see.

          • Dr. Myki

            Quack, quack !

            The 1930’s were the warmest U.S. decade.

            That’s why so many states set all-time heat records in the 1930s and only two, of 50, set all-time heat records in your beloved 2000 – 2010 decade, to 2009

            NASA-GISS didn’t like the hot 1930’s , so arbitrarily changed the historical data.

            By the time they finish adjustin’, and re-adjustin’ and re-re-adjustin”, the 1930s will have changed from the “Dust Bowl”, to the “Snow Bowl”.

            That’s science fraud, but common for the climate change cult (people like yourself)

          • Here’s a link to US state temperature extreme records.

            Where are all the heat records in the 2000 to 2010 decade ?

            In your imagination, Doc (say hi to your horse patient for me).

            https://en.wikipedia.org/wiki/U.S._state_temperature_extremes

          • Fritz Kraut says:

            Richard Ferris says:
            July 5, 2019 at 4:39 PM

            “…the entire theory that CO2 effects the temperature is based on the relationship between temperature and CO2 levels in ice cores.”
            _________________________________________

            You are wrong informed by your “realist” sites.
            Greenhouseeffect isnt based on any observed correlation.
            It was known long before Global Warming started, and long before any data fom icecores did exist.
            Its based on wellknown laws of physics.

          • Bart says:

            “Its based on well known laws of physics.”

            The laws of physics allow it, but there are countervailing influences. Radiative exchange is not the only factor that establishes surface temperatures.

          • bdgwx says:

            RG said…”By the time they finish adjustin, and re-adjustin and re-re-adjustin, the 1930s will have changed from the Dust Bowl, to the Snow Bowl.”

            Umm…what? No. That’s not even remotely close to being correct. GISS adjusted the 1930’s data alright. The net effect of global adjustments to the raw data made the 1930’s WARMER; not cooler. Their adjustments are in the public domain. You are free to review them. If you still think they are flawed then you’re going to have to live with the fact that the warming since the 1930’s is even more pronounced than their official statements.

          • Bill Hunter says:

            bdgwx says: “Umm…what? No. That’s not even remotely close to being correct. GISS adjusted the 1930’s data alright. The net effect of global adjustments to the raw data made the 1930’s WARMER; not cooler. Their adjustments are in the public domain. You are free to review them. If you still think they are flawed then you’re going to have to live with the fact that the warming since the 1930’s is even more pronounced than their official statements.”

            Ummm sort of depends upon which round of adjustments you are looking for for which record. With the pause and all there was a need to reduce early 20th century warming so it didn’t continue to match the recent warming. Each adjustment has a targeted need that arises out of observations. Observations obviously have to be in accordance with settled science. . . .no?

          • bdgwx says:

            Bill, you’re arguing that the adjustments are done to satisfy an agenda instead of making the dataset more correct. Let’s ignore the obvious hint of conspiracy think here for a moment…the indictment that it is agenda based isn’t even true. If you disagree with any adjustment made then point it out, describe how it is wrong, and describe how you would do it better.

          • Bill Hunter says:

            bdgwx says: Bill, youre arguing that the adjustments are done to satisfy an agenda instead of making the dataset more correct.
            ———–

            Largely a strawman you are erecting there bdgwx. I think agendas and personal biases are in everything.

            The best way to avoid having agendas and biases screw the system up is to avoid having monopolist/socialist-like biases and agendas amplify specific biases and agendas. World wide monopolist/socialistic agendas and biases have far more effect than they have here in the US. |And that is a very good thing. But its eroding away under the weight of growing government and the concentration of funding power with the most powerful. Certainly the private sector is capable of monopoly power also and explains why we have anti-trust laws.

            bdgwx says: Lets ignore the obvious hint of conspiracy think here for a momentthe indictment that it is agenda based isnt even true. If you disagree with any adjustment made then point it out, describe how it is wrong, and describe how you would do it better.
            ——-

            LOL! Yea nothing going on here folks just move along. The naivete soup here is so thick you have to cut it with a knife.

          • Bill Hunter says:

            bdgwx says: – Bill, youre arguing that the adjustments are done to satisfy an agenda instead of making the dataset more correct. Lets ignore the obvious hint of conspiracy think here for a momentthe indictment that it is agenda based isnt even true. If you disagree with any adjustment made then point it out, describe how it is wrong, and describe how you would do it better.
            ————

            I thought your comment was so far off target it deserved more comment.

            I have not hinted at conspiracy (except in the case of climategate which is a longterm temperature proxy). There may be more conspiracies but I am not hinting at that in any way shape or form.

            I am making on simple point. Kevin Trenberth a man of great influence on the receipt of funding for climate change work declared that it must be the temperature records were wrong when he talked about the travesty of the pause. Not for one second do I believe that Kevin Trenberth believes anything different.

            Further, I believe Kevin Trenberth might be right. However, I see that as an improbability. Additionally, the climate models have been annoited as settled science using well established physics calculations to estimate the effect of emissions on climate. I not for one second believe that Trenberth does not believe that. And I am certain its not true, but I can see why somebody might think it is as the concept has a certain intuitiveness to it. But intuitive use of physics isn’t always appropriate. But I am sure Trenberth believes it is.

            So is it a conspiracy to dangle money like a fisherman with an anchovy on a hook in front of scientists willing to tackle the morass that the temperature record is? Gee, NO! That is done everyday for every science grant program out there. Its the life blood of capitalism and even relied upon in socialism except in socialism it isn’t always money that’s offered.

            Did the respondees commit fraud? I don’t believe that for one second either.

            So here you are climate models are screaming the temperature record is too cold or whatever, too hot in the early 20th century when there were few emissions or whatever. Somebody takes the grant and bias is ensured because the researcher is going to favor all adjustments he can find that fixes this discrepancy and kind of pooh pooh as unlikely (like I am doing to their choices for action or the opposite of what your doing in support of their choices) We can look at this from a thousand angles. Bias is guaranteed. . . .but bias is just intuition! And if the intuition about the models is correct its likely the intuition about the temperature record is too.

            And dang its all been annoited as settled science and the best science available so for not one second does anybody think they are doing anything wrong. . . .and they aren’t! they are just biased. . . .a perfectly normal human condition.

        • Dr Myki
          I hope you are better at being a doctor than you are at being a climate scientist !
          .
          .
          .
          — Only 1 US state temperature heat record was set after 1995, but 6 US state cold records were set after 1995 (my source data was from Wikipedia, earlier in 2019)

          http://elonionbloggle.blogspot.com/2019/04/us-state-temperature-records-only-1.html
          .
          .
          .
          — Not one continent has set an all-time heat record since 1977
          (my source data was from 2012 — maybe something has changed since then?)

          http://elonionbloggle.blogspot.com/2019/04/continent-heat-records.html

          • Dr Myki says:

            huh?
            Did you read the published articles I cited? No.
            Can you refute their conclusions? No
            Do you ever question the reliability of anonymous blog posts? No
            Sorry. That is why I am a Dr and you are not.

          • Dr. Myki:
            I will assume from your nasty bedside manner, that you are a specialist, most likely a horse podiatrist.
            .
            The United States in 2019, January through June, had the coldest and wettest january through June on record.

            https://elonionbloggle.blogspot.com/2019/07/2019-had-coldest-and-wettest-us-january.html
            .
            .
            .
            ,
            Repeating data from my prior comment that you ignored, like the quack you are:

            (1)
            Since 1995 there were 7 US state temperature records set:
            6 states set cold records
            Only 1 state set a heat record

            https://elonionbloggle.blogspot.com/2019/04/us-state-temperature-records-only-1.html

          • Lewis guignard says:

            Dr. Myki,

            The reason you are a Dr. is, assuming you truly are one, is because you did as you were told and, additionally studied, relatively hard, for a period of time. At the end of that time you were awarded a certificate telling you what a good boy you were.

            No more, no less.

            Since then is what matters to the rest of the world.

          • Dr Myki says:

            RG, Still no published studies I can look up.
            Just “blogspots”.
            Try harder.

            LG,thanks for your comment but my PhD was based on research – not rote learning.

          • Dr Roys Emergency Moderation Team says:

            Myki, please stop trolling.

      • Olof Reimer says:

        Well, I just said that temperature records will be more likely when the average temperature increases.
        And the experts in the field try to estimate how much more likely:
        https://www.worldweatherattribution.org/human-contribution-to-record-breaking-june-2019-heatwave-in-france/

        UHI is a part of the anthropogenic global warming, but UHI affected temperature readings should of course not be allowed to affect rural areas where UHI isn’t present, when contructing regional or global averages.
        I would take that Watts study with a pinch of salt, it’s not peer-reviewed and based on “secret” stations. On the other hand, the Berkeley Earth team has demonstrated that the UHI effect is slightly negative since the 1950ies. Also, the CONUS temperature trend (since 2005) reported by the “rural” USCRN network is 0.12 C/decade higher than that of the big adjusted mixed rural/urban ClimDiv network.

        ERA5, if any reanalysis, it is the most modern, should have spatial info on urbanisation. It also ingests satellite IR readings of the surface.
        Anyway, I suggest that the effect of urbanisation on tmax should be studied using airborne high resolution thermography (flewn in the hottest summer afternoons of course).

      • Bart says:

        It is important to remember that an increasing GHE is not supposed to be associated with higher highs so much as higher lows.

      • Blaz says:

        But even your graph shows a slowly warming earth…it makes complete logical sense that if the bell curve shifts to the right, then you WILL expect more,hotter heatwaves… the heatwave in France is just an example of this.

    • Ice core studies identified mild, harmless climate cycles of warming followed by cooling.

      The cause of those cycles is unknown, and doesn’t even matter, because they are harmless.

      There has been a mild intermittent warming cycle since the late 1600s.

      Compilations of real-time global average temperatures started DURING that warming cycle.

      With all global average compilations made DURING a warming cycle, we should EXPECT frequent “record highs” until the warming cycle ends, and a cooling cycle begins.

      There is no logical reason to get excited about record highs — when we stop having them, that might be the tine to get excited — because that will mean we are in a cooling cycle, and people will soon realize that a warming cycle is more pleasant than a cooling cycle.

      In the junk science of climate alarmism, any excuse to wave one’s arms and declare the world is coming to an end, is good enough.

      Record heat in France = headlines everywhere ! … but … Several old newspapers list hotter French temperatures in 1930 and 1773:

      https://elonionbloggle.blogspot.com/2019/07/the-june-28-2019-french-heat-record-is.html
      .
      .
      .
      A lot of snow in Colorado in the second half of June — never mind that — that’s not important — just move on:

      https://elonionbloggle.blogspot.com/2019/07/lots-of-colorado-snow-last-week-in-june.html

      • Blaz says:

        Look at the location of the heatwaves and the location of cold snaps, then overlay the northern jet streams and it makes perfect sense. But it is the way the jet streams are now behaving that is the pertinent question. Why are temperatures in the arctic regions rising so much, despite being remote and not being significantly affected by urban heat mass? By itself, it makes no sense, however in a world of warming ocean currents, it makes complete sense.

        • Bill Hunter says:

          Blaz says: Look at the location of the heatwaves and the location of cold snaps, then overlay the northern jet streams and it makes perfect sense. But it is the way the jet streams are now behaving that is the pertinent question. Why are temperatures in the arctic regions rising so much, despite being remote and not being significantly affected by urban heat mass? By itself, it makes no sense, however in a world of warming ocean currents, it makes complete sense.

          ————–
          Ice comes and goes. At the peak of the Holocene its estimated that for a few thousand years there was no summer ice in the arctic. Beaches on the northshore of Greenland testify to the fact they were formed by large wave action that tells that the arctic was clear of ice clear to the north pole.

          Even in the 20th century the NW passage opened twice for Amundsen then Larsen then closed again until 2007.

          Ice is like insulation for the arctic. Strip it off the ocean top and the warm currents which used to run under the ice and cooled only by ice at about 0 degrees centigrade becomes exposed to climate dropping way below zero creating annual refreezes far and away larger than when the sea is covered with ice. All this ice freezing squeezes briny water out of the saltwater in converting it to freshwater ice. This saline heavy and very cold brines sink to the bottom of the ocean often creating massive columns of frozen ice rising from the sea floor. This cold brine feeds the global thermohaline currents so as warming occurs at the surface the bottom of the ocean starts cooling and none of this activity can be estimated in size because of processes like frazil ice can create areas in the arctic that are like little ice factories because of the loss of ocean ice cover. And of course the air temperature goes up significantly often spiking arctic-wide temperatures from lows around -30 to -40 up 10C or more. A normal process even with ice but more massive when ice is stripped away. This heat rising out of the once insulated ocean currents in the process warm the frigid arctic airs as ice forms in clumps and brines sink to the bottom.

          So what you are likely observing the most of rising arctic surface temperatures is the heat being extracted from ice in the freezing process and instead of just being relatively normal warming like the rest of the globe there is just a lot more of it.

          These processes have always gone on and will likely continue even in the presence of general warming trends from whatever source. The last time the ice opened up like this was in the 30’s and 40′. Before that little history is written but it was open some time after the failed British expeditions of the 1870’s and the time when Amundsen made his transit. And of course the British expeditions were no doubt driven by aboriginal word of mouth of previous periods when the passage was open or how else would they have thought it to be there?

    • Tim Hammond says:

      No, you cannot know if the frequency of events has increased unless you have a very long record. Two “hundred year” events can occur in two years but that tells you nothing. And if old records are not reliable how do we know what are 100 year events anyway?

      As for this June in Europe, the average is high simply because of weather patterns. The heat is air from North Africa. And either side of the record heat are areas of cold way below average – it’s far easier to produce record heat in a small area than record cold in larger areas, just because of physics.

  2. Nate says:

    ‘Most of the warming since the Little Ice Age (up to about 1900) occurred before greenhouse gases could be blamed.’

    That is not obvious. How do we know that?

    Ive never heard of the LIA extending to 1900. And most of the warming in all the surface records has been SINCE 1900.

    • barry k says:

      Nate,

      If I look at Wikipedia’s graph for temperature in reference to LIA, it seems the coldest was ~1600-1700. I believe Roy was probably saying something to the effect:
      – ‘since the LIA’, there was natural warming up to ~1900 as human effects would have been small (but the LIA ended well before that…)
      – after ~1900, human effects were larger and at least a portion of the warming ‘could be blamed’ on greenhouse gases.

      However, at least Wikipedia blames a cold spell ending around 1850 on the end of LIA…

      Barry

    • Nate says:

      Yes, so todays warming relative to periods just before and after LIA seems to be ~ 1.0C. The LIA min relative to these periods seems to be 0.5 C at most.

      The warming after the LIA thus appears to be larger than the LIA recovery.

      • barry k says:

        Nate,

        Unfortunately, before some point (well after any ‘minima’ from LIA) we don’t have real temperature measurements, only proxy data (ice cores I guess, although I gather there are historical accounts indicating it was much colder). So, we don’t really know how much ‘natural’ warming occurred since then (or even up until human effects ‘started’).

        The big question is how much of today’s warming is ‘natural’?

        I’m sure humans are having an effect (in more ways than just CO2 levels…).

        I’m also reasonably sure there is a ‘natural’ component (unlikely the ‘natural’ warming ceased right when any human effects commenced).

        As I think Roy has pointed out, when you assume all the warming in the temperature record is due to CO2, the models will undoubtedly over-predict the forcing effect of CO2 and then over-predict the expected warming when extrapolating into the future…

        Barry

    • bdgwx says:

      Based on the stuff I’ve read the consensus does seem to be that pre-1900 warming was mostly natural, from 1900-1950 the anthroprogenic factor began ramping up, and post-1950 most of the warming is anthroprogenic. I think the standard 1951-1980 baseline makes for a reasonable approximation of the point where the anthroprogenic factor began in earnest. So yeah, about 1.0C of anthroprogenic warming sounds about right.

      • Stephen P Anderson says:

        It is all natural.

        • Bill Hunter says:

          Stephen P Anderson says: “It is all natural.”

          I disagree. I think there is some room for anthropogenic warming from 1) deforestation; 2) UHI; 3) Emissions. Add them all up and they make a sizable contribution to the long term trend of about half a degree per century mingled in there with a slight amount of warming still occurring from the LIA recovery.

          I have too much skepticism to buy into temperature record adjustments where problems with the record was so uniformly period centered over exactly the warming alarmed scientists couldn’t explain. Its like they repealed prohibition, the climate station managers all got drunk, and they replaced them all in the same decade. . . .either that or sobered them up. Just kidding of course, but its like trying to make a silk purse out of a sow’s ear at best. All in all it results in the perception that rather than solving climate dilemmas we are handwaving the problems away for the sake of politics. Its quite amazing that everything has changed since the 1970’s except the Charney Report which hasn’t budged an inch when the first models were constructed by James Hansen. But thats politics for you in a nutshell.

          • Stephen P Anderson says:

            Bill,
            Your guess is as good as mine.

          • bill hunter says:

            everybody is guessing on this one. even the modeling groups are all over the place like a soup sandwich. The only reason they lean a particular direction is the cherry picking for funding that weeded out groups that didn’t drink the koolaid.

      • Svante says:

        bdgwx, the anthropogenic contribution the current warming is more than all of it, more than twice your number.

        https://www.nature.com/articles/s41598-018-28419-5

        The negative greenhouse forcing in MIS19, relative to pre-industrial “PI” conditions at year 1850, causes a much colder climate. The mean-annual global temperature falls by 1.27 K, while the 56 K cooling in the high Arctic is the most pronounced anywhere (Fig. 2a).

        • Lewis guignard says:

          It is difficult to believe that warming attributed to all natural causes ceased in a short time period of a few decades to be replaced by all anthropogenic warming. The specific question would be: why did natural warming stop?

          • Nate says:

            Not saying natural stopped. It is needed to explain 20th century record.

          • bdgwx says:

            You need to consider all physical processes, both naturally and anthroprogenically modulated, to explain climate trends. These processes wax and wane in magnitude. It’s the net effect of all of them considered together that matters.

          • Dr Roys Emergency Moderation Team says:

            Nate, bdgwx, please stop trolling.

    • At least 3/4 of the +2 degrees C. warming since the 1690s could not have been caused by CO2 — happened before 1940.

      Based on 1690s temperatures in Central England only ( real time temperature records not available from elsewhere ).

      If you data mine, and start with the coldest year in the late 1600s. there has been +3 degrees C. warming in Central England, not +2 degrees C.

      There is no scientific proof that any warming on our planet was ever caused by man made CO2.

      That is a theory — an assumption based on simple closed system water vapor free lab spectroscopy experiments — not a proven fact.

      All climate changes in the past 150 years could have had 100% natural causes.

      There is no justification for claiming “over half” of the warming since 1950 is man made — that IPCC claim is science fraud.

      records

      • Nate says:

        ‘If you data mine, and start with the coldest year in the late 1600s. there has been +3 degrees C. warming in Central England,’

        Which is a thoroughly pointless activity.

        • Nasty Nate is bbbbbbbaaaaaaaaaaaaacccccccccccckkkkkkkkk,

          If the Central England temperature is up +3 degrees since the coldest period in the late 1600’s, that means we have experience with a large amount of global warming, and guess what, nasty Nate, the people of Central England would never want to go back to the cold times during the Maunder Minimum in the last 1800’s.

          So when I hear the climate alarmists bellowing about +2 degrees C., or +1.5 degrees C., I just start laughing at the fools — we’ve already had experience with +2 degrees C., and it was 100% good news. In fact all the global warming in the past 300 years was good news.

          Only FUTURE global warming is said to be 100% bad news, by the climate scaremongers like you, with your scary climate campfire fairy tales.

          Have a nice day.

          • “Maunder Minimum in the last 1800s.”
            should have been typed as “Maunder Minimum in the late 1600’s”
            I was so excited Nasty Nate was back.

        • Nate says:

          Richard,

          Already addressed your cherry picking in CET with you last month.

          Climate average for any location is determined by a 30 y average, not a single year downward spike.

          A single site is interesting to look at, but not for drawing any conclusion about global or even continental temperature.

          You know better.

          • Nasty Nate
            The ONLY real time temperature data for the 1600s is from ENGLAND.

            Climate proxies are not accurate enough for one two degree changes

            Real people in England experienced real global warming.

            Completely unlike the imaginary future global warming that climate alarmists like you love to dream about !

            The +3 degrees C. looks at the coldest year in the late 1600s

            The +2 degrees C. considers a 30 year average.

      • bdgwx says:

        Well actually the IPCC claims 95% confidence that at least half of the warming since 1950 is anthroprogenic. Their best estimate though is nearly 100%; just with less confidence.

        • The IPCC wild guess is a steaming pile of farm animal digestive waste products.

          The correct answer is “no one knows what percentage of warming was natural”

          For 4.5 billion years, 100% of climate change was natural.

          It is the job of climate alarmists to prove modern warming is NOT from natural causes, and they have failed miserably at doing that.

          The 95% confidence used by the IPCC is meaningless — it is just an opinion — the scientists took some kind of a vote, and came up with 95% off the top of their heads, or from two feet lower !

          A 95% confidence level can have an important meaning in math and science.

          The IPCC use of “95% confidence” is totally meaningless.

          And they should be ashamed of themselves for the con job. .

          • David Appell says:

            Richard GreeneNewDeal says:
            The IPCC wild guess is a steaming pile of farm animal digestive waste products.

            It can be modeled and thus calculated. The calculation is certainly in the ballpark (it won’t and doesn’t have to be perfect)

          • Reply to Mr. Apple’s comment below:

            Models do not produce data.

            They produce whatever numbers the computer programmers tell them.

            There is no way to know what percentage of warming since 1940 was natural and what percentage was man made.

            Guesses and models do not create truth.

            If you really have a PhD, you should return it, Mr. Apple.

            You’ve just made the “steaming pile” higher.

        • Since the UN IPCC will not look into natural warming how would they know.
          Remember the IPCC is an ad agency who’s charter spells out it’s mission.
          The mission of the IPCC is to PROMOTE the UN treaty on climate!

          Their is nothing in their mission statement that says do actual science, NO , they are to PROMOTE the climate change treaty period.

          Why believe these frauds?
          Curious, try reading ” the teenager who thought he was the worlds foremost climate expert” if you want to understand what goes on at hoax central.

          Yep, it is not gullible to believe that warming that was 100% natural has suddenly changed to 100% man-made.

          • bdgwx says:

            The IPCC already considers all physical processes both naturally and anthroprogenically modulated. Read the AR5 Physical Science Basis report for information about what is considered.

          • Dr Roys Emergency Moderation Team says:

            bdgwx, please stop trolling.

      • Nate says:

        Lets look at the 30 y averages in the CET record, shall we?

        Downloaded from here:

        https://tinyurl.com/y23brkj7

        the minimum 30 y av was 8.49 C in 1672-1701.

        The average of the whole series was 9.24 C

        The maximum 30 y av was 10.25 C, the LAST ONE 1989-2018.

        So the coldest 30 y period was 0.75 below the average.

        The warmest, today, was 1.01 C above average.

        From 1750-1900 the 30 y average never exceeded 9.31, almost 1 C below the current 30 y average

        • Richard Ferris says:

          Do you understand what the debate is about??

          No one says we are not at the end of the current halcyon period.
          No one says it has not warmed…..although whether it still warming and how much more it will warm is in question.

          How is this relevant to IF CO2 and human activities are the cause????

          It was warmer 6000 years ago, why does that fact not sink in??

          It would be better , right now, to be 2 degrees warmer, than 2 degrees colder!!!! Do you disagree??

          Why the concern about the good positive warming???? Why did what was good since the beginning of human existence suddenly become bad.

          Can you point all of us lost souls to the debates about my questions as most of us missed them

          • Nate says:

            “It would be better , right now, to be 2 degrees warmer, than 2 degrees colder!!!! Do you disagree??t would be better , right now, to be 2 degrees warmer, than 2 degrees colder!!!! Do you disagree??”

            Those are not the choices, so strawman.

            Its not going to be 2C colder no matter what we do next.

            Why do think that you know what a 2C warmer world would be like, and that it would be better, for most people?

        • Far too many numbers for you to handle Nasty Nate.

          I have the same data.

          I said there was +2 degrees warming since the late 1600s,
          and +3 degrees C. from the coldest year in the 1690s’
          in Central England.
          .
          .
          .
          +2 degrees C. calculation:
          The minimum 30 year average was 8.49 C in 1672-1701.
          The maximum 30 year average was 10.25 C, the LAST ONE 1989-2018.
          Maximum minus minimum = 1.76 degrees C. ( I rounded that to +2 degrees )
          .
          .
          .
          +3 degrees C. calculation:
          Minimum year was 1695 at 7.29 degrees C. average
          The year 2018 was 10.68 degrees C. average
          2018 minus 1695 = 3.39 degrees C. ( I rounded that to +3 degrees C. )

          A child could understand the math.
          Find a child to explain it to you Nate !

          • Nate says:

            “A child could understand the math.
            Find a child to explain it to you Nate !”

            Didnt say it was wrong, I said it was pointless cherry picking to measure from coldest year, dufus.

            You also forgot that warmest 30 y period 1750 -1900 was ~1.0 C below current one.

            Your “3/4 of warming since 1690s” natural is DOA.

          • Nasty Nate
            There was not enough change in CO2 levels before 1940 to account for much, if any, of the warming before 1940.

            I estimate that warming as at least +2 degrees C. based on central England real-time temperature data — +1.4 degrees C. before 1940, and +0.6 degrees C. after 1940.

            I’ll assume 10% of the warming before 1940 was caused by man made CO2, and 50% of the warming after 1940 was caused by man made CO2, with no scientific proof any of the warming was caused by man made CO2

            10% of +1.4 degrees C. is +0.14 degrees C.

            50% of +0.6 degrees C. is +0.30 degrees C.

            That adds up to +0.44 degrees C. warming attributable to man made CO2, of the total estimated warming since the 1690s, based on my logical estimate.

            +0.44 degrees C. of +2.0 degrees C. = 22%

            I rounded the 22% up to 25% for my claim that three quarters of the total warming since the 1690s (in central England) was likely to have natural causes.

            Nate, I typed this really slow so even YOU could understand it, but maybe you’d better go find that local child, and pay him a few dollars, to explain this to you.

            No one with sense could attribute a majority of the warming since the 1690s Maunder Minimum period in the Little Ice Age to man made CO2 … well, maybe you could.

          • Bill Hunter says:

            Nate you yourself said there was a pre-industrial warming of .75 degrees and a post industrial warming of 1 degree. Considering AGW was for all practical purposes nil, that saddles the industrial age with .25 degree warming.

            I personally think its maybe a bit more than that like half a degree over 150 years. . . .a combination of UHI, deforestation, and emissions. . . probably split up fairly evenly with maybe a bit more added into the tail as deforestation seems to be somewhat mitigated by an unprecedented greening of the planet in recent years as the huge acceleration in carbon emissions has spurred a green revolution in just the most recent decades.

            One has to allow for an as yet sizeable amount of warming from combined effects not yet realized in the ocean.

          • bdgwx says:

            RG, I’m okay with 10% prior to WWII. I’m not sure it’s quite that low, but it’s not unreasonable. What I’m not okay with is 50% after WWII. I think it’s likely to be much higher than that; possibly near 100%. The reason is that the net effect of all naturally modulated processes post-WWII is believed to produce a slight negative radiative forcing. I will say that I am skeptical of claims that most of the warming since the LIA is anthroprogenic. I just don’t think the numbers are quite there yet. But I do think there is enough confidence to say that most off the warming after WWII is anthroprogenic. This would represent about 0.9C plus the maybe 0.2C prior to WWII brings us to 1.1C. That’s about where I stand unless someone can convince me otherwise.

          • Bill Hunter says:

            Bdgwx: “The reason is that the net effect of all naturally modulated processes post-WWII is believed to produce a slight negative radiative forcing.”

            This argument has been made for over a decade and based on even thinner evidence than the surface effect of CO2 being responsible for the entire greenhouse effect. (e.g. we don’t even know if the auxilliary effects are positive or negative)

            I accept the greenhouse effect and figure total sensitivity at about .4degC per doubling. Interesting analysis above with yet a 5th methodology except not really sure where the percentages came from they seem actually out of line with actual emission history since current emissions are an order of magnitude over 1970 alone.

            The arguments for net natural cooling though are almost certainly the wrong sign in total, except in the current ocean/solar cycle.

            With both solar and multi-decadal ocean indexes positive until the last decade we may well be crossing int a cooling “net other” category now. But we need to wait a couple decades to gain a clear signal of that if that is true.

            We have already seen the scramble toward adjusting the monitoring systems to align them with the “best science available” and we may need a couple of decades to shoot a hole in that balloon. That may not be adequate as its likely there is enough slop in the monitoring systems to keep adjusting them for some time.

            If low solar activity and ocean oscillations continue to occur for a couple of decades at least proponents of natural climate change will get as much time as warmists did post the Charney Report to gin up evidence of warming.

            Rather than subjecting the entire population to oppression over the fears of a few and those who can be convinced via cash over the barrel (e.g. the chinese government and scientists with power over government funding ala the whatever industrial complex), those with real concerns should act individually to a) cut personal emissions; b) go into survivalist mode. As it stands there are more in survivalist mode today over the threat of overbearing government than global warming and as innocuous as the effects of warming has been I am not expecting that to change soon.

          • Nate says:

            Bill,

            ‘Nate you yourself said there was a pre-industrial warming of .75 degrees and a post industrial warming of 1 degree.’

            You are not following the discussion, which was about 1 site in Central England, which had one 30 y period @ 8.5 C in late 1600s.

            From 1750-1900, the 30 y ave stayed between 9.0 and 9.25 C. Then it increased after 1900 until the current 30 y period, which is 10.25 C

          • Nate says:

            “I estimate that warming as at least +2 degrees C. based on central England real-time temperature data +1.4 degrees C. before 1940, and +0.6 degrees C. after 1940.”

            Ill assume 10% yada yada”

            I dont why we should use Central England as a proxy for the globe.

            I don’t know why your estimates and assumptions should be taken seriously.

          • Bill Hunter says:

            Nate says: “You are not following the discussion, which was about 1 site in Central England, which had one 30 y period @ 8.5 C in late 1600s. From 1750-1900, the 30 y ave stayed between 9.0 and 9.25 C. Then it increased after 1900 until the current 30 y period, which is 10.25 C”

            I’m following it just fine. We had one 30 year period before industrialization where the temperature rose by 3/4’s to 1 degree and one 30 year period most recently after industrialization where temperatures rose by 1 degree to 1 1/4 degrees.

            Its a fair conclusion from those facts that industrialization may or may not have contributed to the recent warming.

          • Nate says:

            Bill, like I said to R Greene,

            ‘I dont why we should use Central England as a proxy for the globe.’

          • Nasty Nate:
            In your July 7 %:22 am comment you called me a “dufus”.

            I just wanted you to know the word is spelled “doofus”,in case you ever want to use it again one of your usual scholarly dissertations.

            Spelling your insult wrong is considered a violation of internet ethics — Internet Rule 6b — I assume you are a victim of a pubic school edumacation.

            Have a nice day.

          • Bill Hunter says:

            Nate says: “I dont why we should use Central England as a proxy for the globe. I don’t know why your estimates and assumptions should be taken seriously.”

            Why not Nate? At least its a real thermometer in the real world which is one heckuva lot more relevant than a James Hansen climate model being used as the proxy for scientific evidence of Hansen’s AGW warming theory.

            Certainly there is room for a lot of doubt in every aspect and corner found in climate science.

          • Nate says:

            I ask why Central England should not be a proxy for the Globe.

            Bill says: “Why not?”

            I dunno Bill, why not use Pirates?

          • Nate says:

            ‘I just wanted you to know the word is spelled ‘doofus’.

            Thanks RG. Thats actually a helpful post.

          • bill hunter says:

            Nate says: “I dunno Bill, why not use Pirates?”

            Is Pirates a thermometer that has been around for 320 years or are you just being a jerk?

          • bdgwx says:

            The point is that there is evidence that temperatures in England do not move in the same direction as the global mean or even the NH mean. In fact, sometimes they move in opposite directions. That’s not to say these observations in England aren’t useful. They definitely are. You just have to consider them in context. That’s all.

          • Bill Hunter says:

            bdgwx says: “The point is that there is evidence that temperatures in England do not move in the same direction as the global mean or even the NH mean. In fact, sometimes they move in opposite directions. Thats not to say these observations in England arent useful. They definitely are. You just have to consider them in context. Thats all.”

            You are absolutely right bdgwx. But what context do we consider them against? A sacred tree in Siberia? Nate was just being an ignorant jerk replying the way he did.

          • Nate says:

            Im being a jerk for being sarcastic about Bill’s ‘Why not?’ use Central England as a proxy for Global temperature’ which is so silly it cannot possibly have been intended as serious question.

          • Bill Hunter says:

            Nate, you are being silly because CET is not alone. It may be a lone thermometer but it is consistent with tons of other information that has been hashed over all the time. Sure a several decade long period in CET could be different than a several decade long period of global mean but its about the best proxy we have. . . .that is unless you are worshipper of that single tree in Siberia the advocates on your side pushed to the front page of an IPCC report.

          • Nate says:

            OMG, it WAS intended as serious question!

          • Nate says:

            Just try looking at different states in the US over last 120 y to see how much regional variation there is.

            Here’s Kansas whose 1930s were as warm as today.

            https://tinyurl.com/y5jlz7c7

            Click on map to choose other states.

            Notice eg California and others are much cooler in 1930s than today.

          • Dr Roys Emergency Moderation Team says:

            Nate, please stop trolling.

  3. schneefan says:

    May be corrected into NORTH: “It was caused by a Saharan Air Layer (SAL) flowing in from that gigantic desert to the SOUTH…”

  4. Scott R says:

    The heat island effect is very real. The effects are felt globally, but are peanuts compared to locally. The local temperature forcing from the heat island effect on weather stations across the globe is the #1 reason to trust Dr Spencer’s data over ground based stations. With every station they add at a new location, there is more opportunity for the false trends to continue.

    Don’t ignore this point because it is critical. How else can you explain the flat lined Antarctic trend? Or how about 40 years of southern ocean declines? (HADSST3)

    The same people using ice core data from Antarctica to build models that have been 100% wrong, will tell you to ignore data that comes in now. Hilarious.

  5. David Appell says:

    Re UHI. Cities comprise only 0.2% of the globe by area.

    In the last 365 days in the US, record highs have outnumbered record lows by 1.22:1.

    https://www.climatesignals.org/data/record-high-temps-vs-record-low-temps

    Last decade the ratio was 2:1.

    https://agupubs.onlinelibrary.wiley.com/doi/full/10.1029/2009GL040736

    • David, none of that refutes my point.

      • Butts says:

        Roy,

        You very clearly stated that record highs in the US are not increasing over time. Quote:

        “The question is, are the number of record high temperatures increasing over time? At least in the U.S., the answer is ‘no’, as the number of days over 100 and 105 deg. F have not increased”

        This is a very sneaky way of wording things. Assuming that the climate isn’t warming, we’d expect roughly equal number of record hot and record cold events. Your point #2 from the article implicitly states this.

        David has provided some evidence that record warm events are occurring more frequently than we would expect them to. Rather than commenting on that evidence, you’ve decided to take the route of pedantry and ignore it because it wasn’t “technically” the point you were trying to make.

        Shame.

        • David Appell says:

          Butts: Yes, thanks.

          Roy, in a warming world, the number of high temperature records per year does not need to increase.

          In fact, if the world is warming, that number can stay constant. Yet there is still warming.

          • Lewis guignard says:

            And thankfully, whether warming or not, the world doesn’t seem to be getting colder.

    • Scott R says:

      David Appell,

      The heat island effect is not limited to cities. Every time you cut down trees and build a barn it has an effect. Every time you put in a new road there is an effect. The global temperature departures like the ones used on this data set take into account all of this. You are changing the way the earth (all be it slowly) absorbs and releases energy back to space thru deforestation, pouring cement, and even building cars! Some of this energy ends up in the oceans even though it was originally added to the system on land. Once you add more energy to land, it doesn’t just stay there. The more energy you add to land, the more will slowly transfer to the ocean as the winds blow warmer air off the land onto the ocean where it warms the surface. So our heat island effects everything.

      What is most troubling is how the IPCC, NOAA, NASA can adjust out the rural data to make this look even worse and nobody except the VERY in tune folks will realize it. Add that to the natural changes in TSI forcing over the last 400 years which the effect of that has also been put into the CO2 category, and you are setting up a MASSIVE surprise for the grand solar minimum.

      • David Appell says:

        Scott R says:
        What is most troubling is how the IPCC, NOAA, NASA can adjust out the rural data to make this look even worse and nobody except the VERY in tune folks will realize it.

        Scott:

        Why are the raw data adjusted? Do you know?

        PS: Are you aware the adjustments *cool* the long-term warming trend?

    • Svante says:

      Berkeley Earth found “no urban heating effect over the period 1950 to 2010”.
      http://static.berkeleyearth.org/papers/UHI-GIGS-1-104.pdf

      That was for anomaly trends, record highs could be another story.

      • Scott R says:

        Svante,

        That doesn’t even pass the sniff test. Of course there is a heat island effect. I get to experience it every day as I drive home and watch my temperature change. You can download local NOAA NOW data and sum average temperatures to see I’m right if you still don’t believe me.

        • Svante says:

          Yes, but it didn’t affect the trend.
          In fact the BEST UHI trend estimate was negative.

          Our results are in line with previous results on global averages despite differences in methodology.

          • sky says:

            By chopping all station records into short snippets of data in the name of “break detection” and then reassembling those snippets to conform to urban-dominated “regional averages,” BEST brashly manufactures long time-histories that suppress vital features of ACTUAL temperature variations, while producing a bogus “trend.” Their expertise is in self-promoting PR, not in geophysics.

          • Dr Roys Emergency Moderation Team says:

            Svante, please stop trolling.

        • Butts says:

          The thing that Roy has neglected to mention here is that the UHI study he cited from Anthony Watts is either very poor work or intentionally fraud.

          The publication in question fails to adjust for the time of day that a temperature reading was taken at. It’s completely meaningless. For this gross oversight, one of Watts’ coauthors asked to have his name removed from the publication.

          It discredits Spencer to rely on such an unreliable source of research as Watts. Anthony literally has kept repeating the same experiment until he got the results he wanted for nearly a decade now.

          https://skepticalscience.com/watts_new_paper_critique.html

          • Bill Hunter says:

            David Appell says: “So lets see, who should we believe.”

            Neither! Unless of course you are a fool. Never believe an expert unless you have an enforceable contract with him. History has born out the precaution time and time again.

          • Big Butts:
            I read the Watts study in 2009 and again recently to write a summary on the tent5h anniversary.

            I never considered it to be a study of the UHI effect.

            It was a study of weather station siting in the US and it was obvious the goobermint bureaucrats didn’t care much about reasonable siting.

            From an outsider’s point of view, all you really see is the weather stations — and if they look like they were placed without regard for proper siting, then there is no reason to t4rust the numbers coming from those bureaucrats.

            Three important concerns:
            – Weather station coverage — still poor in 2019 — far too much infilling even in the U.S.

            – Mix of urban, suburban and rural stations — there are not enough rural stations, especially rural stations with long-term data

            — Economic growth and land use changes in the vicinity of a weather station (for all stations, urban, suburban and rural)

            I once researched the weather station at the Dallas Fort Worth Airport — the airport originally had about 3 regular flights leaving per day when the weather station was installed — and now has over 200 flights per day — that’s a lot more jet engines spewing heat in the vicinity of a weather station located near runways.

        • David Appell says:

          Scott R says:
          That doesnt even pass the sniff test.

          So let’s see, who should we believe….

          Scott R, a random, anonymous blog commenter who provides no evidence whatsoever

          or

          A team of scientists and data processors, including a Nobel Laureate, who have spent a few years thinking carefully about this problem and doing actual detailed calculations with real data.

          • Richard Ferris says:

            Yes, trust the scientists who are paid to produce results that conform to the IPCC’s needs.

            Who needs the scientific method of falsification when we have a hoax to promote.

            Do you only count Nobel laureates who support alarmism?

            Yep, appeal to authority settles all questions of science.

            Without loyal gullible dupes where would the hoax be.

          • David Appell says:

            Richard Ferris:
            Which scientists are paid to agree with the IPCC, and how do you know this?

            Who do you think the IPCC is, anyway? They’re the scientists who volunteer to serve on its committees!

            BTW, oil company scientists reached the same AGW conclusions in the late 1970s.

          • Dr Roys Emergency Moderation Team says:

            David, please stop trolling.

          • When using the scientific term “sniff test”, Mr. Apple, I assumed Scott R. was referring to your usual pathetic Appeals to Authority, acting as a trained parrot of climate alarmism.

          • David Appell says:

            No one gonna answer this?

            Richard Ferris:
            Which scientists are paid to agree with the IPCC, and how do you know this?

          • Dr Roys Emergency Moderation Team says:

            OK, I will answer: David, please stop trolling.

        • Lewis guignard says:

          I always found it interesting when I would leave the city and watch the temp gauge in the car drop almost 10 deg F on my way home – only 10 miles away. But in a heavily wooded area.

          • Scott R says:

            Lewis guignard,

            Exactly. Just yesterday, I witnessed temperatures rise from 67 deg F to 72 deg F as I drove home from a late party yesterday. The commute started about 30 minutes east of Flint, MI. As I approached Flint, the temperature spiked. Then, I turned south down US 23 and watched the temperatures slowly drop 2 degrees even as I drove south. The true test is driving INTO a city at the same elevation along an east-west rout in the evening. There is nothing else that can explain the temperature rise that you see. You can also look at nightly weather reports and see that in general, the cities are warmer.

            But people like David Appell want you to disbelieve your eyes and trust corrupt scientists that supposedly know better.

          • Nate says:

            Guys, the point is not that UHI isnt real. It is that the algorithms for finding temperatures at each grid point are dealing with it.

          • Bill Hunter says:

            Nate says: “Guys, the point is not that UHI isnt real. It is that the algorithms for finding temperatures at each grid point are dealing with it.”

            Exactly! Using “settled science” as determined by climate models to get it right.

          • bdgwx says:

            Which datasets use climate models to adjust for UHI?

          • Bill Hunter says:

            bdgwx says: “Which datasets use climate models to adjust for UHI?”

            In the algorithms, do you actually think any well trained scientist is going to ignore settled science?

          • bdgwx says:

            BH said…”In the algorithms, do you actually think any well trained scientist is going to ignore settled science?”

            Yes. That’s why different groups use different techniques and different subsets of available data.

            But that doesn’t answer my question. I’m not aware of any dataset that uses NWP/GCM climate models to adjust for UHI. I mean I’m sure they exist. It’s just that I don’t think it’s very common.

          • Nate says:

            Can Bill offer any evidence that climate scientists are doing these nefarious or incompetent things he often assumes they are doing?

          • Bill Hunter says:

            bdgwx says:
            “Im not aware of any dataset that uses NWP/GCM climate models to adjust for UHI. I mean Im sure they exist. Its just that I dont think its very common.”

            About as common as UHI adjustments? come on bdgwx do you have any experience at any of this stuff? Dataset managers often also sponsor climate models, those that don’t are closely associated with such groups and share data. All data adjustments going back more than a year or so in review are provoked either by climate models or by controversy and which ever it is they are going to resort to the tools they have on hand and not reinvent the wheel.

          • Nate says:

            ‘Can Bill offer any evidence that climate scientists are doing these nefarious or incompetent things he often assumes they are doing?’

            Nope, he just imagines it.

          • Bill Hunter says:

            Nate says: Can Bill offer any evidence that climate scientists are doing these nefarious or incompetent things he often assumes they are doing?

            Nope, he just imagines it.
            —————-

            What your post sounds like to me is you have no argument so you have decided to resort to generalized ad hominems. I don’t think I have accused anybody of being nefarious unless they deserved it but to answer your undefended ad hominem you will need to be more specific.

            If you can’t do that perhaps you should go back to school and learn something so you can keep up

          • Nate says:

            Bill does not know what ad hom means. I was simply pointing out that your statements about how climate scientists adjust for UHI, is not backed by any evidence.

            It just declared, based on your biases.

          • Nate says:

            Ad hom looks like this:

            “So you come in here blabbing like an infant spouting stuff you know practically nothing about because you read it somewhere, probably on a blog populated by other ignoramuses.”

          • bill hunter says:

            could look like an ad hom taken out of context and would be an ad hom without any context like your post

          • Nate says:

            Nope.

            The context was you being frustrated by me disageeing with you on meaning of data and logic.

          • David Appell says:

            Lewis, Scott:

            These guys have looked at the UHI’s impact on global temperature data much more carefully than either of you, and found no effect:

            from Berkeley Earth:

            “The Urban Heat Island effect is real. Berkeleys analysis focused on the question of whether this effect biases the global land average. Our UHI paper analyzing this indicates that the urban heat island effect on our global estimate of land temperatures is indistinguishable from zero.”
            http://berkeleyearth.org/faq/#question-15

            paper:
            “Influence of Urban Heating on the Global Temperature Land Average using Rural Sites Identified from MODIS Classifications,” Wickham et al., Geoinfor Geostat: An Overview 2013, 1:2
            http://dx.doi.org/10.4172/2327-4581.1000104
            https://www.scitechnol.com/2327-4581/2327-4581-1-104.pdf

          • David Appell says:

            Scott R says:
            Just yesterday, I witnessed temperatures rise from 67 deg F to 72 deg F as I drove home from a late party yesterday.

            Scientifically meaningless. An anecdote no better than party talk.

          • bdgwx says:

            Bill said…”Dataset managers often also sponsor climate models, those that don’t are closely associated with such groups and share data.”

            Sure. Hansen is an example. That doesn’t mean he used a numerical weather prediction model to adjust for the UHI effect in GISTEMP. His methods are in the public domain. They’re posted right there on the GISTEMP website for you to review. I recall him using population, light pollution, etc. for UHI adjustments, but never a NWP model.

            Bill said…”All data adjustments going back more than a year or so in review are provoked either by climate models or by controversy and which ever it is they are going to resort to the tools they have on hand and not reinvent the wheel.”

            Aside from the hint of conspiracy theory here this isn’t even true. And besides the net effect of all of Hansen’s adjustments is to REDUCE the longterm warming trend relative to the raw data. So if Hansen, Karl, Berkeley Earth, etc. all had an agenda to make the warming look worse than it is then they did a REALLY bad job at it since the adjustments actually worked to make the warming trend less; not more. It defines credulity to think there is some kind of conspiracy going on here.

          • Bill Hunter says:

            bdgwx says: “It defines credulity to think there is some kind of conspiracy going on here.”

            Come on bdgwx when did I claim a conspiracy? The only conspiracy I have seen was climategate. I have said repeatedly there is no wide conspiracy, yet you remain busy erecting strawmen.

            When it comes to credibility, I know a bit about that, having been in a profession that mandates it. Credibility is built on the foundation of independence. And independence means more than independence in fact, it means also independence in appearance.

            This is our largest problem as I see it. The civil service was created to end political corruption in the work the government undertakes on behalf of its citizens. To we are rapidly backtracking on that commitment to our citizenry by creating politically appointed panels to do such things as select grantees for government work, panels to issue official government positions like on climate. These are jobs that should be done by an independent civil service. Its fine for the civil service to formulate government positions on matters like climate and to choose outside researchers to complete work assignments subject to final review by the civil service to weed out biased statements and questionable conclusions.

            Thus what you had in James Hansen is one hand feeding the other in physical fact and dual loyalty with associations with external institutions seeking public grants. Did he do anything crooked? Probably not, I have said I like Hansen and his forthright honesty even though I don’t agree with his alarmist beliefs. But there is no way to detect that being a fact and there is no way to detect bias in the work product. Bias in particular because a biased honest man will work hard to eliminate his bias but that is a very difficult thing to do in fact. Thats why the standard of independence goes beyond independence in fact and includes independence in appearance. Any sane man realizes that.

      • Gordon Robertson says:

        svante…”Berkeley Earth found “no urban heating effect over the period 1950 to 2010”.”

        Are you still quoting that fraud? Judith Curry was a co-author and withdrew her support when Mueller got climate religion and began misinterpreting the results.

        • Svante says:

          Yes, she liked the method but she didn’t like the result.

        • bdgwx says:

          Judith Curry did not withdrawl her support for the method she signed off on. She abandoned ship when the method she helped develop showed about the same amount of warming as the dozen-plus other datasets that publish a global mean surface temperature.

          • Svante says:

            She didn’t agree to the inevitable conclusion:
            https://www.youtube.com/watch?v=Sme8WQ4Wb5w&t=1m53s

          • Dr Roys Emergency Moderation Team says:

            bdgwx, Svante, please stop trolling.

          • Bill Hunter says:

            bdgwx says: “Judith Curry did not withdrawl her support for the method she signed off on. She abandoned ship when the method she helped develop showed about the same amount of warming as the dozen-plus other datasets that publish a global mean surface temperature.”

            Thats absolutely false.

            Dr. Curry has always supported the surface record and still does as far as I know. Her objection was to the conclusion drawn by Muller, that was not part of the paper that the effort had eliminated all uncertainty about the cause of the warming.

            People need to be more careful about the conclusions they leap to. Not all skeptics expect using many of the same data bases and gridding concepts as used by other surface records a difference would emerge.

            When you really get down to it there isn’t all that much difference between the types of records for anybody to get their panties in a wad about anyway. That is of course unless its extremely important for them to use a record adjusted by the very thing they want it to validate.

            Unlike NOAA Argo buoys, surface records, RSS, tidal gauges, and who knows what else; at least UAH isn’t adjusted by the same thing that other folks are likely to want to use it for to test for validity.

            Over the decades I have had to deal with bias a lot. Bias is subtle. I have worked with scientists for decades and long ago formed an opinion that most want to get it right but wanting to get it right and getting it right is often waylaid by unconscious bias. Typically when they get up to speak about their work its intentional to exaggerate in support of their work. You even see it a lot in abstracts and conclusions of science papers where the statements may not even be tested in the paper but through a word like “suggests” they totally speculate.

            Accountants can’t do that but scientists do it all the time. The difference? The difference is fiduciary responsibility and an accountant can be sued by those claiming the accountants statement provoked action by the plaintiff. You can sue a scientist also but the case will get tossed on the basis of the plaintiff having no standing to sue.

            But despite that natural propensity to exaggerate in speech and writings, I find all the scientists I have worked with very much dedicated to science in the area of what they actually specialize in.

        • David Appell says:

          Gordon Robertson says:
          Judith Curry was a co-author and withdrew her support when Mueller got climate religion and began misinterpreting the results.

          So one scientist against several others.

          How does that prove Berkeley Earth wrong?

          • Bill Hunter says:

            David Appell says: “So one scientist against several others.
            How does that prove Berkeley Earth wrong?”

            Well its not necessary to prove anything wrong, its the job of those who would like to convince us to do something to prove what they say is right.

            When all you have is something written on paper there is no easy way to tell if its science or science fiction.

          • Nate says:

            ‘all you have is something written on paper’

            you mean like Galileo’s ‘Dialogues concerning two new sciences’. Newtons’s ‘Pricipia’, Darwin’s ‘The origin of species’ and Einstein’s ‘Annus mirabilis” papers?

            Many of the major advances in science have been just ‘something written on paper’.

          • Svante says:

            … by “People working in windowless offices” in some cases.

          • Bill Hunter says:

            Nate says: “you mean like Galileos Dialogues concerning two new sciences. Newtonss Pricipia, Darwins The origin of species and Einsteins Annus mirabilis papers?”

            Yes I mean like that absolutely! Galileo had a heckuva time convincing people that the Copernican theory was the correct one as he also could not rely on experiment to prove his case and folks had become so indoctrinated in their particular point of view that it was an uphill battle all the way. Same thing with the others. The scientists behind the Ptolemy Theory even went so far as to invent machinery to duplicate the strange motions of the heavens as they went around the earth including retrograde motion.

            Just thought I would throw that in to specify that there is two sides of the story that scientists like to suggest that the adherents to the Ptolemy Theory weren’t scientists but instead were religious bigots. . . .but thats only a luxury afforded in hindsight.

    • Bill Hunter says:

      David Appell says:

      “Re UHI. Cities comprise only 0.2% of the globe by area.”

      David the percent of the globe area for the cities is only relevant to the satellite record. The UHI error for surface weather station records would be the percent of thermometers affected. If 50% of the thermometers are in UHI influenced areas, that translates to that error affecting half the globe.

      If you read Roy’s post more carefully you will note he is talking about thermometers (mentioned all of 10 times) and not satellite sensors.

      • Svante says:

        The BEST paper says 0.5 % of land stations, so that makes 0.2 % of the total.

        • Bill Hunter says:

          Its a problematic issue. The thermometer I have on the north side of my house typically registers several degrees warmer during the day than NOAA reports for my area.

          Driving around Oregon a few years ago during a heat wave the temperatures when driving on the highway in a forested area were ten or more degrees different than when driving through relatively smaller areas where the trees had been harvested. I am of the mind that there is no way one can have any assurance regarding surface thermometers for trying to measure “mean” climate. Not only are the stations not randomly sited, but every community has one and few forests do, and forests existed before the communities in many locales. .5% sounds crazy low. What did they do? Only count cities with over a 100,000 residents or something like that?

        • Bill Hunter says:

          Svante, I read the paper and found the answer for you. The assumption was a community larger than 50,000.

          UHI is an effect I guess discovered by satellites and the surface weather stations are responding to it by studies from windowless offices in academic institutions.

          • Svante says:

            No, “Sensitivity to the definition of very-rural being 0.1 degree distant from an urban area was assessed by repeating the analysis in this section using distances of 10km and 25km. The resulting curves were very similar”.

            You’re right about all the hard work in academic institutions.

          • Bill Hunter says:

            Svante says:
            “No, “Sensitivity to the definition of very-rural being 0.1 degree distant from an urban area was assessed by repeating the analysis in this section using distances of 10km and 25km.”

            Svante “urban area” is defined as urban areas with over 50,000 residents. That was the question I asked you and you didn’t know and I found the answer for you.

          • Svante says:

            That’s not the criterion in the BEST paper.

          • Svante says:

            Sorry, I lost track of the question.
            It was 0.5% of the area, but 27% of GHCN-M stations are in urban areas of 50000+.

            http://static.berkeleyearth.org/papers/UHI-GIGS-1-104.pdf

          • Bill Hunter says:

            Svante says: Sorry, I lost track of the question.
            It was 0.5% of the area, but 27% of GHCN-M stations are in urban areas of 50000+.

            No problem. But why would we limit UHI to only communities of 50k+. I live in a community of about 800 and we have a very large UHI effect. Our community for being in the middle of nature is rather unique regarding its density and the height of homes which surely increases the UHI. But we are too small for an official weather station.

            If you lowered the standard to 25K plus the number might rise to 52% (based upon proportions of communities in the US, without regard to whether they have a station). Of 10k plus and coverage would compute to 107% (obviously some of those don’t have weather stations).

          • Svante says:

            Bill Hunter says:
            “But why would we limit UHI to only communities of 50k+.”

            That was the question I answered before you asked it:
            BEST didn’t use that limit, they used “very rural” sites:
            “Sensitivity to the definition of very-rural being 0.1 degree distant from an urban area was assessed by repeating the analysis in this section using distances of 10km and 25km. The resulting curves were very similar”.

          • Bill Hunter says:

            Svante says: BEST didnt use that limit, they used very rural sites: Sensitivity to the definition of very-rural being 0.1 degree distant from an urban area was assessed by repeating the analysis in this section using distances of 10km and 25km. The resulting curves were very similar.

            So very rural is defined as distance from an urban site. Hmmm, what tool can do that? Ah a climate model! Take note bdgwx!

          • Svante says:

            No, the MODIS 500m Global Urban Extent classification map is what did it.

          • Bill Hunter says:

            Svante says:
            July 9, 2019 at 3:38 PM
            No, the MODIS 500m Global Urban Extent classification map is what did it.

            So where did the temperatures come from since the Modus map is just a map of urban areas of greater than 50K residents. What did they compare it to? I have heard the USCRN has shown about a tenth degree less that Berkeley over one decade.

          • Svante says:

            The temperatures came from the set 39 thousand stations used by Berkeley Earth. They compared the total to a subset of “very rural” stations according the MODIS 500m grid, and kept well away from any populated areas.

            Again, they did not base the comparison on “50K residents”.

            Where did you hear about the USCRN-Berkeley discrepancy?

            USCRN is high quality and non-urban, and can be used without adjustments. This paper shows that other stations match better after adjustment:

            https://agupubs.onlinelibrary.wiley.com/doi/full/10.1002/2015GL067640

          • Bill Hunter says:

            Svante says: – The temperatures came from the set 39 thousand stations used by Berkeley Earth. They compared the total to a subset of very rural stations according the MODIS 500m grid, and kept well away from any populated areas.

            Again, they did not base the comparison on 50K residents.
            ——
            I am just going with the consistency of what you are saying as I haven’t read the BE report. As I understand it they defined “the populated areas” as urban areas with 50k residents.

            Then they defined the comparative areas as areas first .1degree away (~11km) then repeated it at 10km and 25km away from that urban area. No where have I heard how they calculated the temperatures at those distances, described what was located at those distances.

            So you have not described how the temperature differences were arrrived at nor what they actually compared. Do you know? Or do you just believe it because they came up with a small number?

          • Svante says:

            Bill Hunter says:
            “As I understand it they defined ‘the populated areas’ as urban areas with 50k residents.”

            Your understanding is wrong.

            “No where have I heard how they calculated the temperatures at those distances, described what was located at those distances.”

            They used data from weather stations at those locations.

            “So you have not described how the temperature differences were arrrived at nor what they actually compared. Do you know? Or do you just believe it because they came up with a small number?”

            Why can you not read?

          • Svante says:

            Bill Hunter, here’s more info on the UHI effect by Zeke Hausfather of Berkeley Earth, and Matthew Menne of NOAA:
            https://tinyurl.com/d82nww9

          • Bill Hunter says:

            Svante says: Bill Hunter, heres more info on the UHI effect by Zeke Hausfather of Berkeley Earth, and Matthew Menne of NOAA:
            ——-

            Svante, I think mankind has a huge influence on climate without even considering emissions. UHI is one, deforestation is another.

            I think its erroneous to attempt to measure UHI separate from the deforestation issue. Farmland is probably the biggest offender and its no mystery that farmland is heavy around the entire world and every chance it gets its right next to human populations with farmland occupying every square foot of land not developed into roads, housing subdivisions, or urban areas. In fact investment in undeveloped land is in more demand than areas distant from urban areas because transportation costs of the products are less and farmers are farming lands often simply as a speculative maneuver on expanding suburbs.

            Further reference networks can be place out in nature but limitations exist there also both from funding and access. How many sites are on mountain tops? How many sites are in the trees? If what we tend to measure with reference networks are we favoring the same sort of environments as farmland? I have other concerns as well like how we measure the ocean temperatures for our estimates of radiative temperatures. The very top of the ocean surface has a steep cooling gradient because of evaporation during certain times of the day. Its why a splash of even warm water can feel cold instantaneously. I don’t see the basic building blocks of carefully conducted studies compiled into the sort of form that the more casual public can absorb on any of these issues. Instead its all about how the science is settled and moving on to other things.

            In the work I do I often get asked for help on an environmental concern. First thing I want to see is the science. I am a believer in the best science available but it does have to at least be comprehensive because the way I can help is in spreading that message on the science.

            You see people selling climate change science on the basis of tobacco science. The claim is the cigarette companies knew and covered up the information. Then they claim the same thing for climate science. But its complete BS because nobody seems to have studies that prove climate change causes something bad like cancer.

          • Svante says:

            You say you believe in the best science available.
            Science says GHGs cause global warming.
            You say it could be this or it could be that.
            Why don’t you study the science and find out?

          • Bill Hunter says:

            Svante says: You say you believe in the best science available.
            ——–
            Of course I do. Don’t you?

            Svante says:
            Science says GHGs cause global warming.
            You say it could be this or it could be that.
            Why don’t you study the science and find out?
            ———
            Science doesn’t talk. Science makes it self completely obvious by observation. So far nothing is obvious about “climate change” and thats even acknowledging that greenhouse gases are necessary for a “radiating surface” greenhouse effect.

          • Svante says:

            I’m glad you agree on the scientific basis.

            Science doesn’t talk. Science makes it self completely obvious by observation. So far nothing is obvious about “climate change” and that’s even acknowledging that greenhouse gases are necessary for a ‘radiating surface’ greenhouse effect.

            You cannot conclude much about the globe by looking out of your window. You need global scientific observations, not media anecdotes.

            Science speaks through text books and papers, or you can attend a class.

            So you agree on the GHE, but you think we can add GHGs with impunity? If you are talking feedbacks you are in the realm of the sensible, like Spencer and Lindzen.

          • Bill Hunter says:

            Svante says: You cannot conclude much about the globe by looking out of your window. You need global scientific observations, not media anecdotes.
            ———

            LMAO! Media anecdotes!!!?????!!!! Thats your problem, not mine.

            Therein lies the whole problem if you need somebody else to tell you that there is an environmental problem. Peering out your window rather than going outside and enjoying the many pleasures available to you sets you up as the biggest sucker known to man.

            That’s where we have gotten to with the “me” generation. We worry about stuff only if it is going to affect us personally on the basis we live forever. Meanwhile, huge real problems go unsolved because of the diversion of huge amounts of money to non-problems.

            One has to trust their senses and go out in the world and find real problems they can perceive that needs fixing because there are plenty of them. But no we have no current problems in our own lives so it must be the case there are no current problems except projected problems. . . .all focused on the big “me”.

            Svante says:
            So you agree on the GHE, but you think we can add GHGs with impunity? If you are talking feedbacks you are in the realm of the sensible, like Spencer and Lindzen.
            ———-

            I think its obvious that when it comes to prefeedback sensitivity there isn’t any hope that it could be more than every single additional calorie that CO2 traps. That’s thrown out there with the most aggressive stance one could possibly take. Its my opinion that any number that is only part of a sum that can be observed by observation is the most difficult one to establish. Additionally CO2’s maximum effect and is the least significant number. Even weaker is the argument for feedbacks. Further feedbacks are poorly defined in the first place and encompass unaccounted for primary effects such as how much additional sunlight CO2 will trap high in the atmosphere. The concept of negative feedbacks easily handles any over estimates in any partial parameter.

            So there is little mileage to be gained by going after the first assumption by the alarmists that every single additional calorie trapped by the atmosphere is going to warm the surface.

          • Svante says:

            It’s not a problem for “me”, except I like skating.

            I’m concerned about the risk to other people and the risk of collapsing ecosystems.

            I want every country to be itself. I guess I’m conservative.

            Without feedbacks you have about one degree of warming for a doubling of CO2.
            Problem is we are past one degree and nowhere near a doubling.

          • Bill Hunter says:

            Svante says: –

            1) It’s not a problem for “me”, except I like skating.

            OK, I used to skate. . . .here is socal; I don’t today but it has nothing to do with global warming.

            2) I’m concerned about the risk to other people and the risk of collapsing ecosystems.

            Ecosystems aren’t going to collapse from CO2. Put a lot of poison in an ecosystem and yeah maybe but most likely like a fire that comes through it soon recovers.

            3) I want every country to be itself. I guess I’m conservative.

            You are working contrary to that idea as a large part of the political agenda push is to breakdown nationalism and move toward world government.

            4) Without feedbacks you have about one degree of warming for a doubling of CO2.
            Problem is we are past one degree and nowhere near a doubling.

            You need to understand that a couple of degrees variation in climate is perfectly normal situation. Look at the oscillations in the ice core chronologies. Temperature vary in a very tight oscillation pattern. The ice core record is a long one so it a little difficult to estimate its period but it appears around 200 to 400 years. Three consecutive grand solar minimums creating the temperature decline in the 2nd millennium. https://en.wikipedia.org/wiki/Sp%C3%B6rer_Minimum

          • Svante says:

            The difference now is the speed of change.

            Species have no time to adapt, small creatures can not move fast enough, some move up mountains but get stuck at the top, some run out of land mass.

            Warmer and drier means increased risk of forest fire, and one day the forest doesn’t recover any more.

            To top it off you have global warming’s evil twin, ocean acidification.

          • Bill Hunter says:

            Svante says: The difference now is the speed of change.

            Species have no time to adapt, small creatures can not move fast enough, some move up mountains but get stuck at the top, some run out of land mass.

            Warmer and drier means increased risk of forest fire, and one day the forest doesnt recover any more.

            To top it off you have global warmings evil twin, ocean acidification.
            ———

            Wow! You are really inculcated there. Global warming is on a centennial scale. How slow do you think things move? Its ridiculous. About the slowest movers are plants but plants tolerate far greater seasonal changes than is being projected for global warming in 200 years.

            And where do you get this drier idea from? More moisture in the air equals more precipitation. In fact thats exactly how scientists measure latent heat input into the system. But having spent a good portion of my life in brush fire areas, I am perfectly aware that brush fires are not caused by drought, they are caused by seasonal changes from wet to dry. The wet is a necessary ingredient for forest fires as you have to grow the vegetation to burn it. Only in climate science can you burn stuff that never grew.

            Ah ocean acidification. Another alarmist theory. Is it true? Holy crap they are scaring a lot of people into believing its true. But its interesting how with all the CO2 in the air how the planet is greening. Greening is a negative feedback to ocean acidification because plants take up CO2 and deplete the upper oceans of carbon. Carbon has always been saturated in the oceans below the photic zone.

            Fact is we can’t measure the effect. Its all theorized on 300 year old proxies claimed to establish a diminishing ocean pH. But we don’t even know what mean ocean pH is today, how could we in 1700’s? The answer is you get a bunch of ordained monks and their lay brothers to gin up estimates then you average them all together and draw a mean line between the estimates. LMAO!

          • Svante says:

            Ignorance is bliss again, isn’t it?

            https://en.wikipedia.org/wiki/Ocean_acidification

          • bill hunter says:

            Svante says: Ignorance is bliss again, isnt it?
            ———–

            gee even obama’s epa couldn’t find anything reliable when they examined it. So all they did was start funding studies to gin up something reliable.

          • Svante says:

            Here’s a paper in case you want to learn:
            https://tinyurl.com/y4xl7o7q

          • bill hunter says:

            Svante says: Heres a paper in case you want to learn:

            —————

            As is typical of papers with dozens of authors the message is “send money”.

            What was I supposed to learn from that paper? That a bunch of environmentalists want the government to spend a lot of money to find a problem?

            You know there are poor people in this world with real problems and there are enough environmental problems to soak up the entire budget. Why should we be setting off in search of more problems when people are suffering from problems we can readily see without spending a lot of money?

          • Svante says:

            You need a good grasp of reality to prioritize correctly.
            Your method is ignorance.

          • bill hunter says:

            Svante says: – You need a good grasp of reality to prioritize correctly. Your method is ignorance.

            ——————-
            Obviously you also couldn’t find a single finding of consequence that you could stick in my face either. You have a lot of company there including a long list of authors.

            The whole paper is just a lot of hang wringing over possible consequences. The alleged rate of increases in acids 1) are so small as to be immeasurable, one has to rely on 300 year proxies that completely ignore natural changes. We don’t know the magnitude of chemical processes going on in the ocean. 2) studies conducted on the effects of “real” increases of acids related to the carbon cycle on critters with calcified scales mostly show an acceleration in growth in artificially enhanced acidic laboratory experiments. There is no rational basis for concluding disasterous consequences from a build up of CO2 in the oceans even if it is happening.

            I would certainly be open to the reality of a problem if you could actually find a paper that demonstrates one. That all said we have a huge shortcoming in understanding our own oceans. Certainly anything related to ocean studies to expand that knowledge is a worthwhile endeavor. But lets keep the priorities where real damage and problems have been identified.

      • Wrong again Mr. Apple (as usual)

        The largest UHI effects are from rural stations that become less rural.

        In addition, the percentage of the globe covered by cities is irrelevant.

        The actual location of the weather stations is relevant.

        Weather stations are far more likely to be near where people live. or are willing to live — not many people want to monitor some middle of nowhere rural station — that’s why rural stations rarely have continuous 100 years records.

        • David Appell says:

          Richard GreeneNewDeal says:
          The largest UHI effects are from rural stations that become less rural.

          from Berkeley Earth:

          “The Urban Heat Island effect is real. Berkeleys analysis focused on the question of whether this effect biases the global land average. Our UHI paper analyzing this indicates that the urban heat island effect on our global estimate of land temperatures is indistinguishable from zero.”
          http://berkeleyearth.org/faq/#question-15

          paper:
          “Influence of Urban Heating on the Global Temperature Land Average using Rural Sites Identified from MODIS Classifications,” Wickham et al., Geoinfor Geostat: An Overview 2013, 1:2
          http://dx.doi.org/10.4172/2327-4581.1000104
          https://www.scitechnol.com/2327-4581/2327-4581-1-104.pdf

          • Mr. Apple / Butts

            About half the linear UHI adjustments the NASA GISS computer program calculates have positive slopes !

            The computer program is calculating “urbanization bias” due to “urban cooling“, as often as
            “urbanization bias” due to “urban warming” !

            That’s science fraud !

            Science fraud is the science that Mr. Apple lives for.

            My article on the subject of UHI (ask someone to read it to you, Mr. Apple)

            https://elonionbloggle.blogspot.com/2019/05/urbanization-bias-adjustments-are-tiny.html

          • David Appell says:

            Richard GreeneNewDeal says:
            The computer program is calculating “urbanization bias” due to “urban cooling“, as often as
            “urbanization bias” due to “urban warming” !

            Mumble mumble mumble…. how about writing in English instead of some obscure computer code? Them people might know what you mean.

          • David Appell says:

            Richard GreeneNewDeal says:
            About half the linear UHI adjustments the NASA GISS computer program calculates have positive slopes !

            What does that even mean???

            Adjustments are done pointwise. Points do not have a “slope.”

            Whatever do you mean, RGND?

          • Dr Roys Emergency Moderation Team says:

            David, please stop trolling.

      • David Appell says:

        Bill: from Berkeley Earth:

        “The Urban Heat Island effect is real. Berkeleys analysis focused on the question of whether this effect biases the global land average. Our UHI paper analyzing this indicates that the urban heat island effect on our global estimate of land temperatures is indistinguishable from zero.”
        http://berkeleyearth.org/faq/#question-15

        paper:
        “Influence of Urban Heating on the Global Temperature Land Average using Rural Sites Identified from MODIS Classifications,” Wickham et al., Geoinfor Geostat: An Overview 2013, 1:2
        http://dx.doi.org/10.4172/2327-4581.1000104
        https://www.scitechnol.com/2327-4581/2327-4581-1-104.pdf

      • David Appell says:

        Bill Hunter says:
        David the percent of the globe area for the cities is only relevant to the satellite record. The UHI error for surface weather station records would be the percent of thermometers affected. If 50% of the thermometers are in UHI influenced areas,

        Are they?

        I doubt it, since the Earth is 70% ocean.

        Or do ocean SSTs also have a UHI??

        • bill hunter says:

          David Appell says: “I doubt it, since the Earth is 70% ocean.

          Or do ocean SSTs also have a UHI??”

          David, the sentence I wrote had a big If in front of it capitalized as the primary signal that the sentence was conditional, a perfectly fair practice as long as I don’t do what you love doing of extrapolating as absolute truth from a few data points or a single published paper. And no I don’t expect any UHI effects on the ocean.

      • This is NOT only about “cities”.

        Don’t listen to clueless Mr. Apple.

        This is about economic growth and land use changes that could affect any land surface weather stations.

        A rural station can become less rural = “global warming”.

        The grass and weeds around a rural station can be plowed under, leaving brown dirt (an albedo change)= “global warming”.

        An urban station near buildings could be moved to the middle of a green park = “global cooling”.

        Leftists could drive up to weather stations and aim their tail pipe hot exhaust at them to boost the temperatures — I hear Mr. Apple does this all the time,

    • The US had the coldest winter ( October through April ) in over 100 years, measured by daily average maximum temperatures at the 1,218 Unites States Historical Climatology Network Stations. We don’t care about your alternative facts, Mr. Apple:

      https://elonionbloggle.blogspot.com/2019/05/us-average-maximum-daily-temperatures.html

      • David Appell says:

        Richard GreeneNewDeal says:
        The US had the coldest winter ( October through April ) in over 100 years,

        Not even remotely true, even given your inaccurate definition of “winter.”

        In fact, Oct18-Apr18 ranked as the 56th coldest period of 124 for USA48 since 1895.

        Even recently, Oct13-Apr14 was colder.

        Source:
        NOAA USA48 monthly
        https://is.gd/nN5P9i

        • “GreeneNewDeal” is not funny enough Mr. Apple. Do I have to come up with a better nickname for you to insult me with that will make people laugh? I thought you were a perfessional writer! You can do better than GreeneNewDeal, which would be a complement for a Dumbocrat. Put on your thinking cap. Hire a ghost writer. Get drunk Or perhaps I should say: Get sober?.
          .
          .
          .
          For the U.S. the first half of 2019 was the coldest and wettest January through June on record, based on maximum daily temperatures, at all USHCN stations:

          https://elonionbloggle.blogspot.com/2019/07/2019-had-coldest-and-wettest-us-january.html

          • David Appell says:

            Richard GreeneNewDeal wrote:
            “For the U.S. the first half of 2019 was the coldest and wettest January through June on record, based on maximum daily temperatures, at all USHCN stations”

            I doubt it, RGND.

            The rank of USA48 temperatures (min+max)/2, for the 1st half of the year ranks as 61st highest out of 125 years.

            It is thus very unlikely your claim is true. Or that it matters, since people, plants, oceans etc do not experience minimum temperatures, they experience ALL temperatures

          • Apple:
            I wrote that “coldest” was “based on maximum daily temperatures at all USHCN stations”.

            Do you read before criticizing, Apple?

            The maximum daily temperature is important because it is a daytime temperature when people are awake and likely to be outside.

            Those of us alert enough to notice the weather in the past six months knew it was unusually cool during the day.

            The minimum temperature is much less important because it happens when most people are indoors, often sleeping.

            The average temperature of the day obscures what is really important — how hot did it get during the day?

            How cold it got at night, or near dawn, is not that important to people asleep in their beds (I’ll assume you are outside peeking through windows?).

            Just like a single global annual average temperature obscures important details about the poles versus the tropics, and climate change split by season,

    • spike55 says:

      “Cities comprise only 0.2% of the globe by area. “

      Then WHY is the UHI effect smeared over the remaining 99.8% of the globe, DA?

      You really do have a way of putting your foot in your gob and sucking hard. !!

  6. David Appell says:

    Roy wrote:
    Most of the warming since the Little Ice Age (up to about 1900) occurred before greenhouse gases could be blamed.

    What’s your proof of that, Roy?

    1/7th of CO2’s present forcing happened before 1900.

    From a recent paper:

    “…we demonstrate that multidecadal ocean variability was unlikely to be the driver of observed changes in global mean surface temperature (GMST) after 1850 A.D. Instead, virtually all (97-98%) of the global low-frequency variability (> 30 years) can be explained by external forcing.”

    – “A limited role for unforced internal variability in 20th century warming,” Karsten Haustein et al, Journal of Climate, May 2019. DOI: 10.1175/JCLI-D-18-0555.1
    https://journals.ametsoc.org/doi/abs/10.1175/JCLI-D-18-0555.1

  7. David Appell says:

    Roy wrote:
    Meanwhile, the global average temperature anomaly for June (from NOAAs Climate Forecast System, CFSv2 model) at the surface was only +0.3 deg. C (0.5 deg. F), and even for one day (July 1, 2019, from WeatherBell.com) remains at +0.3 deg. C.

    Sleight of hand.

    You’re comparing a temperature VARIATION of a region for ONE DAY at 5000 ft to the AVERAGE SURFACE temperature of an entire month for the entire globe.

    There are always meteorological explanations for the timing and location of a heat wave. But there is no doubting that global warming shifts the temperature probability distribution to the right and makes a specific heat wave more common and hotter. Exponentially so for a linear increase in temperature:

    https://davidappell.blogspot.com/2015/07/why-very-warm-events-are-much-more.html

    https://davidappell.blogspot.com/2017/08/how-fast-is-probability-of-extreme.html

    • I ALSO included the 1-day average anomaly for the globe (JULY 1) which was also +0.3 deg. C.

      You are making my point for me, though…. weather variations are MUCH larger than climate variations.

      Yes, I agree that warming SHOULD make warm records more frequent, but with UHI, how can we know by how much?

      And why must alarmists like yourself use such misleading statistics, such as “exponential increase” in heat waves? What matters to people is the actual temperature increase, not so much that the event was unprecedented. For example, it’s misleading to claim that the number of heat waves (or heavy rain events) exceeding some arbitrary value has increased by 1,000%, when the actual increase in temperature or rainfall is actually very small. It’s technically true, but misleading in terms of its importance.

      It’s this kind of wishy-washy statistics that make people distrust alarmists.

      • Mike says:

        I distrust alarmist DA because he is only here to be a negative. If he was really here to honestly discuss a topic he wouldn’t ALWAYS post against Roy. Some statements coming from DA would support Roy, even if only a very few. Just negative trolling.

        • David Appell says:

          Why would anyone post to agree with Roy?

          Seems silly. I’m sure Roy doesn’t need my reassurance that I agree with him.

          If I agree with Roy I usually say silent, unless I think I have something unique to add. Usually I do not.

      • David Appell says:

        Roy W. Spencer, Ph. D. says:
        You are making my point for me, though. weather variations are MUCH larger than climate variations.

        Of course they are. No one doubts that, Roy.

        But climate change shifts the weather probability distributions to the right, towards higher temperatures.

        And instead of asking if the heat wave in France was “caused” by climate change, we should be asking if climate change has altered the temperature probability distribution there.

        A NY Times article in the last few days said scientists estimated it was five times more likely than in the absence of AGW.

      • David Appell says:

        Roy W. Spencer, Ph. D. says:
        And why must alarmists like yourself use such misleading statistics, such as exponential increase in heat waves?

        Roy, learn to read.

        I showed that, given a normal distribution, a warmer world increases the chances of extreme temperatures exponentially.

        I showed you the math:

        https://davidappell.blogspot.com/2015/07/why-very-warm-events-are-much-more.html

        If you think I’m wrong, then prove it.

      • Dr Roys Emergency Moderation Team says:

        David, please stop trolling.

    • Nate says:

      Dr. Roy,

      Here is the temp record for Europe.

      https://tinyurl.com/yxukmr4z

      Their is a sharp rise since 1980s of ~ 2.7 F, relatively flat prior.

      Its hard to believe that in Europe The UHI only became important in 1980s.

      Then if you look at all other continents, roughly the same pattern.

      Here’s Africa, whose UHI history is surely different from Europe’s.

      https://tinyurl.com/y6458gxz

      • Roy W. Spencer says:

        Any character of sub-decadal, decadal, or multi-decadal variability can be superimposed upon one or more underlying trends. Alaska warmed up in the late 1970s and then stayed warm…. but that doesn’t mean that climate shift wasn’t superimposed upon one or more long-term trend components, whether warming or cooling.

        For example, look at this time series and tell me what you see. You might read causation into it, but it was created with a time series of low-passed random numbers forcing a 1D model of temperature variability with realistic heat capacity and radiative feedback: http://www.drroyspencer.com/wp-content/uploads/mystery-climate-index-2.gif

      • Nate says:

        Not sure what Im supposed to see?

        Yes ‘trends’ can appear out of noise, but what I see here is a small trend with larger RMS noise.

        Doesnt look like Temp records of the continents I showed above, which show the global trend pattern is the dominant pattern, overwhelming local variation, presumably even UHI, from late 20th century on.

        If UHI is tied to population growth, then Europe will have had a flat UHI effect since 1980s, while Africa will have had its largest UHI effect since 1980s.

        https://upload.wikimedia.org/wikipedia/commons/6/65/Population_Growth_by_World_Bank_continental_division.png

        • Bill Hunter says:

          Your argument is illogical. As we have seen in the data climate change is primarily a northern hemisphere phenomena, thus comparing a northern hemisphere continent with a southern hemisphere one looking for a UHI effect makes no sense whatsoever.

          • David Appell says:

            Bill Hunter says:
            As we have seen in the data climate change is primarily a northern hemisphere phenomena

            Not true.

            Yes, the northern hemisphere is warming faster than the southern hemisphere, which is expected since the SH has more ocean. But even UAH v6 find the SH warming:

            UAH v6 LT trends since 1979 are:

            NH +0.15 C/dec
            SH +0.10 C/dec

          • David Appell says:

            Bill, I don’t see how Nate’s argument is illogical. Could you please explain further?

          • Bill Hunter says:

            David Appell says:
            “Yes, the northern hemisphere is warming faster than the southern hemisphere, which is expected since the SH has more ocean. But even UAH v6 find the SH warming:”

            “Bill, I don’t see how Nate’s argument is illogical. Could you please explain further?”

            David, the temp records also show southern hemisphere land warming much slower than northern hemisphere land.

            The error in logic is in assuming that Africa should be warming faster than Europe because of UHI if UHI was a factor because it has greater population growth.

            So many leaps of logic its hard to name them all. First of all nobody has suggested that UHI was directly linked to population growth. UHI is linked to urban environments with asphalt and concrete coverage of the land, the development of dense jungles of tall buildings etc. None of that is directly connected to population growth and if anything the 3rd world is creating UHI type environments far slower than the developed world, almost by definition.

            Then assuming population growth is directly proportional to UHI, Nate takes the logic leap that therefore Africa should be warming faster than Europe.

            Nate’s argument is illogical because none of his premises even if they are true provide support for his conclusion.

          • David Appell says:

            David, the temp records also show southern hemisphere land warming much slower than northern hemisphere land.

            No they don’t. I gave you the numbers. SH’s warming rate is 2/3rds the NH’s warming rate.

          • David Appell says:

            Then assuming population growth is directly proportional to UHI,

            There’s no justification for assuming this.

            The UHI requires concrete and roof tops and blacktop, not people. Without the former there is very little UHI no matter how any people are put there.

          • Dr Roys Emergency Moderation Team says:

            David, please stop trolling.

      • Nate says:

        I am not assuming UHI is directly proportional to population, by I suspect the two are strongly correlated.

        Europe’s population grew rapidly from 1800s thru mid 1900, and its urvbanization did as well.

        Thats just a fact.

        After 1980 its population growth was very slow. Do you think its UHI effect would have grown more prior to 1980? I do.

        Yet its temperature record is quite flat up to ~ 1980, and takes off after.

        Africa same pattern. Same in South America, North America, Asia.

        Same pattern, not same magnitude. And yes I do think the UHI effect will be shifted in Africa to recent decades, relative to Europe.

        If UHI effect was a significant part of the story in Europe, I think it would have shown up in the record prior to 1960, relative to other undeveloped continents.

        Your ‘illogical’ declaration is a stretch.

        • Bill Hunter says:

          Nate says:, “I am not assuming UHI is directly proportional to population, by I suspect the two are strongly correlated.”

          I also suspect that UHI is correlated to population. but being correlated isn’t a basis for comparison, or a claim of cause.

          The fact is one man can create a UHI effect. It isn’t so much that there is people, its how you go about living that matters the most and big differences in that still exist between Africa and Europe.

          Also Berkeley Earth states: “The topic is not without controversy.”

          Yet there are those who choose to ride roughshod towards what they think is a definitive answer, that Berkeley Earth results are a complete an exhaustive examination of the topic so that you fail to recognize that your little illogical addition to the argument despite correlation completely lacks any controls. The basis of the scientific method is to have everything under control except the experimental variable.

          A failure in logic is when you draw a conclusion not supported by the experiment you offer as proof and thats the case for a comparison where different variables are present aren’t controlled.

          the classic example is the argument that goes: If it rains the sidewalk will get wet. That argument logically supports that when it rains the sidewalk will get wet. Its illogical to claim that it rained because the sidewalk was wet. . . .even though it could be true. There may be other reasons the sidewalk gets wet.

          Its so illogical it has a fallacy named for it. . . .affirming the consequent, or converse error, or fallacy of the converse, or confusion of necessity and sufficiency.

          confusion of necessity and sufficiency is IMHO, rampant in climate science.

        • Nate says:

          Bill,

          Population and UHI are correlated, and it is not an accident.

          Here is urban percentage map

          https://ourworldindata.org/urbanization

          Europe majority urban by 1950s.

          Africa, about halfway urban majority today.

          • bill hunter says:

            Geeez, Nate why don’t you even bother to read my post before replying? I said I believed there was probably a correlation with population, but correlation is an extremely loose concept.

            Trying to fix logic errors with more logic errors doesn’t work well. Unfortunately academics tend to be pretty ignorant people in general due to a lack of real world exposure. I work with academics a lot and there is a huge difference across the board in how aware they are. Farmers and fishermen who are greatly affected by science laugh at a lot of nonsense the academic community comes up with. We work with scientists a lot but the scientists we work the best with spend countless hours in the field actually getting a feel for nature and applying the tools they have learned in their science educations. A scientist behind a desk in a windowless office might be an expert with the tools but has no clue on how to apply them to the real world.

            I experienced that myself coming out of college and taking a private sector job.

            Take for example the figures you just tossed out. You have just made a typical error of a sheltered academic. The figures you offered in support of your argument are all but meaningless in defense of the point you are trying to make.

            Africa is only 40% urbanized which is a minor error on your part.
            But the big error is a completely lack of consideration of effect of population density on the effects UHI will have on mean region temperature.

            Africa is more than 3.5 times less dense in population to Europe.

            And thats just one of the major parameters you failed to even acknowledge. Another more difficult to measure factor is the nature of the urbanization. How much high rise, how much asphalt and concrete per person. Africa is impoverished so the magnitude of that factor is probably nearly off the charts.

            And thats just the beginning. In terms of “development” urban effects are just one of many. I believe that agriculture likely has a larger effect than urbanization and the developed nations tend to be net exporters of food because of being developed and having access to the tools and products to multiply agricultural production.

            So you come in here blabbing like an infant spouting stuff you know practically nothing about because you read it somewhere, probably on a blog populated by other ignoramuses.

          • Nate says:

            “So you come in here blabbing like an infant spouting stuff you know practically nothing about because you read it somewhere, probably on a blog populated by other ignoramuses.”

            Non sequitur, Bill. Nothing I said merits that kind of ad hom BS.

            My post was my opinion, and not meant to be rigorous or publishable. You act like it was intented to be.

            But it was logical, and science types know what that means.

          • Bill Hunter says:

            Nate, I gave you several arguments for why Africa would lag in UHI despite greater population growth. And you are stubbornly trying to avoid acknowledging that. For UHI, population growth is a poor proxy. Like tree rings which are going to be affected by temperature but are affected more by other variables.

            I live in a very small community with a very large UHI factor. Several hundred homes most 3 stories densely packed on very small lots surrounded by nature. It seems abundantly clear that the factors for this UHI effect are the lack of greenery within the community combined with asphalt streets, asphalt roofs, and relatively tall buildings trapping heat while blocking the seabreeze land influences. No valid thermometer could be established in this community for measuring anything but the temperature within the community.

            My community is all of 5% of one kilometer square, extrapolating a thermometer in the community out a radius of 1500km would multiply the UHI error in my community by a factor of 14 billion percent.

          • Nate says:

            Yes, Bill, UHI exists, but you ASSUME that climate scientists are simply oblivious to it, but offer no evidence.

          • bill hunter says:

            practice your readin. skills. nowhere did i claim science was oblivious to it. the main debate is on how to measure it. uscrn should help

  8. stavro says:

    roy
    The most thorough analysis of the UHI effect on U.S. temperature was by Anthony Watts and co-authors, who analyzed the siting of hundreds of thermometers around the U.S. and showed that if only the best (most rural) sited thermometers are used, U.S. warming trends are roughly cut in half.
    —————————
    why has this report never been published. Last I heard was the Climate Audit had fond serious problems – were these fixed?

    • Roy W. Spencer says:

      I had not heard that. From what I understand, one of the co-authors has been taking a long time doing some statistical tests for the paper submitted for publication. I will ask about your claim.

    • Gordon Robertson says:

      ren…”The most thorough analysis of the UHI effect on U.S. temperature was by Anthony Watts and co-authors…”

      http://www.surfacestations.org/

      • David Appell says:

        where was surfacestations.org published?

        It’s just blog crap.

        • Bill Hunter says:

          David Appell says: “where was surfacestations.org published? It’s just blog crap.”

          Sheesh David why don’t you read the site before passing judgement? I went to the link provided and it took me all of 3 seconds to find the published version of the paper.

          https://pielkeclimatesci.files.wordpress.com/2011/07/r-367.pdf

          Just because all you ever post is crap doesn’t mean everything on blogs is crap.

          Not only are not surface stations randomly distributed nor representative, they are sloppily designed and maintained, at least for the purpose of detecting small changes in temperature. And it seems almost a certainty that the US network is superior to that of most nations.

          • David Appell says:

            Not only are not surface stations randomly distributed nor representative

            They don’t need to be. That’s why the averages are weighted by unit area.

          • Dr Roys Emergency Moderation Team says:

            David, please stop trolling.

          • barry says:

            That is not the paper on UHI, Bill. That’s Fall et al (2011), which examined microsite bias regarding min/max temps in the US, corroborating and extending previous work.

            That paper also finds that the best-sited stations mean temp record is a close match to NOAA and GISS US temp records.

            The UHI work is unpublished as yet. As it says in the paper you linked,

            A follow-up study is underway to distinguish and quantify the
            separate effects of siting, instrumentation, urbanization, and
            other factors.

            Don’t know if it’s stalled or what.

          • Bill Hunter says:

            barry says: – That paper also finds that the best-sited stations mean temp record is a close match to NOAA and GISS US temp records.
            ————–

            That makes sense. Almost all the stations are installed in or near human development. Actually being that way was obviously intentional. When a city dweller when checking his weather doesn’t want to hear what the temperature is 1500km out to sea from where he is at.

            So I guess you might say even all that temperature gridding is sort of leaning down the same path. After all the man that wants to know what the weather is and is going to be is for where he is, not where he would like to be.

            I remember staying at a place for a while like 4 decades ago that had a big patio sitting on the side of the house facing the prevailing wind. With no air conditioning we opened the doors and windows there and on the opposite side to let a draft through the house. But that old patio would heat up so hot you couldn’t walk on it and it warmed that breeze coming in the windows by a large degree. So I took to afternoons wetting down the patio to get some evaporation going. It helped. Turned that old patio into a swamp cooler.

  9. stavro says:

    we live 10 miles from Cheltenham uk

    The met office has always given us a lower predicted temperature than Cheltenham.

    Surely this means the metoffice acknowledges UHI?

    Why do you claim different?

    • Gordon Robertson says:

      stavros…”The met office has always given us a lower predicted temperature than Cheltenham”.

      Remember the Cheltenham Flyer?? Or are you too young?

      I’m surprised you get anything from the Met Office since it was lead at one time by Phil Jones of Climategate email scandal vintage.

      The Met Office, aka Had-crut, sounds a lot like NOAA and GISS with their fudging and chicanery. In fact, the Met Office gets their data from NOAA.

      https://wattsupwiththat.com/2009/07/24/uk-met-office-and-dr-phil-jones-pay-no-attention-to-that-man-behind-the-curtain/

      In a Climategate email, Jones admitted to using Mann’s ‘Trick’ (hide the decline) on Had-crut data. In another email, Jones applauded the death of skeptic John Daly.

      Classy guy…classy outfit. [sarc /off].

      • David Appell says:

        Gordon *STILL* doesn’t know what “Mike’s trick” refers to.

      • bdgwx says:

        GR, “Mike’s Nature trick” and “hide the decline” are not the same thing. The former is a statistical technique called principal component analysis (PCA). Mann did not invent it. It is used widely in many disciplines of science. The later is in reference to the divergence problem post-WWII in the field of dendrochronology. The phrase is not in reference to the instrumental temperature trend. FWIW I’m not defending Mann or Jones or here. I’m just letting you know what these phrases mean so that any debate in this regard can be based on fact instead of myth.

        • David Appell says:

          bdgwx says:
          GR, Mikes Nature trick and hide the decline are not the same thing. The former is a statistical technique called principal component analysis (PCA).

          No, that’s wrong.

          PCA is not a trick.

          THe “trick,” if you want to call it that, is using actual temperatures post-1960 instead of proxy temperatures.

          Because proxy temperatures in high latitudes fail after 1960. This is called the “divergence problem.” No one is sure why — it may be pollution, or it may be global warming itself.

          On the Divergence Problem in Northern Forests: A review of the
          tree-ring evidence and possible causes, Rosanne D’Arrigo et al, Global and Planetary Change 60 (2008) 289305.
          http://www.ldeo.columbia.edu/~liepert/pdf/DArrigo_etal.pdf

      • Dr Roys Emergency Moderation Team says:

        David, bdgwx, please stop trolling.

  10. Mark B says:

    From post: The question is, are the number of record high temperatures increasing over time? At least in the U.S., the answer is ‘no’, as the number of days over 100 and 105 deg. F have not increased . . .

    The arbitrary choice of 100 and 105 deg F days seems like a silly proxy for number of record high temperatures. Why not just use daily record temperatures directly if one is interested in that metric?

  11. Bruce of Newcastle says:

    The French heatwave is pretty clearly due to jet stream blocking. Here is a jet stream map of about that time.

    You can see the strong loop to the east and a weaker loop west of Ireland. The stronger loop is blocking movement of air eastwards. At the same time the two loops plus the high pressure system are channeling air up from Africa. The westward loop is keeping cooler sea air from providing any relief over the continent.

    Such sinuous Rossby wave patterns are common during solar minimums. A similar pattern caused the great Moscow heatwave of 2010.

    • Bindidon says:

      2003 on a solar minimum? Really?

      It’s easy to compare a GHCN time series for FR with the 10.7 cm flux…

      • Bruce of Newcastle says:

        What is that about? We’re in a solar minimum now and a feature of solar minima are sinuous Rossby waves and jet stream blocking events. They can cause unusual cold or hot. It’s very well known that the 2010 the great Moscow heatwave was caused by jet stream blocking, as was the white out of the UK in the winter of that year. Mike Lockwood pointed out that low solar activity caused such patterns. Mike is an IPCC lead author.

        • Gordon Robertson says:

          bruce…”What is that about?”

          Binny just shows up every so often and says silly things. Once he disappeared in a snit and re-appeared as a female.

        • Bindidon says:

          Bruce of Newcastle

          I repeat: the problem with your comment is that 2003 never and never has been in any solar minimum.

    • François says:

      Sure, but it did not happen last year, nor at any time during the last couple of centuries. And, by the way, there is not much of an UHI effect in a town of 3000some inhabitants. Mr. Spencer telling us about Miami’s population in the year 1900 and today’s was funny, it does not hold when it comes to the population of European countries.

    • David Appell says:

      Bruce of Newcastle says:
      The French heatwave is pretty clearly due to jet stream blocking

      And why is the jet stream blocking occurring?

    • Dr Roys Emergency Moderation Team says:

      David, please stop trolling.

  12. Bindidon says:

    I read somewhere above a typical pseudoskeptic statement:

    “Or how about 40 years of southern ocean declines? (HADSST3)

    Hilarious.”

    Fourty years of Southern Ocean declines ??? What ???

    (1) Here is HaddSST3 SH from 1979 till now, from Paul Clark’s WFT:
    http://www.woodfortrees.org/plot/hadsst3sh/from:1979/plot/hadsst3sh/from:1979/mean:36

    (2) Here is the evaluation of the download from
    https://www.metoffice.gov.uk/hadobs/hadsst3/data/HadSST.3.1.1.0/diagnostics/HadSST.3.1.1.0_monthly_sh_ts.txt

    to which UAH6.0 LT’s time series (SH ocean)

    (the usual suspect, column 11, can’t access tinyURL right now, 525)

    was added just for fun, ha ha ha, using a well-known spread sheet calculator.

    https://drive.google.com/file/d/1gNHlhA5S29xYd28dI__gIic55qTwk1T2/view

    Linear trends for 1979-2019, in C / decade:
    HadSST3 SH: 0.091 +- 0.004
    UAH6.0 LT SH ocean: 0.093 +- 0.007

    Incompetence and ignorance are absolutely hilarious indeed. Absolutely!

    • Dr Myki says:

      B, exactly!
      That is one reason why I come back to this site when bored.

      • Richard Ferris says:

        Always believe what paid scientist tell you. Especially those paid by organizations that will only accept one type of answer from the research.

        Since there is ZERO doubt that the earth will return to an ice age in the near future ( 50 to 1000 years? ) , why not worry about the problem that is 100% real and 100% going to happen?

        Winter is coming………….

      • Dr. Myki, the horse podiatrist, returns, and then the rest of us get bored with his bloviating.

    • Gordon Robertson says:

      binny…”Here is HaddSST3 SH from 1979 till now…”

      Had-crut gets its data from NOAA, as does GISS.

      Had-crut = NOAA = GISS = fudged.

  13. matthew dalby says:

    The only reason the recent hot weather in Europe attracted so much media attention was because various media attention was because outlets such as the BBC and Guardian here in the U.K. (and presumably other equally biased organisations in other countries) knew they could use it to push their global warming agenda. In reality it was a very minor event in that it lasted for less than a week compared to last years heat wave which lasted for several months. I bet that 30 years ago before global warming achieved such a high profile there would’ve been a few short stories buried deep inside a few newspapers and no more.
    Here in Northern Scotland we obviously missed the “worst” of the heat, but had a few warm days followed by a temperature drop of aprox. 16 degrees in 24 hours as the warm air was pushed aside by cooler air off the Atlantic. I haven’t looked up the figures for what actually happened, but the forecasts were predicting similar if not greater one day drops in temperature over much of Western Europe as the cooler air pushed East over the past few days. If temperatures can change this much from day to day then I fail to understand how an increase of a couple of degrees over many decades can have any noticeable effect what so ever. Indeed I (and presumably the vast majority of people) would be unable to tell the difference between, for example, 75 degrees and 77 or 78 degrees. Presumably the same goes for the rest of the living world as well. Given that all of life can cope with large temperature changes from one day to the next then presumably it can cope with much smaller changes taking place over tens of years.

    • Dr Myki says:

      Mathew, one method for interpreting projected changes in mean temperature is to look at the mean annual temperature for surrounding regions. In your case, plus 2 degrees could be the same as moving from Northern Scotland to Southern England.
      So yes, you might cope very well – in fact, you may thrive! However, you would have to give up producing whiskey and start making sparkling wine.

      • Gordon Robertson says:

        Mickey…”Mathew, one method for interpreting projected changes in mean temperature…”

        This is the sort of bs we must endure around here, Matthew. How does one interpret a ‘projected’ mean temperature?

        Might as well claim to have pulled the temperature from a hat.

      • Mike Flynn says:

        DM,

        Are you trying to look intelligent by providing answers to questions which were never posed?

        Why would he have to give up producing whiskey and start making sparkling wine? Are you quite mad? Whisky is currently produced in England and Wales – why would it not be?

        Average temperatures are an exercise in futility, by themselves. For example, if I tell you that the average monthly temperature is 26 C, what does that tell you about a location?

        Not much – it tells you nothing about minima or maxima. This sort of silliness has resulted in the deaths of special forces soldiers who were kitted out on on the basis of average temperatures in a desert region. Freezing temperatures proved to be a more effective killer than the maxima.

        Your comment about comparing projected temperatures with actual temperatures is equally pointless. What about humidity, rainfall, geography, etc? You sound like a witless pseudoscientific climate cultist, dispensing unasked for opinion backed up by precisely nothing of use.

        Cheers.

        • Dr Myki says:

          Calm down and lighten up.
          I am sure Mathew found my contribution very informative.

          • Mike Flynn says:

            DM,

            Thank you for your interest, misguided as it might be. I do as I wish.

            You wrote –

            “I am sure Mathew found my contribution very informative.” Appealing to your own authority may not be persuasive.

            I am sure you will find my contribution very informative.

            Cheers.

          • Dr. Myki:
            That was the first post under your name that made sense, and was even amusing.

            I assume you hired a ghostwriter.

          • Dr Myki says:

            RG, I am glad to have helped you.
            However, it takes considerable effort on my part to dumb down the science so that even you can understand it.

          • Dr Roys Emergency Moderation Team says:

            Myki, please stop trolling.

      • Richard Ferris says:

        Wow, and how do explain it was warm enough during the Roman era in England when it is not yet warm enough to do so now??

        How does one explain all the dead trees that grew above the current tree lines if it was not warmer in the recent past??

        Quoting studies from discredited government organizations does little to nothing to convince a realist on climate as we all know how much “adjusting” of the data they have done to promote the hoax.

        If all you can do is quote propagandist research, then you do not think much on your own. Can you answer any of the questions I have poised on this thread??

        If you go to any of the realist sites you have been told not to go to, do you understand the issues being discussed???

        Most of what you say or reference starts with the assumption that CO2 is the cause……..and build on that foundation of sand.

        It is said that the higher the education level the harder it is to change an opinion that was not originally based on the facts. This would seem to describe you.

        Are you so illiterate that you believe an ocean that is saturated with CO2 can absorb more???? Base ocean cannot become acidic.
        Please explain how you can believe a hoax based on the relationship of CO2 and temperature that itself is based on the fact that the ocean is saturated with CO2 . So when it warms, like now, it out gasses CO2 (1/3 to 1/2 of the increase) and when it cools it sucks more CO2 in. Does a Doctor know/understand the gas laws of physics that is the basis of my statements??

        You can do better Doc!

      • Richard Ferris says:

        OOPs, my reply to this is down 4 posts…………..

    • Gordon Robertson says:

      matthew…”I fail to understand how an increase of a couple of degrees over many decades can have any noticeable effect what so ever”.

      Most sane people who understand science would fail to understand it either, Matthew.

      And…lack may yer lum reek, wae ither folks coal.

      • Dr Myki says:

        A prize for correctly guessing which group GR belongs to.
        Sane people who understand science
        or
        Insane people who understand science
        or
        Insane people who dont understand science
        or
        Sane people who dont understand science.

      • David Appell says:

        matthew
        I fail to understand how an increase of a couple of degrees over many decades can have any noticeable effect what so ever.

        The global average temperature difference between the Holocene and the depth of the last glacial maximum (23,000 yrs ago) was only 5 C.

      • Dr Roys Emergency Moderation Team says:

        David, please stop trolling.

  14. gallopingcamel says:

    Even though there were no thermometers in 1578 we know that the weather was hot and dry that year. One could walk across the river Seine near the Ile-de-France. The hot summer of 2019 does not come close to what happened 440 years ago before the invention of SUVs:

    You can find the full text here:
    http://www.eu-drought.org/technicalreports/10863624/DROUGHT-R-SPI-Technical-Report-No-35-Historic-droughts-beyond-the-modern-instrumental-records-an-analysis-of-cases-in-United-Kingdom-France-Rhine-and-Syros
    QUOTE
    The drought of 1578
    The 1578 drought is very probably one of most extreme of the history of France of the last five centuries. Despite the lack of instrumental data at that time, there are a plethora of written testimonies in archives because of its severity (Fig. 17). It is during the winter of 1577 when archives mention for the first time a
    “rather dry” season, followed by a very hot spring the same year. The low precipitation continues and in April 1578, archives evoke the general concern about the harvest outlook. They spoke of barley and hemp, which did not grow and pro pluvia processions were organized in Paris by the municipal authorities. Figure 17. Progress of the great drought of 1577-1578 in Ile-de-France according to the written
    archives.

    The environmental crisis reached its climax in the autumn in Ile-de-France where springs and fountains dried up. In the countryside, farmers spoke about the soil being difficult to plough because of being completely dry to a depth of 1.20 m. On the water management plan, it was the whole of the Seine basin that was affected. Low-water then affected the Seine, the Yonne and the Marne rivers and in June, it was even possible to cross the Seine on foot in Paris. This had catastrophic socio-economic consequences.

    It prevented the wood and wheat supplies to the city on the eve of the winter and led to the lay-off of mills. Wheat being rare in the market and grinding impossible, bread prices shot up and diseases gained ground. In total, during 565 days dryness was observed in the archives between 1577 and 1578, and there were only 15 rainy days.
    UNQUOTE

  15. Amillena says:

    Hello from Spain

    Nobody remembers the snowfalls in mountain areas (at 1200 meters) and the frosts in areas of Spain only 20 days ago, with minimun or near minimum temperatures for a month of June.

    Regarding the maximum temperatures recorded this past June in Spain and west Europe:

    1)In my area (northern Spain) some maximum temperatures have been reaching for 70 years in june. It is a long time without registering such high temperatures…

    2)What is the physical difference betwen 29 june and 2 of July?…however, we impose an “artificial wall” ( the month) between consecutive days for considering maximun or minimun historical records

    3)Thermometers are often in airports close to urban areas.70 years ago, the airports were little aerodroms and the urban areas were small. Now we have weather stations in big airports and the urban areas are 5 times bigest than 70 years ago.

    3)We assume as valid many temperature measurements, but we do not know where is the location of the weather station, the solar insulation of the sensor or its calibration. If you visit weather stations you get great surprises

    4) How many meteorological stations remain in undisturbed places more than 50 years with the same meteorological instruments and big Stevenson Screens?

    Thanks

    • Bindidon says:

      Amillena

      You write

      “1)In my area (northern Spain) some maximum temperatures have been reaching for 70 years in june. It is a long time without registering such high temperatures…”

      Here is the top 10 for the June anomalies wrt the mean of 1981-2010, up to June 2018, out of an average of the ten northernmost Spanish stations registered in GHCN daily (among them San Seb and Santander for example):

      2003 6 1.71
      2005 6 1.49
      1976 6 1.33
      2004 6 1.31
      2017 6 1.22
      1950 6 1.19
      1952 6 1.02
      2006 6 0.98
      2014 6 0.92
      1989 6 0.85

      Yes: 2015, 2016, 2018 are missing, and 2019 certainly would have been absent as well if I had the data.

      A commenter visiting Tarragona in June since 15 years wrote recently that June 2019 was the coldest of all.

      “3)Thermometers are often in airports close to urban areas.70 years ago, the airports were little aerodroms and the urban areas were small. Now we have weather stations in big airports and the urban areas are 5 times bigest than 70 years ago.”

      I understand what you mean but I nevertheless recomend to read this paper:

      https://www.scitechnol.com/2327-4581/2327-4581-1-104.pdf

      Egun atsegina izan
      J.-P. D.

    • Bindidon says:

      Amillena

      I forgot to add a link to a rather interesting comment:

      https://tinyurl.com/y2logz9v

  16. Oliver says:

    “We have no temperature measurements during the Medieval Warm Period of 1,000 years ago.”

    Isn’t it possible to see drastic changes in earth climate by analyzing ice core drillings and conserved trees? Starting around 10,0000 years B.C. wood clearing has caused a steep rise in atmospheric CO2. While the beginning of rice cultivation around 7,000 years B.C. has caused a steep rise in atmospheric methane (according to Prof. Lesch). I’m curious about your view of these two events: Didn’t they influence temperatures considerably?

    • Svante says:

      Yes, the agricultural revolution might have added as much as the industrial revolution to global temperatures, but not enough to reverse the natural cooling trend.

      https://www.nature.com/articles/s41598-018-28419-5

      • Mike Flynn says:

        S,

        Oooooh! Another modelling paper!

        How quaint!

        From the paper –

        “Our global climate model simulation driven by orbital parameters and observed greenhouse gas concentrations at the end of MIS19c is 1.3 K colder than the reference pre-industrial climate of the late Holocene (year 1850). ”

        What has any your “reference” to do with reality?

        Cheers.

        • David Appell says:

          All scientific papers are modeling papers.

          Even more — all science is modeling.

        • Svante says:

          And why are we warmer than MIS19?
          Most other interglacials have a sharp peak, ours is drawn out.

          • Bill Hunter says:

            Svante says: “July 5, 2019 at 1:11 AM
            And why are we warmer than MIS19?”

            Good question. MIS11 is similar to the current interglacial in terms of its drawn out nature.

            Shake, rattle, and roll here in California, another strong earthquake, preliminary from Caltech 6.9 magnitude a few miles from the previous one while I was writing this.

          • Svante says:

            Yes, the jury is still out but Ruddiman says:
            “MIS 11 was once claimed to be the closest MIS 1 analog (for example, Broecker and Stocker, 2006), but that claim is now rejected because obliquity and precession peaks in MIS 11 were far offset.”

            See fig. 1 in: https://tinyurl.com/y66xzyxq

            “The long duration of MIS-11 is related to a particular combination of eccentricity, obliquity and precession as well as to its long-lasting high CO2 concentration.”
            https://tinyurl.com/yx8mecna

            The more drawn out forcing removed most of the Greenland ice sheet, implying a strong snow/ice albedo feedback?
            https://tinyurl.com/yxaborsl

          • Bill Hunter says:

            Yep see’n as how we now know everything about everything that was an easy call to make.

          • Svante says:

            Yep, less and less room for doubt.

          • Bill Hunter says:

            Svante says: “Yep, less and less room for doubt.”

            Actually more room for doubt. Nature is amazing in its complexity and as one delves deeper into the mysteries of nature it raises questions a lot faster than it answers them. Doubt is only reduced by ever more complex correlations that begin to clearly statistically set themselves apart from other possible answers.

            The most difficult correlation to make in nature is one without being able to clearly see variation in time with the controlling variable. So in developing natural sciences especially in face of short term effort, mostly what you see at first is more complexity to deal with.

            Its hard with flora and fauna with short generational reproductive cycles and actually still remains beyond reach for many species with long reproductive generations. Climate science appears to have generation times that reach into millennia because of the massive heat capacities of the oceans and due to the fact we don’t even have any statistically sufficient measurements of the entire bottom half of the oceans. Fortunately there is an effort underway in ARGO to address that huge gap, but its likely to take another human generation or two to really start getting a handle on it.

          • Svante says:

            The doubt is in the details. The big picture is clear.

            ARGO measures down to 2 km, there is little effect below that, and whatever effect it has must propagate through the upper layers. There is no evidence that the current warming comes from the abyss.

            The ENSO can be ignored because it is short term.

            The PDO is not visible in global record because it has a plus and minus pole at the same time.

            The only long term cycle that affects global temperatures cycles is the AMO cycle. Now the AMO has been explained as a secondary effect from other primary forcings:

            https://www.carbonbrief.org/guest-post-why-natural-cycles-only-play-small-role-in-rate-of-global-warming

          • Bill Hunter says:

            Svante says:
            “ARGO measures down to 2 km, there is little effect below that, and whatever effect it has must propagate through the upper layers. There is no evidence that the current warming comes from the abyss.”

            LOL! Nice handwave! This is a portion of my theory. Ice has come and gone over the decades. This coming and going of ice I theorize as having a huge impact on the ocean bottoms. Strip the ice off the Arctic ocean and warm currents moving north can rapidly cool without an insulating layer of ice.

            In turn the ocean surface is exposed to wind chilling as the atmosphere up there drops well below zero and the water can be cooled at a much accelerated rate. In addition the loss of ice extent makes for far larger refreezes each winter. The areas stripped of ice are the coldest climates in the world. The conversion of seawater into freshwater ice squeezes heavy very cold brines out of the ice and they sink to the bottom often leaving frozen columns of water in their path. This brine input provides the convective forcing for the thermohaline currents and the saltiness of the water causes it to travel along the bottom rather than form a nearby rising column of water.

            Eventually in the temperate and tropic regions upwellings of cold water occur. So loss of ice leads to eventual atmospheric cooling (so much for positive feedback). And as the atmosphere cools ice begins once again covering the arctic ocean. Now with very little cold brine input the ocean bottom begins to slowly warm from heat from the core and heat from the surface, reducing the the effect of cold zone upwellings.

            ENSO is a natural process of upwelling that occurs on the coast of south America. Its caused by offshore wind patterns and a piling up of warm water in the western Pacific reaching perhaps 10″ higher than the eastern Pacific. Ocean oscillations don’t cause this effect but influence its temperature effects and frequency.

            One can argue how much the net effect of this is, but its really the only explanation for why the ocean bottoms are so cold while being sandwiched between two relatively hot places. Looking at temperature records it appears the effect on a multi-decadal scale can reach about 8 tenths of a degree, whereas the individual ENSO events can influence global temperatures by as much as 5 tenths of a degree.

            I see these processes and internal heat exchange events that have no effect on long term warming say on trends over about 70 years or so. My astrometeorologist says 72 years but I take that with a grain of salt.

            Longer term events seem likely to be occurring via the history handed down over the centuries while instrument records were either unavailable or very scanty. Exactly what their nature might be is beyond me, but since heat exchange events in the ocean more or less handles changes of almost one degree C without any external forcing, that would seem to be in the range of an external forcing event that might take centuries to play out. Recent studies show areas of the Pacific ocean still cooling from the LIA while most of the ocean is believed to be warming. That warming will be manifested at the surface via upwelling water, perhaps even more robustly than cold water upwells since the warmer water is lighter.

            Understanding the dynamics and measurements posed by these conditions is a real challenge as cold water upwellings could be somewhat focused by geographical steering of very slow moving ocean bottom currents while heat of an atmosphere immediately above the ocean may continually supply downwelling heat via conduction from a long ago change in climate due to some solar event. Global warming proponents in fact claim heat is being lost in the ocean and it should be during a warm phase oscillation. My astrometeorologist again times the end of that warm phase as this year. Again I take that with a grain of salt. For over 30 years its been my job to pick the right signal out of a messy situation. I have a pretty darned good track record and know what I am looking for. When I see I will be on one side of the other. Right now I am just skeptical and I am completely unconvinced by what I have seen so far. I have an alternative theory for the greenhouse effect but I am not 100% sure that it isn’t influenced by increasing greenhouse gases as I whole heartedly endorse that greenhouse gases are absolutely necessary for the environment we enjoy today. But again one has to be careful of a causal fallacy where one confuses necessity with sufficiency.

            The ENSO can be ignored because it is short term.

            The PDO is not visible in global record because it has a plus and minus pole at the same time.

            The only long term cycle that affects global temperatures cycles is the AMO cycle. Now the AMO has been explained as a secondary effect from other primary forcings:

          • Svante says:

            Well here’s some science:
            “Improved estimates of ocean heat content from 1960 to 2015”
            https://tinyurl.com/y63w765u

            Fig. 6 shows that the energy anomaly is:
            – positive in all ocean layers (so it does cool earth).
            – mostly at the top.
            – consistent with the TOA radiation imbalance.

            https://tinyurl.com/yxu9jlrf

          • Bill Hunter says:

            Svante says: “Well heres some science:”

            Yep, Al Gore 1995 IPCC appointee colluding with the Chinese government.

          • Svante says:

            You mean “The concept of global warming was created by and for the Chinese in order to make U.S. manufacturing non-competitive”?

            The concept of global warming was created by and for the Chinese in order to make U.S. manufacturing non-competitive.— Donald J. Trump (@realDonaldTrump) November 6, 2012

          • Bill Hunter says:

            Do you think China is going to give up the exemption from needing to comply with the Paris accords that Obama gave them?

          • Svante says:

            Didn’t know that, please tell me about it.

          • Svante says:

            It doesn’t say that “Obama gave them an exemption”.

          • Bill Hunter says:

            Svante says: It doesnt say that Obama gave them an exemption.

            Cripes how naive can you get? Obama is the only American that signed the deal, it didn’t go into force in the US because the Senate refused to ratify Obama’s giveaway.

          • Svante says:

            Cripes, it is in force by an executive order.

          • bill hunter says:

            trump agreed to continue reporting emissions and hopefully will continue that after officially withdrawing

  17. Lasse says:

    Solar brightening is happening since 1980.
    It has an impact not to be neglected!
    10% more energy thanks to less clouds.
    17% more hours of sun since 1980.

    Climate change!

  18. Stephen w says:

    Nate, hes saying most of the warming that did occur prior to 1900 occurred absent of GHG emissions.

    He is not saying there was more warming before 1900.

    • bdgwx says:

      If this is in reference to me then yes. That is what I was saying.

    • David Appell says:

      Stephen w says:
      Nate, hes saying most of the warming that did occur prior to 1900 occurred absent of GHG emissions.

      So what caused that warming?

    • bdgwx says:

      Prior to 1900 the bulk of the warming was likely due to increased solar radiation and a quiescent period of volcanic activity (relative to the LIA era anyway).

      • David Appell says:

        Proof? Evidence? Data?

      • bdgwx says:

        CO2 concentration in 1900 was 290 ppm. This represents a radiative forcing of 5.35*ln(290/280) = 0.19 W/m^2. And using a modern estimate of the climate sensitivity of 0.75C per W/m^2 gives us about 0.19 * 0.75 = 0.14C of warming as a result of CO2. You’ve already presented evidence that the LIA was caused by a more active volcanic era. It certainly didn’t hurt the Maunder Minimum was occurring during this time. Volcanic activity waned and the Modern Maximum began and peaked in 1958. The trough to peak in the solar cycle was likely in the range of 1 W/m^2. I’m not saying that the anthroprogenic factors were zero, but I’ve seen no compelling evidence that they represented a majority portion of the radiative forcing between the LIA and 1900. I could be wrong. But if I am then that means the climate sensitivity (in C per W/m^2) for CO2 would have had to decrease since 1900 for the numbers to all add up. And there’s strong evidence (see the work by Hansen) that climate sensitivity tends to increase not decrease during periods of sudden climatic change.

        • Gordon Robertson says:

          bdg…”CO2 concentration in 1900 was 290 ppm”.

          Alleged warming. The IPCC cherry picked that value among CO2 concentrations in ice cores as high as 2000 ppmv.

      • David Appell says:

        You wrote:
        Prior to 1900 the bulk of the warming was likely due to increased solar radiation and a quiescent period of volcanic activity (relative to the LIA era anyway)

        Instead of meaningless hand waving, I want to see proof of your claim — the data and evidence.

        It doesn’t look like you have it.

      • Dr Roys Emergency Moderation Team says:

        David, please stop trolling.

  19. Steve Cowan says:

    Highest and Lowest Temperatures for the 50 states for the past 200 years:

    https://en.wikipedia.org/wiki/U.S._state_temperature_extremes

    In the past decade: 1 state with a new high; 2 states with new lows;

  20. bdgwx says:

    Interestingly my hometown of St. Louis has one of the most well known urban heat islands. There have been a lot of peer reviewed studies and research conducted here. One thing that makes this doubly interesting is that the metropolitan area is also near the corn belt where agricultural activity is affecting the climate as well. Back to UHI…in our case it affects precipitation as well. It has been observed that thunderstorm activity is greatest on the downwind side of the metro area in the summer and that this effect may be caused not only by the radiation flux changes but by the surface roughness changes as well. Perhaps the UHI may be affecting thunderstorm activity in the area even today.

    • Mike Flynn says:

      b,

      The really interesting aspect (for me) is that nobody can foretell future states of a chaotic system. Lorenz stated he was talking literally when he posed the question “Does the flap of a butterflys wings in Brazil start a tornado in Texas?”

      The answer is a definite and resounding “maybe”.

      There is no minimum initial parameter change which may result in chaos from a system capable of such.

      The nature of chaotic systems such as the Earth is such that assumptions or guesses are as good a way of predicting future states as the most intense numerical methods. Night tends to follow day, the seasons progress, all humans will die, and so on. More than 99% of all species created are now extinct. Sh*t happens.

      Don’t worry. Be happy. In the immortal words of Kung Fu Panda –

      “The past is history, the future’s a mystery. All we have is now, and it’s a gift. That’s why it’s called the present.” Or something like it.

      Cheers.

    • David Appell says:

      “The Urban Heat Island effect is real. Berkeleys analysis focused on the question of whether this effect biases the global land average. Our UHI paper analyzing this indicates that the urban heat island effect on our global estimate of land temperatures is indistinguishable from zero.”
      http://berkeleyearth.org/faq/#question-15

      paper:
      “Influence of Urban Heating on the Global Temperature Land Average using Rural Sites Identified from MODIS Classifications,” Wickham et al., Geoinfor Geostat: An Overview 2013, 1:2
      http://dx.doi.org/10.4172/2327-4581.1000104
      https://www.scitechnol.com/2327-4581/2327-4581-1-104.pdf

  21. Geoffrey Williams says:

    Thank you Roy for explaining and revealing the true nature of these hot weather conditions that have recently occurred in Europe. I believe that we are lucky to have you as a world climate watchdog against the perverse claims of the various national meteorological departments egged on by an uninformed media.
    Regards Geoff Williams

    • Dr Myki says:

      And God bless Donald Trump.

      • Gordon Robertson says:

        mickey…”And God bless Donald Trump”.

        God has already blessed him. He saw that Hillary Clinton might become president and caused the Democrats to disintegrate through creating a bs connection to the Russians.

        Doesn’t mean God likes Donald, it just means he did not see the point in having an airhead like Hillary running the US. Might as well have Donald.

        • Dr Myki says:

          yeah.
          sure.
          whatever.

        • David Appell says:

          Gordon, Russian interference in the 2016 election is an established fact.

          Don’t try to argue facts, Gordon, it just solidifies your reputation.

          • Mike Flynn says:

            DA,

            It is a great pity that nobody in the previous administration (including the oxymoronic intelligence community, the FBI, or even the President) was aware of the cunning Russian machinations to make a mockery of US democracy.

            If the previous administration was that incompetent, they need a damn good shaking. Sack the lot, if they were too thick to know what was going on, or they knew, but were too thick to be able to do anything about it!

            If you are right, why did you put up with such a collection of incompetent fumbling bumblers? Would you go to war at their behest? I suppose you would – you’re pretty gullible, by the look of things.

            Cheers.

          • bill hunter says:

            good one Flynn!!

            And who, disguised as Donald Trump, mild-mannered executive for a great metropolitan development company, fights a never ending battle for truth, justice and the American way by pulling the wool over the eyes of 17 corrupted from the top US security agencies.

  22. As for Miami International Airport setting a new record of 98 F for the month of May: I just tried some factchecking of this. Isn’t that airport KMIA? Isn’t the record high set there for May being 98 set on 5/28/2017? Isn’t the highest temperature recorded there in May 2019 95 F on the 14th and 15th, breaking previous records for those dates by 1 degree F?

  23. Paul Aubrin says:

    Mount Aigoual new record could be the result of sampling.
    Maximum-minimum mercury thermometers were replaced 30 years ago with platinum resistance thermometers. Older thermometers had much more thermal inertia. New thermometers are sampled more frequently (but I could not determine how frequently). A higher sampling frequency translate into peaks being sharper.
    Example:
    http://www.woodfortrees.org/plot/triangle:10/mean:48/plot/triangle:10

    • Dr Myki says:

      Peaks are sharper – yes
      But that applies to both maxima and minima.
      There should be no bias with respect to the ratio of new warm records and new cold records.

      • Paul Aubrin says:

        In a given place, temperatures fluctuate by ±2°C within minutes. A high frequency thermometer will faithfully record the temporary maximum, a LIG thermometer with less inertia will not.
        Only record high temperatures were published by media. Nighttime temperatures were not so warm.

  24. JimGiordano says:

    We’re still colder than the Medieval Warm Period, and certainly colder than the even warmer Roman and Minoan Warm Periods. They were farming in Iceland! So the whole recovery since the minima of LIA and up to today is well within natural variation. There’s various records out there that show the MWP was indeed global as well.

    • Bindidon says:

      Oh welcome to the probably millionth commenter posting such stuff without any reference to published material…

      Great.

    • Rune Valaker says:

      You really look like a smart and well-informed guy. They where farming in Iceland? Well, there has been continuous farming on Iceland the last 1000 years, also during LIA.

      • Bindidon says:

        Rune Valaker

        The ‘smart’ guy above of course was meaning… Greenland and all these Norse ‘farmers’ who in fact all were walrus hunters seeking for their tusks’ ivory until it became really unprofitable.

        • Svante says:

          Yes, they exported more walrus tusks than they could possibly have collected themselves, which implies trade with eskimos.
          It became unprofitable when the Portuguese started shipping African ivory I guess.

        • Rune Valaker says:

          To Bindidon and Svante. The Nordic settlements in Greenland and their fate have been researched for several decades by Scandinavian scientists. It’s still a mystery, and climate probably played a role. I have not read that walrus teeth played a major role. Probably a lack of contact with Iceland and Norway and a no supplies of shipbuilding material that again stopped trading was more important. All in combination with a hostile attitude between the Inuit and the Nordic peoples.

          I present a link of an able Norwegian professor emeritus;

          https://forskning.no/historie-kronikk-kultur/slik-levde-norrone-bonder-pa-gronland-i-vikingtida/1276640

          Try it on Google Translate.

          • Svante says:

            Your article says “The source material does not support a hypothesis that emphasizes climate deterioration and ecological problems”.

            But yes, there must have been many factors.
            The black death appeared around the same time.

          • Bill Hunter says:

            Well we know the glaciers in southern Greenland were advancing at the time of the disappearance. The article does say the Norsemen did not disappear because of climate change, demonstrating yet once again that humans are actually quite adept at adjusting to such phenomena. More likely the cause was indirectly related to climate. Perma-frozen seaways would push the Inuit hunting grounds south due to marine mammals not being as adaptable to increasing year round ice.

          • David Appell says:

            Bill Hunter says:
            Well we know the glaciers in southern Greenland were advancing at the time of the disappearance.

            And how do we know this?

          • Svante says:

            Unlucky citation, it puts the maximum extent at 1340 years ago:

            This transition from colder to warmer conditions in southern Greenland and the contemporary retreat of ice from the Narsarsuaq moraine are concurrent with northwestern European cooling from the Roman Warm Period into the Dark Ages, which would lend support to the hypothesis that late Holocene climate variability in southern Greenland did not necessarily track that of northwestern Europe

            You’re probably right about the western settlement.

        • Paul Aubrin says:

          An abandoned Viking farm named “Gard Unter Sandet” in Kalaallit (Nanuata) was dug out of permafrost [see http://collectionscanada.gc.ca/obj/s4/f2/dsk2/ftp04/mq22551.pdf%5D. From what was found there, its inhabitants were assuredly farmers.

          • Svante says:

            Interesting paper, delete everything after ‘.pdf’ to make the link work.
            The site is in the western settlement.

          • Dr Roys Emergency Moderation Team says:

            Svante, please stop trolling.

    • bdgwx says:

      Can you post links to the lines of evidence you are considering when making this bold claim that the MWP was warmer globally than today? We would like to review the material.

      Also, which physical processes specifically are causing this magnitude of “natural variation” especially after 1950? It would be super helpful if you could post links to this information here as well.

      • David Appell says:

        The MWP has already been settled:

        “There were no globally synchronous multi-decadal warm or cold intervals that define a worldwide Medieval Warm Period or Little Ice Age.”

        — “Continental-scale temperature variability during the past two millennia,” PAGES 2k Consortium, Nature Geosciences, April 21, 2013
        http://www.nature.com/ngeo/journal/v6/n5/abs/ngeo1797.html

        • Paul Aubrin says:

          The MPW has been settled: there were warm events all over the world.
          More than 1200 paper showing its reality have been gathered here:
          https://www.google.com/maps/d/viewer?mid=1akI_yGSUlO_qEvrmrIYv9kHknq4

          For each location on the map, a reference to a scientific publication is given, and the relevant part of this publication is quoted.

        • Svante says:

          The keyword is synchronous, I’m glad you didn’t drop that David.

          • Bill Hunter says:

            Synchronous? You mean the warming that reversed the cooling wasn’t synchronous with anything?

            And of course there was a MWP because it was warmer before it started getting cooler or it wouldn’t have been cooling.

            This is all just one of those argumentum ad ignorantiam examples we see so often in climate science trying to pacify the masses by claiming that those who know better than everybody else indeed do know better than anybody else but they just don’t have a clue just how ignorant they are but rest assured they are less ignorant than anybody else or at least they think they are! LOL!

          • Svante says:

            David’s reference is good.
            Instead of trying to describe it, just look at fig. 2.

          • bill hunter says:

            Well I think maybe a nice picture is good for the all the youngsters, right?

            As we see with natural variation of all sorts like multi-decadal oscillations when SST patterns in the north Pacific align in certain ways for several decades at a time, the actual alignment still shifts in time with the much shorter ENSO cycle and the multi-decadal patterns are only a dominance of El Nino over La Nina for the warm phase or vice versa for the cold phase.

            Natural variation doesn’t typically reveal itself as a pattern most are capable of comprehending, our small brains tend to classify and group stuff in ways quite unnatural.

            I would remain skeptical of such attempts to show a lack of synchrony because that is in fact the natural order of the system even today. You look at the map and you see a dominant pattern of warmth, look at a map today and you see the same thing. Its quite amazing you don’t get that.

          • Svante says:

            Your Nino talk made my head spin, but I do think I got the rest of what you said.

          • Bill Hunter says:

            All I am saying Svante is within natural warming and cooling patterns there are smaller shorter term patterns of warming and cooling.

            You can see that at work daily in the ocean. At a small scale current directions are constantly changing from the tides. Current direction changes occur about 4 times a day, not unlike winds that undergo daily changes due to a rotating planet in relationship to the sun.

            Seasons come and go bringing larger movements. Tides keep doing their thing, while the sun effects undergo longer seasonal changes.

            ENSO is a pattern of winds piling up warm water in the western equatorial Pacific where sealevel rises several inches above the level in the west, then winds change and the water sloshes back to the east, dampening currents, affecting upwelling zones, and extending their effects ocean wide into the entire Coriollis Effect driven winds and currents.

            All these effects are manifested simultaneously and so you see a lot of noise in the data which actually isn’t noise but real climate/weather change.

            Fishermen and farmers see this everyday. The older ones have seen the longer term cycles, the younger ones tend to go bankrupt while the older ones who survived previous cycles reach into their old bag of tricks.

            Scientists without decades outside are like the neophytes who just throw up their hands and proclaim the end of the world.

            The first paper on the Pacific ocean multi-decadal oscillation wasn’t even written until 1996 but its foundations are solid reaching well back into the history of fisheries and is supported by layers of sediments in the bottom of the ocean. What they all have in common for many species of fish are water temperature.

            People working in windowless offices have no concept of any of this.

          • Dr Roys Emergency Moderation Team says:

            Svante, please stop trolling.

    • David Appell says:

      JimGiordano says:
      Were still colder than the Medieval Warm Period, and certainly colder than the even warmer Roman and Minoan Warm Periods.

      I’d like to see that (global) data, too. Jim?

      • Paul Aubrin says:

        https://www.google.com/maps/d/viewer?mid=1akI_yGSUlO_qEvrmrIYv9kHknq4

        Climate reconstructions of the ‘Medieval Warm Period’ 1000-1200 AD. Legend: MWP was warm (red), cold (blue), dry (yellow), wet
        Example:
        Sha et al. 2014, Andresen et al. 2011: Marine sediment core
        diatom-based sea-ice reconstruction from marine sediment core
        DA06-139G, Vaigat Strait, Disko Bugt, West Greenland

        Warming phase 1000-1200 AD marked by increase in Atlantic warm water, increased iceberg calving and an increase in meltwater.

  25. JimGiordano says:

    I would not underestimate Hilary! Definitely not an airhead, more like Senator Palpatine!

    • Gordon Robertson says:

      jim…”I would not underestimate Hilary! Definitely not an airhead, more like Senator Palpatine!”

      My airhead reference is two-fold:

      1)She stood by Lying Willie through several affairs and a sexual harassment suit with Paula Jones that cost the Clinton’s $800,000 in an out of court settlement.

      In the end, Hillary blamed the women. I don’t want such an airhead running the US.

      2)While John Christy of UAH, a good climate scientist and man of integrity, was testifying at a senate hearing, she stood there with arms folded glaring at him. She was very rude to John, another indication that she is an airhead. Since she was not willing to hear John out, even though he had the UAH data, she is an idiot to boot.

      • David Appell says:

        HClinton stood with arms crossed while Christy testified?

        Do you have proof of that?

        PS: Anyone who Gordon thinks is an “airhead” is, ipso facto, quite smart.

        • Gordon Robertson says:

          DA…”HClinton stood with arms crossed while Christy testified?

          Do you have proof of that?”

          Ask John Christy, he was there.

  26. JimGiordano says:

    Hey Mike I for one appreciated your comment, especially about the nature of the chaotic system. However that is more in play with weather predictions. I think we should at least be able to ball-park rough climate ranges, especially when we compare to past climate reconstructions and fact in what we know about the Sun’s moods and planetary motion.

    • David Appell says:

      After several days to a week and a half, weather predictions are subject to chaos.

      But global climate changes are about the planetary energy imbalance. Now that imbalance is inward.

      • Mike Flynn says:

        DA,

        You wrote –

        “But global climate changes are about the planetary energy imbalance. Now that imbalance is inward.”

        More meaningless pseudoscientific drivel! Another pointless, incorrect, and irrelevant word collection.

        Cheers.

        • David Appell says:

          Improving estimates of Earths energy imbalance,
          Johnson, G.C., J.M. Lyman, and N.G. Loeb
          Nature Clim. Change, 6, 639640, doi: 10.1038/nclimate3043 (2016).
          http://www.nature.com/nclimate/journal/v6/n7/full/nclimate3043.html

          From the abstract:
          Here, we update our calculations (Fig. 1), and find a net heat uptake of 0.71 +/- 0.10 W m−2 from 2005 to 2015 (with 0.61 +/- 0.09 W m−2 taken up by the ocean from 01,800 m; 0.07 +/- 0.04 W m−2 by the deeper ocean; and 0.03 +/- 0.01 W m−2 by melting ice, warming land, and an increasingly warmer and moister atmosphere).

          • Mike Flynn says:

            DA,

            Complete nonsense, of course.

            There is no ongoing “heat uptake”. More pseudoscientific cultist propaganda. Heat is not being stored, accumulated, or hidden, The authors are delusional.

            No useful description the GHE exists, and the experiment carried out by Nature over the last four and a half billion years indicates that the Earth has cooled.

            Bad luck for you and the rest of the cultists.

            Cheers.

          • David Appell says:

            The authors are delusional.

            What evidence do you have that they are wrong?

          • Mike Flynn says:

            DA,

            Did you not read my reasons?

            Have you any evidence to say they aren’t?

            Cheers.

          • David Appell says:

            MF, you keep making it crystal clear that you are a waste of time.

            Sadly, that somehow excites you.

          • Mike Flynn says:

            DA,

            Do you truly believe you can read minds? Oh well, if you suffer form delusional psychosis, facts will have no impact on you.

            Michael Mann apparently believes he was unjustly deprived of a Nobel Prize, and Gavin Schmidt believes he is a world famous climate scientist! Join the delusional climate cult club.

            Cheers.

          • nurse ratchet says:

            Michael Mann and Gavin Schmidt !
            They are my heroes !
            I wish they were my patients here at the Delusional Denialist Dreamtime Retirement Home instead of old grouches like MF and GR.

          • Mike Flynn says:

            Begone, psychobabbling troll.

          • Gordon Robertson says:

            nurse crotchrot…”Michael Mann and Gavin Schmidt !
            They are my heroes !”

            Get a life!!!

      • Paul Aubrin says:

        David Appel said: After several days to a week and a half, weather predictions are subject to chaos.
        But global climate changes are about the planetary energy imbalance. Now that imbalance is inward

        No. Climate models have been shown over the last 20 years incapable of predicting the actual temperature trends. And they cannot either predict precipitations or regional variations. Their built-in energy imbalance is a hypothesis, not a conclusion. Their failure to correctly predict the future refute that hypothesis.

        • Gordon Robertson says:

          paul…”Their [models] failure to correctly predict the future refute that hypothesis”.

          Models cannot even predict the past, given past data.

    • Mike Flynn says:

      JG,

      Thanks.

      My point is that any predictions of a chaotic system are no better than a naive persistence prediction in practice. For example, usefully predicting the the next drought in California would be a good thing. However, the location, intensity and duration can only be guessed at.

      For somebody to simply “predict” that California will suffer from drought conditions in the future is not difficult, and might even come to pass. I can make such a prediction. So can you. As such, no use to anybody. When, where, how long, how severe? Nobody can tell. Unpredictable.

      A reasonable seeming assumption might be that even a chaotic system may exhibit stability, as the infinitely variable inputs might tend to cancel each other. This assumption is fine, until it doesn’t work. The “one in a thousand year” event mya be followed by another next week, next year or next century! No two tornado seasons are the same. No two hurricanes seasons are identical.

      And so it goes. Chaos everywhere – many claims of predictability, but all eventually fail, if based on examination of the past. Even based on known probabilities, prediction may not be useful. A coin may have come down heads 50 times in row (unlikely), but the chance of another head remains 0.5 (50%).

      I’ll stick with making assumptions. Most of mine have been good enough, so I’m doing OK. I even bet my life on them, every time I board and aircraft, or apply the brakes to avoid a collision. Would you bet your life on climate predictions?

      Cheers.

      • David Appell says:

        MF says:
        For example, usefully predicting the the next drought in California would be a good thing. However, the location, intensity and duration can only be guessed at

        But predicting the change in global average temperature is much easier.

        Consider a swimming pool on a sunny afternoon. As we all know, it has spots that particularly warm and some that are particularly cold. Predicting the exact location of their spots, and their duration, is a very difficult problem in fluid mechanics.

        But the evolution of the pool’s average temperature is much easier to predict — use Newton’s law of cooling, add wind or whatever else you want, but it’s a much much easier calculation than calculating the evolution of the warm and cold spots.

        The former is like predicting weather. The latter is like predicting climate — dependent on large scale global factors, not the microscopic details.

        • Mike Flynn says:

          DA,

          Don’t be silly.

          You didn’t contradict a single thing I wrote, but decided to avoid reality by saying –

          “But predicting the change in global average temperature is much easier.”

          Another stupid and ignorant unsupported cultist assertion. You agree that you cannot predict climate, but claim you can still predict something you cannot even define – global average temperature!

          Go on – try and usefully define “global average temperature”. According to NASA “The global temperature record represents an average over the entire surface of the planet.”

          Untrue, of course. Actual surface temperatures are totally ignored in favour of nominal air temperatures taken under a variety of conditions at various heights above the surface with very poor controls relating to siting, instrument type and calibration, enclosure parameters and so on.

          Additionally, the surface covered by water (more than 70%), is totally ignored.

          Off you go now. While you are trying to furiously avoid facts, try to figure out why the surface (the actual surface) has cooled from a molten state over the last four and a half billion years.

          Or you could just throw in some more pseudoscientific cultist dogma. Your choice.

          Cheers.

        • David Appell says:

          something you cannot even define global average temperature!

          Do you know the definition of a scalar function over a 2-dimensional domain?

          • Mike Flynn says:

            DA,

            You are obviously confused.

            I referred to the fact that you can’t even define global average temperature.

            You asked –

            “Do you know the definition of a scalar function over a 2-dimensional domain?”

            Don’t ask me. Look it up yourself, if you don’t know. You claim to have a PhD, so you should be capable of finding it out for yourself. Unless, of course, you assumed the identity of David Appel. Did David Appell actually receive a PhD, or can’t you remember?

            Maybe you suffered a traumatic brain injury – you have my sympathy if you are currently suffering from a severe mental defect. I certainly support your endeavours to find out about scalar functions. They are easy enough for you to start re-learning mathematics. I wish you well in your endeavours.

            Cheers.

          • nurse ratchet says:

            My apologies Dr Appell. MF has been off his tablets again. Don’t listen to his ramblings – he will quieten down as soon as I find his comic books for him to read. His favourite is something called “Watts Up”.

          • Dr Roys Emergency Moderation Team says:

            nurse ratchet, please stop trolling.

        • Paul Aubrin says:

          David Apell said: But predicting the change in global average temperature is much easier.
          Actually, climate models tried to do so and failed.
          See for example : “A Test of the Tropical 200‐ to 300‐hPa Warming Rate in Climate Models” [doi:10.1029/2018EA000401].

          • bdgwx says:

            Can you define “failed” so that we can use the definition to objectively compare predictions with observations.

            Also, do you think this is a failure? I mean, it looks pretty good to me.

            https://advances.sciencemag.org/content/5/4/eaav7337

          • Paul Aubrin says:

            bdgwx said : can you define “failed”.
            Please, see the publication doi:10.1029/2018EA000401 as suggested.

          • Bill Hunter says:

            dgwx said : can you define failed.
            Paul Aubrin says: Please, see the publication doi:10.1029/2018EA000401 as suggested.
            _________________

            The most important topics in climate science are the ones that the loudest proponents religiously attempt to avoid or address with a handwave.

          • bdgwx says:

            Paul,

            I did read the publication. It’s about the well known mid troposphere tropical hotspot problem which everyone has known about for like 2 decades now. I’m going to attempt at guessing your definition of failure is when the warming trend of 200-300mb layer between 20N and 20S is off by more than a factor of 2. That’s the error report in the paper anyway. Let me know if you agree. Anyway, if I’m remembering correctly this is a substantial improvement over what the error was in early 2000’s.

            I’m curious though…if a prediction of 0.325C/decade as compared to an observation of 0.173C/decade is failure then what it is when a prediction is for cooling and the opposite occurs?

            Can you read the paper I posted and comment regarding whether you think the authors attempts at modeling the last 3 million years is failure? Given that they don’t attempt to explain the 200-300mb layer I’m not sure we can use the definition I presented above.

          • Bill Hunter says:

            bdgwx says:

            “Im curious thoughif a prediction of 0.325C/decade as compared to an observation of 0.173C/decade is failure then what it is when a prediction is for cooling and the opposite occurs?”

            I would be more ready to take the position that .173C/decade as a result of a .325C/decade to simply be a failure in its own right as that would be the proper representation in contrast to a true skeptic.

            A true skeptic doesn’t make predictions. So you don’t get mileage by contrasting it to other predictions. . . .unless of course you are now resigned to incorporating the other predictions and calling both sides off the mark for failure to see the truth in the oppositions viewpoint.

            Are you at that point?

          • bdgwx says:

            Bill,

            I disagree. True skeptics definitely make predictions. In fact, it’s the one’s that make predictions and demonstrate that their theory is a better match to reality than the established theory they are challenging who are the most convincing.

            The point I’m at is picking the theory that best matches reality. The standard model, general relativity, quantum mechanics, etc. would almost certainly be considered a failure by contrarians because they don’t make perfect predictions. That’s par for the course in most disciplines of science. But they are still useful and provide the best match to reality we have. It’s the same with climate science. The modern consensus on climate change isn’t perfect and it never will be will. But, it provides the best match reality thusfar. Like any true skeptic I form viewpoints around the set of hypothesis that have survived falsification and rally around the theory that does the best job among all of the imperfect candidates. If a new observation, hypothesis, theory forms that does a better job at explain ALL of the observations then I’ll shift my viewpoint. But right now these GHG-less theories are horrible matches to reality so I don’t have much choice at the moment in supporting theories that incorporate GHG physics.

          • Bill Hunter says:

            bdgwx says: “Bill, I disagree. True skeptics definitely make predictions. In fact, its the ones that make predictions and demonstrate that their theory is a better match to reality than the established theory they are challenging who are the most convincing.”

            that may be the “modern” definition created by proponents of global warming deriding all not going along as deniers. Skeptic is a better word for one that actually needs some real evidence to become convinced that a complex theory is correct. However, global warming advocates instead of proof of their own theory desire that skeptics provide proof of an alternative theory and many skeptics work hard at that. However, unless the alternative theory does have a solid foundation in evidence, its proponent is NOT a skeptic in any sense more than a loud proponent of global warming is a skeptic.

            You are just confounding skepticism in general with skepticism only about what you believe.

            Now I grant you, and this was a college major of mine, language is something defined by common usage. So indeed maybe skepticism is becoming only about global warming. But hey the masses out there misunderstanding the English language and basic logic are perfectly in their rights to create any language they want.

          • Paul Aubrin says:

            bdgwx said:”Im curious thoughif a prediction of 0.325C/decade as compared to an observation of 0.173C/decade is failure then what it is when a prediction is for cooling and the opposite occurs?”

            Who cares. A 100% error is huge enough to disprove any hypothesis.

          • bdgwx says:

            Paul, so what criteria do you use to select the theory that best matches observations? For example, would you rather choose a theory that predictions just with the wrong magnitude or a theory that predicts cooling?

          • Bill Hunter says:

            bdgwx says: “Paul, so what criteria do you use to select the theory that best matches observations? For example, would you rather choose a theory that predictions just with the wrong magnitude or a theory that predicts cooling?”

            Why pick a theory? Sure you have to pick a theory to create a climate model. But that’s the problem! All the climate models are operating on the basis of a single theory deemed the best science available and settled science without further evidence. . . .a death knell to centralized science ever inventing a different theory and massive sums of money circling the drain.

            Gee, its the main problem with socialism too. . . .go figure!

          • bdgwx says:

            Scientists rally around the theory that best explains reality. That’s kind of what science does.

          • Nate says:

            “Sure you have to pick a theory to create a climate model. But that’s the problem! All the climate models are operating on the basis of a single theory deemed the best science available and settled science without further evidence.”

            Where does this idea come from that climate models are based on theories that have no evidence, Bill?

            Climate models are based on ordinary physics, and well-tested atmospheric physics models that is able, for example, to produce the general circulation pattern of the atmosphere that is actually observed.

          • Bill Hunter says:

            bdgwx says: “Scientists rally around the theory that best explains reality. Thats kind of what science does.”

            LMAO! Boy are you ever naive! Scientists don’t rally around some kind of silly notion of a “best” unproven theory. . . .not to speak of the fact that the very idea of a best unproven theory is largely an oxymoron. There really is no “best” unproven theory, there are only unproven theories and proved theories or theories with great predictive track records becoming proven. Not anything like that in sight in climate science.

            No, they rally around grant money. Grant money is their life blood, without it they probably ought to start thinking about flipping burgers for a living. Its the grant money that keeps the lab ticking and provides expenses for assistants. Its publish or perish and to publish you need funds to do the work.

            It would be great if what you said was true but the reality of needing to make a living doing what you love to do to keep doing it is a necessity.

            Its a much better situation where the funding is non-politicized and available for virtually any scientists idea. thats really how science advances. When science is not doing that its not being inventive, its not being open minded, its not thinking outside the box, its not inventing anything.

          • Nate says:

            ‘Grant money is their life blood, without it they probably ought to start thinking about flipping burgers for a living.’

            Yes, true.

            But the meme that federal grant agencies EXPECT a certain science outcome, is simply made up.

            As someone who has gotten federal grants, I can tell you thats not how it works, at all.

            Funding agencies expect you to investigate some topic, complete the project, and publish the findings.

            They don’t know what the findings will be, thats why its called SCIENCE.

          • Bill Hunter says:

            Nate says: Yes, true. But the meme that federal grant agencies EXPECT a certain science outcome, is simply made up.

            As someone who has gotten federal grants, I can tell you thats not how it works, at all.

            Funding agencies expect you to investigate some topic, complete the project, and publish the findings.
            ————-

            I have great respect for the civil service run grant agencies Nate. The civil service was a great concept. We should return back towards more civil service control. Unfortunately, the government now is like swiss cheese when it comes to independence. Yes indeed you may have gotten federal grants and felt that the process was extremely fair and not politically motivated. But against that wall of neutrality NGOs and private foundations have exerted their will through Congress to influence the topics, and create appointed panels to direct funding. Often these efforts create a small but extremely potent bias in requiring a “consultation” to recommend topic specific grants and even comment on the recipients of such grants.

            Of course grants should be reviewed and recommended by experts but the civil service is perfectly capable of providing them and keeping the processes independent.

            Of course its all justified as the politically powerful find themselves in positions of power over grants without regard to what side they are on. Big corps actually profit from regulation so the whole “big oil” meme is a false flag operation. The crazy thing about it all its not a conspiracy it is all about appealing to authority and power for the purpose of consolidation of power. That is one of the major reasons I like James Hansen. He demonstrates almost daily he is not part of the operation calling cap and trade what it is. . . .a huge giveaway to the wealthy and not likely to change much of anything. Hansen wants fuel rationing. I completely disagree with him on that point but agree that would be the fair approach to a war on climate change if done and enforced globally if anything is done to restrain free choice of energy usage.

            But the consortium of the politically powerful simply won’t choose that as it doesn’t line their pockets with more of the people’s money as it doesn’t continue to force dollars into the corrupt side of the system and harm the less powerful to the benefit of the powerful.

          • Nate says:

            ‘ But against that wall of neutrality NGOs and private foundations have exerted their will through Congress to influence the topics, and create appointed panels to direct funding. ‘

            Can you point to an example of that?

          • Bill Hunter says:

            Nate says: – Can you point to an example of that?

            Sure thousands of times over. Ask any skeptic scientist if they have encountered a wall of resistance. One of my favorite examples of bias is with a major decision maker on funding science projects. Lonnie Thomson for years gave grave reports on the fate of a tropical glacier Qori Kalis. In 2007 he suggested it would be gone in just a few years. After probably a decade of annual expeditions to Qori Kalis accompanied with a study proclaiming how dire the situation was at Qori Kalis, reports suddenly ceases. Thomson was still mounting expeditions to Peru, still occasionally looked at Qori Kalis, but not one published story appeared since on the status of the glacier. Today you can view Qori Kalis and see its extent has been fluctuating up from and back to its 2007 extent. Of course its not a case of a lack of funding as Thomson has massive control over funding. Its simply he sounded the alarm and doesn’t want to diminish its effects.

          • Svante says:

            Here’s an update by Thomson et al. in 2017:

            Over the thirteen year [2004 to 2017] observational period Qori Kalis areal extent decreased by 30%, its volume decreased by 43%, consistent with past studies and the behavior of the Quelccaya ice cap. Within one to two decades, the Kilimanjaro ice fields and the Qori Kalis glacier are quite likely to disappear completely.

            https://tinyurl.com/y2ofn6vk

          • Bill Hunter says:

            Svante says: Heres an update by Thomson et al. in 2017:

            Over the thirteen year [2004 to 2017] observational period Qori Kalis areal extent decreased by 30%, its volume decreased by 43%, consistent with past studies and the behavior of the Quelccaya ice cap. Within one to two decades, the Kilimanjaro ice fields and the Qori Kalis glacier are quite likely to disappear completely.
            ————–

            Hmmm, you are just proving my point. Thompson didn’t write anything from his expeditions there after 2007 when 20% of the extent was gone and Thompson claimed the glacier would likely disappear in 5 years.

            Now a student of his completing her Master’s Thesis has written something. Thompson is simply an advisor on her thesis committee. And of course you probably missed the part where more than 2/3rds of the loss reported in the recent study was lost by 2006 prompting another “scientific” extrapolation of causing the glacier to completely disappear in 5 years.

            Also missing are any papers during two periods of glacier growth where the glacier gained about 28% of its mass. And you think there is no bias?

          • Nate says:

            Bill,

            I don’t see how this anecdote (no cite) supports your claim:

            ‘But against that wall of neutrality NGOs and private foundations have exerted their will through Congress to influence the topics, and create appointed panels to direct funding.’

          • Bill Hunter says:

            Nate says –
            I dont see how this anecdote (no cite) supports your claim:
            ———

            You can put it down as a cite from me and my 30 years of experience, 20 of which has been deeply embroiled into local environment activism.

            If thats enough I suggest you read Tom Knudsen, Environment, Inc.;
            Michael Crichton, State of Fear; Peter Huber, Hard Green. And I can get you more if you read those and discuss their applicability to what I am talking about.

  27. ren says:

    Do you think that the temperature drop below the average in the southern hemisphere is only seasonal?
    https://climatereanalyzer.org/wx_frames/gfs/ds/gfs_world-ced2_t2anom_1-day.png

  28. Bindidon says:

    To have a look at existing, confirmed data has always been better than reading news, be it on paper or online.

    Even the official MeteoFrance site publishes inofficial informations:

    http://www.meteofrance.fr/actualites/73942103-canicule-de-juin-2019-retour-sur-un-episode-exceptionnel

    When you download the GHCN daily data, many of the highest temperaures communicated in France are not visible because they were not transmitted to NOAA.

    The 45.9 C in Gallargues-le-Montueux for example were by no means measured: it is either an interpolation (which might have been correct) or it was a private measurement. The same holds for the 44.8 C in Nimes: there is no acknowledged GHCN daily station there.

    The highest ‘officialy communicatedl’ temperature measured in FR during the 2019 June heat wave was 43.5 C by two nearby stations at Montpellier airport.

    This is also the highest temperature in France ever communicated to NOAA: is bypasses even the old record (Mont-de-Marsan, 1947 July 25), and all measurements performed in July and August during the 2003 heat wave.

    For Mont Aigoual, 29.9 C were communicated. This temperature there was bypassed only once, in July 2005.

    This is really a high temperature there, because the station’s altitude is 1567 m.

    Luckily, temps actually move down in Yrop, like here, where we soon will experience a drop from 37.5 down to 18 C in one week.

    Perfect.

    • My experience in the US is that not most stations that are considered official by the National Weather Service are not part of the USHCN or the GHCN. I suspect the same is true in France.

      • Bindidon says:

        Donald L. Klipstein

        Correct. But there have been / still are in the sum over 18000 GHCN daily staions for CONUS! Amazing…

        ***

        Re.: Miami

        Fact check succeeded.

        1. The GHCN daily station

        USW00012839 25.7906 -80.3164 8.8 FL MIAMI INTL AP

        indeed is here

        https://tinyurl.com/yxjhex7x

        All ‘skeptic’s will have a big laugh when looking at the station’s place, ha ha.

        2. In the station’s file

        https://tinyurl.com/yxqu3arp

        there is no day with 36.7 C in TMAX for May 2019; the last day in this station’s history showing such a temp was indeed 2017, May 28.

        Good point!

      • Bindidon says:

        Donald L. Klipstein

        Re.: Miami [2]

        Oh I’m afraid I must take the good point half back:

        USW00012839201906TMAX 339 D 333 D 356 D 333 D 333 D 328 D 350 D 333 D 311 D 322 D 328 D 333 D 322 D 344 D 317 D 283 D 300 D 328 D 328 D 333 D 350 D 344 D 350 D 367 D 361 D 350 D 333 D 333 D 294 D 317 D-9999

        because on June 24 your 36.7 C aka 98 F in fact are really there…

  29. While I accept that we often throttle statistical data into submission, I did a curve fit on the monthly CET records from 1650 to see where the minimum of the LIA occurred.

    The equation that I got was T = 44.4-0.0412 x Year+1.177810^-5 x year^2. Differentiating to find the minimum gave 1750 as the turning point from which temperatures are slowly recovering.

    Good fun and a bit surprising that it is so sensible: however, as usual with weather data, the statistical significance of the curve is low (R^2=.348).

    Is there any validated source for the IPCC doom temperature rise of 1.5 deg K (or was it 2 deg K)?

    • Bindidon says:

      jack broughton

      LIA might eventually be a little bit more complex than you think:
      https://en.wikipedia.org/wiki/Little_Ice_Age

      There was not simply one ‘turning point’, even not one global LIA.

      Taking CET as source is somewhat risky I guess… unless you concentrate your ‘theories’ on Western Europe.

      • David Appell says:

        “Abrupt onset of the Little Ice Age triggered by volcanism and sustained by sea-ice/ocean feedbacks,” Gifford H. Miller et al, GRL (2013).
        DOI: 10.1029/2011GL050168
        http://onlinelibrary.wiley.com/doi/10.1029/2011GL050168/full

      • Gordon Robertson says:

        binny…”LIA might eventually be a little bit more complex than you think:
        https://en.wikipedia.org/wiki/Little_Ice_Age

        If you click on the Talk tab at the top of the page you will see the name of William Connolley as an editor. He is an uber-alarmist who hangs out at realclimate and he is a computer programmer.

        Try going onto the site and edit something that has a skeptical nuance. Connolley will appear and cancel it.

        This article is not worth the paper on which it is printed. More alarmists bs.

        There is plenty of evidence to support the LIA as a global phenomenon.

    • David Appell says:

      Differentiating to find the minimum gave 1750 as the turning point from which temperatures are slowly recovering

      What does “recovering” mean?

      The global temperature doesn’t change unless something *causes* it to change. So what has caused the change since 1850?

      • Paul Aubrin says:

        David Appel said: «The global temperature doesn’t change unless something *causes* it to change.»
        No. Given the chaotic nature of the climate systems, causes cannot generally be identified.

        Philippe Larminat applied classical identification techniques on several climate data sets [doi:10.1016/j.arcontrol.2016.09.018]. The results were not exactly what you would imagine.

        Abstract

        Based on numerical models and climate observations over past centuries, the Intergovernmental Panel on Climate Change (IPCC) attributes to human activity most of the warming observed since the mid-20th century. In this context, this paper presents the first major attempt for climate system identification – in the sense of the systems theory – in the hope to significantly reduce the uncertainty ranges. Actually, climatic data being what they are, the identified models only partially fulfill this expectation. Nevertheless, despite the dispersion of the identified parameters and of the induced simulations, one can draw robust conclusions which turn out to be incompatible with those of the IPCC: the natural contributions (solar activity and internal variability) could in fact be predominant in the recent warming. We then confront our work with the approach favored by IPCC, namely the “detection and attribution related to anthropic climate change”. We explain the differences first by the exclusion by IPCC of the millennial paleoclimatic data, secondly by an obvious confusion between cause and effect, when the El Niño index is involved in detection and attribution.

    • Gordon Robertson says:

      jack…”Differentiating to find the minimum gave 1750 as the turning point from which temperatures are slowly recovering. ”

      Apparently there were two minima but the evidence supports the fact that the LIA was a global phenomenon with global temps 1C to 2C below normal. Your base for the rewarming is interesting and likely correct. It seems reasonable it would have taken till 1850 for the full effect to be ended.

      It is also reasonable that it took another century for the re-warming to bring as back to current temps: for glaciers to shrink back, sea levels to re-rise, etc.

  30. Bindidon says:

    Stavro

    You wrote upthread:

    The most thorough analysis of the UHI effect on U.S. temperature was by Anthony Watts and co-authors, who analyzed the siting of hundreds of thermometers around the U.S. and showed that if only the best (most rural) sited thermometers are used, U.S. warming trends are roughly cut in half.

    why has this report never been published. Last I heard was the Climate Audit had fond serious problems were these fixed?

    *
    This report should in fact have been published in… 2012. It couldn’t, probably because it contained too much of manifestly unproven matter.

    Nevertheless, NOAA officially acknowledged the work done by collaborators of surfacestations.org, by publishing in the following document a list of 71 USHCN stations these collaborators had considered valuable:

    Long-Term Monthly Climate Records from Stations Across the Contiguous United States

    Menne, Williams, Vose

    https://cdiac.ess-dive.lbl.gov/epubs/ndp/ushcn/monthly_doc.html

    You read there:
    Set 1 includes stations identified as having good siting by the volunteers at surfacestations.org.

    This is the link to ‘Set 1’:
    https://tinyurl.com/y5f5zwxe

    *
    To discover the list was interesting for me because it made me able to search, within the far bigger GHCN daily station list (over 100000 stations, about 36000 dealing with temperature, 18000 of them in the US) those stations exactly matching the USHCN stations considered well-sited by surfacestations.org.

    The GHCN daily station list can be found within
    https://tinyurl.com/mlsy22x

    46 of the 71 USHCN stations were matched:
    https://drive.google.com/file/d/1nfrk9qylSAyYA1yNilPXrC6E3Sul5rVA/view

    The idea was to compare these 46 GHCN daily stations with all those in the CONUS, what would avoid the bias of comparing USHCN data with GHCN daily data.

    I thought: Oh dear, how will all these 18000 anonymous GHCN daily stations be able to compete with these ‘well-sited’ ones? They sure will show a tremendous warming trend!

    Hmmmh. Here is the rather suprising result.

    1. 1900-2018
    https://drive.google.com/file/d/1B4TzVe7rFLidKIb-dUOLwdittauW2oVY/view

    2. 1979-2018 (together with UAH6.0 LT USA48)
    https://drive.google.com/file/d/138KA91L0a5mTkYTxPKLLw0u3ekC0RaGc/view

    As you can easily see, the 46 well-sited stations selected by surfacestations.org give when averaged together a higher trend than the average of all available GHCN daily stations for CONUS.

    Where the heck then is this UHI?

    I don’t deny it! I simply have to see that I obtain results unable to clearly show its presence.

    The next step is now to select out of the GHCN daily CONUS data subset those 206 ‘pristine’ stations marked with the CRN flag (Climatology Reference Network), and to do the same job again.

    On verra bien!

    Meanwhile we’ll have one more time a good laugh when the genius comes around and as usual spits his faked and/or fudged nonsense. The less you are able to do things, the more you urge in denigrating those who did.

  31. Bindidon says:

    From Roy Spencer’s post we read:

    The question is, are the number of record high temperatures increasing over time? At least in the U.S., the answer is no, as the number of days over 100 and 105 deg. F have not increased (). One would need to study the data for Europe to see if the number of record highs is increasing over time.

    *

    Yes, for the U.S., the answer is no:
    http://www.drroyspencer.com/wp-content/uploads/US-extreme-high-temperatures-1895-2017.jpg

    But for the Globe, the answer is (of course according to a laymans home work), clearly yes.

    1. As John Christy generated his record high stat out of the USHCN record, I first switched to the GHCN daily record with around 18000 US stations in the grand total over the period, and around 36000 worldwide, and generated a similar stat for CONUS:

    https://drive.google.com/file/d/1qGV5LfKw_lFKNdZMlq15ZHz6sA1CA294/view

    I chosed 35 / 40 C instead of 100 / 105 F: nobody uses Fahrenheit ouside of the USA and some of its backyards. But it seems that the stuff, though based on a considerably greater data set, nevertheless fits to John Christys work quite well. The two graphs are very similar.

    2. Extending the stat worldwide then gave this:
    https://drive.google.com/file/d/1TFdltVVFSyDLPM4ftZUCEl33GmjJnasT/view

    The station data was distributed over a grid of 2.5 cell size, in order to have 200 US grid cells competing with 2000 cells worldwide, instead of having in the yearly average about 8000 US stations competing with about 8000 worldwide, what lets the Globe look like CONUS backyard 🙂

    Who has some doubt concerning accuracy and precision is kindly invited to to the same job. We can then compare the results.

    Maybe I redo the stat work again, this time restricted to Europe or even to France, when I have some idle time.

    • David Appell says:

      Bindidon says:
      The question is, are the number of record high temperatures increasing over time?

      No, that is not the proper question.

      In a warming locale a constant rate of record high temperatures certainly indicates warming. That rate need not increase for warming to be present.

      But it is significant if record high temperatures are occurring at a greater rate than record cold temperatures, as is happening at least in USA48.

      • Bindidon says:

        David Appell

        “Bindidon says:
        The question is, are the number of record high temperatures increasing over time?”

        *
        No, Appell. I did not say that.

        It was from Roy Spencer’s head post, right here on top.

        “In a warming locale a constant rate of record high temperatures certainly indicates warming.”

        WRONG, Appell.

        That is exactly why I computed the number of record highs for the Globe instead of for the US only.

        You are an ideologist, not a scientist.

      • Bill Hunter says:

        DA: – “But it is significant if record high temperatures are occurring at a greater rate than record cold temperatures, as is happening at least in USA48.”

        This just shows how imprecise our concepts are. Global mean temperature is merely a statistic not a real temperature. One would expect that the rate of record high temperatures would exceed the rate of record low temperatures in the situation of a rising global mean temperature even when the rate of high temperature records remains level.

        In the real world sense (as an actual sensory experience) that would be more properly characterized as “closer to normal” temperatures because cold divergence from normal is shrinking at a higher rate than warm divergence from normal is.

        But hey any lie works if it achieves the agenda you want it to achieve, right David? That’s why they say figures lie and liars figure.

  32. ren says:

    Grand Solar Minimum GSM News
    Opublikowany 23 cze 2019
    The new research was led by Irina Kitiashvili, a researcher with the Bay Area Environmental Research Institute at NASA’s Ames Research Center, in California’s Silicon Valley. It combined observations from two NASA space missions – the Solar and Heliospheric Observatory and the Solar Dynamics Observatory – with data collected since 1976 from the ground-based National Solar Observatory.
    blob:https://www.youtube.com/33fbdebe-2986-4558-bb52-7f4fe37c9db9

  33. David Appell says:

    Richard GreeneNewDeal wrote:
    The US had the coldest winter ( October through April ) in over 100 years,

    Not even remotely true, even given your inaccurate definition of “winter.”

    In fact, Oct18-Apr18 ranked as the 56th coldest period of 124 for USA48 since 1895.

    Even recently, Oct13-Apr14 was colder.

    Source:
    NOAA USA48 monthly
    https://is.gd/nN5P9i

  34. David Appell says:

    Roy: from Berkeley Earth:

    “The Urban Heat Island effect is real. Berkeleys analysis focused on the question of whether this effect biases the global land average. Our UHI paper analyzing this indicates that the urban heat island effect on our global estimate of land temperatures is indistinguishable from zero.”
    http://berkeleyearth.org/faq/#question-15

    paper:
    “Influence of Urban Heating on the Global Temperature Land Average using Rural Sites Identified from MODIS Classifications,” Wickham et al., Geoinfor Geostat: An Overview 2013, 1:2
    http://dx.doi.org/10.4172/2327-4581.1000104
    https://www.scitechnol.com/2327-4581/2327-4581-1-104.pdf

    • Mike Flynn says:

      DA,

      Berkely Earth is a strange organisation, created by Richard and Elizabeth Muller to apparently ensure a flow of income to – Richard and Elizabeth Muller?

      As is common with such organisations, it creates “scientists” at will. One such is Steven Mosher, who apparently has Bachelor’s degrees in English Literature and Philosophy, and attempted a PhD in Literature.

      Of course, Berkeley Earth has no connection at all to the University of California, Berkeley, which some naive donors might possibly assume.

      Berekely Earth’s concern for the Chinese population is laudable, but possibly pointless, as the PRC Government doesn’t seem to take much notice of Berkely Earth, who wrote –

      “In China the numbers are far worse; on bad days the health effects of air pollution are comparable to the harm done smoking three packs per day (60 cigarettes) by every man, woman, and child. Air pollution is arguably the greatest environmental catastrophe in the world today.”

      Maybe such statements bring a warm glow to the donors who give their hard-earned cash to Berkeley Earth. Apart from that, there doesn’t seem to be much point in telling the Chinese what they already know.

      Cheers.

      • David Appell says:

        BE, in part funded by Koch Industries.

        Their work all open source and published in good, peer reviewed journals.

        So if you think you have something to say, critique the work, if you can.

        • Mike Flynn says:

          DA,

          If you consider papers published by SciTechnol, (OMICS), good, peer reviewed journals, you are deluded.

          Here’s one reference –

          “SciTechnol (OMICS in disguise)

          In May 2012, Beall reported that OMICS created this name for 53 instant journals and was “spamming tens of thousands of academics, hoping to recruit some of them for the new journals editorial boards.” ”

          Or –

          “In August 2016, the U.S. Federal Trade Commission (FTC) filed a suit against OMICS, two of its affiliated companies and Gedela, charging them with deceptive publishing practices.”

          Predatory journals publish any nonsense at all, provided payment is received. Fake peer review is provided as part of the service. Use your noggin, laddie.

          The work is rubbish. Worship it if you like.

          Cheers.

          • David Appell says:

            What about the paper’s contents and conclusions is wrong?

          • David Appell says:

            PS: Be specific.

          • Mike Flynn says:

            DA,

            You wrote –

            “What about the papers contents and conclusions is wrong?”

            If you don’t know, why should I tell you? Read it, and draw your own conclusions. You don’t expect me to spoon feed you, do you?

            Cheers.

          • David Appell says:

            MF, clearly you haven’t read the papers and know nothing about them.

            (It’s just so easy with you people….)

          • Mike Flynn says:

            DA,

            You wrote –

            “MF, clearly you havent read the papers and know nothing about them.”

            You need to seek a refund from the con man who charged you for the mind reading course. You have been scammed. There is no such thing as mind reading. It is about as valid as pseudoscientific belief that CO2 has miraculous heating powers.

            Oh well, these sorts of people prey on the weak minded and gullible. Have you tried studying science? It might help you to distinguish fact from fantasy. You seem to be unaware of the difference at present.

            Good luck.

            Cheers.

        • bill hunter says:

          David Appell says: “So if you think you have something to say, critique the work, if you can.”

          The paper critiques itself and recognizes that the entire discussion of UHI remains controversial. The paper simply offers a narrow view of the topic which adds to the discourse but only a moron would think it represents the last word on the topic.

      • David Appell says:

        “Call me a converted skeptic. Three years ago I identified problems in previous climate studies that, in my mind, threw doubt on the very existence of global warming. Last year, following an intensive research effort involving a dozen scientists, I concluded that global warming was real and that the prior estimates of the rate of warming were correct. Im now going a step further: Humans are almost entirely the cause.

        “My total turnaround, in such a short time, is the result of careful and objective analysis by the Berkeley Earth Surface Temperature project, which I founded with my daughter Elizabeth. Our results show that the average temperature of the earths land has risen by two and a half degrees Fahrenheit over the past 250 years, including an increase of one and a half degrees over the most recent 50 years. Moreover, it appears likely that essentially all of this increase results from the human emission of greenhouse gases.”

        – Richard Muller, New York Times, 7/28/12
        http://www.nytimes.com/2012/07/30/opinion/the-conversion-of-a-climate-change-skeptic.html

        • Mike Flynn says:

          DA,

          An appeal to his own authority. Not terribly convincing, is it?

          He said –

          “Moreover, it appears likely that essentially all of this increase results from the human emission of greenhouse gases.”

          It appears likely? Really? How stupid would you have to be to believe that increasing the amount of CO2 between the Sun and a thermometer makes the thermometer hotter?

          Muller is as delusional as that other astrophysicist, James Hansen. He cannot even provide a useful description of the GHE either, can he?

          Just another pseudoscientific climate cultist.

          Cheers.

          • David Appell says:

            How stupid would you have to be to believe that increasing the amount of CO2 between the Sun and a thermometer makes the thermometer hotter?

            Why do you sleep under blankets at night?

            Why do you wear a coat to stay warm?

          • Mike Flynn says:

            DA,

            I repeat for the slow learners –

            How stupid would you have to be to believe that increasing the amount of CO2 between the Sun and a thermometer makes the thermometer hotter?

            I will add –

            How stupid would you have to be to believe that putting blankets or a coat between the Sun and a thermometer would make the thermometer hotter?

            Maybe you could face facts, and leave your stupid irrelevant gotchas for later?

            Cheers

          • David Appell says:

            Why do you repeatedly avoid these simple questions?

            * Why do you sleep under blankets at night?
            * Why do you wear a coat to stay warm?

          • Mike Flynn says:

            DA,

            Why do you keep posing stupid gotchas?

            Cheers.

          • David Appell says:

            Because these simple questions show how your position is full of shit.

            You know that too, which is why you always avoid answering them.

          • Mike Flynn says:

            DA,

            “Because these simple questions show how your position is full of shit.”

            What is my position, precisely?

            You don’t seem to like the facts I present, as is your right. You can’t describe the GHE on religious or privacy grounds, apparently, but it seems you demand that people accept that you are the GHE’s prophet on Earth. I don’t.

            Ask your gotchas – I’ll generally refuse to answer, as usual.

            Maybe you could explain why the Earth’s surface managed to cool over the last four and a half billion years or so, notwithstanding four and a half billion years of continuous sunlight, and an atmosphere containing so called GHGs for four and a half billion years.

            I’ll let you know my position after examining your explanation.

            Cheers.

          • Carbon500 says:

            DA asks:
            * Why do you sleep under blankets at night?
            * Why do you wear a coat to stay warm?
            Here’s mine: why are we not wearing transparent overcoats filled with CO2?

          • Stephen P Anderson says:

            They threatened to go after his shale oil investments.

          • Stephen P Anderson says:

            If you believe his research you’d have to believe that 100% of the warming was due to less than 1% of the energy budget-almost 100% correlation. Of course if it is the other way around and temperature is causing the CO2? Can’t be, right?

          • Svante says:

            Carbon500 says:
            “why are we not wearing transparent overcoats filled with CO2?”

            Because they have to be 10 km thick?

          • Gordon Robertson says:

            svante…”Carbon500 says:
            why are we not wearing transparent overcoats filled with CO2?

            Because they have to be 10 km thick?”

            If filled with air having a CO2 concentration of 0.04%. Why not fill them with 100% CO2 at a high enough pressure that IR blocking might be significant?

            The problem is obvious. Even though the transparent coat blocked significant amounts of IR, it would not block conduction through the inner and outer linings. Since CO2 has similar heat conduction to air, you might as well fill the transparent coat with air.

          • Bill Hunter says:

            David Appell says: “Why do you sleep under blankets at night? Why do you wear a coat to stay warm?”

            Thats certainly a good point for some of those who think greenhouse gases are not capable of anything.

            But the nature of a radiation barrier is of a blanket of undefined thickness that decreases heat transfer by radiation.

            In other words increase the thickness of a gaseous or liquid radiation blanket and it doesn’t increase its insulation value as heat will travel through the entire blanket thickness via convection.

            These various kinds of blankets exist on the market today. You can buy a thin mylar blanket that gives a boost to reflection of heat (as do all commercially available radiation blankets). These blankets don’t get warmer with thickness as the material is usually some kind of plastic with good conductivity.

            Or you can buy a fabric blanket of different insulation characteristics that varies with thickness of the blanket. Or you can buy a blanket that combines both means of insulation, a thick blanket with a radiation barrier bonded to it.

            Where the physics falls down in all this is in proposing something else that prevents that convection from doing its nonsense. So far no proposal for how that works has been forthcoming except to proclaim that in the “undefined” critical zone the atmosphere cools with increasing elevation. This would suggest less radiation going to space.

            But if well-mixed CO2 densification were also occurring in the stratosphere which increases in temperature with height, more radiation would be going to space from CO2 emissions not less. Seems to me well-mixed would include the stratosphere.

            Finally, if one accepts the top of the troposphere as being defined as the elevation where condensation of water becomes relevantly extinct, and that the rising of water vapor blocks any effect of CO2 on the surface, then the primary obstruction to the radiation of water into space must occur in the stratosphere or above.

            Sounds logical anyway. Perhaps you could refer me to some windowless office studies that refute those exact points.

          • David Appell says:

            Bill Hunter says:
            But the nature of a radiation barrier is of a blanket of undefined thickness that decreases heat transfer by radiation/i>

            It’s measured, not defined.

            Other than that, exactly — GHGs decrease heat transfer out of the atmosphere. That warms the surface.

            Every once in awhile one of the deniers stumbles upon the truth. Today it was Bill’s turn….

          • David Appell says:

            Bill H wrote:

            “and that the rising of water vapor blocks any effect of CO2 on the surface”

            Why do you think this?

            Do you think w.v. and CO2 absorb at exactly the same wavelengths?

            Where did you ever learn that?

          • David Appell says:

            Carbon500 says
            Heres mine: why are we not wearing transparent overcoats filled with CO2?

            That’s a decent question.

            What’s your answer?

            (Hint: CO2 doesn’t block sunlight, it blocks IR.)

          • David Appell says:

            Stephen P Anderson says:
            If you believe his research youd have to believe that 100% of the warming was due to less than 1% of the energy budget-almost 100% correlation. Of course if it is the other way around and temperature is causing the CO2? Cant be, right?

            Stephen,

            Do you agree that man is emitting CO2 into the atmosphere?

            Then doensn’t it lead CO2?

          • Bill Hunter says:

            David Appell says: “Its measured, not defined.”

            LMAO! truth there David! Except the guy with the ruler doesn’t know what the heck he is measuring because it was never defined in physics. It is only defined in physics for solids. Use a little logic please!

            David Appell says:
            “Why do you think this?
            Do you think w.v. and CO2 absorb at exactly the same wavelengths?
            Where did you ever learn that?”

            Where did I say they absorb on the exact same wavelengths? I didn’t.

            I realize we are in an area of uncertainty, but water is a full spectrum absorber. If it didn’t emit frequencies that CO2 could absorb then CO2 would not block outgoing radiation from water. If water can emit frequencies that CO2 can absorb then water has to in accordance with the laws of radiation be able to also absorb the same frequencies. Again use a little logic within the laws of physics. Equal in, equal out.

            p.s. I had a one on one argument with Dr. Kevin Trenberth about water being full spectrum as he uses a blackbody radiation number for its emissions from the surface in his budgeting as does it seems everybody else. I questioned whether water reflected full spectrum implying that water might not be full spectrum and that surface radiation might be high if thats the case. But KT stuck to his guns. Maybe you should argue with him.

    • Gordon Robertson says:

      DA…”Roy: from Berkeley Earth:”

      Berkeley Earth are fudge artists like NOAA. They have retroactively fudged temperatures to suit a point of view.

      I call it scientific misconduct.

      • Svante says:

        Yeah, it’s a conspiracy Gordon, just like the moon landings.

        • Mike Flynn says:

          S,

          I didn’t realise the Moon landings were faked. Thanks for letting everybody know.

          Cheers.

        • Stephen P Anderson says:

          Yeah, its a conspiracy Gordon, just like the moon landings.

          You leftists don’t need to conspire. You all think alike. You’re like a bunch of lemmings. You just watch what the next leftist is doing and herd mentality takes over and you support each other’s idiotic views to advance your common agenda which is to control everything-to create your leftist utopia.

          • Svante says:

            But I’m conservative!
            The world has adapted to the current climate and it works pretty well.
            Why would you want to risk upsetting this delicate balance, and throw the world into turmoil?

          • Bindidon says:

            This is one of the most stupid comments publsihed on this blog since years.

            You are probably a brainless alt-right Breitbart fan, and probably still admirfe people like Stalin, Hitler, Franco, Mussolini, Pinochet, Pol-Pot and the like.

            Just like Trump is a lover of people like Kim-Jong-Un…

          • Gordon Robertson says:

            binny…”This is one of the most stupid comments publsihed on this blog since years”.

            The more you open your mouth and let your belly rumble, the more obvious it becomes that I am right in calling you an idiot.

            Judith Curry was a co-author on the Berkeley Earth study and she withdrew her support due to the fudging of Mueller. The study, as it stands, is a fudged copy of the original, which did not find what the current copy claims.

          • Gordon Robertson says:

            stephen…”You leftists dont need to conspire”.

            The Leftists of today are not the Leftists of yesteryear. They have become politically-correct, effete snobs, riddled with intellectuals and special interest groups. It’s not that Leftists have become believers in AGW in general, it’s that special interest groups like eco-weenies have taken over the cause. They have done the same to the once proud National Academy of Science.

            One must distinguish between the leftist socialist and the communist of yore. The socialists formed unions IN DEMOCRATIC SYSTEMS and put their money where their mouths were. They took beatings and killings and kept at their cause. As a result, they won benefits like shorter work days and weeks, safer working conditions, health care, unemployment insurance, workers compensation and pensions.

            The communists who are generally referenced when the word Leftist is used were not communists. The Russian regime was run by Bolsheviks, who were nothing more than sadists who used the word socialism to give their brutal regime an image of the working class. The Bolsheviks threw socialists and communists alike into concentration camps, much like their counterparts, the Nazis.

            With regard to the global warming/climate change propaganda, there are as many right-wingers as Leftists involved. A carbon tax was imposed in the province of British Columbia, Canada by an uber-right wing regime. They found a way to filter the money collected back to private companies.

            This is not about political leanings, its about a belief system based on emotions. It is bereft of scientific logic or reasoning.

          • bdgwx says:

            GR, as has already been discussed Judith Curry did not withdrawl her support for the methodology she helped develop. She withdrew her support from the conclusion that came out of it after the fact. If there was any fraud on the part of BEST then JC played an active role in it since she gave her blessing on the method employed to produce the result.

          • Gordon Robertson says:

            bdg…”She withdrew her support from the conclusion that came out of it after the fact”.

            That’s an obtuse answer typical of alarmists.

            She withdrew her support after seeing Mueller re-interpret the results from the interpretation originally made by the team.

            Mueller changed from a skeptic to a believer of pseudo-science. He cannot be trusted, nor can his interpretation.

            Same with NOAA, GISS, and Had-crut. They change the facts, and the data, to suit the propaganda.

            Why you are blinded to this corruption is the question. Are you that naive?

          • David Appell says:

            Gordon Robertson says:
            She withdrew her support after seeing Mueller re-interpret the results from the interpretation originally made by the team.

            GR, what was the original interpretation, and how did Muller (not “Mueller”) change it?

          • bill hunter says:

            DA says: “GR, what was the original interpretation, and how did Muller change it?”

            Quite simple. You can read it for yourself here: https://judithcurry.com/2012/07/30/observation-based-attribution/

      • bdgwx says:

        GR said…”Berkeley Earth are fudge artists like NOAA. They have retroactively fudged temperatures to suit a point of view.”

        Keep in mind that NOAA, NASA, Berkeley Earth, Cowtan&Way, etc. all adjust pre-WWII data up for more than post-WWII. The result of these necessary adjustments is to reduce the amount of warming as compared to the raw data. What point of view do you think these institutions support exactly? Are you okay with using the raw data to draw conclusions from instead?

        • Gordon Robertson says:

          bdg…”Are you okay with using the raw data to draw conclusions from instead?”

          I am all for leaving the data as it was recorded. It’s sheer arrogance, never mind scientific-misconduct to go back in history and amend data based on a biased opinion.

          • bdgwx says:

            It’s misconduct to:

            – not consider the impact the time of day in which observations were made
            – not consider the impact of station moves
            – not consider the impact of the urban heat island effect
            – not consider the impact of instrument changes
            – not consider the impact of local factors that might bias observations

            Anyway, let’s move past all of that for now. Are you telling me you agree that the Earth has warmed even more than what NOAA, NASA, Berkeley Earth, Cowtan&Way, etc. have told us? Are you saying their agenda is to downplay the warming rate?

          • Paul Aubrin says:

            bdgwx said: “Its misconduct to:
            not consider the impact the time of day in which observations were made
            not consider the impact of station moves
            not consider the impact of the urban heat island effect
            not consider the impact of instrument changes
            not consider the impact of local factors that might bias observations”

            It is misconduct to blindly apply some non-validated algorithm and pretend to have achieved the goals above when checks with a few individual weather stations prove you just messed with the original data. Without a proper calibration period to compare two stations, the old one and the new one, you cannot validly infer what would have been the data at the new station from the old data, and even less what noise your adjustment procedure adds in the adjusted old data.

            Data is data. Automatically adjusted data is no more data and generally cannot be relied upon.

          • bdgwx says:

            Paul,

            So are you saying you support the viewpoint that the warming rate is even more than the institutions are letting on? Why would they want to downplay the warming?

            Also it sounds like you have a pretty good grasp on how these institutions deal with the issues I listed. What specifically about the way they handle these issues do you disagree with? For example, which calibration method would you have used instead to adjust for station moves? What was the difference in terms of the warming rate between your method and their method?

          • David Appell says:

            Paul Aubrin says:
            Data is data. Automatically adjusted data is no more data and generally cannot be relied upon.

            Paul, why do all the groups that measure temperatures, including Roy Spencer and UAH, adjust the raw data?

            What reason do they give for doing so?

          • Bill Hunter says:

            bdgwx says:

            “Its misconduct to:”

            I have heard it characterized as misconduct to treat station managers as idiots and to do so from a windowless office somewhere far away without even talking to the station manager.

          • bdgwx says:

            Bill, I’m not understanding what you mean. Who are these station managers you speak of? How are they being treated like idiots? How are they supposed to be interviewed?

          • Bill Hunter says:

            guess it went over your head. So explain to me what you think a station manager does during a typical day.

          • bdgwx says:

            Most station managers in the instrumental record, at least those in the early period, are likely dead so it’s not like they can be interviewed. And there’s no broad indictment of idiocy of them. And today most first order surface stations like ASOS and AWOS are fully automated at least in regards to temperature measurements so it’s like there is a person writing down a reading every 1 minute. Sure, upper air stations typically have a person launching the balloon, but the measurements themselves are fully automated. All measurements go through quality control which again is largely automated. Other datasets like satellite or reanalysis would have large groups of people engineering the hardware and software to collect and assimilate the data. Today there are tens of millions of observations taken on a global scale with the vast majority being automated at least in the sense of the actual measurement. That’s why I’m asking you to clarify what you mean by “station manager”.

          • Paul Aubrin says:

            David Apell said: Paul, why do all the groups that measure temperatures, including Roy Spencer and UAH, adjust the raw data?

            You are playing with words, as usual. You can carefully calibrate the output of a new device against the older one to be later able to compare the new values with the older ones. But if you didn’t have a calibration period, you just mess with the data.

          • Bill Hunter says:

            bdgwx says: “Most station managers in the instrumental record, at least those in the early period, are likely dead so its not like they can be interviewed. And theres no broad indictment of idiocy of them.”

            Sure there is, the claim is they didn’t record the low temperature of the day properly and did so on the basis of the time of the log entry without noting that the coldest time of the day varies throughout the night depending upon cloud cover, fronts, etc. Min/max thermometer was invented in 1780.

            If you can’t interview them you don’t know how they dealt with that so they just assumed they were idiots and made the adjustments because they felt the best science available demanded an answer. They didn’t even think of doing that before funding King Kevin Trenberth declared the monitoring systems a travesty.

      • David Appell says:

        Gordon Robertson says:
        Berkeley Earth are fudge artists like NOAA. They have retroactively fudged temperatures to suit a point of view.

        Gordon: why do the temperature groups — including UAH — adjust the raw data?

        Do you know?

        • bill hunter says:

          DA: – “Gordon: why do the temperature groups including UAH adjust the raw data? Do you know?”

          Sure do! I replied above to the comment by bdgwx on misconduct and pointed out that its probably misconduct to adjust the data treating the station managers as idiots and not even ever interviewing them as to the appropriateness of such actions. In the case of UAH, they are the station managers; and indeed sometimes the thermometer position needs to be corrected and the guys actively managing the thermometer have the best view of it.

          • bdgwx says:

            Well if station manager is the rule we are to go by then wouldn’t RSS be preferable over UAH?

          • Dr Roys Emergency Moderation Team says:

            bdgwx, please stop trolling.

          • Bill Hunter says:

            bdgwx says: Well if station manager is the rule we are to go by then wouldnt RSS be preferable over UAH?
            ———
            Excellent question bdgwx! The answer is I think we don’t know the answer. Why would one pick one over the other? Eventually, this discrepancy will get resolved but I don’t think today is a good day to just spin the bottle.

          • bdgwx says:

            I’m not saying that one should prefer RSS over UAH. In fact, I don’t think anyone should prefer any dataset over any other as long each has no egregious errors. They should all be treated equal. I’m just saying that if the rule is to prefer the data published by station managers then you should give RSS preferential treatment over UAH because RSS is the “station manager” for the bulk of the polar orbiting microwave satellite data.

          • bill hunter says:

            bdgwx says: Im just saying that if the rule is to prefer the data published by station managers then you should give RSS preferential treatment over UAH because RSS is the station manager for the bulk of the polar orbiting microwave satellite data.
            ————-

            Thats not a scientific argument. Its like saying the Pope’s scientists control most of the assets and models supporting the idea that the sun revolves around the earth. Its an appeal to authority that doesn’t move RSS any closer to the issue than UAH is.

            Further RSS used surface observation data to make their adjustments becoming yet another group to surrender to the mob mentality. . . .a factor that has absolutely nothing to do with science. Now UAH stands alone as a system developed completely separate from the land surface observations and becomes the only source of ground truthing the surface temperature record. Same thing occurred with the Argo buoy system. Its a problem with single source funding. politics creates an attractant that has nothing to do with science.

          • bdgwx says:

            Bill,

            I completely agree. It’s not a valid reason to prefer RSS over UAH. That’s what I’m saying. The idea of invoking station manager as a rule for selecting data is an appeal to authority and I disagree with it. That’s one reason why I treat RSS and UAH equally. I also treat the conventional surface datasets and reanalysis datasets equally as well.

            Actually at one point RSS used a global circulation model to make some of the adjustments. Their peers criticized this method and so instead they switched to another model-less technique. UAH makes the same adjustments that RSS does just using different techniques. Likewise UAH has been criticized for their methods as well. Neither of these groups are doing anything nefarious though. They are both committed to producing the most accurate dataset possible.

            By the way, neither RSS and UAH actually measure temperature. They measure microwave emissions that then have to be converted to a temperature using a model that maps these emissions to temperatures. And neither of them are looking at the surface. And both have a concern where the cooling stratosphere may be contaminating the result from the lower troposphere.

          • bill hunter says:

            bdgwx says: I completely agree.
            Actually at one point RSS used a global circulation model to make some of the adjustments. Their peers criticized this method and so instead they switched to another model-less technique. UAH makes the same adjustments that RSS does just using different techniques. Likewise UAH has been criticized for their methods as well. Neither of these groups are doing anything nefarious though. They are both committed to producing the most accurate dataset possible.

            ———
            Well you have to accept that by using the surface records to influence adjustments in RSS, you now have only two completely independent temperature records. UAH and everybody else.

            bdgwx says:

            By the way, neither RSS and UAH actually measure temperature. They measure microwave emissions that then have to be converted to a temperature using a model that maps these emissions to temperatures. And neither of them are looking at the surface. And both have a concern where the cooling stratosphere may be contaminating the result from the lower troposphere.
            —————–
            I have no problem with what they measure. Atmosphere temperature is important to the greenhouse effect particularly under the multi-layered theory.

            In fact, the cooling stratosphere under the mainstream theory would exert less forcing on the surface. Where have you heard that accounted for bdgwx?

          • barry says:

            Well you have to accept that by using the surface records to influence adjustments in RSS, you now have only two completely independent temperature records. UAH and everybody else.

            Surface temperature records are NOT used to influence RSS adjustments. The models are process-based, not fed surface data, and are used to test diurnal corrections. Here is the methods paper for RSS.

            https://journals.ametsoc.org/doi/full/10.1175/JCLI-D-16-0768.1

            RSS and UAH are not independent from each other at all, using the same metric and the same data streams – almost entirely the same satellite instrument readings.

            And you made your comment with no idea of the manner in which land surface might be being utilised to “influence” RSS. You determined what was dataset was closer to another with ZERO understanding of the processing method (never mind that the process you avouch is not even occurring).

            This is not skepticism, Bill. Not remotely.

          • Bill Hunter says:

            barry says: – Surface temperature records are NOT used to influence RSS adjustments. The models are process-based, not fed surface data, and are used to test diurnal corrections. Here is the methods paper for RSS.
            ————-

            Yep I misspoke. Surface temperature records and RSS are both climate model influenced. Just a slip of the tongue.

            But the conclusion withstands your criticism: “you now have only two completely independent temperature records. UAH and everybody else.”

  35. Stephen P Anderson says:

    Loved watching the 4th of July celebrations today and Trump’s speech-best Presdident since Abraham Lincoln.

  36. coturnix says:

    [since you didn’t write a separate 4th of july post, i’ll leave it here]

    Happy aphelion-2019 day!, and may the 1321 watts/m2 keep you cool! Glory to the sun, the clouds and the water vapor!

    • David Appell says:

      Oh boy, this is sad.

      The summer solstice is 6/21, not 7/4.

      The solar system doesn’t give a crap about US revolutionary movements. But it’s definitely funny that you think it does.

      • coturnix says:

        Oh, you gotta be kidding me… afaik there is no registration or comment notification on dr spencer’s blog, or is there? because otherwise, how u could reply to a random comment while making complete fool of yourself within 3 minutes unless you just sit there pressing F5 incessantly. Boy, this is sad…

        • David Appell says:

          Why would you write “Happy aphelion-2019 day” on July 4th?

          • Mike Flynn says:

            DA,

            Why do you pose stupid gotchas?

            Do you have a particular reason for wanting to know, or are you just trolling?

            In any case, I suppose a stupid and ignorant GHE true believer would be too lazy or incompetent to look up anything factual for himself, so –

            “Happy Aphelion Day! Earth is farther from the sun today (July 4) than at any other time of the year.”

            If you want to know the difference between solstices, aphelion, perihelion, etc., just ask me. I’ll tell you to use your initiative, and find out for yourself. Do you think your self proclaimed mind reading abilities might help?

            Cheers.

          • David Appell says:

            Mike Flynn says:
            Why do you pose stupid gotchas?

            To show how afraid you are to answer simple questions when it’s clear to you and to us that the answers undercut your previous crappy claims.

          • Mike Flynn says:

            DA,

            You wrote –

            “To show how afraid you are to answer simple questions . . .”

            Oh dear. More mind reading. Why do you think I should answer your pointless questions?

            In addition to mind reading ability, do you possess awesome super powers? Will you unleash them on my poor defenceless self if I refuse to play your stupid games?

            Carry on, David. Have you found out about the solstices, aphelion and perihelion yet? A bit too much to take in at one sitting?

            Best go back to complaining about people who poke fun at your stupid gotchas.

            Cheers.

          • nurse ratchet says:

            Calm down Mr Flynn.
            Is the nasty man asking you to answer nasty questions again?
            Please ignore him as it raises your blood pressure.

          • Mike Flynn says:

            Begone, troll!

          • bdgwx says:

            Aphelion occurs on July 4th.

          • coturnix says:

            Well, obviously because it is aphelion, duh; it seems that you, as had already been noted, confused aphelion with solstice. Which is very amusing, since i was under impression that you were a scientifically savvy alarmist. Honestly, I did think you were a douche, but at least i seen you as a knowledgeable and well-read douche, but now I’m not sure about that anymore. It seems to me I’ve discovered a breach in your knowledge about climate, and so I suggest that you learn about eccentricity and its role in climate system.

            In brief, if you don’t know, aphelion is an event that happens once per year around july 4th, when earth is at its most distant from the sun. Its match with the US independence day is of course a pure coincidence, especially given that due to earth axial precession, the aphelion day is not fixed and in 1776 it fell on july 1st or possibly may 30st. And if one is a sun-worshiper, it is a good date to celebrate! This way, you can celebrate the 4th of july without being a mouth-frothing us patriot or even a US citizen in the first place (and at this point it should be obvious that i am NOT one, of course). In my opinion it is a much more profound event than the solstices, although less in-your-face-obvious to an average joe, which gives it a veneer of mystery (same true about perihelion of course).

            But i did have yet another ulterior motive mentioning it here, that being to see how many people are aware of its role in climate system. Ever since i learned about it several months ago, it just keeps bothering me. Perhaps, I hoped dr. spencer would comment on it, to find out his opinion on the topic. Instead, i learned to my surprise that the alarmist-in-chief for drroyspencer-dot-com has no clue about its existence to the point of publicly humiliating himself; a rater unexpected but amusing result.

          • coturnix says:

            *** june the 30st, not may 30st of course

          • Gordon Robertson says:

            coturnix…”Which is very amusing, since i was under impression that you [Appell] were a scientifically savvy alarmist”.

            DA is a legend, in his own mind. He still doesn’t understand how heat gets here from the Sun when heat cannot flow through the vacuum of space.

            Re aphelion…interesting stuff in that one might think the summer heat would coincide with the perihelion. I guess there is not much eccentricity in the orbit.

            Goes to show that we have a lot to learn about how the Earth works as it orbits the Sun.

          • coturnix says:

            @GR

            >> Re aphelion…interesting stuff in that one might think the summer heat would coincide with the perihelion.
            <> I guess there is not much eccentricity in the orbit.
            <<
            – guess again. Or better yet, google up the aphelion/perihelion distances and calculate tye change in radiative forcing, and I mean it … you'd be pleasantly surprised and baffled, as was I. The change of toa solar radiative forcing over the course of the year is substantial and very much not negligible.

          • coturnix says:

            @GR

            “”” Re aphelioninteresting stuff in that one might think the summer heat would coincide with the perihelion.
            “””

            i’d say, not really. What coincides ith summer heat in NH is winter cold in SH, so don’t be a NH chauvinist =)

            “”” I guess there is not much eccentricity in the orbit.
            “””

            guess again. Or better yet, google up the aphelion/perihelion distances and calculate the change in radiative forcing, and I mean it … you’d be pleasantly surprised and baffled, as was I. The change of toa solar radiative forcing over the course of the year is substantial and very much not negligible.

          • David Appell says:

            coturnix, you were right about aphelion day, and I was wrong.

            Thanks.

      • Gordon Robertson says:

        DA…”The solar system doesnt give a crap about US revolutionary movements. But its definitely funny that you think it does”.

        What’s funny is your utter scientific illiteracy. As coturnix pointed out, July 4th is aphelion day, not solstice day.

  37. David Appell says:

    Wrong, bindion, you wrote that above.

    If you were quoting someone then use quote marks, which is proper English and put that way for a reason.

    If you don’t then people have no idea what you’re writing about and you’ll get the quotes you get and you have no legitimacy for complaint.

    We’re not here to read your mind.

    • Mike Flynn says:

      DA,

      Just a minute there, pardner!

      You wrote –

      “We’re not here to read your mind.”

      Of course you are. You claim to be able to read minds – you have no trouble claiming that you know what I have or have not read, or what I do or do not know, all without asking me!

      So get to it – read bindidon ‘s mind. Tell him what he thinks.

      By the way, when you read his mind, his nom-de-plume came through to you as “bindion”. I know you get your own name wrong from time to time, but you should make sure to get other peoples’ names correct, particularly if you intend to be critical about their grammar. It’s just basic courtesy.

      Sometimes lacking in GHE true believers, I know, but still . . .

      Cheers.

    • Bindidon says:

      Appell

      This is a really dumb reaction.

      You perfectly know that if you paste a text here and for a few seconds forget that this blog’s input scanner eliminates everthing non-ASCII, the quotes won’t be visible.

      “We’re not here to read your mind.”

      We could start a comparison, Appell, about who reads your mind rather than mine.

  38. Geoffrey says:

    I don’t know if you noticed it but the “paper” about 5 times more probability models that was issued only 4 days after the French episode and blindly used everywhere in the world media without any review process has been jointly authored by the French Atomic Energy Commission..
    What would happen if an oil and gas lobby would have published an article showing the contrary ?

    • ren says:

      Blocking circulation at the Bering Sea during periods of low solar magnetic activity (which is happening nowadays) threatens with very severe winters in North America.

  39. Michael Olsen says:

    It would be nice to know the breakdown of new records by month. I suspect that most of the heat records are being set in the winter months, and not in the summer months.

    As far as I know, there is not a really good AGW explanation for that, or have I missed something?

    • Svante says:

      The snow/ice albedo feedback?

    • Svante says:

      https://theconversation.com/the-greenhouse-effect-is-real-heres-why-1515:

      Patterns of temperature change that are uniquely associated with the enhanced greenhouse effect, and which have been observed in the real world include:
      – greater warming in polar regions than tropical regions
      – greater warming over the continents than the oceans
      – greater warming of night time temperatures than daytime temperatures
      – greater warming in winter compared with summer
      – a pattern of cooling in the high atmosphere (stratosphere) with simultaneous warming in the lower atmosphere (troposphere).

      • Gordon Robertson says:

        svante…”Patterns of temperature change that are uniquely associated with the enhanced greenhouse effect, and which have been observed in the real world include:”

        Where the scientific proof associating the patterns with AGW?

        • bdgwx says:

          Do you consider failure to falsify these AGW hypothesis simultaneous with the success in falsifying the various natural hypothesis as proof?

          If the answer is no then would you mind providing criteria by which you would adjudicate which theory is a best match to reality?

          • Mike Flynn says:

            b,

            What testable AGW hypothesis are you waffling about?

            You cannot actually produce any “theory” of AGW. I assume you are going to claim the GHE has something to do with AGW, but you cannot describe the GHE either!

            You’re just spouting pseudoscientific nonsense.

            Silly gotchas won’t get you far. The Earth has cooled over the last four and a half billion years. What part of that fact do you not understand?

            Try learning about the scientific method, if you can find the time. There is no GHE, no heating properties for CO2, and thermometers react to heat. The more humans, the more heat, the more CO2 and H2O. What part of this are you challenging? None?

            I didn’t think so.

            Cheers.

          • bdgwx says:

            The testable hypothesis I speak of are those listed in Svante’s post above.

            Surely you see the absurdity in saying the Earth has cooled based on nothing but 2 data points. Don’t you want to know what happened in between those 2 data points? Wouldn’t you like to use a theory based on physical processes to make predictions about future data points instead using limited skill techniques like persistence?

          • Mike Flynn says:

            b,

            You wrote –

            “The testable hypothesis I speak of are those listed in Svante’s post above.” A testable hypothesis is a hypothesis which can be tested by reproducible experiment.

            You cannot actually describe the “enhanced GHE” which Svante refers to. “Patterns pf temperature change” is meaningless without some refining. Nonsense terms such as “greater warming” are meaningless, unless they can be repeatably observed and measured. If you can’t even describe the GHE, trying to propose reproducible experiments is futile.

            Just more pseudoscientific blather.

            You go on –

            “Surely you see the absurdity in saying the Earth has cooled based on nothing but 2 data points. Don’t you want to know what happened in between those 2 data points?”

            A comparison between two temperatures indicates whether the temperature has risen, fallen, or remained the same. Two measurements – no more, no less. Why do I need to know what, if anything, occurred between the two measurements needed to record the amount and sign of temperature difference? The Earth has cooled. Nothing at all has managed to prevent it. Not any GHE, not any amount of CO2, not four and a half billion years of sunlight, not incalculable amounts of radiogenic heat – nothing.

            I do use theory to predict future outcomes. Every time I board an aeroplane, I trust that the theories involved in designing and building the aircraft are based on reality, and all those theories can and have been verified by reproducible experiment.

            Pseudoscientific climate cultists can’t even state what hey supposedly believe in. They won’t state in writing that increasing the amount of CO2 in the atmosphere (between the Sun and a thermometer) will make the thermometer hotter, because that would be ridiculous. Instead, they just claim that the world is getting hotter due to emissions (presumably by magic) – or something.

            Keep trying – or learn something about the scientific method. You might find you like it.

            Cheers.

        • Svante says:

          Gordon Robertson says:

          “Where the scientific proof associating the patterns with AGW?”

          Solar fingerprint comparison:
          https://tinyurl.com/yx8fcdnz

          • Mike Flynn says:

            S,

            You linked to a pointless piece of pseudoscientific nonsense.

            Ben Santer has a track record of manipulating IPCC reports, which he denied, prior to the emergence of the “Climategate” emails.

            Santer’s latest attempt at “fingerprinting” drew the following comment –

            “Santer et al address none of these issues, and instead and their analysis is little more than a politically driven attempt to prove that the warming seen since 1979 is due to CO2.”

            There is no scientific basis for believing that increasing the amount of CO2 between the sun and a thermometer will make the thermometer hotter. Santer’s nonsense is just more pseudoscientific climate cult propaganda.

            Of course you believe Santer – he is a senior climate cult leader, isn’t he?

            Cheers.

          • Svante says:

            Nice hand waving and zero science.

          • Bill Hunter says:

            Svante says: “Solar fingerprint comparison:”

            What I would be interested in would be a deeper analysis. Obviously the sun coming over the horizon each morning starts evaporating water or sublimating ice in the northern latitudes. This water vapor rises in the atmosphere raising the temperature of the top of the troposphere via condensation and release of latent heat.

            Thus it doesn’t seem one needs a science study to conclude that the “fingerprint” graph offered by a CO2 forced hotspot would be essentially identical to a solar forced hotspot.

            The difference of course is only one of those scenarios actually requires that the hotspot play a role on warming the surface. I will let you guess which one.

          • David Appell says:

            Mike Flynn says:
            Ben Santer has a track record of manipulating IPCC reports, which he denied, prior to the emergence of the Climategate emails.

            What’s your proof?

          • Mike Flynn says:

            DA,

            Why should I prove anything to you? You don’t seem to understand proof.

            Cheers.

      • Mike Flynn says:

        S,

        Unfortunately, you can’t actually usefully describe this nonsensical “enhanced greenhouse effect”, can you?

        The fact that the Earth has cooled over the last four and a half billion years in spite of your “enhanced greenhouse effect” seems to escape you entirely!

        All part of pseudoscientific climate cultism. A triumph of faith over fact, based on precisely nothing except the delusional thinking of self appointed “climate scientists”. Climate is the average of weather, and the IPCC stated that it is not possible to predict future climate states. Gee.

        Are you claiming to know better?

        Cheers.

      • Svante says:

        barry has remarked that the diurnal effect has abated, as evidenced here:
        https://www.nature.com/articles/ngeo1797

        “Most of the estimated DTR reduction occurred over 19601980. In several regions DTR has apparently increased over 19792012, while globally it has exhibited very little change (−0.016 K/decade).”

    • Rune Valaker says:

      “As far as I know, there is not a really good AGW explanation for that, or have I missed something?”

      You are right, in Norway all monthly heat records (at the national level) have been beaten in the last 20-30 years for the period of October to May, but the records for June, July, August and September are decades old. I think it has something to do with polar amplification and PA first and foremost a winter phenomenon, after all, we have more sunshine than anyone else in the summer months. You will se the same pattern un the Arctic, very warm from Oktober to May, but rather average from June to September/October.

  40. Curious says:

    And Scandinavia?

  41. Gordon Robertson says:

    mike flynn…”Actual surface temperatures are totally ignored in favour of nominal air temperatures taken under a variety of conditions at various heights above the surface with very poor controls relating to siting, instrument type and calibration, enclosure parameters and so on”.

    You forgot to mention the fabricated surface temperatures. NOAA has taken to replacing surface temperatures, for no known reason, for sites, by interpolating and homogenizing temperatures from nearby stations up to 1200 miles away.

    Most of the oceans are processed that way, with a few temperatures extrapolated to cover the entire ocean.

    That’s not to mention the plethora of station data they have altered retroactively, again, for no known reason. They claimed to have created a positive trend from 1998 – 2012 where the IPCC found none.

    One can only surmise the fudging and alterations are to bring the surface record in line with the paseudo-scientific AGW theory.

    • Bindidon says:

      The more ignorant people are, the more they guess, claim, discredit, denigrate and lie.

      • Mike Flynn says:

        b,

        Agreed. Gavin Schmidt, Michael Mann, James Hansen, Kevin Trenberth, David Appell, . . .

        Guesses, claims, discrediting, denigration, lies . . .

        You can no doubt lengthen the list.

        Cheers.

        • Bindidon says:

          Of course I can! By adding for example the very first one you silently and intentionally omitt: the guy nicknamed ‘Gordon Robertson’…

    • David Appell says:

      Gordon, are you saying you’re in favor of 100% thermometer coverage over the planet, say, one every cm2?

      If not, then tell us how you would handle areas with no thermometers.

      • David Appell says:

        PS: Let us know the cost of 1 sensor/cm2. Including maintenance, especially in the polar regions.

        • Mike Flynn says:

          DA,

          You wrote –

          “PS: Let us know the cost of 1 sensor/cm2. Including maintenance, especially in the polar regions.”

          Why? Don’t you know? You could try and find out for yourself, if you weren’t so busy wasting your time with stupid gotchas. Or maybe you are just too lazy or incompetent. Which is it?

          Cheers.

  42. Aaron S says:

    At a bigger scale all these regional records are most likely the result of a stronger NAO/ AO which is most likely getting more active as a result of global warming and in the future the warming may result in a minor transgression of global sea level. So what? Why is that scenario a crisis? Nearly every species alive has been through this process. The crisis is that humans have consumed so much of the global landscape that fauna and flora can not respond like they did in the past. The irony is increasing wind and solar would only contribute more to the crisis by converting more land to human resources and at the same time doing little to stop the doubling of CO2. Isnt the solution then to reduce the human footprint with actions like increasing nuclear, increasing high yield agriculture that allows more land to revert to natural, and obviously population reduction? I just can’t buy into a bunch of people eating their food with palm oil and sipping a iced coffee through a paper straw talking about going green. It just seems we are missing the bigger picture and focusing on details that are not the crisis.

  43. JDHuffman says:

    “3 Facts the Media Don’t Tell You”

    Another fact not told us is that CO2 can NOT warm the planet. Either from dishonesty, or incompetence, we are being misinformed. Very few people understand the relevant physics of Earth’s climate. So we become easy targets for a massive hoax.

    Just consider the so-called “energy budget”. For someone that honestly understands photon absorp.tion/emission, and thermodynamics, the diagram is a tragic inaccuracy. There are several versions, but all are essentially the same:

    https://upload.wikimedia.org/wikipedia/commons/b/bb/The-NASA-Earth%27s-Energy-Budget-Poster-Radiant-Energy-System-satellite-infrared-radiation-fluxes.jpg

    The diagram contains numerous violations of the laws of physics, but just consider three of the most obvious ones:

    1) Notice the values are in units of “Watts/m^2” The values are “fluxes”, not “energy”. Energy can be added/subtracted using simple arithmetic, but fluxes cannot. Energy is conserved, fluxes are not conserved.

    2) The solar flux arriving Earth’s “disk” is the “solar constant”, about 1360 Watts/m^2. After adjustment for albedo, that leaves 960 Watts/m^2 that can be used to “warm the planet”. The diagram only indicates 240 Watts/m^2 (“240.5”, to match the exact numbers) being absorbed by Earth’s system, with only 163.3 Watts’m^2 actually reaching the surface!

    3) Notice that only 163.3 Watts/m^2 is absorbed at the surface, yet the surface emits 398.2 Watts/m^2!

    There are many more things wrong. It’s a fun puzzle: “Can you find all the things wrong in the picture?”

    • Svante says:

      Funny how Dr. Roy Spencer missed all that.

      • Mike Flynn says:

        S,

        You wrote –

        “Funny how Dr. Roy Spencer missed all that.”

        Did you use your supposed mind reading skills to arrive at that conclusion? Or are you just making the usual stupid and ignorant cultist assertions?

        The world wonders.

        Cheers.

          • Mike Flynn says:

            S,

            You claim you read Dr Spencer’s posts to determine that Dr Spencer was unaware of certain facts.

            If you want to hide behind Dr Spencer, you could find a better quote from him. You wrote –

            “Heres the GHE explained for you: ‘. . . a simple no greenhouse effect'”, referring to Dr Spencer’s post.

            Your mind reading skills are not exceeded by your English comprehension, obviously. You appear to have redefined “no greenhouse effect’ to mean “greenhouse effect”, in the finest climate cult tradition. In the same vein as “slower cooling” is redefined to be “warming”, and so on.

            This is all well and good, but does not advance your cause much, does it?

            You remain as stupid and ignorant as ever. I know you cannot help yourself, and I understand. You have my sympathy.

            Cheers.

          • Svante says:

            I forgot about your poor comprehension.
            I don’t suppose the illustrations here will help:
            http://www.drroyspencer.com/2019/06/on-the-flat-earth-rants-of-joe-postma/

          • Mike Flynn says:

            S,

            Ah, I see. Your first link was irrelevant, so you try an even more irrelevant link. No GHE explanation there, either.

            Maybe you should try to hide behind Dr Spencer by linking to every post he has ever made. Surely there must be something there that supports your mad assertions, eh?

            Are you still claiming that increasing the amount of CO2 in the atmosphere between the Sun and a thermometer makes the thermometer hotter?

            What a fool you are! Lurching from one stupid appeal to authority to another, and not even getting any of them right.

            No GHE. CO2 heats nothing. Gavin Schmidt is not a climate scientist.

            Cheers.

          • Svante says:

            Mike Flynn says:

            “Are you still claiming that increasing the amount of CO2 in the atmosphere between the Sun and a thermometer makes the thermometer hotter?”

            That’s exactly what Roy Spencer claims here:
            http://www.drroyspencer.com/2019/06/a-simple-no-greenhouse-effect-model-of-day-night-temperatures-at-different-latitudes/

          • Mike Flynn says:

            S,

            You wrote –

            “Thats exactly what Roy Spencer claims here:”

            Nonsense. If he did, you would quote him, wouldn’t you? You’re a cultist fool.

            Not even a good try. I asked you “Are you still claiming that increasing the amount of CO2 in the atmosphere between the Sun and a thermometer makes the thermometer hotter?”

            I don’t blame for refusing to reply. Just posting a link which doesn’t support your nonsense might make you appear deranged. Your choice, of course.

            Maybe you could try evasion and obfuscation?

            Cheers.

          • Svante says:

            Too difficult for you?
            Here’s a quote:
            “This demonstrates the importance of the atmospheric ‘greenhouse’ effect, which increases surface temperatures well above what can be achieved with only solar heating and surface infrared loss to outer space.”

          • Mike Flynn says:

            S,

            You are just being silly, now.

            Dr Spencer does not even mention CO2, does he?

            He just says –

            ” . . . the atmospheric greenhouse effect, which increases surface temperatures well above what can be achieved with only solar heating and surface infrared loss to outer space.”

            Not quite what you claimed, is it? Actually, no resemblance to your assertion.

            Maybe you could try appealing to the faker, the fraud, or the fool. That might work for you.

            Cheers.

      • JDHuffman says:

        Actually, troll Svante, it’s funny how you reject facts and logic. You can’t find anything wrong with my points, so all you do is attempt to pervert reality.

        Nothing new.

        • Ball4 says:

          “You can’t find anything wrong with my points”

          First JD writes point 1): “Energy can be added/subtracted using simple arithmetic, but fluxes cannot.”

          Then JD writes point 2) wherein JD uses simple arithmetic on energy fluxes: “the “solar constant”, about 1360 Watts/m^2. After adjustment for albedo, that leaves 960 Watts/m^2″

          JD doesn’t follow JD’s own rules is what is wrong with JD’s points, nothing new.

          JD’s 3) is wrong since in near steady state global surface equilibrium shows ~398.2 Watts/m^2 is absorbed at the surface as the surface emits ~398.2 Watts/m^2.

          JD doesn’t understand radiative physics. Learn some physics JD but keep your popular entertainment 3 ring circus going & certain readers do miss your bogus but entertaining cartoons.

          • JDHuffman says:

            fluffballs deficit in physics, combined with his overdosing on pseudoscience, is why he cant respond coherently and responsibly.

            Nothing new.

          • David Appell says:

            How is he deficient in physics? Show us your physics-based proof of that.

          • Mike Flynn says:

            DA,

            You wrote –

            “How is he deficient in physics? Show us your physics-based proof of that.”

            Why should he?

            Cheers.

        • Svante says:

          JDHuffman says:

          “You cant find anything wrong with my points, so all you do is attempt to pervert reality.”

          Here’s an attempt by Dr. Roy Spencer:
          http://www.drroyspencer.com/2019/06/on-the-flat-earth-rants-of-joe-postma

          • JDHuffman says:

            Wrong troll Svante.

            That is just another of your failed attempts to hide behind Dr. Spencer. You can’t defend your pseudoscience, so you hide.

            Come out from under that rock and tell us how the surface can emit more than twice what it gets from solar.

          • David Appell says:

            Ger*an says:
            Come out from under that rock and tell us how the surface can emit more than twice what it gets from solar.

            Because of the greenhouse effect!

            You may finally be understanding something….

          • Mike Flynn says:

            DA,

            You wrote –

            “Because of the greenhouse effect!”

            Unfortunately, you might just as well said “Because of Magic!”

            How would you describe this “greenhouse effect”? Does it involve magical heating properties of CO2 perhaps?

            Cheers.

          • JDHuffman says:

            DA, the only understanding is your obsession with Ge*ran.

            After that, you just survive on your trifling inheritence from your parents. Kind of like a “trust-fund baby” on welfare, huh?

          • David Appell says:

            Ger*an, do you have a scientific, rational response, instead of name calling and insults?

            Because the latter just show the vapidity of your original argument

          • JDHuffman says:

            Now DA, I can’t respond rationally and scientifically to a troll, now can I?

            You need to clean up your act, if you expect to be treated like an adult.

          • David Appell says:

            JDHuffman says:
            Now DA, I cant respond rationally and scientifically to a troll, now can I?

            Calling me names doesn’t change the fact that you don’t respond to my scientific arguments. You only make excuses.

          • Mike Flynn says:

            DA,

            You wrote –

            “Calling me names doesnt change the fact that you don’t respond to my scientific arguments.”

            You mean pseudoscientific climate cult dogma, don’t you? You can’t even describe the GHE which you claim exists, can you?

            Make sure you include the reason that the Earth has cooled since its creation, and explain why night is colder than day. Maybe the Earth radiates more energy away than it absorbs from the Sun, do you think?

            Cheers.

    • David Appell says:

      Energy can be added/subtracted using simple arithmetic, but fluxes cannot.

      If an amount of energy E1 passes through an area A, so with average flux E1/A, and an amount of energy E2 passes through the area A, so with an average flux E2/A, then the total average flux passing through A is (E1+E2)/A = E1/A + E2/A = the sum of the individual fluxes.

      • JDHuffman says:

        DA, the more you display your ignorance of physics, the funnier it gets.

        Please continue.

        • David Appell says:

          JDHuffman says:
          DA, the more you display your ignorance of physics, the funnier it gets.

          Your inability to provide a critique that is science-based doesn’t say much for your argument.

          Tell us why I’m wrong and you’re right

          • JDHuffman says:

            You’re wrong because you’re incompetent. You have exhibited an ignorance of physics.

            Do you need examples?

          • David Appell says:

            What “ignorance of physics” have I demonstrated. Be specific.

          • Mike Flynn says:

            DA,

            You commanded –

            “What “ignorance of physics” have I demonstrated. Be specific.”

            Ooooh. Manly. Assertive.

            And if he doesn’t? Maybe you could wave your hand, and stamp your foot? Off you go now, and try and figure out why anybody should follow your orders.

            Cheers.

          • JDHuffman says:

            DA says: “Tell us why I’m wrong and you’re right.”

            DA, your arithmetic is right, but your physics is wrong. An equal energy through an equal area is valid. But, the incoming solar, after albedo is 960 Watts/m^2. That incoming impacts the “disk” of 2A, where “A” is Earth’s surface area. So, the incoming ENERGY is 1920A Joules/sec. Yet, according to your pseudoscience, only 163.3A Joules/sec is absorbed by the surface!

            You clowns don’t understand the relevant physics, all you do is swallow the pseudoscience.

            Nothing new.

          • JDHuffman says:

            I got the areas mixed up.

            Incoming solar energy = 960A Joules/sec

            Pseudoscience claims surface absorbs = 653.2A Joules/sec.

            Where “A” is the area of the “disk”.

            I should have waited to see if the clowns would notice my mistake–likely not….

      • Mike Flynn says:

        DA,

        Complete nonsense. You claim to have a PhD in physics? Did you buy it online?

        Photons are not subject to Pauli’s exclusion principle.

        Look it up for yourself. Don’t bother asking me. You wouldn’t understand.

        Cheers.

    • David Appell says:

      Ger*an wrote
      3) Notice that only 163.3 Watts/m^2 is absorbed at the surface, yet the surface emits 398.2 Watts/m^2!

      The first number is sunlight only.

      When you add the IR coming down from the atmosphere, you get the full amount that balances energy.

      That’s right, about 2/3rds of the energy received at the surface is IR radiation emitted by the atmosphere.

      • Mike Flynn says:

        DA,

        Yet more nonsense. There is no energy balance, and you are clearly unbalanced.

        The Earth has cooled. Night is colder than day, winter is colder than summer, and the polar regions remain cold even while receiving six months of continuous sunlight.

        Best stick to your pointless and irrelevant gotchas about clothes, overcoats, swimming pools and all the rest of the rubbish you spout – good for laughs, if nothing else!

        Cheers.

      • JDHuffman says:

        Calling on your hero Ger*an, while botching the physics again, is doubly funny.

        Please continue.

        (Getting a job might help you. The economy is booming. Even the unemployables can find employment.)

        • David Appell says:

          Ger*an: what physics was botched?

          (Or is name calling the best you can do?)

          • JDHuffman says:

            You would be the one name-calling.

            But denial is one of your specialties.

          • David Appell says:

            “Huffman”: It was established long ago that you comment in the same manner as “Ger*an,” often identically so.

            Now, are you going to address my scientific arguments?

          • Mike Flynn says:

            DA,

            You wrote previously –

            “When you add the IR coming down from the atmosphere, you get the full amount that balances energy.”

            Pseudoscientific gobbledygook!

            That’s about as stupid as saying that you can add 300 W/m2 from ice to 300 W/m2 from sunlight and get increased temperature! You are a fool if you believe such nonsense.

            You asked –

            ” . . .what physics was botched?”

            Another witless gotcha? If you don’t know the answer, your supposed PhD obviously stands for “Piled higher and Deeper”.

            Carry on denying. The Earth has still cooled, and Michael Mann still hasn’t got the Nobel Prize he claimed! How thick would you have to be to think you got a Nobel Prize when you didn’t?

            Cheers.

          • Gordon Robertson says:

            DA…”what physics was botched?”

            The 2nd law was contravened. It’s not possible to transfer heat from cooler GHGs in the atmosphere to the warmer surface in order to raise its temperature.

            That notion not only contradicts the 2nd law, it’s damned silly.

            Furthermore, energy has been created as back-radiation with no explanation of its magnitude. It’s like Trenberth and Kiehle needed to balance the energy budget so they pulled watts out of a hat.

          • JDHuffman says:

            DA botches the physics: “When you add the IR coming down from the atmosphere, you get the full amount that balances energy”

            DA, solar and IR fluxes have different spectra. They have different photons. They are DIFFERENT. They cannot be simply added. You’re STILL trying to warm a room-temperature house with ice cubes. It won’t work!

            Learn some physics.

  44. Dr Myki says:

    Nothing is wrong.
    Only your warped interpretation.
    Get a copy and read “Atmospheric Radiative Transfer for Dummies”.

    • Mike Flynn says:

      DM,

      Are you reduced to issuing pointless commands to anonymous non-believers?

      I don’t blame you – no realist seems to be inclined to dance to your discordant tune.

      Maybe if you just strung random words together, you might be more persuasive. Good luck!

      Cheers.

      • Dr Myki says:

        MF, I was responding to the question:”“Can you find all the things wrong in the picture?”
        I’ve noticed your declining ability to follow an argument and stick to the point.
        Old age cannot be fun.

        • Mike Flynn says:

          DM,

          If you don’t mention what you are replying to, it doesn’t make you look smarter.

          Unlike pseudoscientific climate cultists, not everybody believes they can read minds.

          As to sticking to the point, let he that is without sin . . .

          The majority of your comments seem pointless. You cant even describe this “GHE” which you so ardently defend. How pointless and pathetic is that?

          Cheers.

  45. Amillena says:

    Bindindon

    The record in june in Bilbao and Vitoria was in 1950. San Sebastian in 2003, yes. Not all the records are at the same moment in all weather stations.

    The influence in temperatures of urban areas and airports during heat waves is obvious, like this link shows…if you take long periods or oceanic stations…the influence, of course, is not as evident

    Thanks for your comments

    https://m.europapress.es/ciencia/habitat-y-clima/noticia-huella-ola-calor-capitales-europeas-espacio-20190703141206.html

    • Bindidon says:

      Amillena

      Thanks in turn for this reply. It’s a bit late now to react (over 3 AM).
      I’ll answer downthread later.

      • Bindidon says:

        Amillena

        Sorry, I still lacked idle time to go a bit deeper into UHI.

        Did you read this comment?

        http://www.drroyspencer.com/2019/07/record-high-temperatures-in-france-3-facts-the-media-dont-tell-you/#comment-361312

        *
        I just had some little idle time for a comparison of the GHCN daily stations Sevilla AP and Moron AP in Al Andalus.

        For the period 1960-2019, Sevilla showed a higher trend than Moron; but for 2000-2019, it was the inverse.

        Another comparison in Alaska for which I made a graph some days ago: Anchoragge AP vs. Kenai. Temps in the very rural Kenai are regularly 2 C lower than in the urban Anchorage, but both stations’ records have the same trend during Kenai’s lifetime (2011-2019, incredible 3 C / decade):

        https://drive.google.com/file/d/14aS2UEkD0_Uw2rC05ywbQNdIURBVW-GW/view

        cu

        • Gordon Robertson says:

          binny…”I just had some little idle time for a comparison of the GHCN daily stations Sevilla AP and Moron AP in Al Andalus”.

          Still pushing that fudged, corrupt record?

          • Bindidon says:

            Still the most uneducated, ridiculous, pretentious uncommenter

            – who has never been able to process time series and thus urges in discrediting those who do;
            – denies time dilation, use of relativity basics in GPS, etc etc etc;

            of course doing all that on a blog lacking any moderation, and with a faked pseudoreal name?

  46. Gordon Robertson says:

    bill hunter…”But the nature of a radiation barrier is of a blanket of undefined thickness that decreases heat transfer by radiation”.

    There are unclear inferences in your statement. In practice there is no such device. Radiation barriers are substances that reflect radiation back to the source, they do not decrease heat transfer by radiation. They might reduce heat LOSS by radiation.

    This is the problem with heat transfer via radiation, no heat is physically transferred. With conduction, heat is physically transferred electron to electron in a conductive substance. With radiation, heat is CONVERTED to electromagnetic energy AND LOST.

    If that EM is from a hotter source and contacts a cooler target, the cooler target will absorb it and warm. That is, the EM is converted to heat and LOST. Therefore heat is reduced in the source and increased in the target. The heat decrease/increase is local, not a transfer of heat through space.

    So how do GHGs prevent heat transfer from the surface by radiation? They can’t. All GHGs can do is absorb a trace amount of surface radiation.

    In order to reflect radiation you need a metal-coated surface that creates a barrier to radiation. The space blankets you see with ametallic inner coating is such a radiation reflector. There’s no way the trace amount of GHGs in the atmosphere could ever act that way.

    The presumption in AGW is that the atmosphere somehow absorbs all energy radiated by the surface. All the radiated energy represents a heat loss at the surface but it has little to do with GHGs. It’s the temperature of the 99% of the atmosphere that is nitrogen and oxygen that affects the rate of heat loss at the surface.

  47. Svante says:

    It’s funny how JDHuffman’s messages to others are so well suited for himself, e.g. “Pseudo-scientific climate clown” and “learn some physics”.

    Here’s a good one:
    https://tinyurl.com/y3sw2gkk
    JDHuffman says:

    Energy can be added/subtracted using simple arithmetic, but fluxes cannot.

    David Appell says:

    If an amount of energy E1 passes through an area A, so with average flux E1/A, and an amount of energy E2 passes through the area A, so with an average flux E2/A, then the total average flux passing through A is (E1+E2)/A = E1/A + E2/A = the sum of the individual fluxes.

    Then JDHuffman goes into a hand waving routine to hide the fact that he’s demonstrably wrong, because he never admits being wrong.

    The latter is proved here, where he is again describing himself:
    https://tinyurl.com/y2paoytu

    People that refuse to admit they are wrong are refusing to learn.

    Then he tops it of by calling me a “troll” that “misrepresents” him, again a perfect description of himself.

    • Michael Flynn says:

      S,

      Just stop and think for a sec.

      The Pauli exclusion principle does not apply to photons. You may add as many as you like by adding fluxes, but the result is as meaningless as adding two temperatures (subject to certain qualifications, of course.)

      Try adding 300 W/m2 from ice to 300 W/m2 from sunlight, and convince yourself the result is meaningful. 600 W/m2 of what? Temperature? Power? Flux? Stupidity?

      Off you go now – add some fluxes. You can seek advice from the nearest delusional pseudoscientific climate cultist. You could start with the likes of Trenberth, Mann, or Schmidt, if you like. Let me know how you get on.

      Or you could just add all the flux from the Sun over the last four and a half billion years, and explain why the Earth actually managed to cool. Only joking, even you couldn’t be that silly – I hope.

      Cheers.

      • Svante says:

        The other climate clown chimes in to support the failing pseudo-science.

        It’s a flux of 600 Joules of energy per second per m^2 by the way.

        • Mike Flynn says:

          S,

          S,

          You wrote –

          “Its a flux of 600 Joules of energy per second per m^2 by the way.”

          From Wiki –

          “The watt (symbol: W) is a unit of power. In the International System of Units (SI) it is defined as a derived unit of 1 joule per second, and is used to quantify the rate of energy transfer.”

          Do you expect me to thank you for telling me something I already know, or because you look snarkily foolish?

          Still no GHE. No CO2 heating at all. the Earth has cooled for four and a half billion years.

          Feel free to tell me something else I already know – it’s unlikely a stupid and ignorant person can expand my not inconsiderable knowledge, but you never know. There are still many things I don’t know.

          Carry on.

          Cheers.

          • Svante says:

            The earth has warmed for two hundred years.

          • Mike Flynn says:

            S,

            You wrote –

            “The earth has warmed for two hundred years.”

            Well, no, it hasn’t.

            What you mean is that some thermometers seem to be getting generally hotter in some areas, over an indeterminate number of years.

            Cheers.

          • Svante says:

            The earth has accumulated energy in line with the enhanced GHE.

          • Bill Hunter says:

            Svante says: “The earth has accumulated energy in line with the enhanced GHE.”

            Well that would be correct if and only if the current popular theory of how the greenhouse effect works actually works that way. Right now with the need to alter the monitoring record for the sole purpose of bolstering but still not filling the failure of the models to perform one might even go so far as to say they don’t know how the greenhouse effect becomes enhanced.

          • Svante says:

            Roy recently calculated the surface temperature w/o GHGs.
            Now we are adding more GHGs, standard physics shows you it will result in warming.

            The monitoring record has been verified by proxies and ARES.

          • Bill Hunter says:

            Svante says: “Roy recently calculated the surface temperature w/o GHGs.Now we are adding more GHGs, standard physics shows you it will result in warming.”

            Perhaps. The idea of the atmosphere acting like a solid because of its lapse rate is not to be found in classical physics.

            Svante says:
            “The monitoring record has been verified by proxies”

            You mean the monitoring record has been adjusted by proxies.

            Svante says:
            “and ARES.”

            ARES is a climate investment fund focused on profiting on a climate crisis. https://www.bloomberg.com/news/articles/2019-03-06/ares-starts-fund-to-profit-from-push-to-combat-climate-change. So that makes perfect sense.

          • Svante says:

            It is not “based on the atmosphere acting like a solid”, whatever gave you that idea?

            Sorry, “Recent global warming as confirmed by AIRS”:
            http://tinyurl.com/y6pg7szl

          • Bill Hunter says:

            Svante says: It is not based on the atmosphere acting like a solid, whatever gave you that idea?
            ——
            Solids are the only known things in the universe that maintain a variable resistance to heat transfer. You should read Gerlich and Tscheuschner, 2009

            Svante says:
            Sorry, Recent global warming as confirmed by AIRS:
            —————
            No doubt a Freudian slip! LMAO! So exactly what does airs do to confirm it?

          • Bill Hunter says:

            Svante says: – Gerlich and Tscheuschner are refuted by Roy Spencer here:

            Holy criminy, you don’t even know what the G&T paper set out to establish. Roy’s experiments in no way shape of form address what G&T were going on about.

            Sure there is a greenhouse effect, absolutely. G&T was not about whether there was a greenhouse effect it was a paper describing that the current greenhouse theory of how the greenhouse effect is created and varies is outside of known science.

            They quit because Gerlich passed away, but nobody ever rose to the challenge of establishing a detailed description of the forces at work that add up to our existing greenhouse effect and G&T stated that in their last notes.

            The response to G&T was so wimpy the author doesn’t want it in public. Its behind a paywall with no buy button and they ask you to contact the author which he ignores.

          • Svante says:

            Where do they say that the GHE exists?

          • Bill Hunter says:

            Svante says: – Where do they say that the GHE exists?

            Sheesh why would they say anything about that? The article is about the insulation characteristics of the whole atmosphere which is most likely zero using insulation in the terms of a multi-layered resistance to heat and energy transference.

            If they said the greenhouse effect existed a bunch of morons would probably list them as part of the consensus that we are all going to die from global warming and distract from what they are trying to say.

          • Svante says:

            In fact they say that the GHE does not exist in multiple places, e.g.:
            “3.7.5 Non-existence of the natural greenhouse effect”.

            How do you reconcile “the insulation characteristics of the whole atmosphere which is most likely zero” with Dr. Roy Spencer’s GHE calculation?

          • Bill Hunter says:

            Svante says: – In fact they say that the GHE does not exist in multiple places, e.g.:
            3.7.5 Non-existence of the natural greenhouse effect.
            ————

            You are taking a section title and assuming thats what the section is about. But if you read the section you will see what G&T are taking issue with as fiction, is the calculation of the GHE being 33 degrees.

            This is an area I don’t have resolved either because there are problems with assuming a greybody is a blackbody.

            G&T opened wounds that obviously have not healed. I asked the question a few weeks ago about how emissivity was calculated for a greybody, I think here, and only got wisecracks as a response. Maybe you can answer the question. Stefan-Boltzmann equations include an emissivity factor and thus the question is a crucial one for which nobody seems to have any science to rest their numbers on. I even asked Trenberth why he didn’t consider emissivity and that just annoyed him.

            So you see Svante you think all this is nice and tidy wrapped up in well accepted physics when in fact it isn’t even close to that.

            Svante says: – How do you reconcile the insulation characteristics of the whole atmosphere which is most likely zero with Dr. Roy Spencers GHE calculation?
            ———

            I don’t know what you are talking about regarding Roy’s calculation.

          • Svante says:

            Bill Hunter says:

            I don’t know what you are talking about regarding Roy’s calculation.

            You say:

            But if you read the section you will see what G&T are taking issue with as fiction, is the calculation of the GHE being 33 degrees.

            Roy Spencer calculated temperatures in line with the 33 C average GHE. How is that not at odds with the quote?

            The emissivities of terrestrial surfaces are all in the range of 0.96 to 0.99 (except for some small desert areas which may be as low as 0.7).

          • Bill Hunter says:

            Svante says: But if you read the section you will see what G&T are taking issue with as fiction, is the calculation of the GHE being 33 degrees.
            ————-

            You don’t think its rather ficticious to calculate the emissivity of a surface that reflects 30% of light as the same as one that reflects zero light?

          • Svante says:

            Not if you deduct the reflected energy.

            There is something seriously wrong with your BS filter if you go with G&T and discard Dr Spencer. They spend the first part of the paper showing that the GHE is not exactly like a greenhouse. Cripes.

          • Bill Hunter says:

            Svante says: Not if you deduct the reflected energy.

            There is something seriously wrong with your BS filter if you go with G&T and discard Dr Spencer. They spend the first part of the paper showing that the GHE is not exactly like a greenhouse. Cripes.
            ——-
            First, I have no idea what you are talking about Roy’s calculation.

            Second, the GHE is not exactly like a greenhouse.

            Third, If you deduct the reflected energy most of which is attributable to the fact their are greenhouse gases in our world you are artificially increasing the greenhouse effect because the reflectivity of that results from putting water vapor in the air wouldn’t be there without water vapor. This countervailing effect might be called negative feedback but to a crowd with an agenda. . . .no freaking way will we give up one lousy watt to negative feedback unless we can exclusively use to explain it as a temporary phenomena to explain why the models don’t work. If you can’t spot such BS you have been totally inculcated.

          • Svante says:

            Bill Hunter says:

            “First, I have no idea what you are talking about Roy’s calculation.”
            I linked it ten messages up at “July 10, 2019 at 4:48 AM”.

            “Second, the GHE is not exactly like a greenhouse.”
            Yes, it’s a stupid strawman.

            “Third, If you deduct the reflected energy most of which is attributable to the fact their are greenhouse gases in our world you are artificially increasing the greenhouse effect because the reflectivity of that results from putting water vapor in the air wouldn’t be there without water vapor. This countervailing effect might be called negative feedback but to a crowd with an agenda. . . .no freaking way will we give up one lousy watt to negative feedback unless we can exclusively use to explain it as a temporary phenomena to explain why the models don’t work. If you can’t spot such BS you have been totally inculcated.”
            What a confused argument!

          • Bill Hunter says:

            Svante says: – What a confused argument!
            —–
            Yes it was poorly written. A simplified version would go like this: Under the mainstream theory where the greenhouse effect is controlled by TOA forcing and otherwise the surface is near being a blackbody; that means almost all albedo (.3) is a negative feedback due to radiant forcing.

            This negative feedback is completely ignored in climate models. Remove this error in calculating the greenhouse effect from a earth with zero greenhouse effect and the greenhouse effect we know today is about 9.5C above that.

            I am intimately aware of what goes on in computer modeling for litigation support. Here the objective is to best make the clients case without getting so unreasonable that the judge or jury denies you credibility. 300% spreads between highly skilled legal teams and accountants are not uncommon. Eventually somebody must make a decision but often its a punt.

            In the above case its hard to imagine, if anybody ever gets legal standing to sue, that from the mainstream warmist lobby there would need to be major concessions. For instance saying that 1/2 the observed warming was likely caused by mankind. I think we are getting close to that as an international legal objective but I still think its wrong and the press and a whole cadre of inculcated alarmists, the more dire predictions seem to be lingering. . . .like UFOs.

          • Svante says:

            Another confused argument.
            You don’t seem to know what a feedback is.
            It is something that increases (positive feedback) or decreases (negative feedback) the original signal.

            Climate and models have lots of feedbacks.
            For example the snow/ice albedo feedback.

            Of course the albedo is included, whatever made you think it wasn’t?

          • Bill Hunter says:

            Svante says: – Another confused argument.
            You don’t seem to know what a feedback is.
            It is something that increases (positive feedback) or decreases (negative feedback) the original signal.

            Climate and models have lots of feedbacks.
            For example the snow/ice albedo feedback.

            Of course the albedo is included, whatever made you think it wasn’t?
            ———-

            No you are confused. You just stated (consistent with mainstream theory) that clouds are a feedback of the greenhouse effect; therefore its part of the greenhouse effect.

            You are deceiving people if put all the negative feedbacks into the calculation in order to exaggerate the size of the greenhouse effect and then you can pretend there are no negative feedbacks, only positive ones in your forward projections because the huge gap demands there be positive feedbacks. Accountants love this kind of nonsense. Bernie Madoff and the Enron executives would be proud. But its not fraud. There is nothing illegal about holding bizarre scientific beliefs – like daily visits from UFOs. If you call KT he will probably tell you there are no cloud feedbacks, only more water vapor.

          • Svante says:

            Bill Hunter says:

            No you are confused. You just stated (consistent with mainstream theory) that clouds are a feedback of the greenhouse effect; therefore its part of the greenhouse effect.

            Yes, I say the cloud feedback is probably positive.
            Lindzen says it’s strongly negative.

            You are deceiving people if put all the negative feedbacks into the calculation in order to exaggerate the size of the greenhouse effect and then you can pretend there are no negative feedbacks, only positive ones in your forward projections because the huge gap demands there be positive feedbacks.

            I introduce negative feedbacks so I can pretend there are no negative feedbacks???

            Negative feedbacks make the GHE less harmful!

            Accountants love this kind of nonsense. Bernie Madoff and the Enron executives would be proud. But its not fraud. There is nothing illegal about holding bizarre scientific beliefs like daily visits from UFOs. If you call KT he will probably tell you there are no cloud feedbacks, only more water vapor.

            You’re analogies from the accounting world is leading you astray.

            KT says the cloud feedback is positive.

          • Bill Hunter says:

            Svante says:

            Yes, I say the cloud feedback is probably positive.
            Lindzen says it’s strongly negative.

            I introduce negative feedbacks so I can pretend there are no negative feedbacks???

            You’re analogies from the accounting world is leading you astray.

            KT says the cloud feedback is positive.
            —————-

            For criminy sakes,

            The net cloud feedback of clouds isn’t positive. But even if it positive that fact is entirely irrelevant to the point I am making.

            The greenhouse effect is calculated as current temperature in excess of 255K and they get 33 degrees. They calculate that number from the amount of radiation absorbed by the earth system of 239 watts/m2. But 1/4th of the solar constant is 341 watts/m2. So to get it down to the 239 watts they subtract albedo.

            Albedo that is being subtracted is from reflection of sunlight from snow cover and clouds, both products of water vapor. Without water vapor you get neither snow nor clouds.

            Thus all albedo derived from snow and clouds is a product of the greenhouse effect if the greenhouse effect is caused by greenhouse gases.

            So the correct greenhouse effect with all feedbacks is about 9.5k instead of 33K. 341watt/m2 with is 1/4th the solar constant would produce a surface temperature of about 278.5k.

          • Bill Hunter says:

            Another weird thing in the calculation of the greenhouse effect is using an emissivity of 1.0 to figure the radiant intensity. The surface reflects about 6% of the solar incoming off of snow if you assume everything else is 1.0 emissivity. So the snow reduces the outgoing emissivity under that assumption as well. So at 289K and .94 emissivity outgoing radiation is 374 watts/m2. That works out to a greenhouse effect of 33watts/m2 not 33K. So somebody probably just made a mistake in switching kelvin for watts/m2. LMAO! I guess that makes some pretty good cover huh?

          • Svante says:

            Bill Hunter says:

            The net cloud feedback of clouds isn’t positive.

            You don’t understand what a feedback is.
            Clouds cool earth due to their albedo.
            If higher temperature causes less clouds it will enhance the initial warming. That is an example of a positive feedback.
            If it causes more clouds it is a negative feedback (through increased albedo).

            The greenhouse effect is calculated as current temperature in excess of 255K and they get 33 degrees. They calculate that number from the amount of radiation absorbed by the earth system of 239 watts/m2. But 1/4th of the solar constant is 341 watts/m2. So to get it down to the 239 watts they subtract albedo.

            OK.

            Albedo that is being subtracted is from reflection of sunlight from snow cover and clouds, both products of water vapor. Without water vapor you get neither snow nor clouds.

            OK.

            Thus all albedo derived from snow and clouds is a product of the greenhouse effect if the greenhouse effect is caused by greenhouse gases.

            OK.

            So the correct greenhouse effect with all feedbacks is about 9.5k instead of 33K. 341watt/m2 with is 1/4th the solar constant would produce a surface temperature of about 278.5k.

            I see what you mean. It is a consequence of the GHE but albedo is not in the GHE definition.

            In Spencer’s calculation you had temperatures above freezing at low latitudes, so WV would spread and never melt nearer the poles. That means a positive snow/ice albedo feedback. It has happened more than once in Earth’s history. The CO2 thermostat broke that vicious circle.

            Another weird thing in the calculation of the greenhouse effect is using an emissivity of 1.0 to figure the radiant intensity. The surface reflects about 6% of the solar incoming off of snow if you assume everything else is 1.0 emissivity. So the snow reduces the outgoing emissivity under that assumption as well. So at 289K and .94 emissivity outgoing radiation is 374 watts/m2. That works out to a greenhouse effect of 33watts/m2 not 33K. So somebody probably just made a mistake in switching kelvin for watts/m2.

            Yes, you did that mistake.

            The 6% is part of the albedo, so it’s already deducted.

          • bill hunter says:

            You got a lot of what I said but you missed some important points. First, ice absorbs about the same as water, its snow and its crystalline structure that creates the albedo and you can’t have snow without precipitation, and you can’t have precipitation without evaporation, thus it is all part of the greenhouse effect, the entire albedo.

            The issue on the 6% surface albedo has an effect on the emissivity of the surface according to Stefan-Boltzmann. Thus a surface with .94 emissivity and a temperature of 289K will emit 372 watts/m2. (i was off 2watts above because above i used a percentage estimate rather than modtran)

            Budgets show the surface emitting 398watts using an emissivity factor of 1.0 for 289K.

    • JDHuffman says:

      Yes Svante, DA’s example demonstrates how easy it is for you clowns to fool yourselves. He chose an example of equal energy and equal area. But, the “energy budget” diagram does not use equal energy with equal areas. You too have tricked yourselves, again.

      himself, e.g. Pseudo-scientific climate clown and learn some physics.

      Nothing new.

      And yes, you are a troll, and you do misrepresent me. It’s just that you cannot admit it.

  48. David Appell says:

    Roy, did you cite work by Watts et al that never got published in a scientific journal? Seems so:

    https://twitter.com/hausfath/status/1146450263395319808?s=12

    Thats seriously not cool Roy, if so, and characteristic of the kind of shenanigans you have tried to pull before with journals and editors….

    • Mike Flynn says:

      DA,

      Ooooh! Shenanigans! Sounds interesting. You are going to provide some proof of course. Otherwise, people might think you are just making stuff up, mightnt they?

      Cheers.

    • Eben says:

      Appell creep still trying to bite at Dr. Roy Spencer ankles doesn’t get a clue he will just be ignored

    • Gordon Robertson says:

      DA…”Thats seriously not cool Roy, if so, and characteristic of the kind of shenanigans you have tried to pull before with journals and editors.”

      F*** off, Appell.

  49. ren says:

    A clear temperature drop in the region Niño 3.
    https://www.tropicaltidbits.com/analysis/ocean/nino3.png

  50. ren says:

    Data from Oulu indicate that the minimum develops similarly to the minimum after the 22nd cycle, but the solar wind activity is lower.
    http://oi65.tinypic.com/15civtj.jpg

    • Gordon Robertson says:

      ren…”The amount of heat falls in the upper equatorial Pacific.”

      We are now experiencing the unstable weather normally experienced in early June. It has been cloudy, cool, and rainy from the last week of June till today in July.

      I wonder if we are going to have a summer.

  51. JDHuffman says:

    More facts for clowns to deny:

    Morning high haze, directly overhead –> 18.1 °F

    Ground –> 74.6 °F

    The Sun warms the surface and the surface warms the atmosphere. The atmosphere can NOT warm the surface.

    Nothing new.

    • JDHuffman says:

      Oh yeah, I remember Climategate. That was the beginning of the end for the AGW hoax. The funniest part was when they investigated themselves, finding they had done nothing wrong!

      • Svante says:

        Quick Russian damage control by JDHuffman.

      • Gordon Robertson says:

        JD…”The funniest part was when they investigated themselves, finding they had done nothing wrong!”

        That was a real hoot. When Phil Jones, then head of Had-crut, was investigated, he was represented by his university (East Anglia). They were allowed to submit the questions he’d be asked and those heading the investigation had conflicts of interest. All had connections to the AGW propaganda movement.

        • Svante says:

          You’re gullible Gordon, you fall for any conspiracy theory.

          • Bill Hunter says:

            Questionable science practices were manipulated for the purpose of deception. No question about that. The emails conspiring to do it would be more than enough to convict a securities fraud scheme. However, science is allowed to be far more imaginative than the sellers of securities.

          • Svante says:

            You’re gullible too. Thousands of quote mined emails came up with about a dozen red herrings. Hacked by Russia and released just before climate summits. Talking about fake news.

            The main real finding was avoiding FOIA request, because they felt harassed.

          • Bill Hunter says:

            Svante says: “Youre gullible too. Thousands of quote mined emails came up with about a dozen red herrings. Hacked by Russia and released just before climate summits.”

            Sure thing Svante. So to you its OK to truncate the tree ring proxy temperature decline, then hide the remainder of the decline on a superimposed temperature record for the purpose of deceiving policy makers about the reliability of tree rings as a proxy and sell the hockey stick theory there was no MWP or LIA.

            Then adding to that the conspiracies to silence skeptics and of course deny them access to materials to replicate their work. All good and fine and excusable to you because asking for that stuff made them feel harrassed. LMAO! Sounds like a slow speed white bronco chase to me. . . .but you are lock, stock and barrel convinced its all legitimate huh?

          • Svante says:

            Truncating tree rings was a bad call, but it was not a big secret, had been discussed in scientific papers before.
            https://en.wikipedia.org/wiki/Divergence_problem

            Many other proxy studies have shown the same pattern, the hockey stick has been confirmed over and over. MWP/LIA are there too, so you can relax.

            It was bad a bad call to obstruct the FOIA requests, but it is understandable under the circumstances. Jones had devoted his career to this and FOIA people said he was a fraud.

            He got his data data from different meteorological agencies and some, e.g. Poland, did not allow him to send them on. People could get the data themselves.

            Richard Muller was upset about the “trick”, and he didn’t trust the temperature record. Jones weeded out bad data, BEST had had a brilliant method that could use any biased input. The result was the same, so Jones did a good job.

            It is equally plain to see that the Bronco guy was guilty.

          • Bill Hunter says:

            Indeed Svante. Such behavior in the financial community gets you 3 squares a day behind bars. However, the advice is never trust the claims of an expert unless you have an implied contract with that expert. Your doctor, engineer, accountant, etc. are bound by standards and due diligence. Academics give you nothing as do any other experts you have no implied contract with.

          • Svante says:

            Contracts are broken.

            Science works like a court that never stops. It is verified over and over. There is a tree trunk and branches that grow stronger and stronger, but twigs fall off all the time. Roy Spencer often disputes twigs such as the US hurricane trend, but no sensible scientist can dispute the GHE.

            Your view of scientists is fantasy. Go to lectures and get to know them. Here’s one of them:
            https://www.youtube.com/watch?v=fuRU10ocuds

          • bdgwx says:

            That’s a good analogy Svante. It’s not uncommon for tertiary or even secondary hypothesis (branches/twigs) to get falsified. But the primary hypothesis (trunk) continues to survive with the mountain of supporting evidence piling up higher every year. The trunk is so solid now that it is very unlikely to ever be overturned. It would take an absolutely Earth shattering epiphany upend the whole tree at this point.

          • Bill Hunter says:

            Svante says: “Contracts are broken.”
            ——–
            Indeed, and its a good way to get rich if you are the victim of a broken contract.

            Svante says:
            “Science works like a court that never stops. It is verified over and over. There is a tree trunk and branches that grow stronger and stronger, but twigs fall off all the time. Roy Spencer often disputes twigs such as the US hurricane trend, but no sensible scientist can dispute the GHE.”
            ——
            STRAWMAN! Nobody I am talking about is disputing the GHE. What is being disputed is predictions regarding the variability of the greenhouse effect. Try to fit that past your thick skull.

            Svante says: Your view of scientists is fantasy. Go to lectures and get to know them. Heres one of them:
            ——-
            I would venture I probably work with scientists an order of magnitude more than you. You can’t seem to fathom that I have given a very positive view of scientists with the exception of the climategate bunch and few others. I have a bigger beef with elitist politicians who destructively influence the imagination of scientists. Fact is Svante, we are all just working slobs, some with more integrity than others. But almost all of us work for a paycheck on stuff somebody else tells to work on.

          • Svante says:

            I’m glad we agree that the GHE is real.

            What is the variability if it is not like this:
            http://climatemodels.uchicago.edu/modtran/

            University scientists can propose their own research projects.

          • JDHuffman says:

            What people like Svante and bdgwx attempt to do is twist reality. One way is to point out that CO2 absorbs IR. Everyone agrees. Then, they point out that CO2 also emits IR. Everyone agrees. Then, they claim that the emitted IR will raise the temperature of the surface, hence the so-called “GHE”.

            CO2 emitted IR will NOT raise the surface temperature.

            But, they won’t stop pushing their false religion. That’s what they do.

            Nothing new.

          • bdgwx says:

            I have never claimed that the IR emitted by CO2 could warm the surface by its own means.

            Likewise I have never claimed that the insulation in your home could warm the inside by its own means.

            The key phrase here is “by its own means”. Both require an injection of energy from outside the system for the warming to take place. The thermal barrier just augments that external energy source’s ability to do the warming.

            If you disagree with the fact that the insulation in your home or the GHGs in the atmosphere act as thermal barriers then state concisely what your argument is so that we can review it together.

          • Bill Hunter says:

            Svante says: Im glad we agree that the GHE is real.
            —–
            Of course its real.

            Svante says: What is the variability if it is not like this:

            —–

            It is about light traveling through the entire atmosphere. GHE is about light effects at one point in the atmosphere where.

            Svante says: University scientists can propose their own research projects.
            ——–

            So can I. Yes thats the idea of academic freedom. But what we have is a shadow of the model while still trying to retain the protection of scientists in the name of academic freedom.

          • Bill Hunter says:

            bdgwx says: I have never claimed that the IR emitted by CO2 could warm the surface by its own means.
            ——–

            Then you don’t explain how it gets warmed except maybe some vague reference of the sun warming it for a second time.

          • bdgwx says:

            Bill,

            GHGs are a type of thermal barrier that is sensitive to the wavelength of radiation. Because incoming radiation is shortwave and because GHGs are transparent to shortwave radiation the energy is allowed to pass through. However the outgoing radiation is longwave and because GHGs are opaque to longwave radiation they absorb it and then emit it in all direction with half of it returning to the surface. In this way the energy that would have escaped to space is returned back to the surface. Because of this radiational cooling is slowed down. All other things being equal if the surface of Earth starts off at a higher it will achieve a higher temperature on the next diurnal cycle.

            The insulation in your home works the same way. It is a thermal barrier that does not resist the injection of natural gas or electricity to power your furnace, but it does impede the loss of energy from your home via convection, conduction, and radiation. In this manner the insulation augments the furnace’s ability to warm the inside.

            CO2’s thermal barrier properties were discovered and quantified in the mid 1800’s. The effect it has on the planet was studied in the late 1800’s so this is very old and well established science.

          • Bill Hunter says:

            bdgwx says: GHGs are a type of thermal barrier that is sensitive to the wavelength of radiation. Because incoming radiation is shortwave and because GHGs are transparent to shortwave radiation the energy is allowed to pass through. However the outgoing radiation is longwave and because GHGs are opaque to longwave radiation they absorb it and then emit it in all direction with half of it returning to the surface. In this way the energy that would have escaped to space is returned back to the surface. Because of this radiational cooling is slowed down. All other things being equal if the surface of Earth starts off at a higher it will achieve a higher temperature on the next diurnal cycle.
            ——

            I don’t disagree with that.

            bdgwx says: The insulation in your home works the same way.
            ———-
            I don’t know who told you that but no it doesn’t.

    • Svante says:

      It’s not very surprising, the emails where first released in Siberia.
      The pattern has become clear, another example is the
      Russia planned cyber-attack on the Organisation for the Prevention of Chemical Weapons (OPCW) in The Hague:
      https://www.bbc.com/news/world-europe-45747472

      • Gordon Robertson says:

        svante…”Its not very surprising, the emails where first released in Siberia.
        The pattern has become clear, another example is the
        Russia planned cyber-attack on the Organisation for the Prevention of Chemical Weapons (OPCW) in The Hague:”

        **********

        This proves beyond a reasonable doubt that you are terminally naive.

        Have you the slightest idea how hackers operate? On the Internet, there are proxy servers set up by the corporate community. Anyone can use such a server to strip off the sending IP address and replace it with a meaningless address.

        Hackers route their communication through several such servers and there is no way whatsoever they can be traced. In fact, the more clever hackers ‘spoof’ the sending source to lay the blame on someone else.

        That’s why the security personnel in the US are full of bs when they claimed to have identified the so-called hacker of their government computers.

        This is nothing more than McCarthy-era Russia bashing. They may have had a reason back then due to the Draconian Stalin era, but there are still McCartyhyists, like Hillary CLinton, who hate Russians on principle.

        McCarthyism was not about what was going on in Russia, it was a paranoia based on the notion that Russians were hiding under every bed in the US. The paranoia became so rampant that good scientists like Linus Pauling and David Bohm were targeted, along with 100s of other innocents.

        Furthermore, there is a notion that all Russians are bad-assed, Commies burning to ruin the lives of those in Democratic countries. I would venture that most Russians are too busy trying to survive to give a hoot. It was not the fault of the Russian people that sadistic idiots like the Bolsheviks took over Russia and forced all Russians into serving that brutal administration.

        • Svante says:

          If the internet security is good then it’s easier to hack the WLAN. Check out the stuff they found in their car.

          Most Russian are great, but the regime has paranoia.
          It’s based on security concerns that the west should work hard to resolve.

    • Gordon Robertson says:

      entropic…from your link…

      “The identity of the hackers has remained a mystery despite the efforts of law enforcement and journalists”.

      Then they go on, like the IPCC, after claiming future climate states cannot be predicted, to speculate as to where the hackers came from…Russia.

      What is this, the slam Russia decade? If you have a problem, blame Russia.

      Pathetic!!!

      • Entropic man says:

        Gordon Robertson

        The only other countries in the same timezone are Russia, Pakistan and India.

        Of the three, Russia has form as a hacker of Western databases, while Pakistan and India do not.

        Whoever did the CRU hack has remained remarkably quiet about it, which susggests a state organisation rather than an individual.

    • bdgwx says:

      Here are links to the formal investigations of the UEA email incident for those who are curious.

      https://tinyurl.com/yyha2f39
      https://tinyurl.com/yyswj4lg
      https://tinyurl.com/y2d2mqtr

    • bdgwx says:

      …and…

      https://tinyurl.com/y68afv74
      https://tinyurl.com/yy8tegsp
      https://tinyurl.com/yy6pc4lk
      https://tinyurl.com/y4uyqaku

      Somewhat interesting…AFAIK McIntyre was never investigated for his role.

      • Eben says:

        ☭☭☭☭☭☭ ruskis ☭☭☭☭☭☭☭☭☭ ruskis everywhere ☭☭☭☭☭☭☭☭☭

  52. E. Swanson says:

    Meanwhile, back in the real world, things are still getting warmer.

    • JDHuffman says:

      Swanson, whenever some Skeptic points out a new cold record, some Warmist always jumps in to point out that “weather is not climate”.

      But, they probably won’t do that with a new warm record….

    • ren says:

      This is a very bad forecast for the US for the winter of 2019/2020.

    • ren says:

      If La Nina is created in the winter, I feel sorry for the people of North America.

      • Gordon Robertson says:

        ren…”If La Nina is created in the winter, I feel sorry for the people of North America”.

        Don’t know about those in the lower, more warmer states in the US (yes the US is IN America and not America as they claim) but up here in the cooler part of North America, in Canada, we are used to the cold.

        Here on the west coast near Vancouver, it seldom goes below -10C, and only for a day or two if it does. Might give us something to talk about if temps drop to -20C.

        I worked a night shift outdoors in the Edmonton area for several months where temps were -25C. If you are dressed properly and have places to warm up occasionally, you’re fine. As long as the wind doesn’t blow hard.

        I have also experienced prairie weather at -50C. Below -35C, survival becomes another matter. Not T-shirt and shorts weather.

        • Svante says:

          Does it feel like people are rubbishing your whole career in the oil industry?
          There is no need to feel like that, it’s a great business that filled an important role in the world economy.
          It’s just that it has a side effect that must be fixed.

        • Dr Roys Emergency Moderation Team says:

          Svante, please stop trolling.

    • Gordon Robertson says:

      svante…”Meanwhile, back in the real world…”

      Wow, Svante, whouda thunk? 90F in Alaska during an El Nino?

      https://www.travelalaska.com/Planning/Alaska-Climate.aspx

      “Highest Temperature

      100 F (38 C) at Fort Yukon on June 27, 1915”.

      1915????? Where was all the CO2 in 1915?

  53. PhilJ says:

    Curious,

    “Comment??”

    Thats pretty neat. If true, it will help confirm my hypothesis that the rate of ozone creation is governed by the concentration of co2 in the mesosphere.

    https://agupubs.onlinelibrary.wiley.com/doi/abs/10.1029/JD092iD04p04325

  54. Gordon Robertson says:

    bdg…”The testable hypothesis I speak of are those listed in Svantes post above”.

    Svante quoted an article eschewing the fact that the predictions are based on unvalidated climate models. An unvalidated model cannot be tested against the scientific method. If it could, the model would be validated.

    Therefore Mike’s assertions stands that no testable hypothesis can be offered for either AGW or the GHE.

    • Entropic man says:

      Gordon Robertson

      I’m interested. How do you validate models projecting future events?

      • Mike Flynn says:

        EM,

        You wrote –

        “Im interested. How do you validate models projecting future events?”

        By experiment.

        As Feynman said –

        “It doesn’t matter how beautiful your theory is, it doesn’t matter how smart you are. If it doesn’t agree with experiment, it’s wrong.”

        Make observations, formulate hypothesis, do experiment, and so on. As to numerical prediction of weather (and the average of weather – climate), it turns out that chaos is involved, as Lorenz hypothesised.

        Any model which fails to take this into account is pointless. Even if you consider a very simple equation (the logistic equation, (x)=rx(1−x), is one such), this models various animal populations over time. Depending on initial outputs, final behaviour may be fixed, periodic, or chaotic. As I have mentioned before, there is no minimum change to initial outputs which will result in chaos.

        This is just the way it is.

        However, with other models, experiment may verify the theoretical projections. One needs to bear in mind Einstein’s quote –

        “No amount of experimentation can ever prove me right; a single experiment can prove me wrong.”

        I trust the models which led to the construction of the aircraft in which I fly. So far, so good. The modelling for the 737 Max 8 MCAS turned out to be not so good, resulting in a good few deaths. The model has been shown to be invalid.

        Assumptions need to be made. Climate modelling doesn’t seem to be useful in any way – no better results than you or I can assume, based on history.

        Cheers.

    • bdgwx says:

      3 of those hypothesis were proposed by Arrhenius between 1895-1910 long before NWP climate models (if that’s what you meant) were even a thing. And all of the them are testable. In fact, UAH tests some of them; maybe even all of them. And all of them have survived falsification thusfar. On the flip side all natural-only hypothesis have been falsified to some extent, albeit with varying levels of confidence.

      • JDHuffman says:

        More fiction from bdg: “On the flip side all natural-only hypothesis have been falsified to some extent, albeit with varying levels of confidence.”

        He can make up stuff as well as any typist.

      • PhilJ says:

        bdgwx,

        “And all of them have survived falsification thusfar”

        While I’m not sure what hypotheses you are referring to, I have thoroughly debunked the hypothesis that co2’s insulative effect is to warm the surface.

        On the contrary, by increasing the O supply to the stratopause it in fact cools the surface as it increases production of ozone, blocking more uvb

        • bdgwx says:

          So what kind of test can be constructed that is unique to this hypothesis and which you would accept as a valid falsification attempt.

          • PhilJ says:

            b: “So what kind of test can be constructed that is unique to this hypothesis and which you would accept as a valid falsification attempt.”

            If the concentration of ozone increases, ocean temps must decline.

            If the concentration of ozone remains stable then the ocean temps must stabilize.

            If the concentration of ozone declines then ocean temps must increase.

            Any of these shown to be false would falsify the hypothesis

          • Mike Flynn says:

            b,

            You need to structure your hypothesis in such a way that it can be tested by reproducible experiment, if you want to go on to develop a theory.

            If you can’t, it remains speculation – a guess, in other words.

            Pseudoscience cannot be objectively tested by experiment. That’s why it is called pseudoscience.

            The experiment conducted by Nature over four and a half billion years shows that any supposed GHE was unable to prevent cooling. Not quite what you wanted, I suppose. Oh well.

            Cheers.

          • PhilJ says:

            caveat…

            “If the concentration of ozone increases, ocean temps must decline.”

            there is a limit to this decline… the full ab*so*rp*t*ion of uvb by the stratosphere…

          • bdgwx says:

            Phil,

            I agree those hypothesis are definitely testable. I don’t think they would necessarily uniquely identify ozone as the cause of ocean temperature changes because other agents could be in play, but at least you can test to see if ozone can be eliminated as the cause for ocean warming. You could further refine the set of hypothesis to include the magnitude of the effect and see whether and see whether the theory still holds up.

            Other ozone hypothesis might be:

            – If stratospheric ozone decreases then stratospheric temperatures decrease.

            – If stratospheric ozone increases then stratospheric temperatures increase.

            And I think both of these would survive falsification. That means ozone clearly plays a role in the climate system.

            Again, the rub is that these hypothesis aren’t distinctively caused by ozone. And ozone is also a GHG so its the magnitude of the net effect that is going to be the most discriminatory and the most salient in falsifying whether ozone is THE cause of hydrosphere warming or just a contributing factor. By the way…scientists already consider ozone as a contributing factor to global warming so it’s not like this is being ignored.

          • PhilJ says:

            bdgwx,

            “I agree those hypothesis are definitely testable.”

            Thank you, although I think a laboratory experiment would be difficult to set up… perhaps on the space station?

            ” I don’t think they would necessarily uniquely identify ozone as the cause of ocean temperature changes because other agents could be in play,”

            No, no no no… lol (repeating from other thread…)

            ozone is not the cause… uvb is! Ozone limits the amount of uvb reaching the surface!

            b: “Other ozone hypothesis might be:

            – If stratospheric ozone decreases then stratospheric temperatures decrease.

            – If stratospheric ozone increases then stratospheric temperatures increase.

            And I think both of these would survive falsification. That means ozone clearly plays a role in the climate system.”

            Agreed! where the uvb is absorbed, that’s where you’ll find the heat.

            b: “Again, the rub is that these hypothesis aren’t distinctively caused by ozone.”

            Again, I’m talking about UVB causing the heating or cooling and ozone (or more properly Oxygen!) as the regulator of how much UVB makes it to the surface.. More co2 in the mesosphere means more atomic Oxygen available to create ozone…

            The rub is determining how much of that UVB is absorbed at (or below) the surface!

            Oceans readily absorb uvb down to about 50 M or so

            Snow and ice REFLECT uvb ( yes Ive had snowburn..)

            how bout land? organic material absorbs uvb (perhaps thats what absorbs it in the ocean too?) but what about sand? different types of rock? frankly I dont know….

            but I do know that if you increase the solar uvb input to the oceans, you are increasing the heat flow to the ocean…

            b: “And ozone is also a GHG so its the magnitude of the net effect that is going to be the most discriminatory and the most salient in falsifying whether ozone is THE cause of hydrosphere warming or just a contributing factor. By the way…scientists already consider ozone as a contributing factor to global warming so it’s not like this is being ignored.”

            ozone’s ‘GHE’ that they have been studying is worthless…

            ozone does indeed provide a heat flux to the cooler atmosphere below the ozone layer, but this flux is fully absorbed well above the surface…

            this of course highlights the problem with the ‘energy budget’ diagrams… they show heat flux for evaporation and conduction but NOT for radiation…

            the IR heat flux from the atmosphere to the surface is (on average) negative…

  55. Gordon Robertson says:

    svante…”Then JDHuffman goes into a hand waving routine to hide the fact that hes demonstrably wrong, because he never admits being wrong”.

    The problem lies in Appell’s, and apparently your, inability to understand flux. The term flux comes from Newton’s word fluxion, which is equivalent to the first derivative of a fucntion. In other words, a line of flux is an instantaneous change in a field.

    If you want to take the full change of a surface area you must apply a surface integral. It makes no sense, as DA claimed, to add the flux over one surface to the flux over another surface.

    If you consider the solar EM flux at TOA, it’s about 1360 W/m^2. If you take another m^2 nearby at 1360 W/m^2 and add the fluxes together, what is it you are implying?

    If you took all the m^2 surface areas of an entire sphere around the Sun at 1 AU (TOA) you’d have the total flux from the Sun over a sphere at 1 AU. Using that info, you could calculate the power at the solar surface that produced such a flux density at 1 AU.

    • bdgwx says:

      GR said…”If you consider the solar EM flux at TOA, its about 1360 W/m^2. If you take another m^2 nearby at 1360 W/m^2 and add the fluxes together, what is it you are implying?”

      You mean like 1360 + 1360 = 2720? Why would anyone do that?

      • Mike Flynn says:

        b,

        Silly pseudoscientific climate cultists do almost exactly that. For example, Trenberth has a wonderfully stupid graphic which “adds” fluxes. Amongst other things, his brightly coloured graphic has 341.3 W/m2 of sunlight “added ‘to 333 W/m2 of “back radiation”.

        Complete and utter nonsense, of course. I suppose even you wouldn’t be stupid and ignorant enough to believe such rubbish. The Earth has cooled. Nothing has stopped it. That’s just the way it is, brightly coloured cartoons notwithstanding.

        Cheers.

      • bdgwx says:

        MF,

        The fluxes you see in the various energy analysis are always in reference to the same area. It is valid to compute net energy flows using addition/subtraction because of this fact. What GR is proposing is nonsensical nevermind being a strawman since I’ve not seen a reputable scientists recommend doing so.

        I’d still like to get clarification from GR in case the point was something other than what I thought.

    • Dr Myki says:

      Listen up children.
      For the umpteenth time:
      The Earth/atmosphere system intercepts and absorbs (as a disc) a TOTAL of 1360 pi R^2(R-radius of the Earth) times about 0.6 (i.e. 1 minus albedo) Watts.

      Assuming it is a black body system, it emits at a RATE of sigma T ^4 W/m^2 (Stefan Boltzmann, T=average temperature of the system – not the surface).
      Integrating over the entire sphere of radius R gives the TOTAL emission by the system of
      sigma T^4 4 pi R^2 Watts.
      Equating watts absorbed to watts emitted and dividing both sides by pi R^2 yields:
      sigma t^4 = 239 Watts.
      Which is exactly what Trenberth’s diagram shows.
      Simple.
      All your babble about adding fluxes and areas etc is totally irrelevant when you do the arithmetic. (You did study arithmetic I hope).

      • Mike Flynn says:

        DM,

        And still the Earth has cooled over the last four and a half billion years, has it not?

        You may calculate, differentiate, integrate, or denigrate as much as you like.

        You can’t even describe this silly GHE which you preach, can you?

        Don your funny hat and robe, and practice all the pseudoscience you want. At least it costs you nothing, and hopefully won’t cost me anything either. I wish you well.

        Cheers.

      • Bindidon says:

        Dr Myki

        Comment OK, with the exception of

        “he Earth/atmosphere system intercepts and absorbs (as a disc)…”

        The ‘disk’ of course is not correct because you have an hermisphere hit by the Sun whose surface is 2 pi R^2.

        But you have to apply to the solar irradiance a latitude weighting equal to the square of the cosine of the incidence angle.

        Int [0, pi/2] (cos^2 (x) dx = 0.5

        And that is what gives you the pi R^2.

    • Entropic man says:

      Gordon Robertson

      As you say, the rate of energy flow, the flux, is the first derivative of the total energy flow. To calculate the total energy flow you multiply the flux( energy flow per unit area) by the total area receiving the energy.

      I am in a room with three light bulbs in a chandalier. The total flux reaching my eye is the sum of the flux emitted by aech bulb.

      You only add fluxes when you have multiple sources. Imagine that a second sun appeared beside the first one. Each sun produces a flux of 1360W/m^2 at the TOA subsolar point. The total flux from both suns is now 1360+1360 = 2720W/m^2.

      • Entropic man says:

        Mike Flynn

        As I said above, you can add fluxes from different sources to calculate the total flux received by a given area.

        Thus it is entirely reasonable to calculate the total flux reaching 1m^2 of Earth’s surface by adding the solar flux 341.3W/m^2 and the flux from back radiation 333W/m^2 to get a total flux of 674.3W/m^2.

        • Mike Flynn says:

          EM,

          The trouble is that one “flux” comes from a 5800 K source, and the other comes from a source of completely unknown temperature.

          Ice can emit 300 W/m2. Concentrate this energy with a lens (just like using a lens with sunlight), and if you concentrate the energy into a very small area, you can easily achieve a “flux” of 30,000 W/m2.

          Completely pointless, and you cannot raise the temperature of an object above that of the ice. Concentrate the 341.3 W/m2 from sunlight however, and you can melt metal, light fires, and so on.

          Adding 300 W/m2 from ice, to 300 W/m2 from the sun achieves precisely and absolutely nothing.

          Keep “adding” pointless fluxes, but first consider how such “fluxes” may be measured. By the way, check the ISO standards for the measuring instruments, and you might well come to the conclusion that Trenberth and his ilk are deluded, stupid, and ignorant. Or maybe not – I leave it to you.

          Cheers.

      • bdgwx says:

        Exactly. You have to add fluxes in this case otherwise you violate the 1LOT. Addition/subtraction of fluxes is valid when the fluxes are in reference to the same area. The various energy budget analysis are always in reference to the full area of Earth (~510e12 m^2).

      • JDHuffman says:

        E-man and bdg, that’s wrong.

        You can NOT add fluxes that are not the same wavelengths. You can NOT add solar to IR emitted by the atmosphere. The spectra are different.

        • Dr Myki says:

          Huh?
          Where do you get that idea from?
          The Stefan Boltzmann Law represents the sum/integral of fluxes over all wavelengths? (i.e.the integral of the Planck function). It applies equally well to either the Earth (T about 255K) or the sun (T about 6000 K).
          Having different spectra is irrelevant. The SB Law effectively takes account of any (very small) IR radiation by the sun as well as any (very small) “solar” radiation by the Earth.

        • bdgwx says:

          It has nothing to do with wavelength or even radiation. These are energy fluxes. Radiation is one mechanism for the transmission of energy, but it’s certainly not the only one.

          • Svante says:

            JD, let me help you out. Perhaps you are trying to say that a*b*s*o*r*p*t*i*v*i*t*y can be different for different frequencies?

        • JDHuffman says:

          Myki appears to be confusing “emission” with “wave addition”, or some such nonsense. He’s not making enough sense to figure out where he is wrong!

          “Having different spectra is irrelevant. The SB Law effectively takes account of any (very small) IR radiation by the sun as well as any (very small) “solar” radiation by the Earth.”

          Good luck figuring out that nonsense.

          Then the backdoor guy tells us photons have “nothing to do with wavelength or even radiation. These are energy fluxes.”

          What?

          Finally troll Svante offers another example of his ignorance “Perhaps you are trying to say that a*b*s*o*r*p*t*i*v*i*t*y can be different for different frequencies?”

          (Where do such clowns come from?)

          • bdgwx says:

            JD said…”Then the backdoor guy tells us photons have nothing to do with wavelength or even radiation. These are energy fluxes.”

            What I’m saying is that the fluxes you see on the various energy budget analysis diagrams are general energy fluxes. They might be radiation fluxes and they might not. Some of them are evaporation, convection, etc. As such they have nothing to do with wavelength. Read the Wild et al. 2013 publication that the IPCC’s energy budget diagram is based off of. This is explained in the publication.

          • Dr Myki says:

            I knew this was going to be tedious.
            Lets try again.
            I assume you can absorb (and feel) the sun’s radiation at a wavelength of 550 nanometers ?
            This will be a green visible component.
            I also assume you can absorb (and feel) the sun’s radiation at a wavelength of 600 nanometers ? This will be a yellow visible component
            I also assume you can absorb (and feel) the sun’s radiation at a wavelength of 650 nanometers ? This will be a red visible component.
            You can add the radiation from all the visible components (all the colours) between 390 and 760 nanometers. (That is why sunlight appears white.)

            So far so good?

            Adding up components across this band of (visible) wavelengths therefore is ok. Yes?

            You can also add in components up to (not quite visible) 1000 nanometers. Why not?

            You can also add in components up to (invisible) 10000 nanometers. Why not?
            You are then adding contributions from the “solar” part of the spectrum to the “infrared” part of spectrum.
            (The words “solar” and “infrared” are simply descriptors. Convention is that the boundary is at 5000 nanometers. There is nothing magical about this number.)
            Therefore you can add radiation from a body with a temperature of about 6000K to radiation from a body at 255K. There is no magical cut-off where addition cannot take place.

          • Mike Flynn says:

            DM,

            Cunning pseudoscientific redefinition again, it seems.

            You have apparently redefined “flux” to mean “radiation”, or “components”.

            You write –

            “Let’s try again.”

            Indeed. You are trying to convince people that “fluxes” can be “added”, without actually using the word “flux” anywhere!

            Instead, you are “adding” “components”, which are supposedly discrete frequencies, as in “I assume you can absorb (and feel) the suns radiation at a wavelength of 550 nanometers ?
            This will be a green visible component.”

            You can’t meaningfully add frequencies any more than you can add temperatures.

            You go on to write something woefully stupid and incorrect –

            “Therefore you can add radiation from a body with a temperature of about 6000K to radiation from a body at 255K. There is no magical cut-off where addition cannot take place.”

            Maybe you could talk about “adding fluxes”. Just as stupid and ignorant as “adding components”, or “adding radiation” without amplifying what you mean!

            Try making water hotter by “adding flux” from ice. Let me know the results of your experiment.

            What a Wally!

            Cheers.

          • JDHuffman says:

            bdg, you make fun of yourself better than I can “They might be radiation fluxes and they might not.”

          • JDHuffman says:

            Myki, just because the solar spectrum is composed of different wavelengths does not mean that you can warm your body with ice cubes.

            Or that you can make water hotter by “adding flux” from ice, as Mike Flynn stated.

            You need to learn some physics.

          • bdgwx says:

            JD said…”bdg, you make fun of yourself better than I can They might be radiation fluxes and they might not.”

            It probably would have been better to say some are and some aren’t. For example, most energy budget diagrams have an entry for the latent flux. It was poor wording on my part. Hopefully the rewording is more clear. Sorry for the confusion.

          • Dr Myki says:

            Just as I thought.
            What pathetic set of responses to an excellent explanation by my good self.
            No wonder you guys are in the remedial class.
            As they say, you can lead a horse to water but……….

          • JDHuffman says:

            Sorry bdg, but that was just as funny.

            But, you are outdone by the clown Myki. In his clown routine, he claims to be an expert on “fluxes adding”, so let’s give him some more material:

            E/M fluxes consist of photons. So if fluxes can be simply added, photons must be able to be simply added:

            1) If two photons have different frequencies, what frequency does the “sum” have?
            2) If two photons are added, do their magnetic fields also add?
            3) If two photons have different phases, does the affect the sum?
            4) If two photons have different momentums, what is the momentum of the “sum”?
            5) If two photons have different directions, what is the direction of the “sum”?

            Myki’s response should be even funnier than his previous ones.

            Enjoy!

          • Mike Flynn says:

            DM,

            You wrote –

            “What pathetic set of responses to an excellent explanation by my good self.”

            Your description of your fantasy world explains nothing.

            You seem to be besotted with the pseudoscientific cultist ramblings of a faker, a fraud, and fool, along with sundry other fumbling bumblers.

            Carry on preaching. Maybe you can attract some more followers to your shambling assemblage of incompetents, but the pool of mentally deranged potential cultists seems to be shrinking.

            Good luck with your efforts. It should help to keep some of the more witless candidates content in their imaginary world.

            Cheers.

          • Ball4 says:

            “So if fluxes can be simply added, photons must be able to be simply added.”

            Sure 1 flux + 1 flux = 2 fluxes, 1 photon + 1 photon = 2 photons, this is all so easy JD; it’s too bad you are so busy running a 3 ring circus & drawing bogus cartoons to learn even the basic physics.

          • bdgwx says:

            Likewise, if 84 W/m^2 of latent energy and 20 W/m^2 of sensible energy is released from the surface then the combined energy is 84 + 20 = 104 W/m^2. These figures are taken from Wild et al. 2013 by the way.

          • JDHuffman says:

            fluffball avoided the issue by hiding behind his fluff.

            Nothing new.

          • Bill Hunter says:

            IMO, the whole conversation of fluxes derails over assumptions about energy that hasn’t necessarily been proven. Einstein was aware of this and objected to excessive extrapolation in quantum mechanics, though QM has proven some of its concepts. We don’t even know if photons exist but have been a handy way of explaining certain phenomena. I have yet to see one of these conversations that doesn’t start extrapolating beyond logic when you start discussing the behavior of photons. Much cleaner is “net heat loss” it really doesn’t matter if it happens because of a net photon exchange or it happens because high energy is attracted by low energy. That always invokes the response “are you crazy man do you think a star reaches out across space before it decides to emit a photon?”. I say get over it as none of it seems relevant to anything important all it does is murky up the water and lead to evermore wild extrapolations.

          • Ball4 says:

            Bill, actually much, much cleaner is “net energy loss”. Something not contained in an object (“heat”) cannot then be lost from that object.

          • Bill Hunter says:

            Ball4 says: Bill, actually much, much cleaner is net energy loss. Something not contained in an object (heat) cannot then be lost from that object.
            ———–
            I didn’t say it was going to clear everything up but it does wonders for killing off bunny trails.

            1. Remember nothing can emit that which it didn’t absorb.
            2. How much it emits is limited by the temperature of the object its cooling toward.

            You throw the claim of absorbing backradiation into the equation and the number of paths of energy flows doubles leading to endless confusion. Net energy flow based upon the relative temperatures of the objects is all you need to know and you must have sufficient income and net output to keep it in balance.

            This is not the question, the question really is how does this vary in our climate system.

          • Ball4 says:

            How much radiant energy per unit area per unit time a real, large enough, round enough object emits across the entire spectrum is determined by its own equilibrium temperature, emissivity. Its equilibrium temperature is in balance with other objects in the system of interest.

          • bill hunter says:

            I agree and would emphasize the word emissivity.

  56. PhilJ says:

    If I were to put that into a relationship, i would say the heating of the oceans is inversely proportional to the concentration of ozone above the oceans times some constant that represents the ab*sor*p*tio*n of uvb by water (or the organic material therein)

    Math guys! Give me an equation…. Lol

    • Norman says:

      PhilJ

      I have been researching your ideas. I do find them interesting and based upon what I find, perhaps Climate Scientists should investigate the UV and Ozone connection on surface warming.

      On the other thread I gave a link that said about 10% of solar energy is in the UV band of EMR. Of that around 3% reaches the surface.

      I used 1367 W/m^2 for the solar flux. The average solar flux (though a few disagree, not sure if you are in that thought sphere) is 340 W/m^2. I am not sure what the albedo is UV at the surface. It might all be absorbed or close to. If it is absorbed it would mean 340 W/m^2 times 0.03 or 10.2 W/m^2 of UV energy reaches the surface.

      Here is a link maybe you were looking for. Scientists have not ignored the increase in UV because of ozone depletion. Also you might be interested to know that the biggest increases in UV energy are at the poles (claimed to be the areas of most rapid heating).

      https://www.esrl.noaa.gov/csd/assessments/ozone/2006/chapters/Q17.pdf

      The link shows the percent increase in UV over a 10 year period.

      If you take it at 4% for regions toward the poles, you get an increase of 0.408 W/m^2 in 10 years.

      Then you look at the estimates for the forcing to cause the warming we are seeing, the scientists get 0.58 W/m^2 in 5 years.
      https://www.giss.nasa.gov/research/briefs/hansen_16/

      So you would have 0.0408 W/m^2 forcing from UV and 0.116 from observation. That means your UV idea would contribute 35% of the observed warming. That is significant and would mean the CO2 model is at a high estimate. It could also explain the errors in the Climate Models. They did not take into consideration the large effect of UV energy change on the equation. Now that the ozone level is stabilized the actual warming is much less than the model predictions.
      https://ozonewatch.gsfc.nasa.gov/

  57. PhilJ says:

    “i would say the heating of the oceans is inversely proportional to the concentration of ozone above the oceans times some constant that represents the ab*sor*p*tio*n of uvb by water (or the organic material therein)”

    Oh and directly proportional to the amount of uvb in at the TOA…

  58. Mike Flynn says:

    In relation to measuring the “flux” of back radiation.

    Nobody has ever done it. Nobody.

    Measuring the temperature of the atmosphere above using an IR thermometer for example, tells you nothing about the total amount of energy impinging on the surface, and even less about the amount absorbed by the surface.

    All smoke, mirrors and wishful thinking.

    No GHE. No CO2 heating. The Earth has cooled over the last four and half billion years, and the applicable laws of physics have not changed recently.

    Cheers.

    • PhilJ says:

      “In relation to measuring the “flux” of back radiation.

      Nobody has ever done it. Nobody.”

      Agreed! The heating of the ocean can only come from 2 sources… increased solar input or increased geothermal input

      • Ball4 says:

        Dr. Spencer has done it! And shown how heating of the ocean can come from other than increased solar or geothermal using contact thermometers not just IR thermometers. It’s really very easy, you two just need to learn from some basic theory & real experiments.

    • Norman says:

      Mike Flynn

      You are way behind the times. Do you have a pet dinosaur and bathe in lava lakes?

      You are just plain wrong and ignorant.

      You say: “In relation to measuring the flux of back radiation.

      Nobody has ever done it. Nobody.”

      Here:
      https://www.esrl.noaa.gov/gmd/webdata/tmp/surfrad_5d23f3b1475dd.png

      Time to crawl out of the cave and open your mind.

      Making ignorant unsupportable comments does not help your credibility any.

      • Mike Flynn says:

        N,

        You fool. Maybe you could link to something that is titled something like “measured back-radiation” or something similar.

        Pointless unlabelled graphs don’t show much at all. For example, what is the definition of “downwelling IR”? What frequencies? What is the temperature of the emitting matter?

        And so on. Just more pseudoscientific propaganda, under the guise of scientific research.

        For example –

        “Todays anthropogenic climate change is largely driven by increasing greenhouse gases (GHGs) in the atmosphere, modified to some extent by the distribution of aerosols and aerosol properties.” “It is necessary to develop a solid scientific understanding of their natural cycles, and how human management and the changing climate influence those cycles.”

        What a load of rot! ” . . .how human management and the changing climate influence . . .”?

        Climate is the average of weather. It is a calculated result, and influences precisely nothing! Carry on following the faker, the fraud and the fool. Keep believing that climate dictates weather – a ragtag collection of fumbling bumblers share your delusion.

        Cheers.

        • Norman says:

          Mike Flynn

          I cannot help you with your ignorance. That seems to be your own personal problem. The chart is quite clear. It is labeled Downwelling Infrared. Why are you purposely being an ignorant poster.
          The graph is clearly labeled.

          Since you are a most lazy poster and have no motivation to find things out I guess I will have to show you.

          https://www.esrl.noaa.gov/gmd/grad/instruments.html

          The range of the measuring instrument is 3.5-50 micron IR band. The receiver is coated in a black paint to absorb as much energy in these bands as possible (close to a black body).

          The temperature of the air that is radiating can easily be obtained from the page. Not sure why that matters. You made a very ignorant claim that is easy to dispute! Your ignorant words: “In relation to measuring the flux of back radiation.

          Nobody has ever done it. Nobody.” An ignorant statement that is totally incorrect.

          If you want the temperature to go with your graphs go to this website and make your own graphs.

          https://www.esrl.noaa.gov/gmd/grad/surfrad/dataplot.html

          You can click the air temperature box and it will make you a graph.

          • Mike Flynn says:

            N,

            What leads you to the conclusion that the “downwelling IR” is “back radiation” between 3.5 and 50 microns? Are you sure that back radiation” is restricted to these frequencies? Of course not, you just make assumptions as you go along.

            Your silly suggestion that your link provides the temperature of the object emitting the IR is just more wishful thinking, isn’t it?

            There is no distinct “back radiation”! Even NASA use quotes around the phrase, to indicate it is just a figure of speech, scientifically speaking. The atmosphere has a temperature, called “air temperature”, whether GHE true believers accept that O2, N2 etc radiate IR or not.

            The atmosphere is above absolute zero, and as a result radiates IR continuously. You may call this “back radiation” if you like, but is just plain old radiation due to the atmosphere being above absolute zero.

            Just more pseudoscientific climate cult redefinitions designed to make the fakers, frauds and fools to appear smart. No GHE. No CO2 heating. The Earth has cooled for about four and a half billion years, whether you believe it or not.

            Carry on with the cultist nonsense.

            Cheers.

  59. Mike Flynn says:

    Svante wrote –

    “The earth has accumulated energy in line with the enhanced GHE.”

    Unfortunately, energy in the form of heat cannot accumulate in any meaningful sense. It radiates away if a body is hotter than its surroundings, which the Earth most assuredly is.

    A description of the enhanced GHE does not even exist, because it would have to include the operation of magic at some point. You can’t even describe the “ordinary” GHE, let alone an “enhanced” GHE, can you?

    Give it a try, if you like.

    Cheers.

    • Ball4 says:

      It radiates away if the body is cooler that surroundings too Mike. You are just behind in your studies.

      • Mike Flynn says:

        B4,

        You wrote –

        “It radiates away if the body is cooler that surroundings too Mike. You are just behind in your studies.”

        You don’t appear to be disagreeing with anything I wrote. Is this really your intent?

        Trying to disagree by not disagreeing. Very Zen.

        Cheers.

  60. PhilJ says:

    Ball4,

    “So if fluxes can be simply added, photons must be able to be simply added.

    Sure 1 flux + 1 flux = 2 fluxes, 1 photon + 1 photon = 2 ”

    I’m sorry, I can’t let this stand…

    If what you are saying is correct then 60, 15 micron photons should be able to dissociate O2… They cannot… But one UVC photon can…

    • Ball4 says:

      What I wrote is correct. Challenge what I wrote not something else.

    • Norman says:

      PhilJ

      The energy will add. The 60, 15 micron photons may not be able to dissociate O2 but the IR photons and the UVC photon will both add the same energy to a surface that absorbs them. The energy is what is added. A flux is Watts/m^2 it does not matter what wavelength this energy is in. Watts are joules/second.

      You can easily test that fluxes add, I mean this is an easy experiment to test. No vacuum needed just two heat lamps. Set up two heat lamps on a target and get a thermometer to read the target temperature. Turn on one and get the temperature. Turn on the second and you will see the temperature goes up. The fluxes are adding. Energy is always conserved regardless of the form it takes.

      • Mike Flynn says:

        N,

        You are at it again. Do the experiment, write it up properly, and post the results.

        You have no intention, have you? Try heating some water using ice emitting 300 W/m2. Make sure the environment is warm enough for the water to remain liquid.

        Of you go now. Let me know how you get on. Fool.

        Cheers.

        • Ball4 says:

          With outside surface water & using ice emitting 300 W/m2 in the atm. it does work – Dr. Spencer did just that, increased the temperature of surface water adding energy radiated from ice. Very cool. Try it youself, he gave you all the directions.

          Off you go now. Let me know how you get on.

          • Mike Flynn says:

            B4,

            You wrote –

            “With outside surface water & using ice emitting 300 W/m2 in the atm. it does work Dr. Spencer did just that, increased the temperature of surface water adding energy radiated from ice.”

            Rubbish. You are just making stuff up. That’s why you can’t quote the nonsense you claim exists. Just like your description of the GHE – non-existent. You have a vivid imagination, only tangentially related to reality.

            By the way, thanks for the imitation. It’s supposed to be the sincerest form of flattery, but it won’t get you any respect from me.

            Cheers.

          • Ball4 says:

            “Rubbish. You are just making stuff up.”

            Nope. What I wrote is exactly what Dr. Spencer did. The site has a search button. Use it. Do a little research Mike, it won’t hurt you.

            Off you go now. Let me know how you get on.

            Oh, and I don’t need to describe the GHE Mike Flynn has done so well at it in numerous threads, in ways that could be subjected to experiment and were proven out. Mike Flynn really gets it at times. Other times, not so much.

          • Mike Flynn says:

            B4,

            You wrote –

            “Off you go now. Let me know how you get on.” Thanks again for the flattery. I know you are envious of my panache, but flattery will get you nowhere.

            Cheers.

        • Norman says:

          Mike Flynn

          You are neglecting that to warm water with ice, it must also be heated at the same time. Roy Spencer has already done the experiment to prove it. If you don’t accept his results you would not accept mine.

          http://www.drroyspencer.com/2016/08/experiment-results-show-a-cool-object-can-make-a-warm-object-warmer-still/

          Changing how much IR energy a heated surface receives from colder object directly affects the steady state temperature of the heated object.

          You can do this one yourself if you don’t believe the results.

          If you heat water surrounded by liquid nitrogen (emits very little IR toward the water) until it the heat just keeps it liquid at a steady state of 33 F and then replace the liquid nitrogen with normal ice emitting 300 W/m^2 toward the water (careful not to change the amount of energy you are adding by a heater) the water will increase in temperature.

          Basically it seems you are just a plain old science denier. You deny science exists and you deny that any experiment can’t alter your incorrect belief. Not much can be done to change an extreme denier like you are. No experiment will ever convince you of the error of your thoughts. Ignorance is bliss. It makes you happy and it is much easier to believe you are right than actually prove you are (which could be done if you ever did any type of experiments…since you won’t you will continue to think you know what you are talking about).

          Did Dino come back to your cave for the night?

          • Mike Flynn says:

            N,

            You wrote –

            “You are neglecting that to warm water with ice, it must also be heated at the same time.”

            You fool. You must be stupid if you think that people believe that your insertion of a magic heater means that you can heat water with ice.

            I might also point out that surrounding water with liquid nitrogen will freeze the water. If you use your magic heater to keep the water liquid, your liquid nitrogen will change to gaseous nitrogen, and stabilise at the temperature of your magic heater.

            Another minor obstacle is that liquid nitrogen is not present naturally on the earth’s surface, nor are too many magic heaters.

            Dr Spencer did not heat water using just the radiation from ice, and neither can you. All your attempts to create diversions using liquid nitrogen, magic heaters and all the rest, coupled with your reluctance to carry out the experiments you demand that others perform, might not have others bowing in awe before you.

            Try addressing the supposed GHE. You can’t even describe it, can you? No GHE. No CO2 heating. The Earth has cooled naturally for four and a half billion years. Deny that, if you wish.

            Cheers.

          • Norman says:

            Mike Flynn

            You do seem to be incapable of following an argument. Is Barney around, maybe he can help you understand it in a way your mind can process.

            There is no “magic heater” you bumbling bald thoughtless cave dweller from the time the surface was molten.

            Any heating element can warm water and it can warm it to liquid state if surrounded by liquid nitrogen (stored in a container around the water also in some kind of container). I guess a poster needs to explain every single detail to you. Your highly limited thought has no ability to come up with a solution not completely explained to you.

            Water in a beaker (do you know what that is?), is surrounded by a container (not touching the beaker…the beaker is sitting on a platform surrounded by a container that has liquid nitrogen in it).

            Turn the NORMAL heating element (inserted into the water) not the stupid “magic” one that you make up until the water is at a steady 33 F. Maybe the platform the beaker sits on can be a heater. Either way.

            After the temperature of a steady 33 F is established. Remove the liquid nitrogen from the outer container and add water ice. The water in the beaker will increase in temperature. The greater amount of IR energy given off by the ice will add more energy to the heated water than the liquid nitrogen did. The combined energy of the heater and ice will increase the water temperature. That is real physics. If you got out of your cave more you could understand it. Read a textbook maybe.

            Gordon Robertson rejects textbooks that don’t agree with his false and delusional ideas. Are you as crackpot as him? He can’t understand textbooks so he says they are fake. He can’t understand why textbook writers use current flowing from positive to negative (even though I linked him to an article explaining it to him). He would rather accept he is much smarter than the entire scientific body and correct even though he won’t do one experiment ever.

          • Mike Flynn says:

            N,

            Now try heating water using just the 300 W/m2 from ice.

            No heater, no liquid nitrogen. Can’t do it, can you? No more than you can describe the GHE. Just more evasions and diversions, eh?

            Cheers.

          • Ball4 says:

            “Can’t do it, can you?”

            Sure he can. Dr. Spencer raised the temperature of surface water with the radiation from atm. ice Mike; it’s so easy even Mike can do it in a backyard, all the instructions, procedures, contact thermometers and materials necessary are listed.

            Off you go now Mike. Replicate the experiment. Prove you are up to the task.

          • JDHuffman says:

            fluffball has a great “imagination”.

            Some call it “fluff”. Some call it “delusion”.

  61. Eben says:

    How man-made global warming is made

    https://bit.ly/2JmMVP9

  62. PhilJ says:

    Ball4,

    “Dr. Spencer has done it! And shown how heating …”

    With respect, he has not.. He has demonstrated how you can slow the cooling….

    Slower cooling is NOT heating…

    • Ball4 says:

      It doesn’t matter what you call it PhilJ, Dr. Spencer showed surface water temperature was increased by a process other than solar (it was night time) and geothermal.

      • Mike Flynn says:

        B4,

        Slower cooling is not heating.

        For example, the surface cools at night – quickly or slowly, it still cools. I would be amazed if Dr Spencer managed to get water to increase its temperature without the input of energy.

        While the water as getting hotter, obviously the surface wasn’t. Presumably you can explain this magic? A quote or two might help.

        Cheers.

        • Ball4 says:

          Sometimes Earth surface warms at night Mike. Check it out!

          • Mike Flynn says:

            B4,

            You wrote –

            “Sometimes Earth surface warms at night Mike. Check it out!”

            What are you rambling about? If you supply enough heat, the surface warms – it gets hotter. Slow cooling is not heating – you are mentally deranged (or a GHE true believer) if you think otherwise.

            Can’t back up your original stupid statement, so you play the deny, divert and confuse cards!

            The Earth has cooled over the last four and a half billion years or so. No GHE. No CO2 heating. No heat accumulation. Deny away.

            Cheers.

          • Ball4 says:

            “The Earth has cooled over the last four and a half billion years or so”

            And warmed over the last 30 or so. SUVs are good heaters. Still, the surface warms some nights, cools some others; I see you haven’t checked it out. Your loss, not mine.

          • Mike Flynn says:

            B4,

            Thermometers on the surface will respond to heat. If you think this comes from CO2, you are simply deranged.

            Do you have an explanation for the increased heat, other than the heat producing activities of about 7 billion humans? No?

            I thought not.

            Cheers.

          • Ball4 says:

            Contact thermometers on the surface respond to the avg. KE of the molecules hitting their measuring surface which is not heat.

            Mike thought not maybe, but that’s only because Mike hasn’t done the research & experiments properly (like Dr. Spencer did, several times).

            Off you go now Mike. Let me know how you get on with the proper research. And thanks for describing the GHE so well it could be tested & passed.

          • Mike Flynn says:

            B4,

            You wrote –

            “And thanks for describing the GHE so well it could be tested & passed.” Of course, my description of how greenhouses operate has nothing to do with CO2 or other climatological pseudoscience.

            I am not sure why you are thanking me for something that is widely known, but maybe, like the rest of the bumbling buffoons, you were totally confused about why greenhouses are used.

            You also wrote –

            “Contact thermometers on the surface respond to the avg. KE of the molecules hitting their measuring surface which is not heat.”

            Well, no, they donR