A Stove Top Analogy to Climate Models

September 13th, 2019 by Roy W. Spencer, Ph. D.

Have you ever wondered, “How can we predict global average temperature change when we don’t even know what the global average temperature is?”

Or maybe, “How can climate models produce any meaningful forecasts when they have such large errors in their component energy fluxes?” (This is the issue I’ve been debating with Dr. Pat Frank after publication of his Propagation of Error and the Reliability of Global Air Temperature Projections. )

I like using simple analogies to demonstrate basic concepts

Pots of Water on the Stove

A pot of water warming on a gas stove is useful for demonstrating basic concepts of energy gain and energy loss, which together determine temperature of the water in the pot.

If we view the pot of water as a simple analogy to the climate system, with a stove flame (solar input) heating the pots, we can see that two identical pots can have the same temperature, but with different rate of energy gain and loss, if (for example) we place a lid on one of the pots.

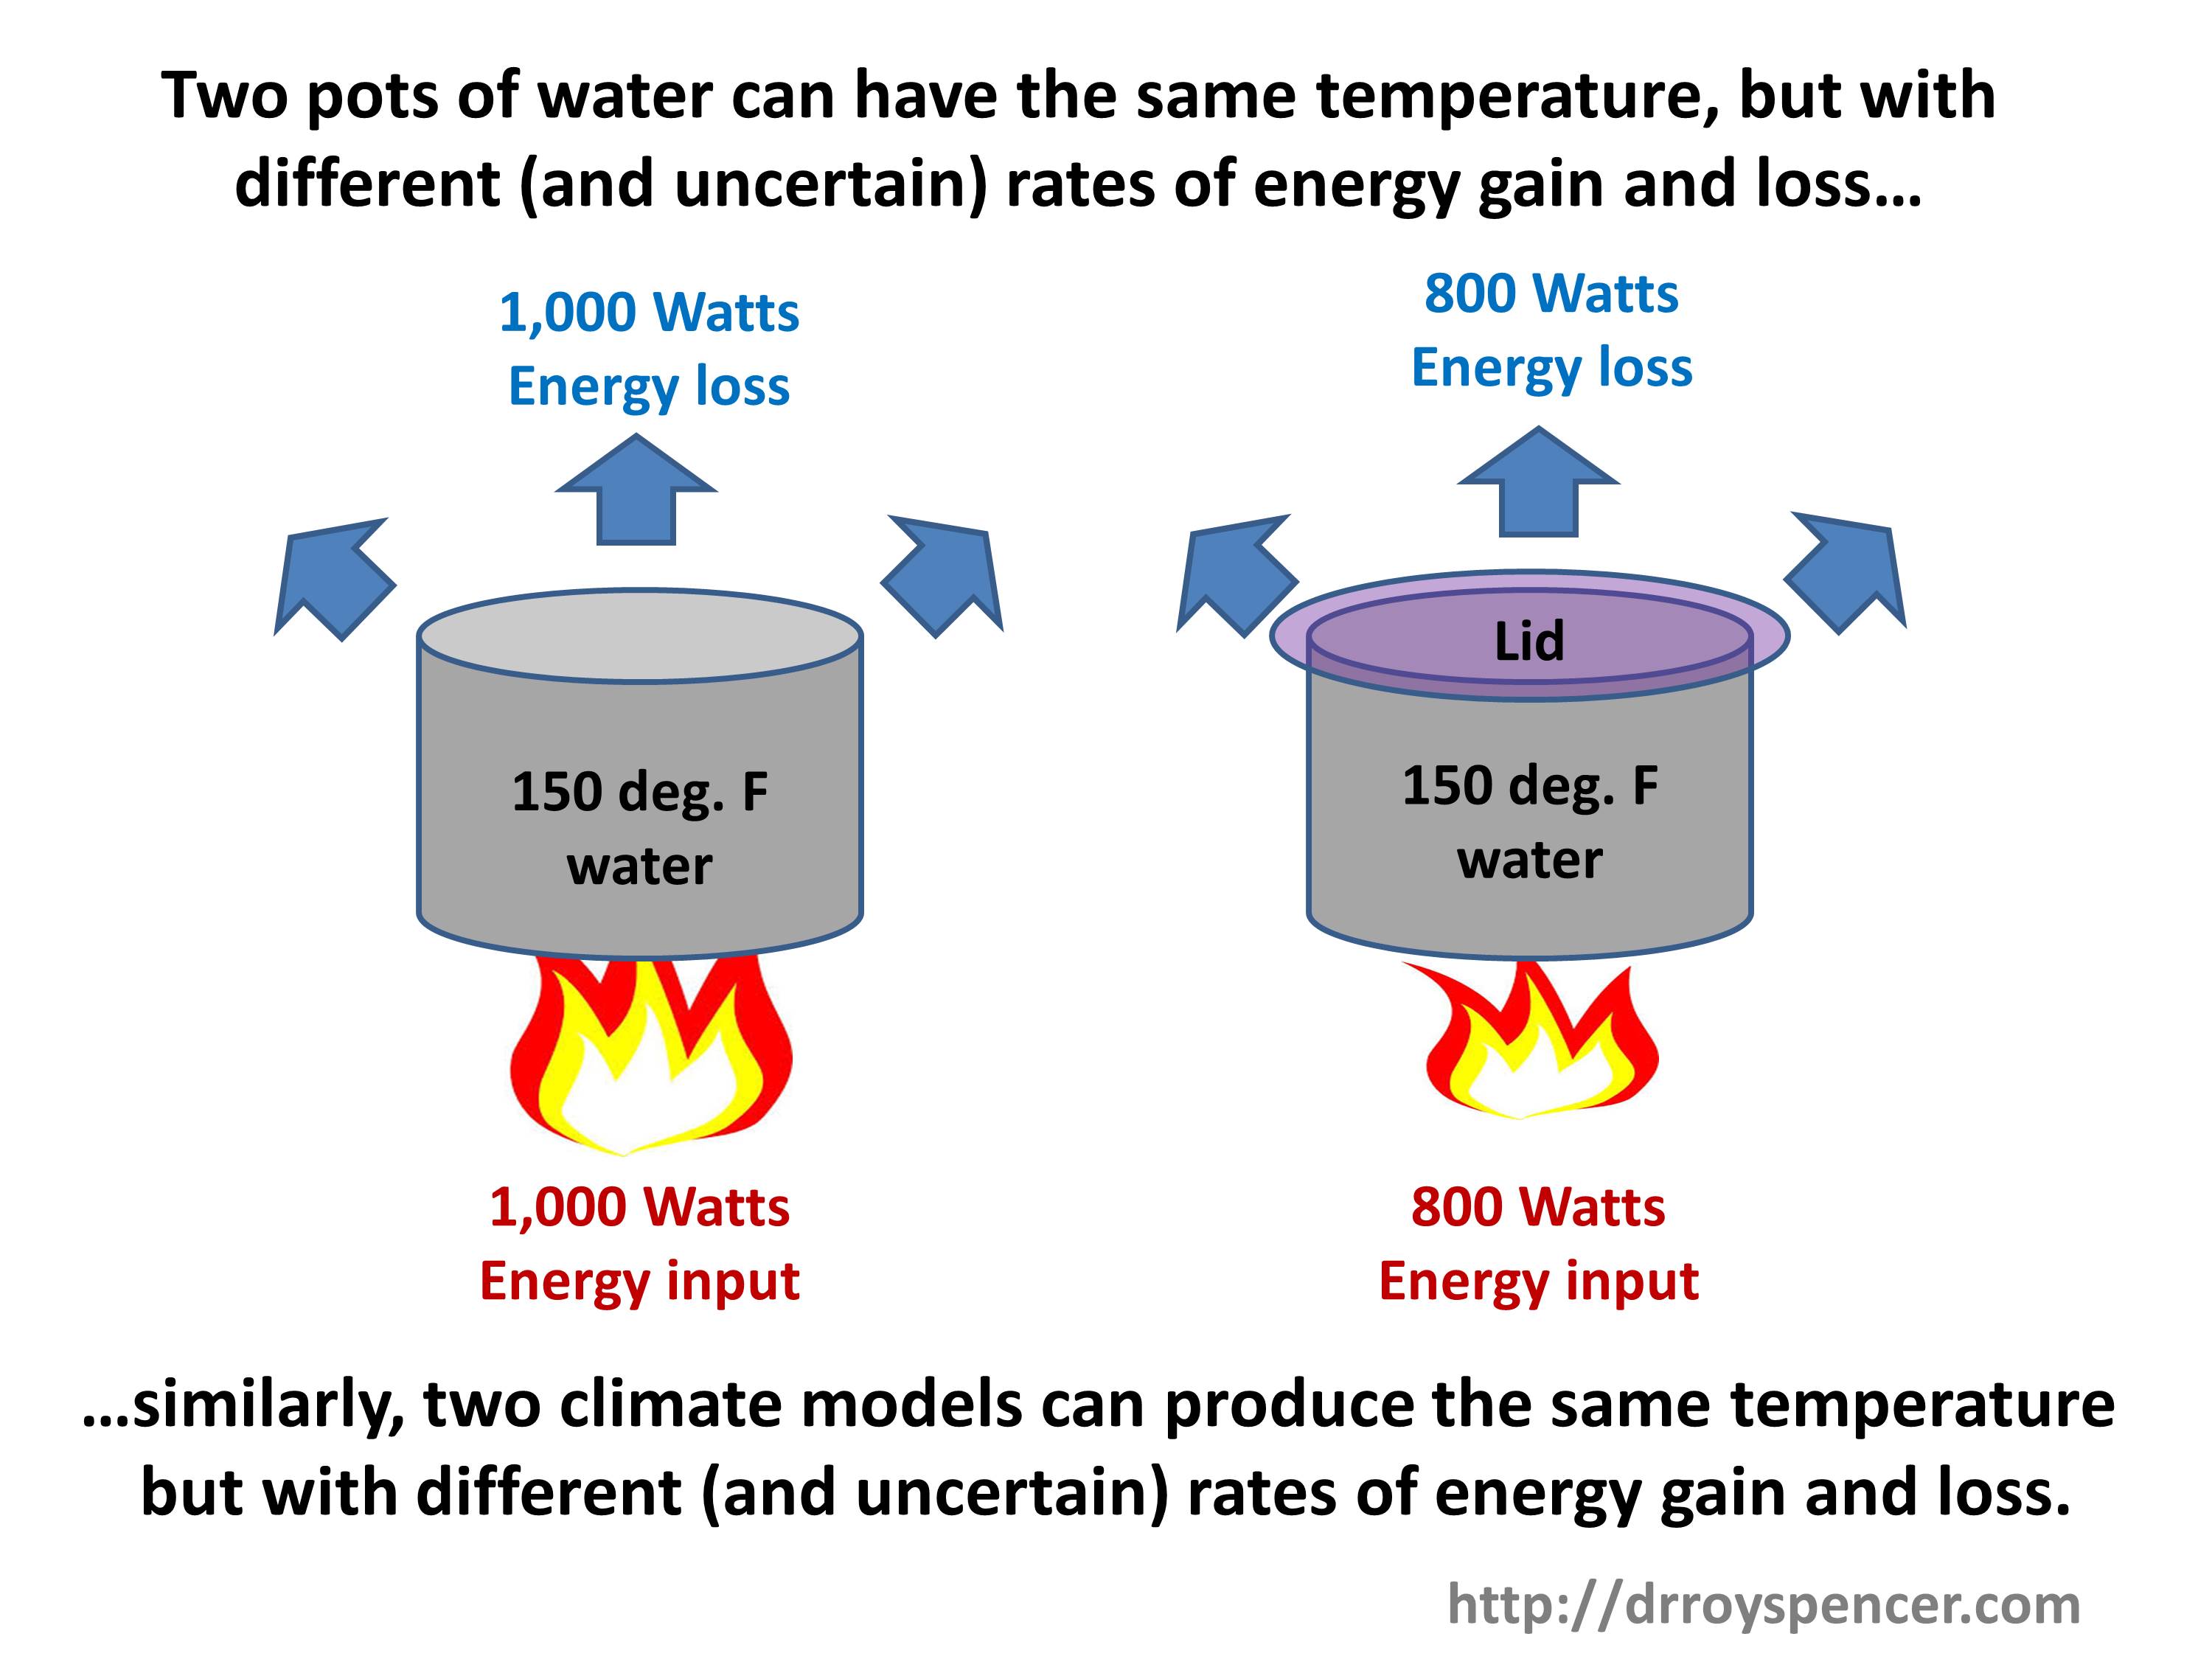
A lid reduces the warming water’s ability to cool, so the water temperature goes up (for the same rate of energy input) compared to if no lid was present. As a result, a lower flame is necessary to maintain the same water temperature as the pot without a lid. The lid is analogous to Earth’s greenhouse effect, which reduces the ability of the Earth’s surface to cool to outer space.

The two pots in the above cartoon are analogous to two climate models having different energy fluxes with known (and unknown) errors in them. The models can be adjusted so the various energy fluxes balance in the long term (over centuries) but still maintain a constant global average surface air temperature somewhere close to that observed. (The model behavior is also compared to many observed ocean and atmospheric variables. Surface air temperature is only one.)

Next, imagine that we had twenty pots with various amounts of coverage of the pots by the lids: from no coverage to complete coverage. This would be analogous to 20 climate models having various amounts of greenhouse effect (which depends mostly on high clouds [Frank’s longwave cloud forcing in his paper] and water vapor distributions). We can adjust the flame intensity until all pots read 150 deg. F. This is analogous to adjusting (say) low cloud amounts in the climate models, since low clouds have a strong cooling effect on the climate system by limiting solar heating of the surface.

Numerically Modeling the Pot of Water on the Stove

Now, let’s say we we build a time-dependent computer model of the stove-pot-lid system. It has equations for the energy input from the flame, and loss of energy from conduction, convection, radiation, and evaporation.

Clearly, we cannot model each component of the energy fluxes exactly, because (1) we can’t even measure them exactly, and (2) even if we could measure them exactly, we cannot exactly model the relevant physical processes. Modeling of real-world systems always involves approximations. We don’t know exactly how much energy is being transferred from the flame to the pot. We don’t know exactly how fast the pot is losing energy to its surroundings from conduction, radiation, and evaporation of water.

But we do know that if we can get a constant water temperature, that those rates of energy gain and energy loss are equal, even though we don’t know their values.

Thus, we can either make ad-hoc bias adjustments to the various energy fluxes to get as close to the desired water temperature as we want (this is what climate models used to do many years ago); or, we can make more physically-based adjustments because every computation of physical processes that affect energy transfer has uncertainties, say, a coefficient of turbulent heat loss to the air from the pot. This is what model climate models do today for adjustments.

If we then take the resulting “pot model” (ha-ha) that produces a water temperature of 150 deg. F as it is integrated over time, with all of its uncertain physical approximations or ad-hoc energy flux corrections, and run it with a little more coverage of the pot by the lid, we know the modeled water temperature will increase. That part of the physics is still in the model.

Example Pot Model (Getty images).

This is why climate models can have uncertain energy fluxes, with substantial known (or even unknown) errors in their energy flux components, and still be run with increasing CO2 to produce warming, even though that CO2 effect might be small compared to the errors. The errors have been adjusted so they sum to zero in the long-term average.

This directly contradicts the succinctly-stated main conclusion of Frank’s paper:

“LWCF [longwave cloud forcing] calibration error is +/- 144 x larger than the annual average increase in GHG forcing. This fact alone makes any possible global effect of anthropogenic CO2 emissions invisible to present climate models.”

I’m not saying this is ideal, or even a defense of climate model projections. Climate models should ideally produce results entirely based upon physical first principles. For the same forcing scenario (e.g. a doubling of atmospheric CO2) twenty different models should all produce about the same amount of future surface warming. They don’t.

Instead, after 30 years and billions of dollars of research they still produce from 1.5 to 4.5 deg. C of warming in response to doubling of atmospheric CO2.

The Big Question

The big question is, “How much will the climate system warm in response to increasing CO2?” The answer depends not so much upon uncertainties in the component energy fluxes in the climate system, as Frank claims, but upon how those energy fluxes change as the temperature changes.

And that’s what determines “climate sensitivity”.

This is why people like myself and Lindzen emphasize so-called “feedbacks” (which determine climate sensitivity) as the main source of uncertainty in global warming projections.


1,049 Responses to “A Stove Top Analogy to Climate Models”

Toggle Trackbacks

  1. Patrick says:

    Why can’t they determine the simple temperature difference between 300 and 400 ppmv with normal air? It seems like a worth while display to start the process of elimination. I’ve never seen the simple calculation.

    Thanks!

    • Roy W. Spencer says:

      What do you mean by “normal air” and “simple calculation”? Can you be more specific?

      • Patrick says:

        Like if we simply quarantined 10,000 parts of air and simply connected 1 carbon atom to 2 of the oxygen atoms already present and measured the results.

      • Patrick says:

        My point is that we have people in Congress who don’t have a clue about climate dynamics, but they seem to continue to get away with injecting fear. Simple calculations for a layman can go a long way towards credibility. The “Climate Apocalypse” is upon us. Showing simple calculations and giving understanding(s) as to why we are by no means even close to an “existential” threat, can go a long way in helping people gain faith towards scientific conservatism. I understand you have your Global Warming 101 page, but I’m thinking we can move the ball forward better using simple displays like you have done with your “2 kettles” analogy.

      • barry says:

        Patrick, the height of the atmosphere plays a very important part in the end result. ‘Optical depth’ is the distance from surface to space that infrared radiation must travel, being absorbed and re-emitted by atmospheric gases.

        Other than building chambers many kilometers in height to ‘quarantine’ parts of air with different amounts of CO2, how would you propose the optical depth of the atmosphere be mimicked.

        Should we/could we replicate convection in these quarantine chambers?

        • Patrick says:

          Barry, I thought about that after I wrote it and propose a location 6 feet above ground at several evenly-spaced across the 0 degrees latitude from magnetic (or geographic) north pole to south pole starting at the equator and every 10 degrees longitude. I am simply trying to simplify the “CO2 Effect” on atmospheric temperature starting with a basic temperature structure based upon evenly spaced 100 ppmv increases and the limitations of that temperature increase to suddenly explode into some sort of catastrophic climate change scenario like those that have been proposed by “legislative scientists” (tic) without getting too deep into the climate dynamics.

          All things remaining constant, what “should” the temperature be at 100 ppmv, 200 ppmv, 300 ppmv, 400 ppmv, 500 ppmv, ….. ?

          Thanks!

        • barry says:

          At 6 feet above the ground your optical depth is 10,000 shallower than the troposphere. CO2 in the atmosphere continues to be present through the stratosphere, and even in the mesosphere.

          The rate at which radiation escapes to space, and therefore the surface temperature, is strongly affected by this optical depth.

          What is the formula by which you will transform the effects at 6 feet above the ground, to a column of atmosphere some miles high?

          If you only want to test that more CO2 = more warmth, you don’t need much altitude at all.

          But if you want to get a handle on how much temperature change comes from a change in CO2 concentration for the whole atmosphere, you can’t do it the way you are suggesting.

        • Dr Roys Emergency Moderation Team says:

          I’ll just put this link near the top of the comments:

          http://www.drroyspencer.com/2019/09/additional-comments-on-the-frank-2019-propagation-of-error-paper/#comment-388652

        • barry says:

          That’s way off topic on this thread. Please stop trolling.

        • Dr Roys Emergency Moderation Team says:

          It’s completely on-topic.

          barry, please stop trolling.

        • barry says:

          Frank’s essay on statistical uncertainty has nothing to do with a physical experiment in an vacuum chamber. Your link is way off topic to Patrick’s query. Please stop trolling.

        • Dr Roys Emergency Moderation Team says:

          It’s not off-topic to the article, barry.

          Perhaps your discussion had wandered off-topic.

          Please stop barry-ing.

    • bdgwx says:

      I’m not entirely sure what you mean either. Simple-the climate is not.

      The closest we have come to a simple formula for the surface temperature response to CO2 is that which Arrhenius helped develop in the late 1800’s. It is dF = S*ln(Cn/Ci) where dF is the change in radiative forcing, s is the sensitivity parameter, Cn is the new concentration and Ci is the initial concentration. Using radiative transfer models (like MODTRAN) it is estimated that S is 5.35 W/m^2. You then need to map that to a temperature using a climate sensitivity multiplier in units of C per W/m^2. It is believed the climate sensitivity is dynamic, but likely between 0.5-2.0 C per W/m^2 for the current era.

      Using Arrhenius’ 2xCO2 estimate of 4C from his 1908 book Worlds in the Making and using S=5.35 we can see that Arrhenius’ early estimate results in a climate sensitivity estimate of about 1C per W/m^2.

      • gallopingcamel says:

        The Svante Arrhenius theory is breathtaking in its simplicity but it is demonstrably false.

        • Roy W. Spencer says:

          I consider it pretty complex, but true, which is just the opposite of what you said.

          • gallopingcamel says:

            You, Scott Denning, Richard Alley, Albert Klein Tank, Judith Curry, Nicola Scafetta, John Christy and Richard Lindzen are high on my list of “Climate Scientists” who can be trusted.

            You are real scientists swayed by facts, evidence and reason as opposed to beliefs and feelings. Also, you all have an extraordinary ability to make complex issues understandable to the general public.

            Sometimes I disagree with one of you and then a debate may ensue. For example I disagreed with Scott Denning when he showed that the GHE (Greenhouse Effect) was 33 degrees Centigrade. It took 18 months of email correspondence before we resolved our differences.

            It was a tactical mistake for me to attack a Swedish chemist who has been dead for 100 years and who would likely be on our side if he was alive today. Instead of attacking someone who can’t defend himself I will set out to convince you that the theory implicit in the IPCC’s AR5 SPM, section D.2 is false.

            My understanding of the IPCC’s SPM is:
            1. [CO2] has a causal relationship with the average global temperature.
            2. The relationship is characterized by a “Sensitivity Constant” in the range of 1.5 to 4.5 degrees Centigrade per doubling of [CO2].

            In my experience this kind of discussion is best conducted “off line” but I am willing to do it in public if you wish.

            I have two arguments, one based on logic and the other based on mathematics/physics.

            I will send my initial arguments to you in the form of email attachments. Please check your spam folder in the next 24 hours.

        • bdgwx says:

          The equation is certainly simple, but estimating the sensitivity parameter and equilibrium climate response is complex stuff. Even the late 1800’s when Arrhenius was working on the problem he had to consider snow/ice cover, clouds, latitudinal difference, land vs ocean difference, etc. all the while doing so with lunar radiation data from Langley. So even though the end result may have been a simple estimation equation the amount of work required to get there is astonishing especially considering this all happened in the 1800’s.

    • bill hunter says:

      not liking the analogy at all. The atmosphere has no lid on it. Dr RW Wood established no radiation-based greenhouse effect in a greenhouse. You will get one in a pot of boiling water simply because water is more efficient at cooling than a dry surface and the Latent heat carries off tremendous amounts of heat that are locked in the pan with a lid.

      • Svante says:

        Yes, Dr. RW Wood indeed, plus Gerlich & Tscheuschner who showed that Earth is not precisely like a greenhouse.

        http://www.ing-buero-ebel.de/Treib/Hauptseite.pdf

      • Roy W. Spencer says:

        Bill, you seemed to have totally missed my point. You’ve missed the forest for the trees. I could have used a car engine, or the human body… just about anything that has energy input and output to make my point.

        • bill hunter says:

          Roy,
          It you put a lid on a pot of boiling water you increase the atmospheric pressure in the pot and thus the temperature, if you really want to get serious about it you will bring out the pressure cooker where you can lock the lid down

          So basically your analogy suggests that indeed you can induce warming in the atmosphere by equating greenhouse gases to a lid and viola you have instantaneous understanding that if you imagine a lid or lids in the atmosphere you will have a very strong imaginary argument for warming in the atmosphere.

          Unfortunately the addition of greenhouse gases in the atmosphere does not, like the lid, increase the pressure of the atmosphere.

          So maybe there is a better analogy like an engine or human body to explain the phenomena of greenhouse gases that doesn’t rely on an entirely different physical mechanism. I just haven’t heard it.

          I recognize that greenhouse gases warm the radiating surface of the planet but am well aware that just how they do that has been very poorly described. And so I can get as far as saying greenhouse gases are a necessity for the greenhouse effect we know. However, I can’t say that greenhouse gases are both necessary and sufficient.

          lids, or a multi-paned window, which doesn’t rely on a pressure change are all fun analogies but none of that exists in the atmosphere.

          Indeed if the atmosphere worked like insulated window with 10 panes of glass/layers/lids that would work. In fact that seems to be the model being deployed. A multi-paned window works because it divides the atmosphere up into separate atmospheres denying diffusion of molecules between the separate atmospheres.

          But the atmosphere isn’t like that. In Lindzen’s Iris effect molecules are literally flying round in the atmosphere and its really not possible to predict the effect.

          • Bindidon says:

            bill hunter

            Again: that was not Roy Spencer’s point.

            The answer depends not so much upon uncertainties in the component energy fluxes in the climate system, as Frank claims, but upon how those energy fluxes change as the temperature changes.

          • bill hunter says:

            Bindidon says:

            bill hunter

            Again: that was not Roy Spencer’s point.

            “The answer depends not so much upon uncertainties in the component energy fluxes in the climate system, as Frank claims, but upon how those energy fluxes change as the temperature changes.
            ====================

            Point take Bindidon. My apologies to Roy for not reading the entire piece. The situation is actually much worse than described by Frank. Got be careful of those boiling pot analogies. . . .AOC might experience even more sleepness nights thinking she is going to dunked into boiling water and lid dropped down on top.

          • ftop_t says:

            @Bill
            Your point is spot on. Dr. Spencer’s analogy replaced the lid with the greenhouse effect when he should be replacing the lid with atmospheric mass.

            This is easy to see based on the boiling point of water at various elevations and the correlation between surface temperature and density/pressure across our solar system.

            At sea level, water boils at 100C. Go up 2,000 meters and that same pot will boil at 93.4C. the atmospheric composition has not changed, but the atmospheric pressure has.

            This is why Mars at 95% CO2 and 1/1000 the surface pressure is cold and Venus at 97% CO2 and 93x the surface pressure is hot. The “lid” correlates directly to the surface pressure and not the composition (which is not a lid).

        • Gordon Robertson says:

          Roy…”Bill, you seemed to have totally missed my point”.

          I am writing this more with humour than anything.

          You stated that the greenhouse effect acts like the lid on the pot. I don’t see how anyone could miss your point with respect to Bill Hunter’s reply.

          I got it as well that you are addressing Mr. Frank’s article. However, in two articles in which you have replied to Mr. Frank’s article you have clobbered those of us who disagree with you over the head by slipping in points that have nothing to do with your article.

          I see the humour in it but you are inviting rebuttals in kind. Perhaps, like me, you like to stick in the needle whenever you can. As owner of the blog you can bar us for reacting but please don’t expect Scotsmen like me to sit on my hands while you make such claims about physics.

          You insisted in a recent article that temperature is nothing more than energy in versus energy out. Temperature is, in fact, a relative measure of heat, and the degree C of the Celsius scale is defined based on the range of relative heat between the freezing point of water and the boiling point of water.

          One degree C, a measure of temperature, is a measure of 1/100th of the heat increase between the FP of water and its BP.

          Both temperature and heat are defined as the kinetic energy of atoms. Heat is the KE of atoms in reality and temperature is a human invention to measure it.

          Then you just had to take a shot about the GHE. I think you should bar yourself. ☺ ☺

  2. Eben says:

    Here is your half way between the data points fix ,
    a very good documentary on climate satellites and their observations, remarkably free of propaganda except a little bit at the end

    https://youtu.be/zbIy0bzPS-c

  3. curious skeptic says:

    what if the lid was no lid at all?
    The doomsayers view the climate system as a ball on the top of a triangle. Push the ball and it is over. I like to believe the climate system is like a ball in a bowl. Push the ball (volcanoes, solar fluctuations, GHG fluctuations etc) and the ball returns. Which of these two systems would likely have persisted the last few million years? If anything, based on our climate history, the bowl is tilted to the cold side.

    • Roy W. Spencer says:

      Even Venus is like a ball in a bowl. It isn’t still warming. It has a stable temperature based upon the rates of energy gain and energy loss. It just gets so hot at the surface because the rate of energy loss is so slow near the surface.

      Same reason the sun gets so hot, even though its rate of energy release from nuclear fusion is weaker, per kilogram of mass, than the heat release by metabolism in the human body.

      • Mike Flynn says:

        Dr Spencer,

        You wrote –

        ” . . . rate of energy loss is so slow . . . “.

        With respect, energy loss results in lower temperature, otherwise temperatures would never drop.

        Cooling, however slow, is still cooling. Your reference to the Sun might be a little misleading. The Sun generates heat internally though nuclear processes. The internal radiogenic heat sources of Venus are largely depleted, and the planet as a whole is cooling.

        As to Venus –

        “A typical rate of cooling is 70K Gyr -1.” – from Mantle Convection in the Earth and Planets.

        So, cooling. Slow, but cooling nevertheless. The Venusian atmosphere is not a perfect insulator, and cannot therefore prevent the surface heat loss proceeding to the cold sink of space.

        I know I’m picky. Hopefully the designers, builders, pilots and mechanics of things like aircraft on which I fly, are just as picky.

        Cheers.

        • Roy W. Spencer says:

          Mike, surely you are smarter than this.

          When you put a pot of water on the stove top and turn the burner on, as soon as the pot of water becomes warmer than its surrounding, it starts to lose energy (“cool”) to the surroundings, even though the water continues to increase in temperature.

          You do understand that, correct?

          • Michael Flynn says:

            Dr Spencer,

            I am as smart as I am – no more no less. Your attempt to dismiss my comment is unworthy of you.

            Try a 200 l drum of water heated by a candle with a flame temperature of 1000 C. If you demand 800 W input, use a pot so big that the water does not increase in temperature. Make the surroundings the same temperature as the burner . . .

            Unstated assumptions just open you to accusations of evasion, and appealing to your own authority. I prefer facts, but there you are!

            I assume you have banned me.

            Oh well.

            Cheers.

          • Stephen P Anderson says:

            This is exactly Murry Salby’s carbon model. The level of carbon dioxide in the atmosphere is in equilibrium as long as carbon input is equal to carbon output. If carbon input is increased then level rises until output matches input again. Carbon output is proportional to carbon level. Dr. Spencer, why do you believe this climate model regarding temperature but you don’t believe the carbon model? You believe some mathematical construct that “assumes” that 50% of the anthropogenic carbon is absorbed but the rest lasts for decades in the atmosphere no matter what the carbon level is? Doesn’t make any sense.

          • Svante says:

            Plus the fact that he used that curve as a measure of total atmospheric CO2 depletion, completely disregarding the exchange with other reservoirs.

          • Dr Roys Emergency Moderation Team says:

            Svante, please stop trolling.

          • Nate says:

            Stephen,

            Here is WUWT take on Murray Salby and his ‘analysis’.

            https://wattsupwiththat.com/2015/04/19/the-secret-life-of-half-life/

            What do you think about this?

          • gbaikie says:

            “Here is WUWT take on Murray Salby and his analysis.

            https://wattsupwiththat.com/2015/04/19/the-secret-life-of-half-life/

            What do you think about this?”

            I think trees absorb a lot CO2- if you plant and grow more trees you reduce CO2 level.
            And Nature is currently growing more trees. Nature dwarfing, any trillion dollar a program you want to devise to grow trees. But still think people should favor things to could result in more tree growing. A few million dollar project greening the already greening Sahara Desert region *might be* a good idea- depending on if done with least corruption.
            Anyhow, the world is greening whether humans do anything in terms to planting trees. But world greening in other ways than just more trees growing, and would say Nature is increasing it’s biological systems or biological processes of removing CO2 is increasing, though such increase will increase biological processes of eating plants life { or increases the amount of animal life } though most animal life also increases amount CO2 “removed” from the atmosphere. Or roughly the Nature Carbon cycle is growing, Nice to know how big it was {and so could figure out how fast it’s getting bigger] And we also have the non life part of Carbon Cycle.

            But as practical matter, China suppose to be engaging in process making liquid fuels from Coal, and if done to any scale, it is suppose create a lot CO2 if done incompetently. And I have much faith in how incompetent any government can be. And rather then depend upon the corrupt and evil Chinese government to report the CO2 emission {which I don’t} I believe we could independent detect it {assuming our government systems is not just as bad at this as Chinese are].

          • Chic Bowdrie says:

            Nate,

            Thanks for bringing that post to my attention. A comment by Richard Courney summarizes my view succinctly, “…correlation does not indicate causation. Hence, the agreement of the red and black lines in Willis’ Figure 3 only indicates a possibility that the recent rise in atmospheric CO2 concentration is caused by anthropogenic (i.e. man-made) CO2 emissions overloading the ability of the carbon cycle to sequester all the CO2 emissions both natural and anthropogenic.” Unless you have newer information to the contrary, I submit we are at an impasse.

            Also, I couldn’t help noting this comment by Bart, “Anyone who actually reads Salby’s work and is capable of understanding it can see very clearly that the man is brilliant, and thoroughly immersed in his subject matter. The people casually lobbing potshots at him have no such demonstrated skill. It would be funny if it weren’t so annoying.”

          • Nate says:

            “Unless you have newer information to the contrary, I submit we are at an impasse.”

            Well, the main point of that WUWT post and the other one i posted above it, is thar Salby, a proven fraud, is continuing his ways in his video. His graphs are used in highly deceptive or misleading ways, and do not support his claims. IOW he cheats.

            No rebuttal from you guys.

          • Chic Bowdrie says:

            “The people casually lobbing potshots at [Salby] have no such demonstrated skill.”

            That means you, Nate.

          • Nate says:

            “correlation does not indicate causation”

            Of course. Some recent episodes in science show that this is certainly valid.

            Cold Fusion- large energy releases in room temperature test tube was not sufficient to prove a casual link to nuclear fusion.

            Living near power lines correlated with childhood leukemia, was not sufficient evidence to prove a causal link.

            Vaccination correlated to Autism was not sufficient to demonstrate a causal link.

            All of these turned out to be wrong.

            But what all these episodes have in common, is that:

            1. There was no prior hypothesis of a causal link between these two things.
            2. There was no plausible mechanism for causation ever proposed. This is a key missing ingredient.
            3. No credible replication or credible additional evidence was found.

            In sharp contrast, with CO2 emissions and atm CO2 concentration rise:

            1. There was a prior hypothesis, more than 100 years ago that our emissions would lead to concentration rise. And the hypothesis was repeatedly asserted and refined in the intervening years.

            2. There is a highly plausible and simple mechanism for emissions to lead to concentration rise. CONSERVATION OF MASS. The mechanism leads to QUANTITATIVE prediction that the CO2 should accumulate in the atmosphere and in the ocean and biosphere in quantities = summed emissions, decade by decade. The available evidence agrees with this prediction, IOW the emitted mass can all be accounted for (approximately) in the accumulations in the atm, ocean and biosphere.

            3. The usual fallacy is that correlation is not by itself sufficient evidence. In this case, we have several other convincing pieces of evidence that should not be ignored.

            Now Berry and Salby claim that (2) is invalid. That anthro emissions are insufficient to explain the magnitude of the rise in concentrations.

            Given all the discussions here, do you still stand by this claim?

          • Nate says:

            ‘The people casually lobbing potshots at [Salby] have no such demonstrated skill.’

            That means you, Nate.”

            Can’t refute the facts, attack the messenger(s). Two others you forgot.

          • Chic Bowdrie says:

            Berry and Salby showed evidence that the mass balance and predictions of CO2 accumulation can be explained by other means than only anthropogenic emissions.

            I’ll never be able to refute your facts because your mind is closed to alternative information not consistent with your confirmed bias. I’m sorry you feel attacked.

          • Nate says:

            ‘Ill never be able to refute your facts because your mind is closed to alternative information not consistent with your confirmed bias.’

            IOW, I, Chic, have no rebuttal to the straightforward evidence that Salby has cheated.

            Since ‘brilliant’ Salby supports my POV, I need to attack the messengers.

            Its a tried and true method (see eg D Trump).

            “Im sorry you feel attacked.”

            Obviously not, since you did the attacking.

          • Nate says:

            “Berry and Salby showed evidence that the mass balance and predictions of CO2 accumulation can be explained by other means than only anthropogenic emissions.”

            Your current seems to be natural sources ‘can explain’, but Berry and Salby’s view is clearly ‘must explain’.

            Their view is that there is a real problem with the anthro model. And therefore we need an alternative.

            If in fact both models are equally valid, then one should just look at the available evidence. The vast weight of it comes down on one side.

          • Chic Bowdrie says:

            Now I feel sad that you feel attacked. How can I help? I will still continue to argue my view and keep responding like this until you get tired of regurgitating the opinions of others and be willing to accept or understand opposing views.

            Willis’ argument is that Salby compares apples and oranges. He doesn’t see the needle in the haystack and his own analysis simply duplicates the same treatment used by Kohler, Spencer, the IPCC, etc. Salby points out that the growth in atmospheric CO2 is unaffected by a change in the growth of human emissions around 2002. My explanation (and I presume Salby’s) is that the human emissions are swamped by natural emissions as my model demonstrates could easily have occurred.

            Even if you were a hands-on climate scientist familiar with all the details involved in this CO2 growth attribution problem, you are not the judge and there is no statute of limitations on this case. You can continue to complain about those of us who are looking deeper into the science for more definitive evidence or you can place some data of your own into evidence.

            The vast weight of available evidence? Good grief, Charlie Brown.

          • Nate says:

            “because your mind is closed to alternative information not consistent with your confirmed bias”

            It is not that BDGWX, Barry, and I and 99 % of scientists who’ve looked into this issue are closed minded, it is that you have not offered up real evidence to support your extremely improbable claims.

            You offer speculation about a large, imbalanced natural carbon source, that arrived on the scene a century ago and has continued to grow ever since.

            We have all asked you: where is the evidence for such a source?

            Why is there no precedent for a source remotely this large for at least many millenia?

            Why does this source’s emissions just so happen to match the anthro emissions history?

            How does this natural source align with the isotopes data?

            How is this source consistent with the atm, ocean and biosphere all being sinks?

            It is not sufficient for you to simply regurgitate the opinions of others, like Berry, and Salby. Because these guys have GENUINE credibility issues.

            Specifically for Salby, as you can see here:

            https://quantpalaeo.wordpress.com/2015/04/28/the-most-interesting-part-of-murry-salbys-lecture/

            He refuses to publish his “brilliant” work.

            He distorts the well know short-term ENSO correlation to CO2 into explaining the long-term rise in CO2.

            At 12:00 in his London lecture he shows us what he calls the ‘thermally induced emissions’ and it matches the growth in atm ppm. But this ‘thermally induced emissions’ plot has no labeled axis. Where is it from?

            In fact this data is something he has made up from whole cloth. He continues to use this made-up data throughout the talk.

            At 30:00 he discusses the bomb C14 decay, stating it was all done in 20 y from 1963. It has a time constant of ~ 6 y.

            He uses this TC throughout the rest of the talk.

            as discussed here:

            https://quantpalaeo.wordpress.com/2015/04/29/dissembling-with-graphs-murry-salby-edition/

            This is clear-cut evidence of cheating.

            He hides the true equilibrium level of Bomb C14.

            His graph “shows atmospheric 14C to have declined to its original value within 20 years of the 1963 test ban treaty. In reality, 14C concentrations remain above background 50 years later.”

            He deceptively shifts axes as needed to make his points. He makes up fake data to make his points.

            Already discussed Berry’s issues at length with you.

            Quoting these guys, therefore, will not be convincing to anyone here.

          • Nate says:

            “Salby points out that the growth in atmospheric CO2 is unaffected by a change in the growth of human emissions around 2002.”

            Emissions data https://ourworldindata.org/co2-and-other-greenhouse-gas-emissions gives GT C average per year

            90s 6.268
            2000s 7.75
            2010s (08-17) 9.38

            https://tinyurl.com/y49npw35

            As you can see, scaled x5 concentration growth rate is hugely variable but continuing to grow from 90s to 2000’s to today

            OLS trend line

            Gives

            1995: 0.675
            2005: 0.80
            2014: 0.914

            Again, a claim of Salby’s is not supported by the facts.

          • Chic Bowdrie says:

            Nate,

            Many of your questions have been previously asked and answered. And I will continue to promote my view until you or others show evidence that definitively conflicts with it. Your position is to accept one line of evidence and reject the other. Nothing unusual about that. Apparently you are deeply invested in supporting the mainstream view. My view is that there are two lines of evidence that both explain the data. I’m not satisfied with taking someone else’s word for it.

            After viewing Salby’s presentation I can respond to specific points to which you object. He explained why he hasn’t published his work. You say he refuses to, which is not what he said.

            He explains that natural CO2 emission data is limited, but asserts that local CO2 emissions are sensitive to surface properties mainly temperature. You are correct that he doesn’t explain how he calculates the thermally induced emissions that he correlates with measured CO2. That doesn’t prove he made it up. We may have to wait for his publication or find somewhere else it may have already been explained.

            I don’t recall Salby using 5 years to describe the 14C decay. Berry’s paper shows a more complete picture which explains how the addition of new radioactivity results in a longer 16 year e-time. Salby only used 14C data to as one of three ways to estimate CO2 residence time and underscore that it is nowhere close to hundreds of years.

            There is nothing fake about the correlation between population growth and the growth in fossil fuel emissions despite his offset on the population axis. Do you deny that emissions will track population growth?

            Using the Mauna Loa and Bowen data from Dr. Spencer’s model, I calculated the trends in yearly increases between 1983 and 2002 and compared them with the trends I calculated between 2002 and 2014. The fossil fuel emissions increased from 0.04 ppm/yr to 0.11 ppm/yr while the CO2 decreased slightly from 0.014 to 0.009 ppm/yr. The facts seem to substantiate Salby’s claim. Your data obscures the exact picture Salby intended to show. Nice try though.

          • Nate says:

            http://www.woodfortrees.org/plot/esrl-co2/from:1983/to:2002/mean:12/trend/plot/esrl-co2/from:2002/to:2014/mean:12/trend

            Trends atm co2 are 1.52 ppm/y and 2.02 ppm/y for 83-02 and 02-14. Not sure what you did.

          • Nate says:

            “he doesnt explain how he calculates the thermally induced emissions that he correlates with measured CO2. That doesnt prove he made it up. We may have to wait for his publication or find somewhere else”

            Given that this is a central point of his talk, this ‘data’ that accounts for most of the rise is used throughout his talk, I would think he would explain how he gets it.
            Of course we know that Henrys law wont do it.

          • Nate says:

            Boden average emissions 2.9 ppm/y and 4.1 ppm/y for 83-02 and 02-14. Not sure what you did?

          • Nate says:

            Salby gets 8.6 y for c14 tc, misread it. But he still states clearly that has reached equil in 20 y. When it clearly has bot because he hides true equilibrium level.

          • Nate says:

            “Do you deny that emissions will track population growth?”

            Yes, per capita energy use today much higher than 200 y ago.

            Just one of many examples of his deceptive use of graphs.

          • Nate says:

            ‘ The fossil fuel emissions increased from 0.04 ppm/yr to 0.11 ppm/yr while the CO2 decreased slightly from 0.014 to 0.009 ppm/yr. ‘

            I think you are looking at ppm/yr^2 here. Acceleration of Co2 concentration.

            This is exactly what Salby does in the talk at 8:45, where he compares trends in emissions ppm/yr^2, to trend in CO2 with ppm/yr.

            In his case, it is another clear cut case of intentional deception, as his comment is “The growth of fossil fuel emissions increased sharply, by 300%. The growth of CO2 remained constant.

            I assume in your case you just made an error.

          • Chic Bowdrie says:

            I did calculate ppm/yr^2. Good catch. Other than that, no error. Except possibly some miscommunication on Salby’s or my part. Bottom line is the acceleration in the fossil fuel emissions is not detected in the CO2 rise. Something else is happening and Salby and Berry have a valid explanation.

            BTW, what I did was correct the problem Willis objected to, ie where Salby compared the derivative of the emissions curve to just the slope of the CO2 data.

          • Nate says:

            “Bottom line is the acceleration in the fossil fuel emissions is not detected in the CO2 rise”

            Well for your selected years, the RELEVANT numbers clearly DISAGREE.

            Years– av emissions–trend in conc. (all in ppm/y)

            82-02 2.9 1.52

            02-14 4.1 2.02

            What we see here is 37% increase in emissions, and a 33% increase in growth rate, with hefty error bars on the latter.

            ‘what I did was correct the problem Willis objected to, ie where Salby compared the derivative of the emissions curve to just the slope of the CO2 data.’

            Not at all.

            When he says 300% increase, that is a red herring. It is the 37% increase that matters.

          • Chic Bowdrie says:

            I’m sorry Nate. You and Willis can’t have it both ways. You are comparing the ppm/year rates which hide the differences I am pointing out by using the derivatives, ppm/year^2. What that shows is the emissions began to accelerate three times faster in 2002. But CO2, which supposedly tracks emissions, did not accelerate any faster. The 37% shows that both rates were increasing, but fails to show that emissions were accelerating faster than CO2. This is evidence you choose to ignore, because it doesn’t fit your paradigm. It suggests that there is another factor influencing the rise in CO2 and it is a major factor compared to FF emissions.

          • Nate says:

            Chic,

            Years av emissionstrend in conc. (all in ppm/y)

            82-02 2.9 1.52

            02-14 4.1 2.02

            This data shows that the rate of accumulation in the atmosphere is ~ 50% of the emissions, during both time periods.

            When the emissions increase, the rate of accumulation increases by almost as much.

            Im not sure why you dont understand this straightforward math.

          • Nate says:

            “What that shows is the emissions began to accelerate three times faster in 2002.”

            Emissions are already a rate ppm/yr, directly comparable to 1st derivative of concentration.

            change in emissions over time ppm/yr^2, comparable to second derivative of concentration.

            First derivative is already plenty noisy. Second derivative very noisy.

            if ppm/yr^2 increases by 3 times that is ppm/yr^3 and is comparable to 3rd derivative of concentration.

            Do we really want to look at 3rd derivative of concentration?

            No. Extremely noisy and pointless.

          • Chic Bowdrie says:

            Rate is ppm/year like miles/hour. Acceleration is ppm/yr^2 like miles/hour^2. Increasing acceleration by a factor of 3 means you go from X miles/hr^2 to 3X miles/hr^2. It has nothing to do with a 3rd derivative. Let me know when you have that straight.

          • Nate says:

            ‘X miles/hr^2 to 3X miles/hr^2’

            And this change in the miles/hr^2 happens over a period of time.

            Then this is looking at the time-rate-of-change of the second derivative, yes?

            That is known as the third derivative, friend.

            It amounts to plotting the derivative of CO2 concentration data, ppm/yr, which is already very noisy, and looking at the CURVATURE of the trend in this data, and comparing it to the curvature of the trend in emissions.

            It is pointless and actually a fools errand to be looking at that.

            The remarkably simple mathematical fact is that the emissions and the concentration growth rate are proportional, as expected.

            Thus ~ 50% of emissions remain in the atmosphere, in both time periods.

            Sorry, there is simply no way to spin this to make it support Salby’s claim that emissions and concentrations are not linked.

          • Chic Bowdrie says:

            “That is known as the third derivative, friend.”

            True, but the change from 0.04 ppm/yr^2 to 0.11 ppm/yr^2 doesn’t change gradually. There is a 19 year period averaging 0.04 followed by a 12 year period of 0.11 ppm/yr^2 acceleration in FF emissions. Meanwhile, the acceleration in CO2 is steady, if not a zero increase in the rate of growth in atmospheric CO2.

            The fools errand is to ignore what is staring you in the face. While FF emission growth is relatively steady, CO2 growth is noisy. If FF emissions are causing all the growth in CO2, then why is the CO2 growth so noisy? The obvious answer is a huge input from natural emissions which are predictably noisy due to temperature fluctuation.

            It is you guys that are doing the spinning with simplistic graphs and irrelevant correlations.

          • Nate says:

            ‘ If FF emissions are causing all the growth in CO2, then why is the CO2 growth so noisy? The obvious answer is a huge input from natural emissions which are predictably noisy due to temperature fluctuation.’

            Everyone agrees the natural variation is present. The link to ENSO has long been known and studied.

            The presence of anthro emissions doesnt make the natural variation go away. Nor does natural variation being present prove anthro contribution is absent.

            If Salby were giving an honest research presentation he would mention the ENSO connection and that this was already well known and has good explanations.

            But instead he uses it to falsely claim that almost ALL variation, including the long-term rise, is natural. This is dishonest.

            When he shows the change in slope of the emissions data (a 3rd derivative of CO2) he dishonestly compares this directly to the CO2 concentration and claims no change.

            Sorry I cannot easily detect 3rd derivative.

            The reality is that the 1st derivative of CO2 data is noisy, and to show it would betray the fact that any curvature in it would be difficult to detect.

            Over a long-enough period we can detect a trend in the first derivative of CO2– the 2nd derivative. That can reasonably well be compared with the trend in emissions.

          • Chic Bowdrie says:

            “Nor does natural variation being present prove anthro contribution is absent.”

            I never claimed such a ridiculous statement. This is your problem. You cannot accept that there might be another explanation than the mainstream view that FF emissions make up 50% of CO2 in the air. Although I consider it impossible that 50% of the very CO2 molecules originating from FF still remain in the air, I accept the the possibility that FF emissions may have contributed to a large share of the increased atmospheric CO2. But I am not a lemming. I will wait for the missing data to confirm more definitively one way or the other.

            I’m sure the author of a textbook on the physics of the atmosphere and climate understands the implication of ENSO on his data. Maybe he would have had a good answer if you could have asked him. Maybe you could review his presentation and see if it was indeed addressed. Seems like it might be somewhere in the “thermally induced emissions” section of his talk.

            I’ve already addressed the rest of your diatribe and, frankly, I’m tired of your nitpicking. I won’t respond again on this thread.

          • bdgwx says:

            Chic said: “Im sure the author of a textbook on the physics of the atmosphere and climate understands the implication of ENSO on his data.”

            I wouldn’t be so sure. He conflates the residence time of individual molecules with the lifetime for a mass that has pulsed into the atmosphere despite this being an obvious concept to experts. So it seems plausible that Salby could be confused by other concepts as well.

          • Nate says:

            “This is your problem. You cannot accept that there might be another explanation than the mainstream view that FF emissions make up 50% of CO2 in the air. ”

            No! That is not the mainstream view. You are confused! Bdgwx red ball explanation is the mainstream view, did you understand it?

            “I consider it impossible that 50% of the very CO2 molecules originating from FF still remain in the air, I accept the the possibility that FF emissions may have contributed to a large share of the increased atmospheric CO2.”
            Good, this is the mainstream view!

      • Gordon Robertson says:

        Roy…”It just gets so hot at the surface because the rate of energy loss is so slow near the surface”.

        It’s 450+ C at the surface. Here’s an abstract from astronomer Andrew Ingersoll re that temperature…

        https://agupubs.onlinelibrary.wiley.com/doi/abs/10.1029/JA085iA13p08219?deniedAccessCustomisedMessage=&userIsAuthenticated=false

        “Pioneer Venus observations of temperatures and radiative fluxes are examined in an attempt to understand the thermal balance of the lower atmosphere. If all observations are correct and the probe sites are typical of the planet, the second law of thermodynamics requires that the bulk of the lower atmosphere heating must come from a source other than direct sunlight or a thermally driven atmospheric circulation. Neither the so‐called greenhouse models nor the mechanical heating models are consistent with this interpretation of the observations”.

  4. JRF in Pensacola says:

    I’ve tried to keep up with the comments here and on WUWT regarding Pat Frank’s paper but there are so many, so I may have missed explanations about the following. I like the concept of “uncertainty” regarding prediction because statistical analyses in the models imply (I think) a more perfect understanding of the underlying science than what is actually known, particularly in a highly chaotic, complex system.

    So, my question regards “The Pause”. The Pause was not predicted in any (is that correct?) of the models (the 20 pots) and I wonder is The Pause an example of Uncertainty raising its head as opposed to just statistical anomaly?

    Have the models been “tuned” (error adjusted) for The Pause and does that error/adjustment propagate?

    My apologies if these are ignorant questions.

    • Roy W. Spencer says:

      The pause was most likely the result of a temporary and natural internally-generated global energy imbalance, maybe due to an increase in clouds, or an increase in vertical overturning of the ocean. The imbalance would only have to be 1 part in 200-300 of the average energy flows in and out of the system. That’s tiny.

      You cannot address the uncertainty in climate model projections without understanding what is in the current blog post. It is a waste of time, and people will be misled by others’ claims and assumptions, whether stated or unstated. What I have described above is as simple as I can make it, and it is the basis of climate change theory.

      If people cannot or will not understand the basics, they should probably just ignore all of the experts.

      • JRF in Pensacola says:

        Thanks for taking the time to reply. It is appreciated. I do follow your site and WUWT almost daily, but rarely comment, as I don’t want to get over my biology/chemistry skis. Everyone may not always agree with you but you have a calm. reassuring manner that garners respect!

        • Real science does not require hand waving, hysterical predictions of future doom, character attacks on those who disagree, and refusals to share data / debate.

          That’s what junk science looks like.

          A few scientists in the 1970s got a lot of media attention by predicting a coming ice age.

          Most scientists at the time expected global warming, but some of them realized the way to get a lot of attention, and study grants = wild guess predictions of a coming climate crisis.

          That was almost 35 years ago, and the climate scaremongering is still ramping up.

      • Gordon Robertson says:

        Roy…”The pause was most likely the result of a temporary and natural internally-generated global energy imbalance, maybe due to an increase in clouds, or an increase in vertical overturning of the ocean”.

        I could understand that over a few years, but the flat trend lasted for 18 years, based on the 15 year IPCC claim and three more from your own graph.

    • bdgwx says:

      Correct. The timing and magnitude of the pause was not generally predicted.

      A large source of error in models is believed to be with the forcing inputs. In the case of “the pause” it is believed that aerosols were underestimated due to increased volcanism and pollution. CFC reductions have been implicated as well. When the CMIP5 suite of models is ran with adjusted forcings the output is a better match to observations.

      • Dr Roys Emergency Moderation Team says:

        bdgwx, please stop trolling.

        • Svante says:

          I agree, the pause was just a blip, more like weather than climate.

          Still, captured pretty well by this model + ENSO (blue):
          https://tinyurl.com/y2t4qc9j

          • Dr Roys Emergency Moderation Team says:

            Svante, please stop trolling.

          • Gordon Robertson says:

            svante…”the pause was just a blip, more like weather than climate”.

            An 18 year blip. And ‘pause’ is a suggestion by alarmists that it is temporary. The flat trend was broken by a very strong El Nino and we are waiting to see where the negative trend following it will end.

          • Svante says:

            That’s right Gordon, an 18 year blip, and now it’s broken.

            You will have more pauses in the future, as long as you remember to start counting at a strong El Niño.

      • Dr Roys Emergency Moderation Team says:

        Regarding “the pause”:

        There is a 25-year trend in the current UAH data that is not statistically significant:

        https://skepticalscience.com/trend.php

        Put in 1994 to 2019 in UAH 6.0 and the trend is 0.102 C/decade +/- 0.116.

        If you put in 1995 to 2019, or 1996, or 1997, and so on and so forth, all the trends are not statistically significant.

        I am wondering if, over the next five years or so, there is the possibility of a 30-year trend that is not statistically significant arising…

        Surely that would be…significant?

        • barry says:

          When a trend is not statistically significant, that does not mean that there is no trend.

          Failing to disprove the null does not prove it. Statistical significance has a strictly limited function.

          To answer your question(?), it would be curious, but not conclusive. More study at that time might yield a firmer answer A non-significant trend line alone would not be enough.

          • Gordon Robertson says:

            barry…”When a trend is not statistically significant, that does not mean that there is no trend”.

            The IPCC error bars made it clear the flat trend may have been a cooling trend. Their upper error margin is ludicrous, however. It would have meant a 0.2C/decade trend, which is not in keeping with their description of the flat trend as a warming hiatus.

            0.2C/decade would not be a warming hiatus. I think the IPCC fiddled the error margin to save face.

          • barry says:

            We are talking about the trend 1994 to 2019.

            The upper margin is the same as the lower margin – it is the same +/- from the mean trend, which is 0.05 C/decade.

            The term ‘hiatus’ appears in the IPCC document as a popular bit of jargon, which is why it gets quotes over it in the technical summary.

            “The observed GMST has shown a much smaller increasing linear trend over the past 15 years than over the past 30 to 60 years (Box TS.3, Figure 1a, c). Depending on the observational data set, the GMST trend over 1998–2012 is estimated to be around one third to one half of the trend over 1951–2012. For example, in Had.CRUT4 the trend is 0.04°C per decade over 1998–2012, compared to 0.11°C per decade over 1951–2012. The reduction in observed GMST trend is most marked in NH winter. Even with this ‘hiatus’ in GMST trend, the decade of the 2000s has been the warmest in the instrumental record of GMST.”

            Ignoring statistical uncertainty, the mean trend is still positive for the period, according to the IPCC [see above, from the technical summary].

            But what is being explored just above is what statistical uncertainty means.

          • Dr Roys Emergency Moderation Team says:

            OK, barry.

        • Dr Roys Emergency Moderation Team says:

          “To answer your question(?), it would be curious, but not conclusive.”

          Not conclusive of what?

          • barry says:

            Whether there is a trend or not.

          • Dr Roys Emergency Moderation Team says:

            Well, there would “conclusively” not be a statistically significant trend for 30 years, just as currently there is “conclusively” not a statistically significant trend for 25 years. Usually the argument is made, when pointing out a a lack of statistical significance, that with a noisy dataset you need to have a long enough period of time over which to detect a trend – that the problem is the noise, not the signal. Sometimes people will even suggest 30 years, because of its additional relevance to climate. This is usually when discussing trends over time periods of 20 years or less. You would hope that these people would be happier with a 25 year or 30 year trend, but maybe there are some who are just impossible to please.

            Another problem pointed out when discussing “the hiatus”, is the choice of starting the trend at 1998, the bumper El Nino year. So, a trend starting at 1994 or earlier nullifies that objection too.

            Also, as the uncertainty would be less than +/-0.116, with a 30 year trend (given that it is 0.116 for a 25 year trend), in order for a 30-year trend to still lack statistical significance would require some cooling between now and five years time. The trend itself would have to be lower. In fact, it would conclusively show that there had been cooling over those years.

            If there were such a 30-year trend to arise before five years time has passed, it would also conclusively show that cooling had occurred.

          • barry says:

            “Well, there would ‘conclusively’ not be a statistically significant trend for 30 years, just as currently there is ‘conclusively’ not a statistically significant trend for 25 years.”

            To be precise:

            For the imagined 30-year period there would be no proof of any trend or lack of one.

            Saying that there is ‘not a statistically significant trend’ says almost nothing. A lot of people make the mistake of thinking that a statistically non significant trend is the same as no trend.

            I’m sure you would not wish to promulgate that basic error.

          • Dr Roys Emergency Moderation Team says:

            “For the imagined 30-year period there would be no proof of any trend or lack of one.”

            …and no proof of any trend over a 15, 16, 17, 18, 19, 20, 21, 22, 23, 24, 25, 26, 27, 28, 29 or 30-year period ought to give some pause for thought. We already have that for all those years up to 25…

          • barry says:

            “and no proof of any trend…”

            Nor proof of a lack of trend.

            The classic climate period is 30 years. There is a statistically significant positive trend in global temperature in all indices that measure it for at least the last 27 years.

            For the UAH6.0 data, the lowest trend of them all, we can say only that there is a statistically significant positive trend at the 95% confidence interval since 1993. After that, the mean trend to present remains positive until 2015 but fails statistical significance.

            Except for the trend running from 1999 to present. That is statistically significant and positive.

            So that’s the statistical uncertainty of global temperature indices. A wider perspective using more indices would determine that global warming has been underway for several decades, and seems to be continuing.

          • barry says:

            “Another problem pointed out when discussing ‘the hiatus’, is the choice of starting the trend at 1998, the bumper El Nino year. So, a trend starting at 1994 or earlier nullifies that objection too.”

            The statistical non-significance of the trend from 1998 meant that you couldn’t say there was a hiatus.

            The skeptic position on this while the ‘hiatus’ lasted, was purely about the mean trend. Any mention of statistical significance was ignored. WUWT and other ‘skeptic’ websites claimed a hiatus, usually referring to Monckton’s graph of the RSS satellite trend, which up until 2016 showed a flat or slightly declining trend line.

            When that mean trend line started to turn upwards, Monckton and others who had been counting the months the ‘pause’ had extended, began to predict its end. The metric was always the mean trend. Statistical significance had nothing to do with it.

            When the ‘pause’, as skeptics had been determining it, ended, there was a sudden interest in some quarters about statistical significance. Eager to keep the ‘pause’ rolling, some adopted the new phrasing – “no statistically significant trend.”

            But no statistically significant trend is not the same as “no trend.” There could well be a real, physically-based upwards trend, but the statistical uncertainty, which is strongly dependent on variability, might be greater than the trend.

            Statistical significance has a very limited function. However much some might hope that a non statistically significant trend means that there isn’t one, that just isn’t the case.

            The problem has always been that ‘skeptics’ have confused the meaning of these statistical applications and tests in order to get snappy soundbytes. Which is why plenty of ‘skeptics’ still think no statistical significance = no change.

            There is an actual statistically significant ‘pause’ in the global temp record – between about 1940 and 1970. The uncertainty interval for that period do not overlap with those for the long-term trend estimates before and after.

          • Dr Roys Emergency Moderation Team says:

            “Except for the trend running from 1999 to present. That is statistically significant and positive.”

            No, it is not statistically significant according to the trend calculator I linked to (Skeptical Science). It is:

            0.137 C/decade +/- 0.147

            All possible recent trends up to a length of 25-years are not statistically significant, in the UAH 6.0 data, according to that trend calculator.

            Your recollection of events regarding discussion of trends is different to mine. Yes I recall the period of time where Monckton wrote his regular updates on RSS discussing a flat trend line of 15 years etc. But prior to that, during that, and afterwards there has always been a discussion of trends that were not statistically significant. And, as I said earlier:

            “Usually the argument is made, when pointing out a a lack of statistical significance, that with a noisy dataset you need to have a long enough period of time over which to detect a trend – that the problem is the noise, not the signal. Sometimes people will even suggest 30 years, because of its additional relevance to climate. This is usually when discussing trends over time periods of 20 years or less. You would hope that these people would be happier with a 25 year or 30 year trend, but maybe there are some who are just impossible to please.”

            Please explain how the 1940 to 1970 pause is statistically significant.

          • barry says:

            The UAH6.0 trend from 1999 to present is:

            0.145 (+/- 0.38) C/decade

            You are typing 2019 into the second time period box. That means the trend will only run to December 2018. Not to present.

            Leave the second time period box blank and it will give you data up to the latest month.

            Your memory may be faulty. In Feb 2016, Monckton is quoted in his post at WUWT:

            “The sharp el Nino spike is just about to abolish the long Pause in global temperatures at least for now.”

            Monckton at WUWT a year later titled his post: When will ‘The Pause’ in global temperature return? Amusingly, not one sentence in the post that followed referred to the question, much less answered it. Skeptics were mobing on to how to message things differently.

            Two posts I contributed to at WUWT asked when the pause would return:

            https://wattsupwiththat.com/2017/02/19/how-imminent-is-the-uah-pause-now-includes-some-january-data/
            https://wattsupwiththat.com/2017/03/14/how-imminent-is-the-rss-pause-now-includes-january-and-february-data/

            The denizens of WUWT had for the most part been consistent about how the ‘pause’ had been defined, and most of the conversation was based on its likely return. But others started talking about statistical significance, something that had been entirely absent on the skeptic side prior to Feb 2016.

            Monckton’s grasphs were the feature item of pause talk at WUWT and throughout the skeptiverse. Shortly after the pause ended, here and elsewhere, people started predicting its return with the next la Nina. They still are, though less so of late. mpainter was one of the loudest voices on that at this site, before Roy banned him. My memory of all this is very clear. I was much involved in the conversations on this topic.

            Please explain how the 1940 to 1970 pause is statistically significant.

            What is statistically significant is a change in trend for that period.

            We take the longest reasonable prior trend*, 1900 to 1940 including statistical uncertainty, the trend 1940 to 1970 including statistical uncertainty, and the following trend to present with statistical uncertainty. If the statistical uncertainties overlap, the changes in trend are not statistically distinct – therefore, not statistically significant. If the uncertainties do not overlap, then we have statistically significant evidence of a change in trend.

            The null hypothesis doesn’t have to be “no trend.” The null hypothesis can be a trend, and the null is “no change” from that trend.

            Here we go:

            Time period : Trend + confidence interval : uncertainty range

            1900-1940 : 0.094 (+/- 0.040) C/decade : 0.054 to 0.134 C/decade

            1940-1970 : -0.024 (+/- 0.056) C/decade : -0.08 to 0.03 C/decade

            1970-2019 : 0.173 (+/- 0.026) C/decade : 0.147 to 0.199 C/decade

            Each of these trends are statistically distinct from the one adjacent in time. Their range of uncertainty does not overlap. So we can say that there is good evidence of a change in trend for each segment. And for the middle period, there is a slight negative trend, but the uncertainty is larger than the trend, so zero trend is also a possibility. In this case, there is fair evidence of a pause in global warming.

            (Done with Had.CRU4 surface data on the SkS app, ignoring the Krieging method data)

            Compare that with the trends and uncertainty for the UAH6.0 satellite data for the alleged ‘pause’ period. We check the prior trend, and see if the following trend is statistically distinct.

            1979-1997 : 0.091 (+/- 0.162) C/decade : -0071 to 0.253 C/decade

            1998-2014 : -0.041 (+/- 0.198) C/decade : -0.239 to 0.157 C/decade

            These uncertainties definitely overlap. The two trends are not statistically distinct from each other. If you are relying on statistical significance, you cannot say that there is a statistically significant change from the prior trend to the latter. You cannot say that there is a statistically significant change in trend. you cannot say that there was a pause.

            So, saying that there is no statistically significant trend is not the same as saying that there is no trend (or that there is a ‘pause’). There never was a statistically significant ‘pause’ after 1997. But there is evidence of one in the middle of last century.

            ( * I figured the data was sparser as we go back in time, and 1900 was a fair start point to give us 40 years of data for the first time period.)

          • Dr Roys Emergency Moderation Team says:

            No barry, my memory isn’t faulty. I didn’t actually say to you that Monckton’s RSS posts didn’t happen, did I? I said that there has always been talk of trends lacking statistical significance…before, during and after. I know, because I took part in some of those discussions, long before the RSS posts.

            So you’re telling me to determine whether a potential 30-year trend is significant (i.e meaningful, not statistically significant) we need to wait up to 5 years to see if that happens, and then we need to wait another 30 years after that to see if the uncertainty ranges overlap!?

            barry, if in a few years time we have a 30-year trend lacking statistical significance in the UAH data, that will be the first time that has ever happened in said data. So I would say that would be something meaningful…but we’ll have to wait and see.

          • barry says:

            “I said that there has always been talk of trends lacking statistical significance… before, during and after”

            If statistical significance was discussed by skeptics in reference to the ‘pause’, how did they not see that there was no statistically significant change in trend before and after 1998 – the classic period? How did the talk of a pause continue when the statistical evidence wasn’t strong enough to enable the claim?

            If you were talking about statistical significance, did you point this out? That without statistical significance there was very little one could claim (because failing to disprove the null does not prove it), and without statistically distinct change in trend, one could not say that the prior trend had been deviated from? That there was no statistical basis for a pause, if one relied on statistical significance instead of just the mean trend?

            How did these conversations go? Do you have links?

          • Dr Roys Emergency Moderation Team says:

            barry, it may come as a shock to you, but skeptics were aware of the concept of statistical significance before February 2016.

          • Dr Roys Emergency Moderation Team says:

            This is not one I commented on…but it will do as an example, that I found within five minutes on Google:

            https://wattsupwiththat.com/2009/12/26/no-statistically-significant-warming-since-1995-a-quick-mathematical-proof/

            That was discussing UAH data…interestingly, there’s still no statistically significant warming since 1995…

          • barry says:

            “if in a few years time we have a 30-year trend lacking statistical significance in the UAH data…”

            The trend 1990 to present (29 years, 7 months) is 0.131 (+/- 0.092) C/decade.
            The trend 1989 to 2018 (30 years) is 0.135 (+/- 0.091) C/decade.

            Uncertainy is pretty stable in the UAH data at about +/-0.090 for 30-year periods (you can test other 30-year periods), so a 30-year trend would have to dip below that figure to get statistical non-significance.

          • barry says:

            Lubos got it right.

            “No conclusion about the slope can be made…”

            Was that the theme of skeptic commentary on the ‘pause’ you are thinking of?

            If so, anyone who understood stat/sig to this degree couldn’t possibly have claimed a ‘hiatus’ from 1998.

            But we know that everyone in the ‘skeptic’ camp was claiming a ‘pause’ or ‘hiatus’ from 1998. I saw no evidence of discussion of statistical significance regarding this topic from the skeptic camp prior to 2016. Which is what I said – I didn’t say that stat/sig was never discussed about any other topic.

            Can you find any ‘skepptic’ commentary on the statistical significance of the ‘pause’?

          • Dr Roys Emergency Moderation Team says:

            “Uncertainy is pretty stable in the UAH data at about +/-0.090 for 30-year periods (you can test other 30-year periods), so a 30-year trend would have to dip below that figure to get statistical non-significance.”

            Yes, barry. That’s what I said to you in my comment at 6:18 AM:

            “Also, as the uncertainty would be less than +/-0.116, with a 30 year trend (given that it is 0.116 for a 25 year trend), in order for a 30-year trend to still lack statistical significance would require some cooling between now and five years time. The trend itself would have to be lower. In fact, it would conclusively show that there had been cooling over those years.

            If there were such a 30-year trend to arise before five years time has passed, it would also conclusively show that cooling had occurred.”

          • Dr Roys Emergency Moderation Team says:

            “But we know that everyone in the ‘skeptic’ camp was claiming a ‘pause’ or ‘hiatus’ from 1998. I saw no evidence of discussion of statistical significance regarding this topic from the skeptic camp prior to 2016. Which is what I said – I didn’t say that stat/sig was never discussed about any other topic.”

            You obviously were not looking very hard, barry. Here’s another one I found in minutes:

            https://wattsupwiththat.com/2013/06/13/no-significant-warming-for-17-years-4-months/

            “The NYT says the absence of warming arises because skeptics cherry-pick 1998, the year of the Great el Niño, as their starting point. However, as Anthony explained yesterday, the stasis goes back farther than that. He says we shall soon be approaching Dr. Ben Santer’s 17-year test: if there is no warming for 17 years, the models are wrong.”

            “Superimposing the temperature curve and its least-squares linear-regression trend on the statistical insignificance region bounded by the means of the trends on these published uncertainties since January 1996 demonstrates that there has been no statistically-significant warming in 17 years 4 months:”

            I didn’t make this up. People were regularly discussing statistical significance long before 2016. You get these ideas into your head about your ‘skeptics’ and their behavior and it seems like nothing will shake them. There were frequent claims of “no statistically significant warming since x”, and as I said before, others would respond that (quite rightly) with a noisy dataset you need to have a long enough period of time over which to detect a trend – that the problem is the noise, not the signal.

            I remember thinking – I bet one day, even if there were a 30-year period with no statistically significant warming, they will just find some other reason to downplay it/ignore it…

          • barry says:

            Lubos got it right, and Monckton got it wrong, trying to say that there had been no warming. He calls the non-statistically significant positive trend (0.09 C/decade) a ‘stasis’.

            He’s also not talking about ‘the pause,’ which he proceeded over the following years to determine as the trend from about 1998 to (eventually) 2015. In 2016, that pause ended as he said – the one he identified under with the metric everyone was using – the mean trend. He then began to ask when the pause would return, as I linked for you. He did not speak of statistical significance when he was talking about ‘the pause.’ But he was, in that post, trying to do what you are doing here, so there is some precedence for what you have been trying to argue.

            I know statistical significance was discussed on other topics, but you still haven’t showed any ‘skeptic’ talking about the statistical significance of ‘the pause.’ That’s the one that the vast majority of skeptics agreed was the mean trend.

            You haven’t explained why ‘skeptics’ failed to realize why the ‘pause’ itself was not statistically significant. If skeptics were across statistical significance, why did they not feature it along with discussions of ‘the pause’?

            They did not speak of it, because an honest discussion of statistical significance would have pulled the rug out from under the messaging.

            Do you understand why there is evidence of a ‘pause’ in the mid 20th century, and why that evidence is not there for the more recent ‘pause’? Based squarely on statistical significance? I spoke of this frequently over the years on this topic, and this was the blind spot that ‘skeptics’ kept having. They just didn’t engage on it. They changed the subject.

            Can you do better? You’d be the first.

          • Dr Roys Emergency Moderation Team says:

            Oh dear God…

            …it was all talk about the pause, hiatus, stasis, call it want you want. There were discussions about statistical significance. There were discussions about flat trends. There were discussions about how some time periods were too short for statistical significance. Too much noise, not enough signal. There was talk about how long a time period was needed in order to reliably detect a trend, and how that varied among the datasets. There was a guy called Werner Brozek writing monthly analyses of non-warming periods in all datasets long before Monckton got the idea to do that with his RSS posts. Statistical significance was frequently discussed in comments under those posts. It was discussed at the Guardian under nearly every post by Dana Nuccitelli, regardless of content of his posts. People talked about it endlessly. You obviously missed all this.

            That this special magic period of time that you will only accept as being the official “Pause” with a capital P came into being, that has to start at 1998, is I guess due to that being the period mentioned in the IPCC reports. But barry, it was all always about the same subject…people looking for periods of time over which the warming rate slowed down, or “stopped”. Just because some of these periods started in ‘95, or ‘96, or ‘93 or whatever does not invalidate them as being a discussion of the pause! Even in the Monckton link I previously gave, he mentions the NYT accusing skeptics of cherry-picking 1998 due to the El Niño…it’s all the same subject!

            A lot of skeptics did realize that “the pause” wasn’t statistically significant due to the short time period and noisy datasets, and this is kind of why I’m bringing up the longer periods with no statistical significance now!

            I understand your criteria for why the 1940-1970 trend represents a “statistically different” change in the rate of warming, yes. Do you understand why I think it’s a bit unreasonable to wait an additional 30 years (so potentially 35 years from now, in total) just to see if the uncertainty ranges overlap? Do you understand why I think it would be meaningful if, in a few years time, we were to get the first ever 30-year period of no statistically significant warming in the UAH data, regardless of your criteria?

            Otherwise we’re just endlessly talking past each other. You’re looking to make your points, over and over again, and I’m just trying to make my straightforward point and try to correct you on this erroneous idea you have that skeptics “discovered” statistical significance in February 2016.

          • barry says:

            “A lot of skeptics did realize that “the pause” wasnt statistically significant due to the short time period and noisy datasets”

            Well all I can say is: “Where were you?!” Prior to about 2015 I was widely involved in the climate debates, and visiting a few of the contrarian websites fairly regularly, particularly WUWT. I never saw any skeptic writing off “the pause” as being statistically non-significant. Did it irk you that the rest of the skeptic world didn’t get it?

            Is there a link to that conversation happening? What you’ve linked so far isn’t skeptics saying that the pause is not a pause because of statistical non-significance. I would be amazed to see skeptics who think like you setting the record straight at WUWT, for example. Because that’s where I was trying to explain it to universal deafness.

            “Do you understand why I think its a bit unreasonable to wait an additional 30 years (so potentially 35 years from now, in total) just to see if the uncertainty ranges overlap?”

            All we need is 2 successive periods, each more than several years, where the trend uncertainties don’t overlap. Make 1994 the beginning of the second period if you like, though it will be problematic with the uncertainty range of the prior period if you restrict yourself to the relatively short satellite temp record.

            Stat sig does not care what anyone finds “reasonable.” Either you adhere to the rigour of statistical significance or you don’t.

            BTW, the current uncertainty range for the UAH6.0 global tropospheric temperature trend since 1994 is -0.002 to 0.220 C/decade. Lubos would put that as highly unlikely there is a flat trend, and hugely likely there is a positive trend.

            “Do you understand why I think it would be meaningful if, in a few years time, we were to get the first ever 30-year period of no statistically significant warming in the UAH data, regardless of your criteria?”

            I know why I think you think it would be meaningful (going off your first comment here), and our conversation has been about that. For me, statistical significance is purely about the relationship between a trend and the variability of the data the yield the trend. For you, it seems to mean something else – ie, that there would by then have been little or no warming, or, as you say in your comment there, even cooling. My view is that you are making use of whatever you can to promote “no warming.” Hence, my critique of over-interpreting (the failing of) statistical significance.

            But perhaps you could explain directly and clearly why you think 30 years of a statistically non-significant trend would be meaningful, so that I don’t misjudge your thoughts.

          • barry says:

            One of the latter paras was ill-considered (and typoed). Rethinking and amending:

            I know why I think you think it would be meaningful (going off your first comment here). For me, statistical significance is about the relationship between a trend and the variability of the data that yield the trend. It has a limited, and very useful function. For you, it seems to mean something else; that is says something about a trend of lack of one ie, that there would by then have been little or no warming, or, as you say in your comment there, even cooling. My view is that you wish to promote “no warming,” and are impinging on the limits of the function discussed, hence my comments of over-interpreting (the failing of) statistical significance.

          • Dr Roys Emergency Moderation Team says:

            “I never saw any skeptic writing off “the pause” as being statistically non-significant. Did it irk you that the rest of the skeptic world didn’t get it?”

            I didn’t say skeptics wrote it off. I said there were skeptics who understood the period (typically 15 years at the time) wasn’t long enough for a statistically significant trend to be detected. That’s why they went for longer trends, starting before 1998. Actually it was for two reasons, the second was to avoid accusations of cherry-picking the El Nio year.

            “For you, it seems to mean something else; that is says something about a trend of lack of one ie, that there would by then have been little or no warming, or, as you say in your comment there, even cooling.”

            You are the king of putting words in other people’s mouths. I didn’t say there would be cooling over the potential 30-year period. I said that since the uncertainty would be lower for a 30-year period, the trend itself would have to decrease. So if we got a 30-year trend lacking statistical significance in the next five years, or especially if it arose before the next five years, that would prove that cooling had occurred…over that five-year (or less) period. Not over the 30-year period.

          • barry says:

            I’m also the king of asking people to clarify what they mean. As I did in the last post. Again. You are the king of concealing his hand. Here is the last line from the long post, again, inviting you to set the record straight.

            “But perhaps you could explain directly and clearly why you think 30 years of a statistically non-significant trend would be meaningful, so that I dont misjudge your thoughts.”

            Let’s go…

          • Dr Roys Emergency Moderation Team says:

            “But perhaps you could explain directly and clearly why you think 30 years of a statistically non-significant trend would be meaningful, so that I don’t misjudge your thoughts.”

            Because, as you said, the uncertainty is pretty stable in the UAH data. So it would represent the first time that a 30-year trend line had dipped below the level of the noise. With 30 years worth of data you really should be able to detect a trend. Are you familiar with this paper?

            https://agupubs.onlinelibrary.wiley.com/doi/full/10.1029/2011JD016263

          • Dr Roys Emergency Moderation Team says:

            Spooky timing…

          • barry says:

            You still haven’t explained why you think this would be meaningful. What are you trying to say?

          • Dr Roys Emergency Moderation Team says:

            OK, barry.

          • barry says:

            For once we’re having a conversation and you won’t explicitly explain your view when asked. You’ve said that a non statistically significant trend for 30 years hasn’t happened before (it has), and that this would be ‘meaningful.’ I ask you why it would be meaningful, and you do not say. Umpteen comments down and in reply to another invitation to explain, you ask me if I’ve read a paper. Why won’t you just lay it out instead of hedging?

            This is the conclusion of the paper.

            “In summary, because of the effects of natural internal climate variability, we do not expect each year to be inexorably warmer than the preceding year, or each decade to be warmer than the last decade, even in the presence of strong anthropogenic forcing of the climate system. The clear message from our signal‐to‐noise analysis is that multi‐decadal records are required for identifying human effects on tropospheric temperature. Minimal warming over a single decade does not disprove the existence of a slowly‐evolving anthropogenic warming signal.”

            Rather than have me guess yet again what you mean, only to have you tell me I’m putting words in your mouth, will you, for Pete’s sake, just say it simply.

          • barry says:

            I felt like this was one of the few conversations here that was actually progressing even if only a bit, so thanks for that, whatever else happens next.

          • Dr Roys Emergency Moderation Team says:

            “You’ve said that a non statistically significant trend for 30 years hasn’t happened before (it has), and that this would be ‘meaningful.’

            I meant it hasn’t happened before in the UAH data, running from 1979. Yes there was a 30-year trend that was not statistically significant back in 1940-1970, in other datasets. That turned out to be a 30-year period you were happy to consider meaningful. You don’t have to repeat why, and how that’s different. Just clarifying.

            “This is the conclusion of the paper.”

            And this is from the abstract:

            “Our results show that temperature records of at least 17 years in length are required for identifying human effects on global‐mean tropospheric temperature.”

            As I said:

            “With 30 years worth of data you really should be able to detect a trend.”

            There should be more than enough time in 30 years for an anthropogenic warming signal to emerge from the noise. No statistically significant trend over a 30-year period should be surprising, first of all. You’re acting like it would mean nothing at all. See in the paper for how much they’ve calculated the signal to noise ratio changes from 10-year periods compared to their 32-year periods.

            If we got to the point over the next five years (and even more so if it happened sooner) that we had our first 30-year period in the UAH data lacking statistical significance, that would be evidence that the long term multi-decadal warming trend is slowing down (not stopping, not necessarily a “pause”, but slowing). This is because, as you said, the uncertainty is pretty stable in the UAH data, and all preceding 30-year periods have statistical significance. So it would represent the first time (in the UAH data) that a 30-year trend line had dipped below the level of the noise. It would also prove cooling had occurred over the next five years or so. I’m having to repeat myself a lot.

            Sorry, I assumed the point I was making was obvious.

          • barry says:

            Ok, this was a clear answer, thanks. It wasn’t previously clear to me from our to and fro.

            “If we got to the point over the next five years (and even more so if it happened sooner) that we had our first 30-year period in the UAH data lacking statistical significance, that would be evidence that the long term multi-decadal warming trend is slowing down (not stopping, not necessarily a “pause”, but slowing).”

            I’m going to base my answer on statistical significance, because that is what we seem to have agreed is a valid component of trend analysis.

            The first statistically significant trend in the UAH 6.0 data (annual averages) is 1979 to 2002. The trend is 0.139 (+/- 0.136) C/decade.

            That is a range of 0.003 to 0.275 C/decade.

            Let’s say the 30 years from 2002 work out to -0.010 (+/1 0.091) C/decade.

            That is a negative, non-statistically significant trend. But the uncertainty overlaps with the previous positive trend which is statistically significant. So we can’t say that the two trends are statistically distinct. The latter trend could still be positive, and it could still reflect the actual (as with a God’s eye view) trend.

            I wouldn’t say there was a ‘pause’, because I do not think the mean trend is the trend. I think the trend is contained within a range (to 95% confidence limits). I never thought the prior trend was exactly 0.139 C/decade to begin with. I always thought – and I believe properly skeptical researchers think – that the trend is not a specific value, but a range.

            “This is because, as you said, the uncertainty is pretty stable in the UAH data, and all preceding 30-year periods have statistical significance. So it would represent the first time (in the UAH data) that a 30-year trend line had dipped below the level of the noise. It would also prove cooling had occurred over the next five years or so.”

            The uncertainty for a 5 year trend in UAH 6.0 data is huge. It’s near 1 degree Celsius uncertainty per decade. Certainly you can say that the data have been cool relative to the trend line, but you can’t say much about a ‘trend’, unless you are using the term much more loosely than a formal statistical definition of such.

            If there was a 30-year stall in global warming, or a cooling of 30 years, then that would be a significant challenge to the notion of AGW, I believe.

            But an analysis that restricted itself to a single data set, from a single source, and ignored data sets for other global metrics…

            That would be a cherry-picked result, not a comprehensive analysis. I would include ocean heat content, global sea ice, global land ice, global surface data sets.

            A non skeptical approach would seek only the data set that gave the answer one wanted, and then discarded everything else.

            I expect I’ll be here for the next few years, so we will see what happens regarding UAH6.0 TLT temps.

          • barry says:

            On Santer’s paper.

            I only ever see ‘skeptics’ (sorry) mention the 17 years in the abstract, never the ‘multidecadal’ period in the conclusions. I never see ‘skeptics’ wondering what “at least” means in the abstract WRT the 17 year period.

            Do skeptics care about whether the science is sound in this paper? Or is it a handy “benchmark” from the mainstreamer side, with a semi-well-known author, to use as a cudgel against the mainstream? I think the latter. I don’t think that ‘skeptics’ care about whether the paper is good or not. It’s a foil to wield in the debate. But please – do correct me if you think differently about it. Do you think Santer et al did great science in the paper?:

          • Dr Roys Emergency Moderation Team says:

            You are simply not grasping what I am explaining to you, and I am not sure I have the patience to continue.

          • Dr Roys Emergency Moderation Team says:

            I will try to correct you on just this one minor point. If you agree, the discussion can continue. If not, I don’t see the point in continuing. Any reasonable person would have conceded this point several comments ago.

            “The uncertainty for a 5 year trend in UAH 6.0 data is huge. It’s near 1 degree Celsius uncertainty per decade. Certainly you can say that the data have been cool relative to the trend line, but you can’t say much about a ‘trend’, unless you are using the term much more loosely than a formal statistical definition of such.”

            Deep sigh of impatience. No. I am not talking about a trend over five years, with associated uncertainty. I’m aware the uncertainty is huge. This is the other thing I’m finding incredibly frustrating, you keep telling me things I already know, as if I don’t.

            I’ll repeat what I explained earlier:

            “Also, as the uncertainty would be less than +/-0.116, with a 30 year trend (given that it is 0.116 for a 25 year trend), in order for a 30-year trend to still lack statistical significance would require some cooling between now and five years time. The trend itself would have to be lower. In fact, it would conclusively show that there had been cooling over those years.”

            Which you echoed with your later comment:

            “Uncertainy is pretty stable in the UAH data at about +/-0.090 for 30-year periods (you can test other 30-year periods), so a 30-year trend would have to dip below that figure to get statistical non-significance.”

            In order for a 30-year trend to “dip below that figure to get statistical non-significance”, there would have to be cooling between now and five years time. In order for the trend to decrease, there would have to be cooling.

            The appearance of a 30-year trend lacking statistical significance, in five years time (and especially so if it occurs before five years time) would conclusively prove that cooling had occurred over those years (over that five-year or less period).

            This shouldn’t even need to be argued so hard. This should have just been, “well yes, of course”, about ten comments ago. If you can concede this point, then I can move on to discussing the rest of your reply, but I’m not moving on unless and until it’s agreed.

          • barry says:

            I totally agree that the mean trend would have to be lower in 5 years time (or less) in order for the trend to remain statistically non-significant.

            Our disagreement may boil down to terminology. If you use the term “cooling” or “warming”, I immediately think you are referring to a background trend, because those words infer a continuum – a trend

            You have stated clearly that you are not confusing an isolated 5-year period with a meaningful trend. However, you do say that if in 5 or so years time the 30-year trend still lacked statistical significance it “would conclusively prove that cooling had occurred over those years (over that five-year or less period)“.

            I can’t agree with that. I can agree that we would have definitely had some anomalies that were cooler than the prior trend (from 1994 to today). If that is what you mean, then we have no argument.

            I’m putting some numbers on this:

            Trend 1994 to now: 0.109 (+/- 0.111) C/decade
            Trend 1994 to 2023: 0.089 (+/- 0.091) C/decade

            The prior trend already included the possibility of a cooling trend (-0.002 C/decade) according to statistical significance at the 95% level.

            The 30-year trend has exactly the same lower bound, the mean trend is well within the range of each, and has a lower higher bound.

            This is what makes me ask “Cooling relative to what?” Because the only “conclusive” thing I see is a lower upper bound.

            I’m not trying to be difficult. We either see things differently, or we use different terminology to say the same thing. I’m genuinely interested to find out which.

          • barry says:

            Dunno why that last bit is in bold, but I closed the tag here just in case.

          • Dr Roys Emergency Moderation Team says:

            “I can’t agree with that.”

            Then the discussion is over. There’s just no reasoning with you.

          • Nate says:

            ‘I cant agree with that.’

            ‘Then the discussion is over. Theres just no reasoning with you.’

            IF you can’t even have a discussion with our most patient poster, without getting offended cuz they don’t agree with you, then you might as well go home, DREMT.

          • barry says:

            How about you agree with this?

            “The mean trend would be lower if the anomalies in the last 5 years tended to be cooler than the prior trend (from 1994).”

            Using the terms “cooling” or “warming” implies a trend – a continuous direction. How about you refrain from using those terms for short time-periods with no statistical significance and we continue? Because that is the only sticking point left.

            But if you really need to use those terms in that context, then we talk about it some more to see if better understanding comes. Like reasonable people.

          • Dr Roys Emergency Moderation Team says:

            barry, you simply can’t be reasoned with.

            If you had a linear trend from 1994 until today that was calculated to be 0.109 C/decade, and then in five years time you had a linear trend that was calculated, in the exact same way, to be 0.089 C/decade, starting from the exact same point in time, 1994, you have three choices of what has happened over those five years in order to alter that trend:

            a) it cooled.
            b) it stayed the same temperature.
            c) it warmed.

            Basic logic dictates that the answer has to be a).

            The trouble is, you won’t listen to reason, and you also seem to use statistics as something to hide behind. A great example of the latter is here:

            “Let’s say the 30 years from 2002 work out to -0.010 (+/1 0.091) C/decade.

            That is a negative, non-statistically significant trend. But the uncertainty overlaps with the previous positive trend which is statistically significant. So we can’t say that the two trends are statistically distinct. The latter trend could still be positive, and it could still reflect the actual (as with a God’s eye view) trend.”

            You are talking about a hypothetical scenario where a 30-year period has developed in the UAH data over which the trend can be calculated as a flat line, or even slightly negative – and you are showing quite clearly that even if this happened, you would find a way to reject it as being anything meaningful! Rather than think that maybe your method of determining whether trends are “statistically distinct” from one another might be somewhat unrealistic, particularly when applied to the UAH dataset (with it being so noisy), you’re happy to stick with it, rather than try something else.

            You say:

            “If there was a 30-year stall in global warming, or a cooling of 30 years, then that would be a significant challenge to the notion of AGW, I believe.”

            Right, but how would anyone get you to accept that there had been a 30-year stall in global warming!?

            I was trying talking to you about how, out of the successive 30-year periods in the UAH data, i.e 1979-2008, 1980-2009, 1981-2010, and so on, there has never been a 30-year period that lacks statistical significance, and if in a few years we got to out first ever such period, that would suggest a slow-down in the multi-decadal warming rate. Just a slow-down, not even a hiatus/pause. But you wouldn’t even accept that!

          • Dr Roys Emergency Moderation Team says:

            Actually, full disclosure…I originally checked the periods 1979-2009, 1980-2010, 1981-2011, etc. I guess these would in fact be 31-year periods…and my original claim about the 25-year trend should have been for a 26-year trend. I didn’t notice until I saw you describe the period 1994-2023 as a 30-year trend. There may be a 30-year period lacking statistical significance already, then, but I know there isn’t a 31-year period. If there was a 30-year period I’m guessing it could only be the one leading up to the 2016 bumper El Niño year.

          • barry says:

            It’s not that I can’t be reasoned with. It is that I think you are quite wrong. It becomes clearer in your last post.

            “If you had a linear trend from 1994 until today that was calculated to be 0.109 C/decade, and then in five years time you had a linear trend that was calculated, in the exact same way, to be 0.089 C/decade, starting from the exact same point in time, 1994, you have three choices of what has happened over those five years in order to alter that trend:

            a) it cooled.
            b) it stayed the same temperature.
            c) it warmed.”

            No! You are here talking exclusively about the mean trends and completely ignoring the uncertainty. You have just jettisoned the statistical significance that is a key component of your argument.

            You have, in fact, just done what Monckton and his followers at WUWT did when saying ‘the pause is over’. They were ignoring the uncertainty and focusing exclusively on the mean trend.

            I thought we had agreed that if there is no statistical significance, you can’t say anything about any trend/flatline.

            You make use of statistical uncertainty to say ‘no evidence of trend’, which is “meaningful,” but then ignore statistical uncertainty and use mean trends exclusively to claim cooling. This is patently inconsistent. Particularly when the compared trends both fail statistical significance.

          • Dr Roys Emergency Moderation Team says:

            “No! You are here talking exclusively about the mean trends and completely ignoring the uncertainty. You have just jettisoned the statistical significance that is a key component of your argument.

            You have, in fact, just done what Monckton and his followers at WUWT did when saying ‘the pause is over’. They were ignoring the uncertainty and focusing exclusively on the mean trend.”

            Incorrect, barry. It’s just that the uncertainty isn’t relevant to the point being made in that one minor side-point about the five years (or less) that might follow. If the calculated trend is less, five years from now, when measuring from the same start point, cooling must have occurred over those five years.

            This is not an argument that “Monckton and his followers at WUWT” have made before, as far as I’m aware…

            …but it’s just a little side issue. Nothing to get all worked up about.

          • barry says:

            “I didn’t notice until I saw you describe the period 1994-2023 as a 30-year trend”

            Yes, there are two different ways to do this, and I went with the more informal. I meant Jan 1994 to Dec 2023. That’s 360 months – 30 years.

            It is often written 1994 to 2024. If you plug those dates in the SkS trend calculator, you get a trend line from Jan 1994 to Dec 2023.

            I could have made a note about that early on. My penance is to work out the longest statistically non-significant trends for UAH6.0 starting from 1979 for each year. I’ll continue using the final year inclusive (up to December that year) notation. This is one year shy of how it is input at the SkS trend calculator.

            1979 to 2000 = 22 years
            1980 to 2002 = 23 years
            1981 to 2000 = 20 years
            1982 to 1999 = 18 years
            1983 to 2002 = 20 years
            1984 to 2002 = 19 years
            1985 to 2002 = 18 years
            1986 to 2005 = 20 years
            1987 to 2016 = 30 years
            1988 to 2015 = 28 years
            1989 to 2015 = 27 years
            1990 to 2016 = 27 years
            1991 to 2016 = 26 years
            1992 to 2016 = 25 years
            1993 to 2017 = 25 years

            Every year since has had a non statistically significant trend to present (September 2019). Except for the trend from 1999.

            So we already have 1987 to 2016 as a 30 year trend that fails statistical significance.

            Here’s what the trend looks like in context with the full monthly data:

            http://www.woodfortrees.org/plot/uah6/plot/uah6/from:1987/to:2017/trend

            Do you think this 30-year non-statistically significant period is meaningful? If so, how?

          • Dr Roys Emergency Moderation Team says:

            “Do you think this 30-year non-statistically significant period is meaningful? If so, how?”

            Absolutely. Glad you asked. If you run successive 30 year periods from 1979 onwards, advancing a year each time, you will notice (along with the steady values for the uncertainty) that the (statistically significant) trend values start to dip as you approach 1987-2016. By the time you get to 1987-2016, you have that 30-year non-statistically significant period. So the multi-decadal trend has finally dipped below the level of that steady background noise (but only just).

            By 1988-2017, the trend is statistically significant again. If you look at the data itself, which the Skeptical Science trend calculator handily puts in the background, you will notice that the major spike due to the El Niño appears in the 1988-2017 data, and not in the period 1987-2016. That spike is the reason that the trend has risen back above the level of the noise.

            So, if in five years time (or less) we return to a 30-year non-statistically significant period, and/or have our first ever 31-year non-statistically significant period, that will be evidence of that slowdown in warming over multi-decadal periods that I was talking about.

            Then, if, over further time, we see the 30-year trend continue to decrease, eventually reaching that flat or even slightly negative trend line that you mentioned previously, that would be further evidence of a slow-down. It would also be time to test that 30-year period to see if it represented a stall in warming. What test would you accept?

          • barry says:

            You are hoping to see a statistically non significant trend for 30 years, or longer, or even a statistically non-significant negative trend over 30 years or more?

            Would you be as interested in a statistically significant positive trend that was warmer than the mean projections? Somehow I think that this would not interest you. As always, correct me if I’m wrong.

            “What test would you accept?”

            One that did not rely on a single data set of a single, thin slice of the entire climate system.

            I would look at ALL the data sets for global temps, satellite and surface.

            I would look at ocean heat content – a metric that Roger Pielke Snr (skeptic camp) considers the most important. I tend to agree with this.

            I would examine sea level for the same period.

            I might include global sea ice.

            Possibly global glaciers and ice sheets.

            With a broader look at the climate system, I might get a clearer picture on whether it was warming or not.

            Would you be interested in a broader look? If not, why not?

  5. ren says:

    Sudden stratospheric warming in the south will lead to a drop in global temperature. La Nina is on her way.
    http://ds.data.jma.go.jp/tcc/tcc/products/clisys/STRAT/gif/pole10_sh.gif

    • Roy W. Spencer says:

      Ren, Please stop making off-topic comments.

      • Bindidon says:

        Dear Mr Spencer,

        I perfectly understand your reaction.

        I’m afraid you won’t stop ren until you decide to get him off the blog.

        But that would be a really harsh, unjust decision when you compare his OT comments with the incredible amount of trash produced by some other commenters I certainly don’t need to name.

        And to be quite clear, this permanent, redundant nonsense a la ‘Bindidon, please stop trolling’ is really the most harmless of all.

        Best regards from near Berlin
        J.-P. D.

        • Dr Roys Emergency Moderation Team says:

          More pompous blah-blah from this website’s most ignorant and pretentious boaster. Never and never would you dare to try such insulting nonsense over at WUWT and Climate Etc. You would be banned from commenting within a day…

          …that’s about all that you normally say, isn’t it?

      • Gordon Robertson says:

        Roy…”Ren, Please stop making off-topic comments”.

        Please confirm that someone has not hijacked your name. Does not sound like you.

        • barry says:

          Roy has never said his blog was a free-for-all, but he has been seen to prefer on-topic conversation. He has banned people for repeatedly posting their hobby-horses, and that is consistent with warning ren, who rarely posts on topic, and keeps posting his/her favourite hobby horses.

          I would be glad of a more disciplined discussion here.

          • Bindidon says:

            barry

            100 % agreed.

          • Dr Roys Emergency Moderation Team says:

            Yes, it’s a good job neither of you guys post you own favorite hobby horses.

          • barry says:

            Are you being sarcastic?

            Pray, tell me what my favourite hobby horse is. I’m keen to learn.

          • Dr Roys Emergency Moderation Team says:

            Let’s see:

            “Trends”
            Over-analysis of climate data
            Defending NOAA
            Tarring all skeptics (or ‘skeptics’ as you usually put it) with the same brush

            Just a few off the top of my head.

          • barry says:

            “Trends”

            I talk about that when the latest anomaly comes out, based on previous and ongoing ‘skeptic’ interest in a return of the ‘pause’. Salvatore was usually the instigator; mpainter, too when he was here. And other ‘skeptics’ hoping for that flat line to come back. It’s not off-topic – it’s an ongoing topic.

            I also respond to that topic if others bring it up.

            “Over-analysis of climate data”

            Disagree. I’m currently having a discussion about being careful NOT to over-analyse climate data.

            “Defending NOAA”

            I never introduce that topic. Bashing NOAA is Gordon’s hobby-horse.

            “Tarring all skeptics (or ‘skeptics’ as you usually put it) with the same brush”

            I’m inclined to agree with that one.

          • Dr Roys Emergency Moderation Team says:

            So you have your own favorite hobby-horse.

    • Scott R says:

      Agreed ren. Today the downtrend was confirmed once again with the Nino 3.4 and 1+2 hitting fresh lows at the same time. The global ocean lags and only reflects ENSO thru July 26th or so I think. The big aug drop for the 3.4 region is coming up shortly for the globe.

      ren do you think that the AMO is a 5th harmonic for the GSM? If so, the amplitude of the change on the NA from the GSM will be absolutely huge, which could kill the gulf stream and do serious damage to agriculture in Europe in short time.

      Sorry Dr Spencer about it being off-topic.

  6. Tim Folkerts says:

    Arthur C Clarke famously created 3 tongue-in-cheek “Laws”. Clarke’s 3rd Law is the best known:

    Any sufficiently advanced technology is indistinguishable from magic.

    Less famous is his 1st Law:

    When a distinguished but elderly scientist states that something is possible, he is almost certainly right. When he states that something is impossible, he is very probably wrong.

    In this case, our favorite ‘distinguished but elderly’ scientist, Dr Spencer, is claiming that it is possible for models to make reasonably accurate projections even with significant uncertainties in some of the inputs, and that small changes in CO2 forcing do not get lost in the noise. The fact that models do not go wildly out of control in a few years suggests that such a claim is correct.

    • Dr Roys Emergency Moderation Team says:

      Dim Folk-wit, please stop trolling.

    • Chic Bowdrie says:

      Tim,

      Your logic seems false to me. While “it is possible for models to make reasonably accurate projections even with significant uncertainties in some of the inputs” (by coincidence perhaps), there is no definitive evidence that CO2 has any significant effect on global temperature. Take away the CO2 forcing and tune the models again. Couldn’t they do better than now?

      • bdgwx says:

        When CO2 forcing is removed from models the fit to observations gets worse.

        • Chic Bowdrie says:

          Are you basing your assertion on personal experience or first hand knowledge of what was done? Even so, can you guarantee that what was done eliminated all possible parameter contributions? Furthermore if all were included, isn’t it possible that the model is still flawed and the best fit does not necessarily reflect reality? It seems the models are far enough off to suggest somethings wrong.

          • bdgwx says:

            Absolutely. Models that include all climate forcing agents still have flaws and are wrong in the sense that they still do not match reality perfectly. And no matter how much progress is made they will always have flaws and suffer from some degree of wrongness. And although the wrongness can never be completely eliminated it can be reduced as new information and better understanding is incorporated in the model.

          • bill hunter says:

            “Even so, can you guarantee that what was done eliminated all possible parameter contributions?”

            Exactly. . . .what beyond simply forcing assumptions do we have. We have error in initial conditions, failure to determine if all relevant physics has been employed, failure to determine that all physics employed is both necessary and sufficient. (like installing a moon rotation specification on the axis of the moon and only discovering a problem when trying to install a moon orbit rotation specification on the center of gravity of the earth moon).

            Like we see coming out science where tree rings are determined as a absolute proxy for temperature (except of course when it goes the wrong way then you hide it).

          • bill hunter says:

            bdgwx says: And no matter how much progress is made they will always have flaws and suffer from some degree of wrongness. And although the wrongness can never be completely eliminated it can be reduced as new information and better understanding is incorporated in the model.
            ====================
            Yea I recall a scientists that said something stupid like that a long time ago in an entirely different area. Its mostly related to the flipside of Tim Folkerts comment:

            When a young, inexperienced, and stupid scientist states that something is possible, he is likely wrong.

            When he states that something is impossible, he also very probably wrong.

            The advantage and disadvantage of the young scientist is he not deterred from believing wild ideas. Occasionally one finds an acorn but the landscape is littered with failed ideas.

            Good story on this on Denier J Harlen Bretz over on WUWT https://wattsupwiththat.com/2019/09/14/washington-winery-releases-wine-called-the-denier/

            This is a story of a young geologist who for 70 years bucked the establishment, finally receiving recognition for his work.

            Of course he was a young scientist, and not an inexperienced one or a stupid one. He did his homework in the field to create his theory and gained so much experience from the field work he was convinced he was right. Turns out he was.

            So indeed experience helps, always has, always will.

  7. Dr. Max Dupilka says:

    Dr. Spencer, I have tried to follow most of the discussions here and on WUWT, and I read through Dr Frank’s paper. I was confused by his reasoning. You have provided very clear and concise explanations which I appreciate. Your pot analogy helps me understand the situation much better. I am not a novice in the field as I have a PhD in atmospheric science and do modeling work and research in boundary layer turbulence.
    One question. I believe you have mentioned that the climate models assume climate equilibrium when all the various adjustments/tweaking is done to achieve energy balance. If the climate, like the pot, was not in equilibrium this could have a significant effect on the end results could it not?

    Thanks again for all of you explanations. I have come to understand the basics of climate models much better.

  8. Eben says:

    I do not believe the ” Stove Top Analogy” is valid at all
    At any one time Only a smaller part of the earth surface is receiving the excess energy while the rest is getting rid of it
    The heat is distributed from hotter regions to cooler ones by air and water circulations.
    The CO2 can absorb infrared radiation from the surface if the surface is warmer but CO2 being an IR absorber is just as good IR emitter , meaning if the ground below is cooler below the CO2 speeds up cooling of the air above.
    No blanket or cover works this way so The analogy of cover over the pot on the stove is wrong.
    Or any other claim of CO2 being a form of a blanket

    • Bindidon says:

      Eben

      What are you telling us here?

      “The CO2 can absorb infrared radiation from the surface if the surface is warmer…”

      Why should an IR absorbing substance be cooler than the emitting substance? You confound radiation with heat, which exclusively moves from warm to cold. Photons are not interested in whether the substances they reach are warmer or colder than those emitting them.

      Moreover, why are you talking about CO2 only? The biggest IR absorber near the surface is H2O. CO2’s absorp-tion role takes place far higher, at altitudes where H2O no longer stays in the atmosphere because it is a condensing gas.

      CO2 is a non-condensing gas, is evenly distributed, and exists at altitudes up to 50 km.

      The more CO2 you put into the atmosphere, the more IR will be intercepted and reemitted by this gas in all directions, instead of immediately reaching outer space.

      The higher the altitude at which the absorp-tion & reemission process takes place, the lower the temperature of the intercepting gas, and the lower the energy reaching outer space.

      This is a tiny amount of imbalance compared with all the IR passing unstopped thru the atmospheric window (8-12 micron), where no IR interception takes place.

      But those who REALLY pay attention to the increasing CO2 concentration usually have less the current situation in mind than that we might expect in 50 to 100 years.

      • bill hunter says:

        Bindidon says: Why should an IR absorbing substance be cooler than the emitting substance? You confound radiation with heat, which exclusively moves from warm to cold. Photons are not interested in whether the substances they reach are warmer or colder than those emitting them.
        =========================

        I always cringe when somebody brings this point up. Its nothing but a distraction. “Net radiation” would be the most appropriate interpretation of “radiation” because it does not matter one way or the other if photons emit in all directions or simply flow in a “netted” manner from warm objects to cold objects. You come up with exactly the same outcome.

        But bringing up the bidirectional flow there is always the implication of heat being added to warm object by that flow which of course completely false if you don’t account for the fact the “net” properly accounts for everything. By drawing all these unnecessary vectors in the sky it acts as nothing more than blatant effort to “bedazzle” the observer in believing what he is going to support next as being an incontrovertible fact.

        So from Roy’s earlier description of a forcing: “an imbalance between energy gain and energy loss by the system.
        This is basic 1st Law of Thermodynamics stuff.”

        That properly describes the role of greenhouse gases as a unique forcing agent. But lets not get ahead of ourselves and do something silly like declare that to be the equivalent of a “surface forcing”. The forcing that has incurred is a momentary imbalance between incoming energy and outgoing energy of the system that will need to be resolved. One can only legitimately come close to a concept of primary forcing on the surface in a single layer radiation model. But there is no single layer of absor*tion in any atmosphere. A single layer model is like a solid.

        Multiple layer models need to find some other way in describing the forcing. Of course many in climate science sort of blindly trudges down some kind of ultra simplicity path of lining up chains of molecules that sort of precisely line up all their individual forcings into trillions of big choo choo trains headed back to the surface with all feedbacks verboten by the guards escorting the trains until arriving back at surface.

        Of course all that is nonsense. Warming the system is but one result to consider. I mean what do gas molecules do with they absorb radiation? Increasing their kinetic energy is one possible result, another one might be an expansion of the atmosphere that counteracts that increase molecule kinetic energy.

        And of course the expansion of an atmosphere made up of radiating greenhouse gases is like an iris widening the pupil opening of an eye so more light will pass. And of course thats just a couple of many more issues in an atmosphere that has many other variable like water existing in all 3 phases within the troposphere.

        The way science has chosen to look at it is as described by Roy above. The forcing is occurring at the location of the greenhouse gas molecule. But the way its sold to the public (and that is not entirely the fault of the science community) the forcing is occurring at the surface.

      • Svante says:

        bill hunter says:
        “One can only legitimately come close to a concept of primary forcing on the surface in a single layer radiation model.”

        The forcing on Earth’s surface is actually less than one single layer, it’s overcooking at 5:50 here:
        https://www.youtube.com/watch?v=hUFOuoD3aHw

        • bill hunter says:

          Svante says: “One can only legitimately come close to a concept of primary forcing on the surface in a single layer radiation model.”

          The forcing on Earth’s surface is actually less than one single layer, it’s overcooking at 5:50 here:
          ===========================

          I think thats exactly what I was saying, Svante.

          But the multi-layered concept starts about 12:00 of your video where your fast talking scientists starts explaining what more greenhouse gases do.

          In the post you responded to I noted that warming an insitu uncontained gas cloud isn’t exactly straight forward. Energy is absorbed and what happens? Does the cloud adopt a higher temperature? or does the cloud expand? A contained gas increases its temperature and an uncontained gas expands.

          If it expands, the professor’s calculations for the lapse rate are wrong as he using the same k/km going through half a bigger gas cloud. Of course he elevated his pane of glass rather than expanded it and thickened it as the nonsense gets thicker.

          So you can virtually toss the nonsense that follows 12:00 of the video. Maybe something in there is salvagable I sort of quit watching at 16:00

          Its a similar issue seen in window technology. And handily your professor is using a window pane as an analogy.

          But maybe your professor sort of only got one chapter of learning on window technology, avoiding reading the all the other chapters.

          You see in window technology you get one credit for one pane of glass. The value of that credit doesn’t generally change as you move or thicken the pane of glass.

          If a cloud of gas expands the lapse rate changes because the halfway point rises higher in the sky.

          So this professor simply runs roughshod over the facts to build his case. Put a big red stamp of WRONG on it after 12:00.

          Now I realize that what is really happening is the cloud of greenhouse gases is both getting bigger and the outgoing view to space level perhaps upwards from 500mb. But equally, the IR view from the surface is moving down 500mb.

          When a glass pane thickens the mid point in the pane (or in the atmosphere) should be exactly half way between the temperature of the surface and the temperature of beyond (space). Insulation equations then step in and warms the warm side and cools the cold side of the glass in accordance with the equations of conductive resistance.

          G&T offered layers of gas molecules as a possibility to employ the conductive resistance substance equations to fill this gap in the problem.

          That would have been the place for climate science to lay out their theory in accordance with known physics. Instead they just took pot shots at G&T for having the temerity to point out the Emperor has no clothes.

          So what we have is the bottom IR view of the atmosphere being different than the top (Trenberth, bottom view=340.2w/m2, top view=199.8w/m2) if GHG were evenly distributed those two views would be equally distant from 500mb.

          But of course that condition isn’t met. And as a result the true level of forcing in the atmosphere isn’t known and thus the forcing on the surface of additional levels of CO2 is completely unknown.

          Now its easy to see a very large cloud of uncertainty to all this. All you need is a sufficient education in physics covering the basics of window technology.

          In fact all that Judith Curry complains about is uncertainty she was almost completely barred from participation as a result. A horrible, unjust, fascist-like, situation. So if you have to kill science to kill the fascists, I am all in. Science can be rebuilt. but this jew-baiting denier BS is out of F—— control. Anybody going along with any of that is part of the problem.

          So go back and reread the post you responded to. there is a lot of unsettled science in regards to climate science. All the claims of “settled science” I can assure with 100% confidence comes from either ignorant people being controlled by their subservience to authority or have interests other than science. And interests different than you too.

        • bill hunter says:

          Svante says:
          its overcooking at 5:50 here:
          https://www.youtube.com/watch?v=hUFOuoD3aHw

          ====================

          One more follow up comment. Did you notice that after 12:00 is the point in the video where the mathematics cease, and animations start animating and gradually starts morphing into and ever more dense series of Flash Gordon takeout clips? LMAO!!! At the very least the producer must have had a ball editing this one.

          • Svante says:

            I don’t know where to start.

            The lapse rate is mainly set by convection. The GHE will enhance it, but any increase in volume is offset by upper atmosphere cooling, as evidenced by reduced satellite drag, see fig. 2.13:
            https://tinyurl.com/y5ntf58g

            Radiation still has to get past the same number of GHG molecules, and the atmosphere is thin compared to the globe, so the TOA area change is negligible.

            The video is good after 12:00, you should really try to understand the concept of ERL and the photosphere. That and the lapse rate is really all you need.

            The mathematics is in MODTRAN by the way.

          • bill hunter says:

            Svante says:——— I don’t know where to start. The lapse rate is mainly set by convection. The GHE will enhance it, but any increase in volume is offset by upper atmosphere cooling—–
            ===================
            That’s a good place to start.

            Explain what you mean.
            How does the GHE enhance the lapse rate?
            How is an increase in volume offset? do you mean the volume never changes?

            All I had said was whatever energy the atmosphere absorbs is manifested as a volume change. As it can’t manifest as an increased atmosphere temperature because that would increase pressure so it expands (does work) rather than heats. So I am not sure what you mean by “offset”.

          • Svante says:

            Thanks for keeping your reply focused.

            “How does the GHE enhance the lapse rate?”

            It’s like an obstacle in a river, higher before and lower after. The upper atmosphere is cooling.

            “How is an increase in volume offset? do you mean the volume never changes?”

            The upper atmosphere is cooling, the total volume is going down, and so is satellite drag.

            “All I had said was whatever energy the atmosphere absorbs is manifested as a volume change.”

            You haven’t quantified that, if you do you will find it’s negligible. Radiation influence is small in the troposphere, convection and latent heat are far greater.

            “As it can’t manifest as an increased atmosphere temperature because that would increase pressure so it expands (does work) rather than heats.”

            You discarded the video too quickly, the key point is at 13:35. The lapse rate curve must start at a higher temperature in order to push the same energy to the top.

          • bill hunter says:

            Svante says:———
            Thanks for keeping your reply focused.
            How does the GHE enhance the lapse rate?
            Its like an obstacle in a river, higher before and lower after. The upper atmosphere is cooling.
            ——————
            An obstacle to the lapse rate? I get that a opaque cloud is an obstacle to radiation passing through the cloud but thats not what you said. I don’t understand what you are trying to say.

            +++++++++++++++++++
            Svante says:———
            How is an increase in volume offset? do you mean the volume never changes?

            The upper atmosphere is cooling, the total volume is going down, and so is satellite drag.
            ——————

            Opaque clouds of gases are always cooling. Please be more specific.

            +++++++++++++++++++
            Svante says:———
            All I had said was whatever energy the atmosphere absorbs is manifested as a volume change.

            You havent quantified that, if you do you will find its negligible. Radiation influence is small in the troposphere, convection and latent heat are far greater.

            ——————
            You believe that radiation warms the atmosphere? Increases its pressure? That only occurs when a gas is in a container and volume cannot change.

            +++++++++++++++++++
            Svante says:———
            As it can’t manifest as an increased atmosphere temperature because that would increase pressure so it expands (does work) rather than heats.

            You discarded the video too quickly, the key point is at 13:35. The lapse rate curve must start at a higher temperature in order to push the same energy to the top.——————

            I said I didn’t watch past 16:00.

            So the theory states. But at 12:00 they had stopped writing any equations. That was G&T’s question. What equations and microphysical processes force a theorized change in the lapse rate start location? He says it and you believe it but you don’t apparently know why you believe it.

            And actually I watched the entire video within a couple of hours after saying I gave up a 16:00.

          • Svante says:

            bill hunter says:
            “An obstacle to the lapse rate?”
            No, to radiation en route to space.

            “I get that a opaque cloud is an obstacle to radiation passing through the cloud but thats not what you said.”

            It’s the same, GHGs stop radiation from going straight to space, they make the atmosphere opaque in IR, you can’t see space in those bands. That means reduced energy loss rate, because heat transfer depends on the T^4 temperature difference, and space is colder than the atmosphere.

            “How is an increase in volume offset? do you mean the volume never changes?”

            The upper atmosphere is cooling, the total volume is going down, and so is satellite drag.

            “Opaque clouds of gases are always cooling. Please be more specific.”

            I meant the decadal trend of reduced temperature in the upper atmosphere.

            “You believe that radiation warms the atmosphere?”
            It warms the lower atmosphere and cools the upper.

            “Increases its pressure?”
            No, the weight is the same so there is no change of surface pressure. Where did you get this volume idea from anyway? It’s pretty irrelevant.

            “But at 12:00 they had stopped writing any equations. That was G&Ts question. What equations and microphysical processes force a theorized change in the lapse rate start location? He says it and you believe it but you dont apparently know why you believe it.”

            It’s the same as before, input and output power must reach equilibrium. If the radiation budget runs a surplus visa-vi space then the inside must warm.

            The lapse rate is what it is, about 6.5 C/km, set by convection and latent heat mainly. If the effective radiating level (ERL: https://tinyurl.com/y22ajtjk) goes up then the surface must be at a higher temperature to restore the same temperature at the top. It must do that to balance the radiation budget visa-vi space, because radiation depends on temperature.

            See chapter 7.2 here:
            https://tinyurl.com/jzqdr4o

            “And actually I watched the entire video within a couple of hours after saying I gave up a 16:00.”

            It’s good that we can ground this discussion on that video, and not go off on a gish gallop.

          • bill hunter says:

            Svante says: ———How is an increase in volume offset? do you mean the volume never changes?

            The upper atmosphere is cooling, the total volume is going down, and so is satellite drag.

            Opaque clouds of gases are always cooling. Please be more specific.

            I meant the decadal trend of reduced temperature in the upper atmosphere.—————

            There is more than one way for the upper atmosphere to cool. Greenhouse gases is but one choice. At least you clarified you are talking about regular old variation in the atmosphere over multi-decadal and perhaps longer periods of time.

            ++++++++++++++++++++++++++++
            Svante says: ———
            You believe that radiation warms the atmosphere?
            It warms the lower atmosphere and cools the upper.

            Increases its pressure?
            No, the weight is the same so there is no change of surface pressure. Where did you get this volume idea from anyway? Its pretty irrelevant.
            —————

            That disconnect there is part of the essential contradiction seen in folks who believe in the Svante Arrhenius theory. Roy believes in it but its interesting that from a scientific detail point of view nobody knows why. That was the wall of silence that G&T faced.

            ++++++++++++++++++++++++++++
            Svante says: ———

            But at 12:00 they had stopped writing any equations. That was G&Ts question. What equations and microphysical processes force a theorized change in the lapse rate start location? He says it and you believe it but you dont apparently know why you believe it.

            Its the same as before, input and output power must reach equilibrium. If the radiation budget runs a surplus visa-vi space then the inside must warm.

            —————

            But you merely ass-u-me that additional greenhouse gases throw something out of equilibrium so as to make your first law declaration that it must be so.

            ++++++++++++++++++++++++++++
            Svante says: ———

            The lapse rate is what it is, about 6.5 C/km, set by convection and latent heat mainly. If the effective radiating level (ERL: https://tinyurl.com/y22ajtjk) goes up then the surface must be at a higher temperature to restore the same temperature at the top. It must do that to balance the radiation budget visa-vi space, because radiation depends on temperature.

            See chapter 7.2 here:
            https://tinyurl.com/jzqdr4o

            And actually I watched the entire video within a couple of hours after saying I gave up a 16:00.

            Its good that we can ground this discussion on that video, and not go off on a gish gallop.—————

            Uh. . . .hardly. Seems it is all a gish gallop. All the Pope’s scientist’s and a large portion of the interested public simply already rode lickety split out of the barn on a gish gallop. Today this gish gallop is so fully embedded in the mind of the typical scientist it looks like Ptolemy II.

            All I am is a skeptic/auditor/philosopher/amateur engineer trying to put the gish gallop that is out there all over the public domain all together like Humpty Dumpty since its apparent nobody in the mainstream is even trying. Its like Roy’s response to Gallopingcamel above. Its not a science response. Like the silence that confronted G&T. The edge of forest analogy is no evidence. Rain falling to the surface through the branches and leaves of a tree are delayed on the trip to the ground but that bottom most branch does nothing to slow the passing of the rain through all the branches above it. Heat moving up works the same way as rain coming down.

            In my amateur engineering work on various heating systems including radiant, heat is very difficult to stop it requires explicit structure that does not appear to exist in the atmosphere. Sure there are lots of way to slow heat going to space and the first layer is extremely important. I think you said it was one layer in a comment above, but while the fast talking scientist only describes one layer he discontinued talking about what the bottom of that layer does as he moved it up. What it was doing lower in the atmosphere was very relevant but moving it up makes it less relevant if you do that rather than start creating additional layers to keep the bottom layer in place.

            I see described this imaginary chain of orderly physical processes and finally reaching some magic unobstructed view at the edge of the forest and then a great leap out into space as the science description of the GHE.

            A few scientists like Lindzen seem to see beyond this gish gallop but have yet to find the answer, however, I suspect its not so darned orderly as mainstream science thinks it is.

            Physicists and most people love order thats why they lean toward it. At the moment that seems to be all, along with the gish gallop, that holds the whole thing together. An experiment is needed that doesn’t rely on a million half truths.

          • Svante says:

            bill hunter says:

            “There is more than one way for the upper atmosphere to cool. Greenhouse gases is but one choice.”

            There is only one way for Earth to cool, radiation.
            If it was from the surface it would be very cold.
            Only GHGs can do that in atmosphere.

            “Rain falling to the surface through the branches and leaves of a tree are delayed on the trip to the ground but that bottom most branch does nothing to slow the passing of the rain through all the branches above it. Heat moving up works the same way as rain coming down.”

            The radiation “rain” falls up and down in equal amounts.
            Now you can make an Excel sheet and repeat this layer by layer. Each layer gets input from above and below. Let’s say the surface emits 400 W/m^2:

            Layer: Down/In/Up
            0: 0/400/400
            1: 320/640/320
            2: 240/480/240
            3: 160/320/160
            4: 80/160/80

            Only 80 W/m^2 sent to space, pretty good insulation.

            “A few scientists like Lindzen seem to see beyond this gish gallop but have yet to find the answer, however, I suspect its not so darned orderly as mainstream science thinks it is.”

            Lindzen has an interesting argument, but you haven’t.
            Linzen and all sensible non-alarmists agree with this:
            1) There is a lapse rate (i.e. temps drop with altitude).
            2) GHGs make the atmosphere more opaque.
            3) Space sees a colder layer with less radiation.
            4) That means less output power.
            5) That means energy gain inside the sphere.

            You can have many interesting arguments about what happens next, but first you need to understand that.

          • bill hunter says:

            Svante says:———“There is more than one way for the upper atmosphere to cool. Greenhouse gases is but one choice.”

            There is only one way for Earth to cool, radiation.
            If it was from the surface it would be very cold.
            Only GHGs can do that in atmosphere.
            ———–

            Come on Svante don’t be stupid! Everything lets off some radiation Svante and some greenhouse gases are far more robust than others. Further you don’t need to be a greenhouse gas. Pure water radiates better than any gas. Also, you can cool the upper atmosphere by denying it heat. Change the albedo, increase clouds. You are employing tunnel vision here.

            +++++++++++++++++++++++++++
            Svante says:———
            “Rain falling to the surface through the branches and leaves of a tree are delayed on the trip to the ground but that bottom most branch does nothing to slow the passing of the rain through all the branches above it. Heat moving up works the same way as rain coming down.”

            The radiation “rain” falls up and down in equal amounts.
            Now you can make an Excel sheet and repeat this layer by layer. Each layer gets input from above and below. Let’s say the surface emits 400 W/m^2:

            Layer: Down/In/Up
            0: 0/400/400
            1: 320/640/320
            2: 240/480/240
            3: 160/320/160
            4: 80/160/80

            Only 80 W/m^2 sent to space, pretty good insulation.
            ———–

            But the atmosphere emits 200watts not 80. And not much of that 200 arrived at TOA via surface radiation. According to Trenberth less than 10% of that 200 watts had surface radiation as a source. And personally I think Trenberth’s figures are likely overstated because of understating other line items.

            Most arrived as a result of convecting sensible and latent heat.

            +++++++++++++++++++++++++++
            Svante says:———
            “A few scientists like Lindzen seem to see beyond this gish gallop but have yet to find the answer, however, I suspect its not so darned orderly as mainstream science thinks it is.”

            Lindzen has an interesting argument, but you haven’t.
            Linzen and all sensible non-alarmists agree with this:
            1) There is a lapse rate (i.e. temps drop with altitude).
            2) GHGs make the atmosphere more opaque.
            3) Space sees a colder layer with less radiation.
            4) That means less output power.
            5) That means energy gain inside the sphere.

            You can have many interesting arguments about what happens next, but first you need to understand that.———–

            Oh, I understand all that. Lindzen does too. We know from Modtran that there is a “energy gain inside the sphere”. But like rain falling on the tree. There is a lot more water suspended above the ground because of the tree. None of the rain in the tree slows rain falling from the cloud.

            Turn all that upside down because hot air is lighter and rises and all that greenhouse cold gas already up is like branches and leaves on a tree. The air still keeps going up and when it arrives in this colder zone its even more effective at releasing its heat because of the cold surrounds. It is not necessary to transfer this heat to the cold molecules the air parcel goes up with its own water vapor and CO2 already hot and will continue to rise until its not hot. You imagine this atmosphere with red dots stuck in one place like in your video. Indeed if the atmosphere was like that your theory would work. But its not. You just need to lubricate your thinking so you aren’t such a one track thinking and think of two things going on at one time.

          • Svante says:

            bill hunter says:

            “Everything lets off some radiation Svante and some greenhouse gases are far more robust than others.”

            Yes, and non GHGs radiate next to nothing.

            “Further you don’t need to be a greenhouse gas. Pure water radiates better than any gas.”
            Yes.

            “Also, you can cool the upper atmosphere by denying it heat. Change the albedo, increase clouds.”

            Yes, now you are approaching Lindzens argument, which is sensible. This effect is in addition to the enhanced GHG effect, you have to get the basics right first to avoid confusion.

            “But the atmosphere emits 200watts not 80.”

            It was a random example to make you understand. The effect is actually less than one layer because you have to repeat for each frequency and add for the whole spectrum, that’s what MODTRAN does. Some frequencies go straight to space.

            It’s much easier if you look at this from space. Which layer do you see and how cold is it?

            But sure you get the same result looking up, there’s a setting for that in the MODTRAN model.

            “And not much of that 200 arrived at TOA via surface radiation. According to Trenberth less than 10% of that 200 watts had surface radiation as a source. Most arrived as a result of convecting sensible and latent heat.”

            That’s right, it doesn’t matter how you get the heat to TOA.
            The important thing is the TOA temperature.

            “Oh, I understand all that. Lindzen does too. We know from Modtran that there is a “energy gain inside the sphere”. But like rain falling on the tree. There is a lot more water suspended above the ground because of the tree. None of the rain in the tree slows rain falling from the cloud.”

            You did not understand my layer example, this rain goes both up and down.
            Remember that heat is net energy flow.
            If you look at my (random) numbers again you will see that the heat flux (up minus down) is 80 W/m^2 all the way from the surface to the top.
            Without any layer you would have 400 W/m^2 straight from surface to space. See the difference?

            “You just need to lubricate your thinking so you aren’t such a one track thinking and think of two things going on at one time.”

            Your thinking is confused because you are all over the place. You should understand the basics before you throw in the Pope and Ptolemy II.

          • bill hunter says:

            Svante says:———
            Yes, now you are approaching Lindzens argument, which is sensible. This effect is in addition to the enhanced GHG effect, you have to get the basics right first to avoid confusion.

            Thats right, it doesnt matter how you get the heat to TOA.
            The important thing is the TOA temperature.

            Your thinking is confused because you are all over the place. You should understand the basics before you throw in the Pope and Ptolemy II.————–

            I agree Lindzen’s argument is sensible. He says scrap the whole climate model exercise. Both him and Happer are calling out the Ptolemaic scale corruption. People unfamiliar with systems think its just fine that science ought to call the shots for science. But like any ecological system you simply cannot have the foxes guarding the chicken coop. Trump’s got the guts (and lack of backdoor corruption) to allow him to cut programs that aren’t working and replace them with programs the might work. Like declaring San Francisco a Superfund site.

          • Svante says:

            I take it you understand the GHE now, congratulations!

            The problem with Lindzen’s iris theory is that it didn’t match reality.

            Trump is also at odds with reality, and he is a danger to the republican party, the US, and the free world.

          • bill hunter says:

            Svante says: ———I take it you understand the GHE now, congratulations!————–

            LOL! The results of monitoring incontrovertibly shows nobody understands the GHE now.

            ++++++++++++++++++++++
            Svante says: ———
            The problem with Lindzens iris theory is that it didnt match reality.
            ————–
            Not as I hear it.

            The bottom line Svante will prove out to be that while there is a physical basis for the concept of the greenhouse effect, the entire atmosphere constantly moves in response to perturbations.

            It is a sad state of affairs when the strongest appeal for dangerous global warming is coming out of the mouth of a child.

            +++++++++++++++++++++
            Svante says: ———
            Trump is also at odds with reality, and he is a danger to the republican party, the US, and the free world.
            ————–

            Just more irrational fear mongering on your part.

            Lindzen:
            ———Richard Lindzen: While mathematics is the language of the physical sciences, mathematics is not simply the use of arbitrary algorithms. This is currently pretty much the situation with climate modeling. Algorithms are used, but they do not represent valid solutions of underlying equations. The models lack the resolution to deal with fundamental aspects of nature some of which are insufficiently understood to even know what equations to use.————–

          • Svante says:

            Lindzen retired in 2013 but he is a genuine climate scientist with a solid base in physics.

            Here he is explaining the GHE and some of your better ideas:
            https://tinyurl.com/yyovo588

            Stick with him and stay clear of crazy stuff like no GHE and 2LOT violation.

          • bill hunter says:

            Who ever said there was no greenhouse effect?

            The question is and has always been the cause of the effect.

            Climate is poorly defined but clearly radiant surface temperatures are an element of climate. They are not the only element. And greenhouse gases are necessary for the radiating surface to hold a higher than expected mean temperature. Beyond that the military measurements of the extinction of light in the atmosphere is probably accurate enough to estimate how much additional energy the atmosphere will absorb with a doubling of CO2.

            After that it appears science crosses the line into a zone of the universe which should be called the Ptolemy Portal. Sure they have a bunch of meteorology thats real good stuff. I have worked with this stuff and don’t hold to the mythological natures of radiant heat that you do and that large numbers of scientists do as well.

            I am not a physicist but even physicists have to stay within the realm of the possible when they deploy their advanced knowledge of equations, details of physical laws and mathematics. Its easy to classify anything that might go wrong as feedback then you don’t feel as constrained about deploying the tools. But real world experience is the best teacher and an attitude that the “science is settled” is like a mind block against the truths of experience.

            Its become a false axiom that additional radiation absorbed radiation in the atmosphere must be mitigated by a warming of the surface. The construct of it is actually quite complicated and much of that construct lacks clear fact.

            Climate models shed no light on that topic as all they do is take some information into a black box and grind out some surface temperature results. The spread of variation of that output puts a lie to actually knowing what is going on. And yet you are comfortable with the range of outputs. I learned many years ago as an auditor that the experts can be very very wrong. I also learned that the best indicator of that is disagreement in opinions. I also learned that experts being similarly trained tended to overly bunch their estimates. So I learned to generally open my mind when proceeding with an audit to take their range and double it as being in the realm of probabilities. Strictly applying that standard blindly to a subgroup of experts who happen to ascribe to the Hansen theory would change the possible range from 1.5 to 4.5 to 0 to 6. With the recent observations and science work it is appearing the truth is likely somewhere in the bottom half of that range.

          • Svante says:

            bill hunter says:
            “Who ever said there was no greenhouse effect?”

            You did:
            “Put a big red stamp of WRONG on it after 12:00.”

            Lindzen said exactly the same as video did at 12:00.

          • bill hunter says:

            Svante says:

            “Who ever said there was no greenhouse effect?”

            You did:
            “Put a big red stamp of WRONG on it after 12:00.”

            Lindzen said exactly the same as video did at 12:00.
            ======================

            I was referring to the fact the video was arguing that the atmosphere worked as a pane of glass and in the video the pane of glass starts going up. That wrong even for the mainstream view of the greenhouse effect. It is an area attacked by G&T without response. I haven’t heard Lindzen addressing that specific point.

            But you will note in the quote you provided for me there is no claim of no greenhouse effect.

          • Svante says:

            Perhaps you’re just confused, but you still cite G&T:
            “FALSIFICATION OF THE ATMOSPHERIC CO2 GREENHOUSE EFFECTS WITHIN THE FRAME OF PHYSICS”.

            There are plenty of rebuttals. Your BS filter should be triggered when they spend the first part of the paper discussing actual greenhouses. It’s not worth the attention of Lindzen, but it is contrary to what he says in my link.

            At 12:00 they switch from glass pane to a photosphere analogy, you should look up that word.

          • bill hunter says:

            Svante says: ———Perhaps you’re just confused, but you still cite G&T:
            “FALSIFICATION OF THE ATMOSPHERIC CO2 GREENHOUSE EFFECTS WITHIN THE FRAME OF PHYSICS”.

            There are plenty of rebuttals. Your BS filter should be triggered when they spend the first part of the paper discussing actual greenhouses. It’s not worth the attention of Lindzen, but it is contrary to what he says in my link.

            At 12:00 they switch from glass pane to a photosphere analogy, you should look up that word.
            ———————-
            G&T made some declarations that allowed for a distraction from their work. However, no response was forthcoming on G&T’s main point that there did not appear to be any classical physics that could amount to the conclusions of the Charney Report. And none was ever forthcoming.

            And switching back to the video, they instantly ass-u-me that the photosphere is starved of energy to emit. . . .that being the central thesis.

            However, the window technology they chose to get to that point has no energy starvation occurring. That is why single panes of glass are given an insulation value of zero and a window is insensitive to how much IR it blocks and is why the Dr. R.W. Woods was able to refute the central tenet of Arrhenius’ theory, which sort of closed the matter without resolving it for about 3/4ths of a century. Of course the pot continued to percolate and out of it emerged this untestable hypothesis of the necessity of a lapse rate to produce the starvation. The “there is no planet B” used in climate change alarmism has two sides to it. First and foremost it means “unverifiable”. Second it means that life itself is an experiment.

            OK so lets look at this from a another angle.
            The “elevating” photosphere analogy has what a 9% blockage of IR energy? (i.e. the bandwidth sensitive to CO2 absorp-tion)

            Already outgoing surface radiation absorbed in all bandwidths by the atmosphere according to the Trenberth budget (NASA version) has been reduced to 18 watts/m2.

            So 9% of that is like 1.6watts/m2. . . .uh if completely blocked would capable of what? about .3degC? And that is based upon equal absorp-tion, to date, on all lines of the OLR which clearly isn’t the case, the case is much worse than that.

            These are just basic budget questions any auditor would ask. Here is more.

            The point I was making is that when it was a window analogy the professor calculated the downward leg of the radiation (Trenberth has it at 340.3watts/m2). Of this downward backradiation, somewhere between half (Trenberth budget) and 3/4’s of it (budget recognizing albedo as negative feedback) is mitigated. 3 tenths of a degree warming in the ultra aggressive equal absorp-tion test is getting further mangled by multiple lines of reasoning.

            Our professor would have us believe that more CO2 will reduce outgoing IR at some extraordinary but rate (not calculated for the reasons I am setting out above).

            I get “talk” about shoulders, but “talk” isn’t science. Modtran? Hmmm, isn’t that a military test using powerful lasers? Extrapolation down to a surface emitting 200watts/m2 full spectra radiation is probably kind of iffy don’t you think? At any rate there is going to be a lot of interaction of molecules in the atmosphere tranferring of energy around to capable molecules remitting at different frequencies precluding any rationale for extrapolation.

            Of course unfettered, unmitigated extrapolation is the pattern of behavior throughout climate science. Worse the there is a selectivity of extrapolation. Feedback isn’t extrapolated in the same way primary absorp-tion is. An unspoken rationalization is behind each but remains unspoken because to speak of them just merely clouds the issue more and raises more science questions than they can answer.

            Now of course none of that amounts to a hill of beans about what the correct answer is, but thats none of that, not just some of that.

            I have been approached on more than one occasion to aid in selling an environmental program based upon a series of cartoons designed to move the public. I always insist on the underlying science because the community I am capable of reaching may not be highly educated but recognizes the difference between cartoons and science.

            Seems though a lot of the public can’t distinguish between the two and a lot of scientists have chosen to get on that cartoon propaganda bandwagon versus answering the central question asked by G&T. If you can’t answer the central question the tactic has been to talk about everything but.

            Cartoons with the alleged imprimatur of the science community behind it isn’t convincing to many because they have a good grasp on what motivates people and how little difference exists between the religious and science disciplines when it comes to extrapolation.

            So you are certainly welcome to get on the cartoon bandwagon if you like and avoid answering the important questions. I have worked with radiant energy and find it fascinating and quite illusive as well. Such illusion has been used to sell trailer trash insulation as well until the Bureau of Standards (NBS) began to address the issue. . . .rather interestingly in the 1970’s. Since the NBS is non-regulatory there is no direct enforcement of those standards, however, whereever a consumer has standing the work of the NBS can be used to win fraudulent advertising cases in civil courts.

            There still remains a trace of trailer trash insulation “suggestion” in radiant barrier advertising but really no unsubstantiated promises of minimum performance. The same should be true with climate change science except that nobody has been able to establish any standing to sue when today it has become clear there is need for such standing with the EPA beginning to pontificate on the matter.

          • Svante says:

            Another gish gallop, I wish you could focus on one thing at a time.

            Visit http://climatemodels.uchicago.edu/modtran/
            and set CO2 to preindustrial 280 ppm.
            Tab out and “Save this run to background”.

            Set CO2 to 410 ppm and tab out.
            The difference is 1.8 W/m^2, that’s 1%.

            The difference in ERL is about 200 m.

          • bill hunter says:

            Svante says:———

            Another gish gallop, I wish you could focus on one thing at a time.

            Visit http://climatemodels.uchicago.edu/modtran/
            and set CO2 to preindustrial 280 ppm.
            Tab out and Save this run to background.

            Set CO2 to 410 ppm and tab out.
            The difference is 1.8 W/m^2, thats 1%.

            The difference in ERL is about 200 m.—————–

            Yep and double the CO2 molecules and you double the collision rate with water molecules transferring energy to the water molecules for emission to space. Of course thats feedback so Modtran doesn’t touch that.

          • bill hunter says:

            And of course for the downward radiation what is it? 25 times more likely to hit a water molecule than another CO2 molecule?

          • Svante says:

            Yes, it’s all inclusive. Mixed gases can not have different temperatures, so there’s sharing all over the spectrum.

            The figure was at the surface, so 71% is ocean.

            You can change the water vapor scale and localities in the model.

          • bill hunter says:

            Svante says:
            September 24, 2019 at 1:21 AM
            Yes, it’s all inclusive. Mixed gases can not have different temperatures, so there’s sharing all over the spectrum.

            The figure was at the surface, so 71% is ocean.
            +++++++++++++++++
            All you are doing is explaining how the model is parameterized. The computation of how much radiation absorp-tion a doubling of CO2 will create is parameterized at the surface by climate models. But its just a model and untested models are almost always wrong.

            Parameterizing the absorp-tion at the surface isn’t supported by science the closest you can get to it is a “system-wide” need for a response to the attenuation of the outgoing radiation. But its rather ridiculous to parameterize it at the surface because the back radiation will be absorbed in the same way the OLR is except it will be only be the 9% of OLR related to CO2 bands.

            The entire exercise is completely plagued with being impotent at separating out the various modes of heat transfer in the face of constant variability of air currents and water species.

            I went through that with the early Ramanathan excuse making for the pause until they got around to adjusting the monitoring system and dreaming up aerosol excuses so they didn’t need all that BS. But it was a great demonstration of the entire climate change science process where they can imagine anything they want, retract it later, and substitute it with something less testable.

            Parameterizing the forcing at the surface allows the skipping over a large amount of negative feedback. Now the hypothesis that is true is being supported by observations with the models far overshooting observations.

            Svante says:
            You can change the water vapor scale and localities in the model.
            ++++++++++++++++++++
            Woo Hoo!

          • Svante says:

            MODTRAN is not a climate model, it just calculates the direct radiative effect, i.e. the greenhouse effect.

            Once you have understood that you can start discussing feedbacks, but don’t mix them up.

          • bill hunter says:

            Svante says:———

            MODTRAN is not a climate model, it just calculates the direct radiative effect, i.e. the greenhouse effect.

            Once you have understood that you can start discussing feedbacks, but don’t mix them up.—————-

            It is you who do not understand Modtran. Modtran is a key submodel of climate models that converts an atmospheric absorp-tion rate of IR by CO2 into a direct surface effect.

            The absorp-tion rate of CO2 has been tested. The Modtran model has not been tested. . . .thus the direct surface effect has never been proven.

            The “model” part of Modtran is essentially the simplest model known to man it simply ass-u-me-s that what is absorbed by CO2 is a direct surface effect. So the model is nothing more than an assumption but its all dolled up as a model so suckers can believe its actually doing something.

            The dolling up part is that Modtran recognizes variation of the absorp-tion of OLR by CO2 due to changes in the atmosphere from clouds and water vapor.

            But if a cloud absorbs OLR and radiates some back to the surface before being absorbed by CO2, that is considered in climate models to be only a temporary variable that eventually averages out of the system.

            This variation be allowed because warming is not perfectly linear to CO2. So the assumption is its only a “weather” variation but is assumed to “average out” on a “climate” basis.

            The problem as I see it is using an absorp-tion model as opposed to simply looking at the direct effect of the first absorp-tion layer.

            Thats not done because the first absorp-tion layer doesn’t fully explain the greenhouse effect. Thus there was a need for some kind of other process, yet to be described, that fully explains the greenhouse effect.

            Thus the Modtran assumption is used as a “plug” theory on the basis they couldn’t think of anything else to do.

            Thats pretty much the same way the Ptolemy Theory was arrived at and they simply handwaved away all suggestions that that there might be another explanation.

            So I don’t know if you understand that or not but what you are doing is promoting an assumption as a fact. Perhaps believing that it is an established fact, when it clearly is not.

            Finally on feedbacks. You want me to buy the unsupported Modtran assumption that X energy absorbed TOA reaches the surface without any feedback modification.

            I find that rather implausible and the lack of a blueprint demonstrating how TOA absorp-tion is converted to surface forcing without any feedbacks occurring during the journey back to the surface. That’s a necessity because AGW is already scavenging for every watt they can get their hands on and have the burden already of needing to create triple positive feedback. A real challenge in and of itself when budgets show 50 to 75% negative non-radiative feedback to every additional watt of radiative forcing at the surface.

            So ignoring any id-atmosphere negative feedbacks amounts to a real necessity to continue to support climate model outputs as opposed to say modifying the models to match observations.

            The failure to do that is almost certainly the failure that is common to climate models. So little is known (as stated by Lindzen and others) regarding what is going on in the mid atmosphere, the entire modeling exercise has been reduced to assumptions about the effects of primary surface effects, how much more water will evaporate, etc.

            Lindzen only picked on one small point on the basis of being able to perhaps actually observe some mid-atmosphere effects; (my gawd, something actually might be observable in climate science!!!!!!!). As it has turned out there is some evidence that Lindzen is right. Naysayers saying they can’t see anything is a tone that has recently changed to an admission to some evidence of such an effect. But like everything in climate science there may be more than one explanation and like everything in the CAWG sphere there are no alternative explanations.

          • Svante says:

            bill hunter says:

            “It is you who do not understand Modtran. Modtran is a key submodel of climate models that converts an atmospheric absorp-tion rate of IR by CO2 into a direct surface effect.”

            It does not calculate “a direct surface effect”, just radiation.

            It is based on solid physics and calculates spectrums.
            It is tried and tested.

            If you are interested in cloud effects there are fourteen types there for you to try.

          • bill hunter says:

            Svante says:
            “It is you who do not understand Modtran. Modtran is a key submodel of climate models that converts an atmospheric absorp-tion rate of IR by CO2 into a direct surface effect.”

            It does not calculate “a direct surface effect”, just radiation.

            It is based on solid physics and calculates spectrums.
            It is tried and tested.

            If you are interested in cloud effects there are fourteen types there for you to try.
            ==============================

            Modtran indeed no longer shows a surface temperature effect though it does report a surface temperature that fails in the look up function (goes to 0k). They must have finally gotten the memo and disconnected this functionality?

            However, it continues to show changes in downward IR heat flux as viewed from the surface.

            To give you an idea how badly its all botched up. Trenberth/NASA reports 340.3 watts of downward IR flux (backradiation) and the Modtran model reports at 400parts/million CO2 269watt/m2. a full 71 watts/2 difference from Trenberth/NASA.

            So your claim that Modtran doesn’t calculate a direct effect could only be judged to suggest that radiation change at the surface doesn’t result in any effect.

            What you need to realize is thats nonsense and the only reason its not showing a temperature effect is because of either a model error or a deliberate decision to disable that portion of the model.

            Lindzen’s theory has since gathered some support. As is the case with most alternative theories like Svensmark’s the issue rests on how much of this and how much of that. The atmosphere is a complicated place and nothing is certain about climate change other than it will continue to change as it has throughout the entire paleo record.

          • Svante says:

            Surface temperature is an input parameter, set it in the “Temperature Offset”.

            To compare with Trenberth you have too “Look Up” from 0 km.

            I thought MODTRAN, that video, and Lindzen could help you understand the greenhouse effect. I was wrong.

            Global temperature is going up.
            Lindzen and Svensmark say no.

          • bill hunter says:

            Svante says:———

            Surface temperature is an input parameter, set it in the Temperature Offset.

            To compare with Trenberth you have too Look Up from 0 km.

            I thought MODTRAN, that video, and Lindzen could help you understand the greenhouse effect. I was wrong.

            Global temperature is going up.
            Lindzen and Svensmark say no.
            ——————–

            Even if you want to exclude feedbacks Svante, the Modtran model pretends that radiation is the only electromagnetic process going on in the atmosphere that isn’t feedback. If you desire to make the assumption that molecules are suspended and frozen in space and don’t collide unless a perturbation occurs then Modtran makes a lot of sense. But thats a senseless assumption and the results are what they are GIGO.

          • Svante says:

            Molecules collide all of the time, energy goes back and forth between electromagnetic radiation and thermal energy all the time. If MODTRAN didn’t handle that it would have the wrong spectrum.

            The fact remains, if optical thickness increases a colder level is seen from space and the output power goes down.

            There is a lot more to the story, but first understand this basic mechanism. You confuse yourself when you throw in everything at once. It’s like bundling CO2 and political corruption, you have to divide and conquer to solve these problems in an optimal way.

            https://en.wikipedia.org/wiki/Divide-and-conquer_algorithm

          • bill hunter says:

            Svante says:———
            Molecules collide all of the time, energy goes back and forth between electromagnetic radiation and thermal energy all the time. If MODTRANdidnt handle that it would have the wrong spectrum.
            The fact remains, if optical thickness increases a colder level is seen from space and the output power goes down.

            There is a lot more to the story, but first understand this basic mechanism. You confuse yourself when you throw in everything at once. Its like bundling CO2 and political corruption, you have to divide and conquer to solve these problems in an optimal way.

            https://en.wikipedia.org/wiki/Divide-and-conquer_algorithm———–

            All those “ifs” are short for “I’m faithful”. The divide and conquer algorithm is a great technique for running experiments, but when its dividing up a thought experiment there is no conquering part going on. That’s because it is dealing with pre-conceived notions and those notions lead directly to a mental construction made to order.

            What you are saying is in effect is there is a pre-conceived notion that collisions have nothing to do with the effect.
            As long as you understand thats a mental state and not a physical state you have nothing but faith.

            In 1909 RW Woods demonstrated that slowing IR losses from the surface had no effect on surface temperature.

            Slowing IR losses from TOA is a different but it has to still find a path to warm the surface. Such a path has never even been so much as hypothesized in any detail as near as I can tell. Either folks aren’t looking (settled science) or they are looking and not finding so they fall back on the phony concept of settled science.

            Obviously there is a path to slowing heat loss to space from the system. But the question is how it works. Greenhouse gases may be necessary is some quantity but there may be other conditions required that may or may not lead back to the surface. Without knowing how that works it is just a guess.

            I know handwaving away Woods is your favorite response and saying the atmosphere does not operate like a greenhouse. However that has no meaning unless you say how it works and can test that your thought experiment is correct. There is no untested science, there is only untested belief.

          • Svante says:

            bill hunter says:

            “Slowing IR losses from TOA is a different but it has to still find a path to warm the surface.”

            If you put your pie in the oven it will get the same temperature as the oven.

            If the Earth radiation budget runs a surplus everything inside the radiation boundary will warm up.

            “However that has no meaning unless you say how it works and can test that your thought experiment is correct.”

            The video showed you how it works but you don’t get it. There are measurements but you ignore them too. I could have given you some good arguments instead of your bogus ones, but at this rate we’ll never get there.

          • bill hunter says:

            Svante says: ———“Slowing IR losses from TOA is a different but it has to still find a path to warm the surface.”

            If you put your pie in the oven it will get the same temperature as the oven.—————

            the same temperature as TOA? LMAO!

            Svante says: ———If the Earth radiation budget runs a surplus everything inside the radiation boundary will warm up.—————

            You say. But you lack proof because it takes time to warm stuff up and that radiation budget surplus may cause nothing but a little extra upper atmosphere turbulence. You know in the zone that jets like to fly because it right above that turbulence zone.

            Svante says: ———
            “However that has no meaning unless you say how it works and can test that your thought experiment is correct.”

            The video showed you how it works but you don’t get it. There are measurements but you ignore them too. I could have given you some good arguments instead of your bogus ones, but at this rate we’ll never get there.—————

            The video is how many folks thinks it works, like teams of the Pope’s scientists looking up at the sky and seeing the sun sets in the west and rises in the east everyday and the created a complex explanation based upon that fact that explained most of the other motions noted in the sky as well. . . .at least until some of the Pope’s scientists started bucking the system some. Sometimes its a difficult road to scientific truth because so many believe what they believe with passion.

          • Svante says:

            bill hunter says:

            “The video is how many folks thinks it works”.

            Yeah, people like Lindzen and Spencer, what do they know, LYAO.

          • bill hunter says:

            Svante says:

            bill hunter says:

            The video is how many folks thinks it works.

            Yeah, people like Lindzen and Spencer, what do they know, LYAO.
            ++++++++++++++++++++++++++++++++++

            LMAO! So in your view that’s a science argument?

          • Svante says:

            No, it says something about you. You laugh at people that know a thousand times more than you. You call Raymond Pierrehumbert a “sleazy politician” when he is one of greatest in the field, no wonder he lost it a bit when he was up against that sentiment.

            I read your posts and see ignorance and little progress:
            “that radiation budget surplus may cause nothing but a little extra upper atmosphere turbulence.”

            Really? Evidence?

          • bill hunter says:

            Svante says:

            No, it says something about you. You laugh at people that know a thousand times more than you. You call Raymond Pierrehumbert a “sleazy politician” when he is one of greatest in the field, no wonder he lost it a bit when he was up against that sentiment.

            I read your posts and see ignorance and little progress:
            “that radiation budget surplus may cause nothing but a little extra upper atmosphere turbulence.”

            Really? Evidence?
            ++++++++++++++++++++++++++++=

            I laugh at you because you keep falling back on an appeal to authority. All that makes you is a sucker. Authority is something to fall back on but only when you have a contract either written or implied that provides recourse for an expert who does not provide you honest and supportable advice. The key word there is “supportable”. The world is full of smart quacks.

            I don’t laugh at Roy, Judith, or Richard because they maintain their skepticism. Roy’s efforts to prove the greenhouse theory is an honest attempt to explain aspects of that theory that lead many to believe more about it than what is actually supportable.

            Professionals don’t have the luxury of speculating. Their advice must be supportable. Doctors, Accountants, Engineers, and Pharmacists all live and work under strict standards. Standards create the body of supportable information they dispense.

            Roy has recognized that what he believes about the greenhouse theory could be partly in error. So Roy maintains an air or professionalism. As I have said repeatedly there is a greenhouse effect, but questions remain as to its variability.

            I probably said something negative about Pierrehumbert. My job for the past 40 years has been to tell really smart people they are full of it. And by full of it I mean in terms of unsupported information. It doesn’t necessarily mean they are wrong what it means is the information they are dispensing has a large uncertainty, something that runs against either promulgated standards or is contrary to the American concept of due process where such unsupported information is being used to deprive people of their rights. Thats been my job and I am darned good at it.

            So you can mock it if you wish relying upon your false theory of expert authority. I am here to tell you on this topic there is no expert authority as it crosses over into the unknown. You can indeed go to your doctor and feel confident you will get advice based upon supportable information because the profession and the law provides you an insurance policy on that. That of course doesn’t mean you should blindly believe your doctor as not all doctors are 100% in compliance with the standards of their profession. but they are one heckuva a lot more so in
            compliance than any other group of experts are where you have no insurance policy on advice being supportable.

            I trust Roy because he is questioning the major part of an unsupported theory. Expert skeptics need to focus on what is most important.

            Your ignorance above is revealed in how you quickly transition from and appeal to authority to asking me for evidence.

            You should be asking those you bow down to for evidence to support your point of view not the people who know you have no evidence. You may as well be asking me to prove that groups of experts can be wrong. I have done that many times in just this thread mentioning the Ptolemy Theory several times. History is full of folks and experts who were wrong. You should know that. You should study your history so that you will be in less danger of reliving it.

          • Svante says:

            I do study history. You have a lot of bad experience from your work, and now you think you can poke holes in core physics with zero understanding. You have no idea how solid and well scrutinized it is. Future updates will be like Newton to Einstein, just generalization. You have good universities in your neighborhood don’t you? Get educated.

          • bill hunter says:

            Svante says: ———
            I do study history. You have a lot of bad experience from your work, and now you think you can poke holes in core physics with zero understanding. You have no idea how solid and well scrutinized it is. Future updates will be like Newton to Einstein, just generalization. You have good universities in your neighborhood dont you? Get educated.
            —————-

            You wouldn’t appear so uninformed Svante if you learned one thing. Science is about evidence, its not a popularity contest either with the public nor among scientists.

            All you have to do to establish science is produce evidence, yet you ask me to do so instead. Or you simply say get educated. Well I am here and you clearly don’t know anything or you would have already told me.

          • Svante says:

            Here’s a CO2 spectroscopy validation:
            https://tinyurl.com/y62sf396

          • bill hunter says:

            Indeed Svante, getting to a point where accurate radiation measurements can be taken in the atmosphere will be critical to learning how the atmosphere works.

          • Svante says:

            Yes, and if you want to improve your argument you should look at Kristian, he’s the only non-AGW commenter here with an interesting scientific argument:
            https://okulaer.wordpress.com/

          • Dr Roys Emergency Moderation Team says:

            “Last word-er” troll Svante, please stop trolling.

        • Svante says:

          What do you think of his arguments?

    • Eben says:

      And sadly I have to report the “Stove Top lid Analogy” has been also rejected by the WUVT skeptical resident crowd

    • Ren, your off-topic comments and lack of understanding of a variety of atmospheric issues has you near the top of my about-to-be-banned list. Not that you aren’t a nice person, but because I don’t want others to be misled by repeated nonsense and crazy theories.

      • Gordon Robertson says:

        Roy…”Ren, your off-topic comments and lack of understanding of a variety of atmospheric issues has you near the top of my about-to-be-banned list”.

        Good grief!!! Have you read the off-topic junk that comes from climate alarmists on your blog?

        Following your threat to ren, you have that butt-kisser bindidon kissing up to you as he forces his agenda to undermine you with amateur Excel comparisons between UAH data, models, and the crap out of NOAA and GISS.

        Don’t bother banning me, if ren goes, I go.

      • barry says:

        The moon rotation stuff, the denial of the greenhouse effect, the misunderstandings of the 2nd Law – these are coming from so-called ‘skeptics’, who initiate these topics, contrary to Roy’s opinion, and nearly always off-topic.

        I would enjoy more discipline in the conversations. These comment threads could be much improved by encouraging on-topic discussion. Ren is never on topic.

      • Dr Roys Emergency Moderation Team says:

        “The moon rotation stuff, the denial of the greenhouse effect, the misunderstandings of the 2nd Law – these are coming from so-called ‘skeptics’, who initiate these topics, contrary to Roy’s opinion, and nearly always off-topic.”

        Initially (well over a year ago now), the moon rotation discussions were brought up by skeptics. Now, they are brought up, more often than not, by those defending the status quo on the issue.

        As for the greenhouse effect, people want to discuss it! Look around other climate blogs, look at different posts. Those posts that are connected to the GHE in some way tend to attract far more comments than any other type of post. It’s been that way for a long time. And don’t forget barry, you brought the discussion of the “plates” to this blog, which has been one of the most frequently discussed topics over the last couple of years, with discussions often running into the thousands of comments. That’s on you, Mr “so-called ‘skeptics’ initiate these topics”!

      • barry says:

        “Initially (well over a year ago now), the moon rotation discussions were brought up by skeptics. Now, they are brought up, more often than not, by those defending the status quo on the issue.”

        Nope. Want proof? Here it is below:

        http://www.drroyspencer.com/2019/09/a-stove-top-analogy-to-climate-models/#comment-388255

        “And dont forget barry, you brought the discussion of the “plates” to this blog..”

        In response to denial of the greenhouse effect. Roy has also tried to rebut this nonsense. There are several posts from him trying to set ‘skeptics’ straight on this subject. And he has banned people for posting nonsense about it in spam-like proportions.

        I’m always happy to let it go, but Huffman demanded I talk about it a few posts ago. I was well over it, but he reintroduced it. ‘Skeptics’ just can’t help themselves.

      • Dr Roys Emergency Moderation Team says:

        barry, I said:

        “Now, they are brought up, more often than not, by those defending the status quo on the issue”

        You linked to a comment from Eben. Eben is defending the status quo on the issue. That’s proof for my point.

        “I’m always happy to let it go, but Huffman demanded I talk about it a few posts ago. I was well over it, but he reintroduced it. ‘Skeptics’ just can’t help themselves.”

        …and you poor “true skeptics” just have to respond, right? There’s somebody literally twisting your arm!?

        Like I said, people discuss the GHE because they want to. That’s true regardless of what “side” you are on. It is a very popular topic for in-depth discussion on blogs.

      • barry says:

        Point is I don’t introduce the greenhouse topic in reply to a completely different topic. This is what skeptics tend to do.

        David A, I see, has introduced the moon-spin rotation thing out of the blue. Well, not really. Eben got there first – and Eben is an AGW ‘skeptic’. That’s the group I’m talking about.

      • Dr Roys Emergency Moderation Team says:

        You’re wrong, barry. Both “sides” of the climate debate go off-topic here, all the time.

  9. Perfecto says:

    The Frank paper demonstrates some basic ignorance, and drags down the skeptic side of this argument. Obviously, the uncertainty in warming is not as large as shown in his Fig. 6 and 7b, because nobody seriously thinks the earth will be 10 C warmer or colder by year 2040. Why is that? Because Frank’s error model is bad. How could this paper get published? Peer review indeed, if your peers are high school students.

  10. Roy W. Spencer says:

    Very often reviewers dont have the expertise. If they do, they often dont have the time to do any more than a cursory review. And even if they do, the author can wear them down with lengthy answers to their objections. This journal ranks 48th out of 49 for Research Gate Impact Factor for Earth science journals. That doesn’t prove anything, it’s just a datapoint.

  11. Nabil Swedan says:

    Climate change is not about meteorology or atmospheric physics. Its effects are, but the front end is life and variations in its size. Models that are not based on variations in the size of life will have a hard time to be accurate and accepted.

    • The models do include LIFE. Humanity is causing atmospheric CO2 to increase. We produce twice the CO2 necessary to explain the atmospheric growth rate. Meanwhile, LIFE (the biosphere) is taking out most of the rest.

      The shape of the CO2 growth curve is perfectly explained with (1) the yearly estimates of CO2 emissions and (2) the simple assumption that nature takes out a yearly amount proportional to the excess above some preferred, background “natural” state.
      http://www.drroyspencer.com/wp-content/uploads/Simple-CO2-model-fit-Mauna-Loa-Period.jpg

      Any model shortcomings in the carbon budget are covered by the various radiative forcing scenarios, which can either express how much CO2 humanity is producing or how fast nature is taking CO2 out of the atmosphere.

      • Chic Bowdrie says:

        Dr. Spencer,

        I modified your CO2 budget model to include the possible increase in natural CO2 emissions. It’s still a good fit showing that CO2 growth is explained by both the human emissions and some growth in natural emissions which are roughly 20 times greater. Nature treats both emissions the same, not preferentially removing the natural emissions.

        https://www.dropbox.com/s/7tqog25c4ofxnu9/Modified%20Spencer%20CO2%20model.xls?dl=0

        • gallopingcamel says:

          Chic,
          Thanks for that CO2 spreadsheet. Somehow I missed it.

          The Pre-Industrial [CO2] was ~280 ppm. Today the [CO2] is ~411 parts per million. These measurements are Hard Science. They show that [CO2] is rising year on year at an accelerating rate. The consensus among Climate Scientists is that mankind is to blame.

          I find that argument plausible. Even though natural processes emit 25 times more CO2 than us humans the estimated 750 giga-tonnes of CO2 per year emitted by natural processes is balanced by natural processes that absorb CO2, so the net effect is close to zero. Mankinds contribution of 30 giga-tonnes of CO2 per year is going to upset the balance.

          • Chic Bowdrie says:

            Hi Peter,

            I find the consensus argument plausible, too. However, my analysis only requires a 0.6% annual increase in natural emissions to give a reasonably similar correlation to the same CO2 data. I call the 0.6% close to zero when you consider the complex carbonate equilibria and the gradual increase in ocean temperature over the past century.

            I highly respect your viewpoint. How deeply have you investigated the emissions balance data?

      • barry says:

        “It’s still a good fit showing that CO2 growth is explained by both the human emissions and some growth in natural emissions which are roughly 20 times greater.”

        The chart you show absolutely does not identify sources of CO2 – it only shows CO2 content increasing.

        The source of the growth is pretty obvious. Annual turnover is huge, but CO2 didn’t grow with this annual turnover until the industrial revolution. IOW, the turnover never caused an accumulation of CO2, because sources and sinks were balanced. Then human activity caused a change in that balance. We now pump out about twice the CO2 that is added annually, over the long-term. The biosphere has to be a sink for excess CO2 emissions, not a source. It’s basic arithmetic.

        • Chic Bowdrie says:

          Column C contains the possible addition of CO2 from natural sources. It begins with an amount consistent with a prior level of 280 ppm in the air and ends with an amount about 20 times the human contribution consistent with IPCC figures. Let me know if you have more trouble deciphering the spreadsheet.

          What we pump out is 20 times less than what nature pumps out because, yes, annual turnover is huge. But natural sources could also have been growing during the industrial period due to a century long increase in global temperature. Unless you have data that proves natural sources of CO2 do not ebb and flow and specifically haven’t been increasing of late, then you are just asserting facts not in evidence. Opinion.

          I trumped your basic arithmetic with plausible calculus. Now you are going to try and discredit my model with assumptions about what CO2 was doing before reproducible measurements began. Go ahead. I’ll see your assumptions and raise you mine.

          • David Appell says:

            Chic:

            How much CO2 does nature absorb, compared to total CO2 emissions (natural + manmade)?

          • Chic Bowdrie says:

            IPCC AR5 WGI reports nature absorbs 210 GtC (circa 2012) and my estimate from modifying Dr. Spencer’s model makes it 242 GtC. Close enough for government work considering an additional 6 or so years have passed.

          • barry says:

            It’s simple arithmetic, Chic. We pump out twice as much as the atmosphere increases. The biosphere has to be a net sink, not a source, in order for a CO2 volume equal to half our emissions to be swallowed up.

            Not only have you not identified any physical sources of natural CO2 increase, your postulate mandates that the biosphere must selectively uptake anthropogenic CO2 over natural CO2. There is no physical mechanism that does that. How does the biosphere prefer to absorb anthro over natural CO2?

            The isotopic evidence proves that the increase is from fossil fuel burning. The fact of ocean CO2 increasing means that the oceans are not a source. The fact that the increase occurs after relatively stable CO2 over thousands of years means it isn’t likely volcanoes (or we would see the evidence). The change of isotopic ratios in ocean CO2 and atmospheric CO2 rules out above ground and underwater volcanos, as does the SO2 content that accompanies volcanic eruptions.

            http://www.ferdinand-engelbeen.be/klimaat/co2_origin.html

            There is plenty of physical evidence that the source of the CO2 rise is anthropogenic. Tons of evidence, not to mention the simple arithmetic that is hard to escape.

            So when I ask you for sources of natural CO2 to explain the rise, this is the sort of physical evidence required. You also need to explain how anthro CO2 gets preferentially absorbed by the biosphere.

            This debate is over in science, and what is happening now is getting a finer handle on the basic facts.

          • barry says:

            I re-read your comments, Chic:

            “Nature treats both emissions the same, not preferentially removing the natural emissions.”

            Ok, good. Now all you need to do is explain how the rise could be partly natural if we emit twice as much CO2 as is taken up by the biosphere. And if you can find a way to do that, the final step is to demonstrate a natural contribution by pinpointing the sources, using whatever evidence is available – such as isotopic ratio changes in CO2.

          • Chic Bowdrie says:

            There is nothing simple about tracking CO2 emissions. There are sources and sinks all over the planet subject to changes in temperatures and non-equilibrium rate processes. Unless you can prove that natural emissions have not been increasing as much as 0.6% more emissions/year, then you have no argument. The total sinks (biosphere and oceans) cannot be a net sink while CO2 continues to increase, that is simple arithmetic.

            “Not only have you not identified any physical sources of natural CO2 increase, your postulate mandates that the biosphere must selectively uptake anthropogenic CO2 over natural CO2.”

            The sources of natural CO2 are the same as the sinks, the biosphere and the oceans. They both “breathe” so to speak. I explicitly stated nature does not discriminate when sinking human or natural CO2. That is the whole point.

            You are confused about oceans not being a source and I don’t consider your Engelbeen source definitive. Simple arithmetic is not your friend.

            I repeat for a third time: Anthro CO2 does not get preferentially absorbed. Nature treats CO2 the same regardless of the source. That’s what my modification of Dr. Spencer’s model shows.

            The debate is over in your mind. I get that. Not in mine.

          • barry says:

            “Unless you can prove that natural emissions have not been increasing as much as 0.6% more emissions/year, then you have no argument. The total sinks (biosphere and oceans) cannot be a net sink while CO2 continues to increase, that is simple arithmetic.”

            Anthropogenic CO2 emissions account for twice the amount that atmospheric CO2 has risen since the industrial revolution.

            Total anthropogenic emissions since measurements began at Mauna Loa has been twice the atmospheric increase.

            This not only explains the rise twice over, it demonstrates that the biosphere has to have been a net sink, otherwise the rise in atmospheric content would be equal to or greater than the total amount of anthro emissions.

            We know to a good approximation what global anthro CO2 emissions are. Simple arithmetic makes very clear what is going on. I can’t fathom how this escapes you. Roy gets it easily:

            “We produce twice the CO2 necessary to explain the atmospheric growth rate. Meanwhile, LIFE (the biosphere) is taking out most of the rest.”

            You have not responded to the other lines of evidence that corroborate what is already very clear. It can’t be the ocean outgassing CO2, because oceanic CO2 content is increasing over time, in step with atmospheric. The change in CO2 isotopic ratio over time confirms the source – fossil fuels.

            You can’t pinpoint a source. We already have a well pinpointed source that accounts for more of the rise of atmos CO2 than observed. Your notion of a natural source increase is based on nothing physical at all, just an arbitrary choice of fraction. Do you even have some kind of reference of physical evidence for this notion?

            “Unless you have data that proves natural sources of CO2 do not ebb and flow and specifically havent been increasing of late, then you are just asserting facts not in evidence. Opinion.”

            We have the ice core records showing changes in CO2 content taking 40 times longer to increase by 100ppm. The same records, as well as other proxies, show stable CO2 levels for most of the Holocene, then a sharp rise tightly correlated with the industrial revolution and increased anthro CO2 output, a relationship which continue through the Mauna Loa record.

            If there is a natural source involved, what a remarkable coincidence it started outgassing precisely when we did.

            The explanation of greatest parsimony and corroborated by physical evidence is that humanity’s activities have increased the atmospheric content of CO2 by 40% since the I.R.

            Your explanation is merely wishful thinking. Unless you substantiate it there’s no need to prove what is barely a working hypothesis wrong.

            You might as well ask me to prove that unicorns don’t exist.

          • Chic Bowdrie says:

            I guess a simple arithmetic primer is required before moving on to the really complex stuff where the numbers get really big and the number of equations get really large.

            “Anthropogenic CO2 emissions account for twice the amount that atmospheric CO2 has risen since the industrial revolution.”

            Let A = total anthropogenic emissions as of 2018 and N = the cumulative increase in natural emissions according to my model that fits Mauna Loa data. A= 441 GtC and N = 3388 GtC. When the 130 ppm increase in atmospheric CO2 is converted to GtC it comes out to 277 GtC. So although anthropogenic emissions are 1.6 times the atmospheric increase, the natural emissions are 12 times the atmospheric increase. Mauna Loa doesn’t measure those large increases because most of it is sinked, but not all.

            Perhaps we aren’t interpreting sources and sinks the same. Technically, the biosphere includes land, ocean, and atmosphere. So maybe we should stick to land and ocean as potential sources and sinks for the air where the measurements are made. If the atmosphere is increasing in CO2, then land and ocean can’t both be net sinks.

            Until we agree on this basic concept, we can’t move forward. I’ll wait for you to concur, but for two other comments.

            “If there is a natural source involved, what a remarkable coincidence it started outgassing precisely when we did.”

            It isn’t so remarkable a coincidence that the industrial revolution coincided with the rise in temperatures since the Little Ice Age.

            “Your explanation is merely wishful thinking. Unless you substantiate it there’s no need to prove what is barely a working hypothesis wrong.”

            Wishful thinking only to the extent that neither of us, to my knowledge, have the data proving that natural emissions have not increased enough to account for the vast majority of the CO2 rise.

          • bdgwx says:

            Chic,

            I’m trying to understand your point. Help me out.

            Let…

            A = atmosphere
            O = ocean
            L = land
            F = fossil

            The carbon budget must balance such that…

            dA + dO + dL + dF = 0

            What are you suggesting is happen to dA, dO, dL, and dF? Are each of them > 0 (sink) or < 0 (source)? Can you provide example values for each flux (doesn't have to be perfect) that best describes how you think the carbon budget is transferring mass from one reservoir to another? I'm okay if you want to add another reservoir to the mix. Just give it another letter. The thing I care most about is making sure the budget balances to zero.

          • Chic Bowdrie says:

            bdgwx,

            Thank you for providing a means of getting to crux of the matter. First of all, yes, I need to add one more term to your mass balance necessary for a minimal explanation of the available data. That term is the sediment (dS) that occurs when carbonate is precipitated in the ocean. There might be a similar land sink term but it is not necessary for this rudimentary discussion.

            What the obvious measurable data says is that dA is increasing, dO is increasing, and dF is decreasing. My model assumes dS is increasing because the ocean is nearly saturated if not supersaturated. I don’t know if dL is increasing or not. Let’s call it zero. Since dF is always negative, then |dF| = dA + dO + dS. [In case they don’t show up, I surrounded dF with absolute value marks].

            dF is 441 GtC, dA is 277 GtC. dO has increased from 1.95 mmol/Kg to at least 2 mmol/Kg at the surface. Here is where it gets messy. CO2 equilibria is affected by ocean temperature and depth. So one have to guesstimate at what the GtC increase in sea water has been. The best I can say is that whatever that number is, it equals the difference between what the ocean absorbed and what was sinked. Assuming the ocean absorbed everything that didn’t stay in the atmosphere (with dL=0), then 441 – 277 = 164 GtC = dO + dS.

            What is difficult for people to get their heads around is that dO and dL are large differences between quantities of CO2 being sourced and sinked on a yearly basis, roughly 20 times the amount of the current human emissions. I admit that an increase in net natural emissions may not be as much as my model suggests. I’m only pointing out that the data still fits that possibility.

          • bdgwx says:

            Chic,

            I accept your addition of S for the carbon precipitate in the ocean. I also accept your assumption that dL is close enough to zero that we can effectively ignore it. So…

            dA + dO + dS + dF = 0

            dF = -447 (it’s a source so the reservoir mass is decreasing)

            dA = +227 (it’s a sink so the reservoir mass is increasing)

            +227 + dO + dS + -447 = 0

            dO + dS = 447 – 227 = +164

            I’m good with that.

            I also agree that the exchanges concerning F are ~20x less than those of L and O.

            And there’s infinitely many ways to arrange dO+dS to get +164. dO could be > 0 (a sink) to still get dO+dS > 0 (net sink).

            Is the argument here that the ocean is a source such that dO < 0?

          • Chic Bowdrie says:

            bdgwx,

            “Is the argument here that the ocean is a source such that dO < 0?"

            No, but you are putting your finger on why this is so hard to understand. dO has to be positive, because there is data showing that to be the case. I think what's happening is that as average ocean temperature creeps up, the total dissolved CO2 concentration has also risen. This is counter intuitive, because we know that CO2 is less soluble at a higher temperature. But at a given temperature, a greater CO2 concentration in sea water will result in a greater CO2 concentration in the atmosphere.

          • bdgwx says:

            Chic,

            Yeah, I mean I think I agree with you here.

            We do have evidence that the ocean is a net sink right now via pH and alkalinity measurements.

            So…

            d’O > 0

            …but as you say as temperatures rise the effectiveness of the ocean to buffer the carbon decreases such that…

            d”O < 0

            Note I'm using d' as the 1st derivative and d'' as 2nd derivative. In other words, as ocean temperatures rise its effectiveness as a sink declines. All other things being equal the same dF value in the presence of rising ocean temperatures would result in faster atmospheric accumulation. I really don't see a problem with this conclusion.

          • Chic Bowdrie says:

            That’s interesting. I hadn’t thought about it in those terms, but you are right. dO > 0 when net emissions are increasing. If d”O is positive, the growth in net emissions is accelerating. If d”O is negative, then growth in emissions will decelerate until the growth in net emissions stops. My prediction is that doesn’t happen without a drop in ocean temperature.

          • bdgwx says:

            Just to be clear on what I’m saying. Oceans are sequestering a lot of the carbon that is accumulating in the atmosphere. This sequestering mechanism loses its effectiveness as ocean temperatures rise. In this way the transfer of carbon from F into O via the chain F -> A -> O will slowly decrease leaving more and more of the carbon parked in A. The flow F -> A is not temperature dependent, but A -> O is.

            One interesting thought experiment. Let’s say that humans stop extracting carbon from the fossil reservoir once CO2 reaches say 560 ppm in the atmosphere sometime in the future. The planet continues to warm for a few decades under the fast feedback equilibrium climate response and perhaps for hundreds of years if factoring in the slow feedback responses. If the continued warming eventually flips the ocean from a net sink to a net source even though direct emissions are zero at this point then who/what do we attribute the additional atmospheric increase as a result of the outgassing from the ocean into the atmosphere? Nature or humans?

          • Chic Bowdrie says:

            Extrospective much?

            I am with you through your first paragraph. Conceivably human emissions could stop and natural emissions continue to rise indefinitely. Former virtually impossible and the latter unlikely, but I’ll accept that as a condition of the thought experiment.

            Here’s where I lose you. I don’t think the ocean will ever be a net source as long as temperature continues to warm. It’s because the dissolved molecular CO2 is near saturation. Only a lower ocean temperature will reduce the airborne CO2. I could be wrong. The preindustrial data suggests oceans were a net source and land a net sink.

            Just for fun, let’s imagine the oceans do become a net source because of stopping human emissions. What’s to blame? Depends on what political gain is to be had by whom.

  12. Steve Richards says:

    Perfecto and Dr Spencer:
    Where did Dr Frank state that the earth will be warmer or colder by 10 C?

    He did not, and you both know it.

    Why keep up the pretense that you understand error propagation?

    His values were explicitly stated to be error ranges/uncertainty values – take your pick – which ever you can manage to understand.

    Dr Frank repeatedly states that his values are NOT TEMPERATURES.

    Please note that in the last paper in Dr Franks reference list, “Uncertainty in Model Climate Sensitivity Traced to Representations of Cumulus Precipitation Microphysics”

    The last few sentences of the abstract
    “The model differences, dominated by shortwave feedbacks, come from broad regimes ranging from large-scale ascent to subsidence regions. Given current uncertainties in representing convective precipitation microphysics and the current inability to find a clear observational constraint that favors one version of the authors’ model over the others, the implications of this ability to engineer climate sensitivity need to be considered when estimating the uncertainty in climate projections.”

    Extracted from the above “this ability to engineer climate sensitivity need to be considered” !!!!!

    All due to clouds not being understood!!

    • First of all you obviously did not bother to read my short post and understand it, while I have spent days wading through Pat’s paper to understand it.

      Secondly, the claim that he was claiming “His values were explicitly stated to be error ranges/uncertainty values” is disingenuous BS. Look at (for example) his Fig. 6b, the vertical scale is temperature and it ranges over -15 deg. C to +19 deg. C. “Uncertainty” means the temperature COULD be that high (or low). Pat is trying to backtrack from his claims now. The context of the wording of the paper also supports this interpretation. If he meant something different, he should not have misled people. But I don’t think he meant something different. The models DO NOT, CANNOT, and NEVER behave with such large deviations in temperature.

      WHY???

      I’ve explained why, multiple times, in multiple ways.

      • Pat Frank says:

        Roy wrote, “Look at (for example) his Fig. 6b, the vertical scale is temperature and it ranges over -15 deg. C to +19 deg. C. Uncertainty means the temperature COULD be that high (or low).”

        Temperature is the line plot. Uncertainty bars provide the envelope.

        From your comment, Roy, one would think you don’t understand a plot that includes the uncertainty in the plotted values.

        Uncertainty in temperature is not temperature. Uncertainty in temperature indicates our ignorance of the correct value. When the uncertainty is large, knowledge of the correct value is absent.

        It’s that simple, and you’ve never grasped the idea, Roy.

        Roy wrote, “Pat is trying to backtrack from his claims now.”

        I have not done anything of the kind, ever.

        I have been completely consistent. Uncertainty is an expression of ignorance. That was my point at the start, and it remains my point.

        Evidently you are unable to grasp that point, Roy.

        So you go on to make false, even pejorative, statements about me personally and persistently apply an obviously incorrect meaning to my work.

  13. DMA says:

    To make your analogy applicable the the discussion of Dr. Franks paper assume an ability to measure the temperature of the water to the whole degree. Now you know the temperature of each pot but you have a known uncertainty. It is expressed in degrees but it is a statistic describing the quality of the measurement. Your pot model is subject to this uncertainty so its output cannot be presumed to be more accurate than that. No mater how many times you run the model and get the same answer the precision will not make it accurate. If some physical quality depended on the change in temperature over time and that temperature was measured at the given time intervals each measurement would have that uncertainty. If the pot model calculated that quantity by computing the temperature for each period then reiterated the calculation based on that computed temperature the error would propagate according to the functions Dr. Frank applied and would potentially have no predictive capability even if each time it was run it gave the same output.

    • bdgwx says:

      Just trying to understand your post here…so if the error in this analogy were +/- 1 degree and the model were iterated 10x then are you saying the error would be -10 to +10?

      • DMA says:

        bdgwx
        Short answer =yes, almost. The propagation of uncertainty would follow the applicable equations from error analysis for the math involved in the process. But the bottom line is that you would not be able to say anything about the accuracy of the pot model output if the error statistic propagated enough.

    • bdgwx says:

      So what are you thinking the odds of are that the error would be on end of the spectrum either -1 or +1? The odds of 10 consecutive occurrences of this error happening are?

      • DMA says:

        In my profession, land surveying, the propagation equations are designed to give a required reliability (ie. 95%). If I have generated an error ellipse that is bigger than my acceptable accuracy, I could be held professionally reliable for returning an erroneous boundary on my certified plat. Without measuring the closing leg of a traverse I don’t know that boundary well enough to report it or use it to compute tract acreage. The propagation math does not include all of the tails of the probable distribution but it allows for blunder detection. In my experience, when blunders were all corrected, the closing error was substantially less that the final error elipse. It seems to me that Dr. Frank’s approach is saying that the “climate error ellipse” is soon too large to trust the accuracy just like I must not trust my survey measurements without proving their accuracy.

  14. Masahiro says:

    The following is posted in every temperature update for as long as I can remember.

    “The linear warming trend since January, 1979 remains at +0.13 C/decade.”

    Could someone please tell me when the linear trend reached this, apparently unchanging, +0.13 C/decade?

    There has to be a plot of these linear trends as they are calculated month after month, year after year, but I have failed to find it.

    Thank you all.

    • Neville says:

      Masahiro here is the York Uni tool and you can check UAH V6 and try different start and end dates.
      If you start at 1978.99 and end at the el nino peak at 1998.99 you have a trend of 0.164 c/ dec.
      Then return to zero at next start date at 1999.99 and finish at next strong el nino peak at 2017.01 and you have a much lower trend of 0.115c/ dec.
      What this proves I’m not sure, perhaps Roy can help us with this problem? Or perhaps Dr Cowton or anyone else?
      But overall trend from 1978.9 to the present day is 0.13 c/ decade.

      http://www.ysbl.york.ac.uk/~cowtan/applets/trend/trend.html

    • Bindidon says:

      Masahiro

      “Could someone please tell me when the linear trend reached this, apparently unchanging, +0.13 C/decade?”

      As a source to compute this, you have Roy Spencer’s anomaly time series for the Globe, several latitude bands and some regions:

      https://tinyurl.com/y62sq3xo

      But the file contains only anomalies and, at the end, trends for the entire time series. If you want to view all consecutive trends, you have to compute them yourself using e.g. a spreadsheet calculator.

      Then you see in the spreadsheet that the 2-digit rounded trends move from 0.12 up to 0.13 C / decade in November 2016.

      Here is a chart showing all these rounded trends starting with Jan 1998:

      https://drive.google.com/file/d/1oXNVNqDPicWbwA9A2NmQhR431h7lrOfT/view

      Thus, the rounded trend has kept unchanged at 0.13 C / decade since now 33 months.

  15. Roy W. Spencer says:

    Math is only useful to physics if it expresses the physics. Dr. Franks math does not.

    • Neville says:

      Well Roy what about the York Uni tool above and my start and end dates for UAH V 6?
      Always amazes me why there’s so little interest in these trends. I know we have the two big volcano eruptions in the earlier period as well.

    • Bindidon says:

      Roy W. Spencer

      “Math is only useful to physics if it expresses the physics.”

      I’m not a physicist, but I think that this is not necessary to feel it was well-said.

      As you certainly know, there is since years a sometimes harsh debate between Pat Frank and Nick Stokes at Anthony Watts’ WUWT, whose kernel substance all the time has been exactly what you just expressed.

  16. Pft says:

    If we cant measure temperature properly, or the fluxes, and if the basic science and assumptions are uncertain or even wrong, then all these models are nothing more than elaborate curve fitting tools. They have a predetermined number in mind , driven by political, ideological and/or financial reasons and simply adjust data, parameters and assumptions to fit their targeted increases. Loe and behold they all end up in the same ballpark despite great uncertainties

    As John von Neumann said

    With four parameters I can fit an elephant, and with five I can make him wiggle his trunk.

    It has never been proven CO2 is the prime driver of climate. The negative feedbacks are not fully understood or measured. Climate is not a linear system its a non-linear complex system. The level of understanding of solar and clouds on climate is low. Our understanding of deep ocean currents and their impact on future seas surface temperatures is low. Yet by assuming mans CO2 is the primary driver of any future climate change the modelers have went from
    fitting an elephant with a wiggling trunk to an elephant can fly.

    One need only look at the climate change over the last million years or so. Earth has been a snow ball with regular cycles of glacial periods (100K years) followed by relatively warm interglacial periods of 10-20K years. Some of these interglacial periods were warmer than today. Sea levels were higher. In fact during the current interglacial known as the holocene the holocene optimum was reached 6000 years ago. Temperatures were higher as were sea levels. Coincidentally or not this was the dawn of human civilization

    Over the last 6000 years there have been a number of cooling and warming periods. All without mans CO2

    Not saying CO2 has no influence, maybe it can keep us from the next glacial period. Maybe not. Going to have to ask my elephant.

  17. fonzie says:

    What cold, dark cave did those commenters over at wuwt come crawling out of? (even had one harping on Dr Roy’s pot model)…

    • Mike Flynn says:

      Dr Spencer,

      The title of your post was “A Stove Top Analogy to Climate Models.

      With respect, might I suggest that you place the heat source in a more appropriate position – above the pots – for a start.

      I understand what you are trying to support, but your analogy is open to question here, there, and everywhere.

      Even apart from ignoring the heat source placement, try convincing anybody that 800 W from 3 M2 ice (suitably concentrated using a lens or parabolic mirror), onto the pot from any direction) will result in a water temperature of 150 F. It wont, of course!

      You assume either that that the water is 150 F everywhere, or that this is an average temperature.

      It it is real water, you immediately strike a problem. If heated from the top, your lidded pot will reduce the amount of heat reaching the water – either by reflection or absorp.tion. Just like the real world. The lidded pot will be cooler than the other.

      The water in both pots will not heat throughout. The hotter water will float on top of the cooler. Just like the real world.

      Even if heated from the bottom, the water temperature will be unpredictable at any given location due to chaotic convection – as Lorenz discovered. Additionally, the hotter water will radiate more intensely, and cool faster, due to radiation being proportional to the fourth power of the absolute temperature. Your temperature probes may be all over the place – just like the real world.

      Now cycle your heat source every twelve hours. If you use a notional heat lamp as heat source, just rotate it on an axis so that in 24 hours it heats the pot for twelve hours, and allows it to cool for twelve hours. Just like the real world.

      Analogies need to be carefully chosen. Pot lids, overcoats, blankets – none explain how reducing the amount of sunlight reaching thermometer (the real atmosphere) makes the thermometer hotter!

      The title of your post was “A Stove Top Analogy to Climate Models. Maybe it provides some insight into why climate models are useless, if modellers refuse to take real world considerations into their programming.

      As you point out in your “Global Warming 101″, ” . . .if energy is gained faster than it is lost, warming occurs but if energy is lost faster than it is gained, cooling occurs.” Completely sensible – and demonstrated by the Earth’s surface cooling since its creation. And by surface cooling at night, and by winter being cooler than summer, and . . .

      Oh, well . . .

      Cheers.

      Mike: Like I said, to demonstrate energy gain and loss concepts, I could have used many things, such as the human body with and without a coat in winter. It doesn’t matter what direction the energy input to the system is from. If WUWT comments are making fun of the analogy, then WUWT must have a pretty science-ignorant audience, because this is just the 1st 2nd Laws of Thermodynamics in their simplest application. If people cannot understand this simple post, they will NEVER be able to offer intelligent comments on Dr. Frank’s paper. Only spout talking points they have heard from someone else. -Roy

      • Go Fish says:

        Bravo Mike! “-and demonstrated by the Earth’s surface cooling since its creation.” I may not yet comprehend the whole of the “science” behind most of the arguments yet but that does not mean I have no comprehension of things that are real or reality!

        • Bondidon says:

          Go Fish

          “… but that does not mean I have no comprehension of things that are real or reality!”

          Reality Nr 1

          While the Sun provides us with about 240 W / m^2 at surface, Earth’s cooling thru radioactive decay etc is about 0.1 W / m^2.

          Reality Nr 2

          Indeed, summers are warmer than winters. But since quite a lot of time, winter month temperatures increase faster than summer month temperatures.

          That, Go Fish, is the reason why you always see historical summer months at top of a sorted list of global averages of absolute monthly temperatures:

          1901 7: 24.14 (C)
          1936 7: 23.06
          1934 7: 23.00
          1931 7: 22.98
          1921 7: 22.92
          1900 8: 22.91
          1897 7: 22.74
          1935 7: 22.69
          1916 7: 22.61
          1910 7: 22.54

          but begin to see more and more recent winter month temperatures at top of a sorted list of global averages of anomalies with annual cycle removal:

          2016 3: 1.04
          2016 2: 1.0
          2015 12: 0.91
          2016 4: 0.76
          2015 11: 0.69
          2007 1: 0.68
          2017 3: 0.68
          2015 10: 0.63
          2010 6: 0.61
          2015 3: 0.61

          That would be even much more apparent if we would not have had a great El Nino event in 2016.

          *
          Data source: GHCN daily (land-only data); anomalies wrt mean of 1981-2010.

          • Go Fish says:

            Bondidon in your view life, science and any other reality is nothing more than a series of mathematical expressions or physics. Moreover, that if one does not comprehend these expressions they do not UNDERSTAND the realities existent around them. The expressions exist whether I understand them or not! As an example lets look at Freeman Dyson and his description of his students’ entry into the world of physics:

            “The student begins by learning the tricks of the trade. He learns how to make calculations in quantum mechanics and get the right answers. To learn the mathematics of the subject and to learn how to use it takes about six months. This is the first stage in learning quantum mechanics, and it is comparatively easy and painless.

            The second stage comes when the student begins to worry because he does not understand what he has been doing. He worries because he has no clear physical picture in his head. He gets confused at trying to arrive at a physical explanation for each of the mathematical tricks he has been taught. He works very hard and gets discouraged because he does not seem able to think clearly. This second stage often lasts six months or longer and it is strenuous and unpleasant.

            Then, quite unexpectedly, the third stage begins. The student suddenly says to himself, “I understand quantum mechanics,” or rather he says, “I understand now there isn’t anything to be understood.””

            Language then or “meaning” (as in equations, encoded meanings, symbols, letters and numbers) is the non material quality that apart from a source such as the human mind, or one much greater than the human mind, has no explanation as to how it could arise! It cannot arise of ITSELF there has to be some other explanation and science with all of its “laws” seems to show their ultimate origin comes from a Supreme being that has revealed Himself in these laws!

            Such is the lot of those who believe they can explain all the intricacies of order in a chaotic system! And do so by mathematical laws!

          • Go Fish says:

            Is it any wonder then how the founders could write in the Declaration of Independence:- “the separate and equal station to which the Laws of Nature and of Nature’s God entitle them,”

            The dark ages are upon us as they seem to have had more light in their day than we do in ours!!!!!

  18. Nick Stokes says:

    I’d like to propose an elaboration. Suppose the 20 pots are actually modelling one special Pot whose temperature we really care about. We have limited control over the lid, and it moves in response very slowly. All the pots are subject to variations in ambient temperature (weather, diurnal, people opening doors etc), and are in different places. We have scenarios for what may happen to the Pot lid in the future (including our attempts to control, which will depend on future decisions) and we want to know what will happen.

    I’m thinking here of a basic claim of Pat Frank’s
    “Scientific models are held to the standard of mortal tests and successful predictions outside any calibration bound. The represented systems so derived and tested must evolve congruently with the real-world system if successful predictions are to be achieved.”
    In fact, GCM’s are models in the sense of the pots here. They don’t evolve congruently. They are devices for testing scenarios. They have different ambient variations. But they are useful for working out what will happen to the Pot in various scenarios.

    And yes, some pots may be perturbed by error. They are perturbed by various things that stop them matching the Pot day by day. But as Dr Spencer says, the key thing is the long term variation, which is determined not by the vagaries of a random walk, but by the flux balance which is still comparable for the pots and the Pot.

    In analysing uncertainty, you need to be clear about what you want to know. We’ll have errors in weather; we want to know about climate.

    • Mike Flynn says:

      NS,

      Maybe you could usefully describe the GHE, and forget about pots (or Pots).

      Then someone might propose a testable GHE hypothesis. All part of the scientific method, I believe.

      In case you don’t know, climate is the average of weather. If you have errors in weather, the average is in error, wouldn’t you agree? Just as 132 computer models producing 132 different results (averages all). At least 131 must be in error, but some people think that averaging 131 incorrect results must give a correct result!

      As the IPCC agrees, the atmosphere acts chaotically. Even if it didn’t, Richard Feynman pointed out in a lecture that given the reality of the uncertainty principle, predicting the future state of the atmosphere is impossible, even if having omniscient knowledge of the position or momentum of every particle of the atmosphere – down to the last photon of almost zero energy!

      Good luck with ignoring or denying physical law.

      Cheers.

      Mike:
      Do you basically agree with Dr. Frank’s conclusions? Because it sounds like you don’t believe in the “greenhouse effect”, yet Frank used one component of the greenhouse effect (longwave cloud forcing, LWCF) to demonstrate his point. In fact, he went so far as to say LWCF determines tropospheric temperature (!!!), when in fact it is only one of many energy flux components determining tropospheric temperature. -Roy

      • Nick Stokes says:

        The topic here is pots.

        • Mike Flynn says:

          NS,

          No, the topic here is “A Stove Top Analogy to Climate Models”, according to Dr Spencer.

          Now, climate models apparently involve climate and models. The models seem to claim that a yet to be described mechanism involving CO2 creating hotter temperatures by shielding thermometers from radiated energy, (like holding a blanket up between a roaring campfire and oneself, to use an analogy). Sounds like nonsense to me. What do you think?

          Stick to pots if you wish. You now claim that his is the topic, although you possibly overlooked this when you wrote “Well have errors in weather; we want to know about climate.”, apparently.

          Carry being potty if you prefer. I prefer science, myself.

          Cheers.

    • TimTheToolMan says:

      Nick writes “Id like to propose an elaboration. Suppose the 20 pots are actually modelling one special Pot whose temperature we really care about.”

      Sure, but the error Pat is talking about can be represented by the pots that are “modeling” the special pot, having different sizes and shapes. So…

      “the key thing is the long term variation, which is determined not by the vagaries of a random walk, but by the flux balance which is still comparable for the pots and the Pot.”

      Now you may think your pot model represents the special pot but its final temperature and time to get there will not represent it at all even though it took a very reasonable path to get to equilibrium.

  19. Jim G says:

    If CO2 only absorbs a few narrow bands of IR that mostly the greater amount of H2O already takes care of, how can CO2 be a factor? Also wouldn’t the CO2 absorb and re-emit more IR from the Sun than the IR from the Sun, resulting in greater cooling as CO2 increases? Anyone have links to the energy curves from the Sun’s light and Earth’s heat to compare? I would assume offhand that the Sun’s energy distribution would be generally greater at all wavelengths at the top of the atmosphere than that of the Earth’s surface, barring specific bands that get absorbed.

    Jim G:

    Sigh. This has been explained so many times, it’s hard to believe that it is still a skeptical talking point. No planetary atmosphere is completely opaque to IR radiation, even Venus, which has 220,000 times as much CO2 as Earth. Overlapping absorption bands, pressure broadening of those bands, etc., have all been taken into account in climate models. That’s not where their errors are. -Roy

    • Eben says:

      I have the energy curves from the Suns light and Earths heat,
      but Earths heat loss is extremely variably from place to place and from time to time , you cannot use it in a sensible way, at least I can’t

      • Mike Flynn says:

        E,

        There is not much hope for the US science education these days.

        This from the National Center for Atmospheric Research, sponsored by the National Science Foundation –

        “For example, nitrogen (N2) and oxygen (O2), which make up more than 90% of Earth’s atmosphere, do not absorb infrared photons. CO2 molecules can vibrate in ways that simpler nitrogen and oxygen molecules cannot, which allows CO2 molecules to capture the IR photons.”

        That would be news to anybody who has ever taken an air temperature measurement, or heated air using hair dryer!

        I suppose this sort of nonsense comes from the same sorts of people from the NSF who denied Archimedes’ principle (claiming that melting sea ice raised sea levels for 6 years or so).

        CO2 continuously capturing photons? And what then? Do they swell up until they burst? Tuck the photons away with Trenberth’s missing heat until Gavin Schmidt plays with his knob, and causes a photonic eruption?

        The mind boggles!

        Cheers.

        • DMacKenzie says:

          Mike,
          N2 and O2 do not absorb infrared. They are transparent to it. CO2 and H2O absorb the photon and either re-emits a photon, or vibrates more and warms up, which causes it to bump into surrounding molecules. Your hair blower heats air by mostly by conduction and forced convection. But the radiation is significant too as the element is red hot, and there are about 10^19 molecules of CO2 per litre of air blown through your hair dryer, and round about 100 tomes as may H2O atoms for IR photons to bump into as well.

        • Mike Flynn says:

          DM,

          As you said “. . . radiation is significant too as the element is red hot, . . .”.

          In other words, you say N2 and O2 do not absorb infrared, but on the other hand radiation is significant. IR radiation, presumably. If the element is not quite red hot, the air still heats.

          Well, O2 and N2 both absorb and emit infrared. Dry air, scrubbed of CO2 can be both heated by radiation, and allowed to cool, when the heat source is removed. Another example. Liquid nitrogen, evaporates very quickly above its boiling point. It absorbs IR from the environment. Air and all other matter definitely emits IR – which is absorbed by thermometers and can be used to determine the temperature of the air or other matter.

          As a matter of fact, NASA agrees with Tyndall that about 30% of the radiation from the Sun (mostly IR and UV), does not even reach the surface. Yes, at some IR wavelengths, some gases are more opaque and reflective than others. However, cylinders of CO2, O2 and N2, in the same environment, have the same equilibrium temperature, even though they have different specific heats, etc.

          There is much nonsense put about relating to CO2 and other gases only absorbing certain wavelengths. Compress a mixture of gases quickly, say in a Diesel engine. The O2, CO2, H2O, N2 and all the rest, very quickly reach say 600 C. What specific frequencies are generated by the cylinder walls to achieve this feat? Or do the molecules emit specific frequencies? But the others don’t? Maybe its’ magic?

          Not at all. Just normal physics at work.

          Cheers.

  20. JDHuffman says:

    “The lid is analogous to Earth’s greenhouse effect, which reduces the ability of the Earth’s surface to cool to outer space.”

    WRONG!

    The atmosphere has no “lid”. Energy flows freely to space.

    That’s why the GHE is bogus.

    Nothing new.

    JDHuffman, you are free to believe in what you want. But my many posts on this subject have obviously been ignored by you. Start your own blog. -Roy

    • Mike Flynn says:

      JDH,

      Spot on.

      [Mike Flynn, you are free to believe in what you want. But my many posts on this subject have obviously been ignored by you. Start your own blog. -Roy]

      The pseudoscientific GHE true believers deny that temperatures drop at night, or in winter . . .

      “Ah, but . . . infrared!”, they cry enthusiastically.

      From NASA –

      “NASA’s Atmospheric Infrared Sounder (AIRS), aboard the Aqua satellite, senses emitted infrared and microwave radiation from Earth. The information is used to map such atmospheric phenomena as temperature, humidity, and cloud amounts and heights. In the AIRS imagery of Dorian, captured during the afternoon (local time) of Aug. 29, 2019 . . . ”

      To satisfy those who quibble –

      “The MODIS instrument has 36 different spectral bands (groups of wavelengths), including some that detect thermal radiance, or the amount of infrared energy emitted by the land surface.”

      Gee. Measuring the Earth’s skin temperature with infrared transmitted from the surface through he atmosphere! / sarc on Who’da thunk such a miracle could occur? /sarc off.

      I’ll let the pseudoscientific GHE true believers work what happens to energy actually absorbed by gas molecules in the atmosphere.

      Cheers.

    • barry says:

      “WRONG!

      The atmosphere has no “lid”. Energy flows freely to space.”

      Nope. Energy would flow ‘freely’ to space if there was no atmosphere soaking up and re-emitting the energy lost directly from the surface.

      But on Earth there is a porous obstruction between the surface and space, and energy has to make its way to space through it. Any object that has its rate of heat loss slowed becomes warmer, and thus the average (daytime + nighttime) surface temperature of the Earth is warmer than it would be with no atmosphere, even though the atmosphere also inhibits some direct solar radiation reaching the surface.

      The pot lid gets warmer and radiates heat itself. The energy is not magically trapped beneath the lid (just as atmospheric molecules don’t simply ‘trap’ infrared radiation). What the lid does is to slow the rate of energy loss from the water in the pot to the room (by suppressing convection).

      The analogy between the atmosphere is not about lids – it’s about the rate of heat loss being slowed. It doesn’t matter if the heat loss is convective, radiative, conductive or some combination, the same principle applies.

  21. David Young says:

    Well Roy, This gets to the heart of the issue. Since the truncation numerical errors and the sub grid model errors are larger than the changes in fluxes we are interested in, skill can only be achieved by tuning the cancellation of large errors. In this case, there is no expectation of skill for any parameter not involved in the tuning. This explains why there is essentially no skill in things like regional climate.

    • David, while I agree that it *might* explain why there is *little* skill in regional climate *change* (3 important distinctions, as climate models do pretty well explaining regional climate differences), I’ve already shown that for global average surface temperature, the biases in individual models’ energy fluxes do not seem to matter. Nor any “truncation numerical errors”. Otherwise the models would drift warm or cold, which they don’t. You obviously have either not read what I have written or do not understand it.

      • David Young says:

        I think I understand what you wrote Roy. The models will not drift warm or cold because of simple conservation of energy and tuning for TOA radiation balance. If the ocean heat uptake is roughly right as it appears to be, then the warming rate will be roughly right (at least in the integral sense even though the pattern or warming might be badly wrong as all the hubbub about the pattern of SST warming shows). Science of Doom has a great post recently documenting the lack of skill in patterns by GCM’s.

        My point still stands as well and does not contradict this first point. Numerical errors in any finite difference scheme are at least as large as the third derivative of the quantity times the mess spacing cubed. With a 100 km mesh spacing, these errors are very large. The solutions will be wrong in detail and only tuning can bring into line with data any output quantities.

        The same can be said of sub grid scale models. Even current high Reynolds’ number turbulence models can produce local errors that can get quite large globally (due to the needed convection of turbulence and its constant creation and destruction).

        There is no magic numerical principle by which large local errors cancel out for a chaotic system. Such a maximum principle exists for elliptic PDE’s but not for fluid dynamics. Discrete conservation can help get 5 quantities roughly right in an integral sense if the fluxes are tuned to agree with data. That’s about it.

  22. kevink says:

    Again, as a refresher course in radiative physics, the alleged “radiative greenhouse effect” occurring in the gaseous atmosphere surrounding the Earth merely acts to delay the flow of energy though the system by causing energy to make multiple transits through the system while changing the direction of travel multiple times.

    Since this energy flow always occurs at nearly the speed of light this simply acts as a hybrid thermal/optical delay line and delays the unavoidable flow of energy from the Sun to the Earth and back to the energy free void of the universe by a few fractions of a second.

    There is no “lid” on the atmosphere of the Earth that blocks this forever ongoing flow of energy through the system.

    It’s kinda of sad that Dr. Roy is still playing around with stove top metaphors that do not apply to the flow of energy as radiation which always occurs at nearly the speed of light.

    Cheers, KevinK.

    If the earth system immediately cools to space radiatively, then why doesn’t it just keep cooling no matter what the solar input is? Why don’t nighttime temperatures drop to near absolute zero? It’s kind of sad you still don’t understand the basics of energy transfers, radiation, and temperature. -Roy

    • Steven Mosher says:

      “Again, as a refresher course in radiative physics, the alleged “radiative greenhouse effect” occurring in the gaseous atmosphere surrounding the Earth merely acts to delay the flow of energy though the system by causing energy to make multiple transits through the system while changing the direction of travel multiple times.”

      No.

      GHGs ( c02 included) raise the ERL. the cause the earth to cool less rapidily to space.. otherwise known as warming. It has ZERO to do with the delay

      https://www.youtube.com/watch?v=slPMD5i5Phg

      • Mike Flynn says:

        SM,

        No. Cooling less rapidly is known as cooling by real scientists. Only dimwitted pseudoscientific GHE true believers think cooling means warming.

        Maybe you also think that warming less rapidly is cooling? How bizarre!

        Cheers.

      • JDHuffman says:

        That video is pure pseudoscience.

        At 6 minutes: “There has to be someplace colder for the planet to radiate.”

        The clown is trying to use the WRONG equation. A body does NOT have to have a “cold place” to radiate to. A body radiates based on its surface temperature.

        Steven Mosher has NO knowledge of the relavant physics.

    • kevink says:

      Dr, Spencer wrote;

      “If the earth system immediately cools to space radiatively, then why doesnt it just keep cooling no matter what the solar input is? Why dont nighttime temperatures drop to near absolute zero? Its kind of sad you still dont understand the basics of energy transfers, radiation, and temperature. -Roy”

      With respect Dr. Spencer, I do not believe I ever stated that the Earth System “immediately cools to space radiatively”

      I think a more correct statement would be that the “Earth System Always cools to space radiatively”, 24/7/365…

      “then why doesnt it just keep cooling no matter what the solar input is?”

      Well, in fact, it is always cooling, 24/7/365… At the same time is is also always warming, 24/7/365…..

      “Why dont nighttime temperatures drop to near absolute zero?”

      Well for one thing there is a heck of a lot of thermal capacity in the Oceans…. If the Sun “went out” tomorrow, it would probably take a few years (or maybe longer, I don’t want to waste my time calculating it) for the Earth to reach absolute zero.

      “Its kind of sad you still dont understand the basics of energy transfers, radiation, and temperature. -Roy”

      With all due respect Dr. Spencer I am fully versed in “the basics” of energy transfers, radiation and temperature.

      Sorry that the Radiative Greenhouse Effect is still an unproven hypothesis, but paradigms shift from time to time.

      I’ve burnt out a few clutches doing a paradigm shift….

  23. kevink says:

    My reference to “nearly the speed of light” is in recognition that light travels “very slightly slower” through a gas, liquid, or solid material with respect to the velocity in a vacuum. This slight change in velocity has no effect on the “radiative greenhouse effect” hypothesis.

    Cheers, KevinK

  24. gallopingcamel says:

    Dr. Roy said:
    “Instead, after 30 years and billions of dollars of research they still produce from 1.5 to 4.5 deg. C of warming in response to doubling of atmospheric CO2.”

    It did not take 30 years! The Arrhenius paper was written in 1896 or about 123 years ago.

    When it comes to precision Motorola and airlines aspire to “Six Sigma” which means that less than 3.4 passengers will die out of every million journeys.

    Respectable physicists (like me) aspire to “Three Sigma” which means our hypothesis has a 99.73% probability of being correct.

    Behavioral scientists aspire to “Two Sigma” or a 95% probability of being correct.

    In “Climate Science” after 123 years the “Sensitivity Constant is 3.0 +/- 1.5 degrees Centigrade/doubling of [CO2]. That is a precision of +/- 50%.

    Science that aspires to “One Sigma” (+/- 32%) is rightly derided as “Squishy” yet “Climate Science” fails even that dismal standard…….SINO (Science In Name Only).

  25. donald keith penman says:

    You could call this the pressure cooker model of Earths overall temperature. I wonder if the outside temperature would make a difference, outside the pressure cooker is room temperature but outside the atmosphere is space which has almost no temperature. The atmosphere warms up if the surface is heating it from below but cools rapidly if the surface is not warming it (at night for instance ). The equilibrium between the atmosphere and the surface would be the lapse rate (unchanging ) as energy transferred between two masses decreases with distance and the surface is warming the atmosphere, if the lapse rate is changing the surface is not in equilibrium with the atmosphere. this works fine if the earth can be thought of as one object such as a pot which has the same pot and the same lid but the earth might also be thought of as many pots and many lids which are combined together to form the earth.

  26. Dr Myki says:

    Kudos to Dr Roy for clearly explaining the issues involved with climate modelling.
    I do not always agree with him, but I certainly respect his “luke-warmist” position.

    He also deserves kudos for being willing to read, analyse and publicly critique Frank’s paper. The resulting flack and ignorant comments from “denialists” is something we “alarmists” have dealt with for decades. It is a tedious task endlessly rebutting falsehoods and correcting errors in interpretation.

  27. Stephen P Anderson says:

    It won’t warm any in response to CO2.

  28. Stephen P Anderson says:

    Difficult to believe we have recent warming of the deep ocean when LWIR doesn’t hardly penetrate the ocean surface.

  29. ren says:

    How much will the temperature in North America drop in the winter when La Nina develops?
    https://www.tropicaltidbits.com/analysis/ocean/cdas-sflux_ssta_global_1.png

  30. Mark Wapples says:

    Although i like the analogy, as a model it contradicts the CO2 theory.

    The pan lid stops heat loss by restricting convection, something that is never discussed in the climate models.

    Has anybody ever investigated how layers in the Earths atmosphere can prevent convection building up, ie a cold layer can cause the crystallisation of water vapour and cause rain limiting the extent of the circulatory pattern.

    • gbaikie says:

      Convection roughly stops at top of troposphere. Convection in terms rising and falling air mass.
      Air becomes lower temperature as elevation increase and air density lowers and lower density of air will transfer or convect less heat.
      Or I guess you could say, convection builds up closer to surface rather than higher in elevation. In room one gets warmer air near ceiling because warmer air has less density and rises or cooler air falls.
      Most heat in atmosphere doesn’t have air masses rising and falling as way to transfer heat, instead heat transfer mostly occurs by collision of air molecules, and kinetic energy rises and falls and you average lapse rate of about 6.5 C cooler air per 1000 meter of elevation.
      So individual molecules stay put because zillions collisions prevent a molecule from traveling any distance. But if mix a gas with air, say Argon, the argon gas will become evenly mixed with the air {or the argon molecule do move or become evenly distributed within the air].
      And water vapor is gas and “moves” in terms becoming evenly distributed within the air.
      And most surface of Earth is water, and water evaporation is major factor in terms heating or warming Earth’s atmosphere.

    • Bindidon says:

      Mark Wapples

      “The pan lid stops heat loss by restricting convection, something that is never discussed in the climate models.”

      What are you telling here?

      It costs you no more than a minute to find one of the oldest papers linking climate modeling and convection together:

      ftp://texmex.mit.edu/pub/emanuel/PAPERS/ezr99.pdf

      From the abstract:

      Cumulus convection is a key process in controlling the water vapor content of the atmosphere, which is in turn the largest feedback mechanism for climate change in global climate models.

      Yet scant attention has been paid to designing convective representations that attempt to handle water vapor with fidelity, and even less to evaluating their performance.

      Here the authors attempt to address this deficiency by designing a representation of cumulus convection with close attention paid to convective water fluxes and by subjecting the scheme to rigorous tests using sounding array data.

      The gap between published science and subjective opinion sometimes is a bit broad, isn’t it?

    • barry says:

      Ramanathan and Coakley in 1978 gave a detailed review of Radiative Convective Models that had been around for some time already.

      http://www.atmosp.physics.utoronto.ca/people/guido/PHY2502/articles/rad-convec/Ramanthan_Coakley_1978.pdf

    • Dr Roys Emergency Moderation Team says:

      Bindidon, barry, please stop trolling.

    • David Appell says:

      Mark Wapples says:
      The pan lid stops heat loss by restricting convection, something that is never discussed in the climate models.

      Mark, no.

      Here is a description of a climate model:

      “Description of the NCAR Community Atmosphere Model (CAM 3.0),” NCAR Technical Note NCAR/TN464+STR, June 2004.
      http://www.cesm.ucar.edu/models/atm-cam/docs/description/description.pdf

      Download the PDF and start reading. Sections 4.1 to 4.3 are about convection.

      In fact, the word “convection” appears 49 times in the description document.

    • Dr Roys Emergency Moderation Team says:

      Maybe a fourth person could make essentially the same point. That would be worthwhile.

  31. pochas94 says:

    The heated covered/uncovered pot analogy should be a clue that what we have is a convective troposphere and that all of these radiative calculations are a bollocks. Because convection is the one and only reason that it makes a difference whether the pots are covered or uncovered.

    • gbaikie says:

      Your insulation of your house is mostly about inhibiting convectional heat transfers {keeps house warm and keeps house cool}.
      And next in importance in terms heat transfer via conduction of heat.

      This roughly the same if had house on Mars or Moon.
      But due to intensity of sunlight on Moon doing something about radiant transfer would become more important.
      Or a greenhouse on Moon could cause air temperature of 120 C, and could keep air cooler by first reflecting the sunlight or partially reflecting the sunlight.

      With earth atmosphere, it’s same thing- sunlight is reflected before reaching the Earth surface, and limit max surface temperature [or car windows rolled up] to 80 C.

      Or max ground temperature on Earth is about 70 C, and require the sun to be near zenith. Or outside the range of 9am to 3 pm, sunlight can never warm ground to 70 C. Or nowhere on Earth is sunlight near zenith outside the 6 peak hours of sunlight.

      This means if could magically stop all radiant heat loss from Earth, Earth temperature or average temperature isn’t very or extremely high- or not vaguely, Venus like.
      And when allow 40 watts per square meter to directly radiated to space [all the times] to emitted to space, it’s even cooler.

      • gbaikie says:

        Also, we say that Earth average temperature is 15 C.
        But if average temperature is 15 C, why is average temperature of the entire ocean about 3.5 C.

        If you could “magically”stop all radiant heat loss, you get an average air temperature being the same as ocean temperature.
        So if average global air temperature was say 30 C, then ocean temperature would be 30 C {it would take maybe a millions year for the ocean to reach the same temperature as air {in world magically prevented radiating energy into space] but it eventually become the same temperature.
        And in terms geothermal energy it would millions of years {say 10 or 100} that can just keep climbing forever- because Earth is heated by radioactive heat- so that way, one be hotter than Venus- but not from just sunlight.

        • gbaikie says:

          Because the Moon’s low gravity. Say you had tall cylinder {a magically structurally strong cylinder] which was 500 km tall, transparent, and on lunar surface the air pressure was 14.7 psi] the air temperature could reach 120 C near the surface, but 200 km higher elevation the air pressure would a lot less and air temperature would a lot cooler.
          But say you a floor at 200 km elevation, the sunlight heat floor could cause the air temperature to 120 C, and cause air temperature at lunar surface to become much hotter than 120 C.
          That’s how Venus is hot at it’s rocky surface.

        • Entropic man says:

          Gbaikie

          “But if average temperature is 15 C, why is average temperature of the entire ocean about 3.5 C?”

          Because of the behaviour of seawater. Like other materials seawater gets denser as it cools. Unlike other materials, density peaks at 4C and then drops again between 4C an 0C.

          This has three consequences.

          1) 4C water sinks to the bottom.

          2) In the tropics the warmest water floats to the surface.

          3) Near the poles water cooler than 4C floats, giving acold surface layer, and floating ice.

          The result is a temperature profile like this.

          http://earthguide.ucsd.edu/virtualmuseum/Glossary_Climate/gencircocean.html

          The cold deep water is replenished at the poles. Other energy exchange takes place almost entirely at the surface with limited mixing to depth. The surface layers have warmed due to global warming but the depth profile stays similar and most of the ocean volume stays close to 4C.

          • gbaikie says:

            “Entropic man says:
            September 14, 2019 at 2:06 PM
            Gbaikie

            But if average temperature is 15 C, why is average temperature of the entire ocean about 3.5 C?

            Because of the behaviour of seawater. Like other materials seawater gets denser as it cools. Unlike other materials, density peaks at 4C and then drops again between 4C an 0C.”

            You describing freshwater, not seawater:
            https://www.open.edu/openlearn/science-maths-technology/the-oceans/content-section-3.2

            But whether fresh or salt water, water don’t conduct heat well, ice is better conductor.
            But if given enough and the surface temperature was uniform temperature of 15 C, the entire ocean would be 15 C.

            “The cold deep water is replenished at the poles.”
            Yes.

            Replenished faster than warmer air above could possibly warm it due to the very poor conduction heat thru the water.

          • Entropic man says:

            Gbaikie

            There is some mixing.

            Research thermohaline circulation.

          • gbaikie says:

            –Entropic man says:
            September 14, 2019 at 5:37 PM
            Gbaikie

            There is some mixing.

            Research thermohaline circulation.–

            Yes.

            I think there is more mixing than is normally suspected.

            But these magical giant mixers were not suspected by anyone.
            Reminds me of giant serpent encircling Earth, Jörmungandr:

            “In Norse mythology, Jörmungandr (Old Norse: Jǫrmungandr, pronounced [ˈjɔrmunˌɡandr̥], meaning “huge monster”, also known as the Midgard (World) Serpent (Old Norse: Miðgarðsormr), is a sea serpent, the middle child of the giantess Angrboða and Loki. According to the Prose Edda, Odin took Loki’s three children by Angrboða—the wolf Fenrir, Hel, and Jörmungandr—and tossed Jörmungandr into the great ocean that encircles Midgard. The serpent grew so large that it was able to surround the earth and grasp its own tail. “- wiki

            But these giant mixers, also need a name.

          • bobdroege says:

            Just wanted to mention that seawater has a peak density at -2 C or 28 F. For the average salt content of seawater roughly 35 K ppm.

            It is fresh water that peaks at 4 C, the salt messes that up.

          • Dr Roys Emergency Moderation Team says:

            Just wanted to mention that you should please stop trolling.

        • Chic Bowdrie says:

          “But if average temperature is 15 C, why is average temperature of the entire ocean about 3.5 C.”

          Apparently the giant mixers at the bottom of the ocean are not working.

          • Entropic man says:

            The Illuminati ordered that they be switched off to create global warming.

          • Michael flynn says:

            CB,

            The mixers are working fine.

            That’s how all the heat entering the bottom of the oceans from thermal vents, mid-ocean ridges, and the slow but inexorable heat released through he crust as the core cools, eventually makes its way to space.

            The water at the bottom is at maximum density. When heat is absorbed, the water expands, and floats upwards a little. On the other hand, water at the surface, water cools, contracts, and sinks.

            After a little while, the familiar thermal profile emerges – dependent on local salinity, of course.

            As part of the convection process, combined with crustal hotspots, the aforementioned vents, ridges and so on, ocean currents form and are maintained, sometimes travelling in reverse directions at different depths. The oceans movements are subject to chaos. Strange, unexpected, and bizarre regime changes occur, to everyones’ astonishment.

            Contrary to the belief of bodies like NOAA and others, cold bottom water does not come from the polar regions, and magically transport itself around the globe. Just ordinary physics in action. No magic required.

            All is progressing as it should, I hope.

            Final comment. I think I have been banned.

            Cheers.

          • gallopingcamel says:

            There is a simple explanation for the fact that the “Deep Ocean” is at a temperature of ~4 degrees Centigrade. Water reaches its maximum density at that temperature which explains why it is so hard to freeze oceans from top to bottom.

          • gbaikie says:

            –gallopingcamel says:
            September 18, 2019 at 7:30 PM
            There is a simple explanation for the fact that the Deep Ocean is at a temperature of ~4 degrees Centigrade. Water reaches its maximum density at that temperature which explains why it is so hard to freeze oceans from top to bottom.–

            That applies to fresh water lakes.
            Not true with saltwater.
            Antarctic deep water {google it}

            Wiki:
            “The Antarctic bottom water (AABW) is a type of water mass in the Southern Ocean surrounding Antarctica with temperatures ranging from −0.8 to 2 C (35 F), salinities from 34.6 to 34.7 psu.”
            And:
            “As the freezing point of sea water is lowered with increasing pressure (−0.07C per 100 m of depth), the shelf water in contact with the base of the ice shelves often at a depth of many hundreds of meters, attains temperatures well below −2.0C. ”
            https://www.sciencedirect.com/topics/earth-and-planetary-sciences/antarctic-bottom-water

    • David Appell says:

      pochas: most of the energy transfer in the atmosphere is radiative, not convective.

      See Trenberth’s energy balance diagram:

      https://scied.ucar.edu/radiation-budget-diagram-earth-atmosphere

      • Dr Roys Emergency Moderation Team says:

        David, please stop trolling.

      • coturnix says:

        jesus christ, what a facepalm! first you don’t know the difference between the solstice and the aphelion, and now this. You just keep delivering, don’t you? I mean, did you even look at the frigging diagram?

        Ok, here’s how one reads the diagram (dun-dun-dun): out of 161 watts absorbed by the surface, 22 watts=14% is emitted directly to the outer space and therefore doesn’t even count as ‘energy transfer in the atmosphere’, 17 watt = 11% is removed by thermals aka dry convection, 80 watt = 50% by latent heat aka evaporation, and a mere 374-333=41 watt = 25% by the radiative transfer into the atmosphere. How is 25% ‘most’?

        • bobdroege says:

          You ask

          “and a mere 374-333=41 watt = 25% by the radiative transfer into the atmosphere. How is 25% most?”

          Because you are supposed to add, not subtract!

          • coturnix says:

            Nope, because we’re talking about net fluxes not radiance.

            Think of thought experiment: in a room where you are now, the temperature is probably around 20C, meaning that a wall in front of you radiates about 400W*m-1 of energy towards the other wall, which does exactly the same. So, that means that means that the total energy fluxes in your room if around 800W*m-1! Dig all that free energy! Exccept that it’s not. The energy flux in your room barring for infinitesimally small fluctuations is exactly zero. The radiance is not, but who cares? If you were to actually look into the details of microscopic energy fluxes and take their individual components seriously, you’d have to assign an energy flux to a simple air pressure (enter the sydragon slayers).

            Here’s what i mean. The air in ur room has a pressure of around 100kPa – approximately, the air around me has a pressure of around 87kPa, exct value is irrelevant. So, what is pressure, I ask thee? Pressure is a force per unit are And what is force? It is mass times acceleration BUT it is also *momentum* per unit time. And what is momentum? It is a two times mass time ENERGY! therefore, it is bovious now that ‘static’ actually corresponds to a directional flux of energy, lets calculate it: P=F/S=dp/S*dt => DE/S/dt=P*sqrt(5RT/u)=64.5MEGAwatt*m-2.

          • coturnix says:

            ERRATA to the previous comment: of course 400W*m-2, not W*m-1, and momentum is a *square root* of 2mE

          • bobdroege says:

            Nope, David was not talking about net fluxes, he was talking of total fluxes.

            Photons don’t interact with each other so your post is essentially a nothing post.

            So are you a sky dragon slayer, hey joe, say it ain’t so.

            The sky dragon is still alive and well.

          • coturnix says:

            >>Nope, David was not talking about net fluxes, he was talking of total fluxes.

            Exactly! That’s why I responded, because it is disingenuous to compare ‘total’ fluxes on one hand and net fluxes on the other. It’s like comparing appels to oranges [pun intended], meaning that he’s either making a gross error or being dishonest. I guess, we’d have to ask him which of these two possibilities is correct.

            You have to compare apples to apples, by using the same degree of approximation. What he’s done is like comparing revenues of walmart to profits of target. Makes literally no physical sense. if you compare next fluxes for latent and sensible heat, you need to compare them to the net fluxes of radiant energy; if you compare gross fluxes of radiant energy, you need to compare them to the gross fluxes of ‘molecular heat’ which as i mentioned, are about 4 orders of magnitude larger than the gross fluxes of radiant heat. Ether way, the radiant fluxes are not dominant.

            >>Photons don’t interact with each other so your post is essentially a nothing post.

            what you just said completely irrelevant in the context of this discussion.

            >>So are you a sky dragon slayer, hey joe, say it ain’t so.

            Nope, i just thought that the insane SDS mob would find my comment interesting =) because it touches issues that are relevant to their mistaken understanding of GHE

            >>The sky dragon is still alive and well.

            Never said it was not, it is mr. appel who effectively panders to the SDS mob by misrepresenting physics and thus confusing people.

          • coturnix says:

            on the second thought, it is not so much a fault of mr. Appel, as it is a fault of dr Trenberth himself. I’ve been thinking about ‘the diagram’ a lot recently, and came to a not so obvious conclusion that it is ‘the diagram’ that is tricky and misleading. Should be dubbed ‘loki diagram’ =) By selectively showing some fluxes and not showing others, it confuses and misleads people about how the climate functions. I don’t know why dr. trenberth made it this way, whether he intended to trick people or it just happened as a side effect of some othergoal, but that’s how it is.

            To rectify the situation, I made a better version, sorry for my lacking photoshopping skills. https://imgur.com/a/Tg98VCW

          • bobdroege says:

            So you made a better diagram, where did the energy from the photons you removed from your diagram go?

          • coturnix says:

            I had to ignore it of course. Under typical earth conditions, the energy of photon gas, which scales with the fourth power of temperature, is over ten billion times less per volume than the internal heat energy of the molecular gas aka air. Basically it is on order of 1-10 microjoules per cubic metre as far as i could find out, and therefore can be safely ignored, just like all climate models do to my knowledge.

            While such a value is certainly not immesureably small in principle, calorimetry is such an imprecise discipline that it is immesurable for all practical purposes. Even inside the sun the photon gas afaik is far from dominant, though i don’t know if it can be ignored in calculations. I mean, by the same principles, the energy of photon gas inside the sun is around 10^13 joules*m-3 (around 3 million kwh per cubic metre), which seems like bloody plenty by earth standards, but you have to compare that to the energy of the baryonic matter also present there. For example, the pressure of the photon gas is 1/3 of its energy so the same order of magnitude of 1e12-1e13 pascals, while the actual pressure inside the sun, as reported by google is typically 1e11 atm or 1e16 pascals. Thus, the contribution of photon gas to the equation fo state of the core of sun seems to be actually quite small, on order of 1e-3 to 1e-4. That’s alot more than its contribution to the earth atmosphere which is on order of 1e-10, but sill pretty negligible.

          • bobdroege says:

            So you consider 666 watts per meter squared over the entire surface of the earth inconsiderable.

            By the way, your use of the term photon gas, confirms to me your wing-nut status.

            Just one question, how many foot-pounds?

          • coturnix says:

            >>So you consider 666 watts per meter squared over the entire surface of the earth inconsiderable.

            not sure what ‘inconsiderable’ means. I explained my position albeit possibly not very well as i am not smart or eloquent, english is not my first language and dr. spencers blog web interface is not very suitable for long and substantive discussions, to put it mildly. If you don’t understand what i meant it is ok for aforementioned reasons, but unless you ask more specifically, i’m not sure what i can answer.

            As it is said, you can lead a horse to water, but you can’t make him drink. It’s up to you now, that is if you care.

            >>By the way, your use of the term photon gas, confirms to me your wing-nut status.

            Since i’m not american, i have some trouble picking up your idioms. Let me guess – do you mean that i am in your opinion a crazy far right ideologist? Well, in some way I am while in others I am not; but what i fail to see is how the use of a perfectly scientifically legal and not extremely out-of-place term ‘photon gas’ makes me a winged nut? I think you’re just rationalizing your prejudice.

            >>Just one question, how many foot-pounds?

            Ok, this one took me a couple of minutes to figure, good one. I’m metric, so how should i know?

          • bobdroege says:

            So you didn’t answer my question, where did the energy go that you removed from Trenberth’s diagram?

            And you went on with some bs about photon gas, which though real, doesn’t have any meaning in this discussion.

            As to wing-nut and foot-pounds, perhaps newton-meters would be better to describe whether or not your head is screwed on tight or not.

          • coturnix says:

            >>So you didnt answer my question, where did the energy go that you removed from Trenberths diagram?

            I didn’t remove ANY energy from the TD because it was not there. I just removed the counterflowing radiance fluxes that just confuse people, by replacing them with their resultant. There is no energy density that pertains to those fluxes because for the accuracy and precision that the models work with, the speed of light is assumed infinite (to my knowledge) and therefore energy density corresponding to fluxes is exactly zero. There is nothing to remove. The photon gas model was an attempt to crudely explain this concept by actually calculating that energy that is not there and why it is ok to remove it.

          • bobdroege says:

            Yeah Right,

            Are you sure you are not confusing yourself?

            “I just removed the counterflowing radiance fluxes that just confuse people, by replacing them with their resultant.”

            Yeah, and then this

            “The photon gas model was an attempt to crudely explain this concept by actually calculating that energy that is not there and why it is ok to remove it.”

            You got that right, it is crude, and by the way wrong.

            You didn’t do any actual calculation, did you?

          • coturnix says:

            I explained clear enough to understand if you cared to apply some effort. but apparently i’m talking to a moron here. D’nite.

          • bobdroege says:

            I asked for calculations and you say your explanation is good enough.

            Frankly my dear, no it’s not.

            Then you call me a moron, because you won’t do the work.

            A little bit ironic, isn’t it?

          • coturnix says:

            Just got tired of moron like you.

          • coturnix says:

            i also got tired of scrolling up and down to post a comment in this horribly designed f-ing blog software. Anyways, It’s easy: a flux F is measures in quantity per m2/s, and density D is quantity/m3. Hence, F/D=c – velocity, in m/s. Therefore, D=F/c, for climate model approximation c=infinity hence D=zero. If really wanna know the density, you get flux ~400 w/m2 and c=3e8 m/s you get D=400/3e8=1.3 microjoules per cubic metre, times two since radiance flux goes both ways. That’s even less than i got from the photon gas internal energy equation (but the same order of magnitude), which is strange. But then again, photon gas is a rather crude approximation here, maybe i used it not quite correctly. Compare that to pv=nu*rt, dU(p=const)=7/2*r*nu*dt hence dU/(Vdt)=7/2*pv/t=1.2e3 joules/m3/K which is what heat capacity of ideal gas is, which is (2*1.3e-6)/1.2e3=2.2e-9. Completely negligible by all standards. Now was it that fukcing hard to do? this is junior high science, if you can’t do that…

          • coturnix says:

            Ok, i forgot to get complete heat contents of an ideal gas, just multiply the result by 300. Although, real air has less heat in it as it is not really an ideal gas at lower temperatures.

          • coturnix says:

            Note. I mentioned liberally along the discussion some loose terms such as for example ‘gross fluxes of radiant heat’, it seems to me now that there already exists a precise term for such a quantities, namely *irradiance*.

  32. Mik.e Flynn says:

    Roy,

    This was supposed to go elsewhere. I assume you have banned me, but I had already typed it up.

    Dr Frank’s final sentence is “The unavoidable conclusion is that a temperature signal from anthropogenic CO2 emissions (if any) cannot have been, nor presently can be, evidenced in climate observables.”

    I agree with this statement. I do not necessarily agree with every detail in the paper.

    As to ” . . . it sounds like you don’t believe in the “greenhouse effect” . . .”, I try not to depend on belief. If someone can usefully describe the “greenhouse effect”, (and I note that you place quotes around this phrase – would you use quotes for the “Seebeck Effect”?), and without even a description, no testable GHE hypothesis can be proposed. This seems to me, to be Scientism rather than science.

    If I have beliefs, I draw them from my notional adherence to the tenets of the Church of Latter Day Factism. Richard Feynman was obviously a believer – he stated “Nature is absurd”, and “It doesn’t matter how beautiful your theory is, it doesn’t matter how smart you are. If it doesn’t agree with experiment, it’s wrong.”

    Proponents of the GHE don’t have a description, hypothesis, or a theory to bless themselves with!

    Obviously not worthy to join my Church of Latter Day Factism!

    No offence intended – your blog, your rules. I thought a bit of humour might help.

    Cheers.

  33. CO2isLife says:

    The Hockeystick, on which all this nonsense if dependent, makes a sharp Dog Leg in 1902. You can do to NASA GISS and filter for all the stations that existed in 1901, along with their BI. Simply identify Weather Stations that have been in existence since 1902 and have a BI of 10 or less. 10 or less implies a rural station largely removed from the Urban Heat Island Effect. What you will find is that if you control for the Urban Heat Island Effect there has been no warming over the past 117 years. CO2 increased from around 296 to 410 today, and it had no impact of temperatures of stations with BIs 10 and below. Every kid should be doing this experiment in their High Schools.

    Here is the Site: Choose the Weather Station Alice Springs (23.8S, 133.88E) ID:501943260000 as a perfect example
    https://data.giss.nasa.gov/gistemp/station_data_v3/

    • David Appell says:

      Baloney.

      No warming, but all this ice is melting and the seas are rising and plants and animals are moving poleward??

      The hockey stick is required by basic physics. It’s time you learned that:

      1. temperature change is proportional to forcing change.
      2. CO2 forcing change is proportional to ln(CO2).
      3. CO2 has been increasing exponentially.

      => hockey stick.

    • Dr Roys Emergency Moderation Team says:

      David, please stop trolling.

  34. Brian Jones says:

    I thought most of the global warming occurred during winter and at night. In that is the case heat is being stored and then released long after the stove has been turned off.

    • gbaikie says:

      Well the 10 tons of atmospheric mass per square meter is storing heat, as is the ocean surface- and some amount, the ocean depth.

      Oh, also clouds.

    • donald penman says:

      You have to remember that they use anomalies to claim this and it is actually colder in winter and at night than in summer during the day.

  35. Eben says:

    This thread is a disaster, worse than the moon rotating one,
    Which reminds me , here is a simplified demonstration why the moon rotates while showing the same side to the earth –
    for those really dense among us.

    https://youtu.be/j91XTV_p9pc

    • barry says:

      Good video – but let’s for goodness sake not stray back to this interminable bollocks.

      Gordon – as I said just above – it’s the skeptics who go off topic more than anyone else. Right here.

    • Dr Roys Emergency Moderation Team says:

      Eben – nothing here we didn’t already understand. It’s our argument that you people are unable to grasp.

      barry – those defending the status quo on the moon rotation issue bring the topic up with more frequency than we do.

    • barry says:

      A ‘skeptic’ brought it up in this thread. Eben. Proof rather quickly.

    • Dr Roys Emergency Moderation Team says:

      Huh? Eben is not a “moon’s axial rotation” skeptic, barry.

      Proof rather quickly, indeed.

      • David Appell says:

        What’s your definition of “rotation.”

        Is the Earth rotating? How do you know?

      • Dr Roys Emergency Moderation Team says:

        David, you’re really not helping barry’s case. You’re making him look quite foolish.

      • barry says:

        Eben is an AGW ‘skeptic’. That is, obviously, what I am referring to. They derail conversations and introduce red herrings with much greater frequency than anyone else here.

        Who constantly posts off-topic stuff? Ren and you, DREMT.

        Huffman’s regular schtick is that because interlocutor A is wrong about X, they are therefore wrong about the unrelated topic under discussion. Often Huffman doesn’t even bother to tie the current discussion into it.

        Flynn’s interminable requests for a definition of the greenhouse effect is in response to any topic under the sun, no matter how unrelated. He wields that schtick the same way Huffman does.

        The people here who accept the science of AGW – you would call them ‘alarmists’ – are far better at replying on topic, and far less inclined to dredge up unrelated disagreements.

        Nobody is perfect, but the tendencies are starkly clear.

        And who is it that sincerely calls for discussion to stay on-topic here? Roy Spencer, Bindidon, David A and me. Only people who understand the AGW effect do that here. The so-called ‘skeptics’? Pretty much never.

        DREMT – why don’t you help out by policing red herrings? You know, do something useful.

        Otherwise, please stop trolling.

        • gbaikie says:

          –barry says:
          September 15, 2019 at 8:12 PM
          Eben is an AGW ‘skeptic’. That is, obviously, what I am referring to.–

          Is an AGW “skeptic” referring to man made global warming which has occurred or “skeptic” about projection {not predictions} about possible man made warming in the future {which everyone who is vaguely sane, including IPCC, is skeptical of. And due to numerous projections which different, one would have to at least pick one and have to be skeptical of others that don’t agree with one which you regard as most dependable}

          I assume you mean to man made global warming which has occurred, and so I want ask how much global warming has been caused by “human activity”. Plus it seems everyone should agree that Urban heat island effects are caused by human activity. And is there anyone skeptical of the warming in regards to UHI effects.

      • Dr Roys Emergency Moderation Team says:

        “Eben is an AGW ‘skeptic’. That is, obviously, what I am referring to.”

        Eben is not a “moon’s axial rotation” skeptic. That is, obviously, what I was referring to.

        “Who constantly posts off-topic stuff?”

        Just about every regular commenting here. For instance, a discussion about the frequency of off-topic comments is off-topic to this article we’re commenting under.

        Don’t worry, looks like Mike and JD have been banned for having contrary positions on the GHE, so you won’t have to worry about them any more. Banning people for the position they hold is bound to make some people wonder what all the fuss is about regarding that position, and send some inquiring minds in that direction, so I guess hopefully at least some good will come from it.

        “The people here who accept the science of AGW – you would call them ‘alarmists’ – are far better at replying on topic, and far less inclined to dredge up unrelated disagreements.”

        Hogwash.

        “And who is it that sincerely calls for discussion to stay on-topic here? Roy Spencer, Bindidon, David A and me. Only people who understand the AGW effect do that here. The so-called ‘skeptics’? Pretty much never.”

        This discussion is off-topic. I sincerely call for it to stop. I don’t want to discuss the moon’s lack of axial rotation on this thread, either. I sincerely call for that to stop.

        • Svante says:

          How do you know JD has been banned?

        • Dr Roys Emergency Moderation Team says:

          He got the same message from Dr Spencer as M Flynn, and Flynn is banned. Banned as in Dr Spencer has put his name on the list of words that you can’t write here.

          I mean, I don’t know that he’s banned, but I assume so, as he hasn’t commented since.

          • Svante says:

            OK, banned for the third time, I expect he will be back soon.

          • Dr Roys Emergency Moderation Team says:

            Yay, for the GHE Defense Team…”winning” the debate one banned commenter at a time…and no doubt happy and proud of it…

          • Svante says:

            Well he was very repetitive. Why do you think he spent so much time here?

          • Dr Roys Emergency Moderation Team says:

            Response.

          • David Appell says:

            Dr Roys Emergency Moderation Team says:
            He got the same message from Dr Spencer as M Flynn, and Flynn is banned. Banned as in Dr Spencer has put his name on the list of words that you cant write here.

            HOW DO YOU KNOW what message Flynn received?

            Or JDH/Ger*an?

            How do you know who Dr S put on a list?

            Very fishy…. You seem to have inside information. How so? Who are you, really? Be honest….

          • Dr Roys Emergency Moderation Team says:

            OK, I’ll come clean. I’m Dr Spencer’s son…Sir Jacob Spencer. I secretly control the blog and pull all the strings behind the scenes.

          • David Appell says:

            Dr Roys Emergency Moderation Team says:
            Yay, for the GHE Defense Teamwinning the debate one banned commenter at a timeand no doubt happy and proud of it

            Here’s hoping they keep “winning,” one banned idiot at a time.

          • Dr Roys Emergency Moderation Team says:

            Yes, you people openly call for censorship and I’m sure you’re delighted when people’s right to freedom of speech is taken from them.

          • Nate says:

            There is no freedom of speech in Dr Spencer’s house, nor your house, DREMT.

            If someone comes to your house and starts calling your daughter a slut, I don’t fault you if you kick them out.

  36. ren says:

    Water vapor packages are lighter than the air around them. The water vapor molecule has a low molecular weight.
    https://www.tropicaltidbits.com/sat/satlooper.php?region=gom&product=ir

    • barry says:

      Though ren is harmless, this interminable off-topic posting would not be missed by me.

      • Bindidon says:

        barry

        I understand your point. But what I would miss even far less are all these incredibly stupid comments like

        “barry, please stop trolling.”

        originated by a troll nicknamed ‘Dr Roys Emergency Moderation Team’.

        Who the heck gets us rid of that?

      • Dr Roys Emergency Moderation Team says:

        Openly calling for censorship, eh, Bindidon?

        • bobdroege says:

          Says the stooge openly calling for censorship.

        • Dr Roys Emergency Moderation Team says:

          Politely (or even impolitely) asking people to “stop trolling” is not “calling for censorship”. They’re more than welcome to keep commenting, and trolling, if they wish…and I’m sure they will.

          Bindidon is clearly hinting at getting another ban from Dr Spencer, for me.

          That’s calling for censorship.

          • bobdroege says:

            Yeah, but when you do it say a thousand times it does indeed appear to be censorship. You have more than worn out your welcome with that repeated phrase.

            What Bindindon should have asked is

            “Will no one rid me of this troublesome Dr Roys Emergency Moderation Team?”

            Now that wouldn’t be a call for censorship either.

          • Dr Roys Emergency Moderation Team says:

            bobdroege, please stop trolling.

          • bobdroege says:

            Now if I only had four medieval Knights from Normandy to do my bidding.

          • Dr Roys Emergency Moderation Team says:

            Say that a thousand times, and according to your “logic”, it would become “censorship”.

          • bobdroege says:

            But I haven’t said it a thousand times, you know, if ifs and buts were candy and nuts you might have a logical argument.

            But you don’t, and you are the troll, constantly asking people to stop trolling.

          • Dr Roys Emergency Moderation Team says:

            If you said it a thousand times, it still wouldn’t be a call for censorship.

            Trying to get Dr Spencer to ban me is a call for censorship.

            Sure, asking people to stop trolling can be seen as trolling. Oh well. Does that mean that the people I ask to stop trolling are not trolling? No. That depends on whether or not they’re trolling…

            …every regular here has trolled from time to time. Nobody is prepared to admit it though.

          • bobdroege says:

            What does it take to get it through your thick skull that what would be nice is if you stopped with your stupid please stop trolling comments.

            We would welcome your on topic comments, however it appears you don’t know enough science to do that.

          • Dr Roys Emergency Moderation Team says:

            You keep talking like this is your blog.

            What will it take to get it through your thick skull that I don’t give a shit if you don’t like my “please stop trolling” comments?

          • bobdroege says:

            Allright then, you will always be an ass.

          • Dr Roys Emergency Moderation Team says:

            Sure blob, blah blah blah blah

  37. Jgc says:

    What would you say if after adjusting the flame and lid, different pots have different temperatures, with variations of up to 3.5C among them. Wouldnt this imply a worrying inability for the pot models to replicate the energy balance of the earth? Even after many adjustments.
    That is the actual figure for current GCMs.

  38. Gordon Robertson says:

    roy…”The lid is analogous to Earth’s greenhouse effect, which reduces the ability of the Earth’s surface to cool to outer space”.

    Roy…the lid blocks real particles of air from leaving the pot. It also changes the air pressure inside the pot/lid container, which affects the water temperature.

    There is no analogy between that lid and a trace gas making up 0.04% of the atmosphere. The analogy, if any, is to the ability of glass in a greenhouse to block heated air from rising.

    You have never explained how that trace gas can affect the dissipation of heat at the surface. CO2 can only trap infrared energy in proportion to its mass. Most surface radiation should bypass the CO2 as if it’s not there.

    In order for the trace gas to affect the dissipation of heat at the surface, it would have to block the rising of heated air molecules, as does the glass in a real greenhouse.

    That heated air is 99% nitrogen and oxygen.

    With regard to radiation, Stefan-Boltzmann tells us it’s the temperature of the atmosphere in contact with the surface that controls heat dissipation radiatively.

    See Net Radiation Loss Rate….

    https://www.engineeringtoolbox.com/radiation-heat-transfer-d_431.html

    q = e.sigma.A (Th^4 – Tc^4)

    q = net radiation heat loss
    e = emissivity
    sigma = Stefan Boltzmann constant
    A = area of radiation
    Th = hot body absolute temperature
    Tc = cold surroundings absolute temperature.

    Of course, as a meteorologist you will know far more about surface/atmosphere processes. Ideally, the surface and atmosphere, at the surface, should be in thermal equilibrium. However, air heated at the surface will rise and cooler upper air will replace it. That recycling should cool the surface by affecting Tc.

    Lindzen pointed out that without that convection the surface would average about 72C. Lindzen’s point seems to agree with the equation above.

  39. ren says:

    Does CO2 have a greater impact than ENSO on the water vapor content of the atmosphere?
    https://www.tropicaltidbits.com/analysis/ocean/global.png

  40. ren says:

    A vertical temperature gradient allows the heat transferred by vater wapor to be released in the troposphere.
    https://www.cpc.ncep.noaa.gov/products/stratosphere/strat-trop/gif_files/time_pres_TEMP_MEAN_ALL_EQ_2018.png

  41. Bindidon says:

    For those interested in reactions to Pat Frank’s guest post at WUWT – reactions similar to all those made by Roy Spencer – here are two home posts make by Nick Stokes:

    – How errors really propagate in differential equations (and GCMs)

    https://moyhu.blogspot.com/2019/09/how-errors-really-propagate-in.html

    and, written a few days before:

    – Another round of Pat Frank’s “propagation of uncertainties

    https://moyhu.blogspot.com/2019/09/another-round-of-pat-franks-propagation.html

    As I wrote upthread, Nick Stokes argues since longer time against Pat Frank’s opinions, especially concerning
    – the relevance of systemic errors;
    – how GCM’s exactly do work.

    Look at it; it is not my role to emit any opinion concerning all that stuff.

  42. David Appell says:

    Roy, in 1982 Exxon scientists produced a climate model that has been accurate. How did they accomplish that?

    https://debunkhouse.files.wordpress.com/2015/10/xom1.png

  43. Dan Pangburn says:

    The observation is that, at least since it has been accurately measured worldwide, WV has been increasing about TWICE that expected from temperature increase. Therefore, for periods of a few years or more, WV increase has been driving temperature increase, not the other way around. Calculations are provided in Section 8 of my blog/analysis (click my name).

    Typical relative IR absorbing ability of the greenhouse gasses water vapor and CO2 at zero altitude are shown in this graph calculated by Spectracalc/Hitran using Quantum Mechanics: https://pbs.twimg.com/media/ECWhyyDUYAA1P89?format=jpg&name=medium
    http://spectralcalc.com/spectral_browser/db_intensity.php . At zero altitude, on average, there are about 10,000/410 ≈ 24 H2O molecules for each CO2 molecule. The relative absorb/emit of H2O vs CO2 can be determined by the ratio of sum of the line lengths for each on the Hitran graph. The ratio of the line-length sums divided by 24 calculates that each H2O molecule is about 5 times as effective at absorb/emit of thermal (LWIR) radiation as a CO2 molecule.

    The tiny % increase in ground level absorbers from increased CO2 is countered by the large % increase in emitters to space above the tropopause with the end result that CO2 has no significant effect on climate. Climate sensitivity is not significantly different from zero.

    • David Appell says:

      Dan Pangburn says:
      The observation is that, at least since it has been accurately measured worldwide, WV has been increasing about TWICE that expected from temperature increase.

      Prove it. With a scientific paper, not your blog or calculations.

      • coturnix says:

        >>>not your blog OR CALCULATIONS.
        <<<
        lol, freudian!

      • Dan Pangburn says:

        DA,
        The simple calculations are proof enough. It is appalling that Climate Scientists were too obsessed with CO2 to even look. If they would have looked they, like me, would have discovered that WV increases about twice that from temperature increase alone and therefore WV increase drives average global temperature increase, not the reverse. This proves that their theory that warming from CO2 produced temperature increasing feedback from WV is bogus.

    • Dr Roys Emergency Moderation Team says:

      David, please stop trolling.

  44. David Appell says:

    Roy wrote:
    Thus, we can either make ad-hoc bias adjustments to the various energy fluxes to get as close to the desired water temperature as we want (this is what climate models used to do many years ago); or, we can make more physically-based adjustments because every computation of physical processes that affect energy transfer has uncertainties, say, a coefficient of turbulent heat loss to the air from the pot. This is what model climate models do today for adjustments.

    Roy, GISS’s code is publically available (unlike your’s!). Show us where they do these adjustments.

    NASA GISS GCM Model E: Model Description and Reference Manual
    http://www.giss.nasa.gov/tools/modelE/modelE.html

  45. gbaikie says:

    –This is why climate models can have uncertain energy fluxes, with substantial known (or even unknown) errors in their energy flux components, and still be run with increasing CO2 to produce warming, even though that CO2 effect might be small compared to the errors. The errors have been adjusted so they sum to zero in the long-term average.

    This directly contradicts the succinctly-stated main conclusion of Franks paper:

    LWCF [longwave cloud forcing] calibration error is +/- 144 x larger than the annual average increase in GHG forcing. This fact alone makes any possible global effect of anthropogenic CO2 emissions invisible to present climate models.–

    I don’t think “cloud forcing” makes “anthropogenic CO2 emissions invisible to present climate models”

    It seems if I held this view, I would have to have high uncertainity about the amount warming due to “anthropogenic CO2 emissions”

    Or how could rule out that doubling of CO2 doesn’t cause 10 C of warming if being made invisible by large variation due to “cloud forcing”.

    I don’t think global average temperature changes much.
    As I have said, I think global temperature is connected to average volume temperature of our oceans {which is about 3.5 C}.
    But we have global weather {and regional and local weather} which can vary the air temperature {regionally and locally} by quite a bit. It fluctuates a lot in various regions, but global temperature is restrained/confined by ocean temperature and giving average global air temperature of about 15 C.
    And as I said, global air temperature is not really global temperature, it’s a proxy of global temperature. And if using this proxy, requires measuring the air temperatures over long period of time, which said to be 17 or 30 years [or more than 30 years.
    Or the “real global temperature” could be measure every second but basically remains the same second to second. Or real global temperature 10 years ago was about 3.5 C and today it’s about 3.5 C. And make it interesting you have measure to thousandth of degrees to get change in a year’s time.
    And instead it’s a lot easier now, to measure the global air temperature proxy for global temperature.
    Or ocean temperature is global temperature, ocean temperature affects ocean surface temperature, and ocean surface temperatures is dominate factor controlling global air temperature, but one also have weather effects {including clouds] which affects air temperature. But clouds don’t have much effect in short term {decades} on the temperature of the ocean, and not even much effect upon the surface temperature of the ocean. Or clouds would seem to have stronger effect upon land surface temperatures {which are minor part of the Earth surface].

    I think what makes the effect of rising levels of CO2, invisible, is takes long time to increase the CO2 levels, and the effect of doubling CO2 levels is a global warming of about .5 C. And our measurement of global air temperature is not been accurate enough to detect such a small change in temperature.

    One could also ask the question, assuming CO2 does increase global air temperatures, where on Earth would increase air temperature the most.
    Say would the drier areas in middle of Canada have largest warming effect from higher CO2 levels.
    Or seems quite unlikely it will be uniform temperature increase- some regions would warm more than other regions. And if not Canada, where?

    • gbaikie says:

      From above:
      –Dr Roys Emergency Moderation Team says:
      September 16, 2019 at 9:09 AM
      Ill just put this link near the top of the comments:

      http://www.drroyspencer.com/2019/09/additional-comments-on-the-frank-2019-propagation-of-error-paper/#comment-388652

      As I have said, it seems to me the greatest uncertainty is what causes a lowering global temperature.
      More specifically, what caused the cooling of the Little Ice Age.
      Or to look further back in time, what caused the cooling from the warm period of the last interglacial period, called the Eemian.

      One could focus on the Eemian, simply because I am unaware of anyone who dispute that about 120,000 years ago, Earth had higher average global temperature. Nor, that cooled a lot after 115,000 year ago.

      And there are some people who want argue that LIA was not global and etc. Of course I am sure if some might argue that Eemian was not global- other than the sea level rise part of it, would seem to make that a difficult obstacle.
      Though I don’t much argument about the lowering of sea levels during the LIA as getting in the way of arguing that LIA was not global.
      As far as I am aware, the average ocean temperature during Eemian was higher, than fell after 115,000 year ago. And the ocean temperature warmer during Eemian.
      But prior to LIA, the ocean temperatures were warmer and sea level was higher, and ocean cooled and sea levels dropped during LIA.
      And then in present time, ocean warmed and sea levels measurable warmed.
      If looking for large changes, Eemian has that advantage, but I think closeness in time of LIA is large advantage.

  46. tonyM says:

    Dr Spencer:
    I hope that the prolific number of articles and posts from you since your op is a good guide to your positive recovery.

    Re the debate with Pat Frank both of you are to be commended for the cordial interchange. I appreciate it has fallen flat without an understanding and resolution. I wonder whether both parties have not been at fault here. I see two main areas of irritation viz.

    a) You were gracious enough to state that you did not understand what he was describing as it did not fit into your ideas and experience with error level (including words to the effect of not having any problems understanding the climate literature etc) and he should explain his position clearly. He had explained it in terms of persistent error but added ‘physicists, chemists and engineers understand it so why don’t climatologists grasp it.’

    I agree that does not clarify it; it is brusque. Nevertheless he felt he had stated that it was an uncertainty and not an actual T measure (in response to the fast divergence or error bounds from the model T measures).

    b) You response was that he had not stated this at the outset and considered it BS and that he was simply covering for what was ‘clearly’ an egregious or absurd situation that the T could diverge so far from calibrated and constrained models (ie reality).

    Here you are wrong; he is being genuine, the spread is not a measure of where the model may land and he has not made it up after your interaction. This has been his position all along and the evidence is in prior interchange with others such as Nick Stokes, Patrick Brown and others.

    The evidence from his debate with Brown over 2 years ago is worth reading:

    Pat Frank says:
    January 29, 2017 at 9:20 pm
    https://patricktbrown.org/2017/01/25/do-propagation-of-error-calculations-invalidate-climate-model-projections-of-global-warming/#comment-1427

    This is a response to Dr. Patrick Brown and his critical video. It consists of multiple parts, and is pretty long. So, I’ll post each section separately, so as to make reading and response easier.

    Before proceeding to specific points, I’ll mention that in minute 12:35, Dr. Brown observed that the ±17 C uncertainty envelope in RCP 8.5, derived from long wave cloud forcing (LCF) error is, “a completely unphysical range of uncertainty, so it’s totally not plausible that temperature could decrease by 15 degrees as we’re increasing CO₂. And it’s implausible as well that temperature could increase by 17 decrees as we’re increasing CO₂ under the RCP 8.5 scenario. But as I understand it, this is the point Dr. Frank is trying to make.”

    A temperature uncertainty statistic is not a physical temperature. Statistical uncertainties cannot be “unphysical” in the sense Dr. Brown implies. The large uncertainty bars do not indicate possible increases or decreases in air temperature. They indicate a state of knowledge. The uncertainty bars are an ignorance width. I made this very point in my DDP presentation, when the propagated uncertainty envelopes were first introduced.

    It is true that the very large uncertainty bars subsume any possible future air temperature excursion. This condition indicates that no future air temperature can falsify a climate model air temperature projection. No knowledge of future air temperature is contained in, or transmitted by, a climate model temperature expectation value.

    Dr. Brown continued, “So he’s essentially saying that when you properly account for the uncertainty in the climate model projections, the uncertainty becomes so large so quickly that you can’t actually draw any meaning from the projections that the climate models are making.” On this, we are agreed.

    —————
    I’d like to see this explored more if possible as the debate had started really well. Forgive me if I have not captured any significant points clearly as most of my reading has been done on my phone and am going from memory. I have just got my computer back.

    • captain droll says:

      If you believe in the existence of Frank’s “ignorance width”, I suggest you hand your computer back.

    • tonyM says:

      https://object.cato.org/sites/cato.org/files/serials/files/regulation/2016/12/regulation-v39n4-7_3.pdf#page=8

      There are additional explanations starting page 9.

      Charles L. Hooper and David R. Henderson, “A Fatal Flaw with Climate Models,” Regulation, Winter 2016-2017.

      The IPCC has looked at a number of different cases and it reports that temperatures could be, in the worst case, up to 4 ̊C higher by 2100. However, based on Frank’s work, when considering the errors in clouds and CO2 levels only, the error bars around that prediction are ±15 ̊C. This does not mean–thankfully– that it could be 19 ̊ warmer in 2100. Rather, it means the models are looking for a signal of a few degrees when they can’t differentiate within 15 ̊ in either direction; their internal errors and uncertainties are too large. This means that the models are unable to validate even the existence of a CO2 fingerprint because of their poor resolution, just as you wouldn’t claim to see DNA with a household magnifying glass.

    • Bindidon says:

      tonyM

      Two home posts of Nick Stokes about Frank’s paper:

      – How errors really propagate in differential equations (and GCMs)

      https://moyhu.blogspot.com/2019/09/how-errors-really-propagate-in.html

      and, written a few days before:

      – Another round of Pat Frank’s “propagation of uncertainties

      https://moyhu.blogspot.com/2019/09/another-round-of-pat-franks-propagation.html

      This is really interesting stuff.

      • tonyM says:

        Bindidon:
        Thanks for that but I am not sure what in particular you wish me to look at or how it addresses the points I made i.e. trying to reconcile the issues to allow for further amicable discourse here.

        Just a couple of observations re your Stokes’ references.
        “As in CFD, GCMs solve the Navier-Stokes equations.”

        Not sure what Nick means by “solve.” If the equations were solvable I suggest there would be little room for argument and the GCM would “evolve congruently with the real world” as Frank has posited as a requirement. In addition the reference to the Navier-Stokes equations would render the $1 million prize from the Clay Maths Inst redundant (is someone is $1 million richer??):

        These are called the Navier–Stokes existence and smoothness problems. The Clay Mathematics Institute has called this one of the seven most important open problems in mathematics and has offered a US$1 million prize for a solution or a counterexample.

        Nick’s arguments rely on a balancing proposition for all these variables. Assumptions are quite useless when we know there is a significant error with clouds that is very real.

        If his sort of assumptions held then we would not see the variations from now going backfor much of 20th century.
        b) mid 70’s to 2005 rate similar to d)
        c) decline from early 40’s to mid 70’s
        d) 1910 to early 40’s

        Other than a) the periods all qualify for a “climate” period.
        e) keep going back to the freeze of the LIA and address the 25% to 33% of deaths in Ireland and Scotland and the demise of the Greenland establishments

        f) go through the MWP and the colonisation of Greenland

        and so on to dip before the MWP, Roman WP, Minoan WP, Climate Optimum, Holocene Maximum.

        A ‘cancelling of errors’ is basically the model used by cave man in starting animal husbandry and agriculture – until upheavals occurred and there were plenty even in the Holocene.

        Additionally the models are meant to be forecasting variables on a spatial and temporal basis and not just one grand value.

        Nick is talking as a non scientist i.e. not following the scientific method. Even on this site Spencer/Christy have shown the spaghetti model graphs and compared those to actual. Christy’s statements are clear; models fail and hence fall foul of the scientific method. They are falsified. There is no talk of balancing in due course!

        On Nick’s second paper I have focused on his red highlighted area which is supposed to show some major error. I don’t see any error. For a start the average is not an avg per 20 year. It is simply X units per one year. The sample size was 20 years.

        How does anyone derive an average for a 20 year period unless the samples were in say 20 year lots (say 10 lots of 20 years or 200yrs – which is not the case)? It would be silly to ask what is your average income over the last twenty years and give me the mean $X p.a. and SD (standard deviation) for the 20 year period as being $SD per 20 years. The SD takes the units of the mean.</B)

        The correct equation would then follow from the SD being in the same units as the mean (watts/m2/year). Square that and we get the Variance; it is fine in dimensional terms. How else would you subtract the mean from each item unless in the same units when deriving the SD?

        You may like to see John Christy's presentation. I think he is spot on.

        https://www.youtube.com/watch?v=I8hdE3eZ6vs
        Confronter au réel les affirmations sur le climat (en)

        • captain droll says:

          Let me say right here that you have expressed nothing of relevance.

        • tonyM says:

          Bindidon:
          sorry correction (not sure what happened in the copy /paste):

          Nick’s arguments rely on a balancing proposition for all these variables. Assumptions are quite useless when we know there is a significant error with clouds that is very real. If his sort of assumptions held then we would not see the variations from now going back in time for avg T:
          a) the hiatus effectively from 2005 to 2014 (but really could take 1995 -2014)

          b) etc…

        • captain droll says:

          I had a look at the presentation and was comforted by the fact that many in the audience were of his age and had grand-children. Just like me!

        • Bindidon says:

          tonyM

          I have nothing in common with people attacking you here with unnecessary and counterproductive polemic.

          But this here:

          “On Nicks second paper I have focused on his red highlighted area which is supposed to show some major error. I dont see any error.”

          is simply incomprehensible to me. I apologise, but on this basis I simply can not continue to discuss with you.

          One does not need to be a professional to understand that Nick Stokes got it right.

          Please read Nick’s head post again and again.

          Rgds
          J.-P. D.

          • tonyM says:

            Bindidon:
            I did say I had focused only on the material in red in Nick’s Sunday, September 8, 2019 paper.
            At the top of Nick’s page in red he says:
            See update below for a clear and important error.

            Towards the end of Nick’s page in red:
            Update – I thought I might just highlight this clear error resulting from the nuttiness of the /year attached to averaging. It’s from p 12 of the paper:

            This is followed by an extract from Frank’s paper showing +/- 4 W/m2/year boldly underlined in red by Nick. This is the annual AVERAGE CMIP5 LWCF calibration uncertainty established from prior samples. It is used in calculations for uncertainty propagation.

            Nick concludes:
            Still makes no sense; the error for a fixed 20 year period should be Wm-2.

            Nick is right that the dimensions should be the same in W/m2 but it is the uncertainty (not error) for the 20th year (not for a fixed 20 year period nor for the whole period as asserted by Nick). Pat Frank does not say it should be in other units. If you believe otherwise show me.

            In formula 6 the Ui is not average uncertainty per year but specific year actual uncertainty for year i.

            As it is not possible to add quantities of different dimensions either decide that the uncertainty is simply in W/m2 or if you wish to use Nick’s view that it is per year then he must specify the year “i.” Remember this yearly absolute quantum is not the average so a per year dimension makes little sense when it is for a specific year and is to be added. But go ahead for it is not hard to fix those dimensions (even can have some of the measures in months or minutes) by appropriate weighting.

            Either way, specific year must have its units in W/m2 by adjusting each entry to be summed by its appropriate factor to achieve a quantum. Simply multiply by “1 year” to accommodate the rate and weighting for any year “i” as the summation is all in 1 year intervals. The end result is W/m2

            Bin:
            Thanks for your concerns about criticism but I don’t get flustered as most readily show their puerile nature and I just have a chuckle. I can also dish it out when i choose. 🙂

          • tonyM says:

            Bindidon:
            A follow up on the above. I think we have been led up a garden path. I have had a quick look at Frank’s paper and the Ui are not W/m2/year. They have already been converted to temperature i.e. the uncertainty is expressed as the T change component for the “i”th year due to the propagation of the +/- 4 W/m2/year average uncertainty. This comes from equation 5 in Frank’s paper not shown by Nick.

            So the equation 6 is the uncertainty in projected air temperature “T” after “n” projection steps as stated.

            The principle I espoused earlier would still hold if needed but I can’t see how it applies to this equation 6 and why Nick has made this an issue around W/m2/year

  47. gallopingcamel says:

    David Appell said:

    “GC: How well does your own climate model do?

    What’s its uncertainty?”

    Thank you for asking. I have two EXCEL models to share with you and neither of them is “mine”. One for the Moon and the other is for bodies with significant atmospheres. I will send you both by email.

    The first is an update of Dr. Roy’s lunar model that he posted a little over a year ago. The precision is improved by adding a multi-layer regolith and replacing the simple Albedo that Dr. Roy used with the 8th order polynomial proposed by Ashwin Vasavada.

    This model has an RMS error of 2.8 K relative to the lunar tempperature as measured by NASA. With a little more work I could cut that in half but who would care? My FEA model has an RMS error of less than 1 K but nobody cared about that!

    The other model is an attempt to capture the Robinson & Catling model in the form of a spreadsheet. As you might expect it does not have the precision of the R&C model that uses IDL but I am making progress.

  48. gallopingcamel says:

    This thread shows Dr. Roy’s ability to make complex matters comprehensible. Genius?

    A back of envelope calculation based on Dr. Roy’s right hand saucepan gives a surprisingly accurate estimate of the surface temperature of Venus. Just in case I have completely missed the point let me explain.

    My saucepan is 65 km tall and the plate at the top can radiate into space. This radiation is exactly balanced by incoming radiation from the Sun.

    How do I know that? The top of the plate has a stable temperature (230 K).

    We don’t know the temperature at the bottom of the saucepan but we do know that the net heat transfer to the planet’s surface is close to zero given the low conductivity of rocks.

    There is no heat transfer via the walls of the saucepan because they are surrounded by other saucepans with temperatures that exactly match my saucepan.

    My saucepan is a closed box with a constant temperature at the top. This situation can be analyzed as an adiabatic problem using thermodynamics.

    T(surface) = 230 + 65*7.9 = 743.5 K.

    According to Sagan (1968) the dry adiabat for Venus after correcting for temperature and pressure is 7.9 K/km.

    According to Wlliams (NASA, 2005) the surface of Venus has an average temperature of 737 K

    It is highly encouraging to get this close on a first attempt. There should not be much change when the actual heat transfer at top and bottom of the saucepan is taken into account.

    Would this work for Earth? I am skeptical as the Earth does not have 100% cloud cover. Some outgoing radiation comes from the surface but according to Dr. Roy most of it comes from the troposphere. Clearly a much more complex situation than Venus.

    • gbaikie says:

      –My saucepan is 65 km tall and the plate at the top can radiate into space. This radiation is exactly balanced by incoming radiation from the Sun.

      How do I know that? The top of the plate has a stable temperature (230 K).–

      Is that temperature and is it stable?
      Wiki:
      65 km −30 C [[230 K = -43.15 C]].
      https://en.wikipedia.org/wiki/Atmosphere_of_Venus

      wiki: 65 km pressure is 0.09765 atm
      Also wiki:
      “The cloud cover is such that typical surface light levels are similar to a partly cloudy day on Earth, around 5000–10000 lux. The equivalent visibility is about three kilometers, but this will likely vary with the wind conditions. Little to no solar energy could conceivably be collected by solar panels on a surface probe. In fact, due to the thick, highly reflective cloud cover, the total solar energy received by the surface of the planet is less than that of the Earth.”
      [I would say, a lot less than Earth and lot less than Mars.]

      “We don’t know the temperature at the bottom of the saucepan but we do know that the net heat transfer to the planet’s surface is close to zero given the low conductivity of rocks.”

      Yes, very close to zero, I would say “geothermal” heat transfer is greater than any heating from sunlight. And considering Venus gets constant global heat from interior of planet and only small fraction of the Venus surface get any light from the sun reaching it, the “geothermal” heat is many times greater.
      So when sun is at zenith and having least interference from varying cloud effects, the sunlight warms the ground less than as compared to the average per square meter heat from the interior of Venus.
      Or probably accurate to say, one active volcano on Venus heats the air more per year than the sunlight does per year.

      • gallopingcamel says:

        My 65 km saucepan is a near perfect adiabatic problem. The only obvious issue is the lack of energy balance at the surface.

        It will be at least a couple of weeks before I can do a more detailed analysis. Given that the radiative thermal flux at the surface of Venus is 16,000 Watts per square meter I doubt if the effect of heat conducted through the rocks will be significant.

        I just sent David Appell my spreadsheets to give him a chance to expose my errors in a snarky way. Let’s hope he has the “Right Stuff”.

        I would be happy to share my calculations with you so you can point out my errors. You can contact me via my public email {info(at)gallopingcamel.info}

        • gbaikie says:

          –gallopingcamel says:
          September 17, 2019 at 7:56 PM
          My 65 km saucepan is a near perfect adiabatic problem. The only obvious issue is the lack of energy balance at the surface.–

          Oh. I guess not sure what you doing- I thought I did.

          “I just sent David Appell my spreadsheets to give him a chance to expose my errors in a snarky way. Let’s hope he has the “Right Stuff”.”

          That should be interesting.

          “It will be at least a couple of weeks before I can do a more detailed analysis. Given that the radiative thermal flux at the surface of Venus is 16,000 Watts per square meter I doubt if the effect of heat conducted through the rocks will be significant.”

          Still not sure what you saying. But to be clear I don’t think it’s likely Venus surface is hot {+700 K} due to internal heat of the planet.
          But I am more certain that Venus rocky surface is not radiantly warmed by sunlight {and/or “back radiation”}.
          Or with Venus, I think the “surface” heated would be the Venus clouds- which are at about 65 Km elevation {and lower and higher than this].
          Or I thought you meant that the lid was the clouds or you meant the entire mass of atmosphere was acting as lid.

          I do agree with Roy that the greenhouse effect does act as a lid, in terms of analogy.
          But perhaps unlike Roy, I don’t think one need greenhouse gases to have the atmosphere act like a lid- or analogy works without any greenhouse gases, also.

          But if want heat like on Venus rocky surface, you need a “cloud lid”. But they do call the clouds a “greenhouse gas”. As in:
          “On the global scale, Venus’s climate is strongly driven by the most powerful greenhouse effect found in the Solar System. The greenhouse agents sustaining it are water vapour, carbon dioxide and sulphuric acid aerosols.”
          https://www.esa.int/Our_Activities/Space_Science/Venus_Express/Greenhouse_effect_clouds_and_winds

          Or don’t need the water vapor or CO2 but do need the sulphuric acid aerosols of the clouds which act as lid.

          • gallopingcamel says:

            I tried to explain the constant 230 K temperature at the cloud tops in terms of the phase diagram of H2SO4 and either CO2 or H20. Thus far I can’t figure it out but hopefully someone here can help. Physical chemistry is not one of my strengths.

            That ESA link has its good points but I don’t agree with the quote you selected. If you replace CO2 with nitrogen the temperature goes up because the DALR (Dry Adiabatic Lapse Rate) for nitrogen corrected for temperature and pressure is 0.1 K/km higher than that of CO2.

            Replacing the CO2 on Venus with nitrogen would therefore raise the temperature by 65*0.1 = 6.5 K. CO2 is not a “Magic” greenhouse gas. It is a gas like all the others with well defined properties.

          • gbaikie says:

            “Sulfuric acid (H2SO4) reacts very vigorously with water in a highly exothermic reaction. If you add water to concentrated sulfuric acid, it can boil and spit and you may get a nasty acid burn. If you’re wondering about the temperature change, mixing 100 ml of concentrated sulfuric acid and 100 ml of water initially at 19 degrees C reaches a temperature over 131 degrees C within a minute. The spitting or splashing of acid that results from mixing them in the incorrect order is from the intense heat produced by delayed boiling.”
            https://www.thoughtco.com/add-sulfuric-acid-to-water-606099

          • David Appell says:

            GC wrote:
            CO2 is not a Magic greenhouse gas. It is a gas like all the others with well defined properties.

            Really? Show me where nitrogen appears in this figure:

            https://www.giss.nasa.gov/research/briefs/schmidt_05/curve_s.gif

          • Dr Roys Emergency Moderation Team says:

            Show me your ability to please stop trolling.

      • gbaikie says:

        –Or probably accurate to say, one active volcano on Venus heats the air more per year than the sunlight does per year.–

        Meant to say: probably accurate to say, one active volcano on Venus heats the air more per year, than all the sunlight reaching the entire rocky surface heats the air above it, per year.

        • David Appell says:

          Where is that calculation?

          Or are you just guessing/hoping?

          • gbaikie says:

            “Where is that calculation?”

            On Earth one gets the most amount sunlight at noon when sun near zenith.
            This only occurs for couple hours of 24 hour day in some regions on Earth.
            When sun is directly above {at zenith] in 15 degree latitude and longitude radius from that point- within that circle the sun near zenith.
            A degree latitude is 111 km. 15 time 111 is 1665 km.
            And circle with 1665 km radius has area of 8.71 million square km.
            8.71 million square km is small part of 510 million square km of Earth surface [less than 2% of total area]

            A day on Venus at the rocky surface is 116 earth days 18 earth hours 0 Earth minutes. So sun where at zenith, remains near zenith for about 9 days.
            The rocky surface temperature will be about 465 C.
            At the point on Venus rocky surface where the sunlight will pass directly, you have night time which 1/2 of Venus day: 58 days and 9 hours, and daytime of 58 days and 9 hours. Using Venus “hours”
            Dawn is 6 am and noon is 12 noon and sunset at 6 pm.
            At dawn, you are not going to see anything sunlight, and sunlight would have travel clouds and about 10 times the Venus atmosphere.
            So wait an Earth more than week after dawn, and in Venus time it’s 9am. Is there any sunlight?
            In three venus hours it rises 45 degree above the horizon {15 degrees per Venus hour {about 4.8 earth days}. So now the sunlight only going to go thru 1.14 times as much Venus clouds and venus atmosphere. So could see at least a dim glow {it’s pitch dark}.
            At this point you measure the temperature of the rocky ground {could probably see it}. And say it’s temperature is exactly 465 C. And after 3 more Venus hours the sun is at zenith. You measure the temperature of ground again.
            I think the temperature is going to pretty close to 465 C.
            When sun at zenith the light levels going like overcast day on Earth when you see bright parts of clouds indicating where the sun is in the sky.
            What do think the ground surface temperature will be when sun is at zenith?

          • David Appell says:

            Where did you say ANYTHING about a volcano on Venus?

            As is often the case, I can’t make heads or tails out of what you are trying to say.

          • Dr Roys Emergency Moderation Team says:

            gbaikie is part of the conspiracy that the Spencer family has to prevent you from trolling.

          • gbaikie says:

            “Dr Roys Emergency Moderation Team says:
            September 20, 2019 at 7:26 PM
            gbaikie is part of the conspiracy that the Spencer family has to prevent you from trolling.

            I see nothing. I know nothing- https://www.youtube.com/watch?v=UmzsWxPLIOo – of this conspiracy.

            I did look for data on volcano on Venus, but it appears not enough is known. Or it’s out there somewhere, and requires more searching.

            There was some models Venus eruptions, and they seem think Venus lava was around 1200 C- but it just based upon typical Earth volcanic temperatures.

          • Dr Roys Emergency Moderation Team says:

            I like your comments. Don’t listen to David. You’re just operating on a higher level than him, so he gets confused.

          • David Appell says:

            Volcanoes aren’t relevant to Earth’s climate change.

            What evidence says they’re relative to Venus’s temperature?

          • Dr Roys Emergency Moderation Team says:

            David, please stop trolling.

    • gbaikie says:

      Hmm looking for air density of venus at 65 km elevation.
      Didn’t find it, but found something that I thought was
      interesting:

      “Jean-Loup Bertaux, Service d’Aronomie du CNRS, France, Ann-Carine Vandaele, Institut d’Aronomie Spatiale de Belgique, and colleagues have now used Venus Express to discover an unexpectedly warm layer of air on the planets night-side.

      It sits between the altitudes of 90120 km, a region that is generally so cold at night that scientists often refer to it as Venuss cryosphere. The new measurements show that the temperature excess ranges from 30 to 70C and peaks at an altitude of 100 km.”
      https://www.esa.int/Our_Activities/Space_Science/Venus_Express/The_unexpected_temperature_profile_of_Venus_s_atmosphere

      • gallopingcamel says:

        Thanks for the link. Venus has a “Tropopause” at a pressure of 0.1 – 0.2 bar as do all the other bodies in our solar system with significant atmospheres.

        Now we are talking about what goes on above the top of the plate that covers the saucepan.

        The top of the Venus troposphere occurs around 65 km where the temperature is 230 K and this is where most of the outgoing radiation comes from. That is the part of the atmosphere that cools the planet by radiating energy.

        In most stratospheres in our solar system, complex molecules are in the minority so these molecules tend to lose energy by collision with simple molecules (that won’t radiate). Consequently lapse rates in stratospheres are generally positive.

        In the Venus stratosphere over 96% of the molecules are CO2 so it is likely that those molecules will radiate energy before they have a chance to lose energy via collisions. This is why the Venus stratosphere has an anomalous (negative) lapse rate.

        I have an EXCEL spreadsheet that does a pretty good job modeling all that. As explained in an earlier comment it is based on the work of Robinson & Catling.

        • gbaikie says:

          “gallopingcamel says:
          September 17, 2019 at 8:40 PM
          Thanks for the link. Venus has a “Tropopause” at a pressure of 0.1 – 0.2 bar as do all the other bodies in our solar system with significant atmospheres.”

          — The tropopause can exist anywhere between about 70 hPa (∼18 km) and 400 hPa (∼6 km), and it is therefore not convenient to use a constant pressure level to describe the tropopause.–
          https://www.sciencedirect.com/topics/earth-and-planetary-sciences/tropopause

          And 65 km on Venus is in the clouds. And there is convection in the clouds {clouds rain acid}.

          400 hPa = 5.8 psi {about 1/3 bar .394 bar}
          70 hPa = 1 psi {1/15th bar .068 bar]

          I guess google, how high does it rain on Venus:
          “The trace amounts of water in the upper atmosphere combine with sulfur dioxide to form clouds of sulfuric acid that cause frequent rainstorms. The acid rain evaporates long before it reaches the surface of the planet, however, and the vapors rise into the atmosphere to create more rain and continue the cycle. ”
          Not really a answer.
          A bit more:
          The Venusian atmosphere supports opaque clouds made of sulfuric acid, extending from about 50 to 70 km. Beneath the clouds, there is a layer of haze down to about 30 km and below that it is clear. Above the dense CO2 layer there are thick clouds consisting mainly of sulfur dioxide and sulfuric acid droplets.

          The thing is, there is no rainfall on the surface of Venus — while sulfuric acid rain falls in the upper atmosphere, it evaporates around 25 km above the surface. ”
          https://www.zmescience.com/other/science-abc/rain-titan-earth-neptune/

          It seems to me if it’s raining it’s not Tropopause and if there is updrafts also not, but perhaps Tropopause does starts around 65 to 70 km elevation. And wiki says 65 km is 0.09765 or about .1 bar
          and I never did find the air density.
          .1 bar = 1.47 psi x 2 = 2.94 psi .2 bar
          Sea level temperature 15 C
          40,000′ {12 km} = 2.73 psi air temperature: -69.7 F
          50,000′ {15 km} = 1.69 psi air temperature: -69.7 F
          Meters:
          15,000 meters .12 bars air temperature: -56.5 C and air
          density: 0.1948 kg per cubic meter
          https://www.engineeringtoolbox.com/standard-atmosphere-d_604.html

          • gbaikie says:

            So wiki said 65 Km on Venus was -30 C and .1 bar
            On Earth when 15 C .1 bar is -56.5 C
            And if Earth surface air temperature was 15 + 16 = 31 C
            Roughly, it would about -30 C at .1 bar on Earth at 15 km with about .2 kg per cubic meter density
            {sort of matching Venus}.
            And would guess density at .1 bar at 65 km at -30 C on Venus with more than .2 kg per cubic meter.
            Very similar condition except clouds are much higher on Venus- and would wildly guess it might related to the global wind on Venus.

            Or if Earth had a similar global wind, it’s might tend to have clouds higher.

          • gallopingcamel says:

            That link about the sulphuric acid was interesting. That could affect my calculations as phase changes modify the adiabatic lapse rate. I assumed a flat rate of 7.9 K/km which may be too high for the region where liquid H2SO4 is found.

            One thing in the article triggered my BS detector:
            “Because CO2 is a greenhouse gas and Venus has so much of it, temperatures on the planet reach a scorching 462 °C…..”

            At the risk of offending our respected host, replacing the CO2 on Venus with the same mass of nitrogen would change the surface temperature by less than 20 degrees Centigrade. CO2 is not a “Magic Gas”…….it is just a gas with well defined properties.

          • gbaikie says:

            “At the risk of offending our respected host, replacing the CO2 on Venus with the same mass of nitrogen would change the surface temperature by less than 20 degrees Centigrade. CO2 is not a “Magic Gas”…….it is just a gas with well defined properties.”

            Yes I think CO2 does have a warming effect and {with Venus with it’s massive CO2 atmosphere} might be about 20 K. And surface air was 20 K cooler, and that is a huge effect caused by CO2.

            Just as if doubling of CO2 on Earth caused 1 C (I think it’s .5 C or less] increase in global temperatures, that would a huge effect.
            Huge effect but not necessarily dangerous particular when you know that we living in an Ice Age {and that a 1 to 2 C increase in global temperature would/could be a positive improvement].
            But if people want to limit our global CO2 {or limit human CO2 emissions] that ok with me. As long as you know, what we presently doing {and spending trillions of dollars, doing} is not working and very unlikely to work. Or only know way to do it, is by using more nuclear energy. {But I would rather to have all nuclear energy production-off, planet Earth.}

          • David Appell says:

            What calculation did you do to be “20 K?”

          • David Appell says:

            gbaikie says:
            Just as if doubling of CO2 on Earth caused 1 C (I think its .5 C or less] increase in global temperatures

            How can it be 0.5 C when we’ve already has 1.0 C of warming and CO2 hasn’t even increased by 50% yet?

          • gbaikie says:

            –David Appell says:
            September 19, 2019 at 9:12 PM
            gbaikie says:
            “Just as if doubling of CO2 on Earth caused 1 C (I think its .5 C or less] increase in global temperatures”

            How can it be 0.5 C when weve already has 1.0 C of warming and CO2 hasnt even increased by 50% yet?–

            No one claiming the rise in CO2 levels to the present time has caused 1 C of global warming.

            I’ve heard some say with high confidence that the rising CO2 levels have caused at least .2 C.

            I would say, the rising CO2 might have caused as much as .2 C.

            Your turn.
            How much warming has the rising levels CO2 levels, caused

          • David Appell says:

            gbalkie wrote:
            Ive heard some say with high confidence that the rising CO2 levels have caused at least .2 C.

            Please show the calculation that results in that number.

          • Dr Roys Emergency Moderation Team says:

            David, please calculate how much you should stop trolling, in ft/years.

    • Bindidon says:

      gallopingcamel / chameau galoppant

      Nice exercise.

  49. donald penman says:

    If we had a hundred pots of water on stoves all being heated by a different energy input (surface heating ) instead of the one pot analogy we are given would the cumulative errors still stabilise in the long run. The question is very complex but I think relative errors between our measurements of each pot would become important.
    I find it very difficult to believe in an intuitive sense that we could know any event in the far future with any precision because of unforeseen events happening such as a super volcano or a meteorite hitting the Earth, which leads me to the view I have rather than any mathematical or statistical knowledge.

  50. Bri says:

    The pot on stove simulation is flawed , you should use a heat lamp or a hair dryer to heat the surface and the pot should be 100M deep.;~)

  51. gbaikie says:

    –h/t JoNova, GWPF; The USA are amongst the most skeptical of the countries surveyed (fourth from the bottom of believers).–
    https://wattsupwiththat.com/2019/09/18/yougov-poll-only-36-of-usa-believe-humans-are-mainly-responsible-for-climate-change/

    Interesting poll. And unlike most polls, I think it might be more accurate. Mainly cause it is in some ways surprising and seems to me to be informing.
    What is surprising {almost unbelievable} is India are the strongest believers {and it makes worried about India’s future- I thought they were wiser than that}. BUT it would not be surprising to me, if Indians were strongly concerned about Urban Heat island effect- and if that was the case, then not worried about India. And it would be a really good thing if Indians do some work related to the matter and design cities to reduce UHI effects.
    Next, sort of surprise is Norway and Sweden are less believers than US.
    Oh, Canada is not list.
    I think or guess Canadians are worst than US.

    US also has large numbers of people who don’t think climate change is happening, both natural or man made.
    And Australia similar. And Arab countries are similar in this respect. I makes sense with US, because we have not had much “climate change” in the US.

    • gbaikie says:

      Blog poster, Eric Worrall
      says:
      “Its not all good news for US climate skeptics.”

      {I don’t agree. And it’s not surprising and consistent with past polls.}
      And:
      “There is another chart (see the yougov link above) which suggests slightly over half of US people surveyed think climate change will have at least a fair amount of impact on the economy, so there is concern.”
      But only 24% think it’s a problem. And probably as many think a space alien invasion is as much of problem.

      Probably 1/2 of 24% are lefties, who lying about there actual opinion. Never met anyone who actually thinks it’s problem. Which can tested. Are planning to move to Canada. Or are willing to increase the amount of nuclear power used.
      Both or either will indicate whether whether just dumb as brick or they are lying {and lying about it, also proves that they quite dumb}.

  52. gbaikie says:

    uh-oh, lunar related:

    Tuesday, September 17, 2019
    Tropical Storms in the Equatorial Pacific Ocean are being triggered by the passage of Kelvin Waves

    “N.B. If our claim is correct that Equatorial Kelvin Waves (EKWs) are being generated by the interaction between maxima in the lunar atmospheric/oceanic tides with minima in the diurnal sea-level pressure variations in the tropics ”
    https://astroclimateconnection.blogspot.com/2019/09/tropical-storms-in-equatorial-pacific.html

    Linked from:
    https://tallbloke.wordpress.com/

  53. gbaikie says:

    Oh gosh, a very stupid idea I have not seen before:

    –Engineering Humans: A New Solution to Climate Change?

    “So far, conventional solutions to global warming — new government policies and changes in individual behavior — haven’t delivered. And more radical options, such as pumping sulfur into the atmosphere to counteract warming, pose a great deal of risk.

    There may be another route to avoid the potentially disastrous effects of climate change: We can deliberately alter ourselves, three researchers suggest.–
    https://www.livescience.com/19357-engineering-humans-climate-change.html

    Ah, a perfect number 3. { as in the three stooges }

    So, I don’t think anyone imagines Climate Change is threat or concern in terms of humans.
    Humans can live on Mercury or the frozen desert wasteland of Mars,
    or the skies of Venus, the concern {if there is any} is related the possible threat to all other life on Planet Earth. Or if something happens to life in general, humans are dependent upon all life on the planet, and therefore does pose a threat to the monkey, homo sapiens.
    Or unless you plan to genetically altering all life on Earth to cope with the climate change fantasy, it’s a problem {you are not solving].
    This was linked from:
    https://pjmedia.com/eddriscoll/2012/3/29/re-engineering-humans/
    {which was linked from https://pjmedia.com/instapundit/ }
    “It’s no coincidence that global warming took off as an issue just as the Soviet Union fell; it’s top-down centralized government’s last best hope of controlling the masses. And like other forms of totalitarian worldviews, it doubles as a religion as well,…”

    Don’t these people watch things like Firefly, where Earth is how ruined, so people stupidly goes to another star system {and then terraform bare rock moons/planet!!}. Yes, dumb, but what about Matrix {digging to center of Earth to gain electrical power- and hippies with bad clothes, and etc}. So to save humans, we leave Earth or I guess blacken the skies {somehow] and live underground.

  54. gallopingcamel says:

    gbaikie said:
    “Still not sure what you saying. But to be clear I don’t think it’s likely Venus surface is hot {+700 K} due to internal heat of the planet.”

    For my saucepan to be a true “Adiabatic” problem there must be no energy entering or leaving the saucepan.

    There is an energy balance at the top of the plate (the constant temperature implies an energy balance).

    There is no energy transfer via the walls because there is no temperature differential at any point.

    If there is zero energy transfer at the bottom it is a true adiabatic problem making it simple to calculate the unknown temperature at the bottom of the saucepan.

    Any heat transfer to or from the core of the planet in contact with the saucepan bottom will modify the temperature relative to the ideal adiabatic solution.

    On planet Earth we ignore the effect of core heating because it amounts to less than 0.1 W/m^2 compared to a surface radiative flux of 390 W/m^2. The contrast will be even more extreme on Venus because the surface radiative flux there is 16,000 W/m^2.

    • gbaikie says:

      –gallopingcamel says:
      September 18, 2019 at 6:43 PM
      gbaikie said:
      “Still not sure what you saying. But to be clear I don’t think it’s likely Venus surface is hot {+700 K} due to internal heat of the planet.”

      For my saucepan to be a true “Adiabatic” problem there must be no energy entering or leaving the saucepan.–

      I just saying, I don’t think Venus air has much energy added at the rocky surface of Venus.
      Or energy added is from sunlight near top of the atmosphere.

      Actually, come to think it, it may need to be added below the level of the tropopause, or in the troposphere.

      As example, say more half of absorbed sunlight occurs at 60 km elevation, the heated air convects until reaches tropopause {can’t convect higher [because definitional, the tropopause doesn’t convect]}.
      Or as general rule, a sunlight heated surface [cloud, sidewalk, a floating parking lot, whatever] has to be within the troposphere {or below tropopause or air density of more than about .1 Kg per cubic meter}.
      Or say you creating gas {from evaporation of water in the acid of clouds. Ie “Venusian clouds are thick and are composed mainly (75-96%) of sulfuric acid droplets” 75% sulfuric acid has a lot more water in it than 96% sulfuric acid. And the sulfuric acid of 75% is heated it will evaporate water. And also if add water to acid there exothermic reaction {the acid heats up}.
      Such chemical reactions are vehicles to to transport heat, you still need an actual heat source which is the sunlight.

    • Entropic man says:

      “On planet Earth we ignore the effect of core heating because it amounts to less than 0.1 W/m^2 compared to a surface radiative flux of 390 W/m^2. The contrast will be even more extreme on Venus because the surface radiative flux there is 16,000 W/m^2.”

      Which raises an interesting problem. If the surface of Venus, at 733K, radiates 16 kilowatts per square metre, where is that energy coming from?

      The conventional answer is that it is redirected back to the surface by CO2 in the atmosphere.

      • gbaikie says:

        –Entropic man says:
        September 19, 2019 at 1:30 AM
        “On planet Earth we ignore the effect of core heating because it amounts to less than 0.1 W/m^2 compared to a surface radiative flux of 390 W/m^2. The contrast will be even more extreme on Venus because the surface radiative flux there is 16,000 W/m^2.”

        Which raises an interesting problem. If the surface of Venus, at 733K, radiates 16 kilowatts per square metre, where is that energy coming from?

        The conventional answer is that it is redirected back to the surface by CO2 in the atmosphere.–

        The answer is surface can’t radiate to something cooler or space, and the heat is lost due to convention. And it does not convect heat because require difference. It’s a pot with lid on it.
        And basically you need to understand the nature of the lid.
        And thick Venus clouds are a big part of this lid.
        But there is a trickle some heat into it, likely is the “less than 0.1 W/m^2” or surface has lose the addition of less than 0.1 W/m^2 or it just gets hotter and hotter- but it’s not much energy to lose- unless we are wrong that it’s “less than 0.1 W/m^2 “.
        Or it could be “less than 0.1 W/m^2 ” over million years but be more than 0.1 W/m^2 for 100 years and much less than 0.1 W/m^2 for 10,000 years.
        But I don’t think doing much warming, rather it’s an uncertainity, because we have not even measured it. Though there theories that Venus periodically re-surfaces due the apparent young surface of Venus.
        So I dismiss sunlight or internal heat directly causing to surface to warm, instead I think part of the lid is being warmed by the sunlight. The problem is this does not explain the apparent young age of Venus surface {but that might be wrong}.

        • David Appell says:

          The answer is surface cant radiate to something cooler

          Really??????

          So the Sun doesn’t radiate to space??????????

          • gbaikie says:

            yeah, I was not clear about that.

            Got room at 20 C, have brick in the room at 20 C.
            Brick not going to cool by radiant or convection heat loss.
            It’s going stay at room temperature.

            Put person in the room, it warmer than 20 C, person transfers most heat by evaporation and convection heat transfer. It could do convectional heat transfer because room is cooler.
            And person will radiate an insignificant amount radiant energy, because again, there is cooler environment.

          • David Appell says:

            You wrote about the Sun. I responded about the Sun.

            Now you’re writing about some room??

            No. Let’s stick to your claims about the Sun.

            Were you wrong?

          • Dr Roys Emergency Moderation Team says:

            Really???????

            You admit that every comment you’ve ever written is trolling?????????

        • gbaikie says:

          –David Appell says:
          September 20, 2019 at 6:19 PM
          You wrote about the Sun. I responded about the Sun.

          Now youre writing about some room??

          No. Lets stick to your claims about the Sun.

          Were you wrong?–

          No.
          I was talking about Venus at it’s rocky surface.
          At it’s rocky surface, Venus is roughly a
          planet of darkness. Though in a small corner of the planet there
          is some sunlight.
          So it’s like very big room with on corner window with sunlight shining thru with cloudy afternoon sun.
          If the room was a 100 C sauna, it would be closer analogy- if our sunlight no where on the surface can increase the temperature of an object which is 100 C.
          {But sunlight on the Moon, can. But, not talking about the Moon- even though it is my favorite topic.}

    • David Appell says:

      GC: At 288 K, the Earth’s surface emits an average of 390 W/m2. But with a brightness temperature of 255 K, only 240 W/m2 leaves out the top of the atmosphere.

      Where is the missing 150 W/m2?

      • gbaikie says:

        In terms average each square meter of earth emits about 240 watt square meter. Or per square km, 240 million watts.
        And since Earth has about 510 million square km:
        510 million times 240 million is 1.224 10^17 watts per second
        Earth absorbs about 1.224 10^17 watts per second of sunlight.

        Earth is currently in an Ice Age.
        It is Ice Age because it’s ocean are cold.
        The range of the temperature of the entire ocean during our
        Ice Age varies from about 1 C to 5 C.
        Presently, our ocean has average temperature of about 3.5 C.
        Our ocean volume is “approximately 1.35 billion cubic kilometers”
        A cubic km of ocean is a billion cubic meter and slightly more than 1 billion tonnes.
        To warm a tonne of fresh water by 1 C requires about
        4200 joules per kg, or 4.2 million joules per tonne
        And billion tonne: 4.2 x 10^15 joules.
        A billion cubic kilometers: 4.2 x 10^24 joules
        5.67 x 10^24 / 1.224 10^17 is 4.63 x 10^7 seconds total sunlight that entire Earth absorbs from the sun. Or 46.3 million second.
        A year has 31.54 million seconds.
        And a small not measured fraction of total sunlight is not emitted but instead is stored a heat in the entire ocean.
        It’s probably not 1 watt of the 240 on average absorbed and emitted. But if was as much as 1 watt retained as heat in ocean then it would take 240 times 46.3 million seconds to warm the ocean by 1 K. Which is 352.3 years.

        Related:
        The surface area of the oceans is “about 360 million square kilometers”. To melt enough glacial ice to add 1 meter elevation requires more than 360 million times million square meter per square km {each square meter weighing a tonne] of ice to melt.
        How much heat is required to melt 360 million tonnes of ice?
        Or how about additional sunlight seconds does Earth have to absorb?
        It took 4200 joules per kg of water to rise by 1 K
        334,000 joules per kg to melt ice into water.
        360 million million
        Or 344 million joules to melt a tonne
        360 million million times 344 million joules is:
        1.238 x 10^23 joules
        Compared warming ocean 1 K: 5.67 x 10^24
        Or requires 45.78 times longer to warm ocean by 1 K as compare
        to melting ice to rise sea level by 1 meter
        352.3 years / 45.78 is 7.69 year.
        So if instead of warming ocean the 1 watt was used to melt glacier, it only takes 7.69 years.
        If want to do both with the 1 watt:
        352.3 + 7.69 = 359.99 year, or about 360 years
        How much does take to warm entire atmosphere.
        Air 1 vs water 4.2:
        1000 joules per kg. A million joules per tonne.
        Got 10 tonnes per square meter, 10 million tonnes per square km.
        and 510 million square km
        5100 million million times million joules is:
        5.1 x 10^21 joules
        compared melting ice: 123.8 x 10^21 joules
        Roughly 1/25th of heat
        Or the 1 watt warms all air in few months rather than several years to melt ice

        • David Appell says:

          So where is that 150 W/m2?

          • gbaikie says:

            We currently have an atmosphere.

            You are missing numbers, because you don’t know that it would only apply if Earth had a vacuum rather than it having 10 tonnes of atmosphere per square meter.

            And as I said, we currently have cold oceans, and if we were living in a normal Earth climate, then ocean could have average temperature of 10 C, rather what it is currently, 3.5 C.

            If ocean was 10 C, you missing more of a number. And if you living at time when ocean was 2 C, you would have a lower number which you would be missing.

          • David Appell says:

            Again: so where is that 150 W/m2?

          • Dr Roys Emergency Moderation Team says:

            Again: where is that skinny, intelligent, educable, pleasant, non-trolling David Appell?

          • David Appell says:

            Anything to avoid the science.

          • Dr Roys Emergency Moderation Team says:

            Yes, that’s the purpose of your questions. Anything to avoid the science.

  55. Stephen P Anderson says:

    Wish I hadn’t been traveling and missed this whole damn discussion. Loved Chic Bowdrie’s version of the Mauna Loa model. How do Dr. Spencer and Barry believe that conservation of energy applies but somehow conservation of mass doesn’t?

    • barry says:

      How does my and Roy’s view conflict with conservation of mass?
      Answer: it doesn’t.

      The physical evidence corroborates the mainstream view. The physical evidence does not corroborate Chic’s view. Chic has supplied no physical evidence to support it against the standard view. Wishful thinking is not a good challenge to the prevailing understanding.

      • Chic Bowdrie says:

        I’ve suggested that a less than 1% yearly increase in natural emissions can explain the known measurable data. The physical evidence you desire is the same evidence you have not presented to prove me wrong and corroborate the mainstream view.

        • David Appell says:

          Are you aware that natural emissions can be distinguished from anthropogenic emissions by looking at carbon isotopic ratios?

        • barry says:

          “I’ve suggested that a less than 1% yearly increase in natural emissions can explain the known measurable data.”

          You have, but you have provided no observational evidence of where that natural increase is coming from.

          “The physical evidence you desire is the same evidence you have not presented to prove me wrong and corroborate the mainstream view.”

          On the contrary, the link to Englebeen’s page contains references and cites to the scientific literature of physical observations.

          The mainstream view has observational evidence supporting it. Yours does not.

          Want more observational evidence?

          Studies of the global carbon cycle
          Studies accounting anthropogenic CO2 emissions
          Studies of oceanic CO2
          Studies on CO2 emissions from volcanoes
          Studies on anthro CO2 observations including signature isotopic ratio changes
          Studies on CO2 records from ice cores
          Studies on CO2 records from other proxies

          Feel free to check these out to discover the source of your proposed natural CO2 increase for the recent past.

          • Chic Bowdrie says:

            You bombarded me with scores of papers supposedly thinking I’m going to comb through them in the off chance that some of them contained evidence supporting a view that challenges the consensus and that somehow no one noticed?

            Just one paper. Cite at least one with data showing natural emissions have been flat for the past century and, therefore, could not explain how human emissions are only responsible for a small fraction of the increase in atmospheric CO2.

          • barry says:

            Chic,

            Let’s first openly declare that you have zero physical (observational) evidence of any natural sources of CO2 contributing to the rise, and that the part of your ‘model’ that adds a natural source is purely hypothetical. I’ve done some legwork, and will do more, but I’d like some more straight talk from you about what you’ve actually done first. Which is, a mathematical exercise whose only physically based roots are in anthro CO2 emissions and overall atmospheric content.

            No observations of any kind contribute to your understanding of a possible natural source, and the figures you come up with for that are pure supposition – a mathematical exercise.

            Are we agreed? Just want to be clear about that at this point. Then I’ll furnish more specific papers.

          • Chic Bowdrie says:

            I don’t know why this is so hard a concept for you to grasp. A human emission is like burning wood in your fireplace or driving a combustion-engine powered car. An example of a natural emission is what dead plants give off or when oceans outgas CO2. Boden et alia have human emission data which Dr. Spencer used in his simple model. I added to that a plausible amount of increasing natural emissions (rotting plants and ocean outgassing) that conforms to the rough estimates published by the IPCC. I made it clear from the beginning this was my hypothesis and asked several times in this discussion if anyone knows of data contradicting my hypothesis. I admit I am not aware of this data or the data that proves my model more valid than Dr. Spencer’s. I’m not referring to any supernatural emissions, just a little more of the same ol’ same ol’ year after year as temperatures rise.

            Is that clear enough for you?

          • David Appell says:

            Chic:

            So go to Google Scholar and start searching, reading, and understanding.

          • Dr Roys Emergency Moderation Team says:

            David:

            So go to kindergarten and start searching, reading, and understanding.

          • David Appell says:

            There was no kindergarten where I grew up. So I went straight to 1st grade.

          • Dr Roys Emergency Moderation Team says:

            OK, David.

          • barry says:

            Chic,

            “I made it clear from the beginning this was my hypothesis and asked several times in this discussion if anyone knows of data contradicting my hypothesis. I admit I am not aware of this data or the data that proves my model more valid than Dr. Spencer’s.”

            That wasn’t clear to me from the outset but it is now.

            The paper lists I provided are more comprehensive than a single paper could ever be, and the understanding comes from the assessment of many strands of evidence. So I’ll give you a paper for each strand of evidence. If it’s not enough, you can always go back to the paper lists.

            First, an easy to read paper on the global carbon budget, sources and sinks:

            https://escholarship.org/content/qt9m41r1mf/qt9m41r1mf.pdf

            This is what you are asking for, but I figured you would want more detail, hence the paper lists. So here is one paper for various strands of evidence.

            Accounting of anthropogenic emissions:

            https://www.pnas.org/content/107/12/5687.full

            This is an accounting by consumption, but it’s not the only method. You have to read more papers to get those estimates. Short story – they corroborate each other.

            Measuring anthropogenic CO2 emissions via isotopic signature of fossil fuel burning:

            https://journals.uair.arizona.edu/index.php/radiocarbon/article/viewFile/16392/pdf

            Again, it’s one method to distinguish anthro CO2 from the rest – but you don’t want to read lots of papers.

            Oceanic sink for CO2:

            https://science.sciencemag.org/content/363/6432/1193.abstract

            (You can get the full version thru google scholar)

            Volcanoes a fraction of anthropogenic emissions:

            https://agupubs.onlinelibrary.wiley.com/doi/pdf/10.1029/2011EO240001

            You are no doubt aware of the recent studies of greening of the planet? This is the biosphere uptaking CO2, not outputting it, and emissions from land clearing is… anthropogenic.

            These papers are the tip of the iceberg.

          • bdgwx says:

            Chic, I’m confused. I thought we agreed that the hydrosphere and biosphere are net sinks. If they are net sinks then how can they be responsible for any of the increase in the atmosphere?

          • Chic Bowdrie says:

            barry,

            Thank you for these references. I don’t contest the magnitude of human emissions. If you think Dr. Spencer has underestimated them, then I/we can modify his model to accommodate.

            Neither of the ocean sink papers indicate the magnitude of any possible growth in natural emissions. The Le Quere article shows data for only the land and ocean sinks, which is consistent with the numbers I get using a modest yearly increase in natural emissions.

            This from Gruber et al., “we include explicitly also the potential loss of natural CO2 from the ocean as a component of the budget.” This is strange considering the ocean is a net sink for both natural and human CO2. Again the data provided do not indicate how they are able to differentiate anthropogenic from natural CO2. It appears that models are used to generate data. Not a good sign.

            They use a 0.28 factor to calculate the change in anthro CO2 between t1 to t2 from the total anthro at t2? It’s not at all clear what they are doing. That factor is the fraction of atmospheric CO2 sinked annually.

          • Chic Bowdrie says:

            bdgwx,

            Review this: http://www.drroyspencer.com/2019/09/a-stove-top-analogy-to-climate-models/#comment-389075

            Most of the sinked CO2 is in the form of bicarbonate and it has increased since preindustrial times (net sink). But the dissolved CO2 concentration is also greater and this makes the CO2 in air greater (Henry’s Law).

            The takeaway point is that nature removes CO2 the same whether it is of human or natural origin. Most emissions are natural and therefore the bulk of the increased atmospheric CO2 is natural.

          • bobdroege says:

            Hi David,

            I didn’t go to kindergarten either.

            Welcome to the club.

          • bdgwx says:

            Chic,

            I get what you are saying. If you could hypothetically tag all emitted CO2 molecules with an A (for anthroprogenic) or N (for natural) what you’d find that is that of all airborne molecules only ~4% or so would have the A tag.

            But…and this a huge BUT…that does NOT mean that the A tagged molecules were not responsible the increase in airborne mass. Why? Because the A molecules are being exchanged with N molecules when they are removed. The tags are switching places, but not the mass. And it was the mass that caused the increase.

            Consider this thought experiment (and do it in Excel to convince yourself of the results). There is a bucket with 300 blue marbles. 100 blue marbles go in at the top and 100 randomly selected marbles comes out the bottom each iteration. The bucket always contains 100 blue marbles because the flow in and out are matched and because only blue marbles are going in.

            Now add 4 red marbles per iteration in at the top so that are 104 (100 blue and 4 red) going in at the top and increase the flow from the bottom to 102 (randomly selected). After 50 iterations the bucket will now contain 400 marbles (an increase from 300). But…the division at the end of the 50 iterations will not be 300-blue and 100-red as might be trivially expected. It will actually be closer to 385-blue and 15-red. Again…do this in Excel to convince yourself of the results.

            The point is that of the 400 marbles at the end of the 50 iterations only 4% were red. BUT…the addition of the red marbles caused the marbles to in the bucket to increase by 100. It wouldn’t have happened without the addition of the 4 red marbles per iterations. That 100 marble increase (from 300 to 400) is 25% of the total. The red marbles entirely caused the number of marbles to increase.

            So your statement that the bulk of the airborne increase is natural is somewhat true, but also very misleading. It’s misleading because the bulk of the airborne increase was caused by the anthroprogenic release.

          • Dr Roys Emergency Moderation Team says:

            bobdroege, please stop trolling.

          • Chic Bowdrie says:

            bdwgx,

            I replied in a new thread below.

    • Chic Bowdrie says:

      Stephen,

      I agree with barry that his view doesn’t conflict with mass balance, but that the manifest data seems insufficient to claim their mass balance is unequivocal. If that’s what you meant, then I agree with you also.

      Are you aware of any more definitive evidence on the measurement of natural emissions? That’s what we need.

      • Stephen P Anderson says:

        Chic,
        It does conflict with conservation of mass. Conservation of mass is sum of the inputs minus sum of the outputs is equal to the change in mass with respect to time. Where is that in his contrived Mauna Loa equation? How does “the planet absorbs about 50% of the anthropogenic CO2 emitted” obey conservation of mass? It doesn’t.

        • Chic Bowdrie says:

          His equation is mathematically correct. If you subtract the sum the inputs and add the sum of the outputs for each year, the CO2 level remains constant. The problem is that the equation doesn’t necessarily tell the whole story if natural emissions contribute to the rise in CO2. If they do according to my estimate, then the planet is absorbing more than 90% of the human emissions.

          • Stephen P Anderson says:

            Yes but his equation essentially ignores natural emission. It is the sum of “all” inputs and the sum of “all” outputs.

          • Chic Bowdrie says:

            Yes. Two mathematically correct models can describe the same data. It doesn’t mean they are physically correct. We agree that Dr. Spencer’s model isn’t.

        • David Appell says:

          How does the planet absorbs about 50% of the anthropogenic CO2 emitted obey conservation of mass? It doesnt.

          {eyeroll}

          What’s amazing is that people like you think they’ve found a very elementary but huge error that thousands of professional scientists all somehow missed for a hundred years.

          What does that egotism come from?

      • Stephen P Anderson says:

        Chic,

        The approximately 100 ppm natural emission is what the IPCC uses. So, they believe it is substantially higher, at least an order of magnitude higher, than anthropogenic emission. I’ve been alerted to Dr. Ed Berry’s work by none other than David Arpell. I’ve been reading a lot of his stuff which supports Salby’s work. Have you watched any of Salby’s presentations? Berry uses a residence time of 4 years but some of Salby’s math implies a much smaller residence time than 4 years-possibly as low as 1 year. If residence time is close to 1 year then this implies much much larger natural emission. Anthropogenic emission isn’t even a blip on the radar.

        • Chic Bowdrie says:

          I’ve gone over Berry’s model thoroughly and I think I’m ready now to digest Salby’s work which was harder to follow at first blush. So much to do, so little time.

          • David Appell says:

            You’re wasting your time. Berry’s model is a perversion of the carbon cycle that in no way describes it. Salby can’t get a job in science and the scientific community ignores his junk.

          • Stephen P Anderson says:

            Most university academia are spineless and will succomb to conventional wisdom. It takes intellectual giants like Salby or Einstein to go against mainstream. A hundred years from now it will only be Salby who is remembered.

          • Stephen P Anderson says:

            https://davidappell.blogspot.com/2019/05/why-ed-berry-is-full-of-shit.html

            Chic,

            By the way this is Judas Appell’s unscientific repsponse to Berry’s model. Also, Judas slanders the journal that recently published Berry’s work and this is how he slanders Berry on his unscientific page “Quark Soup”-I guess an allusion to his quarky brain. He tosses out irrelevant red herrings like Berry’s model doesn’t include any feed backs. What the hell are you talking about Judas? Judas, why don’t you try understanding Berry’s model instead of consigning yourself to historical mediocrity? Sellout.

          • Chic Bowdrie says:

            Stephen,

            Yes, he asserts facts not in evidence to smear Dr. Berry. DA’s whole argument is an appeal to authority. The “humans are responsible for all of the excess carbon” myth is easily demonstrated by the airborne fraction evidence if you include the possible growth in natural emissions.

            https://www.dropbox.com/s/jamm2kt6olywpwm/Airborne%20Fraction.png?dl=0

          • David Appell says:

            THe airborne fraction is only the added CO2 that’s stayed in the atmosphere. The rest of man’s emissions have gone into the biosphere and acidified the ocean.

            It’s hardly appealing to authority to state that the carbon cycle is far, far more complex than Berry assumes, and that a bathtub model is nowhere close to reality.

            https://davidappell.blogspot.com/2019/05/a-bad-assumption-in-ed-berrys-model.html

          • Dr Roys Emergency Moderation Team says:

            You’re wasting your time. David’s model is a perversion of the trolling cycle that in no way describes it. Appell can’t get a job in science and the scientific community ignores his junk. That’s why he hangs out at Dr Spencer’s blog, trying to fill the void in his worthless existence.

          • David Appell says:

            I’m happy where I am and have never looked for a job in the science community.

            Why do you hang out at Spencer’s blog?

          • Dr Roys Emergency Moderation Team says:

            To keep the trolls in check and to make sure the trivially obvious “no GPE/GHE” and “moon doesn’t rotate on its own axis” arguments are understood.

        • gallopingcamel says:

          Salby made so much sense, which is why he was fired without “Due Process” while traveling in Europe.

          Macquarie university demonstrated the kind of petty vindictiveness we associate with Joe McCarthy and Alexandria Ocasio-Cortez when it revoked Salby’s return air ticket.

      • barry says:

        Chic,

        “Are you aware of any more definitive evidence on the measurement of natural emissions? Thats what we need.”

        Please see:

        http://www.drroyspencer.com/2019/09/a-stove-top-analogy-to-climate-models/#comment-389796

        Specifically:

        https://agwobserver.wordpress.com/2010/06/03/papers-on-anthropogenic-co2-emissions/

        and

        https://agwobserver.wordpress.com/2009/10/31/papers-on-anthropogenic-carbon-dioxide-observations/

        They are paper lists of scientific observational studies of direct emissions, and of anthropogenic contribution gleaned from CO2 isotopes. There are many more papers – the lists haven’t been updated for a few years – but they are all congruent.

        • David Appell says:

          The commenters here would rather real Salby and Berry. Deniers need reassurance above all, and will take it wherever they can get it.

        • Dr Roys Emergency Moderation Team says:

          Everyone here would rather real Salby and Berry to fake David Appell.

        • Nate says:

          ‘The commenters here would rather real Salby and Berry. Deniers need reassurance above all, and will take it wherever they can get it.’

          I think that is on target, David.

          As Chic noted, ‘I think Im ready now to digest Salbys work’ and he only has so much time to read.

          He really should take the time to read the scientific literature to find and understand the evidence for, or against, ‘natural sources’ being the culprit.

          Instead, he will use his valuable time to go further down the rabbit hole, reading more flawed, simplistic, misleading, cherry-picked contrarian blogs, that nonetheless confirm his prior biases.

  56. gallopingcamel says:

    gbaikie said:
    “As example, say more half of absorbed sunlight occurs at 60 km elevation, the heated air convects until reaches tropopause {can’t convect higher [because definitional, the tropopause doesn’t convect]}.
    Or as general rule, a sunlight heated surface [cloud, sidewalk, a floating parking lot, whatever] has to be within the troposphere {or below tropopause or air density of more than about .1 Kg per cubic meter}.”

    Suspend disbelief and take Dr. Roy’s saucepan analogy seriously. No matter how crazy that may seem it leads to a solution that agrees closely with much more elaborate models such as my EXCEL spreadsheet that attempts to capture the Robinson & Catling model.

    Getting so close with a simple model is highly encouraging but it only applies to Venus because it has 100% cloud cover.

    When you talk about parking lots you are referring to planet Earth and I don’t have a clue how to use Dr. Roy’s saucepan analogy to solve that problem.

    • gbaikie says:

      “Suspend disbelief and take Dr. Roy’s saucepan analogy seriously. No matter how crazy that may seem it leads to a solution that agrees closely with much more elaborate models such as my EXCEL spreadsheet that attempts to capture the Robinson & Catling model.

      Getting so close with a simple model is highly encouraging but it only applies to Venus because it has 100% cloud cover.”

      I do take Dr. Roy’s saucepan analogy seriously.
      But it doesn’t seem me that much different when Roy than saying Earth does act as actual greenhouse.

      But I have suggestion, since you say it only applies to Venus, use Dr. Roy’s saucepan analogy and Robinson & Catling model and apply it to just the tropical zone of Earth.
      Or cut off the 60% of the rest planet Earth.

  57. gallopingcamel says:

    “But it doesn’t seem me that much different when Roy than saying Earth does act as actual greenhouse.”

    Agreed. People complain that the “Greenhouse” analogy is misleading but that is just semantics. A body with an atmosphere will have a higher surface temperature than a similar body that has none.

    • Chic Bowdrie says:

      That’s precisely why I dislike the greenhouse term. It distracts from the real issue of how much an increase in the current level of IR absorbing gases will have an further effect on global temperature.

      I’ve been told over and over that terminology is here to stay and I need to get over it.

      • Bindidon says:

        Chic Bowdrie

        “Thats precisely why I dislike the greenhouse term. It distracts from the real issue of how much an increase in the current level of IR absorbing gases will have an further effect on global temperature.”

        You are right. But for starting, it is not the worst idea. The main job then follows.

        Here is an article made by two French scientists concerning the GHE.

        Their two key concerns:

        – (1) over the long term, the more CO2 moves into the atmosphere, the higher will be the altitude at which the uppermost IR reemissions to space will take place, the lower the reemission temperature will be, and thus the least will be the reemission energy;

        – (2) over the long term again, an excess of CO2 will be responsible for an increasing closure of the atmospheric window by … H2O.

        http://documents.irevues.inist.fr/bitstream/handle/2042/39839/meteo_2011_72_31.pdf?sequence=1

        Unfortunately, it wasn’t written in English; maybe I’ll find some time to translate it with the help of Google’s translator.

        (One of the difficulties is here the strange pdf format doing its best to prevent copy & paste by inserting lots of line feed everywhere. I’ll try using UNIX tools.)

        • Chic Bowdrie says:

          Bindidon,

          It sounds like an interesting paper from what you write and their abstract. Sorry I don’t read French.

      • David Appell says:

        Chic: That terminology is here to stay and you to get over it.

        PS: and it’s a pretty good analogy.

  58. D.J.C says:

    The models are wrong for the simple reason that the underlying “physics” is wrong. Back radiation from the atmosphere (including that from carbon dioxide) CANNOT be added to solar radiation and does NOT make the effective intensity of solar radiation about three times as much, as indeed would be needed if it were direct solar radiation to the surface that was supporting the global mean surface temperature.

    It isn’t. It is the non-radiative “heat creep” process that I discovered in 2013 that is enabled by gravity because it is indeed increasing entropy and thus a direct result of the Second Law of Thermodynamics..

    http://www.earth-climate.com/Planetary-Core-and-Surface-Temperatures.pdf.

    • gallopingcamel says:

      Wow! I thought you had been banned.

      You may not remember previous occasions when we have debated this issue so I will summarize my position. Much of your paper is good physics so it is OK with me. However some of it is not (at least in my view) yet you are as unyielding as an Ayatollah.

      It is pointless to debate with a person who can’t be reasoned with. That is an unattractive trait you share with David Appell.

      • captain droll says:

        You are referring to an infamous troller who was banned some time ago. Everything – yes everything – he said was crazy. Sorry g, to say “Much of your paper is good physics so it is OK with me” casts serious doubts about your intelligence.

        • Stephen P Anderson says:

          Not quite sure why anyone would be banned but I’m looking forward to reading his paper. Something is causing the warming. It isn’t anthropogenic. We should all be looking for an answer instead of playing politics.

        • gallopingcamel says:

          I used the equations at the bottom of page 8 in the DJC paper to estimate the surface temperature of Venus using Dr. Roy’s right hand saucepan.

          That is not the only thing he got right.

      • David Appell says:

        After constantly insulting me on this blog, GC (= Peter Morcombe) wrote me the other day, asking if I would critique some of his spreadsheets. I think he thought we were friends and I should spend my time telling him what’s wrong with his science when he has ignored the obvious things I’ve told him for a long time.

        • gallopingcamel says:

          Apparently you don’t have the ability to find fault with the spreadsheets I sent you even though there are several.

          Simply said, you don’t have the “Right Stuff”.

          • David Appell says:

            You insult me continuously. Why would I ever spend my time on your spreadsheets?? F.O.

          • Stephen P Anderson says:

            He should insult you. You’re an idiot. Here is one of your comments on Ed Berry’s blog:

            —-“How can human carbon dioxide, which is only 5 percent of natural carbon dioxide, add 30 percent to the level of atmospheric carbon dioxide? It cant.”

            Because nature absorbs more CO2 that it admits. That’s why the ocean is acidifying. Duh. ——–

            Because nature absorbs more CO2 that it admits? What the hell does that mean?

            Are you usually drunk when you’re on the internet Appell? Drunks are routinely insulted Appell. They should be insulted. You should be insulted. Go wash your brain and return the money you’re being paid.

          • bdgwx says:

            SPA said…”Because nature absorbs more CO2 that it admits? What the hell does that mean?”

            Ne = natural emissions
            Na = natural absor.tions

            Na > Ne

          • David Appell says:

            Stephen P Anderson says:
            Because nature ab.sorbs more CO2 that it admits?

            Yes.

            Let Ne be nature’s CO2 emissions and Na nature’s CO2 ab.sorp.tions.

            Let Ae be man’s CO2 emissions.

            It means

            Na > Ne

            The airborne fraction is currently about 0.5, so

            Na is_approx_equal_to Ne+0.5*Ae

            https://en.wikipedia.org/wiki/Airborne_fraction

            with the rest (appx= 0.5*Ae) staying in the atmosphere.

            Of the extra that nature does ab.sorb (appx= 0.5*Ae), about half of that (Ae/4) goes into the biosphere and about half (Ae/4) goes into acidifying the ocean.

          • Stephen P Anderson says:

            Ok show me the 0.5 factor in Henry’s Law. Never seen it before.

          • David Appell says:

            It’s not in Henry’s Law, Einstein. It’s just a fact of nature, for now.

          • gallopingcamel says:

            @David Appell,

            David has a blog called “Quark Soup”. Nobody goes there any more because expels people who don’t worship at the church of climate extremism.

            Given the lack of activity at his own blog, David has time to troll Dr. Roy’s amazing website that makes complex matters understandable to almost everyone.

          • David Appell says:

            You write to me privately asking for my review of your work, clearly valuing my opinion, then here feel compelled to only insult me.

            You can’t even be honest with yourself. And are a hypocrite.

          • David Appell says:

            Worst of all, you can’t find 150 W/m2.

            Should we multiply that over the Earth’s surface?

          • Stephen P Anderson says:

            I didn’t say it was in Henry’s Law, Einstein, BGDWX did.

          • Stephen P Anderson says:

            Only 50% of anthropogenic CO2 absorbed is a fact of nature. Give Appell a Nobel prize.

          • bdgwx says:

            I didn’t say Henry’s Law, by itself, predicts the ~0.5 factor. It doesn’t. I said that Henry’s Law is a good starting point for understanding why the ocean is a net sink for airborne carbon, but there are more pieces to the puzzle.

          • Stephen P Anderson says:

            Well you’ll need to explain how Henry’s Law causes only 50% of the anthropogenic CO2 to be absorbed along all time frames and atmospheric conditions.

          • bdgwx says:

            Why do I have to explain something that I don’t believe or want other people to believe?

            What I’m saying is that if you want to understand why the ocean is a net sink for airborne carbon then it might be beneficial to start your research efforts with Henry’s Law.

          • Dr Roys Emergency Moderation Team says:

            bdgwx, please stop trolling.

    • Bindidon says:

      Oh! The immortal Do-ug Cot-ton is back.

    • David Appell says:

      D*ug C*tt*n (DJC) also wrote me a few weeks ago, asking me to read his papers. I said I would once they were published in a good peer reviewed journal.

  59. Entropic man says:

    Off topic, but the transcript of the Mann v Ball judgement is here.

    http://mustelid.blogspot.com/2019/09/mann-vs-ball-dismissal-transcript.html

    • tonyM says:

      So Mann failed to prosecute his case and costs were awarded against him. Took long enough.

      • David Appell says:

        So the settlement said nothing about the validity of the hockey stick whatsoever. Many conservative bloggers lied about that.

        • tonyM says:

          appell:
          As you are addressing my comment did you find anything wrong with? If so state what was wrong otherwise keep your gossip out of it; total red herring.

          • David Appell says:

            I’m not privy to Mann and his lawyer’s legal strategy, which may have had a logic we know nothing about.

            I’m saying the court concluded nothing whatsoever about the scientific validity of MBH’s science or the hockey stick.

          • Dr Roys Emergency Moderation Team says:

            “I’m not privy”

            Wrong, David. That’s exactly what you are.

          • David Appell says:

            More trolling by DREMT.

            All he’s ever done here. He must be related to Roy or he’d have been banned already.

          • tonyM says:

            appell:
            more totally irrelevant speculation by resident troll Appell.

            The ‘gossip’ is that Mann had agreed to furnish Ball with relevant information requested by Ball re the Hockey Stick crap. He did not do so; no need to wonder why as we are aware of his shonky unscientific methodology he continues to use today. His excuse is that “they” don’t understand. Nope experts do understand! Ball was right.

            Reflecting on Mark Steyn’s opinion Mann was the plaintiff; he was the only one who could gain financially. Ball stood to lose financially beyond legal/court costs. Ball won as he successfully defended the legal action taken by Mann. The allegations by Mann have been dismissed with prejudice. Mann pays court costs and Ball’s legal costs.

            A consequence of Mann’s failure to successfully prosecute as determined by the judge, Ball is entitled to continue saying that Mann belongs in state pen whenever he chooses.

          • bdgwx says:

            tony said…”The ‘gossip’ is that Mann had agreed to furnish Ball with relevant information requested by Ball re the Hockey Stick crap. He did not do so; no need to wonder why as we are aware of his shonky unscientific methodology he continues to use today.”

            Then the ‘gossip’ and the court are at odds with each other.

            https://www.bccourts.ca/jdb-txt/sc/19/15/2019BCSC1580.htm

            BTW…Ball can find all relevant information regarding MBH98 at the following links. Mann’s data and methods have been available to the general public the whole time.

            http://www.meteo.psu.edu/holocene/public_html/shared/research/MANNETAL98/

            http://www.meteo.psu.edu/holocene/public_html/shared/articles/mbh98.pdf

            MBH98 methods and general conclusions have been overwhelmingly corroborated by many independent studies.

            tony said…”A consequence of Mann’s failure to successfully prosecute as determined by the judge, Ball is entitled to continue saying that Mann belongs in state pen whenever he chooses.”

            I don’t think that’s how that works. Besides one of the defendants in the same case has already admitted that “untrue and disparaging accusations” were made against Mann.

            https://tinyurl.com/yy8y3996

          • tonyM says:

            bdgwx

            Go do some work on the subject which covers a lengthy period. Mann lost, period.; he didn’t have the intestinal fortitude to prosecute his case as he would have had to make full disclosure so he kept delaying and would do so to kingdom come.

            Mann has for years claimed proprietary rights in his methodology and data to avoid disclosure (sure, paid by taxpayers!). Under Canadian Law he has no such rights in a truth defence. Mann had agreed to provide Ball the information sought as part of the condition to be granted a delay in proceedings. Mann agreed. He then chickened out and did not provide the requisite information. Ball took action and asked for dismissal. Despite Mann fighting the dismissal application the court dismissed as no action had taken place for considerable lengths of time and was prejudicial to Ball.

            There were basically no real excuses for the inordinate delays on Mann’s part on a case that he had instigated.
            12] Accordingly, I find that the delay is inexcusable

            Contrary to Mann’s claims that he would not be up for Ball’s legal costs the judge decided otherwise. Over nine years that cost will be massive.

            Some seem to feel Mann did not lose; right, for chicken brains!! His case dismissed means he lost. The costs just rub the salt into his ‘non losing’ hide already smarting from strips torn from it.

            Mann had tweeted “we will likely challenge the dismissal of the suit.” Again he has chickened out!! Chicken man for sure, scientist he aint.

            According to your simple mind the information sought was and is readily available. Well here is your opportunity to provide us with those details now. Can I expect it in detail including the r2 and on what data by return posting; Ball will be happy to receive it. He will have won twice!

            To presume I had not read the judgement does little for your intelligence and trying to conflate Ball’s case with the decision of another party adds to the list which prompts one to ask why would someone persist in the dumb, dumber and dumbest in one hit.

          • bdgwx says:

            tony said…”Mann has for years claimed proprietary rights in his methodology and data to avoid disclosure (sure, paid by taxpayers!)”

            His methods and data have been disclosed. You can find his publication, methods, algorithms, data, and even source code at the following links.

            http://www.meteo.psu.edu/holocene/public_html/shared/research/MANNETAL98/

            http://www.meteo.psu.edu/holocene/public_html/shared/articles/mbh98.pdf

            tony said…”Mann had agreed to provide Ball the information sought as part of the condition to be granted a delay in proceedings. Mann agreed. He then chickened out and did not provide the requisite information.”

            I don’t see anything about Mann refusing to provide information. I don’t even see anything about the court, the FCPP, Ball, or the unnamed 3rd party asking Mann to provide information about MBH98 which isn’t already avaible.

            tony said…”Despite Mann fighting the dismissal application the court dismissed as no action had taken place for considerable lengths of time and was prejudicial to Ball.”

            If by “fighting the dismissal” you mean that Mann filed his intention to proceed to trial then yes that happened. The court set the trial date for January 2021. And yes, the judge felt that Mann’s delays in filing his intentions to proceed did prejudiced Ball. That’s why the case against Ball was dismissed.

            tony said…”There were basically no real excuses for the inordinate delays on Manns part on a case that he had instigated”

            This I agree with. It is in the court documents.

            tony said…”According to your simple mind the information sought was and is readily available. Well here is your opportunity to provide us with those details now. Can I expect it in detail including the r2 and on what data by return posting;”

            Again…Mann has made all data and research related to MBH98 available for review. If Ball really wants to see an “R2 regession analysis” as has been claimed (but never verified from what I can tell) then why doesn’t he do this analysis himself? Also, where in MBH98 do you feel this “R2 regession analysis” exists? And why would Ball accept it even if it did exist considering Ball thinks it is fraudulent anyway? I mean…if you want to use it against Mann then wouldn’t you want to perform that kind of analysis yourself?

            tony said…”To presume I had not read the judgement does little for your intelligence and trying to conflate Balls case with the decision of another party adds to the list which prompts one to ask why would someone persist in the dumb, dumber and dumbest in one hit.”

            FYI…The Frontier Centre for Public Policy and Timothy Ball are codefendants in the same case. The FCPP published the alleged defamatory comments by Ball. The FCPP’s acknowledgement of wrongdoing is in regards to the same incident in which Ball is implicated. Again…same case. So how am I conflating anything here? And if Mann really did refuse to release data related to the MBH98 work or the case then why did the FCPP settle with Mann?

          • tonyM says:

            bdgwx :
            His methods and data have been disclosed. You can find his blah blah..
            The onus is on you to show that Mann complied with the agreement with Ball. You can’t; Mann didn’t.

            bdgwx: I don’t see anything about Mann refusing to provide information. I don’t even see anything about the court, etc

            Why would you have to see it in the Judges decision. It is not the essential ingredient for dismissal. Indeed a dismissal would not be granted on that alone. The Judge doesn’t go around writing the minutiae of the case for dismissal just to satisfy you. It is sufficient for Ball to have stated it, which he did and which spurred him on to file for dismissal. The substantial arguments put would have been the areas focused on by the judge.

            [6] g) July 20, 2017, the date of the last communication received from Mr. Mann or his counsel by the defendant. No steps were taken in the matter until March 21, 2019 when the application to dismiss was filed;

            Perhaps you think the judge was suggesting Ball was waiting to learn about the latest weather from Mann!! Mann was not waiting for anything from Ball!!

            bdgwx : If by “fighting the dismissal” you mean that Mann filed his intention to proceed to trial then yes that happened

            No!! Mann certainly tried to defeat the dismissal.

            [17] ….. There are four large binders of materials filed by the plaintiff on the application to dismiss, plus one additional binder from the defendant. The binders contain multiple serial affidavits, many of which are replete with completely irrelevant evidence. In my view, this application could have been done and should have been done with one or two affidavits outlining the delay, the reasons for the delay, and the prejudice.

            Bdgwx : Again…Mann has made all data and research related to MBH98 available for review. If Ball really wants to see an “R2 regession analysis” as has been claimed …. then why …

            Yet again you make yourself a self appointed expert but fail to grasp the issue. I am no lawyer but truth is a complete defence in Canada it seems and full disclosure is a requirement. What you feel Ball should/could have done is of no relevance. He has asked for disclosure. It was not forthcoming despite Mann agreeing to it. This is publicly stated by Ball; ever slippery Mann has never denied it.

            Ball’s statement:
            …… We agreed to an adjournment with conditions. The major one was that he [Mann] produce all documents including computer codes by February 20th, 2017. He failed to meet the deadline.

            Bdgwx: FYI…The Frontier Centre for Public Policy and Timothy Ball are co-defendants in the same case. The FCPP published the alleged defamatory comments by Ball. etc

            Just because one or more parties fold their hand does not mean the remaining party must fold too. Those decisions are independent. Ball did not fold and won. Why do you conflate the two? Your questions are irrelevant. Ask FCPP for answers. Often it relates to money particularly the delaying tactics of Mann. Look at Steyn’s case – same delay tactics.

            Mann says he did not lose…well after having strips torn from his hide the judge rubbed the salt in with legal costs awarded against Mann. Yeah he did not lose; just failed miserably in his prosecution case against Ball. A loss by any other name!

          • bdgwx says:

            tonyM: “The onus is on you to show that Mann complied with the agreement with Ball. You can’t; Mann didn’t.”

            There was no agreement.

            tonyM: “It is sufficient for Ball to have stated it, which he did and which spurred him on to file for dismissal.”

            Hold on…

            tonyM: “Ball’s statement:”

            That actually comes from John O’Sullivan. It was published on July 4th, 2017 via the Principia Scientific website which John O’Sullivan operates. You can see the response from Mann’s legal counsel here.

            https://tinyurl.com/yxlujewh

            But what do the court documents actually say about John O’Sullivan?

            https://tinyurl.com/y23663e3

            https://tinyurl.com/yx8wdoox

          • tonyM says:

            I had wanted to avoid further discussion on the the “agreement” as I did not attach much importance to it in the dismissal case where I said:
            It is not the essential ingredient for dismissal. Indeed a dismissal would not be granted on that alone.” The reasons should be obvious. In fact it would have worked against him had he included it.
            That is the only area in which you have raised an issue so I will engage. You say there is no agreement.

            According to whom? You, Mann or Mann’s lawyers?
            Oh I see it is either you, Mann or Mann’s lawyers. Er er…hold on, who?!! Touche!

            Compare Mann vs Ball, Ball wins hands down for mine! Mann is a fake scientist who betrays the requirements of the Scientific Method but claims he is following it, has form with questionable practices such as Climategate, was basically told by experts as in the Wegeman Report that he was incompetent in Statistical Methods but still persists with his version of principle components and biased statistical testing, is a liar as demonstrated by his denial of his “denier” comment about Judith Curry to a Senate Committee. Ask Muller what he said about trust in Mann!

            So if Mann was to say it is raining outside I would feel obliged to check. Happy to accept your word or Ball’s.

            Mann Tweet 23 Aug: In making his application based on delay, Ball effectively told the world he did not want a verdict on the real issues in the lawsuit.

            Equally, if Mann wasn’t so chicken he would have proceeded in a timely fashion as the judge so found. He could also provide all the data and methodology.

            Mann: BC Court never made any finding that I failed to produce any data.
            True, but what a misleading statement as it does not mean there was no agreement.

            Mann: No judge has made any order or given any direction, however minor or inconsequential, that Michael Mann surrender any data or any documents to Tim Ball for any purpose.

            True,but similarly it does not mean there was no agreement.

            Even on his own twitter feed there are ample questioners asking why he has not made full disclosure – to all and sundry not just to Ball. You claim he has; so it should be easy for you to clearly disclose the data used and the methodology and the R2 we talked about.

            If it is reliance on the lawyers I have no reason to favour one over the other; they have played their own games. WUWT had an article which included PSI O’Sullivan’s quote that Ball made. Other than Ball’s quote I had bypassed O’Sullivan’s piece.

            Reading more, O’Sullivan claims that Ball told colleagues:
            “What my lawyers did was demand a series of concessions, all of which were agreed. I can’t discuss the details but, under the circumstances, it is a good outcome.”

            Despite Ball’s best efforts over 8 years, Mann would not agree to surrender to an open court his math ‘working out’ –  those arcane R2 regression numbers for his graph.

            Again you can assist here by providing this clearly, can’t you?

            Mann says: Here is a followup statement from my lawyer Roger McConchie regarding the Tim Ball defamation case responding to additional false claims by climate change deniers:
            “The BC Supreme Court has never made any finding, directly or indirectly, that you failed to produce your data.”

            True, but again it does not mean there was no agreement.

            I do note that in trying to cover for Mann his lawyer went on to suggest that Ball’s case relied heavily on his health. Immaterial but clearly BS as the judge stated :
            [13] …prejudice is presumed unless the prejudice is rebutted.
            [14] Thus, in addition to finding that presumption of prejudice has not been rebutted, I also find that there has been actual prejudice to the defendant as a consequence of the delay.

            Lawyer McConchie listed three points referring to health. There were at least 84 points made by Ball’s team.

            Whatever the truth is my question is why has Mann not simply made the info public and clearly explained all the questions asked of him.

            But you can do so very clearly, can’t you?

          • bdgwx says:

            tonyM said: “According to whom?”

            The court.

            tonyM said: “He could also provide all the data and methodology.”

            He did. See below.

            tonyM said: “You claim he has; so it should be easy for you to clearly disclose the data used and the methodology and the R2 we talked about.”

            It is easy. See below.

            tonyM said: “Reading more, O’Sullivan claims that Ball told colleagues:”

            You should read the court documents pertaining to O’Sullivan before deciding on his credibility.

            https://tinyurl.com/y23663e3

            https://tinyurl.com/yx8wdoox

            tonyM said: “Again you can assist here by providing this clearly, can’t you?”

            R2 and 2-sigma data are included in the MBH98 materials linked below.

            tonyM said: “Whatever the truth is my question is why has Mann not simply made the info public and clearly explained all the questions asked of him.”

            Mann has made methods and data relevant to MBH98 public. See here.

            http://www.meteo.psu.edu/holocene/public_html/shared/articles/mbh98.pdf

            http://www.meteo.psu.edu/holocene/public_html/shared/research/MANNETAL98/

            tonyM said: “Equally, if Mann wasn’t so chicken he would have proceeded in a timely fashion as the judge so found.”

            True. And this is the salient point. The judge dismissed the case because Mann failed to file his intentions to proceed in a timely manner and NOT because he failed to produce methods and data relevant to MBH98.

          • tonyM says:

            Bdgwx : The judge dismissed the case ……and NOT because he failed to produce methods and data relevant to MBH98.

            Did you not read or comprehend? I spent the first two paragraphs concluding that Ball had not filed a complaint about not receiving the methods and data. It was not included it in his dismissal submission as it would backfire (i.e. I left unsaid that it would show Ball’s own tardiness in pursing the matter here; you obviously did not grasp that).

            In response to your claim that there was no agreement I asked “according to whom?”

            You replied according to the Court. The court said nothing to this effect – nothing at all. Quote the court’s findings on this specific point. I put it to you that either you are obfuscating deliberately or just being illogical.

            How could the Court decide given that no complaint was filed? The court need never have known about any agreement. The usual practice is to leave discovery to the parties. It’s up to the parties to file for non-cooperation.

            So we are back to: “According to whom? You, Mann or Mann’s lawyers? ”

            O’Sullivan again addresses non-compliance re disclosure (Should Michael ‘Hockey Stick’ Mann be Prosecuted for Climate Fraud? May 23, 2018 ):

            When asked to show his disputed code Mann’s response was:
            “I have made available all of the research data that I am required to under United States policy as set by the National Science Foundation….  I maintain the right to decline to release any computer codes, which are my intellectual property… “

            In that piece O’Sullivan capture much of the issues and refers to Wegman:
            On the key issue of Mann refusing to show his secret science calculations Wegman lamented:
            “We were especially struck by Dr. Mann’s insistence that the code he developed was his intellectual property and that he could legally hold it personally without disclosing it to peers.”

            But he missed a clear doozy from Wegman which I quoted for Barry about a year ago re the HS saga:
            “A cardinal rule of statistical inference is that the method of analysis must be decided before looking at the data. The rules and strategy of analysis cannot be changed in order to obtain the desired result. Such a strategy carries no statistical integrity and cannot be used as a basis for drawing sound inferential conclusions.”

            This is a no brainer. Wegman did suggest they get some help from professional statisticians. He was too polite.

            There was no communication from Mann to Ball after July 2017 but here you are are still insisting that Mann has disclosed all that was asked of him by pointing to his various data. You are being hypocritical in that you cannot describe the methodology used to “select” the data.

            It’s Mann’s secret way of cherry picking after the event claiming principal components but you claim to know it is there somewhere in the references you gave. Right: show us precisely!! That way we know how the R2 was achieved. Perhaps you can advise Ball that you have found all that he was seeking.

            Given you have persisted in avoiding and evading this issue of clearly describing the methodology I would expect you to follow the same obfuscation. Ultimately you have agreed it had nothing to do with the dismissal findings where Mann had strips torn from his back with a nice condiment of salt and vinegar for his wounds.

          • bdgwx says:

            tonyM: “It was not included it in his dismissal submission as it would backfire”

            No, that’s not the reason. It wasn’t included because methods and data related to MBH98 were not requested by the court or Ball. Nor were they even relevant to the case since Ball’s defense was that his statements were said in jest.

            tonyM: “You replied according to the Court. The court said nothing to this effect – nothing at all. Quote the court’s findings on this specific point. I put it to you that either you are obfuscating deliberately or just being illogical.”

            Exactly. The court does not address MBH98 nor the methods and data relevant to it. That’s because it is not a matter that is being addressed by the court or by Ball. This agreement that you speak of exists only in the mind of O’Sullivan from what I can tell from the court documents and Ball’s own actions.

            tonyM: “How could the Court decide given that no complaint was filed? The court need never have known about any agreement.”

            So the agreement exists in the mind of O’Sullivan and that’s good enough for you?

            tonyM: “O’Sullivan again addresses non-compliance…”

            Hold on. Is this really a person you want to give your full faith and trust?

            tonyM: “I maintain the right to decline to release any computer codes, which are my intellectual property… “

            Mann does have a legal right to his intellectual property per the NSF. Yet, in the interest of transparency he STILL released the source code anyway long before this case.

            tonyM: “There was no communication from Mann to Ball after July 2017 but here you are are still insisting that Mann has disclosed all that was asked of him by pointing to his various data.”

            Again…he did not refuse any request for information related to MBH98. And as far as I can tell no request was ever issued. Despite that his methods and data related to MBH98 actually ARE available and have been available long before 2017.

            tonyM: “Given you have persisted in avoiding and evading this issue of clearly describing the methodology I would expect you to follow the same obfuscation.”

            The methodology of MBH98 is clearly described at the following links. The data is included. A detailed descriptions of the algorithm is included, and even the source code itself that was used to process the data is included. Everything is included.

            http://www.meteo.psu.edu/holocene/public_html/shared/articles/mbh98.pdf

            http://www.meteo.psu.edu/holocene/public_html/shared/research/MANNETAL98/

          • Dr Roys Emergency Moderation Team says:

            It’s amazing the lengths these people are prepared to go to, to defend obvious villain Michael Mann. You only need to briefly scan his Twitter page to know he’s an utterly indefensible abomination of human filth.

          • tonyM says:

            More diversionary nonsense from you.

            bdgwx: No, that’s not the reason. It wasn’t included because methods and data related to MBH98 were not requested by the court or Ball.

            Really? Where did you determine all this? Why would the court make any request for specific evidence in a filing for dismissal? Dream it up ‘in your waters’ perhaps? Did the judge sent you special messages on what Ball could or could not provide as evidence? The same way he sent messages to Mann so that he could then lambaste him for basically irrelevant rebuttal affidavits?

            You presuppose there was no agreement between Ball and Mann.

            Did you establish that in the same way; ‘the holy waters?’ Certainly neither Mann nor his lawyer has ever stated clearly that such an agreement did not exist despite it being claimed in public by O’Sullivan since early 2017.

            bdgwx : Exactly. The court does not address MBH98 blah blah.

            Where do you get the nonsense that the court precluded reference to an agreement? A delay is material to the dismissal case if it caused prejudice. It’s up to Ball to decide what he presents as evidence or do you get to decide how Ball runs his case?

            Bdgwx; So the agreement exists in the mind of O’Sullivan and that’s good enough for you?

            Given
            a) that it has been in the public forum for years and Mann has never denied the existence of an agreement and
            b) Mann + lawyer both cleverly avoided stating there was no agreement

            then yes I believe an agreement exists. I go by what is openly available not by your smear approach.

            bdgwx: Hold on. Is this really a person you want to give your full faith and trust?

            In this case I have no reason to trust him less than Mann, his lawyers or you.

            That specific section you refer to was basically all factual (Mann’s statement, Wegman report) so your point is a futile smear.

            Bdgsx: he did not refuse any request for information related to MBH98. And as far as I can tell no request was ever issued.

            We are covering the same repetitive ground. You don’t know if there was an agreement nor what is there.

            O’Sullivan maintains there is such an agreement.

            Mann/Lawyers have not denied an agreement when they had a perfect opportunity to deny it.

            Bdgwx: The methodology of MBH98 is clearly described at the following links. The data is included. … Everything is included.

            Truth is you do not have a clue. You have been repeating this but cannot point to the clear specific methodology actually used to cherry pick the data for the regression analysis. Yet you say it was available.

            MBH98 data that you referenced was last modified in 2005 as follows:
            MANNETAL98/
            11-Oct-2005 17:15

            Whilst this is after McIntyre had already exposed MBH98 as incompetent it was well before Wegman and other complaints about the lack of transparency and FOI attempts to get the complete details. This would explains why Mann did not direct O’Sullivan in Twitter exchanges to your references.

            He stood by his rights as stated by Wegman:
            We were especially struck by Dr. Mann’s insistence that the code he developed was his intellectual property and that he could legally hold it personally without disclosing it to peers.

            Yet you ask if I trust O’Sullivan. I don’t know much about him but it is clear you are prevaricating. I salute Ball on his success.

          • bdgwx says:

            tonyM: “More diversionary nonsense from you.”

            We are going around in circles. I want to be perfectly clear here. My whole schtick here is the claim that Mann refused to release information regarding MBH98 and that is why the case was dismissed. That is factually incorrect. That is what I’m correcting here.

            tonyM: “Really? Where did you determine all this?”

            The court.

            tonyM: “Why would the court make any request for specific evidence in a filing for dismissal?”

            I don’t know. Good question. Why would they?

            tonyM: “Did the judge sent you special messages on what Ball could or could not provide as evidence?”

            The case history and documents are posted on the BC courts website. I paid the $6 for access.

            tonyM: “You presuppose there was no agreement between Ball and Mann.”

            There wasn’t…at least no legal agreement that I could find.

            tonyM: “despite it being claimed in public by O’Sullivan since early 2017.”

            This is the salient point. It is claimed by O’Sullivan and only him that an agreement existed. Ball himself makes no mention of it according to all primary sources I could find.

            tonyM: “Where do you get the nonsense that the court precluded reference to an agreement?”

            There is no mention of an agreement in the case files. If you disagree then you are free to read them and if you find something you can post back.

            tonyM: “a) that it has been in the public forum for years and Mann has never denied the existence of an agreement”

            Mann and his lawyer have denied a refusal to comply with court orders or requests for information have occurred. I posted a link to this already.

            tonyM: “b) Mann + lawyer both cleverly avoided stating there was no agreement”

            That was implied don’t you think?

            tonyM: “I go by what is openly available not by your smear approach.”

            Well there you have it. You go what O’Sullivan said. I go by court records. Who am I to argue with your approach?

            tonyM: “In this case I have no reason to trust him less than Mann, his lawyers or you.”

            You should read the court documents concerning O’Sullivan. I posted the links already.

            tonyM: “O’Sullivan maintains there is such an agreement.”

            He has a history of lying (see court documents).

            tonyM: “Truth is you do not have a clue.”

            I could be wrong about all of this. The best way to be convincing to present a court document showing that there was legal requirement and request for information pertaining to MBH98 that was not satisfied.

            tonyM: “MBH98 data that you referenced was last modified in 2005 as follows:”

            I’m not sure how that is relevant. The case was opened in 2011.

            tonyM: “Whilst this is after McIntyre had already exposed MBH98 as incompetent”

            No they didn’t. But while we’re on the topic…when are they going to release their source code?

            tonyM: “it was well before Wegman and other complaints about the lack of transparency and FOI attempts to get the complete details.”

            Don’t you find it ironic that McKitrick & McIntyre and closer to home Christy & Spencer exercise their intellectual property rights by refusing to release their source code even though Mann already has? Just asking…

            tonyM: “He stood by his rights as stated by Wegman:”

            And yet Mann released it anyway.

            tonyM: “Yet you ask if I trust O’Sullivan. I don’t know much about him but it is clear you are prevaricating.”

            Then you should definitely read the court documents. I posted the links above. Fair warning…the material will be offensive to most people. I think you’ll understand why I’m not comfortable speaking opening about these specific court documents related to O’Sullivan’s actions and character in a forum like this once you see the material.

          • Dr Roys Emergency Moderation Team says:

            Still defending him!

          • Nate says:

            I understand you guys are DESPERATE to destroy the Hockey Stick and its discoverer, Mann.

            But sorry folks, science facts aren’t decided in court or by judges.

            Science facts are decided by further testing and replication by others.

            And the fact of Hockey Stick has long since been tested and proven in just this way.

          • gbaikie says:

            –Nate says:
            September 27, 2019 at 2:06 PM
            I understand you guys are DESPERATE to destroy the Hockey Stick and its discoverer, Mann.

            But sorry folks, science facts arent decided in court or by judges.–

            That was exactly what everyone was telling Mann, including major news outlets. Or anyone who had any understanding of the issue.
            And why they filed arguments against him.

            But Mann was using this position, to punish people who disagree with him. {that not what news companies wants- it’s against the US constitution in regards to free speech.

            But it’s going to be public institutions, which will paying for Mann’s immoral choice to bring this matter to the courts.
            It’s called abuse of power, and not acting in the interests of the public.
            Of course, Mann knew he was wrong, and he will forever be wrong, and as known disease upon the public’s interest.

          • tonyM says:

            bdgwx: to be perfectly clear here. My whole schtick here is the claim that Mann refused to release information regarding MBH98 and that is why the case was dismissed. That is factually incorrect. That is what Im correcting here.

            Fine, except that I have never said that was the reason the case was dismissed. I had even told Appell that it was irrelevant gossip – a total red herring.

            Later I even concluded that if Ball had an agreement and Mann had not complied he would still not have included this in evidence for dismissal.

            Admittedly, in much of my search for the primary source of info many sites, too many, carried that spurious claim that it was the reason for the dismissal.

            bdgwx: It is claimed by OSullivan and only him Ball himself makes no mention of it according to all primary sources I could find.

            I agree. I did try to find a primary source from Ball and failed. This alone would not be sufficient to dismiss its existence for the simple reason that there would be some sort of constraining clauses but it is less than satisfactory.

            Our football final beckons and this has far more attraction than Mann/Ball.

    • Stephen P Anderson says:

      So the judge ruled that all the delays caused by Mann resulted in prejudice toward Ball. Not exactly what “Judas” Arpell has been spouting.

    • barry says:

      Pretty simple: delay from Mann’s side was the appeal to dismiss the case made by Ball’s side and the judge agreed. Looks like Mann will pay the costs of delaying.

      Mann’s defamation case against The Frontier Center for Public Policy that published Ball’s remarks was settled in Mann’s favour.

      David is right that much of the skeptiverse saw this as a judgement on the science, and that this is patently not the case.

      • gallopingcamel says:

        I seriously doubt that MM will be out of pocket. Somebody will pick up the tab…..George Soros……Penn State.

      • barry says:

        Maybe. Ball was getting donations from the skeptic side, too.

        • Stephen P Anderson says:

          Ball was asking Mann to prove he curve fit the data by standard scientific method. Mann never did. By dismissing the judge agreed with Ball.

        • barry says:

          We’ve read the judges decision and you are talking BS. The judge specifically said in the 3rd fricking sentence:

          “The plaintiff, Dr. Mann, and the defendant, Dr. Ball, have dramatically different opinions on climate change. I do not intend to address those differences.”

          The judge goes on to lay out why the case was dismissed, and it has nothing to do with the validity of any science.

          Read the judgement for yourself:

          https://www.bccourts.ca/jdb-txt/sc/19/15/2019BCSC1580.htm

          • Stephen P Anderson says:

            Barry,

            The judge didn’t say “I disagree with Mann’s scientific claims and I agree with Ball and that Ball’s scientific claims are valid and that Mann’s claims are not.” Judges don’t do that-they don’t make scientific claims. But the judge did rule on the key question Ball was asking. He agreed with Ball that Mann did not produce the analyses in a timely manner-or in any manner at all for that matter and ruled in Ball’s favor-case dismissed.

          • bdgwx says:

            SPA…”He agreed with Ball that Mann did not produce the analyses in a timely manner-or in any manner at all for that matter and ruled in Ball’s favor-case dismissed.”

            That’s not what the judge said. Why not just read the official court documents?

            BTW…Mann’s methods and data have been available the whole time.

            http://www.meteo.psu.edu/holocene/public_html/shared/research/MANNETAL98/

            http://www.meteo.psu.edu/holocene/public_html/shared/articles/mbh98.pdf

          • Stephen P Anderson says:

            BGDWX,

            I did read the ruling. What are you going on about? What the hell are you reading? You don’t understand plain English? The judge ruled there had been delay by plaintiff. The judge ruled there was no excuse for the delay by plaintiff. The judge ruled the delay prejudiced the defendant. That’s what that means. Ball asked Mann to produce evidence. He didn’t produce the evidence. The judge agreed. Case dismissed.

          • Stephen P Anderson says:

            P.S.-If Mann wants to produce the evidence he can always file an appeal. He won’t.

          • Stephen P Anderson says:

            Furthermore,
            Mann’s unwillingness to produce the evidence permanently finishes the “hockey stick.” It is dead and buried. Done!

          • Stephen P Anderson says:

            —–Manns methods and data have been available the whole time.——

            BDGWX,

            Then all he had to do was produce his data and calculations to the court if he had them the whole time. Do you understand the difference between talking about something and then actually proving something? It is like if you were standing beside a Lamborghini and said “I designed and built this car using CAD and modular design techniques and materials of construction and production methods” and then me saying can you show me how you did it? And, then you show me a photo of the car.

          • bdgwx says:

            SPA…”Ball asked Mann to produce evidence. He didn’t produce the evidence. The judge agreed. Case dismissed.”

            Again…that’s not what the judge said.

            https://www.bccourts.ca/jdb-txt/sc/19/15/2019BCSC1580.htm

            SPA…”Mann’s unwillingness to produce the evidence permanently finishes the “hockey stick.” It is dead and buried. Done!”

            Again…the court, Ball, you, or anyone have always been free to review all materials related to MBH98.

            http://www.meteo.psu.edu/holocene/public_html/shared/research/MANNETAL98/

            http://www.meteo.psu.edu/holocene/public_html/shared/articles/mbh98.pdf

          • bdgwx says:

            SPA said…”Then all he had to do was produce his data and calculations to the court if he had them the whole time.”

            This statement is not consistent with the court ruling. I see nothing related to Ball or the court requesting materials related to MBH98 or any of Mann’s publications. What I do see is that Mann failed to file his intentions to proceed in a timely manner. This, the judge felt, prejudiced Ball’s defense. That’s why the case against Ball was dismissed.

            Also, note that this case had 3 defendants. Frontier Centre for Public Policy, Timothy Ball, and an unnamed party. The case # is VLC-S-S-111913. The FCPP facilitated the interview in which Ball was alleged to have made his defamatory statements. The FCPP settled with Mann earlier this year. They acknowledged that “untrue and disparaging accusations” were made towards Mann.

            https://tinyurl.com/yy8y3996

          • David Appell says:

            Stephen P Anderson says:
            “Ball asked Mann to produce evidence.”

            Ball didn’t need any of Mann’s files to denigrate his work. So why did he need them to defend his claim?

          • David Appell says:

            SPA wrote:
            Mann’s unwillingness to produce the evidence permanently finishes the “hockey stick.” It is dead and buried. Done!

            Sorry, not at all. The termination document said nothing whatsoever about the validity of the hockey stick. You are wrong, and lots of blogging deniers got it wrong as well.

          • Stephen P Anderson says:

            Might as well chop the “hockey stick” up for kindling. It’s toast.

          • Dr Roys Emergency Moderation Team says:

            Creepy.

          • barry says:

            Sorry, Stephen, there is nothing in the ruling about the science, other than the judge saying he won’t comment on it. It is VERY CLEAR.

            Judge: “The plaintiff, Dr. Mann, and the defendant, Dr. Ball, have dramatically different opinions on climate change. I do not intend to address those differences.”

            https://www.bccourts.ca/jdb-txt/sc/19/15/2019BCSC1580.htm

            Nor are those differences ever alluded to again in the ruling.

            Ball brought an order to dismiss the case because it was taking too long.

            The judge agreed with Ball and dismissed the case.

            The validity or otherwise of Mann’s science is simply not part of the ruling, nor does dismissing for delay say anything at all about the science.

            Interpreting further than that is just wishful thinking I’m afraid. This was a defamation case, not a trial of the science, and it was dismissed for taking too long to settle. The end.

          • Nate says:

            Clearly the facts just don’t matter to these guys.

            In the end they always find a way to spin a web of ‘Leftist’ conspiracy theories.

          • Dr Roys Emergency Moderation Team says:

            barry, please stop trolling.

          • bdgwx says:

            test
            test

  60. David Appell says:

    Peter Morcombe wrote:
    CO2 is not a Magic greenhouse gas. It is a gas like all the others with well defined properties.

    Nobody thinks it is magical. But it does ab.sorb a lot of IR very strongly.

    Most IR emitted by the surface is ab.sorbed, at CO2’s ab.sorp.tion wavelengths, in the first meter (that’s what Tyndall found in 1859).

    Hard to believe anyone is denying the physical properties of CO2, after over 150 years. It’s beyond silly.

    • gallopingcamel says:

      I sent you a radiative-convective model based on the measured physical properties of gases. The model is stunningly accurate for all seven bodies in our solar system that have significant atmospheres.

      Nothing silly about that.

  61. gallopingcamel says:

    David Appell said:

    “Most IR emitted by the surface is ab.sorbed, at CO2s ab.sorp.tion wavelengths, in the first meter (thats what Tyndall found in 1859).”

    I sent you a spreadsheet that quantifies the radiative properties of tropospheres where outgoing thermal radiation is absorbed in proportion to pressure squared.

    That is why the lower atmosphere is essentially opaque to thermal IR. That is why Dr. Roy’s satellite measurements show that most of the outgoing IR from this planet comes from altitudes around 2 km.

    Note to Dr. Roy: Did I misunderstand what you have been telling us?

    • David Appell says:

      As I told you, I’m not wasting my time looking at your spreadsheets, not matter how much you beg me.

      What physical law says outgoing thermal radiation is absorbed in proportion to pressure squared?

    • David Appell says:

      GC – At an average temperature of 288 K, the Earths surface emits an average of 390 W/m2. But with a brightness temperature of 255 K, only 240 W/m2 leaves out the top of the atmosphere.

      Where is the missing 150 W/m2?

      • gallopingcamel says:

        Trolls are useful when they stimulate “On Topic” debate.

        Do you have anything interesting to say about Dr. Roy’s saucepans?

      • donald penman says:

        The explanation I would offer here is that there is an equilibrium flow of energy (radiation convection and conduction) between the surface of the Earth and the Atmosphere which we are not aware of because it does not change the temperature of the surface. We are only aware of energy flows that attempts to change our temperature or the equilibrium between the Earths surface and the atmosphere.

          • donald penman says:

            I don’t agree with that model because the Earth does not lose and gain energy as a single body it is not uniform like the Sun. Half of the Earth is being heated by the Sun and half is not there is differential heating of the poles with time of year. The equilibrium temperature is more influenced by solar variation during the year and latitude than it is by co2, WV and precipitation variation affects temperature locally rather than overall. I am not aware of the energy flows in this diagram they are not real but just abstractions.

          • David Appell says:

            “Equilibrium” means after all short-term influences have been averaged out…. So it’s not daily, or even yearly,…. it’s over decades, even after the solar cycle has averaged to a near constant, and ENSOs, and the AMO/PDO/NAO etc.

          • Dr Roys Emergency Moderation Team says:

            David, please stop trolling.

        • gbaikie says:

          “donald penman says:
          September 20, 2019 at 8:05 AM
          I don’t agree with that model because the Earth does not lose and gain energy as a single body it is not uniform like the Sun. Half of the Earth is being heated by the Sun and half is not there is differential heating of the poles with time of year. ”

          I think roughly night and day radiate about same amount of energy.
          {Our Moon is quite different}.
          A major reason is because 70% Earth surface is Ocean.
          Or if 100% was land, it would be quite different.
          Another reason is because we have an atmosphere {which weighs about 10 tons per square meter}.
          And roughly it takes a lot energy to heat the surface of ocean {first few meter of ocean surface water} and it take a lot energy to heat the 10 ton per square meter of air.

          But in terms of land surface air temperature and/or ground temperature there is wide difference of temperature between night and day. And way we take air temperature is by measuring highest near noon temperature.Because measure highest day temperature the 15 C average global is higher than what should a average temperature. And another distortion of the 15 C global air temperature is the tropics has a high average temperature and tropics of 40% of surface. So it seems that the 60% of the rest of the world is warmer. likewise since tropics has fairly uniform night and day temperature it add illusion of more uniformity of global night and day temperature.

  62. gbaikie says:

    –The Big Question

    The big question is, How much will the climate system warm in response to increasing CO2? The answer depends not so much upon uncertainties in the component energy fluxes in the climate system, as Frank claims, but upon how those energy fluxes change as the temperature changes.

    And thats what determines climate sensitivity.

    This is why people like myself and Lindzen emphasize so-called feedbacks (which determine climate sensitivity) as the main source of uncertainty in global warming projections.–

    I don’t think anyone has posted about the Big Question.

    My position is there not really any feedback or a low sensitivity.
    But also think we could wildly effect global air temperature within a very short period of time. Which I mentioned, but this would about cooling global air temperature.
    I don’t any particular idea about how the increase global air temperature.
    And also think it would be good to increase global air temperature, so maybe someone has some ideas of how to warm global air temperature.

    I suppose someone might suggest detonating all Methane Hydrate deposits. It seems like huge waste potential energy, or there are trillions of dollars of methane, if we can figure how to economically mine it. I think people could figure out how to do this, and we had governments and “big businesses” working on it- but that hardly counts as actually trying.

    How trillions of dollar in terms gross worth of methane would be needed. $2.54 spot
    “Where is natural gas most expensive?
    Hawaii, where it costs $42.98 per thousand cubic feet.” {residential}
    Industrial users:
    Hawaii 23.22
    And cheapest industrial users:
    Oklahoma 2.07
    I think about $2.50 is reasonable gross value for thousand cubic feet and how mass is that? 15.69 kg
    The molar mass is 16.04 g/mol. And there are 977.84 moles in 1000 cubic feet of methane, gas. That gives 15.6845 kg.
    For tonne: 1000 / 15.69 = 63.73 or terms dollars, $159.34 per tonne. Or billion tonnes, 159.34 billion dollars.
    And trillion tonnes is serious amount of money.
    Estimated amount of Methane hydrates known in ocean:
    “The total global amount of methane carbon bound up in these hydrate deposits is in the order of 1000 to 5000 gigatonnes”
    Or 1 to 5 trillion tonnes.
    So if only wanted waste trillion dollars of gross value of methane {6.3 billion tonnes] would that have any effect?
    How how have already vented [problem is we tend to burn it}:
    “North Dakotas Bakken Shale and Texas Eagle Ford Shale, Earthworks found that North Dakota oil companies have flared more than $854 million of natural gas since 2010”
    All wet lands are suppose to do 140-280 million tonnes.
    I imagine ocean releases a lot more than that, let’s say total is +1 billion tonnes.
    So, 6.3 billion tonnes or trillion dollars worth is not going to cause much warming. I don’t warming is worth more than 10 trillion dollars. Or for 10 year time and warming by .1 C, I don’t think it’s worth trillion dollars. Or .1 C for 100 years is not worth 10 trillion dollars. But I think .4 C for 20 years is better buy able thing, and say it worth as much as 10 trillion dollar.
    And someone buying that, I don’t you do it with methane if count methane as worth a trillion dollar for 6.3 billion tonnes.
    Anyhow, if you warm global average by .4 C for 20 years can price tag be 10 trillion dollars or less?
    I think one could make the Sahara be grassland for less than 10 trillion dollar and might warm global temperature by .4 to .5 C.
    But what other ways could you warm global temperatures?

    And if Sahara desert was made in a grassland, what possible negative regional effects would there be of doing this.
    And if this was the way global temperature was increased, what would negative of effects globally of increasing global temperature by .4 C.

    Now, if ignore the real cost of methane and detonate some methane Hydrate deposits {though maybe, those that were deemed to be least mineable] there doesn’t seem there would be any significant possible regional effect, and question is what global negative effects would be. And assuming that gas release warmed same amount as greening the Sahara would, would it warm regions differently. Would methane release warm the tropics and Sahara wouldn’t warm tropics {or wouldn’t warm tropics as much}. Or would one of them warm polar regions more than the other?

    • gbaikie says:

      So Big Question is roughly knowing what causes warming [or cooling]
      and result such warming {or feedbacks].
      And I add where is warms and cools {the most].
      And can we make changes which are cheap.

      I want to talk about this {and related}:
      –Svante says:
      September 21, 2019 at 1:27 AM
      Lindzen retired in 2013 but he is a genuine climate scientist with a solid base in physics.

      Here he is explaining the GHE and some of your better ideas:
      https://tinyurl.com/yyovo588

      Stick with him and stay clear of crazy stuff like no GHE and 2LOT violation.–
      First, the 2LOT violation issue, come up when people talking about back radiation warming the surface. Which is obviously wrong, though even most “Warmist/Alarmists” agree it’s wrong, but various posters here keep insisting that back radiation has something to with causing warming or is the greenhouse effect.
      Instead, Lindzen talks what changes the elevation of where Earth emits and lose heat. Or it the radiant energy going up, not energy going down.

      Now, going back the concept of designing or causing changes in global temperature {which could done by humans], what has “nature” done.
      What Nature has done on Earth is have the surface {the ocean} which absorbs the most energy be at lowest average elevation {sea level} and it has land at the higher elevations.
      This is roughly related to: Ocean warms and Land cools.

      One thing Lindzen said is:
      “The poles would be vastly colder than they are today.”
      How cold are poles today and how much vastly colder would they be?
      Or Antarctica is at one pole, and Antarctica is pretty cold, so what is “vastly colder”.
      I don’t have average temperature of arctic ocean, handy, but guess, it’s about -10 C. And it’s at sea level, how much is vastly colder compared to around -10 C.
      I would say -50 to -100 C roughly fits what could be called vastly colder, in terms of arctic ocean region.

      Now, Antarctica average elevation is “8,200 ft (2500m)”. And it’s 20 K cooler just from it’s elevation.
      From a design point of view, Antarctica higher elevation, makes it a good place to get rid of vast amount energy.
      Or opposite way to say it, less warming of the Antarctica, is global warming effect {you are not wasting energy by having it dumped into space]. Or that Antarctica is not warming is a “sign” of global warming, or heating Antarctica is war you can’t win- it’s the killing fields of warmth {particularly if you concerned about global air temperature}. But Antarctica despite “Nature best efforts”, is still getting warmed a lot. Or if Humans mess with “Nature efforts”, it might be a low cost way to cool Earth.

  63. gallopingcamel says:

    @David Appell,

    “But only my model is perfect:
    https://davidappell.blogspot.com/2012/04/norfolk-constabulary-made-wrong-charges.html
    and it’s based on standard radiative physics.”

    You used Albedo = 0.11

    That means you failed to take the Moon’s non-Lambertian properties into account. As a consequence there is no way your daytime temperatures can match observations.

    • gbaikie says:

      “That means you failed to take the Moons non-Lambertian properties into account. ”

      Could you explain to me, “Moons non-Lambertian properties”?

      Well, I am here.

      Greenhouse effect is rising the elevation level, in convecting atmosphere, which is radiating to space.
      {I will note, I have some problems with idea- which will not go into- so as to avoid a rambling post}

      But get to the point, there would be a level in atmosphere where convection doesn’t occur- roughly the tropopause.

      And so having more atmospheric mass allows a higher tropopause.

      So, to those imagining Earth becoming like Venus, one could say that Earth simply does not have enough atmospheric mass for this to happen.

      One could also say Mars doesn’t have enough atmospheric mass, for it to have greenhouse effect.

      It seems like a simple way to explain things.

      Is there any particular reason why it is not an accurate way to explain it?

      • gbaikie says:

        Is density or traffic?

        Sulfur hexafluoride (SF6) is a dense gas.

        So you have fewer SF6 molecules equal the same density
        as more lighter gas molecules {more molecules per volume
        being “more traffic”}.

        I don’t like idea of terraforming Mars atmosphere- takes too long
        and it’s hideously, hideously, expensive.
        Plus I think if add a larger atmosphere, it’s more windy and you have more convectional heat loss {making effectively making it colder than Mars is currently}.

        But putting something like Sulfur hexafluoride in crater, sounds like it might be good idea.
        Look Ma, it float a boat:
        https://www.stevespanglerscience.com/lab/experiments/heavy-gas-sulfur-hexafluoride-sf6/

        It’s suppose to be super greenhouse gas but gaining any elevation might a problem, but it could fill in craters.
        So, fill crater with it, and add a lake of water.

      • gallopingcamel says:

        David Appell assumes that the Moon’s Albedo is 0.11 and he is right when the Sun is directly overhead. This means that 89% of the TSI (Total Solar Irradiance) is absorbed and 11% is reflected.

        Thus at lunar noon the surface receives 1361*0.89 = 1,211 w/m^2

        At the lunar dawn or dusk the situation is different. At grazing incidence the Moon’s Albedo is 0.39. I got this information from NASA:
        https://luna1.diviner.ucla.edu/~jpierre/papers/Vasavada_et_al-2012.pdf

        Thus at lunar dawn or dusk the surface receives 1361*0.39 = 531 W/m^2.

        Even though Dr. Roy is a real scientist he made the same mistake as David Appell. You don’t need to believe me because this spreadsheet speaks for itself:
        http://www.drroyspencer.com/wp-content/uploads/simple-radiative-EBM-of-sfc-and-NOatm-with-diurnal-cycle-using-Earth-days.xlsx

        When a body is Lambertian it absorbs (or radiates) energy uniformly, regardless of the angle of incidence. We say that the Moon is “Non-Lambertian” because the Albedo depends on the angle of incidence.

        NASA researcher Ashwin Vasavada requested funds to determine whether the lunar IR emittance was non-Lambertian. Dr. Roy’s lunar model assumes that the lunar IR emittance is Lambertian @ 0.97 (very close to “Black Body” behavior). I am “for” Dr. Roy on this one and against Ashwin Vasavada.

        This link includes a discussion of the Moon’s non-Lambertian behavior and how to model it:
        https://tallbloke.wordpress.com/2014/04/18/a-new-lunar-thermal-model-based-on-finite-element-analysis-of-regolith-physical-properties/

        There is a simple way to think about this. Objects that are very shiny (low Albedo) are Lambertian. Objects that approximate to being “Black Bodies” (high Albedo) are Lambertian. Everything else is non-Lambertian.

        My apologies to everyone….I ran long on this one!

        • gbaikie says:

          Ok.
          But you made look it up.
          Wiki: Lambertian reflectance:
          “Lambertian reflectance is the property that defines an ideal “matte” or diffusely reflecting surface. The apparent brightness of a Lambertian surface to an observer is the same regardless of the observer’s angle of view.”
          https://en.wikipedia.org/wiki/Lambertian_reflectance
          And: Lambert’s cosine law:
          “In optics, Lambert’s cosine law says that the radiant intensity or luminous intensity observed from an ideal diffusely reflecting surface or ideal diffuse radiator is directly proportional to the cosine of the angle θ between the direction of the incident light and the surface normal.The law is also known as the cosine emission law or Lambert’s emission law. ”
          Whatever that means. And:
          “A Lambertian scatterer will then scatter this light according to the same cosine law as a Lambertian emitter. This means that although the radiance of the surface depends on the angle from the normal to the illuminating source, it will not depend on the angle from the normal to the observer. For example, if the moon were a Lambertian scatterer, one would expect to see its scattered brightness appreciably diminish towards the terminator due to the increased angle at which sunlight hit the surface. The fact that it does not diminish illustrates that the moon is not a Lambertian scatterer, and in fact tends to scatter more light into the oblique angles than a Lambertian scatterer.”

          So wiki agrees that Moon is non-Lambertian.

          I would say a non-Lambertian surface will not give glint.
          The Moon has glint.
          A Lambertian surface has no glint.

          • gbaikie says:

            I mean
            “I would say a non-Lambertian surface will give glint.”

            Though maybe not always true, but certainly always true, that a Lambertian surface has no glint.

          • gbaikie says:

            Oh, I guess a cloud is a Lambertian surface. Other than that, they aren’t surfaces found typically in nature.

  64. gbaikie says:

    In this Earth energy budget:
    https://en.wikipedia.org/wiki/Earth%27s_energy_budget#/media/File:The-NASA-Earth's-Energy-Budget-Poster-Radiant-Energy-System-satellite-infrared-radiation-fluxes.jpg

    It says, 40.1 watts on average is emitted from all the Earth surface and constantly.
    One can assume if surface is some elevation, say 500 meters elevation, when is warmer it emits more and compared to when the surface is cooler. Cooler night surface radiate less and warmer day.
    But cooler surface at higher elevation could radiate more than than warmer surface lower elevation- but there lots of factors involved, hence the word, “could”.

    But in big picture, does ocean radiate more or less than the land surface?
    The ocean average temperature is about 17 C and land average temperature is 10 C.
    Since average of ocean surface is warmer {7 K warmer} one could think possible the ocean radiates near 40 watts {or more} and land radiate less than 40.1 watts.
    Now could also say, if there are clouds, then one could has near 0 watts from the surface going directly into space.
    So maybe the answer to which radiates more, ocean or land, might be which has more clouds? One also has dust/aerosols which block a lot radiation from the surface directly reaching space.
    Wiki:
    “Sea salt aerosols can alter the Earth radiation budget through directly scattering solar radiation (direct effect), and indirectly changing the cloud albedo by serving as CCN (indirect effect). Different models give different predictions of annual mean radiative forcing induced by sea salt direct effect, but most of the previous studies give a number around 0.6-1.0 W m−2”

    And why don’t block part 40.1 watts going directly into space. I suppose one could say Sea salt aerosols are part of the surface- sort of like trees are part of the surface. Anyhow, I think very little effect of scatter, sunlight in terms of warming the ocean {indirect light should warm an ocean the same as direct sunlight}
    Goggle:
    “Decades of satellite observations and astronaut photographs show that clouds dominate space-based views of Earth. One study based on nearly a decade of satellite data estimated that about 67 percent of Earths surface is typically covered by clouds. This is especially the case over the oceans, where other research shows less than 10 percent of the sky is completely clear of clouds at any one time. Over land, 30 percent of skies are completely cloud free.”
    https://earthobservatory.nasa.gov/images/85843/cloudy-earth
    And in picture, Sahara seems to lack clouds.
    As does Australia and interior of Antarctica.
    I wonder if possible that Antarctica, is 40 watts or more.
    Anyhow it seems land radiate more than ocean.

    • gallopingcamel says:

      That link that you provided relates to planet Earth which IMHO is too complex to be modeled using Dr. Roy’s saucepans.

      I am still waiting for someone to explain why the saucepan analogy does does not work for Venus.

      Nobody has explained what is wrong with my Venus model. On the other hand not a single person has affirmed my analysis.

      • gbaikie says:

        “I am still waiting for someone to explain why the saucepan analogy does does not work for Venus.

        Nobody has explained what is wrong with my Venus model. On the other hand not a single person has affirmed my analysis.”

        Well I would say Venus is heated on it’s lid.
        Venus clouds/lid is reflective and transparent and yellowish lid.
        And saucepan tends to warmed from it’s warmed bottom.
        Earth is mostly warmed from it’s bottom like normally done with a sancepan.
        I also think the sun warms Earth clouds- but not sure how much {but does seem like a large factor.
        But if Earth were completely covered by clouds, I don’t that would cause Earth to become snowball Earth.

        How warm would Earth be if completely covered by thick clouds. I don’t possible for Earth to remain completely covered by clouds, but would not very surprised if Earth had short periods where completely covered by clouds. And very likely has long periods in which Earth had a lot more clouds as compared to present, cloudy Earth.

        • E says:

          Gbaikie

          “Nobody has explained what is wrong with my Venus model. ”

          I haven’t seen your model, but I can make three suggestions.

          1) Your model describes lapse rate etc using the Ideal Gas Law, but these are the outcome of the energy budget, not its cause. I would bet you a dollar that you put energy related values such as surface temperature in as assumptions, rather tan deriving them from the energy fluxes, SB radiation etc.

          2) Check that your model conserves mass and energy.

          3)) I hope you weren’t trying to make your model work without the greenhouse effect?

          • gbaikie says:

            –E says:
            September 22, 2019 at 4:16 AM
            Gbaikie

            Nobody has explained what is wrong with my Venus model. —
            That is Camel saying:
            “I am still waiting for someone to explain why the saucepan analogy does does not work for Venus.

            Nobody has explained what is wrong with my Venus model. On the other hand not a single person has affirmed my analysis”

            Camel also said:
            “That link that you provided relates to planet Earth which