This has nothing to do with climate or climate change, but as a photographer it interests me.
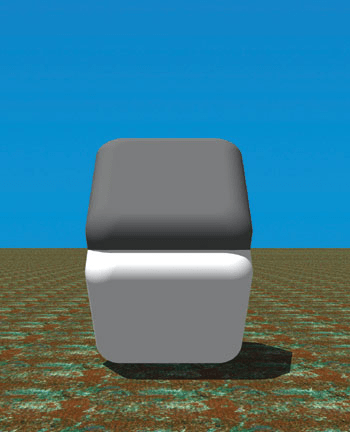
Some version of the following image has been making the rounds on social media for many years. The accompanying claim goes something like this:
“These two blocks are exactly the same shade of grey. Hold your finger over the seam and check.”

I can demonstrate that this is not the case.
The two blocks actually are very different in their shades of gray, given the source of illumination as implied by (1) the area between them and (2) the shadow below them on the ground.
If you cover up that seam (and the shadow as well), they only appear to be the same shade of gray because your brain then assumes (without any other visual cues) that they are both illuminated equally. But given the knowledge of the direction of the illumination, your brain is telling you that they really are different shades of gray.
If you still don’t believe me, you could demonstrate this with two different pieces of paper having very different shades of gray and take them out in the sun, orienting them like the two objects above. You would need to find two shades of gray (say, two paint swatch cards) where their apparent brightness (as measured by, say, taking a photo and analyzing the digital counts in Photoshop) would be approximately the same. In that case, would you say, “These two cards have the same shade of gray because I measured them in Photoshop?”
Of course not.
Now, the question arises, why do the center of the surfaces still appear to be different brightness, even though they are the same? As a photographer, I’ve noticed that when you take a photo of a very contrasty scene, your eye can see details in the shadows that the recorded camera image cannot. Similarly, very bright areas might show details to the eye, but be totally washed out in the camera image.
I don’t believe this is just the differences in dynamic range of the eye versus a camera, because the iris opening of the eye is the same for the entire scene, and the inherent integration time of the eye-brain system is presumably the same across your rods and cones. I think it’s because our brain does a sort of localized contrast enhancement within our field of view, making shadowed things seem brighter and very bright things seem dimmer. (You can make similar adjustments using “curves” in Photoshop).
It’s sort of the visual equivalent of audio compression. The brain alters perceived brightness locally to enhance contrasts. I believe this is why we photographers often use adjustments in software to get the image to look more like what our eye and brain perceived.
I just discovered that my explanation involving localized contrast enhancement seems to be supported by a 1999 article in The Journal of Neuroscience entitled, An Empirical Explanation of the Cornsweet Effect.
Two gray blocks?
I thought they were black and white
Pots of water (last article)
Picture of a girl smoking a blunt (last article)
Might as well have fun here,
since the world is going to end
in 12 years.
Not if you give you your rights and an extra $30,000 per years. YOU can prevent the world from ending.
My original qualifications were in colour chemistry. One of the skills we developed were comparing the shades of different samples. Looking at the two greys as you suggest with something obscuring the difference I see the bottom as being lighter.
The brain has a big effect on how we percieve colour difference and colourists can be trained to detect small differences.
Some scientist you are. There are online color-pickers where you can evaluate the RGB levels.
Both upper and lower images are
R=123
G=124
B=126
The named gray would be 128
A real scientist evaluates the data with the tools available.
Sjertje:
Since this has been around for years and others have already done what you just did, I didn’t feel the need to also do it.
They are the same. Here’s a low tech solution to prove it. Print it out and then cut a vertical rectangle out and hold it against the upper and lower parts and you will see they are indeed the same.
Dr. Spencer, I agree with Mike. I placed the picture into the ‘Paint’ application, then cut a section of each, and put them together. They were the same color.
There is a falsehood in the caption. The two blocks ARE NOT the same shade of gray. The MAIN sections of the two blocks are the same shade, but the intersection and edges are NOT the same shade. If you take away the black from the top block and the white from the bottom block and make a uniform rectangle, the effect disappears.
I think it is implied that the center rectangle of each block is what is being questioned.
FULLSLOT77
jili slot
jili slot
jili
jili
jilislot เล่นผ่านเว็บ
jili slot เล่นผ่านเว็บ
7XSLOT
jili slot
jili slot
jili
jili
jilislot เล่นผ่านเว็บ
jili slot เล่นผ่านเว็บ
Of course they DO have same RBG values, but that’s the point why Roy proves they are NOT same color in real life. They could have same RBG values ONLY IF upper cube is actually darker. Why? Because light shines on it directly, and lower cube is in shadow and gets much less light than upper one. That means, that lower one MUST be of lighter color, if it is able to reach same RBG after “taking photo” as upper one.
the dynamic range of the retina is greater than CCD sensors, without even getting into the effect of the iris.
This is why photographs of clouds are always disappointing.
There is probably a lesson about seeing what you expect to see here, which is relevant to climate consensus science. If you are preconditioned to expecting CO2 to have a devastating effect on climate, you will see evidence of it everywhere, like the lower face looks lighter because we assume it is less well lit. Our expectations trick our perception.
Dr Spencer,
I posted a comment on the “pots” thread yesterday, yet I don’t seem able to find it. What is going on here, am I being blocked ??
Well that one got through OK, but I just tried reposting on the other thread and it seems to dump my post.
It was a few paragraphs and contained on link to Curry’s site. Are there some restrictions on posting here we need to know about?
I posted a similar comment on the WUWT dupe of your post here. I think there is a key point in the way models are tweaked which probably explains why they run hot.
https://wattsupwiththat.com/2019/09/13/a-stove-top-analogy-to-climate-models/#comment-2794618
Bottom line over-sensitivity to volcanic AOD allows over-sensitivity to GHG.
Um, AOD is a negative forcing. GHGs are a positive forcing.
Your last sentence doesn’t make sense.
David, please stop trolling.
I’m afraid you might have to read what I wrote again. You totally missed the point.
Who?
Greg there has a good point. Take a photo, print it or show it, and the brain cant improve the contrast locally any more.
The retina is very good.
Dr. Spencer, I’m pretty sure those are the same shade of gray. It has to do with the way vision is processed. While the graphic may actually be a bit off, that physical property is consistent with the way vision and contrast are processed by the brain. There are all sorts of examples of that and other oddities like staring at a flag of colors opposite of the real color and then looking at a white page and seeing the actual flag. This is similar to the white balance in photography. Vision works on a relative basis, as well as movement.
You can also put the graphic is a photo editor and check and see if the colors are identical. My bet is they are.
Oh, for heaven’s sake. Did you not read the post? The illumination cues indicate the two objects, if they were under the same illumination, would be very different shades of gray. Read my suggested experiment. The interesting thing is why, even given that fact, the brain interprets them as different shades of gray even though they are reflecting the same amount of light. -Roy
Dr. Spencer wrote;
” I think it’s because our brain does a sort of localized contrast enhancement within our field of view, making shadowed things seem brighter and very bright things seem dimmer.”
Exactly, each portion of the eye has, in effect it’s own localized “contrast” adjustment.
The human eye also has higher spatial resolution (ie pixels) along the main observation axis that the peripheral field of view.
There are all kinds of wonderful “computer processing” that goes on in the Human Brain between the actual Photo Receptors (rods/cones) and the CPU (Central Processing Unit).
The system (lens, iris, rods, cones) seems to have been optimized to detect “differences” and “motion”. It also seems to have been optimized to detect “motion” first under dim lighting and “differences” first under bright lighting.
Like an evolution thing (and/or intelligent design).
I know a smart person that did his PhD thesis by raising a litter of kittens. He attached “eyeglasses” to each kitten which “filtered” the spatial content of the images reaching the kittens retina. Some kittens had “vertical blinds” that only passed edges along the “up/down” axis of the eyeball. Other kittens had “horizontal blinds” that passed “side by side” edges.
After the kittens had grown to adult cats (warning the next step may be disturbing) the cats where humanely euthanized. The brains where analyzed and distinct patterns that matched the “spatial filters” that each kitten had while maturing was clearly detected in the brain where the optic nerve connected to the “CPU”.
Not a joke, Look Up Dr. Edward Granger, Univ of Rochester, circa 1970’s IIRC.
Also a clear reason why parents should checkout any suspected vision problems with human infants so they can be corrected before permanent damage occurs.
For me, the link between the brain’s illusion of color and climate change is that the human super computer brain creates a worldview from incomplete data. In doing so we are all very likely prone to bias on complex observations. This is why science relies on independent measurement and empirical data to self correct our collective view of reality. Issue for climate models and really all models (big bang, plate tectonics, economics, string theory) is they never get past the hypothesis stage until calibrated over and over. Some very complex models like standard model of quantum physics are well calibrated others like string theory simply are not. Climate models unlike weather models are not calibrated frequently (in human time scales) because they are predicting temperature decades into the future. Thus, there is no way to fine tune away our bias on the interacting variables with measured data, and to make matters worse the opportunities that do exist to measure data are also models that can be adjusted with bias and can be manipulated (and have been).
So I personally consider climate models low confidence
worse, when basic physical modelling does not give the desired results (Lacis et al 1992 ) for volcanic forcing, it is simply “recalibrated” by arbitrary rescaling to make models give the desired output ( Hansen et al 2002 ).
When this gives an effect on TLS which is twice the magnitude of observed changes, this is not corrected.
Fortunately Spencer and Christy are in charge of the TLS extractions and are not likely to “correct” the data to fit the rigged model output.
UAH has had HUGE modifications to its data — far larger than any surface temperature adjustment:
https://davidappell.blogspot.com/2015/04/some-big-adjustments-to-uahs-dataset.html
And remember UAH’s famous sign error?
So what, the surface record is just a proxy.
Greg,
Can u link the paper? I will have a read but I dont understand why infrequent major volcanoes would be meaningful to a climate model. Of course, there could be something I dont know about and opportunity to learn.
Dr. Spencer, my bet is that you can replicate that graphic in Excel. Gray out some cells, divide them by a white line, and then alter the color of the surrounding sells to alter the contrast.
why do the center of the surfaces still appear to be different brightness, even though they are the same?
Context.
Interesting phenomenon, Dr Spencer. I think the message here is, ‘Don’t be deceived by appearances’.
Everything we see, perceive, hear, taste, smell, and think, is conditioned by the characteristics of the human brain in general, plus the slightly different and unique characteristics of each individual.
We tend to project our impressions of what we see onto the object we are viewing. We describe a leaf as green because our mind produces a sensation of greenness when a certain frequency of light passes through our pupils. It’s true the leaf has the characteristic of reflecting those frequencies of light which our brain interprets as green, but the leaf itself has no color. Color exists only in the human mind.
Regarding the ‘apparent’ two different shades of grey, the extreme black and white areas that separate the two blocks are causing the illusion of the different shades of grey. However, if one inverts the black and white seam (in Photoshop) so that the white area adjoins the upper block and the black area adjoins the lower block, the two shades of grey then look the same, at least in my mind, just as they do if you completely remove the black and white seam. Isn’t that strange?
Hi Dr. Spencer.
I’m not convinced that it is a sort of “visual equivalent of audio compression”.
I think instead it could be a sort of what our brains expects our eyes are seeing under that light source and what it’s really stand in front of our eyes.
To explain better what I mean, what we see can conditionate what we hear too, that is “The McGurk Effect”:
https://www.youtube.com/watch?v=G-lN8vWm3m0
In this only optical case, with a material of the very same color and reflectance, we expected an upper face lighter and the vertical face darker just because of that light source (revealed by the shadows), since instead we see the very same intensity of light, our brain tell us that the upper face is surely darker the vertical one.
Have great day.
Massimo
Removing the shadow on the ground does not change the appearance of the blocks. However, reversing the shadow at the base of the upper block and placing it at the top of the lower block, and placing the white seam at the base of the upper block, makes the grey of both blocks look the same.
Hi Vincent,
yes, it isn’t the shadow on the ground that emphasize the effect, are the shadows on the curved borders of the blocks.
Think this:
If you look the upper face front border, it fades from the face gray to almost black when its thickness face is parallel to the vertical block face, which is gray instead.
You consciously don’t realize that, but your brain unconsciously does it and let you see the upper block face darker. If both the faces where of the same color and reflectivity then the vertical thickness face of the upper horizontal block would be of the same gray of the vertical block face.
Do you get my point?
In the McGurk Effect is the movement of the lips that dominates the heard sounds and let you “hear what you see” instead of what you really heard, in this case instead it’s one of the various subconscious visive planes, that our brain possesses, that looking to the supposed environment lighting make your brain see “the real life color of that faces as you know it”.
Note that we are arguing about this drawing just because it’s the 2D projection of a 3D environment. If that was a true 3D object, with those shading on the borders, the upper block was effectively darker than the vertical one.
Have a great day.
Massimo
Hi Vincent,
“yes, it isnt the shadow on the ground that emphasize the effect, are the shadows on the curved borders of the blocks.”
—————————————————————-
Hi Massimo,
True. However, if you turn those shadows between the two blocks up-side-down so that the black is at the top of the lower block, and the white is at the bottom of the upper block, indicating that the light source is from the ground, then both blocks look an equal shade of grey.
Hi Vincent,
yes of course, it’s exactly what I meant.
I’m Italian and my English is not that good, so maybe I wrote something silly that I lead you to believe that I was contradicting your point, but I fully agree with you.
I add that if you swap the whole two blocks you shouldn’t see any change without changing those shadows between the two blocks up-side-down (or see very little changes). That because that details is the part of the picture which hijack your brain convincing it that those blocks are made of an homogenous material.
You can also remove the background sky and ground and nothing should change, except if you made them (sky and ground) of the same color of the blocks face. In that case I suspect that the effect could be reduced a little(but I’m not sure).
The following story is to highlight you how “magic” is our brain.
Some years ago a friend of mine was very worried because after he had a surgery to one of his eyes to change the yellowished lens, he experienced a change of the perceived color on the operated eye.
He reported that looking to a white paper foil with the operated eye he seen the paper bluish. The surgeon said him that the implanted lens was made by Zeiss and it was absolutely clear. For that reason the surgeon suggested him to have a psychiatric or a neurologic consult to exclude any brain related illness.
I suggested him to wait some months to allow his brain to adapt to the new “absolutely clear” lens and do nothing to his brain. I explained my point of view and convinced him that his old natural lens was became yellowish little by little along his life, so his brain was accustomed to a particular balance of stimuli from his eye cones that corresponded to his (then current) feeling of “white”. Since the yellowing happened little by little, he never perceived it because his brain adjusted the stimuli from the different cones to get always the very same sensation of “white” he had since his birth. But (then) now the surgeon implanted a “very very clear lens” so his brain abruptly received very stronger stimuli from the blue cones because the yellow filter represented by the yellowished lens had been removed, for that he was seeing bluish when looking to a white surface.
Well, he did nothing, six month later the bluish effect disappeared by itself and the year after he went to a second surgery to the other eye.
Our brain is a microcosmo inside our skull and we are far to really know how many incredible thing it can do keeping us unknow about it.
Have a great day.
Massimo
Maybe not this gray block specifically , But visual illusions have a lot to do with climate, The climate shysters are using optical tricks in their charts and graphs to represent the data “looking” as something it isn’t. I talked about it before and presented examples , they have this down to art.
They do it for a living as full time jobs.
Yes. When the graphs are showing 10ths of a degree with a big spacing between each point on the left vertical, the increase in temperature over a century or more can look alarming because the curve is as steep as Mt Everest.
It’s only “alarming” if you don’t know how to read graphs and charts.
David, please stop trolling.
“They do it for a living as full time jobs.”
I can draw charts and graphs. Where do I apply for such a job?
I’m thinking going into business selling climate chart making accessories
https://i.postimg.cc/L6GJ3Np6/350.jpg
Eben, any progress in the last 5 days?
David, please stop trolling.
The planet’s burning up folks. It is even red on top it is so hot.
https://www.washingtonpost.com/graphics/2019/national/climate-environment/climate-change-world/
The igloos are now spontaneously catching on fire
Perhaps there is a lot of money to be made selling solar powered air conditioners for use in igloos?
Unless Al “The Climate Blimp” Gore already has the igloo air conditioner concession?
He beat me by two weeks, when he bought the Wall Street gondola concession, to be used by executives to get to work in the Manhattan financial district, after the streets were flooded from sea level rise.
There’s 12 more years to make money from global warming.
What are you guys waiting for ?
No reason you can’t make the same investments Al Gore and others are making. (That’s capitalism. Maybe you don’t have what it takes.)
Difference is, they see the future and you deny it.
David, please stop trolling.
Thats what I’m talking about, they already used up the darkest red crayon on the north pole, if it gets another degree warmer they will have to literally start drawing flames
They will adjust the scale, Einstein.
David, please stop trolling.
The end of the 1800s was the centennial minimum for the sun. Of course everything looks warm compared to that.
And Of course the data in Antarctica is unavailable.
I have a hard time believing this map anyways. Maps like this lose their credibility when they don’t bother to match the local NOAA data. What did they do, take the heat island stations and average them in with the rest to make every region red and create a false global trend? The USA is not at a record high. In fact, you will have a difficult time finding a year hotter than 1988 which occurred 30 years before this map run ended. We only had about 25% of the 90 deg days that we had in 1988 in the Midwest. It is not even close.
Scott R says:
And Of course the data in Ant.arc.tica is unavailable.
Not true at all.
UAH LT So.Pol land available at:
https://is.gd/iGw1e4
So.Pol temp (Amundsen-Scott Station) available at:
https://is.gd/O03Hp4
David, please stop trolling.
Josef Albers, artist, Bauhaus graduate and refugee to US was interested in experimenting with tone, colour and perception:
https://acpress.amherst.edu/books/intersectingcolors/chapter/josef-albers-and-the-science-of-seeing/
Roy says: “But given the knowledge of the direction of the illumination, your brain is telling you that they really are different shades of gray.”
But such knowledge does not exist! There are no actual blocks. There is no direction of illumination. There are only pixels on the screen.
Our brains are *creating* context based on past experience and trying to force this image to match some context we do understand. It’s easy to interpret this as two different color tiles meeting at a corner, sitting in a field of grass with the sun shining. But there is no such reality behind this picture. There *are* two regions with identical colors of pixels.
What you *should* be saying is “”But given the ILLUSION of the direction of the illumination, your brain is telling you that they really are different shades of gray — when in fact they are identical on your screen.”
Hi Tim Folkerts, glad to see you back again.
DREMT had a weird idea about the GPE, that some of the simple algebra was illegal in this case because it did not agree with physical realities.
I should think not, but is there any part of physics that disallows certain mathematical laws?
I know there are alternate forms of mathematics, but can you not always apply any trick in the book once you have stated it mathematically?
I’d like to hear it from an expert to avoid argumentum ad ignorantiam.
Svante says:
I should think not, but is there any part of physics that disallows certain mathematical laws?
In quantum field theory infinities often appear in the calculations. Physicists have derived ways to, in essence, subtract infinity from infinity and get a finite number at the answer. (It’s called renormalization.)
Scoff if you want, but such calculations give results that agree with experiments to around 1 part in 10^10, as for the electron’s g-2 factor.
Interesting, thanks David.
If you pay more attention to your own heroes, Svante, the argument “the math is correct, but the physics isn’t” has been made before by people on all sides of the climate debate at one point or another. There’s nothing unusual about it.
I printed the picture, took scissors and cut out pieces from both surfaces… They are the same
Dr Spencer… could you please confirm that you asked the group to stop with the off topic posts and this wasn’t someone impersonating you? Although, how can I verify your response to this is really you?
Perhaps as a group, we can all agree to keep the generic climate change discussion going on the monthly temperature update.
My personal opinion is that the length of the monthly temperature thread already becomes too long and quite cumbersome to hold conversations… especially since there are no notifications. It takes a lot of effort to make sure you respond to everyone in this current format especially if you are limited to a mobile device like I am to read charts on google drives.
The generic free for all conversations is really enjoyable to me personally, as I’m legitimately trying to learn by talking to people that agree and disagree with me. I’d hate to see it go. Maybe there is a way if you don’t mind Dr Spencer, you could make a weekly post (without a specific topic) just as a placeholder for whatever conversations we would like to have.
As always, I appreciate your work greatly.
I see the NH made a new all – time high on HADSTT3 for any month. This primarily came from the north Pacific which hit +1.068, heat that hasn’t been seen since 1877. This confirms the PDO trend has still been up. AMO did not make a new high this summer, it made another lower high, which continues to suggest the AMO has rolled over since 2012.Interesting that UAH was so depressed in Aug with the NH ocean so warm. The SH has been offsetting a lot of the NH rise. Let’s see if the globe high we are making turns out to be a lower high. Based on the 11 year ENSO cycle, harmonics I’ve been talking about, it should drop as the effects from the last El Nino will start to disappear from the global ocean in short time and we go into a period of time with multiple la ninas.
Almost all of the temperature movement on UAH can be explained by ENSO and the AMO. I wrote this simple equation:
UAH departure = AMO monthly departure + 0.14* Nino 3.4 monthly HADSTT3 departure (2 month delayed)
If ENSO is controlled by the 11 year solar cycle and harmonics, and AMO is a 5th harmonic of the GSM, there is no room for significant CO2 forcing here. The down beat that caused the AMO cycle is coming soon if I’m right and that could devastate the gulf stream and Europe. I would really like you to comment on that some time.
Numerology.
In case you have even less training than Scott R. (which seems unlikeley), he is proposing a linear lag relationship between UAH and Nino 3.4:
———–
UAH departure = AMO monthly departure + 0.14* Nino 3.4 monthly HADSTT3 departure (2 month delayed)
———-
It is very simple to show that this is a poor long term model, but yet Scott R jumps to a concern about the jet stream breaking down.
The bottom of the gutter . . .
Kudos.
That’s bizarre. Someone seems to be trying to impersonate me.
You would think they would at least spell the name right!
David, Tims, please stop trolling.
Stephen P Anderson
“The planets burning up folks. It is even red on top it is so hot.
https://www.washingtonpost.com/graphics/2019/national/climate-environment/climate-change-world/”
*
I understand your point. I don’t like all these charts full of dark red. (But unlike some commentators, I do not like those full of dark blue either, especially those reminding me February 1956 in France and Germany.)
But… the Arctic above 60 N is warming, that is noticed even by the ‘coolest’ series UAH6.0 LT, indicating twice as much as for the whole Globe, and its northermost grid cells at 82.5 N show trends over 0.4 C / decade. Duh.
Nobody will wonder that a the surface, it warms ‘a little bit’ more. And this little bit is a lot: 0.65 C / decade for the UAH period.
Here is a comparison of GHCN daily stations with UAH (don’t bother about the genius’ inevitable comments concerning faked graphs and fudged data):
https://drive.google.com/file/d/1g3dUwOEn_IYo81_e8KKmsoPgNxRzv_5j/view
Where does that all come from?
When you generate an anomaly statistics for GHCN daily in the Arctics showing for each station the monthly anomalies, and produce an ascending sort out of it, you see that in the top 1000, over 400 stations months from years above 1999 are listed.
That means 40 % coming from the last 20 years, yeah, and 16 % since 2014, i.e. 5 years.
The month with the least anomaly at position 1000 still shows 9.6 C above the mean of 1981-2010.
The top shows, for March 2019, an anomaly with hardly a believable value
CA NT YOHIN 2019 3 +17.4 C
from a station in Canada’s Northwest Territories.
No, it’s not in the middle of some giant UHI spot, it’s in the middle of nowhere:
https://tinyurl.com/y2w7l2pc
I have verified: the average absolute temperature for the March months within 1981-2010 from this station is -20.7 C.
and when you look at this station’s record for March 2019 within GHCN daily, you understand why the anomaly is so absurdly high.
Nobody should panic about that; but it isn’t a reason to ignore it.
Bindidon,
The arctic always warms and cools faster than the globe on average. Look at the short term amplitude of the change on the arctic from year to year. When we are in an up leg, the arctic will out perform. When we are in a down leg, the arctic will underperform. Don’t confuse the Arctic’s higher response to ENSO with the 1980-2016 trend. Last month’s arctic reading was +0.44. Going back 2 months to see what ENSO 3.4 was, I see June was a 0.7462. If you go back 3 months it was 1.0056. So you are talking about a fraction of a degree warming in the arctic during an El Nino.
Despite the arctic fear mongering, the Greenland ice sheet is growing, gaining 600 gt on average, and losing less than that during summer. The Thermohaline circulation is slowings. That gives us a temporary warming in the El Nino region, but could kill the gulf stream during the GSM and devastate Europe. The AMO is almost definitely the 5th harmonic of the GSM, and the PDO is almost definitely the 3rd harmonic. You can easily see the familiar pattern on HADSTT3. If this wasn’t climate data what would you say about it?
HADDSTT3… double bottom (1858, 1917) followed by a long up leg into 1942, then a short down leg to 1976 as the 5th and 3rd harmonics offset, and another upleg into the present. The next move of a 3-5 harmonic data set is collapse to baseline.
T =(1/1.75)*COS((A2+11)*3.14159*2/75.16) + (1/3.25)*COS((A2+11)*3.14159*2/125.2666)
Chart this equation in excel where A2 = 1600, and copy down to A472 = 2070.
I am definitely not sure about my offsets, period lengths, but the data looks about right for the global ocean being controlled by 3rd and 5th harmonics of the GSM.
Scott R
“Despite the arctic fear mongering, the Greenland ice sheet is growing, gaining 600 gt on average…”
Scott R, this is something that YOU pretend. You did not (WANT TO) understand GRACE’s output.
Greeland’s ice sheet is not growing at all. Pretend all you want. It won’t change anything.
Btw: many thanks for sparing me your games with harmonics in the future. No interest.
Scott R
I forgot to ask you: did you, yes or no, understand that I was talking about Arctic’s surface temperatures, and not at all about those in the LT above it?
I have some little doubt…
The sat data is much better than weather station data sets summed by large government agencies to share the wealth of the heat island effect into large regions to draw all red maps. Lol I will look at local data on noaa, it makes a decent proxy if you can avoid high population growth areas.
You still haven’t shown me where Greenland loses more than 600gt of ice. I want a list by glacier with the outflows per year. Why is that so difficult?
As for ignoring natural harmonics, you do so at your own peril. The GSM is almost here, it will cause many issues, and you refuse to listen to me like all the rest. Plot a general 5-3 harmonic wave. These patterns are everywhere in nature, economics, stocks electronics, the list goes on and on. Of course the climate follows harmonics. You could literally do stock trading technical analysis, multiple timeframes on the global temperature data and have better predictions than the best co2 models.
I assume that Scott R is a jillionaire because he can predict the stock market with his 5-3 harmonic wave.
I remember reading an article in 2006 about how the natural cycles were aligning to produce an incredible surge in the stock markets.
The predictions were really reliable until we had the worst recession since the great depression.
Milly
Millerton,
Stock trading takes more than understanding harmonics, trends, moving averages, support & resistance etc. What the federal reserve is doing is very important for instance. And the market makers do their thing of course. Trading harmonics in the stock market might help you change your odds of success from 50% to 60%, but if you dont manage risk correctly, you will get washed out like 90% of the traders out there. I would say trading in the stock market successfully is more difficult than understanding the earths climate if you can believe it.
David Appell,
You continue to respond to me by posting links to people that know better than me, but you never answer any of my questions directly. Just because an article says scientists say doesnt mean everything that follows is true. The 600gt of winter (which is 9 months long in Greenland) gains can be found here by clicking on the Acc. tab: http://polarportal.dk/en/greenland/surface-conditions/
Jesus Christy,
If I wanted criticism of my scientific understanding based on my conclusion, Id go to the Bernie Sanders facebook page and talk to people that know nothing about science. How about providing constructive criticism? This is a science blog, not a political blog.
Scott R, as I predicted below, your link shows the SMB.
Your link says:
“This is known as the surface mass balance. It does not include the mass that is lost when glaciers calve off icebergs and melt as they come into contact with warm seawater.”
Millerton: Ever hear of Elliott Wave Theory?
Not much different.
https://en.wikipedia.org/wiki/Elliott_wave_principle
So you’re saying EW theory is like climate change model- Good in retrospect.
Scott R says:
The sat data is much better than weather station data sets summed by large government agencies to share the wealth of the heat island effect into large regions to draw all red maps.
That’s not what one of the modelers of the sat data thinks:
Carl Mears, Senior Research Scientist, Remote Sensing Systems (RSS)
“A similar, but stronger case can be made using surface temperature datasets, which I consider to be more reliable than satellite datasets….”
http://www.remss.com/blog/recent-slowing-rise-global-temperatures
video: https://www.youtube.com/watch?v=8BnkI5vqr_0
David, please stop trolling.
Scott R says:
the Greenland ice sheet is growing, gaining 600 gt on average, and losing less than that during summer.
According to what data or research? Cite it.
It’s the SMB I guess, ignoring the total.
But SMB includes the total.
His link says:
“This is known as the surface mass balance. It does not include the mass that is lost when glaciers calve off icebergs and melt as they come into contact with warm seawater.”
Svante,
Do you have a list of glacier outflows in Greenland? I haven’t been able to find anyone with that information. My understanding is ~600 gt of new snow falls every year on Greenland. I am not satisfied with the GRACE information as it does not show this known snow fall, looks fake. I’m looking for actual measured outflows by glacier.
Stephen P Anderson
Yes… in fact I am proposing you can use EWT on the climate because it is made of 3rd and 5th harmonics from what I can tell from forcers as short as ENSO, and as long as the super grand solar minimum.
Right now, the UAH is in a leading diagonal down as the 2.2 / 3.6 / 11 / 72 / 120 year cycles have all aligned in the DOWN direction.
Scott R says:
“Do you have a list of glacier outflows in Greenland?”
No I haven’t, but you can download ESA Sentinel-1 flow speeds and thickness data from here:
https://www.promice.dk/FlowingIce.html
There should be plenty more on Google Scholar.
Gotta love a crank who has just the most barely sufficent grasp of science to write a paragraph that is syntactically correct buy utterly devoid of any rigor or scientific substance.
J. Christ
Scott R wrote:
T =(1/1.75)*COS((A2+11)*3.14159*2/75.16) + (1/3.25)*COS((A2+11)*3.14159*2/125.2666)
Chart this equation in excel where A2 = 1600, and copy down to A472 = 2070.
This is called: numerology.
David Appell,
The global ocean data for the last 170 years is taking the shape of a 3/5 harmonic wave, perfectly timed to the GSM. Why hasn’t the ocean made a hockey stick shape like CO2? hmm What you are doing is not science. It’s more similar to religion. You criticize my model, and yet it is a better fit than yours. Hilarious.
High up from the south is approaching Australia. The nights will be very cold.
Again irrelevant to the purposes of this blog.
ren, get your own blog.
David, please stop trolling.
A cold jetstream will bring tornadoes and a strong wind to the North Central US.
https://www.cpc.ncep.noaa.gov/products/stratosphere/strat_int/gif_files/gfs_o3mr_200_NA_f048.png
Off-topic.
“Off-topic.”
lol
I believe the topic was about different shades of grey.
ren interesting. I’m looking at the 540 line covering Michigan (where I live) by Monday. That will end this 1 week heat ridge and give us seasonable temperatures. Should be around 1/2in to 3in of rain with that front. Looks like the heavy ban will be from K-zoo to Lansing to Port Huron.
I’m watching a major snow storm developing starting on September 26th for the west, especially the high elevations with some areas getting more than 2 feet of snow in the first week of fall.
Scott, I think you (and ren, of course) have mistaken this site for one on weather, instead climate.
…instead of climate….
David, please stop trolling.
Scott R,
many variables decide about the temperature. It is important to focus on the two most important:
1. The course of the northern jetstream.
https://www.cpc.ncep.noaa.gov/products/stratosphere/strat_int/gif_files/gfs_o3mr_200_NA_f024.png
2. ENSO cycle.
https://www.tropicaltidbits.com/analysis/ocean/cdas-sflux_ssta_global_1.png
I invite you to my website.
https://www.facebook.com/pages/category/Blogger/Sunclimate-719393721599910/
And climate it is important to focus on the two most important:
1) CO2.
2) CH4.
Svante you really think these trace gasses are more important than the sun, ENSO, AMO? If they were, why didn’t the earth burn up and extinguish all life when there was 10x more CO2 100s of millions of years ago?
ren,
I agree… the Jetstream and the ENSO cycle control our short term weather. I haven’t used that product (ozone mixing ratio) for the jet stream information. I find this one helpful to know where the jet stream likely will be…
https://www.tropicaltidbits.com/analysis/models/?model=gfs®ion=nhem&pkg=mslp_pcpn&runtime=2019092218&fh=6
Thank you. This is exactly what I meant.
The geopotential height above the polar circle affects the course of the jetstream.
https://www.cpc.ncep.noaa.gov/products/stratosphere/strat-trop/gif_files/time_pres_HGT_ANOM_JAS_NH_2019.png
Roy, is climate change making flooding in the Houston area more common?
David Appell
At this time the evidence would not support such a conclusion.
Here is some history of this area. Flooding is very common in this area.
https://www.hcfcd.org/flooding-floodplains/harris-countys-flooding-history/
From the link: “A major flood still occurs somewhere in Harris County about every two years.”
Off topic David Appell. We were talking about shades of gray. lol
You know I’m just messing with you. We should be able to talk about anything related to climate / weather on this blog, anytime we want to. My 2 cents. Course it is up to Dr. Spencer how much leniency he will give the group.
We should be able to talk about anything related to climate / weather on this blog, anytime we want to.
Exactly. That’s why I brought up Houston’s weather and its back-to-back very rare floods….
David, please stop trolling.
Roy, mis it true that you said on the rush Limbaugh show that theres been no global warming in Alabama since 1900?
Wow thats technically true, did you say that the 50 year trend in Alabama is 0.2 for C/decade?
If not, do you at least understand why no one in the scientific community trusts you about anything, and why you will retire with that judgement?
Wow David Appell is a stalker now
I think the man is in serious need of help
Appell:
you are off-topic, again!!!
Perhaps you should go to your own site – and stay there.
The goal of the leftist is his agenda and nothing else. For Judas Appell to comment about the concept of trust is ironic is it not?
Temperature in Alabama in C, 1900-2019, according to the GHCN daily stations
https://drive.google.com/file/d/1g2L2Gu-zgOeGZ6VZMvYYakAwTmLqXQWX/view
Trend 1900-2019: -0.03 C +- 0.02 C
Trend 1970-2019: 0.18 +- 0.04 C
No reason to become agressive about what is known since quite long a time.
Now stop calling those “trends” and you will move an inch closer to a scientist
Eben
You are lightyears away from persons able to decide how close I am to science.
If you don’t know what trends are for, or discredit them for ideological reasons: what about stopping to write comment around them?
you can’t tell the difference between the real trend and the noise you are just like a dog chasing its own tail thinking if you only go faster you will catch it.
Trying to explain this to people like you is an exercise in futility
It’s amazing how many people think that merely minimizing the sum of squares of deviations from a model somehow reveals innate truth, like some magic crystal ball.
Eben
If you have balls enough to do, feel free to teach people like Roy Spencer about that.
They (luckily) produce each month trends out of their data.
But you aren’t the first person showing such poorish mix of ignorance and arrogance. And you won’t be the last one.
Be sure it doesn’t bother me.
The climate changes in cycles some are known some likely still not , The 40 years satellite data set contains exactly one half of 80 year Atlantic Multidecadal Oscillation a well nown strong influencer of the climate , just like a much shorter strong influencer El nino La nina cycle, and exactly from the coldest to the warmest phase , drawing the line through this half of the cycle and calling it a trend is scientifically retarded , If the satellite data started in the 1940 to contain the whole cycle the trend would be exactly zero, but you are too dense to grasp this concept.
https://images.theconversation.com/files/83292/original/image-20150528-31344-zr6dkt.png
Eben is 100% right about AMO. I’ll take it a couple of steps further and say that AMO + ENSO + the 3rd harmonic of the GSM + the 2000 year cycle as described by Zharkova, with a dash of true temperature change in the form of heat islands easily explain everything we are seeing. No CO2 forcing needed at all.
As we continue to cycle through these up and down legs as CO2 rockets higher and higher, it will eventually become obvious which side is using bunk science.
You sound exactly like an astrologer.
You’re doing numerology, not science, and certainly not physics. There isn’t a trace of physics in any of your comments….
David, please stop trolling.
Eben says:
Now stop calling those trends and you will move an inch closer to a scientist
Why aren’t they trends?
David, please stop trolling.
On a different note:
For those of you who read the Wall St. Journal,
Gerald Baker tells readers of the High Church of Environmentalism.
An interesting read.
He will be stoned as a heretic.
https://www.wsj.com/articles/saint-greta-spreads-the-climate-gospel-11568989306?mod=searchresults&page=1&pos=8
It’s very curious how this girl has unnerved conservative white men everywhere….
David, please stop trolling.
Look what these idiot leftists who are running our schools are teaching are kids:
https://www.youtube.com/watch?v=vjZcXWiuliw
Government is always the last bad actor.
….Sorry our kids….
Your complaint is that they are teaching kids science?
Yes, I can see how that would infuriate deniers.
Leftist adults use this tactic of hiding behind children to make their argument exposing the children to criticism. Then the leftist adults attack those who criticize the children-very psychopathic.
This one is even more bizarre that made the rounds a few years ago. In an office poll, we were split roughly evenly on blue and black vs. gold and white.
https://en.wikipedia.org/wiki/The_dress
Yeah, I think someone linked it above.
Folks,
I studies another data set over the weekend. This time it was the Central England temperature data set going back to 1659. What I found is that temperatures are a full 4 deg c warmer now than they were during the GSM. Also of interest, temperatures had already bounced by 3.5 deg c by 1737. So the majority of the temperature change happened without CO2. This data set also shows the 3rd and 5th harmonics of the GSM are responsible for the PDO and the AMO. This agrees with my analysis of the HADSST3 data.
Model for Central England:
T = =4.62+(1/2)*COS((A3-52)*3.14159*2/(365/5)) + 4.62+(1/2)*COS((A3-52)*3.14159*2/(365/3))
Where A3 = 1660 -> 2100
https://drive.google.com/file/d/1fCwbclHobjJekPZbke3Enz2Zv63Nlgse/view?usp=sharing
I do want to note that of course, we don’t have a perfect fit here. We have GSM harmonics impacting climate, but we also have ENSO with a very high amplitude, volcanic activity, and other solar events such as Dalton, Gleissberg, modern maximum which can add to or suppress the GSM harmonics. By no means is this a perfect model, but, it does explain very well the mid-century cooling we had.
Scott says: “By no means is this a perfect model, but, it does explain very well the mid-century cooling we had.”
I hate to rain on your parade, but there seems to be little here beyond: “The data has some wiggles. My curve has some wiggles. One of my wiggles aligns with an actual wiggle, so … success!”
Tim Folkerts,
Actually, the function listed above has a VERY good fit to the data. Of course GSM harmonics are not the only climate forcers, but clearly there is a relationship there. The amplitude of the change from GSM is also very large. When GSM, AMO, PDO, ENSO line up it can get QUITE cold. Like 4 deg c colder.
Anyways, folks around here are creating models of run away global warming based on a linear trend from 1980-2016. The climate in all recorded history has never been linear. As mentioned, the temperature in central England spiked 3.5 deg c over 78 years spanning 1659-1737. Had the global warming alarmists been around at that time to fit their linear model, they would have been just as nervous as today. It doesn’t make sense to try to fit linear trends to climate data. We need to use the SIN/COS function on multiple timeframes for sure.
Scott, without going into too many details, here area few uick critiques.
1) It is really not a very good fit, given the number to adjustable parameters. You have
* a constant (4.62+4.62)
* an amplitude (1/2 for each cosine)
* a phase offset (-52 years)
I suspect a simple linear fit would produce just a close of a fit over the ~ 365 years.
2) your function is fundamentally unable to deal with data that really do have changes. Your function will ALWAYS average to 9.24 in the long term. Your function should at least have the capability of handling long-term trends. (And your function will repeat the exact same pattern for ever, which does not seem very satisfying or very close to nature).
3) Your model kinda sort works until ~ 1900. Since then, it has been running around 0.5 C low. I suspect a simple linear fit would produce just a close of a fit over the ~ 365 years.
3) Perhaps most importantly, there is no physical basis for your 365 year cycle, with 121.7 and 73 year harmonics). This seems to be entirely an artifact of you having 365 years of data to play with. If you had done this analysis 50 years ago, would you have put “315” into your function and told us about the importance of harmonics with periods of 105 and 63 years?
4) Someone else’s questionable model is not support for your model. (Plus no one just fits the past 36 years as their climate model.)
Tim Folkerts,
Thank you for taking the time to look at my function. It is VERY rare to engage people on this level.
As for your criticism that my function has too many adjustable parameters… basically, these constants were not adjustable at all. I picked them to fit the proxy data, in this case, the central England temperature dataset. It is not a coincidence that central England was at a low point during the last grand solar minimum, and a high point during the modern solar maximum. It is completely main stream that we are going into a grand solar minimum now. NASA backs me up on that. There is no opportunity to make the period anything other than the 365 years (+/-). The offset is irrelevant – only having to do with the calendar year we are in. The overall period drives where the harmonics should be, and the data cooperates VERY well.
There is absolutely opportunity to improve this model / add other forcers. Some will have shorter periods (like ENSO, 11 year cycle) others will be longer (like 2000, 40,000 year cycles). The more natural cycles you can add to the model based on proxy data, the more accurate the prediction. If say I add the 2000 year forcing, that accounts for the higher modern high. If I add solar forcing (for instance, 1880 had very low solar activity) the model gets better in that the peak we should have had around that time from the harmonics was suppressed by a weak sun. Tweaks to the amplitudes of the forcers will be possible when more forcers are added in.
The problem with a linear fit, is it does very poorly when used to forecast oscillating systems. It might do ok for a while until a cycle on a larger time frame takes it out. The same is true of sin functions that don’t include a larger timeframe.
My question to you, anyone else that would like to answer me is, how did climate science get so far off track from the reality of these data sets? It’s not like the central England temperature dataset was just revealed to the public. Clearly the earth’s temperature can move by +3.5 deg c in less than 80 years without CO2. I’m not the only person on the planet fitting sin functions to data I can assure you of that. So what gives?
Scott,
“these constants were not adjustable at all. I picked them to fit the proxy data”
That is what “adjustable parameters” means! You adjusted them not because any laws of physics or meteorology or chemistry, but because they happen to fit the data.
“It is completely main stream that we are going into a grand solar minimum now. NASA backs me up on that.”
That is certainly one possibility, but that is not certain. Nor is it cleat just when it will start, nor how long it will last.
“There is no opportunity to make the period anything other than the 365 years (+/-).”
Where does this come from? Records of past grand minima show that
they occur at irregular intervals, not on some 365 year cycle.
https://en.wikipedia.org/wiki/Solar_minimum#Grand_solar_minima_and_maxima
“Some [cycles] will have shorter periods (like ENSO, 11 year cycle) others will be longer (like 2000, 40,000 year cycles).” This makes more sense than your 365 year (non)cycle. There is a physical reason for a ~11 year cycle (the sun); there are reasons for some longer cycles (eg the Milankovitch cycles). Many other ‘cycles’ operate variable timescales that cannot be used to predict the future. But your 365 year seems to be based on … what? That fact that there are 365 years of data in the set? That the most recent solar grand cycle seems to be about 365? And even if were accept this cycle, there is still ZERO motivation for dividing it by 3 or 5. (Why not 2 or 4 or 6 or 7?)
“Clearly the earth’s temperature can move by +3.5 deg c in less than 80 years”
No. Clearly Central England can move that much in a short time.
“The problem with a linear fit, is it does very poorly when used to forecast oscillating systems.”
Conversely, the problem with oscillating fits is that they do poorly when used to forecast changing baselines.
Also, I tried a simple linear fit. The linear fit is better. So empirically, my linear fit is better than your more complicated oscillating fit!
Tim Folkerts,
Respectfully, all models are built upon past data. How else should I build a model? Out of thin air like the IPCC? lol The 3rd and 5th harmonics appear again and again in climate, weather, nature for that matter on all time frames, and all of the time. The fact that the 3rd and 5th harmonics line up with data so well indicates a GSM is coming. You are wrong about the GSM not occurring in regular intervals. Read this paper:
https://www.nature.com/articles/s41598-019-45584-3
By the way, I have less than 365 years of data. We don’t have a complete cycle here. We come up just short. I’m willing to adjust the 365 down the road once more data is collected, but it fits well as-is and makes a good predictor.
The linear fit only works because you are capturing the 2000 year cycle with it, and an incomplete 365 year cycle. (so the 2 cycles lined up during the data gathering period) Once the GSM arrives, you will need to use the COS function.
Central England temperature records are the longest actual recorded temperature data set on the planet as far as I know. It is true, I’ve modeled central England technically, not the globe. I believe we could probably set up ratios or possibly even functions of some type that convert between central England and other places by observing as much data as possible for the alternative location and calculating the amplitude of the GSM, harmonics. In fact, I will be doing that for my home town once I am satisfied that my model is correct. It doesn’t make sense to do that now because I need time to perfect the model for England first. There could be several additional forcers by the time I’m done.
Scott, that paper from Nature helps explain your thinking. I certainly agree that there are many natural cycles that need to be considered. And cycles can be connected in subtle ways.
I am still not quite convinced that
1) AMO & PDO are so simply connected to 1/3 & 1/5 of the solar cycles.
2) the various cycles are as definite as you assume; they they are locked in such tight connections.
3) CO2 can be ignored.
Whatever the natural cycles have been in the past, they can be disrupted by other events. The paper mentions a supernova perhaps affecting signals seen on earth. Similarly, different disruption to the previous status quo — like CO2 — could easily have an effect *in addition* to any effects of the other cycles.
So the linear fit to the CET could be because of CO2, or because of some confluence of natural cycles. The next 20-50 years will certainly give a strong indication. Your model predicts a strong downturn coming. CO2 predicts a continued upturn.
In either case, my linear fit is STILL a better fit than your curves. So if you think there is some loooong cycle at play, you better include it in your model!
BTW,. there is no a priori reason that the 3rd & 5th harmonics should be the same amplitude. You ought to let those be adjustable and see if that helps. You should also consider Fourier Analysis (if you haven’t already), which is designed for exactly such periodic functions.
Tim Folkerts thank you for reading the Zharkova paper.
I understand your hesitation to the AMO, PDO connection to the GSM. As far as I know, I have never heard that before from anyone. I’m go to research it further. People are very smart, and, I’m sure someone has looked into that before. If not, perhaps I should have published my findings.
I know for a fact that each GSM cycle is unique, so we can not use the last cycle 100% to build the model. I would actually have to capture 5 GSM cycles in the model to perfect it. Zharkova also gave a great interview here:
https://m.youtube.com/watch?feature=youtu.be&v=Bl2gg7lT7OM
So your comment is most definitely right on about things not being locked in tight formations. They are not. We see this on smaller time scales where each 11 year solar cycle is unique in both timing and amplitude. Models therefore can become out of phase with the data given a long enough period of time. It is important to align the length of the prediction to the length of the data fit. For instance, I can’t expect my equation to still be in phase 100,000 years from now. That would be ridiculous to think that.
IF at the end of the day, I’ve included all natural forcers and there are some “left overs” I will look at man’s influence. I suspect however that heat islands play a much larger role on our temperature measurements than the sum of all man made gases. In my opinion, co2 probably does contribute something very small. By being willing to look at the natural forcers, we can learn the truth about man’s influence and decide if we should worry about it or not. Keep in mind, for 80% of the time, the entire state of Michigan is under a mile + of ice. If the CO2 forcing is very low, it could actually be considered a positive for mankind. In any case, the world is not going to burn up in 12 years. CO2 has been much higher in the past and life thrived.
I will most definitely continue working on the model to add other forcers. I actually did play with the amplitudes a bit just to see if the fit might change. I think it would be better to leave them split evenly for now until I add additional forcers. I’m working manually so far in excel, not using Fourier Analysis yet, but yes I have most definitely thought about using that.
Thank you for the constructive criticism.
This is probably the wrong place for a mathematical discussion about a topic unrelated to the top post but …
1) Using the standard deviation of the error between model and actual as a measure of goodness of fit
0.75 = your 3/5 harmonic fit
0.64 = improved 3/5 harmonic fit (which could probably be improved a bit more)
0.61 = simple linear fit
0.59 = improved 3/5 harmonic + linear fit
So there is a bit of improvement possible, but adding harmonics to a linear fit, is still hardly better than the linear fit by itself.
2) You say “IF at the end of the day, I’ve included all natural forcers and there are some “left overs” I will look at man’s influence. ”
I think this is a bit dangerous. There is a quote from Von Neumann: “With four parameters you can fit an elephant to a curve; with five you can make him wiggle his trunk”. If you keep adding more and more forcers, you will be able to fit any curve better and better. But excessive curve fitting can blind you to other factors.
Tim Folkerts,
What tools are you using to calculate the standard deviation error to examine my data? Maybe it could help me speed up my climate research. I actually like the idea of using standard deviation a lot. I’ve actually proposed using it on the tide gage readings to see if sea level is actually accelerating or if it is still linear.
I believe the additional of the 2000 year cycle will improve the standard deviation in the same way adding the linear fit did. I also need to worry about other solar cycles. For instance, the 1880 solar output was very low and suppressed that peak. You can see that the harmonic shape is there, but, the amplitude isn’t right. That means a forcer is left out.
I understand what you are saying about the forcers. Keep in mind, as I add more forcers, I will have no choice but to reduce the amplitude of the original forcers. Right now it’s like I have 2 equations and 2 unknowns. The next one will be 3 equations and 3 unknowns. The more forcers I add, the more complex this will get. My logic on why I think CO2 is not the main forcer comes from study of the general shape of the data for temperatures, sea level. Rather than being a hockey stick, you have sharp cyclical ups and downs. We see moves of 3.5 deg c without any influence of CO2. We also see the same thing in HADSST3 data with sharp drops with or without CO2. Once CO2 is introduced, we would expect to see the data depart from the modeled prediction of the “control group”, the period of time without significant CO2 change. I actually think I can do this with enough time.
I just used Excel.
I calculated your fit and a linear fit (and a couples others for fun) in new columns. Then I calculated the difference between the fits and the originals in yet more columns. Then I just used the Excel STDEV function on the difference data.
With that result for the STDEV, you can adjust the parameters to minimize the STDEV, and hence find the best fit
Check out the wave analysis just on short term ENSO…
Using EWT, you could have predicted this bottom in the 3.4 region that started on September 14th by only recognizing a complete 5 wave pattern.
July 23rd – September 14 was a complete impulse wave lower.
https://www.tropicaltidbits.com/analysis/ocean/nino34.png
The 1+2 region also made a complete impulse lower, starting on Aug 28th and ending on September 16th.
https://www.tropicaltidbits.com/analysis/ocean/nino12.png
That type of analysis required no knowledge of deep ocean changes. Only harmonic analysis and data interpretation.
Compare with solar wind waves during this period.
https://www.swpc.noaa.gov/products/van-allen-probes-radiation-belt-plots
ren,
That is absolutely amazing… so the solar wind is directing the El Nino 1+2 region in a direct relationship. The slower the solar wind speed, the MORE upwelling. I do not see the same 3-5 harmonic in the solar wind however. Perhaps the harmonic is created by the earth’s response to the sun’s peak input “event” somehow.
On the other hand, since the 3.4 region has an inverse relationship to 1+2, more solar activity SHOULD create more overturning and cool this area. Since the 3.4 area has a larger impact on global air temperature, this is why the strongest La Nina comes right after the solar min when the solar activity picks up. Nino 1+2 is loading the system with cold water during the minimum, and it is released as we come out of it when the solar wind causes overturning in the 3.4 region.
Interestingly, both regions have been cooling for 4 months now as the ENSO 3.6 yr harmonic ended off the 15-16 high. Of course the 3.6 harmonic is that of the 11 year solar cycle on a delay.
Actually I’ll hold judgment on if the harmonic is coming from the solar wind. Perhaps the 3rd wave is what they call “extended”, meaning, it breaks down into a wave form within the wave. I’ll need to spend some more time watching the solar wind now for sure to see if this relationship continues.
Scott R, strong solar wind increases jetstream speed. It becomes latitudinal. The reaction at the equator is the wind along the equator in the opposite direction.
Cold water below the surface just waits for the wind along the equator.
http://www.bom.gov.au/archive/oceanography/ocean_anals/IDYOC007/IDYOC007.201909.gif
ren, I definitely think we are on the same page with this.
It seems the wind speed should naturally increase as the earth’s orbit takes it closer to the sun this January (per usual). With cold water already building, it may be enough to release the La Nina. If not, it may continue to get bottled up until next year’s annual event lines up with increased solar activity as we come out of SC 24. The longer the under surface 1+2 region gets to build in this solar minimum, the more intense it will be when the cold water is finally released to more of the surface.
Scott R, total agreement.
Another wave of solar wind is expected on 28 September.
https://www.swpc.noaa.gov/products/27-day-outlook-107-cm-radio-flux-and-geomagnetic-indices
If temperature spiked then CO2 spiked. CO2 follows temperture.
CO2 and temperature are in a mutual feedback loop — if one increases, the other does too.
If that was the case we wouldn’t be here now.
Perth is the Australian city which has warmed the most, since 1880.
Perth has warmed by 1.65 degrees Celsius, since 1880.
That is nearly twice the amount that Darwin has warmed, since 1880.
In Australia, if any city had a good case for declaring a climate emergency, then surely it would have to be Perth.
But wait. We have been talking about temperature anomalies, not real absolute temperatures.
Are you brave enough to look at the real absolute temperatures that Perth has been enduring (timid people should not read this article – you have been warned).
https://agree-to-disagree.com/global-warming-in-australian-cities
Sheldon Walker,
I’d just like to point out something. By looking at a longer data set as proxy, we can see where 1880 fell in the context of a longer cycle. For central England, the temperature fell from 10.6 deg c in 1869 to 7.3 deg c in 1879. 1879 was pretty much the coldest year since 1741. Of course, ALL linear trends will look positive, if you start them in 1880. There is no linear trend in Australia. Just cycles on multiple timeframes.
Take a look at what the sun was doing in 1880:
http://lasp.colorado.edu/home/sorce/files/2011/09/TIM_TSI_Reconstruction-1.png
Scott.
When looking at the warming data for Australian cities, and the other analyses that I have done, I have the problem of when to make the “zero” point, from where warming will be calculated.
GISTEMP uses the average from 1951 to 1980 as the “zero” point. This means that GISTEMP temperature anomalies reflect warming from around 1965. This fits in with the idea of “modern” CO2 based warming.
However, GISTEMP temperature anomalies don’t reflect what happened before about 1965, unless you do some calculations.
I have experimented with different “zero” points, to see if there is a “natural” date to use as the base, to calculate warming from. I have found that there is no “natural” base date. Everything is always changing in different ways. Possibly in a chaotic way.
Why should pre-industrial times be the “correct” temperature for the Earth. Pre-industrial times is known by another name, the “Little Ice Age”. Do we really want to base our civilization on a time in Earth’s history, that was unpleasant for many humans?
There has been some general warming on the Earth, since about 1970 (possibly since 1950 for Australia and the Southern Hemisphere). The warming will cause some problems. But it will also bring some benefits. It is unlikely to cause a catastrophe, unless humans do something stupid, like shifting too quickly to 100% renewable energy, and eliminating fossil fuels completely.
Sheldon you will never find a linear fit to the global temperature data that has any legs / staying power. You have cycle on cycle on cycle of natural forcers that will never allow it. Take a look a HADSST3, Historical TSI back to the 1600s, and the central England data set. Compare to co2 levels in the same time. It becomes very obvious the sun drives the climate in cycles. Co2 is a trace gas, nothing more than plant food. Humans have a much larger impact with our heat islands.
Day
Season
2.2 yr El Nio
3.6 yr El Nio
11 yr El Nio / solar cycle
AMO (5th gsm harmonic)
PDO (3rd gsm harmonic)
Multi decadal solar minimums
365 yr grand solar min
1825 yr super gsm
Orbital cycles outside the scope of a human life
How is it you can’t understand that, while CO2 wasn’t much of a player back then (though it does seem to have been brought high enough to prevent the next ice age), it’s a real problem today because it has increased and is rapidly increasing?
David, please stop trolling.
Sheldon Walker
Thank you for your interesting info concerning ‘Global Warming in Australian Cities’.
I understand your point concerning the relevance of absolute data wrt anomalies.
With the exceptions of the yearly ones, anomalies are not simply departures from a mean over an entire reference period.
As Roy Spencer explained here many times, they rather are departures from the same unit in the reference period they are generated out.
The goal is here to remove seasonal or day/night dependencies within absolute data, by the way letting all months, days or hours equally concur when processing measurements (not only of temperature; maybe of e.g. sea ice, snow cover. precipitation or sea level).
So instead of having all boreal or austral summer months at the top of a descending sort of e.g. the monthly averaging of all Australian weather stations present in the GHCN daily data set:
1900 2: 26.68
1896 1: 26.54
1906 1: 26.48
1932 1: 26.32
1902 1: 26.14
1900 12: 25.97
1915 2: 25.96
1882 1: 25.84
1912 2: 25.78
1939 1: 25.74
1901 2: 25.73
1901 12: 25.73
1899 12: 25.72
1947 1: 25.69
1923 2: 25.67
1898 1: 25.66
1905 1: 25.65
1926 2: 25.60
1900 1: 25.58
1896 12: 25.56
1906 2: 25.54
1944 1: 25.53
1903 1: 25.51
1903 2: 25.47
1942 1: 25.46
you have now a descending sort of the highest departures within the same months (here wrt the mean of 1981-2010):
2015 10: 1.62
2018 12: 1.50
2009 11: 1.47
2005 4: 1.44
2013 9: 1.44
2007 5: 1.41
2016 4: 1.41
1883 12: 1.40
2018 4: 1.39
2009 8: 1.38
2016 3: 1.35
1983 2: 1.34
2016 5: 1.33
1915 2: 1.30
1991 6: 1.30
1957 6: 1.29
2017 3: 1.28
1888 11: 1.27
1915 7: 1.23
1914 11: 1.22
2015 11: 1.22
1962 6: 1.20
1988 10: 1.20
1996 6: 1.16
1921 6: 1.12
And that is the major reason to use anomalies. When looking at absolute data, you only see at top the months being warmest anyway; anomalies rather show which months in which years were warmer than the average for the same month over the reference period aka baseline.
No surprise: while the absolute data does not contain one year since 2000 (1947 ist the most recent one), 50 % of the top 25 anomalies were registered since 2000.
This is due to the fact that winter month temperatures increase faster than summer month temperatures. The Globe isn’t so much warming: it’s cooling less.
Ooops!
Wrong data selected for the comparison absolute vs. anomalies.
The correct sort is (starting with Jan 1950 like the anomalies):
1952 1: 25.37
1983 2: 25.19
2001 1: 25.08
1956 2: 25.01
1981 1: 24.97
2018 1: 24.96
1979 1: 24.93
2013 1: 24.92
1955 2: 24.89
1955 1: 24.85
1950 1: 24.81
2006 1: 24.81
1997 2: 24.79
1954 1: 24.77
1999 1: 24.75
2007 2: 24.75
2017 1: 24.74
1973 1: 24.67
2014 1: 24.66
1988 1: 24.55
1956 1: 24.52
2010 1: 24.52
1951 1: 24.50
1951 2: 24.49
2015 2: 24.48
We see now absolute values out of years after 2000, that was evident. Apos.
Bindidon
What you say about monthly anomalies is correct.
I think that the best way to process monthly data, is to look at each month of the year (Jan, Feb, Mar, …) separately. It is more work, but it lets you use real absolute temperatures, without the results being overwhelmed by seasonal differences.
I was looking at the GISTEMP Canadian temperature data about a month ago, and noticed some strange effects. Different months of their winter were doing different things. I can’t remember which ones were doing what, but something like December warming, but January cooling. I didn’t continue looking at this, because I was writing an article on a slightly different topic.
I might have another look at the Canadian data, and also check the Australian data, to see if this is happening. Annual anomalies would not show if this was happening (it would get averaged out). Using monthly anomalies would probably just make the data look noisier.
I wrote an article called “Most of Canada is currently cooling”, which shows that most of Canada has stopped warming, for the last 5 to 10 years. I will have a look at the different months, and try to work out what is happening.
OMG! Did y’all miss the “This has nothing to do with climate or climate change, but…” intro?
No, but We found the correlation regardless
One week to the next data point , maybe watch the space weather lesson
https://youtu.be/rEWoPzaDmOA
https://www.youtube.com/watch?v=bW3IQ-ke43w
Eman and Appell’s love child.
More Thunberg:
https://www.youtube.com/watch?v=1MAk8fRI53o
Isn’t it amazing how the left prop up their children advocates but disparage any child who advocates for conservative values?
Examples?
And these mean what? Links please.
Here you go again: who, what, how, why? Don’t you have access to the internet? Greta Thunberg, David Hogg, Nicholas Sandmann. Just stick those names in your search engine and press enter.
Thunberg, Hoag examples on the left-Nicholas Sandmann example on the right.
In the period of low solar activity, the winter pattern of jetstream over North America remains the same.
https://wordpress.accuweather.com/wp-content/uploads/2019/09/USLateSept.jpeg?w=632
Hurricane Lorenzo moves towards the Caribbean at a speed of 24 km / h.
HURRICANE CATEGORY 3 LORENZO
LORENZO’S CURRENT STATS
Last Updated 9/26/2019, 1:00:00 PM GMT+2
Status
Hurricane Category 3
Position
15.2 N, -39.3 W
Winds
204 km/h
Gusts
250 km/h
Movement
WNW 28 km/h
Pressure
955.00 mbar
Tomorrow the solar wind will violently hit the Earth magnetosphere. There will be a strong push of the jetstream in the north.
https://www.swpc.noaa.gov/products/3-day-forecast
The west USA looks to get a major winter storm from this. Models have been very consistent. No reason to disbelieve.
https://www.tropicaltidbits.com/analysis/models/?model=gfs®ion=us&pkg=asnow&runtime=2019092612&fh=132
We do not know if this will end the heat ridge the east, exactly where the baroclinic zone will be separating the cold and hot air (and the heavy rain). It has been a stubborn one. A lot of people in Michigan are asking when cider mill weather will arrive. My answer? Soon. lol
An ozone wave shows the extent of stratospheric intrusion over North America on September 28.
https://www.cpc.ncep.noaa.gov/products/stratosphere/strat_int/gif_files/gfs_o3mr_250_NA_f072.png
In satellite imagery, Stratospheric Intrusions are identified by very low moisture levels in the water vapor channels (6.2, 6.5, and 6.9 micron). Along with the dry air, Stratospheric Intrusions bring high amounts of ozone into the tropospheric column and possibly near the surface. This may be harmful to some people with breathing impairments. Stratospheric Intrusions are more common in the winter/spring months and are more frequent during La Nina periods.
https://www.cpc.ncep.noaa.gov/products/stratosphere/strat_int/
Impact of the solar wind may cause a push of cold air from the north to the south.
“As the storm evolves, temperatures may plummet 50 degrees Fahrenheit (25 degrees Celsius) or more in some locations.
Those in the high country and intermediate elevations will be at risk for becoming stranded and could be in a life-threatening situation for a few days during and after the storm with below-freezing temperatures predicted.”
The range of ozone shows where the temperature is lowest, especially at night.
https://www.cpc.ncep.noaa.gov/products/stratosphere/strat_int/gif_files/gfs_o3mr_250_NA_f120.png
This blah blah about a GSM coming soon is boring.
What would interest me far more would be Roy Spencer’s opinion, and possible prediction concerning a thrid consecutive edition of the polar vortex experienced by Northeast CONUS and Southeast Canada during the winters 2018 and 2019.
There were this year some isolated, very cold spots at the end of January and beginning of February, (for example, -30 C in Chicago, -40 C at Mt Carroll (IL) or near -50 C in Cot-ton (MN).
Is there sone regular pattern on the road there?
Bindidon that’s harsh. So the impending struggles of humanity are boring to you only if we freeze to death, but if we are talking about burning up you could talk all day. Got it. Do you realize 20x’s more people die from cold than heat every year? Have you considered running the actual RPN numbers on cold / heat? (severity*occurrence*detection) If you are right… the heat is occurring mostly at night and in the arctic when it comes, and seems to be making it rain more. Crops are doing well. If I’m right about the cold and GSM, we will have crop failures everywhere and world wide food shortages, and flooding.
So where is your list of Greenland glacier outflows totaling more than 600 gt? I’m still waiting.
Scott R
1. As I said so many times: warmistas aren’t very good people, but coolistas are even far worse.
https://ourworldindata.org/grapher/share-of-deaths-by-cause
0.1 % ! And you think I’ll discuss about the heat/cold ratio in it ? Pfff.
2. I have shown you many times the GRACE graph.
You will continue ad nauseam to intentionally misinterpret it… but I don’t bother. Why should I loose my time with you and your egocentric GSM-mania? Any idea?
Talk with ren, Scott R. S/he is the ideal partner for all your nonsense.
Bindidon… so you are not worried about warming or cooling? Why are you here so much? Out of boredom? lol
How do YOU explain in your own words, the increase in the average temperature in central England from 6.9 deg c in 1695 to 10.6 deg c in 1737.
As for the GRACE data, I’m giving you the opportunity to provide the proof to me that the GRACE data is accurate. You are choosing not to… actually you are not choosing not to, the data backing up GRACE does not exist. I’ve looked for it and haven’t come up with anything. We know 600 gt of snow fall on Greenland every winter, which lasts for 9 months. Show me the outflow numbers proving more than that is disappearing.
ren seems to know what’s up.
I find Had.CET’s 1695 temperature to be 7.3 C, not 6.9 C.
And 1737’s to be 9.9 C, not 10.6 C.
That’s a difference of 2.6 C, not 3.7 C.
Then there’s this:
“The earliest years of the series, from 1659 to October 1722 inclusive, for the most part only have monthly means given to the nearest degree or half a degree, though there is a small ‘window’ of 0.1 degree precision from 1699 to 1706 inclusive. This reflects the number, accuracy, reliability and geographical spread of the temperature records that were available for the years in question.”
Wikipedia: Central_England_temperature
Scott R says:
As for the GRACE data, Im giving you the opportunity to provide the proof to me that the GRACE data is accurate.
Why are you asking here and not digging into the scientific literature to find these technical data??
I don’t think you really want to know….
David Appell,
You are using calander year. I’m using 12 month running mean. My dataset is more accurate to get the true amplitude of the change that is possible.
Now you want to complain about round off errors? Do you realize how much bigger a 3.7 deg c change over 42 years is compared to the 1980-2016 warming period?
Here is some information proving cold is more deadly even in America with our high standard of living:
https://www.acsh.org/news/2019/07/10/more-people-die-winter-summer-14146
America’s population is 4.3% of the world’s.
What about the 3B people who live in the tropics? Do you think they want a warmer world?
America can easily take care of its poor w.r.t. cold (if it chooses to). What about the poor countries in the tropics?
Hardly proof, as cold and heat are not the leading causes of death in that study.
This study shows that the same group of people are MORE likely to die in the cold part of the year than the warm regardless of the cause.
Direct climate related deaths should continue to drop as technology is improved, plus the media gives people lots of warning.
Bottom line, humans are better adapted to tropical climates than temperate climates, cold climate changes would be more deadly than warming.
Scott R – if you want warmer temperatures, why haven’t you moved south?
David, please stop trolling.
Sheldon Walker
Canada is wrt weather / climate a very disparate, inhomogeneous country.
Thus to look at winter patterns over the whole might be hopeless: British Columbia and Alberta / Saskatchewan / Manitoba for example have few in common with Northwest Territories, let alone with Nunavut.
Nevertheless, what now concerns your cooling of Canada during the winters, please have a look at this (absolute averages):
https://drive.google.com/file/d/1pBEuKsODJOUgwFOttUT4xJdZujQZs5GM/view
Hmmmh.
The beginning of a two-day geomagnetic storm.
https://www.spaceweatherlive.com/images/grafieken/aurora-map.jpg
Now it is worth to observe the Bering Sea.
http://tropic.ssec.wisc.edu/real-time/mtpw2/product.php?color_type=tpw_nrl_colors&prod=alaska×pan=24hrs&anim=html5
Test.
A snowstorm develops in Montana.
weather, not climate.
Please try to keep to the subject here. Respect others.
David, please stop trolling.
“The snow that began to ramp up in the higher elevations of the Northwest on Saturday morning will only worsen and spread to lower elevations into Saturday night,” AccuWeather Meteorologist Renee Duff said.
A huge snowstorm in Canada.
https://www.accuweather.com/en/ca/saskatchewan/weather-radar
Weather, not climate.
ren, please try to stick to the subject here.
Or start your own blog.
David, please stop trolling.
Hallo
Although i did not read all the comments, i want to throw in another argument. I have studied fine arts and I know that it is a very old secret of the art of painting to change the nature of a colour by changing his environment. The reason is that the brain puts on the same levell of cognition similar things: in this case, what we call the local colour of an object wich is defined by the brightest light of each cube. So, the same levell of grey is read as the shadow of white and (that is as a white substance), in the same moment, as the light of a darker colour (that is as a dark substance) .
Appreciating the commitment you put into your website and in depth information you present.
It’s good to come across a blog every once in a while that isn’t the same out
of date rehashed information. Great read! I’ve saved
your site and I’m adding your RSS feeds to my
Google account.
Really good blog,thank you very much for your time in writing the posts.
จัดหนักจัดเต็ม รับเงินรางวัลมากมายได้แล้วที่เว็บไซต์ SLOT PG เว็บไซต์ที่ได้รับความนิยมมากที่สุดในเวลานี้ เล่นแล้วพบกับเงินรางวัลและของขวัญพิเศษมากมายแจกให้ทุกช่วงเวลาภายในเกม ถอนเงินได้แบบไม่อั้น พบกับเงินรางวัลสูงสุดได้มากถึง 100000 เท่าของเงินเดิมพันทั้งหมด อีกทั้งยังถอนเงินได้โดยไม่ต้องรอทำเทิร์นหรือติดเงื่อนไขใดๆ ในการถอนเงิน
รับเงินกันแบบรัวๆ มีความสุขทางการเงินกันแบบง่ายๆ ที่เว็บไซต์ SLOTPG เว็บไซต์ระดับพรีเมียมที่มาพร้อมกับเกมออนไลน์ทุกรูปแบบเปิดให้บริการ ให้นักเดิมพันได้เลือกเล่นกันแบบจุใจไม่มีเบื่อ อีกทั้งยังมีการเปิดให้นักเดิมพันทุกคนสามารถทดลองเกมกันได้แบบฟรีๆ โดยไม่คิดค่าบริการหรือค่าธรรมเนียมใดๆ นักเดิมพันสามารถเข้ามาฝึกฝนฝีมือการเล่นเกม ก่อนเข้ามาร่วมสนุกเล่นเกมจริง
This article is so great! I gained more knowledge after reading this informative article. I really enjoyed reading this article. Good work!
https://electrician-windsor.com.au/
ทุกท่านสามารถกลายเป็นเศรษฐีหน้าใหม่ไม่ยาก ถ้าเลือกเล่นที่เว็บเกมสล็อตออนไลน์ MEGA GAME เว็บไซต์เกมสล็อตของเรามีโปรโมชั่นให้ผู้เล่นเลือกรับตลอดเวลา เรามีเกมสล็อตมากกว่า 100 เกม ทั้งเกมสล็อตยอดฮิตติดชาร์ตและเกมสล็อตน้องใหม่เพิ่งคลอด คลิกเลย เพื่อลงเดิมพันไปกับเรา ผู้เล่นสามารถลงเดิมพันตามต้องการ ไม่ว่าจะลงเดิมพันมากหรือลงเดิมน้อย เรามีขั้นต่ำในการวางเดิมพันเริ่มต้นที่บาทเดียวเท่านั้น
สมัครสมาชิกใหม่ ฝาก ถอน ตลอด 24 ชั่วโมง janaeraquel.com มีทีมงานมืออาชีพค่อยให้บริการ และเป็นที่ปรึกษาแก่ลูกค้าทุกท่าน ไม่ว่าจะปัญหาการเข้าเล่น การฝาก-ถอนเงิน หรือวิธีการเล่นต่างๆ เว็บเราก็มีข้อมูลอธิบายให้อย่างครบถ้วน พร้อมโปรโมชั่นจัดเต็มทั้งลูกค้าเก่าและใหม่
เกมสล็อต Steampunk เป็นเกม สล็อตใหม่ ล่าสุด ชองค่ายเกม ยักษ์ใหญ่ อย่างค่ายเกมสล็อต PGSLOT ที่มาในรูปแบบ ของแนวที่ออกไป ทางแนว ของจักรวาลตามวงจร แห่งการสร้างสรรค์ ทั้งในตอนกลางวัน และ ตอนกลางคืน ที่มีทั้งแสงสว่าง และความมืด ที่จะทำให้สองส่วนที่รวมกันทำให้ วงจรชีวิตในจักรวาล ที่จะสมบูรณ์แบบ ภายในเวลา และ สถานที่ ที่มี มิติอีกมิติ หนึ่ง ที่ถูกเรียกกันมาว่า มิติที่สี่ ที่ตั้งอยู่ มันมีอยู่ ระหว่างช่องว่าง และ รอยแตกของพื้นที่ ที่หายไปทันทีที่ปรากฏ ถ้าหากมีผู้ที่มีความสามารถในการจัดการ มิติที่ว่านี้ จะสามารถเปลี่ยนแปลงของ หลักการ ของสสารเปลี่ยนแปลงโชคชะตา และ ความมั่งคั่ง
JOKER GAMING SLOT ปรับเบทขึ้นลงตามต้องการ เดิมพันได้ตั้งแต่หลักหน่วยไปจนถึงหลักพัน ยิ่งเดิมพันสูง ก็ยิ่งได้รับรางวัลมากขึ้น
สำหรับค่ายเกมนี้ก็เป็นค่ายเกมน้องใหม่ที่มาแรงอย่างนี้ nomakeup.me เรียกได้ว่าเป็นค่ายเกมน้องใหม่แซงทุกเว็บไซต์เลยทีเดียว เป็นเกมที่ได้มีการรวบรวมเอาเกมการพนันที่มีความหลากหลายมาเปิดให้บริการ ไม่เพียงแต่เป็นเกมสล็อตอย่างเดียวเท่านั้น ยังมาพร้อมกับเกมอื่นๆที่มีความน่าสนใจอีกมากมาย สามารถทำรายการฝากถอนได้แบบไม่มีขั้นต่ำตลอด 24 ชั่วโมง ในการเข้ามาร่วมสนุกกับค่ายเกมแห่งนี้ ผู้เล่นจะได้พบกับเกมส์สล็อตแตกง่ายเกมส์สล็อตแตกบ่อย นอกจากนี้แล้วยังมีการซื้อฟรีสปินได้อีกด้วย เป็นเว็บไซต์แล้วเป็นไข้เกมที่เหมาะสำหรับผู้เล่นมือใหม่เนื่องจากมาพร้อมกับระบบทดลองเล่น พี่สามารถเข้ามาทดลองร่วมสนุกได้ฟรีไม่เสียเงินแม้แต่บาทเดียว
ทรูมันนี่ วอลเล็ทเป็นแอปพลิเคชัน PG SLOT pg wallet ที่ให้บริการที่หลากหลาย ครอบคลุมทุกการใช้แรงงาน สามารถใช้จ่ายแทนเงินสดได้ตามร้านค้าชั้นแนวหน้าทั่วๆไป และสนุกสนานกับเกมสล็อตออนไลน์ PG SLOT
กงล้อ-888
กงล้อ 888 เว็บเกมคาสิโนออนไลน์ kong lor 888 ที่น่าจับตามอง เพราะมีความมั่นคง ปลอดภัย100% ไม่ว่าท่านจะเป็นมือใหม่แค่ไหน ก็สามารถเล่นได้แบบไม่มีเบื่อ ท่านสามารถเล่นผ่านเว็บไซต์ในโทรศัพท์เคลื่อนที่ได้ตลอด 24 ชั่วโมง
สมัครสมาชิกกับ 7XBET ฟรี พร้อมรับเครดิตฟรี 300ไปใช้แบบฟรีกันไปเลย ฝากถอนไม่มีขั้นต่ำ เพื่อให้ทุกท่านเอาไว้ต่อทุน
7XBET 7XBET 7XBET
789win
winwin
uwin789
สมัครสมาชิกกับ 7XBET วันนี้เรามีทุนมาแจก ให้กับทุกท่าน เพียงแค่ สมัครสมาชิก แจก แจก แจก 200 บาท
789win
winwin
uwin789
เพิ่มโอกาสการได้รับเงินรางวัลสูงสุดมากถึง x15000 เท่า โอกาสดีๆแบบนี้ไม่ได้มีบ่อยๆ จากทางค่ายทำเงินอย่าง joker gaming ที่นำมาเปิดให้ทำเงินผ่านทางเว็ปสล็อต http://www.jokerslot.ninja/ เปิดให้บริการแบบออนไลน์ตลอดทั้ง 24 ชั่วโมง.
บาคาร่าออนไลน์ เป็นเกมที่นิยมอย่างมากในตอนนี้ สมัครเล่น SA GAMING กับเราได้แล้ววันนี้ที่ sagameherelao.com คุณสามารถ เข้ามาดู โปรโมชั่นของเราได้ที่หน้าเว็บไซต์เลย บาคาร่าออนไลน์ ยอดนิยมที่ครองใจผู้เล่นทุกเพศทุกวัย เนื่องจากเงินเดิมพันที่ได้ค่อนข้างเยอะมาก และตัวเกมยังเล่นง่าย มือใหม่ก็สามารถเล่นได้ รวมทั้งมีความอิสระในการเลือกเล่น ไม่ว่าจะเป็นการเลือกห้องในการเล่น หรือเลือกรูปแบบในการเดิมพัน สมัครสมาชิกฟรี ฝากถอนไม่มีขั้นต่ำ สามารถวางเดิมพันได้ขั้นต่ำแค่ 1 บาทเท่านั้น !
สล็อตทั้งหมด
สล็อตทั้งหมด
สล็อตทั้งหมด
สล็อตทั้งหมด
สมัครสมาชิกกับ 7XBET ฟรี พร้อมรับเครดิตฟรี 300 ไปใช้แบบฟรีกันไปเลย ฝากถอนไม่มีขั้นต่ำ เพื่อให้ทุกท่านเอาไว้ต่อทุน
#เครดิตฟรี50 #เครดิตฟรี100
#เครดิตฟรีpg #เครดิตฟรีjoker
#10รับ100 #20รับ100 #50รับ100
It has arrived today. The new camp has come to give credit to friends to spin the game in the PG SLOT camp for free without having to pay anything at all, just join the activities on our website if you Good luck, you will get credit. Credit giveaway event is limited, hurry up. คลิกที่นี้ good luck to play game slot.
JOKER GAMING SLOT ก็สามารถรับโบนัส 100 เครดิต โดยฝากเพียงแค่ 29 บาท พร้อมบริการ แก้ไขปัญหา ตอบคำถามที่คุณต้องการทุกวัน
ผู้เล่นทุก ๆ ท่าน ที่เข้ามาเล่น เกมสล็อตออนไลน์ เว็บ BETFLIX เครดิตฟรี 100 และเข้าใช้บริการ Pragmatic Play ส่วนใหญ่ มักเล่นเกมเพื่อ หาผลกำไรเพียงอย่างเดียว และ เล่นเพื่อคลายเครียด หรือ หารายได้ เสริมเล็ก ๆ น้อย ๆ ด้วยความที่ เกมทดลองเล่น SLOT PP สล็อตมีผู้เข้าเล่นจำนวนมาก BETFLIX เครดิตฟรี 100
ในช่วงที่เป็นยุคโควิดแบบนี้ เศรษฐกิจไม่ค่อยดี สล็อตเว็บตรงขั้นต่ำ 1 บาท ที่ BETFLIX จะเป็นช่องทางที่เปิดโอกาส ให้ผู้เล่นที่กำลัง ตกงานPG SLOT รายจ่ายมีมากกว่ารายได้ ได้เข้ามาหารายได้เสริม BETFLIX เพิ่มเติมกัน แม้ว่าจะไม่มีเงินทุนใดๆ PG SLOT
PG slots can play all systems without interruption no download required Access the website directly, not through the application.
PG Slot Sites Now Open Can play any system without lag, no interruption, because we designed online slots games to support playing on mobile phones, smartphones, tablets and PC computers on all operating systems, including iOS, Android, MacOS. and Windows without downloading and installing applications Every game supports Thai language. Just come to the website PGSLOT145 and register for membership. You will be able to use and play games on our website immediately. Access the website directly, not through the app!pgslot
สล็อตออนไลน์
PG
คาสิโนออนไลน์
แจก สูตรสล็อต ฟรีทุกค่ายใช้ได้จริง 100 % เล่นง่าย ได้เงินไว มีบริการฝาก ถอนเงินออโต้ที่รวดเร็วที่สุด สามารถเล่นได้ตลอด 24 ชั่วโมงบนมือถือและคอมพิวเตอร์
Slots are the most popular online games. The game with the fastest mobile phone support for smartphones. and the most convenient because with the method of applying through the automatic system. เติมเกม
PGSLOT ซื้อฟรีสปิน มีเกมสล็อตให้เลือกมากมาย เล่นได้ไม่มีเบื่อ ทางเราเปิดให้บริการ 24 ชม ซื้อฟรีสปิน pg
เกมสล็อต betflixauto89 อันดับหนึ่ง ในประเทศไทย โปรโมชั่น และ บริการของเรานั้น เรียกได้ว่า เป็นที่ยอมรับ จากผู้ใช้งานมากมาย เครดิตฟรี โบนัส100% 50 รับ 100
Pragmatic Casino
Pragmatic Casino is a new type of casino game camp. Also known as Pragmatic Play, the game camps as mentioned above mainly focus on mobile gaming services on smartphones. which comes with a prize money that is extremely high There are many games to choose from, Baccarat, Roulette, Slots and Bingo, along with many other games in the Live Casino system. can support players all over the world Due to the support of up to 30 languages, you can register with our website today.เซ็กซี่บาคาร่า
ทางเข้าบาคาร่า
สมัครบาคาร่า
Lucabet
บาคาร่าฟรี
betflix เครดิตฟรี 50 ล่าสุด 2022 รับได้ง่ายๆ ในไม่กี่ขั้นตอน หรือผ่านทางกิจกรรมต่างๆ หากผู้เล่นทุกท่านสมัครสมาชิก กับ เว็บสล็อตออนไลน์ของ betflixauto89 เพียงเท่านี้ ผู้เล่นทุกท่านก็สามารถรับ เครดิตฟรี ที่มีจำนวนจำกัดได้ทันที
สำหรับการเล่นเกมส์ สล็อตออนไลน์ การพนัน และ เกมส์การพนัน ที่กำลังได้รับความนิยม betflik เป็นอย่างมาก
ฝากถอน pgslot ปลอดภัยน่าเชื่อถือ ทำเงินได้สบายใจ pgslot เว็บสล็อตน่าลงเดิมพันต้องมองหาเว็บที่น่าเชื่อถือในการเล่น จะได้ไม่ต้องมากังวลในวางเดิมพัน
Thanks for opening this type of article that might be worth reading.
อยู่กับโลกออนไลน์ โดยเฉพาะแบรนด์ ดังอย่างเช่น betflix285 ของเรา Betflix เว็บคาสิโนออนไลน์ และ สล็อตออนไลน์ ที่ดีที่สุด ในเวลานี้ เพราะเรา pgbetflix คือเว็บผู้ให้บริการเกม
วันนี้ เรา betflix888 ทางเข้า เว็บสล็อตออนไลน์ ชื่อดังอันดับหนึ่ง betflixpg มีเกม ให้สมาชิก ทุกท่านได้เลือกเล่นอย่างล้นหลาม โดยเฉพาะเกมสล็อต และ เกมคาสิโนออนไลน์
For anyone who wants to go out to breathe fresh air. Cool and comfortable near Bangkok Stay in a house by the river Can pitch a beautiful tent There is a river to play There are lots of activities to do. including swimming, white water rafting, kayaking, paintball, and ATV driving. There are also houses for rent here. and then the camping ground For those who prepare their own tents, they can spread it out. You can choose the area where you want to spread it. Here, he has a lot of space to set up. Falling at night, there are lights, not scary, new clean toilets In the evening, you can sit and eat grilled pork. As for the morning mist, the air is lively. All of the above mentioned, this is only near Suan Phueng District, Ratchaburi Province.บาคาร่าออนไลน์
ทางเข้าเล่นบาคาร่า
สมัครบาคาร่า
Lucabet
Nowadays, it has been replaced by other words for self-improvement or mind-improvement, such as growth mindset, until empathy is beginning to be seen as something that is lacking at the moment because In many cases, positive thinking seems to be used solely for self-consciousness.บาคาร่าออนไลน์
ทางเข้าเล่นบาคาร่า
สมัครบาคาร่า
Lucabet
สำหรับการเล่นเกมส์ สล็อตเบทฟิก การพนัน และ เกมส์การพนัน ที่กำลังได้รับความนิยม betflik เป็นอย่างมาก
เข้าถึง JOKER GAMING ได้อย่างง่ายดายโดยไม่ต้องดาวน์โหลดแอป ลองใช้ช่องนี้แล้วจะติดใจ การจัดอันดับของ Google รับประกันคุณภาพ แต่ถ้าเล่นผ่านแอพเราก็มี ดาวน์โหลดเกม Joker
หากคุณลองประสบการณ์การเล่นเกมเพียงเล็กน้อย ต้องเป็นเกมที่เล่นแล้วติดและถือว่าเป็นเกมสร้างรายได้ออนไลน์ที่ยอดเยี่ยม ปลดล็อกประสบการณ์พิเศษสำหรับสมาชิกทุกท่าน เลือกเฉพาะเกมคุณภาพเพื่อเล่น แต่ละเกมมี ลองสล็อตเกม JOKER ที่ไม่เหมือนใคร
สมาชิกกับเรา XOSLOTZ สล็อตออนไลน์ เครดิตฟรี เว็บสล็อตออนไลน์ชื่อดังที่รวบรวมเกมคาสิโนออนไลน์ต่าง ๆ ไว้มากมาย เรียนเชิญ ทุกท่าน ที่เว็บไซต์ PG BETFLIX
Play games for free, no money, apply for a new one, get free credit and try it before filling up. สล็อตpg ทดลอง
ผู้เล่นสามารถร่วมลุ้นรับรางวัลกับ betflixauto89 สล็อตเว็บตรง แตกง่าย ได้แล้ววันนี้ปฏิเสธ ไม่ได้เลยว่า PGSLOT เว็บตรง ไม่ผ่านเอเย่นต์ เป็นเกมบนมือถือที่ได้รับยอดนิยม
สล็อตเว็บตรงวอเลท
เกมส์ยอดฮิตที่รวมค่ายดัง ด้วยระบบ ฝากถอนออโต้ เว็บตรง
ไว้ในเว็บเดียวอย่างเว็บเรานั้น เป็นเกมส์ คาสิโน ที่สามารถทำเงินได้จริง สำหรับคนที่มีต้นทุนที่น้อยแต่ต้องการหารายเสริมที่สามารถทำเงินได้ง่ายๆ เราขอแนะนำให้คุณได้ลองมาเล่นเกมส์กับ เว็บตรง เรา ที่จะทำให้คุณนั้นเพิ่มโอกาสทางรวยง่ายๆโดยที่มีต้นทุนการลงทุนที่ต่ำ ฝากถอนออโต้ เว็บคาสิโนออนไลน์
Casinos that can make money continuously and also have games to choose from บาคาร่า All bets can be played in one place. Don’t waste time migrating in making money online
วันนี้ เรา betflix888 ทางเข้า เว็บสล็อตออนไลน์ ชื่อดังอันดับหนึ่ง betflix มีเกม ให้สมาชิก ทุกท่านได้เลือกเล่นอย่างล้นหลาม โดยเฉพาะเกมสล็อต และ เกมคาสิโนออนไลน์
ทางเว็บ PGSLOT ให้คุณได้รับรางวัลได้อย่างจุใจ อย่ามัวรอช้า เรามีทีมงานมืออาชีพคอยให้บริการทุกท่านตลอด 24 ชั่วโมง หากติดปัญหาหรือมีข้อสงสัยใดๆ ท่านไม่ต้องกังวลใจไป ท่านสามารถติดต่อเราได้คุณจะได้รับการแก้ไขปัญหาของคุณ ช่องทางการติดต่อที่ สล็อต มีไว้เพื่อบริการ รับรองว่าเข้ามาแล้วคุณจะเพลิดเพลินไปกับเกมด้วยความสนุกเลยล่ะ
Nowadays, it has been replaced by other words for self-improvement or mind-improvement, such as growth mindset, until empathy is beginning to be seen as something that is lacking at the moment UFA600 because In many cases, positive thinking seems to be used solely for self-consciousness
และที่สำคัญมีอัตราการจ่ายเงินรางวัลสูงมาก ๆ เพราะเงินรางวัลถูกคิดเป็นสกุลของยุโรปslot เลยทำให้มีการแจกเงินรางวัลที่สูง ยิ่งเล่น สล็อตทดลองเล่นฟรีเว็บตรงยุโรป รางวัลแจ็คยิ่งพอตแตกง่าย ทำเงินได้อย่างสนุกสนาน สำหรับใครที่เป็นผู้เล่นสายเกม สล็อตบอกเลยว่าไม่ควรพลาด
THANK YOU FOR INFORMATION. เว็บแทงบอลออนไลน์
สำหรับใครที่กำลังมองหาเว็บพนันออนไลน์ที่สามารถเล่นได้ครบจบในเว็บเดียวและเป็น สล็อต เว็บตรง สล็อต เว็บตรง ใหม่ล่าสุด 2022 เว็บไซต์ เว็บตรง Miami90 นั้นเป็นเว็บไซต์ที่กำลังได้รับความนิยมและชื่นชอบกันเป็นอย่างมากสำหรับนักพนัน บาคาร่าออนไลน์ มืออาชีพทั้งหลาย https://www.miami90.com/ ทั้งความสนุกแถมยังสามารถได้รับเงินรางวัลจากการชนะเกมการแข่งขันต่างๆ ได้อย่างง่ายดายอีกด้วยเพราะเราคือ สล็อต เว็บตรง เว็บตรง บาคาร่าออนไลน์
สำหรับใครที่กำลังมองหาเว็บพนันออนไลน์ที่สามารถเล่นได้ครบจบในเว็บเดียวและเป็น สล็อตเว็บตรงแตกง่าย สล็อตเว็บตรงแตกง่าย ใหม่ล่าสุด 2022 เว็บไซต์ Lavagame Lava90 นั้นเป็นเว็บไซต์ที่กำลังได้รับความนิยมและชื่นชอบกันเป็นอย่างมากสำหรับนักพนันบาคาร่าออนไลน์ มืออาชีพทั้งหลายhttps://www.lava90.com/ ทั้งความสนุกแถมยังสามารถได้รับเงินรางวัลจากการชนะเกมการแข่งขันต่างๆ ได้อย่างง่ายดายอีกด้วยเพราะเราคือ สล็อตเว็บตรงแตกง่าย Lavagame บาคาร่าออนไลน์
สล็อตเว็บ pgbetflix ดีแตกง่าย ทำกำไรให้ผู้เล่นทุกๆ ท่านเลือกเว็บ สล็อต เป็นที่รู้จักกัน
I have witnessed some fantastic items in the following paragraphs. Well worth bookmarking for revisiting. I shock exactly how much work you set to develop such a fantastic insightful Internet site. Your perform is absolutely appreciated through the clock and likewise the world.https://in1.bet/.
สล็อต PGเกมใหม่แห่งปี ฝากถอนเงิน เล่นได้ดั่งใจ ทำกำไรได้ไม่มีสะดุด บริการเล่นได้ในระดับพรีเมี่ยม
Hello everyone! The author of this article has done a great job easy to read.
สล็อตขั้นต่ำ 1 บาทฝากขั้นต่ำ100
สล็อตเว็บตรง ข้อดีของการเล่นเว็บตรง สล็อตเว็บตรง เว็บไหนดี clubred666 มีคำตอบ
โลกปัจจุบันนี้ได้เกิดเว็บพนันออนไลน์มาเยอะมาก นับไม่ถ้วนเลยก็ว่าได้ สำหรับผู้เล่นที่ต้องการเป็นนักพนันมืออาชีพ การทำความเข้าใจในคณิตศาสตร์เป็นเครื่องมือสำคัญที่ขาดไม่ได้ แต่ก็ไม่ใช่ทั้งหมด จากที่นักพนันท่านหนึ่งได้กล่าวไว้ถ้าอยากเป็นนักพนันอาชีพการลงทุนที่ประสบความสำเร็จอย่างมากผลตอบแทนหน้าประทับใจจากการลงทุนเฉลี่ยอยู่ที่ 20% ของทุนที่เรามี การจัดการเงินทุนแบบนี้นั้นทำให้มีโอกาสชนะมาก เพราะมันคือการวางแผนการลงมือเล่น สล็อตเว็บตรง
Hello everyone, Its a very interesting article. easy to read and understand.
สล็อตขั้นต่ำ 1 บาทฝากไว1วิ
Hello everyone, The author of this article has done a great job easy to read.
สล็อตขั้นต่ำ 1 บาทฝากถอนออโต้
Hello everyone, Its a very useful article. The author has done it very well easy to read.
สล็อตขั้นต่ำ 1 บาทฝากไว1วิ
สำหรับใครที่กำลังมองหาเว็บพนันออนไลน์ที่สามารถเล่นได้ครบจบในเว็บเดียวและเป็น สล็อตเว็บตรงไม่ผ่านเอเย่นต์ สล็อตเว็บตรงไม่ผ่านเอเย่นต์ ใหม่ล่าสุด 2022 เว็บไซต์ เว็บสล็อต Noar168 นั้นเป็นเว็บไซต์ที่กำลังได้รับความนิยมและชื่นชอบกันเป็นอย่างมากสำหรับนักพนันสล็อตออนไลน์ มืออาชีพทั้งหลาย https://noar168.co/ ทั้งความสนุกแถมยังสามารถได้รับเงินรางวัลจากการชนะเกมการแข่งขันต่างๆ ได้อย่างง่ายดายอีกด้วยเพราะเราคือ สล็อตเว็บตรงไม่ผ่านเอเย่นต์ , เว็บสล็อต , สล็อตออนไลน์
thank you for this useful informations amd i found something is interesting here mega game please visit my webside
เว็บตรง NIGOAL911
Play online casinos. Smooth flow. Just have a mobile phone. You can play. Minimum deposit 1 baht, only 30 seconds, money comes in. Challenge you to try the number 1 gambling website in Thailand. Guaranteed by gamblers all over Thailand. Must be Nigoal911
บาคาร่า ออนไลน์ เกมบาคาร่าที่ทำกำไรได้มากที่สุด เล่นง่าย ได้ง่าย รวยง่าย หลายๆคนรวยจากเกมบาคาร่าของเว็บเรา
your website is very nice, the article is very enlightening, I wish you continued success.