While the vast majority of our monthly global temperature updates are pretty routine, September 2019 is proving to be a unique exception. The bottom line is that there is nothing wrong with the UAH temperatures we originally reported. But what I discovered about last month is pretty unusual.
It all started when our global lower tropospheric (LT) temperature came in at an unexpectedly high +0.61 deg. C above the 1981-2010 average. I say “unexpected” because, as WeatherBell’s Joe Bastardi has pointed out, the global average surface temperature from NOAA’s CFS model had been running about 0.3 C above normal, and our numbers are usually not that different from that model product.
[By way of review, the three basic layers we compute average temperatures from the satellites are, in increasing altitude, the mid-troposphere (MT), tropopause region (TP), and lower stratosphere (LS). From these three deep layer temperatures, we compute the lower tropospheric (LT) product using a linear combination of the three main channels, LT = 1.548MT – 0.538TP +0.01LS.]
Yesterday, John Christy noticed that the Southern Hemisphere was unusually warm in our lower stratosphere (LS) temperature product, while the Northern Hemisphere was unusually cool. This led me to look at the tropical results for our mid-troposphere (MT) and ‘tropopause’ (TP) products, which in the tropics usually track each other. A scatterplot of them revealed September 2019 to be a clear outlier, that is, the TP temperature anomaly was too cool for the MT temperature anomaly.
So, John put a notice on his monthly global temperature update report, and I added a notice to the top of my monthly blog post, that we suspected maybe one of the two satellites we are currently using (NOAA-19 and Metop-B) had problems.
As it turns out, there were no problems with the data. Just an unusual regional weather event that produced an unusual global response.
Blame it on Antarctica
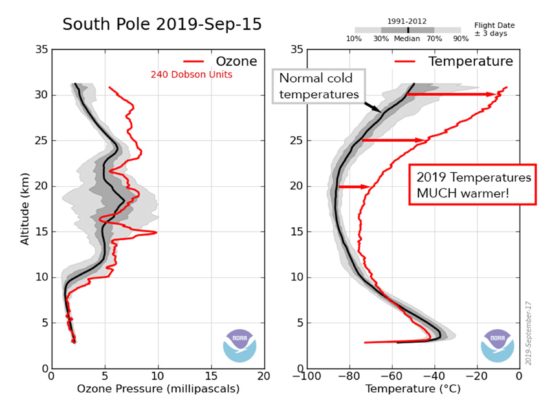
Some of you might have seen news reports several weeks ago that a strong stratospheric warming (SSW) event was expected to form over Antarctica, potentially impacting weather in Australia. These SSW events are more frequent over the Arctic, and occur in winter when (put very simply) winds in the stratosphere flow inward and force air within the cold circumpolar vortex to sink (that’s called subsidence). Since the stratosphere is statically stable (its temperature lapse rate is nearly isothermal), any sinking leads to a strong temperature increase. CIRES in Colorado has provided a nice description of the current SSW event, from which I copied this graphic showing the vertical profile of temperature normally (black like) compared to that for September (red line).

By mass continuity, the air required for this large-scale subsidence must come from lower latitudes, and similarly, all sinking air over Antarctica must be matched by an equal mass of rising air, with temperatures falling. This is part of what is called the global Brewer-Dobson circulation in the stratosphere. (Note that because all of this occurs in a stable environment, it is not ‘convection’, but must be forced by dynamical processes).
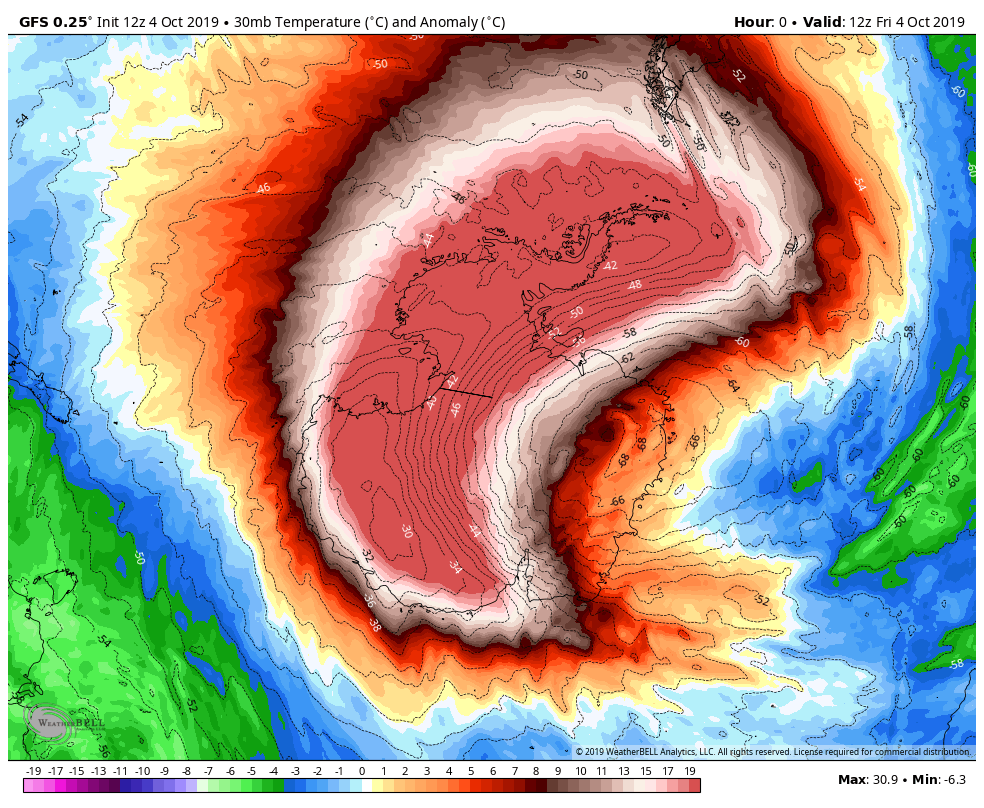
As can be seen in this GFS model temperature field for today at the 30 mb level (about 22 km altitude) the SSW is still in play over Antarctica.

The following plot of both Arctic and Antarctic UAH LS temperature anomalies shows just how strong the September SSW event was, with a +13.7 deg. C anomaly averaged over the area poleward of 60 deg. S latitude. The LS product covers the layer from about 15 to 20 km altitude.

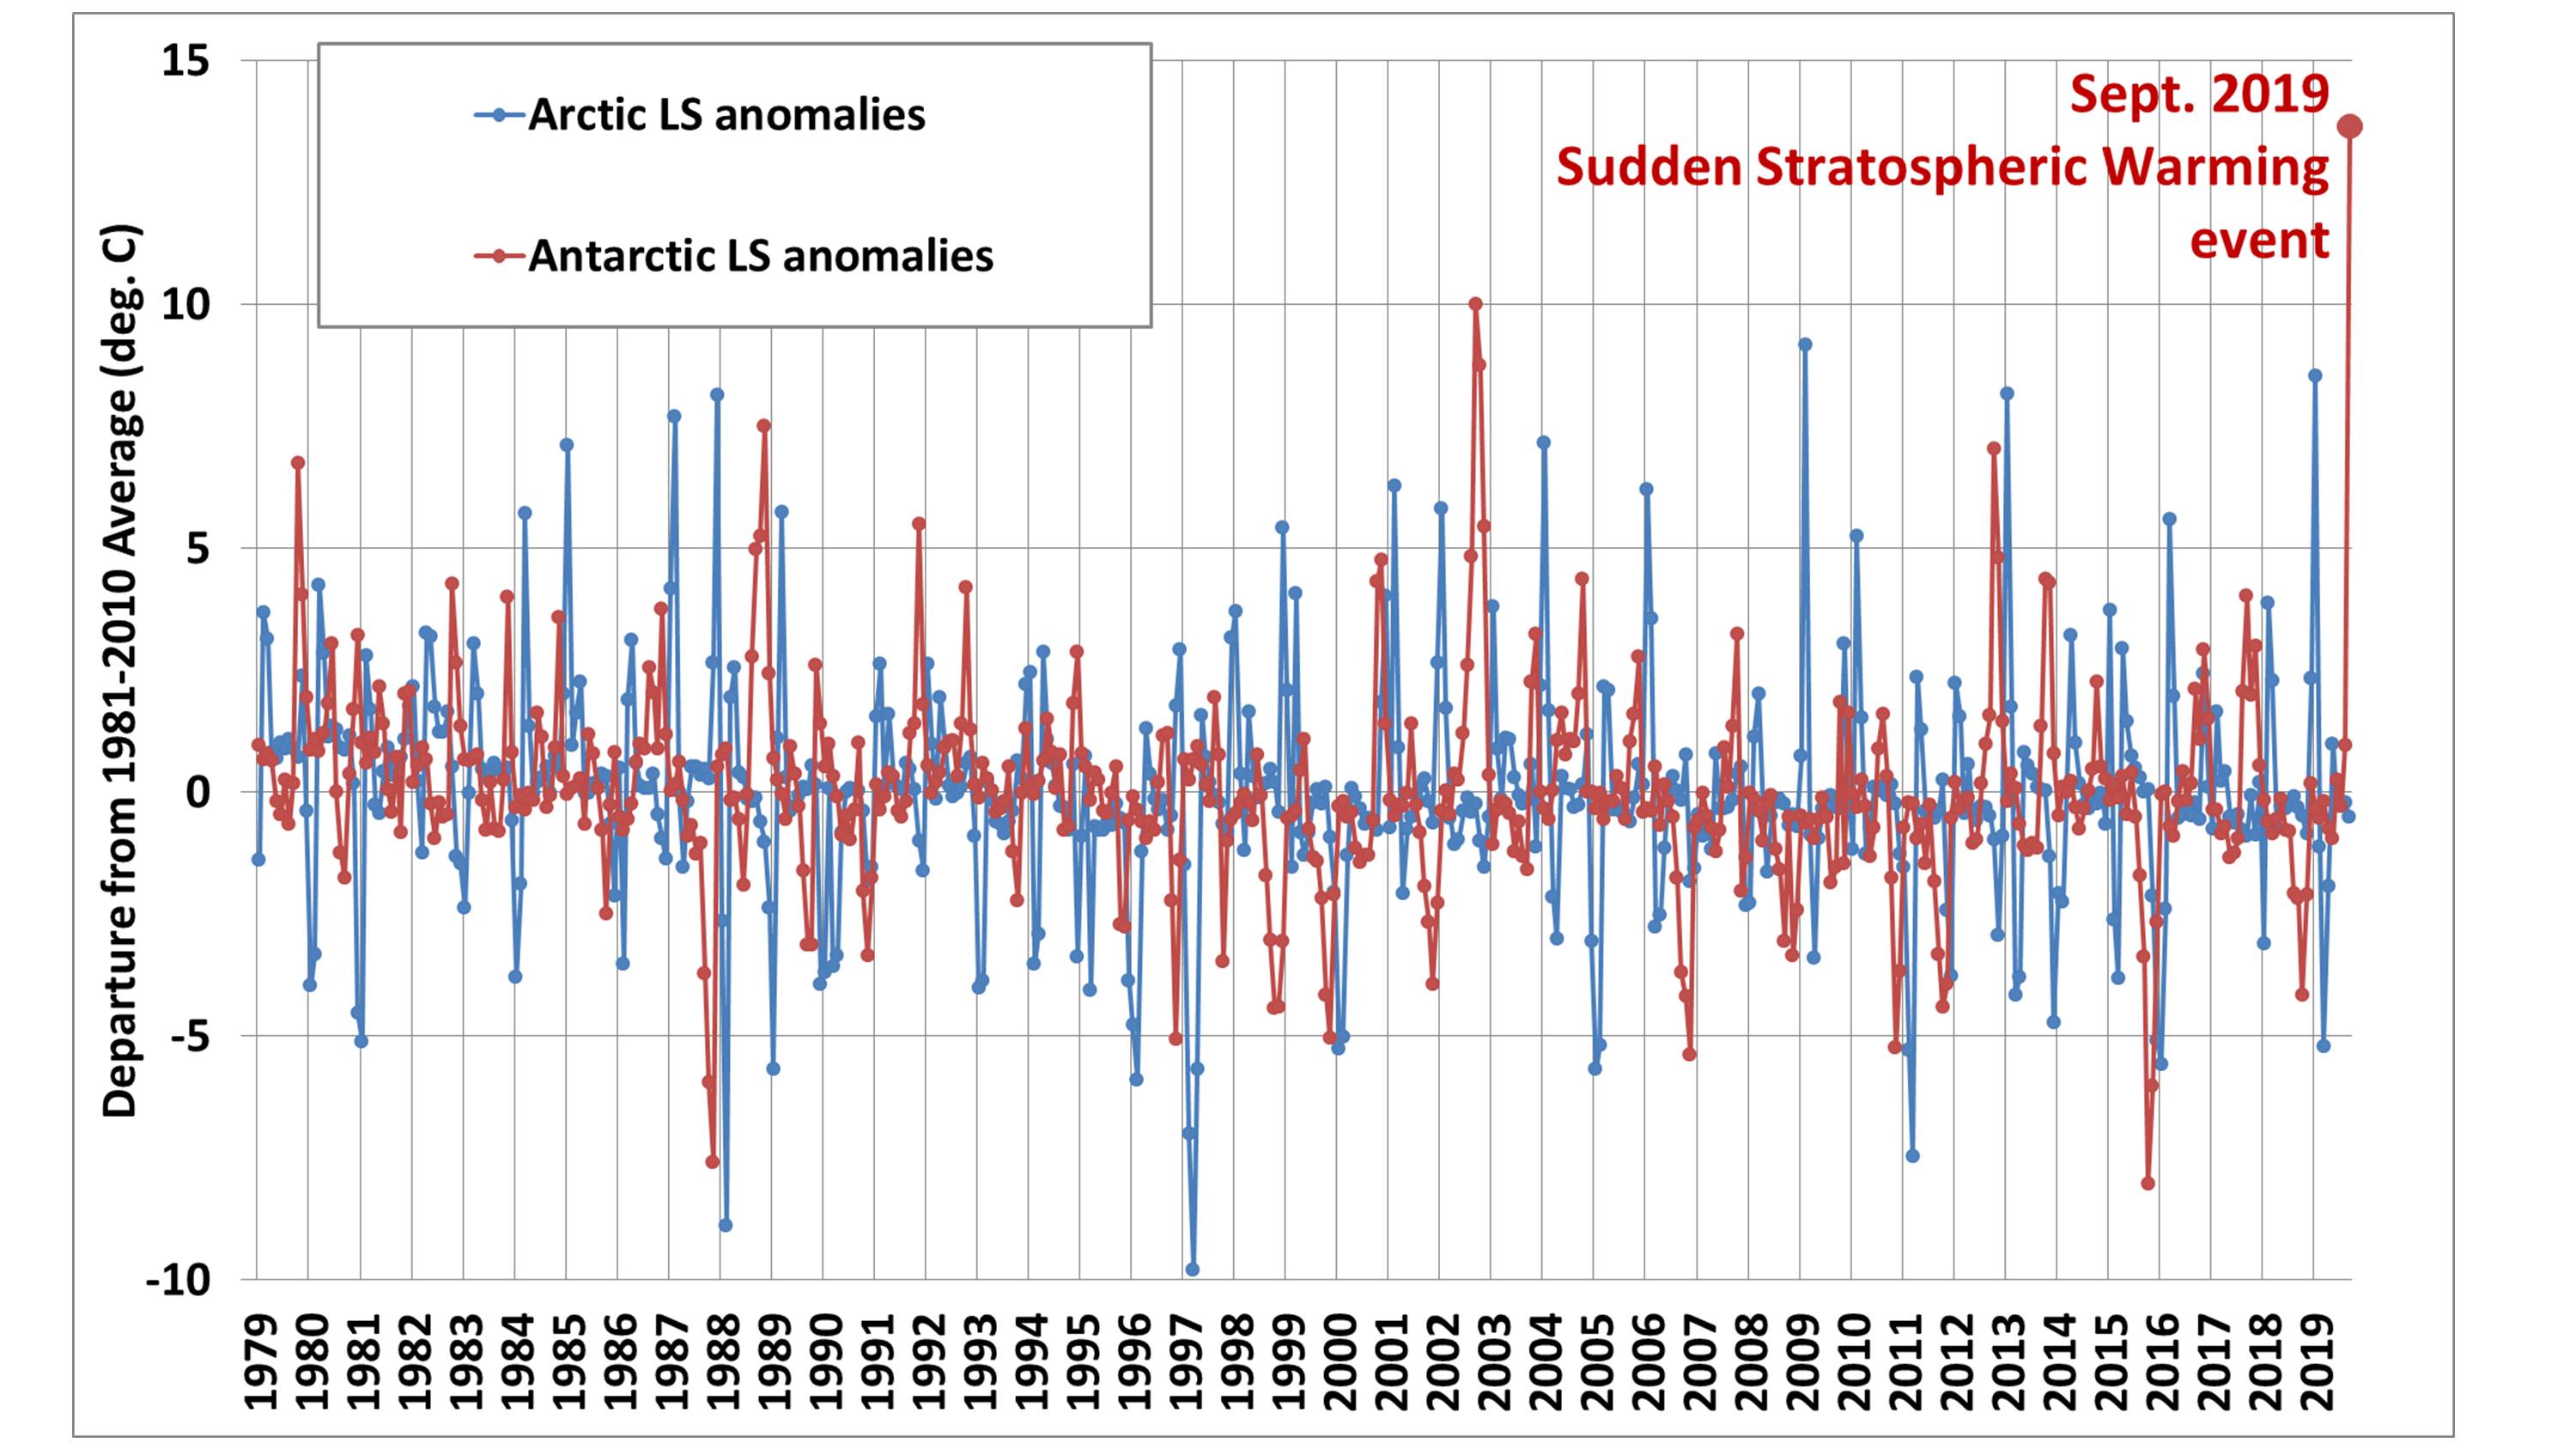
As mentioned above, when one of these warm events happens, there is cooling that occurs from the rising air at the same altitudes, even very far away. Because the Brewer-Dobson circulation connects the tropical stratosphere to the mid-latitudes and the poles, a change in one region is mirrored with opposite changes elsewhere.
As evidence of this, if I compute the month-to-month changes in lower stratospheric temperatures for a few different regions, I find the following correlations between regions (January 1979 through September 2019). These negative correlations are evidence of this see-saw effect in stratospheric temperature between different latitudes (and even hemispheres).
Tropics vs. Extratropics: -0.78
Arctic vs. S. Hemisphere: -0.70
Antarctic vs. N. Hemisphere: -0.50
N. Hemis. vs. S. Hemis.: -0.75
Because of the intense stratospheric warming over Antarctica, it caused an unusually large difference in the NH and SH anomalies, which raised a red flag for John Christy.
Next I can show that the SSW event extended to lower altitudes, influencing the TP channel which we use to compute the LT product. This is important because sinking and warming at the altitudes of the TP product (roughly 8-14 km altitude) can cause cooling at those same altitudes very far away. This appears to be why I noticed the tropics having the lowest-ever TP temperature anomaly for the MT anomaly in September, which raised a red flag for me.
In this plot of the difference between those two channels [TP-MT] over the Antarctic, we again see that September 2019 was a clear outlier.

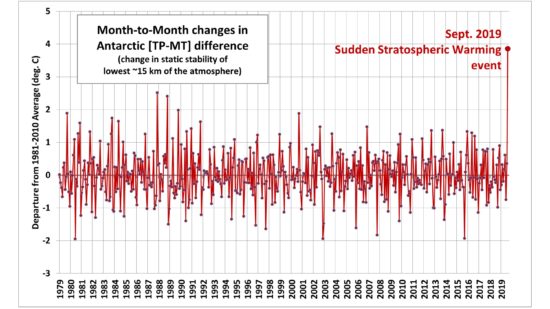
Conceptually, that plot shows that the SSW subsidence warming extends down into altitudes normally considered to be the upper troposphere (consistent with the CIRES plot above). I am assuming that this led to unusual cooling in the tropical upper troposphere, leading to what I thought was anomalous data. It was indeed anomalous, but the reason wasn’t an instrument problem, it was from Mother Nature.
Finally, Danny Braswell ran our software, leaving out either NOAA-19 or Metop-B, to see if there was an unusual difference between the two satellites we combine together. The global LT anomaly using only NOAA-19 was +0.63 deg. C, while that using only Metop-B was +0.60 deg. C, which is pretty close. This essentially rules out an instrument problem for the unusually warm LT value in September, 2019.
The graphics below show that the stratosphere temperature does not depend on the troposphere temperature. A very wide tropopause separates the stratosphere from the troposphere in the tropics.
https://www.cpc.ncep.noaa.gov/products/stratosphere/strat-trop/gif_files/time_pres_TEMP_MEAN_ALL_EQ_2019.png
https://www.cpc.ncep.noaa.gov/products/stratosphere/strat-trop/gif_files/time_pres_TEMP_ANOM_ALL_EQ_2019.png
If you look at September, its rather the temperature in the stratosphere that affects the temperature drop in the tropopause above the equator.
“The graphics below show that the stratosphere temperature does not depend on the troposphere temperature. A very wide tropopause separates the stratosphere from the troposphere in the tropics.”
And yet, in the tropics, all of the lower stratospheric air originates from the troposphere below.
“If you look at September, its rather the temperature in the stratosphere that affects the temperature drop in the tropopause above the equator.”
ren, you really need to learn more about the global circulation, atmospheric radiation.
Plus, maybe read and understand what I wrote.
How much water vapor is in the lower stratosphere above the equator?
http://tropic.ssec.wisc.edu/real-time/mtpw2m/product.php?color_type=tpw_nrl_colors&layer=000-300&prod=global2×pan=24hrs&anim=html5
Below 300 hPa (upper troposphere) it is different.
http://tropic.ssec.wisc.edu/real-time/mtpw2m/product.php?color_type=tpw_nrl_colors&layer=300-500&prod=global2×pan=24hrs&anim=html5
This is old news, on the Norwegian climate blog “Wahl’s Blog,” Geir Frysjøenden stated three days ago;
“Could it be related to large stratospheric warming over Antarctica in September? UAH its so-called TLT
can pick it up (gets the temperature a little higher than the original TLT). Not sure we will see similar in RSS which equally cuts off Antarctica.”
https://blogg.forskning.no/terje-wahls-blogg/refleksjoner-etter-rapporten/1570540
Rune, what “Wahl’s Blog” suggested as an effect did not make LT warmer. If you read and understand my post, you would understand that.
Dr. Spencer, I must admit that I do not understand all the details in Your work, but I think it was a good catch when Geir Frysjøeenden at Wahl’s blogg could identify Antarctic Stratospheric Warming as the reason why UAH had this high value for September.
But it’s NOT why LT was high. It was just a coincidence that LT was unexpectedly high, and we thought something was wrong, and found unusual changes related to the SSW event. But the SSW event did not cause LT to be high.
The temperature anomaly in September 2019 at an altitude of about 20 km above the southern polar circle.
https://files.tinypic.pl/i/00989/4ud0tdyf11q1.png
Dr Spencer,
Have you noticed any connection between SSW and short term trend changes in the UAH? Like they occur at local peaks for some reason?
Scott, no, but now that I better see the dynamical connection, I guess there could be a small impact. I’ve always assumed there wouldn’t be, but now I’m curious about whether (for instance) tropical precipitation increased in September from destabilization of the upper troposphere by the increased flow of stratospheric air from the tropics to the South Pole causing lifting and cooling of the upper tropical troposphere.
Reason I ask… there seems to be some pieces coming together here:
AMO shifting from + to – after a 40 year advance(and we see a sharp decline in the north Atlantic currently)
The southern ocean temperature as seen in HADSTT3 had a 40 year decline, UAH Antarctica lagged and did not warm over the last 40 years. Now maybe it has bottomed. (inverse relationship to AMO)
The 3.6 yr harmonic of the 11 year ENSO cycle occurring at the same time as a rare SSW. I’m thinking that this is not a coincidence. Both SSW and ENSO 3.6 occurring at minor data peaks seems solar forced. Again this 5 / 3 harmonic is showing up everywhere and in everything. WHY?
I had been thinking that this divergence between Antarctica and the globe was being caused by slowing of cold water upwelling and may be responsible for the 40 year up trend. Now I can add another factor to this… has the number and intensities of SSW increased or decreased? The more SSW events, the more energy is transferred from the tropics to Antarctica, the cooler the earth. If I can prove the number of events was small as AMO increased, and large as AMO decreased that would really be something I think.
Antarctic SSW events are rare, last one was 92?
However I have heard that the warming is associated with an increase in zonal wind around Antarctica that has reduces air mixing and cold outbreaks. Less mixing equals less clouds, which causes cooling in winter and more sun in summer to reach the surface. If you apply this to both poles (especially with black carbon deposition) then you see that it will have an opposite effect on temp. In the last 3 years we have seen a shift in Antarctic sea ice and a more meridional pattern and an increase in fronts reaching southern Australia (3 consecutive years with >2m snow depth at Spencers creek despite drought conditions)
Where this leads to with global temp? Wait and see what happens with La Nia when the new solar cycle fires up.
As for increase of tropical precipitation correlating with the cooling of the tropical upper troposphere, at altitudes measured by the TP satellite sensors: I suspect the increased tropical precipitation could be the cause – although climate models seem to indicate that warms the tropical upper troposphere. I think that an outburst of tropical precipitation could be caused by anomalous middle/upper troposphere cooling at highly extratropical latitudes, and that could assist/push tropical upward convection to happen more and extend to higher altitudes than natural convection would reach unassisted by forces outside where it is happening. I see such extratropically-assisted (forced?) tropical convection causing cooling in the tropics around the 300 – 200 millibar level range, or as high as the tropical convection gets pushed by this. (I am aware that localized natural convection in and near the ITCZ can go very high, as in 100 millibar level.)
So do I panic or just a rogue heat blob ?
Dr. Spencer,
In the graph display of Arctic-Antarctica LS anomalies, are my eyes deceiving me or is there a very slight decline in the linear trend? If there is, would such a trend have any significance to it?
The global stratosphere has cooled substantially since 1979, presumably some combination of ozone depletion and increasing CO2. Changing water vapor is also a possibility.
How much of stratosphere warming/cooling is due to UV levels? A direct connection to solar activity.
Surely that is what one would expect when CO2 concentration is rising, According to Hansen et al. (2013) the lapse rate in the stratosphere would become negative if [CO2] exceeded 6,000 ppm.
Dr Spencer.
Look at the graph, no changes outside of volcanic episodes in strat temp.
SO2 goes in, combines with H20 and 03 and H2SO4 comes out. Thats a net loss of H20 that cant be recovered due to the inversion.
Multidecadal volcanic effects.
Now what would happen if a low SO2 volcano erupted a high amount of steam into the stratosphere?
“Now what would happen if a low SO2 volcano erupted a high amount of steam into the stratosphere?”
Answer: https://www.nasa.gov/feature/jpl/tonga-eruption-blasted-unprecedented-amount-of-water-into-stratosphere
Translation: not much.
It is interesting that anomalies in the polar vortex have not (so far) caused strong blocking of circulation in the troposphere in south.
https://www.cpc.ncep.noaa.gov/products/precip/CWlink/blocking/real_time_sh/500gz_anomalies_sh.gif
Blocking is more visible in the northern hemisphere.
https://www.cpc.ncep.noaa.gov/products/precip/CWlink/blocking/real_time_nh/500gz_anomalies_nh.gif
As can be seen in the lower stratosphere over North America.
https://www.cpc.ncep.noaa.gov/products/stratosphere/strat_int/gif_files/gfs_o3mr_150_NA_f012.png
With solar activity mostly decreasing since 1998 does not make sense to me that we would have linier warming…..do u think it could be a natural C02 cycle combined with mans premature release of CO2. I’m not trolling being a “luke warmist” I want to what dr Spencer and others think
Brewer-Dobson is a good example of Gibbs free energy minimisation in action.
To get a positive feedback the energy must come from somewhere else.
This is why CAGW water vapour positive feedback is impossible, warming from CO2 needs to cannibalise another form of energy (like kinetic) whereas instead the feedback increases latent heat. Energy in a thermodynamic system is minimised, (the equilibrium point is the lowest point) thus you get negative feedback because from equilibrium you are pushing uphill.
Sorry, warming from CO2 is new energy, not a cannibalization of another form of energy.
CO2 molecules absorb heat.
CO2 molecules do absorb heat at certain spectra.
A much larger question is how CO2 transfers heat. CO2 emissivity is very very low. That means almost all the heat gets transferred by collision as the CO2 molecule vibrates, and does its thing according to the gas law. That makes CO2 a conveyor of heat to space.
That should stop AGW hypothesis in its tracks
And that question requires a calculation — not based on the gas law, but based on radiative transfer.
Where’s yours?
Ken,
Ummmm…your contention is self-contradictory. If, in the physics in your universe, almost all the “heat” in CO2 is transferred by collision, how does this energy get into space from the thermosphere, where the pressure approaches nil? Also, since the pressure increases as you head down towards the surface, this would mean that almost all energy transfer happens in the lower levels of the atmosphere and increasing the CO2 concentration would cause these lower layers to warm more rapidly than the upper layers. CO2 causes tropospheric warming even in your universe.
“If, in the physics in your universe, almost all the heat in CO2 is transferred by collision, how does this energy get into space from the thermosphere, where the pressure approaches nil?”
Pressure is low, but kinetic energy per molecule is huge.
And during Solar Min and Max, it shrinks and expands.
And it seems to me that magnetic changes and solar wind changes effect the thermosphere.
And it seems the molecules are in plasma state rather than gas state.
Although I suspect water vapour positive feedback is possible, the argument he’s making is about positive feedback, not CO2 warming itself.
My own opinion is that feedbacks larger than the original forcing either make no sense or are simply very unlikely putting an upper bound on CO2 doubling of a 2 degree effect. This is probably why the IPCC models are running hot so far as they appear to on average model feedbacks larger than the discrete effect of CO2.
Here’s your SSW event.
https://www.cpc.ncep.noaa.gov/products/stratosphere/temperature/70mb6590.png
Notice that a similar SST took place last year at the same time, the onset of antarctic summer. Speculate that this is the same dynamic that affects the ozone hole.
Clearly, the science isn’t settled.
What does this mean for using satellite temperature anomaly as a proxy of global temperature?
Rule 1: People live on the surface, not in the troposphere.
Rule 2: UAH is an outlier, and made a major boner in the past, so few scientists accept it as definitive.
David:
1. No one lives in the ocean, yet the heat accumulation there is pointed to as the most important gauge of global energy imbalance due to humans. Do you see my point?
2. Our 2018 published paper had the most extensive comparison to other data sources (radiosondes, reanalyses), and an objective person would consider our satellite dataset as the most accurate.
3. Referring to a couple mistakes we made over the last 20 years (which we immediately corrected) is a cheap shot. At least we correct our mistakes, still waiting for the climate modelers to do the same.
4. Tweeting about some nut job posting an anti-Semitic rant here as if I’m supportive of it is something that my Jewish friends and co-workers would not do.
I think it’s time for you to go, David. I’ve given you wide latitude in the past, but I’ve had enough.
-Roy
My response is blocked by WordPress for some reason.
Please see here:
https://drive.google.com/file/d/1yxiNZdsIYkO9SOKXH4DYHCjPyyydaLbn/view?usp=sharing
I have never understood why Dr. Spencer allows comments at all . The huge majority of them are unscientific and/or trolling. Guilt by association is ingrained in our society. Then Dr. Spencer complains that the larger field of climate science doesn’t take him seriously. If you want more respect, then don’t allow thousands of garbage comments every month on your blog.
Then Dr. Spencer complains that the larger field of climate science doesnt take him seriously.
(that’s a nutty theory)…
IOW, it’s a stretch to think that Dr Spencer’s comment page makes an iota of difference with his standing in the scientific community…
Keep in mind that Dr Roy created this blog with your average joe (or josephine) in mind to make climate science understandable for the layman. That it attracts average commentary should not be surprising. It’s not an exclusive, esoteric club like, say, Climate, etc. Spencer’s been geared toward the layman and the general public since day one. He could have created an eggheads only blog if he so desired and it would’ve, along with the comment page, looked entirely different. It all boils down to what Dr Spencer, and Dr Spencer alone, wants to do. (and not the respect of the larger field of climate science)…
That is Arpell’s role. He is a leftist propagandist. He continually posts on here questioning Dr. Spencer’s legacy and tries to delegitimize the credibility of UAH. (So funny because UAH is totally transparent unlike many others.) So now UAH is the outlier and it “must conform” or continue to be marginalized by the left.
SPA: So funny because UAH is totally transparent unlike many others.
Where can I download UAH’s source code?
SPA: So now UAH is the outlier
Yeah…interesting isn’t it?
No one seems to have any trouble getting it.
But, you’re all about the science, right BDGWX?
SPA: No one seems to have any trouble getting it.
It’s not available. That means UAH is less transparent than many others. Not that I care. I don’t necessarily think their source code should be available. I’m just saying…
SPA: But, you’re all about the science, right BDGWX?
Yeah. Definitely. That’s what makes UAH’s outlier status interesting.
It was not always thus. Ten years ago, all the data sets were substantially in agreement. Then, the “pause” became inconvenient. UAH is not the one that changed.
More info: http://clivebest.com/blog/?p=8934
“UAH is not the one that changed.”
UAH changed radically in 2015, going from V5.6 to V6.0. The trend since 1979 went from 0.14 °C/decade to 0.11 °C/decade . Later RSS changed in mirror image fashion. Surface indices changed little in comparison.
“But, you’re all about the science, right BDGWX?”
I’m glad others see through him, too.
We need a 3rd big player in the satellite space.
“The trend since 1979 went from 0.14 C/decade to 0.11 C/decade .”
That is not a radical change. You’ll get more variation just by changing your end-points.
Wait a minute, haven’t most of the temperature slopes decreased since the pause?
Source code not available huh? And, all the others are? He opened it up here for discussion. Did you ask about the source code? So you want to compare their source code to the other satellite data sets?
Bart,
I think the issue is more that the UAH trend changed by more than 30% going from UAH 5.6 to UAH 6 when processing data for identical start and end points that spans more than 30 years!
On a separate issue Dr Spencer should note that he has a typo above in his description of the calculation of UAH LT.
The expression
LT = 1.548MT 0.538TP +0.01LS
should be
LT = 1.538MT -0.548TP +0.01LS
to be consistent with the expression used in Section 2.1 of http://www.drroyspencer.com/2015/04/version-6-0-of-the-uah-temperature-dataset-released-new-lt-trend-0-11-cdecade/ .
I believe he has used the latter as the derived trend and the sum of the residuals indicate that the second expression was used to calculate the September 2019 LT data.
Mike R:
“I think the issue is more that the UAH trend changed by more than 30% going from UAH 5.6 to UAH 6…”
The trend changed by -.o26C/decade (from v.5.6 to v6) from the original v5.6 trend of .140C/decade…This is a .026/.14=.19=19 percent change …not greater than 30%. Don’t you agree?
see: http://www.drroyspencer.com/2015/04/version-6-0-of-the-uah-temperature-dataset-released-new-lt-trend-0-11-cdecade/
I’ve always wondered if DA gets paid to constantly mess with Dr Spencer.
i kind of doubt it, Mike. DA has made the rounds for a long time, here and elsewhere. He’s even debated climate change on t.v.(!) Just someone with a passion for all things liberal…
It’s not just Spencer. He pops up anywhere someone might question the pseudoscience. Ed Berry has an open letter discussing Arpell’s propagandist tactics. He makes 86 irrelevant (86 red herring) comments on Berry’s site….you can tell he didn’t even read the paper. It isn’t about the science.
DA was a Chihuahua snapping at the heels of a Rhinoceros. His yapping won’t be missed.
My comment was blocked too.
Um, maybe it’s Harp?
Galactic radiation now reaches maximum values in cycle 24.
https://cosmicrays.oulu.fi/
Due to the two centers of the magnetic field in the northern hemisphere, the sudden warming of the stratosphere causes much stronger effects on the surface.
https://youtu.be/bminxfVGa5w
Magnetic field in the Arctic regions
The observed magnetic field is highly asymmetrical.
Lines of inclination are highly elliptical, with the North Magnetic Pole situated near one end of the ellipse.
The strength of the magnetic field is no longer a maximum at the North Magnetic Pole. In fact, there are now two maxima, one over central Canada, the other over Siberia.
Magnetic meridians do not converge radially on the North Magnetic Pole.
https://www.geomag.nrcan.gc.ca/mag_fld/arctics-en.php
Ren, that is number 10 out of 31 comments so far. Please give it a rest.
Then when you’ve had a rest, please come back and post many, many more.
What’s the fuss, there is normally upper level tropical cooling during a SSW.
It was an extreme event; by some accounts unprecedented in the last 50 years. The only other event that was even remotely close in magnitude was from 2002.
During SSW, ozone accumulates in excess in a certain area and the ozone stain slowly moves in the stratosphere. In this region, air is exchanged from the upper troposphere and the lower stratosphere.
https://pics.tinypic.pl/i/00989/j9qkvv5iu2at.gif
So this means the calculation of LT as a fixed linear combination of MT TP and LS is inaccurate under these conditions? Is there a better approximation that would apply?
The surface temperature in medium latitudes decreases during SSW.
https://climatereanalyzer.org/wx_frames/gfs/ds/gfs_world-ced_t2anom_1-day.png
This figure shows the progress of the size of the ozone hole in comparison to other years. For more information about this graph go to the ozone hole web page.
https://www.cpc.ncep.noaa.gov/products/stratosphere/polar/gif_files/ozone_hole_plot.png
Good catch, ren. The ozone “hole” appears to be “healing” with this year’s area being quite low. That means that the stratospheric ozone level is returning to “normal”, i.e., the level which existed before man-made CFC’s and other chemicals began to destroy things. Given that our satellite data only extends back to the late ’70’s, the springtime Antarctic temperatures have been biased low since then as the ozone hole increased.
The situation is now reversed, as these temperatures appear to be recovering, a possible cause which Dr. Spencer didn’t mention. The data only appears to be a warming because the base period used to compute the anomaly included those cold years.
TEST: is Huffington blocked?
Interesting. I had not considered this. So a biased low stratospheric temperature as a result of previous ozone depletion would slightly mask part of the cooling signal that is induced by GHGs in the troposphere?
“TEST: is Huffington blocked?”
Wrongly, yes. Hopefully he will return at some point, to liven things up a bit. I’d suggest a one word name.
The minute I saw the satellite crashing on the last episode of “Walking Dead” I knew the data was going haywire
Does this mean that the value is correct? In the text It looks like there is an error when an SSW occur in the calculation of the product but in the comment I get the idea that it doesnt effect the temperature. There wasnt any strat-trop-coupling in september even if it was a Linda big SSW. Shouldnt it at least decrease the global temp in the upper troposphere a lite due to tropical cooling in this layer?
A wave of dry air that falls from the stratosphere causes a large drop in surface temperature. In this area, the vertical temperature gradient is maximum. The tropopause height drops. Explained below.
https://www.cpc.ncep.noaa.gov/products/stratosphere/strat_int/gif_files/gfs_hgt_trop_NA_f000.png
https://www.cpc.ncep.noaa.gov/products/stratosphere/strat_int/gif_files/gfs_o3mr_250_NA_f000.png
https://www.cpc.ncep.noaa.gov/products/stratosphere/strat_int/
Hi Dr. Spencer,
don’t care too much about David App-ell when wrote about your mistakes.
Doing mistakes is part of any real world task, and doing science isn’t that different. I’ve serious doubts about infallible science and become more skeptical about it.
When he highlight those mistakes, he’s just evidencing that he never worked on real issues.
Have great days.
Massimo
“Doing mistakes is part of any real world task, and doing science isnt that different. Ive serious doubts about infallible science and become more skeptical about it.”
There aint no such thing as infallible science. Everyone knows it, especially the scientists.
Which is why published science goes through peer review in advance and public discussion afterwards.
On a blog the equivalent is the comments thread. If you ban the critics you get an echo chamber.
Hi Entropic man,
I fully agree.
I just missed to put “infallible science” between quotation marks to highlight that I was sarcastic about that.
My message was intended to respond to the above comment 394253 at this link:
https://www.drroyspencer.com/2019/10/record-antarctic-stratospheric-warming-causes-sept-2019-global-temperature-update-confusion/#comment-394253
Since the first time my post has been rejected, when I re-posted it I didn’t notice that I was no longer writing in its response.
Have a nice day.
Massimo
It appears the post went well beyond mere criticism.
When you make mistakes you are big enough to admit it.
Dishonest scientists like Michael Mann and James Hansen can never admit their mistakes.
+1
“If you ban the critics you get an echo chamber”
No danger of that happening on this blog…there’s about another 15 regulars who are DA stand-ins to replace him.
…but please, let’s have some more complaints from the Team that has an absolute stranglehold over this blog through weight of numbers, and who were all either strangely quiet (or supportive) of the bans that JD or M Flynn received. Oh no, now one of your own got banned…suddenly censorship is bad!
I wonder if they are banned.
History this blog is no one ever gets banned.
I seem to have limitation on number of posts I can do- per day or hour or something- it’s not problem for me, in any case.
But it seems this blog has lots of sock puppets, and I don’t do the sock puppet thing {never done it}. But since some do and since one can hide your IP address {I don’t know if mentioning makes me terrorist:)} I think it’s mostly deterrent, rather than something like a ban.
Or if you are crazy and rude, you can post all you want on this blog.
So I suspect the banned guys are still playing or playing somewhere else. Or took a vacation {maybe they thought their “work” was done- don’t know, but doesn’t seem like problem similar to being banned on twitter or something.
The ban works by making the person’s name a blocked word, like ‘absorp.tion’. You cannot write out the names M…Flynn or JD H…, or David A… in full, the way they used to write them. Dr Spencer usually writes a message too, over one of their comments, e.g:
http://www.drroyspencer.com/2019/10/record-antarctic-stratospheric-warming-causes-sept-2019-global-temperature-update-confusion/#comment-394253
All three are most definitely banned, to the full extent that this website enables somebody to be banned. Of course, D…C…tton is similarly banned, but still occasionally comments through other names.
As for sock puppets, yes…there’s Bindidon/La Pangolina, and Bob/Des/Bond/Bobdesbond/Midas, I suppose. I guess there must be more.
Is JD Huffington Blocked?
only if used in the NAME field of the post.
Well heck, I misspelled JD’s name.
But, JDHuff-man and DRsEMT appear to be the same person, i.e., a sock puppet.
Nope.
By the way, what was JD’s name derived from?
I have no idea. Maybe it was just his real name?
You might be right, he seemed to imply that himself.
Hopefully he’ll return under a different name soon enough, since censorship just for the position you hold is obviously wrong.
Aha, I see.
I think of it like this…if this was your home, and somebody came in and insulted you and your family, it would be understandable if you chucked them out. So, even though I am anti-banning generally, I can understand Dr Spencer chucking out Fatvid Failure on the basis that he has continually and relentlessly personally insulted Dr Spencer.
But just having the position that there is no GHE, or disagreeing with Dr Spencer on any issue, is not an insult.
Constantly telling Newton there is no gravity could be irritating.
…there’s so much wrong with that as a comparison, it’s unreal.
It does show how extreme your beliefs are, I guess.
You keep telling us that. Constantly.
Who is “us”, and what do I keep telling you, constantly?
You say “No GHE” to everyone on this forum.
2LOT violation remember?
…no, I don’t remember that. I’m not sure I’ve written anything about 2LoT violations. Perhaps you can find me an example? Regardless, saying “no GHE” is not remotely comparable to telling Newton there is no gravity.
First, the observation that gravity exists is about as settled as science ever gets. Compared to that, the GHE is more or less conjecture. Second, there are those supporting the “no GHE” who are arguably more qualified in the relevant physics than some of those supporting it. If anything, they probably find the constant “there is a GHE” quite irritating. So what?
Ultimately, you don’t seem to have a decent argument for why people should be banned for the position they hold.
Dr Roys Emergency Moderation Team says:
No 2LOT confusion, good, but this is what you said a week ago:
https://tinyurl.com/y3vo3jlx
It is to Roy Spencer and thousands of active university physicists in the field. Now name your handful oddballs in the same category and tell me about Galileo and Feynman.
The GHE is easily understood and calculated from first principles.
I didn’t say banned, it’s just tiring to hear “no gravity” over and over. Same thing with your repetitive and childish “please stop trolling”.
“…but this is what you said a week ago”
Haha, yes. That was a funny one. Thanks for posting it.
“It is to Roy Spencer and thousands of active university physicists in the field. Now name your handful oddballs in the same category and tell me about Galileo and Feynman.“
“Climate scientist” does not necessarily equal “physicist”.
Thanks for displaying your intolerance with the “oddball” remark. I’m bored of hearing people categorise the “No GHE” crowd as “oddballs”, “cranks”, “insane” etc. Boring ad hom garbage.
“I didn’t say banned, it’s just tiring to hear “no gravity” over and over. Same thing with your repetitive and childish “please stop trolling”.”
You didn’t need to say “banned”. It’s obvious you have a problem with me, and want me gone. “No GHE” is not equivalent to “no gravity”, no matter how many times you say so. My mature and sophisticated “please stop trolling” comments will reduce in number now that DA is banned…as at least two-thirds to a half of them were directed at him.
You do have a “mature and sophisticated” sense of humor!
Thanks for cutting back on the silly trolling.
Well, the fewer trolls there are commenting here, the less I have to PST them.
Roy is not banning all critics…….just the toxic ones.
Just The Toxic One, and two honest rationals doing their best to spread an inconvenient and unwanted truth.
The “Freedom of Speech” problem, particularly in a political context, is that the choice of who is “toxic” and who is not is inherently a politically biased decision. In the U.S., it’s clear that the political world has drifted toward ever more strident camps with blind tribal allegiance becoming the end result.
That said, in the scientific world, I think trolls who post without any attempt to discuss scientific questions or content and sock puppets posting off topic content with nefarious intent, should be banned.
So for the trolls who post without any attempt to discuss scientific questions or content you have e.g. Captain Droll, Dr Myki, Nurse Ratchet, Professor P, etc; and for the sock puppets you have e.g. Bindidon/La Pangolina, Bob/Des/Bond/Bobdesbond/Midas, etc.
Sure, OK, but I still don’t think anyone should be banned.
I’m not in favor of banning people, regardless of their side, what level they are on scientifically. Doing this always tends to favor people with might not necessary people that are right. Historically that has been bad for science.
I’m not in favor of banning people either. David was, though. I guess it’s a case of “live by the sword, die by the sword”.
DREMT
I’m afraid the idea of the censorship of people that disagree with you in the left wing has spread into the scientific community. They literally think having an other than mainstream scientific opinion is as good as shooting polar bears dead. It is a very emotional response from a group of people that if they TRULY believed what they are saying, would make changes to their own lives. Instead they just want to blame society for not forcing them to live in an environmentally sustainable way instead of taking responsibility for it themselves.
Fact is, there are a lot of competing environmental challenges facing humanity. Why not get the facts and figure out how to prioritize our actions?
Absolutely. All I would add is that it’s a shame that AGW seems to have wound its way to the forefront of the environmental movement, for two reasons. One, it’s diverting attention away from real environmental challenges; and two, when everybody finally realizes that it was all nonsense, it’s going to seriously damage the credibility of that movement.
yes, I find this interesting as well…
generally when I’ve had discussion with folks in the AGW crowd it ultimately boils down to a ‘moral’ imperative to ‘do something’ (since we in the USA can only control our own CO2 output not global CO2 output). Funny how they think the ‘moral’ imperative to act should be applied to everyone first, before they act themselves.
Meanwhile if everyone who claims to be in the AGW crowd (lets say 1/2 of the USA population) were to cut their own CO2 emissions individually by ~90% or more, that would have a much larger impact much quicker than anything any legislative action would accomplish.
It’s hypocritical to the nth degree. Basically, demanding that everyone be forced to live by their morals without even starting to do so themselves…
Barry
But, the comment that elicited this ban appears to have included a rather vile calumny. There are limits.
ironically UAH is the outlier.
Look here.
https://moyhu.blogspot.com/p/latest-ice-and-temperature-data.html
Go to the graph of monthly temperature datasets on a common baseline, set it to show 4 years data.
At random each of the six sets should be lowest 8 times out of 48.
UAH is lowest thirty times, more than the rest put together.
We want to have an accurate reaction. Not under, not over. UAH data is under a microscope, so even if it’s biased low, why would RSS and land-based measurements not have a bias as well? Moral of the story, start building 100 nuclear reactors ASAP. Copy the plans and get the same crews working on them to get the costs down.
argus,
100 times $35 Billion, the very possible finished cost just to build Vogtle 3&4 in Georgia USA, equals $3.5 Trillion US dollars at today’s rate.
Where will you get and who has that kind of capital to build them?
Reactors take 8 – 10 years to build. If you use the same crews 100 new reactors would take 800+ years to build. ???
Just wondering.
They only take 8-10 years and cost 3-4 times more when nobody takes them seriously. Once the realization hits there is no alternative if you want clean air and when the field redevelops the expertise, expect things to go much quicker and be much cheaper.
UAH is not the outlier vs RSS TLT V4
Same problem.
http://www.drroyspencer.com/2019/10/record-antarctic-stratospheric-warming-causes-sept-2019-global-temperature-update-confusion/#comment-395324
Climate shysterin 101
I like the last video on WUWT as it points out how when talking about any specific region it always warms faster than the rest of the globe,
Another climate shysterin tactic for the lowest common denominators.
I really don’t understand this very well. We had a similar thing happen with the SSW in January 2010 where we were all shivering in cold and snow but UAH declared the warmest January on record. We were informed by the MSM that we might be cold but the world was the hottest ever. I take the point that you use some sort of average temperature of various atmosphere levels to derive your product. I think though that you equate surface heat loss with being warm and reduced surface heat loss with being cold which does not align with what we experience at the surface.
A positive anomaly in Iceland indicates a strong circulation blockade during the winter of 1708/1709.
https://upload.wikimedia.org/wikipedia/commons/thumb/0/06/Winter1709.png/800px-Winter1709.png
1708/1709 winter temperature anomaly with respect to 19712000 climatology.
https://en.wikipedia.org/wiki/Great_Frost_of_1709
In a few days, the tropopause height in the Midwest will drop to just 6 km. This will cause a strong drop in temperature at night and a large temperature difference on the front.
https://images.tinypic.pl/i/00989/2hylttou6174.png
Snow is also forecast to develop along with a dramatic temperature plunge over parts of Colorado, including the Denver area.
“Within 48 hours, Denver may go from 80 degrees and sunshine on Tuesday to 20 degrees and snow Wednesday night,” Sosnowski said.
https://www.accuweather.com/en/weather-news/snowstorm-rapid-freeze-up-to-create-dangerous-travel-over-rockies-and-high-plains-this-week/596373
I have a question for the atmospheric scientists on this page. As an operational marine forecaster, stratospheric warming or cooling is not a significant factor for me to be concerned about. But I do have a curiosity about it. And from what little knowledge I have on this subject, I gather that stratospheric cooling means the troposphere is warming because increasing CO2 is retaining more heat in the lower atmosphere, thus decreasing the rate of heat transfer to the stratosphere which cools the stratosphere.
But I was wondering about something. Doesn’t the stratosphere also radiate heat out into space? And when it does, doesn’t that cool the stratosphere as well? It seems to me that there is a lot of focus on the tropopause as the primary control knob for stratospheric warming and cooling. Is what happening at the top of the stratosphere considered negligible when it comes to radiating heat from the earth?
Yes, but the energy involved is small relative to the other energy flows and acts as in indicator rather than a driver.
Please see how strong the stratospheric warming in the south is.
https://www.cpc.ncep.noaa.gov/products/intraseasonal/temp50anim.gif
Folks,
I did a study to see if the number and intensities of SSW is increasing or decreasing. Bottom line, the number and intensities of the SSW has been increasing since 1980. Here is a list of all events where TLS tropics was in the coldest 10% of all readings going back to 1979 and at the same time TLS south pole was in the warmest 10% of all readings.
Date of Report, TLS Tropics Departure, TLS South Pole Departure
1979.833333 -1.2534 7.081
1986.666667 -1.297 2.538
1988.75 -1.1756 4.9741
2000.833333 -1.7217 4.7523
2000.916667 -2.1254 4.195
2002.583333 -1.185 2.3213
2002.666667 -1.3257 4.6641
2002.75 -1.9591 10.1142
2002.833333 -1.8514 9.2127
2003.833333 -1.2604 2.764
2003.916667 -1.1317 1.9011
2005.833333 -1.2181 1.9857
2005.916667 -1.4516 2.7498
2007.833333 -1.3204 3.6059
2009.833333 -1.1517 2.1281
2012.833333 -1.6827 7.2931
2012.916667 -1.2073 4.3466
2014.833333 -1.1312 2.7398
2016.75 -1.3431 2.2815
2016.916667 -1.2884 2.3453
2017.666667 -1.2121 1.9791
2017.75 -1.4526 4.1531
2019.75 -2.6358 13.4656
If I have time, I’ll post the chart later when I’m at home (and not blocked).
You might notice there was a long absence of SSW events after mount Pinatubo. Interesting that that eruption impacted the climate for so long. I’m wondering if other Volcanic eruptions may have also slowed the heat transfer to the south pole down prior to the late 80s when we had the 1988 heat wave / drought and a couple of SSWs. Perhaps the earth did not truly recover from the volcanic eruptions until 2000. (so the entire 1980-2000 period could possibly be suppressed by volcanic forcing)
Anyways, bottom line, SSW is not responsible for the Antarctica / global UAH departure split with Antarctica lagging. If anything, SSW has contributed more heat to the Antarctic as of late, keeping the tropics cooler than they otherwise would be possibly, so SSW is a feedback, not a forcer. So we are back to ocean currents having to be the cause of that Antarctic / globe split. Large Volcanic eruptions seem more important to me now.
One other observation… all SSW events by my 10% / 10% criteria occurred between July and November as the energy balance of the earth switches from SH- to SH+.
In the north between January and February.
ren
I was actually thinking about running the same study for the NH. I’ve noticed they do not impact the mid latitudes the same way. In the south, mid TLS is aligned to the south pole in a direct relationship. For the NH, mid latitudes are aligned to the tropics in a direct relationship, not the pole (just from eyeballing the data). I haven’t run the numbers yet.
Here is a chart showing all SSW self categorized as described previously.
https://drive.google.com/file/d/1qJ1qdjv6rLD_FrIdWu_AgKCQW2hYUL5-/view?usp=sharing
Scott R
Great job.
“Substantial blowing and drifting of snow is in store at the height of the storm Friday and in its immediate wake during part of this weekend.
The storm is forecast to bring a few inches of snow to northwestern Nebraska and western Minnesota.
In the wake of the storm, record low temperatures can occur over portions of the North Central states late this week and this weekend.”
ren,
It looks like the snow could be measured in feet!
The Sun is extremely quiet.
http://www.solen.info/solar/images/AR_CH_20191007.png
Just toying with us yet again.
I am a layman and appreciate Dr. Spencer’s blog and the chatter it stimulates.
Summarizing Mr Spencer’s post:
The satellite record is more accurate than the thermometer record, unless it comes out higher. Then we have to look for excuses.
What excuses? What are you talking about?
bdgwx,
I’ve thought a little bit about your comment that I need to divide the natural irradiance of the sun by 4. I’ve come to the conclusion that the man made forcers in the paper we were discussion ALSO need to be divided by 4. Man made forcers should also be relative to the sun. If you have 2 glass containers with 2 different mixtures of air in them in the shade, but will be close to the same temperature. It’s only when you add the sun that you would get a difference. The man made forcers require the sun.
That said, dividing by 4 is pointless. What is important is the earth’s recorded reaction to past changes in the gross solar irradiance (and a host of other sun driven items linked to long period cycles). It is not reasonable to exclude such unknown items now because we don’t have the physics (or political will power) to completely understand them.
My conclusion is still that we are yet to record any significant changes in temperature due to human activities… despite the calculations in the paper. We are still in the expected range considering past temperature response to the phases of the sun’s activities. Also, it seems we are going into a major drop soon due to the sun.
It’s a simple balance. The area presented to the Sun is pi*R^2, which is 1/4 of the radiating surface area of 4*pi*R^2.
ScottR,
Radiative forcings are by convention expressed in W/m^2 at the surface and in relation to the total surface area of the Earth.
TSI is NOT the radiative forcing applied to Earth. It is the average incident radiation received at TOA perpendicular to the surface. It needs to be normalized to the spherical shape of the planet (see Bart’s explanation above). So a +1.0 W/m^2 change in TSI is equivalent to a radiative force of about (1.0 / 4) * 0.7 = +0.175 W/m^2 at the surface. Note that I’m using the standard 0.7 reduction factor from TOA to surface.
Best estimate from the physicists is that a 4W/m^2 increase in surface radiation produces a 1 C rise in surface temperatures.
On that basis a 1W/m^2 increase in TSI produces an extra 0.17W/m^2 at the surface and a warming of 0.17/4 = 0.04C.
0.04C is well within the noise level of global temperature measurement, so I would be surprised to see any corealation between solar insolation variation and global temperature.
The general estimates for climate sensitivity I’m familiar with are 0.5 – 2.0C per W/m^2. For the modern era its probably close to 1.0C per W/m^2. So a +1.0 W/m^2 change in TSI would probably be closer to (1.0 / 4 * 0.7) * 1.0 = 0.17C of warming. This is certainly open for debate though.
Entropic Man, bgdwx, please stop trolling.
bdgwx,
I don’t think you understood what I’m saying. I understand the math behind the divide by 4, but I don’t understand why that is being applied to natural forcing from the sun, but not the man made forcers. Basically, for 75% of the time, CO2 can not make any difference because there is no sunlight.
Think of it this way. Suppose I have a bunch of random objects sitting outside in the sun. Some will get much warmer than others. But when I come back in the morning, all the objects are the same temperature. (assuming we aren’t talking about a super large rock) My point is, the cooling part of the cycle can un-do the un-even adding of energy to small objects. Air is way less dense and energy flows much better than potential random items left outside during the day.
My conclusion is that the more energy you add to the earth system, the faster it will radiate into space. The earth is a self-correcting system. The feed back in this case is 4 times more important than the energy input. So what really explains the temperature variations on the earth? It’s not CO2 because we have seen the temperatures move against CO2 trends on multiple time frames. Temperature has been following the AMO and the ENSO ocean currents. Always has been. For me, global warming alarms will not go off in my head unless we see AMO depart from it’s cycle. The higher low in 1980 is explained by GSM harmonics. (3rd and 5th) The higher peak in 2016 than in 1870 was due to low solar forcing at that time. All evidence points to a trend change in the north Atlantic per usual, and a return of the ocean to baseline over the next 80 years.
I will upload my updated model later. Still working on it though, but you guys can provide constructive criticism as I go.
Scott R wrote:
While CO2 does intercept a small fraction of the total energy from the Sun’s TSI, it’s main effect on climate occurs in the IR portion of the spectrum. That process involves energy leaving the Earth atmosphere and occurs 24/7/365 over the Earth’s entire surface area.
That’s the story and you’re sticking to it.
SPA, Yup, that’s the “story”, as you call it. It’s also the theoretical foundation of S & C’s UAH “temperature” products, which rely on the thermal absorp_tion and emission of oxygen molecules in the microwave portion of the EM spectrum. Given your apparent rejection of the basic theory, why aren’t you also ranting about the UAH “temperature” data?
E. Swanson, please stop trolling.
The figures you see for CO2, aerosols, CFCs, etc. are already expressed as radiative forcings. No conversion is necessary for them. TSI itself is not representative of the solar radiative forcing. That’s why it has to be converted. And the radiative forcing figures are averages over long periods of time so daily and yearly cycles are already accounted for.
Maybe this will help:
https://climateofsophistry.com/2019/07/08/how-to-calculate-the-average-projection-factor-onto-a-hemisphere/
Folks… let me try to explain again. It is not necessary for someone to understand the heat transfer equations DREMT posted to think about what I’m saying. As much as I’d like to pull out my college text books and check that paper, please hear me out.
Let me use an automotive example if I may. Suppose you have an electric system and we are trying to decide on what type of wire to use. Your choices are copper, aluminum, and a new alloy that is 99.99% copper, and .01% unknown due to industry trademarks.
Now suppose we apply the same current to all 3 wires as a test, and record the circuit’s performance during the test. The current we apply, is low enough where failure does not occur for either wire type (and we know this is the case for the earth because CO2 was much higher and we are still here!). The resistive / temperature performance of all 3 wire types is graphed. After power is cut, all 3 wire types cool down quickly at first, and at a slowing rate. The copper wire and 99.99% copper wire data looks identical with no distinguishable differences in performance. The Aluminum curve looks a little different. The time all 3 materials return to ambient temperature is checked, with not surprisingly, the copper and the 99.99% copper returning to ambient temperature at indistinguishably the same time. Aluminum is slightly different.
My point is the factor “t” is missing from this CO2 discussion. How close are we to flat line where the material doesn’t matter? Also, the fact that earth’s atmosphere is only being changed by .01%, to another material that performs X% the same way as the original. No, CO2 does not block 100% of energy, it too passes energy thru. How close would you have to zoom in on the overall chart of the copper wires I descrived to actually see a difference for .01% material change with X% performance difference? How would the gap between copper(100%) equilibrium and copper(99.99%) equilibrium compare with the over all test time? Express that as a %.
Are you picking up what I’m putting down yet?
So yes… TSI is only changing by a small %, but the total change from atmospheric materials as a % of the whole is also tiny, and along with it the performance % change of the material.
Read the penultimate sentence:
“The major point here of course being that it is 100% irrational, illogical, and incredibly stupid to average the incoming solar flux evenly over surface area it never exists upon, i.e. the entire surface area of the Earth at once, literally as if the Earth is a flat plane, etc.”
Then take another look at what they’re telling you…
And yet Postma has no problem averaging it over one hemisphere at a moment in time that only occurs two days out the year. But lets forget about that nuance for now. If Postma is offended by averaging it over both hemispheres and 1 orbital cycle then how would he compute the mean solar forcing (in W/m^2) from a perturbation in TSI over a period of time?
It’s OK, bdgwx, nobody expects you to honestly/correctly represent anything Postma says. You already conclusively proved that a little while ago.
Prediction is a mug’s game but I am going to stick my neck out. Strange things are going on in the upper atmosphere as this post explains. Does it mean anything at the bottom of the troposphere where we live?
I think is does have significance even though I can’t “Connect the Dots”. In my opinion Mother Nature is about to remind us who is in charge (and it ain’t us).
For the last 50 years crop yields have been rising steadily owing to several favorable factors including warm temperatures, rising CO2 levels and improving farming techniques.
Crop yields are about to dip especially in the USA owing to a couple of adverse factors. We have a global effect thanks to the the minimum in solar activity that will last for at least the next six years. In addition the USA will be affected by falling temperatures due to ENSO.
In the USA growing seasons are declining to such an extent that global grain prices will be affected. Hopefully this will just be a “blip” rather than the prelude to the next glaciation.
Apparently there will be crop report on Oct 10.
There is speculation it could slighter lower yields.
I would say low US yields might be bad news for China.
U.S. CORN YIELD IS GETTING BIGGER, USDA SAYS
SOYBEAN ENDING STOCKS ARE SEEN TIGHTENING.
https://www.agriculture.com/news/crops/us-farmers-tol-grow-smaller-corn-soybean-crops-usda-says
So, perhaps the Chinese have screwed themselves- because they clueless about how markets work.
And farmers probably got better handle on weather than most people, and they adjust.
I still think winter could be more severe this year, or the Solar min is effecting weather {but could take awhile to effect “global average temperatures” and centuries {a lot longer} to actually affect the real global temperature {which I think is the average volume temperature of entire ocean- currently at about 3.5 C].
Is there any update on what has been learned so far?
I’ve completed the same type of analysis for all SSW events for the north pole region using the same idea as last time. TLS tropics must be in the bottom 10% at the same time TLS north pole must be in the top 10% of recorded data. All together, there are fewer north pole events vs south pole. 23 vs 16. All north pole events occurred between November and March. November 2016 was the only time we had both a north and south pole event at the same time since 1980. Both NH and SH SSW events occur within a 5 month period. Interestingly, the NH events occur earlier within the seasonal cycle than the SH. No SSW ever occur in April, May and June as heat is strongly transferred to the NH, and the earth moves farther from the sun in it’s orbit. As for volcanic forcing, like the south pole, there was a long gap in SSW due to the eruption of Pinatubo. I can now narrow the gap where SSW disappeared completely by considering both NH and SH. So from 1989-1997 we had no SSWs. Another gap occurred between 1980-1984. Multiple mid size eruptions? Other than that, we haven’t had any other gaps other than a skipped year. It would seem having SSW is the NORMAL case. When we don’t have this feature, it probably means some large volcanos are going off somewhere.
Date of Report, TLS tropics Departure, TLS north pole Departure
1985.083333 -1.2608 7.9669
1987.166667 -1.1311 8.4446
1998 -1.705 3.4531
1998.083333 -1.7208 4.6805
2001 -1.8732 4.144
2001.166667 -1.2094 7.1016
2004.083333 -1.5179 7.9959
2006.083333 -1.4191 6.9889
2009.166667 -1.5171 9.8349
2010.166667 -1.706 5.8702
2012.083333 -1.2349 3.0544
2013.083333 -1.6618 9.039
2016.25 -1.2817 5.096
2016.916667 -1.2884 2.3849
2018.166667 -1.4495 4.5458
2019.083333 -1.2063 9.4108
I’ll post the chart later.
The two strongest SSWs in the north:
February 2009, North Pole 9.17
January 2019, North Pole 8.52
The two strongest during the deep solar minimum.
nice observation ren!
Here is the NH chart:
https://drive.google.com/file/d/11XsQt_2lNTns_le9ig3txwsXGedpxiwC/view?usp=sharing
Meanwhile, another cold wave appeared in the eastern equatorial Pacific.
https://www.tropicaltidbits.com/analysis/ocean/cdas-sflux_ssta7diff_global_1.png
I saw that hard reversal ren. 1+2 is at -1.621. Cold water still seems to be emerging there… the break was likely caused by mixing. 3.4 is also dropping again. Since we are still in SC24 as indicated by the last sun spot, the wait for the deep multiple surge multi-year La Nina goes on.
https://www.tropicaltidbits.com/analysis/ocean/nino12.png
Clearly!
“The arrival of the Arctic air and the strengthening storm will cause weather conditions to change rapidly, whether in the mountains, over the passes or on the Plains.”
Does it make any sense to weight the measurements by heat capacity as places that are more humid would have higher heat content vs drier regions ?
Model update:
I’ve managed to incorporate the 11 year solar cycle into my model and it improved the results. The period that bothers me the most still is the 1819-1834 period. They were much too warm for what should have been happening. Obviously, there is much more to climate than 3 forcers. I’ll have to think about what might have caused that. It’s not just a quick burst either that I can kind of shrug off… it was quite sustained. Let me know if you guys can think of anything.
month 1611.00 (dec 1610) Temperature = 4.62+(0.5)*COS((A3-52)*3.14159*2/(365/5))+ 4.62+(0.25)*COS((A3-52)*3.14159*2/(365/3))+(G9-1360.61)*1.5
A3 = 1610.0833
G9 = TSI for 1610.58
A goes from 1610.0833 to 2100 for this chart.
Hope that makes sense.
https://drive.google.com/file/d/1j3GGF1BEqnrM7pZqRdWIxmTxKczUP6T5/view?usp=sharing
What confuses me is that you say subsiding air over the pole is matched by rising air further from the pole and yet both the Tropics and the Southern Hemisphere as you measure it are both warmer not cooler. We are regularly having to account for these erratic upward surges in global temperatures, we just accept this and move on, but note however that there have been no erratic downward surges in global temperature.
donald penman,
The TLS has been in a long term decline. Do you understand there are different portions of the atmosphere in different locations with different trends? The entire planet hasn’t been warming. We do have energy moving around. Study the data here and see for yourself:
http://images.remss.com/msu/msu_time_series.html
Finally ! Your tolerance has been amazing Roy.
Nino makes a lower monthly low as the north Atlantic makes a lower monthly high:
https://www.tropicaltidbits.com/analysis/ocean/nino12.png
https://www.tropicaltidbits.com/analysis/ocean/natlssta.png
*Nino 1+2
The drop in temperature in Colorado
https://files.tinypic.pl/i/00990/cyywra31vteb.png
Extremely cold air moves to Kansans and Nebraska.
https://images.tinypic.pl/i/00990/bak78d3fitcn.png
And there is no warming in the troposphere in the Southern Hemisphere.
https://climatereanalyzer.org/wx_frames/gfs/ds/gfs_world-ced_t2anom_1-day.png
I looked up the thermal conductivity for air and compared it to CO2 by itself.
Compare air at 1 atm, 6.9 deg c to carbon dioxide at 1 atm, 6.9 deg c.
air: 24.88 mW/mK
co2: 15.20 mW/mK
Now, we can predict what might happen to overall thermal conductivity if we add another 100ppm CO2.
.9999*24.88+.0001*15.20 = 24.879
The conductivity changes by .004%.
Compare to TSI which changes by .1%
TSI is 25 times more important than the CO2 we’ve already added to the system. CO2 might be responsible for approximately 4% of the up trend.
Have I over simplified this? Yes. Tell me why I can’t do this for a quick estimate.
I just checked my work to make sure round off error didn’t influence the results. We are good. Using exact CO2 parts per million numbers, exact TSI numbers, I have concluded that ~3.7% of the 1695-2016 uptrend may have been caused by co2. Other man made gases also play a role. Co2 is approximately 64.3% of the total forcing from all man made gases. So your grand total AGW is 5.8% responsible for the 1695-2016 trend, not including heat island.
That is actually higher than I thought it would be FWIW. Does that mean I’m now a luke warmist?
Thermal conductivity is a measure of how eager a material is in transmitting heat via conduction. It doesn’t tell you anything about the ingress and egress flows of energy along the material boundary that would dictate whether the material warms or cools. Nevermind that conduction is but one of the heat transfer mechanisms anyway.
CO2’s global warming potential occurs by blocking some of the flow of UWIR that would normally escape to space and instead either returns it to the surface via DWIR or thermalizes it via conduction directly. Most of it is returned to the surface via DWIR. This creates a positive energy imbalance at the surface and a negative energy imbalance at TOA. About 90% of the surface imbalance is taken up by the ocean. The ocean can and will eventually transfer this to the atmosphere, but that process can take decades to fully equilibriate. That’s a big reason why the equilibrium climate response is higher than the transient climate response.
bdgwx,
Other forms of energy transfer will also have ratios that I could come up with comparing CO2 to air. Are you saying thermal conductivity is not the most important factor here? The ratio I am applying for CO2 vs air is
15.20 mW/mK / 24.88 mW/mK = .61
Based on thermal conductivity
That means CO2 transmits energy at an efficiency of 61% compared to that of air. If I used other methods of energy transport, I would get other ratios. I’m willing to listen if you want to argue for another method being more important, or we could even create a weighted system and use multiple methods. Other methods will be much harder to prove, might actually be greater than 61%, but I’m willing to look at them.
Then you still have the fact that the man made portion only makes up .01% of the atmosphere.
If the question you’re trying to answer is what is the relative contribution to global heat uptake then the metric you’re after is the climate forcing in W/m^2. If you want to extend this to temperature changes at the surface then you need to combine another metric called climate sensitivity in C per W/m^2. The climate sensitivity invariant to the forcing mechanism.
For example…
A 0.1% perturbation in TSI yields (1360 * 0.001) / 4 * 0.7 = 0.24 W/m^2
A 0.013% increase (by relative composition) in CO2 yields 5.35 * ln(0.00041 / 0.00028) = 2.04 W/m^2.
So if you want to know the relative contribution of the warming from the LIA to present for just solar and CO2 effects it would be…
0.24 / (0.24 + 2.04) = 10.5% for solar
2.04 / (0.24 + 2.04) = 89.5% for CO2.
Of course, there are other factors involved in the warming from the LIA to present. You would need to do the exercise for each of them to get the full breakdown.
And again, while conductivity is an import metric for quantifying the effectiveness of heat transmission via conduction it does not tell you anything about how much heat may be accumulating in the material. By the way, convection and advection is by far the most effective mechanism for moving heat throughout the atmosphere.
bdgwx,
In order for CO2 to be 1 order of magnitude stronger than the sun, you will have to have a -1% change in the atmosphere’s ability to transmit heat back to space. That is approximately 10x’s more than the .1% change in TSI. In order for that to be the case, you would have to prove to me that the man made gases are 100x’s a better insulator than air, because man made CO2 is only 0.01% of the atmosphere. There is no way. These gases are not going to be orders of magnitude different on heat transfer, regardless of what type of mode you want to study. Maybe if I have some free time I will dive into these papers more later because I am fascinated by them… to see how exactly they came up with this numbers.
Anyways, thanks for not saying “it’s settled science” or refer me to the Nasa website or opinion articles that start with “scientists say” from the “experts”.
A 1% change in the atmosphere’s ability to block infrared radiation would be about 3.5 W/m^2 because total IR radiation being blocked is about 350 W/m^2 out of about 390 W/m^2 coming off the surface.
What CO2 is doing is closing off part of the (390 – 350) = 40 W/m^2 “atmospheric window”. If we consider “air” to be only O2 + N2 then “air” can’t close off any of that. In that context CO2 is nearly infinitely more effective at acting as an insulation for this crucial egress flow.
Yes. CO2, H2O, CH4, CFCs, or any polyatomic gas species are many orders of magnitude more effective in blocking IR radiation than what air is primarily made of (O2 & N2). The reason is well understood and explained by molecular physics and quantum mechanics.
BTW…solar forcing acts to adjust the ingress energy flow while GHG forcing acts to adjust the egress energy flow. It’s the change in the net flow of energy that drives the change in heat in the entire system. Change the net flow of energy and you change the temperature.
Scott, not to beat a dead horse, but
* It is not about the thermal conductivity of CO2
* it is not about CO2 being an insulator
* It is also not about heat capacity of CO2
It is all about the IR properties.
About 390 W/m^2 of IR are emitted by the surface.
About 240 W/m^2 of IR are emitted to space.
You say: “you would have to prove to me that the man made gases are 100xs a better insulator than air”
REALLY you should say “you would have to prove to me that the man made gases are 100xs a better ABSORBER OF IR than air”.
Since N2 and O2 basically absorb no IR, CO2 is ~ infinitely better than most of the atmosphere at absorbing IR. So we should have now convinced you!
bdgwx, Tim, please stop trolling.
Hottel’s book shows emissivity of CO2 is very low. So, if emissivity is low, how does CO2 transmit most of DWIR back to earth when most of the energy is lost by collision with O2 and N2 atoms?
Here is Nasif Nahle Sabag Paper on emissivity of CO2 http://www.biocab.org/Emissivity_CO2.html
Ken
You have to look at Hottel’s units. It is the partial pressure in one meter. CO2 will emit very little IR just one meter above the surface. The pressure does not change that much as you go to 1000 meters but then you multiply by 1000 meters of air (the path length), the 0.00034 now moves to the 0.34 column and you can see the emissivity of a 1000 meter column of air with CO2 will have an emissivity of around 0.17 and will emit around 80 W/m^2 of energy back to the surface. Hope that helps.
Norman, please stop trolling.
Dr Roys Emergency Moderation Team
You have this passion to post “please stop trolling”
Can you remotely explain what was trolling in my response to Ken. I don’t think you will be able to.
Shut up.
Aha, I see.
I’m just following the precedent set by Dr Spencer. A little while ago, I made a comment that people should ignore the attention-seeking antics of E.Swanson, as he would continually get first comment on the UAH updates with his completely off-topic “experiments”. Dr Spencer made the comment, “…speaking of trolls”. This we interpreted as Dr Spencer calling me out as a troll. Later, he clarified that “coming to this website and saying there’s no GHE” was trolling, or words to that effect. So, following that precedent, I have taken it upon myself to ask anyone defending the GHE to please stop trolling, regardless of the content of their comment, since that follows the same general logic of his definition of trolling.
Dr Roy says “no GHE” is trolling.
Dr Roy’s team says “GHE” is trolling.
So Dr Roy’s team says Dr Roy is trolling.
Poor Svante completely misses the point again.
I’ll attempt to explain this. I want to be as precise and correct as possible so if someone notices an inaccuracy or better way to explain it please chime in.
Here we go. Consider the pathways in which CO2 can utilize the energy from a captured photon. It can use that energy to accelerate the molecule via the induced dipole moment leading to a collision with a nearby molecule in a process called thermalization or it can spontaneously emit a new photon thus relaxing the dipole moment before a collision takes place. But, the reverse process in which a collision from other energetic molecules is also possible. This will induce the same dipole moment allowing for the possibility of a spontaneous emission of a new photon. So even if we assume the CO2->other collision pathway is preferred on capture you can’t ignore the fact that CO2 molecules are being pinged by energetic O2 and N2 molecules in the reverse other->CO2 direction. In either case radiation is scattered in all directions regardless. In this manner part of the UWIR is converted into DWIR.
In regards to emissivity remember that CO2 is far from being a perfect blackbody as result of it being active only in a very small part of the EM spectrum. This is why it has a low emissivity. But, in the narrow focused 15um band it is very active. And the 15um band happens be near the peak of the surface emission. That’s why its so important and why the low emissivity is insignificant.
Those impingements are convection and conduction. CO2 can release its energy through radiation and convection or conduction (thermalization). Energy can get to the top of the atmosphere from the surface by any of the three modes. I think they have a pretty good idea how much energy hits the atmosphere from the Sun. They don’t know much of anything else.
It is probably a pretty good assumption that the dominant mode of heat transfer in the atmosphere is done by the greater than 99.9% of the gases that aren’t CO2.
Also, more than likely that CO2 collides with other molecules several times before it ever has a chance to release its energy through radiation. It has more of an effect on temperature through collisions than radiation. But again it is less than 0.1%.
And CO2 can radiate after colliding with non-GHG molecules.
Yes, it can radiate after it collides a bunch of times, especially if it collides with molecules with more energy.
“It can use that energy to accelerate the molecule via the induced dipole moment…”
Better: On Earth, in the relevant mid-tropics troposphere, the ground state air molecule can use the photon’s energy to increase (excite) the quantized rotational rate of the entire molecular structure above the ground state level…
“…more than likely that CO2 collides with other molecules..”
At ~sea level, 293K, only about one part (by volume) per thousand of air is occupied by matter. Contrary to intuition, air is not very crowded, more like a few cows on an acre of pasture and a lot less like cows rubbing flanks feeding in the barn.
Even better: On Earth, in the relevant mid-tropics troposphere, the ground state air molecule can use the photons energy to increase (excite) the quantized VIBRATIONAL STATE. This excess vibrational energy can be transfered to other molecules during collisions.
Also, cows in a pasture might be a good analogy — but only if those cows are constantly racing around at 10,000 miles per hour! Air molecules collide with other molecules typically travel on the order of 100 nm before colliding, moving on the order of 500 m/s. They literally collide billions of times per second. This means a collision is MUCH more common than the emission of an IR photon. (And conversely, all those collisions can transfer energy back to the CO2 molecule to excite that vibrational mode.)
“increase (excite) the quantized VIBRATIONAL STATE.
Not nearly as much Tim, takes order of ~10x the photon energy to do that in a troposphere air molecule thus is much more rare.
Rotationals for air molecules are the main grey absorber/emitter method in the troposphere.
Non-GHGs are sort of a dead end street, so to continue on Stephen’s thought process, how much of the input IR comes back out as IR (albeit in other bands)?
More than all of it I guess, since convection and latent heat are net contributors.
“So even if we assume the CO2->other collision pathway is preferred on capture you can’t ignore the fact that CO2 molecules are being pinged by energetic O2 and N2 molecules in the reverse other->CO2 direction. In either case radiation is scattered in all directions regardless. In this manner part of the UWIR is converted into DWIR.”
Except obviously those CO2 molecules getting “pinged” by O2 and N2 molecules is not UWIR being converted to DWIR. That is not what the GHE is supposed to be (I eagerly await the new definition that will shortly be invented).
Ball4,
The 15 um band is due to vibrations, not rotations. The temperature of the molecules does not change that. When the molecule emits or absorbs near 15 um (the important band for climate), there MUST be the vibrational mode involved.
One possible pathway is 15um/UWIR -> CO2 -> N2 -> CO2 -> 15um/DWIR. Without CO2 that 15um/UWIR would have a free path to space.
And another possible pathway is 15um/UWIR -> CO2 -> N2 -> CO2 -> 15um/DWIR -> CO2 -> N2 – CO2 -> 15um/UWIR.
SPA, convection can transport heat vertically. However, convection is mostly confined to the troposphere. Little if any heat is transported from the surface to TOA via convection nevermind letting it proceed into space. Conduction is the same and for some of the same reasons even.
So yeah, CO2 can have fun ping-ponging photons around the atmosphere…so what!? What molecules are actually retaining the heat in the atmosphere….why, it’s the molecules that can’t ping-pong photons around, of course…the N2/O2 molecules…they’re what actually insulates the surface…
DREMT, you’re absolute correct. That is yet another pathway. But notice what’s happening. Whereas 15um UWIR from the surface had a free path to space without CO2 it now does so with reduced probability since the conversion pathways favor DWIR and UWIR equally now. And, of course, there are many pathways that still result in thermalization in the troposphere. None of those pathways are possible without CO2.
“DREMT, you’re absolute correct.”
Thanks, I know.
DREMT: why, it’s the molecules that can’t ping-pong photons around, of course…the N2/O2 molecules…they’re what actually insulates the surface…
N2/O2 molecules are not active in the infrared part of the spectrum where most of the surface heat loss is occurring and since N2/O2 form most of the mass they carry most of the heat off the surface via convection. In addition O2 is very effective in blocking part of the incoming shortwave spectrum. N2/O2 do more to cool the surface than they do to warm or insulate it.
DREMT: Thanks, I know.
Just to be clear so there is no misunderstanding. I agree with 15um/UWIR -> CO2 -> N2 -> CO2 -> 15um/DWIR -> CO2 -> N2 > CO2 -> 15um/UWIR being a possible pathway and nothing more. Don’t let it be said that I won’t acknowledge a statement as being correct even if it comes from someone that may have misunderstandings on other points.
Just don’t misunderstand what’s happening here. Whereas 15um/UWIR photon would have certainly had a free path to space without CO2 it now only has an even chance with CO2 assuming the pathway hasn’t already ended with thermalization.
I’ll just copy and paste this comment, that was already written out by someone else, for just such an eventuality:
”There are 3 ways that heat (Infra-Red or IR radiation) passes from the surface to space.
1) A small amount of the radiation leaves directly, because all gases in our air are transparent to IR of 10-14 microns (sometimes called the “atmospheric window.” This pathway moves at the speed of light, so no delay of cooling occurs.
2) Some radiation is absorbed and re-emitted by IR active gases up to the tropopause. Calculations of the free mean path for CO2 show that energy passes from surface to tropopause in less than 5 milliseconds. This is almost speed of light, so delay is negligible.
The bulk gases of the atmosphere, O2 and N2, are warmed by conduction and convection from the surface. They also gain energy by collisions with IR active gases, some of that IR coming from the surface, and some absorbed directly from the sun. Latent heat from water is also added to the bulk gases. O2 and N2 are slow to shed this heat, and indeed must pass it back to IR active gases at the top of the troposphere for radiation into space.
In a parcel of air each molecule of CO2 is surrounded by 2500 other molecules, mostly O2 and N2. In the lower atmosphere, the air is dense and CO2 molecules energized by IR lose it to surrounding gases, slightly warming the entire parcel. Higher in the atmosphere, the air is thinner, and CO2 molecules can emit IR and lose energy relative to surrounding gases, who replace the energy lost.
This third pathway has a significant delay of cooling, and is the reason for our mild surface temperature, averaging about 15C. Yes, earth’s atmosphere produces a buildup of heat at the surface. The bulk gases, O2 and N2, trap heat near the surface, while CO2 provides radiative cooling at the top of the atmosphere.”
“The 15 um band is due to vibrations, not rotations.”
You then will have to come up with a molecule in STP air that has only vibrations alone not rotations 15 micron band.
It is the vibration-rotational band of CO2 in air (no permanent dipole) near 15 micron that is a major player in the global warming scenario.
As a consequence of its permanent dipole moment, though, a rotating water vapor molecule radiates (emits). From 4 micron to 1mm absorp_tion by water vapor, with contributions from carbon dioxide and ozone, is often so strong that air transmissivity is nearly zero over broad ranges within this region. One important exception is 8–12 micron, where transmissivity often exceeds 0.6. Emission by Earth peaks in that region, often called the “window region” because transmission of radiation from at/near the surface is high.
N2,O2 air molecules rotations also contribute a bit of opacity due their huge amount over the full depth of air.
Spectroscopy is the science of details, not sound bites here if you want more understanding, as Herzberg’s treatises fill 581 pages for diatomic molecules, 538 pages for polyatomic molecules.
“A small amount of the radiation leaves directly, because all gases in our air are transparent to IR of 10-14 microns”
No. Look at a detail spectrum surface viewed from space, transmissivity is not 1.0 in band 10-14 microns.
The bulk gases of the atmosphere in air are only in part warmed by conduction and convection from the surface, they are also warmed by solar radiation and release of enthalpy of vaporization (condensation), and in certain cases clouds.
No, the bulk gases, O2 and N2, cannot trap heat. The walls of ordinary houses are opaque like atm. air in some bands, and no critical, informed author writes that they “trap” heat. You can demonstrate for yourself just exactly what house walls do by opening all the doors and windows of your house on a cold and blustery winter day. The walls “trap” just as much heat as when the house was shut tightly, but now the furnace is heating the great out of doors.
;No. Look at a detail spectrum surface viewed from space, transmissivity is not 1.0 in band 10-14 microns.”
The author of my last comment (it’s not me, I merely quoted his words) was just referring to the atmospheric window. Define it how you like.
“No, the bulk gases, O2 and N2, cannot trap heat. The walls of ordinary houses are opaque like atm. air in some bands, and no critical, informed author writes that they “trap” heat.”
Well, plenty of authors that are supposedly critical and informed have previously written that CO2 “traps” heat. The author of the comment I quoted was merely noting that out of greenhouse gases and O2/N2, its O2/N2 that are involved in a pathway with the most significant delay in cooling. So they “trap” heat more than CO2 does.
DREMT ponders: “What molecules are actually retaining the heat in the atmosphere … ?”
BOTH the CO2 and the bulk of N2 & O2 are involved. It is not an “either/or” proposition.
As an analogy (and no analogy is perfect), consider a conveyor belt, where people watch for defective parts and transfer them into a storage bin. What is responsible for ‘retaining’ the defective parts.
* Is it the people who pull them out in the first place?
* Is it the storage bins where the defective parts are kept?
Of course, both are involved. CO2 catches some of the IR energy as it is being conveyed to space. From there, energy is transferred to the N2 & O2. The analogy would need a lot of tweaking to describe the next steps, but you have to understand the intertwined contributions of *both* CO2 *and* the bulk of the atmosphere. Arguing that only one or the other matters is simply wrong.
Good job I didn’t argue that, then. Thanks anyway, Tim.
Ball4 says: “It is the vibration-rotational band of CO2 in air (no permanent dipole) near 15 micron that is a major player in the global warming scenario.”
Your original comment mentioned only the rotational energy, not the vibrational energy. I was pointing out this significant oversight.
* The *existence* of the band at 15 um is due to *vibrational* energy levels. This is the defining feature of this band.
* The *width* of the band is due to (among other factors) rotational energy levels.
So I agree that the lack of permanent dipole is important.
I agree that rotations are also a part of the story.
The *key* plot point in this story, however, *is* the vibrational mode. The plot below illustrates these features, for those who understand the physics involved.
http://www.barrettbellamyclimate.com/userimages/CO21M.jpg
Thumbs up for your 1) 2) 3) (the latter was missing) DREMT.
Feel free to use them against me anytime (except for delay/trap semantics).
Cool graph Tim. Does doppler and pressure broadening raise the humps on either side of the spike or flare them out wider?
Not mine, Svante.
Aha, I see.
Yes, well done. It’s not difficult to see, since I clearly explained at the time I wrote the comment out that it was a copy and paste of somebody else’s words. I wouldn’t want to take credit for somebody else’s remarks, you see. Sorry, I forgot…you already see.
I don’t think CO2 has any rotational bands because of its symmetry.
“I don’t think CO2 has any rotational bands”
Sure it does. Anyone who has studies this topic knows that. Any textbook on the quantum mechanics of atoms/molecules will explain that. Google will point you to any number of links.
Why post personal opinions about basic, well-known scientific facts?
“Your original comment mentioned only the rotational energy, not the vibrational energy. I was pointing out this significant oversight.”
In the troposphere, the rotational quantum energy level jump by photon interaction with the molecular rotational-vibrational 15micron CO2 band is the major player in global warming scenario as order of 10x the photon energy is needed (which is very rare in the troposphere) to jump the vibrational quantum energy level rotational-vibrational 15micron CO2 band, there was no oversight in my original comment seeking to better bdgwx 8:17pm comment as requested “if someone notices an inaccuracy or better way to explain it please chime in.” It is always possible this interests commenters to dig into the research experimental details and improve their comments.
I observe this level of detail is rarely written up in these comments and continues to be a source of misunderstanding & error as few read the details in a treatise on atm. radiation, look at experimental results and write consistently with them; even after that few write precisely about the detail driven science of optics.
“So they “trap” heat more than CO2 does.”
Ugh. DREMT, neither trap “heat”, the windows of the house are open. In any event, in the science of optics, not the MSM, there is no kind of entity “heat” which “they” or CO2 can “trap”. Or show experiments supporting your opinions that an entity “heat” can be “trapped”.
Pretty sure I made it clear that I didn’t think heat could be “trapped”.
Ball4, I think you still have some misunderstandings.
In the spectrum I posted earlier, the sharp peaks were a little less than 2 cm-1 apart, or about 0.6 cm wavelength, or about 6000 um (in the far IR). This is also 5e10 Hz or 0.0002 eV.
These are the energies specifically for the rotational energy quantization. These are tiny energies.
The vibrational states are the source of the 15 um location, which is ~ 0.08 eV or about 400 times the energy of the rotational levels.
Basically there are a bunch of possible transitions with energy 0.08 +/- (n x 0.0002) eV.
Rather than “the rotational quantum energy level jump by photon interaction with the molecular rotational-vibrational 15micron CO2 band is the major player”
The correct description is “the rotational quantum energy level jump is a MINOR adjustment to the VIBRATIONAL energy level. The rotational-vibrational 15 micron CO2 band is the major player, which is >99% due to 1 quantum of vibrational energy and <1% adjusted by rotational energy quanta."
Perhaps that is what you meant, but it didn’t come across that way to me.
Tim 7:17pm, as I noted a thorough discussion of the CO2 polyatomic molecule et. al. rotational-vibrational spectral transitions could take 500+ pages, not going to happen here.
My limited original intent in this sub-thread was to improve on bdgwx’s comment in that non-permanent dipole CO2 rotational quantum energy level jumps are much lower energy level steps than the first excited vibrational level step above base of the CO2 bending mode which takes way more photon energy to excite. Thus rotational transition emissions of this IR active molecule are way more common in the troposphere.
At what temperature, pressure is the CO2 gas held for the fractional absorp_tion v. wavenumber chart showing almost completely opaque at 1 meter path length you linked? This could not be for air at earthen STP.
Ball4, My limited original intent in this sub-thread was to further improve on your commment.
Induced dipole moments are not the primary factor for the important IR properties of CO2.
Rotational energy levels are ALSO not the primary factor for the important IR properties of CO2.
The 15 um IR band is the important factor for CO2’s impact on global warming. The 15 um wavelength is determined by 1 quantum of vibrational energy of a CO2 molecule. That 15 um band simply does not exist unless vibrations are involved. The small rotational energies that occur WITH the vibration broaden the band, but they are a minor perturbation to the essential vibrations of the CO2 molecule.
Tim,
So which bands are rotational?
http://users.physik.fu-berlin.de/~essenber/Dateien/VersucheChemie/rotvib.pdf
I searched for “primary factor” phrase which is only found as Tim’s words. Tim has not as yet further improved on my comment wording. It may still be possible to do so as I’m just invoking earthen atm. radiation 101 basics.
[sigh] The link explains it rather well, so you all can read it for the details. There are plenty of other explanations around.
If there are specific things in the link you don’t understand, you could ask me or the author for specific explanations.
In the meantime, another quick recap of the critical ideas.
1) The *location* of an IR band is due to vibrational energy. CO2 has asymmetric stretching and bending modes that corespondent respectively to wavelengths of 4.25 um and 15.0 um; and energies of 0.29 eV and 0.08 eV
There are no purely “rotational bands” so the answer to “So which bands are rotational?” would be “none”.
2) The *structure* of the band depends on rotation. The details are a bit complicated, but the net result is a large central peak corresponding to 1 quantum of vibrational energy, and then a series of smaller peaks on each side of the center corresponding to 1 quantum of vibrational energy +/- some rather smaller units of rotational energy.
So the ‘primary factor’ is the vibration, which determines where the band is located. A secondary factor is the rotation, which results in a perturbation around this location and broadens the peak.
“There are no purely “rotational bands” so the answer to “So which bands are rotational? would be “none.””
The question was poorly worded. No “bands” but there are purely quantum rotational energy excited jumps above base shown, which one can verify in the 7:16am linked information. These are on the order of 1/10 the photon energy required to excite those of the vibrationals up 1 quantum level. An example is given, under certain conditions, at about 1/20th.
Tim still hasn’t identified the temperature, pressure used in his link. It is not for air.
Tim,
I’ve always seens CO2’s bands described as vibrational bands-that was my point. The small discrete rotational state differences are unimportant. I guess nice to study if you study quantum mechanics.
Have I over simplified this? Yes. Tell me why I cant do this for a quick estimate.
——————————–
You are moving in the right direction but you cannot compare conductivity of pure CO2 gas where all the molecules of the same behaving gas are tightly packed together , to a diluted mix of air where each molecule of CO2 gas is surrounded by a million molecules of something else.
In other words you are trying to add apples and oranges.
I can’t believe what I’m hearing. You guys honestly expect me to believe that CO2 is a factor of 100 times less able to transfer energy? Don’t you realize that energy will take the path of least resistance forward? CO2 only makes up a fraction of the atmosphere. We are not destroying the other particles in the atmosphere. Sure as energy flows to CO2 particles the transfer of energy is slowed, but these particles are transferring heat back to other molecules all the time and the energy is set free. That is why using the conductor ratio + changes in CO2 concentration makes sense. The energy is never locked into the CO2, that is ridiculous. A simple experiment with a copper wire may help. Take a copper wire 0.5mm^2 with a given insulation thickness. Now increase the insulation thickness by 52%. Increase it 100%. Increase it 1000%. The wire hasn’t burned up yet has it. Expecting the mode that the energy is transferred to change because the insulation is thicker is ridiculous. Electrons will always take the path of least resistance. You can not block this energy flow by a factor of 100 by increasing the insulating portion of a system.
This comment was directed at bdgwx, Norman, not you Eben.
All I can say Eben is that I’m trying to be fair about CO2, man made gases. They should in fact make a small difference despite the low concentration. I’m trying to get to the bottom of this situation because as you might know, proxy data, recorded data has not been tied to Co2 concentrations at all. Just like the performance of a copper wire does not depend much on the insulator, the performance of earth’s atmosphere does not depend much on the insulator… especially noting that the insulator is only making up .04% of the atmosphere, of which ~.01% was put there by humans.
They should in fact make a small difference despite the low concentration.
Let’s see your calculation the specifies “small.”
Go away, David.
Yes. Near 15um CO2 is at least 100x (and likely far higher) more effective at impeding the flow of heat than O2 and N2 molecules. Note that 15um is a part of the spectrum that is in the atmospheric window. And again…the atmospheric window is the part of the EM spectrum that currently has a free path for radiation to escape to space.
bdgwx,
But CO2 and other air molecules are constantly interacting with each other transferring energy. If convection is slowed by 100x like you say, the energy will be transferred using the most efficient method, in this case conduction. Path of least resistance. What ever energy transmitting method is the most efficient will dominate the energy flow.
The heat can never build up because the energy is constantly being transferred and moved away from the sparse CO2 molecules.
He didn’t say convection is slowed by 100x. Greenhouse heating is about *radiative* transfer….
I didn’t say either convection or conduction was slowed 100x. I said the effectiveness of radiation escape to space was slowed by at least 100x (in reality its much higher than this even) by CO2 as compared to O2 and N2 for the crucial 15um band. Also, the Earth does not lose any heat to space via convection anyway. In fact, convection does not routinely cross the tropopause boundary into the stratosphere even. It’s primarily a troposphere phenomenon.
Bdgwx if the other energy transfer types are so restricted, why would there be any doubt that the energy is transferring from co2 to other molecules via conduction? Are you going to give me a reason now why co2 can not conduct heat? Anyways, looking up values from testing and applying it to this situation seems to make sense. I can not believe that co2 would be a better insulator than air by a factor of 100. It does not pass the Scott R sniff test looking at the test tables.
CO2 does conduct heat. It also participates in convection like N2 and O2. But, unlike N2 and O2, CO2 also blocks infrared radiation. It is infrared radiation that is the primary mechanism by which Earth loses heat to space. And there is a lot of IR to block; about 390 W/m^2 of it from the surface. 40 W/m^2 of that is part of the atmospheric window which has a free path to space. CO2 closes off part of that free path and it does so with many orders of magnitude more effectiveness than N2 or O2. And then on top of that CO2 provides a pathway by which the heat being conducted from N2 and O2 can be converted into DWIR and returned back to the surface. And air (meaning N2 and O2) in general isn’t that great of an insulator. First, it prevents a lot of sunlight from reaching the surface. And second, it provides an interface by which conduction and convection can remove it from the surface.
https://www.allphyscon.ch/wordpress/wp-content/uploads/Allmendinger_Behaviour-of-Gases_IJPS.pdf
bdgwx,
Let me give you the example of the simple circuit again. Suppose you have a circuit with 3 resisters in parallel. Each resister represents a mode for energy to escape from the earth’s atmosphere. Now suppose you increase the resistance of one of the resisters by 100x. What happens? The current thru the other 2 resisters actually increases. This is no different that the earth. The energy will take the path of least resistance, and actually increase to make up for the higher resistance. Changing one resistor of the 3 by 100x (if that is even true) does not mean that the heat generated by the system goes up by 100x, or anything like that.
There are just too many ways for the energy to transfer from CO2 back to other molecules and still escape to space.
Allmendinger wrote some further commentary on his experimental results (Norman should like this, as he always stands by experiment):
“It is the topic of the here reported author’s work [Allmendinger, 2016] concerning thermal measurements instead of spectroscopic ones…delivering the evidence that any gas ab.sorbs IR-radiation – but in the short wavelength range – with the consequence that air is warmed up by direct solar insolation – as well as by artificial IR-light – up to a limiting temperature due to radiative emission, and leading to an equilibrium state…
…the here reported investigation reveals the discovery of direct absorp.tion of shortwave IR-radiation by air. It is part of the incident solar light, but also of artificial light which enables a more exact detection. It is caused by another effect than the one which is responsible for the longer-wave absorp.tion being observed at carbon dioxide, and it is not detectable by IR-spectroscopy since its absorp.tion coefficient is too low. However, it is clearly detectable by means of the here applied apparatus leading to a distinct temperature elevation up to a limiting temperature which depends on the radiative emission. The limiting temperature depends on the gas kind, whereby practically no difference between air and carbon-dioxide could be found.
Nevertheless, that direct absorp.tion effect [shortwave IR] which was discovered thanks to this method probably contributes significantly to the warming up of the atmosphere while the warming-up due to carbon-dioxide can be neglected.“
The comment about the effect being “not detectable by IR-spectroscopy” is significant…as Allmendinger’s experimental result ties in with Blair Macdonald’s work on Raman spectroscopy:
https://www.researchgate.net/publication/328927828_Quantum_Mechanics_and_Raman_Spectroscopy_Refute_Greenhouse_Theory
DREMT,
Interesting. Thanks.
Allmendinger invents his own particular version of GHE definition:
“According to the greenhouse theory, the absorp_tion of IR-radiation is solely due to greenhouse-gases such as carbon-dioxide or water vapour but not to pure air since thereto no spectral absorbance had been observed.”
which Allmendinger, who does not define composition of his “pure air”, then stabs:
“As a consequence, in the absence of such greenhouse gases, the atmosphere would be expected to absorb no IR-radiation at all.”
That is not the generally accepted GHE. In the absence of greenhouse gases (Allmendinger term) Earth’s N2, O2 atm. would still absorb/emit IR radiation. Thus, this paper is unreliable, any unnamed peer reviewer (outside the Allmendinger-paid editorial board) is very suspect.
Allmendinger: “Tyndall did not detect any adsorp_tion by pure air”
Adsorp_tion? Wrong field. Tyndall detected IR absorp_tion by dry air vs. a near vacuum & lab air vs. a near vacuum.
Allmendinger also cites Barrett 1995 who writes: “excited carbon dioxide and water molecules being de-activated mainly by the emission of fluorescence radiation at all altitudes.”
Thus Barrett’s GHE is due to “fluorescence” meaning matter illuminated by light in visible or near visible not infrared. Fluorescent whiteners are added to laundry detergents to make clothes visibly “whiter than white” (“When I’m watchin’ my TV and a man comes on and tells me how white my shirts can be”) and to white paper to make it brighter.
A peculiar collection of minor gripes, nit-picking, smearing, and general fluff from fluffball, who clearly has no criticism of the experiment, or any alternative interpretation of the results to offer.
“More fluff from fluffball. Nothing new”, as his intellectual and moral superior used to say.
Scott, that is actually a rather effective analogy — for explaining why GHG’s warm the earth!
“Suppose you have a circuit with 3 resisters in parallel. Each resister represents a mode for energy to escape from the earths atmosphere.”
The three modes for energy to escape from from earth are
1) IR from the surface to space
2) IR from clouds to space
3) IR from GHGs to space
“Now suppose you increase the resistance of one of the resisters by 100x. What happens? The current thru the other 2 resisters actually increases. ”
This is true for a constant current source, but not for the more typical constant voltage source. Fortunately, constant current is a better model here. If one resistor increases, the voltage will increase until the same original current is restored.
Current flow is analogous to heat flow. There is a (relatively) constant 240 W/m^2 getting ab.sorb.ed by the earth, and a (relatively) constant 240 W/m^2 getting emitted by the earth.
Voltage difference would be analogous to temperature difference. If one of the three heat dissipation modes becomes less effective, the temperature increases until the heat flow is restored (but with a higher steady-state temperature now).
“The energy will take the path of least resistance, and actually increase to make up for the higher resistance.”
Yep! When the ‘resistance’ for path #3 increases by adding more GHGs, the others will indeed take up the slack — by increasing the surface temperature to drive larger amounts of radiation from the surface!
“no criticism of the experiment.”
None is warranted. The experiments found “limiting states are due to equilibria between absorp_tion and emission rates” which once again proves out the 1LOT consistent with 2LOT.
The experimental conclusion: the limiting temperatures of air, pure carbon-dioxide…were nearly equal while the light gases neon, and particularly helium, exhibited significant lower limiting temperatures is reasonably expected due ratio of specific heats (commonly symbol gamma) for atomic gases is 1.66 while for nitrogen and oxygen about 1.4 appreciably less.
The source of that experimental finding is the internal structure of the polyatomic molecules.
“More fluff from fluffball. Nothing new.”
Tim Folkerts,
I’m glad you like my analogy… but you missed my point (I’m assuming on purpose) You can not make all 3 resisters in parallel IR.
Let’s level up the analogy. Pretend for a moment that you have 30000 resistors in parallel. Each resister represents one of the 3 types of energy flow for each 100 ppm of the earth’s atmosphere. Now, take 1 of those 30,000 resisters and eliminate it, creating an open circuit. Infinite resistance due to man made CO2 for 1 out of the 30,000 resisters. What happens to the heat generated by the system? Almost nothing. lol
Tim,
Or are we adding resistor # 30,001 with infinite resistance to the earth system by adding more CO2 to the atmosphere? I mean, we aren’t replacing air, we are only adding to it.
Scott,
You will have to clarify what your resistors represent in your analogy.
You said “Each resister represents a mode for energy to escape from the earths atmosphere.” I took that to mean energy escaping from the top of earth’s atmosphere to space.” Using that interpretation, then every mode MUST be IR. There is no convection or conduction to space!
Your discussion now makes it seem like you might be considering conduction, convection and radiation. It also seems like you might be considering energy escaping the atmosphere to places like the ground or the oceans. Or maybe energy escaping from the each type of gas to space.
I am really not sure. So until you explain your analogy (like I explained mine), I can’t really try to interpret your analogy. For example, are you dividing the atmosphere into 10,000 regions that radiate to space? Are you dividing the atmosphere by type of gas, so there are ~ 7700 “IR resistors” for Nitrogen, 2100 “IR resistors” for oxygen, 4 “IR resistors” for CO2, etc?
“…but you missed my point (I’m assuming on purpose)”
They’ll just say anything, Scott. An experimental result is a game-changer, they just pretend it was expected. They’ll argue for weeks that with a ball on a rope, the rope cannot generate a torque about the axis of the ball, then when they realize that refutes their own position, they just switch to arguing the exact opposite, that the rope can generate a torque. They’ll even argue that angular momentum is not a quantity of rotation. There’s absolutely no limit to what they’re prepared to say in order to defend the status quo.
Professional sophists like Tim and Ball4 have devoted their entire lives to lying about the GHE on blogs, and they know every trick in the book. It’s just not worth wasting your time. All that ever needs to be said to them is, “please stop trolling”.
Hi Drempty,
You say
“Nevertheless, that direct absorp.tion effect [shortwave IR] which was discovered thanks to this method probably contributes significantly to the warming up of the atmosphere while the warming-up due to carbon-dioxide can be neglected.”
However, in order to contribute to the warming by the shortwave IR mechanism, the concentration of N2 and O2 in the atmosphere would have to change.
Sorry Charlie, no change in those concentrations.
However, the concentration of CO2 is changing and thus is contribution to the warming.
Way to miss the point, blob.
Nope point not missed,
The effect of IR on Oxygen and Nitrogen is dwarfed by the effect of IR on CO2.
The absropt.ion of IR by Oxygen and Nitrogen is on the order of a billionth of the absropt.ion of IR by CO2.
you just don’t understand that you are not making a point and therefore your conclusion is wrong.
Sorry Charlie.
But you always say I miss the point when I bust your explanations.
Same old story.
I can only assume you have not read the paper.
Drempty you would be wrong,
It’s nothing new, I have known O2 and N2 abzsorb and emit in the infrared range since before that paper was published, it isn’t worth a pack of Ramen noodles.
Maybe you could show me where in that paper it supports the notion that O2 and N2 abzsorb more IR than CO2, that would indeed be groundbreaking.
On second thought, less than a pack of Ramen
“No experiment as such was undertaken, but rather a first principles review of literature, theory, application, and instruments with respect to the hypothesis.”
The Allmendinger paper is the experiment. The Macdonald paper is the literature review.
No wonder you’re confused.
“One of greenhouse theory’s key premises – N2 and O2 are not greenhouse gases as they do not emit and absorb infrared radiation – presents a paradox” – Macdonald
There is no such key premise “paradox”. Together atmospheric N2 and O2 amount to 15% of the OLR-reduction caused by CH4 at present atmospheric concentrations.
“However, in order to contribute to the warming by the shortwave IR mechanism, the concentration of N2 and O2 in the atmosphere would have to change”
This comment missed the point, because Allmendinger’s discovery that air can be directly warmed by the SW IR from the sun, rather than needing to be warmed via collision with GHGs, challenges our entire understanding of the Earth’s energy budget. Nobody is suggesting the concentration of N2/O2 in the atmosphere has changed, or would need to change, for this discovery to be significant.
“The effect of IR on Oxygen and Nitrogen is dwarfed by the effect of IR on CO2.”
This comment missed the point, because what you describe is the current understanding we have via IR spectroscopy, regarding which Allmendinger notes:
“[the SW IR warming] is caused by another effect than the one which is responsible for the longer-wave absorp.tion being observed at carbon dioxide, and it is not detectable by IR-spectroscopy since its absorp.tion coefficient is too low.”
…and from there we move on to the Raman spectroscopy, the Macdonald paper, as a possible further explanation of the observed SW IR warming effect.
I’m sure all this “missing the point” is deliberate, as Scott R observed. Thanks for proving my point about you all.
Tim Folkerts,
In my analogy of 30,000 resistors, each resistor represents 1 mode of energy transfer for each 100ppm of the atmosphere. 100 x 10,000 = 1,000,000, but I’m dividing each 100 ppm into 3 separate resistors for 3 different types of energy flow.
Bottom line, changing 1 resistor to near infinity to make up for man made gases in a 30,000 resistor set isn’t going to do much, in the same way removing 1 resistor completely wouldn’t do much.
DREMPTY,
This has all been discussed before, you didn’t understand it then, and you don’t understand it now.
Too bad you don’t understand Allmendinger didn’t do an experiment investigating the greenhouse effect, maybe he could try again.
I am a true skeptic, so “Therefore, the greenhouse theory has to be questioned.” I have no problem with that.
Both papers lack any investigation into the greenhouse effect.
Scott R: I mean, we aren’t replacing air, we are only adding to it.
To be pedantic we are replacing O2 with CO2. When fossil fuels are burned they release C which then bonds with O2. This is why O2 ratios are declining slightly. Not that it matters all that much for this discussion though.
“This has all been discussed before, you didn’t understand it then, and you don’t understand it now.”
I have not discussed these papers before.
“Too bad you don’t understand Allmendinger didn’t do an experiment investigating the greenhouse effect, maybe he could try again.”
I have been perfectly clear on what the experiment investigated, and the reasons for its significance.
Please continue to demonstrate that my point about you is correct. Thank you for your co-operation.
Scott, you still haven’t said what those 30,000 resistors connect *to* in your analogy. Do they connect the atmosphere conductively, convectively and radiatively to the surface? To space? To each other? All of the above? Something else?
Within the atmosphere there are certainly many paths for energy to flow — many ‘resistors’ to consider for transferring heat upward from the warm surface to the cool tropopause. Changing any one of those ‘resistors’ would indeed have minimal impact on the ability of the atmosphere to transfer heat.
But from the atmosphere to space, there are suddenly dramatically fewer ‘resistors’ available. No conduction or convection, so those resistors become effectively infinite. Then N2 & O2 do not radiate any appreciable IR, so those ‘resistors’ become infinite. Now we are down to ‘4 resistors’ for CO2 (and several more for other GHGs). Your network of 10,000’s of resistors has now had to join together and flow through just a handful of resistors to actually let heat escape to space.
THIS BOTTLENECK IS WHERE THE GREENHOUSE EFFECT MAKES AN IMPACT, not in the myriad paths that get to the top of the atmosphere. Minor changes in the paths leading to a bottle neck don’t change the flow; minor changes within the bottleneck itself change the flow.
“Then N2 & O2 do not radiate any appreciable IR, so those ‘resistors’ become infinite….”
“It was found the gases do possess quantum predicted emission spectra at 2338cm-1 and 1556cm-1 respectively, both within the IR range of the EMS, and these are only observed – and their respective temperatures and concentrations accurately measured – by Raman laser Spectrometers. It was concluded: using thermoelectric (IR) instruments alone constitutes a systematic error.”
DREMPTY,
There is an equation you can use to relate the temperature of a gas and the energy level of the vibrational state that tells you how likely gases are to emit infrared radiation.
And then you could compare how likely Nitrogen, Oxygen and CO2 are likely to act as greenhouse gases in the terrestrial atmosphere.
I am absolutely sure you have never heard of it.
You could prove me wrong.
Or you can keep blathering about how Nitrogen and Oxygen emit infrared, they do, just an insignificant amount.
“Or you can keep blathering about how Nitrogen and Oxygen emit infrared, they do, just an insignificant amount.”
Yes, that was the previous understanding.
And then, new information came to light…
DREMT: It was found the gases do possess quantum predicted emission spectra at 2338cm-1 and 1556cm-1 respectively
2338cm-1 -> 4.2um
1556cm-1 -> 6.4um
The one around 2340cm-1 is certainly known. I’m not aware of the peak around 1550cm-1.
Anyway, the thing is that 4.2um (2338cm-1) is in a part of the spectrum that has little flux either incoming or outgoing so the amount of EM being blocked is pretty low. Contrast this with 15um which has a large outgoing flux from the surface.
https://webbook.nist.gov/cgi/cbook.cgi?ID=C124389&Type=IR-SPEC&Index=1
https://i.imgur.com/fgmdY4w.jpg
DREMPTY,
And then, new information came to light
Do tell where you got this marvelous new information because it’s not in the two papers being discussed.
Cause like if you stand out in the sunlight you can feel the heat from the infrared, but then the sun goes behind a cloud and then you don’t.
I’m sorry to have been the bearer of bad news. Try not to take it all out on me.
Nope, you are not the bearer of bad news.
Just poppy-cock, irrelevant to climate science.
As an attack on the greenhouse effect it was pitiful.
Poor poor pitiful you.
OK, blob. Perhaps you could stamp your feet while you say it, too. That might help.
I won’t insult anyone’s intelligence by bothering to point out what’s wrong with bdgwx’s comment. I assume everyone can work that out on their own.
If I’ve made a mistake or worded something inadequately then please let me know. It’s more important for me to understand how things really work than to maintain a false pretext of being right.
Seriously?
OK.
“…the thing is that 4.2um (2338cm-1) is in a part of the spectrum that has little flux either incoming or outgoing”
As measured by?
4.2 um is shall we say, between the boobies as shown by this graph.
in this paper found here
https://www.researchgate.net/publication/282393775_The_climate_system
Dr Roys Emergency Moderation Team
The facts are that Raman scattering is very low intensity. It is warming nothing.
https://tinyurl.com/y4gflz6l
From the article: “The vibrational energy is ultimately dissipated as heat. Because of the low intensity of Raman scattering, the heat dissipation does not cause a measurable temperature rise in a material.”
Sorry the researcher on Raman scattering did not investigate his topic at enough depth.
Of course he did, Norman.
The question re: the Raman spectroscopy is, could the “effective emission height” be affected by the ability of N2/O2 to radiate in these spectra? Future measurements could show this.
The SW IR warming effect as shown in the Allmendinger experiment would mean the energy budgets need a rethink, too. It’s a reproducible experiment, Norman, I’m sure you’ve got nothing bad to say about that. Right?
Dr Roys Emergency Moderation Team
N2 and O2 radiate in the IR bands through complex molecular arrangements (not as individual dipoles, no charge variation so the vibrating molecule does not have a changing electric field). Raman scattering is very small and would not significantly affect anything.
The energy is not there. It is a good tool to for Chemistry to detect things but as a source of cooling from atmospheric emission it is very small indeed. Maybe read the quoted material I took from the article I linked to again.
I will try to read the other article at some point. I think I scanned it at some point.
You’re all just on “dismiss, dismiss, dismiss…” duty. The fact is, until the measurements are actually made, you have no idea.
It’s also funny that you think that in your five minute google-search you have discovered something the author was unaware of.
This issue is not going to be settled in the comments here. Sorry, Norman.
DREMT, solar spectral radiance peaks at 10.0um. 4.2um lies in between on the tail ends of the spectral radiance curves of the two.
That should have read solar spectral radiance peaks at less than 1.0um while Earthly spectral radiance peaks at greater than 10um.
As measured by IR spectroscopy…
Meanwhile, Norman is making the mistake discussed in Section 2.3 of the paper on page 15, “No Confusion between Raman Spectroscopy and the Raman Effect”.
The aim of you people is to keep making comments until I stop responding…until I give up, basically. I’m not the author of either of these papers. If I were to stop responding, and you guys were to keep bringing up your talking points, that doesn’t mean this is settled.
I can’t spend day after day defending these papers against all and sundry.
If you really care, contact the authors and bring it up with them.
Independent Thought Alarm blaring, the Greenhouse Effect Defense Team arrive en masse, to stamp out any dissent from their beloved religion…
I wonder which of the many completely different definitions of the GHE they will defend this time (they will probably switch between them, as necessary)…
Your team ignores the evidence.
I don’t have a team, David. There was about four of us here who regularly stated the fact that there’s no GHE. Two got banned simply for holding that position.
You got banned, too. Off you pop now, David. Enough’s enough.
Another good one from Heller:
https://www.youtube.com/watch?time_continue=136&v=8455KEDitpU
People who lie for Internet fame are a real problem.
Yet here you still are.
Like I said , you throw the creep out the door he comes back through the window , you throw him out the window he crawls back through the chimney
SPA, Yeah, another good example of cherry picking from Heller.
He points to temperature data for a single site, selected from the USHCN network, claiming the raw data “proves” something. Well the Waverly data is from a succession of different locations, beginning in 1883, which is typical for the data from volunteers of the period. There were 6 different observers from 1883 to 1945, then one from 1945 to 1972, at which time the site was moved from town to a site located out at the water treatment plant down by the Scioto River. Along the way, there were other changes, such as changes in time-of-day for reading the instruments, which introduces biases in the data set.
This is just another example of the old tricks by the Idso’s and others who think “raw” data gives the correct picture of climate change.
I think you just supported Heller’s point.
“In Minnesota, North Dakota, South Dakota and Wisconsin, corn harvested is at less than 3%. Those same four states are also substantially behind in soybeans harvested, with North Dakota at just 8% compared to its five-year average of 48%.
And now comes an expected snowfall for that area.”
ren,
The meridional jet stream flow squeezed farmers in the US with a cold, wet spring, now a snowy / cold fall. The FED can’t print food. The price of food is going to go up, and will keep going up until it gets so expensive that people start to farm. That’s the law of supply and demand. People everywhere do not appreciate the cold weather risks generations before us did because they have been so brain washed. Just imagine when our government has to tell people the price of food has gone way up because crops were lost due to cold, wet weather. They tried to change the narrative by changing global warming -> climate change, but people will hopefully realize the scam as food is a global commodity. If the cold is a local weather phenomenon only, why the food shortage right?
In two days the winter storm will reach the Great Lakes.
https://images.tinypic.pl/i/00990/kkl4cqpra7rs.png
Scott R, Global Warming is expected to lead to changes in climate. But climate is the statistics of weather, so for climate to change, weather must also change. But, as you suggest, there’s a natural component to climate, so the detection and attribution problem is separating the natural component from the anthropogenic component. I think it’s not at all clear exactly how much of any weather event is natural and how much is the result of AGW.
That said, we know for a fact that the Earth’s energy balance results in more solar energy entering the tropics than leaves the TOA and more IR energy leaves the Arctic TOA than the solar energy is received, each averaged over the yearly cycles. Those flows are balanced by transport between those regions via the atmosphere meridiona circulation and ocean currents. Warm air moving toward the Arctic cools and must return back to the south to complete the circulation loop. This process is strongest during the Winter half of the year, as evidenced by the occasional outbreaks of very cold Arctic air which we all know and love.
Adding in the possible reduction or relocation of the oceans poleward currents makes things more difficult to predict. If, as has been predicted (and found to be happening in some studies), the ocean THC slows, the atmosphere circulation must increase to balance the energy flows. I expect that increased weather variability will be one result, so food security may be expected to suffer, as you suggest. And, yes, that would be due to AGW.
E. Swanson,
But I think I proved with my study of SSW for instance that the heat is transferred to the poles faster due to lack of volcanic activity as well. The fact that strongest SSW events in the NH occurred during solar minimums, the fact that April – June have no SSW ever recorded, suggest this is sun driven, not a product of the heat content of the ocean.
Additionally, trade wind speeds are higher when TSI is higher. High speed polar vortex, trade winds keep the jet stream from getting loopy. Cooling causes the jet stream to do this in my opinion. Maybe this is another study I can think about.
Scott R, the frosty upper low (500 hPa) will form over the Great Lakes.
http://www.lightningwizard.com/maps/North_America/ani.html?0,gfs_,_usa12.png,cape,mucape,icape,layer,lfc,mulfc,el,icon10,omega,pvort,pvort2,difadv,kili,spout,lapse,lapse2,the700,thetae,mixr,mtv,gusts,stp,srh,srhl,pw,hail
Anthropogenic Global Warming Hypothesis causes nothing except Mass Delusion and the Madness of Crowds. That is because people listen to their gut instead of trusting the instruments and the data.
Curious.
As a scientist I was trained to trust the instruments and the data rather than my gut. On that basis AGW is the more likely than any of the other hypotheses.
…but you’re not a scientist, E-Man. Hence why you have the time to comment so extensively here.
E-man,
As a scientist to you trust mathematical proof and logic inference?
MINI AOC IS BACK!
https://www.youtube.com/watch?v=rVk3CHlL-NM
Blizzards in the northern US.
https://files.tinypic.pl/i/00990/9a8f0qo7v6q4.png
remember that DA was banned for saying that UAH was an outlier?
More evidence that he was right.
https://tamino.wordpress.com/2019/10/08/global-temperature-evolution-1950-to-2018/#more-10753
No, E-Man…I don’t remember that.
😂
October 4th 9.53pm
“Rule 2: UAH is an outlier,”
Five surface datasets and RSS average a 0.18C/decade warming rate and their 95% confidence lmits overlap. Evidence that they are measuring. The same thing.
The rate for UAH is 0.13C/decade and its confidence limits do not overlap with any of the others.
https://tamino.files.wordpress.com/2019/10/rates.jpg
Examine the temperature anomalies over time and you can see the reason. UAH reads consistently higher than the other datasets before 2000 and lower after 2000.
https://tamino.files.wordpress.com/2019/10/adj_dev_sat.jpg
UAH IS the outlier.
You are comparing surface data sets and satellite data sets?
Comparing anomalies, which should change in step whichever dataset you use, satellite or surface. If you use the same baseline you should see values and a similar rate of change over time.
Comparing raw surface and satellite data, you would expect the satellite data (which measures troposphere temperatures) to read lower than the surface data because of the 9C/km lapse rate.
Aren’t all those surface data sets sourced from the same stations?
same station data. Different datasets process the areas with poor station coverage differently.
UAH and RSS have a number of satellite sensors available. I’m not sure whether they use the same ones.
Keep going…
…David was not banned for saying UAH is an outlier.
I’m less interested in why he was banned than in the possibility that UAH is an outlier; and the scientific reasons why it is an outlier.
Great, so next time don’t start your comment, “remember that DA was banned for…”.
Banning is nothing much. I was banned by three denier sites before I learned subtlety.
Oh, that’s why there’s a majority of “warmist” regulars at a skeptic website…the lack of moderation here! That explains it.
UAH is the last data-set that hasn’t been retroactively falsified to show nonexistent warming
That’s right Eben, UAH is one of those that show warming.
Eben
The blog’s scanner didn’t accept the comment, here it is:
https://drive.google.com/file/d/1PRzS5e7Trr9o09xewtRMek-BA5MOQedu/view
Here’s my reply on Tamino’s site:
https://tamino.wordpress.com/2019/10/08/global-temperature-evolution-1950-to-2018/#comment-105565
Hilfe , Climate shysters are ganging up on me
https://youtu.be/bOHrYY3yAGE
Eben, Heller’s video claims that Carl Mears at RSS has fabricated data with his version 4 product in order to get continued funding for his work, casting Mears as a science fraud. This claim is not supported in any way, other than by showing a comparison between the old v3 with the new v4. The accuracy of the TLT product is entirely dependent on the process of combining the data from 13 satellites, including adjustments for orbit drift in LECT and decay, as well as adjustments for instrument changes, a process which is subject to considerable disagreement among the different groups that have analyzed the data sets.
In addition, he begins by showing a graph which starts in 1995 ends in 2015 before the El Nino in 2016, which is a well known trick by the denialist. Cherry picking the start data with the El Nino spike tilts the trend calculation to a lower value, whereas including the 2016 El Nino or beginning the calculation in 1999 would increase the slope calculation. The video is just another example of typical denialist BS posing as real analysis, which feeds more red meat to the rabid anti-AGW crowd.
And wasn’t RSSv3 the one that was using NWP models for their diurnal corrections which they changed and used a non-NWP model based approach for the same correction in RSSv4? It seems given the universal dislike of NWP models by skeptics that RSSv4 would have been a welcome change.
“The video is just another example of typical denialist BS posing as real analysis, which feeds more red meat to the rabid anti-AGW crowd”
http://www.drroyspencer.com/2019/10/record-antarctic-stratospheric-warming-causes-sept-2019-global-temperature-update-confusion/#comment-396271
See?
The twenty-four hour average neutrons in Oulu exceeded 6,800 counts.
That must be why I have been feeling the strange tingling all over in the last day
Circulation in the lower stratosphere indicates further attacks of cold air from Canada in the north-central US.
The problem with the temperature in the lower stratosphere during a minimum of solar activity is due to the increase in ionization by GCR in the lower stratosphere and upper troposphere. This increase in ionization is particularly visible in winter and is consistent with the geomagnetic field.
https://www.intechopen.com/books/current-topics-in-ionizing-radiation-research/atmospheric-ionizing-radiation-from-galactic-and-solar-cosmic-rays
The problem with the temperature in the lower stratosphere during a minimum of solar activity is due to the increase in ionization by GCR in the lower stratosphere and upper troposphere. This increase in ionization is particularly visible in winter and is consistent with the geomagnetic field.
http://sol.spacenvironment.net/~nairas/Progress.html
Below you can see a temperature anomaly in the stratosphere that occurred in January 2019 over the northern polar circle.
https://www.cpc.ncep.noaa.gov/products/stratosphere/strat-trop/gif_files/time_pres_TEMP_ANOM_ALL_NH_2019.png
North Atlantic plunges to -.334 below baseline.
https://www.tropicaltidbits.com/analysis/ocean/natlssta.png
The midwest continues to get lots of precipitation matching the +PDO -AMO pattern.
The driest year in Detroit MI was 2012, matching the multi-decadal arctic ice min, and the top of the AMO cycle. The last time it was that dry was the 1988 drought year.
Interesting that the record low snow totals matched record low rain totals for the Midwest. Perhaps high temperatures from CO2 did not cause the low ice coverage that year, and it was the peak of the +PDO +AMO that slowed snow fall.
Scott R, the drop in temperature in the Atlantic is associated with blocking circulation over northeastern Canada.
https://www.cpc.ncep.noaa.gov/products/precip/CWlink/blocking/real_time_nh/500gz_anomalies_nh.gif
ren,
That link isn’t working.
Sorry.
https://www.cpc.ncep.noaa.gov/products/precip/CWlink/MJO/block.shtml
ren,
Are you thinking that a blocking high pressure over eastern Canada forces the low pressure systems around and into the Atlantic which creates overturning? (negative AMO) That also should force the cold air to loop down between the mountains and the upper Midwest. When we have a high pressure centered more over the Atlantic, that should be a +AMO as low pressure systems are blocked from disturbing the waters. Do I understand this correctly?
So it is. Watch the animation below (updated every hour).
http://tropic.ssec.wisc.edu/real-time/mtpw2/product.php?color_type=tpw_nrl_colors&prod=namer×pan=24hrs&anim=html5
Blocking occurs in specific areas of the Pacific (Bering Strait) and the Atlantic. The weaker the solar wind, the stronger the blocking.
ren,
Interesting… that theory would explain why Alaska actually got warmer during the last GSM. If low solar activity strengthens the Pacific high pressure, that warms Alaska. That also sends very cold air from Canada into the US as the jet stream “bounces back”. It also explains why meridional jet stream flow is a function of cooling, not warming and co2. It makes sense that meridional jet stream flow should have a further long term cooling effect on the planet. It allows heat to be sent to the poles, in particular the north pole which doesnt have the strong southern ocean currents to defend it. It is like spreading out the coals in a fire pit. At first, there is a burst of heat, but then the fire dies.
Scott R, look at the forecast. This is jetstream level on 200 hPa. The jetstream runs along the edge of two different air masses. Air with ozone falls into the troposphere, air with water vapor is pushed up.
https://www.cpc.ncep.noaa.gov/products/stratosphere/strat_int/gif_files/gfs_o3mr_200_NA_f120.png
Blocking in the Atlantic is nothing new. See the temperature anomaly in Iceland in the winter of 1708/1709.
https://en.wikipedia.org/wiki/Great_Frost_of_1709
“This winter event has drawn the attention of modern-day climatologists in the European Union’s Millennium Project because they are presently unable to correlate the known causes of cold weather in Europe today with weather patterns documented in 1709. According to Dennis Wheeler, a climatologist at the University of Sunderland: “Something unusual seems to have been happening”.
Scott R, this time the air from Canada will hit the Great Lakes. This can be a surprise.
A Sneaky Bully has the biggest bully pulpit.
The Destructor or the Monster Trump:
https://www.youtube.com/watch?v=m7XZmugtLv4&t=310s
Plus:
[email protected]
Be Brave. Do Something.
God is Great.
Comedy Gold.
Going need 50 gallon drums of popcorn- buckle up!
Where my coffee?
Dr. Spencer, there may be an answer to Greta. Some teenagers are working to debunk AGW. You may want to try this experiment yourself and write about it in a blog post.
Teenagers catch NASA Concealing Data from Public
NASA Caught Withholding Data from the Public(Short)
https://youtu.be/9gqpD5QZm60
NASA caught withholding data! (not a conspiracy theory but a fact)(Long)
https://youtu.be/vEYKkKaQlWI
Original Document of Experiment
The Case of the Disappearing Data
https://co2islife.wordpress.com/2019/10/08/the-case-of-the-disappearing-data/
You might find the following publication regarding UHI useful.
http://static.berkeleyearth.org/papers/UHI-GIGS-1-104.pdf
In a nutshell…the UHI bias is negative from 1950 to present which is the period in which AGW is most acute. In other words, comparisons between rural vs urban stations suggests that the UHI bias is close to zero or possibly even negative.
Who needs data when you can cast the spell
https://youtu.be/nUb4MovqcBY
BDGWX,
I agree there has been warming. That’s why natural emission CO2 has increased.
bdgwx,
You can not be serious that UHI is negative. You can see this heat island effect show up every single day on the GFS model. I’ve studied this effect locally by taking various 2 weather stations pairs nearby to each other, and I studied the warming trend from 1980-2016. I’ve found that the trend for the airport (for the most obvious example) is 3x’s that of nearby Ann Arbor MI. Major metropolitan areas have much higher warming trends since 1980 than the closest station located outside city limits. I also experience the effect personally as I commute each day. Don’t you see this happening?
This is why Dr Spencer’s work is so important. UAH is a fair representative to what we actually have so that we can actually run the numbers, calculate forcers without UHI clouding the picture.
Scott R, Yes, the UHI effect is real. However, most of the US is not urban and the averages must be area weighted, thus the UHI isn’t going to have a large impact. Also, there’s the negative UHI effect to consider, as stations once located in urban areas before WWII were moved to airports out in the country afterward. Not to forget, in the early 20th century, the US area was covered by farmlands, but after the introduction of tractors and other mechanical devices, many smaller farms were abandoned and reverted to tree cover, which is much cooler in summer. Then too, on a global scale, land represent about 28% of the surface area, the oceans covering the rest and there’s no UHI in the ocean.
Your claim that “UAH is a fair representative to what we actually have” is subject to debate, for several reasons.
Why don’t you claim that RSS is similarly “representative”, since you (or anyone else outside the scientific community) can’t actually test the MSU/AMSU products for accuracy. For starters, the MSU instruments may not have been well calibrated before launch and none made it back to the ground in one piece for a calibration check. Those products must also be adjusted for various known problems and there may be other issues yet to be resolved. Lastly, the UAH products are based on theoretical models, that is, they are not raw data which the skeptics seem to think is the only source of truth.
E. Swanson,
UHI is a function of world population. You don’t have to have an official city for their to be an effect. Unless population reverses and starts declining, UHI in no way, shape or form has the ability to decrease. Even if we build up, taller buildings will still create more heat than shorter buildings. You will note the shadow for a tall building is much larger than that of a shorter building. So more chance of solar rays hitting cement instead of grass and trees.
You could even argue that these UHI are having an impact on the heat content of the ocean as more warm air blows off of places like New York out into the ocean. The equilibrium will naturally move, and the oceans will hold more heat due to UHI.
As for UAH vs RSS, Dr Spencer has posted comparisons before and is far more qualified than I am to comment on why one is better than the other. I can tell you that on the VERY FIRST MONTH of the datasets, RSS was 0.1 deg c warmer. So the initial calibration might be part of this. That 0.1 c difference remained pretty much until around 2000 when RSS departed from it’s typical match +.1 to UAH, and by 2008, it had found it’s new comfort zone about 0.3 deg c warmer than UAH. Now look at what HADSST3 was doing from 2000-2008. It was making a slightly lower low. So yes, UAH is more accurate, RSS was adjusted higher both from the start and from 2000-2008.
UHI is positive, but dUHI is zero or possibly negative after 1950. That is what is being claimed in the publication.
E. Swanson,
I plotted HADSTT3 – UAH vs HADSTT3 – RSS and took the linear trend of both datasets.
HADSTT3 – UAH
y = 0.0006x-1.0274
(UAH -.024 40 year error possible)
HADSTT3 – RSS
y = -0.0069x + 13.925
(RSS +0.276 40 year error possible)
Now do you get it? RSS can be used to get an idea of what is going on, but it is worthless for absolute values. RSS is a full order of magnitude less accurate.
Scott R: UHI in no way, shape or form has the ability to decrease.
The question BE was trying to answer was is the UHI bias increasing? Their conclusion was no. Remember, the UHI bias can be positive, but if it isn’t increasing then it does not bias the warming trend high.
Anyway, the UHI effect on the warming trend can decrease even if urbanization itself increases. One obvious way for this to happen is if urban stations decline relative non-urban stations.
bdgwx,
Think of it this way. Say you are talking about a 100% completely developed cell of land. That I agree, can have a positive heat island effect, but then the warming trend becomes flat.
The trend in a unit area is a function of the % developed. As long as we are developing new areas, you will have a heat island effect in the global data set contributing to the positive temperature trend.
Interestingly, as the suburbs AROUND a completely developed city are developed, the city also trends higher as the energy has a spilling over effect.
Temperature anomalies of the lower stratosphere above the southern polar circle have reached tropopause.
https://www.cpc.ncep.noaa.gov/products/stratosphere/strat-trop/gif_files/time_pres_TEMP_ANOM_OND_SH_2019.png
No testable GHE hypothesis yet?
“The Greenhouse Effect!”
☺️
Never stops being funny.
Here it is
https://notrickszone.com/2019/10/17/physicists-co2-molecules-retain-heat-just-0-0001-of-a-second-meaning-co2-driven-warming-not-possible/
Oh, that reminds me of the research by Dai Davies, which says basically the same thing:
http://brindabella.id.au/climarc/dai/RadiativeDelay/RadiativeDelayInContext170828.pdf
Theres a paper fundamentally challenging the GHE out every other month these days, it seems.
石器私服一条龙制作www仙境1u开区一条龙服务端ROһ<a href="http://www.81uv.com客服咨询w.81uv.com-ͷѯQQ915515538-Email:[email protected]