
 Home/Blog
Summer and early Fall are fire season in California. It has always been this way. Most summers experience virtually no precipitation over much of California, which means that the vegetation that grows during the cool, wet Winter becomes fuel for wildfires in Summer.
When you add the increasing population, risky forest management practices, and lack of maintenance of power lines, it should be little wonder that wildfire activity there has increased.
Few news reports of wildfires can avoid mentioning some nebulous connection of wildfires to human-caused climate change. This is a little odd from a meteorological perspective, however.
First of all, most of the historically significant wildfire events occur when COOL and DRY Canadian high pressure areas move south over the Great Basin region, causing strong downslope easterly winds (Santa Ana winds, Diablo winds). Global warming, in contrast, is supposed to result in WARMER and MOISTER air.
Secondly, the argument I’ve seen that excessive vegetation growth from a previous winter with abundant precipitation produces more fuel is opposite of the observation that fewer wildfires typically follow an unusually wet winter in California. They can’t have it both ways.
You might ask, why do SoCal temperatures sometimes rise so high before wildfire events if the source of the air is “cool” high pressure? It’s because the cooler high-altitude air over the Great Basin warms by compression as the air descends down the mountain slopes. Almost without exception (i.e., a super-adiabatic lapse rate), air at a higher altitude that is forced to descent to a low altitude will have a warmer temperature (and lower humidity) than the air it is displacing at low altitude. (While the warmth and dryness is widespread during these events, the high winds tend to be more localized to canyons and downslope areas.)
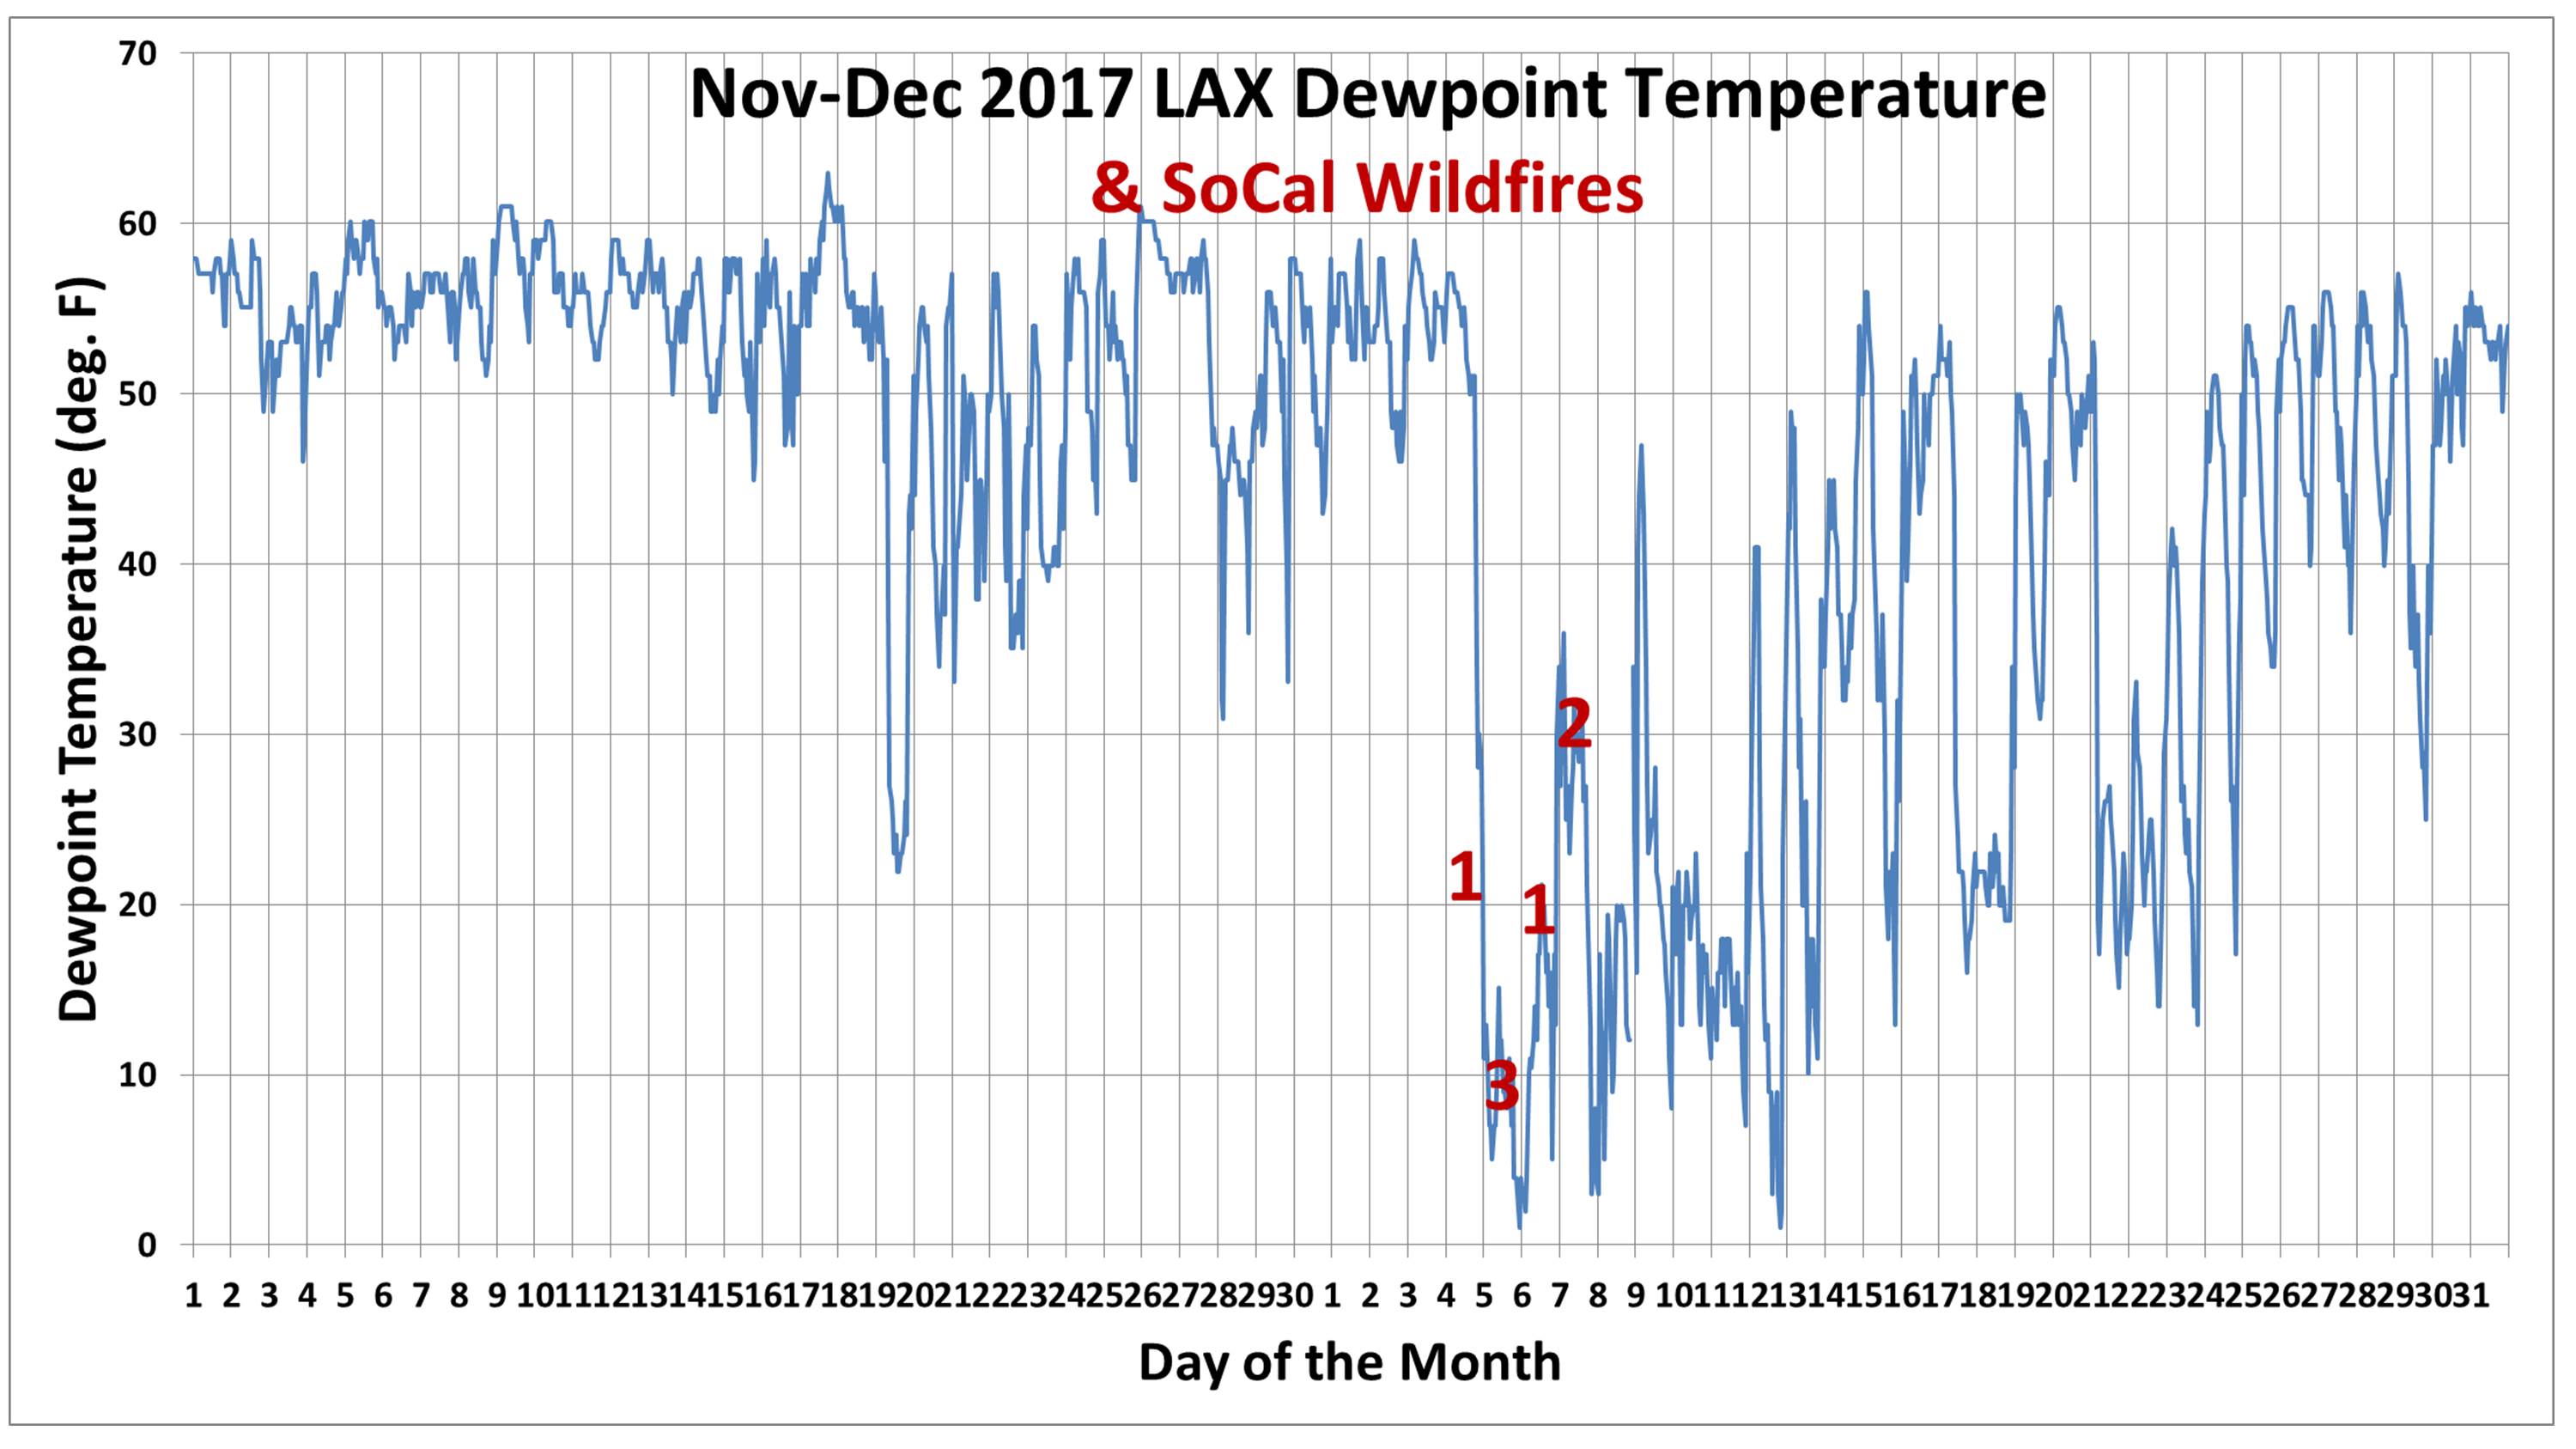
The dryness of this sinking air can be seen in this plot of the dewpoint temperature at LAX airport (Los Angeles) as dry air moved in from the east on December 4 with strong high pressure positioned over Nevada, and seven major wildfires developed and spread from the hot, dry, and locally windy conditions.
But have such fire-enhancing weather events increased in, say, the last 50 years or more? And even if they have, was the cause due to greenhouse gas emissions from fossil fuels? While blaming some portion of recent global average warming on increasing CO2 is somewhat easier, blaming a change in regional or local weather patterns on it is much more difficult.
In the process of looking around for an answer to this question, I found some interesting recent work that would allow someone to analyze the appropriate meteorological station data, if it hasn’t already been done.
The Hot-Dry-Windy (HDW) Fire Weather Index
In 2018, a paper was published by a university research meteorologist and U.S. Forest Service (USFS) employees from three different USFS offices that describes a simple meteorological index related to wildfire risk. They call it the Hot-Dry-Windy (HDW) index, which is simply the product of (1) the surface wind speed times (2) the water vapor pressure deficit. The vapor pressure deficit uses the same information as relative humidity (temperature and dewpoint temperature), but it is a difference rather than a ratio, which better measures the potential of air to rapidly remove moisture from dead vegetation. For example a 10% relative humidity at 40 deg. F will have low drying potential, while 10% RH at 100 deg. F will have very high drying potential.
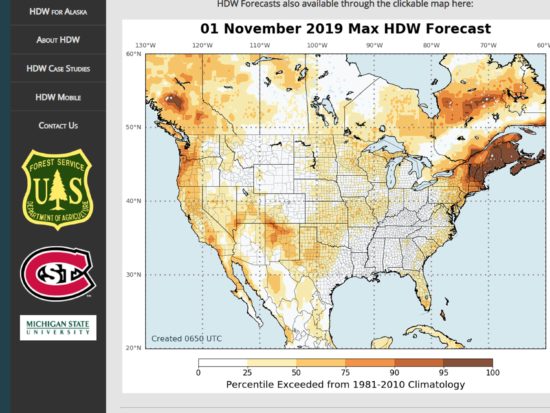
What is especially useful is that they used 30 years of weather forecast model (GFS) data to build a website that gives daily-updated forecasts of the HDW index across the United States. For example, here’s today’s forecast.
Importantly, the HDW index does not measure the actual fire danger, which must include how dry the vegetation currently is. It only shows whether the current weather will be conducive to the rapid spread of fire if a fire is started.
If you go to that website and click on a specific location, you get a time series plot of the HDW index values from 10 days ago up through the forecast for the coming days.
Unfortunately, the website does not provide any time series of the data over the last 30 years. But I can see the technique being applied to weather station data that goes back 50 years or more, for instance the formatted weather station data available here (which is where I got the Los Angeles airport data plotted above).
Until someone does this (if they haven’t already), I think it is a mistake to blame increased wildfire activity on “climate change”, when we don’t even know if there has been a change in the meteorological events most associated with major California wildfires: the intrusion of cool Canadian high pressure areas into the U.S. Southwest.


