Comments by Ross McKitrick on the Continuation of Climate Model Failure

November 12th, 2019 by Roy W. Spencer, Ph. D.

The following is a re-posting of an article by Dr. Ross McKitrick, University of Guelph, published yesterday, November 11, 2019. I have a comment that follows his post.

Climate Models vs Observations: 2019 Update

Back around 2014 many people, me included, were commenting on the discrepancy between climate models and observations. In a report for the Fraser Institute I showed the following graph:

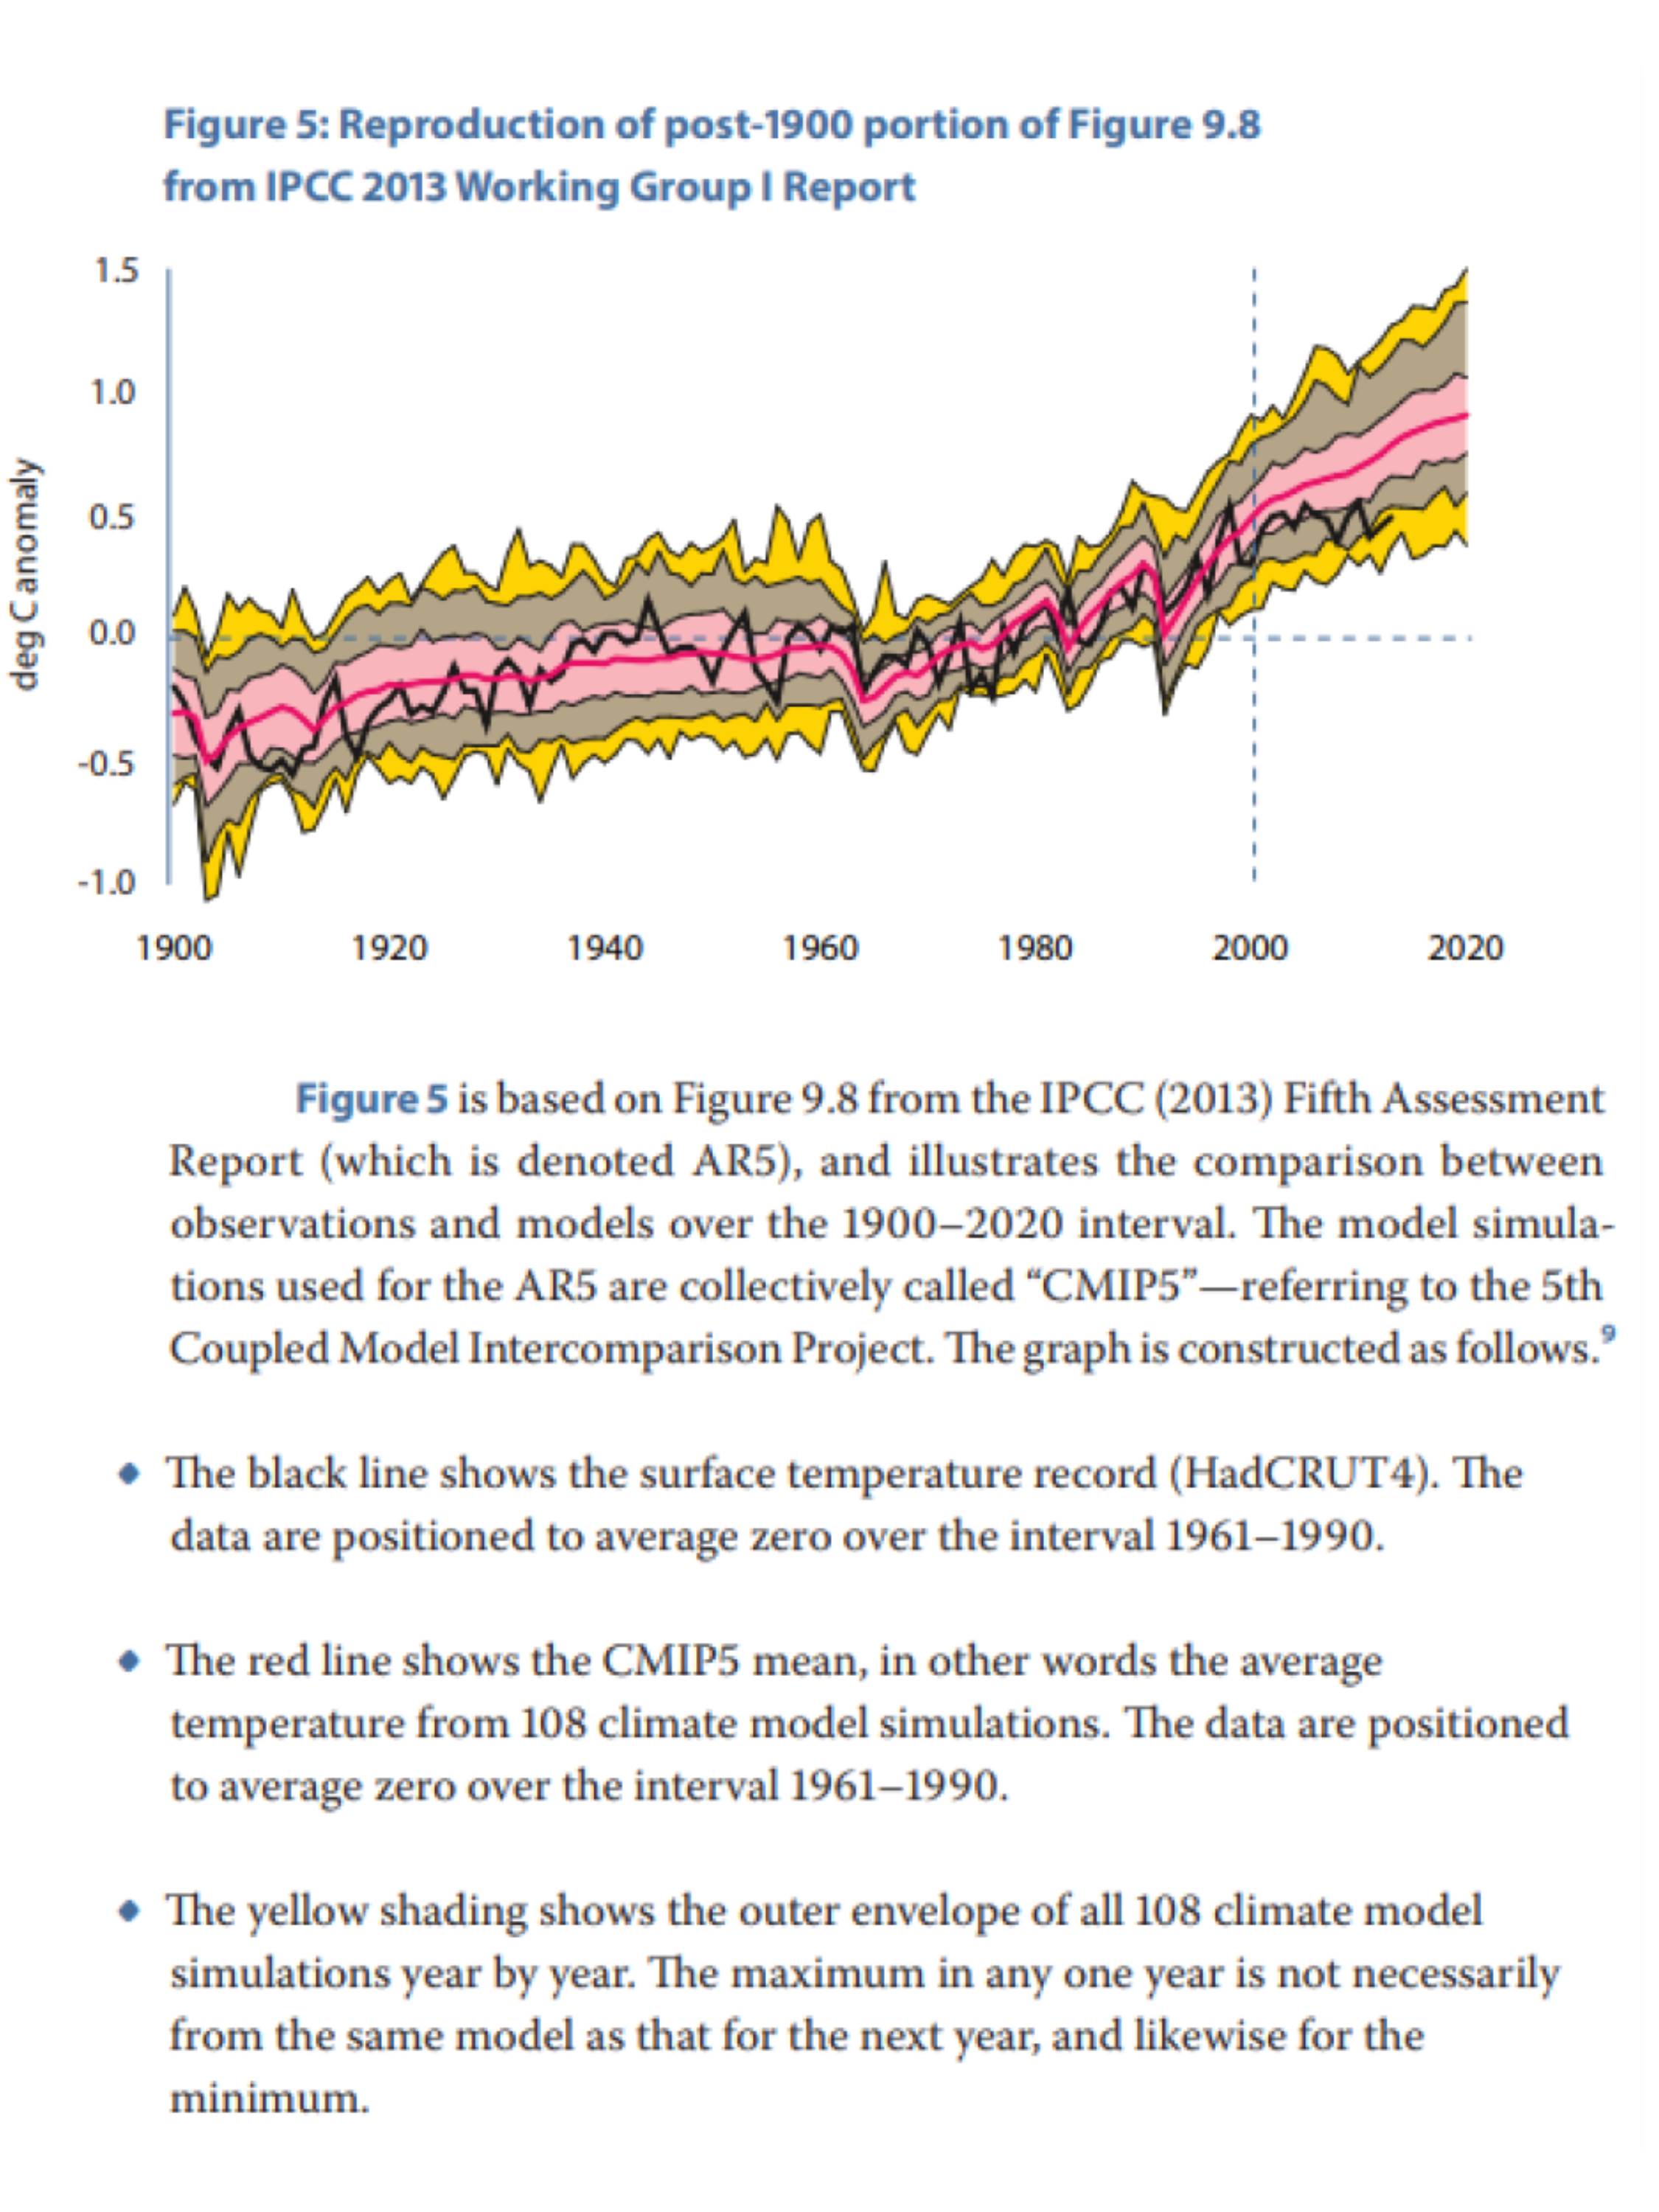
The HadCRUT4 series (black) was then dipping below the 95% lower bound of the model distribution. The IPCC itself in the 5th Assessment Report (2013) noted that out of 114 model runs, 111 had overstated observed warming since the late 1990s. That same year, Hans von Storch told Der Spiegel that:

“If things continue as they have been, in five years, at the latest, we will need to acknowledge that something is fundamentally wrong with our climate models. A 20-year pause in global warming does not occur in a single modeled scenario. But even today, we are finding it very difficult to reconcile actual temperature trends with our expectations.”

But before 2018 came along, the modelers were saved by the El.

El Nino, that is. The powerful 2015-16 El Nino caused temperatures to surge, apparently erasing the discrepancy. It was just in the nick of time. In 2018 the US National Assessment came out, using data sets ending in 2017, as did the Canadian counterpart, and they were able to declare that a lot of warming had occurred, more or less in line with model projections. Blog articles about the 30th anniversary of James Hansen’s predictions did the same.

Well it’s a couple of years later and the El Nino heat has mostly gone from the climate system. What does the model-observational comparison look like now?

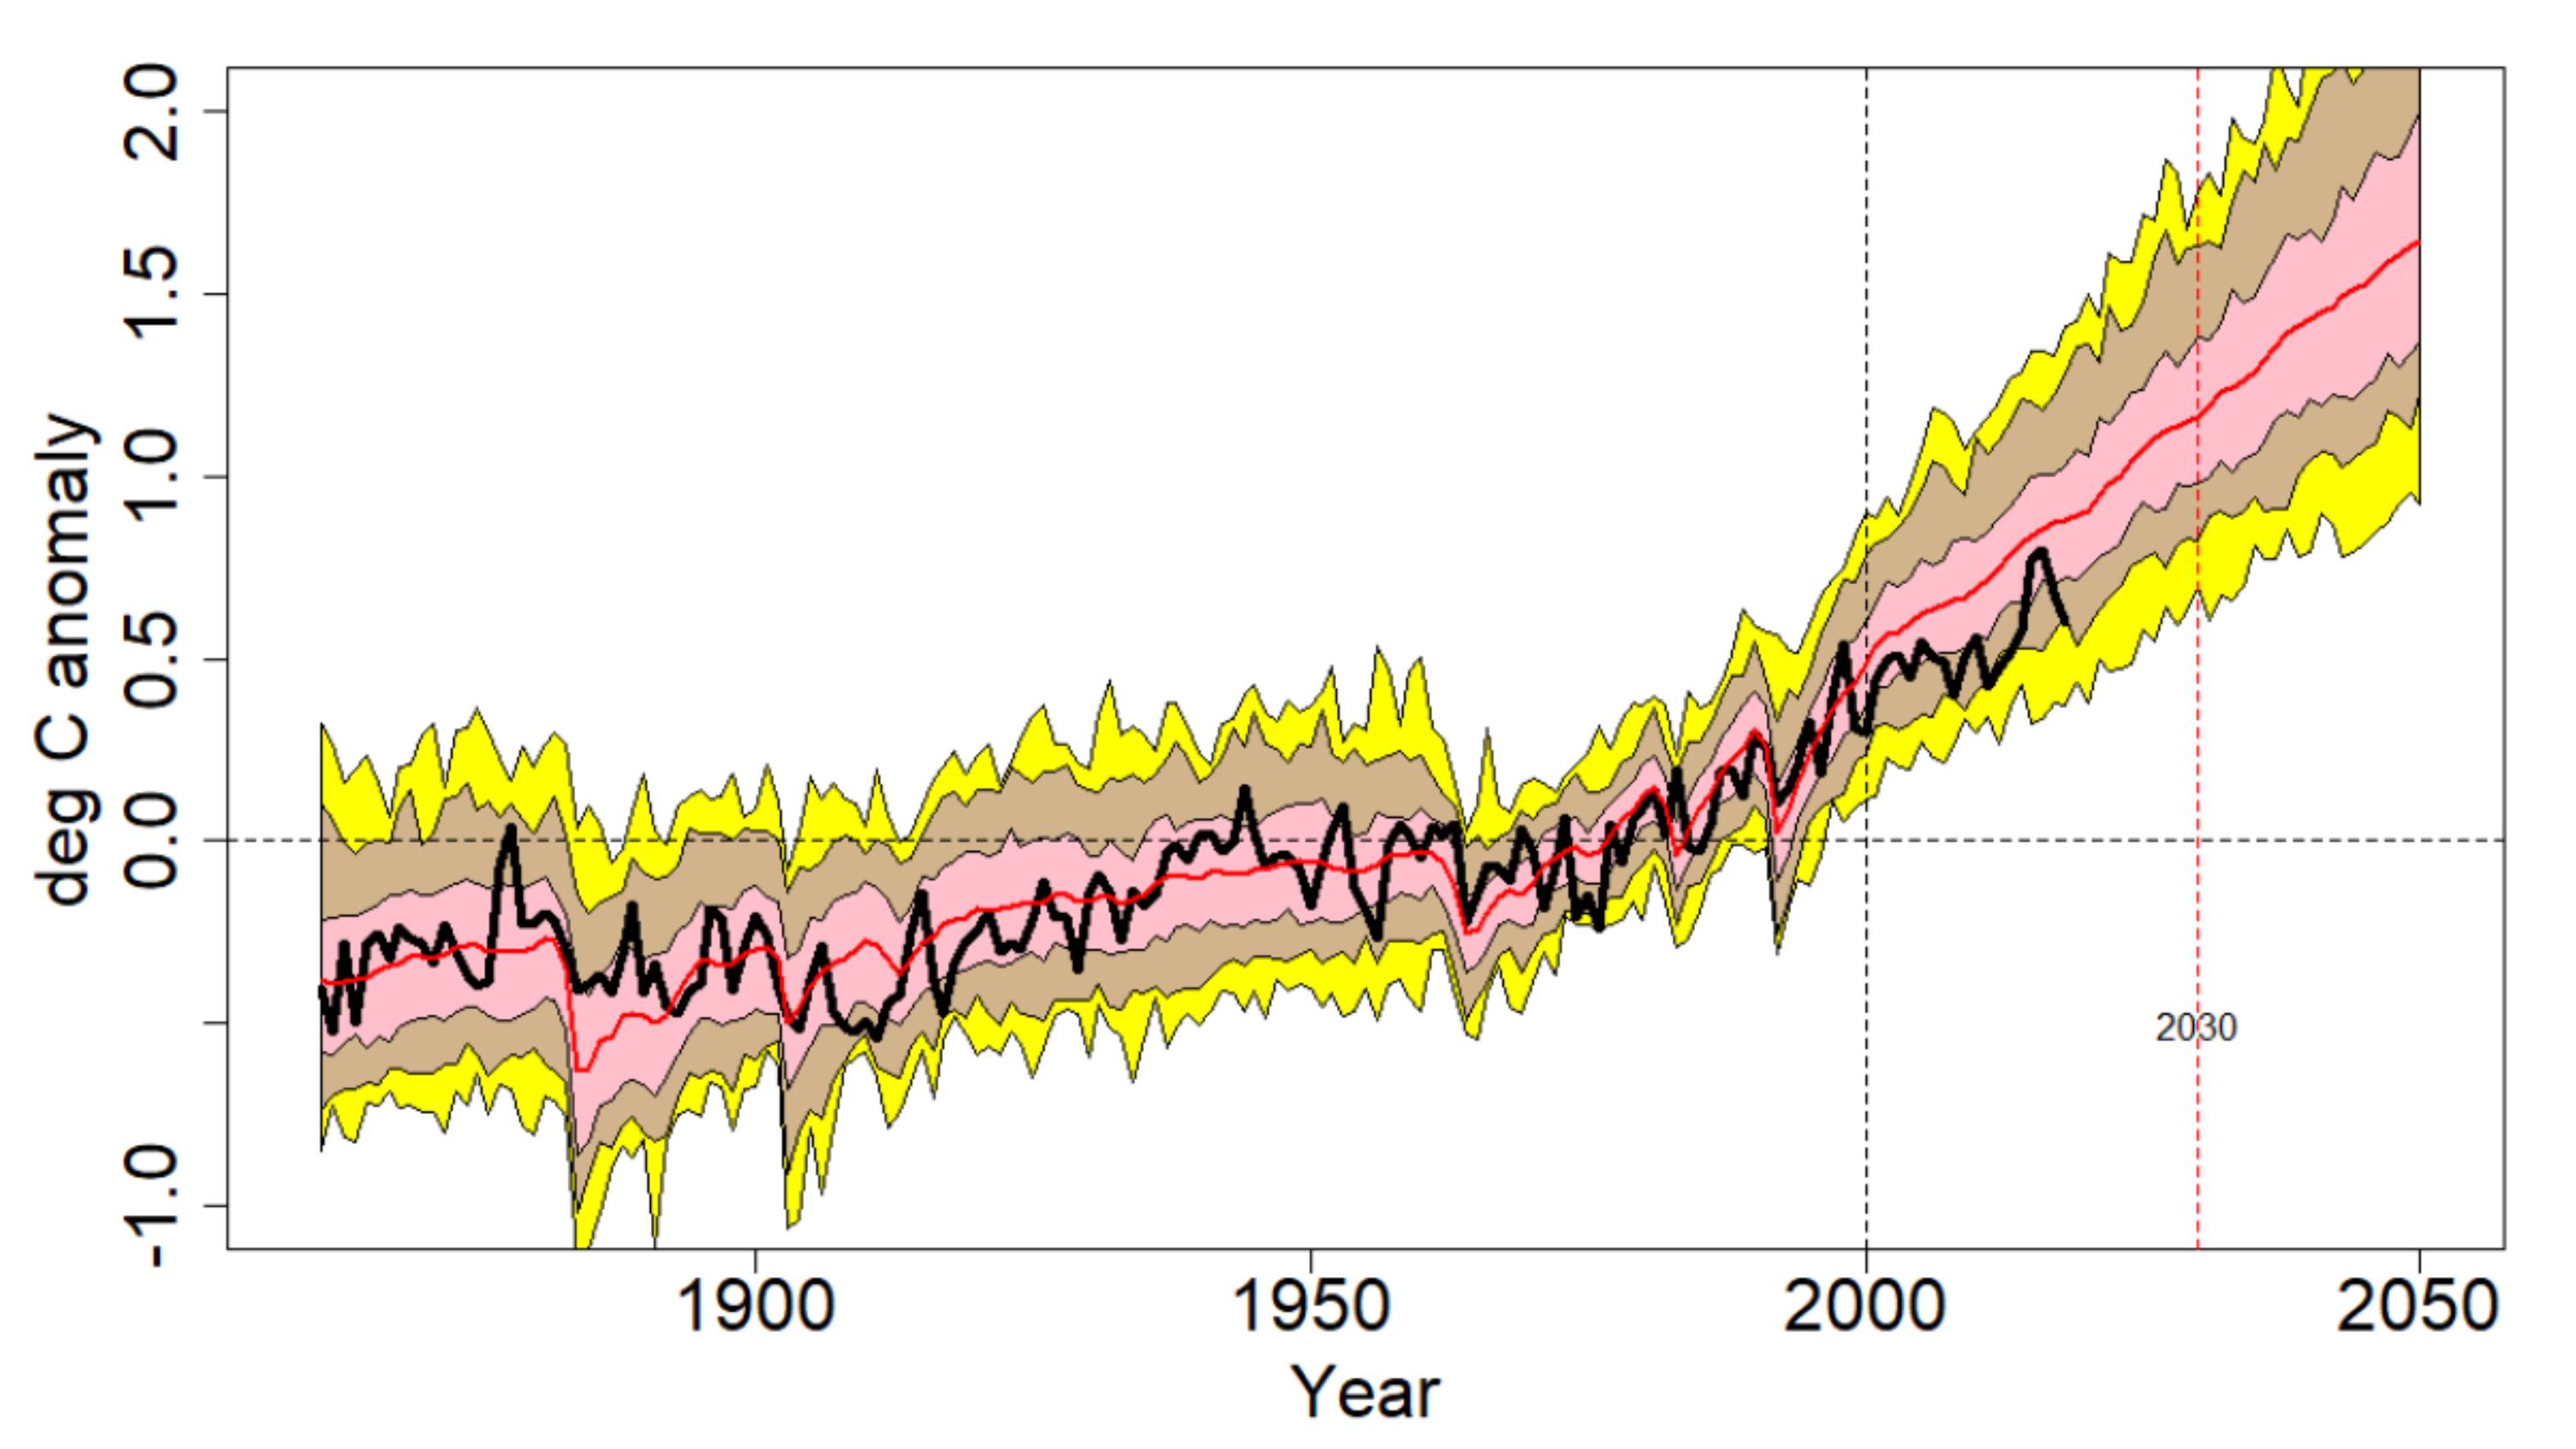
This graph, like the earlier one above, compares the HadCRUT4 surface temperature average (black line) against the CMIP5 mean (red line). The pink band shows the 1-sigma (67%) distribution and the tan band extends out to the 2-sigma (95%) distribution. The outer yellow bands show the lower and upper 2.5th percentiles. The lines are positioned so all models and observations are centered on a 1961-1990 zero mean. The model runs follow the RCP4.5 scenario and extend out to 2050.

Let’s zoom in on the post-1950 interval.

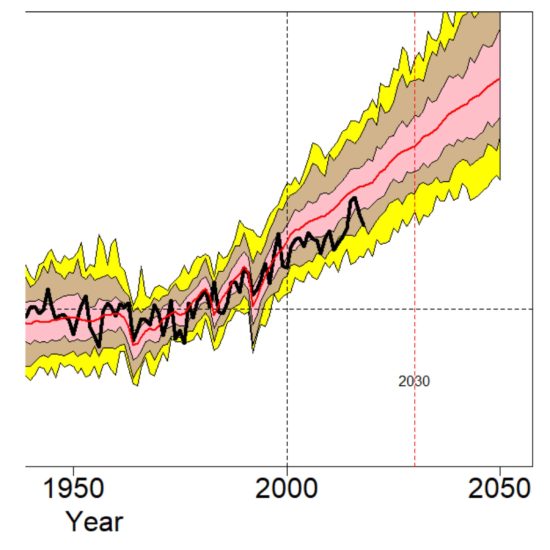
The HadCRUT4 series ends in 2018, which is the last complete year. Temperatures in 2018 (+0.60C) are back down to about where they were in 2014 (+0.58C). We’ll know in February or March where 2019 ends up.

The worry back in 2014 was that the Hadley (black) line had dropped below the 97.5th percentile envelope of the CMIP5 model runs. The El Nino pushed it almost all the way up to the mean, but only temporarily. It’s now back to the edge of the yellow band, meaning it’s skirting the bottom of the 95 percent confidence interval.

The big issue is not whether warming has “paused” or not, it’s how it compares to model projections. RCP4.5 is considered a medium, plausible projection. But it’s already pulling away from the observations.

I have indicated 2030 on the graph. That’s the year we all die, or something. But I think it’s more likely that will be the year by which the HadCRUT4 line drops out below the bottom of the CMIP5 RCP4.5 ensemble once and for all. The El Nino disguised the model-observational discrepancy for a few years, but it’s coming back.

There are other versions of this graph that don’t show such a discrepancy. Zeke Hausfather, for example, prefers to use a different set of CMIP5 outputs in which water surface temperatures rather than air temperatures from the (modeled) oceans are used to correspond to the sampling method
in HadCRUT4. The result is that the model temperatures tilt down a bit towards observations. That’s fine, but when governments draw scary charts of future warming those aren’t the model runs they show us, instead they show charts like the one I’ve drawn, so I’m more interested in seeing how it compares to observations.

I referred above to the Der Spiegel interview with Hans von Storch back in 2013. I very much appreciate another of his comments:

“Unfortunately, some scientists behave like preachers, delivering sermons to people. What this approach ignores is the fact that there are many threats in our world that must be weighed against one another. If I’m driving my car and find myself speeding toward an obstacle, I can’t simply yank the wheel to the side without first checking to see if I’ll instead be driving straight into a crowd of people. Climate researchers cannot and should not take this process of weighing different factors out of the hands of politics and society.”

That is very well put.

Roy W. Spencer comment: With the new CMIP6 models coming out suggesting even more warming than the CMIP5 models did, I fear we will see continuing “adjustments” of the instrumental temperature record to produce even more warming. This is the only way that the models can retain credibility in the face of real-world evidence that warming has been modest, at best.


57 Responses to “Comments by Ross McKitrick on the Continuation of Climate Model Failure”

Toggle Trackbacks

  1. RW says:

    Yes, they keep having to adjust the temperature data upward, yet this doesn’t seem to be drawing suspicion from the public at large. It means our side is in big trouble.

    • Ken says:

      The ‘problem’ isn’t the climate models vs the observations or or even if the observations keep getting ‘adjusted’. The problem is the extraordinary popular delusion and the madness of crowds surrounding the faux-climate crisis.

      It doesn’t seem to matter how much the scientists like Spencer and McKitrick vigorously try to spread the facts, it doesn’t even seem to matter that a lot of people do understand, the problem is our governments and the media are stuck on the delusion that there is a climate crisis.

      I can’t help but wonder if the malfeasance in our governments is deliberate.

      • Archie says:

        If it’s not deliberate than the people are stupid. I guess you can make your choice.

      • Nabil Swedan says:

        We have climate crisis, just watch the weather channels and bad news around the world. The problem is this crisis cannot be demonstrated by the wrong science developed and supported by meteorologists. These should go back to the drawing board and figure out a correct climate science, not keep blaming computer models that are inherently wrong.

        • Archie says:

          There is a lot of anecdotal weather hysteria but I doubt any climate crisis. I live in a harsh and cold area in the winter and I have what I like to call, “weather amnesia.” It’s how I survive here without going crazy. Without searching good historical records, nothing of value can be said. Have a look at Tony Heller’s work if you want historical perspective on the “climate crisis.”

          https://realclimatescience.com/

          • Nabil Swedan says:

            Archie,

            I have been monitoring the weather and climate for over 15 years. Also, I have reviewed their historical records. Yes, everything points out to a crisis. We just do not have the correct science to convince all of the public of the existence of the crisis, and meteorologists are to be blamed. Please remember that “IPCC” is …WMO…meteorologists.

            Meteorologists are interested in the controversies of the climate science and issue for money and funding considerations.

          • Mark E. says:

            Tony Heller has been getting a large following on You-tube which is growing rapidly. I try to share his videos as much as I can. People are starting to notice.

          • Nabil Swedan says:

            Tony Heller and similar others have to publish what they says in scientific journals to be somewhat credible.

        • Adam Gallon says:

          The climate journal gate-keepers, won’t let Tony Heller within a country mile of their “Reputable” journals. The struggles that established scientists , have, to get their work that casts doubt upon CAGW, published.(See Dr Curry’s previous posts).

          • Nabil Swedan says:

            Adam,

            If what Tony Heller says is scientifically sound and that reputable journals refuse to publish his work, then these are not reputable journals. He should look for other journals. The world is full of reputable journals that would be more than happy to publish sound science.

          • spike55 says:

            “then these are not reputable journals.”

            BINGO !!

            bullseye ! etc etc.

  2. gbaikie says:

    –The big issue is not whether warming has “paused” or not, it’s how it compares to model projections. RCP4.5 is considered a medium, plausible projection. But it’s already pulling away from the observations.–

    I think the pause is big issue, and I would say we aren’t there yet.
    As far as projection they already seem way off.
    They are way off, because government has done utterly nothing to limit CO2 emission. Though Government has caused trillions of dollars to be wasted. So governments have been spending vast amounts of money but what they doing has not limited CO2 emissions and I would say their sum of action has caused an increase in CO2 emission. Or there are numerous ways that governments have increased CO2 emission, and the governments involved in trying reduce CO2 have nothing to decrease CO2 emission.
    Countries such as India and China have done some things to reduce CO2 emission {but I don’t think they taking this actions to reduce global CO2 emission- they doing for other reasons, one reason being to reduce air pollution {local air pollution- not global air pollution]. So big reduction in CO2 to date has been using more natural gas. In terms of future reduction in CO2, it’s building more nuclear power plants- long term this could bigger than natural gas. But countries “seen” as doing something about the “climate emergency” are reducing nuclear power and burning coal. They taking the advantage of natural gases, but not doing much to increase natural gas supplies- Europe is getting natural gas from elsewhere including Russia.
    So in terms heeding “the lesson” or value of any of the projection the governments “involved” with doing something about the “climate emergency” are doing the most they can to increase CO2 emissions, the markets {based on making money by delivering products consumers want} on the other hand, are doing a lot.
    So if you assumed governments would do things to make worst, and private sector would “save the day” then projection are not bad as they as they actually are. But for people who don’t know any better, they could imagine that governmental projections could be something for governments to use for governmental policy.

    –“Unfortunately, some scientists behave like preachers, delivering sermons to people. What this approach ignores is the fact that there are many threats in our world that must be weighed against one another. —
    The “scientists” are also paid salesman for government corruption related to the “climate emergency”.
    There is no threat from warming in an Ice Age. But in terms of imagined threats of climate change, the imagined threats are not as significant as real problems in this world.
    The Holocaust occurring in China, is pretty big problem- for an example.
    There are opportunities being missed which probably more important than even the Holocaust currently occurring in China. Though this is connected to it not being reported much in the news, the state of news in general is maybe a bigger issue than any single lost opportunity we failing to act on.

  3. DocSiders says:

    Where are the rigorous statistically valid audits of the widespread temperature record adjustments? (All “down in the past and up recently” to enhance the trend)

    The raw data and adjustment algorithms must surely be available…else those adjustments cannot be rationally defended.

    This lack of good auditing AND REPORTING of the adjustments to the temperature records is exasperating.

    What’s Up With That?

    • Roy W. Spencer says:

      I suspect that the “homogenization” procedures are so involved that it would take a major funded effort to explore the impact of all the various assumptions involved. That kind of research $$ does not exist because the dataset developers who review your proposal would claim there is no need for such a study. I prefer Anthony’s approach of just throwing out all but the best-sited data. Leaving in corrupted data and expecting the “homogenization” procedure to fix it should, at a minimum, require a comparison of the final result to just the best-sited data. When Anthony et al. did that, there was a clear discrepancy, over the U.S. at least.

    • Bindidon says:

      DocSiders

      I don’t know wether other climate observation institutions publish their sources, but at least GISS does.

      From the GISTEMP main page

      GISS Surface Temperature Analysis (GISTEMP v4)
      https://data.giss.nasa.gov/gistemp/

      you easily go down to
      https://data.giss.nasa.gov/gistemp/sources_v4/

      and from there you can download the sources and evaluate them.

      There is also a more specific page related to uncrtainty computations in the GISTEMP series:
      https://data.giss.nasa.gov/gistemp/uncertainty/

      All that you find using… Google.

  4. Scott R says:

    The 2016 ENSO has not been completely absorbed yet. You can see this by placing a 5 year moving average on the ENSO 3.4 data. Additionally, per HADSTT3, we haven’t even absorbed the 3.6 year harmonic off of the super nino yet. I see the October number was +0.775.

    These models can and will continue to fail, because the established baseline for “pre-industrialized earth”, was in fact a very cold period compared to the prior couple of thousand years. So you are capturing part of the solar cycle there (as outlined by Zharkova) which is of course natural.

    On top of that, the AMO clearly cycles. We have seen the regions especially between 45-60 deg N go sub-0 repeatedly over the last couple of months. This region is an area critical to the Greenland ice sheet, weather patterns in the eastern US and the Midwest.

    I’m honestly not sure why we are even worried about a warmer climate. We only need to look at the Holocene optimum to know that there were more fertile grounds in particular Africa when it was actually a little warmer. Also, without the introduction of man made CO2, the plants may have become CO2 starved during the next major glaciation period.

    • Robert Austin says:

      Im honestly not sure why we are even worried about a warmer climate.

      Warmer is good and not scary to the general public. Hence the metamorphosis to climate change and thence to climate emergency. Since warmer is not scary, extreme weather is invoked to frighten the plebes.

  5. In the real world the Δ 33 oC difference does not exist.

    A Planet -Without- Atmosphere Effective Temperature Complete Formula:

    Te.complete.earth = [ Φ (1-a) So (β*N*cp)¹∕⁴ /4σ ]¹∕⁴ = Te.complete.earth = 288,36 K

    vs the incomplete effective temperature:

    Te.earth = [ (1-a) So /4σ ]¹∕⁴ = 255 K

  6. gbaikie says:

    –SEN. MAZIE HIRONO (D-HI): We Should Believe in Climate Change as If It’s a Religion, Not a Science.

    “…These are times that call for us to do those things that we believe in, and to march, and not just to march, cause that’s important to show solidarity, but then to do those things such as voter registration, get people out to vote, so that we can have people here who are truly committed to human rights, environmental rights — climate change…believe in climate change as though it’s a religion, it’s not a science — and all the things that need to be done, and there is a lot,” Sen. Hirono told the crowd.

    While Nietzsche assured the Jurassic “woke” class of the late 19th century that “God is dead,” most of the branches of the “Progressivism” that followed are forms of a substitute religion to fill the void, including both radical environmentalism, and even socialist health care. As the late Tom Wolfe wrote in his epochal 1976 article, “The ‘Me’ Decade and the Third Great Awakening,” —
    https://pjmedia.com/instapundit/

  7. Gerard says:

    My understanding of CMIP6 is that the original version included solar influences but that modellers asked for a version that left these out because their models would have had to leave out the influence of CO2 for them to be able to represent real temperatures. Is this correct???

  8. Bri says:

    We don’t die in 2030 , it is the date the socialist need to have complete control of energy policy. They know that the I.T.E.R fusion reactor will be operational by 2035 and want to take credit for saving us all . There will be little support for cow fart generators and such when we can have unlimited power from fusion.

  9. Antonio (AKA "Un físico") says:

    All CMIP models are useless for prediction. Scenarios set there are based on previously set political targets, (CO2 concentrations and global warming are only excuses), as certain politicians want to be told, that: (1) they must shift, from capitalized (i.e., carbon-based and nuclear fission), to renewable energetic sources; (2) UN must control human population growth, (3) rich countries must pay poor countries (no matter if poor ones are corrupted or oppressive countries). This political “bussiness” is the greatest hoax in our 21st century. If you read my “Climate” document: drive.google.com/file/d/0B4r_7eooq1u2ZlIwZFcxQ2ZWaHc , you would learn why we should require centuries of data in order to get reliable models.
    I do not know how we can put an end to this global madness. I thought that basic people, after being teached the truth, would start claiming their money back. But basic people is so stupid: they actually believe that, by paying a 40% extra in their electricity bills, they are saving the planet against climate change.

  10. ren says:

    A positive temperature anomaly in Iceland during the winter of 1708/1709 indicates a breakdown of the polar vortex. Was it a fault of CO2 growth?
    https://upload.wikimedia.org/wikipedia/commons/thumb/0/06/Winter1709.png/800px-Winter1709.png
    https://en.wikipedia.org/wiki/Great_Frost_of_1709

  11. Aaron S says:

    Can you add satellite data?

    It would be useful to have a readily available graph online for discussions in day to day life.

  12. bdgwx says:

    It would be nice to see a similar analysis with the forcing adjusted model runs side by side so that we can see if it is the model physics or the assumed RCP45 scenario inputs that causing the subpar results.

  13. Entropic man says:

    Hans von Storch told Der Spiegel that:

    If A 20-year pause in global warming does not occur in a single modeled scenario”

    A 20-year pause in global warming did not occur in reality either.

    You cant criticise models for not representing an event which did not happen.

  14. Aaron S says:

    Entropic man,

    You say ~”20yr pause did not occur in reality” are you splitting hairs about the 15 yr hiatus or a denier that in the less adjusted data it was clearly there?

    Lol. The battle of nature and science papers.

    1. https://www.nature.com/articles/nclimate2938
    2. https://www.nature.com/articles/nclimate2531
    3. Satellite data clearly had it also

    And a series of other hiatus supporting papers in 2015 and 2016.

    Then Karl et al. Paus buster paper was accepted by the church of natural climate change deniers and history was rewritten with the authority only a religion can provide.

    https://science.sciencemag.org/content/348/6242/1469

    I personally take the position that any individuals are logically busted if they disregard the uncertainty that there was a significant hiatus or paus. It’s called confirmation bias or more simply cherry picking to accept updates from the people whom have the most to loose from a pause.

  15. Nefyn says:

    Dr Spencer….I am always troubled when I see the qualifier observed in terms of temperature. Shouldnt observed be the raw data? Or at least, the variable should be defined as adjusted land-based temperature reading or proxy observation?

  16. bobdroege says:

    Ross,

    I don’t see a discrepancy between the models and the data.

    And at least you are doing a like for like comparison.

  17. Aaron S says:

    Entropic man,
    So I provide data in “nature” addressing explicitly the existence of a hiatus. You then provide your ad hoc analysis of adjusted data and say you prefer to start with the data?

    Are you seeing the paradox? You accept data you select and utterly disregard contrarian data. Seem scientific to you?

    If you prefer to start with data then what about paper 2 i provided?

  18. gbaikie says:

    In our climate emergency it’s suppose to be the end in 11 years.
    And we don’t have a climate projection for 11 into the future- and climate project longer than 20 years, does not make any sense if you imagine everything going to end in 11 years.

    Also in the next 11 years, China probably will emit more CO2 than US does, China is currently emitting about twice as much CO2 than the US, and China say it might significantly do something to lower CO2 emission after 2020 or maybe it’s 2030. Anyhow if worried about CO2 emission and everything will end in 11 years because CO2 emission, it seems you have be concerned about China CO2 emissions and any argument related to the fact that China didn’t emit much CO2 20 years ago, should be argument that China “should be allowed” to emit the most amount of CO2 now, and within the next 11 years, if you think the world going to end in 11 years. Unless you want China to be mostly responsible for ending the world. Or when the end happen you can, it’s all due to China. But that would not be very honest if you have been buying China products, because you have to blame yourself.
    Anyhow there are children who are worried the world will end in 11 years, and if anyone cared about these children, they would provide a climate projection for the next 11 years.

    • Mick says:

      CO2 isn’t the culprit anyways. Bad hypothesis is what it is.

      • gbaikie says:

        “Bad hypothesis is what it is”
        I think when committee makes a hypothesis it generally is a bad hypothesis. So this bad hypothesis could be a major element which caused the Greenhouse Effect Theory to be pseudo science.
        I tend to think C02 levels can have some effect upon global temperature, but I would not agree with the idea of the so called “Greenhouse Effect Theory” which claims the the radiant effects of all greenhouse gases are dominant factor in determining global average temperature.
        I don’t directly blame “Greenhouse Effect Theory” for dumb idea that greenhouse gases will make air and the surface hotter {or the lack of them, colder} because the effect of “greenhouse gases” is not increasing the input of energy but rather is “suppose to be” about reducing the amount energy radiated in space {reducing the amount of energy lost}. Or it mostly about increasing night and winter temperatures- though if you have a cold morning it does limit how warm the day generally becomes.

        There is no evidence of “days becoming hotter” and I would say evidence of days not getting hotter could be related to “global warming.
        Or that hottest day anywhere on Earth, “According to the World Meteorological Organization (WMO), the highest temperature ever recorded was 56.7 C (134.1 F) on 10 July 1913 in Furnace Creek (Greenland Ranch), California, United States,..” does not disprove there has not been global warming since that time {1913 AD] rather it’s something one should expect as result of global warming.
        Anyhow, the idea global warming causing hotter days is due to the pseudo science created by the bad hypothesis that was established by committee.
        One dumb idea associated with “Greenhouse Effect Theory” is that the cause of all warming is from CO2, or the so called “Greenhouse Effect Theory” does not assert that only CO2 causes all global warming. Though the vagueness of the bad hypothesis does permit all manner dumbness, such as CO2 is the control knob.

        I have said the controlling factor of global average temperature is the ocean average temperature {or total heat content of the entire ocean]. Or simply our ocean is cold, it’s average temperature is about 3.5 C. And 3.5 C is cold. An example of warm ocean is average temperature of 10 C. {of course 10 C is not actually very warm}. And very warm ocean would 20 C -which certainly not “hot”, rather it’s a comfortable room temperature which on the cool side.}
        If our ocean were a lot warmer, such as an average 10 C, we could be in a Ice Age. Or the Ice Age which we been in for million of years {but not tens of million of years} has a cold ocean which has range of 1 to 5 C in terms to average temperature of entire ocean. Or as said more than 90% of our ocean has temperature of 3 C or colder. And the entire ocean is average of 3.5 C.

        But what reflects directly in terms of global average air temperature is the thin surface temperature of the entire ocean, which has average temperature of about 17 C. But the cold ocean limits this average surface temperature of 17 C.
        Anyways as Berkeley Earth claims in paper, the average land surface air temperature is about 10 C. With 30% of surface being 10 C and 70% being 17 C, the average global temperature is about 15 C.

        Just in terms of averaging numbers, if Earth average ocean surface was 15 C instead of 17 C, Earth global temperature would be much colder. But if average surface ocean temperature was 15 C, that cause lower average land surface temperature.

        Now what would an ocean with an average of 15 C, look like? It could be all kinds of things, could be northern Hemisphere ocean is colder than Southern ocean, or Southern ocean colder than Northern ocean. Currently the southern oceans is about 1 C colder than northern oceans. Or it could be the tropical ocean is colder and 60% of the rest is not cooled as much- but that sort of unrealistic. More likely 60% of ocean is colder.
        Currently the tropical ocean is about 26 C and the 60% of rest of ocean is about 11 C. So if 60% of ocean surface was about 1.5 C cooler, or 9.5 C rather about 11 C and most it come North Hemisphere and more balance the different. Basically Europe become a icebox. And glacier will form in North America- and else where. But glaciers forming in North American is the beginning of glacial period. Or this would be colder than the Little Ice Age.

  19. Entropic man says:

    Testing

  20. Entropic man says:

    Aaron S

    I’m struggling to post here today.

    In brief, to be statistically significant a hiatus must have at least 4SD less warming than the long term trend over the same time.

    Since SD is +/-0.05C, I need to see at least 0.2C less warming during any proposed hiatus.

  21. PhilJ says:

    If this years higher ozone numbers are the beginning of a robust recovery in the ozone layer, look for rising stratosphere temps followed by decreasing ocean and troposphere temps…

    Wonder how long before the eco-lefties will claim victory, that their ‘efforts’ succsessfully stopped global warming….

  22. Aaron S says:

    Phil J,

    No way can they claim victory. The CO2 ppm and even rate of increase continue to rise despite the billions of dollars to attempt to slow it. So if a person takes the position CO2 drives climate then they can not claim victory if temp rise slows or reverses but CO2 increases. A decrease would just throw a wrench into the dogma.

    Ozone is a fascinating concept because I am ignorant about its role in surface temperatures. Is there a key paper you can share so that I can read to learn more?

  23. Aaron S says:

    PHIL J.

    I read a paper from 2000s about UV and Ozone. A guy from my job published another but it was generally not accepted by academia

  24. PhilJ says:

    Aaron,

    I have searched but have been unable to find any work done on the effect of uvb on ocean temp.

    The only thing close is by Dr. Peter Ward here: https://ozonedepletiontheory.info/ImagePages/TempClOzCO2-5.html

  25. Snape says:

    The CMIP3 ensemble looks to be spot on, at least when compared to GISTEMP:

    https://twitter.com/ClimateOfGavin/status/1195427546164350978/photo/1

  26. With the new CMIP6 models coming out suggesting even more warming than the CMIP5 models did, I fear we will see continuing “adjustments” of the instrumental temperature record to produce even more warming. This is the only way that the models can retain credibility in the face of real-world evidence that warming has been modest, at best.

  27. WinPlay Club - Huyền thoại trở lại mang thần ti g cửa nh bạn says:

    https://betdoithuong.com/game-bai-doi-thuong/winplay-club-huyen-thoai-tro-lai-mang-than-tai-go-cua-nha-ban
    Xuất hiện trn thị trường Việt Nam vi năm nay nhưng cổng game bi ăn tiền thật WinPlay Club đ tạo nn một tro lưu mạnh mẽ với thnh vin tham gia cực kỳ nhiều.

  28. our site says:

    I am happy to find so much useful information here in the post, we need to develop more strategies in this regard, thanks for sharing.

  29. James Kee says:

    There are opportunities being missed which probably more important than even the Holocaust currently occurring in China. | rent atvs now

  30. Columbus says:

    Well, its a couple of years later and the El Nino heat in Columbus has mostly gone from the climate system. But I never imagined the impact La Nia brings this year. I can see floods all over the world.

  31. Thanks for sharing this great information on this site.

Leave a Reply