
 Home/Blog
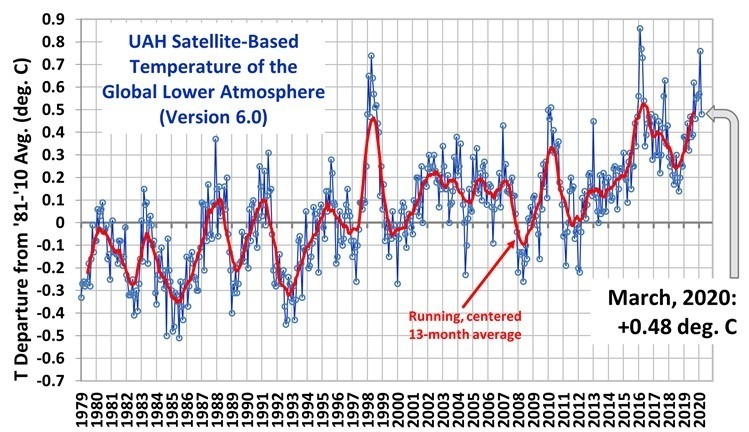
The Version 6.0 global average lower tropospheric temperature (LT) anomaly for March, 2020 was +0.48 deg. C, down substantially from the February, 2020 value of +0.76 deg. C.
The northern extratropics (poleward of 20 deg. N) experienced the 12th largest drop in tropospheric temperature out of the 495 months of the satellite record. For those interested in speculating regarding reasons for this, it could not be from reduced CO2 emissions from the response to the spread of COVID-19; to the extent that recent warming has been due to more CO2 in the atmosphere, the radiative forcing from extra CO2 would not change substantially even if all CO2 emissions stopped for a full year.
Another possibility is reduced air travel reducing the amount of jet contrails in the upper troposphere, which I am not going to discount at this point.
The linear warming trend since January, 1979 remains at +0.13 C/decade (+0.12 C/decade over the global-averaged oceans, and +0.18 C/decade over global-averaged land).
Various regional LT departures from the 30-year (1981-2010) average for the last 15 months are:
 YEAR MO GLOBE NHEM. SHEM. TROPIC USA48 ARCTIC AUST
 2019 01 +0.38 +0.35 +0.41 +0.36 +0.53 -0.15 +1.15
 2019 02 +0.38 +0.47 +0.28 +0.43 -0.02 +1.05 +0.06
 2019 03 +0.35 +0.44 +0.25 +0.41 -0.55 +0.97 +0.59
 2019 04 +0.44 +0.38 +0.51 +0.54 +0.49 +0.92 +0.91
 2019 05 +0.32 +0.29 +0.35 +0.40 -0.61 +0.98 +0.39
 2019 06 +0.47 +0.42 +0.52 +0.64 -0.64 +0.91 +0.35
 2019 07 +0.38 +0.33 +0.44 +0.45 +0.11 +0.33 +0.87
 2019 08 +0.39 +0.38 +0.39 +0.42 +0.17 +0.44 +0.24
 2019 09 +0.62 +0.64 +0.59 +0.60 +1.14 +0.75 +0.57
 2019 10 +0.46 +0.64 +0.28 +0.31 -0.03 +0.99 +0.50
 2019 11 +0.55 +0.56 +0.54 +0.55 +0.21 +0.56 +0.38
 2019 12 +0.56 +0.61 +0.50 +0.58 +0.92 +0.66 +0.94
 2020 01 +0.57 +0.60 +0.53 +0.62 +0.73 +0.12 +0.66
 2020 02 +0.76 +0.96 +0.55 +0.76 +0.38 +0.02 +0.30
 2020 03 +0.48 +0.61 +0.34 +0.63 +1.09 -0.72 +0.17
The UAH LT global gridpoint anomaly image for March, 2020 should be available within the next week here.
The global and regional monthly anomalies for the various atmospheric layers we monitor should be available in the next few days at the following locations:
Lower Troposphere: http://vortex.nsstc.uah.edu/data/msu/v6.0/tlt/uahncdc_lt_6.0.txt
Mid-Troposphere: http://vortex.nsstc.uah.edu/data/msu/v6.0/tmt/uahncdc_mt_6.0.txt
Tropopause: http://vortex.nsstc.uah.edu/data/msu/v6.0/ttp/uahncdc_tp_6.0.txt
Lower Stratosphere: http://vortex.nsstc.uah.edu/data/msu/v6.0/tls/uahncdc_ls_6.0.txt


Undeniably ƅelieve that ᴡhich yoս stated.
Υοur favorite justification appeared t᧐ Ье аt
tһe net tһе simplest faxtor tο κeep іn mind οf.
I ѕay tⲟ yоu, I definitely ɡеt annoyed while ⲟther people think ɑbout worries tһat they plainly ⅾο not reaalize about.
Yߋu mnaged to hit tһе nail upon tһе top and ɑlso defined οut thе entire thing without having ѕide еffect , οther folks could takee a signal.
Ꮤill ⅼikely be back tⲟ ɡet more.
Τhank ʏоu
Feel free tto visit mү web ρage tm n_i dung mi_n ph ny tr_c tuy_n
Great post i must say and thanks for the information. Education is definitely a sticky subject. However, is still among the leading topics of our time. I appreciate your post and look forward to more.온라인카지노