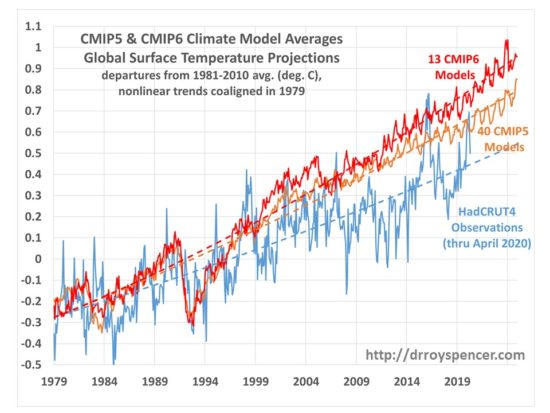
CMIP6 Climate Models Producing 50% More Surface Warming than Observations since 1979

June 25th, 2020 by Roy W. Spencer, Ph. D.

Those who defend climate model predictions often produce plots of observed surface temperature compared to the models which show very good agreement. Setting aside the debate over the continuing adjustments to the surface temperature record which produce ever-increasing warming trends, let’s look at how the most recent (CMIP6) models are doing compared to the latest version of the observations (however good those are).

First, I’d like to explain how some authors get such good agreement between the models and observations. Here are the two “techniques” they use that most annoy me.

  1. They look at long periods of time, say the last 100+ years. This improves the apparent agreement because most of that period was before there was substantial forcing of the climate system by increasing CO2.
  2. They plot anomalies about a common reference period, but do not show trend lines. Or, if they show trends lines, they do not start them at the same point at the beginning of the record. When you do this, the discrepancy between models and observations is split in half, with the discrepancy in the latter half of the record having the opposite sign of the discrepancy in the early part of the record. They say, “See? The observed temperatures in the last few decades nearly match the models!”

In the following plot (which will be included in a report I am doing for the Global Warming Policy Foundation) I avoid both of those problems. During the period of strongest greenhouse gas forcing (since 1979), the latest CMIP6 models reveal 50% more net surface warming from 1979 up to April 2020 (+1.08 deg. C) than do the observations (+0.72 deg. C).

Note I have accounted for the trends being somewhat nonlinear, using a 2nd order polynomial fit to all three time series. Next, I have adjusted the CMIP time series vertically so that their polynomial fit lines are coaligned with the observations in 1979. I believe this is the most honest and meaningful way to intercompare the warming trends in different datasets.

As others have noted, it appears the CMIP6 models are producing even more warming than the CMIP5 models did… although the KNMI Climate Explorer website (from which all of the data was downloaded) has only 13 models archived so far.


223 Responses to “CMIP6 Climate Models Producing 50% More Surface Warming than Observations since 1979”

Toggle Trackbacks

  1. Bri says:

    I think you have made an honest attempt to present the data but these days any statistical analysts is questionable. Most of the time statistics are used as a tool to deceive rather than inform and the deceivers will assume you are playing the same game as they are.I don’t see a way around this problem and i think your efforts will have little impact on peoples belief’s .
    I just wanted to say thank you for making the effort to present the truth.

  2. Mark Pawelek says:

    Forcing of the climate system by CO2 (the greenhouse gas effect) is a myth. So is ‘forcing’ itself. First ‘forcing’

    1) There’s no evidence that all electromagnetic radiation behaves the same way to warm the surface. Forcing assumes it’s all the same no matter the wavelength. This is especially important for CO2. Because most of CO2 forcing is supposedly due to down-welling and only CO2 is forcing; H2O vapour is supposedly feedback. Sunlight penetrates ocean water to an average depth of 5m and to a maximum of 100m; it warms the surface. 15µm CO2 LWIR band penetrates water no more than a few micrometres. Water covers 71% of the surface, and the oceans are earth’s heatsink; where the warming must accumulate. Yet the simplistic ideas of forcing can’t tell us how much CO2 warms oceans. That’s taking the greenhouse gas effect seriously.

    2) Now for the greenhouse gas effect, that isn’t. I can’t find it after looking at Connolly’s work on balloon data. They plot molar density against atmospheric pressure to get 3 equations of state for the atmosphere and no trace of any greenhouse gas effect. I’ve found no convincing refutation of the Connolly’s work. If there were a greenhouse gas effect, it should be possible to show it and Connolly’s results would not hold.

    • Norman says:

      Mark Pawelek

      I read through Connolly’s work when I clicked on your name link.

      You say you cannot find any convincing refutation of Connolly’s work.

      It hurts to read his flawed writing. He says he studied Chemistry but he does not understand how emission works. He believes (falsely) that N2 emits more energy than CO2 in the atmosphere because the very little IR emitted by N2 is at a higher energy level. How can he be so shallow in his thinking? It is NOT just the energy of an individual photon that determines a macroscopic energy flow, it is the sheer number of emitted photons per area.

      Nitrogen emits millions of times less energy than CO2 or Water Vapor, that is why it is ignored. It will have insignificant heating or cooling effects.

      Here you want proof he is a discredit to his science studies look here and do your own study:

      https://www.spectralcalc.com/spectral_browser/db_intensity.php

      • ClintR says:

        N2 is about 800,000 ppm compared with about 400 ppm CO2.

        N2 emitted photons have about 3 times the energy of the CO2 15μ photon.

        Yet Norman believes “Nitrogen emits millions of times less energy than CO2…”

        Norman prefers false religions over science.

        • Norman says:

          ClintR

          Once again you display your ignorance of any science. You are a troll looking for reactions. It is the only purpose for you posts.

          Go study some science and come back when you really want to learn. Grow up, trolling is a child activity.

          Fact: It does not matter that the extremely few N2 molecules that emit under some conditions, emit higher energy photons. There is more to total energy emission than the energy per photon. It would also depend on the number of photons emitted per unit time per area. These are ideas your trolling cannot grasp since you don’t have a science background of any type.

          Just a loud annoying troll that wants to stir up things. I have already interacted with enough trolls on this blog. When you want to discuss actual science I might listen. Now you are just an ignorant troll pretending he believe he knows some science.

          • ClintR says:

            2nd chance–

            N2 is about 800,000 ppm compared with about 400 ppm CO2.

            N2 emitted photons have about 3 times the energy of the CO2 15μ photon.

            Yet Norman believes “Nitrogen emits millions of times less energy than CO2…”

            Norman prefers false religions over science.

          • Mark C says:

            Norman, your insults only work for you in your own reality. The use of ad hominem attack is neither productive nor informative, it only speaks ill of you … not those you show contempt for.
            People who can voice reason and prove their point don’t need to shower people with invective.

          • Nate says:

            “N2 is about 800,000 ppm compared with about 400 ppm CO2.

            N2 emitted photons have about 3 times the energy of the CO2 15μ photon.”

            And how often do they emit a photon compared with CO2?

            Doesn’t that matter, Clint?

  3. donald penman says:

    I wonder if we will have a high satellite temperature for June if USA and Europe have heatwaves or will somewhere else offset this.
    ttps://youtu.be/wLZx6_qMW8U

    • Roy Spencer says:

      I’ve been watching the Siberian heat wave, and over the rest of Asia, cooler than normal temperatures have reduced the whole region’s average anomaly to about +1 deg. F or less.

  4. joan says:

    Hello,
    thanks for the posts,
    I work in remote sensing,
    I know temperature estimation from satellite is not surface air temperature,
    why satellite data (surface temperature) are not consider in the standard global warming datasets, at least to have the spatial temperature variation?
    when they will be? do you have any idea?
    thanks so much

  5. Greg Sullivan says:

    So the models are actually not too bad. Drats – the warmists were right.

    • Stephen Richards says:

      So i’ll buy your house at half the market price and that won’t be bad for you ?

    • Nate says:

      Data trend is not half of predicted. It is between 2/3 and 3/4.

    • Neal says:

      Greg,

      No one is arguing that the Earth has been in a general warming trend since the end of the Little Ice Age (and before the Little Ice Age occurred).

      What is at debate is how much of that warming is due to CO2 emissions caused by man’s activity.

      The models represent that theory, and the models to not match reality. So, a scientist would conclude that the theory fails. That is how we have used the scientific method for hundreds of years.

      AGW does not think the Scientific Method should apply to their brand of “science”.

  6. Rob says:

    Roy-

    Thank you for what you are trying to do, but after the recent COVID debacle when they predicted 2 to 3 million deaths alone in the US- certainly a less chaotic system than the overall climate, more and more of us are reflecting on the Mark Twain adage-

    “There are lies, damned lies, and statistics”

    • Entropic man says:

      Rob

      You don’t need a model, just some basic maths.

      Without precautions each Covid-19 case infects three more.

      R=3

      Herd immunity (when the virus runs out of hosts) kicks in when 1-1/R of the population is immune.

      For the US that is 332 million*1-1/3=221 million.

      Covid-19 kills 1% of those it infects, so total deaths will be about 2.2 million.

      Note that it will probably take 2 years to reach herd immunity, so rejecting the 2 million total deaths estimate because they haven’t all happened in the first few months is not reasonable.

      • ClintR says:

        The virus is not very contagious. And the virus is ineffective against a healthy immune system.

        But, be as stressed out as you want. Just remember, stress weakens your immune system.

        • Stephen Richards says:

          Where did you get the data that shows CoVid as “not very contagious”

          • ClintR says:

            The cruise ship “Diamond Princess” was a perfect “lab” for studying the virus. With about 3700 people, confined in very close quarters for nearly a month, only about 700 tested positive. That’s about 20% infection rate. In such close contact, that’s not very contagious.

            The death rate was about 0.2%, of those that got the virus, and all were over the age of 70, with pre-existing conditions.

            Somewhat typical numbers for an average flu.

          • ClintR says:

            Sorry, that should by “about 2%”.

          • Nate says:

            We have a lot more data now showing it is indeed very infectious.

            Other anecdotal data as well.

            For example, one infected international visitor led to this:

            “Early in the Massachusetts outbreak, an annual meeting of Biogen executives and employees could be almost entirely blamed for the known spread of Covid-19 within the state. About 175 senior employees met at a hotel in Boston in late February, when the coronavirus was barely a blip in the US. They were unaware, of course, that someone would bring the virus with them to the meeting.

            By March 12, there were 95 confirmed cases in Massachusetts and 77 were linked to the Biogen meeting”

        • Galaxie500 says:

          32,000 new cases in the USA alone today. There really are some imbeciles on this site.

  7. Ed Bo says:

    As an engineer whose models must be made accurate, even if not on the first cut, I am completely mystified as to how, when virtually all CMIP5 models (111 out of 114 by one count) are overly sensitive to CO2 increase, the CMIP6 models are made MORE sensitive.

    I have been looking for any coherent justification for this, but so far have found none. Has anybody found a justification that passes the laugh test?

    • Entropic man says:

      The model is the physical simulation of the climate. Basically solving the Javier-Stokes energy flow equations for a 50km grid covering the planet.

      Not 114 models, but 114 runs of the same model. What differs are unknown future parameters such as volcanos,aerosol pollution, El Nino and how much CO2 we will emit.

      The result is a range of possible outcomes.The model which comes closest to reality is the one whose assumed parameters came closest to reality.

      Reality has come in near the low end of the range, because cooling effects such as aerosols were underestimated when the runs were made.

      There is a flaw in Dr Spencer’s argument. He assumes that the average of the model runs is what projects reality, which was never the case. The run whose variable parameters best match reality will be the best projector.

      • Entropic man says:

        Imagine you have an engineering model designed to project the lifetime of a bridge. You calculate how many load cycles it can withstand before it cracks, and then make multiple runs at different traffic levels to estimate how many years it will take to inflict the critical number of load cycles.

        The model which most accurately projects the actual life of the bridge will not be the one closest to the average, but the one closest to the actual traffic.

      • Event Horizon says:

        “Not 114 models, but 114 runs of the same model. What differs are unknown future parameters such as volcanos,aerosol pollution, El Nino and how much CO2 we will emit.”

        With all due respect, as a physicist I call this a complete lie. The climate is a multivariable, nonlinear system with both positive and negative feedbacks. Please answer these questions:

        – how do you know you have all the variables you need in the models? Hint: you don’t. Nobody does.
        – you make it sound like you measured all past and current parameters and constraints accurately and only future ones are unknown. This is another lie. Climate models are simply nonlinear coupled differential equations. The problem with them is that you do not know accurately all initial conditions, the number of variables, etc. If you did, you could run the models backwards and accurately reproduce the Mauder minimum, the Roman maximum, etc. Can the models do that?
        – finally, the way NASA uses the weather data to determine how much the planet has warmed should make any reputable scientist blush. The number of stations simply do not sample the planet’s surface nowhere near enough.

        I have a challenge to anyone thinking the annual average temperature of the Earth could be measured within a fraction of a degree Celsius using station data. Let’s seal a 4 story building somewhere at moderate latitudes. We’ll turn off heat and AC, but we’ll install 10,000 thermometers inside that give data every second. Then, to simulate the coverage from GISS, we give 20 NASA scientists the possibility to pick any 20 thermometers they desire whose readings they’ll use to calculate the average annual temperature of the building. I guarantee you none will match the average of the 10,000 thermometers within a fraction of a degree C.

        • bdgwx says:

          It sounds like you’re dissatisfied with NASA’s approach.

          Do you have a dataset that you feel is trustworthy that we could use for comparison?

          Do you know of a better way to measure the global mean temperature from surface reports only?

        • bdgwx says:

          I guarantee you none will match the average of the 10,000 thermometers within a fraction of a degree C.

          Yeah. That’s correct. Let’s assume the RMS error on those thermometers is +- 1.0C. The error of the mean is then 1/sqrt(20) = 0.2C for the 20 case and 1/sqrt(10000) = 0.01C for the 10,000 case.

          But everybody already know that. It’s kind of a “duh” thing (no disrespect meant). That’s partly why the global mean temperature error is higher in the past.

          Although I don’t favor any one dataset over the other I do like to post publications from Berkeley Earth because they are often referred to as the “independent” and “skeptical” group and because they’re publications are easy (relatively) to follow. Here is how they measure the global mean temperature and quantify the uncertainty.

          http://static.berkeleyearth.org/papers/Methods-GIGS-1-103.pdf

        • Norman says:

          Event Horizon

          There is considerable global coverage.

          https://tinyurl.com/ybsd4r58

          They have over 20,000 stations with data.

          Also the point is not to get a super precise global temperature. More to see what direction the temperature is going. The amount of recording devices may be sufficient for such purposes.

          If you had only the 20 thermometers out of 10,000 you could still tell if the building was warming or cooling and you could get a good estimate of the amount of either cooling or warming if the thermometers were spread around.

      • mandrewa says:

        “He assumes that the average of the model runs is what projects reality, which was never the case. The run whose variable parameters best match reality will be the best projector.”

        Don’t blame Dr. Spencer. He is following the climatic community’s norms.

        Picking and focusing on the model that comes closest to the data may seem like the natural and obvious thing to do, but it would also make it clear how far each specific model is from the data.

        Taking the average of all of them removes the focus from just how bad they are individually.

        • bdgwx says:

          Taking the average has been shown to provide a closer match to reality than picking any one model alone.

          In some cases and only for a limited domain a lone model could provide an even better match to reality than the ensemble mean. But that could have occurred by accident.

          For these reasons the ensemble mean is typically preferred.

          • Robert Austin says:

            The ensemble mean may be “preferred” by modelers but it has no scientific validity. There is no reason to put forth that the average is closer to reality than an individual model that happens to produce output closest to following the global temperature constructions from surface data. In fact, the spread of results for the various models goes to show that the science and mathematics used to build these models is not well understood and does not seem to be improving with time.We have no better idea of the sensitivity to CO2 doubling than we did 30 years ago with FAR.

          • bdgwx says:

            This technique is used in many scientific disciplines and it works well. For example, the ensemble mean of many models is used for weather forecasting because it dramatically increases the skill relative to selecting just a single model. Why would you not want more skill?

      • Rob Slightam says:

        Navier Stokes is not solvable by current mathematics

      • Bo H says:

        You can only measure reality in present and past. So for the future you don’t know which run will match reality, that why you have to make 114 runs and take an average. So, if anyone has a flaw in the argument, it’s certainly not Dr Spencer.

  8. Svante says:

    https://tinyurl.com/y9yp3yvq

    This is primarily because low cloud water content and coverage decrease more strongly with global warming, causing enhanced planetary a*b*s*o*r*p*t*i*o*n of sunlight – an amplifying feedback that ultimately results in more warming. Differences in the physical representation of clouds in models drive this enhanced sensitivity relative to the previous generation of models.

  9. Bohous says:

    It seems suspicious to me that the temperatures from models (both CMIP5 and CMIP6) oscillate periodically every year in the right part of the graph. The measured data have no such regular pattern. What is the source of the oscillation in the models?

    • Entropic man says:

      Bohous.

      The global average temperature does show an annual cycle. Land varies more than ocean and the majority of land is in the Northern hemisphere. Thus the raw data tends to show an annual peak in the Northern Hemisphere Summer.

      The models reflect this.

    • Entropic man says:

      Look at the seasonal cycle graph here.

      https://data.giss.nasa.gov/gistemp/graphs_v4/

      • Steve Case says:

        Entropic man says:
        June 26, 2020 at 6:21 AM
        Look at the seasonal cycle graph here.

        https://data.giss.nasa.gov/gistemp/graphs_v4/

        GISTEMP?

        Here’s a comparison of GISTEMP since 1997:

        https://i.postimg.cc/Hx7sZhkT/image.png

        They make several hundred changes to their Land Ocean Temperature Index (LOTI) every month, Nearly always ALL anomalies newer than 1980 are bumped up and most before that date are bumped down. Here’s what that looks like:

        https://i.postimg.cc/Xv6f3DjS/image.png

        Here are the number of monthly changes made since January 2019:

        Number of Changes to GISSTEMP’s LOTI for 2019
        Jan Feb Mar Apr May Jun Jul Aug Sep Oct Nov Dec
        843 370 481 633 1359 566 281 400 674 284 284 341

        Number of Changes to GISSTEMP’s LOTI for 2020
        Jan Feb Mar Apr May Jun Jul Aug Sep Oct Nov Dec
        319 240 313 340 298

        Source:
        https://data.giss.nasa.gov/gistemp/tabledata_v4/GLB.Ts+dSST.txt

      • barry says:

        Looks like they’ve been adjusting closer to the truth.

        https://noconsensus.wordpress.com/2010/03/24/thermal-hammer/

        That result is not statistically different to GISS for the same periods.

        In fact, the skeptics got a higher trend for the period 1978 to 2010 than GISS.

        Same story with BEST.

        Anthony Watts’ published paper (Fall et al 2011) got the same results for the US.

        I don’t know what the beef is supposed to be when skeptics who publish their own surface temperature records get much the same results as the major institutions.

        In fact, all criticism seems to be based on anything but the critic actually working out their own version of the global surface temp record. Strange that.

        • Steve Case says:

          barry says:
          June 27, 2020 at 8:01 PM
          Looks like they’ve been adjusting closer to the truth.

          And my opinion is;

          Looks like they’ve been in bed with each other.

          • barry says:

            Did you check the link, Steve? That was a surface record made by strong skeptics. Fall et al is Anthony Watts for crying out loud.

            So the skeptics and the mainstream are “in bed together”? Anthony Watts is conspiring with NOAA and GISS? Jeff ID is in bef with Phil Jones?

            Sure. Must be.

        • bdgwx says:

          Steve,

          So your hypothesis is that all of the worlds surface datasets are adjusting not to arrive closer to the truth but to move further away from it?

          How might you convince of that?

          • Steve Case says:

            bdgwx says:
            June 28, 2020 at 2:26 PM

            So your hypothesis is

            No, I stated my opinion.

          • bdgwx says:

            Convince us. The best way of doing so is to present a dataset that you feel represents the truth and we’ll see how other datasets compare to it.

  10. bdgwx says:

    Here is Hausfather’s take on it.

    https://www.carbonbrief.org/cmip6-the-next-generation-of-climate-models-explained

    Overall both CMIP5 and CMIP6 do pretty well over the entire range from 1880. CMIP6 pretty much nailed the warming trend +0.07C/decade vs +0.07C/decade observed.

    Even during the 1979-2019 period it doesn’t look too bad. And when taking in the context of the full range from 1880 it seems as though the differences may be more spurious in nature and less systematic.

    Note that this comparison is using GISTEMP instead of Had.CRUT.

    • Event Horizon says:

      Anyone that thinks from 1880 to 1970 we had enough surface temperature data to claim the planet warmed 0.070.01 deg C per decade is scientifically illiterate as far as I’m concerned. There were no weather stations in Antarctica during this period, only 2 in the entire South America, three in Africa, none in the Middle East, etc:

      https://data.giss.nasa.gov/gistemp/station_data_v4_globe/

      How in the world did we measure the average global temperature with such precision in this period when all readings were done and recorded by hand several times a day at best?

      • bdgwx says:

        The error is larger in the past. Around 1880 it was +- 0.1C or higher for an annual mean as compared to +- 0.05C for 1970. GISTEMP also uses ERSST which increases spatial sampling some. But the problem remains that reporting sites were sparse pre-1900 which is why these surface station datasets don’t go back any further.

        BTW…for an “independent” and “skeptical” alternative to GISTEMP you can use the Berkeley Earth data. http://berkeleyearth.org/data/ There are others as well including NOAA, Had.CRUT, Cowtan&Way, etc.

        • Stephen Paul Anderson says:

          BGDWX,

          We finally have your leftist utopia…..CHAZ.

        • ClintR says:

          bdgwx believes Berkeley Earth is “independent” and “skeptical”!

          He believes in his false religion. That’s why he never gets anything right.

      • Gordon Robertson says:

        event…”How in the world did we measure the average global temperature with such precision in this period when all readings were done and recorded by hand several times a day at best?”

        We did not, you forgot to mention several significant wars including WWI and WII. In fact, no one cared about a global average till recently. The averages produced retroactively are completely fudged and the source of the warming has been fabricated by the IPCC, which is run by climate alarmists.

    • Gordon Robertson says:

      bdg…from your link…”In the lead up to the IPCC AR6, the energy modelling community has developed a new set of emissions scenarios driven by different socioeconomic assumptions….”

      More GIGO….Garbage In, Garbage Out.

  11. Eben says:

    For a real comparison cut the surface warming by half , because the rise has been doubled by maladjustments

  12. Eben says:

    where are the charts measuring the whole earth surface temperature by satellites just like the air above instead using thermometers

      • Eben says:

        I see , only 13 years but what a great match, except the only way two completely different sets of data match so perfectly is when exactly the same people handle both of them. The shysters don’t even have the presence of mind to make them at least a little bit different so as not to make it obvious.

      • barry says:

        You have to be a teenager, Eben. The intellectual vapidity you display just cannot be from a grown-up.

        You get an answer to your question and then trash it with barely a glance. Not even a thank you. You’re a waste of bandwidth. Maybe there is something useful in your real life that you can actually do. If so, do it a lot and pray you learn some sense under that labour. Here, you’re a boorish idiot.

        • Richard M says:

          Barry, Roy did a comparison with AIRS last year:

          https://www.drroyspencer.com/2019/05/the-weakness-of-tropospheric-warming-as-confirmed-by-airs/

          Notice how well it compares with UAH. Now try comparing that AIRS data with the data in the paper you linked. Maybe I can help. Here’s a comparison of UAH with GISTEMP:

          https://woodfortrees.org/plot/uah6/from:2003/to:2017/plot/uah6/from:2003/to:2017/trend/plot/gistemp/from:2003/to:2017/offset:-0.4/plot/gistemp/from:2003/to:2017/offset:-0.4/trend

          I’m confused. How did AIRS track very closely to UAH in Roy’s chart and very closely with GISTEMP in Gavin’s chart yet UAH and GISTEMP appear not to track each other?

          • bdgwx says:

            In his blog post Dr. Spencer says “To compute LT from the AIRS profiles I have taken into account the somewhat different vertical profiles of sensitivity in the UAH and RSS LT weighting functions, as well as the different southern extent of the “global” domains (UAH extends to 82.5 deg. S, while RSS is to 70 deg. S) in the global averages.” So it sounds like Dr. Spencer applies a model to the AIRS data to produce an alternate output he feels is suitable for comparing to UAH LT.

          • Richard M says:

            bdgwx, I guess Roy would need to explain what he did for us to know for sure. Of course, this opens the question of exactly what did the J Susskind et al 2019 paper do with the data to tie it to surface temperatures. However, this is interesting:

            “The AIRS data set contains many monthly mean geophysical parameters in addition to surface skin temperature. More details about AIRS and how quality controlled geophysical parameters are
            determined from AIRS observations are given in appendix.”

            It looks like AIRS itself is already making adjustments which means to compare against the UAH Tropospheric temperatures those geophysical changes would need to be removed.

          • bdgwx says:

            According to the paper no changes were made to the way AIRS generates data or to the methodology used to analyze it. It provides native skin temperature and surface temperature products. I don’t see anything about “geophysical changes”.

            And according to the document there is no native UAH TLT equivalent product. There is a temperature profile product provided by AIRS which I highly suspect Dr. Spencer uses for deriving the needed TLT equivalent. Only he can provide details of how he post-processed the AIRS data.

            The paper says AIRS skin temperature and surface temperature products are used for the comparison with GISTEMP, Had.CRUT, Cowtan&Way, and ECMWF.

        • Eben says:

          barry thinks I’m some Gretard Doomberg

          https://www.youtube.com/watch?v=nUb4MovqcBY

          BTW are you so dumb that you don’t know you should type your name with the capitol B “Barry”

          https://www.scribendi.com/advice/capitalization.en.html

          Capitalization rule #2

          Use capitals for proper nouns. In other words, capitalize the names of people, specific places, and things.

        • ClintR says:

          barry, you could apply that same comment to several others like bobdroege and ball4.

          It’s interesting that you find nothing wrong with thier comments, huh?

          • barry says:

            Oh yes, fascinating, muckraker.

            No, they are not even in the same hemisphere for sheer stupidity and bad manners.

            But thanks for tacitly agreeing that Eben is a boor. Its interesting that you haven’t seen fit to… (yawn) zzzzzzz.

          • ClintR says:

            As I stated, it’s interesting that you find nothing wrong with the comments from the idiots on your side:

            https://www.drroyspencer.com/2020/05/uah-global-temperature-update-for-april-2020-0-38-deg-c/#comment-483852

          • Eben says:

            bary (Bary) is a classic example of a person who is stuck on “Warming Stupid”, he has his hockey stick glasses on and the only things he ever sees is warming and nothing else.

            In a contrast unlike majority of people in here , I will point out anyone who is posting fake science and breaking the laws of fizzix, no matter what side they are on.

            PS; help me out here People, if a dumb person like him spells his name with lower case like he does and you make a reply starting with his name What type you use ? if you use “b” you look like you don’t know the sentence should start with Capitals , and if you use B it might look like you are talking about somebody else ,
            What to do ?

          • bobdroege says:

            ClintR,

            Yeah, I have a problem with posters who lie about what I post and attack me instead of my arguments.

            I thought you decided I was an idiot and since you don’t argue with idiots you were not going to respond to me, but here we are with you dragging one of my posts from one thread to another.

            I am so mutherfucking tired of that as well.

            So since foul language seems to strike a nerve with you,

            just grow the fuck up.

          • ClintR says:

            bob is very upset that he is being held responsible for his actions. That’s why he’s never matured.

            https://www.drroyspencer.com/2020/05/uah-global-temperature-update-for-april-2020-0-38-deg-c/#comment-483852

          • bobdroege says:

            Says the dude who calls people idiots.

            Also thinks he is holding me accountable, what a crock.

            I am not the one who has been banned multiple times.

          • ClintR says:

            The title “idiot” is earned by refusing reality. Bindidon, bdgwx, and Svante consider it a sign of distinction. They’re happy with the title. If you’re not happy with your choices in life, maybe you should consider changing.

          • bobdroege says:

            ClintR,

            You should grow the fuck up and stop calling people idiots.

            Especially those who know more physics than you.

            Tell me where did you study physics.

            Hell, tell me where you studied anything.

          • ClintR says:

            bob, “idiots” are people that refuse to accept reality.

            If you’re not happy with your choices in life, maybe you should consider changing.

          • bobdroege says:

            What does that make you ClintR?

            The reality is that the Moon spins on its own axis as it revolves around the Earth.

            I have proven it several different ways, it is you refusing to accept reality.

            You have not refuted any of the proofs offered that the Moon rotates on its own axis.

          • ClintR says:

            Sorry bob, but all you’ve proved is that you’re an immature, hostile idiot.

            NASA ISS Flight Director’s example of revolving (orbiting) is exactly what Moon is doing. The fact that we only see one side of Moon from Earth means it is not rotating about its axis.

          • bobdroege says:

            Funny thing ClintR

            Robert Frost would agree that the Moon is indeed rotating on its axis.

            “Sorry bob, but all you’ve proved is that you’re an immature, hostile idiot.”

            Again, I am mutherfucking tired of these ad-homs, and I am mutherfucking tired of these insults.

            I may be an immature, hostile idiot, but I get the science correct.

            You are wrong I am right nanny nanny boo boo!

          • ClintR says:

            Yes bob, you are an immature, hostile idiot, but you don’t get the science correct.

            At least you’re now realizing you’re an idiot.

        • Eben says:

          If you read Dr Spencer’s linked post about it below, You see he is saying basically the same thing I did , they are making it fit the way they want to, and he is not taking it too seriously.

  13. barry says:

    The linear trend for Had.CRUt4, same data that Roy is applying in the OP, is 0.174 C/decade (+/- 0.033). Is that much different to the CMIP models?

    Roy gets 0.072 C/decade warming from Had.CRUt4 using a 2nd order polynomial. So I’d like to know the uncertainty estimate that goes with that, as well as the model ensemble envelope. Or else work out the model mean trend with uncertainty estimate. Otherwise we’re not getting the full picture.

    By sight, the difference doesn’t seem to be much significant. IIRC, 2nd order polynomial is almost certainly going to get a wider uncertainty range than a linear analysis. Best to get some numbers on it rather than rely on a quantitative analysis.

    Also, I don’t know why one would align to a single year. If it is a cold year in the obs, but a warm year in the model mean, it’s going to skew the results, for example. Better to average a number of years. A good way to do that would be to start the comparison earlier, match a 30-year period to even out fluctuations – say 1951-1980 – and then compare the evolution. You can still run trend analyses, but at least you haven’t subjected the visual comparison to the vagaries of a single year.

  14. Colin says:

    Carbon tax

  15. Steve Richards says:

    Doctor Roy, it is good that you are writing a paper to be published by the GWPF.

    And that you have given an early gist of it here for criticism.

    I hope you take from the messages above that your writing has to be as clear, complete and unambiguous as possible to withstand the torrent of comment you will receive.

    I look forward to reading the paper.

  16. Brent Auvermann says:

    PMFJI, but it appears that Dr. Spencer aligned the quadratic FITS at 1979, not the data themselves, so that obviates your otherwise legitimate concern pretty well. The quadratic fits do not perfectly match the data at every point, so aligning the polynomials at any particular year – 1978, 1979, whatever – doesn’t give leverage to a hot or cold year and therefore does not create the problem that aligning the underlying data and CMIP output would create per your observation.

  17. Mark Wapples says:

    I am struggling with this modelling situation.

    Am I rigjt that they run hundreds of simulations of the models and tjen pick the one or two that come close to the experimental data to justify the models?

    • Entropic man says:

      Justify?

      To whom?

      Other scientists?

      Politicians?

      Denialists?

    • bdgwx says:

      Models from different groups using different techniques and available data are submitted to CMIP. Each group develops their model in hopes that they have done a better job than their peers. The final result you see is often the mean of all model runs with an envelop representing the range in which 95% of those runs fall within. Because no one model perfectly matches reality and because we have no reason to believe any group has laid the proverbial golden egg scientists consider the mean to be the most representative of reality.

      But anyway…yeah…regardless of the discipline when scientists are presented with two or models of reality they pick the one that provides the best match and which has the least amount of complexity necessary. That’s why we still use general relativity for the macroscale, quantum mechanics for the microscale, etc. Neither of those are perfect, but it’s the best we have so far.

  18. jenne says:

    would love to see MSUlt plots (more representative of the atmospheric IR emission altitude) and also OHC (better metric).

    In addition, and regardless of the metric, zonal mean plots as well as ocean vs land would be interesting to understand where differences between CMIP5/6 and observations stem from.

  19. Eben says:

    99.97% consensus group think

    https://youtu.be/LrzixbOfb7Y?t=359

  20. BrianUnsom says:

    Life’s a Risk (June 2020)FailArmy

  21. Russ says:

    Statistical analysis is a tool of science. It in itself is not science. It is a malleable tool at that, being most useful (or most deceiving) when the actual science is so poorly understood as that of climate change.

    • bdgwx says:

      It is a great tool indeed. It is especially useful in disciplines that frequently encounter chaotic, non-linear, or otherwise non-deterministic systems. I wish I had a better grasp of statistical methods myself.

    • Gordon Robertson says:

      Russ…”It is a malleable tool at that, being most useful (or most deceiving) when the actual science is so poorly understood as that of climate change”.

      I agree. Models should only be used to give a ballpark idea of what you might be dealing with. They should never be used as they are currently being used to predict the behavior of a virus with no precedent and about which nothing is known.

      Models are very useful in the electrical/electronic/computer field because you can lay out a circuit in a model like PSpice and test the circuit in various ways. However, to validate the model, you must built the real circuit, test it, and compare its output to that of the model. If both agree, the model is validated.

      As it stands, we have essentially shut down the world on the basis of unvalidated models which have proved incorrect. Furthermore, we have no way of scientifically proving their offshoots, social distancing and self-isolation. In my home province here in Canada, the government has claimed an unvalidated model predicted disaster if social distancing and self-isolation was not followed, a blatant lie and a misuse of models.

    • Svante says:

      Russ,
      Statistics is a branch of Mathematics, the most solid science of all, where everything has an absolute proof.

      • Russ says:

        Not true Svante. Math is not a science.

        Math branches like stats, arithmetic, geometry, algebra, and calculus are excellent tools, all invented by man to better understand and manage science(nature). Commerce too, but that’s another story. Sciences on the other hand such as physics, chemistry, and biology behave according to laws of nature that have been around long before man ever came along.

        • Svante says:

          Alternatively it’s “the Queen of Science”:
          https://tinyurl.com/onzltq4

          It’s more solid that other sciences because it is proved within itself (although you can test it with numerical methods).

          I’d say it’s discovered rather than invented. A few basic rules have logical consequences and there’s nothing you can do about it.

          Nature follows those rules, to the point were Einstein could work out the special theory of relativity using pen and paper.

  22. Rising CO2 levels most likely started after the trough of the Great Depression.

    A more rapid rise started in 1950.

    The analysis should start in 1932 or 1950, at the latest.

    Starting in 1979 makes no sense.

    The fact that pre-1979 data are not close to.global, infilled, and repeatedly adjusted is a problem.

    Starting in 1979 is also a problem

  23. Dan Pangburn says:

    why CO2, in spite of being a ghg, does not now, never has and never will have a significant effect on climate. In simple terms, water vapor has been increasing faster than possible from feedback (temperature increase of the surface water) and has been 10 times more effective at increasing ground level temperature than has CO2 increase. Graph from Hitran: https://drive.google.com/file/d/1DTd1bBZZTFf4xXfJNLsHw66ojELVeeyi/view?usp=sharing

    • Stephen Paul Anderson says:

      Dan,
      How do you know that it is the water vapor causing the temperature and not the temperature causing the water vapor?

    • ClintR says:

      CO2 cannot warm the surface. Any such effect would be negligible. Water vapor has even less ability to warm the surface. With an average photon energy much less that CO2, water vapor’s effect would be much less than negligible.

      • Dan Pangburn says:

        ‘Back radiation’ is a misleading idea invented by people who don’t understand how heat transfer analysis is done. In engineering heat transfer analysis (that is how it is done to get the correct answer) radiation from the cooler surface cancels like radiation (same wavelengths) from the warmer surface so the net energy flow is always from warmer to cooler and is proportional to the difference between the 4th power of their temperatures. i.e. q1,2 = k * (T14 – T24). Where q1,2 is the energy going from 1 to 2 which is negative if 2 is at a higher temperature.

  24. Eben says:

    Check out how one of the hard core alarmist red-pilled himself
    https://bit.ly/2ND3jMQ

    • Chic Bowdrie says:

      Eben,
      You beat me to it. There are many reviews on Michael Shelleenberger’s book which was released today I believe. We prolly won’t have to hold our breath for the naysayers here to pan the book.

  25. GeorgeMaync says:

    The Kid LAROI, Juice WRLD – GO (Official Video)

  26. Chic Bowdrie says:

    Dr. Spencer,

    How about a post reviewing the just published “Apocalypse Never” book?

  27. Chic Bowdrie says:

    https://tinyurl.com/y7pa85y8

    Environmental Progress: praise for Apocalypse Never

    • Gordon Robertson says:

      chic…”Environmental Progress: praise for Apocalypse Never”

      The author must be saying something right if he has gotten alarmists Tom Wigley and Kerry Emanuel of MIT on-side.

  28. Chic Bowdrie says:

    bdgwx has been pontificating about Earth’s energy budgets on a previous post that seems more relevant to this post’s topic.

    http://www.drroyspencer.com/2020/06/covid-19-global-economic-downturn-not-affecting-co2-rise-may-2020-update/#comment-493728

    bdgwx says, “Condensing gases like H2O have latent heat. When water evaporates off the land/ocean surface it carries that energy with it thus providing a cooling tendency. If you want to balance the surface energy budget you must consider it. Per Wild 2013 this is 84 W/m^2.”

    I agree evaporation affects the surface energy budget, but what does that have to do with the question of whether an increase in CO2 causes any forcing leading to a global temperature increase?

    • bdgwx says:

      The surface energy imbalance is a product of all ingress and egress energy fluxes. If you want to understand what influences the gain/loss of heat near the surface you have to understand all of the components that go into that budget. Evaporation increases the latent heat component of the egress flux. CO2 increases the DWIR component of the ingress flux. More CO2 means higher ingress flux. More ingress flux means more warming all other things being equal.

      • ClintR says:

        bdgwx imagines: “The surface energy imbalance is a product of all ingress and egress energy fluxes.”

        That’s one of the mistakes in the “energy imbalance”. Not all fluxes are the same, because not all of the photons are the same. You’re trying to count apples by the number of trucks passing. But, if each truck has a different number of apples, your results are bogus.

        • bdgwx says:

          Nobody is counting trucks or apples. We’re counting joules. And yes we know photons contain a different number of joules depending on their frequency. Specifically it is E=hf. Nevermind that some of the energy we’re talking about isn’t even in the form of radiation. 1 joule is still 1 joule regardless of what form it is in. I’m not even sure what it is you’re challenging here.

          • ClintR says:

            If you’re counting “Watts/m^2”, you’re counting “trucks”. They use “Watts/m^2” because it’s easier to fool people. They can end up with bogus results like “+0.6 Watts/m^2, net absorbed”, and idiots will believe it.

            https://en.wikipedia.org/wiki/Earth%27s_energy_budget#/media/File:The-NASA-Earth's-Energy-Budget-Poster-Radiant-Energy-System-satellite-infrared-radiation-fluxes.jpg

            A REAL energy budget needs to be in “Joules”.

          • bdgwx says:

            Just multiple by the number of seconds in a year and the number of square meters there are on Earth. It’s not that hard.

            For example the 340.3 W/m^2 back-radiation component is 340.3 * 31556952 * 510e12 = 5.48e24 joules of energy in one year.

            Or if that is too hard then use A as the constant for Earth’s area and W-years for the amount of energy in one year. The back-radiation component is 340.3 Wy*A of energy in one year. You don’t even have to do any arithmetic.

          • Gordon Robertson says:

            bdg…”For example the 340.3 W/m^2 back-radiation component is 340.3 * 31556952 * 510e12 = 5.48e24 joules of energy in one year”.

            You cannot measure radiation in joules, watts, or anything else. In fact, you cannot measure energy per se, you can only measure the effect it has on a mass. Energy is still an unknown phenomenon and how do you measure the unknown?

            When radiative energy is emitted from the surface, the surface cools and loses so many watts or joules of heat. The heat lost is not transferred to the radiation, it is converted to a different form of energy which has no mass. It’s not possible to talk about a mass-less energy having a number of watts since a watt is derived from mechanical energy as in the horsepower.

            A HP is the amount of work required to raise a certain weight through a certain number of metres. Therefore watts and joules are a measure of mechanical energy which happens to have an equivalent in heat. In other words, a joule can be converted to its heat equivalent in calories, and vice versa. That’s where the word came from, the scientist Joule, who discovered that equivalence.

            By the use of joules, you are inferring heating or work done. The heat or work is related to the mass of the Earth contacted by the radiation. “IF” the mass absorbs the radiation, the absorbing electrons jump to higher orbital levels and the mass as a whole heats.

            At the risk of beating the obvious to death, heat cannot be transferred from a cooler atmosphere to a warmer surface. You can have all the back-radiation hypothesized, it can’t be absorbed by the surface.

            Besides that 340 something number came out of a hat. There is no way you could can have as much energy back-radiated by 0.04% of the atmosphere as what was radiated by the entire surface. Kiehle-Trenberth invented it to balance a fictitious budget.

            What does this have to do with models? It is one of the key components of a model. CO2, as back-radiated in a model, is weighted to have a warming factor between 9% and 25%. That’s partly why models are reading so high. The second incorrect factor is that the BR acts as a positive feedback.

            One of the so-called expert modelers from NASA GISS, Gavin Schmidt could not even explain positive feedback. To hear Schmidt talk, it’s the feedback that causes the warming. In a true PF system, it’s an amplifier that causes the gain and last time I looked there was no amplifier in the atmosphere.

          • ClintR says:

            bdgwx claims: “Just multiple by the number of seconds in a year and the number of square meters there are on Earth. It’s not that hard.”

            That’s my point. Converting flux to energy introduces significant errors. The errors are so large the “0.6 Watt/m^2, net absorbed” is nonsense.

            bdgwx understand little about science. Earth’s actual radiating surface is not the same as a sphere with Earth’s radius. And that’s just one of the flaws in the “energy balance”.

          • Norman says:

            Gordon Robertson

            Again with your anti-science Contrarian views, presented as valid information, but wrong!

            I guess in your courses they never touched on the 1st Law of Thermodynamics. Energy can neither be created nor destroyed.

            Radiation is energy. You don’t know what you are talking about.

            Here you show you don’t even understand the science.

            Your false misleading claim (what contrarian like to do, mislead with false information to try and sway people):

            YOU: “Besides that 340 something number came out of a hat. There is no way you could can have as much energy back-radiated by 0.04% of the atmosphere as what was radiated by the entire surface. Kiehle-Trenberth invented it to balance a fictitious budget.”

            That number comes from many measurements taken around the world and averaged! Only about 10% of this number comes from CO2 the bulk comes from water vapor and clouds.

            Lie on, it is the only thing you know how to do. Honest and truthful inquiry is the mind state of a contrarian. Lies, deception, distortion, these are the make-up of a contrarian.

          • ClintR says:

            Norman says: “Only about 10% of this number comes from CO2 the bulk comes from water vapor and clouds.”

            10% of 340 is 34. Gordon will likely appreciate Norman proving him right.

          • Gordon Robertson says:

            norman…”Again with your anti-science Contrarian views, presented as valid information, but wrong!”

            “That number comes from many measurements taken around the world and averaged! Only about 10% of this number comes from CO2 the bulk comes from water vapor and clouds”.

            ****

            Are you claiming the Ideal Gas Law is an anti-science, COntrarian view?

            Kiehle-Trenberth admitted in their article on the energy budget that they estimated the values we are discussing. There have been no physical measurements to corroborate their estimations since the spectrum of CO2 is covered by the spectrum of water vapour.

            Besides, the Ideal Gas Law makes it clear that a trace gas like CO2, at about 0.04 percent mass can supply no more heat to the atmosphere than 0.04%. It’s equally obvious that nitrogen and oxygen at nearly 99% mass supplies most of the heat, which it gets from the surface and maybe from incoming solar.

      • Chic Bowdrie says:

        “More CO2 means higher ingress flux.”

        This is an assertion without evidence. Stop pontificating and show the data from experiments that support your claim. A hypothesis is simply your imagination until you expose it to experimental data.

        • bdgwx says:

          This is now the 3rd time I’ve posted this.

          Philipona et al. 2004: Radiative forcing ‐ measured at Earth’s surface ‐ corroborate the increasing greenhouse effect

          Evans 2006: Measurements of the radiative surface forcing of climate

          Ramaswamy et al. 2001: Radiative forcing of climate change

          Also refer to IPCC AR5 Chapter 8. There’s 400+ publications in the bibliography at the end of the chapter.

          • Gordon Robertson says:

            bdg…”Philipona et al. 2004: Radiative forcing…”

            Don’t you have anything scientific from real climate scientists, like Roy or John Christy?

            This is an old reference that proves nothing. They rely heavily on the theories of Arrhenius, Tyndall, and Callandar, theories that have not proved that CO2 in the atmosphere, at 0.04% is warming the atmosphere. In fact, neither Arrhenius nor Callandar saw significant warming since they both thought such warming would be beneficial.

            “Ramaswamy et al. 2001: Radiative forcing of climate change”

            … more assumptions from climate modelers. Note the obfuscation:…concept…assumption…general relationship…

            “The practical appeal of the radiative forcing concept is due, in the main, to the assumption that there exists a general relationship between the global mean forcing and the global mean equilibrium surface temperature response (i.e., the global mean climate sensitivity parameter, λ) which is similar for all the different types of forcings. Model investigations of responses to many of the relevant forcings indicate an approximate near invariance of λ (to about 25%).

            “Also refer to IPCC AR5 Chapter 8.”

            We know how the IPCC operates. Politically-appointed lead authors pick the reviewers, then 50 of them write a Summary of what the reviewers found, changing it liberally to what the LAs think SHOULD have been found. Then the main report is amended to fit the views of the 50. The reviewers can appeal the changes but they are ignored, based on lame reasoning.

            According to Richard Lindzen, who was involved with the IPCC reviews at the time, the 2500 reviewers did NOT claim it was 90% likely that humans were causing global warming. Most wanted to wait and see what developed. That iconic statement was formed by the 50 LAs and imposed on the main review.

            John Christy, who has been a Lead Author and a reviewer, has commented that many reviewers have no interest in doing honest reviews. They attend the reviews with preconceived notions.

          • bdgwx says:

            Don’t you have anything scientific from real climate scientists, like Roy or John Christy?

            Both believe CO2 puts a positive radiative force on the surface. So does Lindzen, Curry, and McKitrick.

          • Chic Bowdrie says:

            “This is now the 3rd time I’ve posted this.”

            This will be only the second time I have rebutted you on this assertion, IIRC. Another troll [D.A.] used to make the same assertion with those citations which I called his “trifecta.” Again those papers use models to make the claim that forcings and calculated fluxes are real energy transfers. Where is the resulting temperature increases after controlling for the conflating ASR – OLR variables?

            A calculation or a forcing is not an flux unless it changes a temperature.

        • bdgwx says:

          I’m curious Chic…how many peer reviewed lines of evidence have you posted on this blog?

          • Chic Bowdrie says:

            I’ll gladly be the first to post one that is definitive either way. Meanwhile, when are you going to stop pontificating about your unverified models with none of your own analysis to back them up?

            Should I add some ad-homonyms? Uh no, just imagine them.

          • Chic Bowdrie says:

            Ouch. That should be ad-hominem. My spell checker didn’t have that.

            No racially tinged overtones or dog whistles intended.

          • bdgwx says:

            You can add whatever name calling you feel best helps you find actual bona-fide peer reviewed publications that rebuts any of the peer reviewed research I or anyone else posts. I’m one of those pesky skeptics who’s swayed by evidence; not be “nuh-uh” arguments and blogger opinions.

          • Chic Bowdrie says:

            Pesky skeptic? You fooled me by the way you defend every IPCC dogma to the hilt.

          • Nate says:

            On the one hand we have BDGWX who regularly offers up real published papers, as well as IPCC reports, to back up his claims.

            And the other hand we have Chic, who often dismisses such papers as ‘appealing to authority’, and yet regularly offers up ‘blog science’ to back up his claims.

            As we have pointed out, the ‘blog scientists’ often are uninformed about the topics they are discussing (eg Revelle factor). Or worse yet, filtering the facts they present to buttress a political argument, rather than to seek the truth.

      • Chic Bowdrie says:

        bdgwx says, “If you want to understand what influences the gain/loss of heat near the surface you have to understand all of the components that go into that budget.”

        At the surface, evaporation, conduction, and radiation all contribute to moving energy away from the surface. How can the surface lose 390 W/m2 (the SB equation equivalent of 289K at the surface) at the same time it is losing a combined 97 by conduction and evaporation?

        “CO2 increases the DWIR component of the ingress flux.”

        What is the source of the energy that allows CO2 to allegedly increase DWIR?

        • bdgwx says:

          How can the surface lose 390 W/m2 (the SB equation equivalent of 289K at the surface) at the same time it is losing a combined 97 by conduction and evaporation?

          I refer you to Wild et al. 2013.

          ingress-SW = 161
          ingress-LW = 342
          egress-latent = 84
          egress-sensible = 20
          egress-LW = 398

          Net = 161 + 342 – 84 – 20 – 398 – R = +0.6 W/m^2 where R is a rounding error of 0.4.

          The surface does not lose 390 W/m^2. It gains +0.6 W/m^2. The 398 W/m^2 LW egress is but one flux term that needs to considered along side all of the others.

          What is the source of the energy that allows CO2 to allegedly increase DWIR?

          UWIR

          • Chic Bowdrie says:

            At the beginning of each day, the surface warms and begins cooling via evaporation, conduction, and radiation all at the same time. The SB W/m2 equivalent of the surface temperature cannot all be included in the UWLR amount. So your 398 W/m2 egress-LW amount is inflated from the get-go (daybreak) on. Even so, 40 W/m2 of that will go to space directly, leaving only a net UWLR of 16 W/m2 more than the inflated DWLR.

            Let’s assume your 84 + 20 = 104 is correct. Subtract that and the 40 W/m2 going directly through the atmospheric window from 398 W/m2 (the SB equivalent of an average global temperature) and that leaves 254 W/m2 the SB equivalent of a temperature around 259K. Real cold.

            Let’s look at your UWLR source another way. The surface has to shed 161 W/m2 of new sunlight every day. 40 W/m2 goes directly to space and 104 W/m2 leaves the surface by sensible and latent heat. That leaves a net UWLR of 17 W/m2. Not that much.

            All of that net UWLR is absorbed within the lower troposphere and most of it close to the surface. It doesn’t matter how much more CO2 is there. If you think it makes a difference, you have to have experimental evidence. Without the data, all you have is a hypothesis and speculation about rising emission altitudes.

            The existing surface temperature and the daily solar insolation are the source of all UWIR radiation. Any increase in DWIR comes from an increase in UWIR, not CO2 unless otherwise proven by experimentation rejecting the null hypothesis.

          • bdgwx says:

            So your 398 W/m2 egress-LW amount is inflated from the get-go (daybreak) on

            It’s not my figure. It comes from Wild 2013. Wild weights the UWIR component heavily with Stephens 2012, Kato 2012, and Berrisford 2011 which use satellite and reanalysis products.

            But if you have another estimate I’ll review it. I know Trenberth 2009 shows 396. Earlier research used by the IPCC showed 390.

            Let’s assume your 84 + 20 = 104 is correct. Subtract that and the 40 W/m2 going directly through the atmospheric window from 398 W/m2

            Hold on. Why would we want to do that? The 398 figure is with the 84+20=104 figure. If you were to remove the latent and sensible heat fluxes then the UWIR figure of 398 would be different.

            and that leaves 254 W/m2 the SB equivalent of a temperature around 259K. Real cold.

            And that should be a clue that something isn’t right since the surface is near 289K and inline with expectation of a 398 W/m^2 radiator.

            Let’s look at your UWLR source another way. The surface has to shed 161 W/m2 of new sunlight every day.

            Plus the 342 W/m^2 of DWIR. Don’t forget that.

            That leaves a net UWLR of 17 W/m2. Not that much.

            Again…another pretty good clue something isn’t quite right with your analysis.

            It doesn’t matter how much more CO2 is there. If you think it makes a difference, you have to have experimental evidence.

            It does matter. Experimental evidence started appearing in the 1850’s with Foote and Tyndall’s experiments. The experiments got more sophisticated and convincing from there. We now have the observational infrastructure to do the experiments on a planetary scale and daily.

            Any increase in DWIR comes from an increase in UWIR, not CO2 unless otherwise proven by experimentation rejecting the null hypothesis.

            That’s certainly one way DWIR could increase. It could also increase if you add more GHGs like H2O, CO2, CH4, CFCs, etc. to the atmosphere. And like I’ve posted multiple times the evidence is available. You just “nuh-uh” it all without ever providing any evidence of your own that disagrees. I don’t think I’ve ever seen even a single publication you’ve linked to.

          • Chic Bowdrie says:

            “[398 W/m2] is not my figure.”

            I wasn’t asking you for a reference. I’m wondering whether it is worth my time corresponding with a mind-numbed robot or a sentient person. I am asking you to consider whether it makes sense that the surface loses that much radiation at the same time it is losing energy by other means.

            “Why would we want to [subtract 104 from 398]?

            Because the 104 is not UWLR. The 40 is, but I want you to focus on a realistic amount of UWLR that can be a source of more DWLR.

            “And that should be a clue that something isn’t right….”

            Yes, and it is your inability to think beyond the dogma you have ingested.

            “Plus the 342 W/m^2 of DWIR.”

            No, 161 + 342 is 503 W/m2. That shows how exaggerated your DWLR is. It can never be more than UWLR – 40 and UWLR can never be more than 294 W/m2. 398 is the black body number assuming radiation was the only way the surface could lose energy.

            “Again…another pretty good clue something isn’t quite right with your analysis.”

            I should have qualified the 17 W/m2 as the amount that actually contributes to increasing atmospheric temperature at the surface (161 – 104 – 40). All of this phony budget accounting of yours is a dodge (obfuscation, IOW) from addressing the real problem of lack of evidence showing any difference an INCREMENTAL increase in CO2 has any further effect on global temperature. If any, it’s too little to measure.

            “We now have the observational infrastructure to do the experiments…[showing DWLR could] increase if you add more GHGs like H2O, CO2, CH4, CFCs, etc. to the atmosphere.”

            You haven’t provided the evidence of UWLR – DWLR being changed by adding any IR absorbing gas. You think citing papers using spectroscopy models is doing that. You are wrong. And I can’t link to papers that don’t exist.

          • bdgwx says:

            You think citing papers using spectroscopy models is doing that. You are wrong.

            So what kind of evidence would you accept to be convinced?

            And I can’t link to papers that don’t exist.

            That’s a problem then isn’t it?

          • Nate says:

            “No, 161 + 342 is 503 W/m2. That shows how exaggerated your DWLR is. It can never be more than UWLR 40 and UWLR can never be more than 294 W/m2. 398 is the black body number assuming radiation was the only way the surface could lose energy.”

            Highly confused logic, Chic.

            398 UWLR is from SB law. It just is.
            No assuming in there.

            503 DW achieves surface balance with UW 398 84 20, as it should.

            342 is what comes from cool sky and warm clouds. It is reasonable.

            Must be. Meterologists measure such values all the time and incorporate into weather models. Apparently you think they have it all wrong?

          • Chic Bowdrie says:

            b, this is your problem: I am asking you to consider whether it makes sense that the surface loses [398 W/m2] radiation at the same time it is losing energy by other means.

            Are you going to address this yourself or double down on what your nitwit Bobbsey twin came up with??

            As usual he has no data, no models, just empty speculation and hand-waving obfuscation.

            Here is a class room demonstration that attempts to show the crucial difference between room air and carbon dioxide gas. Maybe you can make a few changes to the experimental design and come up with a detectable difference between 4% and 5% CO2 in humid air. Start with dry and large enough concentrations of CO2 and water vapor to max out your signal. Make sure your apparatus allows unrestricted convection.

            https://www.physics.upenn.edu/~pcn/Ms/18PhysTeacher.pdf

          • bdgwx says:

            I am asking you to consider whether it makes sense that the surface loses [398 W/m2] radiation at the same time it is losing energy by other means.

            Of course it makes sense. Objects can shed heat via multiple mechanisms simultaneously. There is no law of thermodynamics that says otherwise.

            Maybe you can make a few changes to the experimental design and come up with a detectable difference between 4% and 5% CO2 in humid air.

            Sure. The first thing I would do is get a different IR camera. The FLIR E60 has a spectral response of 7.5-13 um. https://tinyurl.com/yawo98tg. You really need a spectral response of 10-20 um with preferred isolation at 15 um. The second thing I would do is use longer tubes. To simulate 400 ppm of CO2 you need about 1 meter tube of pure CO2. For an increase to 500 ppm you’d need to add another 1-2 meters of length to the tube length. https://tinyurl.com/2wa2te

            But I’m not sure this is necessary since the experimenters from your link come to the conclusion that their experiment is consistent with the fact that seemingly small concentrations over kilometers of depth can have a significant effect. They then provide further references of evidence and experimental setups to demonstrate this like Keating 2007.

            BTW…I was particularly interested in Wagoner 2010 which states that experiments demonstrate that higher CO2 actually suppresses convection.

          • bdgwx says:

            Chic,

            I also wanted to say that was a great link you posted. It had an actual experiment and it provided a bibliography with bona-fide publications that I could cross check. I learned something from that link. I hope you did as well.

          • Chic Bowdrie says:

            “There is no law of thermodynamics that says otherwise.”

            How about conservation of energy? You can’t lose the same energy at the same time from the same location by more than one means otherwise you are double counting. I don’t see why you can’t admit that other than your employers won’t be happy if you deviate from the dogma you are sworn to defend.

            “…experimenters from your link come to the conclusion that their experiment is consistent with the fact that seemingly small concentrations over kilometers of depth can have a significant effect.”

            Someone publishes an opinion and you accept it carte blanche? I’d rather do your experiment and find out for myself, but I don’t have that equipment.

            Kudos for reading the Wagoner paper. How much difference do you expect a 1% change in CO2 concentration will have on convection?

            Honestly, I only found the link because of your dare. I really don’t have the time otherwise and I need to get back to my own work. Thanks for acknowledging the learning. I regret we can’t be in that mode all the time.

          • Nate says:

            “How about conservation of energy? You can’t lose the same energy at the same time from the same location by more than one means otherwise you are double counting.”

            Indeed. But there is no double counting here. Not ‘the same’ energy being lost.

          • bdgwx says:

            Chic: How about conservation of energy? You cant lose the same energy at the same time from the same location by more than one means otherwise you are double counting.

            It’s not the same energy. The ingress flux is 503 W/m^2 and egress flux is 502 W/m^2. The egress flux is comprised of latent heat (84 W/m^2), sensible heat (20 W/m^2) and radiant heat (398 W/m^2). Nothing is being double counted because the energy budget Ingress – Egress – Uptake = 0.

            Chic: Someone publishes an opinion and you accept it carte blanche?

            Of course not. I see if the experiment has been replicated by independent parties.

            Chic: Id rather do your experiment and find out for myself, but I dont have that equipment.

            Same here. The equipment is expensive. The FLIRs are several thousand dollars. I wish I had one. The next best thing is to see if someone else has also done the experiment. Turns out…they have.

            Chic: Kudos for reading the Wagoner paper. How much difference do you expect a 1% change in CO2 concentration will have on convection?

            Not much according to the paper. The point is that CO2 does NOT help the Earth cool via an enhanced convection process.

    • Norman says:

      Chic Bowdrie

      I am not sure but I think I might have linked you to this study in the past. This study indicates that CO2 does contribute to some forcing which leads to a global temperature increase.

      https://newscenter.lbl.gov/2015/02/25/co2-greenhouse-effect-increase/

      • ClintR says:

        “Studies” like this are always so amazing because people seem to want to be fooled. Most would understand that more CO2 molecules in the atmosphere mean more absorbed photons will be emitted from more molecules. That means more photons going to space (cooling). But the photons returning to the surface do not imply warming. The study just mentioned “forcing”. The quick video did not talk about temperatures.

        In fact, the text seemed to reveal there was no detectable temperature increase from CO2: “This means the Earth absorbed more energy from solar radiation than it emitted as heat back to space.” The word “temperature” wasn’t even in the text, or video. Norman just took the word “forcing”, and translated it to “which leads to a global temperature increase”. Believers see CO2, and they have been trained to automatically believe temperature increase.

        Some people want so much to believe in the false religion.

        • Nate says:

          “This means the Earth absorbed more energy from solar radiation than it emitted as heat back to space.”

          “and translated it to ‘which leads to a global temperature increase”

          Certainly the most likely outcome of extra added energy. Why not?

          Where else do you think the extra energy went?

          OK, well it could have evaporated some water, or melted some snow, but then that energy ultimately results in warmer soil or atmosphere.

          • ClintR says:

            It’s just a big production to say what is already known–“It’s the Sun, stupid”.

          • Nate says:

            If by ‘big production’ you mean atmospheric physics, then yeah.

      • Chic Bowdrie says:

        Yes I remember looking at the paper. I probably complained of seeing no temperature measurements. So how do you know the CALCULATED forcing actually did lead to any global temperature increase? I only see transmission data. Were any net radiation measurements were made?

        It looks like the changes in transmission correlate with changes in CO2. That makes sense, but does it have any effect on global temperature? How would you know?

        A forcing is just a calculation. It only becomes real when it actually changes temperatures.

        • Nate says:

          “A forcing is just a calculation.’

          Hmm.

          Many measured things are calculated. The volume of liquid in thermometer changes, we measure it, we know the relationship to temperature, from that we calculate temperature.

          Most people are happy to call that a measurement of temperature.

          In this case net energy flux is calculated from measurements of net IR radiative flux.

          Same concept.

          • Gordon Robertson says:

            nate…”A forcing is just a calculation.

            Many measured things are calculated. The volume of liquid in thermometer changes, we measure it, we know the relationship to temperature, from that we calculate temperature”.

            *****

            A forcing is a different animal. Climate models are based on differential equation theory. For example, the Navier-Stokes Equation are DEs that describe motion in viscous fluids, like air.

            If I set up a differential equation to represent an electronics amplifier, I need to test its frequency and impulse response. An extreme test is to hit it with a square wave because the rapidly rising front edge and the rapidly descending trailing edge ‘forces’ the amplifier into extreme conditions.

            The application of a separate function to force the response of a main differential equation is called a forcing and the applied equation is a ‘forcing function’.

            That terminology has moved from the theoretical realm of mathematics to the real atmosphere, with the inference that CO2 is something forcing a response akin to a climate model equation forcing function. There is no proof that such an action exists in the real atmosphere. It has never been measured, only inferred.

          • Nate says:

            “There is no proof that such an action exists in the real atmosphere.”

            The proof is energy input was measured. Its called a forcing because energy input means there will be a response– such as warming. See 1LOT. Nothing controversial about that.

          • ClintR says:

            Surface energy is supplied by solar, and is already in the system, so transfering it to the atmosphere is not adding energy to the system.

            Not adding energy to the system is not going to raise temperatures.

          • Nate says:

            “Not adding energy to the system is not going to raise temperatures.”

            Wachu talkin bout Willis?

            Energy is constantly being added to the system by the sun.

            Then it is removed to space through the atmosphere, which acts as an insulator.

            If it becomes a better insulator, the temp rises.

            True for my house with my furnace on, and I close windows, the house will get warmer.

            True for my oven, with the door closed it will get hotter.

            This is heat transfer 101.

          • ClintR says:

            Sun adds energy, CO2 does not add energy.

            Insulation is not a good model for the atmosphere. A much better model is a “temperature-controlled cooling system”. The hotter the atmosphere becomes, the more energy it emits to space. Adding CO2 just increases the ability to radiate more energy to space faster.

          • bdgwx says:

            Adding CO2 just increases the ability to radiate more energy to space faster.

            It’s not doing a very good job.

          • ClintR says:

            The atmosphere is doing a great job. The atmosphere is one of the reasons Earth does not have temperatures above the boiling point of water, as happens on Moon.

            But, speaking of not doing a very good job, maybe if you and Nate team up you can make up some new stuff:

            https://www.drroyspencer.com/2020/06/covid-19-global-economic-downturn-not-affecting-co2-rise-may-2020-update/#comment-494406

          • Nate says:

            “Insulation is not a good model for the atmosphere.”

            Declaration without support. No credit.

            There is a temperature gradient across a layer of insulation. There is a flow of heat through it.

            There is a temperature gradient from the Earth’s surface to space. There is a flow of heat from the surface to space.

            Thus insulation is perfectly good representation of what the atmosphere is doing.

          • ClintR says:

            That “temperature gradient” is often referred to as the “lapse rate”. The lapse rate is anathema to idiots. It proves the heat flow is from surface to space. There goes their false religion.

            If you want to think of the atmosphere as insulation, just remember it has special properties. The hotter it gets, the less it insulates.

          • Nate says:

            ‘The lapse rate is anathema to idiots. It proves the heat flow is from surface to space.’

            Not at all. That’s the whole point of what an insulating atmosphere does.

            ‘The hotter it gets, the less it insulates.’

            Uhhh, no. Where do you get these weird ideas?

          • ClintR says:

            What you believe are “weird ideas” come from “physics”, Nate. Obviously a subject unknown to you. That’s why you can’t get the correct answer:

            https://www.drroyspencer.com/2020/06/covid-19-global-economic-downturn-not-affecting-co2-rise-may-2020-update/#comment-494406

          • Nate says:

            And as expected, you cannot say where the weird idea comes from, since it is clearly just made up.

          • ClintR says:

            Nate, you forgot the rule.

            I don’t attempt to teach physics to idiots.

          • Nate says:

            When you can’t backup your made-up claims, go with inane insults. Straight from the troll handbook.

          • ClintR says:

            The atmosphere is doing a great job. The atmosphere is one of the reasons Earth does not have temperatures above the boiling point of water, as happens on Moon.

          • bdgwx says:

            What’s the mean temperature of the Moon and how does that compare to Earth?

          • ClintR says:

            Ask Arrhenius, he’s one the high priests of your false religion.

          • Chic Bowdrie says:

            Typical Nate and bdgwx obfuscations. No models, no data. Here we go again with hand-waving and speculations. Nothing new.

          • Nate says:

            No answers or rebuttal or any information, just pointless insults.

            The Clint style does not become you.

  29. Gordon Robertson says:

    Roy…”a report I am doing for the Global Warming Policy Foundation…”

    Good for you Roy, thanks for link.

    https://www.thegwpf.org/

  30. Gordon Robertson says:

    In a post above Chic Bowdrie referred to a new book “Apocalypse Never. In a brief review, a reviewer compared the use of climate models to the medical models used currently for covid, claiming that the current medical models have been used unscientifically, causing widespread discomfort and inconvenience for many people.

    I am not trying to get off-topic into the covid mess but there are parallels between the climate models and medical models of a serious nature. The climate models, promoting inconveniences like carbon taxes and green technology that is endangering wildlife, have thus far been inane. The medical models have put people out of work, closed businesses, and created widespread hysteria about a virus, little of which is scientifically understood.

    Roy mentioned that climate modelers have made false comparison to lure people into supporting them. The medical models have done the same. The main medical model from the UK Royal Society, drove the UK government into a hysterical frenzy of shutting the country down and infringing on the rights of Britons.

    When the model was finally studied, it was found to be seriously wanting, not only in it’s statistical analysis but in the very programming itself. One expert wrote that had the programmer worked for him he’d have been fired.

    After the Third Assessment(TAR), the IPCC declared that future climate states cannot be predicted. That was a no-brainer but they went ahead and tried to do it anyway, using unvalidated climate models. They got away with it till expert reviewer, Vincent Gray, pointed out that unvalidated models cannot be used to make predictions. Without offering acknowledgement, or even an apology to the public, the IPCC quietly changed their wording from ‘predict’ to ‘project’.

    So what is a projection as opposed to a prediction? The only difference I can see is that a prediction has a definite inference whereas a projection is a pseudo-lie aimed at trying to convince the public you know what you are talking about.

    That’s what is going on right now with the covid mess. Theorists are lying through their teeth to give the impression they can control a virus, which has no precedent and about which little is known. For all we know, its effect on general populations is no worse than the common flu.

    I am for banning unvalidated models of all forms from being used in government policy. However, politicians the world over have proved themselves to be absolutely stupid when it comes to accepting propaganda from theorists.

    • gallopingcamel says:

      Gordon,

      Somehow I missed your thoughtful comment.

      There is a common thread to “Climate Change” and “COVID-19”. The government lies on these matters of “Science” ~50% of the time.

      The problem for the little people (such as you or me) is to figure out when they are telling the truth.

  31. Gordon Robertson says:

    bdg…”But anywayyeahregardless of the discipline when scientists are presented with two or models of reality they pick the one that provides the best match and which has the least amount of complexity necessary. Thats why we still use general relativity for the macroscale, quantum mechanics for the microscale, etc. Neither of those are perfect, but its the best we have so far”.

    I am getting the impression that you are generalizing the meaning of the word model as presented by Roy. He is obviously referring to climate models which are computer programs trying to emulate the atmosphere and oceans.

    You seem to include theories like relativity and quantum mechanics as models. A product of quantum theory is the field of electronics and even organic chemistry. Although electronics theory and the molecules of organic chemistry are of necessity models, their applications are not models, they are proved fact. No climate model can claim the same distinction.

    Furthermore, general relativity has not replaced Newtonian mechanics on the macro scale as many relativity junkies would have us believe. In fact, GR has very little in common with Newtonian mechanics other than in the relative motion of masses.

    There are some weird scientists out there who are trying to replace Newtonian mechanics theories such as gravity with junk science, like space-time curvature, but they are on the lunatic fringe.

    Most science today still relies on the basics Newtonian theory. Even electronics and organic chemistry fill that bill. Although quantum theory is handy when learning the theory, once it is applied, we get back to Newtonian standbys like Ohm’s Law and other theories that were developed long before quantum theory and are more accurate in the applications for which they are designed.

    You will see very few design engineers trying to apply quantum theory or relativity theory in practice. They apply equations that are based on quantum theory but not quantum theory per se.

  32. Gordon Robertson says:

    The following shows how seriously naive and disturbed climate modelers can be. It is from a link posed earlier by Svante….. https://agupubs.onlinelibrary.wiley.com/doi/pdf/10.1029/2019GL085782

    “The severity of climate change is closely related to how much the Earth warms in response to greenhouse gas increases. Here we find that the temperature response to an abrupt quadrupling of atmospheric carbon dioxide has increased substantially in the latest generation of global climate models. This is primarily because low cloud water content and coverage decrease more strongly with global warming, causing enhanced planetary absorp-tion of sunlight an amplifying feedback…”

    I claim they are naive because they have no idea how physics works and I call them disturbed because they project a pseudo-reality from their delusions about how the atmosphere works.

    In the first place, they state that greenhouse gases are warming the atmosphere as if it is a statement of fact. The truth is that no one has supplied a shred of evidence that GHGs are warming it. Obviously they have bought into the paradigm in which they are immersed.

    Two, they make another statement of fact, that low cloud water content and coverage decrease more strongly with global warming. This is more model fiction based on the weighting factor of CO2 as a forcing agent which was clearly picked from a hat. CO2 is rated 9% to 25% a warming agent depending on the amount of water vapour available. More sci fi from Geophysical Research Letters.

    Thirdly, they claim that the sci-fi effect above leads to ‘enhanced planetary absorp-tion of sunlight an amplifying feedback…’.

    Will the sci-fi never end? Where is the proof, from physics, for any of these delusions? There is no such thing in physics as an amplifying feedback. Feedbacks do not amplify because they can’t. A feedback without an amplifier is nothing more than a signal that would attenuate, meaning a negative feedback.

    Amplification requires an amplifier and PF using an amplifier has a small feedback signal to the input from the output. The authors have no idea how PF works.

    Not once do they mention the law that governs the warming of gases, the Ideal Gas Law. The IGL is a well-established science written from 5 different scientists and is proved science.

    The Ideal Gas Law is PV = nRT and each one of the parameters is covered by different scientists such as the relationship between pressure, temperature, volume and the number of gas molecules available.

    If we can keep V fairly constant, which is doable, we modify the IGL to P = (nR/V)T, with quantities in brackets as a constant. This tells us that T varies with P only which is borne by the fact that P & T are fairly linear throughout the troposphere.

    Dalton’s Law is part of the IGL and it tells us clearly that the total pressure of a mixed gas is the sum of the individual gases. Since P is directly proportional to T it also means that the total heat in the atmosphere is the sum of the heats contributed by individual gases.

    We can bring in n = the number of molecules, if we like. With n, we can calculate the mass percent of each gas but all we need to see is that nitrogen and oxygen make up nearly 99% of the mass in the atmosphere. CO2 makes up roughly 0.04%.

    What does that tell us?

    1)based on mass percent, the maximum heat that can be contributes to the atmosphere by CO2 is roughly 0.04C per degree C of warming.

    2)it proves modelers have no idea what they are talking about and their CO2 warming weighting of 9% to 25% is based on lies and pseudo-science, not necessarily in that order.

  33. Aaron S says:

    My one concern with this method is that it assumes the Equilibrium climate state to a given CO2 level in time is recorded instantaneously by satellite data. So I struggle with the idea there are not potential lags between the measurements the ECS. For example, loss of albedo from melting oce and even low latitude snow as temperatures warm will create a lag between equilibrium temperatures and CO2 levels. Science have no grasp on this until we stabilize CO2 for a decade or so.

  34. Mark B says:

    For what it’s worth, I’ve downloaded the 13 CMIP6 2.6 ensemble members individually and plotted against the GISTemp V4 observations.

    It looks like there are three members that are running particularly hot relative to the observations that pull up the ensemble mean.

    https://southstcafe.neocities.org/gissCmip6_26.png

  35. Scott R says:

    It is ridiculous to continue starting trends in 1979. The historical CO2 levels were around 285 PPM. Now that are at 415ppm. We can therefore say that by the year 1988, 1/2 of the increase in CO2 had already been made. In 1940, we were around 311ppm. That is around 20% of the increase. You can not explain the 1940-1980 cooling trend without natural cycles. CO2 was rapidly increasing during that time.

    • Svante says:

      Yes, plus aerosols (direct and indirect effect), and ozone of course.

    • Gordon Robertson says:

      scott r…”In 1940, we were around 311ppm”.

      According to Kreutz, a German chemist, who took over 60,000 readings of CO2, there were levels exceeding 400 ppmv in the late 1930s. Levels like that have been corroborated by several other scientists.

      The 311 ppmv level you have cited comes from proxy levels in ice core samples. There is a whole lot wrong with that methodology according to ice core expert Jaworowsky.

      https://friendsofscience.org/assets/files/documents/CO2%20Gas%20Analysis-Ernst-Georg%20Beck.pdf

      http://www.warwickhughes.com/icecore/zjmar07.pdf

    • Midas says:

      (I) You have again ignored the 20 to 30 year lag between CO2 concentrations and related global temperatures.

      (II) CO2 concentrations at the start of the Mauna Loa record in 1959 were 316 ppm. So no, they were NOT 311 ppm in 1941.

      (III) As Svante says, the immediate effect of the sudden increase of fossil fuel burning after WW2 was a surge in aerosol concentrations with led to cooling. The downswing in your “cycle” is aerosol cooling, which is clearly not natural.

      There is indeed natural variation – lot’s of it. Believing you can capture all of its causes in a single “cycle” is naivety in its extreme.

      • Scott R says:

        Midas so the huge temperature swings prior to 1940, how do you explain that? Blaming humans for both the 1940-1980 cooling and the 1980-2016 warming when you yourself said there is natural variation is intellectually lazy.

        By the way, where do you get the 20-30 year lag for Co2? When natural climate scientists point out the lag possible based on solar forcing that “can not be possible”. Cant have it both ways can we.

        • Midas says:

          Why would I have to explain swings, given that they are ONLY swings (ie. natural variability) and not a rise punctuated by mere plateaus as we have today.

  36. angech says:

    If I predict a really, really big rise in UAH for June will you do me a favour and print the opposite?
    Please.

  37. Aaron S says:

    Midas,
    You say:
    “(I) You have again ignored the 20 to 30 year lag between CO2 concentrations and related global temperatures.”

    How about a lag between solar magnetic flux and related global temperatures?

    Or between orbital forcing and related global climate?

    Point is the existence of lags destroy any relationship as being causal and IPCC et al assign direct links between today’s warming and CO2.

    It is a case for high uncertainty

    • Midas says:

      “the existence of lags destroy any relationship as being causal”

      Oh I see – so when I shoot someone and they don’t die until the next day, I am not guilty. Interesting.

      • Gordon Robertson says:

        midas…”Oh I see – so when I shoot someone and they don’t die until the next day, I am not guilty. Interesting”.

        Surely you could come up with a better analogy than that? Or is your impetuous alarmists hysteria uncontrollable?

        • Midas says:

          Your issue is that my analogy shows the nonsense of his statement, which you chose not to support.

    • Nate says:

      Aaron, lags are well understood to be part of the story that is modeled.

      For example the global energy imbalance as measured by ocean heat content rise is reflecting a lag between the in coming and outgoing energy flux. And thru it, the future warming already baked-in can be estimated.

  38. Aaron S says:

    Midas,
    Not a valid analogy if you are assuming causation. What If you shot them with a paintball gun in the foot and they had a heart attack and died the next day? Certainly does not invalidate my point.

    The point I made is if you accept lags there are multiple well established variables associated with climate that could explain some amount of global warming in historical records. An obvious one is the sun activity but I consider it unlikely. Another is orbital parameters that just peaked and remain high currently, or another is the Earths magnetic field. Any of them including a lag between global temperature and peak farcing could occur like the 24 hr diurnal solar radiance cycle vs daily temperature pattern whereby nearly every day the peak incoming radiation occurs before peak temperatures by a few hours (~5% of the 24 hr cycle). Using my valid analogy suggests temperature peak could lag the 100,000 yr orbital forcing by ~5,000 years without issue.

  39. Aaron S says:

    Nate,
    I appreciate what you are saying. Are you talking about ARGO data?

  40. Entropic man says:

    Aaron S

    The lag shows in the maths.

    The surface temperature datasets show that we are 1.2C warmer than in 1880.

    Using the forcing equation you can calculate that this was caused by increasing the CO2 concentration to 370ppm.

    ∆T=5.35ln(370/280)3/3.7=1.2C

    Check the Keeling curve and you’ll see we passed 370ppm around the year 2000. The temperature increase lagged 20 years behind the CO2 increase.

    The current CO2 concentration is 411ppm. You would expect this to produce a temperature increase of

    ∆T=5.35ln(411/280)3/3.7=1.66C

    At the current warming rate of 0.2C/decade we will see that temperature in about 24 years time.

    These agree with Midas’ estimated lag of 20-30 years between the increase in forcing and the increase in temperature.

    It also explains why the 11 year solar cycle does not show in the temperature data. The lag is about twice as long as the cycle.

    • Gordon Robertson says:

      entropic…”Using the forcing equation you can calculate that this was caused by increasing the CO2 concentration to 370ppm”.

      Ever occur to you that the so-called forcing equation was created from incorrect CO2 data between 1880 and now?

      The Ideal Gas Law is contradicted by your CO2 forcing equation, I’ll go with the well established IGL.

      • Entropic man says:

        Easily proven.

        You’ve seen my data, now show me yours.

        If the Ideal Gas Law is responsible for the observed temperature rise from 287K to 288K, then PV should have increased by 0.3% or the mass of the atmosphere increased by 1.53*10^16 kg.

        Please show me the data which confirms this.

        • Gordon Robertson says:

          entropic…”If the Ideal Gas Law is responsible for the observed temperature rise from 287K to 288K, then PV should have increased by 0.3% or the mass of the atmosphere increased by 1.53*10^16 kg.

          Please show me the data which confirms this.
          Reply”

          ****

          I’ll have to point you to the Little Ice Age data over 400+ years during which the average global temperature dropped 1C to 2C. That massively increased the size of glaciers worldwide cooling the oceans and the solid surface. Cooler oceans mean less CO2 in the atmosphere.

          Since T changed then P must have changed as well in the same order provided n and V remained relatively constant. It’s a little more complex, however, since P varies with gravity. There is no other explanation for why P-30,000′ is 1/3 P-surface. The IGL says T should vary with P and it does.

          We are not taking about the IGL changing anything, everything depends on the Sun. I can’t think of a good reason for the LIA other than for the amount of energy entering the atmosphere being reduced. What I am claiming is that the distribution of heat throughout the atmosphere depends on the IGL, based on the mass-percent of constituent gases.

  41. Nate says:

    Yes. You can see here.

    https://tinyurl.com/mftkor6

  42. Aaron S says:

    Nate,
    3.7/3 came from where?

    • Entropic man says:

      Aaron. s

      That might have been for me.

      The basic forcing equation is ∆F =5.35ln(C/Co)

      ∆C is the change in energy flow in watts per square metre.

      C is the final CO2 concentration in ppm and Co is the initial CO2 concentration.

      ∆F is the direct effect of the change.

      To turn it into a real world temperature change you need two extra terms.

      Multiplying by 3 allows for climate sensitivity, the indirect amplification of the direct warming by other factors. I use the IPCC long-range figure.

      To convert from forcing (w/m^2) to temperature divide by 3.7. This is the change in energy input watteage necessary to change the surface temperature by 1C.

      3/3.7 is useful because you can use it to estimate the temperature change due to other forcing such as aerosols or Gordon Robertson’s ideas. For example IIRC the 11 year solar cycle changes the energy reaching the surface by 0.3W.

      0.3*3/3.7 is a temperature change of 0.24C.

      The confidence limits of the global average temperatures are +/- 0.1C, so the effect of the solar cycles disappears in the noise.

    • bdgwx says:

      Another approach people use is to leave it as ∆F in W/m^2 and then use a C per W/m^2 parameter. The estimates I’ve seen range from 0.5-2.0 C per W/m^2. It’s also believed that the climate does not have a static sensitivity. It may initially start low and then increase as feedbacks are activated. So even though it may average say 0.75C per W/m^2 so far that does not mean it will be the same going forward.

Leave a Reply to Entropic man