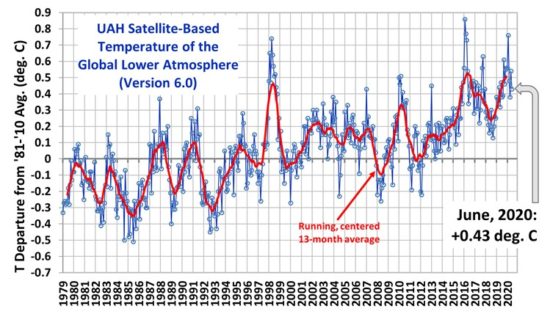
UAH Global Temperature Update for June 2020: +0.43 deg. C

July 2nd, 2020 by Roy W. Spencer, Ph. D.

The Version 6.0 global average lower tropospheric temperature (LT) anomaly for June, 2020 was +0.43 deg. C, down from the May, 2020 value of +0.54 deg. C.

The linear warming trend since January, 1979 is +0.14 C/decade (+0.12 C/decade over the global-averaged oceans, and +0.18 C/decade over global-averaged land).

Various regional LT departures from the 30-year (1981-2010) average for the last 18 months are:

 YEAR MO GLOBE NHEM. SHEM. TROPIC USA48 ARCTIC AUST 
2019 01 +0.38 +0.35 +0.41 +0.36 +0.53 -0.14 +1.15
2019 02 +0.37 +0.47 +0.28 +0.43 -0.02 +1.05 +0.05
2019 03 +0.34 +0.44 +0.25 +0.41 -0.55 +0.97 +0.58
2019 04 +0.44 +0.38 +0.51 +0.54 +0.49 +0.93 +0.91
2019 05 +0.32 +0.29 +0.35 +0.39 -0.61 +0.99 +0.38
2019 06 +0.47 +0.42 +0.52 +0.64 -0.64 +0.91 +0.35
2019 07 +0.38 +0.33 +0.44 +0.45 +0.11 +0.34 +0.87
2019 08 +0.39 +0.38 +0.39 +0.42 +0.17 +0.44 +0.23
2019 09 +0.61 +0.64 +0.59 +0.60 +1.14 +0.75 +0.57
2019 10 +0.46 +0.64 +0.27 +0.30 -0.03 +1.00 +0.49
2019 11 +0.55 +0.56 +0.54 +0.55 +0.21 +0.56 +0.38
2019 12 +0.56 +0.61 +0.50 +0.58 +0.92 +0.66 +0.94
2020 01 +0.56 +0.60 +0.53 +0.61 +0.73 +0.12 +0.66
2020 02 +0.76 +0.96 +0.55 +0.76 +0.38 +0.02 +0.30
2020 03 +0.48 +0.61 +0.34 +0.63 +1.09 -0.72 +0.16
2020 04 +0.38 +0.43 +0.34 +0.45 -0.59 +1.03 +0.97
2020 05 +0.54 +0.60 +0.49 +0.66 +0.17 +1.15 -0.15
2020 06 +0.43 +0.45 +0.41 +0.46 +0.38 +0.80 +1.20

The UAH LT global gridpoint anomaly image for June, 2020 should be available within the next week here.

The global and regional monthly anomalies for the various atmospheric layers we monitor should be available in the next few days at the following locations:

Lower Troposphere: http://vortex.nsstc.uah.edu/data/msu/v6.0/tlt/uahncdc_lt_6.0.txt
Mid-Troposphere: http://vortex.nsstc.uah.edu/data/msu/v6.0/tmt/uahncdc_mt_6.0.txt
Tropopause: http://vortex.nsstc.uah.edu/data/msu/v6.0/ttp/uahncdc_tp_6.0.txt
Lower Stratosphere: http://vortex.nsstc.uah.edu/data/msu/v6.0/tls/uahncdc_ls_6.0.txt


210 Responses to “UAH Global Temperature Update for June 2020: +0.43 deg. C”

Toggle Trackbacks

  1. Midas says:

    Could we please have more divisions in the data – Europe, Asia, Africa, South America, …

      • Midas says:

        You are really coming out with those considered replies today, aren’t you mate. Perhaps you’d care to share your reasoning, because someone who says “no” as a reflex response is by definition an unthinking denier.

        • Eben says:

          Reveal what slicer and dicer exactly are you using to splice your numbers

          • Midas says:

            Perhaps one day you will learn to write an intelligible English sentence that doesn’t look like it was penned by a 12 year old.

            Perhaps you’ll also learn that “slice” and “splice” are difference words with different meanings.

            And perhaps if you actually learned the meaning of “slice and dice” you would realise that it is deniers who do this by looking at below average temperatures in one city on one day and claim this is indicative of climate. We on the other hand take long-term averages and trends, the exact opposite of slicing and dicing.

          • Eben says:

            Are you using Michael E Mann’s splice-o-matic that was invented to created the hockey stick

          • Midas says:

            Sorry – make that “by a 10 year old”.

          • Eben says:

            Which part of no you don’t understand , or did you actually think Dr Spencer takes your quacking on this board seriously

  2. RW says:

    Thanks for the report.

  3. Midas says:

    18 consecutive months above +0.3.
    The previous record was 14 consecutive months, and that took a super El Nino.

    But of course we will eventually drop below +0.3 as (if) we head towards a La Nina, and deniers will insist on making comparisons with El Ninos instead of with other La Ninas.

    Number of +0.30+ months:
    Before 2010s (31 years): 18
    Starting 2010 (10.5 years) :56

    • Richard M says:

      Most of those 14 months have been under El Nino conditions. Seems you forgot that fact. Not to mention +PDO and +AMO.

      • Robert Ingersol says:

        Actually conditions have been in the neutral range the last 18 (not 14) months.

        https://psl.noaa.gov/data/correlation/meiv2.data

        More importantly, there is a strong warming trend upon which these cycles are being imposed. 1998 was an extremely strong el Nino which caused that year to obliterate the previous temp record set the year before. The six (mostly la Nina) years that followed were cooler. Thus was born “the pause”. 2005 and 2010 were modest el Nino years that were nontheless warmer than 1998, as was 2009 which was actually a la Nina year. But Neutral and la Nina years through 2013 were still cooler than 1998 so the myth of the pause persisted.

        Then Neutral 2014 beat 1998. A new super el Nino (though not as strong as 1998)started the next year causing 2016 to be the new super peak warming year. Every year after 2013 (including this year) has beaten 1998.

        Now that super hot, super el Nino 1998 is not even in the top ten warmest years on record. It is increasingly unlikely that anyone a live today will ever see another year as cold as 1998.

        Note that temp records above are based on surface instrumental records which are in closer agreement with each other, and have less uncertainty compared to the satellite MSU records.

        • Richard M says:

          Robert, the MEIV2 is a very questionable source. Use the NOAA ONI if you want to understand what is going on. The new MEI inserts a non-existent trend into the Nino 3.4 area. Not worth a hill of beans.

          • Midas says:

            What is your justification for saying such a trend is non-existent?

          • Robert Ingersol says:

            Your opinion regarding ENSO indices notwithstanding, 1998 remains an extreme el Nino year and now it is getting beat by la Nina years. That certainly suggests a strong warming trend.

            The fact that Spencer’s warming rate odometer just flipped to 0.14 K/decade indicates that warming is accelerating.

          • barry says:

            I’m not sure ypou know what you are talking about, Richard. All ENSO monitoring groups use various techniques to elimnate the warming trend seen over the course of the data, in order to account for only the ENSO oscillaitons. ONI does it with a sliding window. And it does it BECAUSE there is a trend. MEI also eliminates the trend to reveal the oscillations, which, after all, is the action contained within the definition of the el Nino Southern Oscillation.

    • SkepticGoneWild says:

      Loser Chicken Little no-nothings are always gonna sound the alarm. “The sky is falling!”.

    • Eben says:

      The number slicer and dicer Muffler boy crawled out of his igloo

    • mick says:

      Before 2010? you mean from the beginning of time? or from 1979

    • Midas says:

      We see here in these replies the “intelligence” of the denier clan. No science, just meaningless childish attacks.

    • Gordon Robertson says:

      midas…”18 consecutive months above +0.3.
      The previous record was 14 consecutive months, and that took a super El Nino”.

      Following the 1998 El Nino there was a sudden uptick of about 0.2C, followed by a lengthy flat trend. Same thing (uptick) circa 1977, which lead to the discovery of the Pacific Decadal Oscillation.

      http://icecap.us/images/uploads/More_on_The_Great_Pacific_Climate_Shift_and_the_Relationship_of_Oceans_on_Global_Temperatures.pdf

      • Midas says:

        That’s right, we continue to see a pattern of rises and plateaus, no falls. This despite the fact that solar activity has been steadily dropping for the past 40 years.

  4. Chic Bowdrie says:

    No temperature increase in twenty years.

    • Midas says:

      Hahaha – you’re a comedian!!

    • bdgwx says:

      The warming trend over the last 20 years is 0.159C/decade +-0.018.

      The warming trend over the entire period is 0.136C/decade +-0.007.

      Not only has the planet warmed over the last 20 years but the warming has occurred at a rate higher than that over the entire period.

      • ClintR says:

        Those panicked over the pandemic should be comforted by any global warming. Cold weather puts extra stress on weakened immune systems. Earth dodged a bullet getting through the solar minimum without too much adverse effect. And the attempt at a La Niña seems to have stalled. Another half a degree higher in UAH Global could really help, but that’s probably asking too much.

        • Simon says:

          “Those panicked over the pandemic should be comforted by any global warming.”
          Yeah coz two negatives make a positive in denier world.

          • ClintR says:

            Something that counters a disease is a “negative”?

          • Robert Ingersol says:

            @ClintR

            In case you haven’t noticed, the Florida COVID outbreak is coinciding with record heat in that state.

            I saw an article indicating that cigarette smoking may actually make one less susceptible to COVID. Even if true, I would still call smoking a “negative”.

          • ClintR says:

            I wonder if Florida residents live outside, in inside with air conditioning.

          • Midas says:

            ClintR

            Thanks for clearly pointing out that any slight effect on the spread of the disease by increasing temperatures is swamped to the point of being unnoticeable by other considerations.

          • ClintR says:

            You’re welcome, Midas.

            Glad to help.

          • Midas says:

            So you can cross that off your spin list as a “positive” for warming.

          • barry says:

            Hot weather doesn’t decrease COVId. It’s in the medical reports.

            Naturally, science deniers prefer fictions. Something a politician said, or a blog, or a…. news article.

            They never learn to get expert opinion. They just reflexively reject point blank the source that should be the first go-to.

      • Gary Palmgren says:

        Just an industrial lab squirrel here. I would just like to note there is no thermometer I work with that has an an absolute accuracy of 0.2°C and certainly would none I would trust one over a ten year period.

        Yes with constant calibrations one can get to that accuracy. Just like my analytical balances, when calibrated, could measure exactly how many angels are dancing the head of a pin. (a little sarcasm here.) But 0.2°C per decade from 25 years of data is not only noise, it still could be measurement error/drift. Its a tiny change in a chaotic system, and satellite measurements are very complex.

        Tony Heller has proven that that NOAH’s corrections to ground based thermometers has >90% correlation to CO2 in the air. The longer term ground based measurements are corrupt. Absolutely corrupt, as there is zero chance that honest corrections to the temperature record would correlate almost perfectly with CO2 levels. How would mercury thermometers make errors due to the CO2 level?

        I trust Roy Spencer’s work but the time frame is limited and the 1930’s record is essential but not available from Dr. Spencer’s work.

  5. Ernst says:

    Fortunately we have BLM now, otherwise Greta would have nothing to do.

  6. Aaron S says:

    How many years of a hiatus in warming until the smoothed UAH global temperature trend is out of the CMIP 5 distribution?

    The version 6 will probably have more low sensitivity scenarios as well as the high sensitivity ones already published to prevent this realization.

  7. David Vanegas says:

    Wow. 0.43 degrees warming over forty years Of intense industrial growth.

    Dear Mum,

    Nothing to write home about.

    • Lou Maytrees says:

      If one follows the little red running centered 13 month average line David, it is +.73*C over those past 40 years.

      And that is for the UAH Lower Atmosphere only, averaged at 11,000 feet, where not so many people live.

      • Midas says:

        I’ve always said that the 13-month average is too short to eliminate ENSO variation and the like. We should be going with the linear trend, which indicates a rise of about 0.55C in that time. But yes, the real surface rise is considerably higher.

    • barry says:

      5 degree C change removed 3 kilometers deep ice from North America in the climb out of the last ice age.

      We’ve had 20% of that change already, and we’ve only just started to feel the lagged effects of that. I’ll be curious to see what happens with another degree and a half C of global warming.

  8. MrZ says:

    Hi Roy!
    Have you checked how your graph compares with SSR?
    ERA5 provides reanalysis data for SSR and as it looks to me SSR has increased by 4W/m2 since 1981.

    • Roy W. Spencer says:

      yes, actually the total absorbed solar by the climate system, measured by CERES, that does indeed show an increase. The climate modelers say the warming is causing a decrease on clouds, which would be positive feedback, but I have argued for years that we don’t know and it could be a decrease in clouds is causing some of the warming, with negative cloud feedback. We published several papers on this. There is no good way to prove how much of each is happening but it makes a huge difference for the sign of cloud feedbacks and climate sensitivity.

      • MrZ says:

        Thanks Roy,

        This is triggering, looks as if they are allowed to bet on every horse.
        I would love to read your papers on this matter. A link here or a mail possible?

        Two things comes to a layman’s mind.

        1. Since the back radiation is estimated at 100% (ref: https://earthobservatory.nasa.gov/features/EnergyBalance) an increased SSR should eventually cause a problem in getting the budget to sum up to something believable around the magic +30C.
        They will have to decrease the 100% and hence CO2 contribution. (Actually the “Effect on Surface Temperature” section in the linked page is already several W/m2 wrong on the SSR side).

        2. Warmer equals less clouds???
        I understand I lack lots of knowledge but to me warmth drives humidity as long as there is water to draw from. Over land not so long intervals after rain as the ground dries up pretty quickly. But endlessly over the oceans.

        -Higher humidity should build clouds faster.
        -Higher temperature also moves the Dew point so that the water can be held longer.

        How this results in less clouds is beyond me, hence I am eager to read your papers.

        • RW says:

          Yes, you’re correct. It’s makes no sense that warming would cause a decrease in clouds. But this is apparently one of the things underpinning high sensitivity and legitimizing the issue. Even Roy, IMO, is giving it far too much credibility.

        • bdgwx says:

          All other things being equal higher relative humidity would likely lead to more clouds. But…RH is the ratio of vapor pressure (E) to saturated vapor pressure (Es). Es scales as 7% per 1K. The question then is which is increasing faster? And, of course, not all other things may remain equal. Clouds are complex both in what modulates their formation and in how they then modulate the ingress and egress radiation fluxes. Clouds are a complex topic for sure.

        • ClintR says:

          The 4 W/m^2 would result in a 0.33C increase.

          • MrZ says:

            Is that including backradiation?
            Can you share your formula?

          • ClintR says:

            It’s just the basic formula for blackbody sphere:

            Incoming to surface is 960 W/m^2, plus your 4 W/m^2 = 964 W/m^2

            So at equilibrium, sphere is radiating 241 W/m^2.

            S/B equation — 241 = σT^4

            T = 255.33 K versus 255 K

            Increase of 0.33 K, or 0.33 C

          • MrZ says:

            Hmm,

            960W/m2?
            Maybe a typo from your side.
            SSR has increased from 159.x to 164.x W/m2 approximately 3%. According to ERA5.
            According to NASA the back radiation is 100% of that figure. So the 4W/m2 additional incoming results in 4W/m2 back radiation. 8W/m2 summed together. (Almost 9W/m2 with the decimals included)

            NASA link: https://earthobservatory.nasa.gov/features/EnergyBalance
            “The natural greenhouse effect raises the Earth’s surface temperature to about 15 degrees Celsius on average—more than 30 degrees warmer than it would be if it didn’t have an atmosphere. The amount of heat radiated from the atmosphere to the surface (sometimes called “back radiation”) is equivalent to 100 percent of the incoming solar energy. The Earth’s surface responds to the “extra” (on top of direct solar heating) energy by raising its temperature.”

            I am on really thin ice here but to me it looks as if it represent a large portion of the measured warming. In fact so large that if it continues to increase NASA will have to rethink their back radiation part or the result will be a crazy high figure.

          • ClintR says:

            SSR is “Surface Solar Radiation”. They reduce solar to the 163 W/m^2 level by a number of tricks. But, even with all the tricks, it is solar only.

            So now I’m confused as to what the 4 W/m^2 really is. Would you be able to link to your source that indicates the 4 W/m^2?

          • MrZ says:

            Yes,
            I wanted to find a parameter that indicates the incoming energy as close to the ground as possible because I wanted to better understand what the cloud does.
            I have used the ERA5 re-analysis data as my source.
            Link here: https://cds.climate.copernicus.eu/cdsapp#!/dataset/reanalysis-era5-land-monthly-means?tab=overview

            Read @ “Surface net solar radiation”.

            “Amount of solar radiation (also known as shortwave radiation) reaching the surface of the Earth (both direct and diffuse) minus the amount reflected by the Earth’s surface (which is governed by the albedo).Radiation from the Sun (solar, or shortwave, radiation) is partly reflected back to space by clouds and particles in the atmosphere (aerosols) and some of it is absorbed. The rest is incident on the Earth’s surface, where some of it is reflected. The difference between downward and reflected solar radiation is the surface net solar radiation. This variable is accumulated from the beginning of the forecast time to the end of the forecast step. The units are joules per square metre (J m-2). To convert to watts per square metre (W m-2), the accumulated values should be divided by the accumulation period expressed in seconds. The ECMWF convention for vertical fluxes is positive downwards.”

            They provide a wealth of information and you need to apply for a free registration to download. Personally I download in netCFD format and use https://www.giss.nasa.gov/tools/panoply/ as my verification tool.
            I also have my home-brew application here: https://cfys.nu/GTA where my calculations/compilations are eventually presented.

            Here is a demo of the ERA5 crazy resolution running in next version of my app. Its Katrina as measured humidity at the 850hPa level. http://cfys.nu/videos/Katrina2005%40850hPa.m4v

            I should clarify that my +4W/m2 might be an over estimate because I selected July as month. For NH winter months the increase is probably less because less land mass is lit.

            ClintR I am here to learn and my motto is I have to be wrong pretty often to progress. I like your tone and I think we can reach an interesting result with your math.

          • ClintR says:

            I couldn’t find reference to the 4 W/m^2 you mentioned, but it doesn’t matter. If it is “back-radiation”, it does not add to solar. So the calculations I provided don’t work for back-radiation. I was thinking you meant the 4 W/m^2 figure was from decreased albedo, since you mentioned clouds and SSR.

            If fewer clouds resulted in a 4 W/m^2 increase of solar at surface, then the calculations above could be representive.

          • MrZ says:

            ClintR
            You last sentence is the right interpretation.
            The data is under the download tab but a bit cumbersome to extract without a tool.
            Anyway, it is the SSR after clouds and with albedo reflections deducted.
            I trust your 0.33K is about right but would you agree the backradiation would double the effect?

            I dont fully get how cooler objects can warm warmer objects. Instead I think as if radiation has no temperature but its energy dampens outflow from the receiving object. Hence that object gets warmer than it would be without that other object e.g back radiation. So with my thinking (as I interpret NASA) the 0.33K would instead be 0.66K.

            Makes sense?

          • bdgwx says:

            If the 4 W/m^2 is a global mean from the ERA reanalysis then that represents a 1.0K increase using the SB law.

            ((240+0) / (1*5.67e-8))^0.25 = 255.06K

            ((240+4) / (1*5.67e-8))^0.25 = 256.12K

          • ClintR says:

            MrZ, there’s a good reason you “don’t fully get how cooler objects can warm warmer objects.” It’s called the Second Law of Thermodynamics. But “GHE believers” try to get around the Law by what you mentioned — they claim more energy always means higher temperatures.

          • ClintR says:

            Yes bdgwx, it makes a difference if the “4 W/m^2” is the total or the average. That’s why I was trying to find the source. But, as MrZ indicated, it doesn’t matter. It’s back-radiation so it doesn’t add to solar.

          • MrZ says:

            Thank you both.

            I obviously have a problem expressing what i mean in written words but I think we are getting closer. I do understand math when I read it as computer code but the math nomenclature with more than 3 signs gets me confused.

            The +4W/m2 is the daily average of July 2017 compared with July 1981.
            bdgwx way of expressing it makes perfect sense and I am with him that 4W/m2 should mean approx 1.0K. I think ClintR math is also right but I was not clear ERA5 figures was at ground – albedo reflections.

            So we can all three align around the approx 1.0K.

            Now, and this is purely my interpretation, we also have to consider back radiation. Not as a heating source but as an “insulation layer” preventing the heated ground to cool down as fast as it would without it. Not cooling means additional heat as long as the source i.e SSR is active

            NASA states the back radiation is 100% of SSR (and it probably was at 160W/m2). My interpretation is that their formula runs far too hot with an SSR increase of 4W/m2. They have to calculate 8W/m2 or approx 2.0K.

            If this is clear enough I hope you can explain where my thinking is wrong. To pretend I have found something out that NASA hasn’t would be pretty ignorant of me, but I am currently stuck at that point.

          • ClintR says:

            “So we can all three align around the approx 1.0K.”

            Wrong-o, MrZ. That’s your biased opinion leading you away from reality. I would never “align” to such nonsense. You cannot add “back-radiation” to solar and use the S/B equation.

            And that’s just one of your many mistakes. But, your false modesty almost fooled me.

            You guys are getting trickier and trickier.

          • MrZ says:

            ClintR

            When I said I liked your tone I really ment it. The normal is one mistake (or deviate from ones opinion) and you are out. You actually took the time and tried to explain.

            I suggest you read the thread again with a filter that I actually know less than you when it comes to energy balance. I am pretty good processing data and presenting it. I want to add an energy budget perspective and I lack the knowledge,

            When you say mistakes it’s not that I try to trap you like a snake holding back vital information it’s simply because I ask you to fill a knowledge gap on my side.
            When you say biased I wonder in what direction?

            Probably this media is so infected because its public that personal scores ranks higher than spreading knowledge. I am NOT like that.

            Really sad.

          • bdgwx says:

            I happen to really like your site MrZ. I bookmarked it a few weeks ago actually. And I really like how you pull in the ERA data. ERA is considered to be among the best reanalysis datasets out there.

          • ClintR says:

            MrZ, “this media is so infected” becauee some want to deny reality. Some even perfer to prevert reality, as you did:

            “So we can all three align around the approx 1.0K.”

            Like bdgwx, you believe you can just type out a longer comment to justify your disregard for reality.

            Go for it.

          • Mrz says:

            ClintR
            Sorry but I can’t see how I deny reality by asking questions.
            In sync on 1.0K was obviously not acceptable to you. We can go with your 0.33K.
            Does what NASA states in terms of back radiation add to this or not, from a modeling point of view. It is a question not a statement.

            I DONT HAVE AN AGENDA!

          • ClintR says:

            “Sorry but I can’t see how I deny reality by asking questions.”

            Nice avoidance of reality, MrZ. You didn’t ask a question, you made a statement: “So we can all three align around the approx 1.0K.”

            Until you quit perverting reality, you DO HAVE AN AGENDA.

        • MrZ says:

          bdgwx
          Thanks for the feedback on the app it helps with my motivation.

          If you want you can put your email in the applications feedback form and I’ll send you a link to an early next version. The app v1 was coded to handle temp anomalies but I have changed it to deal with anything “gridded”. That is part of the reason I am asking about the energy budget here.
          I have also change resolution so it can handle data down to 1hr resolution. I linked the Katrina example above and the film you see is actually 30fps realtime calculations in 4K.

          I put the Katrina link not only to advertise the app but to show what resolution ERA works with. I think their re-analysis data is of really high class. From what I have experienced their 30-45 day forecasts are also really good, especially compared with our local MET office. Modeling 50 years out is a different task altogether.

          Finally can you help me understand where ClintR and I clashed and why? He must read words I did not write or does it really appears as if I have an agenda?

          • MrZ says:

            ClintR
            You can also use the feedback form in the app to forward your email.
            I can hint here that opinion about where the world is heading in terms of climate catastrophe is vastly different from asking about the energy balance. The latter is actually pretty neutral and only about understanding math and theories. You have misread me big time.

          • ClintR says:

            I haven’t “misread” you, I have exposed you.

            You’re just another one seeking to pervert reality.

          • Svante says:

            MrZ, ClintR is a troll that has been banned multiple times.
            You will not get much sense out of him.

          • MrZ says:

            Thanks Svante.
            I got tricked/carried away but I see it now. What a waist of time.

          • ClintR says:

            I haven’t been banned once, idiots.

            And, its “waste”, not “waist”.

          • Svante says:

            Thats right, youve been banned at least three times.
            As geran (anger with syllables reversed), then g*e*r*a*n, and then JDHuffman.

          • ClintR says:

            I’m glad to see you tacitly admit you have no science, Svante. You just seem fixated on nonsense.

            Paranoia is often common among cults. Consequently, Bindidon might be after you. He signs off as “JPD”. Pretty close to “JD”, huh?

            Watch your back!

    • bdgwx says:

      MrZ,

      At least know what SSR from ERA is in reference to. If you look at the energy budgets from Wild et al 2013, Trenberth 2009, or the like you’ll see a 161 W/m^2 component. This is the amount of solar shortwave radiation arriving at the surface minus the amount reflected off it. 185 W/m^2 gets there and 24 W/m^2 is reflected leaving 161 W/m^2 to be taken up.

      What would be interesting is to compare this figure to OLR from TOA. It appears that ERA5 provides this product along with many other radiation fluxes. Though strangely they provide it in J/m^2 and note that you have to divide by the number of seconds in the period to get to W/m^2. Anyway…I’d be interested in seeing what OLR was doing. Did it also increase by 4 W/m^2?

      https://cds.climate.copernicus.eu/cdsapp#!/dataset/reanalysis-era5-single-levels-monthly-means?tab=overview

      • Mrz says:

        Thanks!
        Yes the ERA5 figure is through the atmosphere and clouds and with albedo deducted. It ranges between 159.x and 164.x W/m2 for the month of July. It is expressed as Joules and average per 24hs so the watts are Joules/86400.
        I was also interested in TOA measurements but I can only find it as CMIP5 forecasts. They use the grib2 format and I have not found any way to translate this to my format yet. However I found two satellites that measure this since 2003 and I will look into that further.

      • Matz Hedman says:

        Too fast.
        You meant downwards. I will check that.
        According to what I here sun fluctuates parts of a W. But lets see.

        • Matz Hedman says:

          Not my day…
          I blame it on the small screen of this phone (and also the spellos)
          If you found OLR at TOA in the list can you please point it out.

        • Matz Hedman says:

          I think top net thermal is the one we want.
          No more wine tonight.

      • MrZ says:

        Please disregard my hickups in the between posts. I am at the PC now and luckily I ran out of wine.

        I did not find your requested parameter earlier because I had selected an over land dataset. Here: https://cds.climate.copernicus.eu/cdsapp#!/dataset/reanalysis-era5-land-monthly-means?tab=form

        The data we want is called “Top Net Thermal Radiation” TTR and it only exists as land+ocean. (From what I can find now I should add)

        It also has another time span 1979-2019 vs 1981-2019. This leads me to believe they are not calculated in the same manner and the latter has probably more precise measurements in it.

        So, I will create new datasets for both SSR and TTR and then use my application to filter land/ocean. That way I can first compare the SSR part and then see how TTR matches up. This will take some time.

        If SSR variants differs a lot when I filter out ocean I will ask ECMWF how they differ in terms of input data.

        If the data looks interesting I will publish both in the current version of the application

        FYI, I did do TTR as land+ocean and it is virtually flat around -251W/m2.

        • MrZ says:

          Hi bdgwx!

          Maybe this thread is getting to long and old so I put the final results where I see you next time.

          I did not think much about TTR @ -251W/m2 as average for July until I did the TSR. It shows approx 237W/m2. What I have learnt is 340W/m2. My current interpretation is that ERA5 projects the value as 1m2 at the surface but I have to investigate further. Also, I managed to put 84600 instead of 86400 for the TTR. The real average for July is 246W/m2 (same projection).
          It differs from year to year but it looks as if we have 3-4W/m2 more input than output for a full year according to ERA5. I still have to do the ocean/land split. Land seams to have more input than ocean according to the SSR dataset I mentioned above.

          • bdgwx says:

            Interesting. I was half expecting TTR show an increase. The reason is because it is said that OLR is increasing.

            DeWitte & Clerbaux 2018

            https://www.researchgate.net/publication/327874661_Decadal_Changes_of_Earth's_Outgoing_Longwave_Radiation

          • MrZ says:

            Thanks for this, a good reference to have in mind.

            I took 2 years (24 months) snapshots for the interim, 1979 and 2019 and TTR looks pretty stable, actually slightly down. But I don’t think we can read too much into this yet. It feels that there are many attributes that are “unstable”. As an example ERA5 states TOA is @ 0hPa and since that is a moving point in terms of altitude the 1m2 projection will differ. This is just a top of my head example. I think it renders some careful reading and maybe questions to the ERA5 team.
            I am pretty confident though (after watching Katrina) that their data is pristine once I know how to interpret it properly.

          • bdgwx says:

            Yeah…This stuff is so complicated. I agree though…ERA is considered to be one of the best datasets available. I wish people would utilize reanalysis more often. I used to download the grib and netcdf files and analyze them myself as well (not ERA, but other reanalysis sources). Unfortunately I’m far too busy today.

          • MrZ says:

            “I wish people would utilize reanalysis more often”

            Agree!

            I think one problem some people have is that re-analysis filters bias and the result is almost always less dramatic. It does not show them what they want to see. UAH is for example far better aligned with ERA5 re-analysis data compared with RSS. So those people prefers RSS.

            RSS used to also match up but that changed with their last update. There is an ERAv5 LB Beta set in my app that helps with comparison.
            LB stands for Lennart Bengtsson who is a longtimer in the industry, knows every important person and has a knowledge base that I don’t have brains enough to come close. He helped me combine the most important pressure levels into that set and also describing why combining them was interesting. I hope he will help me out on the energy balance as well…

            It was nice talking to you. We can learn from each other even when we don’t share opinions 100%. As long as there is a good tone and honesty I find such discussions really valuable.

            Talk in next thread when I have some more progress.

  9. CAD says:

    Thanks Dr. Spencer,

    the art of science of radiometry – impressive and we do see expected persistence and autocorrelation in the brightness temperatures year over year. What comes next? nobody knows – that’s the fun of it!

  10. Richard M says:

    June temperatures are still affected by the recent El Nino and the 3-4 month lag associated with satellites/ENSO. So will July. The real story will unfold come August.

    The drop this month is likely associated with less Arctic warming during the NH summer.

    • Bindidon says:

      Richard M

      Like every month, the usual nonsense.

      There was NO El Nino at all since 2015/16.

      1. Here is the chart for 1979-now:

      https://tinyurl.com/y8mjlflm

      2. El Nino is when the index is above 0.5 for at least 6 months:

      https://tinyurl.com/y8pjme62

      This is completely ridiculous.

      With only 0.77, the index didn’t even reach 1.0 in 2019, compared with about 2.2 in 2016, about 2.8 in 1998 and about 3.0 1983.

      • Nate says:

        And amazing that such a low index over the last year resulted in a smoothed peak in Temp just about the same height as the one in 2016 due to the super El Nino of 2015.

        That suggests an ongoing upward trend continues in the background, in addition to the ENSO variation.

      • Richard M says:

        Bindidon, the ONI shows El Nino conditions over most of the last 1.5 years. I guess denial must be your middle name.

        https://origin.cpc.ncep.noaa.gov/products/analysis_monitoring/ensostuff/ONI_v5.php

        or, you can look directly at the indexes here.

        https://www.cpc.ncep.noaa.gov/data/indices/sstoi.indices

        Your denial of scientific data is hilarious.

        • bdgwx says:

          ONI over the last 18 months is 0.5. Yes…El Nino…but just barely and weak. And if you go back to an earlier time in the record with the same average (like from 1990/6 to 1991/11) you’ll find that the temperature is higher in the present.

          Also, ONI from 1979 has a trend of -0.027/decade +- 0.032 so we can say with confidence that at the very least ENSO is NOT trending more El Nino. In fact the odds are higher that it had been trending more La Nina. So clearly ENSO cannot explain the +0.136C/decade trend.

          Nevermind that ENSO cycles do not add energy to the geosphere. They just moves it around. So there’s no causative mechanisms by which it could induce long term changes in atmospheric temperature. Furthermore…ENSO metrics like ONI are temperature anomalies themselves. And specifically it resets every 5 years to the most recent 30 year mean. So saying ENSO is the cause of warming/cooling is like saying the Earth warmed/cooled because because a specific area warmed/cooled. While the correlation may be true it’s not actually a cause. For example, you wouldn’t say your house warmed because your master bedroom warmed. Sure, there may be a correlation, but the cause of the warming in your home was because the furnace turned on.

          • Richard M says:

            bdgwx, I have no clue where you get your trend but it is not interesting. What is relevant today is the recent trend (last decade) which is clearly in the other direction.

            I am not claiming ENSO has caused long term warming but that it has influenced the recent satellite measurements.

            I understand that alarmists are constantly deflecting to avoid dealing with inconvenient data. It’s part of the general denial I see from your cult.

          • bdgwx says:

            I got my trend from the monthly ONI values.

            We already know that ENSO has an effect on monthly troposphere temperatures. Nobody is denying that.

        • Midas says:

          Richard M

          Decade … (#months ONI >0.5, >0.4, >0.3) … [#months UAH >0.4, >0.3, >0.2]

          1980s … (33, 35, 37) … [0, 1, 2]
          1990s … (38, 49, 63) … [10, 11, 17]
          2000s … (28, 36, 43) … [1, 7, 33]
          2010s … (33, 38, 45) … [30, 50, 76]

          Explain away …

          • Richard M says:

            Midas, you are also attempting to deflect from my point which is that recent satellite anomalies are higher due to the recent El Nino event. I am not saying El Nino is the only factor involved.

            Sorry, but you just wasted your time on irrelevant data.

            We are dealing with a new baseline since the AMO went positive in the 1990s. It is this baseline you need to use and need to correct based on ENSO.

          • Svante says:

            Richard M,
            Perhaps the AMO and ENSO are oscillations, and as such have nothing to do with global warming.

            See them factored out here:
            https://agupubs.onlinelibrary.wiley.com/doi/full/10.1002/2013EF000216

          • Midas says:

            Richard M

            Higher than what? Just saying “higher” is meaningless.
            I have had multiple conversations with you where you claim that “El Nino conditions” are the reason it is warmer than the 80s and early 90s, so your spin has evolved.

            And the AMO has no effect on southern hemisphere temperatures, so you need to evolve your spin even further.

          • Richard M says:

            Midas, I have never said that ENSO is the reason we are warmer than the 80s and 90s. You must be confusing me with someone else. The reason we are warmer is primarily the +AMO. ENSO is a more recent factor.

          • Richard M says:

            Svante, while natural cycles do not have much to do with long term warming they have a lot to do with short term changes. The AMO has created much of the warming in the 21st century.

            Even with this help climate models overstate warming. That’s the problem. Once you correct for this problem what is left is far below anything that is going to lead to future problems and is likely net beneficial for both humanity and the biosphere.

          • Midas says:

            Richard M

            As I said, the AMO has no effect of SH temperatures.

          • Midas says:

            ON

          • Svante says:

            Richard M says:
            “The AMO has created much of the warming in the 21st century.”
            The AMO is +/- 0.2 C, and less if you smooth out the peaks, which can’t impact the Earth’s inertia.
            https://agupubs.onlinelibrary.wiley.com/cms/asset/669cb5c3-8bf8-4c3f-b91c-98b1e53345b8/eft234-fig-0010-m.jpg

            The AMO peaked over ten years ago:
            https://tinyurl.com/y83dl8rg

            “Even with this help climate models overstate warming.”
            You don’t need any models to see where this is going:
            https://tinyurl.com/wz6oelr

            “likely net beneficial for both humanity and the biosphere.”
            It too much too fast. It causes sea level rise and risk, risk, risk.

  11. Rob Mitchell says:

    Looks like the polar jet stayed mostly south of Australia last month without even looking at a weather chart!

  12. Galaxie500 says:

    +0.43 Third Warmest June on UAH records?

    • Roy W. Spencer says:

      could be, I didnt look.

    • Bindidon says:

      Galaxie500

      ” +0.43 Third Warmest June on UAH records? ”

      *
      Correct:

      1998 6 0.57
      2019 6 0.47
      2020 6 0.43
      2016 6 0.34
      2015 6 0.31
      2010 6 0.31
      1991 6 0.31
      2002 6 0.30
      2014 6 0.25
      2017 6 0.22

      … but does that tell us much?

      J.-P. D.

      • Gordon Robertson says:

        binny…” but does that tell us much?”

        Yes. It tells us that June 1998 was warming than June 2020, therefore it has cooled.

        • Bindidon says:

          The dumbest ‘comment’ator is here again…

          This is really one of the most stupid things one can write about warming or cooling.

          UAH’s LT trend for June 1998 till June 2020: 0.139 +- 0.02 C / decade, i.e. a tiny bit higher than for the entire period:

          https://woodfortrees.org/plot/uah6/plot/uah6/from:1998.5/trend/plot/uah6/trend

          Robertson will never learn anything, especially not about anomalies, baselines, trends.

          Did he ever learn anything, apart from trivial things a la ‘f = ma’ ?

          J.-P. D.

    • Gordon Robertson says:

      galaxie…”+0.43 Third Warmest June on UAH records?”

      Don’t know where that would apply but certainly not here on the West Coast of Canada.

      • gbaikie says:

        Cool in southern Cal, also. But expect it get hot in July and August because it’s summer.

        • Gordon Robertson says:

          gbaikie…”Cool in southern Cal, also. But expect it get hot in July and August because it’s summer”.

          Hope it doesn’t get hot in other senses of the word like it did in Seattle recently. Your governor in California seems to be about as stupid as the Mayor in Seattle. A few days ago she was gushing about how cute it was for masked gunmen, one openly wielding an AK-47, to take over a portion of Seattle.

          She did not react immediately even after two teenagers were shot to death in the enclave. No one in the city advised the father of one teen that the kid was dead and the fake news media who were gushing over how cool it was for anarchists to take over part of the city as a protest completely ignored the murder of the kids.

          If your governor keeps up his ridiculous restraint orders and forcing people to wear masks, things could get hotter down there before the Sun does it.

  13. Scott R says:

    Looks like the ocean tropics have dropped back down to 0.43 slightly below the 0.45 set back in April. The surge up to 3rd highest value since 2016 of 0.69 last month seems to have been a fluke. Based on the 3.6 year cycle, 11 year cycle, we are due for that strong la nina I’ve been talking about. Seems like it is trying to start but region 4 is stubborn. Looking at all the energy waves in the ocean tropics data set, we look very similar to the formation of the 1989 la nina. I don’t think we will get that 1988 la nina summer heat. The drop off is just a little too late for that set up. (a good thing if you remember what 1988 was like) It should make it in time for a cold NH winter.

    In other news I see the south pole is well below baseline again. -0.26. The south pole is a thorn in the side of the AGW community. Just does not cooperate.

    • gbaikie says:

      AGW community includes a lot idiots, but I think the cargo cult experts, don’t expect Antarctica to warm [though might hope some of Antarctia peninsula warms]. I think the hope of doom related Antarctica is connected to sea level rise, effecting it. So they imagine Greenland will melt and cause sea level rise, and such rise in sea level somehow effect Antarctica melting glacial ice and then under 60 feet water.
      But impossible and if happenned quickly {less than 1000 years} it cause ocean to freeze.
      But with a lot volcanic help, perhaps, maybe.

      • gbaikie says:

        Btw, I don’t we get 1 foot of sea level rise within a century, but if got more couple meters in century, I think that would be good, because maybe we then could get serious about living on the ocean. So sea level rise 2 meters with century, that good thing for ocean dwellers. Or the existing beach infrastructure is somewhat problematic.
        Or beach parking is something wars are fought over. And 2 meter rise in sea level would shake that box. Or if nothing else could start with parking on the Ocean.
        Never considered that before. One start ocean living by starting with putting beach parking on the ocean- so, don’t need sea level rise, just the need of more beach parking being actually solved.

        • Scott R says:

          gbaikie,

          My impression of sea level rise is that the rate of change has been a very steady increase.

          I therefore do not think it is related to man made gases because it should have taken more of an exponential curve. It is more likely this is being caused by isostatic rebound from the retreat of the glaciers, or perhaps rocks weathering.

          Short term swings in sea level are possible via the AMO, ENSO, but the trend is maintained.

          That being said, we should regulate new construction on the coast. Nothing new under 2 meters above sea level.

          • Bindidon says:

            Scott R

            ” It is more likely this is being caused by isostatic rebound from the retreat of the glaciers, or perhaps rocks weathering. ”

            No.

            It is evident for anybody reading papers about SLR that Vertical Land Movement (i.e., not only postglacial isostatic rebound) is accounted for.

            ” Short term swings in sea level are possible via the AMO, ENSO, but the trend is maintained. ”

            No. This is accounted for as well (what W. Eschenbach deliberately ignores in his somewhat arrogant WUWT guest posts).

            ” That being said, we should regulate new construction on the coast. Nothing new under 2 meters above sea level. ”

            Yes! But to that we have to include all places located many meters above, but which nonetheless are in danger due to the Oceans’ increasing aggressivity.

            France’s Atlantic coast is at many places a good example.

            *
            The best evaluation I ever read:

            Reassessment of 20th century global mean sea level rise

            Sönke Dangendorf, Marta Marcos, Guy Wöppelmann, Clinton P. Conrad, Thomas Frederikse, and Riccardo Riva (2017)

            https://www.pnas.org/content/early/2017/05/16/1616007114

            Their data:

            https://static-content.springer.com/esm/art%3A10.1038%2Fs41558-019-0531-8/MediaObjects/41558_2019_531_MOESM2_ESM.txt

            Compared with a quick shot made by statistician Grant Foster:

            https://drive.google.com/file/d/1dNTLShsJp2U9aBHuU3h4OL5tK32of9pg/view

            J.-P. D.

          • Bindidon says:

            Scott R

            I forgot to add a chart comparing these two above in the ‘altimetry period’ (1993-now, but till end of 2015, Dangendorf’s end) with
            – an own evaluation;
            – NOAA’s altimetry data.

            https://drive.google.com/file/d/1nMqjTy4vtwwR3HUX_kiARXnGQuLkDk_n/view

            Draw you own conclusions about satellite data being allegedly ‘much higher’ than that measured by tide gauges…

            J.-P. D.

          • gbaikie says:

            “That being said, we should regulate new construction on the coast. Nothing new under 2 meters above sea level.”

            –Tsunamis have a small wave height offshore, and a very long wavelength (often hundreds of kilometres long, whereas normal ocean waves have a wavelength of only 30 or 40 metres),[33] which is why they generally pass unnoticed at sea, forming only a slight swell usually about 300 millimetres (12 in) above the normal sea surface. They grow in height when they reach shallower water, in a wave shoaling process described below. A tsunami can occur in any tidal state and even at low tide can still inundate coastal areas.

            On April 1, 1946, the 8.6 Mw  Aleutian Islands earthquake occurred with a maximum Mercalli intensity of VI (Strong). It generated a tsunami which inundated Hilo on the island of Hawaii with a 14-metre high (46 ft) surge. Between 165 and 173 were killed. The area where the earthquake occurred is where the Pacific Ocean floor is subducting (or being pushed downwards) under Alaska.–

            How about nothing on beach which can not withstand 20 meter high Tsunamis?
            Why take a chance?

        • gbaikie says:

          –Scott R says:
          July 3, 2020 at 12:34 PM
          gbaikie,

          My impression of sea level rise is that the rate of change has been a very steady increase.

          I therefore do not think it is related to man made gases because it should have taken more of an exponential curve. It is more likely this is being caused by isostatic rebound from the retreat of the glaciers, or perhaps rocks weathering.–

          I think it dependent on how increasing or decreasing levels and where there is oceanic volcanic activity.
          Roughly to get 1 foot rise in sea levels, need ocean to warm from 3.5 to 4 C. And that seems close to impossible within a century.
          My view is we are warming as part of recovery from Little Ice Age.
          I think we got the LIA due to cooling of ocean and had lowering of sea level, now we might recovered mostly from that ocean cooling but have not recovered from a 5000 years of ocean cooling, and it’s possible to return to 5000 years of ocean cooling at some point.

          So, I always wondered what caused the cooling of LIA, and suspected in had to do volcanic activity and solar activity.
          It’s said 75% of all volcanic activity occurs on Ocean floor.

          And seems if we had largest volcanic eruption occuring on Ocean floor, and be on boat above it, one would not notice anything.
          Or what count as largest volcanic eruption have only occurred on Land, where 25% of volcanic eruptions occur.
          I can’t rule out 1 foot rise in sea level within century. Odds indicate more than 1 meter rise is unlikely.
          What is certain is ocean floor is young, and it’s volcanically active.
          Now another aspect is if didn’t have as much oceanic cooling of deep water, our ocean would not have average temperature of 3.5 C, but would be much warmer. And other than cooling mechanism of ocean, one probably mechanisms could release heat from ocean faster [than “average amount released”].
          Or people saying global warming is 90% warming of the entire ocean, and fear this ocean heat being released “suddenly”. So let’s say “suddenly is over time period of 100 years than than 1000 or 5000 years. That’s what mean by mechanism could release heat from ocean faster.
          Or I think global temperature is exactly ocean temperature, and sudden release of oceanic heat, causes near term warming, but long term cooling.
          So, I say we mostly flying in the dark. I think doubling of CO2 probably causes some atmospheric warming, and close to zero ocean warming. Some atmospheric warming being of order of 0 to .5 C increase in surface air temperature.

          And since we in Ice Age, I would like .5 C or 2 C of atmosphere warming. But better than that would be .5 C increase of ocean temperature. But to get 1 meter rise in sea level, need a 1 C increase in ocean temperature, or from 3.5 to 4.5 C increase.

    • Entropic man says:

      South pole trend has been upwards for 20 years.

      http://nsidxxxxxc.org/arcticseaicenews/files/1999/07/Figure5b-1.png

      Take out the xs before linking.

      • Scott R says:

        Entropic man,

        According to the HADSTT3 dataset, the southern ocean was the warmest in the late 1800s. Also, the 40s, 80s, 90s were warmer than today.

      • Gordon Robertson says:

        entropic…”South pole trend has been upwards for 20 years.”

        Once again we have fudged data from NOAA and NASA GISS. The authors of the graphic are affiliated with both. If I had produced a Mickey Mouse graphic like that in engineering school I’d have been expelled.

        They don’t mention when (which part of the year) the SP is warming and their graphic gives no indication of that. The graphic shows temps always below 0C and no warmer than -47C in winter.

        I’d like to see the idiots who created that graphic explain to people living at the South Pole that it’s warming there.

        I prefer the view of Polar expert Duncan Wingham. When asked about glaciers melting in Antarctica, Wingham, an alarmist, claimed it is far too cold for glaciers to melt in Antarctica. I can respect an alarmist provided he/she is a realist. Unfortunately they are few and far between.

        No solar input for most of the Antarctic winter means incredibly cold temperatures. Any warming in the summer is irrelevant.

      • Bindidon says:

        Entropic man

        ” South pole trend has been upwards for 20 years. ”

        Even Ole Humlum can’t discard things when there is evidence:

        https://www.climate4you.com/images/AntarcticTemperatures.gif

        Apart from McMurdo which showed most warming since 1960 but less since 2000, all three stations shown at climate4u confirm what you wrote.

        Ignorant blah blah replies can’t change that.

        J.-P. D.

  14. Peter B says:

    Dr Roy,
    Thank you for your work. I have what may be an old question but why does the 1979 zero year start at – 0.3 and not 0.0*C?

    • Svante says:

      Zero is a “1981-2010” (see top of page) average and we are trending up every decade.

    • MrZ says:

      Adding to Svante
      Each month has its own base temperature that is calculated as an average for the 30 year period Svante mentions.
      What you see in the graph is the individual months deviation from that base temperature.

  15. ren says:

    The magnetic field strength of the solar wind is still very low. La Nina cannot develop despite the low temperature of the Peruvian Current. SOI value is very variable, which indicates the meridional course of the jet stream.
    https://pics.tinypic.pl/i/01009/q9lx3xwuflec.gif
    https://www.tropicaltidbits.com/analysis/ocean/nino12.png

    • Midas says:

      Your first link provides a good analogy for your “logic”.

    • ren says:

      Galactic Cosmic Rays (GCR) are the slowly varying, highly energetic background source of energetic particles that constantly bombard Earth. GCR originate outside the solar system and are likely formed by explosive events such as supernova. These highly energetic particles consist of essentially every element ranging from hydrogen, accounting for approximately 89% of the GCR spectrum, to uranium, which is found in trace amounts only. These nuclei are fully ionized, meaning all electrons have been stripped from these atoms. Because of this, these particles interact with and are influenced by magnetic fields. The strong magnetic fields of the Sun modulate the GCR flux and spectrum at Earth.
      https://www.swpc.noaa.gov/phenomena/galactic-cosmic-rays

  16. Herv Girard (CH) says:

    Interesting indeed.
    Please remember that 1979-2010 is the very first climate normal so accurately known (+/-0.1C).
    The next climate normal to be compared will be delivered in 2040.
    Until then, all arguments have nothing to do with climate science, but only with meteorology.
    The WMO definition for CLIMATE is: 30 YEARS OF ANALYSIS.

    • bdgwx says:

      Berkeley Earth lists the 1951-1980 average as 14.177C +- 0.048 (air method). And the annual anomaly for 1910 was -0.509C +- 0.072. That means the absolute temperature in 1910 was 13.668C +- 0.087 using the summation in quadrature rule*. That’s the error for the annual mean. 5y, 10y, and 30y mean errors are obviously less. Uncertainty in the BEST dataset is 2-sigma. Other surface based datasets have similar uncertainty margins. I just used BEST as example because their data and methods are easy to obtain.

      * If someone notices an error please correct it. I’m not a stats guy.

      http://berkeleyearth.lbl.gov/auto/Global/Land_and_Ocean_summary.txt

      For climate periods the WMO does indeed standardize on 30 years and resets every 10 years. The current period is 1981-2010. The next period will be delivered next year and will represent 1991-2020.

  17. Mike Maguire says:

    While the ocean temperatures or indices are not into official La Nina territory, below average SST’s in the east-central and east tropical Pacific for over a month now appear to be inducing a La Nina type response in the atmosphere downstream in the US.

    https://www.cpc.ncep.noaa.gov/products/analysis_monitoring/lanina/enso_evolution-status-fcsts-web.pdf

    Summer’s with La Nina’s in the US have higher odds historically of widespread, rain suppressing heat ridges in a large part of the country in the growing season.
    The location of the long lasting heat ridge varies from La Nina to La Nina.

    It can be in the S.Plains(2010/11) shifting into the Midwest early 2012.
    Or the Southeast(2007/8).
    Or Midwest July/August (98/99/00)
    Or the Midwest (1988) That drought started early in the year.
    Or the Midwest(1983)Drought started in July.
    1974 featured a La Nina and some of the worst growing conditions in US history.
    1954’s La Nina coincided with one of the hottest Summer’s in history.

    The correlation between a La Nina and adverse growing weather in the US is very strong. As one might expect, having an El Nino during the growing season greatly elevates the chances of favorable weather for much of the US key growing regions.
    ENSO neutral in 1980 coincided with an historic heat ridge in the S.Plains so they don’t require a La Nina.

    Scroll down at this link to see those La Nina analog years mentioned above as part of the discussion:

    https://www.marketforum.com/forum/topic/52701/

    The point is that the current atmosphere in the US is acting like it did during previous La Nina Summers, likely because of those below average SST’s noted above in the key tropical Pacific locations(eastern)………which also happens during La Nina’s.

    Potentially bad news for crops the rest of the Summer, which are off to a terrific start so far.

    A pretty good soil moisture profile in many places will help offset the negative impacts initially. Some of the daytime heating will be used up evaporating moisture from the soils for the first couple of weeks and prevent excessive daytime readings………..but 2 weeks of drying out would set the stage for heat waves to use more of the high angled, powerful sunlit hours to heat the air above the surface.

  18. ren says:

    A strong El Nino will not form unless a strong La Nina is formed (a strong subsurface wave must form). From this it follows that there will be no large global temperature anomalies from the current level.
    https://www.cpc.ncep.noaa.gov/products/analysis_monitoring/enso_update/heat-last-year.gif

  19. Gordon Robertson says:

    binny…”Even Ole Humlum can’t discard things when there is evidence:

    https://www.climate4you.com/images/AntarcticTemperatures.gif

    What kind of a trashy graphic is that? There is no title, no source, nada. Is that from you Excel spreadsheet?

    There is no indication what time of the year the graphs represent.

    • Bindidon says:

      Robertson

      You are too lazy to find it out by yourself, as it seems:
      https://www.climate4you.com/Polar%20temperatures.htm

      • Gordon Robertson says:

        binny…”You are too lazy to find it out by yourself, as it seems:”

        Not that at all, I am simply tired of reading propaganda and fudged temperature series from climate alarmists. They are desperately trying to squeeze any evidence of warming they can by milking statistics.

        The truth, as I have pointed out several times, is that the polar regions have little or no solar input for most of their respective years. The amount of CO2 we have in our atmosphere, a ridiculously insignificant 0.04% could not possibly warm a region for most of the year when there is little or no solar input.

        In summary, the alarmists are lying…again!!!

        • Svante says:

          The GHE works while surface temperature exceeds 2.7 K.
          Winds keep temperatures above that.

          • ClintR says:

            Is that what your “authorities” told you?

          • Svante says:

            Yeah, ren showed me.

          • Gordon Robertson says:

            svante…”The GHE works while surface temperature exceeds 2.7 K.
            Winds keep temperatures above that”.

            The basis of the GHE is wrong. It is based on the incorrect notion that SW solar entering a real greenhouse warms the soil and infrastructure. The SW solar is converted to LW IR and emitted. It is claimed by the GHE that the glass in the greenhouse traps the IR, warming the greenhouse.

            No one has ever explained how trapped electromagnetic radiation raises the temperature of air molecules in the greenhouse. In fact, an expert on gases like CO2, R.W. Wood, claimed that is not true, and he proved it. Based on his experiment he concluded that greenhouses warm due to a lack of convection. In essence, heated air molecules are trapped by the glass as they rise and the accumulation of energized molecules raises the temperature.

            In order for so-called greenhouse gases in the atmosphere to raise the temperature of the atmosphere they would have to trap heated air molecules. Not possible, therefore the theory is wrong.

            The other theory, that IR trapped by 0.04% of the atmosphere represented by CO2, thus warming the molecules, can transfer that energy to nitrogen and oxygen representing 99% of the atmosphere is unvalidated bs.

            Same goes for the theory that the same trivial gas can affect the rate of cooling of the surface. That theory contradicts the Stefan-Boltzmann equation governing the cooling of the surface, which requires that the temperature of gases adjacent to the surface control the rate of heat dissipation. That means O2/N2 control the rate of dissipation, not CO2 or WV.

          • Svante says:

            Let me answer that sentence by sentence:
            No, no, yes, no, no.
            No, yes, no, yes, yes.
            No, yes, no.
            No.
            No, no,no.

          • Gordon Robertson says:

            svante…”Let me answer that sentence by sentence:
            No, no, yes, no, no”.

            We’re doing science here, Svante, could you try to answer using science, something with which you seem to struggle. Maybe you could ask your buddy Bindidon to help you find some citations which neither of you understand.

          • Svante says:

            If you could stop your Gish galloping. Whenever one point is addressed you respond with a dozen new misconceptions.

        • gbaikie says:

          Irish physicist John Tyndall is commonly credited with discovering the greenhouse effect, which underpins the science of climate change.

          Starting in 1859, he published a series of studies on the way greenhouse gases including carbon dioxide trapped heat in the Earth’s atmosphere.

          A recently digitised copy of The American Journal of Science and Arts suggests a woman beat him to it, however.

          It includes a presentation by Eunice Foote to a top US science conference in 1856. She describes filling glass jars with water vapour, carbon dioxide and air, and comparing how much they heated up in the sun.

          “The highest effect of the sun’s rays I have found to be in carbonic acid gas,” she writes, using the contemporary term for carbon dioxide.

          “The receiver containing the gas became itself much heated – very sensibly more so than the other – and on being removed, it was many times as long in cooling.”
          She goes on to speculate that concentrations of carbon dioxide in the air could influence global temperatures.

          The Father or Mother depends the speculating.

          • Gordon Robertson says:

            gbaikie…there’s no doubt that Tyndall’s method proved that gases like CO2 can absorb IR and warm. Tyndall did not prove the warming applied to the atmosphere although he suggested that. He actually thought the warming would be an advantage so I take that to mean he did not foresee catastrophic warming.

            Tyndall also did an experiment which became the impetus for the Stefan-Boltzmann equation. He electrically heated a platinum filament till it glowed, then gradually increased the current, recording the colours given off as the temperature increased with current.

            Someone else converted the reported colours to colour temperatures and Stefan used the relationship between the emitted EM (frequency is equivalent to colour) and the equivalent temperatures recorded by Tyndall to establish his T^4 relationship. There’s no question that Tyndall was a good scientist.

            However, the experiment he did with the heated filament wire makes it clear the filament at temperatures between 700C to 1500C were radiated to a cooler ambient air temperature, satisfying the 2nd law. Those who have arbitrarily reversed the process to suggest heat can be transferred from the cooler air temperature to the hotter filament are scientifically out of order.

            Tyndall’s experiment essentially proves upholds the 2nd law of Clausius which as stated by him makes it clear that heat can never be transferred, by its own means, from a cooler body to a hotter body.

            That’s another nail in the coffin of GHE/AGW which depend on back-radiated involving a transfer of heat from a cooler atmosphere to a hotter surface that warmed the GHGs in the atmosphere.

          • gbaikie says:

            –Thats another nail in the coffin of GHE/AGW which depend on back-radiated involving a transfer of heat from a cooler atmosphere to a hotter surface that warmed the GHGs in the atmosphere.–

            But only the more uneducated among the uneducated believers think “back-radiation” heats the ground or ocean surface.

            Though there is the religious question.
            Is Eunice Foote the mother of children of global warming?

            Plus there is that eternal mystery.
            What is the need of having a global warming mommy and/or daddy?

            Has anyone dared to copy what their mommy did?
            Is it shameful what mommy did?
            Is there a taboo against any repetition.

            Should we have a public warning advising against danger of putting carbonic acid gas in jars?

            Is there a safe jar size to use?

            Can we call it, Venus in a jar?

            Could one sell Venus in a jar.
            Blasphemy??

            On to the topic of statues.
            Do we need one of Eunice Foote?

          • gbaikie says:

            Scott Adams is saying we are all bad at measuring things.
            One could say science is largely about measuring things, well.
            Scott is correct that we bad measuring things, and I would governments are terrible at measuring things. And pseudo science lives/survives with bad measurement.

            The whole China virus thing is hopeless bad measuring.
            As is the global warming religion- full of bad measurements.
            The UAH is better measurement- but it could certainly be improved.

            I would like some hopeful news of getting better satellites some time soon.
            Regarding the future this video is pretty good {or at least a hopeful future path]:
            https://www.youtube.com/watch?time_continue=2081&v=bmcr2FaoWoU&feature=emb_logo

            One aspect I like about it, is the guy is interested getting better space telescopes. Which is important part related to exploration goals. I kind of like his optimism about SLS- which I tend to think is mostly doomed. But he quite optimistic and has assembled a lot details about plans of Lunar and Mars exploration.

          • barry says:

            Eunice Foote never was credited with her work on “Carbonic Acid” acid in jars popularly, so she is not the mother of AGW.

            But she has gotten some recognition in the climate debates, and eventually a little more broadly. I’m going to take a little credit for that. First to bring her work to the table in 2011.

            https://skepticalscience.com/climate-curve-fitting-fools-gold.html#61013

          • ClintR says:

            I’m perfectly happy with you taking “a little credit” for promoting such nonsense, barry.

            Using sunlight to heat gases in glass containers to “prove” the GHE, is something only a physics-deprived idiot would attempt. I’m not sure you even understand how the GHE nonsense is “supposed” to work.

  20. Gordon Robertson says:

    bdg…”* If someone notices an error please correct it. Im not a stats guy.”

    The Berkeley study as it stands is fudged. That was revealed by Judith Curry who was a co-author on the original study. She claimed Meuller to license with the original conclusions.

    • Svante says:

      Funny thing she signed the methods paper but not the results.
      She liked the method but not the result 🙂

      • Svante says:

        She did not contest the numbers though, did she?

        She left after they tested and “ruled out every other scientific theory other than the GHG theory”:
        https://tinyurl.com/yd24sl7l

      • Bindidon says:

        Svante

        Don’t mind about “The Berkeley study as it stands is fudged”.

        Robertson is a persistent liar who distorts, discredits and denigrates everything what differs from his thoroughly ignorant narrative.

        There is no ‘original’ study, only that one for which Judith Curry signed both methods and conclusions.

        What she later disagreed upon was the global temperature increase clearly indicated by the BEST measurements.

        Personally, I stopped years ago appreciating her comments.

        She never says ‘yes’ or ‘no’, always ‘yo’ or ‘nes’.

        J.-P. D.

      • Gordon Robertson says:

        svante…”Funny thing she signed the methods paper but not the results”.

        Judith Curry signed the original findings. What you get today are the fudged interpretations of Mueller et al. She did not sign off on that propaganda, in fact, much to her credit, she exposed it as a fraud.

      • An Inquirer says:

        Her problem with Berkeley is that they did not do what they said they were going to do. She endorsed the methods, but when the methods employed differed from the methods promised, she disagreed.

    • bdgwx says:

      FWIW I was actually speaking of the summation in quadrature rule for combining two RMS errors. I’m pretty sure when you combine two RMS errors X and Y the final propagation of error on addition of the two is given by E = sqrt(X^2 + Y^2). Thus we say the actual temperature in 1910 is known to be 13.668C +- 0.087 because sqrt(0.048^2 + 0.072^2) = 0.087 where 0.048 is the uncertainty on the actual baseline and 0.072 is the uncertainty on the 1910 anomaly.

      My point was that even the actual annual mean temperature in 1910 is known to within +-0.1C 2-sigma certainty. And the anomaly is a bit lower still.

      And why is it when I ask people when they don’t agree with BEST, NOAA, NASA, Cowtan&Way, JMA, Had.CRUT, etc. estimates of error to provide their own estimate of the error and how they arrived at it all I ever hear is crickets?

      • Gordon Robertson says:

        bdg…the method for calculating RMS error:

        http://courses.washington.edu/phys123z/119_123_common/UncertaintiesManual.pdf

        Brings to mind a method we learned in calculus for estimating the error. Using a series, or a curve, you cut the series/curve off at an arbitrary value. You then operate on the remainder. I don’t recall the method offhand but I do recall it took us into 4th order differentials.

        The class of engineering students was PO’d because it was an exercise from a quirky math prof who was obviously oblivious to the work load we were enduring, some 44 hours a week of classes and labs alone. He told us we were not responsible for the material on an exam but it took us a couple of hours to understand the method and work it out. Just what you need when you have 6 other courses to cover.

        • Tim Folkerts says:

          Gordon, bdg was talking about the *next* step. After finding errors in two quantities using methods like you linked to, you might then want to combine the two quantities and find the overall error.

          For example, suppose you determine that one set of objects is 10.0 +/- 1.0 cm long, and another set is 20.0 +/-2.0 cm long. If you lay two such objects end to end a bunch of times, the length would be given as 30 +/- 2.24 cm. The error is not 1.0 + 2.0 = 3.0, but it is only (1^2 + 2^2)^0.5 = 2.24

          • ClintR says:

            An object from the 1st set might be 11 cm long. An object from the second set might be 22 cm long. Adding, the total length is 33 cm, not 32.24.

          • barry says:

            Did you miss the point deliberately to troll, or did you actually not get it, Clint?

          • ClintR says:

            Did you miss the point deliberately to troll, or did you actually not get it, barry?

  21. Svante says:

    That’s right, you’ve been banned at least three times.
    As geran (anger with syllables reversed), then g*e*r*a*n, and then JDHuffman.

  22. Chris Thomas Biscan says:

    You are embarrassingly wrong

  23. barry says:

    Every year someone tells us global cooling has started, and every time they’ve been wrong.

    https://www.youtube.com/watch?v=h6eswiI3KLc

    We’ve seen it so many times here, one wonders how addled the poor buggers are.

    • Svante says:

      What are the main risks you see with global warming?
      And which are exaggerated?

    • Eben says:

      The conditions to cooling have to be set many years before it actually shows up on the scale, your brain is too limited to comprehend that’s how the climate works , let alone recognize the actual driving forces,

    • barry says:

      Svante,

      Any number of risks have been exaggerated in some corner of the web or in the MSM. I don’t think any of the risks articulated by the IPCC are consistently exaggerated. I think most people don’t know the detail of what the risks are, so misunderstanding leads exaggeration, and profit-making causes media sensationalism, whatever view is being articulated.

      Eg, the average punter might think that the risk of sea level rise is only or largely about submerging habitation (when that is the least problematic issue associated with it) when a news item shows a graphic of Miama with 1.5 meters of sea level rise.

      On the other side of the coin, a news item including a graphic of a declining trend in burn area for location X leads another reader to believe that global warming isn’t happening or can’t be having deleterious effects.

      For what the risks are – the IPCC lays them out, with caveats. No need for me to write an essay on it here.

      https://archive.ipcc.ch/pdf/assessment-report/ar5/wg2/ar5_wgII_spm_en.pdf

  24. Svante says:

    Thanks for your input barry.

  25. gbaikie says:

    Sunspot number: 0
    Updated 14 Jul 2020
    Spotless Days
    Current Stretch: 3 days
    2020 total: 146 days (74%)
    2019 total: 281 days (77%)
    2018 total: 221 days (61%)
    2017 total: 104 days (28%)
    2016 total: 32 days (9%)

    Thermosphere Climate Index
    today: 2.34×10¹⁰ W Cold
    Max: 49.4×10¹⁰ W Hot (10/1957)
    Min: 2.05×10¹⁰ W Cold (02/2009)

  26. Garage shopper says:

    Does the sun spin? If so which direction- left or right?

  27. angech says:

    Nick stokes moyhu shows july anomaly < June, just.
    Bodes well for a drop in UAH
    Could I ask for st least 0.1?
    Ta

  28. sanvendra says:

    Thanks for sharing a important post for us. It helps to aware peoples about global warming.
    https://www.tractorfirst.com/

Leave a Reply