
 Home/Blog
Overview: Death certificate data, corrected for recent under-reporting, reveals a 10-20% decrease in weekly deaths compared to seasonal norms commencing in early March, 2020. This date coincides with the widespread closing of public schools. It is hypothesized that a decrease in traffic accidents is the most likely explanation for the decrease, a conclusion which would be confirmed from detailed analysis of the death certificate data.
I had previously blogged on the caution needed when analyzing the death counts from death certificate data compiled by the CDC. The most recent weeks always have under-counted totals because it takes weeks to months for all of the death certificates to trickle in and be counted. Use of the data without knowing this can lead to false conclusions about recently declining death rates. I outlined a simple method for doing a first-order correction of the data based upon the number of additional death reports in each successive week, a method which I use here.
The CDC data report weekly deaths in three age groups: less than 18 years old (“child”), 18-64, and 65 on up. The data are updated weekly, and the data online extend back to week 40 in 2015. I examined the death totals for the under-18 year old group versus the totals for the 18-and-older (combined) group. (Only those recent reports that were labeled as “100% reporting” were used, but this notation is misleading because the CDC means 100% of the locations around the country had submitted reports, not that all of the reports were complete.)
I removed the average seasonal cycle (2016-2019) from the weekly totals, which show a seasonal ~11% peak in deaths in early January for adults, and a weaker ~6% peak in children’s deaths in early June (Fig. 1).
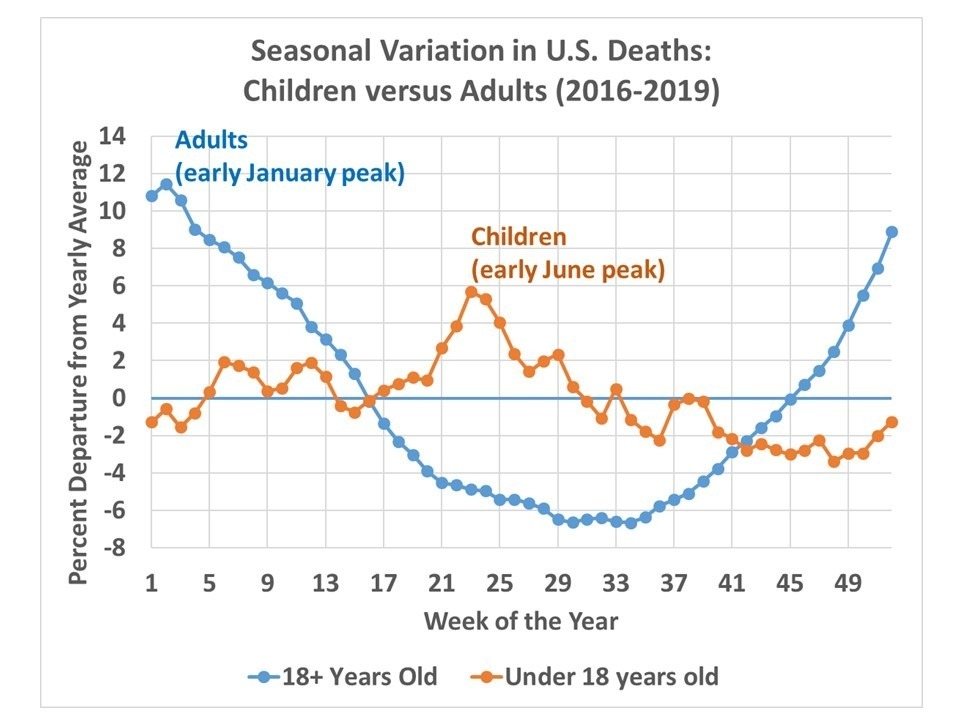
Fig. 1. Seasonal variations (%) in deaths (all causes) for adults versus children, 2016 through 2019.
In order to corrected for under-reporting of recent deaths, I used the data from 4 successive weeks earlier this year to correct the most recent 52 weeks of data. Those 4 successive weeks yielded average week-to-week adjustments which accumulated to 16.5% under-reporting for 1 week previous to latest reported week; 10.4% at 2 weeks previous; 7.8% at 3 weeks; 6.4% at 4 weeks, dropping below 1% at 10 weeks previous, etc.
I then computed the weekly percent departures from the average seasonal cycle for the entire time period (since week 40 of 2015). The results (Fig. 2) show the unusually bad peak in seasonal flu and pneumonia deaths in 2017-18, which as expected results in a larger increase in adults that children.
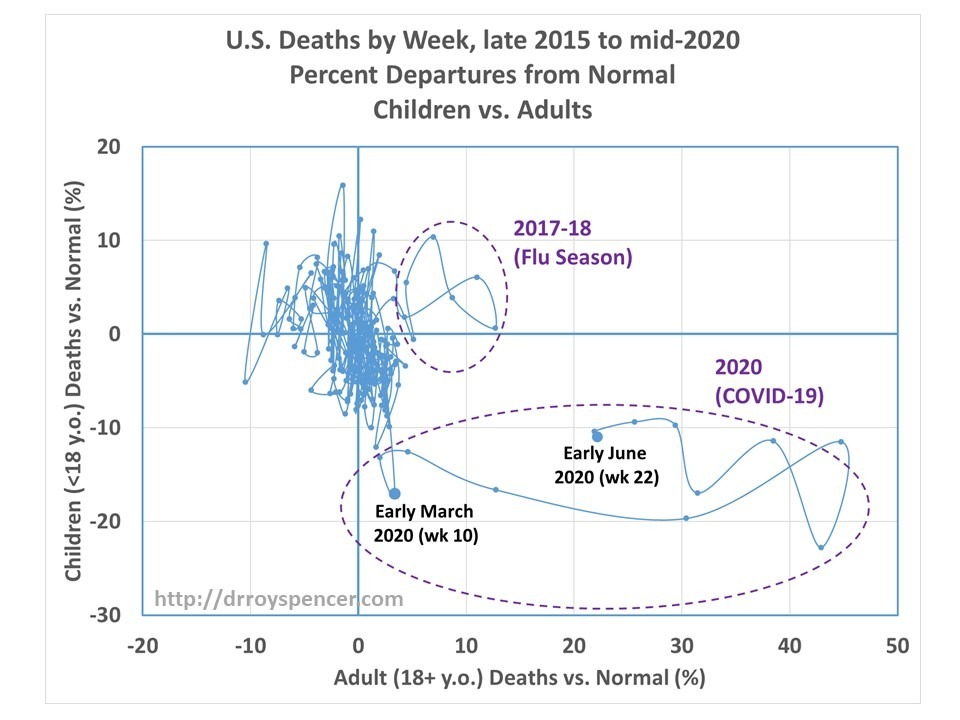
Fig. 2. Weekly number of deaths as percent departures from seasonal normals, for adults versus children, plotted as a phase space diagram (successive weeks connected by a line).
Note that there is a 10-20% decrease in child deaths beginning in early March, which is when most schools in the U.S closed down. Since the most frequent cause of death in the under-18 age group is auto accidents, it makes sense that the greatly reduced traffic activity during “lockdown” led to fewer deaths.
Of course, the same kind of reduction would be expected in the adult age category, but it is completely overwhelmed in Fig. 2 by the large increase due to COVID-19 deaths, which peaked in mid-April. Since there have been very few COVID-19 deaths in children we more clearly see the reduction in that age group. In absolute terms, a 15% reduction in childhood deaths equates to about 85 children per week.


