
 Home/Blog
The Version 6.0 global average lower tropospheric temperature (LT) anomaly for September, 2020 was +0.57 deg. C, up from from the August, 2020 value of +0.43 deg. C.
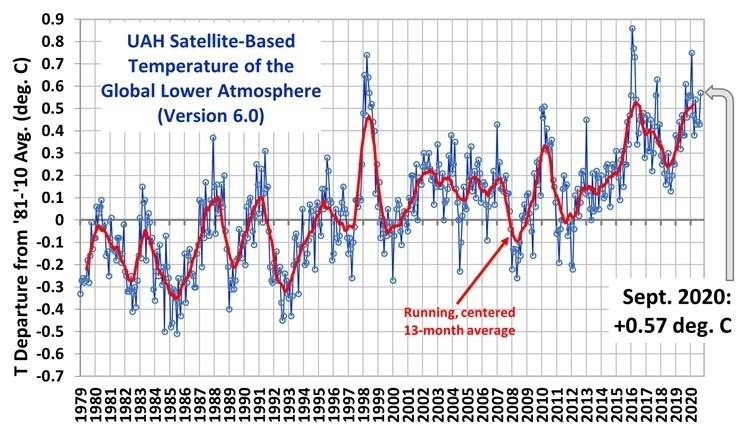
The linear warming trend since January, 1979 remains at +0.14 C/decade (+0.12 C/decade over the global-averaged oceans, and +0.18 C/decade over global-averaged land).
For comparison, the CDAS global surface temperature anomaly for the last 30 days at Weatherbell.com is +0.38 deg. C.
With La Nina in the Pacific now officially started, it will take several months for that surface cooling to be fully realized in the tropospheric temperatures. Typically, La Nina minimum temperatures (and El Nino maximum temperatures) show up around February, March, or April.
Various regional LT departures from the 30-year (1981-2010) average for the last 21 months are:
YEAR MO GLOBE NHEM. SHEM. TROPIC USA48 ARCTIC AUST
 2019 01 +0.38 +0.35 +0.41 +0.35 +0.53 -0.14 +1.14
 2019 02 +0.37 +0.47 +0.28 +0.43 -0.02 +1.05 +0.05
 2019 03 +0.34 +0.44 +0.25 +0.41 -0.55 +0.97 +0.58
 2019 04 +0.44 +0.38 +0.51 +0.53 +0.49 +0.93 +0.91
 2019 05 +0.32 +0.29 +0.35 +0.39 -0.61 +0.99 +0.38
 2019 06 +0.47 +0.42 +0.52 +0.64 -0.64 +0.91 +0.35
 2019 07 +0.38 +0.33 +0.44 +0.45 +0.10 +0.34 +0.87
 2019 08 +0.38 +0.38 +0.39 +0.42 +0.17 +0.44 +0.23
 2019 09 +0.61 +0.64 +0.59 +0.60 +1.14 +0.75 +0.57
 2019 10 +0.46 +0.64 +0.27 +0.30 -0.03 +1.00 +0.49
 2019 11 +0.55 +0.56 +0.54 +0.55 +0.21 +0.56 +0.37
 2019 12 +0.56 +0.61 +0.50 +0.58 +0.92 +0.66 +0.94
 2020 01 +0.56 +0.60 +0.53 +0.61 +0.73 +0.12 +0.65
 2020 02 +0.75 +0.96 +0.55 +0.76 +0.38 +0.02 +0.30
 2020 03 +0.47 +0.61 +0.34 +0.63 +1.09 -0.72 +0.16
 2020 04 +0.38 +0.43 +0.33 +0.45 -0.59 +1.03 +0.97
 2020 05 +0.54 +0.60 +0.49 +0.66 +0.17 +1.16 -0.15
 2020 06 +0.43 +0.45 +0.41 +0.46 +0.38 +0.80 +1.20
 2020 07 +0.44 +0.45 +0.42 +0.46 +0.56 +0.39 +0.66
 2020 08 +0.43 +0.47 +0.38 +0.59 +0.41 +0.47 +0.49
 2020 09 +0.57 +0.58 +0.56 +0.46 +0.97 +0.48 +0.92
The full UAH Global Temperature Report, along with the LT global gridpoint anomaly image for September, 2020 should be available within the next few days here.
The global and regional monthly anomalies for the various atmospheric layers we monitor should be available in the next few days at the following locations:
Lower Troposphere: http://vortex.nsstc.uah.edu/data/msu/v6.0/tlt/uahncdc_lt_6.0.txt
Mid-Troposphere: http://vortex.nsstc.uah.edu/data/msu/v6.0/tmt/uahncdc_mt_6.0.txt
Tropopause: http://vortex.nsstc.uah.edu/data/msu/v6.0/ttp/uahncdc_tp_6.0.txt
Lower Stratosphere: http://vortex.nsstc.uah.edu/data/msu/v6.0/tls/uahncdc_ls_6.0.txt


Hello,
What a cool article!
May I scrape it and share this with my website members?
My site is about Korean 출사유출
If you are interested, feel free to visit my site and
check it out.
Thank you and Keep up the good work!
We absolutely love your blog and find almost all of your post’s to be just what I’m looking for.
Do you offer guest writers to write content
to suit your needs? I wouldn’t mind publishing a post or elaborating on a number of the subjects you write with regards to here.
Again, awesome web log!
Wow! This blog looks exactly like my old one!
It’s on a completely different topic but it has pretty much the
same page layout and design. Outstanding choice of colors!
I am really impressed with your writing skills and also with the layout on your weblog.
Is this a paid theme or did you modify it yourself?
Anyway keep up the nice quality writing, it is rare to see a great
blog like this one these days.