Several lines of evidence suggest observed warming trends are not nearly as large as what you have been told.
It’s been almost eight years since I posted results on my analysis of the global Integrated Surface Database (ISD) temperature data. Despite finding evidence that urbanization effects on temperature measurements have not been removed from official land temperature datasets, I still refer people to the official products (e.g. from NOAA GHCN, HadCRUT, etc.). This is because I never published any results from my analysis.
But I’ve started thinking again about the question, Just how much warming has there been in recent decades (say, the last 50 years)? The climate models suggest that this should have been the period of most rapid warming, due to ever-increasing atmospheric CO2 combined with a reduction in aerosol pollution. Since those models are the basis for proposed changes in energy policy, it is important that the observations to which they are compared be trustworthy.
A Review of the Diagnosed Urban Heat Island Effect
The official datasets of land surface temperature are (we are told) already adjusted for Urban Heat Island (UHI) effects. But as far as I know, it has never been demonstrated that the spurious warming from urban effects have been removed. Making temperature trends be the same independent of urbanization does NOT mean urban warming effects have been removed. It could be that spurious warming has simply been spread around to the non-affected stations.
Back in 2010 I quantified the Urban Heat Island (UHI) effect, based upon the difference in absolute temperatures between closely-spaced neighboring stations having different population densities (PD). The ISD temperature data are not max/min (as in GHCN), but data taken hourly, with the longest-record stations reporting at just the 6-hourly synoptic times (00, 06, 12, 18 UTC). Because there were many more stations added to the global dataset in 1973, all of my analyses started then.
By using many station pairs from low to high population densities, I constructed the cumulative UHI effect as a function of population density. Here are the results from global data in the year 2000:
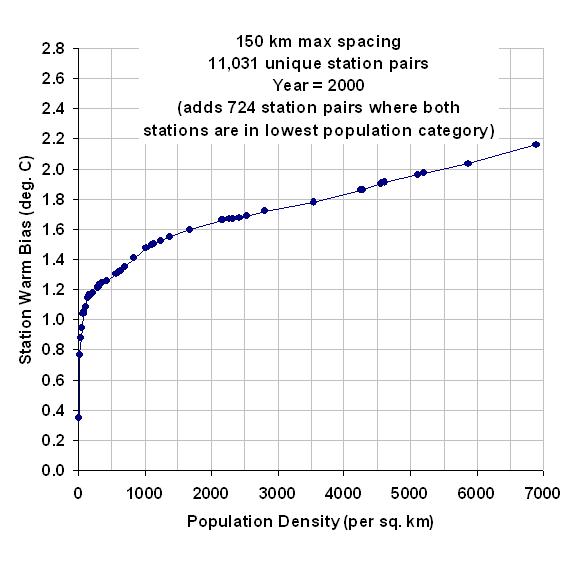
Fig. 1. Diagnosed average Urban Heat Island warming in 2000 from over 11,000 closely spaced station pairs having different population densities.
As can be seen, the largest warming effect with a change in population density occurs at the lowest population densities (not a new finding), with the most total warming at the highest population densities.
The Effect of Population Density on U.S. Station Temperature Trends
In 2012 I experimented with methods to removed the observed UHI effect in the raw ISD 6-hourly data using population density as a proxy. As you can see in the second of the two graphs below, the highest population density stations had ~0.25 C/decade warming trend, with a reduced warming trend as population density was reduced:
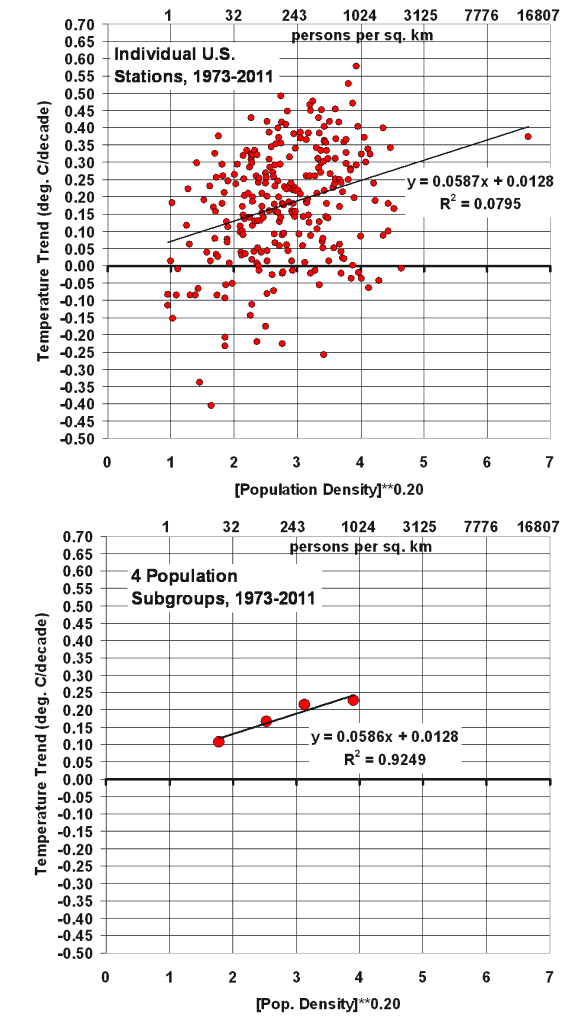
Fig. 2. U.S. surface temperature trends as a function of local population density at the station locations: top (raw), bottom (averages into 4 groups).
Significantly, extrapolating to zero population density would give essentially no warming in the United States during 1973-2011. As we shall see (below) official temperature datasets say this period had a substantial warming trend, consistent with the warming in the highest population density locations.
How can one explain this result other than, at least for the period 1973-2011, (1) spurious warming occurred at the higher population density stations, and (2) the evidence supports essentially no warming if there were no people (zero population density) to modify the microclimate around thermometer sites?
I am not claiming there has been no global warming (whatever the cause). I am claiming that there is evidence of spurious warming in thermometer data which must be removed.
Next, we will examine how well that effect has been removed.
How Does this Compare to the ‘Official’ Temperature Trends?
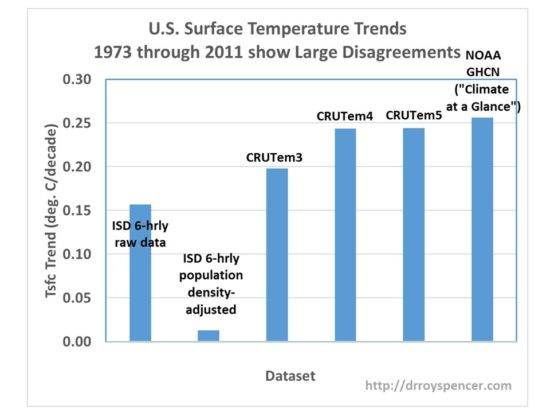
Since I performed these analyses almost 10 years ago, the ‘official’ temperature datasets have been adjusted several times. For the same period I analyzed 8-10 years years ago, look at how some of these datasets have increased the temperature trends (I used only CRUTem3 back then):
The CRUTem3 data produce a trend reasonably close to the raw, unadjusted 6-hourly ISD-based data (the correlation of the two datasets’ monthly anomaly time series was 0.994). Note that the latest USHCN data in the above graph has the most warming, at +0.26 C/decade.
Note that this is about the same as the trend I get with the stations having the highest (rather than lowest) population density. Anthony Watts reported qualitatively similar results using different data back in 2015.
How in the world can the warming result from NOAA be reconciled with the (possible zero warming) results in Fig. 2? NOAA uses a complex homogenization procedure to make its adjustments, but it seems to me the the results in Fig. 2 suggest that their procedures might be causing spurious warming trends in the data. I am not the first to point this out; others have made the same claims over the years. I am simply showing additional quantitative evidence.
I don’t see how it can be a change in instrumentation, since both rural and urban stations changed over the decades from liquid-in-glass thermometers in Stevenson screens, to digital thermistors in small hygrothermometer enclosures, to the new automated ASOS measurement systems.
Conclusion
It seems to me that there remains considerable uncertainty in just how much the U.S. has warmed in recent decades, even among the established, official, ‘homogenized’ datasets. This has a direct impact on the “validation” of climate models relied upon by the new Biden Administration for establishing energy policy.
I would not be surprised if such problems exist in global land temperature datasets in addition to the U.S.
I’m not claiming I know how much it has (or hasn’t) warmed. Instead, I’m saying I am still very suspicious of existing official land temperature datasets.
Recently this was posted. US aver temp data (not an anomaly set) & graphed. Shows no warming in US since 1998:
Data generated by the National Oceanic and Atmospheric Administration (NOAA) for the relevant years under discussion. The table below reports the average mean temperature in the continental U.S. for the years 1998 through 2019*:
https://rclutz.wordpress.com/2020/12/10/fear-not-rising-temperatures-or-ocean-levels/
Also CONUS_temp anomaly_NOAA-contiguous-USA-crn-2005-2019, don’t show any warming for US.
We need someone at the WH press events to hold up some posters illustrating these issues, and others with the actual scientific understandings re: trends in SLR, tropical cyclones, global wildfires, floods, tornadoes, etc., as printed in the IPCC and NCA reports and challenge this admin – make it public so the audience can see.
Also push them to distinguish between natural climate variability (which is always dramatic – even on decadal time scales) and the view that there might [eventually] be some human footprint in it.
Did anybody ever tell you that your US corner is no more than little 6 % of Earth land surface?
When I read such comments, I get a big laugh.
J.-P. D.
On the other hand, over 300 million people live in the US, so the climate THEY LIVE IN is important to them.
If people are ever harmed by climate change, and I don’t know of anyone harmed during the warming since the 1600s, it will be from changes in their LOCAL climates. No one lives in the global average temperature.
I get a big laugh from your comments too, Bindingdong.
Greene
Feel free to get the big laugh too. No problem for me!
What you omit (intentionally or not) is nonetheless the fact that nearly all people posting here very well discuss about global warming but in fact have only their little provincial CONUS corner (no: not US, CONUS) in mind.
Where I live, Greene, matters to me as well, and I’m happy to live since years without the harsh winters I had to experience in earlier times, starting with 1956 (I was 7). The last one was 2010.
This, Greene, is not a reason for me to ignore
– what happens in the Northwestern Atlantic
– that it is certainly not due to local phenomena
and
– how it increasingly influences our local weather patterns in a Germany radically changing wrt weather – and maybe climate.
I have nothing in mind with CO2 etc etc.
J.-P. D.
I’m happy with the warming since the 1970s, in Michigan, where I live.
You seem to be happy with the warming since the 1970s wherever you live.
I’d bet most people living in Canada, Sweden, Norway, Finland, Iceland, U.K., Russia, and other nations at similar latitudes, are happy with the warming since the 1970s.
A chart showing warming by latitude, since January 1979, is here:
https://elonionbloggle.blogspot.com/2021/02/a-series-of-honest-climate-charts-first.html
In my opinion, that adds up to A LOT OF PEOPLE who are happy about ACTUAL global warming they have experienced, since the 1970s, WHERE THEY LIVE.
Many of the nations I listed probably had more warming than the global average.
Do people in those nations care if the oceans are a degree warmer than they were 45 years ago?
I doubt it.
The climate alarmists have their inaccurate predictions of future global warming, with their predictions averaging double the warming that actually happens (based on the average climate computer game).
Versus real people LIVING WITH and ENJOYING WARMING for the past 45 years.
People like warm.
People I know, who can afford to vacation anywhere on the planet, usually go to warm locations, even during the warmest months of the year.
The claim that continued warming will suddenly change from being pleasant, into a “crisis”, makes no sense, but that’s what climate alarmists have been warning since the 1960s.
It’s long past time to stop listening to climate alarmists.
Real environmental problems include air pollution, water pollution, soil pollution, etc.
Real energy problems include the one billion people on our planet with no electricity.
NOT spending a fortune on ourselves, to replace a reliable electric grid, with a less reliable electric grid, powered mainly by wind and solar energy.
More CO2 in the air, up to 1,000 ppm, is not a problem.
More CO2 is greening our planet.
800 ppm to 1,000 ppm CO2 (versus 415 ppm today) optimizes the growth of C3 plants used for food.
More CO2 in the air supports more life on our planet.
People who are anti-CO2 are anti-life !
J.P.D Sorry I called you Bindingdong in my last comment — that was something I would have deleted after I posted it, eventually, if it was possible to edit comments.
“People like warm.”
So do mosquitos.
Historically, people like temperate zones. Thats where civilization flourished.
Temperate: not too hot, not to cold. And that’s what many crops seem to need.
Historically people could deal with cold, with dwellings and fire. But not so well with heat and bugs and tropical diseases.
You might be thinking of retirees, who may want to move from Michigan to the sunbelt.
As I get older, I can appreciate the idea of moving to a warmer place… but I hate hot and humid as much as much as cold.
What a pathetic – sick – comment. Just a hateful soul (if you have one) you be.
Suspect that you did not manage to catch the title at the top of this piece by Dr. Spencer?
“Could Recent U.S. Warming Trends be Largely Spurious?”
If it is spurious than UAH itself is spurious as well.
The US is just a small portion of the entire planet, so why cherry pick one nation?
While it is possible to do a UHI estimate for the US, it is impossible for most of the world. The reason is that you need to compare rural weather stations, that remained rural over many decades, with nearby urban stations where the cities/suburbs had a lot of population and economic growth over the decades.
Unfortunately, there are few rural weather stations in the world that remained rural, with continuous data for a century or more.
The NOAA USCRN weather station network shows no obvious U.S. climate trend since 2005 — a short period, but not that short:
https://elonionbloggle.blogspot.com/search?updated-max=2021-01-26T13:44:00-05:00
In 1999, NASA-GISS began using a computer program to automatically search weather station records, and apply adjustments to remove urbanization bias.
( Hansen et al., 1999 )
When the Goddard Institute ran their program on about 6,000 station records, there were lots of adjustments, but they only added up to about -0.05°C. per century.
The reason the net adjustment was so small is puzzling: About half the GISS computer program adjustments are to remove UHI warming, which makes sense … but the other half are adjustments to add warming, which makes no sense !
That negligible GISS net UHI adjustment convinced many people that urbanization bias problem was tiny.
For about 200 of the urban stations, GISS did not have enough rural neighbors for their computer program to work, and so those un-adjusted urban stations are not included in their global temperature estimates.
Strangely, GISS does not subtract their estimated urbanization bias from the current temperatures — their program adds degrees to the early unbiased temperatures, which is “rewriting history”.
NASA-GISS never verified their adjustments to prove they were actually removing urbanization biases from their data !
Once they had written their computer program, they merely assumed it would work.
For the entire planet, we have UAH to help keep the surface temperature numbers honest (in the ballpark). Of course economic growth affects the land surface numbers over the decades. But there is no economic growth in the troposphere.
The ocean surface measurements are not trustworthy until ARGO data less than two decades ago. Buckets and thermometers in Northern Hemisphere shipping lanes is not sufficient global coverage, or close to accurate.
Most important, with all the surface data wild guess infilling, and “adjustments”, the government bureaucrats who compile the surface global average temperature have a lot of flexibility.
I say they can’t be trusted. They WANT to see more global warming, which means lifetime job security for them. So they will “round up” the numbers whenever possible, intentionally or unintentionally.
Correct link for my initial comment:
https://elonionbloggle.blogspot.com/2021/01/some-us-climate-data-for-300-million-of.html
Because the Biden admin, most Democrats and their national mainstream media are shrilling every day of the week about how the people in the us are suffering tremendously from the effects of man0-made GW or ACC (they don’t know the difference).
Of course they are not, as there are no long term worsening trends (globally, nor for the US) with much of anything. Not hurricanes, drought, wildfires (only regional – not for the US) floods, nor SLR during the course of our lifetimes.
Yes – perhaps during that time frame we have seen an average yearly increase of a 0.5C or so, and even if they are correct and most of that (no one says all) – say 0.35C? – is man-made . .that is not something that a human being can actually feel/experience over the course of their lifetime; ‘honey have you noticed that the average annual temperature here is now 55F, not 54.1 that it was the day we were born?’
Now – move from Boston to Miami – a 25F ave annual increase – and you bet that it can be felt. But, do those migrating folks suffer immensely from their choice to escape the dangerous cold? Do men become sterile – noting that a recent study predicted that a 1C inc in GT’s would make men sterile?
Does anyone have any common sense any more?
… But it is political common sense that politicians can benefit from getting the general public frightened about something, even a harmless gradual warming trend, so the public will demand that their government DO SOMETHING NOW !
DO SOMETHING NOW is exactly what leftist politicians running governments want to hear!
“The urge to save humanity from harmless carbon dioxide
is a ‘progressive’ false front for their urge to rule”.
The Honest Global Warming Chart Blog
“Politics is the art of looking for trouble,finding it everywhere, diagnosing it incorrectly,and applying the wrong remedies.” Groucho Marx
Richard,
As Lincoln said, “the left are wolves disguised as shepherds.”
Climate change is not uniform in a warming world. As Richard points out the arctic is warming quite fast relative to the tropics. Weather patterns can be expected to change as a result of this change in the temperature gradient.
Climate change can be good or bad.
Bad is if the western US, or other fertile regions become a desert. Bad is if major, reliable, glacier-fed water sources dry up. Bad is if Miami, New York, Houston, Venice, Shanghai, etc flood much more often. Bad is if ocean warming and acidification result in loss of major reefs and fisheries.
Bad is if we exceed tipping points, that commit the Earth to the irreversible loss of the Greenland and W. Antarctic ice sheets over the next few centuries, and resultant sea level rise of many meters.
But if you guys are certain that these bad outcomes won’t happen, then, no worries.
Damn, Richard, you cut Nate off at the pass.
Nate will be here soon.
Put on your boots.
The people who claim 1-2 degrees of warming will cause some kind of climate catastrophe are basically two groups , Komunist shysters – and debils who follow them , nothing to do with science.
Correction , it should read “Komunist shysters who hijacked climate as a means of total global control”
There’s a little science.
Added CO2 ought to cause some warming.
Lab experiments suggest harmless warming.
Actual warming has been harmless.
Even if you assume ONLY CO2 is the cause.
We want more warming here in Michigan.
We love warming.
We want to retire our snow shovels.
Taking a little science, in a lab, and extrapolating a “climate emergency”, is no longer real science at all. What we have now is climate astrology, used by leftists to creats fear, to gain more control of general public … with the false claim they are saving the planet. Leftists always want more government power. Now they have a (fake) virtuous reason (“climate emergency”) to get what they have always wanted.
I happen to know, with 101% confidence, that Earth’s climate will get warmer, unless it gets colder. And I sure prefer warmer.
As long as you’re warmer in Michigan in January. Or maybe just move to the always warm Maldives islands. Very cheap, and every house will soon be ocean view..
Hey Nate
The Maldives have been “sinking” for three decades, according to the alarmists, probably from the weight of all the resorts being built there!
Warm weather, Pacific Ocean, and lots of bikinis — who would want to live there?
https://travelaway.me/aerial-photos-maldives/
True, who wants bikinis on their beach front property..
Maybe try Bangladesh!
N,
You do realise that according to geophysicists, all deltas sink?
The sediments from the Ganges and Brahmaputra offset this sinking at present.
Even continents rise and fall, sea beds the same. No expansion of the oceans due to mythical CO2 forcings.
Learn some physics. Learn what real scientists do.
Evidence? A link?
No of course not. Facts dont really matter when you dont need to back them up.
N,
Are you really so incompetent that you need me to spoon feed you?
You dont know how to use a search engine?
Best stop randomly pounding your keyboard until you do.
You have a history of making unsupportable claims. This is likely another one.
But feel free to prove me wrong.
Re: Bangladesh. You can easily search for subsidence in the delta region there. There are also additional man-caused land use issues at play.
Also note that the continent, as illustrated by sea tide gauges, either side of Bangladesh, show very little relative sea level rise – a function of the continued uprising of the continent.
A learning lesson about subsidence (other than the East coast of the US) is Bangkok, which is sinking inches every year.
“Experts warned in 2008 that Bangkok is sinking at a rate of 10 cm (4 inches) per year. An extra 7 in of SLR over 100 years time is not the pressing issue at hand. Bangkok will be a disaster sometime in the next 15 – 25 years. But the media will just keep lying to the public saying we’ve got to stop nature.”
There seems to be a lot more ‘total global control’ going on these days. If people dont follow orders, theyre likely to get cancelled, or worse….and thats just in the Republican party!
I think the oceanic sea surface temperatures are a very good indication of how unlimited real global warming has been. If one goes back to 1970 to now it’s like +.3c
That could easily decrease.
Salvatore, you are right on the money. You can ignore land based stations as the oceans tell us the global climate change.
https://woodfortrees.org/plot/uah6/from:1979/to/plot/uah6/from:1979/to/trend/plot/hadsst3gl/from:1979/to/offset:-0.2/plot/hadsst3gl/from:1979/to/offset:-0.2/trend
Amazingly, the SSTs also matches UAH perfectly (and CERES). A trend of .065 C / decade where about .04 C of that is ocean cycles (AMO,PDO,ENSO) and another .02 C is due to increasing salinity.
Sorry I copied the trend data wrong. It is .137 C / decade. The ocean cycles are 2/3 of the trend while the underlying salinity change is 1/3.
RM,
That would be 13,700 C after a million years?
Nonsense. When do you expect the trend to stop, if CO2 levels keep rising (or stay the same)? What physical laws support your estimate?
Swenson,
I expect the trends to reverse soon. The AMO and PDO could both reverse within the next 3-4 years. The salinity cycle is unknown. It could be at its peak right now or could continue for years.
The causes for the AMO and PDO are currently unknown but have been tracked historically for hundreds of years in the past. The salinity physics is well known. Higher salt content means lower evaporation rates leading to warming.
Sea surface measurements:
Wood bucket and thermometer almost entirely in Northern Hemisphere shipping channels
Various types of buckets
Engine water intake from various depths
Fixed and drifting buoys
ARGO floats
That’s a lot of changes to the measurement equipment, starting with very little global coverage pre-1920, and gradually getting better global coverage.
No experiment, that I know of, used all prior and present sea surface temperature measurement instruments AT THE SAME PLCE, and AT THE SAME TIME, to determine if changes in the instruments, over time, could have unintentionally caused warming, or cooling.
I doubt if ocean measurements have been accurate enough to tell us the “global climate change” until the use of ARGO floats less than 20 years ago.
The climate has been warming for 20,000 years.
The warming in the past 145 years is not known with the claimed +/- 0.1 degree C. accuracy claimed by government bureaucrats. Prior to 1920 we only have rough estimates of the Northern Hemisphere oceans, and nearly wild guesses of the Southern Hemisphere oceans.
You list the rationales for making adjustments. Good to know.
Actually, one needs to do side by side calibration tests in order to do the adjustments. That seems to have been scrupulously avoided. This Matthews paper is the closest I found to analyzing the historical methods. https://os.copernicus.org/articles/9/683/2013/os-9-683-2013.pdf
https://climatereanalyzer.org/wx/DailySummary/#t2anom
Only +.3c since 1970 ,30 year average.
cor 1980
Please explain how this shows “only +.3C since 1980”.
The KNMI climate explorer and google earth are two useful tools for this. I did some research. I sought for 100+ years temperature series in natural environments around the world and I found a couple. And guess what… almost no warming. But as soon as there is some agriculture activity around temperature rises. I think this has to do with the humidity of the soil and the shading of forests.
You cannot trust “rural” either. I live in Finland, used to have a very rural official weather station as next door neighbour (rural, means half a mile away). It was located on a lawn, next to a gravel yard. After the first ten years they paved the gravel. Another ten years later, they placed a container for metal scrap next to the screen. In close to 40 years, the screen was never painted. Now the station has been dismantled for almost 20 years, replaced by a less rural location. I have no idea how they dealt with the time series when they moved.
Sorry for the above – it seems your site does not like quotation marks. You cannot trust RURAL either.
Claes Ehrnrooth
The bog site doesn’t like most of the special UTF8 characters.
For that reason, when I do not forget to do, I paste texts into
https://mothereff.in/html-entities
and paste the tool’s result back into the blog’s editor.
Moreover, beware of trying to enter texts containg ‘d’ immediately followed by ‘c’. Absorp-tion is a problem as well…
*
Btw: could you please publish that station’s name? Maybe you manage to find it by downloading e.g.
https://tinyurl.com/ydbymtp6 (tinyURL’d due to above problem)
and extracting, out of that huge file, all station lines whose id begins with ‘FI’.
J.-P. D.
I would imagine that the biggest UHI effect, over time, would be from a rural station that is gradually surrounded by a small village, which gradually becomes a town, and eventually becomes a city.
A weather stat,ion within a city will measure warmer than one in nearby suburbs but the UHI might not change much over time if it remains within a city.
The UHI might decrease if an inner city weather station is moved to an airport … at first … but then areas near airports tend to have a lot of economic growth over time.
And then you have micro changes to the landscape near the weather station — grass & weeds vs. dirt vs. pavement.
Finally, some smarmy climate alarmists back up their cars to weather stations located near the pavement, to to aim their auto engine exhaust heat at the weather station. That will become a problem as they buy more and more electric cars. heh heh
An audit by researcher Steve McIntyre reveals that NASA has made urban adjustments of temperature data in its GISS temperature record in the wrong direction. NASA applies an urban correction of its GISS temperature index in the wrong direction in 45% of the adjustments. Instead of eliminating the urbanization effects, these wrong way corrections makes the urban warming trends steeper.
https://friendsofscience.org/index.php?id=396
NASA data I found when researching UHI adjustments subject a year or two ago stopped at 2011 — after 2011 seemed to be hidden from the public.
Roughly half the adjustments were in the wrong direction, increasing the global warming trend, which made no sense. Similar to the link you provided using data from few years earlier.
The warming and cooling “adjustments” ended up almost cancelling each other (see my prior comment).
It seemed to me that NASA-GISS wanted to claim they “adjusted” for UHI, but they also wanted the adjustment to be so small that it was almost meaningless for their global average temperature. The methodology they used suggests either science fraud, or incompetence — typical goobermint work.
I think McIntyre got a paper published on paleoreconstructions, but has he submitted his musings on UHI to a journal?
You make it sound like his view is the final word, Ken, but it only rises to the level of blog until he formalises it.
Yet the UAH data for USA48 shows a similar trend (about +0.15 deg/decade) as ISD RAW.
Since there is no UHI effect in the lower troposphere, the UAH data supports the adjusted surface data.
The problem appears to be that none of your deduced relationships with population are statistically significant. That means any value based on extrapolation (to zero population) will be very uncertain.
My eye-balling of Figure 2 suggests that a positive trend of +0.15 could lie well within any uncertainty limits.
Therefore I remain unconvinced that the land surface data sets are misleading.
But one could consider the warming Urban Heat island as serious issue as most people most concerned about rising temperature live in Urban areas.
And it seems the cheapest way to solved this problem is to start moving cities into the Ocean.
I would propose, that governments developing low income housing in ocean settlements. And government effort should not be about housing specifically but it rather should be focused making the breakwaters for the future ocean cities.
And one might start in areas which largest potential for Hurricane damage- or the breakwaters should be designed to withstand and eliminate the wind and waves produced by hurricanes, and if settlement large enough, even effect coastal damage from hurricanes.
Or government should focus on the infrastructure of the city and breakwaters are part of infrastructure and are of communal interest and management. There other aspect needed including such things as developing and managing sewage systems, transportation, and water and electrical power.
One can’t build large ocean settlements within a short time period, and governments are known for there inability to anything. One need future planning, and experimental projects based on getting to such future planning and may take decades. But most of that time would consumed with the experimental projects, or test, and prove what works, but once build the knowledge {know “exactly” what you want] the large construction phase, could be done quickly.
So as a start one do stuff which have immediate value {politicans live in world where they need fast result to gain political support} so one start by making breakwaters for coastal regions.
And what talking about is anchored {I thinking pile anchored} floating breakwaters, and at cost of about $10 million per km- which can achieved by using least amount of any kind material- which also stop hurricane type waves and last for many decades.
Very roughly what talking about is something like what was used on D-day, but it wasn’t designed for 40 year gales, and what you want something for 1000 year “gale”. Anyhow, it worked until they got the 40 year gale. As people might be aware, D-day was almost canceled because the predicted bad weather. Ie:
http://www.mulberryharbour.com/wp-content/uploads/2014/05/The-Bombardon-Floating-Breakwater-by-R-Lochner-O-Faber-and-W-G-Penney.pdf
And from it:
“would suppress waves of the maximum size anticipated in operation” Overlord” for an expenditure of about 1 1/4 to 2 1/2 tons
of steel per foot of breakwater frontage. That represented an expenditure of less than one-tenth of that required for any other
possible method.”
And I think can do it with modern technology so it would less than 1 ton per foot.
A study by McKitrick and Michaels 2007 showed that about half of the warming over land since 1980 in instrument data sets is due to the Uurban Heat Island Effect (UHIE). The authors compared the pattern of warming over the Earth’s land surface to local economic conditions.
http://icecap.us/images/uploads/MM.JGR07-background.pdf
A paper by De Latt and Maurellis 2005 gives evidence of strong influences of urban activity and other surface processes on measured temperature trends in both the surface dataset by the Climate Research Unit and the satellite lower troposphere datasets. The gridded emissions of CO2 are used as a proxy of urbanization. The study shows half the warming over land of the CRU data is due to UHIE.
https://rmets.onlinelibrary.wiley.com/doi/abs/10.1002/joc.1292
Some critique of the M&M papers on tying warming to economic growth.
https://projects.met.no/regclim/results/Benestad04_CR_c027p171.pdf
https://sci-hub.do/10.1002/joc.1831
M&M use a short time span, as well as not really doing a global analysis, but using a subset of stations.
I checked the global temperature trends for the period in MM07 (1980-2002), and the global trends from the surface data sets were quite similar, varying by a few hundredths of a degree C per decade. GISS and NOAA trends are actually lower than UAH lower trop for the period, so even if we did accept that the time period is long enough and the small surface area reflects global behaviour, the surface records are very similar to the satellite record, which should have little to no influence from UHI.
I would think population growth rate would be tied to temp trends, if UHI were a big factor.
Here are states and their population growth
https://upload.wikimedia.org/wikipedia/commons/f/f3/US_state_historical_population_FRED_SMIL.svg
I looked up Temp Trends since 1970 on NCEI for the 5 states with highest growth rates, and 5 states with ~ no growth rate since 1970.
High pop growth rate since 1970, and T trend since 1970 in deg F/century
NV 5.3
UT 5.7
AZ 6.3
FL 4.7
TX 5.5 Ave 5.50
No pop growth since 1970 and T trends.
NY 5.5
PA 5.1
OH 5.0
NJ 6.4
MI 5.2 Ave 5.44
Also note all the states have a similar pattern of Temp change with very different patterns of population change.
This suggests that a population driven UHI effect is not very important.
Example trend
https://tinyurl.com/1l99yko8
Change the state and hit PLOT
Not really; in those states with low population growth, you still have had urban sprawl. This would have the same effect as the population growth in states like Nevada and Arizona. In NY and PA et al., you have many more automobiles and HVAC units now than before, contributing to the UHI effect. Your examples aren’t very insightful on closer inspection.
“This would have the same effect as the population growth”
Not obvious. If so then same applies to Roys population analysis. Pls quantify that effect.
Population and energy use and UHI was growing rapidly in 50 y prior to 1970 in many states, eg NY, CA, TX, FL, MI.
But in all of these states there was ~ flat warming trends 1920-1970.
It doesnt make sense for the UHI effect to turn-on everywhere in 1975.
BTW the warming trend also turned-on simultaneously in Africa, and all other xontinents.
You just repeated what you stated before. Dr. Spencer’s data is trended for population density around weather stations. Yours is just generalized based upon states’ population growth with no correlation to weather stations or anything.
Also, temperature data sets from third world stations have been aggressively “adjusted.”
The key word is ‘change’.
We are interested in temperature change.
Changing population density can clearly be expected to produce the largest change in UHI effect. Certainly a larger one than a static population.
As Roy noted, the change in UHI effect is most dramatic when population density is low and increases.
Europe has had a high and stable population density for most of the last century, with high growth in the previous century. Africa has had rapid growth in population in last few decades.
Both Europe and Africa have the same T pattern, with rapid rise starting circa 1975.
That makes no sense if population driven UHI effect is the main cause of the warming.
You need to go back and reread Spencer’s article and actually pay attention this time, then maybe find fault in his reasoning method. Bringing up warming in Africa or Europe or comparing one state to another has no bearing on what he is saying. He is comparing closely spaced neighboring stations with different population densities. It appears urbanization effects have not been removed from the temperature data. Don’t you want accurate data?
Yes I want accurate data. Just because a hero of yours makes a claim like this, doesnt make it correct.
The main temp record algorithms try to avoid UHI effect. A published study by Berkeley Earth found little UHI impact. Roys is not published.
I am pointing out flaws in the logic of Roys claims. Real scientists expect that kind of critique.
Be skeptical of skeptics my friend.
But he’s using data that everyone else is using and analyzing it differently. If you disagree with his rationale, then offer a different explanation. You are not finding fault with his logic. It seems you are trying to avoid confronting his logic.
“Be skeptical of skeptics.”
Do you realize how nonsensical that statement is in the realm of science?
” If you disagree with his rationale, then offer a different explanation. ”
I did exactly that. Did you miss it?
Look at his figure 1. It shows that the warm bias (offset) changes rapidly with population density around a station.
That means if population density is increasing rapidly, the offset to the temperature will increase. That is how the UHI effect can influence temperature TREND.
The point I made is that population growth, rather than population, should correlate to temperature trend.
Berkeley Earth paper on UHI non-effect. Notice J. Curry is an author.
https://static.berkeleyearth.org/papers/UHI-GIGS-1-104.pdf
Berkley Earth doesn’t really explain anything. There’s a correlation between temperature and CO2. If you want an explanation, you have to go to Salby. CO2 increases as the time integral of temperature, which Berkley Earth demonstrates.
No, that isn’t what it means. It means that if you take closely spaced stationed pairs with different population densities, then there appears to be a UHI effect. It doesn’t mean anything about rapidly growing areas. You really need to stay away from science.
What does warm bias mean in fig 1?
I think it means the thermometer reads warmer by that much, compared to pop density zero.
How do you imagine that makes temp increase with time?
Did you click on “constructed?”
OK,
Right away I noticed this
“While the rate of warming with population INCREASE is the greatest at the lowest population densities, some warming continues with population INCREASES even for densely populated cities.”
Thus the main idea is that populations must be INCREASING to see a warming effect.
This has been the point Ive been trying to make.
Good stuff, Dr. Roger. One further datapoint. The Berkeley Earth data for 1973 – 2011 shows a trend of 0.10C/decade, between the ISD Raw and the ISD adjusted data.
Onwards, ever onwards,
w.
Dr. Roy, not sure if I can post images here, but I thought you’d enjoy this, so I’ll just put in the URL:
https://wattsupwiththat.com/wp-content/uploads/2021/01/scatter-density-vs-temp-trend.png
Best regards,
w.
Two or three years ago there was an article on one of the popular climate blogs, perhaps a journal published article, perhaps not. It analyzed results from various published UHI studies. It was about how greatly the urban to open temperature varies from city. Analysis suggested that at least some of the differences might be due to the density of trees along streets and in yards, the amount and size of urban parks, and other factors I don’t recall. Basically, the situation is apparently much more complex that just the physical urban size or its population density. It reported that in some cases recorded urban temperatures are significantly lower that surrounding open countryside.
My own observations, though hardly on a level with serious scientific endeavors, suggest another major factor. For years I had a job which had me making a trip every workday over a route that covered perhaps six or eight miles of city streets. I never paid attention to the distance but the trip route was consistent. After noticing a large temperature difference between a couple of stopping points, I started paying attention.
For this regular route, summer temperatures regularly varied by a measured 6 degrees F between the lowest and highest, and occasionally, on particularly hot days, by 10 F and even 12 F degrees. The temperature went up, then dropped, then rose again as I went forward. I went one way, and came back the same way, block by block. I could observe that the temperature climbed when I went along one stretch and fell when I went back the other direction, always along the same stretches, all within 15 minutes or so for any particular stretch. I never could make sense of why it should go up, or down, based on the surroundings but since it was consistent, day after day there probably was some reason(s). During the winter months there was little or no temperature differences from place to place. While spring temperatures were climbing, or autumn temperatures dropping, the point to point temperatures were smaller than during the hottest months.
All that verbiage is to say that just where the recording is made, even within a relatively small area, seems to greatly effected the temperature observed, at least during half the year. Possibly the official urban temperature, in some or in many places, would be quite different if measured a little ways one direction or another. 6 to 10 degrees measured difference could make the calculations come out rather different.
While the calculations presented in this article are consistent with “climate” literature practices, they are really a fantasy. There are two too many decimal places to be real. The uncertainty in the temperature measurements are much larger than the calculated differences. They might, by chance, correspond to some real differences, assuming the measurement positions are meaningful (possibly a big assumption) but it is only a pretend mathematical game not really supported by the available data.
https://cryosphere.today/IMAGES/antarctic.recent.png
When you take this into account the fact sea surface temperatures are barely above average, the fact no major volcanic eruptions of late have taken place, the urban heat island effect the global warming that is forever hyped is just that hyped.
Even global snow cover is average for this time of year.
Flux of solar UV radiation.
https://www.iup.uni-bremen.de/…/solar/mgii_composite_2.png
The only thing missing is a stratovolcano eruption in Indonesia.
https://magma.vsi.esdm.go.id/
Sorry.
https://www.iup.uni-bremen.de/gome/gomemgii.html
https://drive.google.com/file/d/1uBLq_FlpeaYvwf4eCcF6a2Hjgj0KqQBO/view
Looks quite OK.
J.-P. D.
Are they still compensating for urban warming by cooling the past?
Of course no!
To compensate for urban warming you have to warm the past, making the present less hot.
J.-P. D.
Polar vortex forecast for early February.
https://i.ibb.co/YRs5ZRt/gfs-z100-nh-f120.png
Are we talking T-Max or average temperature?
After a short [Ctrl-F] search on “average” and “max”, I find “The ISD temperature data are not max/min …” but no mention that T-Max was used, but several finds that indicate that average temperature was.
If you Google “Climate Change” and select [images] you get endless pictures of dry cracked river beds from heat waves and drought. The IPCC tells us that in the future the warming will be at night, in winter, in the higher latitudes, and there will be more precipitation.
Obsessing over average temperature, and it looks like that’s what’s going on here is another example of allowing the alarmists to control the language and agenda.
Keep in mind that wonderful quote from Dixie Lee Ray:
During a speech in Pasco, Washington, in 1991, she further denounced the growing number of scientists advancing theories of climate change by telling her audience to “beware of averages. The average person has one breast and one testicle.”
What is the problem with using averages? It actually reduces the uncertainty compared to using maxima and minima because you are drawing from more data.
https://en.wikipedia.org/wiki/Law_of_large_numbers
Hi Barry, If you are interested in the extremes, i.e., how hot it got, then maybe that’s what you should look at. Averages don’t tell you that. After all, the average of 49 and 51 is 50 and the average of 1 and 99 is also 50.
Chapter Ten Page 750 of the IPCC’s AR4 Report says:
Almost everywhere, daily minimum temperatures are projected to increase faster than daily maximum temperatures, leading to a decrease in diurnal temperature range.
Globally averaged mean water vapour, evaporation and precipitation are projected to increase.
Sounds like milder climate with more rain to me, but when you Google images for “Climate Change” you get landscapes ravaged by heat waves and drought.
Averages hide important details.
For the climate, a single global average temperature hides very important details.
The warming since the 1970s has not been even:
Lots of warming in the Arctic
Very little warming of Antarctica.
And warming in Antarctica has been in a pattern that could be caused by underseas volcanoes, but not caused by CO2.
More warming in the coldest six months of the year, than in the other six months.
More warming at night, than in the day
In summary, the actual warming since the 1970s has been good news, unless you consider warmer winter nights in Siberia and Alaska to be bad news.
All those details are hidden by a global average temperature.
A global average temperature is not very valuable for three other reasons:
(1) No one lives in a global average temperature — any problems people have from climate change will be from changes in their local climates, where they live,
(2) Estimates of a global average are rough before World War Ii, and worthless before 1900, when there were very few land weather stations outside of US, Europe and Australia, and there were very few ocean measurements in the Southern Hemisphere (not that sailors with buckets and thermometers in Northern Hemisphere sea lanes are even close to an accurate sea temperature measurement methodology), and
(3) No one knows what a “normal” global average temperature is, or if “normal” even makes sense, because our planet is not in thermodynamic equilibrium, so the climate is ALWAYS changing.
Rather than listening to climate alarmists claiming “pre-industrial” climate is ‘normal’, with almost no real time measurements to determine what the temperature actually was in 1750, why not make a judgement on the current climate?
The current climate is wonderful, and if it gets a degree C, warmer in 50 or 100 years, that would be even better.
Scaremongering with a single global average temperature, that not one person lives in, is not real science.
“(1) No one lives in a global average temperature any problems people have from climate change will be from changes in their local climates, where they live,”
But Richard, you have made it plain, that only YOUR personal temperature in your cold place matters. F**K the rest of the world.
Thus your claims GW is only a good thing should be seen for they are: self serving BS.
Nasty Nate, thanks for a brilliant, thoughtful reply.
I stated in my prior comment how the Arctic had warmed more than other areas since the 1970s.
It would be more accurate to say the northern half of the Northern Hemisphere has warmed the most, and their warming was mainly in the six coldest months of the year, and mainly at night.
The bottom line, that even a ten year old could understand (go find a ten year old to explain it to YOU) is that ACTUAL warming since the 1970s has been beneficial for many people, including people who live in Michigan.
If you don’t like Michigan as an example, for some reason, consider Canada — do you think most Canadians dislike being a little warmer now than in the 1970s?
The locations of our planet with the most warming, and the timing of that warming, has been beneficial since the 1970s.
And there is no logical reason to claim that continued warming MUST be 100% bad news.
That claim is for climate scaremongers, like you.
You should not ‘average’ intensive variables it is a nonsense.
Air Temperature depends on enthalpy (the specific heat) which varies considerably with humidity. To give an example: take a Louisiana Bayou misty after an afternoon shower air temp is 75F and 100% humidity the energy content of that air is TWICE that of a similar volume of air over an Arizona desert at 100F and close to 0% humidity. Air temperature is the wrong metric, although that is what everyone talks about. The metric that should be used is energy content in kilojoules per kilogram after all CO2 does not absorb and re-emit temperature it re-emits energy.
This would also make more sense than comparing Sea Surface Temperatures with 2 meter air temperatures as the water energy content is huge compared to the atmosphere – the top 6 meters or so of the oceans holding more heat than the entire atmosphere.
Considering that the politicians want to cripple entire economies based on the affected panicky reports from climate ‘scientists’ at least be clear on what is being measured to create that panic.
Steve Case
I formally understand your Tmax interest (though missing the complementary interest for Tmin).
But what I don’t understand is: what do you do with these isolated maxima and minima?
Don’t you always obtain the same info about how hot it is at given stations during July/August, and how cold it is there during January/February?
Is it not as important to obtain regional information about these Tmaxes and Tmins? That is the very beginning of averaging.
How else can I understand the amazing similarity between Germany, Belgium and France during the extreme winter in February 1956? Or during the heat wave in Spain, France and Italy during summer 2003?
*
Moreover, when e.g. John Christy wants to show lawmakers how CONUS behaves wrt extreme temperatures over 125 years, he necessarily has to average numerous local maxima/minima per measurements per year, here the maxima:
https://drive.google.com/file/d/1qno66UybjEWAPKBJiQxxaIXaOu-MO3Xz/view
(snapshot out of a document which disappeared in between).
*
And now suppose somebody says: “Well your CONUS is nice! And how does the Globe behave?”
Here it is, please look at the difference between yellow and red bars:
https://drive.google.com/file/d/1qe7HVPQHnniK1F6CMUh5zoO6fL-314WE/view
The yellow bars you obtain when you average all station data into years; the red bars you obtain when you firstly average the station data into grid cells encompassing them, and then into years.
The difference is due to the fact that in the yellow case, among about 1750 stations worldwide, over 1400 US stations compete with the pitiful rest; in the red case, 170 grid cells in the US compete with 170 outside (fair enough; there should better be 2500, in fact).
*
This eternal discussion between looking at individual values / behaviors on the one hand, and average values on the other hand, reignites again and again when it comes to e.g. sea levels.
Why keep referring to individual gauges when there are over 1500 of them, some with extremely different trends? This is like hiding a forest behind its trees.
How – other than by means of average values – should one calculate that the worldwide sea level change at the Gauges from 1993 to today is almost identical to that determined by satellite measurements?
J.-P. D.
Bindidon says:
January 31, 2021 at 7:52 AM
Steve Case
I formally understand your Tmax interest (though missing the complementary interest for Tmin)….
Good science should look at the Max Mode Median Mean and Min. But our wonderful mainstream media as I illustrated with Google showing heat wave and drought ravaged landscapes on an [image] search of “Climate Change” is only interested in the Max.
Here’s a quote from my file:
“It doesn’t matter what is true, it only matters what people believe is true.” -Paul Watson, Co-Founder of Greenpeace
I stopped typing there and read what Richard Greene said above at 8:48 AM If you didn’t read that maybe you should and Barry should too. I know I can’t improve on it.
I read it. If you are interested in the kinds of questions that looking at sub-hemispheric or local scales can give you answers for, then go ahead. No problem.
There are questions that can be answered by looking at global-scale stuff, and when we talk about ‘global warming’, averages can be quite useful.
Not to mention – Richard is also relying on averages when he discusses warming and cooling in the Arctic and Antarctica.
barry says at 4:53 & 6:09 AM
“…when we talk about ‘global warming’, averages can be quite useful.
…Richard is also relying on averages when he discusses warming and cooling in the Arctic and Antarctica.”
I said good science should look at every thing, no stone unturned, to include Max Mean Mode Median Min and the various trends. And it should follow that the media should put their science speak into plain language that ordinary people like me can understand. But the media doesn’t. I like quotes:
“In China the State controls the media
In America the media controls the State”
Jack Posobiec (Who ever he is)
Our politicians are seeing the same bullshit images of heat wave and drought stricken landscapes that you and I see if we depend on Google and the nightly news.
I have to dig to find the truth. That’s why I put up that link to:
Chapter Ten Page 750 of the IPCC’s AR4 Report says:
Almost everywhere, daily minimum temperatures are projected to increase faster than daily maximum temperatures, leading to a decrease in diurnal temperature range.
Globally averaged mean water vapour, evaporation and precipitation are projected to increase.
It would follow that storms would be less severe with a milder climate. You and the media choose to ignore that part of what the IPCC says and you are happy point out that averages are useful. Yes they are but Dixie Lee Ray pointed out they can be misleading. She didn’t and I didn’t say to never use them.
So, is that passage from the IPCC above a ringing endorsement for the media to promote nothing but images of oppressive heat and drought?
An average for a nation, or for a specific region, such as the Arctic or Antarctica, is a lot different than a single average temperature for the entire planet’s surface.
People live on 29% of the planet’s surface (land), so don’t care much about the temperature of the other 71% (oceans),
The timing of the warming matters too.
Warmer winter nights in Siberia, which has happened over the past 45 years, is a lot different than imagining warmer summer days in a city the equator.
A single global average hides a lot, but that’s all we hear, because the truth is in the details:
The most warming has been in colder areas of the planet, except Antarctica, mainly during the colder months of the year, and mainly at night.
“I said good science should look at every thing, no stone unturned, to include Max Mean Mode Median Min and the various trends.”
Do you realize that you follow this remark with a quote from the IPCC demonstrating “good science” according to your metric there?
“Almost everywhere, daily minimum temperatures are projected to increase faster than daily maximum temperatures, leading to a decrease in diurnal temperature range.”
I’ve said the same thing to you several times and cited the IPCC forecasts that some places will get wetter and some drier, while on average the atmosphere will become more humid.
Why is it so difficult to understand that this is not a contradiction?
barry says:
February 2, 2021 at 8:15 PM
Why is it so difficult to understand that this is not a contradiction?
The contradiction is the media. Did you Google “Climate Change” and select [images]? Did you see all the depictions of sun baked drought ravaged landscapes? If all you ever did was listen to the nightly news and read National Geographic, you would never know we are seeing a decrease in diurnal temperature range. Or in words that most people would understand, the weather is becoming more mild.
In my neck of the woods, Wisconsin has nice pages for several cities with monthly temperature records, Min and Max, back to the 19th century, and none of the Monthly Min and Max temperature records have been in the current century. Here’s Milwaukee
After a very short search I find the following for Sydney last year:
Nights warmer than average
Night-time minimum temperatures were above average in 2020 at most Greater Sydney locations, while daytime maximum temperatures were near average in the west and generally above average near the coast.
Milwaukee and Sydney aren’t the world, but I’m pretty sure what I’m hearing from the so-called mainstream media is mostly bullshit about nearly everything.
“If you don’t read the newspaper, you’re uninformed.
If you read the newspaper, you’re misinformed.” Mark Twain
If the data had been split in half then there would be a correlation of 1.0 for a regression line going through the two averages. This doesn’t mean that it is a “good” model!!! Using averages of groups for a regression is not a good idea.
This is an important issue. There are several pieces of evidence that the homogenization procedures did not eliminate UHI and other non-climatic biases from the land temperature data.
In my latest publication, I propose a methodology to detect where the bias could be still present and how to evaluate it at least on the global scale:
Scafetta, N. Detection of non‐climatic biases in land surface temperature records by comparing climatic data and their model simulations. Clim Dyn (2021).
https://doi.org/10.1007/s00382-021-05626-x
The paper contains world maps and the USA appear to be particularly affected.
That was a great read. Thanks for posting.
What would the results look like with Had.C.R.U.Tv5? v4 is a partial sphere estimate and is widely regarded as having a cool bias because of it. v5 switched to a full sphere estimate and so shows a slightly higher warming trend.
Can you reconcile the differences between figure 14 comparison of CMIP5 vs observation with Dr. Hausfather’s depiction CMIP5 vs observation here https://tinyurl.com/y35gbkkp?
Thank you for this excellent paper. I found it very interesting. I agree that this UHI effect is very important. The analysis of the reduction of the diurnal temperature range (DTR) Tmax – Tmin in the land temperature record versus the climate models very useful. You estimate that 25 to 45% of the land warming from 1950 to 2010 is due to the UHIE and other biases. The McKitrick and Michaels 2007 paper estimates that about 50% of the warming from 1980 to 2012 is due to UHIE. Your DTR analysis suggest that significant UHI effect started after 1965 (Fig. 3c). The tree-ring reconstruction (Fig 12)shows a UHIE divergence starting after 1970.
You calculate the UHIE is 0.36°C/0.97°C = 37% over land from 1950 to 2010 (using the midpoints of your ranges). But if the UHIE started only at 1970 rather than 1950, how does that change the UHIE fraction of land warming?
On a global scale, it appears that the warming shown by the UAH MSU v6.0 low troposphere global temperature record since 1980 may be the most accurate.
See my figure 14.
See also this comment from Andy May:
https://wattsupwiththat.com/2021/01/22/a-new-look-at-the-urban-heat-island-effect/
UAH temp trend for the US is 0.17 C/decade.
https://tinyurl.com/y62sq3xo
…since December 1978 to present.
“How in the world can the warming result from NOAA be reconciled with the (possible zero warming) results in Fig. 2?”
You need clarity about what yu are actually correcting for. UHI is not a measurement error; the thermometers reported correctly. It is a (small) sampling bias. The locations really did warm, but they are not representative of the country as a whole. Urban areas were over sampled.
Roy has a dubious model for the component of the whole country temperature that is due to population, and he wants to remove it. That is, he doesn’t want to more correctly measure the warming that happened. He wants to take out a component of warming that happened because he says it is due to population increase and so shouldn’t count. He wants to adjust back to the warming that would have happened in an unpopulated US.
I think his model for that is spurious. But the point here is that he is adjusting to solve an attribution problem, not a measurement problem.
I’m adding UHI to my list of potential errors in the surface global average temperature statistic:
My ever growing list of potential errors in the surface global average temperature statistic:
— Very far from global coverage before 1900
— Insufficient global coverage before WWII
— Excessive infilling (guessing by government bureaucrats) of missing data before WWII, and still true today
— Excessive, repeated “adjustments” made years, and sometimes decades, after the measurements
— Too many weather stations located in or near cities, which only cover 1% to 2% of the planet these days
— Inaccurate bucket and thermometer ocean measurements in the old days
— Too few ocean measurements in the Southern Hemisphere before WWII
— Too many ocean measurements in common shipping channels
— No comparison of all the different ocean measurement methodologies, used in the same place, at the same time, to determine how the changing methodologies affected the numbers over a century
— Economic growth in the vicinity of weather stations is likely to cause warming unrelated to CO2 — Urban Heat Island “adjustments” are ridiculously tiny, or not used at all
— Changing equipment in land weather stations, from mercury thermometers in large boxes, then smaller boxes, then automated equipment
— Changing locations of land weather stations, such as from weather station located within cities, to airports in the suburbs
— Government bureaucrats compiling global average temperature statistics whose job security increases if the illusion of a climate crisis is kept alive
— Claimed global average temperature margins of error of about +/- 0.1 degree C., not justified by the measurement equipment used, and all the missing data being “infilled”, which is a guess that can never be verified
— Smarmy climate alarmists who back up their cars to land weather stations located near the pavement, and aim their hot exhaust fumes at the thermometer for one hour each day (I made that one up for a laugh, but it could be true).
Most important:
Ignoring the good news from actual global warming for the past 300 years, and then claiming that continued warming must be very bad news.
Can you post a link to a dataset publishing a global mean surface temperature which you feel best addresses your concerns?
You are here.
UAH has the potential for accuracy because the measurements are in the troposphere, where the greenhouse effect occurs, and the troposphere is an environment without economic growth and land use changes.
And that means estimates of the global average temperature before 1979 are rough, and probably nearly worthless before World War II, because of too few measurements in the Southern Hemisphere, especially the oceans.
Sea level rise, as measured by tide gauges with long term records, suggest the global warming that started 20,000 years ago is still in progress. And that is good news. Because the only other trend is global cooling. For those of us living in Michigan: We love warming, except for a few ski bums.
USA48 trend is +0.17C/decade.
bdgwx
It’s a pity that the satellite-born remote 60 GHz O2 sensing has just passed 40 years.
Otherwise we would see much better how valuable are claims like
“… estimates of the global average temperature before 1979 are rough, and probably nearly worthless before World War II”.
Let us for example look at a comparison of GHCN daily worldwide with UAH6.0 LT Globe land, starting in 1930 to keep UAH’s 40 years visible:
https://drive.google.com/file/d/1tKMoslhP_gBUlN9yO8lp-00TFDP7dYTD/view
and also look at a comparison of HadSST3 SH with UAH6.0 LT SH oceans:
https://drive.google.com/file/d/1S-Mtwc9nVczp8CuE-uMA2pYa_b4UzrEY/view
{ Don’t wonder about the graph showing centered 2 year running means instead of the monthly data: as soon as you move from the Equator to the south Pole, standard deviations increase by X, be it at surface or in the LT. }
*
When I see these two graphs, I have difficulties to believe that the claim above was emitted by a person who ever processed or compared temperature data by his own.
There is more politics than science in such comments.
J.-P. D.
If you’re alarmed about suggestions to correct the surface temperatures, you’ll be terrified to learn the AGW nonsense is anti-science.
AGW is supported by some science.
Plus a lot of assumptions.
The amount of AGW is unknown
Not likely for AGW to have no effect on temperature.
Not likely for AGW to have 100% control of the temperature.
It’s CAGW that is anti-science.
After over 300 years of mild, intermittent global warming, it is ridiculous, and ant-science, to claim continued warming will be a crisis. Or even a problem.
RG, I keep asking for the AGW believers to provide proof that adding more CO2 to the atmosphere will cause an increase in surface temperature. So far, they haven’t been able to do so.
Their few faint attempts were to link to papers that started off with the assumption that CO2 was a “forcing”. There was no physics to support their beliefs, just assumptions.
As you know, beliefs and assumptions ain’t science.
Nick,
The other problem I see is with figure 2A and 2B. The values from A are grouped into 4 categories with a regression applied to the mean of each category. The problem is that in reality those 4 dots you see in B aren’t dots at all, but vertical lines representing the probability distribution that the constituent samples fall along. In other words, those dots really should be visually represented with box and whiskers or similar technique. The R^2 reported in B of 0.9249 is grossly overestimated. In reality the trend line drawn in A and B has so much uncertainty that they aren’t statistically significant. The end result is that the correlation between UHI and population density is so uncertain in this analysis that it is inconclusive.
Nick, I’m glad to see you still at it here. Hope u have been well but I can’t let you get away with: “He [Dr. Roy] wants to take out a component of warming that happened because he says it is due to population increase and so shouldn’t count.”
I hope you are not saying that local warming of the thermometers should count as AGW. I once had Anders (Mr Physics) make this claim to me. I pointed out that half of the non-climate effects are caused by warming that occured due to ground changes within 100 yards of the detector. The other half were changes within a few miles, development and agriculture.
First, if this warming is not due to GHG then even a 20 trillion-dollar policy reducing GHG will not reduce this type of warming.
Second, non-climate effects, land use and land cover (LULC), like GHG mainly increase Tavg by raising Tmin, thereby making winter nights less harsh. It’s UHI that kills people from heat stroke. See Kim (2002)
Third, the sole danger of global warming is sea level rise. Accurate SST measurement is the key and land measurements are only a useful proxy for AGW because the lack of heat content drag as compared to ocean. But we need clean non-biased data. Thank Dr. Roy for pointing out that the climate establishment has been cheating.
nick…”He wants to take out a component of warming that happened because he says it is due to population increase and so shouldn’t count. He wants to adjust back to the warming that would have happened in an unpopulated US”.
No…Roy is simply asking how much of the temperature rise measured by surface thermometers is due to artificial heating in urbanized areas. The claim by climate alarmists is that the warming is caused by a trace gas in the atmosphere.
If you want to see real data shystering, look at NOAA and their fudging. In 2013, the IPCC announced that the previous 15 years had shown insignificant warming. NOAA data showed the same until NOAA went back and fudged the SST to show a warming trend. Why would anyone do that?
They have gone back to the 1930s and fudged the warmer temperatures so the anthropogenic warming trend would look better.
NOAA, NASA GISS, and Had-crut are climate alarmists and cheaters. Climate modelers are psychotics.
The NOAA data then showed a slight warming. The adjusted NOAA data showed a bit more warming for the same period.
Had.CRU data showed 0.05 C/decade in 2013 for the period, and it shows the same now.
The IPCC also said that short-term trends such as the one you are referring to do not necessarily reflect the underlying trend.
You know, the bit in the same parasgraph you usually cite that you refuse to acknowledge whenever it is brought to your attention, Gordon.
Major problem.
If alarmists claim that the global temperature is increasing (for whatever reason) by, say, 0.15 C per decade, then that is 1.5 C per century, 15 C per millennium, and 15,000 C per million years.
Somewhat ridiculous, as the Sun cannot possibly heat anything to hotter than itself – around 5,800 K.
Given that this nonsense is based on some mythical energy imbalance, why would the temperature not keep rising at the current rate? Do alarmists really believe their nonsense, or are they just pretending to be stupid?
Maybe Fourier was right – that the Earth gives back to the terrestrial spaces all the heat it receives from the sun, and adds a part of what is peculiar to itself.
Flynn
” Do alarmists really believe their nonsense, or are they just pretending to be stupid? ”
This is what a person writing such redundant trash first of all should ask her/himself.
*
Oh, by the way: You are brazen enough to ask ‘Who is Flynn’ ?
Really, seriously?
Well, Flynn alias Swenson: what about collecting all comments written by ‘Swenson’ and all those written by ‘Flynn’ (until end of 2018 or so) and letting a clever software extract what the two comment streams have in common?
Have some fun, Swynn (or are you Flenson today? Apos if so)
J.-P. D.
Binny,
Who is Flynn?
Are you really stupid enough to believe a trend will go on forever?
No, you couldnt be that stupid, could you?
So tell me, if CO2 levels keep increasing, when will the temperature stop increasing?
Will the Antarctic ice-cap melt? Will Siberia and Canada become the food bowls of the world?
You really have no clue, have you?
Leave your fantasy. Start thinking. Learn some physics, and you wont look quite as delusional.
binny…”Oh, by the way: You are brazen enough to ask Who is Flynn ?”
Typical reply by Binny. If he is not appealing to authority he is ad homming and/or insulting.
How about the time you got in a snit and told everyone you were leaving only to start posting with a female nym? Talk about brazen. You later explained the female nym as your girlfriend. You never explained why your girlfriend had never posted till you quit the blog and why her posts sounded exactly like yours.
Robertson the cheating SOB
YOU, Robertson, speak here about “ad homming and/or insulting” ???
You seem to forget that you are here the person insulting not only the most commenters on this blog, but also a renowned person like Andrew Motte, who translated Newton’s work from Latin into English, whereas you were not even able to correctly read Sir Isaac’s Latin prose, and hence insulted Motte with
“In other words, Motte was a cheating SOB”.
I won’t forget that. Shame on you, Robertson!
J.-P. D.
“Are you really stupid enough to believe a trend will go on forever?”
Aside from you, who has suggested that the temperature trend will go on forever?
Nobody. It’s all your own smoke and mirrors, no one else.
We live in a time of increasingly gullible people. Conspiracies flourish – the greatest being climate change/emergency.
denh
What you forget to write (or intentionally omit, who knows) is that those discrediting all the people who think climate is changing in fact are exactly as gullible, with the other sign in front of the level, however.
I don’t know if climate is changing, let alone would I know or think or gullibly believe that CO2 is the cause of that.
And… what now concerns ‘Conspiracies’… Oh Noes. We were recently experiencing some of an incredibly higher magnitude, see the dumb Q-Anon pack.
J.-P. D.
Binny,
I will help you out.
Climate is the average of weather, which is never static.
Climate therefore always changes.
You dont need to thank me – my pleasure.
How could I ever omit to thank a poor ankle biter?
J.-P. D.
You are so dumb you repost other peoples lines directed at you right on this board thinking how clever you are
To be named ‘dumb’ by a genius like you: that sounds like a compliment!
Thanks / Merci / Danke.
J.-P. D.
Binny,
Why do you boast about how stupid you are?
Are all alarmists as silly as you?
As a layman regularly inspecting temperature time series, I express a clear doubt about this UHI stuff allegedly being responsible for exaggerated temperature trends in the CONUS area, or anywhere else.
*
Firstly, it makes in my opinion few sense to talk here about absolute temperatures, when we often enough see that different contexts with sometimes highly different absolute temperatures suddenly look quite similar when viewed as departures from the local means of a common reference period.
A typical example is a comparison of two GHCN stations in AK (Anchorage International Airport, USW00026451; Kenai ENE CRN, in the ‘pampa’, USW00026563), distant by about 50 km, with absolute temperatures differing by up to 4 C, but whose departures (aka anomalies) look like this:
https://drive.google.com/file/d/1OhCuDiAFUT80Ws4S8XopciaWQTp4rorn/view
*
Next, I recall having compared 71 USHCN stations noted by volunteers at Watts’ surfacestations.org as ‘UHI-poor, well sited’ stations, with over 8000 CONUS stations out of the GHCN daily data set:
https://drive.google.com/file/d/1tbreucKhA5wCgFtPcgKIWGuCiwHe4zCC/view
The first thing a layman asks for is:
If UHI is the problem, how can a couple of so differently located stations in Alaska
– the one at an international airport, highly UHI-suspected
– the other nearby, but in the middle of nowhere
show so similar when compared over the same period, even if very short?
And how can
– 71 carefully selected USHCN stations show over 120 years a higher trend than about 8000 stations collected without caring about their location?
*
Currently I’m collecting and comparing data from
– 3 station subsets in GHCN V3 (all CONUS stations; all stations marked as RURAL with lowest nightlight A; all stations marked as SUBURBAN or URBAN, with nightlight B or C);
– NOAA for CONUS, out of Climate at a Glance (CaaG);
and
– UAH6.0 LT for “USA48” – aka CONUS.
What I see until now, out of a very first pass in this comparison, is that while the complete subset of V3 stations is quite near to the subset of rural stations (having the least average trend of all), NOAA’s CaaG data is much too similar to the subset of urban stations, which shows the highest average trend.
A first look at anomalies wrt the mean of 1981-2010 out of GHCN V3, NOAA and UAH48:
https://drive.google.com/file/d/1ChYZ8-Ffk5t_F9hmMw-rC24RztMcizsp/view
It is easy to see that NOAA’s evaluation, based on their Pairwise Homogenization Algorithm, shows with 0.27 C / decade for 1979-2019, a much higher trend than GHCN V3 (0.20) and UAH48 (0.17).
La suite au prochain numéro.
J.-P. D.
binny…”A typical example is a comparison of two GHCN stations in AK (Anchorage International Airport…”
Is that one of the 6000 reporting stations slashed by NOAA circa 2015 till they had less than 1500 covering the surface? They justified that with some sort of pseudoscience but the end result was NOAa filling in the stations they slashed with averages homogenized in a climate model from stations up to 1200 kilometres away.
All you had to do was click on the graph linked below the comment to see it has data up to 2020.
But then you wouldn’t have had the opportunity to spout your favourite talking point, which is itself complete bullshit.
Robertson
” Is that one of the 6000 reporting stations slashed by NOAA circa 2015 till they had less than 1500 covering the surface? ”
Again and again and again your stupid lie.
You are such a brazen liar, Robertson.
But all your lies can’t change the fact that GHCN daily has over 40,000 stations worldwide, and GHCN V4 over 25,000 of them.
You can repeat your lies as long as you want, Robertson.
The stations I was writing about are very well alive, I use their data – what YOU never would be able to do, you pseudo-engineer!
J.-P. D.
Binny,
When will the trend stop, do you think?
Or will the temperature rise by 27000 C in the next million years? Maybe a little less, possibly?
This business of believing you can predict the future by extrapolating the past is just delusional thinking.
Economists, financial experts and the US military do it all the time. With limited success, it seems. Might as well use an astrologer, or examine the entrails of a chicken.
Flynn
I have an urgent question, and I am sure you know the answer and will be willing to help me a bit.
” If I put CO2 between the Sun and a thermometer, will the thermometer get hotter? ”
All the time I ask everywhere, and no one is able or willing to asnwer!
I am on the verge of absolute despair!
Thanks in advance for your help, I’d be so grateful.
J.-P. D.
Binny,
Not only do you have a delusional fixation with someone called Flynn, you avoid discussing your fixation with trends, and assuming they continue for ever.
I point out the consequences of this stupidity. Dont blame me for not thinking about the logical outcome of your fantasy.
As to your claim you ask everywhere, all the time – obviously you are either a lying alarmist, suffering from OCD, or exceptionally dim.
Cant you think for yourself? Read the publications of Professor Tyndall. If you cannot understand the results of his observations and experiments, just admit your inability to comprehend.
I will help, if you are willing to accept that my knowledge is obviously superior to yours.
Flynn
After ‘gotcha’, ‘CO2 between Sun and thermometers’, now ‘Read the publications of Professor Tyndall‘.
Flynn, Sie sind definitiv entlarvt. Geben Sie auf!
J.-P. D.
Binny,
If you ask for help, but then refuse it, you are obviously just trying to waste the time of those like myself who are willing to assist you to accept reality.
You can lead a Binny to knowledge, but he still remains a Binny.
A female donkey is a Jenny. Maybe the male donkey is called a Binny by some?
It would make sense.
Apart from the dodgy significance, the whole exercise is physically dubious.
Think about it – Roy is associating population density with a supposed UHI temperature TREND. Based on this model, if you take a town whose population is constant over time, the model predicts it will warm due to UHI! I.e. take some small town with a population today the same size as 100 years ago and is expecting no change 100 years into the future. The model says it experiences warming due to UHI when obviously nothing much changes over time!
Or, take a town with a large population 100 years ago which experiences a decrease in population. The model says it will continue warming due to UHI when we would expect the a reduction in urbanisation to cause cooling!
Obviously, any serious model would look at associating temperature TRENDS with population TRENDS – not raw population numbers.
Similarly if a city experienced suburban sprawl and the official site moved from the city center to the suburbs, which was not uncommon in the US, then there would likely be a declining UHI effect yet this model predicts an increase in the UHI effect. Nevermind that this model is not statistically significant anyway.
When a station is moved an adjustment is made to level the baseline. However, moving the site to the outskirt of town development, as is often done, say the water treatment plant or airport, just allows the trend to refresh from the start. And as we see on the graph the small changes in the development of rural areas have a lot of effect.
The reason land station data is not adjusted for UHI goes back to a href=”https://journals.ametsoc.org/view/journals/clim/16/18/1520-0442_2003_016_2941_aouvri_2.0.co_2.xml”>Peterson (2003) who claimed there is no difference found between rural and urban stations after standard adjustments for elevation. His reasoning was that most non-climate effects were occurring at the site of the detector or immediate vicinity rather than the meso-scale UHI. Peterson pointed out that urban stations were likely to be placed in a park, which had more effect than the city itself.
The perplexing thing is that Karl (1988) showed that US stations up to 1984 showed detectible UHI directly proportional to population, with effects even in towns of 10K.
These contradictions admitted and mused by <a href="http://rankexploits.com/musings/2016/richardlh-is-now-subject-to-willardian-moderation/#comment-142688"Steven Mosher in 2016
The argument that Angech and I [Ron] am hearing is: UHI is a dangerous influence that must be mitigated and adapted to but on the other hand it does not affect the urban temperature record to any statistical significance.
yes that is the mystery as Peterson termed it.
go ahead and read back to everything I [Steven] wrote about Peterson.
We all acknowledge that UHI is real. Some argue it is potentially dangerous. To make that case they do tend to focus on worst case UHI.
Since we see UHI in individual records it seems OBVIOUS that the global record should show some sign of it.. after all there are plenty of urban sites in the total average.
But when we use the same method , that found the signal in individual cases, and apply it to global data, the signal
gets attenuated to the vanishing point.
I did a little digging and think I solved the “Peterson mystery.”
Steven McIntyre did a post in 2007 here. that shows Peterson chose very questionable urban stations and also just compared them for three individual years, not their trends.
When Steve Mc plotted the trends for the stations he found a 0.7 C per 100 years difference between rural and Peterson’s urban. When Steve used urban stations that had a sports team the difference was 2C per 100 years, agreeing closely with Karl (1988).
The trick is that Peterson may have been correct that Urban station siting had been fixed and that micro effects afflicted Rural likely as much or more than urban sites in 1999. BUT this did not erase the huge signal sitting in the climate station’s records.
Therefore for the IPCC to use Peterson (2003) as a justification for not addressing UHI is unscientific at the least and disingenuous more likely. BTW, Steven Mosher was one of the commenters in McIntyre’s 2007 post. He knew the answer to the “mystery” all along. Or perhaps he just forgot the answer when he joined the paid climate team at Berkeley Earth. Who knows.
Did the IPCC “use Peterson (2003) as a justification for not addressing UHI”?
I smell BS.
https://archive.ipcc.ch/publications_and_data/ar4/wg1/en/ch3s3-2-2-2.html
But it was alreasy obvious from the charged language.
“BTW, Steven Mosher was one of the commenters in McIntyre’s 2007 post. He knew the answer to the “mystery” all along. Or perhaps he just forgot the answer when he joined the paid climate team at Berkeley Earth. Who knows.”
You should write some more gripping fiction.
Barry, I don’t understand your point. The link to AR4 that you provided confirmed my point that Peterson (2003) was used to dismiss concern about non-climate effects on the land record. I like how they used a chart from “adapted from Peterson and Owen (2005)” to make it appear that Peterson (2003) was addressing trends.
UHI is intentionally built into the land record by “correcting” the location of the urban stations but not their historical contribution to the all important trend. Berkeley Earth locks in the spurious UHI influence by simply starting any moved station as a new station, where USHCN splices the old station to the new with an adjustment to restart a new spurious trend of bias as that station is encroached on by metro-growth.
I love this part of your link:
“McKitrick and Michaels (2004) and De Laat and Maurellis (2006) attempted [emphasis added] to demonstrate that geographical patterns of warming trends over land are strongly correlated with geographical patterns of industrial and socioeconomic development, implying that urbanisation and related land surface changes have caused much of the observed warming.
Regarding Mosher, I don’t know what you mean by fiction. I supplied you the links so you can read his assertions for yourself. In 2007 he witnessed McIntyre shred Peterson and in 2016 to me he says that Peterson is God and it’s one of the great mysteries as to why UHI is a global health crisis and at the same time non-existent when it comes to station sensors.
The BS is that IPCC didn’t address UHI (I linked a section on it), and that they relied solely on a single study (they cite 10 studies on the topic in just that section).
The implication that Mosher has lied about the issue because he was paid to work on a study is slimy.
Mosher and the team of ‘skeptics’ who created the BEST temperature record from raw data have been derided by fake skeptics ever since the results came out. I remember the train of events very well, From Watts declaring he would accept the results no matter what, to Curry rescinding her approval.
They are not the only skeptics to have created a global temperature record from raw data…
https://tinyurl.com/y342r8ss
but they are among a select few who actually did the work required to give them some authority on the topic.
Nasturally, because Mosher gives no comfort to the lazy rats who nibble at what they believe are coffin-sealing flaws in climate science, he is somewhat misliked by that community.
Ron,
I’m totally with you regarding the station move just changing the baseline and its a one-time deal.
What I’m thinking about is what this effect has when applied to many station in aggregate over a period of time. It’s kind of similar to the time-of-observation problem where sites slow moved from PM to AM over many decades. It didn’t all happen at once.
BEST deal with discontinuities like that by separating the data, as if it is two stations.
“Rather than “homogenize” the raw data, an automated procedure identifies discontinuities in the data; the data is then broken into two parts at those times, and the parts treated as separate records.”
https://static.berkeleyearth.org/pdf/methods-paper.pdf
The paper is worth a read, as they attempted to create a global temperature product that paid heed to ‘skeptics’ criticism of the older temp records, including dealing with UHI.
Barry, Thank you for all your efforts on behalf of the planet. I know your are sincere about your thoughts. I hope you can assume the same about me. I actually love that Steve Mosher was kind enough to engage me, a newcomer to the climate blogs. Steve answered a lot of my questions and other’s, but it was always clear that he could not be completely candid. Some attacked him. I tried always to be friendly. I found we both like Cat Stevens. He seemed to be teasing me and others with the secrets he knew but could not blurt out, certainly not to newbies. He did feel if one did the research they deserved a some answer about conflicts. How could UHI be a major urban problem causing deaths from heat, (though its most powerful effect is during winter nights), yet not affect thermometers, according to IPCC?
Steve gave me the big clue. He directed me to study Peterson. I did read the papers but lacked the expertise to crack its shell game. I neglected to check the Climateaudit.org archive until I just thought of it yesterday. I don’t know if Steve wanted me to find the truth in some way but he clearly is not as religious about “the mission” as you are. He sees himself as a professional.
I know how Best does their work thanks to Steve patiently explaining it over months of time on Lucia’s. Also, of course, I never meant to imply that the IPCC were unaware of UHI or would dare to ignore the topic. My aim is to get at the truth wherever it leads. I foolishly believe that is what will really saves the planet.
Thank you for your friendly, candid remarks, Ron.
I wonder what “mission” you think I am on? If it is “saving the planet,” you are mistaken.
I can’t remember when I first came across Mosh online, but it was probably in 2007 when he was at climateaudit with JohnV, Anthony Watts and others taking on the US temp record, using the station list grown by surfacestations.org (Anthony Watts’ ‘best’ sited stations in the US) to compare against the official record. It was a great read, because it wasn’t about politics, it wasn’t about personalities, it wasn’t about sides, it was just a forensic analysis that took its time and was very particular to get at the truth. I often described it back then as one of the best of the skeptical efforts to address climate science. I imagine that this was some of his earliest interest in long-term temperature records that resulted in the creation of a competing global temperature record, though he may have been at it for longer for all I know.
The three threads are still online and worth the read if you want to get an idea on how Mosh started approaching and learing about temp records.
https://climateaudit.org/2007/09/15/a-second-look-at-ushcn-classification/
https://climateaudit.org/2007/09/30/a-second-look-at-ushcn-classification-2/
https://climateaudit.org/2007/10/14/ushcn-3/
I’ve followed some the the conversations at Curry’s, and seen what Steve says to newbies and oldbies. I don’t think he’s hiding anything. It looks to me like someone who has done the work, now understands what it takes to do it, and is sick of the lazy, ignorant criticism that he has repeatedly tried to correct, and seems to be at annoyed at having to repeat himself.
He was just as harsh to ‘mainstreamers’ who offered fluff and/or nonsense. But he was always honestly trying to get to the truth, in my estimation.
To clarify – it is in the comments section of those threads that the methods to derive a better temperature record are discussed and implemented – some 1000 comments, an ongoing conversation. I’m confident you would find the germ for a number of ideas utilised by BEST.
The work of the other effort I mentioned, culminating in:
https://noconsensus.wordpress.com/2010/03/24/thermal-hammer/
also informed Mosh. He was talking with Jeff Condon and Roman M while they were putting together their own temperature record from raw data.
You might find the lead-up posts from The Air Vent on constructing a global temperature record, quite interesting, if you haven’t checked them out before – and you can find them. I clicked back through posts until I found previous ones when I read back on it.
Barry, thanks for the links. I did browse back on Climateaudit years ago and saw Roman M and Jeff Condon working out the statistical questions on the BE setup. I also went further back an saw how Judith Curry first appear at CA, defending her paper in McIntyre’s cross hairs. That got her exposed to the skeptics, like Roger Pielke Jr., who got her out of the echo chamber. When asked in 2015 why she left camp she said the short answer was Climategate. I think Mann and the hockey team truly gave her the Willies. Seeing the candid emails made her throw up a little in her mouth.
This was about the same time that Richard Muller stepped out of consensus for a second, criticized Mann and thanked McIntyre for his work. I know vaguely that Watts and Mosher and Muller (and Koch?) got together to make an independent look handling the weather station data in a more trusted manner, BE. At this point Steve Mosher was still a skeptic but something happened. I believe if was Menne who came in with the kriging method that Roman M and Jeff worked, except Menne was an approved climate scientist, a professional on payroll, a career guy. Menne I think is the one who convinced Mosher that UHI was a unicorn. Or, at least Menne made it disappear and Mosher could not figure out which shell it was under.
Mosher 2016: “Lets suppose you though so. You take all the stations
and divide them into two piles. One rural the other urban.
If you think urban rural should be different, what do you expect?
You expect to find a difference.
You do that. You find no difference. Your hypothesis is busted
Call Feynman. he says,, ditch your theory.
Not so fast.. maybe the rural are not really rural. so you try another definition of rural. That fails. you try another. that fails. another.. that fails. Now you start to cast around for all sorts of reasons why you didn’t get the result you expected.
mr Feynman and mr popper tap their foot. Bonferroni smirks.”
Mosher was broken down by Gavin and Rhode and Menne and many other very credentialed people. And he got hired. He joined the cause. And a very nice group of people, including Zeke. Watts was forgotten and I’m sure very hurt. I don’t know what part Curry played.
Mosher was still very interested in UHI in 2016 and actively reading Oke and very interested in Watt’s pristine stations, which is odd if he truly convinced 100% that it was insignificant.
Interesting that Mosher and Curry switched sides at almost the same exact time, both being heavily affected by Climategate. Here is a copy of the BE paper you linked to but with Mosher’s name added at the end now.
https://static.berkeleyearth.org/papers/Methods-GIGS-1-103.pdf
If the land area of the earth is about 200,000,000 sq. mi, and there are 22,000 weather stations, that would be about 9,000 sq. mi per weather station. That is about the size of Vermont. How can one weather station accurately represent that entire area?
4 weather stations 1000 miles apart from each other making up 4 corners of a square amount to a surface area of 1 million sq miles.
So if you have 9000 sq miles, the distance between each of your 4 weather stations is 95 miles.
Also, numerous pairs of stations at various distances apart are checked to see how well they correlate. Generally they stay well corrleated up to 620 miles apart.
For the US, there is no issue with coverage.
For the Earth, you’ve given the entire surface area, not just land. Land-only surface area is 57,500,055 sq miles.
So, to redo your calculation, 22 000 weather stations over 57.5 million sq miles area is 2614 sq miles per station.
Which is a (average) distance of 51 miles between each weather station.
I’m not sure where you get the 22,000 weather station count, though.
barry
” I’m not sure where you get the 22,000 weather station count, though. ”
On mid October 2020, the downlaod of GNCN daily gave 40364 stations busy with temperature measurement (115084 in the total).
But many of these stations can’t be used due to (1) too short a lifetime (less than 30 years), or (2) to discontinuity in life, or (3) to spurious trends.
If I exclude these stations, I get … 19304 left over.
J.-P. D.
Gregory J.
I understand your point.
But… please look at the following two examples.
1. CONUS temperature series out of 71 USHCN stations vs. over 8000 of them
https://drive.google.com/file/d/1tbreucKhA5wCgFtPcgKIWGuCiwHe4zCC/view
Can you see how good the data of these few stations fit to the whole data?
2. UAH6.0 lower troposphere with a minimum of grid cells
The UAH time series consists of monthly grids of 144 x 72 cells (in fact 9504, because in Rev 6.0 the three latitude bands near the Poles do not contain valuable data, as opposed to Rev 5.6).
Here is a chart with three UAH plots for the Globe: one with the full grid, one with 1024 evenly distributed cells over the grid, one with even only 256 of them:
https://drive.google.com/file/d/1YjFLnql_uzZrXY_Hff5TYY9bTBxO38lO/view
There is undoubtedly some redundancy in all these datasets.
J.-P. D.
Gregory J.
I suddenly recall that Nick Stokes made years ago a very interesting experiment:
https://moyhu.blogspot.com/2011/03/area-weighting-and-60-stations-global.html
J.-P. D.
Do look at some recent, good quality Australian data. Melbourne is BOM headquarters. From 1856 to 2014 they collected data from Melbourne Regional site 86071, which had become affected by tall buildings and closed. The new site was Olympic Park, 86338, some 2.27 km to the S-E. View these on Google Earth Pro at lats and longs of 37 48 27.3 S, 144 58 12.2 E for Regional and 37 49 32.3 S, 144 58 53.9 E for Olympic Park. There is daily data for the public for an overlap in time from 1 June 2013 to end Dec 2014, some 578 days. The difference in daily temperature, ⁰C, Regional minus Olympic, is shown in the following graphs for both Tmax and Tmin :
http://www.geoffstuff.com/melbtempdiff.jpg
For the purposes of Urban Heat Island UHI studies, one can regard these as an exercise, as Regional being urban and Olympic Park being rural, though in real life they are both rather urban surrounded by some 4 million people. (The first is at about 30 m above sea level, the second about 7 m.)
The BIG question is, how are you going to use these numbers to subtract one temperature from another to find a UHI residual? They can be up to a couple of ⁰C apart some days.
Will the blunt approach of comparing their annual averages work, or will you have to take into account other factors such as altitude above sea level, holiday populations, energy reductions like Covid gives, bigger differences in mid-summer than-mid winter, some monthly differences being positive and others negative – in short, do you need to consider all of the confounding variables that you can quantify before you do the comparison? Then, even if you do, how do you correct for the situation in 1910 compared to 2010, where one has sparse metadata and the other rather more?
Please let me know below if you consider it valid to try to correct for UHI, using historic data, by any mathematical means.
I do not believe that you can. The only solution I can see is to shift all prime station locations to areas obviously unaffected by UHI, or use remote sensing like Roy and John & Co. do. Then, start again. There is no hurry. Good, hard science will wait for you. Geoff S
Geoff Sherrington
Thanks for the interesting analysis.
” The BIG question is, how are you going to use these numbers to subtract one temperature from another to find a UHI residual? ”
*
1. When I compare, within the Contiguous US (or, as John Christy recently wrote, ‘Conterminous’ – nice word), the raw data of a few hundred rural GHCN V3 stations with the rest, I see that the difference between the two resulting time series is smaller than when comparing a few hundred urban stations with the other rest.
2. When I compare, for the same area, NOAA’s output I obtain from their Climate at a Glance corner with the time series above, I see that NOAA’s series looks like if they had considered only urban stations.
My layman’s conclusion: not UHI is the problem, NOAA’s evaluation using their Pairwise Homogenization Algorithm is.
*
P.S. Do you know whether or not BoM has made context information like rurality and nightlight factor for all stations it manages, like NOAA did for GHCN V3?
I would then try to do the same job for your Downunder as I did above for CONUS.
J.-P. D.
J.-P.D,
I know of no public BOM work on lights or population corrections for UHI. Nor would I encourage them, because metadata are unsuited for the task.
Years ago I see!ected 40 BOM stations for their isolation, being able to be named ‘rural’. I calculated 40 years of temperature trends for each, Tmax and T min. The aim was an average rural trend to be compared with urban trends.
The big factor that emerged was, the more remote the site, the greater the T variability. It could be that remote sites have lower quality via management intensity.
The numbers were too variable to be useful. Too much missing data commonly. I looked at some correlations of trends with other factors and found correlations with altitude, longitude, and just for fun, correlations with BOM station numbers. So you could expect perhaps a correlation with your favourite chosen meme. The latter is a widespread problem among climate researchers.
Geoff S
Geoff S
Thanks for the convenient reply.
Selecting appropriate stations indeed is sometimes hard work:
http://www.drroyspencer.com/2021/01/could-recent-u-s-warming-trends-be-largely-spurious/#comment-604285
J.-P. D.
Bindidon,
You get more out of blogging when you work with data than with posting your preferences about the comments of others.
Here are the data I used.
Why do you not do your own analysis, any way you want, then report back?
The point I make is reasonably important for UHI. Simple thoughts are “Why not just use rural sites, free of UHI?” Simple answer is, “In Australian data, the more remote the site, the more variance there is, possibly because more remote means lower quality.” I have been to most of these remote locations and I can tell you that some of the observers have been rather interesting characters.
My analysis here indicates that you can get a correlation of warming or cooling trend in these numbers for some strange factors. For those with crooked bent, this means data ready for selective argument. I do not do that. Geoff S
http://www.geoffstuff.com/pristine_feb_2015.xls
During La Nina, the ice in the Central Arctic strengthens.
https://i.ibb.co/jVMnkpY/r11-Central-Arctic-ts-4km.png
http://www.bom.gov.au/cgi-bin/oceanography/wrap_ocean_analysis.pl?id=IDYOC007&year=2021&month=01
The polar vortex will now attack the Northeast.
https://i.ibb.co/K0kjWwb/Screenshot-2.png
You mean the La Nina is finally going to have an effect in the US?
No. The impact of the polar vortex on the weather in winter is now greater than the impact of La Nina.
https://i.ibb.co/B4Y5Mv1/gfs-hgt-trop-NA-f072.png
So then the La Nina has had NO effect in the US?
La Nina has an effect on winter temperatures throughout the Northern Hemisphere, but now has no effect on North American circulation.
In the graphic below, you have a polar vortex pattern in the lower stratosphere.
https://i.ibb.co/YXDPFpd/gfs-z100-nh-f72.png
The slope on the first red graph is totally spurious. Just by eye we can see it should be WAY steeper. This is a known problem ( called regression dilution ) with using least squares regression on data with noisy x axis data. It is NOT VALID.
The true slope is way steeper and the intercept strongly negative.
The similarity with the four dot graph TOTALLY COINCIDENTAL. Any scientist would be instantly suspicious that these regressions agree to 4 sig figs. It’s absurd.
I really don’t know what Dr Spencer is doing here but it’s a mess.
A steeper slope would mean even more correction but until it is done in a valid way it means nothing.
Here is an article I wrote on inappropriate use of OLS: a typical trick used by warmists to get a falsely high climate sensitivity:
https://climategrog.wordpress.com/2014/03/08/on-inappropriate-use-of-ols/
You need to give good reasons why any trend line is better than another.
If you are going to argue that a curved trend line will be better than a linear one, you need a solid demonstration.
There are many ways to test the goodness of fit of a particular trend, whether linear or curved – there are many statistical tests available.
Chi-squared test
Akaike information criterion
Kolmogorov-Smirnov test
Anderson-Darling test
Shipiro-Wilk test.
For example.
https://www.investopedia.com/terms/g/goodness-of-fit.asp
https://en.wikipedia.org/wiki/Goodness_of_fit
Older people with known covid should be given injections of heparin from the onset of the disease.
“Answer: We noticed, through some of our collaborations with medical centers, that COVID-19 was causing some patients to experience what appeared to be significant microthrombosis. So, we talked to medical centers about putting people on heparin when they come to the hospital, whether it’s subcutaneous low-molecular-weight heparin or unfractionated heparin. A number of papers that came out subsequently indicated that, indeed, anticoagulation therapy improved the outcome of patients, particularly those who were seriously ill.”
https://www.healio.com/news/hematology-oncology/20200827/heparin-may-neutralize-virus-that-causes-covid19#
Urban Heat island Effect has number of causes.
If you measuring air temperature over an asphalt parking lot, it will result in higher temperature. More paved surface areas, more UHI effect. Another mentioned effect is canyon effect of tall buildings:
https://en.wikipedia.org/wiki/Urban_canyon
Another effect is due adding water vapor, if UHI effect is creating rain shadow, it’s seems that is largely due water added, though other factors could also be involved. The more humid air feels warmer, but also going cause warmer nights. And the often given idea of adding shade trees, could add to the UHI effect.
Having more reflective roofs is said to reduce UHI effects, or roofs which are less reflective cause UHI effects.
It’s also said CO2 or smog cause UHI effects.
Anyhow there lots reasons given and probably just way city is designed {it’s layout] has an effect.
Fulco
You wrote upthread:
” I sought for 100+ years temperature series in natural environments around the world and I found a couple. ”
Why do you search for 100+ years stations? That is the best way to find nearly none outside of CONUS, Europe, Australia and a couple of other countries.
And the least of these will be located in ‘natural environments’, of course, because that wasn’t the goal at that time.
And the least of these will show, over a century, any trend, as the global average trend over all stations since 1900 is about 0.08 C / decade.
*
Though NOAA’s GHCN V3 data set management has stopped activity by August 2019, the data and metadata still are there.
And V3 has over newer series like GHCN daily and GHCN V4 the advantage to show environmental contexts in its station list, e.g.
40371131001 49.2000 -109.5200 945.0 NASHLYN,SA
912R -9FLxxno-9x-9COOL CROPS A
which help you in selecting stations of hopefully (!) more rural aspect.
It’s our / and your job of course to eliminate, using e.g. Google Maps, those stations which in between no longer fit into that rural scheme.
GHCN V3 has worldwide 7280 stations { don’t care about the stoopid boaster telling you they all no longer exist, and were replaced by synthetic data }.
Of these, 2269 share both in the metadata the attribute ‘R{ural} ‘ and low nightlight level ‘A’.
You can compute their trends for say 1971-2020, by using the stations’ data, and obtain by the way their start and end date of activity as well.
I used the ‘unadjusted’ variant. Using ‘adjusted’ increases the trend for about 60% of the stations.
Removing all stations showing trends below -0.5 C and above +0.5 C / decade (there were way way more of the latter) gives you a list of 728 stations:
https://drive.google.com/file/d/1Atb4G7_9Nd31GLK-oye0Ybl-sQJsdeBf/view
That would be a good start for your investigation.
J.-P. D.
“For residents that are dreading the approaching Arctic blast, there’s still time to get out and enjoy the relatively mild weather early this week. Through midweek across the Plains and the Upper Midwest, temperatures will climb 5-15 degrees above average, along with dry conditions.
Signs of a changing weather pattern will begin to surface during the latter half of the week as a storm system is expected to sweep through the Plains and Midwest with a swath of accumulating snow. While temperatures are expected to be seasonably low during the storm itself, the rush of Arctic air in the wake of all of the precipitation will really usher in the bone-chilling conditions.”
https://www.accuweather.com/en/winter-weather/arctic-invasion-to-usher-in-1st-subzero-temperatures/891604
Thank you for the nice article. From my look at USHCN data, it didn’t seem fit for the purpose of climate change detection, with the many adjustments needed that are produced by their opaque FORTRAN code. Systematic problems with the data are swept under the rug rather than treated honestly.
I wrote these notes for myself a while back:
I’ve been looking at the US historical data to get a better understanding of the time-of-observation adjustment, which has been criticized as introducing spurious bias. This adjustment accounts for most (all?) of the 20th century US warming. If observers reset the temperature min/max every 24 hours and recorded at the stated time, time-of-observation bias would seem to occur (Karl 1986).
However, an unknown fraction of observers were aware of the double-counting effect that leads to time-of-observation bias, and reset the thermometer maximum at a cool time of day (see 1921 Handbook of Meterology, page 181). Also, only in 1952 did official instructions for temperature measurement direct observers to reset exactly every 24 hours. Prior instructions did not state this. Perhaps, the official bias correction underestimates the motivation and skill of the cooperative observers.
1921: A Manual For Cooperative Observers and Students (not NWS)
“Usually the maximum temperature of the day occurs between 2:30 p.m. and 4:00 p.m. and the thermometer should be set late in the evening or early next morning so as to record the maximum for the next day.”
This guidance changed in 1952 to one-reset-per-day.
The “verification” for the time-of-observation bias adjustment (Vose et al 2003) was done for more recent data (post 1951) but not earlier (why?). If pre-1951 data did not actually contain the hypothesized warm bias (due to afternoon/evening measurement), then it is incorrect to adjust that data. The current data is primarily morning data, which is less biased anyway.
The paper was trying to establish the validity of TOBS adjustment, after a paper the previous year said TOBS adjustments made the last 30 years warmer than in other data sets.
As the TOBS adjustment method (Karl et al 1986) had been undertaken with data from 1957-1964, Vose et al used the data immediately following that period (1965-2001) to get a fix on the most recent 3 decades. As this was a verification of a method in response to a paper claiming a warm bias for the last 30 years, they weren’t obliged to consider what had been done with TOBS adjustment for the whole record.
https://agupubs.onlinelibrary.wiley.com/doi/full/10.1029/2003GL018111
ProgramThyself
You write here lots of guessing, without any visible results anybody could properly evaluate.
Why don’t you, for example
– extract all GHCN daily stations tagged ‘HCN’
– generate out of them TMIN and TMAX time series
and compare these series with those you obtain out of the USHCN v2 corner, i.e. ‘raw’, ‘tob’, and ‘Fls.52i’ ?
So we could see what really remains of your somewhat pretentious guessings.
As an European, I won’t do the job, because data restricted to the US is of no interest for me.
J.-P. D.
https://youtu.be/kSAVfL6_Z-4
Atrocious blogger.
No, I don’t have to demonstrate why in the slightest, if all you are going to do is post a youtube link.
Tony Heller is a propagandist, nothing more.
b,
And Tony Heller (whomever he is) is a propagandist because?
Or are you just another fact-free alarmist disciple – all faith, no facts – who believes that anything they say must be infallible?
Thanks for the humour.
swenson…”And Tony Heller (whomever he is) is a propagandist because?”
1)He’s not a climate alarmist.
2)His science disagrees with Barry’s propaganda.
You can’t read.
b,
If you say something, it must be taken as infallible, is that it?
It is fairly obvious that I can, in fact, read.
It is thus fairly obvious that you are dim-witted. A fantasist. Deluded, even.
Nope, you’ve still got it wrong. You can’t comprehend what you read.
barry is trying to deny his own words: “Tony Heller is a propagandist, nothing more.”
(That’s why this is so much fun.)
b,
I see. Having been caught out, you now change your words.
Typical alarmist tactics.
You make another flat assertion, without explanation.
You appear to be flailing about, hoping desperately that digging a deeper hole will enable you to avoid scrutiny.
Would you like to change your unfounded accusation again? Or maybe just apologise fro trying to appear intelligent, and start over?
Nope, I stated it clearly, but you keep missing the point. It’s fun to watch you monkeys dance, though.
barry, basic denial won’t work for you this time. The evidence is too clear. You’re going to have to come up with something better. For example, you could claim that some “other barry” made that comment above. Try that.
There’s a tune in my head while I read these replies. I’ll see if I can find it for you:
https://youtu.be/pct1uEhAqBQ?t=12
I wonder if you’ll pull a new trick or just keep doing the same one.
Wow barry, you responded in 3 minutes! You’re even more desperate than usual. You must know you’ve been caught in your own trap.
Nothing for you to do now except squirm like a trapped rat.
Maybe you can gnaw your way out….
Keep dancing, please!
https://youtu.be/pct1uEhAqBQ?t=12
Well you took over a day this time, but couldn’t do any better.
When you have to face reality, everything gets tougher, huh?
Monkey see
https://tinyurl.com/y42pggdo
Heller’s main benefit is to get people like you so riled that you can no longer fake it. Your true colors come out.
That’s where he excels.
As opposed to his other main benefit, which is not knowing the pressure of the triple point of water.
That was a food fight to remember.
Tony kicked him off of his blog, so I can say Tony did do something right for a change.
Someone who isn’t good enough for Whatsupmybutt, isn’t good for much of nothin at all.
bob is definitely riled, but we already know his true colors.
If you were there you would know that I was the one that got Heller riled, not the other way round.
It is a two-dimensional chart. On the Y-axis is degrees Celcius, and on the X-axis is population density. Did you click on “constructed?”
I still cannot get over how this exercise is a complete misuse of statistical analysis.
Here is a simple task. Generate 100 pairs of completely random numbers and calculate the line of best fit. I am looking at one right now and see that it has a small trend, with an r-squared value of .0125. Nothing much to see, agreed?
I then averaged each of 25 consecutive pairs to obtain 4 data points. When I plot these I obtain an even stronger trend line with an r-squared value of .5399. Hey presto! I have found a relationship from meaningless data! Magic!
Honestly, you could write a whole chapter on this mess.
s,
Or, if you were a faker, fraud, deadbeat and scofflaw like MichaelMann, you could probably take meaningless data, then use Mikes Nature trick to come up with a composite and totally meaningless hockey stick.
The facts still dont change, whatever they are.
+1. Yeah, the 2B figure and its R^2 are misleading at best.
In the United States, the temperature during the winter in stratospheric intrusion drops rapidly over large areas within just a few hours. Is the average temperature in these areas relevant for the inhabitants?
Came across this entry in a blog far, far away.
“There are people who put together a coherent picture of a scientific issue, who review lots of evidence and assemble a rational synthesis. They’re called scientists. Then there are the myopic little nitpickers, people who scurry about seeking little bits of garbage in the fabric of science (and of course, there are such flaws everywhere), and when they find some scrap of rot, they squeak triumphantly and hold it high and declare that the science everywhere is similarly corrupt. They lack perspective. They ignore everything that doesn’t fit their search criterion, and of course, they’re focused only on putrescence. They aren’t scientists, theyre more like rats.
And the worst of the rats are the sanctimonious ones that declare that theyre just ‘policing’ science. They arent. Theyre just providing fodder for their fellow denialists, and like them all, have nothing of value to contribute to advance the conversation.”
That was a biologist speaking about creationists.
Yeah barry, some biologists can be very anti-science.
“theyre just policing science”
There are different kinds of policing or people that guard “stuff”,
mobs can police, in terms of lynch mob, or something more organized like a criminal gang, or the Mob family type mob which has traditionally values of some kind and more corporate thing which called a Cartal. You had Nazi SS, police or police guarding a government itself; as with The “Secret Service” guarding President. The Vatican police.
Or private security, people at gate house to entrance, those patrolling one foot, bike, or cars, and personal bodyguards.
Then have cops, police enforing governmental laws.
But everyone is policing, stuff, but roughly, anyone paid for the service, are said to be police. And policing science would be enforcing rules of science {paid or unpaid}. Just as everyone to some extent is policing some form of etiquette
“There are people who put together a coherent picture of a scientific issue”
That could be anyone, but one could say, Einstein put together a coherent picture of the Universe, and it seems clear to me that Einstein was scientist. Scientist investigate something, using a scientific method of investigating which is systematically logical/rational. But one could say everyone does this.
So, I don’t think I am scientist.
I would say, I am philosopher {which one could call a curse to humankind] and I am interested in everything, and a scientist is focused on something, which usually involves being involved in a field, and I would say would be finding errors in that field- which is what Einstein did.
Finding errors, deficiencies, confusions, whatever you want to call it. And then of course giving a “coherent picture” of what was “found”.
And as a philosopher, I would say Exploration {ie, space exploration} has and will continue to “fuel” science. And one has the explorer scientist, like Darwin.
b,
In climatological circles, the word scientist has been redefined to include anyone who believes in the magical powers of CO2 to heat planets.
Examples include Gavin Schmidt, a mathematician. Steve Mosher, BA, described as a scientist by Berkeley Earth (apparently hoping that people would associate Berkeley Earth with the University of California Berkeley campus).
As to the term climate scientist, this is an oxymoron. Climate is defined as the average of weather. Repetitive arithmetical operations on historical numbers can be performed by any competent school student.
Your anonymous, possibly mythical blogger, sounds like a climate alarmist who has been caught out spouting nonsense, and is unhappy about it.
In any case, a persons scientific achievements may be such that their religious views are irrelevant. Take Sir Isaac Newton, for example. His writings on religion were prodigious, far greater than his scientific and mathematical works. Do I care that he thought the New Jerusalem would be a cube extending to the heavens, and containing beings who had powers beyond the ken of humans?
You might care to vent your spleen elsewhere. Its only engendering sympathy for your delusional state here.
Swenson – What is your take on the faint sun paradox and the situation on Venus?
G,
The faint sun paradox is nonsensical. The Earth seems to have cooled from its original molten state. The chances of the Earth freezing over because the sun was fainter are about as remote as the chance of Hell freezing over, as they say.
The proponents of this sort of nonsense probably believe Venus is hot because its atmosphere is dense and contains a high proportion of CO2!
The situation on Venus is what it is. I assume you agree.
Yes it has cooled since it’s molten period
Until the Cryogenian
https://www.nature.com/articles/s41598-019-43177-8
when it was quite chilly
and it has warmed and cooled since then.
With more warm and cold periods before, after, and between those two above.
Also we don’t know anything about the period before it was molten, when the earth didn’t have a Moon.
The Physics of the CO2 molecule are pretty set. Small changes in CO2 simply won’t alter the W/M^2 back radiation of the atmosphere. There is absolutely no way for CO2 to cause the extreme variability in temperatures. If there is a rapid increase in temperatures, it is certainly due to something other than CO2. Just look at the Hockeystick. It dog-legs at 1902. The physics of the CO2 molecule didn’t suddenly change in 1902. CO2 won’t cause dog-legs or spikes. CO2 can’t cause cooling, it only adds to the W/M^2. Instead of trying to blame CO2 for the warming, which it isn’t responsible for, simply look at a desert station over the past 140 years, people should be asking what truly causes temperature variations.
–CO2isLife says:
February 1, 2021 at 12:21 PM
The Physics of the CO2 molecule are pretty set. Small changes in CO2 simply won’t alter the W/M^2 back radiation of the atmosphere.–
I am not sure the cargo cult of global warming, claims an increase in “back radiation” is caused by increasing levels of CO2.
It seems the doctrine is that increased CO2 level causes the atmosphere to radiate more at higher elevation.
Or radiates more at higher elevation which is colder due to it being higher elevation as compared warmer lower elevation radiating more.
{I don’t think atmosphere cools much at higher elevation, but it’s seems the religious want explain it this way- or I tend to think increased CO2 level effect is near the surface and then if when at surface one could then actually measure it- like you seem to be saying. But I also think it’s a small effect, but given enough time, a small effect could be significant. Or as I said before, 0 to .5 C if present CO2 levels are doubled within time period of 100 year of the doubling.}
“Instead of trying to blame CO2 for the warming, which it isn’t responsible for, simply look at a desert station over the past 140 years, people should be asking what truly causes temperature variations.”
Temperature variations are largely caused by clouds. And weather in general.
What controls global surface air temperature {or entire atmosphere temperature- but other satellites, we measure surface air} is
the ocean surface, due simply to it’s the super majority of Earth surface {if don’t want bother to include other factors}.
And I would say the average temperature of entire is global temperature- or our cold ocean {average of 3.5 C} causes us to be in an Ice Age. A ocean which is warmer than 4 C, will cause us to be in warmer period of our interglacial period, if ocean was 3 C, one say we, at least, we appear to be leaving our interglacial period. Or we have not had ocean of 3 C or colder, during our interglacial period- and in past {in warmest times} in past interglacial periods, the ocean has reached 4 C {or warmer}.
The American Journal of Medicine has reversed its stance on hydroxychloroquine to fight COVID now that Trump is gone. These are medical doctors who killed people because of politics. That is what leftists do, psychopathic.
https://www.amjmed.com/article/S0002-9343(20)30673-2/fulltext
It is indeed The American Journal of Medicine’s reversal since in the time of warp speed review for the sake of saving lives the AJM held this 17 university study since August before releasing last week.
In times past, these people would never have been allowed into medical school.
There was a reason for that.
Perhaps they were unwilling to publicly disagree with a POTUS who tried to defund or fire anyone who disagreed with him.
Thanks. You remind us who the left is with every post.
To someone on the extreme Right wing like yourself, no doubt anyone less extreme looks like a leftie.
“In the modern U.S., there are strong populist and illiberal sentiments on the right, so it would be fair to describe it as a right-wing or rightist movement. However, this is still an oversimplification, as historical fascism included specific policies that would hold appeal for modern American leftists. Fascists were strongly anti-capitalist; they strongly controlled their markets and offered extensive social programs (albeit as a privilege, used as a carrot and stick to exercise control). They also employed strong police powers and used propaganda that made naked appeal to historical national greatness, things that would have far more appeal to American conservatives and rightists.
In sum, fascism is – in a modern context – a rightist government, but it is one that could also hold appeal to anyone with an illiberal, populist worldview, which would include many leftists. If thats confusing, wellthe world is a complicated place, and history rarely slots cleanly into anyones narrative.”
Andrew Johnston
“There is no right or left, only up and down.” -R. Reagan
Protecting Street thugs
Censorship
Suspension of due process for enemies
Exempting elites from account
Weaponizing government agencies
Surveillance state
Coercive propaganda
Perversion of Science
Increased taxation
Government expansion
Collusion with oligarchs
Interventionism per se
Family members accepting bribes
vs.
Excessive tweets in condemning these
Whether Marxist or Fascist, it’s a poor leader who surrounds himself with sycophants.
Better a staff that tell you what you need to know rather than what you want to hear.
Thank you. I appreciate the label extreme right, although I haven’t earned it. Someone on the extreme right is the opposite of the extreme left. Extreme leftists are big government, absolute control, state-owned, authoritarianists. Extreme right proponents are small government, little control, private property, individual liberties, non-authortarians. I believe in some government, not no government, but I somehow think we’d be much better off with no government.
FYI, Fascists like Marxists are leftists.
Have you encountered the political compass.The
https://www.politicalcompass.org
After you’ve tried the test, look at their analysis of the 2020 US election.
https://www.politicalcompass.org/uselection2020
I don’t use left-leaning web sites as a source. I only need logic. The opposite of big leftist totalitarianism is a small conservative decentralized government. The left has been trying to re-define Nazis and Fascists since WWII. I don’t blame them, but historical facts are difficult to cover or re-define. That whole holocaust thing sure made leftists look bad. They ignored all the Jews that Stalin murdered, too.
Have you read “Road to Serfdom” by Freidrich Hayek? He gives you a first-hand account of the Nazis and Fascists and who they really were.
Lol
Amazing how little the dogmatic, very vocal, political party adherents understand totalitarianism.
The range of political philosophy is like a clock face. The center is at 6 o’clock, but at 12, they meet.
At 12 there is no difference between a Stalin, Franco, Mao, Mussolini, Kim ll, or Hitler.
Until the power over popular education is wrested from these disciples of doom and get back to basics, civilization is doomed to
rinse and repeat.
It is truly mystifying that Stephen still denies that there are right-wing authoritarians.
For evidence, just need to look no farther than his own comments, where HE, a right-winger, personally advocated authoritarianism.
“Trump should invoke the Insurrection Act and stop this steal.”
https://www.drroyspencer.com/2020/11/benfords-law-part-2-inflated-vote-totals-or-just-the-nature-of-precinct-sizes/#comment-590996
“The American Journal of Medicine has reversed its stance on hydroxychloroquine to fight COVID now that Trump is gone.”
Wrong.
The AJM has published a study that says hydroxychloroquine “may reduce the progression of disease, prevent hospitalization, and are associated with reduced mortality” if used early in outpatient treatment, and is probably ineffective used late in treatment.
The journal has not published its ‘stance’ on this issue, it reviews and publishes papers that come up to minimum standards.
Hydroxychloroquine was touted as a silver bullet for COVID. Even if this study’s findings bear out, it is still not a vaccine or a cure.
This is how lies start. Someone twists the truth, someone likes the narrative, and suddenly the pack these people run with on the net are saying that a science journal has a ‘stance’ on a medical question that it has now ‘reversed’. It’s like the worst tabloid journalism, but anyone can do it.
It was like that with AGW, barry.
And guess who fell for it….
It came out in August. Why do you think it was ‘held’ til now?
Literally nothing is happening.
In four days, the stratosphere will flow to the Midwest and the Great Lakes. I advise you to prepare a fuel supply.
https://i.ibb.co/YjtWHfj/gfs-hgt-trop-NA-f120.png
We will see in a few days if the current temperatures
tinyurl.com/1r9kg05t
develop to bypass the recent record
tinyurl.com/1pvu9f85
J.-P. D.
The northern jet stream is now pushing the cooler surface water in the East Pacific further south.
http://virga.sfsu.edu/jetstream/jetstream_pac/big/2102/21020200_jetstream_pac_anal.gif
https://i.ibb.co/QJH3pJ0/cdas-sflux-ssta-global-1.png
http://www.bom.gov.au/archive/oceanography/ocean_anals/IDYOC002/IDYOC002.202102.gif
Richard Greene
” J.P.D Sorry I called you Bindingdong in my last comment — that was something I would have deleted after I posted it, eventually, if it was possible to edit comments. ”
Please don’t worry! You belong to the most polite persons here.
And yes: we differ in many points of view, here and there even fundamentally. So little skirmishes are unavoidable.
I prefer nonetheless our educated differences to stubborn, ignorant, antiscientific ‘meanings’ like about Earth’s energy balance, Einstein, lunar spin, viruses, etc etc.
J.-P. D.
You can’t shame the creep
I’m wondering about this sudden reversal on hydroxychloroquine by the American Journal of Medicine.
The reason is
Horby P et al. Effect of Hydroxychloroquine in Hospitalized Patients with Covid-19, New Engl J of Med 2020
DOI: 10.1056/NEJMoa2022926
Link found in
Hydroxychloroquin bei COVID-19 auch in randomisierter Studie wirkungslos
https://www.kardiologie.org/covid-19/hydroxychloroquin-bei-covid-19-auch-in-randomisierter-studie-wir/18461708
Medicine people seem to have different meanings depending on the country they live and work in. Duh.
In any case, one of the strongest proponents of using hydroxychloroquine in the fight against COVID19, French medical doctor Didier Raoult, recently reconsidered his position and withdrew his 100% recommendation.
It took him a year for that.
J.-P. D.
Didier was courageous to hold out that long.
You wonder how they got to him? Threats about his job, salary, family?
Clint R
” Didier was courageous to hold out that long. ”
Typically intentional misrepresentation of facts by a permanent Contrarian.
Raoult was not courageous: he is a stubborn, pretentious person, who deliberately ignored the evidence shown by nearly all his colleagues.
I don’t remember anyone writing about his presence in a French hospital that was running out of ICU beds and ventilators.
Only recently was he willing to admit that he had manipulated the results of his HCQ studies in Marseille.
*
But Contrarians, of course, defend other Contrarians – against all odds.
Nobody in France threatened Raoult: that is your own invention.
Hvor mange franske aviser leser du?
J.-P. D.
Nah, Didier could have handled the slurs and name-calling. Those of us that are Realists must put up with that all the time. And Didier had too much of an established career of successes and awards.
HCQ is very inexpensive, helpful, and harmless. That’s scary for reality-deniers.
binny…”Im wondering about this sudden reversal on hydroxychloroquine by the American Journal of Medicine”.
I would think you’d be more concerned about the German Court ruling that lockdowns in Germany are unconstitutional.
https://ahrp.org/german-court-in-weimar-declares-lockdown-unconstitutional/
Hopefully this sanity will prevail in the rest of the so-called free world.
Perhaps you could elaborate on how this discussion of Hydroxychloroquine pertains to US Warming trends.
I would recommend for those interested here, go to http://www.realclimatescience.com
Tony has done a thorough job devastating the adjusted data for years. He has demolished Zeke’s arguments.
I would recommend following Zeke’s work. He has actually done the hard yards while propagandist Heller has, rat-like, found whatever flaws or incongruities he can find – any bit of putrescence that shines for him – and woven false stories about many things, including the temperature records.
Let him construct his own temperature record and then submit it for review. His shonkiness would never pass professional muster.
Thanks for your opinions, barry.
Now, do you have any REAL science to support additional CO2 can raise surface temperatures?
Nonsense like the “steel greenhouse” ain’t science.
b,
Would this be the same Zeke who signed a letter to Michael Mann, complaining about Mann publishing falsehoods?
From Zekes site –
* Climatologist Michael Mann has published a number of claims about the Breakthrough Institute that are demonstrably false, in his new book, The New Climate War. In a public letter to Mann and his publisher, PublicAffairs Books, Breakthrough’s Ted Nordhaus, Zeke Hausfather, and Alex Trembath Institute refute claims the author has made about our organization, its founding, and our agenda and demand a correction to his false assertions *
Zeke describes himself as a climate scientist – a mythical creature akin to a unicorn.
As Ernest Rutherford once said –
* All science is either physics or stamp collecting. *
Self proclaimed climate scientists apparently compute averages, and then claim this is science!
So, who is lying – Zeke and co, or Michael Mann?
Yes, Zeke Hausfather.
I don’t think they disagree on the utility of averaging, but if you have a direct quote I’ll be sure to attend it gravely.
This business between Zeke and Mike is a bit of a rum do. It looks like the final nail in the coffin of climate science again.
Maybe I missed it…can you post a link Tony Heller’s global mean surface temperature dataset? I’d like to review it.
b,
It doesnt matter what they agree or disagree about.
Nature always wins. Facts are facts.
Who is less intelligent – Zeke or Mike? Maybe both lie. Who would know?
Surface temperature data altering is real and thank you Dr.Spencer for questioning the valid of the data sets.
If the corrections fixed known problems in the instruments, that would help accuracy. But they are statistical. They make the station measurements smoother when mapped and they smooth over discontinuities. In my opinion, NOAA has overdone it. TOB, PHA, infilling and gridding are overkill. This is easily seen in Figure 7 and by comparing Figure 3 to Figure 6 or Figure 5. Does the final trend in Figure 3 more closely resemble the measurements (Figure 6) or the net corrections in Figure 5? The century slope of the data is 0.25°, the corrections add 0.35° to this and the “climatological gridding algorithm” adds 0.9°! It is worth saying again, the type of statistical operations we are discussing do nothing to improve the accuracy of the National Temperature Index, and they probably reduce it.
https://wattsupwiththat.com/2020/11/24/the-u-s-national-temperature-index-is-it-based-on-data-or-corrections/
https://realclimatescience.com/2021/02/erasing-the-holocene-optimum/
https://principia-scientific.org/damning-ruling-posted-in-the-mann-v-ball-trial-of-the-century/
https://principia-scientific.org/breaking-michael-mann-doubles-down-over-contempt-issue/
https://principia-scientific.org/breaking-news-dr-tim-ball-defeats-michael-manns-climate-lawsuit/
Considering UHI study is important both for urban planning and GHG mitigation policy, it seems like the funding and efforts could be beefed up. I think there are many more studies funding by urban planning than for IPCC. I wonder what the land record would be if properly adjusted for non-climate effects. Karl thought it was important in 1988 but somehow interest was lost.
Here is an interesting paper that found big cities worldwide had 1-3C/ 100-yrs in UHI: https://www.jstage.jst.go.jp/article/jmsj1965/74/5/74_5_639/_pdf/-char/en
I wonder is everyone agrees that the proper way to study non-climate effects is not by finding pristine stations but by finding and comparing proximate pairs having pristine metadata. The greater the variation in rate of change in population density the more significant the UHI effect, holding instrumentation or time of observation constant.
Once land stations are properly adjusted the next analysis should be for marine effects on them to verify imbalance of land to oceans and compare to what should be theoretically created by AGW.
ron…”Karl thought it was important in 1988 but somehow interest was lost”.
Karl is a climate alarmist. He was privy to the shenanigans in the hockey stick data before the graph was released and said nothing. He was still head of NOAA when they retroactively fudged the SST to show warming over the 15 year flat trend from 1998 – 2012 reported by the IPCC.
Under the guidance of Karl, NOAA became a scientifically corrupt organization.
barry…”That was a biologist speaking about creationists”.
You mean the kind of idiot who talks down his nose at Creationists yet support the THEORY of evolution based on no more proof than Creationists can supply?
Modern evolutionists like to conveniently forget that evolution theory is ultimately based on abiogenesis, a theory that living matter can evolve from matter that has no signs of life, like atoms of hydrogen, oxygen, nitrogen, carbon, and phosphorus. There is no evidence in chemistry theory, related to chemical bonding, that those 5 elements can form living matter. In fact, mathematical analysis of the likelihood shows the chances of it happening are billions and billions to one against.
Evolutionists would rather adhere to good theory developed for genetics, which is the study of actual life in the here and now. The evolutionists take that theory and add science fiction to extend the theory into the past, developing pseudo-science called natural selection to explain what they cannot explain nor for which they can supply evidence.
The Creationists may be off-base with their generalized theories but the more we learn about genetic material like DNA, the more it becomes apparent that life is based on intelligent codes built into the DNA. Intelligent, ordered codes don’t appear randomly out of chaotic processes, there is every reason to think they are designed.
I’ll stop there because I have absolutely no evidence of who or what might have created the codes upon which life is based. That’s about the same amount of evidence supplied by evolutionists that their theory is correct.
Besides the quote you have supplied defines science incorrectly. Shows that the author, allegedly a biologist, has no idea of what science might be.
barry…”I would recommend following Zekes work. He has actually done the hard yards while propagandist Heller has, rat-like, found whatever flaws or incongruities he can find any bit of putrescence that shines for him and woven false stories about many things, including the temperature records”.
Is this the Tony Heller you are maligning?
https://realclimatescience.com/who-is-tony-heller/
Sounds to me like he’s eminently qualified to speak on the subject. Also appears he is seriously ruffling your alarmist feathers.
https://realclimatescience.com/2021/01/five-years-since-the-end-of-the-world/
“I’m not claiming I know how much it has (or hasn’t) warmed. Instead, I’m saying I am still very suspicious of existing official land temperature datasets.” CYA much?
It seems that Exxon’s model was very accurate 40 years ago https://ibb.co/Fh0nfH7 in predicting both the rate of CO2 and global temperature increase. No wonder they’ve spent so much money supporting deniers’ institutions over the years.
The problem is finding the deniers institutions that you refer to.
The companies themselves state they don’t fund climate science by any party.
It would save a lot of time and trouble to simply recognize that the people claiming we have a problem are inveterate lairs who make stuff up, have a history of predictions that have never come to pass, and who have a vested financial interest in making everyone think something terrible is occurring.
Figure 1 looks like a fractional power will fit relatively well – x^y where y looks to be something less than 1/2.
I think the oceanic sea surface temperatures are a very good indication of how unlimited real global warming has been. If one goes back to 1970 to now its like +.3c
That could easily decrease.
Quality puppy wipes,what is nmn supplement
, wipes for dogs and More. — DhohOo、
เกม Pg Slot เล่นง่าย ผ่าน pinterest ได้รวบรวมเกมหลากหลายมากมายใว้ที่นี่เดียว ของเกม Pg Slot ที่น่าดึงดูดจากทั่วทั้งโลก โดยคนที่ลงผลงานสามารถเป็นคนไหนกันแน่ อยู่ไหนก็ได้ติดตามผลงาน
Mega Game 5 ขนมไทยเสริมดวง สล็อตเป็นเกมที่ยอดฮิตเวลานี้สามารถหาเงินจากการเล่นได้มากมาย ใช้อีกทั้งความสามารถและก็วิธีต่างๆสำหรับการเล่นรวมทั้งหัวใจสำคัญของเกมสล็อต megaslotgame ที่ใช้สำหรับเพื่อการเล่น
These are truly fantastic ideas in about blogging.
You have touched some fastidious things here. Any way keep
up wrinting.
Howdy! I know this is kinda off topic but I’d figured
I’d ask. Would you be interested in exchanging links or maybe guest authoring a blog post or vice-versa?
My blog covers a lot of the same topics as yours
and I feel we could greatly benefit from each other.
If you happen to be interested feel free to send me
an email. I look forward to hearing from you! Excellent blog by the way!