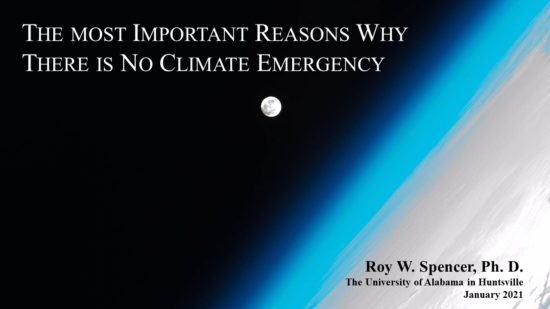
This Tuesday, Jan. 19: My Friends of Science Society Livestream Talk: ‘Why There Is No Climate Emergency’

January 15th, 2021 by Roy W. Spencer, Ph. D.

On Tuesday evening, January 19, at 8 p.m. CST there will be a 30 minute livestream presentation where I cover the most important reasons why there is no climate emergency. I just reviewed the video and I am very satisfied with it.

In only 1/2 hour I cover what I consider to be the most important science issues, the disinformation campaign that spreads climate hysteria, some of the harm that will be caused by forcing expensive and unreliable renewable energy upon humanity, and the benefits of more CO2 in the atmosphere.

You can go to the FoS website for more information. The tickets are $15, and I will be doing a live Q&A after the event.


239 Responses to “This Tuesday, Jan. 19: My Friends of Science Society Livestream Talk: ‘Why There Is No Climate Emergency’”

Toggle Trackbacks

  1. From the link,
    in an easy to read format:

    “Summary
    The current claims of a “climate emergency” are shown to be gross exaggerations.

    Recent warming of the climate system has been modest and benign, and at the low end of the warming predicted by the computerized climate model projections used to guide changes in national energy policy.

    Climate model projections of human-caused climate change are based upon the assumption that climate does not change naturally, and so represent an example of circular reasoning.

    From sea level rise to wildfires to severe weather, there has been little to no change observed which is outside the realm of natural variation.

    Thus, the “climate emergency” claims are not based upon science.”

  2. David Wojick says:

    My explanation of the circular reasoning in some detail:
    https://www.cfact.org/2018/03/01/circular-reasoning-with-climate-models/

  3. Entropic man says:

    Friends of Science.

    The sport of organisation which would be set up by the Ministry of Truth.

  4. Adelaida says:

    Dr. Spencer,

    I hope your talk and live question session on the 19th goes great and that you have great success with your new book

  5. Adelaida says:

    Ren,

    Thank you very much for your explanations about La Nia.

    Even if the correct TSI reconstructions imply little solar variability, it would be possible to amplify through the nucleation mechanism that Svenmark and Nir Shaviv have managed to model in 2020 … Is that so?

    I send the links again because they are two posts behind:

    https://www.researchgate.net/publication/228907219_Using_the_oceans_as_a_calorimeter_to_quantify_the_solar_radiative_forcing
    https://agupubs.onlinelibrary.wiley.com/doi/full/10.1029/2020EA001142

    And did you know the following?
    “In 2018, the environment committee of the German Bundestag invited him as an expert to the German Parliament. There he denied that carbon dioxide had a substantial effect on climate change [28] and stated that the Intergovernmental Panel on Climate Change (IPCC) it was ignoring information that the sun was the main cause of climate change. [29] ” https://en.m.wikipedia.org/wiki/Nir_Shaviv

    One link More about Nir Shaviv:
    https://www-researchgate-net.cdn.ampproject.org/v/s/www.researchgate.net/profile/Nir_Shaviv/amp?amp_js_v=a6&_gsa=1&usqp=mq331AQFKAGwASA%3D#aoh=16106451389472&refercsi=htttt 3A% 2F% 2Fwww.google.com & amp_tf = De% 20% 251% 24s & ampshare = https% 3A% 2F% 2Fwww.researchgate.net% 2Fprofile% 2FNir_Shaviv

  6. Jason Radley says:

    When will it be available for free?

    • Glenn Cox says:

      Hopefully soon. This information needs to be shouted from the rooftops since the media won’t cover it.

    • Ken says:

      Its free to members of Friends of Science.

      You’ll have to pay the fee.

      I did watch it. If you are a regular on this blog there isn’t anything new. It is a good condensed version of the science as we know it.

  7. ren says:

    Presented here is a simple and reliable method of accurately calculating the average near surface atmospheric temperature on all planetary bodies which possess a surface atmospheric pressure of over 0.69kPa, by the use of the molar mass version of the ideal gas law. This method requires a gas constant and the near-surface averages of only three gas parameters; the atmospheric pressure, the atmospheric density and the mean molar mass. The accuracy of this method proves that all information on the effective plus the residual near-surface atmospheric temperature on planetary bodies with thick atmospheres, is automatically ‘baked-in’ to the three mentioned gas parameters. It is also known that whenever an atmospheric pressure exceeds 10kPa, convection and other modes of energy transfer will totally dominate over radiative interactions in the transfer of energy, and that a rising thermal gradient always forms from that level. This rising thermal gradient continues down to the surface, and even below it if there is a depression or a mine-shaft present. This measured thermodynamic situation, coupled with other empirical science presented herein, mean that it is very likely that no one gas has an anomalous effect on atmospheric temperatures that is significantly more than any other gas. In short; there is unlikely to be any significant net warming from the greenhouse effect on any planetary body in the parts of atmospheres which are >10kPa. Instead, it is proposed that the residual temperature difference between the effective temperature and the measured near-surface temperature, is a thermal enhancement caused by gravitationally-induced adiabatic auto-compression, powered by convection. A new null hypothesis of global warming or climate change is therefore proposed and argued for; one which does not include any anomalous or net warming from greenhouse gases in the tropospheric atmospheres of any planetary body.https://www.researchgate.net/publication/324599511_Thermal_Enhancement_on_Planetary_Bodies_and_the_Relevance_of_the_Molar_Mass_Version_of_the_Ideal_Gas_Law_to_the_Null_Hypothesis_of_Climate_Change

  8. Pat from kerbob says:

    Cant you even spell correct in your pointless slurs?

  9. Pat from kerbob says:

    Entropic

    And the Ministry of Truth is definitely in your corner

    Roy Spencer is not one of those who are busily adjusting away past temperature excursions.

    You can only support your future beliefs by erasing the past.
    The truth is pretty much the opposite of everything you say, your comments are a good indication of what is not true.

    Orwell warned us about you.

    • bdgwx says:

      Maybe you didn’t know…UAH has had several revisions that have resulted in adjustments to the warming trend.

      • Richard Greene says:

        bdgwx
        UAH has had small adjustments never hidden from the public.

        NASA, NOAA and other global average temperature compilations have hundreds of “revisions” every week and some of them have been huge, over time — consider the -0.3 to -0.5 degree C. global cooling originally measured from 1940 to 1975… that has been “adjusted” away — from nearly no cooling, to about -0.1 degrees C. cooling in various compilations.

        That’s not adjusting, it’s junk science, and YOU love it.

        Claiming to know a global average before 1900 when there were very few land weather stations outside of the US, Europe and Australia, is nonsense.

        Claiming a global average temperature margin of error of
        +/- 0.1 degrees C. is nonsense when not one measurement instrument has such accuracy, not to mention the huge amount of infilling in the global average — wild guessing temperatures that can never be verified.

        The global average temperature before 1979 is not fit for real science.

        There has been warming since the Little Ice Age centuries — no one know exactly how much warming since the 1600s.

        After 1979, with the “competition” from UAH, the global average temperatures are worthy of real science.

        The CO2 numbers prior to 1958 are guesses based on ice core air bubbles — not high accuracy.

        • bdgwx says:

          UAH’s source code is hidden from the public.

          GISTEMP is open source. I run the code on my machine on a daily basis. I get the same result as NASA. I can see exactly what it is doing.

          Yes. I WANT institutions like NASA and UAH to correct for errors and biases. At least with NASA I can validate and replicate their results. I cannot do that with UAH.

          If you don’t a global mean temperature can be accurate to within 0.1C (or 0.05C for NASA) then you don’t understand how math works. I encourage you to study normal distributions and the standard error of the mean to get a brief introduction as to why even large individual sampling error is drastically reduced when performing a mean.

          The global mean temperature anomaly is known within ~0.15C for annual means and within ~0.08C for 5 year center means at 1900. But 1950 this drops to ~0.1C and and 0.07C respectively. And by 2000 it is ~0.06C and 0.05C respectively. There is no magical threshold around 1979 by which we all of sudden can know the GMST within a reasonable margin of error. In fact, we known the GMST in 1880 well enough to known that it warmed 1.26C +/- 0.12. https://tinyurl.com/yabz2w5m

          UAH continues to be an outlier relative other datasets by a wide margin. As of yet there is still no adequate explanation for this. This is partly because UAH is not open for examination so other scientists must try to reverse engineer or speculate. Maybe someday UAH will make there methods open for replications like NASA. Perhaps you can contact and Dr. Spencer and Dr. Christy and implore them to do so.

          • Richard Greene says:

            bdgwx sez:
            “GISTEMP is open source. I run the code on my machine on a daily basis.”

            YOU must be a riot at parties!

            Since you claim to be familiar with surface temperature numbers, why not tell us what percentage of them for the latest month are made up numbers = infilled?

            And how can anyone ever know if the made up numbers are even close to reality — they can never be verified.

            The lack of global coverage makes surface numbers a government bureaucrat guess.

            The UAH temperature numbers at least have the potential for accuracy, with their near global coverage, in a stable environment, where the greenhouse effect occurs.

            In the past, NASA has claimed record hot temperatures in surface grids in Africa where there were NO weather stations. They make up a number, and declare it to be a record?

            And you study those “data” every day?

            Don’t waste your time.

            Come here and cause trouble instead!

          • Svante says:

            The surface records have been verified against proxy data.
            There are seven statistical outliers, see fig. A2.
            https://agupubs.onlinelibrary.wiley.com/doi/full/10.1002/2013EF000216

          • Svante says:

            Surface records have been verified against proxy data.
            There are statistical outliers around 1940.

          • barry says:

            The data in the UAH record change near monthly, same as that for the other data sets.

            Some of the largest changes in data, at least in terms of trends after revision, have been in the satellite data sets, including UAH.

            If you’re going to nakedly barrack for your favourite science team, at least get the facts right.

          • Richard Greene says:

            UAH revisions have nothing even close to matching the gradual elimination of the cooling period from 1940 to 1975 in the surface global average temperature compilations.

            I’m still waiting for YOU, or ANYONE, to provide data on the percentage of infilled numbers (for any of the surface global average temperature compilations).

            Those of you who “worship” surface numbers appear to have no idea, or even care about the infilling.

            Climate proxies are only very rough guides to past temperatures — they can not verify surface temperature numbers, claimed to be +/- 0.1 degrees C. — they can only verify that surface temperature numbers are in the ballpark.

            Radiosonde temperature data can be useful — they support the UAH numbers, and contradict the average climate models.

            The temperature numbers from all sources after 1979 are similar.

            Temperature numbers before 1979, especially before World War II, are suspect, because of so much infilling, with no alternative satellite data to keep them honest.

            Temperature numbers before 1900 are wild guesses based on very few land weather stations outside of the US, Europe and Australia … and ocean temperature “measurements” using a very primitive bucket and thermometer methodology, mainly in Northern Hemisphere shipping lanes = poor global coverage.

            Temperature numbers before 1979 are not worthy of real science.

            I’m still waiting for your explanation of the high percentage of surface temperature numbers that are guessed by government bureaucrats, NOT based on real data from thermometers.

          • bdgwx says:

            RG,

            GISTEMP “infilling” is significant especially before 1960 where spatial sampling was sparse. Here is the paper explaining the “infilling” method and the answer to your question.

            https://tinyurl.com/yxdg8be6

            And here is the paper quantifying the sampling uncertainty that the sparseness of data creates.

            https://tinyurl.com/y68ku6q4

          • bdgwx says:

            RG said: UAH revisions have nothing even close to matching the gradual elimination of the cooling period from 1940 to 1975 in the surface global average temperature compilations.

            I don’t know what you’re talking about. The cooling trend from the 1940’s to 1970’s is pretty obvious in the GISS record among others.

            UAH adjusted the warming trend by -0.03C/decade when the v6 was released. It is my understanding that no new observations were processed in v6; only that the methodology of how those observations were processed changed.

            RG said: Those of you who worship surface numbers appear to have no idea, or even care about the infilling.

            We are well aware of it and it advantages and disadvantages. Note that some datasets like those provided by NOAA and Had.C.R.U.T do not attempt to “infill” the same way GISS does. As a result they underestimate the warming trend since the Arctic region is partially ignored by these analysis.

            RG said: Radiosonde temperature data can be useful they support the UAH numbers, and contradict the average climate models.

            No they don’t. https://tinyurl.com/y2ncoe9g

            RG said: The temperature numbers from all sources after 1979 are similar.

            No they aren’t. UAH is an outlier.

            RG said: Temperature numbers before 1979, especially before World War II, are suspect, because of so much infilling, with no alternative satellite data to keep them honest.

            Again…not all datasets employ the same “infilling” technique as GISS. I posted the GISS sampling error above so you can objectively quantify what “suspect” actually means.

            RG said: Temperature numbers before 1979 are not worthy of real science.

            The 5 year centered mean error in 1900, 1925, 1950, and 1975 is 0.055, 0.049, 0.054, and 0.027 respectively. What kind of uncertainty threshold do you consider “worthy of real science”? https://tinyurl.com/y2qr4hk4

          • barry says:

            Richard, you’re a political hack trying to do science. You get the basics wrong.

            “…the gradual elimination of the cooling period from 1940 to 1975 in the surface global average temperature compilations.”

            The various data sets have had the same period with a flat or very slightly negative trend for years and years. That has barely moved.

            We can compare Had.CRU3 with Had.CRU4 to see how much change there has been for that period with data revisions.

            https://tinyurl.com/y6l25cyl

            Had.CRU3 trend 1940-1975 = -0.016 C/decade
            Had.CRU4 trend 1940-1975 = -0.028 C/decade

            Contrary to your assertion, the Met Office global temp data revision from version 3 to 4 resulted in a steeper negative trtend for the period you specified.

            We can look at some other data sets:

            https://tinyurl.com/y2fpw5mv

            GISS = -0.018 C/decade
            BEST = -0.014 C/decade

            Current GISS has a steeper negative trend now than did Had.CRU3. BEST trend is different from Had.CRU3 by a whopping + 2 thousandths of a degree per decade. And this data set is compiled by skeptics.

            “I’m still waiting for YOU, or ANYONE, to provide data on the percentage of infilled numbers (for any of the surface global average temperature compilations).”

            This question makes no sense. What are you asking for?

            You can get a percentage of land coverage for GISS stations here, simple graphs near the bottom of the page:

            https://data.giss.nasa.gov/gistemp/history/

            Why don’t you research the subject yourself instead of demanding others do it for you? You obviously need to do this work before you continue here.

            “Radiosonde temperature data can be useful they support the UAH numbers, and contradict the average climate models.”

            The radionde data has poorer coverage than surface data. The sonde network for global temperature is 800-900 balloons daily. The global network of weather stations is +6000. That doesn’t include the sea surface temp measurements.

            Look, it’s obvious you only want people to provide you with information so you can think of something to say to discredit it. You would be better served researching the methodologies for the the surface temperature sets, as well as for the satellite data, which has its own challenges no less problematic than the surface temps.

            That’s all the help you’ll be getting from me.

          • Svante says:

            Richard Greene says:

            Climate proxies are only very rough guides to past temperatures – they can not verify surface temperature numbers, claimed to be +/- 0.1 degrees C. – they can only verify that surface temperature numbers are in the ballpark.

            Look again, the trends are the same.

          • Geoff Sherrington says:

            bdgwx,
            Then it should be a snap for you to reveal this important part of daily global temperature estimates. How far apart must two temperatures in different places be, so that it can be sad with confidence that one is higher than the other and not so close that their envelopes of uncertainty overlap.
            I have been asking this question of out BOM for 6 years now and they still have not provided an answer, other than to refer me to official sources of definitions and terms and to say they have studies in progress to answer this question at a future date, unspecified.
            So, what is the simplest answer you can give for the GISTEMP methodology?
            Numerical uncertainty is a concept that is nearly as important as a number itself.
            There is widespread abuse of concepts like the law of large numbers, the central limit theorem, averaging of numbers too different to be lumped together and more. It is unacceptable to state that the global average near surface atmospheric temperature is known to better than 0.1 degrees Celsius. A correct estmate would be around ten times that for customary observations taken before year 2000.
            Why is there such intense effort to hide this realism?
            Geoff S

          • Svante says:

            Here’s the BEST method by Judith Curry et al.:
            http://static.berkeleyearth.org/papers/Methods-GIGS-1-103.pdf

          • Nate says:

            Geoff,

            Are you suggesting, without evidence, that Climate Scientists are making elementary statistics mistakes in their calculation of uncertainties?

            Are you suggesting that they are unaware of correlations in temperature from place to place? And you think they simply calculate error of the mean by err/sqrt(N)?

            It would be convenient if they made such basic errors.

            Sorry, they are not that ignorant.

          • bdgwx says:

            Geoff,

            The 95% CI on the conventional surface datasets is about 0.05C for annual means post WWII. Each dataset publishes something different obviously, but they’re all this ballpark.

            The simplest answer I can give for the GISTEMP methodology is to refer back to their official publication I posted above.

    • Bindidon says:

      Pat from kerbob

      You seem to be blind on the ‘right’ eye…

      FYI: a comparison of the differences between
      – UAH6.0 and UAH5.6
      – RSS4.0 and RSS3.3

      https://drive.google.com/file/d/1xVNr2ry4ozSCYh49MpfLoH7Twx7C2HLP/view

      J.-P. D.

      • Richard Greene says:

        Time to look at some REAL differences.

        Consider what authorities said in the mid-1970s about the 1940s to 1970s global cooling … enough cooling was being reported to make mainstream media articles predicting a coming global cooling crisis seem reasonable:
        http://elonionbloggle.blogspot.com/2021/01/there-used-to-be-lot-of-global-cooling.html

        … but now most of that 1940 to 1975 global cooling has been “adjusted” away. I suppose people in the 1970s couldn’t read temperature data? Or maybe that global cooling, while CO2 levels were rising over that 35 year period, didn’t fit the coming global warming crisis narrative?

        The climate is whatever government bureaucrats tell you it ism and they will change climate history any time they want to.

        The future climate NEVER changes — always a coming global warming crisis. We’ve been hearing that, with a few exceptions in the 1970s, for 50 years.

        Funny that the (real) past climate keeps changing, but the (imagined) future climate is always the same.

        A symptom of junk science!

  10. Entropic man says:

    “Orwell warned us about you. ”

    The Ministry of Truth dealt in propganda, like the recent climate change flyers. They were written for a politician who would have felt right at home in Airstrip One.

    Orwell was warning against your kind, not mine.

  11. Frank kocsis says:

    Dear Mr. Dr. Spencer, I´d like to attend the virtual event on next Tuesday. I contact you from Germany, and please, may I ask the silly question: What would be time in Germany (GMT+1) at 7pm “Montain-Time”? Another question: When will your new book published, and where could I order it?

    Your presentation (no climate crisis) in February last year in Pasadena has been translated to German, and is very successful in our conservative “circles”. We need urgently such presentations for “ordinary Joe” (Otto Normalbürger). So the 10 flyers should also be visualised in presentations (one picture tells more than 1000 words).

    Many THX in advance.

  12. S.K.Dodsland says:

    To Dr. Roy Spencer,

    Has there ever been an experiment quantifying co2 climate sensitivity.

      • Richard Greene says:

        All “studies” on TCS and ECS are speculations.

        No one knows what TCS and ECS are, and we may never know the right answers in our lifetimes.

        The best that honest scientists can do is to consider all measured warming since 1940 (but global average temperature data before 1979 are not very accurate), the rise in CO2 since 1940 (not very accurate before 1958) and then ASSUME a worst case that CO2, and only CO2, caused 100% of the global warming since 1940.

        That worst case estimate would be that a doubling of CO2 causes about a +1 degree C. global warming, assuming the temperature is ONLY affected by CO2, and there is no known feedback effect (even the direction of any feedback is not known).

        Rather than doing such a calculation, and calling them a “study”, to get a rough worst case estimate, it would be easier to make these assumptions:

        (1)
        CO2 is a mild greenhouse gas in closed system lab experiments, using artificially dried air, expected to cause mild global warming in the atmosphere.

        The atmosphere includes the primary greenhouse gas, water vapor, which partially overlaps the greenpouse effects expected from CO2

        (2)
        There has been intermittent mild global warming in the atmosphere since the additions of man made CO2 accelerated after 1940

        (3)
        Adding man made CO2 to the atmosphere probably caused some of the warming after 1940 … but such temperature changes have happened before, without any additions of man made CO2, so the cause(s) of the global warming after 1940 (actually no warming from 1949 to 1975) can not be known.

      • Gordon Robertson says:

        entropic…. “This should get you started”.

        The usual circle of alarmist idiots.

  13. Entropic man says:

    S.K.Dodsland

    “That is not experimental evidence that is just more IPCC propaganda. ”

    Thank you for establishing your climate change denier credentials so quickly. It saves wasting more time on you.

    • S.K.Dodsland says:

      And likewise.

      • Clint R says:

        Correct, S.K.Dodsland.

        The IPCC, and Ent, are both anti-science.

        • S.K.Dodsland says:

          Any individual or organization that believes co2 impacts the climate and believes they have the ability to predict the climate are the science deniers.

          There are three basic principles:

          1. Climate science is in its absolute infancy and the science community has little or no data on or understanding of the 24 processes that impact our climate.

          2. The climate so incredibly complex it is impossible to model or predict.

          3. The inherent complexity ensures the climate will always be changing and nothing man does impacts.

          In less political times a trace gas like co2 which is minute part (0.04%)of atmospheric composition which is just one of 24 systems would not even be mentioned.

          • bdgwx says:

            1. Climate change has been studied since the 1800’s.

            2. There are energy budget models, radiative transfer models, statistical models, global circulation models, etc. Not only is it not impossible, they actually perform reasonable well. Review Hausfather 2020 for a review how well even the primitive models from the 70’s and 80’s have performed.

            3. Yes. Climate always changes and does so for a reason. The goal is to enumerate and quantify the causes and predict which ones are in play today.

            In 1815 Mount Tambora erupted and lofted 100 MtSO2 into the upper atmosphere. That is 0.02 ppm (0.000002 %). It caused the year without a summer. Humans have pumped 6500x that amount of CO2 into the atmosphere.

            If you have questions about what evidence is available please ask.

            BTW…How much of that Sherwood et al 2020 paper in regards to your question regarding climate sensitivity did you get to review? Did you make through any of the 400 citations?

          • Clint R says:

            1. bdgwx is an anonymous troll, willing to pervert reality to promote his anti-science nonsense.

            2. He won’t address the fact that the “Energy Imbalance” is nonsense. He continues to try to preach it.

            3. He won’t clean up his messes where he misrepresents others.

          • gbaikie says:

            1. Climate change has been studied since the 1800’s.
            Yes, it was known earlier that Gulf Stream warms Europe.
            If European feel that average temperature of about 9 C is
            too warm, inhibiting the Gulf Stream could done, and they could live with lower average temperature.
            But they tend vacation in the summer, in warmer regions, which indicates they like having warmer weather.

            And I think the world in general is tired of Europeans doing ineffective favors for them.
            But I think the few which got the indoor plumbing, should be forever grateful.
            Also earlier on, it was know the southern hemisphere was about 1 C cooler than northern Hemisphere and by 1900’s it known earth {or at least northern hemisphere] was warming. And of course that we were living in the warmer part of an Ice Age. And they wondered why we had glaciation and interglacial periods. Which other than aligning fairly well with Milankovitch cycles, still don’t know. But it’s not from varying CO2 levels, that has been disproven, despite Al Gore lying about it and force feeding his propaganda to school children.

  14. Adelaida says:

    Dr. Spencer, I repeat my previous message with the emphasis that I feel is necessary: ​​Adding !!!

    I hope your live talk and question session on the 19th is great !!!

    And have a great success with your new book !!!

    My best regards!!!

  15. S.K.Dodsland says:

    bdgwx says:

    The UN/IPCC has never produced an experiment that quantifies co2 climate sensitivity because traces gas like co2 and SO2 do not impact the climate but particulate matter from volcanoes do. The reason particulate matter has an impact is because it blocks solar radiation from reaching the earth just like clouds.

    Dr.Ross Mckitrick has revealed how inaccurate the IPCC’s models are and just recently did an in-depth study of the Integrated Assessment Models and determined them to be highly inaccurate.

    Check out Heartland Institutes climate change webpage to learn how inaccurate the IPCC’s temperature models are.

    2 ppm is not 2 one hundred thousands of a percent it is 2 one ten thousands of a percent.

    The atmospheric co2 level has been as high as 8000 ppm and man’s contribution is less than 5% of the present day level.

    • Rob says:

      “2 ppm is not 2 one hundred thousands of a percent it is 2 one ten thousands of a percent.”

      Why did you change BOTH numbers from his comment?

      He said 0.02 ppm, not 2 ppm.

      He said 0.000002%, which is 2 MILLIONTHS of a percent, not “2 one hundred thousands of a percent”.

      His statement, unaltered by you, is absolutely correct.

      Is your only way of combatting an argument to first alter the argument you are trying to combat? I believe there is a name for that … straw man.

    • Richard Greene says:

      With the one exception of the Russian INM model, the so-called climate models are nothing more than nearly worthless computer games.

      When back tested, they do not “predict” the 1910 to 1940 warming. Note: I don’t trust temperature numbers before 1979, especially before 1940, because of sparse global coverage. So the claimed warming could be wrong.

      The computer models, when back tested, do not predict cooling from 1940 to 1975. That cooling is gradually being “adjusted” away by government bureaucrats so the models look better!

      The cooling from 1940 to 1975 is blamed on air pollution (aka aerosols) blocking sunlight, but that is nonsense, because the air pollution did not fall out of the sky in 1975, allowing a warming trend to begin.

      In fact, air pollution was gradually reduced from 1975 to 2000, although it increased in many Asian cities after 2000.

      Based on their performance since 1975, climate models, on average, predict double the actual global warming, excluding the Russian INM model that seems to do a good job.

      Predicting double actual warming is STRONG evidence that the warming effect of CO2, which is unknown, is being over estimated in the climate models.

      Our planet existed for 4.5 billion years with no evidence that CO2 levels ever “controlled” the climate.

      The claim that CO2 levels “control” the climate since 1975 is an assertion, not a proven fact, and is not even logical. The lack of warming from 1940 to 1975, and from 2003 to mid-2015, while CO2 levels rose (especially fast from 2003 to mid-2015) shows that CO2 is NOT the sole “climate controller.

      It is just one variable involved in climate change.

      Fortunately, adding CO2 to the atmosphere, when using modern pollution controls, is good news. Plant growth is increases, while their fresh water requirements are reduced. There are thousands of experiments to prove that. Not to mention the experience of greenhouse owners.

      The warming since 1979, when measured more accurately with satellites, has been mainly in the northern half of the Northern Hemisphere, mainly during the coldest six months of the year, and mainly at night. Think of warmer winter nights in Siberia, Russia.

      That is a great time and location for a slightly warmer climate!

      Mild global warming since 1979 has been 100% good news.

      There is a logical reason to claim that global warming will continue, but no logical reason to claim it will be bad news, or even a problem.

      The (false) claim of a coming “existential” climate crisis an attempt to scare people into giving their government absolute power over their energy use. As if governments had not already seized enough power over our lives in 2020.

      The current political goal of replacing inexpensive, reliable electric power sources, with more expensive, intermittent electric power sources, is just the type of idiotic idea one would expect from politicians.

      Claiming that the effect of CO2 is known, and 50 years of claiming a climate crisis is coming, is junk science.

      Claiming that CO2 is probably responsible for some global warming, and observing that the global warming in the past 300 years has been beneficial, is real science.

      • Rob says:

        As most aerosols are rained out after two weeks, the negative effect of aerosols on temperature is (roughly speaking) a function of how much has been emitted in the past two weeks.

        If we had not been burning fossil fuels, and started doing so right now, the initial effect would be a drop in temperature. The amount of CO2 emitted in one year is nowhere near enough to outweigh the cooling effect of aerosols coming from the same fossil fuels. But unlike aerosols, CO2 is not completely removed from the atmosphere in the short term by natural processes. It accumulates.

        After the war, the burning of fossil fuels skyrocketed. The immediate effect was cooling, due to the immediate and strong effect of increased aerosol concentrations. It took 30 years for the cumulative increases in CO2 to overtake the immediate effect of increased fossil fuels.

        And as you stated, aerosol concentrations decreased from roughly the mid 70s, due mainly to the implementation of clean air acts in various countries, amplifying the effect. And you even gave a possible reason for the “pause”, with China increasing the burning of fossil fuels after 2000, causing another mini-surge in aerosols and requiring another stretch of time before the tortoise (the slow but steady accumulation of CO2 in the atmosphere) could up with the initially-fast-but-now-sleeping hare.

        You provided all the necessary evidence, but you had already pre-determined what the conclusion was going to be, so were incapable of drawing the correct conclusion from the evidence.

        • Richard Greene says:

          Thank you (not a) perfesser Rob

          The huge, repeated revisions to the initially measured cooling from 1940 to 1975 are real, not in my imagination.

          The burning of fossil fuels does cause aerosol pollution DEPENDING on the use of pollution controls. The lack of polluytion controls allowed air pollution to increase, probably peaking in the 1970;s. The increased use of pollution controls reduced aerosols for the next 25 years.

          So according to your “conventional” theory, aerosols were so severe from 1940 to 1975 they blocked so much sunlight that the planet had global cooling … overwhelming the alleged warming effect of CO2.

          And then SUDDENLY, in 1975, aerosols were so quickly reduced after that the global cooling IMMEDIATELY ended — global cooling from aerosols reversed to global warming from CO2.

          How can anyone with sense believe that?

          • Rob says:

            It did not suddenly get warmer in 1975. 1975 was only the 12th warmest year in the 20 years 1956-1975. In other words, below average for that period. And 1976 was even colder – it was the second coldest year in the 20 years 1957-1976, tied with two other years.

          • bdgwx says:

            RG,

            Aerosol forcing increased rapidly from about WWII to 1980 before leveling out. It from 0.25-0.50 W/m^2 to about 1.00-1.50 W/m^2. Unfortunately the forcing has a significantly larger uncertainty envelope for aerosols as compared to GHGs, but it is narrow enough to conclude that the rapid expansion of aerosols significantly offset the GHG forcing during this era. Its kind of a catch-22. Cleaning up aerosol pollution removes the negative forcing and leads to yet more warming. I think you and I both can find common ground on the fact that we need better aerosol tracking. That’s something scientists have been requesting for decades. It seems to be falling on deaf ears though. BTW…I don’t think any of this is as controversial as you are insinuating though. Even vocal AGW skeptics like Lindzen, Curry, Spencer, etc. all agree on these points…more or less anyway.

        • timothy Goldstein says:

          Complete rubbish. Coal use was flat after WW2, so aerosols were not the reason for the cooling. That is another alarmist myth.

    • bdgwx says:

      What Rob said. Also, SO2 is the precursor that forms the aerosols that blocks solar radiation. Let me know if you’d like links to literature regarding Tambora, how it effected the climate, and even how our models can explain the effects with reasonable skill.

      See Dr. Hausfather’s 2020 State of The Climate for up-to-date CMIP5 and CMIP6 outputs vs observations. https://tinyurl.com/y35gbkkp Make sure you review the scorecard for the 70’s and 80’s era models as well. https://tinyurl.com/y38ooxer

      Humans are responsible for nearly 100% of the increase from 280 to 410 ppm. That means humans are the cause of ~30% of the total carbon mass in the atmosphere.

      • Clint R says:

        Sorry bdgwx, but your beliefs and “papers” ain’t science.

        REAL science proves your nonsense is invalid. Your so-called “energy imbalance” is pure nonsense. You can’t add/subtract/average flux. Flux can NOT be treated as energy.

        Norman fell on his sword when he claimed that an object absorbing 900 W/m^2, and emitting an average of 180 W/m^2, was increasing in temperature because it had an “energy imbalance” of 720 W/m^2. WRONG! There was no “energy imbalance”. It was emitting the SAME energy as it was absorbing. It had a “flux imbalance”, which is meaningless.

        That’s the same mistake being made by you and all others that try to pervert science.

        • Rob says:

          Rather than making unsupported assertions, how about explaining why “flux imbalance” is meaningless, and why 720W/m^2 in and 180W/m^2 out is not an imbalance resulting in warming. All of your comments appear to consist of these unsubstantiated assertions mixed with needless insults. You claim an association with “real science” yet you seem to believe in science by assertion.

          • Clint R says:

            Rob, a cone shaped black body, with its based aimed at the sun would be absorbing 900 W/m^2 (at the right distance from Sun), and emitting 180W/m^2. The surface area of the base is 1 square meter, and the remaining surface area is 4 square meters. The equilibrium temperature is 237 K.

            The “flux imbalance” is 720 W/m, incoming, yet the body is NOT increasing in temperature.

            “Flux imbalance” is NOT “energy imbalance”..

            Making false accusations like, “All of your comments appear to consist of these unsubstantiated assertions mixed with needless insults.”, is what idiots do. You don’t want to be an idiot, do you?

          • Rob says:

            Why did you calculate fluxes over two different surfaces? That 900 W/m^2 is the flux at the base. Assuming no incoming energy at the curved surface, when averaged over the entire surface of the cone, the flux is 180 W/m^2, and you have equilibrium. That is precisely what is done in climate calculations. Everyone knows that the fluxes used in whole-earth calculations are averages over the entire surface of the earth. Everyone but you apparently.

            You couldn’t stop the needless insults. It didn’t help your understand of flux calculations, did it.

          • Richard Greene says:

            CLIMATE (non)SCIENCE BY ASSERTION:

            We know the global average temperature in the 1800s and earlier ( even 1900 to 1979 numbers are very rough )

            CO2 controls the climate

            CO2 doubling causes +3 degrees C. warming +/- 50%

            A climate crisis is in progress

            +1.5 degrees C. is an important temperature target

            Over +2.0 degrees C. will be a climate emergency

            The “pre-industrial” climate was “perfect”, and any deviations are bad news

            CLIMATE REALITY:
            — No one knows what a “perfect” climate is.

            — The current climate, however, is BETTER than the pre-industrial climate!

            — CO2 acts as a greenhouse gas in a laboratory, so CO2 may be responsible for some global warming, amount unknown

            — Added CO2 in the atmosphere benefits plant growth and reduces their fresh water use too. People who are anti-CO2 are anti-life.

            — Global warming since 1979 has been mainly in colder areas, mainly during the colder months of the year, and mainly at night = good news

            — There is no climate emergency.

            — After over 300 years of intermittent global warming, possibly up +2 degrees C. already, which was 100% good news, the claim that continued mild global warming will be 100% bad news, is an unjustified claim — just climate scaremongering.

            — Replacing fossil fueled electricity generation with renewable energy sources will be very expensive, and will create intermittent electric power, requiring up to 100% fossil fueled back up. Use of batteries for back-up would be much more expensive.

            — With about one billion people in the world with no electricity, climate alarmists want to spend HUGE amounts of money on THEMSELVES, replacing a reliable electric grid with a more expensive, unreliable electric grid. But of course the huge demand for batteries, solar panels and wind turbines will create lots of HORRIBLE, dangerous mining jobs in Africa, with terrible working conditions and lots of pollution.

            — The Green New Deal would require the greatest expansion of mining and manufacturing in human history … powered by fossil fuels! (= even more cO2 in the atmosphere).

          • Clint R says:

            Good points, Richard Greene.

            I would add:

            — No one knows what the “perfect” sea level is supposed to be.

            We know sea levels have varied by over 100 meters, but they are suddenly concerned about a few centimeters that may not even be happening?

          • Clint R says:

            Rob, you couldn’t understand it, until I explained it to you. So don’t act like you’re somehow an expert.

            And, I did NOT “calculate fluxes over two different surfaces”. The incoming only strikes one surface. The outgoing is the same for ALL surfaces.

            Fluxes from differing surfaces can’t be averaged. As an example, a flat plate has one side with emissivity 1.0, and area of 1 sq. m. The other side is also 1 sq. m. and emissivity of 0.5. The side with the higher emissivity is receiving 1500 W/m^2. At equilibrium one side is emitting 1000 W/m^2, and the other side is emitting 500 W/m^2. The average flux is then 750 W/m^2. 750 corresponds to a temperature of 339K, but the surfaces are at 364K, a 25 K error.

            Another example, one surface has a temperature of 400K. Another surface has a temperature of 350K. The emitted fluxes are 290 W/m^2 and 280 W/m^2. The average flux is 285 W/m^2, but that corresponds to a temperature of 266 K, a 9K error.

            If you’re interested in REAL science, you should be asking what the margin of error is for the supposed “0.8 W/m^2 energy imbalance”.

          • Rob says:

            RG – Given that all of your claims there are unsubstantiated assertions, to be consistent the second group should be labelled “CLIMATE DENIAL BY ASSERTION”.

            Do you even understand that a bald claim IS an assertion? In fact, your two headings should be “THINGS I CHOOSE NOT TO BELIEVE” and “THINGS I CHOOSE TO BELIEVE”.

          • Rob says:

            ClintR

            Yes, if your surfaces have different emissivities then you need a weighted average of the fluxes.

            Your statement “750 corresponds to a temperature of 339K” is utter nonsense. Why would the temperature of an object be determined only by emitted energy, and not also by energy received?

            The same goes for your second example. How can an object that is only emitting energy at a given rate, without receiving any energy, have a corresponding non-zero equilibrium temperature? Just nonsense.

          • Clint R says:

            Rob, you should have at least a rudimentary understanding of the S/B Law, before trying to find ways to pervert my examples.

          • Rob says:

            Stefan-Boltmann does not permit an object that is receiving no energy and steadily emitting energy to have a non-zero equilibrium energy. It is you who doesn’t understand the law.

            Note – I said equilibrium temperature.

            The fact that you think averaging a non-linear function of flux (temperature) and not getting the same as that function of the average flux means that “you can’t average flux” is telling.

          • Clint R says:

            As I said Rob, you should have at least a rudimentary understanding of the S/B Law, before trying to find ways to pervert my examples.

            PS It’s “Boltzmann”.

          • Rob says:

            All you can do is restate your false assertion, and comment on a typo with the implication that this somehow proves that I don’t understand the law.

            You pretend that in the S-B law it is emitted radiation which determines the temperature of the body, when it is the temperature of the body that determines emitted radiation. From this assumption, you basically conclude that if you start out with a given outgoing flux, the temperature can’t change because the outgoing flux will remain constant.

            In summary your claim is:
            No change in temperature => No change in outgoing flux => No change in temperature
            … a circular argument.

            Tell me – what do you actually believes causes the temperature of a body to change?

          • Clint R says:

            Sorry Rob, but I recognize all the techniques — the false accusations, confused physics, random directions, twisting and distorting.

            I have no interest in typing contests with idiots.

            But feel free to abuse your keyboard as much as you desire.

          • Rob says:

            Of course you recognize them. You have adopted them. Nothing to do with me though.
            Anyway, go away and fine tune your little story to fill in the holes you created for yourself.

        • Norman says:

          ClintR

          I need to correct you. Your problem did not specify anything to suggest you are dealing with a cone. You just said a blackbody floating in space, no specifications on shape.

          I was just as correct as you since the shape could be anything and there could easily be an energy imbalance in your wording.

          And radiant flux is Watts! It is energy per second not area. What you describe is flux density. You use science terms too loosely, which can happen on a blog, but once pointed out you should try to be more precise with your terms. Everyone makes mistakes, will you correct yours?

      • timothy Goldstein says:

        Aerosols were also produced by burning coal from 1910 to 1940. According to the ‘blocks solar radiation’ theory, that should have produced cooling, right?
        Only problem is that temperatures rose during that period.
        But then, for some strange reason, the aerosols produced AFTER 1940 did produce cooling!
        So aerosols produced from 1910 to 1940 caused warming, but the aerosols produced from 1940 to 1970 caused cooling?
        I wonder how that works.

        • bdgwx says:

          Anthroprogenic aerosol radiative forcing went from 0 W/m^2 to about -0.5 W/m^2 from 1850 to 1945. It then rapidly tripled in the next 35 years or so before leveling off. And remember, warming/cooling is a product of the net of ALL radiative forcing agents both positive and negative. The planet can still warm/cool even though one particular agent yields a negative/positive force because other factors are in play that can and do tip the net towards positive/negative.

  16. E. Schaffer says:

    @Roy Spencer

    I stumbled over something that I would like to ask your opinion on. The LW CF (long wafe cloud forcing, more accurate LWCRE) is derived from a simple formula. It is the difference between clear sky emissions and average emissions (average would then include all the different grades of cloudiness).

    LW CF=OLRc−OLR

    Although it looks perfectly logical, I have come to find it is not! It is like defining the size of an ice berg just by what you see reaching out of the water. Let us say the emission layer was at 5.000m due to GHGs and a cloud would moved it up by another 1.000 to 6.000m. At 6.000m it will be somewhat colder and looking down on Earth (with a satellite), you will detect less emissions where this cloud is, and attribute it to LW CF.

    However if there were no GHGs, the cloud would move the emission layer visibly from 0m altitude to 6.000m, thereby suggesting a 6times stronger LW CF. Both effects, of clouds and GHGs, are largely overlapped. Given the above formula, this overlapped component is attributed to GHGs in its entirity. There is no logical justification for that, rather it is an arbitrary choice. It is equally justified to attribute it to clouds only..

    I have no solution on how to allocate causation within a redundant system, but certainly you cannot do it by choice. Assessing LW CF this way must come with a huge margin of error, severly undererstimating it. I need to suggest, given the named problem, satellite measurements of LW CF are actually useless, unless there is a solution to it.

    There is yet another way to adress the CRE, which is simply looking at weather records and the relation between cloudiness and temperatures. I have done so and it clearly suggests a positive NFC, or a LW CF that exceeds SW CF.

    https://notrickszone.com/2020/09/11/austrian-analyst-things-with-greenhouse-effect-ghe-arent-adding-up-something-totally-wrong/

  17. S.K.Dodsland says:

    To Richard Greene,

    Your summary of climate science was excellent and I agree with just about everything you wrote except the line that co2 acts as GHG in the laboratory.I have read a number of articles and watched a few video refuting that claim so I would appreciate if you could provide a link to the experiment. Thanks.

    “The greenhouse effect inside of greenhouses is due to the blockage of convection heat transfer with the environment and it is not related, neither obeys, to any kind of trapped radiation. Therefore, the greenhouse effect does not exist as it is described in many didactic books and articles.”
    https://principia-scientific.com/publications/Experiment_on_Greenhouse_Effect.pdf

    Greenhouse Gas? The Two Bottles Experiment Explained | Principia Scientific Intl. (principia-scientific.com)

    https://principia-scientific.com/publications/PSI_Miatello_Refutation_GHE.pdf

    https://principia-scientific.com/publications/Butina-Virual-vs-Reality.pdf

    https://principia-scientific.com/publications/Reynen-CO2.pdf

    https://principia-scientific.com/wp-content/uploads/2019/11/Postma-Nov-26-2019.pdf

    https://principia-scientific.com/?s=greenhouse+effect

    Sent with ProtonMail Secure Email.

    • Rob says:

      Please address the following reply by me to your stupid comment:
      https://tinyurl.com/reply-to-dumb-comment

      • S.K.Dodsland says:

        There seems to be far more scientists questioning the GHG Effect and the IPCC’s co2 climate sensitivity value than there are supporting them.

        https://notrickszone.com/2019/12/12/the-list-grows-now-100-scientific-papers-assert-co2-has-a-minuscule-effect-on-the-climate/

        http://petitionproject.org/

        https://notrickszone.com/2020/02/13/physics-professor-co2s-0-5c-impact-after-rising-to-700-ppm-is-so-negligible-its-effectively-unmeasurable/

        And there is more where that came from if you’re interested.

        • Rob says:

          Did you even read the comment I linked to? Your reply has absolutely nothing to do with my comment. Unless you reference my comment, I will have to assume that you recognize your mistake and are too cowardly to admit to it.

        • bdgwx says:

          No one seriously challenges the GHE. It was widely accepted even in the 1800’s. And even most skeptical leaning 2xCO2 climate sensitivity estimates fall within the IPCC range now. This includes sensitivities published or mentioned by Dr. Spencer, Dr. Lindzen, Dr. Curry, and Dr. Happer who was the author of one of the recent controversial flyers. You’ll definitely still be able to find the fringe stuff if you look hard enough, but that’s par for the course in any scientific discipline. PSI and NTZ are not reputable sources…be careful.

          • S.K.Dodsland says:

            There still is no experimental evidence quantifying co2 climate sensitivity.

            The UN/IPCC is a political organization that has ignored the research of the CRU from day 1, created SFP’s that are sheer nonsense and have zero credibility

            The IPCC has created a black box around the AGW, has inserted climate alarmists in the science journals destroying the peer review process and has refused to publicly debate climate science.

            A court in Canada ruled against Mann in his lawsuit against Dr. Ball and in so doing invalidated the hockeystick graph. Scientists that study tree rings claim tree ring width is not an accurate method of measuring co2 and there is proof co2 rises before the global temperature. In other words the UN/IPCC’s AGW has been totally invalidated has destroyed their credibility.

          • bdgwx says:

            No. Canadian courts did not rule against Mann.

            1. The case # is VLC-S-S-111913 filed in British Columbia.

            2. There are 3 defendants in the case: Tim Ball, Frontier Centre for Public Policy, and an unnamed party.

            3. The FCPP already settled with Mann (https://tinyurl.com/yy8y3996).

            4. The judged dismissed Mann’s case against Ball. He did not rule in favor of Ball or against Mann on the merits of the case. The dismissal was related to the length of time the case had been open, Mann initiated delays, Ball’s health, and the fact that many of his character witnesses had passed away. BTW…I feel the judge made the right decision here.

            5. The case is still open.

            6. I encourage you to read the court documents in this case. The Principia Scientific International site (which you linked to) is actually linked to the court case via the site owner John O’Sullivan. It turns out that O’Sullivan has a rather questionable history at best. Fair warning…the court documents in this regard in the Mann case are so offensive I do not recommend reading them while at work or from a computer in which you’d be embarrassed or disciplined for reading the materials.

    • Bindidon says:

      S.K.Dodsland

      Oh! How nice!

      Somebody seems to believe no one here knows about ‘Principia-Pseudoscientific’ and Gosselin’s TricksZone… why not to add some links to ‘iceage.info’ ?

      The best is to refer here to the insult specialist Joseph Postma.

      And when I read such nonsense as

      ” There seems to be far more scientists questioning the GHG Effect and the IPCC’s co2 climate sensitivity value than there are supporting them. ”

      I get a big, big laugh.

      Even a Superskeptic like Willis Eschenbach would explain you how GHE works (he did that in 2011 already at WUWT, together with Ferdinand Engelbeen).

      And, last not least: who is the one who would have the least problems to do? It is, should you not be aware of that yet… Roy Spencer.

      J.-P. D.

    • Richard Greene says:

      The greenhouse effect was discovered in the 1800s.

      The name “greenhouse effect” is somewhat misleading, since the it has nothing to do with actual greenhouses where plants are grown.

      I always find it amusing that greenhouse owners add CO2 to the air inside their greenhouses to make their plants grow faster, larger, with less fresh water too.

      For them, the ‘inside the greenhouse effect’ is the beneficial addition of CO2 … while the climate alarmists can’t seem to find any good news from adding CO2 to the atmosphere. (There are only thousands of scientific studies showing how much added CO2 in the atmosphere benefits plants).

      The infrared spectroscopy lab studies show that CO2 in the atmosphere should disrupt the ability of our planet to cool itself. It’s actual effect in the atmosphere can’t be measured. The lab experiments suggest a mild, harmless effect even with the overlapping effect of the primary greenhouse gas, water vapor.

      To create a climate “crisis”, climate alarmists invented a “water vapor positive feedback” effect, that they claim will triple the warming effect they expect from CO2 alone.

      That theory makes no sense.

      There is no evidence of a positive feedback in satellite temperature data. There is no evidence of a “hot spot” over the tropics, that would be a symptom of a water vapor positive feedback. If there really was any positive feedback, at all, there would have been runaway global warming long ago, when CO2 levels in the atmosphere were much higher than today. Runaway warming in the past would mean that none of us would be alive today to debate the effects of CO2.

      There is no evidence in the 4.5 billion years BEFORE the twentieth century that changes in CO2 levels ever caused changes in global average temperatures.

      The two climate alarmist theories:
      (1)
      man made CO2 “controls” the climate, and
      (2)
      the imaginary “water vapor positive feedback” tripling the warming effect of CO2 alone,
      are both recent theories that contradict 4.5 billion years of climate history … up to the 1970s.

      • bdgwx says:

        RG said: There is no evidence in the 4.5 billion years BEFORE the twentieth century that changes in CO2 levels ever caused changes in global average temperatures.

        There is evidence…literally. Was this just a poorly worded off-the-cuff remark? Do you actually mean that you just don’t accept the evidence?

        RG said: are both recent theories

        The WV feedback isn’t imaginary nor is our understanding of it recent. Scientists knew of it in the 1800’s. For example, See Arrhenius 1896.

        • Richard Greene says:

          If there was a positive feedback to CO2 warming, then we would have had runaway warming when CO2 levels were MUCH higher than today — up to 7,000 to 8,000 ppm according to geologists.

          That runaway warming would have ended life on this planet long ago. That did not happen. Therefore the theory of water vapor positive feedback is speculation that you climate alarmists love … because without that unproven theory, increasing CO2 in the atmosphere is harmless (actually beneficial) … as it has been for over 100 years.

          You leftists can not be happy without imagining a coming catastrophe that you will “magically” prevent. It is a mental illness to participate in (the past 50+ years of) global warming scaremongering … as our planet’s climate keeps improving for humans, animals and plants.

          • bdgwx says:

            I think you have me confused with someone else. I’m not a “leftist” nor do I think a catastrophe is imminent. I also do not participate in global warming scaremongering whatever that may mean exactly.

            Anyway, It is important to understand that the WV feedback does not feedback on itself. In this regard it is probably more intuitive to think of WV as an amplifier. It will amplify a temperature change that was induced or catalyzed by some other agent, but it will not induce or catalyze a change all on its own. The primary reason is because H2O is a condensing gas.

            Not only can H2O cannot cause a runaway warming effect, but no GHG actually can CO2 or otherwise. The reason is very complex. I recommend reading up on the Komabayashi-Ingersoll and Simpson-Nakajima limits.

            BTW…the last time CO2 was 7000 ppm the Sun was 6% dimmer. Relative to today the radiative forcing is +15 W/m^2 and -15 W/m^2 respectively. It is kind of interesting that the CO2 and solar forcing roughly offset each other.

      • S.K.Dodsland says:

        Thank you for the information.

        I believe what is driving the skepticism related to the GH effect and co2 climate sensitivity is the lack of an experiment quantifying the sensitivity.

        A computational value is not meaningful especially considering the number of research papers that question the IPCC value.

        There are numerous experiments refuting the GH effect but I am unaware of any supporting the theory or quantifying co2 sensitivity.

        Until the IPCC creates an experiment that can be replicated by independent scientists the skepticism will continue.

        My personal belief is co2 does not impact the climate and an experiment will never be found to valid the theory.

        • bdgwx says:

          Earth has performed the experiment on a planetary scale many times before. And we are conducting the experiment in realtime today for the entire world to observe. So far the experiment is consistent with theory.

          The universe and laws of physics do not care about your feelings or beliefs. And we don’t conduct experiments to validate theories. We conduct experiments to falsify them. And so far the consensus theory of the contemporary warming era is consistent with experiment and observation.

  18. ren says:

    Great increase in the extent of sea ice in the Northern Hemisphere.
    https://i.ibb.co/t8F8X4m/r00-Northern-Hemisphere-ts-4km.png

    • Rob says:

      Would you now compare Dec/Jan 2020/21 to the corresponding period in the first 20 years of the satellite record 1979-1998.

      • Bindidon says:

        Rob

        ren doesn’t like such questions: he loves to show cooling.

        Anyway, like every year, he will calm down in at best two months concerning Arctic sea ice.

        https://drive.google.com/file/d/1jNZN7EbOiWxmJV5NkeVFuLAmq0kfS00Z/view

        J.-P. D.

      • Richard Greene says:

        ARCTIC SEA ICE EXTENT

        The current Arctic sea ice extent is very close to the 1981 to 2000 average.

        https://elonionbloggle.blogspot.com/2021/01/arctic-sea-ice-extent-is-very-close-to.html

        When looking at the seasonal variations, there has not been much change since 2006.

        https://realclimatescience.com/2020/04/no-trend-in-arctic-sea-ice/

        There was significant land surface Arctic warming since 1975 — the “poster child” for global warming. The minimal local warming of Antarctica near underseas volcanoes is conveniently ignored.

        Land surface temperature trends do not necessarily match sea ice extent trends, which are mainly affected by water temperatures.

        The polar bears are very happy with local warming, and the few people living within the Arctic Circle love warming too.

        • bdgwx says:

          RG said: The current Arctic sea ice extent is very close to the 1981 to 2000 average.

          First…I think you mean 1981-2010 average.

          Second…Nope. Not even close. As of Jan. 16th, 2021 the 5 day average is 2 sigma below the average.

          RG said: When looking at the seasonal variations, there has not been much change since 2006.

          Nope. Not even close.

          The 1981-2010 average minimum is 6.19e6 km^2. Here are the minimums since 2006.

          2006 = 5.75
          2007 = 4.15
          2008 = 4.55
          2009 = 5.05
          2010 = 4.59
          2011 = 4.33
          2012 = 3.34
          2013 = 5.04
          2014 = 4.99
          2015 = 4.39
          2016 = 4.15
          2017 = 4.64
          2018 = 4.63
          2019 = 4.17
          2020 = 3.71

          The 1981-2010 average annual mean is 11.61e6 km^2. Here are the annual means since 2006.

          2006 = 10.773
          2007 = 10.474
          2008 = 10.978
          2009 = 10.932
          2010 = 10.714
          2011 = 10.484
          2012 = 10.406
          2013 = 10.897
          2014 = 10.791
          2015 = 10.566
          2016 = 10.163
          2017 = 10.393
          2018 = 10.355
          2019 = 10.201
          2020 = 10.160

          Note that 2020 now ranks as having the lowest extent on record.

          ftp://sidads.colorado.edu/DATASETS/NOAA/G02135/seaice_analysis

          • Richard Greene says:

            I presented links to sea ice extent charts with data from reliable sources. You just ignored them?

            I wrote 1981 to 2000 because I meant 1981 to 2000.

            Sea ice extent minimums are cherry picking data to show maximum differences over the years. Sea ice extent maximums would also be cherry picking data to show minimum differences over the years. No surprise which you chose!

            I have provided a few links for people to stare at the data in charts and make their own decisions. The Arctic, the “poster child” for global warming, has had surprisingly little change in the average annual sea ice extent since 2006, using data sources I trust.

            Since the planet has been warming since the 1970s, when Arctic sea ice extent data collection began, declining sea ice extent should be expected, and phrases such as “lowest extent on record” are needless scaremongering using a very short record. Arctic ice melting does not raise sea level and might open up some new areas for fossil fuel exploration — I know you would love that.

            Here are links to current Arctic sea ice extent data:

            http://polarportal.dk/en/sea-ice-and-icebergs/sea-ice-thickness-and-volume/

            http://polarportal.dk/en/sea-ice-and-icebergs/sea-ice-extent0/

            https://earth.gsfc.nasa.gov/cryo/data/current-state-sea-ice-cover

          • bdgwx says:

            RG,

            Your post was about “seasonal variations”. That’s what I’m responding to. I provide both the summer minimum extent AND the annual mean extent. I did this specifically to touch on both the “seasonal variations” AND to avoid an cherry-picking accusations. Note that the year 2006 was picked by you and you alone.

            Arctic sea ice is declining. The winter maximum is declining. The summer minimum is declining. The annual mean extent is declining. No matter what metric you choose to measure it is declining.

            Your own dataset doesn’t even agree with your claim that “The current Arctic sea ice extent is very close to the 1981 to 2000 average.” It is literally 2 standards of deviation below the 1981-2000 average according to OSISAF. And note that OSISAF agrees with the NSI.D.C data I was referring to.

            And the fact that declining sea ice does not directly impact sea levels or that it opens the possibility of fossil fuel exploration in no way nullifies the fact that sea ice is declining. So this talking is completely irrelevant at best and diversion at worst in the context what the extent actually is.

          • bdgwx says:

            RG,

            Another point…notice that the last 4 years on your dataset of choice are all at least 2 standards of deviation below the average. What that means is that if each year were left to random indepedent variability you would expect a 2 SD excursion about 2.2% of the years or once every 50 years. To have it happen 4 years in a row would be expected about once every million years. Obviously sea ice extents are not exhibiting independent random variability. The Arctic is warming rapidly (2-3x the global average) and this is putting substantial downward pressure on sea ice extents.

          • Richard Greene says:

            I consider the Arctic sea extent numbers you presented for 2006 through 2020 to be close, just as they are on the charts I presented (at the links).

            Certainly no climate emergency.

            Not even a problem.

            Remember in mid-December 2009 when your climate hero Al “the climate blimp” Gore, predicted no sea ice in the Arctic in five years? yet another failed prediction of climate doom.
            https://electroverse.net/eleven-years-ago-today/

            By the way, ice on our planet has been melting for about 20,000 years, with no help from man made CO2 during most of that period. So don’t claim that a small decline in the Arctic sea ice extent from 2006 to 2020 is anything unusual — it’s not even a problem.

          • bdgwx says:

            Al Gore is not a sea ice expert, a climate expert of any kind, or even a scientist at all. And he’s certainly not my hero. I don’t pay attention to “predictions” from random non-expert activists and bloggers and neither should you. Al Gore dispenses propaganda; not science. Bona-fide experts predict that the Artic will not go “ice-free” in the summer until around 2050 or so.

  19. ren says:

    Very low Pacific surface temperature in the Nino 4 area and more rainfall in Australia.
    https://www.tropicaltidbits.com/analysis/ocean/nino4.png

  20. Adelaida says:

    bdgwx,

    What’s your take on the post Ren posted at the beginning of this thread?

    “Thermal Enhancement on Planetary Bodies and the Relevance of the Molar Mass Version of the Ideal Gas Law to the Null Hypothesis of Climate Change”
    April 2018Earth

    And also, What do you think of the previous comment of mine to which I say of Ren, about the latest advances of Nir Shaviv and Svenmark modeling the nucleation of cloud-forming aerosols?

    …. Although the Cloud project did not go as expected, they are still in that line and are happy with the results …

    • Rob says:

      It is by 1000frolly – need I say more.

      The man who pretends he has PhD in climate science, when in fact his PhD is only in mitigation of methane gas in coal mines.

      The man who was sacked from his teaching job at Federation University for posting “papers” outside his field of expertise, but pretends he was sacked solely because he had the paper published by the “wrong” publisher.

    • Rob says:

      The paper is by 1000frolly – need I say more.

      This is the man who pretends he has PhD in climate science, when in fact his PhD is only in mitigation of methane gas in coal mines.

      This is the man who was sacked from his teaching job at Federation University for posting “papers” outside his field of expertise, but pretends he was sacked solely because he had the paper published by the “wrong” publisher.

      This is the man who published disgusting anti-Muslim videos on his channel, and after being forced by YouTube to remove them, pretended they were never there in the first place.

      This is the man who tried to scrub his name from the internet for the years he was doing his PhD because he knew the content of his channel contradicted the content of his PhD.

  21. Clint R says:

    I was pointing out another flaw in the AGW nonsense — the “energy imbalance”. A troll tried to confuse the issue, so it’s important to finish.

    Fluxes from differing surfaces can’t be averaged. As an example, a flat plate has one side with emissivity 1.0, and area of 1 sq. m. The other side is also 1 sq. m. and emissivity of 0.5. The side with the higher emissivity is receiving 1500 W/m^2. At equilibrium one side is emitting 1000 W/m^2, and the other side is emitting 500 W/m^2. The average flux is then 750 W/m^2. 750 corresponds to a temperature of 339K, but the surfaces are both at 364K, a 25 K error.

    Another example, one surface has a temperature of 400K. Another surface has a temperature of 350K. The emitted fluxes are 290 W/m^2 and 280 W/m^2. The average flux is 285 W/m^2, but that corresponds to a temperature of 266 K, a 9K error.

    The “0.8 W/m^2 energy imbalance has an accuracy of +/- 10 W/m^2!

    • Rob says:

      All you are doing is repeating your earlier comment, not “finishing”.

      As I’ve already said for your first example, you need an average weighted by emissivity.

      “The Stefan-Boltzmann law states that the radiant power of an object in thermal equilibrium is proportional to the fourth power of temperature and directly proportional to its surface area.”

      Do you know what thermal equilibrium is? Is the object in your second example in thermal equilibrium? It’s easy to “disprove” something when you try to apply a rule in a situation for which the law was not designed.

    • If our planet is getting warmer, or cooler, I suppose “energy imbalance” is a description of that.

      But our planet is always warming or cooling, so I suppose there is always an “energy imbalance”?

      Starting long before the use of fossil fuels for energy.

    • Clint R says:

      As the simple examples indicate, flux cannot be treated as energy. That’s why the idiots got so confused with the example of a cone. The base of the cone is receiving 900 W?m^2, but they entire surface only emits 180 W/m^2. There is a “flux imbalance” of 720 W/m^2, so Norman believed the cone would be warming. But, the cone is in equilibrium. The flux is not balanced, but the energy is balanced.

      It’s the same for Earth, if it’s done correctly. Energy is conserved. But it’s nearly impossible to account for all the energy. Some is even converted by plants in photosynthesis. And NO ONE knows the exact surface area of Earth. It is more than the estimate of 510 (10)^12 m^2. That estimate assumes a flat surface of a sphere having the average radius Earth has. Just the estimate for surface area is probably wrong by more than 5%!

      The “0.8 W/m^2 energy imbalance” is as bogus as the rest of the AGW nonsense.

      (For those enjoying the off-topic diversions, the S/B Law applies to any surface, at any time, not just at “thermal equilibrium”. Trolls have some inner need to pervert reality.)

      • Rob says:

        According to you, making the law factual so that it matches any thermodynamics text is an “off-topic diversion”. If the surfaces are at different temperatures, then there will be net heat flowing from one to the other within the solid. You have to wonder how anyone could imagine the law working under that condition.

        • Clint R says:

          You just can’t learn physics from wikipedia, can you?

          • Rob says:

            No you can’t – I agree entirely. Wikipedia doesn’t mention thermal equilibrium, so that was your source. I prefer books written by university professors – and also plain common sense.

  22. Bindidon says:

    A flux (and, among all fluxes, a fortiori radiant fluxes like solar or heated body irradiance), is always the expression of a power per unit of surface, e.g. watt/meter^2.

    Power is energy per unit of time, e.g. joule/second.

    Thus, fluxes are energy per unit of time per unit of surface, e.g. joule/second/meter^2.

    *
    To tell that fluxes cannot be treated as is energy is the signature of the Pseudoskeptics (those who persistently oppose denial to useful, sound skepticism).

    I very well remember the ignorant Pseudoskeptic nicknamed JD*Huffman, who pretended that ‘fluxes cannot be added’, and similar nonsense.

    Oh Noes! Will that never end?

    It’s like
    – the denial of lunar spin just because a ball fixed on a string cannot rotate about its axis, or
    – the effect of CO2 being inexistent just because there is no warming measured by a few (among many) weather stations located in desert areas.

    You can really become quite a bit tired with such ignorant boasters.

    J.-P. D.

    • Clint R says:

      Just ask Norman. Like you, he didn’t know the difference between flux and energy.

      He looked like an idiot.

      (For those that are able to learn, the “time” makes the difference. “Power”, energy per time, is NOT conserved, because it is a rate. “Energy” is a “quantity”, and must be conserved. So a “power flux” is not conserved. That’s why the cone is absorbing 900 W/m^2, but only emitting 180 W/m^2, and that doesn’t violate anything.)

      • Bindidon says:

        The idiot is here the one who tries to explain things using artificial arguments.

        J.-P. D.

        • Clint R says:

          Yes, Norman likes to use “artificial arguments”. Like when he claims two ice cubes can warm more than one ice cube!

          “Artificial” is a nice way of putting it….

    • Gordon Robertson says:

      binny…”Power is energy per unit of time, e.g. joule/second.

      Thus, fluxes are energy per unit of time per unit of surface, e.g. joule/second/meter^2.”

      ***

      Power in watts is a measure of mechanical energy. It is derived from the horsepower, a measure of the rate at which a horse can lift a weight on a pulley system. Applying the watt to a flux field, like electromagnetic energy, is just plain dumb.

      Here’s why. EM has no mass and can do no work. It is not a force and it has no heat. It is simply and electric field transmitted through space accompanied by a perpendicular magnetic field.

      If EM is absorbed by electrons in a mass, it can raise their kinetic energy level which translates to an increase in heat, measured by the human invention temperature. However, EM is lost in the process, converted to heat.

      Heat has an equivalence to work as proved by Clausius and demonstrated earlier by Joule, the scientist. Joule found that 1 calorie of heat is equivalent to 4.184 joules of mechanical energy. A joule is related to a watt as an EQUIVALENT measure of heat, in calories.

      That’s the relationship between EM and mechanical power, measured in watts. It is a potential form of mechanical energy and claiming EM is so many watts of power is plain bs. It has the possibility of creating that much power when absorbed by electrons, but the measure is an equivalent measure of mechanical power that is the same as the heat, measured in calories.

      The 2nd law applies. If the EM was produced by a cooler body it cannot be absorbed by a hotter body therefore the power rating is meaningless. It’s not till the EM is absorbed by a body cooler than the emitting body than it can be transformed to heat. So, if the EM is emitted to space and never encounters a cooler body, it can never be converted to real power.

  23. Bindidon says:

    There are basically three estimations for Earth’s exact surface:
    – the sphere
    – Earth’s triaxial reference ellipsoid (which takes into account Earth’s oblateness at the poles, and recent measurements at the equator)
    – its geoid, which differs from the ellipsoid due to
    — mountains and abysses
    — the difference in behavior between ocean and land surfaces with respect to gravity and spin.

    I don’t know the difference between Earth’s geoid and its reference ellipsoid.

    But it is known since longer time that the surface difference between Earth’s reference ellipsoid and its best possible spherical approximation is about 0.3 %.

    J.-P. D.

    • Clint R says:

      Keep going, JD. You’ve only just begun.

    • Entropic man says:

      This could be fun. The Earth’s surface is rough, with a fractal dimension between 1 and 3 depending on locality.

      Depending on your unit of measurement the radiating surface of the Earth might be anything up to three times the normal estimate, which would mean that the Earth’s surface is radiating three times as much energy as we currently measure and the greenhouse effect is three times stronger. ( smile emoji)

      • Clint R says:

        Wrong again, Ent.

        The more surface area, the more energy that would be emitted, for the same surface temperature.

        • Entropic man says:

          “The more surface area, the more energy that would be emitted, for the same surface temperature. ”

          Read my post. That’s what I said.

          • Clint R says:

            I read your comment. That’s why I said you were wrong. Let’s try some numbers.

            One m^2 of a perfect emitter at 288 K would be emitting 390 W/m^2, or 390 Joules per second. A 1.05 m^2 area at the same temp would then be emitting 410 Joules per second.

            Kind of makes the “0.8 W/m^2 energy balance” nonsense look stupid, huh?

  24. ren says:

    On all planets with a dense atmosphere there is a vertical temperature gradient in the atmosphere from a pressure level of 100 hPa to the surface.
    The mean temperature in the tropopause is constant.
    https://www.cpc.ncep.noaa.gov/products/stratosphere/strat-trop/gif_files/time_pres_TEMP_MEAN_ALL_EQ_2020.png
    Common 0.1 bar tropopause in thick atmospheres
    set by pressure-dependent infrared transparency
    http://citeseerx.ist.psu.edu/viewdoc/download?doi=10.1.1.465.8585&rep=rep1&type=pdf

  25. Entropic man says:

    I was thinking about balls not being able to rotate because the string was attached to their surface and, when swung, kept the attachment point towards the centre of swing.

    Modify the ball. Drill a hole through the centre of the ball to take a wire.

    Cut the ball in half perpendicular to the hole to produce two hemispheres.

    Tie a small loop in the string and put the wire through the loop. Slide the hemispheres onto the wire, leaving a small gap so that the ball can rotate independantly.

    Now, when you swing the ball, it no longer has to rotate at the same rate at which it revolves around the other end of the string.

    Gravity is the string, but like the modified ball, there is no attachment point on the surface of the Moon. It is free to rotate around its axis and does not have to rotate and revolve at the same rate.

    The ball on a string analogy collapses.

    • Clint R says:

      Wrong Ent. The ball-on-a-string is a model of pure orbital motion, like we see with Moon. Your modification allows the ball to also rotate about its axis, as we see with Earth. If the ball were also rotating about its axis, we would see all sides of it, from the center of orbit.

      The ball-on-a-string analogy still holds for pure orbital motion.

      • Entropic man says:

        “The ball-on-a-string analogy still holds for pure orbital motion. ”

        But it’s not pure orbital motion. The Moon’s orbit is elliptical, not circular. For half its orbit the Moon rotates faster that it revolves. For the other half of its orbit it revolves faster than it rotates. My freely rotating ball describes the Earth/Moon system better than your fixed attachment point ball.

        • Clint R says:

          Ent, the ball-on-a-string is pure orbital motion. In pure orbital motion the same side always faces the center. The fact that Moon’s orbit is elliptical does not affect the fact that the same side always faces the center of orbit.

          Sheesh, you idiots are slow.

    • Gordon Robertson says:

      entropic…”Modify the ball”.

      For what reason, so you can obfuscate the physics?

      It’s simple, a ball is attached to a string and is being rotated. The ball wants to move in an instantaneous tangential path but the string constrains it to an orbit. Since the ball is attached to the string, under tension, the ball cannot rotate about its own axis.

      Why is this so hard to understand?

      • Entropic man says:

        Because it’s wrong. The Moon rotates at a constant rate. It rotates faster than it orbits as it ascends from pedigree to apogee and rotates slower than it orbits during its descent, because it’s orbit is elliptical.

        The result is that the same face does not always face the Earth. It appears to rotate clockwise and anticlockwise several degrees back and forth each orbit so you see libration.

        To properly simulate the elliptical orbit you would have to make the string longer and shorter once per circuit.

        This would have to change the ball and the Moon’s rotation rate, removing angular momentum to slow it’s rotation as it ascends and adding angular momentum to make it rotate faster as it descends.

        The is no known mechanism to do this. Since angular momentum is conserved, where is it being stored while the Moon is at apogee?I

        Your ball on a string model of of the Earth/Moon system violates the 2nd Law.

        • Dr Roys Emergency Moderation Team says:

          The Moon changes its orientation at a constant rate. It changes its orientation faster than it orbits as it ascends from perigee to apogee and changes its orientation slower than it orbits during its descent, because its orbit is elliptical.

          There, fixed it for you.

          A change in orientation of an object does not necessarily equal axial rotation. An object also changes orientation because it is rotating about a fixed axis that is external to the object, and not about its own center of mass. So, it faces through e.g. N, W, S and E and back to N again as it completes one full rotation about the external axis. Its orientation is changing, but it is not rotating on its own axis. Meanwhile the same inner face of the object remains pointing towards the center of revolution throughout.

        • Clint R says:

          Ent, the “ball-on-a-string” is a model of orbital motion. It is NOT meant to be a model of Earth/Moon system. The purpose of the model is to show that the same side always faces the center of the orbit, as Moon.

          And it does NOT violate the 2nd Law. You don’t even know the “Laws”.

          Sheesh, you idiots are slow.

          • Entropic man says:

            From you 3.02on post.

            “The ball-on-a-string is a model of pure orbital motion, like we see with Moon. ”

            From your 8.07am post.

            “the ball-on-a-string is a model of orbital motion. It is NOT meant to be a model of Earth/Moon system. ”

            Make your mind up.

          • Clint R says:

            Both statements are correct.

            The ball-on-a-string is a model of pure orbital motion. One side of the ball always faces the center of orbit, as does Moon.

            The ball-on-a-string is NOT a perfect model of Earth/Moon actual motion because Moon has a slightly elliptical orbit. But, one side of Moon always faces the center of orbit, because it is orbiting. If it were also rotating about its axis, Earth would see all sides of it.

          • Entropic man says:

            We’ve been over this.

            Whether you regard the Moon as rotating or not depends on your viewpoint. Because of its tidal locking,from the viewpoint of a terrestrial observer it is oscillating rather than rotating.

            In other frames of reference, relative to the Sun or the. Stars or from the viewpoint of an observer on the Moon it is rotating.

            Physical tests show it to be rotating relative to the inertial reference frame. Moving objects in the Northern Hemisphere of the Moon are deflected to the right by the Coriolis effect. A Foucault Pendulum or a gyroscope on the Moon would detect rotation.

            The reason you are convinced that the Moon is not rotating is that you are stuck in a pre-Copernican Earth centred universe. The rest of us moved beyond that delusion in 1543.

          • Dr Roys Emergency Moderation Team says:

            “A Foucault Pendulum or a gyroscope on the Moon would detect rotation.”

            Sure, but rotation about which axis?

            The moon rotates about the Earth/moon barycenter, not about its own center of mass. You see, “revolution”, or “orbiting”, are just different words for a rotation about an external axis. The moon “orbits”, but it does not “rotate on its own axis”.

            That’s true regardless of reference frame.

          • Clint R says:

            Yes Ent, we’ve “been over this” many times. You got that much right.

            Moon rotation does NOT depend on “viewpoint”. As with the ball-on-a-string, if the ball were really rotating about its axis, the string would wrap around it. You just refuse to accept reality.

            And Moon is NOT “oscillating”. You’re just making things up because you refuse to accept reality.

            A Foucault Pendulum would detect the orbital motion, because that is the only motion Moon is doing. You just refuse to accept reality.

            The reason you are convinced that Moon is rotating is that you are stuck in a false religion worshiping institutions, and denying reality. The rest of us avoid cults, and cult behavior.

          • Entropic man says:

            DREMT

            “Sure, but rotation about which axis? ”

            The Moon’s own axis.

          • Entropic man says:

            ClintR

            “The reason you are convinced that Moon is rotating is that you are stuck in a false religion worshiping institutions, and denying reality. The rest of us avoid cults, and cult behavior. ”

            Purists may care to analyse ClintR’s statement.

            https://www.healthline.com/health/projection-psychology

          • Dr Roys Emergency Moderation Team says:

            Incorrect, E-man. A Foucault Pendulum or a gyroscope only detect changes in orientation. As explained, that can be due to a rotation of the object about an external axis, and not rotation about the center of mass of the object itself.

          • Clint R says:

            Ent, it appears you have ran out of ways to pervert reality, so you’re now searching for links that don’t help you.

            The problem with trying to save yourself by clinging to “projection”, is that the ball-on-a-string brings that to a stop. Reality is the 8000# gorilla in the room.

            You have to claim the ball is rotating about its axis, to support your false religion. But, then the string would be wrapping around the ball.

            You can’t win when you go against reality.

  26. ren says:

    https://i.ibb.co/SKf8Wv6/gfs-toz-nh-f00.png
    https://i.ibb.co/mh9hB64/gfs-z100-nh-f00.png
    During longer periods of low solar activity, the winter ozone distribution in the northern hemisphere’s stratosphere is highly uneven. This is the cause of the strong weakening of the polar vortex.

  27. Adelaida says:

    Barry,

    I have posted a comment in the thread of the 12th, corresponding to your response to a previous comment of mine on a different topic than this thread and that is why I am not posting here.

    https://www.drroyspencer.com/2021/01/at-the-white-house-the-purge-of-skeptics-has-started/

  28. Eben says:

    It is the year 2021 and demented Germans have to ration electric power because they don’t have enough , do you want to be like them ???

    https://notrickszone.com/2021/01/19/last-ditch-effort-germany-weighs-electricity-rationing-scheme-to-stabilize-its-now-shaky-green-power-grid/

  29. jay cadbury says:

    @bdgxw

    how many times have the surface temp records been adjusted compared to UAH? Tony Heller has so thoroughly owned zeke on the topic, cheers!

    • bdgwx says:

      Every month. The primary reason here is because the GHCN-M files are continuously being updated with new observations even for years in the distant past. And since GISTEMP reprocesses all years and their months each time the code runs you’ll get a different result each time. And this is exactly what we want. We want datasets like GISTEMP to always reflect the best possible estimate from whatever set of observations are available at the time. BTW…the UAH monthly anomalies get adjusted every month as well. So I guess the answer to your question is that there is no difference in that regard. If the question is how often do their processing methodologies change then the answer is 4 major version for GISTEMP and 6 major versions for UAH. And the temperature trend changes with UAH revisions have been more impactful than those for GISTEMP.

      BTW…you can help participate in digitizing old weather records so that they can be loaded into GHCN and ERSST (and similar repositories). Here is one such project that is working on digitizing hand written records from the US Navy during WWII. https://www.zooniverse.org/projects/krwood/old-weather-ww2 I also hear there is still treasure trove of weather records from Africa still waiting to be digitized.

    • bdgwx says:

      Because I’m curious and because I don’t frequent Tony Heller’s blog…does he go over the station move bias, time of day bias, instrumentation bias, etc. adjustments and quality control like spatial inconsistency, outlier values, etc. checks with his audience? Does he talk about the various record digitization and upload efforts into the data repositories that these global mean surface temperature datasets rely upon? Does he mention how the urban adjustment works and what effect it actually has on the GMST? Does he mention that the net effect of all of these adjustments actually work to reduce the warming trend relative to the unadjusted data?

    • Bindidon says:

      jay cadbury

      ” Tony Heller has so thoroughly owned zeke on the topic, cheers! ”

      Are you joking?

      Goddard aka Heller compared years ago single GHCN V3 station data – adjusted vs. unadjusted.

      I remember to have cross-checked some of his claims. They were wrong as wrong can be: the increase in trend was in all these cases correct.

      Moreover, OK: there were, within the adjusted set, more a posteriori higher trends than lower ones wrt the unadjusted data: about 4500 of 7280.

      But… did you ever see this Goddard guy posting about adjusted data having a trend lower than the unadjusted? I can’t recall having seen that.

      FYI: here is a chart with two adjustment plots I made in 2016 – one for the diff between UAH6.0 beta5 and UAH5.6, one for the diff between GISS actual and a version saved in 2011, and yes, still accessible:

      https://drive.google.com/file/d/1b6axDruUd62XggCQtxje25aI8I4bOFGX/view

      Nick Stokes, who is a lot more experienced than Goddard, has written a lot about adjustments in GISS vs. UAH:

      https://moyhu.blogspot.com/2015/12/big-uah-adjustments.html

      J.-P. D.

    • Bindidon says:

      Oh I just see this on Google Drive:

      https://drive.google.com/file/d/1gT1bWIH2JhpqMgisImxsQfyqMfx_-53P/view

      It is a comparison of land-only data sets: GISS, UAH6.0 LT, and an own processing of the GHCN daily data set, the rawest station data available.

      It was made in 2019, and at that time, GISS land was based on GHCN V3 station data; now it has moved to V4, whose adjusted data shows more homogeneisation than V3’s.

      If I would reconstruct the graph using today’s data, I’m sure the GISS plot would now be more above the others.

      But… when processing GHCN daily, I do area and latitude weighting, but no infilling of empty grid cells.

      This is a major flaw, because all cells you leave empty have the same value as the average of all non empty cells. Plain wrong!

      J.-P. D.

      • bdgwx says:

        Absolutely. When faced with empty grid cells you have to make assumptions about those cells regardless. You can “infill” them using neighboring observations or you can blindly “infill” them with the global average. I think it is obvious to anyone other than Tony Heller, certain elements of the blogosphere, and many posters on this blog which method yields the least sampling error.

        • Richard Greene says:

          If you make up temperature numbers that can never be verified, the margin of error claim is meaningless.

          Satellite data have much less inflling, and that’s why they have the potential for accuracy. They are also measured in a stable environment where the greenhouse effect occurs.

          The huge changes to the 1940 to 1975 global surface average global cooling trend reported by officials in the mid-1970s, compared to what we are told now, is evidence of junk science.

          Changing the past that much is junk science:
          http://elonionbloggle.blogspot.com/2021/01/there-used-to-be-lot-of-global-cooling.html

          • Bindidon says:

            Richard Greene

            A look at this chart:

            https://tinyurl.com/yych9c4d

            is enough for me to understand your position that the changes between the two plots inevitably MUST BE due to ‘adjustments’, to ‘fraud’, etc etc.

            Did you ever spend even one second about the crucial differences in both knowledge and available data between these two periods?

            In 2008, there were no more than 7280 weather stations registered in GHCN V3.

            In October 2020, as I downloaded the ‘GHCN daily’ for the last time, there were about 40000 stations measuring temperature.

            Now try to think a little bit, Mr Greene, and imagine how many stations existed at the beginning of the 1970s.

            50 years ago, there were very few REGISTERED stations outside of the US and Europe (many more existed, especially several hundreds in the Russian domain, but were out of reach).

            *
            50 years ago, measurement processing subtasks like area weighting were still either unknown or unused, the consequence being that the result of global temperature processing looked like that of the USA. The Globe was, technically spoken, its backyard.

            I can show you the difference between a global processing with and without area weighting. It’s sometimes amazing.

            *
            Btw: do you know, Mr Greene, how infilling is tested?

            You hide known data in cells, process the infilling over the cells now artificially empty, and compare the result with what you intentionally had hidden.

            Infilling by kriging is done everywhere, in mining, in the computation of highways, in every context where you need valuable spatiotemporal estimates.

            *
            Why do so many people doubt about what they don’t like, and trust in what they believe be right?

            J.-P. D.

          • Richard Greene says:

            There were plenty of land weather stations in the 1960s.

            The number of weather stations is less important than the:

            (1) global distribution of stations,
            http://elonionbloggle.blogspot.com/2021/01/nasa-ghcnv4-land-weather-station.html

            (2) movement of stations over the decades,
            (3) missing data requiring infilling,
            (4) proper siting of stations,
            (5) changing equipment and louvered box sizes,
            (6) economic growth in the vicinity,
            (7) land use changes in the vicinity,
            (8) landscape changes very close to a station
            (8) repeated adjustments to the raw data over the decades.

            All temperature data from before 1979, without satellite data for a “check and balance” comparison with surface data, are suspect — especially claims of +/-0.1 degree C. margins of error.

            In addition, since the majority of the planet is water, the land weather stations are only 29%-30% of the planet’s surface.

            The ocean surface numbers are even worse
            … with repeated changes of measurement methodologies, starting with buckets of different materials, engine water intakes from various depths, moored buoys, drifting buoys, satellites and ARGO floats.

            The bucket and thermometer methodology was almost entirely at various locations in shipping channels in the Northern Hemisphere. There were far fewer measurements in the Southern Hemisphere.

            I have never seen a study of ALL the sea surface measurement methodologies used in the same place to see exactly how the changing methodologies could have affected the measurements over time.

            Sea surface temperature data before ARGO floats in 2003 are suspect.

            All temperature numbers before 1920, mainly wild guess infilling, are not worthy of real science. Perhaps good enough for government bureaucrats with science degrees and armchair “scientists” like YOU, but not for reals science.
            http://elonionbloggle.blogspot.com/2021/01/poor-global-coverage-of-land-weather.html

          • Nate says:

            “All temperature data from before 1979, without satellite data for a ‘check and balance’ comparison with surface data, are suspect especially claims of +/-0.1 degree C. margins of error.”

            Riiiight..

            You seem to believe that TODAY surface measurements require the satellite troposphere measurements to perform their calculation or be a check and balance.

            They don’t. They are independent measurements of different things. Thermometers worked before 1979.

            In fact they worked better, since their calculation of temperature is much more direct.

      • S. K. Dodsland says:

        Dr. Tim Ball warned about parameterized data for years.
        No one listened.

        • Bindidon says:

          S. K. Dodsland

          Yessah, and Dr Pat Frank warned about systemic errors for years.

          Ball and Frank spend their time since years and years in criticizing other people’s work, but NEVER managed to present the only useful result of their endless criticisms: a constructive, working alternative to all the work they criticized.

          It is not sufficient in life to post at WUWT giant articles about systemic errors: you must do YOURSELF the jobs you pretend be wrong.

          J.-P. D.

          • Galaxie500 says:

            For SK Dodsland

            B.C. Supreme Court Justice Ronald Skolrood was critical of Ball’s work

            ”[…] despite Dr. Ball’s history as an academic and a scientist, the Article is rife with errors and inaccuracies, which suggests a lack of attention to detail on Dr. Ball’s part, if not an indifference to the truth,” Justice Skolrood wrote.

            He added later in the judgement:

            “[T]he Article is poorly written and does not advance credible arguments in favour of Dr. Ball’s theory about the corruption of climate science. Simply put, a reasonably thoughtful and informed person who reads the Article is unlikely to place any stock in Dr. Ball’s views, including his views of Dr. Weaver as a supporter of conventional climate science.”

          • Clint R says:

            That’s the problem with the courts. They are unable to understand the actual science. They tend to always take the easy path, going with the consensus.

            But consensus ain’t science.

  30. S. K. Dodsland says:

    Something for the average reader that is interested in the whole forest not just the rings of just one tree.

    https://www.youtube.com/watch?v=S6sKPSKkvVs

    https://www.youtube.com/watch?v=M1VJtER2IUE

    • Rob says:

      Still waiting for you to be a man and own up to your mistake.
      Here it is again:
      https://tinyurl.com/reply-to-dumb-comment

      I’m going to hound you until you do so.

      • S. K. Dodsland says:

        My statement that 2ppm is 2 ten thousands of a percent is correct.

        2/1,000,000*100=0.0002

        You’re a typical repressive regressive progressive. Get a life.

        • bdgwx says:

          Right. But that’s not what is being challenged. What is being challenged is your misrepresentation of what I actually said.

          I said: In 1815 Mount Tambora erupted and lofted 100 MtSO2 into the upper atmosphere. That is 0.02 ppm (0.000002 %).

          You then said: 2 ppm is not 2 one hundred thousands of a percent it is 2 one ten thousands of a percent.

          Pay very close attention what I actually said and then what you attributed to me saying. See the difference?

          Look, I make mistakes all of the time. It happens. In fact, I probably make more than my fair share of them so I cannot fault you for misrepresenting me. It was probably an honest mistake. The thing is…you didn’t address it.

          BTW…no worries…I’m not offended. We can just pretend like it didn’t even happen for all I care.

          • bdgwx sez
            “I make mistakes all of the time. It happens. In fact, I probably make more than my fair share of them”

            Admitting mistakes is a violation of internet rules, according to Rule 3d, which stipulates:
            — None of your faults are your fault, and
            — Always blame the computer.

          • Rob says:

            I’d say it is more a violation of conservative policy, exemplified by its insurrectionist leader.

            When was the last time you admitted to making a mistake, old Donnie Boy? Come on Adolf, be brave and begin with Eric.

        • Rob says:

          Let me repeat:
          The original claim did not say 2 ppm.
          It said 0.02 ppm.

          And then there is your false claim that: “man’s contribution is less than 5% of the present day level”. It is in fact more than 30%. But of course you deliberately made your claim ambiguous by not stating “today’s level of what.” Emissions or total atmospheric concentration. At least, I hope for your sake it was deliberate.

          So if I am all that, what does that make you?

    • bdgwx says:

      Ah yes…our “friends” Tim Ball and Patrick Moore. You might like these videos as well.

      https://youtu.be/3k_61EC9Y-8?t=331

      https://youtu.be/MTJQPyTVtNA?t=470

      https://youtu.be/9XIpTqbLR5Y

      BTW…Tim Ball is one of the friends in “Friends of Science” who happens to be hosting Dr. Spencer’s presentation tonight. [https://youtu.be/nZDOJqAs9eE?t=77] Oh…and who’s that…why yes, it’s Ross McKitrick as well [https://youtu.be/nZDOJqAs9eE?t=191]. I noticed you mentioned him earlier. Tight-nit group they are!

      • S. K. Dodsland says:

        Spare me the smear campaign by the IPCC’s public relations team.

        When are you climate alarmists going to publicly debate the science?

        What are you afraid your ignorance will be revealed?

        • Gordon Robertson says:

          s.k….”Spare me the smear campaign by the IPCCs public relations team.

          When are you climate alarmists going to publicly debate the science?”

          **********

          Quite right, S. K., all the alarmists have are a load of laughing hyenas who would not understand the scientific method if it was spoon-fed to them. They have all learned through agreement. They hang in small groups quoting so-called science from each other and never getting beyond the group-think stage.

        • Rob says:

          This thread is full of comments where he attempts to debate the science with you guys. And then you focus on one comment where he points out the nonsense of the nay-sayers, and pretend that this is representative of all his comments. Not very honest of you, is it. Kind of like arguing correctly that 2 ppm is 2 ten thousand of a percent, while glossing over the fact that the 2 ppm itself was wrong.

        • Carbon500 says:

          S.K. Dodsland: I’d love to see a public debate on television about the issue of ‘climate change’.
          However, here in the UK for example the BBC has fallen in solidly behind the climate doom-mongers. There’s no chance of an exchange of views – they recently aired a programme about Greta Thunberg, but not for example the work of UAH and its scientists – need more be said?

      • studentb says:

        Thanks bdgwx – those videos were harsh, but fair. Also hilarious.

  31. Rob Mitchell says:

    Just saw Dr. Spencer’s livestream talk. I enjoyed his presentation and the Q&A afterwards. One of the things he mentioned that makes a lot of sense, and is never discussed in the mainstream news media, is how cold the average ocean temperature is at all depths. The warm ocean waters is near the surface. But as you go down from the surface, including the Tropics, the water temperature drops with depth considerably. The warm water on top is always mixing with the colder water below. The amount of this mixing determines the ocean temperature at the surface, thus the global temperature. If there is a lot of mixing, this leads to global cooling. If the mixing is relatively stagnant, this warms the surface waters, thus your global warming.

    Dr. William Gray always said global temperature is determined by ocean currents. I think he was right.

    • Rob says:

      Global temperature is affected by ocean currents, not determined by them.

    • Bindidon says:

      Rob Mitchell

      I understand your point.

      But, as so often, we must not consider only consider how warm or cold things are; it is also important to see whether these things become colder or warmer over time.

      The Japanese Met Agency monitors temperature differences in the oceans since the 1950’s:

      https://www.jstage.jst.go.jp/article/sola/13/0/13_2017-030/_article
      (behind paywall, but free sources should be available.

      And here is the access to their 1 degree grid data:

      https://www.data.jma.go.jp/gmd/kaiyou/english/ohc/ohc_data_en.html

      and a simple graph describing it:

      https://www.data.jma.go.jp/gmd/kaiyou/english/ohc/ohc_global_en.html

      J.-P. D.

    • Swenson says:

      RM,

      Warm water is unlikely to mix with cold water beneath it. Warm water is less dense. It floats. How do you manage to make warm water sink, and cold water float?

      That is the same sort of silliness shown by NASA and NOAA. About as silly as the NSF scientists claiming that melting sea ice would make sea levels rise!

      You seem to have mislaid your clue, leaving you clueless.

      Over to you.

      • Entropic man says:

        “How do you manage to make warm water sink, and cold water float? ”

        You make the warm water saltier, as happens by evaporation from the Gulf Stream.

        In the Greenland Sea it then becomes dense enough to sink through the colder less saline water coming out of the Arctic.

        • Swenson says:

          EM,

          Unfortunately, the very thin surface layer rapidly cools as it descends (not very far), due to being surrounded by colder water, and rapidly decreases in salinity, due to diffusion into the less saline environment.

          Try again. Maybe rely less on nonsense dished out by organisations like NOAA. Learn some physics, and understand why solar ponds are not a simple, maintenance free implementation of concentrating the heat of the sun.

          Then go back and re-examine your comment.

        • Nate says:

          Ok. So the Thermohaline Circulation is not real? We’ll add to the list of real things that Swenson declares are not possible.

          • Swenson says:

            N,

            Silly boy. Your attempt at sarcasm falls flat.

            No doubt you are referring to this piece of NOAA nonsense –

            * These deep-ocean currents are driven by differences in the water’s density, which is controlled by temperature (thermo) and salinity (haline). This process is known as thermohaline circulation. *

            Starts off well. The following paragraphs then descend into fantasy.

            Anybody interested can read the rest for themselves.

            On a par with the NSF declaring melting sea ice raises global sea levels, or NASA believing that CO2 controls global temperatures!

            Dont be so gullible. Ask yourself why glaciers get warmer towards their baes, and oceans get colder.

            The physics remains the same. Think, lad, think!

          • Nate says:

            “The following paragraphs then descend into” science too complicated for dimwit/trolls, is the way to interpret that.

            And if you don’t get it, it must be wrong.

  32. Frank says:

    Dear Mr. Dr. Spencer,

    Unfortunately it was not possible to watch the event. I have purchased a ticket in advance. A link and a password has been sent by e-mail even with the notice “unlimited viewing”. Using the link and the password I can see only the error message:

    “Access Denied. This password is not for this video. Try different password or find the right video!”

    This is very unfair. How could I receive the right link/password or the video?

    Thank you in advance,

  33. ren says:

    The distribution of ozone in the stratosphere at high latitudes in winter affects the circulation in the upper troposphere.
    https://i.ibb.co/DbdRtYS/gfs-toz-NA-f024.png
    https://i.ibb.co/Lnkycsh/gfs-o3mr-300-NA-f012.png

  34. George says:

    Dr. Spencer,
    I enjoyed your recorded talk and the Q&A after, though your internet connection was pretty bad. These days, we’re all at the mercy of our connection.

    Would it be possible to make your slides available? I took some notes, but having the slides to refer to would be great. Thanks!

  35. S. K. Dodsland says:

    Can’t handle the real science Spencer.

  36. Frank says:

    Dear Dr. Spencer

    Many THX for the presentation and for the QA-session. Scince does work on your way. You have shown a chart in the QA-session (temperature as a function of time in Canada). Would it be possible to find this chart as a downloadable pdf somewhere?

  37. Geoff Sherrington says:

    “Nate says:
    January 20, 2021 at 9:06 AM
    Geoff,
    Are you suggesting, without evidence, that Climate Scientists are making elementary statistics mistakes in their calculation of uncertainties?”
    …….
    “bdgwx says:
    January 20, 2021 at 1:58 PM
    Geoff,
    The 95% CI on the conventional surface datasets is about 0.05C for annual means post WWII. Each dataset publishes something different obviously, but they’re all this ballpark.”
    ………
    Bindidon says:
    January 17, 2021 at 5:37 AM
    FYI: a comparison of the differences between
    – UAH6.0 and UAH5.6
    – RSS4.0 and RSS3.3″
    https://drive.google.com/file/d/1xVNr2ry4ozSCYh49MpfLoH7Twx7C2HLP/view
    ……….

    For those with some comprehension of error in measurement, here we have two bloggers talking about temperatures with errors of 0.1C (more or less) then a third comparing results from UAH with RSS and showing a difference of 0.3 Deg C at the right of the graph.

    How can results differ by 0.3 when the error is only 0.1?
    It is easy. It all depends on what you select to report as “error”.
    There is a modent tendency in climate research to simply omit large contributions to error that are inconvenient or misunderstood or would spoil a neat scientific argument. This is an example of this deplorable post-modern trait. It is far from the best example, I simply chose it because it was discussed in this post. Examples are everywhere. Geoff S

    • bdgwx says:

      It is suspected that satellite datasets have large and as yet unquantified epistemic uncertainty in addition their larger aleatoric uncertainty.

    • Nate says:

      Geoff, You were talking about the surface data sets and their errors.

      Now you are switching to satellites and LT.

      There are large systematic errors in the satellite measurements, such as different satellites used over time and their calibrations/corrections for various effects. The two groups make different choices about how to combine data from different satellites and how to correct for effect like drift etc.

      These don’t apply to the surface measurements.

    • TallDave says:

      “There is a modern tendency in climate research to simply omit large contributions to error that are inconvenient or misunderstood or would spoil a neat scientific argument”

      yep they just pretend sampling error is the only possible source of error

      then they change the published results by large multiples of the claimed error

      last week: “Oct 1965 temp is 23 degrees +/- 0.05”

      this week: “we discovered Oct temp is ACTUALLY 24 degrees +/- .05”

      next week: “now we know Oct temp is REALLY 25 degrees +/- .05”

      but don’t worry, they’re only demanding we restructure the entire global economy based on their claims

  38. Gordon Robertson says:

    nate to geoff…”Are you suggesting, without evidence, that Climate Scientists are making elementary statistics mistakes in their calculation of uncertainties?””

    Without evidence???? NOAA claimed 2014 as the warmest year every based on a probability of 48%. Not to be outdone, GISS made the same claim with a probability of 38%. They are either making mistakes or they are outright liars.

    • Entropic man says:

      You are disingenuous and it is obvious to everyone.

      Stop embarrassing yourself.

      • Gordon Robertson says:

        entropic…”You are disingenuous and it is obvious to everyone”.

        Yeah, but I’m very good-looking and you can’t have everything. No need to worry about me embarrassing myself, I released that image burden a long time ago. You obviously still find value in having an image.

        Never occur to you that image comes from imaginary? We imagine who we are and spend our lives defending those imaginary images. Hell of a burden to carry around. As if that’s not bad enough, we see others through those imaginary images. Leads to war, hatred, and killing but then we’re all bored and need action to keep us entertained.

        Heck, you even imagine that the Moon rotates on its axis, or that NOAA and GISS are fine upstanding collections of scientists. See what I mean?

  39. The warming trend can all come crashing down as many previous warm phases have in the historical climatic past. It is when not if.

    • Entropic man says:

      The flaw in your expectation is that last changes were natural and reversed themselves of you wanted long enough.

      The current changes are artificial and will not be reversed for centuries after we stop. This may take a while since human behaviour is notoriously difficult to change.

  40. Ken says:

    Does carbon dioxide act as a greenhouse gas when it is dissolved in the ocean?

  41. Gordon Robertson says:

    bdg…”It is suspected that satellite datasets have large and as yet unquantified epistemic uncertainty in addition their larger aleatoric uncertainty”.

    Why do you feel compelled to excel in bs. and general propaganda? You seem like an intelligent chap, why not focus your awareness on real science rather than anti-science, which itself is driven by emotion and orneriness?

Leave a Reply