SUMMARY: The Urban Heat Island (UHI) is shown to have affected U.S. temperature trends in the official NOAA 1,218-station USHCN dataset. I argue that, based upon the importance of quality temperature trend calculations to national energy policy, a new dataset not dependent upon the USHCN Tmax/Tmin observations is required. I find that regression analysis applied to the ISD hourly weather data (mostly from airports) between many stations’ temperature trends and local population density (as a UHI proxy) can be used to remove the average spurious warming trend component due to UHI. Use of the hourly station data provides a mostly USHCN-independent measure of the U.S. warming trend, without the need for uncertain time-of-observation adjustments. The resulting 311-station average U.S. trend (1973-2020), after removal of the UHI-related spurios trend component, is about +0.13 deg. C/decade, which is only 50% the USHCN trend of +0.26 C/decade. Regard station data quality, variability among the raw USHCN station trends is 60% greater than among the trends computed from the hourly data, suggesting the USHCN raw data are of a poorer quality. It is recommended that an de-urbanization of trends should be applied to the hourly data (mostly from airports) to achieve a more accurate record of temperature trends in land regions like the U.S. that have a sufficient number of temperature data to make the UHI-vs-trend correction.
The Urban Heat Island: Average vs. Trend Effects
In the last 50 years (1970-2020) the population of the U.S. has increased by a whopping 58%. More people means more infrastructure, more energy consumption (and waste heat production), and even if the population did not increase, our increasing standard of living leads to a variety of increases in manufacturing and consumption, with more businesses, parking lots, air conditioning, etc.
As T.R. Oke showed in 1973 (and many others since), the UHI has a substantial effect on the surface temperatures in populated regions, up to several degrees C. The extra warmth comes from both waste heat and replacements of cooler vegetated surfaces with impervious and easily heated hard surfaces. The effects can occur on many spatial scales: a heat pump placed too close to the thermometer (a microclimate effect) or a large city with outward-spreading suburbs (a mesoscale effect).
In the last 20 years (2000 to 2020) the increase in population has been largely in the urban areas, with no average increase in rural areas. Fig. 1 shows this for 311 hourly weather station locations that have relatively complete weather data since 1973.
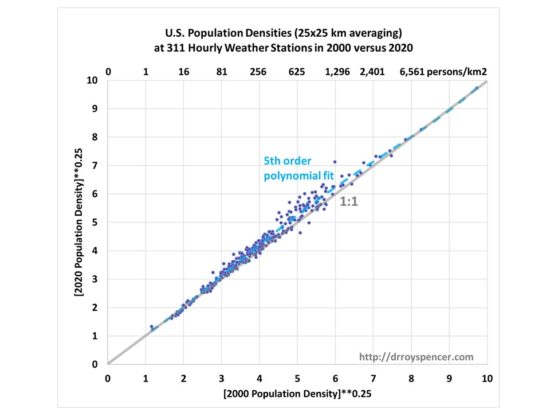
Fig. 1. U.S. population increases around hourly weather stations have been in the more populated areas (except for mostly densely populated ones), with no increase in rural areas.
This might argue for only using rural data for temperature trend monitoring. The downside is that there are relatively few station locations which have population densities less than, say, 20 persons per sq. km., and so the coverage of the United States would be pretty sparse.
What would be nice is that if the UHI effect could be removed on a regional basis based upon how the average warming trends increase with population density. (Again, this is not removal of the average difference in temperature between rural and urban areas, but the removal of spurious temperature trends due to UHI effects).
But does such a relationship even exist?
UHI Effects on the USHCN Temperature Trends (1973-2020)
The most-cited surface temperature dataset for monitoring global warming trends in the U.S. is the U.S. Historical Climatology Network (USHCN). The dataset has a fixed set of 1,218 stations which have records extending back over 100 years. Because most of the stations’ data consist of daily maximum and minimum temperatures (Tmax and Tmin) measured at a single time daily, and that time of observation (TOBs) changed around 1960 from the late afternoon to the early morning (discussion here), there was a TOBs-related temperature bias that occurred, which is somewhat uncertain in magnitude but still must be adjusted for.
NOAA makes available both the raw unadjusted, and adjusted (TOBs & spatial ‘homogenization’) data. The following plot (Fig. 2) shows how both of the datasets’ station temperature trends are correlated with the population density, which should not be the case if UHI effects have been removed from the trends.
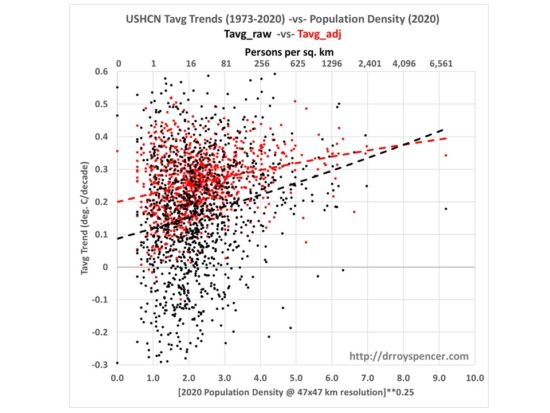
Fig.2. USHCN station temperature trends are correlated with population density, which should not be the case if the Urban Heat Island effect on trends has been removed.
Any UHI effect on temperature trends would be difficult to remove through NOAA’s homogenization procedure alone. This is because, if all stations in a small area, both urban and rural, are spuriously warming from UHI effects, then that signal would not be removed because it is also what is expected for global warming. ‘Homogenization’ adjustments can theoretically make the rural and urban trends look the same, but that does not mean the UHI effect has been removed.
Instead, one must examine the data in a manner like that in Fig. 2, which reveals that even the adjusted USHCN data (red dots) still have about a 30% overestimate of U.S. station-average trends (1973-2020) if we extrapolate a regression relationship (red dashed line, 2nd order polynomial fit) to zero population density. Such an analysis, however, requires many stations (thus large areas) to measure the average effect. It is not clear just how many stations are required to obtain a robust signal. The greater the number of stations needed, the larger the regional area required.
U.S. Hourly Temperature Data as an Alternative to USHCN
There are many weather stations in the U.S. which are (mostly) not included in the USHCN set of 1,218 stations. These are the operational hourly weather stations operated by NWS, FAA, and other agencies, and which provide most of the data the National Weather Service reports to you. The data are included in the multi-agency Integrated Surface Database (ISD) archive.
The data archive is quite large, since it has (up to) hourly resolution data (higher with ‘special’ observations during changing weather) and many weather variables (temperature, dewpoint, wind, air pressure, precipitation) for many thousands of stations around the world. Many of the stations (at least in the U.S.) are at airports.
In the U.S., most of these measurements and their reporting are automated now, with the AWOS and ASOS systems.
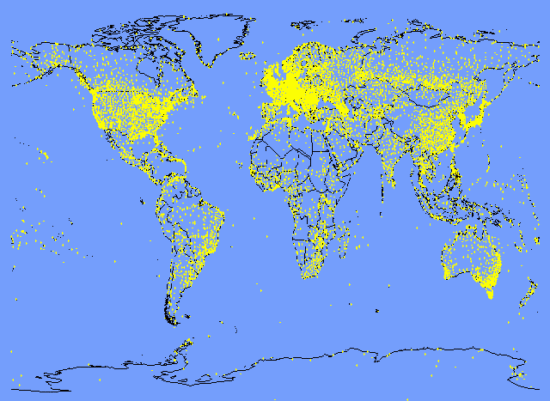
This map shows all of the stations in the archive, although many of these will not have full records for whatever decades of time are of interest.
The advantage of these data, at least in the United States, is that the equipment is maintained on a regular basis. When I worked summers at a National Weather Service office in Michigan, there was a full-time ‘met-tech’ who maintained and adjusted all of the weather-measuring equipment.
Since the observations are taken (nominally) at the top of the hour, there is no uncertain TOBs adjustment necessary as with the USHCN daily Tmax/Tmin data.
The average population density environment is markedly different between the ISD (‘hourly’) stations and the USHCN stations, as is shown in Fig. 4.
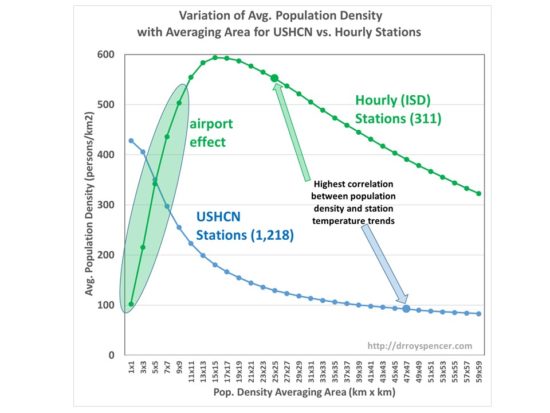
Fig. 4. The dependence of U.S. weather station population density on averaging area is markedly different between 1,218 USHCN and 311 high-quality ISD (‘hourly’) stations, mainly due to the measurement of the hourly data at “uninhabited” airports to support aviation safety.
In Fig. 4 we see that the population density in the immediate vicinity of the ISD stations averages only 100 people in the immediate 1 sq. km area since no one ‘lives’ at the airport, but then increases substantially with averaging area since airports exist to serve population centers.
In contrast, the USHCN stations have their highest population density right in the vicinity of the weather station (over 400 persons in the first sq. km), which then drops off with distance away from the station location.
How such differences affect the magnitude of UHI-dependent spurious warming trends is unknown at this point.
UHI Effects on the Hourly Temperature Data
I have analyzed the U.S. ISD data for the lower-48 states for the period 1973-2020. (Why 1973? Because many of the early records were on paper, and at hourly time resolution, that represents a lot of manual digitizing. Apparently, 1973 is as far back as many of those stations data were digitized and archived).
To begin with, I am averaging only the 00 UTC and 12 UTC temperatures (approximately the times of maximum and minimum temperatures in the United States). I required those twice-daily measurements to be reported on at least 20 days in order for a month to be considered for inclusion, and then at least 10 of 12 months from a station to have good data for a year of that station’s data to be stored.
Then, for temperature trend analysis, I required that 90% of the years 1973-2020 to have data, including the first 2 years (1973, 1974) and the last 2 years (2019-2020), since end years can have large effects on trend calculations.
The resulting 311 stations have an 8.7% commonality with the 1,218 USHCN stations. That is, only 8.7% of the (mostly-airport) stations are also included in the 1,218-station USHCN database, so the two datasets are mostly (but not entirely) independent.
I then plotted the Fig. 2 equivalent for the ISD stations (Fig. 5).
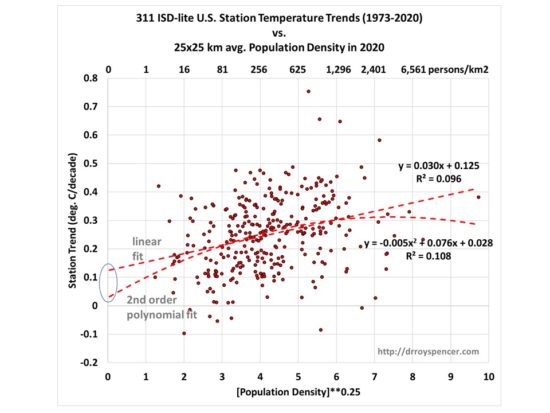
Fig. 5. As in Fig. 2, but for the ISD (mostly airport) station trends for the average of daily 00 and 12 UTC temperatures. Where the regression lines intercept the zero population axis is an estimate of the U.S. temperature trend during 1973-2020 with spurious UHI trend effects removed.
We can see for the linear fit to the data, extrapolation of the line to zero population density gives a 311-station average warming trend of +0.13 deg. C/decade.
Significantly, this is only 50% of the USHCN 1,218-station official TOBs-adjusted, homogenized average trend of +0.26 C/decade.
It is also significant that this 50% reduction in the official U.S temperature trend is very close to what Anthony Watts and co-workers obtained in their 2015 analysis using the very best-sited USHCN stations.
I also include the polynomial fit in Fig. 5, since my use of the fourth root of the population density is not meant to perfectly capture the nonlinearity of the UHI effect, and some nonlinearity can be expected to remain. In that case, the extrapolated warming trend at zero population density is close to zero. But for the purpose of the current discussion, I will conservatively use the linear fit in Fig. 5. (The logarithm of the population density is sometimes also used, but is not well behaved as the population approaches zero.)
Evidence that the raw ISD station trends are of higher quality than those from UHCN is in the standard deviation of those trends:
Std. Dev. of 1,218 USHCN (raw) trends = +0.205 deg. C/decade
Std. Dev. of 311 ISD (‘hourly’) trends = +0.128 deg. C/decade
Thus, the variation in the USHCN raw trends is 60% greater than the variation in the hourly station trends, suggesting the airport trends have fewer time-changing spurious temperature influences than do the USHCN station trends.
Conclusions
For the period 1973-2020:
- The USHCN homogenized data still have spurious warming influences related to urban heat island (UHI) effects. This has exaggerated the global warming trend for the U.S. as a whole. The magnitude of that spurious component is uncertain due to the black-box nature of the ‘homogenization’ procedure applied to the raw data.
- An alternative analysis of U.S. temperature trends from a mostly independent dataset from airports suggests that the U.S. UHI-adjusted average warming trend (+0.13 deg. C/decade) might be only 50% of the official USHCN station-average trend (+0.26 deg. C/decade).
- The raw USHCN trends have 60% more variability than the raw airport trends, suggesting higher quality of the routinely maintained airport weather data.
Future Work
This is an extension of work I started about 8 years ago, but never finished. John Christy and I are discussing using results based upon this methodology to make a new U.S. surface temperature dataset which would be updated monthly.
I have only outlined the very basics above. One can perform similar calculations in sub-regions (I find the western U.S. results to be similar to the eastern U.S. results). Also, the results would probably have a seasonal dependence in which case that should be calculated by calendar month.
Of course, the methodology could also be applied to other countries.
In 1975 I took a course called In Urban Meteorology from Garstang and Pielke. This is consistent with what they taught 45 years ago.
Measuring land temperature is proxy for measuring global surface air temperature.
{and as side note, I would say global surface air temperature is proxy for measuring ocean temperature which is about 3.5 C, or could say the effects of ocean temperature is global surface air temperature}
Anyhow, in terms global air, it’s controlled by surface temperature and by most of the surface which is ocean surface.
And my question is why can’t we measure ocean surface by using satellites.
It’s said [by others] that average ocean surface temperature is about 17 C, but would guess this was said, even before we had satellites.
But apparently it’s uncertain about what exactly meant by ocean surface. As far as I am concerned is the skin temperature of ocean, averaged. Or 1 cm or less of ocean surface.
Also since people living on land, and most people are living in cities, it does not matter, why it’s warm or cold, they would simply want to know what the air temperature, is. And what feels like due to humidity is likewise, useful.
Also since people acclimate to whatever the conditions {and one’s mental state can affect how warm or cool it seems like} one could additionally focus on daily changes of temperatures- ie, the high or low temperature will be 5 or 10 C warmer, or colder, tomorrow, could be useful.
Or if going somewhere else, the differences between that place and place where you are- before you leave it- could be useful.
Anyhow, being in the Computer/Information Age, it seems UHI will become less significant as people should have less need to live in cities. And despite ever increasing energy usage of servers, would result reduction overall energy use. And when we put all the servers in orbit- it will be better.
My impression is that the best temperature measurements for the US continuous 48 states are:
USCRN (surface), and
UAH (satellite)
… but they are not included here.
I know USCRN is not long term but it is supposedly the best network of US weather stations.
The big picture is our planet has been warming since the 1970s, and no one knows the exact number. I would expect the government bureaucrats compiling the temperature statistics to be biased in favor of reporting too much warming, intentionally, or unintentionally.
Issues that matter more than UHI to me include NASA claiming a record high temperature in central Africa, where THERE ARE NO WEATHER STATIONS AT ALL.
Most important is the most basic question almost never discussed: Is global warming good news, or bad news?
We have all lived with global warming since the 1970s, and most of us have enjoyed it. Warming has most affected colder areas, mainly during the colder months of the year, and mainly at night. If that pattern of warming continues, that would be even better news.
Economic growth (cement, asphalt, bricks, etc.) in the vicinity of a weather station has to cause cause warming.
Whatever the urban heat island effect is, 71% of the planet is water, and not affected.
My old theory was that global warming was mainly caused by extraterrestrial space dust, and cosmic rays … but now I have a new theory: Global warming is caused by billions of people and animals exhaling carbon dioxide. More people and animals on the planet = more exhaled CO2 = more man made global warming. The solution is for people to be lazy — no exercise or strenuous work that would cause heavy breathing. I hope to win some kind of prize for this theory.
My new theory, is people don’t complain much about the temperature if living at the beach. And we could live in ocean settlements where everyone could live on the beach {and with low cost housing}.
Some people like to live in desert, but a lot people find tropical island paradises, appealing.
I think you present a well thought out argument here. Obviously I’d like to see this published and have other experts weigh in before drawing any conclusions. One obvious discrepancy that would need to be resolved is the +0.17C/decade trend from UAH TLT. Perhaps the +0.13C/decade throw out here is underestimated by 30%? Or perhaps there is a US based variation of the mid troposphere hotspot in play? Also, what does reanalysis show for the USA48 region?
All of these trends have error bars which are not well known. Also, the tropospheric trends cannot be expected to match the surface trends over such a “small” area (~2% of the Earth).
Much appreciated. Thanks.
“Black-Box Nature” (Translation-Opaque and Unscientific)…LOL!
Roy,
This work is hot trash. If there is a heat island effect why would it be linear with density? This seems like the obvious first step in the work. Determine the functional form of the
Why would extrapolating to zero density in Fig 5 give the “actual” change in temperature? Surely there’s some nonzero density where the heating effect on instruments is negligible. I think we could just as well argue from the data presented that the actual trend is 0.2 deg/decade and that a population density of 81 persons per km^2 has the exact same impact on the measurements as a population of 0 persons per km^2. You really need to put some real time in to show there’s any effect at all between 0 and 81 persons per km^2. There’s barely any data below 16 persons per km^2. This seems to correspond to warming of 0.18 deg/decade.
The correlations themselves are also hot trash. The trends that you claim belong to the data presented is very difficult to believe. The slope of your linear fits can be easily moved in one direction or the other without significantly changing the correlation. In Fig 2, you do a linear fit to one set of data and a 2nd order fit to the other.
I cannot understate the importance of the following line: Homogenization adjustments can theoretically make the rural and urban trends look the same, but that does not mean the UHI effect has been removed.
That’s the first-order homogenization algorithm. NOAA uses a second homogenization algorithm to blend and obscure even more detail. And that’s primarily on the land-surface record; the ARGO buoy system has its own adjustment errors covering 70% of the globe (each data point representing ~200k sq kms.)
If the temperature record was robust enough in 1880 with as few widely dispersed locations as existed back then, then the same level of granularity can suffice today to establish and track a GMT. But if not, then one has to question with what veracity the pre-1950 global temperature record actually conveys — and with it, the entirety of the 1:1 CO2-to-GMT relationship NOAA and NASA are trying to paint themselves into.
Still not persuaded!
If I suddenly build an airport or a small town in a rural area, the average temperature will be suddenly warmer than the surrounds due to the UHI effect. But, and consider this carefully, thereafter if nothing else changes, the temperature does not continue increasing. It simply remains at the higher value. There is no reason for it to continue increasing ad infinitum.
i.e. relating temperature TRENDS to absolute population is faulty logic. The UHI effect can only be detected by relating temperature TRENDS to population TRENDS.
“Fig.2. USHCN station temperature trends are correlated with population density, which should not be the case if the Urban Heat Island effect on trends has been removed.”
Wrong! Even if there is a slight correlation between population and temperature trends, this is an erroneous conclusion. What is really happening is that the more densely populated regions are most likely GROWING at a faster rate than the less densely populated regions.
The bottom line is that trying to account for UHI effects based on population only is misleading.
And yet, with the same population in prosperous countries, prosperity increases. It does matter what you imagine how the way things work: what matters is the data shows the warming trends increase with population density.
I also did multiple regression with population densities in 2000 and 2020, to see if an increase over time might (reasonably) be the cause. The results showed a weak dependence on population increase, but just the population density in 2020 explains most of the variance in station temperature trends.
But you are free to disbelieve it.
If you found a weak relationship between aggregated temperature trends and population trends then the obvious conclusion is that there is no relationship between the UHI effect and aggregated temperature trends.
This indicates that the observed aggregated temperature trend for the USA is not artificial.
i.e.you are arguing against yourself.
It may seem intuitive that population trend should be the primary variable. But I think that is only the case if you ignore how humans affect their habitat. They arrive then they develop. As Roy points out prosperity increases.
One also needs to recognize that the greenhouse effect isn’t about making things hotter its about retention of heat and anthropogenic fossil fuel emissions is only one means of retaining heat.
“the population density in 2020 explains most of the variance in station temperature trends.”
If you are talking about Fig 2. The correlation looks extremely poor.
Zero correlation is entirely likely.
where is your math on that Nate?
I agree the correlation, R2 = 0.096, is very low. Maybe not zero but it only explains 10% o the variance.
Yeah. And even that could well be with error.
arggh
within error
Yep and when you consider that Roy’s analysis suggests half the warming variance is potentially UHI that puts the other half of the warming in the error bars as well.
“suggests half”
Maybe half, maybe 0
I know exactly what you are saying and I don’t disagree, but I’m not sure how much that matters. I was thinking that urbanization had already run it’s course by 1980. In that regard I’m not sure how much of a TREND population density has exhibited during this time. I think Dr. Spencer’s point is worthy of more investigation.
The problems I see are 1) there are other explanations for the arrangement of the red data points in Dr. Spencer’s analysis other than UHI contamination 2) the potential discrepancy between the conclusion of +0.13C/decade and other analysis.
It is important for all of us to remember that the UHI effect itself is not the problem. It should not be removed from the individual station records. The problem is the use of urban stations as proxy’s for grid cells that are predominantly rural. We need to take care that the UHI effect is removed when using urban stations in this manner. What I’m getting at is that with 25×25 km grid cells many of these cells are predominantly urban especially in the northeast. Removing the UHI signal from that grid cell would be just as wrong as applying it to nearby rural grid cell. In this context you can see why the analysis in figure 2 above could be misleading since it implies that a regional or global mean temperature will be biased by the UHI when in reality it might not. It depends on how that mean temperature calculation accounts for the UHI effect. There is a distinction that needs to be made between the warming trend of individual stations and the warming trend of a robust (UHI accounted for) regional mean temperature.
And a corollary to the above is that the UHI effect could create a cooling bias in regional and global mean temperature calculations if handled improperly. This would be the case if a grid cell were large enough to have significant rural and urban areas. As rural station counts increase and urban station counts decrease over time in this cell may cause the cell to underestimate the temperature due to the overweighting of rural stations. In fact, this effect may explain some of Berkeley Earth’s conclusion that the UHI bias is actually more likely to be negative after 1960. If such mishandling were to be occurring it would not detectable with Dr. Spencer’s analysis above.
It is for these reasons that I remain skeptical.
I would like to go one step further and suggest that apparent population/trend correlations could also possibly mask the fact that the background warming trend varies geographically.
You might think you have detected a correlation when, in fact, the real reason is that the largest trends occur further north, and that is where the higher density population cities are located.
i.e. evidence of correlation does not guarantee evidence of cause and effect.
Exactly.
“In the last 20 years (2000 to 2020) the increase in population has been largely in the urban areas, with no average increase in rural areas.”
Curious to check against the “pristine” US Climate Reference Network.
https://tinyurl.com/sw24csc
The CRN starts only at 2005, but I would have thought that there would be some differences with NOAA’s US temp record if urbanisation has an impact over the last 16 years.
However, USCRN has warmed ever so slightly more than the official record since 2005 (1.44 vs 1.40 F/decade).
Min and max for CRN and NOAA’s official surface record compared here:
https://tinyurl.com/yxjcmvtj
barry
You are right.
Your graph reminds me a comparison of two stations in Alaska I made two years ago, between
– a ‘bad’ station at Anchorage Intl Airp
– the ‘pristine’ CRN station Kenai ENE, distant by 50 km, in the middle of nowhere.
https://drive.google.com/file/d/1OhCuDiAFUT80Ws4S8XopciaWQTp4rorn/view
Absolute temperatures in Anchorage are at least 2 C higher, but the departures wrt a common reference period (here: 2011-2018, due to Kenai ENE’s short lifetime) look quite nice.
I made several comparisons between USHCN, USCRN, GHCN daily US, including the 71 USHCN stations pompously certified ‘well sited’ by Watts’ surfacestations.org.
The best is that these 71 stations, when compared with about 8000 GHCN stations in the US, show on average less warming in the past and more warming in the present! The data is till 2019, I’ll update the graph.
https://drive.google.com/file/d/1pbQCHFwTTy1HIns9pDNj6mDQ85Vau7NC/view
Great.
But it’s soon 2 am here, and Germans love to say: “Morgen ist auch ein Tag’.
J.-P. D.
This is another piece of evidence that suggests the relationship between population density and temperature as visualized in figures 2 and 5 could be caused by something other than UHI contamination at least after 2005.
Point #1
I have seen the assumption that maximum temperature occurs generally around noon and minimum around midnight written in various discussions but my observation differ markedly. I wonder if actual data supports those particular times of max/min in very many places?
Here, and in a couple of relatively nearby places I’ve lived and worked over the past 30 years or so (withing a 50 mile radius), daytime temperatures peak around 6 PM during the hottest part of the year, falling back to (or moving up from, depending on season) around 3 PM during the coldest part of the year. Noon seems never to be even near the hottest except on heavily overcast winter days with little air movement where the temperature might not vary much between around 10 or 11 AM to somewhere near sundown.
I am often up until the wee hours, even until after the sun is up. While they are no doubt inferior to official weather thermometers, my two thermometers (front and back yards) often continue to show slowly decreasing temperatures until about the time the sky starts getting lighter, which is always long part midnight.
So, once again, does actual data support the idea that maximum is around noon and minimum around midnight anywhere?
Point #2
Even more important, or so it seems to me, if there are hourly temperature reading (more frequent than hourly might be better) why not use the actual recorded high and recorded low, regardless of when they occur?
My understanding might be frightfully deficient, but why does the time make any difference at all? I have read that TOB adjustments make the averages (or perhaps trends) either higher or lower, depending on how they are done, but if the actual highs and lows are known, would it not be more reasonable to just use them, with no adjustments, no assumptions?
Point #3
Also, the highest and lowest temperatures seem quite deficient for representing anything much. Some integration of temperature over time would provide a more realistic view of what actually effects the environment, the people, animals, and plants within it, but then reality could be even much more complicated than that. Here, air movement is extremely important for heat and cold.
The air is sometimes very still for days on end. During the high temperature seasons, that can mean that at midnight the temperature hasn’t fallen all that much from the day’s high. It is difficult to lower the house’s interior temperature much.
On the days with good evening breezes the temperature can come down 20 degrees fairly quickly once the sun has set. In the colder seasons a stiff wind can make even moderate daytime temperatures quite uncomfortable and lower the inside temperature quite markedly overnight. But, I guess all that is a completely different discussion.
My understanding might be frightfully deficient, but why does the time make any difference at all? I have read that TOB adjustments make the averages (or perhaps trends) either higher or lower, depending on how they are done, but if the actual highs and lows are known, would it not be more reasonable to just use them, with no adjustments, no assumptions?
The problem with the time-of-observation is that depending on when the observer records the min/max from the instrument she will unshiftingly double count some mins or maxes. It is important to understand that reading the instrument involves “resetting” it for the next observations. This has little effect on the temperature trend if the TOB stays consistent. But if you switch from say a PM reading to an AM reading you switch the direction of the double count problem. That creates an instant discontinuity in the station’s time series. Now imagine hundreds or even thousands of stations making the switch from PM to AM over many decades. That is where part of the cooling bias comes from. Another component is the transition to MMTS instrumentation.
So I think the answer to your question is that highs and lows as they appear in the record are not always correct and it has nothing to do with the quality of the instrument. It has everything to do with how the instrument was used. For example, if you read the instrument at say 6:00am the instrument will get reset and possibly record a lower value 6:01am which will be applied to the following day even though the low on the following day may have actually be higher. AM observations cause more double counting of lows than double counting of highs. And that’s exactly what happened. Stations slowly began switching from PM to AM observations.
This article is all about automated systems. There is no problem with observers.
This subthread is about time of observation bias, which is not about automated systems.
I’ll take a stab at your #1. The 1200/0000 times are UTC (Zulu), which is -4/-5 for local time on the east coast to -7/-8 on the west coast (depending on whether we are in daylight savings time or not). 1200Z is decent enough for low temps on the east coast, little early for the west coast where 0000Z is decent for high temps on the west coast, little late for the east coast.
Am I allowed to be practical? It seems that urban density has 2 effects. One is the size of the urban area, and the other is the effect of density itself. It is reasonable to assume that increasing the size of the urban area would have a diminishing effect. As growth moves away from the measuring location it should have less effect. One the other hand, construction of larger and taller buildings could have an effect, and vacant lots near the measuring location that get filled in, should definitely have an effect, so I believe the data is supported by a physical analysis.
Taller buildings could shade the weather station, introducing cooler temps after construction.
Changing urban environments don’t always warm the trend for a given station. Station moves from urban area to airports also cooled the record.
Many airports have had a lot of economic growth in the vicinity, and that should cause some warming in the decades after the initial move of a weather station, from an urban environment, to an airport.
In addition, air traffic has increased a lot since the 1960s, as air travel became less expensive. More and more planes using an airport = more heat.
Richard Greene
You write above
” More and more planes using an airport = more heat. ”
Are you sure?
Last year I made some ‘intra CONUS’ comparisons between the well-known set of 71 USHCN stations estimated ‘well sited’ by Watts’ surfacestations.org volunteer team (*) and other, much bigger sets of CONUS stations within the GHCN daily data set.
One comparison was between the well-sited station set and all GHCN daily stations operating within CONUS.
One was between the well-sited station set and all 1260 GHCN daily stations operating at CONUS airports:
https://drive.google.com/file/d/1tbreucKhA5wCgFtPcgKIWGuCiwHe4zCC/view
Don’t you think that if a majority of airports had any UHI problem, this then would not be visible in the chart? Hmmmh.
Of course one could refine the software process by looking, for each airport, at the nearest rural station, and compare the resulting two time series.
I doubt that we would obtain something dramatically different.
J.-P. D.
(*) This set of 71 ‘well-sited’ USHCN stations has been documented by NOAA:
https://tinyurl.com/hqkcju6p
Las Vegas may be a poor example because the desert does not have much plant growth, but the model is probably a good one. I know for a fact that McCarran airport was out in the desert 35 years ago. Today it is literally surrounded by new development. If this had occurred in a forest or grassland area, the effect would have been dramatic. The growth of the airport itself with bigger buildings and parking lots would also contribute.
The Detroit City Airport was located in an urban area with little room for economic development. Then a new Detroit Metro Airport was opened far from the city of Detroit. Over time, the area around that suburban airport became filled up with huge parking lots, hotels, motels, and restaurants. The deregulation of airline ticket pricing led to flights as low as $100 from New York to Detroit — air traffic increased a lot. More recently the airport was significantly expanded with more terminals.
The Dallas Fort Worth airport had very little air traffic when it was first opened. It is MUCH busier now.
On the other hand, La Guardia Airport in NYC was always in an urban environment with little room for economic development in the vicinity.
Every airport is different.
“The magnitude of that spurious component is uncertain due to the black-box nature of the ‘homogenization’ procedure applied to the raw data.”
Is this true? I understood that the methods
https://tinyurl.com/y5cpqwwx
and code
https://tinyurl.com/y4ttgbay
are available online at those links.
For example;
“Because there is not an obvious meso‐scale metric that determines the impact of urban form on temperature in all situations, we examined four different measures of urbanity that are available as georeferenced datasets: satellite‐derived nightlights, urban boundary delineations, percent of impermeable surfaces, and historical population growth during the period where high‐resolution data is available (1930 to 2000).”
Quantifying the Effect of Urbanization on U.S. Historical Climatology Network Temperature Records
Hausfather et al 2013
“More people means more infrastructure, more energy consumption (and waste heat production), and even if the population did not increase, our increasing standard of living leads to a variety of increases in manufacturing and consumption, with more businesses, parking lots, air conditioning, etc.”
Actually in the US, our per-capita energy use has been extremely
flat since the 1970s.
https://www.google.com/search?q=energy+use/per+capita+US&source=lmns&bih=365&biw=982&hl=en&sa=X&ved=2ahUKEwiY_KjqyuTuAhVHLN8KHV3jB2cQ_AUoAHoECAEQAA
You keep posting stuff that has no relevance to his data. Do you just do Google searches until you come up with something you think contradicts his point? He is trying to get an accurate temperature record. What are you trying to do?
“no relevance to his data.”
Man is it hard to get you to use your logic chip, Stephen. Maybe it needs to be replaced.
Then please show how it is relevant to his data? You post a chart of per capita energy consumption. He posted something about air conditioners, infrastructure, population increase. So if 10 people are consuming 20KW/day each in an area and then a year later 20 people are consuming 20KW/day in the same place, who’s going to put our more energy? The 10 people or the 20 people? Please explain instead of posting something that has no meaning.
Trying showing us your mastermind logic chip.
He also said this “and even if the population did not increase…”
Jeez…how did you miss that?
That was what my post was relevant to.
Yes, but per capita consumption doesn’t reveal how the energy is used. Cars have increasingly gotten more efficient. Air conditioners and heat pumps have gotten more efficient. Motors and batteries are more efficient. So, per capita consumption could stay flat while people are using more energy to affect temperature and less energy that doesn’t affect temperature. There is no way of knowing with a general chart you linked.
I guess too I wanted to show you what it feels like. You seem to have a problem with everything he posts. He doesn’t conform to the big climate agenda, so you have a problem. He seems like a scientist who’s in search of the truth. I don’t always agree with him, but he’s what we need, truthseekers.
I have a problem when he makes weak arguments. They are almost always intended to support a political agenda. You like that agenda, so naturally will eat it up without skepticism.
stop being such a nincompoop Nate.
Roy is simply showing a different UHI result using hourly station data where available rather than tmin tmax data that gets fiddled with on time of day adjustments.
I have done enough sampling to know you can’t fix bad data. All you can do is substitute something else. Warming trends have been created by such fiddling.
So you sit here whining about Roy getting an idea to reduce data fiddling and substitution and you whine like a banshee stuck by a spear.
The real problem here is a lot of data on variation that have little or no visible effects.
Its not like the temperature of a town went up and the residents dropped like flies. . . .images of that is specially reserved as massive extrapolations to feed young impressionable minds.
“you whine like a banshee stuck by a spear.”
Not really. I simply pointed out some issues with the analysis. As have others. These are legitimate issues to raise.
Skeptical opinions, different from the party-line are allowed in this forum. But some of you, like the Republican party, are really into Cancel Culture right now.
What are the uncertainties of the linear fit in Figure 5?
Given that this is being extrapolated outside the data range, and the linear fit is based on a forth root scaling, it could well be that the confidence intervals at 0 are very large, and could easily include the “official” warming rate.
Ditto. The R^2 of 0.096 on that linear fit in figure 5 makes me think the standard error of that trend could very well exceed the slope of 0.03.
However when we start about trends within error bars practically nothing survives in the world of AGW beyond normal variation.
For the very reason of this article this is why I think oceanic sea surface temperatures are a much better indicator of just how much or little global warming is taking place, over the long run.
Even better…total oceanic heat content.
Bdgwx, I believe the surface temperature is a good indicator of the mixed layer and since we don’t have total ocean heat content there’s no way to use it anyway. The mixed layer is in contact with the atmosphere. It’s where changes will show up first.
Interestingly, we find the SSTs agree with UAH (and CERES) almost perfectly. Which is a good indication they are accurate.
https://woodfortrees.org/plot/uah6/from:1979/to/plot/uah6/from:1979/to/trend/plot/hadsst3gl/from:1979/to/offset:-0.35/plot/hadsst3gl/from:1979/to/offset:-0.35/trend
Using SSTs back to 1940 gives a a trend of .07 C / decade. I think this is the most accurate figure. Going back further reduces the impact of the AMO, PDO and ENSO on shorter term trends.
https://www.woodfortrees.org/plot/hadsst3gl/from:1940/to/plot/hadsst3gl/from:1940/to/trend
This leaves us with one more significant factor. Increasing ocean salinity. It could be responsible for most of what is left. That would agree with the experimental evidence which shows almost no warming potential for increases in CO2.
https://www.scirp.org/journal/paperinformation.aspx?paperid=99608
” … and since we dont have total ocean heat content theres no way to use it anyway. ”
Aha.
Japan’s Met Agency certainly thinks different about it!
http://www.data.jma.go.jp/gmd/kaiyou/data/english/ohc/ohc_global_1955.txt
Looks like a good approximation, n’est-ce pas?
J.-P. D.
Looks like numbers for the top half of the ocean. That is not total ocean heat content. Never mind that anyone can create a file with some numbers in it.
And Cheng provides his data here.
https://tinyurl.com/3sboqkgt
And the peer reviewed publication can be found here.
https://link.springer.com/article/10.1007/s00376-021-0447-x
Another science free climate paper. Full of assertions with zero actual science.
Yes Richard M
‘We’ know: your genial, fantastic WFT graphs ARE the real, actual science!
As many others, you are a king in discrediting and denigrating what you yourself never would be able to reach a single % of…
J.-P. D.
At least WFT graphs are based on real data and not based on opinion and models. The fact you would think otherwise pretty much explains everything about you.
How would you measure OHC using scientific principals?
“Another science free climate paper. Full of assertions with zero actual science.”
Wachu talkin bout RichM? Looks like normal science, with loads of ocean measurements. Exactly what we need to understand climate change.
Multi-proxy studies are like having multiple variables. Play with 3 variables and you can create and elephant. Add a 4th and you can make its trunk wiggle.
The upper ocean could be warming for a variety of reasons. If the ocean bottom is cooling it will create less vertical mixing in the ocean by increasing stabilization of the temperature profile of the ocean and reduce upwelling. All of that could be part of a LIA recovery.
Upwelling is a very evident process but is poorly measured. Ocean mixing is what gives us ENSO and multi-decadal ocean oscillations and most likely longer lived variation as well.
Much is simply handwaved away in climate science. It is simply assumed that the LIA did not occur but its rapid dip was a natural consistent cooling only interrupted by the industrial age. Sloppy science at best. Instead the 400 to 600 year descent into the LIA may well have been reversed by a reversal of the causes of the dip. . . .a reversal that likely occurred over 300 years ago.
” If the ocean bottom is cooling ”
The ocean bottom is ~ constant 4 C. This is the temperature of highest density water, which ends up on the bottom.
https://www.windows2universe.org/earth/Water/temp.html
Temp profile
Not 4 C for seawater. Closer to 0 C.
Ocean water freezes at about -2C
Yes w density maximum a bit higher than that.
Richard M says: ”This leaves us with one more significant factor. Increasing ocean salinity. It could be responsible for most of what is left.”
That sounds pretty crazy. Why would ocean salinity increase?
NOAA says this: ”Evaporation of ocean water and formation of sea ice both increase the salinity of the ocean. However these “salinity raising” factors are continually counterbalanced by processes that decrease salinity such as the continuous input of fresh water from rivers, precipitation of rain and snow, and melting of ice.”
Hmmm, indeed mankind has created a lot of water impounds but irrigation is increasing and glaciers are supposedly melting. What goes up must come down.
Have you ever thought about doing this for Europe? afaict theyve seen more warming over the last 50 years.
And with low population density increase.
” U.S. temperature trends in the official NOAA 1,218-station USHCN dataset”
…
“This is an extension of work I started about 8 years ago, but never finished.”
The lapse of time shows. USHCN ceased to be the official data set in March 2014. Since then, the NOAA calculations have been based on the much larger ClimDiv dataset. So this analysis is pointless.
“Instead, one must examine the data in a manner like that in Fig. 2, which reveals that even the adjusted USHCN data (red dots) still have about a 30% overestimate of U.S. station-average trends (1973-2020) if we extrapolate a regression relationship (red dashed line, 2nd order polynomial fit) to zero population density. ”
This is the discrepancy underlying most of these results. No-one but Dr Spencer is trying to fit to zero population density. That is fantasy world stuff. The US has a population, and it isn’t going to go away. NOAA, and others who measure the temperature, are trying to measure what it actually is, population and all. They try to remove a UHI bias in the sampling of the US temperature, but they don’t try to emulate that fantasy.
“They try to remove a UHI bias in the sampling of the US temperature, but they don’t try to emulate that fantasy.”
Nonsense.
The actual UHI adjustment is extremely tiny — almost as if NASA wanted to claim they made a UHI adjustment, but didn’t want it to affect their beloved global warming trend.
The reason the adjustment is so small (less than 0.1 degrees in a century) is that roughly half the so called UHI “adjustments” are cooling (?), and half are warming, so the net change is near zero.
That result makes no sense, and I suspect science fraud.
The main problem with surface numbers is not UHI, it is insufficient coverage, especially before World War II
And the result is excessive guessing (infilling) of missing data .. guesses that can never be verified.
So the global average temperature is whatever the government bureaucrats tell you it is. And when they claim a record high temperature in central Africa, where there are no weather stations, just shut up, and don’t complain.
If you don’t trust government bureaucrats, and their infilling, and “adjustments”, the only other choice is UAH.
UAH requires much less infilling, and is measured in a more consistent environment … where the greenhouse effect actually occurs.
Every time I ask for details on the percentage of temperature numbers that are estimated (infilled) for the global average surface temperature statistic, I get a blank stare from climate alarmists.
And that includes Mr. Stokes.
RG said: The actual UHI adjustment is extremely tiny almost as if NASA wanted to claim they made a UHI adjustment, but didnt want it to affect their beloved global warming trend.
It’s not just NASA though. Others have come to the conclusion that the effect is small when applied to global scale averaging. I’ve noticed that those that come to a different conclusion do not produce their own global mean surface temperature datasets. Don’t you find that odd?
RG said: That result makes no sense, and I suspect science fraud.
This is the problem with blogs like this. If someone does not understand something they immediately invoke fraud and conspiracy to rationalize their position.
RG said: The main problem with surface numbers is not UHI, it is insufficient coverage, especially before World War II
Yeah…coverage sucks. I wish we had a station for every sq km that has recorded data for the last 2000 years. But the reality is that we don’t so we have to make the most of what we do have.
RG said: And the result is excessive guessing (infilling) of missing data .. guesses that can never be verified.
When doing spatial averaging with inhomogeneous data you have to infill no matter what. At least NASA and Nick Stokes do it with verified mathematical techniques instead of just assuming empty grid cells inherit the global mean. And although there are legitimate criticisms on the details of these techniques nobody has any serious fundamental objections to their use. In fact, of those that did express legit skepticism they conceded that these techniques are necessary to decrease the uncertainty envelope.
And I bet you anything you could figure out how one could verify the “infilling” in a matter of minutes. Take a stab at it. The most mind numbingly obvious technique has been mentioned several times on this blog.
RG said: So the global average temperature is whatever the government bureaucrats tell you it is.
I’ll let Nick Stokes speak for himself, but I doubt he has government bureaucrats breathing down his neck.
RG said: If you dont trust government bureaucrats, and their infilling, and adjustments, the only other choice is UAH.
Sorry to bust up the party, but UAH makes adjustments. In fact, they don’t even directly measure the temperature. They have to use a complex model to map O2 microwave emissions to meaningful temperature values. Then they employ a finely tuned weighting function to derive the LT temperature from MT, TP, and LS products. And if you saw my post a few days you would know that even the smallest change in this weighting function makes for huge changes in the final LT result. And then even at that it is not even the surface temperature. Dr. Spencer mentions in this very blog tropospheric temperatures have little correlation to surface temperatures on regional scales like USA48.
RG said: Every time I ask for details on the percentage of temperature numbers that are estimated (infilled) for the global average surface temperature statistic, I get a blank stare from climate alarmists.
https://data.giss.nasa.gov/gistemp/station_data_v4/
Another non-answer from perfesser bdgwx
It requires just one number, a percentage, to answer my question about the percentage of infilling, and you have provided a web page … not the answer.
What is the percentage, Mr. Smarty Pants?
I have to suspect you have no idea.
I question the fact that roughly half the NASA UHI adjustments reduce global warming, and roughly half increase global warming.
Economic growth near land weather stations (cement, asphalt, bricks, buildings etc) should increase measured warming very gradually over time.
The UHI number may be small, but almost half the “adjustments” should not REDUCE global warming.
If you can explain (I doubt it) why so many UHI adjustments increase global warming, please share that knowledge with us.
In my opinion that pattern of adjustments smells of science fraud.
Your claim:
“If someone does not understand something they immediately invoke fraud and conspiracy to rationalize their position.”
That is your childish character attack, typical of leftists.
RG said…It requires just one number, a percentage, to answer my question about the percentage of infilling, and you have provided a web page … not the answer.
It is literally right there at the top of the page. And it’s not just one number. It changes over time. That’s why I gave you link.
RG said: The UHI number may be small, but almost half the “adjustments” should not REDUCE global warming.
Why? What evidence can you present that this should not occur?
RG said…In my opinion that pattern of adjustments smells of science fraud.
And yet there is no systematic or widespread fraud to be found.
RG said…That is your childish character attack, typical of leftists.
Whoa…time out. First…I think you have me confused with someone else. I’m not a leftist. Second…I’m not attacking your character at all. I’m sure you a great person and I’d imagine we’d probably get along just fine if we met in person. In fact, I’m certain we would. But being a great person is not an excuse for someone to invoke fraud and conspiracy to rationalize their position.
“It requires just one number, a percentage, to answer my question about the percentage of infilling, and you have provided a web page”
A webpage that tells you not only the percentage of coverage, but also what that coverage is depending on which year in the record. More than you asked for, and why a simple single number doesn’t cover it.
I don’t think you try to understand, you seem to only want to discredit.
I’m still waiting for the number. Of course it will vary from month to month. I don’t expect every month. The most recent month will do. I’m waiting very patiently. I ask questions. You fail to answer them. I would think you are more curious than that, being a big fan of surface temperature numbers.
Data that follow are a few years old:
… the National Climatic Data Center (creatred) a US dataset
with a large number of “contiguous United States” weather stations, called the U.S. Historical Climatology Network
( USHCN ).
Almost all of the station records are fairly long and complete — there are several rural and urban stations located in each of the U.S. states.
Of the 1,218 USHCN stations about 23% are very rural, and about 9% are highly urbanized.
Both US subsets show similar trends:
— Warming from the 1890s to the 1930s
— Cooling from the 1930s to the 1970s
— Warming from the 1970s to the 2000s
Most of the US weather stations with records going back
to the late-19th century (or earlier) are urban stations.
( The longest station records are mostly in Europe, and
North America), far from a good global distribution.
The rural US stations agree with the urban stations that the 1990s-2000s were warmer than the 1960s-1970s, but disagree
over how much.
The urban US stations imply the 1990s-2000s were the the warmest decades on record, but the rural stations imply it was as warm in the 1930s !
NASA-GISS divided their weather stations into “urban stations” and “rural stations”.
Since 2010, that division was based on night-light intensity in the location of the station (using satellite data).
For every station identifies as “urban”, there is an individual urbanization bias adjustment, using the following method:
A “rural average” is calculated for the urban station by averaging together the trends of all of the rural neighbors in a 500 km radius (or 1000 km, if there aren’t enough within 500 km).
The difference between the urban station record and the rural average is then calculated, and assumed to be “the urbanization bias”.
The urbanization adjustment is calculated by approximating the difference using a linear fit.
However, because urbanization is not a simple linear process, they use a two-part adjustment.
They calculate two linear fits – “Leg 1” is the linear fit for the first part of the record, and “Leg 2” is the linear fit for the second part of the record.
About half of all the linear adjustments their computer program calculates say the UHI causes cooling, rather than warming.
“Urbanization bias” due to “urban cooling“ ?
Details:
15% Both adjustments are “urban warming”
9% Both adjustments are “urban cooling”
76% One adjustment is “urban warming, and the other adjustment is “urban cooling”
The “urban cooling” adjustments do not make sense.
They do not make sense because I am not gullible, as you are, when government bureaucrats tell me what to believe!
“I’m still waiting for the number.”
Despite the figures being linked for you, you want someone to write in a comment here?
Since 1985, the global coverage has been roughly 81%.
It’s a very simple matter of looking at the chart, adding the North and South hemisphere results and dividing by two.
What issue resides within you that you are incapable of doing this yourself when it is laid out for you? Is it arrogance? Incompetence?
Whatever the answer, it will also be the reason you fabricate so much.
“The urban US stations imply the 1990s-2000s were the the warmest decades on record, but the rural stations imply it was as warm in the 1930s!”
I call BS. I’d ask you to substantiate, but I expect that you will not bother, as usual. Others provide links to help you out, but the street is one way for you.
That web page does not answer my question.
You have not answered my question.
Bdwgx has not answered my question.
Nick Stokes has not answered my question.
I’ll make it as easy as possible:
Pick any one month, of any year, and you tell me what percentage of the temperature numbers in the global average for that month have been estimated (by “estimated”, I mean the number was infilled by government bureaucrats, and NOT based on actual measurements FROM THAT WEATHER STATION)
It seems like an easy question.
It seems like climate alarmists would want to know the answer.
So what is the answer?
On February 12, 2021 at 12:48pm, long after his bedtime, “Barry” provided a non-answer to my question.
Of all the numbers used to calculate a global average temperature in any month, I wanted to know what percentage were made up numbers, aka infilled.
Obviously, a surface grid with no weather stations at all requires a made up number. The “coverage” number may explain this infilling.
But there will be other weather stations, with some missing data, that also require a made up number. The coverage number is not likely to explain this infilling.
My question is what percentage of all the numbers used to compile a global average temperature are made up numbers rather than real data.
The percentage for any one month would be sufficient.
I would prefer data from long ago, perhaps before World War II, but any month will do.
In my opinion the “coverage” number does not reveal the TOTAL percentage of infilling … although it is ALREADY large enough to make the official claims of a +/- 0.1 degree C. margin of error, for the global average temperature, appear to be science fraud.
RG,
Here is a comprehensive breakdown of the GISS uncertainty.
https://csas.earth.columbia.edu/sites/default/files/content/Lenssen_et_al-2019-Journal_of_Geophysical_Research__Atmospheres.pdf
The uncertainty is actually less than 0.1C and has been since at least 1960.
And I guess I don’t understand your question regarding the percentage. Can you provide more details so that I can better understand it?
RG,
Something that might help facilitate the discussion is the GISTEMP methods paper.
https://pubs.giss.nasa.gov/docs/1987/1987_Hansen_ha00700d.pdf
Read through and make sure you understand how GISTEMP computes the global mean.
Unfortunately until I get more clarification on your question I’m sticking with the answer that there is about 80% coverage which means 20% of the subboxes are “infilled”. Note that “infill” does NOT mean that temperatures are simply “made up”. It means that the subbox inherits the temperature of its neighbors. The full procedure is actually quite clever. If you want we can discuss it to ensure there is mutual agreement on the way it works.
I don’t know why all the comments do not have a “reply” button or maybe it’s just my computer. Or a conspiracy!
If 20% of surface grids were infilled, then that is already a lot of wild guessing.
Far too much wild guessing to claim a +/- 0.1 degree C. margin of error, EVEN TODAY, much less in the 1800s.
And don’t tell me that infilling in place of ACTUAL MEASUREMENTS is not wild guessing.
At best it is “educated guessing” by people biased to want more global warming, for job security, and to support their predictions of fast global warming.
“Educated guessing” by people likely to be biased = wild guessing.
While there are surface grids with no weather stations, there are also surface grids with one of more weather stations, some of which may have some, or all, missing data for any given month.
Those missing data must be infilled too.
I have evidence that infilling of data points for any given month is higher than 20 percent … and 20 percent is already a lot of guessing without data.
In addition, when raw temperature data are “adjusted”, for any reason, they are no longer data.
They become opinions of what the data would have been if measured accurately in the first place.
The “adjustments” become suspicious when they are done a month, year, or many decades AFTER the actual measurements, or there are multiple “adjustments” of the same data.
Any organization that claims a +/- 0.1 degree C. margin of error for temperature statistics that start in the 1800s, with few land weather ,stations, and ocean measurements with a bucket and thermometer used by untrained sailors, almost entirely in Northern Hemisphere shipping lanes, is practicing science fraud.
RG,
There is a lot of rhetoric in your post that I could address, but I’m not sure it would do any good at this point.
Let me just cut to the chase. How would YOU go about computing the global mean temperature from GHCN and ERSST?
bdgwx says:
”This is the problem with blogs like this. If someone does not understand something they immediately invoke fraud and conspiracy to rationalize their position.”
You are doing the same thing bdgwx. How does saying something involves fraud and conspiracy have any reflection on what they understand?
I agree with you that it is not fraud. The only fraud that exists in the world of academic science is plagiarism and data falsification. And technically even that isn’t fraud its simply grounds for dismissal.
Academic science is designed for scientists to glean what they want out of it. Grant science is designed for their funders. And science designed for the public like medicine you need one helluva lot more vetting than the science community’s opinion of it.
The science community’s opinion is whatever is best for science like any other community that enjoys free speech advocates for what is good for them. Some communities don’t enjoy those freedoms as they operate under professional standards as licensed doctors, engineers, accountants and more and must limit what they offer in that capacity to the public.
So if its a conspiracy its not a criminal conspiracy at least and in the academic world its only grounds for dismissal if it runs against the internal politics of the hirer. . . .which course is what tenure was designed to protect.
No. I do not invoke unsubstantiated accusations of fraud to justify my position. My position can be justified by the abundance of evidence. In other words, I do not accept AGW just because some contrarian may have presented his argument in bad faith. I accept it because of the evidence.
I’m not even sure contrarian viewpoints even when presented in bad faith could rise to fraud since fraud generally requires an expectation of credibility and accountability. Bona-fide experts generally have a high bar of accountability while non-affiliated contrarians have a very low bar if there is any accountability at all that is. And I happen to think it is completely fair. That is bona-fide experts trying to legitimately advance scientific understanding should be held to a higher standard while those that only criticize without providing any useful insights to science and who invoke unsubstantiated accusations of fraud themselves should have the right to continue to do so unimpeded. Science will always win in the end regardless.
Bdgwx you claim your point of view is supported by experts. So does everybody else.
There is plenty of just bad papers out there that get stamped by funders and powers that be as the best science available when its questionable its even science.
You talk about high levels of accountability for so-called bona-fide experts as if there was any reality at all to that. But you don’t say what that accountability is.
An expert is somebody who should understand enough about a topic top to bottom to provide reliable advice. Instead, science trundles along like Michael Crichton outlined in State of Fear; where one scientist accepts officially anointed nonsense and expounds on it as it were a certain truth.
It isn’t codified fraud its hog’s lined up at the feeding trough feeding on the ‘science on demand’ brought up by Lindzen in his essay ignoring any personal skepticism or self assessment as a true expert simply doing what they get paid to do.
Nick Stokes says
“The US has a population, and it isnt going to go away. NOAA, and others who measure the temperature, are trying to measure what it actually is, population and all.”
I think you make a great point Nick and makes this(Spencer’s)type of research even more valuable. Most of the disagreements on AGW center on natural cycles vs. the man-made component of temperature change. However, I don’t hear much on urbanization vs. CO2 impacts on the instrument record. It is mostly a CO2 discussion.
From a philosophical perspective, if increasing Earths measured average temperature is bad, would we not want to know the various components of that increase to make informed decisions. i.e. if it is strictly natural cycles, how can man interfere to control average temperature, seed the atmosphere with a reflecting agent? if it is urbanization do we spend trillions to add trees to our cities? And if it is CO2, do we forgo fossil fuels sooner than existing supply would have allowed increasing energy cost at a faster rate?
Of course there is always going to be the question of who decides what the best average temperature is and even if using an average makes any sense given regional differences. Anyway, thought is was a great comment.
“However, I don’t hear much on urbanization vs. CO2 impacts on the instrument record. It is mostly a CO2 discussion.”
The urban heat island effect has been studied for more than 50 years…
https://agwobserver.wordpress.com/2009/12/27/papers-on-urban-heat-island/
…and examined in all IPCC reports from the first in 1990 to the most recent in 2013.
“if increasing Earths measured average temperature is bad, would we not want to know the various components of that increase to make informed decisions”
That’s what the IPCC (and the research it relies on) has been doing for 30 years.
Complete nonsense from barry
A question was asked by Billy Bob:
if increasing Earths measured average temperature is bad, would we not want to know the various components of that increase to make informed decisions
Barry answered:
“Thats what the IPCC (and the research it relies on) has been doing for 30 years.”
COMPLETE NONSENSE !
The IPCC has been trying to blame global warming on humans since 1988, while claiming natural causes of climate change, which had caused ALL climate change for 4.5 billion years, are just “noise”.
The explanation for this alleged change, from natural causes of climate change, to man made climate change, is never proven — it is just assumed.
100 percent of the warming in the 20th century COULD have had only natural causes.
Claiming the warming in the 20th century is unprecedented, and could only have man made causes, is science fraud — your favorite kind of “science”, Barry !
“The explanation for this alleged change, from natural causes of climate change, to man made climate change, is never proven it is just assumed.”
This is pure bullshit, Richard.
“Claiming the warming in the 20th century is unprecedented….”
IPCC doesn’t claim that. IPCC points out that there were periods in the past that were warmer. Don’t fabricate, Richard.
“…and could only have man made causes…”
IPCC says warming in the early part of the 20th century was partly due to natural causes.
Why do you fabricate?
Unlike you, nasty Barry, I read — you fabricate!
I have read the IPCC Summary for Policymakers, even though the final draft is written by leftist politicians and leftist activists who are biased, believing that CO2 is the devil ion the sky.
Here is a quote from the BEGINNING of the 2019 version:
“Summary for Policymakers (2019)
A. Understanding Global Warming of 1.5C
A.1 Human activities are estimated to have caused approximately 1.0C of global warming above pre-industrial levels, with a likely range of 0.8C to 1.2C. Global warming is likely to reach 1.5C between 2030 and 2052 if it continues to increase at the current rate.”
It seems to me that first sentence implies humans are the cause of global warming since the (not specified) “pre-industrial levels”. and will be the cause of future warming
What warming is being attributed to natural causes in that VERY IMPORTANT first sentence of the IPCC Report?
Barry, you have a convenient memory. “Unprecedented rate of warming” is often used by Bill Nye the Science Guy.
I didn’t see Bill Nye’s name on the IPCC contributor list. Maybe I just missed it?
I see that Barry also becomes a ‘nasty’ person for pointing out the obvious flaws in RGs claims.
Richard, “with a likely range of 0.8C to 1.2C.” clearly allows room for part of the warming to be natural.
Various papers (eg Hansen 81) explained the temperature record in terms of a combination of natural (sun, volcanoes), and more recently (ENSO, ocean cycles) and anthro (CO2, aerosols).
When Bill Nye goes on CNN and MSNBC and spouts these idiotic claims, I don’t see you or anyone of your ilk or anyone on IPCC publically stating, “Bill doesn’t speak for us.” All we hear is crickets from the so-called 97%.
Cancel culture at work here? Bill Nye can express any opinion he wants.
Just as anybody can write what they want in denialist blogs.
Bill Nye does not speak for me.
The IPCC back up reports are released months after the Summary for Policymakers, for good propaganda reasons.
After people are told the conclusions in the Summary, they have no opportunity to look up the details to see if the conclusions exaggerate, omit uncertainties, omit assumptions, etc.
It also does not matter what the IPCC said in the 1980s or early 1990s.
It does matter what they say NOW, and natural causes of climate change are not featured in the Summary for Policymakers.
If you want to go far back in time, when the IPCC was almost an honest organization, rather than a leftist propaganda machine … they provided wisdom about climate science that seems completely missing from recent Summaries for Policymakers:
“14.2.2
Predictability in
a Chaotic System”
The climate system is particularly challenging since it is known that components in the system are inherently chaotic; there are feedbacks that could potentially switch sign, and there are central processes that affect the system in a complicated, non-linear manner.
These complex, chaotic, non-linear dynamics are an inherent aspect of the climate system.
As the IPCC WGI Second Assessment Report (IPCC, 1996) (hereafter SAR) has previously noted, future unexpected,
large and rapid climate system changes (as have occurred in the past) are, by their nature, difficult to predict.
This implies that future climate changes may also involve surprises.
In particular, these arise from the non-linear, chaotic nature of the climate system
… Progress can be made by investigating non-linear processes and sub-components of the climatic system.
These thoughts are expanded upon in this report: Reducing uncertainty in climate projections also requires a better
understanding of these non-linear processes which give rise to thresholds that are present in the climate system.
Observations, palaeoclimatic data, and models suggest that such thresholds exist and that transitions have occurred in the past.
… Comprehensive climate models in conjunction with sustained observational systems, both in situ and remote,
are the only tool to decide whether the evolving climate system is approaching such thresholds.
Our knowledge about the processes, and feedback mechanisms determining them, must be significantly improved in order to extract early signs of such changes from model simulations and observations. (See Chapter 7, Section 7.7).
14.2.2.1
Initialization and
flux adjustments
” … Models, by definition, are reduced descriptions of reality and hence incomplete and with error.
Missing pieces and small errors can pose difficulties when models of sub-systems such as the ocean and the atmosphere
are coupled.
As noted in Chapter 8, Section 8.4.2, at the time of the SAR, most coupled models had difficulty in reproducing a stable climate with current atmospheric concentrations of greenhouse gases, and therefore non-physical flux adjustment terms were added.”
In plain English — the climate models are “all fluxed up”.
Richard,
“I have read the IPCC Summary for Policymakers… Here is a quote from the BEGINNING of the 2019 version:”
That’s a Special Report that IPCC does in between the larger reports, not the IPCC state-of-the-science report on climate change that comes out every 6 to 8 years.
Special Reports have a narrow focus, and this one was about mitigation pathways.
In every IPCC assessment report, there is plenty of attention given to other causes of long and short term global temperature change (and sea level and precipitation change), and what their contribution might be on various time scales. Attribution studies are a key element in understanding what drives short and long term changes.
The chapters on observations, radiative forcing and attribution detail how natural influences are assessed against the trmperature record. Every SPM mentions the assessment of natural forcing and variability.
1990 First Assessment Report (FAR) Summary for Policymakers:
“What factors determine global climate?
What natural factors are important?
How do we know that the natural greenhouse effect is real?
How might human activities change global climate?
1995 SAR Summary for Policymakers:
“Any human-induced effect on climate will be superimposed on the background “noise” of natural climate variability, which results both from internal fluctuations and from external causes such as solar vaiiability or volcanic eruptions. Detection and attribution studies attempt to distinguish between anthropogenic and natural influences.”
2001 TAR Summary for Policymakers
“Changes in climate occur as a result of both internal variability within the climate system and external factors (both natural and anthropogenic). The influence of external factors on climate can be broadly compared using the concept of radiative forcing. A positive radiative forcing, such as that produced by increasing concentrations of greenhouse gases, tends to warm the surface. A negative radiative forcing, which can arise from an increase in some types of aerosols (microscopic airborne particles) tends to cool the surface. Natural factors, such as changes in solar output or explosive volcanic activity, can also cause radiative forcing. Characterisation of these climate forcing agents and their changes over time (see Figure 2) is required to understand past climate changes in the context of natural variations and to project what climate changes could lie ahead. Figure 3 shows current estimates of the radiative forcing due to increased concentrations of atmospheric constituents and other mechanisms.”
2007 AR4 Summary for Policy Makers:
“Changes in the atmospheric abundance of greenhouse gases and aerosols, in solar radiation and in land surface properties alter the energy balance of the climate system. These changes are expressed in terms of radiative forcing, which is used to compare how a range of human and natural factors drive warming or cooling influences on global climate. Since the TAR, new observations and related modelling of greenhouse gases, solar activity, land surface properties and some aspects of aerosols have led to improvements in the quantitative estimates of radiative forcing.”
2015 AR5 Summary for Policymakers:
“C. Drivers of Climate Change
Natural and anthropogenic substances and processes that alter the Earth’s energy budget are drivers of climate change.”
Richard G: The explanation for this alleged change, from natural causes of climate change, to man made climate change, is never proven — it is just assumed.
1990 FAR concluded it was not yet possible to detect a anthropogenic signal emerging from the envelope of natural variability.
1995 SAR concluded that although natural variability was still able to explain global temperature change, “Nevertheless, the balance of evidence suggests that there is a discernible human
influence on global climate.”
2001 TAR concluded “In the light of new evidence and taking into account the remaining uncertainties, most of the observed warming over the last 50 years is likely to have been due to the increase in greenhouse gas concentrations”
Confidence in detecting a human signal arising out of natural variability firmed up over time. It was never a given that natural influences are nil. The IPCC has always assessed the impact of all factors that could reasonably have an impact on climate.
Richard Greene: “The explanation for this alleged change, from natural causes of climate change, to man made climate change, is never proven — it is just assumed.”
If you mean, as I thought you did, that the IPCC simply assumes that carbon dioxide is the dominating factor in recent climate change without bothering to weigh the evidence for natural factors, then your statement, as I said, is bullshit.
The IPCC reports are freely accessible. Type in the 4 letters, go to the wbesite, do a bit of very elementary research. It’s all indexed. Educate yourself.
I was really referring to the discussion on this blog. Over the years, this blog mostly has centered on added CO2 GHE vs. natural variation. There is tons of research on UHI, and some of it older than 30 years. I remember studying it at Rutgers in the 80’s and it wasn’t new then either.
Thanks for the link though Barry, will take a look to see if there is anything interesting that I may have missed.
Urban areas are something like 1% to 2% of our planet’s surface.
So UHI warming in or near urban areas, over time, should be small.
But more than 1% to 2% of land weather stations are in urban areas.
So the first question is why?
People put weather stations where they live.
Figure 1 shows an very interesting statistic.
The fat part of the uhi effect is around 625 persons per sqkm.
That works out to only about 2 1/2 persons per acre.
Typical suburban development puts about 4 to 10 houses per acre with an occupancy of an average of about 2.7 persons per household. This ratio includes about 50% space for schools, small retail, parks, and roads.
One of the problems I noted with the Berkeley Earth examination of UHI is they were doing comparisons within the urban zone, specifically to dense urban to less dense urban.
It must have been designed out of ignorance about where the UHI bubble actually exists. . . .which just goes to show one good experiment is worth more than all the bad ones.
The defined urban areas in the US increased by 47% between 1974 and 1997. I haven’t found a trend chart for after 1997.
When you get to the 4 units per acre figure (approx 6k sqft lots) your density per acre is 4 times the fat part of the curve 2400 persons per sqkm. At that point in time folks are spending the next 30 years growing trees around their homes.
Roy’s graph shows virtually no urban warming for the dense urban development at 10 homes per acre (8,000 persons per sqkm), here there is far less opportunity for tree gardens.
Before anybody jumps all over this, there is much to look at here. I find figure 1 tantalizing. When one rolls up a lot of information into so-called urban clusters which I haven’t really figured out from an acreage/development standpoint it may be that what needs to be looked at is the process of deforestation and land grooming that precedes the expansion of suburbia.
Berkeley Earth’s analysis was with sites they classified as “very-rural” which means no urban influence within 1 degree lat/lon per the MOD500 dataset. These “very-rural” subset of stations warmed more than the set of all stations.
https://static.berkeleyearth.org/papers/UHI-GIGS-1-104.pdf
The MOD500 dataset is highly developed urban comprising .5% of the land. Using the GRUMP urban dataset you get 2.5% of the land.
Thats what is interesting about Figure 1 the most warming is occurring in the bottom .5% of urban land and there is essentially no UHI in the upper .5% (in terms of trends vs actual absolute UHI).
So to find the interesting stuff you need to increase your focus.
https://smap.jpl.nasa.gov/system/internal_resources/details/original/288_046_urban_area_v1.1.pdf
Note Section 2.4
Now that is the type of contribution to this blog I can absolutely accept. Berkeley Earth should redo their analysis with GRUMP and see what changes.
What I would like to hear is why Roy’s proposition of using hourly station data as opposed to relying upon uncertain time-of-observation adjustments in the USHCN dataset.
I have heard many weather experts say that that process of time of day adjustments treat station managers like programmed robots in it is assumed the time of the Tmax and Tmin is a certain time versus the time the station manager recorded it.
It is that kind of data fiddling that increases skepticism. And to be clear I am not alleging fraud, such outcomes can result simply due to the presence is some more rapidly warming stations coupled with a strong belief the warming arises from an identified source other than UHI.
That has been essentially the same approach with ARGO where ocean temperatures simply must be globally increasing due to sealevel rise from everything from ice melt to continental uplift. Those may be reasonable assumptions but reasonable assumptions go awry pretty randomly.
“That has been essentially the same approach with ARGO where ocean temperatures simply must be globally increasing due to sealevel rise”
I didn’t understand your comment here. ARGO measures temps by measuring temps, not by extrapolating from sea level rise. Sea level rise is alluded to as corroborating evidence of increasing ocean heat content.
Barry, ARGO adjustments arose in 2009 when it was discovered the ocean was cooling. Methodology involved comparing data to sealevel rise, models, and estimates of SSTs from other methods. When done NOAA reversed its viewpoint solely on the need for being consistent with other means of estimates that the ocean was warming.
Adjustment method was to toss out buoys suspected of leaking without confirmation.
Originally there was going to be a study on these buoys which never emerged, thus its reasonable to say the adjustment process continues in the absence of such a study.
Are there leaking buoys? Most likely yes.
Does such leaking to the extent it occurs reduce ocean warming. Yes.
Does it make sense to have a program that identifies leaking buoys? Yes
Has such a program been implemented? To my knowledge not to the extent of actually verifying the buoys that are leaking.
Like in any true scientific endeavor the question arises what we are actually using to determine rate of climate change in the ocean. The question should be transparently answered and available. If its a case that due to may lack of access to information my view is outdated a simple reference could put my mind at ease.
“ARGO adjustments arose in 2009 when it was discovered the ocean was cooling.”
The usual conspiracist BS from Bill.
There is no evidence of adjustments made by them because the ocean was cooling.
Aha Nate right on cue ready willing and able, as usual, to both demonstrate his ignorance and make a statement certain about which he knows nothing about.
Here is about version 6 of how adjustments were made to the ARGO system. By now in view of lawsuits launched by manufacturers of the probes discussion of leaks in the buoys had been edited out of the original document.
https://earthobservatory.nasa.gov/features/OceanCooling/page1.php
“made by them because the ocean was cooling.”
Technical problems yes. No surprise there. Corrections made yes.
Because of cooling, no. Bill BS.
Did I claim the ocean was cooling Nate? Nope I didn’t.
I am just interested in science investigating the matter.
According to the article and quite a few other versions leading up to the last one – technical correction was applied unscientifically.
Having a confab and picking a favorite isn’t science Nate. . . .in fact its not even technical.
“technical correction was applied unscientifically.”
Don’t see that. Are you making that up?
There is nothing scientific about confabs.
Errata…1 degree lat/lon should have been 0.1 degree lat/lon.
WUWT had an article on this around the time the Berkeley Earth paper was released with aerial photos (may have been Boston area) of zones defined as rural in the same aerial photo with the urban. So .1 degrees would be something around 6 miles versus 60 where it would be difficult to see the actual development.
I guess the bottom line roughly suggested by Figure 1 is on a density basis MOD500 grids and rural grids have something in common, namely no population trend. Who would have thought?
An alternative analysis of U.S. temperature trends from a mostly independent dataset from airports suggests that the U.S. UHI-adjusted average warming trend (+0.13 deg. C/decade) might be only 50% of the official USHCN station-average trend (+0.26 deg. C/decade).
The official USHCN trend is highly altered and has the airport data been adjusted for aircraft exhaust emissions impact.
Raw data from 1895 to the present graphed by realclimatescience.com does not reveal a warming trend.
https://realclimatescience.com/2021/02/coldest-valentines-day-on-record-2/ (graphs 5:15 mark)
You cannot use the raw USHCN data to deduce temperature trends due to TOB bias, instrumentation bias, station move bias, urban heat island bias, etc.
Climategate revealed the data altering was premeditated and was designed to disinform.
Dr. Spencer’s paper is meant to provide support to a highly altered USHCN data set and inaccurate projection.
I just lost all respect for him.
NASA and NOAA are producing not but propaganda.
Skeptics who have done the work confirm the need for adjustment to the US temp data.
Anthony Watts collaborated on a paper published in 2011 where they tried hard to avoid, but eventually had to concede, that time of observation bias was something they’d have to deal with or they would get spurious results. Once they’d done the work themselves, they realized that adjustments are necessary, and acknowledged that in the opening of thir paper.
https://agupubs.onlinelibrary.wiley.com/doi/full/10.1029/2010JD015146
Cleaning up the data for climate purposes – to assess change over time – is an unfortunate necessity. ‘Climategate’ also revealed researchers trying hard to get it right.
ClimateGate revealed smarmy government bureaucrats with science degrees conspiring to change data they did not like, and to pressure publishers to not publish articles and studies that disagreed with the THEIR consensus (and their climate models, which are just their personal opinions programmed into a computer).
Anyone who claims ClimateGate emails were good news, or revealed honest science, is a l i a r … or a f o o l.
“was infilled by government bureaucrats”
Bureacrats? You mean researchers paid by govt grants or work for govt agencies?
Funny that this pejorative term keeps getting lobbed, since Roy Spencer and his colllaborators are just as much government bureaucrats as any of the accused.
‘Govt bureaucrats’ produce most of our meteorological data, I suspect.
Oh well.
No he isn’t talking about the data collectors he is talking about bureaucrats that substitute politically correct data for raw data.
Give us a couple of names of these bureaucrats.
thats the problem Barry. No audit trail.
Duh! The lack of evidence is proof of the conspiracy.
conspiracy is your word Nate.
Fact is people tend to find what they are looking for and not notice what they aren’t looking for.
Awareness of the above is the first job of an auditor in making decisions about dedicating resources to an audit. Lack of an audit trail makes tracking that down extremely difficult.
You wanted names. The lack of names should be your first concern, folks who handwave that away are those upon who suspicion falls the most quickly. . . .as witnessed by probably every mystery story written. . . .so even non-auditors should be able to pick up on the problem.
“that substitute politically correct data for raw data.”
Seems no evidence is required for you to believe in this.
I dont think people are subjectively picking data. Algorithms are used.
Are the algorithms bad?
Nate its not about algorithms being good or bad. All that is debatable.
Its about algorithms are not being observations.
bill,
Even something as trivial as a single temperature reading from a thermocouple requires a model and algorithm to map material properties and electrical voltages to meaningful temperature values.
And the amount of modeling and algorithms UAH employs to measure the global mean temperature is orders of magnitude above and beyond that.
If UAH or even a single temperature reading from a thermocouple, RTD, or laser interferometer is not considered an observation then what is?
“thats the problem Barry. No audit trail.”
The problem is that people like you and Richard say stuff that has zero substance to it.
Perhaps it is a problem with the way you guys think. If there is no data, you can’t make a claim. I don’t know how to explain that in such a way as to change your mind, but hopefully you’ll think about it for a while and see the logic for yourself.
bill,
Even something as trivial as a single temperature reading from a thermocouple requires a model and algorithm to map material properties and electrical voltages to meaningful temperature values.
And the amount of modeling and algorithms UAH employs to measure the global mean temperature is orders of magnitude above and beyond that.
If UAH or even a single temperature reading from a thermocouple, RTD, or laser interferometer is not considered an observation then what is?
—————————–
Obviously the mapping of material properties and electrical voltages is ones that are well known, universal and consistent. The day be day manual compilations of temperature data has a human element in it that isn’t well known.
As I understand it the one item UAH does that has some uncertainty is calculating satellite drift. Fact is because of moving cloud cover surface readings vary greatly hour by hour. We have seen this in Roy’s own backyard experiments and is consistent with my monitoring of personal weather station equipment over many years. If humans robotically measured the equipment in a consistent way and disregarded everything else there would be less to worry about. But human monitors are driven to compensate in a non-robotic manner. And when you have robotic monitoring. . . .Roy is right hour by hour data is far superior and with robotic monitoring hourly data is easy to obtain.
The experts that criticize adjustments on human monitoring characterize the problem as treating station managers like they were idiots, but the truth is nothing could be further from the truth.
barry says:
”The problem is that people like you and Richard say stuff that has zero substance to it.”
Zero substance? You are very welcome to show the audit trail to me. How can I show you something of substance if it either doesn’t exist or can’t be found?
I have spend the majority of my adult life professionally holding segments of the State and Federal governments to account. You operate as an ignorant man believing in black and white when in fact all is shades of grey. The only way in domestic government is complete transparency and full documentation. Without that people can never be free. And believe it or not the only reason its not complete and transparent is a combination of fraud, deceit, and tradition.
Tradition is listed because it is not an easy process of revealing the facts and that process must be built brick by brick with a lot of less than honest people trying to knock it down.
“You are very welcome to show the audit trail to me”
I asked Richard to name the “government bureaucrats” he claims infilled temperature data.
My point is that if there is no audit trail, then Richard’s claim has no substance. He can’t name names without the audit trail.
So please, direct your question to Richard, and maybe we will point out the audit trail.
Dr. Roy, great work as usual. I’m up over 260 Stations that show no warming uptrend.
https://wattsupwiththat.com/2021/02/12/urban-heat-island-effects-on-u-s-temperature-trends-1973-2020-ushcn-vs-hourly-weather-stations/#comment-3181833
One thing you may want to consider is not only controlling for the UHI Effect but also Water Vapor. Identify all the Desert Locations and you will discover that CO2 has no no impact on temperatures at all. Once again, here is a list of 260+ Stations that show no warming.
https://wattsupwiththat.com/2021/02/12/urban-heat-island-effects-on-u-s-temperature-trends-1973-2020-ushcn-vs-hourly-weather-stations/#comment-3181833
This is my favorite:
Alice Springs (23.8S, 133.88E) ID:501943260000
https://data.giss.nasa.gov/cgi-bin/gistemp/stdata_show_v3.cgi?id=501943260000&dt=1&ds=5
Of course, be sure to use the “Un-Adjusted” Data.
Lastly, NASA distorts the data. My bet is if you just look at the High Temperatures, you won’t find much warming in any location. The problem you face is accounting for the “adjustments” and accounting for the accuracy of the data in the first place. Another interesting study would be the spread between the High and the Low. My bet is that the spread won’t be narrowing, and if it isn’t, the average temperature will be approaching the High Temperatures of the day, which doesn’t make any sense.
CO2isLife said: Of course, be sure to use the Un-Adjusted Data.
What possible justification can you present that would convince us to prefer a time series with known errors and biases over one that has those errors and biases considered?
“I’m up over 260 Stations that show no warming uptrend.”
But we have checked some of those stations and found they do have warming trends. Apparently you do not have a method for assessing whether there are upward trends or not. You just look at the chart and make a declaration.
Your diligence is admirable, but it is wasted if you don’t apply rigour.
You checked? Really? What were the results? A teensy weensy warming trend? Is that true across the board or did you as you say just check a couple you wanted to check?
Your diligence is admirable, but it is wasted if you dont apply rigour.
bill the hunter said:
“What were the results?
A teensy weensy warming trend?”
I personally see an itsy bitsy warming trend,
not a tenesy weensy warming trend.
Itsy bitsy is real science.
Tennsy weensy is junk science.
‘Itsy bitsy is real science.’
Yep! But nothing to get your panties in a bunch.
Vilnius from 1960 is +0.420C/decade +/- 0.064. That is 3x the UAH TLT trend of +0.14C/decade.
You are, of course, encouraged to double check this value.
https://data.giss.nasa.gov/cgi-bin/gistemp/stdata_show_v4.cgi?id=LH000026730&ds=14&dt=1
bdgwx is that one of the 260 stations?
Yes
Interesting that no significant warming occurred until they hooked up with the Nordic and Euro banking systems in the mid naughts.
Interesting that your name has no capitalisation. Interesting and… suspicious.
we are talking about UHI barry.
Money has a way of attracting development, development is what attracts farmers to the city.
Rhetoric has a way of attracting BS.
There is nothing substantive in what you’ve just said. Just propagandistic waffle.
Barry waves his hand it the air and proclaims UHI as bogus.
The results are upthread. Statistically significant warming.
I chose some at random, so did others.
We didn’t need to check all 260. It was already obvious that the claim was deeply flawed.
CO2isLife needs to apply some test to the data before he calls any kind of trend. This obviously had not been done.
Nate: ”Maybe half, maybe 0”
Yes keep in mind we have 1) natural variation; 2) anthropogenic fossil fuel burning; 3) Deforestation and landuse change; 4) UHI
So Roy’s hourly station data suggests 1/2 due to UHI.
But thats only for the most aggressive surface records. UHI most likely isn’t an important factor in satellite data.
So one can conclude that 1 and 2 and perhaps 3 are factors in the observed warming recorded by satellites.
All you sycophants have been worshipping Berkeley Earth but . . . .why?
We are in interglacial period.
Past interglacial periods were much warmer than other present global average temperature.
It seems to me there 3 options:
1] We have already had the warmest part of interglacial period.
2} we going to have warmer part of interglacial period in the future.
3] Our interglacial period is somehow different than past interglacial periods.
And fourth option, my odd hybrid, our interglacial period was different and we already had the warmest part of our interglacial period, but maybe it will warm up again.
But it seems to me the Little Ice Age was likely the coldest time in last 10,000 years, and our warming is like all other warming periods that are following cooler periods over the last several thousands years.
“All you sycophants have been worshipping Berkeley Earth but… why?”
Why do you fabricate?
I like Berkeley Earth because it’s like The Hitchhiker Guide, slightly cheaper and easier to use.
If there better ref which gave average temperature of all countries
on Earth- and was cheap and easy to use- I might use it.
I agree. Nearly all the science being produced is useful. The trick is in determining usefulness for what purpose.
Fact is we live in a cold world. Hardly anybody beating the drum for a cooling world. . . .which would be something I might worry about.
I have had the advantage of having lived in multiple climates for long enough periods of time to adjust to them. Still just about everywhere you live there is enough natural weather variation to make you both to feel both too hot and too cold. Hawaii might be the only exception in the US being heavily buffered by the Pacific Ocean. Hawaii’s highest recorded temperature is 100F tying Alaska. Hawaii’s lowest recorded temperature is 12F, 14 degrees warmer than second place Florida. Most of us survive in a world with greater than 44C swing in weather temps and we fret about a 100 year extrapolation of 3C which looks to be from observations about 1/2 of that. Climate change is really only something folks worry about who have nothing else to worry about and like any war there will be big winners and big losers. With so much money at stake you really want to be sure you aren’t being conned about something to worry about for which there is no justification.
“So Roys hourly station data suggests 1/2 due to UHI.”
Sure if you apply no proper skepticism.
A real skeptic would look at this analysis and understand that it is very weak.
I can agree it can use more work and Roy recognizes that. But when it comes to weak. . . .its not even close to how weak your criticism is.
This work is deeply flawed
Hilarious..
By Feb. 17, the stratospheric intrusion will extend westward. I predict record low temperatures in the Rocky Mountains.
https://i.ibb.co/RNkkF4w/gfs-hgt-trop-NA-f120.png
Temperature anomalies in Europe.
https://www.tropicaltidbits.com/analysis/models/gfs/2021021306/gfs_T2ma_eu_1.png
The Great Lakes are currently freezing fast.
https://www.glerl.noaa.gov/data/ice/#currentConditions
Dr. Spencer consider doing this research:
1) Identify locations protected from the UHI and Water Vapor Effect (Dry and Cold Deserts).
2) Have High Temps from UnAdjusted Data been increasing?
3) Has the Spread between High and Low Temps been narrowing, meaning that CO2 actually holds heat in the atmosphere over time
4) Have the low temperatures been increasing? If they haven’t, the AGW is moot given that warming is isolated to daily events and not changing over time as CO2 increases.
5) Run regressions based on ΔW/M^2 and temperatures, not ΔCO2 and Temperature.
6) Provide an explanation as to why so many stations show no warming trend, and an explanation as to why so many stations have a jump in temperatures over the last decade or so, but not over the previous 110 years.
Here are 265 Stations and links that show no warming. How is that possible? Do the laws of Physics Cease to Exist in those Locations. No they don’t. If Climate Science wants to be considered a real science and gain respect, that question needs to be answered.
https://wattsupwiththat.com/2021/02/12/urban-heat-island-effects-on-u-s-temperature-trends-1973-2020-ushcn-vs-hourly-weather-stations/#comment-3181833
Dr. Spencer, one other piece of research that would be great is to Validate what Tony Heller did by showing that the NASA Adjustments are almost universally biased towards warming. Cooling the distant measures and warming the near term measures. Also run a regression of the CO2 vs. the “adjustments.” If you get a high R-Square, that proves my point that the “adjustments” are intended to improve the relationship between CO2 and Temp in a more linear manner, but that is contrary to the real relationship of ΔW/M^2, not ΔCO2.
If you do that study, demonstrate the increase in linear trend in temperatures to match the CO2 trend. That is not consistent with the Physics. That is how you demonstrate motive and fraud. Data in intentionally being “adjusted” to improve linear models that are modeling a non-linear relationship. That is the problem Climate Science faces.
Here is another critical evaluation of the USHCN data set supporting Dr. Spencer’s conclusion.
If the corrections fixed known problems in the instruments, that would help accuracy. But they are statistical. They make the station measurements smoother when mapped and they smooth over discontinuities. In my opinion, NOAA has overdone it. TOB, PHA, infilling and gridding are overkill. This is easily seen in Figure 7 and by comparing Figure 3 to Figure 6 or Figure 5. Does the final trend in Figure 3 more closely resemble the measurements (Figure 6) or the net corrections in Figure 5? The century slope of the data is 0.25°, the corrections add 0.35° to this and the “climatological gridding algorithm” adds 0.9°! It is worth saying again, the type of statistical operations we are discussing do nothing to improve the accuracy of the National Temperature Index, and they probably reduce it.
https://wattsupwiththat.com/2020/11/24/the-u-s-national-temperature-index-is-it-based-on-data-or-corrections/
At first I thought you wrote that paragraph, but you didn’t. That is from the article. You should put quotes around it.
The article describes some of the processing of data that goes on and the reason for it.
Then it does an abrupt left turn from being factual, and the author tells us they have a gut feeling that the processing goes too far.
Doesn’t do any analysis of their own to test their gut feeling.
But at least WUWT has moved on from decrying adjustments as needless and malign. No, in this article at least, the author understands that they are necessary.
Until some other article in the near future calls any adjustment a fudge.
Barry adjustments are a fudge.
Adjustments arise out imperfections in the collection system. Many years ago it was acknowledged that the absolute temperature of the climate might be off by as much as 2c and anomalies were used instead in order to detect trends from whatever the actual average temperature is.
Adjustments are made to supposedly provide consistency of potential absolute temperature whatever it is even if it is not actually representative of the overall climate. But at every single adjustment point uncertainty is introduced is the new station or new observation method actually affecting the consistency? Or have station managers actually done the ground truthing to ascertain there has been no affect.
This is an area of science concern. Science is supposed to be more concerned about consistency than perhaps a bureaucrat assigned to collect a temperature reading every day.
But a lot of people love their jobs and go far beyond simply being a robot and have their own curiosities. this isn’t factored in at some desk in Boulder Colorado where the station temperatures of Fargo North Dakota are changed.
So what does our Boulder Colorado scientist use as a benchmark. We have seen what it is over and over again. Its a combination of sources of information that comes from models, nearby stations, general system changes, etc. Each adjustment contains an element of a fudge arising from the individuals own biases.
Can we account for that? Yeah about as well as the Boulder Colorado scientist accounted for the actions of the Fargo, North Dakota station managers actions. In fact we can probably account correctly for the direction of bias of every single regular poster in this forum if they were to do the adjustment. We just won’t know the absolute value of the bias.
Bottom line is you want a monitoring system you don’t have to adjust. You want satellites with drift correcting abilities. You want weather stations built with equipment that doesn’t change and environments that doesn’t change. But above all you really need to know how climate varies. Setting up good laboratory experiments can be quite difficult. Setting up experiments in nature is mostly beyond what we can do.
Mankind struggles with developing ideal habitats on a small scale. We are far better off learning how to adapt to natural change. The world has been doing that for 4 billion years. We might ought consider jumping on that train rather than trying to stop the clock. Nature Deficit Disorder is a real psychological disease that is rapidly arising in our increasingly regimented society.
“Many years ago it was acknowledged that the absolute temperature of the climate might be off by as much as 2c and anomalies were used instead”
That’s not why anomalies are used. I think that is pure BS from you.
“Adjustments are made to supposedly provide consistency of potential absolute temperature whatever it is even if it is not actually representative of the overall climate.”
Could you please provide a methods paper where the stated goal is to adjust temperature data in order to “provide consistency of potential absolute temperature.” I think this is BS from you.
Who the hell is the Boulder scientist? If you dialled the rthetoric down in favour of facts and figures with references, the conversation might get interesting.
That is why ‘only’ anomalies are used. If the absolute mean surface temperature were 2c different 3watts of ghg forcing would produce for all intents and purposes the same anomaly (the difference would be immaterial).
What I find really hilarious is trying to limit global warming to 2 degrees from levels found in the Little Ice Age that ended 150 years ago. That might have been something my great great grandfather may have given some consideration to, like I might give some consideration to the idea of the climate warming another 2c from today. but since I actually celebrate the warming to date its hard to turn around and worry about it.
I strongly suspect that if it warms another degree in my lifetime that any additional concern about 2 more degrees above that will become more worrisome. Fact is global warming panic is totally lacking any baseline about which to worry.
So the propaganda focus is on the young who think they will live forever and the parents who worry about their kids even when there isn’t really anything to worry about.
No link to a methods paper, nothing to corroborate what you’ve said.
I think you make some stuff up, and the above is of that ilk.
Its automatically corroborated Barry. Check Stefan and Boltzman for the temperature difference for a .2deg anomaly at 15C and 18C
For a 3 degree C difference in absolute temperature a .2 deg anomaly at 18C is equivalent to about a .205 anomaly at 15C.
The rest is my viewpoint on what it means to warm 2degC from 1880 when there is allegedly already 1.5degC sunk. It means nothing to me.
Anomalies: another faux controversy to build a conspiracy theory around.
Nate says:
”Anomalies: another faux controversy to build a conspiracy theory around.”
Boy you sycophants sure can’t think for yourselves. I am building a controversy I am defending the use of anomalies. The only problem I have seen in the use of anomalies is actually not honoring the principle like in introducing computer generated historical polar data in order to claim some higher variability in the arctic.
That is a violation of the principle of consistency. Its fine to start monitoring polar data but mixing it with computerized rebuilds after the periods rebuilt were declared to contain inadequate data simply because it is now known that a good deal of atmospheric warming occurs when sea ice melts fails to consider where that heat is coming from and where it is going.
Hear, hear: Co2isLife calling ‘Dr Spencer, Dr Spencer! Here are over 260 GHCN stations showing no warming’ !
So what.
barry, bdgwx and I we repeatedly pleased CO2isLife to stop eye-balling on GISS station data graphs, and to start processing the stations’ data instead, in order to obtain a real picture of their trends.
For each station he collected, CO2isLife can
– download the data, e.g.
https://data.giss.nasa.gov/tmp/gistemp/STATIONS/tmp_NOM00001233_14_0_1/station.csv
– enter this data into a spreadsheet tool
– let it calculate the data’s trend, and
– build an average over all calculated trends.
That’s the right way, based on information instead of guessing and eye-balling.
I didn’t process any GHCN V4 data until now, and unfortunately, the same stations ids refer in many cases, within GHCN daily, to completely different station metadata.
Dombaas in Norway is the perfect example, see the GHCN daily data:
NOM00001233 62.0830 9.1170 638.0 DOMBAAS 01233
NOM00001233 62.0830 9.1170 TMAX 2006 2021
NOM00001233 62.0830 9.1170 TMIN 2006 2021
NOM00001233 62.0830 9.1170 TAVG 2006 2021
compared with GHCN V4:
Dombaas 62.0830N, 9.1170E NOM00001233 (BI) 18 01/1880 – 01/2021
Thus, an evaluation of the station data using GHCN daily unfortunately is not possible.
Maybe somebody can do the same job I usually do, but by using GHCN V4 instead.
J.-P. D.
– enter this data into a spreadsheet tool
– let it calculate the data’s trend, and
– build an average over all calculated trends.
Actually I did that, and you get a wave, and no trend. Temps increase in the early party of 1900, fall in the middle, and increase in the later part of the 1900s. There is no trend.
Using regression analysis, as I’ve explained a million times, isn’t appropriate for data that is this volatile and has an R^2 well below 50. CO2 causes warming. If temperatures in the last decade are below the levels set early in the 1900s, CO2 can’t be causing the warming even if the recent temperatures are at a peak. You have to tie the log decay in ΔW/M^2 to Temperatures, and CO2 can’t cause spikes. You rely on recent spikes to distort your regressions knowing full well that the recent spikes can’t be due to CO2.
CO2isLife
Until now, you didn’t explained more than trivial stuff, indeed a million times.
Don’t write so much, and manage to show you your results.
J.-P. D.
Bindidion, for the nteenth millionth time, that data you want me to download and run a regression on is “adjusted” data. The slope you are calculating is a slope of the “adjustment” over time, not temperature over time.
You honestly want to argue that there is an uptrend in this data just because you calculate a positive trend in the regression stats? That is absurd and pure fraud.
Ponta Delgada (37.7410N, 25.698W) ID:POM00008512
https://data.giss.nasa.gov/cgi-bin/gistemp/stdata_show_v4.cgi?id=POM00008512&dt=1&ds=15
Oooops, I stand corrected. I just downloaded the data and it is the UnAdjusted” data. For some reason I thought the previous data I had downloaded was “adjusted” data. Anyway, when I run the regression I get these parameters.
0.0003 Slope
0.0008 R-Sqr
In other words, there is no relationship between CO2 and Temperature over the past 140 years.
Now try it with adj-cleaned data which fixes known errors and bias with the station’s time series. Report what find. Make sure to include the standard error on the trend. It is R2C1 in the matrix LINEST returns.
As I commented under the thread on WUWT, the warming trend is much less if you go back further in time. Since Roy’s trend is almost exactly the same as HadSST3, I brought HadSST3 back to 1940 to try and remove most of the effects of natural cycles and volcanoes.
https://www.woodfortrees.org/plot/hadsst3gl/from:1940/to/plot/hadsst3gl/from:1940/to/trend
As we can see the trend now drops to .07 C / decade. Certainly this is not any kind of climate emergency. Add in that ocean salinity changes probably account for most of this and we are left with CO2 having very little effect. That agrees with this recent paper.
https://www.scirp.org/journal/paperinformation.aspx?paperid=99608
After considering the paper I think I now understand why CO2 back radiation has such a small effect. It’s there. They measured it in this experiment. However, almost no warming.
The first thing a person needs to do is accept the result is valid. Once that is done the reason starts to unfold.
The back radiation does not warm the air because the GHE is essentially saturated. Hence, it goes all the way to the surface. However, the surface (the back wall in this case) has a heat capacity 1000+ times that of air hence will only warm a small amount. That won’t have much effect on the air in the time they ran the experiment.
If they let the experiment run for a long time they might start to see some effect. The problem is that source of the heat turns off on planet Earth in a pretty short time. The surface then cools and because of several mitigating factors almost all the heat is lost before the sun returns.
The combination of a nearly saturated GHE in the lower atmosphere and the huge difference in heat capacity between the surface and the air almost completely negates the ability for back radiation to warm the planet beyond where we are today.
I read above the typical statement:
” In my opinion, NOAA has overdone it. TOB, PHA, infilling and gridding are overkill. ”
I have read some comments posted here by ‘S.K. Dodsland’, and these comments are very probably based much more on guessing and pretending than on own evaluation of data.
Especially the gridding point is of interest.
In summer 2018, Roy Spencer published in a thread a graph made by John Christy:
https://www.drroyspencer.com/wp-content/uploads/US-extreme-high-temperatures-1895-2017-550×413.jpg
Prof. Christy’s idea was to collect, for each year, the number of daily maxima temperatures per station going over 100 F resp. 105 F.
Commenter Bily Bob soon asked for a corresponding graph concerning the whole Globe.
I thought: why not to do the job, and as USHCN is of course restricted to the US, I chose GHCN daily with about 40000 stations worldwide, and made a similar graph for CONUS:
(1) https://drive.google.com/file/d/1qGV5LfKw_lFKNdZMlq15ZHz6sA1CA294/view
Now I extended the range from CONUS up to the Globe, and was surprised to see
(2) https://drive.google.com/file/d/1GMuNs9ptRzDd7KxFQbKv0o5ySR5VNc9b/view
because it did not at all give any match to what I had experienced before.
The reason was that in graph (2), about 20000 US stations compete with about 20000 stations outside of CONUS.
Gridding (or ‘area weighting’) means to average the data provided by all stations encompassed by the same grid cell, and then to average the data of all grid cells into time units, e.g. months.
Thus an area weighting based on a UAH-like grid (2.5 degree) was used; this gave a very different view on the same worldwide data:
(3) https://drive.google.com/file/d/1TFdltVVFSyDLPM4ftZUCEl33GmjJnasT/view
Now you have, instead of 20000 US stations competing with 20000 other stations, about 200 US grids competing with 2200 worldwide, what corresponds much better to CONUS’ 6% of Globe’s land surface.
*
Who still pretends that gridding is something like data wrangling, as expressed by a commenter at WUWT, is simply dishonest.
*
Recently, Prof. Christy published a remake of his observation, now based on better ideas, without treshold values like 100/105 F, and including near TMAX a TMIN analysis.
The results when extending his scheme up to a global view remained very similar.
I’ll post these results when I have time to do it.
J.-P. D.
Just look at this Fraud:
1) Unadjusted data shows absolutely no warming over the past 120 years, in fact, 2010 is near an all time low. 1890 has a temp of 18.25, current Temp is 17.75. There is absolutely no up-trend. The “Adjusted” data shows warming from 14.75 to a peak of 19, and current Temps are at 17.75. 3 Degrees of warming that are 100% data manipulation. More importantly, the Temp Trend becomes more linear in a clear uptrend. Note how the adjusted data is below the actual, then matches the actual, then exceeds the actual. This is fraud if you put the “adjustment” in the context of someone trying to make a linear model produce better numbers. That is the motive for these “adjustments.”
Ponta Delgada (37.7410N, 25.698W) ID:POM00008512
https://data.giss.nasa.gov/cgi-bin/gistemp/stdata_show_v4.cgi?id=POM00008512&dt=1&ds=15
Fraud IPCC Model: ΔTemp = Linear f(ΔCO2)
Real Model ΔTemp = Log(ΔCO2) where Log(ΔCO2) = ΔW/M^2
That is the problem Climate Science Faces, they are trying to make a Log Function linear. They are trying to fit a square peg in a round hole. It will never work. Simply study the quantum physics of the CO2 molecule.
Bindidion Says: barry, bdgwx and I we repeatedly pleased CO2isLife to stop eye-balling on GISS station data graphs, and to start processing the stations’ data instead, in order to obtain a real picture of their trends.
Simply take a look at this Graphic. Clearly there is an uptrend in the “Adjusted” data and no trend in the “Unadjusted” data. Running a regression on the data that you can download, the “Adjusted” data will definitely give you a regression trend with a positive relationship between time and temperature. Problem is, that regression is a measurement of the adjustment over time, not temperature over time. It is classic GIGO. Only a fool would believe that there is an uptrend in the actual real temperature data, and only a fraud would try to pass off regression stats on the “adjusted” data.
Ponta Delgada (37.7410N, 25.698W) ID:POM00008512
https://data.giss.nasa.gov/cgi-bin/gistemp/stdata_show_v4.cgi?id=POM00008512&dt=1&ds=15
BTW, if someone knows how to download the “Unadjusted” data please post it. I’m 100% confident that I’ll be able to show significant differences between the slopes of the unadjusted and “adjusted” data. What kind of science relies on “adjusted” data to support their conclusions? If the data needs to be “adjusted” to support your conclusion you are either 1) not measuring the data correctly or 2) you aren’t getting the results you want from the real data so you adjust the data to fit the model which is anti-science. Real science adjusts the model to explain the data. The data is the independent and dependent variables, the model defines the relationship.
Back on the station map you need to select the dataset before you search for the station. I believe you can also change the ds= parameter in the url. 15 is unadj, adj is 12, adj-cleaned is 13, and adj-homogenized is 14. The csv download button pull the data from the ds selected.
There has definitely been global warming since the coldest decade during the Maunder Minimum (1690s) … and it could be +2 degrees C. (climate proxies are not precise enough to make a better guess).
The global average temperature pre-World War II is based on questionable data.
Poor global coverage before 1920.
Horrible global coverage before 1900.
No one knows the global average temperature in 1890 to two decimal places, and probably not to one decimal place.
There were few land weather stations outside the US, Europe, the east coast of China, and the east coast of Australia, before 1900.
Sea temperatures were measured with buckets and thermometers at random locations, almost entirely in Northern Hemisphere shipping lanes. The result might be accurate to the nearest degree C., definitely not hundredths of a degree C. (Maybe +/- 0.5 degrees C. for the Northern Hemisphere only.)
There are two choices for the climate on our planet — warming or cooling. Most people prefer warming.
The anecdotal, climate reconstruction and real-time measurement evidence strongly suggests intermittent warming since the late 1600s.
Any claim of no global warming in the last 300 years, or the last 100 years, or in the last 50 years, is likely to be wrong.
Note: I could be biased. I love global warming, and want more!
Bindidion Says: barry, bdgwx and I we repeatedly pleased CO2isLife to stop eye-balling on GISS station data graphs, and to start processing the stations’ data instead, in order to obtain a real picture of their trends.
I just did that for:
Ponta Delgada (37.7410N, 25.698W) ID:POM00008512
https://data.giss.nasa.gov/cgi-bin/gistemp/stdata_show_v4.cgi?id=POM00008512&dt=1&ds=15
Results:
0.0003 Slope
0.0008 R-Sqr
Basically, there is no relationship between CO2 and Temperature over the past 140 years. Be careful what you wish for Bindidion, barry and bdgwx, you just might get it. Any fool can look at those charts and know there is no real trend in them.
“Basically, there is no relationship between CO2 and Temperature over the past 140 years.”
I disagree.
The correct statements in my opinion:
(1) There was no known CO2 temperature relationship for almost 4.5 billion years
(2) In the past 500,000 years, temperature peaks happened hundreds of years before CO2 peaks, per Antarctica ice core studies.
(3) Since the 1970s, there has been a relationship (positive correlation) between CO2 levels and the global average temperature. But correlation is not causation, so it is only an assumption on how much of the warming could be blamed on greenhouse gasses — I can say for sure the percentage is between 0 and 100%.
I can also say for sure the future climate will be warmer, unless it is cooler. I can also say with confidence that people generally prefer warming.
No one would even notice climate change if not for hysterical leftists bellowing “climate emergency”, so no one can enjoy the best climate on this planet, for humans, animals who live outside, and plants, in hundreds of years. It’s like having a sunny warm spring day where you live in Florida ruined by a miserable leftist neighbor who can’t stop talking about the coming hurricane season.
CO2isLife
” Basically, there is no relationship between CO2 and Temperature over the past 140 years. ”
Your problem is that your trial to prove this is based on trivial stuff – of exactly the same niveau as what Moon spin deniers are able to give: ball-on-a-string, merry-go-round, coins and the like.
I have tried numerous times to explain to you that there is indeed NO relation between surface temperatures – regardless where they are measured – and CO2’s activity.
If this activity exists – what I can’t prove because I lack the scientific education to do that – then it is located ABOVE THE TROPOPAUSE, where water vapor disappears because it is a condensing gas and precipitates.
If I had any motivation or better: any reason to do, I would translate this document in English:
documents.irevues.inist.fr/bitstream/handle/2042/39839/meteo_2011_72_31.pdf?sequence=1
or at least the simplified version detected a long while ago by Adelaida:
https://www.centrale-energie.fr/spip/spip.php?article151
But… why should I do that? Shall I work hours and hours with as result the job being automatically denigrated by all these better-knowers posting here?
Non merci. Nein danke. No thanks. Gracias no.
J.-P. D.
Bindidon one isn’t a moon spin denier simply because he isn’t a sycophant of an arbitrary assignment of spin energy. The spin energy of the moon exists both in terms of its bonds to earth and independently should those bonds be broken. What they aren’t is doubled. To put an independent spin on the moon or particles in the deck of a merry-go-round you must add energy.
What you have utterly failed to do is challenge Tesla’s calculations surrounding the matter and choose ‘group’ hand waving as your only argument. . . .just like you do with CO2.
hunter
As usual, you prefer Tesla’s oversimplified quick shot to the work of a well known astronomer like Tobias Mayer, who wrote a splendid treatise about Moon’s spin:
https://www.e-rara.ch/download/pdf/913790?name=IV%20Abhandlung%20%C3%BCber%20die%20Umw%C3%A4lzung%20des%20Monds%20um%20seine%20Axe%20und%20die%20scheinbare%20Beweg
You might lack the ability to read and understand the German text, written and typeset 270 years ago; though not being written in my native tongue, I had no problem to read and understand all 130 pages.
Btw, hunter, the group hand waving in fact is on YOUR side: people like you and your friends Roberson, ClintR, DREMT and some others would never and never be able to scientifically contradict what Mayer published in his treatise.
You wrote, not so long time ago that Mayer failed in keeping it simple or something similar: that tells me everything about your way to think about science… and engineering.
And boasting genius Robertson was even able to write ‘Mayer didn’t know what he was talking about’ !!! Ha ha ha haaah.
This is of unimaginable arrogance.
*
Maybe some commenters agree with what I write; BUT I write for myself here, regardless what it is about.
J.-P. D.
bindidon you are well known to be impressed by anything that spins your political outlook.
As to Mayer’s paper did anybody ever find it worthwhile enough to translate into English?
hunter
” … you are well known to be impressed by anything that spins your political outlook. ”
This is really one of the most ridiculous statements I have ever read about me.
Simply because it is valid for nearly everybody here, beginning with… yourself. Feel free to extend the list!
*
” As to Mayer’s paper did anybody ever find it worthwhile enough to translate into English? ”
One more hint on your mix of ignorance and the resulting arrogance.
Go into that book hunter, and try to evaluate the huge amount of work needed to get it translate in modern English text form!
Why, do you think, did nobody until now ‘find it worthwhile enough’ to translate that other book into English?
https://digital.slub-dresden.de/data/kitodo/kurzbedem_324138768/kurzbedem_324138768_tif/jpegs/kurzbedem_324138768.pdf
Why, do you think, did nobody translate Lagrange and Laplace’s 300 pages long treatises into English?
Will YOU finance all that work, hunter?
*
Steven Wepster wrote a book in English about Mayer’s work, unfortunately behind paywall:
https://tinyurl.com/1obcwd0a
I obtained the book’s most important Chapter 9 from the library of the ‘Hamburger Sternwarte’, Hamburg’s observatory, but I’m not allowed to upload it.
J.-P. D.
hunter
Look at this:
https://dspace.library.uu.nl/bitstream/handle/1874/22975/index.html%3Bjsessionid=42D429814C688D0C5038F5F265EDD4B2?sequence=19
But it is still far away from what I need: a perfect, 1-2-1 transcription of Mayer’s document that accurately reproduces how Mayer, starting from seemingly trivial observations at the telescope with the help of a self-made micrometer, finally comes through numerous trigonometric transformations to data that clearly demonstrate the rotation of the Moon.
J.-P. D.
What you have to do Bindidon is open up your mind.
Einstein came along and shook up classical mechanics with his relativity observations. Perspective is the basis of all classical mechanics.
You want to throw a bunch of classical mumbo jumbo out here from authors that far preceded Einstein. Fact is the disk of a merry-go-round accelerated by motors encompasses all the forces necessary to spin the disk. Same deal for orbiting celestial bodies. Fact is all objects in the universe have a spin in that they all rotate around something else influenced by gravity. Those objects not perceived to be orbiting are in fact orbiting. The concept of barycenter’s was created to deal with rotations that don’t go around the other influencing object.
Traumatic events like collisions are able to create additional rotations. Objects entering orbits speed up their apparent rotation without adding energy like an ice skater pulling in her arms.
Objects with different rates of spin to their orbits slowly do adjust to the rate of spin of the orbit. And that final piece is the final fact. You can’t have an orbit without angular momentum. Its complete BS that such an orbit where all sides of the orbiting body are seen from the COG of the orbit is an additional energy that eventually will be absorbed into a single perspective from the COG with an adjustment to the orbit.
So in a narrow minded classical sense its not difficult to attribute mathematically that momentum to an spin on an internal axis. Tesla did a credible job of translating his native Serbian to English, made his argument briefly in English. You on the other hand want to hide behind a text with no translation. You don’t want to debate you simply want to avoid debate.
…but not on its own axis.
As a follow up to the above:
1) Curvilinear translation is simply a translation plus angular momentum.
2) A curvilinear translation is a rotation around a single axis when all the particles are moving in concentric lines.
3) A curvilinear translation has two or more axes when all the particles are not moving in concentric lines.
I am not making this up just read Madhavi.
hunter
” You on the other hand want to hide behind a text with no translation. You dont want to debate you simply want to avoid debate. ”
As usual: claims about what I allegedly intend to do.
If I was able to find the text, I evidently would have provided for it.
But one thing I evidently won’t do: to translate all 130 pages of Mayer’s text by my own.
Two years ago, I translated Lagrange’s introductory text (about 10 pages) with the result that it was superficially and woefully discredited by the boasting Ignoramus Robertson who was not able to read more than the first lines of it.
Never again!
Keep free to discredit real science with Tesla’s quick shot, hunter! No problem for me.
J.-P. D.
Thats of course all BS Bindidon you haven’t even made a claim of particular calculations that shows the angular momentum of the moon spinning on its own axis isn’t identical to the angular momentum of any rotating object whether it be on its own axis or on an external axis. Its certainly not both.
And if its not both Madhavi correctly classifies it. And if its not both then your antique classical theories have nothing.
bill hunter nailed it: “bindidon you are well known to be impressed by anything that spins your political outlook.”
Bindidon is not able to fool thinking people anymore. He’s spent too much time here trying to pervert reality.
hunter
” … then your antique classical theories have nothing. ”
Whom do you mean here, hunter?
For example, Newton?
Apart from about 10% added by Einstein, Newton’s gravity theory still is present, zero dot zero percent ‘antique’.
And you reach here a maximum of perversity.
Dunno why, hunter?
Simply because you not only reject all these “antique classical theories” ! Oh no.
You also reject everything made by lots of people since the beginning of the 1960’s.
You wouldn’t even be able to understand what Steven Wepster wrote about Mayer’s calculation of Moon’s spin about its axis (lin above, see Chapter 9).
You reject EVERYTHING that does not fit into your little pseudo-knowledge.
A propos Madhavi:
Do you have an identifiable source of this person where he supports your idea that the Moon doesn’t rotate as calculated by Mayer and hundreds of other people after him?
Feel free to publish the link to that source, hunter…
J.-P. D.
J.-P. D.
Bindidon says:
”Whom do you mean here, hunter?
For example, Newton?”
I realize you can’t resist being an obfuscating moron. No I don’t mean Newton and duly note that Newton isn’t one of the antique classical theories you mentioned in this thread.
You just can’t resist appealing to authority can you? That is because your brain is empty of anything else.
Bindidon says:
”You wouldn’t even be able to understand what Steven Wepster wrote about Mayer’s calculation of Moon’s spin about its axis (lin above, see Chapter 9).
You reject EVERYTHING that does not fit into your little pseudo-knowledge.”
Wepster was able to extract important information from Mayer’s works to further his works that are completely 100% non-dependent upon which axis the moon rotates around. But you are too utterly stupid to realize that.
Bindidion Says:
I have tried numerous times to explain to you that there is indeed NO relation between surface temperatures – regardless where they are measured – and CO2’s activity.
This entire frraud science is based upon that single concept. You can only tax carbon. CO2 has to be the basis for this socialist religion. Climate Change is Tabacco Lawsuit 2.0. Socialism is a parasitic non-sustainable system that is always seeking a new host. Energy is that new host.
Bindidion Says: If this activity exists – what I can’t prove because I lack the scientific education to do that – then it is located ABOVE THE TROPOPAUSE, where water vapor disappears because it is a condensing gas and precipitates.
Actually, it does, and the Stratosphere has been cooling, not warming. The GHG Effect is radiative, so its most effective action is to cool because it rapidly removes energy from the system.
Consequently, decreased ozone in the stratosphere results in lower temperatures. Observations show that over recent decades, the mid to upper stratosphere (from 30 to 50 km above the Earth’s surface) has cooled by 1° to 6° C (2° to 11° F). This stratospheric cooling has taken place at the same time that greenhouse gas amounts in the lower atmosphere (troposphere) have risen. The two phenomena may be linked.
https://www.giss.nasa.gov/research/features/200402_tango/#:~:text=Observations%20show%20that%20over%20recent,atmosphere%20(troposphere)%20have%20risen.
Dr. Spencer, Bindidion, barry and bdgwx may have discovered a great research project for one of your Grad Students. They love to play games with a regression on a data set with a very low R-Sqr and a sudden non-CO2 caused spike in temperatures. If you remove the last decade of a 140 year track record, you get no warming in many if not most of the charts I’ve posted.
To adjust for this recent non-CO2 related spike that distorts the regression with outliers that can be misrepresented by people making a dishonest conclusion, basically lying with numbers to deceive those that don’t understand statistics and trend analysis.
The Project would simply be to start a ROLLING Regression, starting at the first main peak. Anchor the starting point, but float the end point and copy it down the data set.
What that will demonstrate is how the trend changes over time as new data is added. The purpose would be to identify how long a station exists with no warming, basically, identify the “Pauses.” Bindidion and others use station data that is flat for about 120 years, and then pops up for the final 20 years. Using a rolling regression you will be able to identify that for 120 out of 140 years there was no warming at this station. Clearly CO2 isn’t causing the warming.
Using this station as an example, the regression would start at 1931 and the rolling regression shows a (-)Slope until 1985, a 54 year period of no warming using regression analysis that Bindidion and the others seem to love. How does an increase in CO2 cause a 54 year pause in termperatures? In 2020 the slope is a laughable 0.003, or 0.03 Decade or 0.3 every 100 years IF THE TREND PERSISTS which it won’t. Simply put, Trends change over time, which wouldn’t happen if CO2 was the cause of the warming.
Indian Head Cda (50.5500N, 103.65W) ID:CA004013480
https://data.giss.nasa.gov/cgi-bin/gistemp/stdata_show_v4.cgi?id=CA004013480&dt=1&ds=15
NASA’s own data proves AGW is a fraud if people only understood how to understand and present the data in an easy to understand fashion.
To put things in perspective, the R-Sqrs of the station temp time analysis will show near 0.00, and the rolling slope described above is very volatile. Do that for CO2 data from Moana Loa and you get a near PERFECT 0.976995321. Perfect = 1.0.
The slope over the entire time period is 0.62 ppm/yr, but has been increasing.
CO2 has very solid numbers when linear regression stats are applied. Station data doesn’t. That is the problem CLimate Change Science facts. They are trying to fit a square peg in a round hole.
Correction, the Slope is 2.243437834 ppm/yr. I had an error in the formula thinking it was monthly data when it was formatted to be daily. That caused a big difference in the scale.
CO2isLife said: Using this station as an example, the regression would start at 1931 and the rolling regression shows a (-)Slope until 1985, a 54 year period of no warming using regression analysis that Bindidion and the others seem to love.
The trend for Indian Head Cda from 1931 to 1985 is -0.039C/decade +/- 0.102. Though not statistically significant it is indeed negative.
CO2isLife said: Trends change over time, which wouldnt happen if CO2 was the cause of the warming.
Clearly the hypothesis “CO2 is the only thing that can modulate temperature and will always result in a positive trend with R^2 = 1” is wrong. We just performed a falsification test. It was falsified.
bdgwx, what is your position on CO2 and Temperature? You make a big deal out of finding positive slopes in data sets with 0.00 as the R-Sqr. Every Station I posted will easily have multi-decade flat and negative slopes. It you simply remove the outliers in the recent decade, most will have (-) Slopes for most of the 1880 to 2000 period. Do you still claim CO2 is causing the warming, even though the slope is totally dependent upon the recent outliers.
My position is the same as the scientific consensus which is supported by the abundance of evidence.
CO2 is a significant contributing factor to the positive linear regression trend of the global mean temperature and oceanic heat content from 1850 to present but especially from 1960 to present.
and
Human emissions account for the vast majority of the 130 ppm rise from 280 ppm to 410 ppm.
Don’t hear what I didn’t say. I didn’t say that CO2 alone can explain all temperature movements on all spatial and temporal scales. I didn’t even say that it was sufficient to explain the entirety of the linear regression trend of the global mean temperature and oceanic heat content by itself. I repeat…the models that best match reality include ALL climate forcing factors including but not limited to solar radiation, clouds, land use changes, albedo, sea ice, land ice, orbital dynamics, biosphere changes, aerosols, greenhouse gases, etc.
4.5 billion years of huge climate changes from natural causes, yet the IPCC was already dismissing natural causes of climate change as “background noise” in 1995.
The bias toward blaming humans for climate change was obvious in the beginning of the IPCC (1988), and is worse now.
From 1995:
“1995 SAR Summary for Policymakers:
“Any human-induced effect on climate will be superimposed on the background “noise” of natural climate variability … “
Blaming humans was the only reason for the IPCC. Blame is like oxygen for the IPCC. Deprive it and it will wither and die.
Richard Green Says: 4.5 billion years of huge climate changes from natural causes, yet the IPCC was already dismissing natural causes of climate change as “background noise” in 1995.
The bias toward blaming humans for climate change was obvious in the beginning of the IPCC (1988), and is worse now.
Rarely have I seen this fraud be more eloquently explained. Bravo Richard.
Thank You CO2:
I’m glad you could understand my comment because some strange alien symbols show up where I typed quotation marks.
This is obviously due to pixel manipulations done by Barry, who follows my comments like a rock band groupie, and holds a powerful rare earth magnet next to his computer screen while reading my comments, thereby distorting the text before the ink dries and the comments become permanent. Of course I could be wrong.
More CO2 = more life on our planet.
Only a fool, or a leftist (I repeat myself) would believe CO2 is the “devil in the sky”.
We have all lived with global warming for 45 years.
The moderately warming climate has been wonderful.
The climate has not been better in our lifetime, and has been getting better since the 1970s.
We could enjoy it more if pesky leftists were not always bellowing about a coming climate crisis.
They started the warnings in the late 1950s, in a calm voice, but have been getting louder ever since.
They have now reached hysteria — DURING the best climate on our planet in over 300 years.
What’s wrong with those climate alarmists?
““Any human-induced effect on climate will be superimposed on the background “noise” of natural climate variability”
Fail to see any controversy in this statement.
But conspiracies are hidden everywhere…
Nat:
“Noise” implies ‘background noise’, and unimportant, which is exactly how the IPCC treats natural causes of climate change.
4.5 billion years of huge climate changes with no input from man made CO2 at all, and suddenly natural causes of climate change are demoted to “noise”.
That’s junk science, and you love it.
It doesn’t how CO2 (or any GHG) got into the atmosphere. It has the same effect.
We don’t have trustworthy climate proxy evidence to show the relationship of CO2 and temperature beyond about 500,000 years ago, using Antarctica ice cores.
It would make sense that what we have found out about natural climate change in the past 500,000 years also applied to the four billion years before that, but that is just an assumption.
What we have learned from ice cores is that temperatures peaked BEFORE CO2 levels peaked.
Strongly implying that temperature changes CAUSED CO2 changes, NOT the opposite.
The usual, sensible explanation is that natural causes of climate change warmed the oceans and as the oceans warmed they released dissolved CO2 in the atmosphere.
Just like a cold soda pop sitting outdoors on a hot day.
If the extra CO2 in the atmosphere caused a higher vapor content (Water vapor positive feedback theory beloved by climate alarmists), then there would be additional warming, releasing more CO2 from the oceans.
Eventually the runaway global warming (positive feedback) would have ended all life on our planet.
And none of us would be here today to give each other a hard time about climate change.
But runaway warming never happened.
Even with CO2 levels up to 10 times higher than today, according to geologists.
All prior warming trends ended, and cooling trends began.
So there is no evidence that CO2 levels ever controlled the temperature of our planet.
And ZERO evidence of a water vapor positive feedback tripling the claimed greenhouse effect of CO2 alone.
“What we have learned from ice cores is that temperatures peaked BEFORE CO2 levels peaked.
Strongly implying that temperature changes CAUSED CO2 changes, NOT the opposite.”
Not at all. It is well known that temperature rise can cause a CO2 rise.
But also we KNOW that we currently have a GHE: a CO2 rise can cause a temperature rise.
You see a chicken hatching out of an egg and conclude ‘Chickens DON”T cause eggs’
Brilliant.
RG said: We don’t have trustworthy climate proxy evidence to show the relationship of CO2 and temperature beyond about 500,000 years ago, using Antarctica ice cores.
Reasonably reliable proxies go back about 500-1000 million years in the past. We can certainly debate on how “reliable” they are though.
RG said: Strongly implying that temperature changes CAUSED CO2 changes, NOT the opposite.
Remember, CO2 both forces temperature changes and responds to temperature changes. Therefore it can both lead and lag the temperature depending on which set of agents catalyzed the temperature change. There are several episodes in Earth’s history in which sudden carbon releases catalyzed a temperature increase. The PETM is probably the best analog to our current era. And, of course, the CO2 forcing is required to explain to the faint young Sun problem.
RG said: The usual, sensible explanation is that natural causes of climate change warmed the oceans and as the oceans warmed they released dissolved CO2 in the atmosphere.
Except…carbon mass is increasing in the ocean today. The ocean is taking up the excess carbon in the atmosphere.
RG said: Eventually the runaway global warming (positive feedback) would have ended all life on our planet.
A runaway greenhouse effect is not possible on Earth.
RG said: Even with CO2 levels up to 10 times higher than today, according to geologists.
Yep. And remember that like all main sequence stars the Sun brightens as it ages. It is ~1% dimmer for every 120 million years in the past. That means even at 10x the current amount it still would not have provided enough radiative force to offset the -14 W/m^2 solar force 600 MYA.
RG said: All prior warming trends ended, and cooling trends began.
Yep. And they do so for a reason. We want to know what those reasons were.
RG said: So there is no evidence that CO2 levels ever controlled the temperature of our planet.
Patently False. There is a mountain of evidence. I think what you actually mean is that you just don’t accept the evidence.
Nate says:
”Not at all. It is well known that temperature rise can cause a CO2 rise.
But also we KNOW that we currently have a GHE: a CO2 rise can cause a temperature rise.”
————————
There is a degree of uncertainty in that statement Nate. Fact is climate involves far more than the radiating surface of the ground and ocean surface. We only know that that surface is affected by what it actually sees above it. We don’t know how its affected by that which is hiding behind what it sees.
“We don’t know how its affected by that which is hiding behind what it sees.”
‘We’?
Your ignorance of the science does not mean Science is ignorant.
Nate having an opinion means thinking you know something that you really might not.
The claim the science on all this solid is just balderdash.
Unlike USHCN which is deprecated since 2014 but still exists, GHCN V3 has been shut down in 2019.
Nonetheless, the data is alive and can be downloaded and evaluated by anybody who knows how to do.
As opposed to GHCN daily and GHCN V4, GHCN V3 has a nice feature: all 7280 stations (which all are real, regardless what boasting genius Robertson might pretend about them) have, in the station metadata file, some attributes specifying rurality and brightness index.
I made years ago comparisons between time series generated out
– ‘rural’ stations with the lowest of the 3 BI categories (about 2300);
– suburban and urban stations with highest BI (about 2900);
– all stations.
Here is the most recent output — for CONUS:
https://drive.google.com/file/d/1XvrhqhSkJl23pqqr70g6_fuSmHFlfLMX/view
I know: this distinction has become somewhat arbitrary over the years. But we have it, and to criticize it is quite simple.
What I found interesting is that
– while having bypassed the other plots around 1990, the ‘urban’ plot was way below the others decades ago, what explains its far higher trend;
and above all that
– the ‘all stations’ plot has been all the time much nearer to the ‘rural’ plot than to the ‘urban’ plot.
But the main discussion for me is – as Nick Stokes wrote – centered around the fact that we can’t ignore urban heat just because lots of alarmists try to misinterpret and misrepresent it as a consequence of solely CO2 increases.
This is the reason why I don’t understand Roy Spencer’s idea.
J.-P. D.
Most urbanization bias studies relied on just one indicator to separate urban and rural stations.
Peterson, 2003 assumed that a station was urban once the nightlight brightness in the area, measured by satellite,
reached a certain value.
In reality, urbanization bias is a gradual process.
Picking a single rural to urban threshold variable is too subjective, and arbitrary.
Urbanization bias is a continual process that gradually
becomes greater as a rural village with a weather station becomes a small town, then a large town, then a small city,
and then a thriving metropolis.
By taking a very simplistic approach, most of the studies
failed to properly distinguish between the true climate trends, and urbanization bias.
Most studies seem to have assumed if you could divide stations into two subsets – rural and urban — using a single variable,that was good enough to estimate urbanization bias.
I disagree.
Th information below is from somewhere on this website, in 2010:
The “urban heat island “effect is greater for a rural station
becoming slightly urbanized, than for an urban station
becoming slightly more urbanized R. Spencer
“The global average urban heat island effect in 2000 estimated from station temperatures and population density data.”
“Peterson, 2003 assumed that a station was urban once the nightlight brightness in the area, measured by satellite,
reached a certain value.
In reality, urbanization bias is a gradual process.
Picking a single rural to urban threshold variable is too subjective, and arbitrary.”
Richard, once again you prove what a joke Climate Science is. What kind of “science” doesn’t standardize their measuring specifications? They just take all stations, garbage, corrupted, moved, Urban, Rural etc etc etc and then throw them all together and claim that they can somehow produce a valid temperature chart. I’ve said countless times and used Desert Locations to prove it, that the increase in temperature recorded in the NASA GISS Global Temperature Graph is nothing more than a measure of the UHI and Water Vapor Effect.
Any real science would have specifications for stations that meet the requirements of no UHI or Water Vapor to be included in the Composite. I created a list of 265 Stations that show no warming.
https://wattsupwiththat.com/2021/02/12/urban-heat-island-effects-on-u-s-temperature-trends-1973-2020-ushcn-vs-hourly-weather-stations/#comment-3181833
Simply identify desert locations, dry and cold, and you will see there is no warming, even when CO2 increases from 300 to 415 ppm.
Here is my Favorite:
Alice Springs (23.8S, 133.88E) ID:501943260000
https://data.giss.nasa.gov/cgi-bin/gistemp/stdata_show_v3.cgi?id=501943260000&dt=1&ds=5
Looks right to me.
On a global average basis it looks like this: https://watervaporandwarming.blogspot.com https://drive.google.com/file/d/1_2m02r30FmvtgSnOEZunFRpUJwTUFU_V/view?usp=sharing
That link shows that measured WV is increasing faster than possible from global average surface temperature increase which demonstrates that CO2 has no significant net effect on climate. This agrees with CO2islife finding.
The graph at https://drive.google.com/file/d/14PxMjIbvcLoe-iY9lVefM-CVTsj6_quZ/view?usp=sharing shows a comparison of measured temperatures with calculated temperatures assuming no contribution from CO2.
Dan, great posts. Your one link requires access permission. Would you repost as open?
Done. The link looks the same but now you can see the graph.
Thanks for the note
CO2…”Richard, once again you prove what a joke Climate Science is”.
If you go back to the roots of the IPCC you can see why. It is based on the thoughts of Margaret Thatcher which were based on a fight she was having with UK coal miners. She was exasperated with her inability to control them.
She had a degree in chemistry and an advisor urged her to take it to the UN, to scare them onside by the fear that emissions from coal could cause global warming, hence the need to shut down coal mines. She did, and the UN bought it.
Of course they bought it. Since the 1960s, the IPCC has been looking for a way to form world government in order to impose taxes on wealthy nations to support less fortunate countries. The IPCC has no interest in science, they are a child of the UN and the real motive is world government.
The first co-chair of the IPCC was John Houghton, a protege of Thatcher. He was also a climate modeler and he imposed model theory as a basis of IPCC thought processes. Houghton once declared that it was necessary to scare the public onside, otherwise no one would listen.
Since then, all forms of pseudo-science have been employed to support the AGW theory. It is disgraceful to me that organizations such as NOAA, GISS, and Had-crut should buy into deceit in order to enable such pseudo-science.
Mr. Robertson
You wrote:
“Since the 1960s, the IPCC … ”
I believe you meant:
“Since the 1960s the United Nations … ”
Look up Maurice Strong
You also wrote:
” … the AGW theory. It is disgraceful to me that organizations such as NOAA, GISS, and Had-crut should buy into deceit in order to enable such pseudo-science.”
My comment:
Did you mean the Catastrophic CAGW theory?
The AGW theory (man made global warming) is not deceit.
It’s based on real science in a laboratory, proving CO2 is a greenhouse gas.
The effect of added CO2 in the atmosphere is not known, and not knowable.
To claim it is “significant” is speculation.
I accept the infrared gas lab spectroscopy experiments as real science, and have no problem assuming CO2 has some warming effect (by interfering with our planet’s ability to cool itself).
On the other hand, I favor a lot more CO2 in the atmosphere to accelerate plant growth, increase crop yields, and green our planet, based on thousands of real science experiments, and the experiences of greenhouse owners.
If that extra CO2 causes any warming, the warming should be mild, and harmless.
That’s what the lab experiments suggest, and that’s what has happened in the past 45 years.
There is no evidence of a water vapor positive feedback that would triple the warming suggested by the lab experiments caused by CO2 alone — changing harmless warming, to potentially harmful global warming.
I reject the always wrong, wild guess predictions of a coming climate crisis.
They started in the 1960s, and I’m tired of hearing them.
Unlike the climate alarmists, I have noticed that the locations and timing with the most warming since the 1970s were colder areas, mainly during colder times of the year, and mainly at night.
Which makes the mild warming pleasant — and pleasant is better than harmless.
Meanwhile, It’s really cold where I live in southeastern Michigan, and has been for a week.
That is a global warming “emergency”?
It has been so cold in Texas recently that wholesale electricity prices have gone through the roof.
See the article on my climate science blog:
https://elonionbloggle.blogspot.com/2021/02/global-warming-hits-texas-we-are.html
richard…”My comment:
Did you mean the Catastrophic CAGW theory?
The AGW theory (man made global warming) is not deceit.
It’s based on real science in a laboratory, proving CO2 is a greenhouse gas.
The effect of added CO2 in the atmosphere is not known, and not knowable”.
****
I was referring to the way shysters like NOAA, GISS, and Had-crut have taken the good lab work of Tyndall, circa 1850, and built it into pseudo-science. As you say, there is no way of knowing the effect of CO2 with regard to warming.
We can use our own speculation based on real science. For one, CO2 makes up only 0.04% of the atmosphere. I have heard all forms of rebuttals on that, from the effect of a drop of ink in a glass of water, but not one addresses CO2 as a mix in a gas. So I gave my own view on that.
I realize the atmosphere is a turbulent mixture of gases that creates an impossible situation for analysis. All the same, if you could reduce the atmosphere to a static mixture of gases, where the Ideal Gas Law applies, we can see the effect of 0.04% CO2 in that mix.
First, we must presume a relatively constant volume, or break the atmosphere into layers small enough where the IGL might apply. Given constant V, we have PV = nRT. With a constant v we can write:
P = (nR/V)T
That tells us that with a constant volume and number of molecules (n) that P is directly proportional to T.
Next we apply Dalton’s law of partial pressures. It tells us that the total pressure of a gas equals the sum of the partial pressures of each gas. Since partial pressures are almost directly proportional to the mass percent of each gas in the mix, and since those partial pressures must also generate temperatures in proportion to the overall temperature, the 0.04% of CO2 can never exceed a contribution of 0.04C per degree C warming.
In the AGW theory as applied in models, that 0.04% is given a warming factor of 9% to 25%, depending on the amount of water vapour. The Ideal Gas Law tells us you cannot simply assign an arbitrary number to the warming effect of CO2.
When I use the term AWG, I am referring to the corrupted version, not the inferences of Tyndall and Arrhenius. I fully accept that gases like CO2 and WV can absorb electromagnetic energy and warm. As you know, the atmosphere is not a lab where a gas can be constrained to a long tube in which it is exposed to infrared energy from a burning flame.
Gordon Says: If you go back to the roots of the IPCC you can see why. It is based on the thoughts of Margaret Thatcher which were based on a fight she was having with UK coal miners. She was exasperated with her inability to control them.
Yes, thanks Gordon. There is a Documentary “The Great Global Warming Swindle” that details that.
I once saw a documentary detailing how aliens came to our planet and Egyptians worshipped them.
I hope those aliens come back to disprove AGW.
Australia has a climate temperature record going back to the 1860s. Since about 1900, there have been hundreds of digitised station records to choose for research on matters like UHI. Australia also has a great deal more open space than many countries, so it lends itself to examination of the “urban minus rural T” approach to see what UHI there was.
In 2011 I separated out some 44 stations that any reasonable observer would label “rural”. I have been to many of them. At the time, I even called them “pristine”. These were to form a basis of rural stations to compare with another selected set of “urban”. It never got that far. There was too much noise in the data. Too many missing values. Too much repeat data where a month of temperatures were copied to fill in another month of missing obs. That sort of thing. I chose 1972 as a start year because conversion of deg F to deg C happened that year; and 2006 as the end year because my digital data source ended in March 2007. Both Tmax and Tmin were analysed. I started with daily data, infilled, then averaged it to annual.
Here are the numbers, in easy Excel form, for any readers here to crunch. It is easy to do.
http://www.geoffstuff.com/pristine_44_2018.xls
The more isolated the station, the poorer the quality, it seemed.
There was so much missing data that infilling gave different final results depending on who did the infilling, or whether the missing data were just ignored instead of invented. These numbers here are invented by inserting a rough mean of the data just before and after the missing data on a daily basis.
If you extend the time scale from 1972-2006 to 1972-2020, the trends alter substantially, some from negative trends to positive, some the opposite, for the small number of updates that I did recently.
The data are not stable enough to derive much of interest. As the spreadsheet analysis shows, you can get the temperature trends to correlate with all sorts of extraneous variables. The trends even have a pattern when plotted against the stations numbers from the World Meteorological Organization, when they should not.
If anyone, including Dr Spencer, think that you can extract useful UHI relations from these numbers, go ahead. I dare to say that you cannot. I cannot comment on the method of relating UHI to population, because just about all of these stations have essentially zero population within reach. However, from years of other UHI work, I cannot support the use of populations of people, of night lights or anything else. There is simply not enough recorded aboservation about enough sites with adequate quality to start to generalise and draw inferences. And, at least in Australia, there is not enough quality in the rural temperature data. It was never designed for this type of use and it is simply unfit for purpose. Geoff S
Geoff.
Are you saying that the data we are basing major decisions on has been fabricated?
If its not reliable enough to use to determine UHI effect surely it is not reliable enough to show a warming effect in general.
MW,
“Fabricated” is too strong a word. As part of a team we have just started making a renewed effort with better software and are finding more and more examples of shoddy raw data in the official Australian temperature numbers. We tend to put these down to lazy or naive sorts of efforts by people transcribing from handwritten original observation sheets to digital forms. Fabricated implies an evil intent to do something wrong and I am showing no evidence for that yet with Raw data. We are not talking adjusted data here.
My main point is that there is too much noise of various types to perform other than very rudimentary analysis. If people calculated proper, official estimates of uncertainty they would soon find that many attractive ways to use the numbers are defeated by noise before they even start to get anywhere.
bdgwx says: February 13, 2021 at 10:06 AM “The uncertainty is actually less than 0.1C and has been since at least 1960.” This is no more than a public statement of scientific ignorance, made worse from the safety of nobody being able to go back in time with a thermometer and on the same day, to replicate. Easier to fib when you can’t be caught.
I have tried to get an uncertainty extimate from the BOM for several years now, but they have declined several times to give one. Their responses have been “obfuscation”, “work in progress”, “hope to publish a paper soon”, “have a read of what was said at this conference last year”, that type of deflection.
I used to own a lab where our future income depended on giving estimates of uncertainty for our measurements that clients could test openly or secretly by easy methods. If we failed, the enterprise failed. It would be interesting to read of overall uncertainties claimed by NOAA and GISS and Berkely and UAH, so that there was some material to work on as to how good those estimates are.
If the uncertainty is less than 0.1C as bdgwz claims, then ten people with a thermometer each would be able to go to a time and place, measure temperature, then compare results. Chance that 66% would fall within +/- 0.1C is remote. Then, start accounting for other known factors that can affect temperatures and you are more likely to go beyond +/- 1C. With that noise, it is not quite proper to try to derive trends of less than that per time, as a rough rule of thumb.
Many publications in other areas of science exist for the proper calculation of errors and uncertainties. One of the hallmarks of climate research is the rarity with which proper, recommended, explained, sometimes even officially mandated methods are even mentioned, let alone performed properly. Geoff S
Geoff said: If the uncertainty is less than 0.1C as bdgwz claims
It’s not my claim. It is the result of peer reviewed analysis.
https://csas.earth.columbia.edu/sites/default/files/content/Lenssen_et_al-2019-Journal_of_Geophysical_Research__Atmospheres.pdf
Geoff said: then ten people with a thermometer each would be able to go to a time and place, measure temperature, then compare results.
What? That doesn’t even make any sense. How can ten people take a single reading a specific time and place and report a global mean surface temperature value?
Geoff said: Chance that 66% would fall within +/- 0.1C is remote.
Actually that is 2 sigma so it is a 95% confidence interval.
Geoff said: Many publications in other areas of science exist for the proper calculation of errors and uncertainties.
Agreed. That’s why none of this is a mystery.
Geoff said: If the uncertainty is less than 0.1C as bdgwz claims
Badwax replied:
“Its not my claim. It is the result of peer reviewed analysis.”
My comment:
That is pal reviewed baloney.
There is no way to calculate a margin of error when there is so much guessing (infilling) that can never be verified.
In addition, the measurement instruments are not likely to have +/- 0.1 degree C. accuracy, and checked regularly for accuracy, especially before World War II, so the claim of +/- 0.1 degree C. for the global average temperature is science fraud.
No bogus “study” will overrule common sense … except for you badwax — a victim of the appeal to authority logical fallacy (if government paid/granted bureaucrats say so, then it must be true).
Greene
What a dumb, incredibly arrogant comment!
You spend your free time here to produce discrediting and denigrating remarks about lots of things you yourself would never be able to do.
That is what I call bare pseudoskepticism.
Thanks for that!
J.-P. D.
RG said: There is no way to calculate a margin of error when there is so much guessing (infilling).
And yet the authors listed on the publication figured out how to do it. And it’s not just them. Other institutions who publish global mean surface temperature datasets have quantified their uncertainty as well. Here is BEST publication.
https://static.berkeleyearth.org/papers/Methods-GIGS-1-103.pdf
RG said: that can never be verified.
Sure it can. I promise you that you’ll be able to figure out how to verify GISTEMP’s method (and others) of interpolation in a matter of minutes. It is mind numbingly obviously how to do it. Take a stab at and post back.
RG said: In addition, the measurement instruments are not likely to have +/- 0.1 degree C. accuracy, and checked regularly for accuracy, especially before World War II, so the claim of +/- 0.1 degree C. for the global average temperature is science fraud.
It’s a good thing 0.1C accuracy is not required on individual instruments then. In fact, as a first approximation and with 8000 subboxes GISTEMP only requires about 4C of accuracy on each subbox to yield a 0.05C standard error of the mean. E = S/sqrt(N) = 4/sqrt(8000) = 0.045. Note that in reality the uncertainty quantification is vastly more complicated. Read the paper.
RG said: except for you badwax
Seriously?
You can’t guess temperatures for many grids, and then claim you know the margin of error for a global average, and it is tiny, especially in the Southern Hemisphere before 1900, with far too few measurements.
No amount of high level math, Ph.D. degrees and mathematical mass-turbation will chage that fact that the accuracy of unverified guessed/infilled temperature numbers, plus measurements using buckets and thermometers, mainly in shipping lanes in the Northern Hemisphere, with a margin or error likely to be +/- 0.5 degrees for untrained sailors … somehow ends up as a +/- 0.1 degree C. margin of error for the global average.
That +/- 0.1 degrees C. claim is science fraud.
RG,
If the margin of error on each subbox is 0.5C then the standard error of the mean is E = 0.5/sqrt(8000) = 0.002C.
bdg…”Its not my claim. It is the result of peer reviewed analysis”.
***
Hilarious…a paper co-authored by Gavin Schmidt and James Hansen, two of the biggest alarmists who ever walked the planet.
Your naivete knows no bounds and your appeal to authority the same.
Are you aware that Schmidt sat on a review board as an editor at the Journal of Climate? The paper was likely reviewed by him and or his buddy, Michael Mann, who was an editor on the same journal.
Peer review no longer means a darned thing. It has been hijacked by idiots. When Australian researcher, Barry Marshall, submitted a paper claiming to have found a bacteria, h. Pylori, that could survive in stomach acid and create ulcers, his paper was rejected BEFORE it got to peer review.
The journal editor listed Marshall’s paper as one of the ten worst ever submitted. Can you imagine what kind of idiot that idiot would have appointed as a reviewer? Marshall had to drink a concoction with H. pylori in it, making himself very ill, then healing it using antibiotics before anyone would listen.
If the idiots in the peer review journal had gotten their way, and Marshall did not have the guts to proceed with his proof, we’d still be treating stomach ulcers with antacids and getting nowhere.
I’m sorry, modern peer review is often utter garbage and that’s pertinent to the climate sciences where peer review has been hijacked by the likes of Schmidt and Mann.
Ask Roy or John of UAH about peer review. They struggle to get their papers published. And when they have succeeded, people like Kevin Trenberth have hounded journal editors to get their papers withdrawn.
Climate science peer review is rigged.
The entire world has had 33 years to review the GISS method and 18 months to review their more rigorous uncertainty analysis. They’ve had 7 years to review the BEST method and uncertainty analysis. Can you post a link to a peer reviewed publication presenting an alternate analysis that comes to a significantly different conclusion?
sorry bdgwx but you are expressing an argument from ignorance. The surface doesn’t warm from something simply because we are ignorant about how multiple layers of greenhouse gases get heat back to the surface.
I am convinced that greenhouse gases are absolutely necessary for warming the actual radiating surface of the ground and sea but that is only line of sight and doesn’t explain the greenhouse effect as expressed by our climate temperatures. There is difference between surface radiating power and climate and radiation does not explain it all. Radiation only explains a lot at some virtual surface high in the sky. . . .and even there one cannot go so far as define an equilibrium as defined by Stefan and Boltzmann. The frustration and complications of doing that has actually created the necessity of an abandonment of science in order to express a particular theory.
It is an easy and common abandonment that auditors frequently note where form dominates over substance. It is a most common issue found in the most regimented of governments and large institutions where substance becomes defined by ‘accepted’ symbolic forms.
bill,
I fail to see the connection between your post above and the quantification of the uncertainty in GISS’ land-ocean temperature index. That is what is being discussed in this thread.
with all due respect bgdwx, your statement was the world had 33 years to review the GISS method.
The assumption you express is that there is a reliable means of reviewing it.
Scientific peer review doesn’t ensure the methods are adequate and reliable. All scientific peer review does (when not engaged in political obstruction) is ensure there is not any conflict with better understood science within the narrow window of the peer reviewer’s expertise and beliefs.
Scientific peer review is not a professionally designed independent full spectrum look at a science paper.
Much of the talk recently on ”red team” peer review has been designed at broadening the examination. There have also been professional team recommendations of that sort given to the IPCC which have only partly been implemented.
Process is everything. Literally tens of thousands of science papers or more would not stand up to full examination to at all any degree that say corporate financial statements must withstand or sat FDA drug approval moving into the science realm.
It seems clear to me with all the claims of harm to health and finances AGW science should be so examined. . . .and actually to some extent it has been as the government hasn’t completely caved in to all this. . . .some harmful stuff but mostly aimed at politically already sensitive topics like the keystone pipeline, coal mines and few other things.
bill said: The assumption you express is that there is a reliable means of reviewing it.
If the collective intelligence of 7 billion people is insufficient to reliably review GISS’ method and uncertainty quantification then what more are you looking for?
Peer review at the journal level is only meant to keep publications with egregious mistakes from spamming the system. The “real” review occurs when that publication is presented to the entire world. The Hansen 1987 methods publication has been available to the entire world for 33 years. And although there are several legitimate critiques of it no one has expressed any serious objections at a fundamental level regarding their method and quantification of uncertainty.
I have to be honest…I think the GISS method elementary. I’m critical of it because it is so simple. More dynamic methods like kriging, local regression, etc. would be more appropriate IMHO. But I do have to concede that something can be said for simplicity and the fact their results match others is quite compelling.
bdgwx my response is in part here: http://www.drroyspencer.com/2021/02/urban-heat-island-effects-on-u-s-temperature-trends-1973-2020-ushcn-vs-hourly-weather-stations/#comment-618262
and is in part because GISS doesn’t come up with the same result as others.
bill said: and is in part because GISS doesnt come up with the same result as others.
Yes they do. And it is remarkable because the between NASA, NOAA, Hadley, Berkeley Earth, Cowtan & Way, and Copernicus we have techniques ranging from NASA’s subbox method to C&W’s kriging method to Copernicus’ 4D-VAR method with each using a different subset of available data. BTW…make sure you check out how well CMIP5 model predictions match observations while you’re on the page. Oh…and notice that like any true scientist Dr. Hausfather cites his evidence for everyone to review.
https://tinyurl.com/7cglt5l9
bdgwx the graph you present shows a difference of .15 between the surface records. That provides additional evidence that the GISS claim of .1 accuracy is bogus.
And of course all that exists on that graph are surface records subject to UHI influences. UAH is another ~.13 additionally less (roughly estimated) from the coolest of the surface records. But UAH is largely immune to UHI.
So rather than arbitrarily attacking one or two of the records, the difference could largely be UHI and variations on how that UHI is gathered and treated providing a similar margin of difference between the surface records themselves.
Roy in this post has developed a means of somewhat ground truthing that argument. I wish him the best of luck in continuing his research and gaining additional budgets to expand it.
Remember these are 2-sigma uncertainty values for a single value. That means there is a 5% chance the error is more. When comparing the two or more values you have to use summation in quadrature. So using 0.1C as the basis for both values we expect disagreement at 95% confidence of S = sqrt(0.1^2 + 0.1^2) = 0.14C. That means on average we expect a disagreement of >= 0.14C every 20 years between 2 preselected series. The probability of a disagreement of >= 0.14C between any 2 of the 6 series in any given year is thus 1-(1-0.05)^15 = 0.54 or 54%. In other words, we expect a disagreement >= 0.14C between 2 of the 6 series about once every 2 years. Obviously in reality it does not occur that often. That is because the 95% CI is actually closer to 0.05C after 1970.
BTW…this does not factor in systematic biases like is the case with the NOAA and Hadley temperature series. Those are only partial sphere measurements and do not adequately cover the Arctic region. This lowers their warming trends since they exclude the fastest warming region from their global mean temperature calculation. As a result they will deviate more and more from the others as time goes on. That is why NOAA and Hadley will be more likely to break above the 0.14C error margin and the probability of such an occurrence increases with time.
I will say that Had.C.R.U.T version 5 has just recently been published. v5 moves from 80% coverage to near 100% coverage like what NASA and BEST achieve. Note that Copernicus uses the very different and vastly more complex 4D-VAR method. That is a subject for a different discussion though.
I read the paper referenced in your comment and it is a pile of steaming farm animal waste products: The goal was obviously to use mathematical mass-turbation to justify bogus claims of tiny global average temperature statistics margins of errors, using mathematical guesswork (extrapolation of missing data) called kriging.
There is far too much missing temperature data before 1900 for the claim of a +/- 0.1 degree C. margin of error in the stated global warming since 1880.
Most of the planet had no weather station coverage before 1900.
For sea temperature “measurements”, areas outside normal shipping lanes were generally ignored, with few measurements in the Southern Hemisphere.
Using buckets and thermometers. Ha ha
You can’t extrapolate accuracy, to the nearest 0.1 degree C., starting with no data for most surface grids on the planet.
The coming climate crisis alarmists promote many misleading claims:
Claimed global average temperature margin of error of +/- 0.1 degree C. since 1880
Claiming to actually know the global average temperature in the 1800s.
Claiming a theoretical water vapor positive feedback effect, tripling the alleged warming effect of CO2 alone, that has never been seen in actual temperature measurements in the past 50 years.
Using climate computer games that predict more than double the actual warming since 1979.
Over 50 years of predicting a climate crisis as the actual climate gets more moderate, and more comfortable.
Promoting a single global average temperature that no one lives in, while ignoring the locations and timing of the most warming since the 1970s, such as warmer winter nights in Siberia.
Claiming future global warming will be a “climate emergency”, completely unlike the mild, pleasant global warming since the 1970s, that most people have enjoyed.
Demanding the replacement of reliable sources of electric power, at great expense, with unreliable wind and solar power.
Refusing to debate climate science, rudely attacking skeptics as “science deniers”, falsely claiming climate science is settled.
This all adds up to junk science used for climate change scaremongering.
How about real air pollution over many Asian cities from burning fossil fuels without modern pollution controls.
Who cares about that pollution?
Not the climate alarmists.
How about one billion people in the world with no electricity.
Who cares about them?
Not the climate alarmists.
RG said: I read the paper referenced in your comment and it is a pile of steaming farm animal waste products:
Fine. Now here is where you need to present evidence backing up your position. The most convincing evidence you can present is a dataset that publishes a global mean surface temperature accompanied with an uncertainty analysis that comes to a significantly different conclusion.
RG said: There is far too much missing temperature data before 1900 for the claim of a +/- 0.1 degree C. margin of error in the stated global warming since 1880.
That paper does NOT claim +/- 0.1C of error since 1880.
RG said: You cant extrapolate accuracy, to the nearest 0.1 degree C., starting with no data for most surface grids on the planet.
GISS, BEST, NOAA, JMA, Cowtan&Way, Had.C.R.U.T, UAH, RSS, the half dozen so reanalysis in datasets in widespread, etc. have no problem doing it.
Just because you don’t know how to do it doesn’t mean everyone else is as equally perplexed.
RG said: Using climate computer games that predict more than double the actual warming since 1979.
No. I’m sorry that statement is not right. See Hausfather 2019.
https://agupubs.onlinelibrary.wiley.com/doi/abs/10.1029/2019GL085378
“There is far too much missing temperature data before 1900 for the claim of a +/- 0.1 degree C. margin of error in the stated global warming since 1880.”
It is truly amazing how RG makes generalized hand-waving claims, with no calculations offered whatsoever, and in the end somehow comes to a quantitative conclusion!
Badwax
Perhaps someday in your life your wisdom will increase to the point where you realize the answer to many questions is
“we don’t know”.
Right now you are at a lesser level of wisdom — you love the appeal to authority logical fallacy ( they just HAVE to be right — they are EXPERTS — experts ALWAYS have answers — they NEVER say “we don’t know”, even when they don’t know ).
The comparison of computer games I previously mentioned was for UAH satellite “temperature” data and CMIP5 models, from 1979 to 2019. The models predicted more than double the actual warming in the UAH statistic.
The numbers would be different using surface statistics and different start and end years, but in general, the average model has ALWAYS over-predicted warming, and have not been getting more accurate over time.
Your sentence:
“Just because you dont know how to do it doesnt mean everyone else is as equally perplexed.”
… was a sophisticated character attack (did you hire a ghostwriter?), but it was still a character attack. Character attacks don’t refute anything, except the character of the person typing them. I would never do that. ha ha
… To Nasty Nate, who blabbered:
“It is truly amazing how RG makes generalized hand-waving claims, with no calculations offered whatsoever, and in the end somehow comes to a quantitative conclusion!”
My response:
I was NOT waving my hands — that’s how I type.
BS detection does not require alternative calculations. BS detection requires repeatedly asking the question “How do they know that?”
That’s an important question.
Because people often claim to have knowledge they do not have. They state answers to questions, when they do not know the answers. They claim their data are very accurate, when they are not. They resist saying “I don’t know”. They assume their credentials/college degrees/government position will keep people from asking the obvious question: How do you know that? And never accepting a simple answer, such as: ‘A peer reviewed study by Professor Joe Schmo” (the good old appeal to authority).
The global average temperature in the 1800s is a rough guess, no matter what any scientists claim, because of such poor global coverage, not to mention the not very precise bucket and thermometer methodology for 71% of the planet.
The future climate is unknown, and for over three decades, climate computer game predictions have been worse than a “more of the same” prediction, which seems to be what the Russian INM climate model predicts, with great success.
The claim of a water vapor positive feedback has no proof from climate history, and doesn’t even make sense — a positive feedback “runaway warming” would have destroyed the planet long ago.
The claim that we are in a “climate emergency” is wild speculation, that completely ignores actual experience with global warming in the past 45 years, which was pleasant for most people, and beneficial for plant growth.
RG,
You are absolutely right. My level of wisdom on climate science topics or any topic really is vastly inferior as compared to others. One thing I’ve learned over the years is that the more I learn the more I realize how little I actually know. So you definitely got that part right.
I do not appeal to authority. I appeal to evidence. You will often see me appealing to evidence either directly or indirectly by proxy by deferring to an authority who herself appeals to evidence. Note that I will never assume as fact something just because of who presented the evidence. It is all about the evidence itself. Don’t mistake my name dropping as appealing to authority. There is a difference between appealing to authority and deferring to authority. I defer to authority because 1) I recognize my own incompetency 2) that is the way you look up peer reviewed publications and 3) because it is considered plagiarism to present the work of others without proper citation.
And none of this has anything to do with your character. As I’ve said before I’m sure you are a great person with a fine character. But even great people with infallible characters encounter problems they can’t solve. Just because they were perplexed by the problem doesn’t mean that everyone was as equally stymied by it. That is my point. And I will be the first to admit that there is a whole array of problems that I can’t even begin to understand how to solve. I wish I had a better understanding of the climate than currently do.
Going forward just understand that pesky skeptics like me are convinced not by “nuh-uh” arguments but by “here’s how to do it better” arguments that are backed by vetted evidence. If you think +/- 0.1C is unreasonable then clearly and concisely describe how that publication got it wrong and how they should fix the problem. Get it peer reviewed. Then provide a reference to a dataset that also computes the global mean surface temperature accompanied by a rigorous uncertainty analysis that comes to a substantially different conclusion. I will then weigh that equally against all of the other pieces that compromise the body evidence. It is fair and it is reasonable.
“There is far too much missing temperature data before 1900 for the claim of a +/- 0.1 degree C. margin of error in the stated global warming since 1880.”
“BS detection does not require alternative calculations.”
Yes, yes it does.
Again Richard, you make a quantitative statement above. And you still havent added any quantitative backing for that.
“BS detection requires repeatedly asking the question ‘How do they know that?’
That would be a fine question.
But you not knowing how they do that, is not equivalent to ‘theyre doing it wrong’ or ‘its a steaming pile of whatever’, is it?
bdwdx sez:
“If you think +/- 0.1C is unreasonable, then clearly and concisely describe how that publication got it wrong and how they should fix the problem. Get it peer reviewed. Then provide a reference to a dataset that also computes the global mean surface temperature accompanied by a rigorous uncertainty analysis that comes to a substantially different conclusion.”
My comment:
You have described your own appeal to authority logical fallacy BETTER THAN I COULD. Thank You. For you to believe something, it was written by someone with a science degree and peer reviewed. That provides the authority you require.
What you don’t realize is that advanced degrees ans peer review do not create truth. In fact, peer reviews tend to create conformity (needed to get published).
Many peer reviewed studies make predictions of the future climate, which are speculations, not science at all.
Especially after so many decades of inaccurate predictions by climate models. No amount of peer reviews makes climate predictions accurate.
Yet the ‘coming climate crisis’ is based entirely on predictions of doom. No attention paid to the people on our planet who have lived with pleasant global warming for the past 45 years — the predictions are ALWAYS for bad news. The future climate can never get better? The future must be bad? That’s not science, it’s more like a religious belief.
The sparse global coverage before 1920, and especially before 1900, requires a lot of guessing to infill data free surface grids.
There is no honest way to guess so many numbers and then claim you even KNOW the margin of error.
It is especially wrong to claim a +/- 0.1 degree C, margin of error for pre-World War Ii temperatures, when that precision may not even be possible today.
Worse than claiming great accuracy of the past climate data, which at least is supported by some measurements, is grossly over confident predictions of the future climate, using a TCR from the 1970’s, that apparently never changes, even though it overstates actual measured warming.
AGW is real, and harmless.
CO2 is likely to cause some warming — amount unknown.
Older temperature measurements are approximate, and their accuracy is unknown, not +/- 0.1 degree C.
100 year climate predictions are climate astrology.
CAGW is scientific speculation, at best, and left wing propaganda, at worst.
bdgwx says:
”I do not appeal to authority. I appeal to evidence. You will often see me appealing to evidence either directly or indirectly by proxy by deferring to an authority who herself appeals to evidence.”
——————
LOL! Two concurrent sentences that contradict each other.
——————
——————
—————–
bdgwx says:
There is a difference between appealing to authority and deferring to authority.
—————————–
LOL! There is only a difference if you don’t say anything bgdwx. As soon as you open your mouth deferral becomes an appeal.
——————–
——————–
——————–
bdgwx says:
”Going forward just understand that pesky skeptics like me are convinced not by nuh-uh arguments but by heres how to do it better arguments that are backed by vetted evidence. ”
—————————-
Uh indeed you might be relatively more skeptical than the average individual but you aren’t actually very skeptical. Folks don’t like not having an opinion and they tend to adopt ‘groupy’ popular opinions for the purpose of social advantages.
but its a lot like invading Iraq to dispose of WMDs. An important need arising out of a lot of propaganda from experts. Of course it didn’t hurt that Saddam Hussein wasn’t in any way a likeable character. Sort of like oil tycoons have been portrayed in just about every school book published in the last 100 years or so.
——————–
——————–
——————–
bdgwx says:
”Get it peer reviewed. Then provide a reference to a dataset that also computes the global mean surface temperature accompanied by a rigorous uncertainty analysis that comes to a substantially different conclusion. I will then weigh that equally against all of the other pieces that compromise the body evidence. It is fair and it is reasonable.”
——————————
First off peer review serves a very narrow purpose in science. It does not come close to providing a means of validation. Validation in science comes from experiment and observation, not peer review.
Second, you say you will weigh the evidence after peer review. Yet you say its way beyond your understanding.
Third, I don’t see anything wrong with Richard’s post. He is expressing skepticism where skepticism is due. Its clear the situation is worse than looking for a needle in a haystack. Warming has been gentle and its been good for mankind. Technological advance comes from having the time and wherewithall to devote to exploration.
Fact is all of us have a lot more than we need. thats why we devote time to this forum. But skepticism is really writing it all off like Richard is doing until it actually proves to be something positive. Unfortunately its evolved beyond exploration which of course is a huge potential waste of resources. there is almost certainly more important fish to fry.
RG,
There is still a disconnect here. You keep saying that +/- 0.1C isn’t possible, yet all of the available evidence suggests that it is. You provide no alternative quantification of the global mean surface temperature and associated uncertainty. You don’t even provide commentary as to how you think NASA, NOAA, BEST, Had.C.R.U.T, etc. got it wrong. That is what I’m challenging you to do. If you won’t or can’t provide this kind of analysis then I have to choice but to fall back on the abundance evidence that is already available.
bill,
I think you may be misunderstanding what appeal to authority means. Appealing to authority means you accept a claim because of who made the claim. For example, accepting that the GMST has an error < 0.1C after 1950 only because Gavin Schmidt said so and for no other reason is appealing to authority.
Appealing to evidence means you accept a claim because of the evidence that was provided. It doesn't matter who's names are on a publications. The publication and all content within are the evidence. And when that evidence has survived whatever critiques have been leveled against we have confidence that it represents reality. For example, accepting that the GMST has an error < 0.1C after 1950 because there exists a publication detailing the methods and calculations used showing as much and having that content reviewed by experts in the field and the entire world without any significant criticisms leveled against is appealing to evidence. It doesn't matter if Gavin Schmidt's name is on the paper or not. The paper could have any been submitted anonymously and it still counts as evidence. It is the content itself and not not who published it that matters.
Deferring to authority is accepting a claim not because of who said it, but because that person demonstrated that their claim is supported by evidence. For example, I am completely incompetent in the field of neuroscience. But I will defer to an authority on any neurological ailments I might have as long as that authority has demonstrated that their diagnosis and treatment plan is supported by evidence. Deferring to authority is NOT the same thing as appealing to authority. It all has to do with whether evidence plays a central role or not.
I'm going to give you the same challenge I gave RG. If you want to convince me that the GMST has an error larger than 0.1C after 1950 then you need to present evidence to back up that claim. Evidence includes a publication that computes the GMST and provides a rigorous quantification of the error. Enough details need to be provide so that the results can be duplicated.
bdgwx says:
I think you may be misunderstanding what appeal to authority means. Appealing to authority means you accept a claim because of who made the claim. For example, accepting that the GMST has an error < 0.1C after 1950 only because Gavin Schmidt said so and for no other reason is appealing to authority.
Appealing to evidence means you accept a claim because of the evidence that was provided.
———————————
LOL! Uh. . . . here we are in the 21st century. Amazing instruments and the rate of warming difference between systems exceeds .1 degree C per decade. And you are going to argue that the science is adequate enough to say the warming since 1880 (14 decades) is within .1 degree C???
LMAO!
It doesn't matter who's names are on a publications. The publication and all content within are the evidence. And when that evidence has survived whatever critiques have been leveled against we have confidence that it represents reality. For example, accepting that the GMST has an error < 0.1C after 1950 because there exists a publication detailing the methods and calculations used showing as much and having that content reviewed by experts in the field and the entire world without any significant criticisms leveled against is appealing to evidence. It doesn't matter if Gavin Schmidt's name is on the paper or not. The paper could have any been submitted anonymously and it still counts as evidence. It is the content itself and not not who published it that matters.
Deferring to authority is accepting a claim not because of who said it, but because that person demonstrated that their claim is supported by evidence. For example, I am completely incompetent in the field of neuroscience. But I will defer to an authority on any neurological ailments I might have as long as that authority has demonstrated that their diagnosis and treatment plan is supported by evidence. Deferring to authority is NOT the same thing as appealing to authority. It all has to do with whether evidence plays a central role or not.
I'm going to give you the same challenge I gave RG. If you want to convince me that the GMST has an error larger than 0.1C after 1950 then you need to present evidence to back up that claim. Evidence includes a publication that computes the GMST and provides a rigorous quantification of the error. Enough details need to be provide so that the results can be duplicated.
bdgwx says:
I think you may be misunderstanding what appeal to authority means. Appealing to authority means you accept a claim because of who made the claim. For example, accepting that the GMST has an error < 0.1C after 1950 only because Gavin Schmidt said so and for no other reason is appealing to authority.
Appealing to evidence means you accept a claim because of the evidence that was provided.
LOL! Uh. . . . here we are in the 21st century. Amazing instruments and the rate of warming difference between systems exceeds .1 degree C per decade. And you are going to argue that the science is adequate enough to say the warming since 1880 (14 decades) is within .1 degree C???
Sorry for the double post but missed erasing a lot of my quote.
bill,
The claim (backed by evidence) is that global mean surface temperature anomalies have less than 0.1C uncertainty for years after WWII.
There is a difference between the uncertainty on individual monthly values and the uncertainty on the linear regression trend.
The GISS 2-sigma uncertainty on the +0.192C/decade trend from 1979-2020 is +/- 0.011.
The GISS 2-sigma uncertainty on the +0.075C/decade trend from 188-2020 is +/- 0.002.
Not only am I going to argue that the science is adequate enough to know the monthly global mean surface temperature anomalies to within 0.1C after 1960, but I am also going to argue that the linear regression trend of those anomalies is known to within 0.002C.
My evidence is the various datasets that publish a GMST and accompanied uncertainty analysis the raw output from Excel’s LINEST function.
bdgwx, your response is just a bunch of mumbo jumbo. Differences between different temperature records vary over .1degC at all levels, monthly, annually, decadal. And all the records combined aren’t going to provide the boundaries of potential error.
bill,
Don’t move the goal post. We are NOT discussing the variance in the individual temperature readings. We are discussing the standard error of the monthly and annual means. That is a completely different topic.
bdgwx you are the one moving the goal posts. I responded to your comment about ”accuracy”, not standard error.
Standard error is a poor indicator because it assumes error is random. This entire thread is not about ”random” error.
bill,
Accuracy is a non-factor here because we’re using anomalies. If there was an accuracy bias on the measurements then it cancels out via the use of anomalies.
For example, let Mb be the basis and Mm be the monthly mean, and B be the measurement bias. The anomaly A is…
A = (Mm+B) – (Mb+B)
A = (Mm-Mb) – B + B
A = Mm-Mb
Notice how the accuracy bias B cancels out. This is actually one reason why most people use anomaly analysis in the computation of the global mean temperature.
This is why when I see the word “accuracy” I implicitly understood it to mean “precision”.
I just looked…shame on me for using the word “accuracy” in one of my posts above when I should have used “precision” or “uncertainty”. That is on me. I’m usually careful about things like that. I guess I just overlooked it this time.
I will say that accuracy does come into play when you want to compare one time series to another. But that is a different topic.
But regardless this is all mostly moot because variance is still a different concept from either accuracy or precision. You’re still moving the goal post here.
bill,
I will say that the bias B in Mb+B and Mm+B above assumes that there is no time dependence. In other words, I probably should have labeled things as Mb+Bb and Mm+Bm and then said I’m assuming Bb = Bm. And for the most part that is a safe assumption. The issue that arises here is that Bb and Bm could deviate with time introducing a bias independent of the statistical uncertainty of the measurement. This is the case for UHI, TOB, instrumentation, etc. issues. But, and this in important, the bias is estimated at 0.01C. It is a value that is nearly one order of magnitude less than the statistical uncertainty. See section 4.2 on Bias Uncertainty.
What you need to do bdgwx is realize that standard error is only a relevant concept to random sampling. Right out the box even GISS wouldn’t argue that their sampling program is random.
In my view folks like Gavin Schmidt only throws those kinds of numbers around to con people into thinking it means something. Mathematicians sometimes need to come out of their shell and smell the coffee.
Snowstorm in Texas and Louisiana with very cold temperatures. This is the result of an unusually strong stratospheric attack in the US.
https://i.ibb.co/b51kfX5/gfs-o3mr-200-NA-f012.png
https://i.ibb.co/Svg32BB/Screenshot-4.png
The stratospheric forecast for five days does not predict major changes in the weather. Still heavy frost in the same areas of the US with a small shift eastward.
https://www.cpc.ncep.noaa.gov/products/stratosphere/strat_int/gif_files/gfs_o3mr_200_NA_f120.png
https://www.cpc.ncep.noaa.gov/products/stratosphere/strat_int/
Very dangerous freezing rain in Louisiana and Mississippi.
Thanks Geoff.
I wasn’t suggesting the numbers were fabricated,
I just wanted to query how data which relates to one study could not be used in another study.
I find the whole aspect of data measurement and the use of that in climate change confusing.
It seems to me as a non climate scientist that if a measurement doesn’t fit the model the data is deemed wrong rather than the model and the assumptions that the model is based on.
Maybe CONUS will have to suffer a while longer, but it seems that in Northern Germany, we slowly come out of this cold weather phase:
https://drive.google.com/file/d/1BV_fY5znBbM1iy2ILj8LV55UwHLyXpD1/view
Yahoooo! Even if it will take a while for this bloody snow to disappear, I’m happy, because… I don’t like it cold.
And… it was really funny to see at WUWT all the Coolistas claiming as usual the Grand Cold soon coming back, just because the Thames got frozen here and there.
So what! Weather is weather, and climate is climate.
J.-P. D.
I dare say if CO2
I was going to say if CO2 levels were back to levels a 100 years ago I bet the temperature trend would have been about the same.
Then bindidon,
Do you think the property called “closure” on which the climate study is based,
Regardless of the chaotic behavior of the short-term meteorological weather study (10-14 days), it is sufficiently proven or experimentally contrasted. How to believe in the prediction capacity of the IPCC models?
Note:
(Beyond the discussion about the noise that may be in the shot
or transcription of some data or data series … or the possible bias in the temperature homogenization criteria ,,,)
Adelaida
I apologize, but… I really don’t know what you are here referring to.
Please add some explanation helping me in identifying what you mean.
J.-P. D.
It looks like real scientists are finally taking a look at the data:
New Study Finds 25-45% Of The Instrumental Warming Since The 1950s Is Due To Urbanization, Not CO2
https://notrickszone.com/2021/02/15/new-study-finds-25-45-of-the-instrumental-warming-since-the-1950s-is-due-to-urbanization-not-co2/
Funny how an amateur Climate Data Scientist like me could have reached that conclusion blindfolded.
Urbanization = man made
They got the “man made” claim right = half credit?
CO2…”Funny how an amateur Climate Data Scientist like me could have reached that conclusion blindfolded”.
I am sure quote a few have reached this conclusion but getting the message out there is the problem. If you go the scientific route you have to get the paper through biased peer review. If you go the media route, you will likely never get covered by a major media outlet, who are seriously biased toward CAGW.
I am sure there’s a way, if enough people put their heads together.
“It looks like real scientists are finally taking a look at the data”
UHI has been assessed using observational data for decades.
What you mean is, “This researcher agrees with nme, so that makes them a real scientist.”
Geoff Sherrington
Thank you for the valuable comments concerning your BoM data analysis.
I downloaded your pristine_44 Excel file, had a quick look at it, but there is a lot on the FIFO stack to be done before.
While you prefer to zoom into single stations, I prefer to stay on their average level.
Here is a comparison of the Australian GHCN daily data set with UAH6.0 LT AUS, made a while ago till Dec 2019:
https://drive.google.com/file/d/11G0ce_SU-4Sd8vDrk58FhkCe8YQztu98/view
I like such comparisons of temperature measurements differing by about 24 C.
J.-P. D.
Sorry Bindidon and Thanks for responding !!
It is because of the phrase you said in the comment before I made you:
“So what! Weather is weather, and climate is climate.”
And I meant that long-term weather forecasting studies, which were instituted by Barry Saltzman, are alien to the chaotic determinism of short-term (10-15 day) weather forecasts.
That this is based on a property that is very clear and experimentally proven in quantum physics, that the change in scale (from the quantum scale to our macro scale in which humans normally move) causes a different physics. That is to say:
In the most normal day-to-day life of humans, Newtonian physics prevails, however, on the quantum scale, the laws that predict what happens with subatomic particles are very different and it is called quantum mechanics.
This ability is well proven in particle physics ….. but what about the climate?
Your phrase seemed to me to imply that you assumed this difference in the climate … and that therefore you understood its experimental basis …
I was asking you about it and I wanted to know your opinion!
Thanks for your patience and thanks to the whole group !!
¡Buenas tardes Adelaida!
You have overestimated my knowledge by dimensions.
And as I wrote:
” So what! Weather is weather, and climate is climate. ”
I must confess that it was less my personal meaning than what most people say.
To be honest, I intuitively rather think that weather and climate are two highly intricated phenomena, for which a clear separation is illusory.
The transition between the two depends on the spatiotemporal scale within which we observe them, and is probably not quite deterministic, he he.
J.-P. D.
binny…”And as I wrote:
So what! Weather is weather, and climate is climate. ”
As Tony Heller so insightfully put it, there is no concise definition of climate anywhere in science. Climate is far to complex to be defined and far too variable.
When people talk about climate change, they are talking through their hats.
Gordon Robertson
I think it is you who “talk through your hat”. You always follow a contrarian without thinking on your own.
Climate is actually well defined and relatively stable. Evidence by the type of life sustained in a given climate.
http://www.physicalgeography.net/fundamentals/7v.html
Seems different climates are very well defined and this article gives actual data on types of climates. Climate is not “far to variable” at all. If such were the case the types of life would not persist in the climate regions. I think you need to take a breather from contrarian thought and actually used some rational logic. A little thinking might help.
Climate change would be a case where a persistent region’s temperature and precipitation patterns altered in a long term change. If the Pacific Northwest no longer had the precipitation patterns and it dried up. After a few years you would no longer see dense forests. If much greater rainfalls took place in deserts of Arizona or Nevada you would get a much different ecosystem.
Wow, great analysis. Makes sense, and correctly isolating/ removing UHE would also seem to bridge the gap a bit between the sorts of temperature trends being recorded by Satellites and what *should be reported by land stations.
As an aside, the New York Times has retracted their false story about Capitol Officer Brian Sicknick’s death. He was NOT struck in the head with a fire extinguisher. Apparently, he wasn’t hit in the head at all.
Stephen Paul Anderson
It seems at this time the cause of his death is not known to the Public.
https://www.foxnews.com/us/capitol-riot-brian-sicknick-death-investigation-no-charges-autopsy-results-pending
As it is uncertain we will have to wait on this one before making conclusions. Someone was hit by a fire extinguisher however.
https://www.washingtonpost.com/video/politics/video-shows-rioter-throw-fire-extinguisher-at-police-during-capitol-attack/2021/01/14/1e75a543-7c61-43f2-a710-37edde925c0f_video.html
Norman,
So that is supposed to be evidence of someone throwing a fire extinguisher at the police?
Stephen Paul Anderson
That was not supposed evidence. It was real evidence. Someone in the crowd threw a fire extinguisher and hit a police officer in the head with it. The person hit may not have been Sicknick, that is what might have been wrongly assumed. However it is not supposed evidence, it is real.
You do realize that is a fake photo?
Stephen Paul Anderson
Do you realize it is a video and not a photo? You would have to alter the entire video to make a fake. Not saying it can’t be done, if you believe the video is fake provide valid supporting evidence. Just saying it is fake is not an intelligent response. Support your claims with evidence. Demonstrate the video is a fake using evidence.
It looks fake, but maybe it isn’t. I don’t trust a lot of these photos and videos. Many of them are fake (doctored).
WTF has this got to do with the UHI effect?
MJ,
None of your business. Pull your head in.
Thanks for your explanation …..cretin.
They are now blaming the riot on climate change, caused by Trump.
Who are “they,” and where can I see this?
You have no sense of humor.
A typical angry leftist.
Also, no sense.
But you already knew that.
Oh, that was humour, was it? It was hard to tell because it wasn’t funny. Maybe if hyperbole was something you didnt always engage in…
stephen…”New York Times has retracted their false story about Capitol Officer Brian Sicknicks death…”
Thanks for news. It’s beginning to look like a witch hunt. No one seems to know why the guy died even though it’s horrible that he was killed.
From the little I know of the White House altercation, I see no evidence of a riot. Civil disobedience, maybe, but riot, no. I saw far too many real riots in cities like Seattle and Portland, where property was damaged, people were murdered, and police were assaulted. It was disturbing to see Democrats supporting the riots.
All I can make of the White House incident is a protect gone wrong.
Spoken like a true denier.
MJ,
WTF are you talking about? Who cares what you think?
Spoken like a truculent teenager.
Scientists do not use “denier,” but propagandists do.
MJ,
And?
It was a riot. It just wasn’t a socialist riot where capital destruction is the object.
Trump isn’t at any more fault than any other political riot being some politicians fault.
I am sure I couldn’t count the number of flyers I have received from politicians and NGOs imploring that I join the fight.
Normand,
Of course,
for our human time scale the climate is very stable and well defined … but when it comes to computer modeling with the aim of predicting changes in the near future, especially at levels as small as a few degrees of temperature, in the middle of those immense scales of time and space!!!
Shouldn’t it make more sense to consider climate as a chaotic process with extreme scales of space and time … but ultimately intrinsically dependent on the initial parameters and the exact knowledge of how each and every one of these values influence in order to be able to quantify it …..?
Are these parameters well known? … Its assessment within the models is in many cases not approximate and depends on an incomplete current knowledge? (case sun-cosmic rays … to give an example …)
Thank you by your answer Bindidon!!:)
” it make more sense to consider climate as a chaotic process”
Look at a graph of Phanerozoic global temperatures ( the last 700 million years) and you become aware of five strange attractors spaced about 5C apart.
Hothouse 24C
Greenhouse 19C
Icehouse 14C
Severe Icehouse 9C
Snowball 4C
We were in Icehouse conditions during the Holocene and are now rising out of the Icehouse. Having risen from 13.8C to 15C it will be interesting to see when we tip over into the Greenhouse strange attractor. 2.5 C warming would put us halfway to the Greenhouse, call it 16.3C. At current warming rates we might tip as early as 2085.
So far my discussion points about noise in the BOM Australian raw, pristine data has been about “first inspection” errors from transcription etc., errors that can be seen before processing under program.
By far the biggest and most common perturbation of these temperatures is from water, as in rainfall, evaporation, flood etc. Put simply, water cools. Here are some papers by colleague Dr Bill Johnston that deals with water:
https://www.bomwatch.com.au/bureau-of-meterology/are-australias-automatic-weather-stations-any-good/
There are more stations analysed in detail on the bomwatch web site. Broadly, inclusion of annual rainfall figures into multiple linear regression methods commonly shows that some tens of % of the temperature variance can be statistically attributed to rainfall variation. Further noise comes from changes to instruments, glass or electronic thermometers, housings, as in different screen volumes, shapes, effective heights above ground and so on. These are detected by break point analysis and corrected for.
Then using rainfall as a correction factor, a reconstructed temperature time series can be made with corrections for these noise sources, to obtain a “naked” temperature/time series on raw data. This is little different in concept to adjusting data to allow for UHI effects. It is all standard methodology and it gives rather useful outcomes. One day I shall take those 44 pristine Australian stations through the procedures, but it is tedious work on a home PC. It amazes me that the paid professionals with supercomputers have not been responsible enough to do this out of scientific rigor.
Those who comment here that one can obtain high accuracy by averaging large numbers of readings might benefit from going back to the text books to determine if it is proper to use Central Limit Theorem and Law of Large Numbers on data like these. See if you have a sequence of independent, identically distributed (IID) random variables. I say you do not. You have temperature data that can vary from one station to the next because one has an automatic lawn watering system and the other does not. That is not independence in your data.
Nor are two stations independent when one has a UHI effect and the next one does not. Sorry, you are looking at errors, not mathematical ways to reduce them. Geoff S
“One day I shall take those 44 pristine Australian stations through the procedures, but it is tedious work on a home PC.”
Only 44 stations? And only using annual data? Tedious?
It should be easy unless your PC is actually a hand-held calculator.
Rather, I suspect either laziness or a failure to come up with the answers you want.
studentb,
Send me your email address and I’ll send you the starting data. Why not compute it for me?
You do not seem to understand what this next round of calculations entails. Geoff S
Better still. What If I tell you what to do.
First, pick a station. Put the annual rainfall and temperature data into excel columns.
Calculate the linear trends in both series.
Calculate the linear regression (function LINEST) between the 2 data sets and remove the rainfall effect from the temperature series.
Re-calculate the linear trends in the temperature series.
There – simple. Even my cat can use excel.
“Here are some papers by colleague”
A ‘paper’ is a peer-reviewed study. This is not what you colleague has linked. Indeed, he spends one of his blog posts downplaying peer-review. Your colleague has linked to some word documents he typed in.
The headline today is “unprecedented” storm stretches across 25 states. What is it with media today? Everything is unprecedented.
Four million people in Texas without electricity, and frozen wind turbines in Texas, ARE unprecedented. Extremely cold weather is caused by global warming.
As everyone knows, extremely cold weather is caused by global warming. Anything extreme is caused by global warming. The world is going to end in 10 years from global warming. That would REALLY be unprecedented … but there will be no media to report it !
Jennifer Francis was right.
The jet stream is becoming more unstable and the amplitude of Rossby waves is increasing. Hence the present extreme Southerly position of the jet stream over the US and the extreme temperatures in Texas.
https://insideclimatenews.org/news/02022018/cold-weather-polar-vortex-jet-stream-explained-global-warming-arctic-ice-climate-change/
RG said: The world is going to end in 10 years from global warming.
Which publication and which page number from the IPCC does this claim come from?
From climate perfesser Greta “thundering” Thunberg, and climate perfesser Alexandria Occasionally Coherent, (’12 years left’, first stated roughly two years ago).
I forget the page number, but it included a “2”, probably in one of the back-up books — perhaps you can find it? We’ll wait here.
Ok, well, neither name is listed on the IPCC contributor list nor is either a climate expert or even a scientist at all. I can’t imagine why anyone would expect them to be adequate proxies for bona-fide experts or to even speak intelligently on the actual science involved. My advice here is to use your time reading peer reviewed literature on the topic instead of wasting it on trying to parse what they have to say which probably isn’t even remotely close to being right in the first place.
Badwax
You have no appreciation for my “12 years to go” humor comments. I’ll have you know my wife FREQUENTLY compares me with one of the most famous American comedians of all time — Rodney Dangerfield — She often looks at me in the morning and says:”You look like Rodney Dangerfield”.
bdgwx says:
”Ok, well, neither name is listed on the IPCC contributor list nor is either a climate expert or even a scientist at all. ”
They just aren’t listed individually bdgwx. they are listed by association under the category of ”nations”. While this has no scientific reference within the IPCC works it is manifested in the interpretation, selection, consensus, summary, and conclusions.
Beyond that there is a lot of good science within the science bibliography of the IPCC workpapers. All that confabulating though isn’t science its policy.
Thats also why the process isn’t fraudulent. One who confabulates isn’t lying. Instead they are just prone to error.
bill,
By that definition I would be considered a contributor. Except…I definitely am not a contributor.
bdgwx says:
bill,
By that definition I would be considered a contributor. ExceptI definitely am not a contributor.
——————————
I didn’t say you were a contributor.
I was talking about political influence in the system and I don’t even know how you vote. I can simply surmise that your posts here don’t amount to any significant political influence.
You definitely nailed my political persuasion…about as close to zero as you can get. I dislike politics with a passion. That is applied equally regardless of whether it is “left”, “right”, Republican, Democrat, or even Independent. My loathing for politics is universal and complete.
One should face it. Identifying with a political party is an excuse to not think for yourself. If you think for yourself a political party isn’t useful. . . .unless you are on the take.
bill,
There is common ground between us. I agree with you on the MOD500 vs GRUMP criticism and I agree with you on the politics thing. 2 in one blog post isn’t bad at all!
Oh, come on BGDWX, do you have your head up your butt?
https://www.theguardian.com/environment/2018/oct/08/global-warming-must-not-exceed-15c-warns-landmark-un-report
It’s already too late.
The CO2 already released has baked in more than 1.5C. We are currently at 1.2C above preindustrial.
Even if we stopped emitting CO2 tomorrow, in 25 years we will have exceeded 5.35ln(411/280)3/3.7 = 1.66C.
I actually read IPCC SR15 report. No where in the report is there any mention of the world ending in 12 years, 10 years, or 100, 1000, or even 100000 for that matter. In fact, even just the word “catastrophe” or similar variations makes no appearance in the summary for policy makers at all. And of the 2 appearances in the text of the full report the word is used in the context that that an increased risk of damage by hurricanes, droughts, flooding, etc. would qualify as “catastrophic”. There is absolutely no mention whatsoever that humanity will die off or that the Earth will come to end.
Now if your beef is actually with the rhetoric The Guardian uses to portray the IPCC report then I share your frustration. I very much repudiate the media’s hype on the topic. Their insistence on insinuating that every weather event is the result of climate change is beyond maddening. Let me spell this out in no uncertain terms so there is no mistake on my position…climate change is NOT alarming. But don’t hear what I didn’t say. I didn’t say there won’t be consequences. I didn’t say that sea level rise, reduced crop yields, etc. are not a concern. But to sensible people those things are not cause for “alarm” in the context the word is used by contrarians.
So you’re saying the Guardian are a bunch of liars, and anytime one of your brethren links them here, you will speak out against it?
If anyone makes a claim that isn’t supported by science then I will definitely speak up. That applies equally to Al Gore, Greta Thunberg, AOC, The Guardian, or whoever else wants to misrepresent the science with flashy headlines or unsupported claims.
BTW and FWIW…The Guardian did not say the world would end anytime soon. And yet I still feel obligated to repudiate their rhetoric. If that doesn’t make my position on the matter crystal clear than I don’t know what will.
Stephen.
Imagine that I publish a spoof paper describing the effect of leprechauns on climate change, including the most likely outcome, 0C change, and 95% confidence limits of +/-1C.
How a newspaper reports the paper depends on its editorial policy.
The Guardian tends to focus on the highest figure.
“Leprechauns warm the world by 1C.”
Th Daily Mail tends to focus on the lowest value.
” Leprechauns cool the world by 1C. ”
Best to get your information directly from the scientific papers rather than the newspapers.
EM,
Exactly. And the context in which the word “catastrophe” was used by the IPCC wasn’t the same context that The Guardian was trying to imply. Nevermind that the 2nd use of the term by the IPPC appeared in a box with the label “Scenario 3 [one possible storyline among worst-case scenarios]”. So not only was it a worst-case scenario, but it wasn’t delivered with the same “alarmism” that The Guardian tried to insinuate. Like you said…it’s better to just read the scientific papers directly then having the media interpret them for you.
But they weren’t saying that without context. They said, according to the UN. You know, the IPCC people.
I don’t see many IPCC people clamoring loudly after The Guardian, and others report such nonsense. That’s the point. The IPCC needs to shut them down, not us “deniers.”
I agree with you on that. The scientific community needs to step up and combat extreme rhetoric on both ends of the spectrum.
Winters like these should act as a warning that we do not have a global warming problem. We have a global cooling problem. If the planet starts cooling significantly at some point, we are screwed.
One the basic problems I see with the multi-layered climate model is the night and day problem.
Science is silent on how heat trapped at TOA gets back to the surface. That is an obvious obfuscation as one cannot surmise a multi-layered theory on the basis of ”some how” with no official expressed theory.
And here is the probably the reason, IMO, something hasn’t been surmised at least publicly (beyond the obvious need to encode the processes in someway in models if the models are just simply parameterized to avoid the physics problem)
Basically the only logical method would be via restriction of convection. But convection is primarily a daytime phenomena that would feature higher Tmax temperatures with less impact on Tmin temperatures.
But when we look at the rare Tmin/Tmax graph what do we see? Twice the effect of global warming on Tmin than Tmax. Then the Guardian jumps in to talk about massive Tmax effects. Its all so illogical and ignorantly discussed. Fact is the ”assumptions” about the CO2 greenhouse effect seem to override common sense. Must not be much running around or skepticism would be an order of magnitude higher.
Literally the first sentence in the article:
“The worlds leading climate scientists have warned there is only a dozen years for global warming to be kept to a maximum of 1.5C”
What is meant here is that if we don’t reduce emissions in the next decade we will be locked in for 1.5C of warming by 2100.
This is super simple stuff you’re messing up here.
Four million people in Texas without electricity, and frozen wind turbines in Texas, ARE unprecedented. Extremely cold weather is caused by global warming.
China will never power their tanks with Solar, Russia will never fly their bombers using wind, rockets will never be powered by geothermal. China, Russia and our enemies are laughing at us.
Biden blocks pipelines in the US, support them overseas. Hunter helps Russia, Ukraine and China build energy projects, while Daddy Joe blocks energy projects here in the US. Most concerning of them all is that Joe Biden supports nuclear power and ultimately a nuclear bomb for Iran, while blocking Nuclear Power in the US. Why would anyone want Iran to be a nuclear power? I can only think of one reason, and it is horrific.
“Four million people in Texas without electricity, and frozen wind turbines in Texas, ARE unprecedented. Extremely cold weather is caused by global warming. ”
Indeed. I think of human activity as the cause, global warming as the effect and climate change as the consequences.
Climate change is not just about warming, it is about changing the way the climate behaves. The shape of the frequency distribution of the temperature data is changing. The global mean is increasing, so is the standard deviation. The frequency of both extreme heat and extreme cold is increasing.
Effects include unusual heat waves in India and unusual cold elsewhere. The unusual cold at present in Texas and Greece are present examples, caused by the jet stream at both locations moving unusually far South and bringing Arctic air with it.
You may remember that increased variability in the movement of the NH polar jet stream was predicted by Jennifer Francis in 2013. The southerly net stream currently chilling Texas is not proof of her hypothesis, but it is consistent with it.
https://insideclimatenews.org/news/02022018/cold-weather-polar-vortex-jet-stream-explained-global-warming-arctic-ice-climate-change/
ET Says: Climate change is not just about warming, it is about changing the way the climate behaves.
By what possible mechanism can man increasing CO2 cause cooling? The physics are very very very simple. Increase CO2 increase W/M^2 at a log decay rate. How can you cool something by adding energy to the system.
All this CO2 and AGW is pure nonsense. CO2 has been as high as 7,000 ppm and there was no catastrophic warming.
I’ve posted 265 stations that show no warming, even though CO2 has increased by 30 or more %. There is infinitely more evidence that CO2 isn’t causing warming than that it does. Doctored data doesn’t count as evidence.
It is interesting to note that
– neither Entropic man’s comment,
– nor the article he refers to:
https://insideclimatenews.org/news/02022018/cold-weather-polar-vortex-jet-stream-explained-global-warming-arctic-ice-climate-change/
– nor Jennifer Francis’ article the article above refers to:
https://iopscience.iop.org/article/10.1088/1748-9326/10/1/014005
do contain the word ‘CO2’.
https://en.wikipedia.org/wiki/Ivan_Pavlov
J.-P. D.
Entropic Man’s comment. LMAO!
I didn’t say what is causing the warming, nor does it matter in this context.I’m just describing one of the secondary effects of warming.
Observation shows that the Northern Hemisphere is warming and that the Arctic is warming faster than temperate latitudes.This is reducing the strength of the jet stream, which is stronger when the temperature gradient is larger.
Like a river, a weaker let stream meanders more, bringing Arctisc air further South. This used to be rare, but excursions like the current cold snaps in Greece and Texas are expected to become more frequent.
Entropic man
” … but excursions like the current cold snaps in Greece and Texas are expected to become more frequent. ”
Maybe!
But… please look at e.g. the night temperatures the Greek location Larisa experienced during the last weeks:
https://tinyurl.com/zk7av3ek
and compare them with a sort of Larisa’s February history in GHCN daily since the 1950’s:
GR000016648 51-80 2004 2 14 -12.0
GR000016648 51-80 1963 2 1 -10.5
GR000016648 51-80 1991 2 3 -10.2
GR000016648 51-80 1956 2 9 -9.5
GR000016648 51-80 1985 2 21 -9.5
GR000016648 51-80 1991 2 4 -9.4
GR000016648 51-80 1992 2 3 -9.4
GR000016648 51-80 1960 2 3 -9.3
GR000016648 51-80 1960 2 4 -9.0
GR000016648 51-80 1975 2 10 -8.6
No doubt that there was a sudden stratospheric warming, possibly due to the weakening of the polar vortex, and that it affected lots of places in Europe!
But colder temperatures than now happened lots of times in Greece already.
J.-P. D.
… and now I add, just for fun, the data I have hidden above, by restricting the output to February days, he he:
GR000016648 51-80 1968 1 15 -21.6
GR000016648 51-80 2001 12 20 -20.6
GR000016648 51-80 2001 12 19 -20.2
GR000016648 51-80 2001 12 21 -17.6
GR000016648 51-80 1988 12 20 -17.5
GR000016648 51-80 1968 1 14 -17.4
GR000016648 51-80 1966 1 9 -17.0
GR000016648 51-80 1988 12 19 -16.0
GR000016648 51-80 2017 1 11 -14.8
GR000016648 51-80 1957 12 4 -14.0
J.-P. D.
Looks as though the Greek chill is much less severe than the Texas cold snap.
I was just watching a report on the Texas weather in the BBC. It was noticeable that the local infrastructure is not designed to cope with extreme cold.
Power outages, party because the wind farms froze up.
Most houses were uninsulated, which made them very difficult to heat.
No attempt had been made to clear snow off the roads, perhaps for lack of suitable machinery. Lots of crashes because nobody had experience of driving in snow.
People have asked what the optimum global temperature should be. The planet probably doesn’t have one, but communities do. The Texas infrastructure has been designed to handle heat, and the current conditions are outside their design envelope.
As time goes on many more communities are going to encounter conditions that their infrastructure is not designed for. Too hot, too cold, too wet, too dry or too windy.
Entropic man
I just looked at my weather web site, and discovered this:
https://images.ctfassets.net/4ivszygz9914/83fe1bce-2c73-4ceb-a1e4-9dfcae3b78df/5319c75ad0fb4a9f347525d09bb6a13f/a89d1897-d07c-48cd-86b3-47095a03be0b.png
Looks quite heavy…
Polar vortex weakening seems to have much more radical consequences in CONUS than in Europe.
J.-P. D.
Perhaps because CONUS is a large enough continent to contain an entire Rossby wave without disruption.
I don’t know why, but this pattern seems to recur, with the wave stabilising down the centre of the continent.
Someone with more meteorology might speculate on coastal effects, or the presence of two North/South mountain ranges, the Rockies and the Appalacians on the Western and Eastern sides.
The main mountains in Europe are the Alps and their extensions, running East-West.There is also a coast to the West, but only land to the East. Do N/S mountain ranges and coasts tend to hold a Rossby wave in place?
The frozen wind turbines in Texas are only 13% of the outages.
The rest are failures at natural gas, coal and even nuclear plants.
Iowa is pretty cold, as well as Illinois, and wind turbines there can work in winter, I wonder why Texas is so fouled up.
Maybe there electrical grid being by itself and deregulated is the main reason.
They should build there infrastructure to be able to withstand a little cold weather.
“They should build there infrastructure to be able to withstand a little cold weather.”
Cold weather adapted infrastructure costs, as does heat adapted infrastructure. It is uneconomic to build everything to tolerate every possible contingency, so you optimise for your normal range of conditions plus a bit of margin and accept that you will see occasional disruptive extremes.
A full suite of snow clearing equipment might cost $20 million.
Chicago airport would use that every week during the Winter, Houston airport might use it once a decade.Similarly Illinois maintains a pool of equipment to keep the roads clear which would be uneconomic in Texas.
Ditto with houses. My 1930s built house in Ireland is designed for temperatures between 5C and 25C. Even with modern insulation it is hard to keep warm in freezing weather and uncomfortable in hot Summer weather.
This will be the same for any house. In Houston, house features which make it comfortable in Summer heat make it difficult to live in in the cold.
A house which is comfortable both in -10C and 30C would be very expensive and contain a lot of features and equipment which would be rarely used.The
One of the problems with climate change is that in many regions the normal range is drifting, making the existing infrastructure obsolete. Due to increasing sea level Miami Beach is raising roads on embankments, installing drainage pumps to protect high value properties and will have to abandon whole neighbourhoods which now flood regularly.
“What is it with media today? Everything is unprecedented.”
You don’t know that the news media sensationalise content as a matter of course? What, are you twelve?
Andrew Stout
You wrote upthread:
” … the sorts of temperature trends being recorded by Satellites… ”
1. You very certainly did not mean ‘satellites’ here.
You very probably meant ‘UAH’s evaluation of satellite data’ instead.
Simply because for RSS4.0 LT and NOAA STAR, the evaluations give higher trends, unacceptable to ‘Skeptic’s:
1.1 LT: UAH6.0 vs. RSS4.0
https://drive.google.com/file/d/1Xnvq5KqYbroDtjGkl1wq7kL5hEu6Giz8/view
1.2 MT: UAH6.0 vs. NOAA STAR
https://drive.google.com/file/d/1wP_BVntz4YFoV3uUDpJAdhwQsCVLhBSa/view
Since many here think I’m an alarmist, I have fun in playing this role, and say, so to speak “the other way around”:
UAH makes everywhere the past warmer and the present cooler, ha ha.
*
2. The origin of the gap, if any, is not ” what should be reported by land stations “.
It is rather the overall evaluation of the data they report.
For example, the global evaluation made by Japan’s Met Agency is, with a trend of 0.14 C for 1979-2020, identical to UAH’s:
https://drive.google.com/file/d/1VCFyZQZVc0ZjVqHqux-lNAPbAIrgpk5A/view
*
At the cost, of course, of a lack of interpolation helping in filling at least a part of the unknown.
Not doing this automatically means that all unknown places will have the same temperature and the same trend as the global mean.
Of all the people boasting that infilling is by definition something wrong (if not even fraudulent, hear hear) not one would ever be able to provide for a proof for their claim.
Not one of them!
Infilling using interpolation (mainly kriging) is used in several disciplines (mining, highway design, even medical research) without any complain from anybody.
Anybody having experience in software development and V&V knows that such a task is tested by removing known data and comparing its ‘ersatz’ thru infilling with the original.
But, ooooh… here, CO2’s shadow and fossile fuel lobbyism make everything different.
J.-P. D.
Sources
1. RSS4.0 LT
http://images.remss.com/msu/graphics/TLT_v40/time_series/RSS_TS_channel_TLT_Global_Land_And_Sea_v04_0.txt
2. NOAA STAR (TMT)
ftp://ftp.star.nesdis.noaa.gov/pub/smcd/emb/mscat/data/MSU_AMSU_v4.1/Monthly_Atmospheric_Layer_Mean_Temperature/Global_Mean_Anomaly_Time_Series/
… and
3. JMA
https://ds.data.jma.go.jp/tcc/tcc/products/gwp/temp/list/csv/mon_wld.csv
Bindidon:
“Infilling using interpolation (mainly kriging) is used in several disciplines (mining, highway design, even medical research) without any complain from anybody.”
Beeen there, done that.
You miss a vital difference.
Those applications use those statistical methods primarily to estimate uncertainty. For mineral resources, for instance, we used them to put uncertainty limits around our estimates of grade and tonnes to be mined, so the bankers could see how much they would risk if the lower estimates turned out correct. The decision to mine (and I was involved in this several times) is mostly made on the results of drill hole assays, not on the interpolations, because they commonly contain subjectivity.
Also, in mining, after the deposit is mined out, one calculates tonnes and grades actually mined, to reconcile with pre-mining estimates. This allows continuining refinement of the methods.
You should not place much weight on interpolations when you cannot complete this reconciliation. Like, you cannot with infilled sea surface temperatures.
Interploated results should not be used to influence public policy.
Interploations are guesses. You should not try to place credibility on the statistics of guesses, when real data are available, for there is no standard text about statistics of guesses that can help this work. Geoff S
Geoff Sherrington
Thanks for your convenient reply.
1. You seem to have made experiences differing a lot from what I learned through discussions with French engineers long time ago.
2. No I did not miss any vital point, please believe me.
3. But conversely, I miss from your side a valuable estimate for what is better:
– uncertainty through use of infilling
– certainty of doing wrong when you don’t use it, for the reason I clearly indicated above.
4. Whom do you think shall I trust more?
– Geoff Sherrington?
or
– Kevin Cowtan?
https://agupubs.onlinelibrary.wiley.com/doi/full/10.1002/2015GL064888
https://rmets.onlinelibrary.wiley.com/doi/full/10.1002/qj.2297
We all have to choose who to trust. C’est la vie.
Rgds
J.-P. D.
Bindidon.
You were not to know this, but in the 1970 our exploration company deliberately involved ourselves in the emerging methods of geostatistics. We sent people from my offices to France for months at a time and brought French people to Head Office in Sydney for lengthy stays. We applied the methods to the estimation of grade and tonnes in the major uranium deposits of Ranger One, Numbers 1 and 3 orebodies. We later did a reconciliation which showed the calculations to be more than adequate. It is possible that after the French themselves, Matheron, Journel, Krige, Sichel and others at Fontainebleau. We immersed ourselves in the methods quite instensely for several years and I was fortunate to have some rub off on me.
All this before Kevin Cowtan was out of short pants.
Keep your rude comments to yourself, please. Geoff S
Geoff,
So how would you go about computing the mean from a 2D scalar field and quantifying the uncertainty? Can you post a link to a dataset that publishes a global mean temperature that uses a method you feel is adequate?
bdgwx,
My preference is to direct my research along lines that I like, not to slavishly try to fit my thoughts into the crowded mind space of others with various competencies. I have no interest in a historic global mean temperature because the data available to contribute to it are not fit for that purpose. Geoff S
Climate scientists definitely have an interest in constraining the range of the global mean temperature at various moments in time. If you can’t offer a better method or constrain the temperature any further then I guess I have no choice but to rely on the evidence that is currently available.
the common person without propaganda influencing him simply isn’t concerned about global mean temperature if its in the delta range of 1 to 5c.
I mean I can live just as well in Costa Rica at a mean 27C as I can in Seattle where its below 11C.
And trends in global mean temperature don’t seem relevant to much when looked at over periods of time where various regions at similar latitudes aren’t consistent with each other. Such longterm regional variation when at greater differences than the global trend is indicative of internal variation such as oceanic overturning and the geographic features of the earth that would cause thermometers in different places to both vary and vary over different time scales.
This observation was made by a celebrated atmosphere physicist over a decade ago, Dr. Syun Akasofu, yet sycophants love to latch on to small tidbits of largely meaningless prattle to come to sweeping conclusions about the future of the earth.
All this cold weather has me wondering how we could tell the Holocene interglacial period is ended. How long would it then take the ice to return to being a mile thick over Toronto?
Ken
I open the bet
10,000 years.
J.-P. D.
For the last 2 million years we have alternated between icehouse conditions around 14C and severe icehouse conditions around 9C.
Until we started interfering the cooling trend was -1.2C over the last 5000 years. That would bring us back to 9C and full severe icehouse conditions in another 16,000 years.
There are feedbacks such as increasing ice albedo which accelerate the cooling, so that 16,000 years is probably longer than it would actually take.
We’ll probably never know now. Our extra CO2 will prevent an imminent severe icehouse. It is estimated that it will take at least 40,000 years for natural processes to remove it.
Ent, perhaps you could explain why the geological data temperature goes up then CO2 goes up lagging temperature by about 800 years and then the temperature drops precipitously and this appears to happen cyclically. If your hypothesis about CO2 preventing the return of severe icehouse conditions were right wouldn’t the data be showing something else? Or does too much CO2 in the atmosphere trigger a severe icehouse event?
This is an old denialist meme, that temperature change always precedes and causes CO2 change and therefore that modern CO2 release cannot cause temperature change.A logical fallacy.
CO2 and temperature form a feedback loop.If temperature changes, CO2 follows. If CO2 changes, temperature follows.
There are temperature sensitive carbon sinks like the oceans, permafrost and peat bogs.
When something naturally increases temperature the sinks release CO2 into the atmosphere and the increased greenhouse effect amplifies the temperature change.
When something naturally decreases temperature the sinks take up CO2 and the reduced greenhouse effect amplifies the cooling trend.
CO2 follows temperature.
The reverse also happens. A natural increase in CO2 such as a shield volcano causes temperatures to increase. When the excess CO2 is removed temperatures drop again.
700 million years ago weathering reduced CO2 to the point where temperatures dropped enough to allow global glaciation and a snowball Earth. It took millions of years of volcanic activity to increase enough CO2 for temperatures to begin rising.
Temperature follows CO2.
Think of humanity as an artificial shield volcano. We have released enough CO2 to increase concentrations by 40% and temperatures are following CO2.
Ken,
The claim that CO2 lags temperature is for the glacial cycles.
And this claim is actually a bit more nuanced than the bloggers want you to believe. It has been shown that CO2 lags in the SH, but leads in the NH. See Shaken et al. 2012 for details.
CO2 leads the temperature when it plays the role forcing first and feedback second. It lags when it plays the role as feedback first and forcing second. Or in other words, it leads when it catalyzes the temperature change and lags when another agent catalyzes the temperature change.
There have been periods in Earth’s past where CO2 has both lead and lag. The glacial cycles would be an example where a lagging behavior has been observed (though as I said above this is rather nuanced). But the PETM, ETMx, and other events would be examples where a leading behavior has been observed.
In a nutshell…CO2 leads when a non-temperature related event causes it to be released into the atmosphere. It lags when it gets into the atmosphere because of temperature related feedbacks.
The glacial/interglacial cycle is driven by changes in the Earth’s orbit.
This changes the amount of sunlight reaching high Northern latitudes. Reduced sunlight allows snow to persist through Summer and build into ice sheets which reflect even more sunlight. Reducing temperatures cause sinks to take up CO2 amplifying the cooling.Earth cools into a glacial period.
Increasing sunlight reverses the process and Earth warms into an interglacial like the present.Under current geological and astronomic conditions one cycle takes about 100,000 years with interglacials lasting on average 10,000 years.
For more detail research Milankovich Cycles.
We are in what would naturally be the end of the Holocene interglacial. Temperatures drifted gradually downwards by 1.2C in the last 5000 years, with CO2 expected to follow.
Then the Industrial Revolution happened. We have released enough CO2 to reverse the natural cooling trend and extend the Holocene interglacial indefinately.
40,000 years is just a fake scare figure. Removal of anthropogenic CO2 is a logarithmic function with most being removed in about 40 years. Indeed there is a long tail of very low levels of reduction that would extend out longer.
Ken
This is global temperatures for the last 800,000 years.
http://railsback.org/FQS/FQS800katoFutureTemps01.jpg
Gives you some feel for the timings.
( The “You are here” is a bit obsolete. We are now at 1.2C on the Right hand temperature scale)
EM,
Why have you not learned that it is not correct to pin recent thermometer data on the end of old proxy data? Why Mann was chastised correctly for making a hockey stock this way? Why you then add pure speculation in the form of guesswork by IPCC? This is wrong on too many counts. Geoff S
Geoff Sherrington
Sorry, you are certainly honest in your evaluation, but undoubtedly you are a victim of a big manipulation, too.
Mann wasn’t ‘chastised’ for ‘old proxy data’.
1. Ross McKitrick unqualifiedly denied the correctness of his use of Primary Component Analysis as statistical method;
2. Steve McIntyre’s claims against the mix of proxies and temperatures were, over time, reduced down to… dendrochronology using a few pine samples.
3. At least 9 studies confirmed Mann’s work.
4. In 1998, the attacks against the stupid hockey stick were IMHO due to the fact that no one had ever seen a temperature time series of that size.
Please look e.g. at Pages2K 0-2000:
https://drive.google.com/file/d/1QNmA5_rTVCHEOCo87TcPvmuB2GO_jiSV/view
and at a comparison since 1850 with Had-CRUT4, and since 1979 with UAH6.0 LT data:
https://drive.google.com/file/d/1H3mDVGgtHXG4Nct8LM9qcB85jnM1U_v1/view
It’s exactly the same data I downloaded from the corner
https://www.ncei.noaa.gov/pub/data/paleo/pages2k/pages2k-temperature-v2-2017/readme-pages2k2017.txt
5. In addition, lots of people, convinced about the fact that MWP was everywhere on Earth, missed on all such plots the peak they had expected.
J.-P. D.
Bindidion: At least 9 studies confirmed Manns work.
That is an absurd joke.
1) No independent study would ever implement the completely custom “Mike’s Nature Trick to Hide the Decline.” That is fraud.
2) No credible temperature reconstruction would ever produce a Dog-Leg specifically in 1902 and 1980 when the construction methodology changes.
3) The Dog-Legs are not supported by physics
4) Individual station data controlled for UHI and Water Vapor you find no warming at all
5) 70% of the earth is water, that temperature record contridicts the Hockeystick
6) Sea levels and other climate data don’t show confirming Dog-Legs in 1902, it is a pure hoax
CO2isLife
Stop your stoopid fraud claims. We are on a science blog here, and not at your loved breitbart corner.
1. For your afflicting dog-leg trauma, please visit a psychiatrist.
2. You have beeen shown many times that your trials to link CO2’s activity to surface temperatures are absolute nonsense. CO2’s activity is located above the tropopause.
3. I have shown to you that the average over 130 desert stations, including the Antarctic, has very well a trend, which moreover is higher than the average over all stations located in the tropical regions saturated with water vapor.
When will you finally stop boring us with your stubborn, prepubescent garbage?
J.-P. D.
Up the road from me is one of the Dupont nylon plants.
It is liberally covered with temperature sensors. In its early days you climbed ladders with a clipboard to record temperatures directly from a mix of alcohol thermometers, mercury thermometers, and bimetallic strips.
Gradually they began to use electrical sensors and now they are in their third generation of thermistors and radiation sensors, reading directly into a central computer.
They use this data to calculate fatigue lives for the reactors, so the continuous record is safety critical, but noone has ever suggested the the temperature/time series generated by one set of instruments could not be connected to the next.
Geoff said: Why have you not learned that it is not correct to pin recent thermometer data on the end of old proxy data?
How would you relate the proxy temperature record to the instrumental temperature? Can you point us to a publication that describes an alternate method that you feel is acceptable?
There is very little proxy data that is reliable over less than 100 year periods. . . .that was the reason for excessive reliance on dendrochronology with cherry picked trees.
Earlier I have provided what should be useful information about the correction of ground temperature data for UHI.
My meteorologist colleague Dr Bill Johnston has a blog site that is much more useful to describe the processes required to clean up such data to make it useful in UHI studies. This is for Australian data, which has fewer historic complications than USA, for example TOBS. However, Bill has developed an excellent approach using rainfall to correct for step changes that are all too often not associated with well-recorded metadata.
Look for stations Rutherglen, Cape Leeuwin, Amberley and soon-to-be-released Charleville, Queensland. Geoff S
https://www.bomwatch.com.au/category/bill-johnston/
Yeah, I recall lots of info provided by Bill Johnston, e.g.
https://jennifermarohasy.com/2014/09/rutherglen-still-looking-for-answers/
J.-P. D.
A major problem with the approach proposed by Geoff Sherrington for adjusting Australian temperature data is this:
decreasing rainfall can be expected to have a positive effect on temperatures while increasing rainfall can be expected to have a negative effect.
The thing is that much of western and north-western Australia has been getting wetter. Therefore, temperature trends there will have been suppressed. i.e. any corrections taking account of rainfall will result in an increase in background warming trends.
Cherry picking stations where rainfall has decreased, such as Cape Leeuwin, will only distort your results.
Student,
Thank you for turning a genuine scientific effort into a sneer exercise. Your comments are wrong in so many places that one might conclude that you did not comprehend the methodology.
What did you hope to gain from this ignorant negativity, when a reasonable, normal scientist would enjoy new material with potential to advance understanding?
Geoff S
“a genuine scientific effort” ?
Give me a break! This is pure, armchair, amateurism that would never pass peer review in a million years!
studentb,
sounding more like studentc,
or studentf
Wild guess speculation about climate doom 50 to 100 years in the future passes peer review too.
Peer review is pal review — it enforces the current consensus, which usually turns out to be wrong — from slightly wrong, to completely wrong. Science is never settled. If it was, we would need far fewer scientists.
Noah Diffenbaugh: WE HAVEN’T HAD ENOUGH WARMING TO ELIMINATE COLD EVENTS
And?
The overall GW on Land is ~ 2 degrees F on average.
In winters, a cold air mass comes through and drops temps by 40 deg F. The 2 degrees added to the global average wont make much of a difference to that.
But the much warmer Arctic MAY change regional weather patterns, via the Jet Stream. That can potentially be a much larger effect.
Indeed often one needs to get really ”imaginative” to come up with excuses.
The fact is that the stratospheric jet stream that holds the arctic air in place, in the Arctic, has quite complex behavior, and itseems to be changing, just as the Arctic is rapidly warming.
Science is about finding out why things are happening.
You wanna call that finding excuses…whatever you say.
The problem is as I pointed out above the politics is spending huge sums of money to try to think about what a warmer climate brings and not about what was a common occurance a few decades ago.
When I was a youth the jet stream dipping down into Texas and Florida was a more common occurrence. What may be primarily decadal climate variation is the most likely culprit here and a lot of loud mouths who think they know something.
“the most likely culprit”
So now you understand the science of the jet stream wandering enough to be confident that Arctic warming has no effect on it?
While the actual scientists are not certain about it.
Typical Bill.
Nate you should learn to read with better comprehension.
I didn’t say a warmer arctic or anything else was responsible. I merely pointed out that in the 1950’s and 60’s the jet stream dipping into Florida and Texas was a more common event than it has been recently. BTW, the arctic was colder then.
You can draw your own conclusions and I have no doubt that you will in doing so will don some horse blinders to see only what you want to see.
” I merely pointed out that in the 1950’s and 60’s the jet stream dipping into Florida and Texas was a more common event”
We know that overall CONUS was colder in the 60s and 70s.
I don’t think we know that the kinds of events that just happened in Texas were more common. Unless you have some data on that?
Here is the Arctic vs other regions. The Arctic has warmed faster than the Tropics or Mid latitudes.
http://www.columbia.edu/~mhs119/Temperature/T_moreFigs/zonalT.png
I asked our resident Meteorologist, Roy, awhile back whether this change in the N-S gradient could be expected to change weather patterns in CONUS. He answered with unequivocal YES
Your confidence that “decadal climate variation is the most likely culprit here” is not science based opinion.
“The problem is as I pointed out above the politics is spending…”
When science hasnt found a final answer yet, you seem to think your political biases can give us the answers.
Nope.
Nate says:
”We know that overall CONUS was colder in the 60s and 70s.
I dont think we know that the kinds of events that just happened in Texas were more common. Unless you have some data on that?”
LMAO!!! You mean you didn’t check first before buying the hogwash about this having something to with global warming???!!!!
Boy you bit on that with all the intellectual fortitude of a cod striking a clam with a big hook in it.
Yes this is an unprecedented event but its not unprecedented because of the cold. Fact is in the 50’s few homes had electric or natural gas heat. Most homes had on site storage of fuel in the form of wood burning fireplaces or stoves and/or coal or oil burning furnaces. Plus people tended to have thick wool blankets. Wool blankets became very popular for the native populations especially after the buffalo herds had been thinned down.
What has changed is growing dependence on either governments or corporate/municipal utilities to deliver fuel for heat real time.
The transfer to this dependence has been ongoing for at least 55 years through a combination of subsidies to tract home builders (all electric homes), and via regulation making the population in many ways more vulnerable to disruption.
” You mean you didn’t check” C’mon Bill, we all know that is your standard MO. Ha!
“Fact is in the 50’s few homes had electric or natural gas heat. Most homes had on site storage of fuel.”
Now we’ve subtly moved the goal posts back to the 50s and changed the subject, so that you don’t need to offer evidence to back your original claims.
Standard Bill BS.
Is that the best you can argue Nate. No movement of goal posts.
The temperatures and dipping of the jet stream into Texas and Florida in the 50’s and 60’s was common. People were used to it. You are just stupid.
“The temperatures and dipping of the jet stream into Texas and Florida in the 50’s and 60’s was common.”
Show us evidence.
Otherwise it is just another Bill declaration, ie worthless.
Nate says:
”Show us evidence.
Otherwise it is just another Bill declaration, ie worthless.”
What and educate you? Nah. . . .much more fun having you hold up the fringe lunacy viewpoint around here.
You seem to equate mainstream science with “fringe lunacy”?
That explains the many anti-science themes of your posts.
Nate says:
”You seem to equate mainstream science with “fringe lunacy”?
That explains the many anti-science themes of your posts.”
Right! But its only in your dreams that AGW causes extreme cold events. There is zero science supporting that concept which is held only by fringe lunatics.
” only by fringe lunatics.” OK Bill, whatever you declare…
OK name a top atmosphere physicist that believes extreme cold events are being caused by global warming.
Various non-lunatic authored papers
https://agupubs.onlinelibrary.wiley.com/doi/full/10.1029/2012GL051000
Idea goes back decades
https://www.carbonbrief.org/qa-how-is-arctic-warming-linked-to-polar-vortext-other-extreme-weather
LOL! How predictable a link to a lunatic blog and a science paper whose primary source link is to AR4 on extreme events that reads:
”Temperature Extremes
It is very likely that heat waves will be more intense, more
frequent and longer lasting in a future warmer climate. Cold
episodes are projected to decrease significantly in a future warmer
climate. Almost everywhere, daily minimum temperatures are
projected to increase faster than daily maximum temperatures,
leading to a decrease in diurnal temperature range. Decreases
in frost days are projected to occur almost everywhere in
the middle and high latitudes, with a comparable increase in
growing season length.”
I guess you are the lunatic along with your favorite lunatic blog. Nice Job showing us where you are really coming from Nate.
The point I am making Nate is being responsible for supplying power needs to be contracted on a rational basis not 1 second before the fuel goes into the line. Consumers shouldn’t be abused like that.
I would think rates that changed monthly with a one month notice of change along with some kind of delivery guarantee, which would be both gnarly and politically hot to negotiate as nobody likes assuming liabilities, might have to be mandated legislatively.
What we are looking at is a lot inherent risk that nobody really wants to assume and it lands of the heads of the municipal suppliers and end customers instead. Neither of the those is what free market are about. Free markets are about choice and suitability of those choices for lifestyles. Essential warranties are become more commonplace all the time. Micromanagement seldom works well for several reasons. One is the corruption in the specifications, two is unintended consequences, three is the unforeseen.
Wind power though probably doesn’t want to have buy fuel when the wind doesn’t blow and there is one place the politics at work.
Would someone please explain to me how increasing W/M^2 can possibly cause temperatures to fall to the record levels we are seeing today? We have spend trillions to fight climate change and Texas, one of the most oil rich locations in the world with plenty of access to Coal and Natural Gas and they can’t power their state. That is how totally insane the Green Economy is. BTW, Biden wants a Nuclear Iran, why, certainly not for electric power, what he should be pushing for is a Nuclear Texas.
Why the hyporcicy? Why does Biden want to arm our greatest enemy with a nuclear bomb that doesn’t need energy, and he opposes nuclear and pipelines in America? Why does he want to strengthen our enemies and weaken our Domestic Economy?
Greta was caught turning up the thermostat.
“Would someone please explain to me how increasing W/M^2 can possibly cause temperatures to fall”
We already have. Global warming can cause changes in the behaviour of jetstreams. These in turn can cause local cooling.
https://insideclimatenews.org/news/02022018/cold-weather-polar-vortex-jet-stream-explained-global-warming-arctic-ice-climate-change/
https://iopscience.iop.org/article/10.1088/1748-9326/10/1/014005
… and the very best is that in Texas, one of the most conservative, pro-industrial, pro-fossile corners on Earth, suddenly the “Green Economy” is the origin of all the state’s malheurs.
It would be more sane and more fair to see the problems somewhere else, for example, in the indifference typical of the southern US states.
But that seems to be politically unacceptable.
J.-P. D.
Funny that Germany has retained all its coal-fired plants. Odd you’re beating the drum for us to eliminate ours.
Anderson
As usual: simple-minded, polemic blah blah.
I never and never was at any time beating any drum to eliminate any coal plant on Earth.
And above all, Germany did not ‘retain all its coal-fired plants’.
That is typical American alt-right nonsense written by persons ignoring facts.
*
In 1990, we had, as relevant electricity production sources (gross production, i.e. including respective internal consumption), 550 TWh out of:
– 64% fossile (57% coal, 7% gas), 28% nuke
– 3% renews (0 %wind, 0% solar, 0% biomass, 3% hydro).
In 2020, we had 570 TWh out of:
– 40% fossile (24% coal, 16% gas), 11% nuke
– 44% renews (23% wind, 9% solar, 9% biomass, 3% hydro).
*
Activate your brain cells, and additionally read this, as carefully as you can:
https://www.ise.fraunhofer.de/content/dam/ise/en/documents/News/electricity_production_germany_2020.pdf
*
You simply know nothing, Anderson.
Wake me up when the US manage to reach us.
J.-P. D.
Thanks for confirming my belief. Coal generates 28% of Germany’s power while only 23% of America’s power.
Thanks again. Germany gets 22% more of its power from coal than the US. All kinds of tidbits.
Anderson
Again, you behave as a polemic ignorant: you hide the facts that
– your Trump dictator guy has forbidden us to intensify our gas cooperation with Russia;
– Germany has no shale gas, due to the extreme population density.
Luckily it hasn’t!
Your country will have to pay a huge bill in one or two generations.
J.-P. D.
Stephen,
10 y ago, Coal was 33% of US electricity. All you are saying with this stat for the US is that we have gained access to an abundance of new, cheap, natural gas AND renewables in the last 10 y.
While Germany has gained renewables, but not had that easy access to gas.
The larger US has access to relatively more natural resources than Germany.
And…what is your point?
Even with this access to Gas, the US per capita carbon emissions were 16, while Germany was 9.
https://en.wikipedia.org/wiki/List_of_countries_by_carbon_dioxide_emissions_per_capita
Yes Nate per capita consumption in Germany is about 1/3rd less than in the US. Thats what happens when you triple the price of gasoline and put all the burden on the middle class and poor.
“Would someone please explain to me how increasing W/M^2 can possibly cause temperatures to fall to the record levels we are seeing today?”
This has been explained to you many times.
Weather does not stop happening under global warming. The squiggly line will still go up and down for ther global average, and those upsd and downs are much more extreme for local weather.
What should happen in a warming world is that local record-breaking highs should occur more frequently than local record-breaking lows in most if not all years recently.
Guess what?
https://www.mherrera.org/records.htm
https://www.mherrera.org/records1.htm
“We already have. Global warming can cause changes in the behaviour of jetstreams. These, in turn, can cause local cooling.”
Really? Proof of that? CO2 can cause both warming and cooling? That isn’t science, that is superstition. If you think through that insane logic, CO2’s warming would be self-correcting. It would warm, change the jet stream, and cool. Then there is no problem. If CO2 now causes cooling, how are we ever going to get back to warming? Texas is now paying $9,000 MegaWatt, which used to cost $100 at peak demand. That is how insane this unreliable Green Economy is.
Anyway, here are the Facts:
1) Official US Policy is to support and facilitate nuclear power in Iran, a sworn enemy of both the US and Israel.
2) Iran has promised to “wipe Isreal from the map.”
3) The US is helping Iran reach that goal by facilitating the production of a Nuclear Bomb
4) The US policy is to support the Trans-Afganistan Pipeline and Natural Gas Importation of the EU.
5) The US is blocking pipelines in the US and inhibiting production of Natural Gas.
Bottom line is US Policy is to facilitate the arming and strengthening of our enemies and weaken the US.
Texas is a great metaphor for AMerica of the future. They have a huge surplus of energy and can’t keep the lights on. Texas has no execute, they had California and Germany as warnings, and they chose to ignore them.
Once in a while it gets very cold in Texas. So what.
That’s weather in Texas, not climate.
The climate of our planet has been warming since the mid-1970s, but by a small amount. That doesn’t mean Texas will never have a really cold week. We’re having a really cold week here in Michigan too. But our winters in recent years have not been as cold as they were in the 1970s. And that is great news. I hope someday, after more global warming, we will never have a really cold week in Michigan again, and we can retire our snow shovels.
Really cold weather in Texas happened before, in 2011, when 3.2 million people were affected by rolling blackouts. Windmills were not the problem back then — they accounted for only 4% of the total sources of electricity.
A report was written the 2011 incident. In summary, the entire energy infrastructure in Texas was not set up to withstand unusually cold weather. I suppose the report was put on a shelf to collect dust.
So it happened again in 2021 the next time really cold weather hit Texas. But even worse this time, because windmills were up to 25%, from 4%, and roughly half of them froze. The other windmills did well because there were good winds to spin them. A large majority of the problem was from the non-wind energy sectors, just like in 2011.
My brief article on the 2021 and 2011 Texas “incidents”,
posted on my climate science blog yesterday, is at the link below, which includes a link to the official 2011 report:
http://elonionbloggle.blogspot.com/2021/02/weve-had-fun-mocling-frozen-texas.html
We should be fair in our reporting about the Texas windmills — including both the bad news, and the good news:
The bad news:
Half of the Texas windmills froze.
The good news:
Half of the Texas birds were safe.
What a propagandist you are, Richard.
“…wind farms are responsible for roughly 0.27 avian fatalities per gigawatt-hour (GWh) of electricity while nuclear power plants involve 0.6 fatalities per GWh and fossilfueled power stations are responsible for about 9.4 fatalities per GWh. Within the uncertainties of the data used, the estimate means that wind farm-related avian fatalities equated to approximately 46,000 birds in the United States in 2009, but nuclear power plants killed about 460,000 and fossil-fueled power plants 24 million…”
https://tinyurl.com/ya9njy7f
Your usual nonsense — wild speculation about the effects of air pollution, based on many assumptions, and some computer models. Not reality.
Windmills are bird shredders Nuclear plants are not.
https://www.engineering.com/story/the-realities-of-bird-and-bat-deaths-by-wind-turbines
What a propagandist you are, Richard.
Your article doesn’t compare nuclear to wind power generation and bird mortality. Nuclear kills more. Coal kills more.
“Bird-shredder”
That’s your own language, as you soberly assess the difference in vario- I beg your pardon, I mean- as you pour on the rhetoric to smear wind energy.
If you read the article you get to this paragraph:
“Even with its relatively low impacts, the wind industry holds itself to a higher standard and does more to mitigate wildlife damages than any other energy industry.”
So not only does wind power kill significantly fewer birds per kilowatt hour than fossil fuel sources, the industry also does more to mitigate the issue than fossil fuel industries.
But you wouldn’t learn any of that if we relied on you and you alone for information.
“Your article doesn’t compare nuclear to wind power generation and bird mortality. Nuclear kills more. Coal kills more.”
My response: Barry is quoting junk science — his favorite kind of “science”. Leftists will lie about any subject to get what they want. They’ll include bird deaths from transmission lines as fossil fuel bird deaths as if solar farms and wind farms did not need transmission line. In fact they add even more transmission lines, often long lengths, since solar and wind farms are rarely located close to cities where lots of electrical power is used. Your problem, Barry, is a constant appeal to authority — quoting a study because you like the conclusion, with no thinking about whether the so called study makes sense, or is biased to reach a desired and/or leftist approved “politically correct” conclusion.
https://atomicinsights.com/nukes-kill-more-birds-than-wind/
Bingo call out the psychobabble!
When that stuff gets repeated either you are self-interested propagandist or a sucker for a self-interested propagandist.
That’s a good critique, Richard, and about the only thing of merit I’ve seen you bring to the table. I agree that it takes the Sovacvool studies apart, and that the evidence for nuclear killing more birds than wind farms is deeply flawed.
barry says:
February 20, 2021 at 11:42 AM
“That’s a good critique, Richard …”
I’m putting that quote on my resume. It was so unexpected. I want to thank my mother, father, wife, and cat, for pushing me to question leftist fairy tales about climate change.
We love global warming here in Michigan.
Except a few ski bums.
Richard Greene
I have to agree with you on windmills. My observation is that wind energy is good as a supplement and alternative power source. Terrible idea to make it a Primary source with no viable means to store large amounts of power! If the US wants to develop wind it needs to do it in step with electrical storage systems or it is a really stupid pursuit. Wind, by its nature, is not reliable. It blows some days and then it does not. No thinking person would push it as a primary power source and eliminate reliable power without a viable storage system of electricity for when the wind does not blow.
The problem in Texas is NOT new. This article was written in 2019 and made the prediction: “However, without the proper financial incentives, more dispatchable fossil generation will exit the market, resulting in rising electric power prices, greater price volatility, and increased risk to the reliability of the electricity grid.”
https://www.americaspower.org/coal-retirements-have-ercot-power-prices-soaring/
The media is making claims that the windmills are not the problem with the Texas power outage.
https://www.texastribune.org/2021/02/16/texas-wind-turbines-frozen/
Texas wind capacity is 30,000 Megawatts.
https://en.wikipedia.org/wiki/Wind_power_in_Texas
http://www.ercot.com/content/cdr/html/real_time_system_conditions.html
http://www.ercot.com/content/cdr/html/CURRENT_DAYCOP_HSL.html
From ERCOT current energy production wind is only 3711 Megawatts, a little more than 10% of its capacity. More reliable energy sources such as Nuclear, coal would be able to achieve capacity production unless some problem prevented it (mechanical failure of some type). These are currently reliable power sources. Wind is not such a source.
Good post. Thats what I gather. Reading the various news reports the failure of the wind power was less than expected. They only expected 6% to be online. Whereas the natural gas power was less than expected.
In other words, the power managers are ahead of the game on the lack of reliability of wind power.
And of course keeping wells from freezing and storing natural gas is probably a lot cheaper than keeping the wind turbines turning and storing electrical power.
Lesson? One can make anything look reliable if expectations are really low or there is no limit on the amount of money you can spend.
“unless some problem prevented it (mechanical failure of some type). These are currently reliable power sources.”
Exactly what happened here. So not so reliable, unless a regulation requires it to be reliable in such circumstances.
And then when you factor in Texas’ inability to import electricity in times of supply/demand issues you have a recipe for disaster.
Hindsight is 20 20. Back up not necessarily needs to be import especially when that puts you under another regulatory scheme.
Could be a lot cheaper to simply provide some pump insulation but since natural gas pump freezing has been kind of the opposite of the political viewpoint no doubt its been neglected.
Kind of like when they were predicting in UK the end of snow events leading up to a record snow event and the stockpiles of road, bridge, and airport clearing equipment and supplies had been allowed to deplete.
First rule of precaution! Don’t believe the non-professionalized academic community about anything. Especially if it has anything even remotely related to polar bears.
Kamala Harris first claims there was no vaccine distribution plan. Now Biden claims there was no vaccine until he took office. What’s the common theme among leftists? Pathological? Psychopathic? Narcissists?
And Biden claimed 2 weeks after taking office his vaccination development and distribution plan was far ahead of schedule.
What do you know — another lying politician !
And Trump won the 2920 election by a landslide
And Trump colluded with Russians to win in 2016
And with ObamaCare you can keep your doctor and health plan
And Iraq had weapons of mass destruction
And there was a Gulf of Tonkin incident in Vietnam that never happened
And Bill Clinton never had s e x with that woman, Monica Lewinsky
“Now Biden claims there was no vaccine until he took office.”
Hold them accountable, fine. But not for made up bullshit.
Texas has no excuse. They had California and Germany as warnings, and they ignored them. Texas, a State synonymous with Oil, can’t keep its lights on. Why? They were gullible enough to cave to the insane liberals.
The very first station I chose in Texas shows No warming, and in fact cooling, since 1900.
Burnet (30.7586N, 98.2339W) ID:USC00411250
https://data.giss.nasa.gov/cgi-bin/gistemp/stdata_show_v4.cgi?id=USC00411250&dt=1&ds=14
From 1897 to 2020 Burnet warmed 0.94C +/- 0.20 per the adj-homogenized dataset.
bdgwx: From 1897 to 2020 Burnet warmed 0.94C +/- 0.20 per the adj-homogenized dataset.
You simply can’t get more dishonest than that. Deliberately using “adjusted” data instead of the actual data.
Even using the adjusted data, the current temperature is basically the exact same value as that in 1897. How anyone would want to spin that into warming is beyond me, but no matter how you look at it, unbelievably dishonest and decietful.
CO2isLife
I am not sure how you can’t see a warming signal in the data you posted. Again if you take a piece of paper and line it on the 19 C mark you see much more significant peaks after 2000. And again if you go down to the 17 C line you see most years reach at least some points down to this level but none after 2000. I really do not understand how you process data. If you draw a line through the data it will rise upward.
I think your attack on bdgwx is not valid. I think if you put the unadjusted numbers in a spread sheet and draw a trend line through the unadjusted data you might find it shows a definite upward trend. Without running the numbers I can’t give you a value.
To be fair the unadjusted shows a negative trend. But it’s also pretty obvious that there are extreme discontinuities possibly caused by station changes that makes this trend meaningless. Obviously time-of-observation changes, instrumentation changes, etc. would be problematic as well.
That’s right. I “deliberately” used adj-homogenized because I want to know the temperature trend using a time series that has known errors and biases corrected. It would be unethical for me to provide you an estimate of the trend using data that has known errors and biases that have not been corrected. And by any rational thinker if would rise to fraud if I knew about it and didn’t tell you. I’m starting to wonder if you have a different worldview of right and wrong than I do and most everyone else.
What errors and biases are you aware of that were corrected bdgwx? And how was the correct answer determined of what the outside temperature really was 40 years after the alleged error was made?
Thats right. I deliberately used adj-homogenized because I want to know the temperature trend using a time series that has known errors and biases corrected.
That is absurd. They have actual data unadjusted from the time period it was taken. You honestly think you can take a data set in 2020 and go back and accurately adjust the data going back 140 years? That is absurd. They have no idea what the conditions were for those sites 140 years ago. What you do know is that almost every “adjustment” works to increase warming and make the trend more linear. That is a fraud. You have actual data and you have adjusted data, and you choose to use the “adjusted” data. That is absurd. Either way, even using the garbage adjusted data the current temperatures are still at the same level as 1897, or whenever the data started.
According to the metadata record Burnet USC00411250 had 8 relocations. In fact, it’s altitude jumped from 305m to 403m above sea level. That change alone creates a dramatic 0.6C drop in temperature if using the average 6.5C/km lapse rate. It’s TOB switched to 08:00 in 1945 and transitioned to MMTS in 1986. Are you guys suggesting that we should just pretend like none of that happened, perform climatic analysis on the unadjusted data anyway, and not disclose these issue to consumers of your results?
https://tinyurl.com/ckxym64g
bdgwx
https://tinyurl.com/ckxym64g
Thanks, I did not know this info source.
This time, you were doing the good legwork!
By the way, I know since longer time that the very raw GHCN daily data set I preferred to use all the time… is a quite similar problem.
J.-P. D.
I don’t think anybody is saying data should never be adjusted.
Howver, sometimes its better to throw data out as opposed to manufacturing it as long as whatever you do you fully document and make transparent the reasoning and action.
elevation change is perhaps the most likely of valid adjustments but lapse rates are not all that consist. Some locations experience more inversion, have different humidities, and God forbid may already be adjusted. Temps on the ridge or building top can be a lot warmer than on the street below.
Auditors don’t audit back at their home office. Its a job done in the field looking at the data there and asking questions of those in charge. Doing 40 years later?. . . .well never done that.
The governor of Texas went on Fox news and tried to blame wind turbines for the problems of his state, while ignoring the much larger problem caused by Natural Gas and other power plants, and the lack of regulation of these.
Since its Fox News, there will be no correction or push back, and the viewers will eat it up because it confirms their beliefs.
And most viewers will never get the truth, because they will only watch conservative media.
Texas was warned 10 y ago, but its lazy fair govt failed to act.
https://www.texastribune.org/2021/02/17/texas-power-grid-failures/
Yep the experts know how bankrupt the global warming rhetoric is. Its just the petty bureaucrats are constantly under the pressure of spending money to guard against too much heat rather than too little.
How do you get that bizarre lesson from that?
The lessen is that under regulation can be as bad or worse than over regulation.
Sorry Nate but your political philosophy is as antiquated as physics. . . .perhaps moreso.
What overregulation and socialism have in common is a tendency to large disaster. Over regulation decreases diversity of business ideas and thus increases the chances of widespread disaster.
Under regulation may not substantially reduce disaster it just tends to reduce the scope of it when it does happen.
The greens enthusiastically embrace bio-diversity put for some odd reason flip-flop on diversity across the board. . . .why? Cause they are being conned by massive international NGOs and getting fleeced without them knowing it.
AGW is the same thing. Its about a massive government-sponsored transfer of wealth from oil interests to whoever does enough political favors and is willing to spend some of it on massive non-sustainable economic investments in unprofitable ventures.
Who gets burned? Well its hard to say the oil tycoons get burned. . . .often enough they are willing to line up at the hog’s trough and have enough wherewithall to prime the pump and even if they aren’t willing to do that they have plenty of assets taken in the form of dividends and other revenues to land squarely on their own two feet in very good shape.
Its everybody else that gets burnt.
“Under regulation may not substantially reduce disaster it just tends to reduce the scope of it when it does happen.”
Uhh, apparently the weeks events prove that FALSE. Did you not watch the news?
Good example of Conservative theory vs pragmatism.
The theory is that the Free Market can meet any challenge or need.
And the theory was applied to the extreme in Texas, with totally unregulated Electric Market. The Market failed to provide winterization of power plants and fuel pipelines.
Then when the lights went out and the $7000 electric bills driven by the Free Market arrived, politicians like the Governor Abbott and Ted Cruz were disavowing Market pricing.
Pragmatic conservative governing means having enough regulation to prevent such disasters.
Nate says:
Under regulation may not substantially reduce disaster it just tends to reduce the scope of it when it does happen.
Uhh, apparently the weeks events prove that FALSE. Did you not watch the news?
Good example of Conservative theory vs pragmatism.
The theory is that the Free Market can meet any challenge or need.
And the theory was applied to the extreme in Texas, with totally unregulated Electric Market. The Market failed to provide winterization of power plants and fuel pipelines.
===========================
Nate croaking away at stuff he knows nothing about as usual.
1) ERCOT the Texas grid that failed is not a) unregulated; b) not free market; c) ”the market” isn’t responsible for the grid.
The grid is regulated by the Texas Public Utility Commission and the Legislature. There is only one company. Parts of Texas along the fringes of the state opted out of the Texas ERCOT grid. the failure here is very similar to the California electric disaster a couple of decades ago that had a big role in getting the California Governor impeached.
Something like 3 other grids operate in Texas and were not part of this as they get their power from other regions.
ERCOT is only unique because its regulated by the State of Texas vs the federal regulation of the other grids.
Grids are natural monopolies so they really have nothing to do with free markets. Never have and never will. Try learning something Nate before flapping your jaws.
And you do understand it, because..?
“There is only one company.”
???
There are many suppliers. They were basically unregulated. Winterization was not required.
As you noted: “The grid is regulated by the Texas Public Utility Commission and the Legislature.”
Governor looking for scapegoats. ERCOT does not make regulations. They just manage the grid with the supply they have.
ERCOT “The Electric Reliability Council of Texas (ERCOT) manages the flow of electric power to more than 26 million Texas customers — representing about 90 percent of the state’s electric load. As the independent system operator for the region, ERCOT schedules power on an electric grid that connects more than 46,500 miles of transmission lines and 680+ generation units. It also performs financial settlement for the competitive wholesale bulk-power market and administers retail switching for 8 million premises in competitive choice areas.”
Nate says:
And you do understand it, because..?
—————————-
35 years at the highest level as a consultant/analyst in major matters controlled by the government. . . .actually working as a consultant on both sides at different times.
What experience do you have? Read a couple of articles in the New York Times?
——————-
——————
——————–
———————
Nate says:
“There is only one company.”
???
There are many suppliers. They were basically unregulated. Winterization was not required.
———————–
LOL!
Two facts need to always be considered. 1) power corrupts and absolute power corrupts absolutely. and 2) the bigger they are the harder they fall.
Regulation is a common substitute for the common sense above.
regulation inevitably leads to either corruption or collapse. Its why socialism doesn’t work at all.
In the power delivery business guaranteed contracts is the way to go. e.g. either the contracted party delivers on time or he pays for the most rapid alternative delivery and only receives his contracted rate. Consumers are protected against non-delivery and has recourse for damages for non-delivery.
Wall Street accomplishes the same approaches in the commodity markets.
But you take some government agency or not-for-profit and you have relinquished much of any chance of writing good contracts where bureaucrats are more interested in making points with the contractor, have no personal investment at risk with guaranteed employment and pensions and opportunities for fat consulting contracts to double dip into pension systems.
Regulation can have a role but regulation isn’t responsive, seldom is efficient, and is wholly unadaptable to changing conditions. So all too often regulation costs more to implement than the return for it given to the consumer.
As I pointed out this disaster is unprecedented and to some extent arises out of regulating alternatives and to the remaining extent is about the concentration of power. Its just too tempting to put all the eggs in one basket as a hog trough for insiders. It attempts to circumvent the 2 truths outlined above by concentrating power.
“Regulation can have a role but regulation isn’t responsive, seldom is efficient, and is wholly unadaptable to changing conditions. So all too often regulation costs more to implement than the return for it given to the consumer.”
My original point was this failure was “Good example of Conservative theory vs pragmatism.”
Your answer seems to be go with Conservative Theory anyway.
IOW do nothing, and let the Market take care of it. Which it didnt.
Nate you continue to miss the point.
The grid is what shut down. The grid evenly distributes what it gets. If demand exceeds supply the grid starts shutting down customers.
If you had multiple grids to choose from the ones that shutdown customers would lose business and people would shift to grids that didn’t shutdown. You want to blame the suppliers when all you need to do is ensure the blame bears the brunt of market forces.
So now that the quasi-government grid needs to respond to something they did not foresee. Asking the legislature to do it by regulation results in poor efficiency, unintended consequences, higher rates, less competition. If the grid does it by contracting supply or pay, businesses will want more money for their guarantees of supply but competition will force the price of those guarantees to the bare minimum. If the government wants to try to do that by regulation you will face corruption, bad ideas, zero innovation, and it will cost the consumers a lot more. In fact if the government does it select businesses will help them by trying to get conditions favorable to that particular business and they will succeed via the usual corruption of the political environment and consumers will pay.
bottom line Nate is for competition to work it needs both multiple vendors and multiple customers. A quasi-government agency or not-for-profit can sit as an intermediary in the situation of a natural monopoly like power distribution grids and it often works when really qualified people get put in charge whose future salaries depend upon good practices.
Rule 2 above states essentially that big grids may breakdown less frequently but when they do they tend to be bigger deals unless they have properly learned their lessons from their little brothers.
Nate you are wrong that FERC is regulated and ERCOT is not and that FERC. Thats just your ignorance speaking. They operate under essentially similar models to promote competition in energy supply. https://www.ferc.gov/industries-data/electric/power-sales-and-markets/electric-competition#:~:text=FERC%20issued%20a%20series%20of,888.&text=The%20President%20signed%20into%20law,open%20access%20to%20transmission%20facilities.
“Nate you continue to miss the point.
The grid is what shut down. The grid evenly distributes what it gets. If demand exceeds supply the grid starts shutting down customers.”
Indeed so. The Market for suppliers to the grid for suppliers to residences, as shown clearly in the ERCOT ‘ABOUT US’ description.
Thus problem was not ERCOTs fault.
The problem was that many suppliers simultaneously were shut down because of lack of winterization requirements.
Seems like you are missing this key point.
“If you had multiple grids to choose from the ones that shutdown customers would lose business and people would shift to grids that didnt shutdown.”
That is utterly absurd.
The grid is more analogous to the highway system. All the trucks drive on the same hi-way system, and the competition is between different trucking companies.
“Nate you are wrong that FERC is regulated”
??
I never said diddly squat about FERC.
You keep dodging the key element Nate.
The grid failed because of a lack of delivery.
You have looked at a newspaper and determined that the lack of delivery was a lack of winterization. . . .whatever that is.
The key issue was lack of delivery not lack of winterization. Delivery can, will and has failed for innumerable reasons. You don’t need regulation you need guaranteed delivery contracts such that the contractor that doesn’t deliver is liable for damages and must pay whatever rate is required to provide replacement delivery.
The problem is the facilitator has no cock in the fight. . . .trying to please everybody and make friends. I have worked as a consultant for a number of such intermediaries (other than electricity) over perhaps just the last few decades these intermediaries are developing skill sets to ensure open markets, competition, and responsibility.
Its not an easy road to hoe because suppliers want contracts without responsibility for obvious reasons. And what you don’t want is a bunch of bureaucrats and politicians specifying how they accomplish what they are supposed to accomplish.
All you need to do is make it such its the only route to profitability. . . .that’s the difference between smart contracts and regulation.
The biggest hurdle to over come is the politicians can easily get kickbacks out of regulation design. Identical contracts that adequately address responsibility provides no such opportunity, it simply becomes a choice of the consumer and supplier.
All you want is to contract for what the consumer wants delivered in the form of guaranteed delivery contracts.
Simply insisting on delivery is the conservative De Minimis approach that minimizes government’s role while maximizing innovation and the end result. then you wouldn’t be talking about consumers getting gouged on replacement power.
That is what I do go into some system that hasn’t been working well or has flat out failed as part of a consulting team, audit the situation, and make recommendations. Most of the time you find that the intermediary was trying to be too smart do too much when they should have left the details to those with the investment, motivation, experience, and expertise.
“You have looked at a newspaper and determined ..”
Indeed I have.
While you didnt bother to gather the relevant facts and just blurted out politically biased opinion.
Then, as so often, when called out on it, you have to walk much of it back. Why not get informed first?
Nate nothing got walked back.
The concept of ERCOT is to provide free market access to energy. ERCOT acts as the middleman regulating conditions. . . .powers granted to it by the legislature.
It seems obvious to me one thing you would want to have is some forms of protection against volatility and/or forms of consent to volatile rate shifts. Even Wall Street has that.
As to your lastest claim on the gov blaming wind energy. . . .indeed its justified.
The fact is some folks would rather burden natural gas with regulation rather than simply fixing issues of volatility and who pays for supply disruptions.
All you want to do is distract from inherent non-mitigatable risks of wind power and focus instead on mitigatable ignorance of not insulating well heads.
Wind power problems are the only political issue as nobody knows how to fix it. Subsidization is where you find it.
You guys want to subsidize wind power and wind power comes out the loser with smart volatility and supply protections. . . because wind power has higher costs associated with providing guaranteed delivery within a framework of smart volatility protections. Imagine the wind farm operators needing an insulated natural gas wellhead as backup.
So feel free to troll and dance your political jig all you want Nate. . . .and I will feel free to expose it for what it is.
Bill from the beginning you claimed it was not a market based system, had to walk that back.
You continue determined to miss the point,
“The problem was that many suppliers simultaneously were shut down because of lack of winterization requirements.”
And you keep trying to blame the GRID manager for this the lack of supply, and you already admitted that “The grid is regulated by the Texas Public Utility Commission and the Legislature.”, not ERCOT.
Texas was given a clear warning 10 y ago and failed to fix the problem.
Unclear what change you recommend to Texas to avoid this problem in the future?
Nate says:
Bill from the beginning you claimed it was not a market based system, had to walk that back.
==============================
I didn’t walk any of that back you just misinterpreted that I stated energy delivery via wire and pipe is a natural monopoly. A monopoly is not a free market system.
Texas’ ERCOT is designed to take what is not free market as a system and make certain elements of it free market through regulation and legislation. Name make just the fuel that travels on the lines and in the pipes free market.
To make that separation workable is a challenge as the centralized non-free market ERCOT grid has to establish the rules of the market (e.g. customers cannot drive down to the local gas station and fill up energy containers at the station of their choice, which if the price of gas just doubled they might forego a purchase and go home and allocate what fuel they have left as wisely as possible.
Choice before being charged is a fundamental aspect of true free markets. Who is going to get charged in now a topic of lawsuits.
———–
————-
————-
————
Nate says:
”Texas was given a clear warning 10 y ago and failed to fix the problem.
Unclear what change you recommend to Texas to avoid this problem in the future?”
———————–
Yes you are correct and the consumers had no opportunity to select on that basis so the attempt at creating a free market on that failed.
I said there are a number of ways besides regulating insulation of well heads and dreaming up some way of solving the massive shutdown of windpower which nobody has figured out yet and regulating that.
One way is to make power suppliers responsible to deliver at the “beat this price” level where the regulator doesn’t have to raise the instant price 700% to try to entice delivery.
A more detailed example would be like Wall Street volatility protections. Establish a price to beat allow it to change but put a limit on how much it can change in say a month.
That collars price volatility. Then the way to collar supply volatility is to demand that once contracted on a ”price to beat” basis the utility is bound to deliver a given number of Kwh based upon the number of customers that selected that particular supplier. Wall Street does it by selling options.
In this case the suppliers would determine their own risk and either buy coverage (say options for the delivery of alternative energy) protecting them from their own equipment shutting down
None of this is all that complicated. Its just a case that in new endeavors it usually takes a little time to get it right.
“I didnt walk any of that back you just misinterpreted that I stated energy delivery via wire and pipe is a natural monopoly. A monopoly is not a free market system.”
As shown, it is a Free Market for Suppliers, and a Free Market for Deliverers.
IDK why you keep ignoring these facts.
“Texas ERCOT is designed to take what is not free market as a system and make certain elements of it free market through regulation and legislation. ”
IDK why you think the Free Market arises from ‘regulation’?
Confusing.
This may be helpful to see what financial penalties were already in place but still failed to take care of the problem.
And you, and Right wing Media keep erroneously emphasizing Wind Turbines when the evidence shows that they were a minor, and easily fixed, part of the problem.
https://www.yahoo.com/finance/news/texas-electricity-firm-files-bankruptcy-064724456.html
this…
Nate says:
”IDK why you think the Free Market arises from ‘regulation’?
Confusing.”
It shouldn’t be confusing. Laws, regulations, and the Constitution is a framework of a broader category of regulation that this country operates from.
Thus the Bill of Rights is in the same category as regulation.
”This may be helpful to see what financial penalties were already in place but still failed to take care of the problem. And you, and Right wing Media keep erroneously emphasizing Wind Turbines when the evidence shows that they were a minor, and easily fixed, part of the problem.”
You must be confusing me with somebody else. I don’t think wind power should bear any additional responsibility.
The free market fix is to assign the same liability energy industry wide and let each supplier determine how they can mitigate that liability.
Each supplier should individually bear the costs associated of unreliability and be held to the same reliability standard.
Since wind power has been politically favored pushing management towards a failing micromanagement regime while knowing wind power has been less reliable. The right action and at the heart of my specialty is in ensuring costs get assigned properly and fairly.
It is very possible the Texas Governor is just doing CYA for somebody. But quite frequently you find with careful examination of public testimony that often administrations are aware of some risks, want to assign costs of reliability fairly, meet a lot of political opposition to that, and then everybody gets caught with their pants down. The bottom line is its well known how to go about regulating free market systems. . . .it just that there is a lot of special interest resistance against that from special interests and do gooders who really aren’t up to speed.
That is exactly what is inherent in micromanagement regulation and it does take a good deal of time and research to dig it out. Handing out hidden subsidies is a land office business in politics. And hidden is the key word nobody wants it known to be such. Assigning equal across the board liability for being responsible doesn’t provide an avenue for that corruption.
Great examples of that in everyday life is the ‘professionalization’ of a trade where performance standards, license, bonding, and insurance are the trademark of a profession, like doctors, engineers, accountants, contractors, etc. All that goes a long ways to ridding a trade of quacks.
Nate says:
https://www.yahoo.com/finance/news/texas-electricity-firm-files-bankruptcy-064724456.html
this
==========================
Perfect you are commenting on an area where I have the most experience. The municipal utilities got nailed. Why?
Well in the ‘market’ that failed the municipal utilities are nothing but customers and consumers of energy. Worse they have contracts to sell energy to end customers at rates fixed by their own municipal regulators.
So here they are with huge prices for raw energy to power whatever they do like run generating stations and distribute electricity to end consumers and fixed rates coming from at least a portion of their customers as established by their local utilities commission. Kind of like California’s PGandE giant responsible for wild fires that killed something like 120 people.
Huge liabilities and fixed rate revenues.
The fix for this is in transferring the liability for failure to deliver to the suppliers. Its nice to think of for consumers to buy energy at the wellhead at a rate with practically no markup; but as we see from this event that isn’t 100% feasible. There needs to be like an insurance premium on top where the suppliers either insure themselves (like a contractor or other professional does) or places the risk in arbitrage where investors bid for the risk. It adds a small premium to the cost of energy but it is something most consumers would want for higher levels of reliability.
So suppliers might think they can mitigate the risk by insulating wellheads, for example, as opposed to putting the risk out to bid in an arbitrage market.
It might be attractive to think that risk can be mitigated by mandating wellhead insulation and be done with it. But risk is by far a more complicated beast than that and it leaves everybody else off the hook who don’t have wellhead freezing problems and shutdown anyway without fulfilling their role.
I am not an electricity expert but I suspect that what is needed is a brief time commitment on the part of suppliers. Since utility bills go monthly typically a month interval would have fixed this problem where rates are fixed in the short run. They already have opportunities for customers to get longer term rates up to 2 years. Having a range of time commitments would fit the bill probably pretty well for most but the answer to that is subject to a lot more information and is just a simplified example and not all inclusive of how to handle risk.
” dreaming up some way of solving the massive shutdown of windpower which nobody has figured out yet and regulating that.”
This wasnt you?
And more blurted nonsense.
There is no need to ‘dream up’ what ‘nobody has figured out yet’.
There are massive numbers of winterized wind turbines in states like the Dakotas with harsh winters.
Indeed Nate. Cold weather isn’t wind power’s Achilles heel. Biggest one is the wind not blowing.
They are hoping it will be blowing someplace else where they can borrow power in the north. Is that a good bet in this era of extreme weather? The wind not blowing would seem to be the most logical outcome of the weakening and slowing jet stream along with a lower temperature gradient across latitudes.
I am fine with wind power competing on a level playing field. Here at my house I don’t need imported monopoly power for heat. Its just a nice convenience to have when you want it. Some people like to be dependents though. It will definitely give them a lot to complain about like teenage children.
barry
You wrote upthread:
” What should happen in a warming world is that local record-breaking highs should occur more frequently than local record-breaking lows in most if not all years recently. ”
Correct.
Recently, Roy Spencer published among other papers a short study made by Prof. Christy
” Are Record Temperatures Occurring More Often in the Conterminous United States? ”
*
within which he interpreted a parallel decrease of highs and lows reported by USHCN stations in CONUS since 1895, as a hint on extremes lessening there over time.
I wanted to see how the Globe would behave compared with CONUS.
Like I did 2 years ago, I took GHCN daily worldwide instead of the US-restricted HCN station set.
Like did Mr Christy, only stations with at least 105 years of activity were selected.
CONUS differs a bit from Mr Christy’s graph because
– GHCN daily has more HCN stations than the HCN set itself;
– I preferred to keep his original 2018 scaling (highs per station) instead of taking his newer one (highs per measurements).
Each chart shows in yellow the values without area weighting, and in red/blue/green those computed with area weighting (in addition to his blue lowest TMIN records, I generated data for highest daily TMIN values, in green).
1. CONUS TMAX
https://drive.google.com/file/d/1mdk43WKwvDYe3UTjUYyeF9MfktcacIKZ/view
The yellow stuff is similar to Mr Chrisy’s TMAX.
2. CONUS TMIN
https://drive.google.com/file/d/1LCMjreVGILlIy82tKbN9BQ2MM9kvdqs5/view
The yellow stuff is similar to Mr Christy’s TMIN.
3. Globe TMAX
https://drive.google.com/file/d/1qe7HVPQHnniK1F6CMUh5zoO6fL-314WE/view
Here we see that in opposition to CONUS, the Globe’s red stuff increases over the years when area weighting is activated, because one gets 170 US grid cells vs. 170 outside instead of 2107 US stations vs only 468 outside!
4. Globe low TMIN
https://drive.google.com/file/d/1q70BufrN6gKCHbt4guEO-Bg4JdephHhr/view
This is quite similar to the TMIN graph for CONUS. I don’t know why the TMAX graphs differ, but the TMIN’s nearly don’t.
5. Globe high TMIN
https://drive.google.com/file/d/1XCMCMGzaFqhcS46UggIAB4emjOpN4ELC/view
Here we see what is known since longer time: outside of CONUS, where it keeps nearly constant, the ratio of warmest, absolute night temperatures increases over time.
*
All in all, it seems to me that Mr Christy’s TMAX/TMIN study shows conclusions which are really only valid for CONUS, and cannot be transferred to the Globe’s land areas as a whole.
Yeah: CONUS, that’s 6% of Earth’s land surface.
J.-P. D.
The US is incredibly parochial.
Entropic man
Would then people like Grant Foster be as well?
I see the problem at a different level: John Christy is busy since years with writing testimonies destinated to the Senate’s most conservative lawmakers.
Such people aren’t interested in anything outside the US (some are even in nothing outside of CONUS).
One day you begin to slightly move from science into… politics.
J.-P. D.
I have a feeling Grant Foster didn’t survive 2020.
barry
me too, the blog has stopped on July, 23.
Last year, his wife wrote on the blog that her husband was seriously ill and they were both delighted to receive donations from readers to buy medicines for him.
Didn’t sound very good.
I really appreciated his dissertations on statistics. He managed to make difficult concepts clear, and was a good teacher of the power and limits of statistics.
Somewhere upthread, I read a superintelligent statement:
” The bad news:
Half of the Texas windmills froze.
The good news:
Half of the Texas birds were safe. ”
Wooooaah! One must really be a genius to write such things.
*
I prefer to read accurate informations, e.g.
Direct Mortality of Birds from Anthropogenic Causes
Scott R. Loss, Tom Will, and Peter P. Marra
https://www.annualreviews.org/doi/full/10.1146/annurev-ecolsys-112414-054133
There you see the reality:
https://www.annualreviews.org/na101/home/literatum/publisher/ar/journals/content/ecolsys/2015/ecolsys.2015.46.issue-1/annurev-ecolsys-112414-054133/20151118/images/medium/es460099.f2.gif
Every bird killed by a wind turbine is a dead bird too much!
But before you rant against windmills, what about killing a few cats instead?
J.-P. D.
bindion – You are a spot on!
Here in Oz cats kill millions of native species every year – leading to the near extinction in many parts.
If I had my way I would cull all domestic cats and even cull their stupid, selfish owners!
Michael Jackson
Thank you for this fair – and rare – reaction.
CONUSian people often aggressively reply that their magnificent bald eagles horribly suffer.
Robin? Mountain finch? Swamp tit? Bullfinch? Thrush? Starling?
” What’s that? ” they say.
J.-P. D.
I wrote those words at the end of a long comment that was worth reading. I typed them slow, so even YOU would understand it. Thank you for the complements, Bindoofus, but it was not necessary to call me a “genius”, and “superintelligent”. After all, how would YOU know?
A cat has instincts to kill birds for food. That’s why i have always kept my cats indoors. Do you hate cats too?
Windmills are build by choice. Through the use of large government subsidies, tax credits and mandates to use them (or solar panels).
Otherwise the wind industry would practically disappear.
After they are built, windmills take up a lot of space, provide intermittent, highly variable, unpredictable energy, kill birds and bats, cause health problems with their infrasonic noise:
https://elonionbloggle.blogspot.com/2020/10/wind-power-infrasound-noise-problem.html
… and windmills are ugly too.
Windmills are substandard electricity generators for the modern world, unless battery prices decline by about 90%.
The windmills kill lots of insects, which attracts smaller birds for meals, and then some of them are killed, which attracts larger birds for meals, and then some of them are killed, which attracts animals for meals.
There is no way to accurately count dead birds and bats near windmills (not all of them die right next to the windmills) because they become part of nature’s food chain.
https://elonionbloggle.blogspot.com/2020/07/wind-turbines-are-potent-bat-killers.html
Too bad you can’t think about these issues by yourself, and always resort to the appeal to authority logical fallacy — “I read a report on birds that I like, by an “expert”, so it must be right”.
Greene
” Too bad you can’t think about these issues by yourself, and always resort to the appeal to authority logical fallacy… ”
Typical pseudoskeptic nonsense.
Each time people like you, Robertson, Swenson or the like go out of arguments, you all automatically invoke “appeal to authority”.
That, Greene, is simply stubborn.
Btw: no, I don’t hate cats.
Start thinking, Greene, instead of writing such trrivial stuff.
Maybe thinking brings you near to the fact that cats are no longer wild animals, but are animals that are completely overfed by humans and that kill birds not out of need, but out of instinct and lust.
Oh Noes! Is that soo difficult, Greene?
J.-P. D.
An incoherent comment. Didn’t your mother teach you to stop drinking two hours before posting comments online? But thank you for spelling my name right.
Greene
Don’t try it that way, it’s hopeless. I have to do with people like you since at least 10 years.
There is nothing incoherent at all in my comment, Greene, and you know that.
J.-P. D.
“Don’t try it that way, it’s hopeless. I have to do with people like you since at least 10 years.”
Is English your first language, Mr. “I read it is a study, so it has to be right” Bindoofus:
If it favors renewables, it has to be right.
If it criticizes fossil fuels, it must be wrong.
If it predicts climate doom in the future, it has to be right
If it says CO2 has no benefits, it has to be wrong.
You are as predictable as a broken watch — providing the “right” time, two times a day?
I’m laughing a lot about these arrogant Anglo-Saxons.
You have to complain about what I wrote above? Really?
Then go to Google, people, and manage to complain about the bad quality of their translation tool.
And by the way, I hope you two are not quite as provincial as the average CONUSian, who isn’t able to understand anything else than his American, let alone to speak any foreign language.
I recall the son of a Middle West farmer, who replied to the evident question:
” Yurop? Wha’s that? C’n I eat it? ”
Parlez-vous français, Messieurs?
Sprechen Sie Deutsch, meine Herren?
Pffff.
J.-P. D.
Bindidon says:
”Maybe thinking brings you near to the fact that cats are no longer wild animals, but are animals that are completely overfed by humans and that kill birds not out of need, but out of instinct and lust.”
Definition: lust
noun
very strong sexual desire.
sounds pretty incoherent to me also.
Cherrypicking , Bill?
Why not include the full definition?
lust
intense sexual desire or appetite.
uncontrolled or illicit sexual desire or appetite; lecherousness.
a passionate or overmastering desire or craving (usually followed by for):
a lust for power.
ardent enthusiasm; zest; relish:
an enviable lust for life. ”
“a passionate or overmastering desire or craving ” certainly describes my parents’ cat’s desire to kill birds and present them to the family.
Today four cats fight in my garden for the territory which contains my bird feeders.
Entropic man
Thank you for this sane and intelligent reaction on hunter’s reckless prose.
J.-P. D.
Entropic man says:
a passionate or overmastering desire or craving (usually followed by for):
a lust for power.
ardent enthusiasm; zest; relish:
an enviable lust for life.
a passionate or overmastering desire or craving certainly describes my parents cats desire to kill birds and present them to the family.
Today four cats fight in my garden for the territory which contains my bird feeders.
=========================
Well besides lust being a very poor description of a cat’s native instincts or have a concept of being overfed. Cats live in packs and families. Less so than dogs but still a cat hunts to feed its young and other relatives. A streak of independence would better explain the offerings at the door. Not every creature in the world turns around, bends over and lifts its skirts for masters. but I guess thats probably a pretty foreign idea to you guys.
For those using the Texas cold spell as a stick to beat wind farms, I hope you have a bigger stick to beat gas and nuclear which have struggled even more.
https://www.bbc.co.uk/news/world-56085733
Entropic man
” I hope you have a bigger stick to beat gas and nuclear which have struggled even more. ”
You ask here for the impossible, that would be politically incorrect.
J.-P. D.
10s of people have died, and the cold spell isn’t over. The cost of electricity is/was $9,000 megawatt, and it cost $900 to charge your Tesla. Only a complete and utter fool would continue to argue for “diversifying” energy supply by adding unreliable energy sources to the portfolio. No “science” would even support such foolishness. Trust the Environmentalists at your own peril. They offer no solutions, only anti-capitalism rhetoric. China is building coal and nuclear plants, they build wind farms only because they get paid to do so, and many aren’t hooked to the grid. China doesn’t have a “Green Movement.” Environmentalists who put the environment above the state join the Uygurs in their concentration camps supplying labor to “dirty” power plant construction projects.
Entropic man
“In 2019, Texas had a total summer capacity of 125,117 MW through all of its power plants, and a net generation of 483,201 GWh. The corresponding electrical energy generation mix was 53.5% natural gas, 19.0% coal, 17.3% wind, 8.6% nuclear, 0.9% solar, 0.3% hydroelectric, 0.3% biomass, and 0.1% other sources.
*
Yeah. And now… read this below!!!
From ‘The Texas Tribune’
https://www.texastribune.org/2021/02/16/natural-gas-power-storm/
Texas largely relies on natural gas for power. It wasn’t ready for the extreme cold.
” Failures across Texas’ natural gas operations and supply chains due to extreme temperatures are the most significant cause of the power crisis that has left millions of Texans without heat and electricity during the winter storm sweeping the U.S.
From frozen natural gas wells to frozen wind turbines, all sources of power generation have faced difficulties during the winter storm. But Texans largely rely on natural gas for power and heat generation, especially during peak usage, experts said.
Officials for the Electric Reliability Council of Texas, which manages most of Texas’ grid, said the primary cause of the outages Tuesday appeared to be the state’s natural gas providers. Many are not designed to withstand such low temperatures on equipment or during production.
So, when you read CO2isLife’s incredible attacks, you know that this commenter is either an Ignoramus, or a… liar.
J.-P. D.
There are 3 electric grids in the United States. The western interconnect. The eastern interconnect. And Texas. Yep…Texas operates their own independent and isolated electric grid. They do not have the ability to import electricity from other regions like every other state does. That was by design. The breakdown of self sufficiency and the inability to receive a lifeline from outside is a huge contributing factor to the problem as well.
bdgwx
That makes all those ‘expert’s here looking full dumb, who ranted against renewables, or more especially windmills, for having been the major cause for Texas’ energy disaster.
*
Headline on the website of the German newspaper “Der Tagesspiegel”:
” Millionen Amerikaner ohne Strom und Wasser: Gouverneuer von Texas sieht Schuld in erneuerbaren Energien
But in the article text you read, translated in English
In fact, wind power only accounts for about 7 percent of the state’s total capacity at this time of year. According to experts, a large part of the power outage is due to frozen pipelines.
Greg Abbott finally admitted in a press conference on Wednesday afternoon that frozen wind turbines are not the main cause of the electricity shortage.
J.-P. D.
badwax sez: “That makes all those experts here looking full dumb”. I guess you would be an expert on the subject of dumb.
Here are some facts from my Texas wind power article a few days ago, where you can look at charts of wind power by hour on several days. Averages tell you little. There are huge variations from day to day, and even during a day:
“Just a week before the outages of Monday night, wind output was strong throughout the day .. in terms of its capacity factor (64%) and percentage of the ERCOT load (58%):
But wind production looked entirely different on Monday night and Tuesday morning: … during the critical four-hour period from 10 p.m. to 2 a.m. when ERCOT was forced to begin rolling blackouts, actual wind output averaged less than 5% of the ERCOT load.”
The whole article and many charts are here:
https://elonionbloggle.blogspot.com/2021/02/wind-subsidies-help-freeze-texans.html
bdgwx: According to the metadata record Burnet USC00411250 had 8 relocations. In fact, its altitude jumped from 305m to 403m above sea level. That change alone creates a dramatic 0.6C drop in temperature if using the average 6.5C/km lapse rate. Its TOB switched to 08:00 in 1945 and transitioned to MMTS in 1986. Are you guys suggesting that we should just pretend like none of that happened, perform climatic analysis on the unadjusted data anyway, and not disclose these issue to consumers of your results?
OK, let’s look at the adjustments then. From your description, there would have been a 0.6 Degree Immediate drop in temperatures with the change in the raw data. There is a giant step at 1945, so that adjustment looks appropriate. Using the “Adjusted” Data, and starting the regression in about 1935 when it peaks, you still get a negative trend through the current. 85 years of no warming. Still want to argue warming is a problem for Texas? 99% of the “adjusted” data is below 1935. Almost all warming had occurred by 1935. Current temperatures are at the level of 1897. Temps in 2005 were near an all time low. Basically, there is 0.00 evidence CO2 is causing warming in Texas.
Same story for these other Texas Stations.
Lampasas (31.0717N, 98.1847W) ID:USC00415018
https://data.giss.nasa.gov/cgi-bin/gistemp/stdata_show_v4.cgi?id=USC00415018&ds=14&dt=1
Blanco (30.1061N, 98.4286W) ID:USC00410832
https://data.giss.nasa.gov/cgi-bin/gistemp/stdata_show_v4.cgi?id=USC00410832&ds=14&dt=1
https://data.giss.nasa.gov/cgi-bin/gistemp/stdata_show_v4.cgi?id=USC00411348&ds=14&dt=1
San Marcos (29.8833N, 97.9494W) ID:USC00417983
https://data.giss.nasa.gov/cgi-bin/gistemp/stdata_show_v4.cgi?id=USC00417983&ds=14&dt=1
Temple (31.0781N, 97.3183W) ID:USC00418910
https://data.giss.nasa.gov/cgi-bin/gistemp/stdata_show_v4.cgi?id=USC00418910&ds=14&dt=1
bdgwx, run your regression from the 1930s peak and you will get 85 years of no warming. Funny how your regressions only show warming if you include the early period of warming, and then ignore the cooling during the period when CO2 increased the most.
Dr. Spencer, bdgwx has identified a great project for a Ph.D Student. What are the slopes of regressions that start at the 1930s or earlier peak? You will see the CO2 causes no warming during the period of major CO2 increase.
CO2
To look for climate change, one must look at trends in the average temperature of large regions, whole continents. Only then is the local variation caused by weather, reduced enough to see the underlying trend.
But you keep wanting us to look at individual towns to see trends, but that is quite pointless. They all have huge local variation due to WEATHER.
It seems you prefer data that has so much noise that any trends are swamped by that..
I have to admit Nate is right.
Climate is a long term average of weather.
The measurements have not been very accurate until the 1970s.
Very inaccurate in the 1800s and earlier.
A single global average is a rough estimate, especially before the 19oos. Since 1979, satellites give us an opportunity for more accuracy in seeing where the warming was strongest and weakest. That’s more important than a single average, because not one person lives in a global average temperature.
I have no idea why individual weather stations are considered to be important, EXCEPT for an analysis: A history of changes to the location, the current siting versus optimum siting, along with economic growth in the vicinity and instrument changes over a long period of time. A history study of an individual weather station would tell us how many variables have changed OTHER THAN the temperature.
We can put objective definitions on your word choices.
“rough estimate before 1900” – 5yr centered mean error of 0.06C with annual mean error of 0.07 in 1900 and 0.12 in 1880. BEST: https://tinyurl.com/3jcutohd
“not been very accurate until the 1970s” – 5yr centered mean error of 0.04C with annual mean error of 0.05 in 1970, 0.07 in 1950, and 0.07 in 1930. BEST: https://tinyurl.com/3jcutohd
“very inaccurate in the 1800s and earlier” – 0.4C prior to 1800, see Kaufmann 2020: https://tinyurl.com/5ji0otpn
“satellites give us an opportunity for more accuracy” – 0.2C in 2010, see Mears 2011: https://tinyurl.com/l72xud3a
I personally think “satellites give us an opportunity for more accuracy” at 0.2C conflicts with “rough estimate fore 1900” of 0.12C in 1880. I’ll give you the opportunity to clarify these statements.
“rough estimate before 1900” – 5yr centered mean error of 0.06C with annual mean error of 0.07 in 1900 and 0.12 in 1880. BEST: https://tinyurl.com/3jcutohd”
Baloney
You can’t guess temperatures for half the world and then claim you know a margin of error for the global average that you calculated. The global average is not a temperature measurement, it is a statistic. It is a statistic that consists of very little data (actual measurements) because of so many adjustments to the raw data. Any adjustment to raw data changes the number into an opinion — no longer real data. It becomes an opinion of what the data would have been if measured correctly in the first place. Every adjustment has the potential for error just like the original measurement did.
The global coverage was haphazard in the 1800s. The thermometers used in buckets mainly in Northern hemisphere shipping lanes, and manually read, would be +/- 0.5 degree C. at best. So there is no way the global average margin of error could be less than +/- 0.5 degree C. … BUT it would actually have to be larger than that because so much of the planet is infilled with guesses that can never be verified.
Your problem continues to be far too much trust of people in authority, badwax — government employees making ridiculous claims of accuracy for their 19th century and early 20th century numbers. You trust too much, and think too little. All appeal to authority, and no common sense.
RG said: Baloney
Then present evidence to back this up. Evidence would be an alternative dataset that computes a global mean surface temperature with an uncertainty analysis that is significantly different then what all of the other datasets publish.
Evidence RG…EVIDENCE!
RG said: Your problem continues to be far too much trust of people in authority, badwax government employees making ridiculous claims of accuracy for their 19th century and early 20th century numbers. You trust too much, and think too little. All appeal to authority, and no common sense.
There is absolutely ZERO appeal to authority here. I never said the uncertainty is what it is because of who made the claim. I said it is what is because of the evidence I linked to. And I didn’t even scratch the surface of all the evidence available. The evidence is massive and convincing.
Evidence RG…EVIDENCE!
bdgwx says:
”Then present evidence to back this up.”
========================
If I am not mistaken I think thats precisely what Roy is proposing.
================
================
=================
bdgwx says:
”There is absolutely ZERO appeal to authority here. I never said the uncertainty is what it is because of who made the claim.”
==================
Hmmm, you spend a lot of time talking about ”accuracy” and other such nonsense like ”standard error” surrounding GISS temperature records when none of that does anything to address real concerns like UHI, undocumented adjustments, or even the record itself which is not a random statistical sample.
What exactly is that you think is proven by ”standard error” and how is that relevant to the well expressed concerns surrounding the records?
Absolutely. Dr. Spencer presents evidence of the UHI effect.
You presented an evidence backed argument with your criticism of BEST’s use of MOD500 instead of GRUMP.
This is the type of thing that I appeal to.
Now we need to get Dr. Spencer to compute a global mean surface temperature with a rigorous uncertainty analysis, publish it so that everyone can replicate and review it, and then we’ll compare it to all of the other datasets that are out there and draw conclusions from there.
CO2isLife said: Using the “Adjusted” Data, and starting the regression in about 1935 when it peaks, you still get a negative trend through the current. 85 years of no warming.
Sigh…not even close. You’re eyes are deceiving you again.
The peak actually occurred in 1938 so I’ll start from there. I assume you don’t mind. So from 1938 to 2020 the change in temperature at Burnet USC00411250 from the adj-homogenized dataset is +0.88C +/- 0.22. The trend is +0.11C/decade +/- 0.03.
bdgwx: Sigh…not even close. You’re eyes are deceiving you again.
Really? How can you possibly claim your regression is worth anything when the current values are BELOW the level in 1938. The level in 2005 (eyeballed) is near a record low. The level in 1978 (eyeballed) is a record low if 1938 is a peak.
My eyes aren’t deceiving me at all, you are distorting the validity of a garbage regression. Just look at the standard deviation. No way in the world is the current value 2 or 3 standard deviations from any mean you choose.
Dr. Spencer should have a grad student take all the charts that I’ve posted and there are many many many more and have that student pick a pre-1940 peak and run regressions through the current to demonstrate that almost all stations will show no warming if only a min effort is applied to control for the UHI and WV. Texas is a desert, most of their stations will show no warming.
CO2isLife said: Just look at the standard deviation. No way in the world is the current value 2 or 3 standard deviations from any mean you choose.
That has nothing to do with the warming trend though. That is a measure of how much variability there is in the data. And there is a lot.
The SD on the data is 0.69. That means we expect 68% of the samples to be within 0.69C of the mean. That tells you nothing about how the samples are evolving with time though.
To see how the samples evolve with time we do a linear regression of the y-values (temperature) and x-values (years – 1 based). That gives us the slope of the line that tells you how temperatures are evolving with time. The slope is +0.0076C/yr +/- 0.0016.
And now we have the trendline we can analyze the yearly deviation from the trendline. The standard deviation of the difference between the actual value and the trendline is 0.63C. What that means is that is we expect 68% of the yearly temperature values to stay within 0.63C of the trendline. But the trendline is moving up. What that means is that the 16.29C record low in 1903 comes with z-score relative to the trendline of -2.19. But the equivalent z-score in 2020 would be -3.60. These are probabilities of 2% and 0.01%. In other words whatever is driving that upward trend in the temperatures made the record low of 16.29C 200x less likely in 2020 than in 1903.
In a nutshell…you have conflated the variability of the data with the evolution of the data wrt to time. We aren’t trying to answer questions concerning how noisy the data is right now. We are trying to answer questions concerning how the data evolves with time. Big difference.
CO2isLife,
I want to provide instructions so that you can do linear regression trends yourself.
1. From the GISTEMP station map page make sure adj-homogenized is selected. https://data.giss.nasa.gov/gistemp/station_data_v4_globe/
2. Search for the station.
3. Click the csv link underneath the graph.
4. In Excel fix the 999.9 records in column R. Use whatever technique you feel is appropriate. I use linear interpolation as a quick and easy fix. There are other strategies that can be used. In the end it won’t really affect the result that much regardless of how you do it. But you do need to fix the 999.9 values somehow because they are so high that they will definitely skew the result.
5. Select a 3×3 array of empty cells. Enter =LINEST(Rx:Ry,,true,true) and press CTRL-SHIFT-ENTER to enter the array formula into those cells. Rx is the starting point of the regression where x is the row number and Ry is the ending point where y is also the row number.
6. In the array returned by LINEST R1C1 is the slope. R2C1 is the standard error of the slope. R3C1 is the R^2. To get the trend in C/decade multiple R1C1 by 10. To get warming over that period multiple R1C1 by the number of years. Remember to multiple R2C1 by the same amount to normalize the standard error to the length of period you are analyzing.
bdgwx
I’m not quite sure of him still being unaware of LINEST().
What he imho might be trying is to perform a multiple regression covering temperatures and CO2, using something like
https://www.informit.com/articles/article.aspx?p=2019171
J.-P. D.
Have fun this this one bdgwx, and I can find many many many more.
Lampasas (31.0717N, 98.1847W) ID:USC00415018
https://data.giss.nasa.gov/cgi-bin/gistemp/stdata_show_v4.cgi?id=USC00415018&ds=14&dt=1
Dr. Spencer you should have a grad student identify all these stations that show no warming.
From 1889 to 2012 the station warmed 0.61C +/- 0.21. There is a pretty high uncertainty on that one, but it still shows statistically significant warming of at least 0.19C at 95% confidence. The warming could be as high 1.03C though. Ya know…you can just follow the instruction I posted above and do these yourself.
bdgwx, are you honestly trying to argue that you consider Lampasas is showing an uptrend that can be attributed to CO2? There is no uptrend what so ever if you define the uptrend as a series of higher highs and higher lows that would occur with a continual increase in W/M^2 due to CO2.
Here are the facts regarding Lampasas
1) current temperatures are below almost all measurements between 1880 and 1940 (Eye Balled)
2) I just ran the regression and get a (-) coefficient until 1920(Start 1891)
3) the slope in 2012 using the annual date is 0.007 degrees per year, basically zero.
4) Start the regression in 1922, you get a negative coefficient up to 1997.
Facts are the data is so volatile, volatility that can’t be attributed to CO2, that you can pick a data point 1 or 2 years apart and completely reverse the coefficient. Facts are every one of the charts I posted have multiple decades of flat to falling temperatures. Observations that simply are inconsistent with CO2 driven warming.
ALso, with that kind of volatility none of your regressions have any certainty at all. None of those data sets have an r-square over 90, so as I said and demonstrated that I can pick time periods with significant coefficients with the exact opposite sign depending on the time period chosen. If that is the case, the coeficiends are garbage.
“None of those data sets have an r-square over 90”
?? Do you know what you are doing ??
r squared values are less than 1 by definition.
Are you equating r square values with confidence levels?
They have nothing to do with confidence levels until you know the number of degrees of freedom in the data.
Maybe go back to school on this.
CO2isLife said: are you honestly trying to argue that you consider Lampasas is showing an uptrend that can be attributed to CO2?
I’m saying there is uptrend. It is statistically significant. The question of attribution is a different matter and cannot be assessed with this data alone.
CO2isLife said: There is no uptrend what so ever if you define the uptrend as a series of higher highs and higher lows that would occur with a continual increase in W/M^2 due to CO2.
Nobody declares a trend either way based on cherry-picked samples. And no, higher highs and higher lows is at all sites is NOT an expectation of global warming regardless of which agents are contributing to the global warming.
CO2isLife said: Facts are the data is so volatile, volatility that can’t be attributed to CO2, that you can pick a data point 1 or 2 years apart and completely reverse the coefficient.
Yep. I totally agree. In fact, that’s what I’ve been trying to tell you. Can we drop this strawman argument now?
CO2isLife said: Facts are every one of the charts I posted have multiple decades of flat to falling temperatures.
Yep. And that is totally expected.
CO2isLife said: Observations that simply are inconsistent with CO2 driven warming.
Not all. Not only are these observations consistent with CO2 influenced warming, but these observations are expected given our current understanding of ALL radiative forcing agents including but not limited to CO2.
CO2isLife said: ALso, with that kind of volatility none of your regressions have any certainty at all.
I provide the standard error on ALL trends I’ve posted.
CO2isLife said: None of those data sets have an r-square over 90
And as I’ve explained that is not unexpected given the high variability of the data. But remember variability should not be conflated with the trend so stop doing it.
bdgwx y CO2Life:
“CO2isLife said:
Facts are the data is so volatile, volatility that can’t be attributed to CO2, that you can pick a data point 1 or 2 years apart and completely reverse the coefficient.
bdgwx :
Yep. I totally agree. In fact, thats what Ive been trying to tell you. Can we drop this strawman argument now?”
Could you explain a little more what this means? : Are the coefficients related to the steepness of the trend?
No. The R^2 is not a measure of the error of the slope of the trend. It is a measure of how closely the individual monthly means cluster near the trend. R^2 = 1 would be a perfectly straight line. But since weather still happens we expect a lot of variation or noise on the temperature measurements and thus a low R^2. That does not mean that the trend can have a positive slope with a low error.
bdgwx: No. The R^2 is not a measure of the error of the slope of the trend. It is a measure of how closely the individual monthly means cluster near the trend. R^2 = 1 would be a perfectly straight line. But since weather still happens we expect a lot of variation or noise on the temperature measurements and thus a low R^2. That does not mean that the trend can have a positive slope with a low error.
???? R-Sqr is the explanatory power of your regression. A 0.00 means your regression has 0.00 explanatory power, and any associated values the Alpha and Beta are also meaningless. That is what I’ve been trying to tell you. R-Square = Regression Sum of Square Error/Total Sum of Square Error, the closer the Regression SSE is to the Total SSE the more explanatory power you have.
In your regression you are making an assumption that CO2 and Time are linearly related, because the real regression you want to run isn’t Temp = Y-Axis and Time = X-Axis. Many things, like the orbit of the earth, irradiation and other can change over 140 years along with CO2.
If you were serious about your regression analysis you would run Temperature = Function of ΔW/M^2 which is basically Temp = Function of log(CO2). It is not a linear trend, so if you had any idea about the physics of the CO2 molecule, you would understand that a linear trend, which is exactly what LINEST is, proves CO2 ISN’T the cause of the warming because CO2 isn’t lineraly related to ΔW/M^2. That is what no one in the entire field of Climate “Science” doesn’t seem to understand. Temp isn’t linearly related to CO2, temp is liearly related to W/M^2, and CO2 isn’t linearly related to W/M^2.
If you understand those concepts that are 100% undeniable you will understand just how wrong you are. You are literally arguing against quantum physics.
“that a linear trend, which is exactly what LINEST is, proves CO2 ISNT the cause of the warming because CO2 isnt lineraly related to ΔW/M^2.”
Why do you insist on posting such dumb things, CO2?
CO2 growth has been ~ exponential over last 50 y or more.
As you should know log(exponential growth) gives linear growth.
The temp rise has been ~ linear over last 50 y.
Nate: Why do you insist on posting such dumb things, CO2?
What you are saying is that just by chance the log growth in CO2 caused by man exactly offsets the log decline in W/M^2. Let’s test that:
Pre-Industrial CO2 270 PPM = 330.404 W/M^2
Current CO2 415 PPM = 298.363 W/M^2 Δ2.04
CO2 increasing from 0.00 to 270 added 29.3 W/M^2
I want you to do an experiment in Excel. Put a series of values 1-1000 in column B. In column B put the formula =rand() * 1000 and copy it down. In column C put the formula =A1+B1 and copy it down. A is the signal, B is the noise, and C is the signal+noise.
Then in a 3×3 section enter =LINEST(C1:C1000,,true,true). The signal produces a slope of 1 on the data, but the noise makes the variability of the data high. As a result you will notice that the slope is close to 1, but not exactly. The standard error will be around 0.03. And because there is so much noise the R^2 will be around 0.5. Play around with the noise level by multiplying rand() by smaller or higher amounts. Play around with the number of samples by extending the number of rows in your spreadsheet.
What you will observe is that as noise goes up the error on the trend goes up and the R^2 goes down. And has noise goes down the error on the trend goes down and R^2 goes up. Also notice that even with low values of R^2 there is high confidence in the trend slope. Even with R^2 of 0.2 I see 0.1 error on the trend slope of 1.0. In other words, even with R^2 of 0.2 we can eliminate slopes < 0.8 with 95% confidence.
CO2isLife said: If you were serious about your regression analysis you would run Temperature = Function of ΔW/M^2 which is basically Temp = Function of log(CO2).
Why would I bother doing so on an individual station basis?
Why would I bother doing so by only including CO2’s RF?
I already know what the result is going to be. There is going to be very little correlation.
What would give us higher correlations is doing all of this on the global mean temperature and for the net of all radiative forcing agents.
CO2isLife said: so if you had any idea about the physics of the CO2 molecule, you would understand that a linear trend, which is exactly what LINEST is, proves CO2 ISNT the cause of the warming because CO2 isnt lineraly related to ΔW/M^2.
Absolutely not. These linear regression trends on individual stations say nothing either way as to what is the cause of that trend. Nevermind that it says nothing at all regarding the trend of the global mean temperature or its causes either. Attribution of causes is a completely different topic that can only be assessed with vastly more data.
Your number 1 mistake here is your unbridled and irrational insistence that CO2 and only CO2 is the sole driver of all temperatures changes regardless of the spatial and temporal scales being analyzed. I have to be honest…this insistence by you and you alone is beyond baffling. I literally know of no one else that even remotely thinks this hypothesis has merit.
b,
Radiative forcing agents?
Say again? More obscurity – no doubt you will trot out bizarre jargon about energy imbalances, and other similar rubbish.
Learn some physics.
By the way, you might like to learn the definition of hypothesis.
What phenomenon are you trying to explain?
bdgwx: Your number 1 mistake here is your unbridled and irrational insistence that CO2 and only CO2 is the sole driver of all temperatures changes regardless of the spatial and temporal scales being analyzed.
If CO2 isn’t the cause, why does anyone care? None of this nonsense existed when climate change was considered natural…which it is. Climate Science wasn’t even a major when I went to college. If you want to get research funding you basically have to tie the conclusion to CO2 being the cause. That isn’t by accident. The only reason this nonsense exists is because the Tobacco money has run out the the socialists need another host. What is the greatest host of all time? Energy. Something people can’t do without and have to buy regardless of the tax. That is what this is all about and that is why they tax carbon, have carbon offests, try to sequester CO2, stamp out the Coal and gas industry. If CO2 isn’t being blamed as the cause, why did we just put 12,000 pipeline workers out of work, and why in the world would Texas build wind and solar farms when oil and coal are so cheap?
If CO2 isn’t the cause, why are we focusing everything in replacing fossil fuels?
CO2isLife,
CO2 and other GHGs are a cause of the planetary energy imbalance and cumulative energy uptake over the last 140 years and especially the last 60. And they happen to be a significant contributor accounting for well over 100% of the uptake. Note that it is over 100% because aerosols provide a negative radiative force that partially offsets the RF of GHGs.
This is a planetary scale phenomenon that can only be assessed by measuring the global scale heat uptake in the land, cryosphere, hydrosphere, and atmosphere. The excess energy/heat gets distributed throughout the entire system with various heat transfer processes constantly moving the energy/heat around. You simply cannot assess the global scale changes in the climate system by myopically focusing on small spatial and temporal elements of the system. The entire troposphere (not just the surface) stores only 1% of the excess heat. The cryosphere takes up 4%, land 6%, and ocean 89%.
Read though this publication.
https://essd.copernicus.org/articles/12/2013/2020/essd-12-2013-2020.pdf
Ask questions if there is something you do not understand.
If you regard a linear regression method like Pearson’s r as inadequate, why not use Spearman’s rank correalation p?
This isn’t rocket science. People claim CO2 traps heat. If a temperature in the last decade is below that of 100 years ago, there is no way CO2 trapped any heat in the atmosphere. You don’t need a regression to know that. The atmosphere isn’t a battery. It doesn’t store heat over time. If it cooled to 10 degrees, and then warmed to 20 degrees, extra energy had to be added, and CO2 doesn’t add extra energy. All it can do is slow heating by milliseconds. Radiation rapidly moves energy out of the system. In fact the CO2 signature can’t even be identified until you are up about 3km when water vapor starts to precipitate out.
CO2, you have the wrong analogy. GHGs don’t “trap heat” the way a battery “traps electrical energy” and can store it for later. GHGs “trap heat” the way extra insulation on your house “traps heat” during the winter. The way that closing a window “traps heat”.
C,
Entropic Man is not terribly bright. He refuses to acknowledge that all the heat of the day escapes to outer space at night.
He refuses to believe that the seasons exist, and all the heat of the summer is nowhere to be found in winter.
For all I know, he thinks the Earth has not cooled since it was a complete molten mass.
He might be silly enough to believe that Gavin Schmidt is a climate scientist, or that Michael Mann is a Nobel laureate!
Oh well, the rich fantasy world of the CO2 alarmist!
Tim, greenhouse gases don’t trap heat like a window because windows don’t rapidly diffuse or convect.
Analogies aren’t science yet science rides on an analogy for AGW.
If greenhouse gases worked like a window then greenhouse experiments would not fail using IR transparent comparisons to IR Opaque.
so we are at the crossroads of one lie crossing another. Greenhouse gases both don’t and do work like greenhouses.
Bill says: “Analogies aren’t science… “
I absolutely agree. Analogies are simply way to make ideas intuitive to beginners.
“greenhouse gases don’t trap heat like a window because windows don’t rapidly diffuse or convect.”
You misinterpret the analogy I was making. (And CO2 misinterprets the analogy in a *different* way.) Since no analogy is prefect, it is often important to explain the analogy, or different people will take away different conclusions than were intended. The analogy is only SORT OF like closing a window.
A house in winter (with a furnace always running) can lose energy via many paths (like thru the walls or through the roof or through cracks around a door or through open windows). Like the earth’s surface can lose energy via many paths (like convection or evaporation or radiation to space. That is the analogy.
Limiting one specific path of heat loss like closing one window reduces the heat loss for a house and will make the house warmer (again, with a furnace running). Similar limiting one specific path for heat loss like some specific wavelengths of radiation leaving to space will reduce heat lose for the earth and lead to warmer temperatures.
The analogy here is that of limiting a path for heat loss. The analogy is not specifically stopping convection or conduction like a window. Just limiting *some* form of heat transfer (some wavelengths of IR radiation).
“… yet science rides on an analogy for AGW.”
No. The analogies come FROM the theory, as a way to make the ideas intuitive to non-experts. The analogy do not create the theories. Scientists do not look to “greenhouses” or “blankets” or “traps” as the basis for the theories.
Well here is the bottom line on Lampasas, TX. 1) its primarily rural. 2) population has fluctuated over time both lower and higher than present in the distant past. 3) two temperature records a) observations; b) desktop observation adjustment record. Since absolutely zero documentation appears to be available on the sites reference a seasoned investigator would give equal weight to both records.
Results indicate a slight cooling trend without further informative input.
All that statistics mumbo jumbo means nothing. There is nothing here that can’t be easily seen with an eye.
bill hunter, from your comments, they can be applied to every station, so what you are saying is that none of this data can be trusted. I don’t agree, the more you look into this garbage, garbage used by NASA to perpetrate a fraud, the more a joke the conclusions reached using this data become. NASA just landed a rover on Mars. I assure you, none of those real scientists would support what the NASA CLimate Scientists are doing. NASA GISS is an embarrassment to NASA, and your comments prove that.
Can you provide another dataset that feel is not garbage that publishes a global mean surface temperature with uncertainty analysis that you want us to review?
b,
Why would anybody think that the opinions of you and your ilk are anything other than a cause for laughter?
How about reviewing * Atmospheric CO2: Principal Control Knob Governing Earth’s Temperature *?
One of the more ludicrous claims is * Without the radiative forcing supplied by CO2 and the other noncondensing greenhouse gases, the terrestrial greenhouse would collapse, plunging the global climate into an icebound Earth state. *!
Review away. Give all the rational commenters a good laugh.
Oooooooh!
The little barking ankle biter is back again!
Il ne nous manque plus que le génie Robertson.
Espérons qu'il sera très bientôt parmi nous!
Ted Cruz’ poodle?
Gee I didn’t know Ted Cruz spoke French too!
b,
You do realise that correlation is not causation?
Seems not.
Thermometers measure degrees of hotness, not concentrations of CO2.
Temperatures are measured in degrees, not W/m2, but the usual run of alarmist idiots live in denial.
bdgwx: Can you provide another dataset that feel is not garbage that publishes a global mean surface temperature with uncertainty analysis that you want us to review?
I’ve done that nteenth million times. That is why I keep posting links to cold and dry desert locations. Identify locations that are shielded from the UHI and Water Vapor and you get a natural control for isolating the impact of CO2 on Temperatures.
This is my favorite:
Alice Springs (23.8S, 133.88E) ID:501943260000
https://data.giss.nasa.gov/cgi-bin/gistemp/stdata_show_v3.cgi?id=501943260000&dt=1&ds=5
Alice Springs is not the same thing as the entire globe. Do we really need to hash this out too?
From 1889 to 2012 Lampasas USC00415018 warmed 0.65C +/- 0.21. The station is on its 7th relocation. The TOB switched to 07:00 in 1946 and then to 06:30 in 2000. It switched from an unknown instrument type to MMTS in 1986.
So how do you know any of those changes had an effect on the temperature readings?
GHCN use the pairwise homogenization algorithm. The publications regarding GHCN and PHA are too numerous to post here so I’ll just post the overarching GHCNv4 publication. I recommend reading this and then taking a deeper dive into PHA itself.
https://journals.ametsoc.org/view/journals/clim/31/24/jcli-d-18-0094.1.xml
We know these changes had a significant impact especially between 1945 and 2000 because the adj-homogenized data differs significantly from unadjusted. PHA is what runs to identify, quantify, and correct inconsistencies in station records.
You mean assumed inconsistencies bdgwx. You obviously have no experience in either intelligently filling out a government form or give consideration to what a station manager might do to provide the most correct answer on the form.
I’m not sure I understand your point. No one is assuming anything about the existence or nonexistence of inconsistencies. That’s why PHA applied. It’s job is to identify and correct inconsistencies if they exist. If they don’t then that’s great.
LOL!
bdgwx I already asked you why you thought all these adjustments are merited. Near as I can tell initial adjustments was a process of weeding down stations to a much smaller number tossing out any hot station on the basis of finding some inconsistency somewhere in the data. (more on some inconsistency later)
Now after the adjustment a great deal of skeptic scorn was thrown in the direction of the effort for few stations dominated by UHI. Indeed I heard all of California had something like 5 to 8 stations left (though I didn’t verify).
Now this new round of homogenizing adjustments is adding stations back in after, not surprisingly they have been corrected and compiled in a way to mostly not affect the existing trend.
Homogenization presumably is where you might use the remaining UHI affected stations to correct via interpolation with the tossed out stations so now they can claim a lot of stations.
So what you have is a lot of guys completely in denial of UHI making adjustments to temperature records accordingly.
Roy’s post here highlights that issue. So as a professional auditor what do I have to say. Well one is you need to learn to walk before you run. We have seen and you are aware of Berkeley Earth falling on its face on obviously ignorantly selected to support the case for zero UHI. I mean you really need to identify where UHI might exist. It has long been recognized as a temperature affect associated with population. I have never seen it characterized as existing as a trend in a heavily populated area with a steady population. There it has always been characterized as simply being warmer but not trending faster. (up to 2C warmer).
So Berkeley Earth comes along an picks areas for examination without population trends and instead just selects the most densely populated areas (which Roy’s analysis in figure 1 suggests doesn’t have population trends).
Now since the whole process of homogenization, station adjustment, station weeding, correction, and reintroduction has all been done with experts that no nothing about UHI; it seems to be crying for a whole new start in developing a surface station record from the raw data. . . .but of course only after you get those people to come to a recognition that the UHI matter needs to be addressed in a satisfactory manner first.
So my comments are in regards to spinning our wheels on adjusting station records to quickly assemble a temperature record to do something that the samples being nonrepresentative and never designed to do.
Understand bdgwx I am not favoring an outcome. I am leaning towards a lower trend for the surface records due to ignorance and I can accept the possibility that the original RSS and UAH records possibly could have understated it. But what I do know from my own experience in dealing with science issues at policy levels is that you frequently really do see a lot of real consensus and you don’t have to depend upon a phony consensus sold as propaganda to a gullible population.
So the bottom line is I have to laugh at this homogenization stuff. Ignorance has a tendency to march on like lemmings over a cliff.
Typical hunter blah blah, without any real background.
No source.
Guessing, ranting, distorting, discrediting, denigrating.
J.-P. D.
As usual Bindidon you are so disconnected from all this you can’t even point out which assertion you disagree with, much less why.
” There is nothing here that cant be easily seen with an eye. ”
It should not be so difficult to keep as near to the data as possible, bdgwx has shown how to do:
https://tinyurl.com/22gxnx9e
no he doesn’t know how to do it Bindidon.
bdgwx has shown a ability to take one cherry picked viewpoint and crank out some statistics from it an offer it up as an answer. . . .and all he has done is become a mouth piece for the guy that picked what they wanted him to look at.
A better way is with the eye after you have clicked on the non-highlighted unadjusted numbers, which conveniently still show up lighter than what they want you to look at but at least its good enough to see a much better picture of a range of uncertainty. When you do that its an obvious cooling trend and all bdgwx could come up with is some mumbo jumbo about a warming trend.
Now I am certainly open to more information if anybody wants to provide any but I suspect the answer there is like Phil Jones said in his email to fellow conspirators that he would rather destroy the raw data than give it to the likes of Steve McIntyre because he was sure Steve would find something wrong with it.
I’ll remind you that I’m not the one selecting these sites.
No. Trying to eyeball a trend from noisy data is not going to be better than the purely mathematical and repeatable approach of linear regression.
No. Using unadjusted data is unethical at best and fraudulent at worst if you present conclusions without telling your audience about known errors and biases that contaminate those conclusions.
bdgwx says:
”No. Trying to eyeball a trend from noisy data is not going to be better than the purely mathematical and repeatable approach of linear regression.”
Who said ‘better’? The point I am making is the mathematics doesn’t add anything important to public debate. You can recognize that right?
Even CO2isLife seems to have learned that the Moon rotates about its center of mass.
Luckily, people à la hunter, Swenson, Robertson, ClintR, DREMT and a few others never had, don’t and will never have anything to do in any lunar mission.
Imagine them working in a project like Chang’e 5, where it is absolutely vital to understand that at its equator, Moon rotates with 4.6 meter/second!
Unimaginable.
J.-P. D.
Imagine Bindidon still writing comments which indicate he doesn’t understand the “Non-Spinner” position. Still!
He is also so ignorant about navigation and the non-spinner position that he thinks his comment has meaning.
And worse he is so stupid about what he thinks he knows he doesn’t hold out at all flapping his jaws about something he knows nothing about. . . .but then again there is a whole crew of that ilk in here for the sole purpose of trolling Roy.
Where is ren?
He promised us a harsh winter in Europe, 30 cm snow in Berlin, etc etc.
We had 15 cm snow, now all away.
Central Germany had more snow, due to the collision of two huge wind fronts just above it: cold, sometimes glacial from NNE (Arctic import), versus mild, sometimes really warm from SSW (Africa import).
https://www.wetteronline.de/?daytime=day&diagram=true&fcdatstr=20210220&iid=euro&pid=p_city_local&sid=Pictogram
Even in Greece, where people experienced -10 C here and there (what is very cold for them), the situation is back to normal.
https://www.wetteronline.de/?daytime=day&diagram=true&fcdatstr=20210220&iid=GR&pid=p_city_local&sid=Pictogram
I’m happy to have it warm again, he he.
But, what’s the matter with your forecasts, ren?
J.-P. D.
Binny,
How are your own forecasts going? Have you worked out how to forecast future climate states?
The IPCC says it is not possible to forecast future climate states, but of course you know better, dont you?
Maybe you could just pretend that CO2 causes heating, and project past temperature trends into the future. If that seems silly, you could just threaten anyone who disagrees, with extermination or lingering death by incurable disease!
You really are a strange delusional chappie, eh Binny.
Flynn
I have always pretended that putting CO2 between the Sun and a thermometer increases the temperature indicated by the thermometer.
How could it be possible to doubt about such definitive evidence?
Binny,
Who is Flynn? Why are you fixated on him (or her)?
As to your last somewhat incoherent sentence – maybe you need to express yourself in another language. Have you considered becoming fluent in English?
The Republican state government of Texas refused to believe the warnings that climate change could bring extreme cold as well as extreme heat.
They are now stuck in -10C temperatures with power and water systems that dont work.
Vote Republican!
If something is understood, it can be modeled. That is what defines truly “settled science.”
Let’s Review 50 Years Of Dire Climate Forecasts And What Actually Happened
https://www.zerohedge.com/political/lets-review-50-years-dire-climate-forecasts-and-what-actually-happened
Only fools believe the predictions of climate scientists. They are literally the laughing stock of the academic community. The only reason it exists at all is because they have the media and liberal academia covering for them, and the government funding them.
Imagine a lawyer using those articles in a court of law. The jury would be laughing their butts off by the end of the trial. The only way Climate Science survives is by avoiding cross-examination.
Tim Folkerts says:
February 19, 2021 at 10:48 PM
CO2, you have the wrong analogy. GHGs dont trap heat the way a battery traps electrical energy and can store it for later. GHGs trap heat the way extra insulation on your house traps heat during the winter. The way that closing a window traps heat.
Actually, that isn’t exactly correct. The one and only defined mechanism by which CO2 can affect climate change is through the GHG Effect. CO2’s contribution to the GHG Effect is to impede the exit of LWIR between 13 and 15µ from the atmosphere. Studies I’ve linked to this site demonstrate that CO2 slows the exist of LWIR from the atmosphere by a few milliseconds, not hundreds of years, milliseconds. To complicate this issue, LWIR of peak 15µ has a black body temperature of -80C°, so the GHG contribution is to prevent the atmosphere from falling below -80C°, it doesn’t actually warm anything. CO2 thermalizes LWIR between 13 and 15µ to a temperature of -80C°. That can be seen using Modtran and how the Stratosphere cools to -80C°, and not much lower.
Oooops, that should say 13 to 18µ peak 15µ LWIR. That is the quantum physics supporting the CO2 GHG Effect.
“To complicate this issue, LWIR of peak 15 has a black body temperature of -80C”
Once again, this is COMPLETELY WRONG! BACKWARDS!
Turn that around and you get a true statement. A black body with a temperature of -80C as a peak of 15.
But ….
* A non-black with a temperature of -80C could have a peak at 15 … or at 14, or at 10, or at 20. Or pretty much anywhere.
* A non-black with a temperature of -80C … or -100C or -40C or +80C could have a peak at 15.
You simply are not understanding the physics here at all. The location of the peak for a non-blackbody tells you (almost) nothing about the temperature. It instead tells you about the quantum mechanics of the materials involved.
All conservatives can do is say “we told you so,” but that is no consolation. Conservatives hate to see Progressives lead this country to ruin.
Royce Pierce told Newsweek he owes electric company, Griddy, $8,162.73 for his electricity usage this month. He said that’s a massive increase from his usual $387 bill.
https://twitter.com/katandtonyT/status/1362460057447849987?s=20
Maybe AOC can crowdsource money to pay Texas’ electric bill. BTW, why don’t I hear Texas crying for a Federal Bailout? And why isn’t Biden falling all over himself to throw money at Texas for making idiotic decisions?
This is what you get when you allow demand pricing.
Typical American attitude. A system designed to favour the rich, who then tell the rest “F*ck you, Jack. I’m all right.”
Simple Question ET, what would the cost of electricity be in Texas if they had relied on safe, clean, reliable Coal and Nuclear like China is doing?
The one and only reason Texas is in the mess they are in is because they trusted people like you. Now all Conservatives can do is say “I told you so.” Right now Biden is helping Iran get a nuclear bomb. When they eventually get it, and start WWIII, saving “I told you so” won’t help much. Millions will die. Right now Biden is tolerating China putting Uygers and Fulong Gong” members in labor and concentration camps. Eugenics was supported by Progressive “Scientists.” Where do you think this is all headed?
Coal is more expensive than anything except nuclear.
Their gas pipes froze up and their nuclear plant shut down because they were too tight to invest in heaters for their pumps.
The underlying problem is that the Texas state government allowed their utilities to be run for maximum profit, with minimum investment. This left them with no margin for high loads and fragile equipment which couldn’t cope with cold weather.
Northern Ireland had -10C night temperatures a few weeks ago for similar reasons, a very Southerly Rossby wave, and everything kept working.
Why can’t Texas manage?
Entropic man
I will agree that Texas has problems with greed. Someone wants to pocket all the money rather than make sure they have reliable power.
Your point on the cost for power would not matter. If I needed power I would rather pay a little more than freeze or overheat. Wind, as it is now being developed with no storage capability, is most unreliable. It would not matter if it cost a dollar a megawatt hour if it does not provide full service.
Whoever is in charge of the power plants needs to maintain them like airlines maintain jet planes. You don’t want a jet to fail when needed most (in the air). Texas can ask their counterparts in colder climates how to maintain equipment in colder temperatures.
Here is an intelligent comment from WUWT. If demonstrates the problem with both wind and gas. Storage capacity.
From WUWT comment: “What happened is that there was a lack of storage for both renewables and gas. Wind was offline due a lack of wind and and lots of blade icing. Gas went offline due to everyone turning on their gas heaters, so no gas was available for the power stations. As far as I can see the Texas electrical mix totals went something like this for the 15th Feb
Wind . 30 gw installed 10 gw expected 5 gw online .
Solar 2 gw installed 0.5 gw expected 0 gw online (day only)
Gas … 35 gw installed 35 gw expected 15 gw online
Coal 15 gw installed 15 gw expected 15 gw online
Nuclear 11 gw installed 11 gw expected 10 gw online
(Note: a total of 25 gw dropped off the grid during the freeze.)
So wind and solar COULD have alleviated this situation, if they were remotely reliable. But they are not reliable, so Texans froze.
Note that coal and nuclear were doing fine, because they have sufficient fuel storage facilities. While gas does not have so much storage, as it is expensive. And domestic gas usage went through the roof, depleting supplies to the power stations. But if gas had any incentive to invest in storage, it could. Meanwhile wind and solar make no effort whatsoever to construct backup storage systems, because they are hugely expensive and would make them totally uneconomic.”
Norman
” Gas went offline due to everyone turning on their gas heaters, so no gas was available for the power stations. ”
This is a bad joke, Norman.
Everyone knows in between (Tx’s gov included) that gas supply went down due to freezing wells and to the higher humidity of gas coming from hydraulic fracturing compared with ‘natural’ gas.
And that is the reason why so many people were freezing in their houses.
Please never trust in WUWT head/guest posts dealing with energy supply.
What is exceptionally correct is the lack of supply by windmills.
In Germany, winter normally is the best time for wind energy. But the amount for 2021 was far worse than 2020, as you can see here (in TWh):
Year 2021 2020 (amounts for Jan 1 – Feb 19)
Total 20 vs 29
Onsh 16 vs 24
Offsh 4 vs 5
J.-P. D.
” Why cant Texas manage? ”
Attitudes like this don’t help.
https://www.mrt.com/news/local/article/Ex-Texas-mayor-says-residents-should-fend-for-15957735.php
“In his typo-ridden post made Tuesday morning, Tim Boyd wrote, Only the strong will survive and the weak will parish. He also said he was sick and tired of people looking for handouts and that the current situation is sadly a product of a socialist government.
Texas has had a Republican governer since 1996 and a Republican legislature since 2002. What socialist government?
Entropic man
Since a few years, anybody ‘left’ to Trump and his lovers is a socialist, or better: a leftist.
J.-P. D.
Bindidon
The purpose of my copy of a WUWT post was the major point. I did not research if heating use of natural gas created a shortage so I can’t verify that one. But that is not the point. His point was that wind has no storage capacity. It is a stupid thought process just to build a bunch of windmills and not have any means of power storage.
https://freerepublic.com/focus/f-news/3935690/posts?page=4
The second graph in this link clearly demonstrates the point. Wind can easily be the reason for the blackouts and loss of power. On Feb 8 wind was generating almost 20,000 Megawatts of power and the natural gas plants were very low. Then when needed (a capacity of 30,000 Megawatts) the wind was gone. Yes all the other sources of power went down but NONE went down like wind. If Texas had 30,000 extra capacity electrical production besides wind they would not have had a problem even with some power going off line. Nothing goes off-line more than wind which can give you 30,000 megawatts one day and then just a few thousand a week later. It is not intelligent to continue investment in wind energy without investing in some form of electrical storage. Wind alone is terribly unreliable when you need it most.
With weather patterns the super cold and super hot are a product of a stubborn high pressure system. These do not produce winds within the extended high pressure. Very high or low temperatures with these systems and no wind. Many people know this but they just keep spending more on wind knowing it is not there when needed. This is very stupid thought process.
Bindidon
Agreed.
By world standards Biden and the Democrats are well to the Right of centre and the Republicans are even further Right.
I stopped laughing at their distorted view of the world years ago, but it can still raise a smile.
Dr. Spencer, bdgwx may have provided you a way to expose the Climate Change Hoax in an undeniable way that anyone with basic math skills could understand.
bdgwx uses regression analysis and cherry-picking time periods to identify a positive slope to support his preconceived conclusions. That is how typical climate science works. Torture the data until it gives you the answer you want. Cherry-pick, misrepresent, and distort the truth to make your case.
How you can use that data to tell the truth:
1) Replace the Average with Median, which reduces the skewing caused by outliers and gives a more true representation of what can be expected
2) Convert the data from a time series to a distribution, and show where the current or recent data is to the median and the mean
3) bdgws loves to use the recent spike in temperatures to distort the regression, to address that, identify what % of the data falls below that temperature, and compare it to earlier periods in the time series. That way you can show that the recent spike was an outlier and represents just a small % of the period, and that earlier periods were at that level as long as well
4) bdwgx loves to distort regressions and their interpretations, so use his deceptive tactics to understand how to present the data in an honest manner, one that accurately defines a trend the way they are intended to be interpreted.
5) Rolling Medians or rolling averages
6) Rollings regressions to show how bggwx’s coefficients swing from + to – depending on the time period
The R-Sqr is the explainatory power of a regression. The regressions bdgwx uses have very very very low R-Squareds, so you can torture the data to get any answer you want. To refute such dishonesty, you have to explore different ways to present the data and desciles, medians, distributions, and ranges is how you do it.
CO2isLife said: bdgwx uses regression analysis and cherry-picking time periods to identify a positive slope to support his preconceived conclusions.
I’m not the one selecting the sites and time periods. That is your doing. And I’ve warned you repeated about it.
CO2isLife said: Replace the Average with Median, which reduces the skewing caused by outliers and gives a more true representation of what can be expected
Sure. We could use Tukey’s biweight mean or similar approach, but I don’t think you’re going to get the result you’re looking for.
CO2isLife said: bdgws loves to use the recent spike in temperatures to distort the regression,
I have done no such thing. All I do is plug in ALL of the values and let LINEST do its work. In fact, if anything by starting the regressions at high and ending at lows as you’ve requested me to do we are actually slightly distorting the regression in the negative direction.
CO2isLife said: The R-Sqr is the explainatory power of a regression.
Sure. Specifically it is how close the data clusters near the regression. Low noise high R^2. High noise low R^2. But, as I’ve said repeatedly, that is different than the standard error of the slope of the regression. These are two different metrics that are trying to conflate.
CO2isLife said: The regressions bdgwx uses have very very very low R-Squareds
Given the noise in the data I actually thought some of them were quite high. Regardless I don’t think you’re going to get a lot of support with your argument since the many of these trends have slopes that are several multiples of the standard error. Even Dr. Spencer’s R^2 in this very post at 0.096 is quite a bit lower than the R^2 of most of the sites you had me look at.
Bottom line, if there is a true up-trend in the data the early data should fall 1 or more standard deviations BELOW the mean, and the current data should be falling 1 or more standard deviations ABOVE the mean. Thinking through that however, a great way to represent a trend would to graph the T-Score/Z-Score over a time series. A trend by definition will have the recent data above the median and the distant data will have to be below the mean. The mid-point of the time series should fall very close to the median and/or mean.
Get a Grad Student to convert the Temp Data to T-Scores,and map it out on a time series. That is the best way to demonstrate an uptrend.That way you can standardize all the graphs and create an apples to apples way to compare different stations.
https://www.statisticshowto.com/wp-content/uploads/2013/09/The_Normal_Distribution.svg_1.png
CO2isLife said: Bottom line, if there is a true up-trend in the data the early data should fall 1 or more standard deviations BELOW the mean, and the current data should be falling 1 or more standard deviations ABOVE the mean.
Patently False. If there is a true up-trend in the data then the slope of the linear regression trend will be significantly higher than the standard error of that trend. For UAH TLT the trend is +0.1375C/decade +/- 0.0066 with an R^2 of 0.46. And here are the z-scores for different warming trends.
+0.1375C/decade : 0
+0.1309C/decade : -1
+0.1243C/decade : -2
+0.1177C/decade : -3
+0.1111C/decade : -4
+0.1045C/decade : -5
What this means is that we have 99.9% confidence that the actual warning rate is at least +0.1177C/decade. And with 99.9999% confidence we know the rate must be at least +0.1045C/decade. All of that with an R^2 of “only” 0.46.
BTW…the UAH TLT mean is -0.08 with an SD of 0.25. The 13m centered means at the beginning and end are still > 1 SD below and above the mean. Just saying…
Here is an example of how to lie with a regression. If I play with the data of this chart I’ll be able to find a positive slope to make my case that temperatures are warming at the Toledo Blade Site. It of course would be a lie, but I could torture the data to support my lie.
Toledo Blade (41.6500N, 83.5333W) ID:USC00338366
https://data.giss.nasa.gov/cgi-bin/gistemp/stdata_show_v4.cgi?id=USC00338366&ds=14&dt=1
This is what a true uptrend looks like. It is a continual series of higher highs and higher lows, no ifs and or buts. The original data is far far far below the current data. If I run a regression it will have a statistically significant Beta/Slope and a very very very high R-Squared. You will find no temperature graphics that produce the regression numbers like CO2 does. So when bdgwx posts regression stats, just remember what a true up-trend looks like, and trust that your eyes aren’t lying to you.
Atmosspheric CO2
https://assets.show.earth/widget-co2/kc-monthly-0600.png
CO2isLife said: Here is an example of how to lie with a regression. If I play with the data of this chart Ill be able to find a positive slope to make my case that temperatures are warming at the Toledo Blade Site.
The trend is actually 0.000C/decade +/- 0.020. The slope has no statistically significant slant either positive or negative. We say that the slope is consistent with a flat trend.
bdgwx, run your regression stats on the CO2 data. You will discover that it has a very very very high R-Squared. You will find that the early data is way below the current data. You will find that it has a series of higher highs and higher lows. You will find that the current data is in the right tail and the early data is in the left tail. That is how you define an uptrend, not with a regression that has an R-Squared of 0.00.
BTW, this is a serious question. How are you determining the statistical significance of the slope? What time period are you using to calculate the standard deviation of the slope? How did you calculate the standard deviation of the slope to determine that it is statistically different from 0.00?
CO2isLife said: How are you determining the statistical significance of the slope?
Most people consider a result to be statistically significant if it meets the 2-sigma or 95% confidence intervals. Linear regressions provide a standard error for the slope term. We subtract off 2 SD’s from the slope and say that we have 97.8% confidence that the slope is at least that amount.
CO2isLife said: What time period are you using to calculate the standard deviation of the slope?
I’m using whatever time period you tell me. If you haven’t specified than I do the entire population. So for Toledo Blade it is 1880 to 1996 or 117 years. It is also important to note that I do not ever cherry-pick years from the population. I run LINEST with every sample in the population regardless if it is a record low or high year. Literally every value is plugged in.
CO2isLife said: How did you calculate the standard deviation of the slope to determine that it is statistically different from 0.00?
The linear regression technique provides this value for you.
https://en.wikipedia.org/wiki/Simple_linear_regression
Excel’s LINEST function drops this in R2C1 of the output.
Some people seem to lack the necessary experience in puncto ‘manipulation with charts’.
A little help?
https://www.woodfortrees.org/graph/esrl-co2/scale:0.008/offset:-2.7/plot/hadsst3gl/from:1958/mean:36
Is that not beautiful?
To make things clear: I use HadSST3 because according to one of these great Richard geniuses posting here, this time series perfectly fits UAH…
J.-P. D.
Thanks Bindidion, that makes my case perfectly. CO2 and Temperatures aren’t linearly related, yet you are trying to demonstrate a linear relationship. If you replace ΔCO2 with ΔLog(CO2) or ΔW/^2 you would understand why your graph doesn’t implicate CO2.
It also shows a very linear uptrend in temperatures which I have proven simply doesn’t exist, and am now up to 340 stations that show no long-term uptrend in temperatures, and in fact, many show a down trend.
Toledo Blade (41.6500N, 83.5333W) ID:USC00338366
https://data.giss.nasa.gov/cgi-bin/gistemp/stdata_show_v4.cgi?id=USC00338366&ds=14&dt=1
Your analysis fails for multiple reasons:
1) It demonstrates a linear relationship with CO2 and Temperatures
2) It doesn’t relate Temperature to ΔW/M^2 or Δlog(CO2)
3) The temperature data isn’t supported by station data when controlled for CO2 and the UHI Effect
4) Your relationship totally breaks down when applied to the Holocene as a whole, you simply cherry pick a very short period of time to make your case
5) Your CO2 shows very little and consistent variability, your temperature does not
6) Your R-Squared will still be very low
7) Your temperature data doesn’t match UAH Satellite Data
8) You obviously didn’t get the memo from bdgwx, he is claiming that the CO2 drives temperature model is a complete myth
CO2isLife
You seem to be a kind of German elementary school teacher.
Only a German teacher wouldn’t understand that my graph was pure irony.
*
You don’t need to teach me about how CO2 relates to temperatures.
*
Your blah blah about ‘station data when controlled for CO2 and the UHI Effect’ and R^2 is incredibly boring and above all does not explain anything concerning CO2’s effect.
*
You don’t seem to understand how easy it is to make things matching other things:
https://www.woodfortrees.org/graph/esrl-co2/scale:0.008/offset:-2.7/plot/hadsst3gl/from:1958/mean:12/plot/uah6-land/mean:12/offset:0.35/plot/hadsst3gl/from:1979/trend/plot/uah6/trend/offset:0.35
*
I don’t know what drives your endless, psychotic, urgent need to permanently repeat the same, boring blah blah on this blog.
Do you suffer from the urge to dominate other commenters?
Have you been banned recently out of another blog?
J.-P. D.
Binny,
As you say, it is easy to make things matching other things. CO2 alarmists do it all the time.
These are the sorts of people who warm themselves in front of a fire, and convince themselves that the CO2 from the fire creates the heat!
They have created a graph which shows that more CO2 correlates nicely with more heat!
Dimwits, just like yourself.
Superdimwit Flynn
You are, as usual, blind on one eye.
And here you even manage to show us how stubborn you are:
” These are the sorts of people who warm themselves in front of a fire, and convince themselves that the CO2 from the fire creates the heat! ”
I can’t recall anybody writing such dumb stuff – even your friends-in-denial ClintR and Robertson don’t go down that low mentally, and that’s saying something!
Yeah, Flynn! Intelligent sarcasm and the tendency towards trivial sayings are not good friends.
J.-P. D.
Nice try Bindideon, but you can’t get away that easy. You have posted all the evidence I needed.
1) You demonstrated that CO2 and Temperature is the focus of Climate Change, which is denied by bdgwx once I demonstrated the absurdity of his claims
2) You posted a graphic that make is undeniably clear what an uptrend looks like, as opposed to the graphics that bdgwx tortures to identify a LINEST + slope, everyone understand that your CO2 and Temperature charts displays two clear uptrends, whereas the ones bdgwx claims are uptrends look nothing like the graphics you posted. No one denies the uptrends in your graphic
3) You demonstrated that the published global temperature trend is 100% inconsistent with the now 340 locations that I’ve identified that show no warming trend. In fact, I am having trouble finding any sites with a clear uptrend to them
Once again, thanks for posting all the evidence I needed to refute both you and bdgwx. You and bdgwx need to make sure you have your stories straight.
https://www.woodfortrees.org/graph/esrl-co2/scale:0.008/offset:-2.7/plot/hadsst3gl/from:1958/mean:36
Please, CO2isLife! Please, please, please.
Couldn’t you manage to stop your trivial stuff?
Why don’t you have the humility and the courage to visit the people who do the work you so superficially discredit, denigrate and distort, and REALLY begin to learn what they do?
Why do you write all this unscientific nonsense while comfortably and cowardly keeping hidden behind a pseudonym?
bdgwx and I we use pseudonyms too; but as opposed to you, we don’t discredit and denigrate the work of other people.
J.-P. D.
1) I made no such claim.
2) You picked those graphs. Don’t try to pin your cherry-picking on me. I’ve been telling you over and over again that you need to look at the global mean temperature and oceanic heat content. And the reason why you able to more easily see the uptrend in the global SST and CO2 graph is because both have far less noise than the 2m temperature at a single site.
3) First…We know for a fact that several of your 340 cherry-picked sites actually do show warming with some of them far exceeded the global rate. Second…340 sites is only 1% of the GCHN-M repository and because those 340 sites are included in spatially averaged global temperature measurements that necessarily makes them consistent with global mean surface temperatures. And since SSTs are also an input into the global mean surface temperature it only makes since that they too are consistent with it.
A very good research work would imho be to find out the reasons for
– the difference between the effect of the respective polar vortex weakenings above Northern America and Europe;
– a possible increase of these effects in Northern America.
John Christy’s recent paper about extreme weather patterns in CONUS could hardly have been better challenged than by what is happening in Texas these days.
Any client for a PhD in Huntsville, AL?
J.-P. D.
bdgwx says:
February 20, 2021 at 4:09 PM
1) I made no such claim.
Which is it? CO2 does or does not cause climate change and is the most significant factor causing climate change? State your position.
2) You picked those graphs. Don’t try to pin your cherry-picking on me. I’ve been telling you over and over again that you need to look at the global mean temperature and oceanic heat content. And the reason why you able to more easily see the uptrend in the global SST and CO2 graph is because both have far less noise than the 2m temperature at a single site.
Not a single graph I identified shows an untrend anywhere close to the composite global temperature. None. The global mean temperature is a composite of all other stations is it not? I challenge you to find any stations that even come close to the uptrend identified in the composite. Find a single one. I challenge you. I’ve keep finding countless ones that show no trend and have yet to find one that show a clear trend anywhere near that global composite. BTW, land and sea temperature show widely different slopes, the difference of which can’t be caused by CO2
3) First…We know for a fact that several of your 340 cherry-picked sites actually do show warming with some of them far exceeded the global rate. Second…340 sites is only 1% of the GCHN-M repository and because those 340 sites are included in spatially averaged global temperature measurements that necessarily makes them consistent with global mean surface temperatures. And since SSTs are also an input into the global mean surface temperature it only makes since that they too are consistent with it.
None of them show warming in an uptrend, none. Using Bindidion’s example of a real uptrend as a standard, none of the graphics I posted come close to an uptrend. None, a LINEST positive slope does not represent an uptrend is the R-Squared is 0.00. Every stat book ever published will agree with me on that. BTW, mixing and matching completely different data sources into a single composite does nothing but increase the error you will get in the final version. Any real science would identify the most accurate way to measure and use it. Mixing garbage with accurate data still leaves you with garbage. Once again, how does CO2 cause a greater slope over land than sea? It can’t.
1. CO2 is a contributing factor to the increase in the global mean temperature and oceanic heat content. That is the position supported by the abundance of evidence. I accept it.
2. False. The counter example I will use is Vilinius LH000026730. From 1880 to 2020 it exhibited a warming rate of +0.162C/decade +/- 0.020. The global temperature over that period is +0.080C/decade +/- 0.003. Vilinius was on your list.
3. Same as #2.
I forgot to include my global mean temperature reference.
http://berkeleyearth.lbl.gov/auto/Global/Land_and_Ocean_summary.txt
Vilnius (54.6331N, 25.1000E) ID:LH000026730
https://data.giss.nasa.gov/cgi-bin/gistemp/stdata_show_v4.cgi?id=LH000026730&dt=1&ds=14
Temp: 1882 7C&Deg;
Temp:1940 3.5C&Deg;
The Low is set in 1940
The uptrend begins in 1985, over 100 years of flat temperatures
CO2 can’t cause the sudden warming post-1985
Tempertures in 2005 are below most levels in up to 1940
Doing a regression up to 1985 would show a flat to negative slope, only post 1985 can you claim there is any warming, and it isn’t due to CO2.
7C&Deg; doesn’t get broken until 1960
Its neighbor also shows sudden warming starting in 1985:
Kaunas (54.8831N, 23.8331E) ID:LH000026629
https://data.giss.nasa.gov/cgi-bin/gistemp/stdata_show_v4.cgi?id=LH000026629&ds=14&dt=1
Plenty of stations show no sudden warming post-1985
Columbus (39.1661N, 85.9228W) ID:USC00121747
https://data.giss.nasa.gov/cgi-bin/gistemp/stdata_show_v4.cgi?id=USC00121747&ds=14&dt=1
Chryl Atkinson’s Full Measure 02212022 covers Green Energy Boondoggle. She covers Montana and how insane the drive is to force consumers to pay 140% more for electricity. The first thing I did was go to the Montana Stations to examine the catastrophic consequences CO2 is having on Montana. Guess What? You guessed it, no warming over the past 100 years.
Mather 3 Nw (44.1747N, 90.3483W) ID:USC00475164
https://data.giss.nasa.gov/cgi-bin/gistemp/stdata_show_v4.cgi?id=USC00475164&ds=14&dt=1
La Crosse Muni Ap (43.8789N, 91.2528W) ID:USW00014920
https://data.giss.nasa.gov/cgi-bin/gistemp/stdata_show_v4.cgi?id=USW00014920&ds=14&dt=1
Blair (44.2906N, 91.23W) ID:USC00470882
https://data.giss.nasa.gov/cgi-bin/gistemp/stdata_show_v4.cgi?id=USC00470882&ds=14&dt=1
Also, I’ve challenged bdgwx many times to identify a station that matches the Global Aggregate’s uptrend. I’m up to 400 stations that show no warming, and honestly haven’t found any that come close to the Global Aggregate. Well, guess what? NASA GISS Found One. Remember what the hypothesis was. If you control for the UHI and Water Vapor you will find no warming. I’ve posted many stations showing no warming that fit those requirements. Now, how did NASA GISS address this issue? Did they choose to highlight a station that fits those requirements? Nope, they literally chose Central Park NY, a location that is synonymous with the Urban Heat Island Effect, and it is surrounded by water. That isn’t a joke. Look at the one they chose to highlight that looks a whole lot like the chart above it on the front page.
https://data.giss.nasa.gov/gistemp/
Here is the Global Graph:
https://data.giss.nasa.gov/gistemp/graphs_v4/graph_data/Global_Mean_Estimates_based_on_Land_and_Ocean_Data/graph.html
Here is the chart they choose for the Front Page
https://data.giss.nasa.gov/gistemp/link_stations.png
Note, they chose not to feature West Point which would have been a more appropriate site.
West Point (41.8450N, 96.7142W) ID:USC00259200
https://data.giss.nasa.gov/cgi-bin/gistemp/stdata_show_v4.cgi?id=USC00259200&ds=14&dt=1
As of right now there are only 14 stations of the 27,000+ in the GHCN-M inventory on GISTEMP’s exclusion list. West Point is part of the GISTEMP’s global mean temperature calculation.
I’m kind of curious bdgwx, I’ve posted two locations basically at the same latitude and longitude, and yet one shows a strong uptrend clearly due to UHI and WV, and one that is largely sheltered from changes in UHI and WV that show no warming. Why in the world would you include one station that is known to have corrupt data and one that doesn’t? What benefit does it provide to include garbage data with accurate data. Why would you include both? What is the logic to intentionally corrupting the data other than to present a false impression of warming?
I have no idea what you are talking about. First, West Point USC00259200 is a thousand miles away from Ny City Central Park…ya know…one being in New York and the other Nebraska and all. Second, who said anything about corrupt data?
Understanding an Uptrend:
New York Cntrl Pk Twr (40.7789N, 73.9692W) ID:USW00094728
https://data.giss.nasa.gov/cgi-bin/gistemp/stdata_show_v4.cgi?id=USW00094728&ds=14&dt=1
Central Park, a location synonymous with the Urban Heat Island Effect and surrounded by water, basically the worst location to identify true warming, show a clear up-trend.
1) It is a series of higher highs and higher lows
2) The T-Scores of the early data would be the left tail and the current values would be the right tail
3) Recent lows are well above even the highs of the earlier time period ranges
4) It would have a solidly statistically significant coefficient
5) It would have a reasonably high R-Squared, but I bet it is still pretty low
6) The early range centers around 11 and the current one centers around 13.5, a full 2.5C°
7) Recent highs are well above the highs of the range set early in the data
8) Range borders would be two parallel uptrending lines that enclose the vast majority of the data
Clearly NY Central Park is an uptrend, and clearly, it is the worst possible example of a station to reflect true global warming. It is the epitome of stations to highlight the corruption of the UHI and WV, not CO2’s impact on temperatures.
Here is a location that is basically the same location, but removed from the UHI and WV, and it is a far better location to highlight the impact of CO2 on temperatures.
West Point (41.8450N, 96.7142W) ID:USC00259200
https://data.giss.nasa.gov/cgi-bin/gistemp/stdata_show_v4.cgi?id=USC00259200&ds=14&dt=1
As a I said above West Point, NB and NY Central Park aren’t even remotely in the same location.
60 miles on a global scale is the same location.
https://www.google.com/maps/dir/West+Point,+New+York/New+York/@41.0515397,-74.2337183,10z/data=!3m1!4b1!4m14!4m13!1m5!1m1!1s0x89c2cd92fd52d37f:0xba42d6d4455b94cb!2m2!1d-73.9559721!2d41.3914827!1m5!1m1!1s0x89c24fa5d33f083b:0xc80b8f06e177fe62!2m2!1d-74.0059728!2d40.7127753!3e0
West Point is a very short train ride. It is basically the same distance to the end of Long Island.
Facts are, the location is close enough, and CO2 is identical in both locations, so once again, why is there a temperature trend that is extremely different? The only reason NYC is increasing and West Point isn’t is because NYC corrupts the data with the UHI effect.
What is your explanation as to why the locations have dramatically different trends, and why justification is there in including them in a composite knowing that one if corrupted?
CO2isLife said: 60 miles on a global scale is the same location.
West Point USC00259200 is in Nebraska. Nebraska is west of the Mississippi River. That is 1200 miles from New York Central Park.
CO2isLife said: Facts are, the location is close enough
On what planet is 1200 miles about as much as 60 miles?
CO2isLife said: and CO2 is identical in both locations, so once again, why is there a temperature trend that is extremely different?
Because CO2 isn’t the only thing modulating the temperature.
CO2isLife said: What is your explanation as to why the locations have dramatically different trends, and why justification is there in including them in a composite knowing that one if corrupted?
Neither are corrupted. GISS uses both and pretty much all of the 27,000+ GHCN-M stations because they want to get the best possible estimate of the global mean temperature.
Good catch on West Point:
West Point (41.3906N, 73.9608W) ID:USC00309292
https://data.giss.nasa.gov/cgi-bin/gistemp/stdata_show_v4.cgi?id=USC00309292&ds=14&dt=1
Current temp is below the level of 1920
Almost all data falls below the level of 1920
Unsdjusted Data shows no warming at all, only the adjusted data does
Compare West Point to NYC and there are clear difference, differences that can’t be due to CO2. As a reminder, this is what an uptrend looks like.
https://data.giss.nasa.gov/gistemp/link_graphs_v4.png
Here are locations around West Point NY all showing no warming up-trend:
Scarsdale (40.9833N, 73.8W) ID:USC00307497
https://data.giss.nasa.gov/cgi-bin/gistemp/stdata_show_v4.cgi?id=USC00307497&ds=14&dt=1
Yorktown Hts 1W (41.2664N, 73.7975W) ID:USC00309670
https://data.giss.nasa.gov/cgi-bin/gistemp/stdata_show_v4.cgi?id=USC00309670&ds=14&dt=1
Carmel (41.4333N, 73.6833W) ID:USC00301207
https://data.giss.nasa.gov/cgi-bin/gistemp/stdata_show_v4.cgi?id=USC00301207&ds=14&dt=1
Bedford Hills (41.2333N, 73.7167W) ID:USC00300511
https://data.giss.nasa.gov/cgi-bin/gistemp/stdata_show_v4.cgi?id=USC00300511&ds=14&dt=1
And I could keep going on and on and on.
CO2isLife said: Here are locations around West Point NY all showing no warming up-trend:
Post the linear regression trend for each site. If you don’t I will.
CO2isLife
I am not sure what you are trying to demonstrate. You can look at Roy Spencer’s temperature graph and see a warming of around 0.8 C in 42 years. The troposphere where he is getting his values would not warm unless the surface did as well, the surface should warm a little more than the atmosphere above as the atmosphere is generally a little cooler than the surface.
https://data.giss.nasa.gov/gistemp/graphs_v4/
The near surface in the same time frame went up around 1.17 C which is kind of matches Roy Spencer’s graph of higher level Troposphere temperature.
I do not think you found a smoking gun in your data quest. A lot of what you claim is no warming looks like warming to me. Higher highs and higher lows near the end of many of the extended temperature graphs. I believe bdgwx did actual trend lines through lots of your data and found warming. You may not be able to tell with the “eye balls” it may require a trend line to determine the actual direction of the temperature graph.
It’s interesting again to see that NOAA, which is repeatedly discredited by ‘some’ commenters, continues to publish a La Nina-oriented evaluation of NINO3+4:
https://www.cpc.ncep.noaa.gov/products/CFSv2/imagesInd1/nino34Mon.gif
while at the same time BoM
http://www.bom.gov.au/climate/ocean/outlooks/#tabs=Graphs®ion=NINO34
and JMA
http://ds.data.jma.go.jp/tcc/tcc/products/elnino/elmonout.html#fig2
do the inverse.
Note that last week, the red bar in the JMA picture was only at 10%.
Bah. The effect of La Nina in my corner is probably equal to zero.
J.-P. D.
Arctic & Antarctic sea ice from NSID-C via colorado.edu
1. Arctic, absolute
https://drive.google.com/file/d/1J9kx750_CtARv4sKfXBddRnkZm3E2U4v/view
2. Arctic, departures wrt 1981-2010
https://drive.google.com/file/d/1QBlh325tHF-4NRlWsHf_6sgskO_ipyse/view
3. Antarctic, absolute
https://drive.google.com/file/d/1BY_ACQnX5hfQbvPAih6YTzsYEISTatTO/view
4. Antarctic, departures wrt 1981-2010
https://drive.google.com/file/d/1PdqOctb7zaMgvdMdX2sId1g_o7U13mM-/view
Source
ftp://sidads.colorado.edu/DATASETS/NOAA/G02135/
J.-P. D.
It is possible that the winter max is in for the year.
From the (very conservative) French newspaper ‘Le Figaro’
In Texas, after the cold snap, five-figure electricity bills
Faced with extreme temperatures, many residents received prohibitive bills, up to $ 17,000.
Texas is in fact the only state whose energy distribution network operates only state-local, and its electricity market is completely deregulated.
Many homes have contracts whose monthly price varies according to demand, and the latter exploded with the cold snap. With the extreme weather conditions, energy use has skyrocketed, pushing wholesale electricity prices to over $ 9,000 per megawatt hour, compared to a seasonal average of $ 50 per megawatt hour.
A resident of Dallas has reported to the local channel WFAA to have seen his bill go to $ 17,000 against $ 660 in normal times for his main residence, his outbuilding and his office.
A couple has to pay 3,800 dollars for 15 days when their bill for the whole of 2020 was 1,200 dollars. Another could see on the application of its operator, Griddy, having to pay 573 dollars for the single day of Monday.
Furious, many residents of the “lone star state” tweeted the photo of their bill to their governor, Greg Abbott, as well as their senator Ted Cruz, who took refuge in a seaside resort in Cancun, Mexico in the midst of chaos.
*
And some stubborn dumbies are brazen enough to blame windmills on that ultraliberal chaos a la Maggie Thatcher!
Oh Noes.
J.-P. D.
NOrman: You can look at Roy Spencers temperature graph and see a warming of around 0.8 C in 42 years.
Dr. Spencer’s graphic doesn’t even attempt to correct for the UHI and Water Vapor. If you parse Dr. Spencers data for Polar or Ocean Temperatures, areas partially controlled for the UHI Effect, you will see that you get widely different temperature trends. Same for the N and S Hemisphere. CO2 is 415 all over the globe, so CO2 can’t cause the differences in slopes of UAH Temperature graphics. I don’t disagree that the globe may be warming, my focus is providing evidence that it isn’t due to CO2. Simply find a desert location and you won’t find any warming over the past 100 years.
Here are over 400 sites with no warming uptrend. Unfortunately the link won’t post.
CO2isLife
They have actually measured the increase in DWIR from increased CO2. It is not much per year. 0.2 W/m^2 per decade. That would be 0.02 Watt/m^2 per year. Not noticeable and then many other factors can vary the temperature on a yearly scale like cloud variation and many others. On short term basis like yearly many things can affect the changes in temperature (volcanoes also). The AGW is a slow but steady slog up the path.
Also with the deserts, the CO2 will just increase the energy the surface receives. That energy can be used to increase temperature but it could also just increase convection and not show up as an increase in temperature at some locations.
Maybe I will look up some desert locations and see if I can determine zero warming.
I am not against your efforts but I do not think NOAA is intentionally creating false data by making a global data set using the individual reporting stations. They could be this deceitful and dishonest. It is always a possibility but I am not inclined to believe this is the case as this time.
CO2isLife
I was trying to make temperature plots from the GISS page in Arizona but I get “Not a valid station” (or close to that) error. I tried Phoenix, Yuma, Tombstone but no luck.
Norman: I am not against your efforts but I do not think NOAA is intentionally creating false data by making a global data set using the individual reporting stations.
Thanks Norman, but my point is that by combining Corrupted Data with non-corrupted data is something every scientist knows it is a worst practice. NASA GISS and others are the biggest Cheerleaders for CO2 being the culprit, and yet they choose locations like NY CIty to make their case.
This is my favorite desert location, but I have found many many more.
Alice Springs (23.8S, 133.88E) ID:501943260000
https://data.giss.nasa.gov/cgi-bin/gistemp/stdata_show_v3.cgi?id=501943260000&dt=1&ds=5
Where is this “corrupted” data that you are seeing?
bdgwx
I guess it’s here:
https://drive.google.com/file/d/1Maa7AKnB7RblEG7-qQU-v4mq_FAHNgyj/view
0.10 C/decade for 1890-2019 (0.26 since 1979, Antarctic included), i.e. 1.3 C for 130 years.
Everybody will tell you: so what!
J.-P. D.
The data from Alice Springs is combined with NYC and NASA makes the claim that CO2 is the cause. Alice Springs shows no warming and isn’t subjected to WV or UHI, NYC is the standard location to demonstrate the UHI effect. By combining the two data sets together you get warming that is clearly not due to CO2. If you want to really define the impact of CO2 on the temperature you would eliminate stations like NYC, and use only stations that are controlled for UHI and WV. If you are going to use NYC, they should have a disclaimer that the warming is due to the UHI, not CO2.
I don’t care about combining datasets, UHI, or WV. I want to know where specifically you are seeing “corrupted” data.
Did you find a temperature series in the GHCN-M repository that was not readable at all? Is there a specific station for which the GISS station temperature plot tool does not work or return data?
Why would UAH need to correct for UHI and WV?
If you want to falsify the hypothesis that CO2 can effect the global mean temperature and/or oceanic heat content then here are some ideas.
– Show that there is no increase in the global mean temperature.
– Show that there is no increase in the oceanic heat content.
– In lieu of the above show that there is no cooling of the stratosphere.
– Show that CO2 is not active in the infrared spectrum.
– Show that all other agents sans CO2 can adequately explain the GMT and OHC trends during the contemporary era.
Since no one seriously advocates for any hypothesis in which CO2 is the only agent that can modulate the temperature on small spatial and temporal scales then your proposed test in regards to a specific site is useless.
bdgwx says:
1) Show that there is no increase in the global mean temperature
Done: I’ve identified many locations of various latitudes and longitudes that when controlled for UHI and water vapor shows no warming up-trend and no relationship to CO2
2) Show that there is no increase in the oceanic heat content
Done: CO2 and LWIR between 13 and 18µ won’t warm water, so CO2 can’t be the cause. What has warmed the oceans is the lower cloud cover that has been allowing more warming visible radiation to reach the oceans. The deep oceans are also warming, and CO2 and visible radiation can’t cause that warming. Lastly, the Hockeystick shows a dog-leg in 1902, ocean temperatures (Southern Hemisphere) doesn’t show a dog-leg, and there is a large difference between the N and S Hemispehre that can’t be due to CO2.
3) In lieu of the above show that there is no cooling of the stratosphere
CO2 would cause cooling in the stratosphere. Radiation rapidly moves energy out of the atmosphere. What CO2 will do is put a floor into the temperature of the stratosphere which is -80C°
That temp is consistent with the black body temp of peak 15µ LWIR
4) Show that CO2 is not active in the infrared spectrum
CO2 is absolutely involved with the LWIR Spectrum, specifically 13 to 18, peak 15µ LWIR. That wavelength is consistent with -80C° and will not penetrate or warm water. It is also the reason the stratoshoere or any later with CO2 won’t fall below -80C°. In fact even the Mars atmosphere, which is much thinner but largely CO2, barely violates that level.
5) Show that all other agents sans CO2 can adequately explain the GMT and OHC trends during the contemporary era
Prove there was warming. Alice Springs and the other 400+ locations I’ve identify don’t show warming. The better question is why can I find so many locations with no warming? Even if I agree there is warming, there had been a decreasing cloud cover over the oceans, and a greening of the N Hemi (more H20). BTW, simply look at the trend in the N vs S Hemi and look at the Pools. How can CO2 cause so many different trends in temperature?
I’ve not seen you post a global mean surface temperature product that is substantially different than any of the others.
I’ve not seen you post an oceanic heat content product at all.
Let me be perfectly clear here since there seems to be confusion on what global actually means. Global means the entire planet. One location is not a proxy for the entire planet. Nor is 400 or even 27,000 locations. Global means that all of the Earth’s 510e12 m^2 of surface area are accounted for. Global means that each of those 510e12 m^2 are equally weighted when computing the spatial average.
If you still do not understand what “global” actually means then please ask questions.
bdgwx: I’ve not seen you post a global mean surface temperature product that is substantially different than any of the others.
I can’t publish it, but you can easily recreate what I’ve done. Just go and download the data for the Locations I’ve identified that have a long-term history and a BI of 10 or less. What you will find is that the composite that you will create shows a wave, but no uptrend. It warms from 1880 to the 1930s-40s, cools through the 70s and 80s, and then warms again to current. The composite chart is a real spaghetti chart with some warming while others cooled, but when you equal weight them they form a wave, but certainly no uptrend. The one thing I didn’t do was create a grid to ensure that the stations have a reasonable dispersion. I have a feeling that the US is overweighted in my original work. My next time I will ensure that I’m not using redundant stations that are close by and tell the same story.
The important thing here is that you need to compute a spatial average that provides sufficient coverage of the Earth. Nick Stokes did this with just 60 stations so there’s no reason you shouldn’t be able to do something similar with your selections.
https://moyhu.blogspot.com/2011/03/area-weighting-and-60-stations-global.html
Something here reminds me of one of Frank Zappa’s songs.
”
The torture never stops!
”
Of course: our good old guy meant something quite different… but torture is torture!
J.-P. D.
bdgwx says: The important thing here is that you need to compute a spatial average that provides sufficient coverage of the Earth. Nick Stokes did this with just 60 stations so theres no reason you shouldnt be able to do something similar with your selections.
Thanks bdgwx. I will do something similar but with the intentional selection of stations controlled for the Urban Heat Island Effect and Water Vapor. I will deliberately select desert stations in as many various locations as possible.
https://www.nationalgeographic.com/environment/article/desert-map
Think about that for a moment. If you had only select urban stations then your global mean temperature would have an urban bias. Likewise if you only select desert stations then your global mean temperature would have a desert bias. It would be better to select stations from all over the world that represents Earth’s climate diversity. And since Earth is 70% ocean you’ll want to heavily rely on island stations like what Nick Stokes did so that you do not underweight marine environments.
CO2isLife: “..controlled for the Urban Heat Island Effect and Water Vapor.”
UHI is more than adequately discussed in top post. How will CO2isLife control for atm. water vapor…exactly?
Selecting only desert weather stations will not necessarily accomplish that ideal, CO2isLife will have to do some proper hard, calculating work.
Deserts have relatively low precipitation, not necessarily low atm. water vapor. Desert weather stations are dry because they are located in regions of descending air. Owens Valley on the lee side of the Sierras and the Atacama Desert on lee side of the Andes are two examples.
As a detail hydrology example, look up recent same day June meteorology reports in Madison, Wisc. and Tucson, Ariz. For the same June day, they show precipitable water above Madison was 1.09 in., 119% of avg., Tucson 0.75 in., 93% of avg. Thus the avg. precipitable water above Tucson and Madison on a June day is about the same even though Tucson’s annual precipitation is less than one-third that of Madison’s.
To show I didn’t just cherry pick, look up meteorological records for June in Alouef in Algeria, firmly within the Sahara. Finding June water vapor partial pressures and converting to densities shows concentration of wv in Madison is around 20% less than Alouef. And the air temperature in Alouef is higher. This means radiation from the atm. above Alouef is more than likely higher than Madison. CO2isLife properly controlling for water vapor in June would have to pick Madison as a desert station over Tucson & Alouef.
Today, there are satellite TPW measurements that you can use instead of doing this old fashioned work; not doing the detail meteorological work means less learning about meteorology for CO2isLife who definitely needs to extend studies in the field.
ball4
Excellent stuff, thx.
J.-P. D.
bdgwx
Exactly, and that is the reason why about 30% of the 85 RATPAC radiosondes are located… on islands.
J.-P. D.
The whole purpose of the experiment is to isolate the impact of CO2 on temperatures. Deserts are natural controls for the UHI and Water Vapor. The entire point is to demonstrate that if the globe is warming, it isn’t due to CO2. If cloud patterns change for non-CO2 related causes, yes, you can bet the temperature will change. If there are fewer clouds over the oceans, yes, they will warm, but it won’t be due to CO2. NASA uses the UHI effect and other non-CO2 related events to push the narrative that CO2 is the cause of warming. That is demonstrated by them literally choosing NYC as the graphic to highlight the warming and to support the global graphic they have right above it.
How do you plan to control for aerosols, solar irradiance, advective processes, albedo, and countless other factors that also modulate the temperature?
How do you go about determining why cloud patterns have changed?
bdgwx Says: Think about that for a moment. If you had only select urban stations then your global mean temperature would have an urban bias. Likewise if you only select desert stations then your global mean temperature would have a desert bias.
bdgwx, have you never run a controlled experiment? CIties grow over time. Cities are variable over time. Each year they build another road or building. Each year more heat trapping material is added to the system.
Deserts are basically constant. A sand dune is basically the same sand dune in 1,000 years. Yes it may change shape, but the physical properties are essentially constant. If you have an unchanging desert and a changing city, that is the differential you look for to tease out the impact of the UHI. You need changes, that is why they are called differential equations. ΔY = ΔX +b
If Δ = 0.00, then it has no impact on the model. To isolate the impact of CO2 on temperature you have to have as many factors with Δ = 0.00, and that is why you choose deserts, they are basically constant. You can find 5,000 year old papayrus in the Egyptian desert.
Your post mentions UHI and CO2. Which one are you trying to isolate here?
bdgwx, from your comment, “Your post mentions UHI and CO2. Which one are you trying to isolate here?”
I take it you haven’t run a controlled experiment.
1) The UHI is present in cities, it is not present if deserts, that is a differential between cities