“The magnitude of the increase is unprecedented.”
A new study published by NASA’s Norman Loeb and co-authors examines the CERES satellite instruments’ measurements of how Earth’s radiative energy budget has changed. The period they study is rather limited, 2005-2019, probably to be able to use the most extensive Argo float deep-ocean temperature data.
The study includes some rather detailed partitioning of what sunlight-reflecting and infrared-emitting processes are responsible for the changes, which is very useful. They also point out that the Pacific Decadal Oscillation (PDO) is responsible for some of what they see in the data, while anthropogenic forcings (and feedbacks from all natural and human-caused forcings) presumably account for the rest.
One of the encouraging results for NASA’s CERES Team is that the rate of increase in the accumulation of radiant energy in the climate system is the same in the satellite observations as it is when computed from in situ data, primarily the Argo float measurements of the upper half of the ocean depths. It should be noted, however, that the absolute value of the imbalance cannot be measured by the CERES satellite instruments; instead, the ocean warming is used to make a “energy-balanced” adjustment to the satellite data (which is the “EB” in the CERES EBAF dataset). Nevertheless, the CERES dataset is proving to be extremely valuable, even if its absolute accuracy is not as high as we would like in climate research.
The main problem I have is with the media reporting of these results. The animated graph in the Verge article shows a planetary energy imbalance of about 0.5 W/m2 in 2005 increasing to about 1.0 W/m2 in 2019.
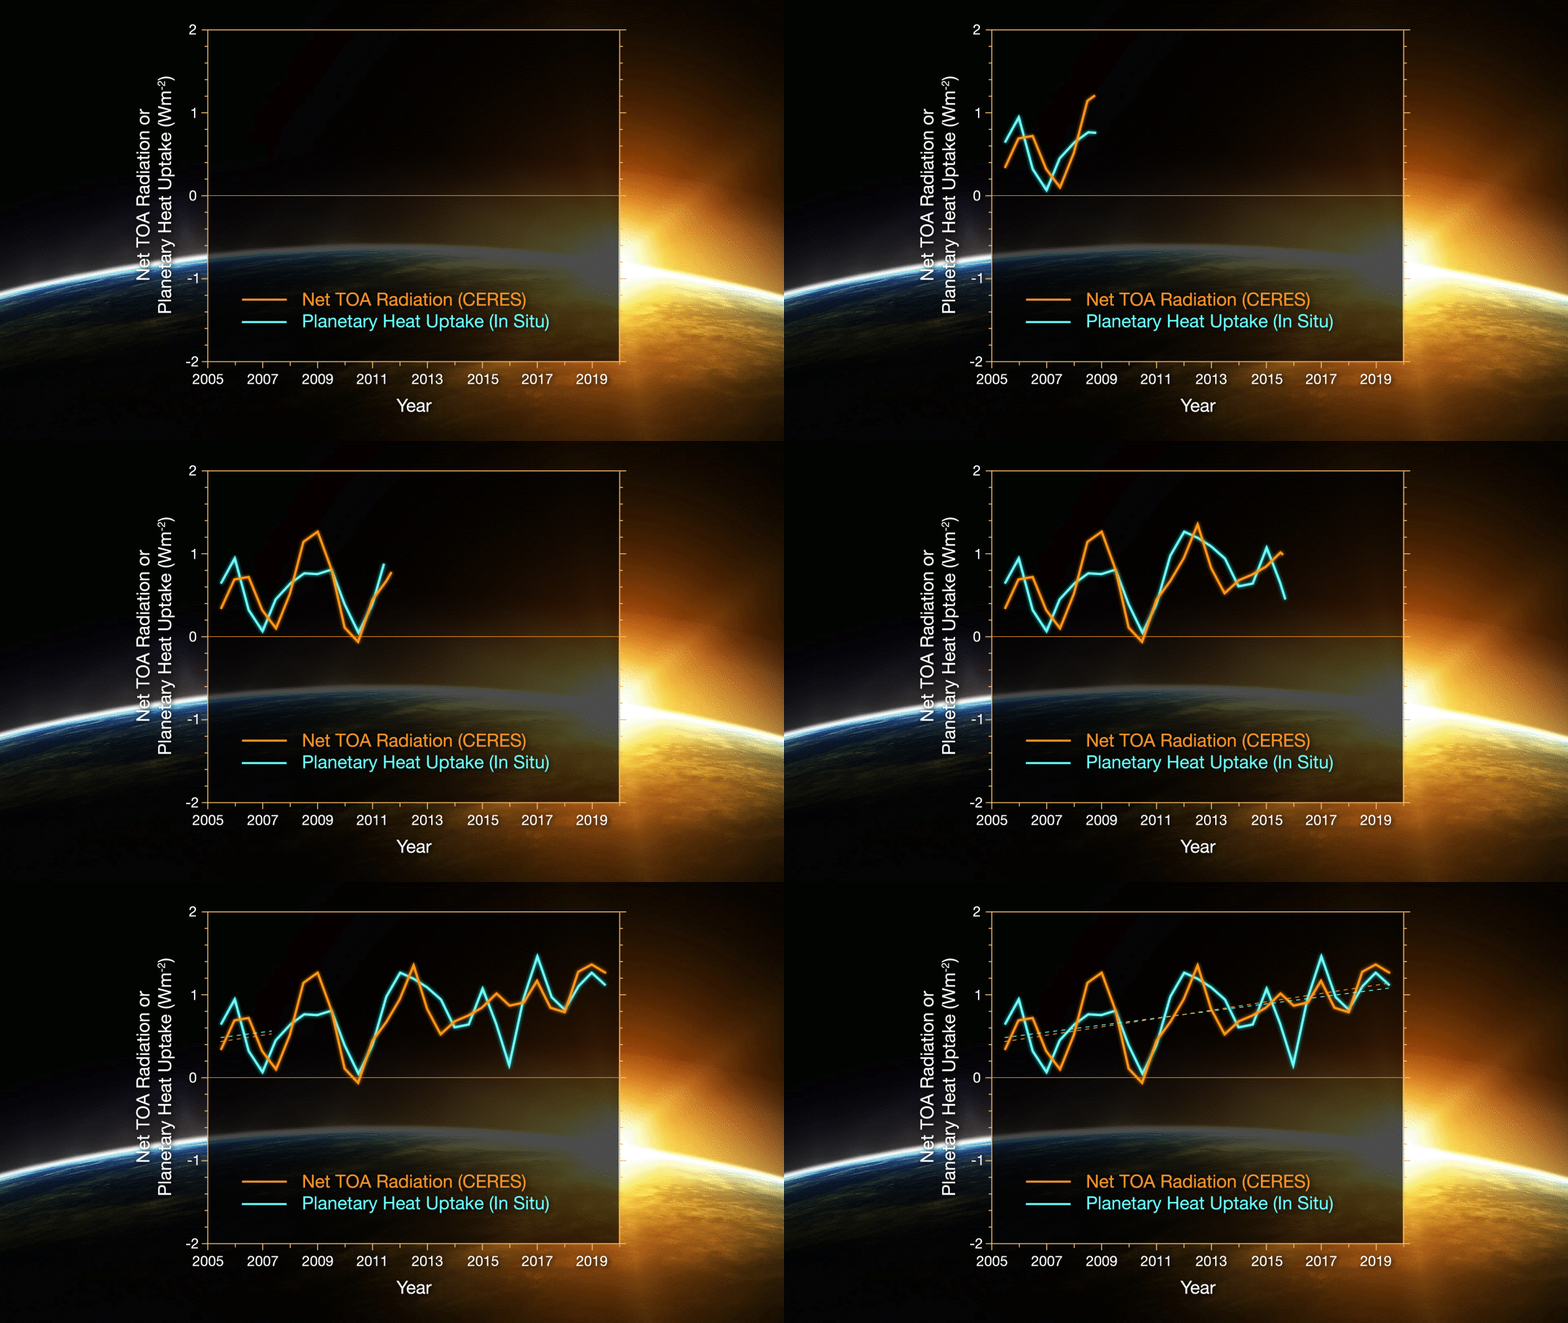
First of all, the 0.5 to 1.0 W/m2 energy imbalance is much smaller than our knowledge of any of the natural energy flows in the climate system. It can be compared to the estimated natural energy flows of 235-245 W/m2 in and out of the climate system on an annual basis, approximately 1 part in 300.
Secondly, since we don’t have good global energy imbalance measurements before this period, there is no justification for the claim, “the magnitude of the increase is unprecedented.” To expect the natural energy flows in the climate system to stay stable to 1 part in 300 over thousands of years has no scientific basis, and is merely a statement of faith. We have no idea whether such changes have occurred in centuries past.
This is not to fault the CERES data. I think that NASA’s Bruce Wielicki and Norm Loeb have done a fantastic job with these satellite instruments and their detailed processing of those data.
What bothers me is the alarmist language attached to (1) such a tiny number, and (2) the likelihood that no one will bother to mention the authors attribute part of the change to a natural climate cycle, the PDO.
Thank you for clarifying this article.
> First of all, the 0.5 to 1.0 W/m2 energy imbalance is much smaller than our knowledge of any of the natural energy flows in the climate system.
We might not want to observe a planet where energy imbalance is bigger that its natural energy flows.
An A/C planet, perhaps?
Added to “But Trace Gas”:
https://climateball.net/but-trace-gas/
Wee Willy,
There is no “energy imbalance” causing heating. The Earth has cooled. It radiated more energy than it received. How can it do otherwise?
Learn some physics, you idiot!
Or keep on being a climate crackpot, if you prefer.
Mike Flynn,
You say:
“There is no energy imbalance.”
Roy says:
“I think that NASAs Bruce Wielicki and Norm Loeb have done a fantastic job with these satellite instruments and their detailed processing of those data.”
The study found an energy imbalance.
Who should we believe, Sky Dragons you deny just about everything, or Roy, Bruce, and Norm?
Best,
Wondering Wee Willy,
You and your ilk may believe as you wish.
You might even want to agree with Richard Feynman who said “For a successful technology, reality must take precedence over public relations, for Nature cannot be fooled.”
The Earth has cooled. Feel free to imagine otherwise.
Mike Flynn,
Contrarians have a thin bench.
Sky Dragons have no bench at all.
That’s all that matters.
Deal with it.
Every time there’s a convective outburst one could say that it’s because of an energy imbalance. The very act of convection brings the atmosphere back into balance. You clamor about the heat wave out west as evidence of a heating up planet, and totally ignore the record low temps expected in the east, which I will beat my previous record low for tomorrow by several degrees. It’s your thinking that resulted in dozens of deaths in Texas due to record cold last February. The earth is not heating up. It’s impossible due to the convective nature of our atmosphere. As far as the heat out west, it’s the result of the recent LaNina which has ended. Heat waves and droughts in the west have lasted as long as 200 years, so consider yourself lucky.
The climate is controlled by 2 things. Solar output and ocean cycles, and they don’t always jive with each other so there’s going to be considerable variation in the climate
It’s impossible for CO2 to be the driver of our climate. Period
Eli wrote:
Convection only moves energy from the surface and lower atmosphere to higher elevations. That process does not remove that energy from the Earth to deep space, which must occur or the planet would overheat. CO2 has a major roll in that final process, which you apparently are ignoring.
> the record low temps expected in the east
We’ll see when ren and Eben harp about it.
Sounded good until you used jive instead of jibe.
>> controlled by 2 things. Solar output and ocean cycles.. impossible for CO2 to be the driver
Sure [sarcastically], and an oven is controlled by two things as well, the heating quantity of the heating element and convection inside the oven,.. and definitely absolutely not at all [more sarcasm] by how far open the door is left ajar.
Thought experiment of very, very well insulated oven set to max for 1 hour (inside of an average temperature kitchen).
1.a Oven door is closed 0% (aka wide open) for an hour so that lots of heat leaves oven confinement.
1.b Heating element remains at max level.
1.c Quantity of heat escaping through large opening is deduced/measured to be Q0.
1.d Q0 out matches heating element Q.
2.a Oven door is closed 99% afterward for 1 hour to allow buildup of temperature inside.
2.b Heating element still at max level.
2.c Quantity of heat escaping through tiny opening is deduced/measured to be Q1.
2.d Q1 out matches heating element Q. Again.
We have matching amounts of heat going out of the oven at stability points, yet with nothing different except the closing of the door, we find that the temperature inside changed dramatically.
Moral: Don’t judge the temperature changes inside by a few observations of heat escaping.
The planet is not an oven, but there are similarities with increasing CO2 and closing the oven door. That similarity is not obvious until we have a model of CO2 and analyze it fairly well (using data capture in the analysis feedback loop). We can argue about the analogy all day long, but the math/analysis/measurements will ultimately decide if the analogy is worth it.
Adding CO2 adds more energy capture sources of photon energy that would otherwise have left into space on a more direct path. We also have more sources of photons, true. A nice physical model exists that allows us to conclude that the temperature will rise inside somewhere to a different equilibrium point. This will coincide with the same outward facing escape heat profile before and after but with a higher temperature level near the surface when we have higher levels of CO2. How much higher is what the math and models are designed to predict. Again, more CO2 adds more sinks in the atmosphere so that release of photon energy near the surface takes a longer amount of time to reach space. I believe in a nutshell and simply that covers modern theory on climate warming from CO2 increases.
>> You clamor about the heat wave out west as evidence of a heating up planet, and totally ignore the record low temps expected in the east
The belief the planet is in warming trend is based upon the imbalance of evidence favoring the warming side of the ledger. It’s impossible to bring up every piece of data to defend warming of the planet in every discussion and at the same time expect that no evidence can be brought up for the cooling side of things.
>> ..in Texas due to record cold last February.. Heat waves and droughts in the west have lasted as long as 200 years..
See? There is always data on the cold side one can bring up. And this is but a sliver of the overall cold evidence. The warming side is still much larger.
If there are loads of ice at the polar caps and if “a convective outburst” is a thing (both true), then let’s not be too surprised that somewhere like Texas experienced a very cold brief period at some point. [The planet, thank goodness, is not warming up so fast that we are done with white Christmases.]
On the other hand, the cold blast made it down to Texas! That also goes on the warming side of the ledger. One could say, as the polar regions are taking a warming beating, they still manage to add a little frost to the rest of the planet in revenge. But the cold is losing.
Our planet’s climate is always changing.
So there is always an “energy imbalance”.
”
“Climate change” and “energy imbalance”
are two useless, generic phrases.
Changing Climate is more apt than Climate Change.
SOLAR DECREASE UPDATE:
https://www.npr.org/2021/06/19/1008248475/the-record-temperatures-enveloping-the-west-is-not-your-average-heat-wave
Changing Climate allows for all sorts of variations.
Climate change too.
>> “Climate change” and “energy imbalance” are two useless, generic phrases.
Useless for conducting science but not useless for communicating efficiently amongst trusting individuals.
All you disingenuous and dishonest haters that have been attacking me for claiming that Climate “Scientists” blame 100% of the warming on CO2, Dr. Spencer clearly states that the Climate Models assume Natural Energy Balance, ie the only variable is man-made CO2.
https://youtu.be/sqbsvR5Ik9M
https://imgur.com/QbBB6tP
If all you have is a hammer, everything looks like a nail, Climate scientists aren’t studying the climate, they are selectively identifying data to support the myth of CO2 causing the Warming. BTW, the graphic Dr Spencer uses shows a dog-leg in 1990. Nothing about the trend is CO2 would justify a dog-leg. My bet is however that cloud cover has decreased since 1990 if that data is anywhere near accurate.
https://imgur.com/aezjwJ9
> Nothing about the trend is CO2 would justify a dog-leg.
Technical analysis is astrology for men.
Willard, how could CO2 cause the rapid change in temperature post 1990? The trend totally changes and you are blaming CO2. What changed in the physics of the CO2 molecule in 1990? That is the question every real scientist would ask. What changed with regards to CO2. Simply answer that question.
Life,
Thank you for your question.
If CO2 was the only parameter in the equation, your curve fitting exercise would at least make sense. I’m not saying that it would be conclusive or anything, for that you’d need a mechanism. But it would still make sense.
In return, let me ask *you* a question:
Do you think red baiting has ever worked except to get more people killed?
Williard:
https://youtu.be/hs70QLpBBvo
https://imgur.com/I9kto8G
Are you telling me that your eyes are telling you that there isn’t a sharp change in trend in this temperature chart?
https://imgur.com/aezjwJ9
If yes, get your eyes examined. There is a clear change of trend immediately starting in 1990. I ask again. What changed about the physics of the CO2 molecule in 1990? If you can’t explain a dog-leg in a chart, you can’t explain any of it because there are clearly hugely significant factors that are not understood. Once again, what is causing all the dog-legs?
CO2Lifer, HERE’s another view of that ocean data. Looking at the smoothed curve fit, there doesn’t appear to be a sharp “dogleg” inflection at 1990. The old hairy eyeball curve may be misleading you.
Life,
https://en.wikipedia.org/wiki/Red-baiting
I’m telling you that inference is not something that you can do with your eye balls.
Wacky Wee Willy Asshat wrote –
“Im telling you that inference is not something that you can do with your eye balls.”
I’m telling you that you are an idiot, you presumptuous patronising donkey.
Keep braying.
Mike Flynn,
Good morning.
“What changed in the physics of the CO2 molecule in 1990?”
_________________________________________________________
Nothing. Physical laws dont change. Only the amount of CO2 in atmosphhere incrases, but not only in 1990; it increases exponentially since beginning of industrialisation. Therefore, of course, warming accelerates.
Then why were they bleating about a coming ice age in the 60s to early 80s? Ice started to expand as CO2 increased. 1880s to the early 50s was as warm as now. CO2 is not a variable. We are not considering all the variables, nor are we aware of all the variables. It is an integrated system, yet they appear to be measuring the contents of a beachball with linear analysis. Oceans, clouds, moisture content,solar,galactic.
“We are not considering all the variables, nor are we aware of all the variables.”
True for you, perhaps. For science, not so much.
To say that science is only considering CO2 is ridiculous. But it is a common strawman posted here.
@Nate – so if so many other things are important, why are people only concerned about CO2 when it comes to climate?
CO2 clearly doesn’t drive warming as the correlation between CO2 and temperature is not very good anymore (if it ever was a good correlation).
>> Then why were they bleating about a coming ice age in the 60s to early 80s?
I’m sure some were, but a study iirc of journal entries suggested the ratio in the 70s was something like 7 to 1 in favor of warming. By 1979 the US Academy of Sciences had put a very unambiguous position paper out that the climate was clearly warming and it was because of CO2 as the driver. Also by that year there were very good papers out on modeling the atmosphere that included both convection and radiation.
>> CO2 clearly doesnt drive warming as the correlation between CO2 and temperature is not very good
They both have upward trends with CO2 being clearer. Despite the usual natural sources and sinks of CO2, CO2 has been going up overall for decades. There are many studies of the past that show temperature lags CO2 potentially by many centuries, so I would not try to correlate the two too strongly to judge immediate cause and effect.
CO2 as a driver is based on scientific principles (and much experimental data of workings of CO2 in other contexts). Think of it as a little tweak of the dial in an air conditioned controlled environment. A small little change can lead to large effects. Ironically, the majority of the gain in temperature is from water but due to the increase in CO2. Water comes out of solution in the air quickly but CO2 doesn’t. Small changes in CO2 levels leads to slight increases that lead statistically to more average quantity of water in the air that multiplies the effect until the balance of outgoing radiation into space is re-established (at that higher temperature). So directly H2O is responsible for more temp rises, but the driver for more H2O comes from the growing CO2.
It looks like methane from permafrost could become a significant contributor as well, again as a result of effects initiated and sustained by higher levels of CO2.
>> of the past that show temperature lags CO2
My bad. It’s the other way around. The point was to suggest that there are differences between these two in the short term.
But while on the topic. The natural approach many times is that temperature leads, then CO2 follows as it bubbles out of the ocean for example. Man has flipped that storyline around and has initiated temperature rises by affecting the CO2 first. It’s hard to believe temperatures would have risen anything to the level they have in these past decades (post 1970s) had there been no contributor but nature alone (with solar sources being relatively stable during the time). In fact during the past few decades some contrarians had predicted a new ice age to have occurred by about now, instead temperatures have continued to rise and even faster than in earlier decades.. as predicted by CO2 analysis.
RE: “Technical analysis is astrology for men.”
Love it!
“been attacking me for claiming that Climate ‘Scientists’ blame 100% of the warming on CO2”
Did you bother to read Roy’s article? It highlights that these climate scientists are NOT doing that.
“They also point out that the Pacific Decadal Oscillation (PDO) is responsible for some of what they see in the data, while anthropogenic forcings (and feedbacks from all natural and human-caused forcings) presumably account for the rest.”
So your ‘100% CO2’ claim is evidently a strawman. Shocking.
Nate Says:
“Did you bother to read Roys article? It highlights that these climate scientists are NOT doing that.”
Simply watch the video.
https://youtu.be/sqbsvR5Ik9M
Dr. Spencer is making every point I’ve made thousands of times and have been attacked for it.
Here is the graphic if you don’t want to watch the video.
https://imgur.com/I9a0qlR
Shocking, either Nate is lying to you or your eyes and ears are.
“They also point out that the Pacific Decadal Oscillation (PDO) is responsible for some of what they see in the data, while anthropogenic forcings (and feedbacks from all natural and human-caused forcings) presumably account for the rest.”
But I though you said that the PDO was not periodic and had little effect on air temperatures overall.
Not periodic, and nothing in this paper suggests that.
I have said that ENSO has a clear but small effect on global temps, and PDO appears to as well, in part thru modulating ENSO.
And BTW over the short 2005-2019 period discussed the 2016 Super El Nino will have a considerable influence. Associated with that was a jump in PDO.
https://tinyurl.com/5ft6ytxp
T ~ 0.1*PDO
And the PDO covers how much of the Earth’s surface?
Swanson says: CO2Lifer, HERE’s another view of that ocean data. Looking at the smoothed curve fit, there doesn’t appear to be a sharp “dogleg” inflection at 1990. The old hairy eyeball curve may be misleading you.
Are you kidding me? OK, the Dog-Leg occurs in 1985, but there is clearly a dog-leg. Between 1955 and 1985 the chart increased 2.5, from 1985 to 2020 it increased 30, or over 10x.
Problems a real scientist would focus on:
1) Heteroschedasticity, clearly the volatility pre and post 1985 dramatically changes.
2) Relative randomness pre 1985, and linear post 1985. Auto/serial-correlation appears post 1985.
3) The physics of the CO2 molecule didn’t change in 1985.
4) You have provided 2 different charts with dog-legs at different periods, no “settled” science has multiple charts telling different stories for the same observation. That is Orwellian Nonsense.
5) The trend in CO2 didn’t materially change between 1955 and 2020.
6) The W/M^2 of CO2 shows a log decay. The impact of CO2 would show a flattening of the curve, not a steepening of it.
7) Visible radiation penetrates and warms the oceans, not LWIR
8) CO2 is relatively linear, the marginal change in W/M^2 with an increase in CO2 shows a log decay (diminishing returns)
Simply study the physics of the CO2 molecule and you will understand why none of these charts support CO2 as the cause of warming. If you want to see the impact of CO2 on temperatures, isolate the impact of CO2 on temperatures. When you do that, what do you find? No warming.
https://imgur.com/a/CDasqHH
https://imgur.com/a/IrE63Xo
https://imgur.com/a/siHPINY
CO2isLife says:
*micdrop*
Everybody else:
*crickets*
Lol?
Life is a boring memer.
Regulars just ignore his spamming.
Welcome aboard!
>> 2) Relative randomness pre 1985, and linear post 1985. Auto/serial-correlation appears post 1985.
Temperature rates are also colored by internal earth variability (sloshing around of heat, including bringing them up from oceans, and dealing with melting ice which consumes heat without any temperature increase due to melting itself).
As the CO2-based longer term upward drift increases in speed, this precise effect is sometimes enhanced and sometimes mitigated (on short term bases) by natural short term variability. This is why climate scientists prefer to look at 30 year intervals or so.. but people on forums insist on focusing and fighting over yearly changes.
>> 3) The physics of the CO2 molecule didn’t change in 1985.
If CO2 additions by man would stop overnight, temperatures would keep going up for a while. Think of it as new yeast being added to bread in the oven. The yeast you inject into it now won’t have full effects for a while to come. The fact we are adding even more CO2 means the total effects to be realized in the future keep going up, which potentially leads to increases in rate of temp rises at least up to a point.
5) >> The trend in CO2 didn’t materially change between 1955 and 2020.
Not true or misleading. The world continues to industrialize in many places that weren’t back in 1955 and we accordingly are building more products. There is more tree cutting for farmland and growing livestock. Cement production has continued to rise. We make improvements in efficiency but to suggest we are almost the same to 1955 is not accurate. Each new decade has added the same as the prior decade and then some.
>> 6) The W/M^2 of CO2 shows a log decay. The impact of CO2 would show a flattening of the curve, not a steepening of it.
Log decay is if you analyze an initial amount of CO2 and add no more. And that decay is over a hundred years to get sizable reductions — again assuming we stop adding more CO2.
[Integrating the yearly differentials:] If human activities add 0 CO2 per year, the current CO2 levels will decay slowly until they reach back to natural equilibrium levels. If human activities add a constant amount of CO2 each year, current CO2 levels will grow linearly. If human activities add more each new year (on average linearly growth in CO2 yearly additions), then the overall CO2 follows a quadratic path upwards. In other words, the total CO2 is the integral of the yearly changes, with the understanding that if humans add 0 per year, the overall additions per year to the atmosphere will revert to negative to move in the direction of natural sinks/sources equilibrium below current levels.
Overall CO2 amounts in the past few decades seem somewhat linear in appearance because the actual “quadratic” (aka, faster-than-linear) growth is very slow since humans yearly produce a small fraction of all natural sources combined (and is further masked by variability within the planet year to year).
The United Nations Intergovernmental Panel on Climate Change (IPCC) was formed in 1988 to blame climate change on humans.
The underlying goal was to give the United Nations new powers as a world government of climate change and energy use.
UN members decided they wanted the new powers themselves.
The IPCC mission was made very clear in 1995 when they declared all natural causes of climate change were “noise”.
They provided no logical explanation for declaring that 4.5 billion years of natural climate change had “died”, at some time during the 20th century (perhaps 1975?), and greenhouse gasses were “made the boss”.
That’s when I knew the always wrong coming climate crisis predictions, that I trace back to Roger Revelle in 1957, was science-free scaremongering, to create fear, for political purposes.
64 consecutive years of always wrong predictions of a coming climate crisis.
About 40 years of climate computer games predicting more than double the warming that actually happens (based on the average computer game projection, representing the government bureaucrat climate science consensus, which is obviously wrong).
No improvement in climate computer game accuracy in about 40 years, proving that accurate projections are NOT a goal.
No emphasis on the only climate model whose projections are not far above observations — the Russian INM model.
The Russian model is simply blended in with all the other less accurate models.
Can you imagine meteorologists with dozens of weather forecasting models, ignoring the one model that makes the best forecasts, preferring to use an average of all the weather forecasting models, to make inaccurate forecasts?
And then we’ve have re-writing of global average temperature history.
In 1974, officials reported -0.5 to -0.6 degree C. of global cooling from 1940 to 1970.
Now the numbers are only from zero to -0.1 degrees cooling, with slightly different years.
That was obvious science fraud.
Done because falling temperatures, with rising CO2 levels, were inconvenient data — didn’t fit the CO2 is the climate control knob narrative — so the global cooling was gradually “adjusted away”.
Government bureaucrat climate science is much closer to junk science than real science.
There is a political agenda supported by always wrong, scary predictions of the future climate, made with excessive confidence, and no uncertainty.
And while we hear those always wrong predictions of coming climate doom every year, we have about seven billion witnesses who lived with up to 45 years of ACTUAL global warming since the mid-1970s.
And those 45 years had mild, beneficial warming, with CO2 enrichment of the atmosphere that greened our planet.
The greatest warming has been in colder areas of the Northern Hemisphere, mainly during the colder months of the year, and mainly at night.
Think of warmer winter nights in Siberia as the “poster child” of global warming since the mid-1970s.
How is that a climate emergency?
Again with the RG monthly declaration there is only “beneficial warming”.
Again we ignore the fact that humans have always thrived in the temperate zone of the planet. The parts with consistent rainfall and moderate temps that enabled agriculture and minimized deaths from heat waves and tropical diseases.
But RG lives in the cold upper Midwest, and is over 60. Hence he considers warming a desirable outcome.
Here’s two plans for him that won’t affect the rest of us.
Get an electric blanket!
Or move to Florida! Enjoy year round heat and humidity and bugs.
Reminds me of another “emergency”, which seems to have followed a very similar Modus Operandi, the start of which was perpetrated early last year and which is ongoing even now….
“The underlying goal was to give the United Nations new powers as a world government of climate change and energy use.”
Just substitute ‘global health responses’ for ‘climate change and energy use’.
*cough*
Dr. Spencer, you make the claim that CO2 must cause some warming.
https://youtu.be/sqbsvR5Ik9M
https://imgur.com/eTF6sVN
I would argue these points:
1) CO2 COOLS the stratosphere by speeding the energy out of the system
2) CO2 and H2O absorb the same wavelengths, so when H2O is present, CO2 won’t cause any warming.
3) To identify the true contribution of CO2 you have to control for the UHI Effect and Water Vapor. That is Antarctica and Deserts. Those locations show no warming. Nada, ZIP.
https://imgur.com/a/CDasqHH
https://imgur.com/a/IrE63Xo
https://imgur.com/a/siHPINY
Also, how can CO2 cause the dog-leg in 1990?
https://imgur.com/aezjwJ9
CO@Lifer, It’s a problem with your eyes:
https://www.drroyspencer.com/2021/06/new-nasa-study-earth-has-been-trapping-heat-at-an-alarming-new-rate/#comment-731772
your
What is total cooling from stratosphere?
100% Proof Positive. Dr. Spencer specifically states that climate models assume 100% warming is due to Man. 100%.
https://imgur.com/I9a0qlR
Just go back and read the responders to my posts. These are very dishonest and disingenuous people that have attacked me for making that very claim. If you want to know how much warming is due to CO2, simply look at Antarctica and the deserts. No model needed, simply look at the data.
https://imgur.com/a/CDasqHH
https://imgur.com/a/IrE63Xo
Dr Spencer, how could back-radiation ever cause the oceans to warm? The oceans saturate the air above them with H2O. Look at modtran. Look up from the surface of the oceans and add as much CO2 as you want and you won’t change the actual backradiation at all if you add H20. The saturates air above the oceans literally makes CO2 irrelevant. CO2 only impacts the climate when H2O precipitates out, and then it actually works to cool the stratosphere.
https://youtu.be/sqbsvR5Ik9M
Look up from the surface and change CO2 from 400 to 800 and just slightly alter the H20 from 1.1 to 1. You actually cool the atmosphere.
http://climatemodels.uchicago.edu/modtran/
Based on your data showing slowly rising temperatures since 1979, is this even surprising?
The UAH data does not show slowly rising temperatures. All of the increase to date occurs in two discrete steps that are coincident with super El Ninos. It is surprising that ENSO is not considered in the CERES analysis. As a chaotic oscillator, ENSO never balances.
https://www.cfact.org/2021/01/15/the-new-pause/
Another step on Da Escalator:
https://skepticalscience.com/escalator
Another idiotic comment accompanied by another pointless link from the Idiot Wee Willy.
He’s a strange lad, is Wee Willy. Appeals to the authority of other fantasists, cartoonists, and assorted other climate crackpots.
What a guy!
Mike Flynn,
No authority is required to recall that contrarians fall for Da Escalator.
All one needs is to click the link see it.
Go ahead, click on it.
Swoon,
Whacko Wee Willy,
Da Escalator? Skeptical Science?
You are an idiot.
Mike Flynn,
Tell me if Roy answers your silliness.
Woeful Wee Willy,
Why would I bother doing anything you ask, and to which “silliness” do you refer?
Mike Flynn,
It was a rhetorical question.
I am referring to the comment you posted in response to one of Roy’s comments.
Did you tell him you were Mike Flynn?
Woeful Wee Willy,
Why should I bother doing anything you ask, I ask again?
Whether you think facts are “silliness” is up to you. Other people are obviously free to think otherwise. Is your unsupported opinion somehow valuable?
I think not. Can you provide support for a contrary view?
Mike Flynn,
If you cared about honor, you’d tell Roy that you’re Mike Flynn.
You would not hide under a sock puppet to bypass his ban.
Is this clearer this time?
“You would not hide under a sock puppet”
As you do you mean?
That “no u” is overly silly Richard.
Since you like incorrect formalism:
sock puppet != pseudonym
If you can guess why that’s an incorrect statement, you’ll get a cookie.
Both serve to hide your true identity.
Sure, RLH.
“Another step on Da Escalator”
What goes up must come down.
No U.
I already told you, most alphabets contain a U
You say lots of irrelevant things, Richard.
You say a lot more
What comes in must come out.
The 40 year UAH trend is up.
All surface data compilations are up trends too.
With only two choices for our planet, warming or cooling trends, I am confident the past 45 years have been a warming trend.
No amount of data mining can change that trend.
Whether the two super El Ninos in 1998 ans 2015/2016 are unique events, that will never be offset by La Ninas, remains to be seen
But the long term ENSO trend adds up to near zero.
So does the PDO eventually. But it also contains wriggles that are over 30 years long.
That are not well correlated to the rising trend.
A hockey stick corresponds quite well to the rising trend, apparently.
Dr. Spencer, your model assumes a death spiral and your model accurately reflects highly suspect data. GIGO.
https://imgur.com/aezjwJ9
Here are some things to consider:
1) You have evidence the oceans are warming
2) There has been fewer clouds over the oceans since 1990
3) Henry’s Law explains how warmer oceans would de-gas CO2
4) More CO2 would warm the oceans more
5) Warmer oceans would degas more CO2 leading to a death spiral
6) CO2 has been as high at 7,000 ppm and the earth never experienced a death spiral
7) Life, including corals reefs, thrived with much higher levels of CO2
8) Use Modtran and look up from the surface, and then again from 0.1 km altitude. That is the layer of the atmosphere that would directly warm the oceans. Change the level of CO2 and measure the change in energy in that layer of the atmosphere. It won’t change much.
9) Nothing about the trend in CO2 would have caused that dogleg in 1990, something else must be causing that warming
1) yes, CO2 cools the stratosphere. All climate models that produce tropospheric warming also produce stratospheric cooling, too. That’s what greenhouse gases do, they warm the lower atmosphere and cool the upper atmosphere.
2) CO2 and H2O do not absorb the same wavelengths, but even if they did, it wouldn’t matter. The more greenhouse gas an atmosphere has, the greater the greenhouse effect (warming below, cooling above).
CO2 likely didn’t cause the dog-leg in 1990 (as shown by the model fit in my presentation slide #6)… it could be an artefact of poor data coverage of the deep oceans, or a sudden reduction in aerosol pollution around that time. Maybe some natural climate fluctuation. Who knows?
Roy Spencer
Thank you very much for this, even it won’t change a bit in the perpetual mispresentation of real facts AND presentation of pseudofacts by the usual suspect.
J.-P. D.
Bindy, maybe you missed this “CO2 likely didnt cause the dog-leg in 1990.”
If you can’t explain a dog leg you can’t explain any of the data. There is clearly some highly significant factors that are unknown. You can either model the post-1990 data or the pre-1990, but no model would be valid that explain bother without explaining why a dog leg occurred. That is simple modeling 101.
Also, CO2 and H20 do absorb the same wavelengths.
https://imgur.com/cBaqWUJ
And CO2’is’Life really believes that anyone (other than a few stubborn denialists) would trust him, a simple layman, more than in Roy Spencer!
Incredible.
J.-P. D.
Bindy, maybe you don’t understand what Dr. Spencer said in the video.
1) Climate Data is garbage and unreliable if it exists as all
2) Climate models don’t model the climate
3) Climate models assume 100% of the warming is due to man-made CO2.
What am I missing?
What you are missing is all what you don’t want to see, and hence aren’t able to read, digest and grasp:
http://www.drroyspencer.com/2021/06/new-nasa-study-earth-has-been-trapping-heat-at-an-alarming-new-rate/#comment-731671
And now, baby, stop boring me.
“2) CO2 and H2O do not absorb the same wavelengths, but even if they did, it wouldn’t matter. The more greenhouse gas an atmosphere has, the greater the greenhouse effect (warming below, cooling above).”
The problem is more profound. Modtran does suggest they would be overlapped, yet it could be wrong. I mean picking “tropical atmoshpere”, I get 307,123W/m2 in emissions with 400ppm, and 339,12 with 0ppm, a difference of 31.997W/m2. Setting vapor to 0, that differnce grows to 43,018W/m2, suggesting some 25% superimposition.
Yet modtran assumes every deviation from a black body emission curve would be due to GHGs (or at least aerosols), and does not account for deviations with surface emissivity. And surface emissivity is only about 0.91!
https://greenhousedefect.com/what-is-the-surface-emissivity-of-earth
Either way, the problem is all these models, even the “GHE” itself, are assuming no overlapping by GHGs, a perfectly emitting surface, and no clouds. This causes huge error margins. Sorting them out, bit by bit, has the potential to blow up current “climate science”. It does matter a lot!
https://greenhousedefect.com/basic-greenhouse-defects/the-beast-under-the-bed-part-2
I might add I “nullified” CH4, Ozone and Freon, so to only check for an overlay of CO2 and vapor.
http://climatemodels.uchicago.edu/modtran/modtran.html
2) CO2 and H2O do not absorb the same wavelengths, but even if they did, it wouldn’t matter. The more greenhouse gas an atmosphere has, the greater the greenhouse effect (warming below, cooling above).
I’m not sure I understand this concept. There is 1 photon. No matter how many GHG molecules there are, there is only 1 photon to absorb and re-emit. You can’t create energy by simply adding more GHGs. If you could we could power the world with GHG generators. What does happen is with more GHGs, the distance between absorbing molecules is shortened, so the warming layer increases in height, but it doesn’t increase in temperature. This principle gets reversed with altitude, and GHGs actually work to speed the release of energy from the atmosphere by converting slowly moving conduction and convection thermal energy to rapidly moving radiative energy. Think of the atmosphere as a group of inverted funnels. It is easy to leave, but hard to come back down. The hole at the bottom is much later than the hole at the top, so once you leave the funnel, the path of least resistance it to pass through the next funnel above instead of trying to make it back through the small hole in the lower funnel.
“You can’t create energy by simply adding more GHGs”
GHGs will never create energy, not even the first GHG-molecule. I probably should not say it here, since I know Dr. Spencer has certain beliefs, but “back radiation” is not causing any GHE. In short, “back radiation” as any radiation, is a function of temperature, not vice versa.
I mean, just look at the emission spectrum of Earth. It should intuitively explain what the GHE is. Or use modtran for instance. It is all about emission altitude and furthermore emission temperature. “Back radiation” has nothing to do with it.
Also GHGs are NEVER saturated, adding them will always increase emission altitude and lower emission temperature. And the superimposition of GHGs AND clouds is where the huge confusion is.
Just think about it. What if a GHG within a certain spectral line should elevate the emission level to say 4.000m, while there is a cloud pushing the emission level to actually 5.000m.
Then what is the effect of the GHG, and what the effect of the cloud? Enjoy 😉
“1) yes, CO2 cools the stratosphere.”
How much does stratosphere cool. And how much does CO2 cool the stratosphere?
It seems to me, if got planet which has stratosphere, will it be cold.
As general thing, I don’t think gases cool much from radiating and thinner {lower density] gases radiate less.
The thermosphere has a lot lower gas density than stratosphere, but gas molecule hitting each other at much velocity [compared stratosphere- or troposphere]. Thermosphere is +2000 C [due to high collision but does not convect or radiate any amount energy which can warm something- it’s not warm and cool, it’s like space which has no temperature. So thermosphere glows fiercely, but such high temperature emissions are not said to cooling thermosphere by any significant amount.
Now if put some dust up into stratosphere, the dust will cool the stratosphere. Dust actually has temperature, and gas molecule temperature is the average velocity lots molecules is counted within some volume of space in which hit each other.
But don’t know how much the stratosphere, it probably cool by some amount. What is the amount?
Now, I am know living in an Ice Age, and I don’t think warming is problem.
It seems warming causes deserts to green. If think warming is going to cause water vapor, then that is pretty obvious. But how exactly, is the interesting bit.
So, one could a question what is the warmest ocean and/or what is the average surface temperature of the Pacific Ocean.
What is warmest ocean gets the answer the Indian ocean:
“Here are the oceans in order of their temperature:
1. Indian Ocean”
https://www.worldatlas.com/articles/which-ocean-is-the-warmest.html
And next one is The Pacific.
Indian ocean being warm, is due about 1/2 being tropical ocean {not that anyone said this obvious thing]. Anyhow I guessed Indian Ocean average +17 C. And Pacific was around 17 C, but it seems the northern Hemisphere pacific Ocean would about +17 C, and it’s southern Hemisphere of pacific ocean which makes entire pacific ocean about 17 C. And it’s seems Pacific average fluctuate a bit {due how big it is the average doesn’t change as much- but if cut Pacific at equator, then Northern Hemisphere Pacific is somewhere close to 18 C, and if it were warm by 1 degree, what is effect it?}. But anyhow I haven’t got to Atlantic ocean yet and wondering anyone knew it’s average surface temperature?
“Maybe some natural climate fluctuation.”
Or a combination of different climate fluctuations at different semi-periods. Wriggles as I like to call them.
” CO2 and H2O do not absorb the same wavelengths, but even if they did, it wouldnt matter.”
If CO2 and H2O absorbed exactly the same wavelengths, together they would approach saturation of those wavelengths faster than if they did not.
“2) CO2 and H2O do not absorb the same wavelengths”
“The effect of overlapping between the CO2 band and the water vapor band is taken into consideration by adopting the following approximate equation..” (Manabe, Strickler 1964)
To expect the natural energy flows in the climate system to stay stable to 1 part in 300 over thousands of years has no scientific basis, and is merely a statement of faith. We have no idea whether such changes have occurred in centuries past.
The paleo temperature and sea level reconstructions at least would bound on any long term natural energy imbalance and form a scientific basis for this statement.
Mark B
I agree.
J.-P. D.
Dr. Spencer,
I know that you like experiments. Using infrared camera pointed to sky at night, your greenhouse gas and backradiation are nowhere to be captured? Surf the net for a mature infrared videos of sky at night. So where is this greenhouse gas effect that continues after the sun goes down or after we stop producing carbon dioxide?
Nabil:
Yes, I did this 8 years ago. Read especially the last 3 paragraphs.
http://www.drroyspencer.com/2013/05/imaging-the-greenhouse-effect-with-a-flir-i7-thermal-imager/
…and this, from 11 years ago:
http://www.drroyspencer.com/2010/08/help-back-radiation-has-invaded-my-backyard/
Dr Spencer,
Every square foot of surface has about 1 ton of atmosphere pressing upon it. This ton of atmosphere is radiating energy. It is above absolute zero. It doesn’t matter whether it is O2, N2, CO2 or whatever – all radiating proportional to absolute temperature.
And of course, the amount of radiation depends on density, which varies with altitude, amongst other things.
Point your IR thermometer at the sky normal to the surface. How many tons of radiating gases are included in the view of your instrument? Are you really surprised that your instrument is responding to such infrared radiation? Point your instrument closer toward the horizon. The temperature increases, as you are now reading the radiation from a longer optical depth of denser, hotter, atmosphere closer to the surface.
Of course air has a temperature! Climate crackpots manage to convince themselves that O2 and N2 cannot radiate IR, but then acknowledge that air temperature can be measured! Everything above absolute zero radiates IR. Removing any of the atmospheric constituents form a sample of air makes not one jot of difference to the temperature, nor should it.
The fact that nobody at all can even say where this mythical “Greenhouse Effect” may be observed and measured, might indicate that it is a chimera. Pointing an IR thermometer at the sky, or measuring radiation emitted by the atmosphere with highly sophisticated radiometric equipment is evidence of nothing more than the fact that all matter above absolute aero emits radiation.
Very good comment, Mike Flynn!
Whimsical Wee Willy,
Can’t bring yourself to face facts? Even though you have addressed your plaudits to your imaginary foe, I will accept your opinion – in this case.
Thanks for acknowledging the “goodness” of my comment.
There, you see. I even accept praise from idiots and asshats. Unbisaed, that’s me!
Mike Flynn,
Enjoy your evening,
Swenson
N2 and CO2 are transparent to IR at atmospheric temperatures. Water vapor, clouds and CO2 are not, and at many frequencies absorb some to all of the IR depending on beam length. Since you refer to believers of these basic scientific truths as ‘crackpots’, there is really no reason to have any discussion with you on the topic, and I only post this so newbies can do some basic reading and determine the flaws in your mis-statements.
Swenson made no mention of transparency of N2 and O2 to IR, but rather that all molecules radiate IR. It seems you didn’t understand his post at all. Maybe you would like to rephrase so that newbies can get a more accurate view.
“Climate crackpots manage to convince themselves that O2 and N2 cannot radiate IR”
I guess you are including Dr. Spencer in the group of crackpots, since he and all who have seen the data, agree that what you are saying here is nonsense.
Different gases radiate at different wavelengths. Why is that fact so difficult for you?
Total obfuscation as usual. Is there evidence that O2 and N2 cannot radiate IR? Where did Swenson imply gases don’t radiate at different wavelengths?
Why is having an open mind and curing your AGW dogma addiction so difficult for you?
> Is there evidence that O2 and N2 cannot radiate IR?
Have you looked, Chic:
https://scied.ucar.edu/learning-zone/how-climate-works/carbon-dioxide-absorbs-and-re-emits-infrared-radiation
“Have you looked, Chic?”
Pretty much sums up Chic.
8 years ago !
11 years ago !
You have to do the experiments again !
Maybe everything has changed since then?
ha ha
purchase antabuse
The images that you provided are in line with those available online. They do not show a bright sky at night. For 330 w m-2 of back radiation from sky we expect Orange to yellow night sky. The images do not show these colors. They are either gray, dark, or slightly blue, depending on the filter used. Sorry, there is no backradiation.
As for infrared thermometers, they are thermometers, good for short distances. No one uses them to map the sky.
Dr. Spencer,
The images that you provided are in line with those available online. They do not show a bright sky at night. For 330 w m-2 of back radiation from sky we expect Orange to yellow night sky. The images do not show these colors. They are either gray, dark, or slightly blue, depending on the filter used. Sorry, there is no backradiation.
As for infrared thermometers, they are thermometers, good for short distances. No one uses them to map the sky.
“The main problem I have is with the media reporting of these results. The animated graph in the Verge article shows a planetary energy imbalance of about 0.5 W/m2 in 2005 increasing to about 1.0 W/m2 in 2019.
OK, now let’s look at this scientifically.
1) CO2 in 1880 is about 290ppm
2) CO2 in 2005 is 377ppm
3) CO2 is currently about 413ppm
4) Temperature change between 1880 and 2005 is about 0.75 Degrees C
https://imgur.com/WjS3zAY (Note the Dog Leg in 1990)
5) Temperature change between 2005 and 2020 is about 0.75 Degrees C
6) CO2 shows a log decline in W/M^2 with an increase, so how can a smaller change in CO2 lead to equal changes in temperature if CO2 is the cause?
7) What caused the dog-leg?
8) Do the quantum physics of the CO2 molecule change in a manner that would explain a dog-leg?
9) How reliable is the data, and how would LWIR between 13 and 18 microns ever warm the deeper oceans?
10) Do we have data regarding the sunlight reaching the oceans over this time period?
11) What is causing the PDO and ADO is most likely also causing the warming elsewhere.
Surprise surprise, look what I stumbled upon.
In fact, I now believe that the PDO is critical to our understanding of global warming. This is because a change in weather circulation patterns can cause a small change in global-average cloudiness. And since clouds represent the single largest internal control on global temperatures (through their ability to reflect sunlight), a change in cloudiness associated with the PDO might explain most of the climate change weve seen in the last 100 years or more. -Dr. Roy Spencer
https://www.drroyspencer.com/global-warming-background-articles/the-pacific-decadal-oscillation/
Oh, my. So now it comes down to the color scheme applied to temperature imagery, rather than the temperatures themselves? Wow.
Hot is red, right?
Can a scientist who selects clashing colors be trusted?
Is blue cold?
Astronomers do the other way round, blue is hot, and red is cold.
https://www.scientificamerican.com/article/red-objects-strangely-feel-cooler-to-the-touch-than-blue-ones/
Nabil, I’m afraid that your lack of understanding of how radiometry works means I can no longer participate in this discussion.
https://agupubs.onlinelibrary.wiley.com/doi/full/10.1029/2002JA009390
Comparing 14 years of ARGO data to the time duration of one cycle of quasi periodic PDO is about like the satellite data is to one Gleissberg solar climate cycle. I suspect global warming in these 40 yrs of data are also somewhat influenced by a longer natural cycle. But it is hard to isolate.
Similarly the lag in temperatures to the daily solar radiance cycle could be an analogy for a lag in global response to the recent decrease in solar activity after a major sustained solar maximum.
Cycles and lags are everywhere in natural climate records.
Only alarmists love use of the word unprecedented. Those who have a brain in their head know the absurdity of its use in any climate discussion.
Agreed:
https://www.drroyspencer.com/2021/06/biased-media-reporting-on-the-new-santer-et-al-study-regarding-satellite-tropospheric-temperature-trends/#comment-730590
You do realize what that means don’t you?
Indeed I do, Richard.
It’s easy to plan future contrarian tropes with past contrarian tropes.
Idiot
Your past performances makes me plan to ignore more “idiot” from you in the future, Richard.
>The magnitude of the increase is unprecedented.
…..Bill Nye The Science Guy
Apparently many people have been so heavily indoctrinated by the consensus assertion that CO2 causes warming that they are unable to think rationally. I, and others, keep pointing out that CO2 has no significant effect on climate but sadly many are not willing to take the blinders off.
It is really quite simple:
Since both have been accurately measured worldwide about 7 molecules of WV have been added for each molecule of CO2. Because the absor_p_tion lines of WV are spread out compared to CO2, there is less absor_p_tion overlap and each WV molecule is about 1.37 times more effective at absorbing radiation than a CO2 molecule. The result then is that WV increase has caused about 10 times more ground level warming than CO2 increase. The extra cooling from more CO2 in the stratosphere apparently compensates for the small added warming from more CO2 at ground level.
WV has been measured by NASA/RSS using satellite instrumentation and reported monthly. They assert that the measurement is quite accurate because of a high signal to noise ratio and report an RMS of about 1 mm which is about 3.4%. Their measurements show that the WV increase is about 43% more than POSSIBLE if as a result from liquid water warming (the results of feedback). This demonstrates that the human contribution to planet warming has been from WV increase, not CO2 increase.
The conclusion is the same regardless if you calculate the WV increase correctly from the relation of saturation vapor pressure to temperature of liquid water, or as done in GCMs, sometimes as calculated internally, which results in approximately constant RH with temperature increase, or by explicitly stating that RH remains constant with temperature increase.
And Salby, Berry, Harde and others have shown that most of the CO2 increase has been caused by nature and Salby has shown that CO2 follows temperature in both short and long time scales.
“have shown”
Weasel words. They have advanced maverick hypotheses that have been roundly criticised by experts. They have a different POV, and you are nowhere near educated enough on the matter to grant them preeminence.
If I see “trapping heat” one more time my head will explode
https://climate.nasa.gov/faq/19/what-is-the-greenhouse-effect/
You go play Pocket Pool with your Climate balls
Thanks, Eben. I like it here.
How’s the head?
Wee Willy,
Oh dear, the “blanket” again! Really? Don’t these donkeys realise that peer reviewed studies show that the “Black Bedouins” wear thick dark robes in the hot desert – to keep cool!
And of course, insulation is used more often to keep things cool. The dimwits at NASA promulgating this nonsense are about as thick as you. Hard to say, really. Who is dumber?
Stick to “silly semantic tricks” and “auditing skillz”. It will be less embarrassing for you when you come out looking like an idiot.
Mike Flynn,
Whining about semantics and blankets in the same comment is a thing of beauty.
You’re a gift that keeps on giving!
Love,
Wistful Wee Willy,
Is that really the best you can do, kiddo?
Not all that impressive, but not all that unexpected, either.
Mike Flynn,
The only reason I reply to you is to mention your name.
So I could write “Mike Flynn” and it would be enough for me.
If your abuses do you good, suit yourself.
See if I care.
Woebegone Wee Willy,
You wrote –
Mike Flynn,
“The only reason I reply to you is to mention your name.”
This shows an unhealthy fixation, to say the least. Understandable in primitive societies which did (and still do, in places) that names have magical properties.
Quite apart from that, to impute magical properties to a pseudonym used by another anonymous person, is simply bizarre!
Maybe if you could come up with a logical reason for your uncontrollable desire to write “Mike Flynn” as often as you do, you might engender some sympathy, at least. Otherwise, you might just look like what you are – an obsessive and delusional climate crackpot.
As to supposed “abuses”, why do you feel the need to feel “abused”? is this just another example of the ‘silly semantic games” you claim to be playing?
You are an idiot, that’s all. Get over yourself.
Mike Flynn,
You don’t know my needs.
Thanks!
“You dont know my needs.”
Your needs appear to be that you don’t continue to make a fool of yourself. Out of luck so far.
No U.
Most alphabets contain a U
y tho
My comment went completely over your head. Not surprising.
You need to click on “reply,” Roberto.
If I see another contrarian whine about the word “unprecedented,” it’ll be another day like any other in Climateball.
Whickering Wee Willy,
You inhabit a richly bizarre fantasy world, don’t you?
If you could pull your head out of your ass for a moment or two, you would have to face reality. I assume you don’t like inconvenient truths, so you choose to wear your ass for a hat.
You may well be an asshat, but at least you’re delusional. Why don’t you post another irrelevant link to SS, NASA, NOAA, or any other refuge of a ragtag mishmash of climate crackpots? You could always dare me to waste time clicking on it!
Good luck with that!
Mike Flynn,
There’s no need to post any link.
Your spit is worthless.
Will you run out of it?
Tune in tomorrow!
Wobbly Wee Willy,
I am comforted that you no longer feel the need to post any more irrelevant and stupid links.
Why the change of heart? A momentary attack of sanity?
Mike Flynn,
I don’t post links for you. Sometimes I post links, sometimes I don’t. If I can show how silly you are with a link, I post one. If I can show how silly you are without a link, I don’t. Since you have something like five different comments, I switch it up.
Have you considered therapy?
“Have you considered therapy?”
Have you considered getting a life?
I did, Richard.
But No U.
It’s “unprecedented since….”. Get your quotations correct.
Roy’s parser eats dots, Richard.
Strange that they’re still there then
All four of them when you don’t copy-paste.
https://volcano.si.edu/faq/historical_activity_600years.jpg
Dr. Roy, here’s the reality of the CERES calculations, from Loeb et al. 2018, emphasis mine.
Thus, the real uncertainty has to be the difference between the standard CERES data products and the actual EEI, which is something on the order of 3.5 W/m2 …
Regards to you and yours,
w.
Willis Eschenbach
Thx for comminicating this here.
J.-P. D.
NASA doesn’t appear very proud of Loeb’s educational background. All they list is “Atmospheric Scientist”, whatever that is. But, we know his dog’s name is “Cruiser”.
https://mynasadata.larc.nasa.gov/stem-career-connections/meet-dr-norman-loeb-atmospheric-scientist
I wonder if Loeb works around any physicists. In physics, one learns that flux is NOT required to “balance”. So, the “EEI” is just more anti-science nonsense.
> NASA doesnt appear very proud of Loebs educational background.
https://terra.nasa.gov/people/dr-norman-g-loeb
“He hopes to one day see a multi-decadal climate data record of the Earth’s radiation budget to help improve our understanding of climate.”
He’ll never understand climate if he keeps trying to “budget” radiated flux. Flux is NOT a conserved quantity.
Look up the “solid cone” example and try to learn, Willard. Or, just keep wasting your time trolling. It’s entirely your choice.
> Look up the solid cone example
Right after you do the pole dance experiment, Pup.
Willard chooses to continue being a troll.
That’s probably a good idea because he can’t learn anyway.
You’re trolling with that flux bit of yours, Pup.
The pole dance experiment would be better for your health.
Trolling is what you do.
Do I hear a “No U,” Richard?
Troll
No U.
Alphabet soup anyone?
What’s the good mannered word for butting in, Richard?
Not Willard for sure
No U either.
Willis Eschenbach says: Thus, the real uncertainty has to be the difference between the standard CERES data products and the actual EEI, which is something on the order of 3.5 W/m2 …
The 3.5 W/m2 (or whatever it might be) is a residual bias between the satellite observations of SW and LW TOA. The error between, for instance, individual SW measurements in the time series is much smaller. That is the instrument is biased but stable.
In this study they use an average EEI from Argo to, in essence, calibrate out the CERES EEI bias. They then look at the relative change over time of the Argo measurements and the CERES measurements and find them to be consistent. The uncertainty of consequence isn’t the bias term, it’s the net measurement to measurement relative uncertainty.
Mark B, they fool you with all that nonsense.
Flux can NOT be added/subtracted/divided/averaged. You can NOT have an energy balance based on flux alone. Flux is NOT conserved.
And object at equilibrium can emit much less than it absorbs. A blackbody sphere absorbing 960 W/m^2 only emits 240 W/m^2. 960 does NOT equal 240.
Sputnik V vaccination has begun in Slovakia. The pass round of the Russian vaccine to the motherland was accompanied by a civic calumny and led to the abandonment of Prime Strife of the the religious ministry Igor Matovich and a reorganization of the government. As a denouement, the sphere received the Russian vaccine, undeterred by the low-down that neither the European regulator nor the WHO has furthermore approved it.
In neighboring Hungary, which approved the fritter away of Sputnik in February as the principal in Europe, more than 50% of the mature natives has already been vaccinated; in Russia – a paltry more than 10%. In Slovakia, five thousand people signed up toward the Sputnik vaccination.
Dear administrator, You can write information about your blog on my bulletin board.. You can present another article on this point at this association https://amso.rabaty.site
My Problem with the conclusions of Climate Scientist (Except Dr. Spencer and Christy of course): The Multiple Dogs that Don’t Bark.
1) Multiple Charts show dog-legs at different time
2) Multiple charts of the same observation vary dramatically
3) If glaciers were melting at an accelerating rate, sea levels would show an acceleration
4) The charts and conclusions reached aren’t consistent with the physics of the CO2 molecule
5) The models profess certainty totally inconsistent with the quality of the available data, if the data is no good, neither is the conclusion
6) Obvious experiments aren’t run and contradictory information is completely ignored
7) Historical temperature charts pretty much demonstrate tremendous natural variation, yet climate models assume Natural Forces are in balance and only man-made CO2 can impact the climate (just think about how absurd that is when said out loud).
8) Climate scientists don’t seem to understand how absurd that statement or assumption is
9) We can’t model the weather 1 week out, the stock market 1 day out, and yet we are being told there is high confidence in climate models predicting catastrophe years in the future
10) Experts make statements that are clearly not factual, often tell half-truths, and fail to correct of clarify when myths are published, Think Mt Killimanjaro melting glacier in sub-zero temperatures
11) They don’t even attempt to control for factors other than CO2 in their research, in fact, they rely on UHI and Water Vapor to make the case for man made warming and attribute it to CO2
https://imgur.com/a/CDasqHH
12) The physics of the CO2 molecule don’t change depending upon the date or location, CO2 doesn’t cause dog-legs or hemispheric differentials
And I could go on and on and on
CO2
12 minor problems
so what?
Do you expect perfection?
A climate crisis is coming in 20 years.
It’s true that prediction was made in every year since 1957.
But the prediction is right.
It’s been peer reviewed and published.
By PhDs with computers.
Big computers!
And 105% confidence (during the consensus confidence show of hands vote, it appears that a few scientists raised both hands — practical jokers.
Just a slight miscalculation with the date of climate doom.
You can’t expect perfection from scientists, or even normal people.
E. Swanson says: June 19, 2021 at 12:27 PM
CO@Lifer, It’s a problem with your eyes:
This is the true power of Progressivism, it can literally brainwash people to to not believing their eyes and simple common sense.
E. Swanson used this graphic to prove his point that there is no dog-leg and that it is a valid and reliable graphic.
https://eos.org/wp-content/uploads/2017/09/ocean-heat-content-atmospheric-carbon-dioxide-measurements.png
Just open your eyes and mind and look at the evidence produced to prove me wrong. You will never see a more Orwellian 1984 example in your life.
1) The level/range in 1982 to 1985 is below the level/range of 1958 to 1968.
2) Volatility and lack of trend define the data before 1985, a clear linear trend, defined as a series of higher highs and higher lows.
3) The R^2 between CO2 and Temperature before 1985 is non-existent, post-1985 is is likely over 90.
4) CO2 increases between 1958 and 1985, Temperatures FELL.
5) The physics of CO2 didn’t change in 1985
6) CO2 and Temp have a near perfect match post 2005, there is no relationship between CO2 and Temp pre-1985
That is the power of progressivism. If you can get a huge number of gullable people eager to join a cause you can do a whole lot of damage. 600k people fought and died to instill Kim Il Sung and communism in N Korea. That is the power of Progressivism and Marxism. It gets people to act totally counter to their best interests. They feed on people that will believe anything you tell them, even when faced with irrefutable evidence as the chart provided by Swanson.
https://imgur.com/5uMtCxf
> CO2 increases between 1958 and 1985, Temperatures FELL.
https://www.woodfortrees.org/plot/best/from:1950/to:1990
Willard, look at the Chart Swanson posted. I already know you can shop around for temperature charts to make any point you want. This is a real simple concept. Swanson posted a graphic to make the point that I was wrong. His graphic totally vindicates me and proves him wrong. Unless climate expert have no knowledge of how to read a graphic, anyone should understand just how wrong Swanson and you are. Anyway, did I miss it? Did you or any of your fellow alarmists explain how CO2 can cause a dog-leg which we now know exists in all these charts?
Life,
You cherrypicked two end points.
You got caught.
That’s all there is to it.
Have some more sea level:
https://en.wikipedia.org/wiki/Sea_level_rise#/media/File:NASA-Satellite-sea-level-rise-observations.jpg
How do you explain that: hippies?
Are you saying that the slope to the left continues downwards in a similar straight line?
No, Richard.
You are.
So how do you think the line to the left would be best represented?
Why would I think about your squirrel, Richard?
Because you are trying to draw conclusions (or lead others too) about what is happening to the right in that graph (the future) without, at the same time, drawing any conclusions as to the left (the past).
A very dishonest way of doing science.
> Because you are trying to draw conclusions
No, Richard.
You are.
How can I be making conclusion outside of the range when I contend that linear slopes are not capable of doing that?
Are you suggesting that the irrelevant conclusion you draw is not a conclusion, Richard?
An observation that a linear trend is only valid over the range it comes from is not a conclusion. It is an observation.
Validity isn’t an observational property, Richard.
Nor is logic to you either, apparently.
Is that a No U, Richard?
Indeed it is!
It’s just you finding something to say.
Are you saying that your “are you saying” wasn’t a way for you to say something without saying anything, Richard?
Idiot
No U, my lil’ dogwhistler.
Salby has talked about this time in the temperature record. He talks about it recently during one of his presentations. The temperature was flat between 1950 and about 1977 and then there was a non systematic step change and then it flattened again. He also showed how CO2 lagged temperature on short time scale.
CO2Lifer, You can argue all you want with the AGU presentation, but notice that they were presenting the same data which Roy used in his latest video and which you copied. The difference is in that the AGU paper included error bars and a smoothed curve which has no “dog leg” in it. You re also ignoring that the warming from CO2 isn’t a linear function and there are long time lags in ocean heat content. There’s also another feedback due to the reduction of sea-ice and snow, which Roy ignores in his 1-D model, but which results in greater warming at high latitudes. Then there’s the Thermohaline Circulation, which exhibited a significant reduction in the early 1990’s, seen particularly in the high latitude North Atlantic.
I love your radical right Red Scare screed from 1963. That’s the sort of crap which got the US deeply involved in Vietnam in an attempt to slow the Communist march to take over the world (after China went communist, the Korean War and Cuba’s revolution/missile crisis), one “domino” at a time. I suggest that you stick to the latest batch of Q-Anon conspiracy theories, they are much more fun to debunk.
We don’t need no stinkin’ data, or always wrong wild guess predictions of a coming climate crisis, CO2
We have about 7 billion witnesses who LIVED WITH actual global warming, for up to 45 years, since the mid-1970s.
And every person alive today has lived with rising CO2 levels for all of their lives.
No one was harmed.
No emergency
No crisis
Not even a minor problem !
Now’s your chance to plug your favorite Burke quote, Richard!
“Willard is a dingbat”
Is that the quote you meant?
Richard Greene,
I hope you didn’t hurt the feelings of too many dingbats. They might not appreciate having Wee Willy as one of their tribe. Lowers the tone of dingbats generally, I would imagine.
No, Richard.
It’s “You can never plan the future by the past.”
Which is silly, if you think about it.
The trick is to do as the other Richard does and not to think about it.
“”It’s You can never plan the future by the past.”
Which is silly, if you think about it.”
So Willard is more thoughtful than Edmund Burke. (In Willard’s own mind)
No, Richard.
Every animal is.
Every animal is what? More intelligent than you? Quite probably so.
I love how you play dumb while issuing a No U to that effect, Richard.
Is it that you are dumb? Or the rest of the world is? That is the real question.
Animals plan, Richard:
https://www.theatlantic.com/science/archive/2019/06/surprising-complexity-animal-memories/589420/
And if we extend the concept to intention-guided behavior, it goes beyond that kingdom:
https://researcher.watson.ibm.com/researcher/view_group.php?id=8432
Even your mindless retorts are planned in some sense.
Whereas yours are just repetitive
That would be U, Richard.
The main problem with these findings is very obvious from NASA’s own website describing the rate of increase in thermal expension of the ocean, as an important part of sea level increase.
The trend is not accelearing in this period, and as Dr. Spencer mentions affected by cyclic episodes – most obvious descelerating after 2015-16.
https://sealevel.nasa.gov/understanding-sea-level/key-indicators/steric-height
Sea levels are increasing? Not at these locations. Many things, the least of which are CO2 and atmospheric temperatures impact sea levels.
https://imgur.com/a/siHPINY
Actually, temperatures aren’t increasing either if you control for UHI and water vapor.
https://imgur.com/a/CDasqHH
CO2Lifer, Norway’s sea-level is receding because of isostatic rebound after the glaciers melted after the end of the LGM.
There’s no UHI in the satellite record or in the oceans.
E. Swanson, the North East Coast sea level of America level is rising because of the same bit opposite effect. All I hear about is that alarmists claiming that CO2 is causing the warming.
https://imgur.com/aWjDRIB
https://imgur.com/KemP0Rk
https://imgur.com/4ofE0B7
https://imgur.com/7mvIPho
Care to provide evidence from your side refuting my evidence?
Yes, the area around Hudson Bay in Canada is rising, also due to isostatic rebound. Nothing new here, keep moving. Careful, you might actually learn something about climate change.
Once again Swanson, you have evidence of sea-level increase in some areas, I repeat some areas. What possible evidence do you have to tie CO2 to the sea level rise? The only way you can tie CO2 to sea level is to do what Dr Spencer says climate models do, you assume Narural Forces are in balance so the only source allowed in the model is due to man. That is fraud and will always give you the answer you want, it is only allowed to give one answer, man is the cause. By what mechanism does CO2 cause sea level to rise?
https://imgur.com/a/siHPINY
Correlation isn’t causation. You need a valid hypothesis and supporting evidence. YOu don’t have them other than failed computer models.
“Correlation isnt causation. You need a valid hypothesis and supporting evidence. ”
We have it.
1) Increasing CO2 increases DWLR.
2) Increasing DWLR increases the temperature of the ocean surface film and the atmospheric boundary layer.
3) The temperature gradient across the ocean surface decreases.
4) The equilibrium temperature of the ocean increases.
https://skepticalscience.com/How-Increasing-Carbon-Dioxide-Heats-The-Ocean.html
Ent, you went off the cliff at 2).
One of your problems is that your source is a Warmist site.
ET Says:
We have it.
1) Increasing CO2 increases DWLR.
No it doesn’t at current concentrations. There are a finite number of photos and the current level of CO2 and H20 absorb them. In other words the atmosphere is saturated with GHGs, and at higher altitudes they actual aid cooling. When you isolate the impact of CO2 you get no warming at all.
https://imgur.com/a/CDasqHH
https://imgur.com/a/IrE63Xo
2) Increasing DWLR increases the temperature of the ocean surface film and the atmospheric boundary layer.
Prove it. H20 saturates the air above the oceans and adding CO2 won’t change anything. Taking the 101st aspirin won’t cure the pain that is no longer existent.
https://imgur.com/cBaqWUJ
3) The temperature gradient across the ocean surface decreases.
CO2 evently blankets the globe, so its contribution is constant. The gradient that matters is the depth gradient, and LWIR doesn’t penetrate or warm the oceans. If you claim it does, so me a legitimate experiment that proves that 13 to 18 Micron wave length warms water. Hint, Ice emits higher energy LWIR than that. If LWIR between 13 and 18 microns could warm water Ice would melt itsenf. Do you understand that concept? Ice would melt itself if what you claim is true. SImply get an IR meeter and point it at ice. It will register near 10 or 11 microns, well above the energy of the 15 microns CO2 emits.
4) The equilibrium temperature of the ocean increases.
Oceans increase when you allow more visible radiation to reach them. Water has the highest specific heat of all common materials. The PDO clears out clouds resulting in more visible warming radiation to reach the oceans. Willard points that out below.
For the lurkers I can clarify this by adding a bit more detail.
3a) The rate of heat loss from the ocean drops below the rate of heat input.
3b) Extra heat accumulates in the ocean.
3c) The rate of heat loss increases until it balances the heat input.
Whether you believe in the effect of not, it has been experimentally observed.
https://agupubs.onlinelibrary.wiley.com/doi/full/10.1002/2017JC013351#:
CO2Lifer can’t even bother to read the sea-level summary on Wikipedia, posting the same cherry picked graph which is easily explained by glacial rebound. Other locations around the Earth show a rise, yet CO2Lifer ignores the evidence, which is supported by the many references on the Wiki page.
Then, we find the usual denialist claim that the AOGCM’s aren’t perfect, so they can be ignored. Well, I think we know that and we also know that Dr. Spencer’s model is even less accurate, even as he found warming from that effort. You seem to forget that the UAH satellite analysis is based on the same physics as that for CO2’s warming, so shouldn’t you also extend your denial to their work as well?
Ent, it has NOT been “experimentally observed”.
That “paper” is just more of the anti-science nonsense.
Want one example? What is the measured DWIR when they are measuring the surface penetration? What was the corresponding air and water temperature?
“What is the measured DWIR when they are measuring the surface penetration? What was the corresponding air and water temperature?”
Look at figures 8,9,10 and 12.
Those figures are all good examples of anti-science nonsense: “Time-averaged heat balance”!!! Trying to represent SH and LH as fluxes?
What is the measured DWIR when they are measuring the surface penetration? What was the corresponding air and water temperature?
EM,
Quite apart from the fact that the paper contains no reference whatsoever to an “experiment” of any sort, the following extract from the abstract is illuminating –
“Thus, more heat beneath the TSL is retained leading to the observed increase in upper ocean heat content.”
Rubbish. Warmer water floats on colder water. No increase in temperature of the colder, denser water beneath. Then, at night, the surface layer cools, descends, allowing displaced water to replace it at the surface, cooling in its turn. The net result is that deep abyssal water is at its maximum density, generally around 3 C.
Obviously too complicated for the authors to accept. They probably work for the Government in one form or another.
Swenson, The density of pure water (i.e., distilled) is a maximum at about 4C. However, for the oceans, the high salt content results in increasing density all the way down to the freezing point, which is about -1.8C. The low temperature of the bottom waters is the result of high latitude waters sinking due to sea-ice formation, which releases salt into the water below the ice, making it even more dense. This sinking has nothing to do with the day/night daily cycle, except that the coldest waters will occur during the polar winter night as the waters freeze.
ES,
You wrote –
“The low temperature of the bottom waters is the result of high latitude waters sinking due to sea-ice formation, which releases salt into the water below the ice, making it even more dense.”
No.
Climate crackpots use new-age physics, which has water cooling in high latitudes, and then magically flowing from the North and South cold regions towards the Equator, up hill, down dale, crossing mid ocean ridges emitting molten magma directly through the crust, and crossing observed crystal hotspots without changing temperature.
You may not be aware of ancient ice making methods in various desert regions, using the fact that water will cool to below freezing, even when ambient air temperatures are well above freezing. Professor John Tyndall gives a lucid account of experiments supporting his explanation for this phenomenon, nearly 200 years ago.
No need for high latitudes to create conditions for dense cold bottom waters.
Here’s the sort of thing –
‘Warm monomictic: water cools to near 4C in winter, when turnover may occur. Lakes are stratified during other times of the year and are not ice covered. Lakes in the tropics or low altitudes in northern temperate areas can be warm monomictic.”
Of course, deep tropical lakes such as Lake Tanganyika have warmer bottom waters, with unknown numbers of geothermal vents emitting unknown quantities of water at measured temperatures up to 103 C. Tends to keep the bottom waters above 4 C!
Basically you are talking rubbish. Just more climate crank wishful thinking.
Swenson/Flynn, Yes, freshwater lakes do tend to turnover in winter. But the oceans are not filled with freshwater (DUH). Are you seriously arguing that the well known physical properties of sea-water are wrong? Oceanographers been learning about the oceans for many decades, long before concerns about the oceans’ roll in climate change.
Your refusal to accept established facts is not unusual these days, the US Republican Party can’t accept our duly elected President, having become the Trumpian party.
For those who rely on sea level observations it would be wise, as any sailor will tell you, that tidal observations and predictions require some inclusion of lunar and solar orbits, atmospheric pressure, wind direction, fetch, and duration, bottom profile, depth and type, off shore and coastal profiles, bays, estuaries etc. to even get close to what will actually happen at the next tide at any given spot.
Simple isn’t it?
Oh, and that is without any consideration of land movement, either rising or falling.
“Sea levels are increasing? Not at these locations.”
No one in Climate Science is claiming that Sea Level Rise should be uniform, nor ignoring the GIA.
No one in Climate Science is claiming that CO2 is the ONLY driver of Temperature. Thus CO2 can rise when Temperature falls, as it did due to La Nina this year.
Continually knocking down these notions that no one is supporting is rather pointless.
CO2 has become our most reliable STRAWMAN specialist.
Nate Says: No one in Climate Science is claiming that Sea Level Rise should be uniform, nor ignoring the GIA.
Sure, my point is that there are countless factors that impact sea level, the vast majority aren’t measured. There is no way to claim CO2 is causing sea level increase. Where are your measurements for erosion? Tectonic Plate Shift? Underseas Volcanoes? You don’t have any supporting data, yet you claim CO2 is the cause without even having any supporting data.
Climate Science relies on cherry-picking data, that is all they do. I simply turned the tables and you did a great job highlighting how inappropriate such a tactic is. Care to explain how the Mt Kilimanjaro glacier is melting in sub-zero temperatures?
https://imgur.com/7nnfPK3
What about leprechauns, mermaids, sea monsters and politicians?
EM,
What about them?
They all can be killed by an Aussie animal that looks cuddly, Mike Flynn.
A bit look you, except for the dangerous part.
Swenson
“What about them? ”
CO2isLife has not considered their contribution to sea level rise.
Global average surface air temperature remains around 15 C and there is difference of average surface air temperature in Northern and Southern Hemisphere- the Southern Hemisphere is about 1 C cooler than Northern hemisphere.
Both average land and average ocean surface air temperature of southern hemisphere is lower than northern hemisphere.
Why and how it’s different can be “blamed” on various things, ie Africa is mostly in northern Hemisphere. And how one decides to measure Antarctica surface air temperature. And how you count the arctic ocean.
Trying to follow the crazy rules that appear to exist {not making my own crazy rules].
It appears average land surface air temperature in northern hemisphere is about 12 C, and with southern hemisphere it is about 8 C. Giving global average surface air temperature of about 10 C.
Other than Africa, Australia land mass is major player in bringing up the Antarctica cold average temperature in southern hemisphere.
And as said, large amount African land mass above equator counter balances the coldness of Canada, Greenland and Russia.
The ocean average global surface temperature of about 17 C, has south having about 16.5 and North being about 17.5 C.
The coldness of large amounts ocean water in southern hemisphere Ocean would be colder if not due to the Indian Ocean, and northern hemisphere get it’s bump up due to vastness of the Pacific Ocean tropical ocean [and shortage of northern cold surface waters {or it has a lot more cold southern surface waters]. One could say the vastness immovable coldness of Antarctica land mass has large effect upon vast southern Water.
Or Antarctica location as land Mass is only reason Southern Hemisphere is colder than Northern Hemisphere.
But as I said, Earth average surface temperature or Earth average temperature is the temperature of entire ocean- which has average temperature of about 3.5 C.
In terms of “real” temperature, the arctic ocean is the coldest ocean. Arctic Ocean is both coldest ocean in terms it’s entire volume of ocean water, and it’s surface temperature.
If arctic ocean had average or uniform temperature of 5 C, it’s CAGW that CAGWers are looking for. Earth’s vast deserts would all green like crazy [other than vast desert of vastness of immovable coldness of Antarctica land mass]. CAGWers are always hopeful about a possible changing of the coldness of Antarctica- but also ever hopeful about communism- or they have serious mental problems or massive delusions of changing things.
But roughly there is uniformity in terms entire ocean temperature and if most ocean warms to 5 C {from 3.5 C} it will warm the arctic ocean. Or arctic ocean could still remain coldest ocean, but it could warm up a lot- ice free summers, and even ice free winters. Weather cause not to ice free in winter, I mean most of time one could have ice free summers [or even winter] anyhow, we long way from that- and may never [in this interglacial period] have this, again.
Now, on to more practical matters of how to green the Sahara desert without waiting for global warming to do it.
A problem with greening the Sahara deserts is, it would [or “should”] increase global air temperature.
One might ask, if the hottest continent gets hotter, will Africa have more snow?
Africa doesn’t currently have much snowing. The coldest country in Africa, Lesotho, does snow. It’s average yearly air surface temperature is about 14.5 C. Or it has slightly lower average temperature than California {and it snows in California and it even snows in spot where highest daytime air temperature was recorded in in whole world- which about 300 miles from where I live, btw, we got some summer, here, and had daytime high of about 112 F. It looking like summer was never going to start, but now it’s summer}.
It fair to say, that if one greens the Sahara desert, it will not have much effect upon Lesotho- Lesotho will continue to snow- it’s very far, far south of Sahara Desert. Anyhow near the greened Sahara desert it seems it could snow more in some places. And snowing in US doesn’t lower average temperature in US and could considered a “warming effect”. So area near Sahara which currently reach night time temperature of below 0 C, could be warmed by snowing.
“Near-freezing temperatures in north-central Guinea in January destroyed crops and livestock on which thousands of people depend for food as well as cash.”
https://www.thenewhumanitarian.org/report/83042/guinea-record-cold-snap-destroys-crops-kills-hundreds-animals
Guinea is lot closer the Sahara than Lesotho- or warming effect of green Sahara might prevented that cold weather. Might have snowed on mountains tops and rained at lower elevations.
Now, one reason why one should think greening Sahara, will cause global warming, is because Africa will dump less heat into space, and Sahara desert is a big place that dumps lots of heat into space. Hot daytime and cold nights.
And one should always think of global warming as causing more uniformity in global temperature, mostly making nights and winters warmer.
The next issue is how to green Sahara. Or what way greening the Sahara require least costs or least amount of total manhours to make it green.
I have to chuckle just a little bit about your statement
Secondly, since we don’t have good global energy imbalance measurements before this period, there is no justification for the claim, “the magnitude of the increase is unprecedented.”
Actually, since there is no data, the implication that there really is no precedent (unprecedented) is actually pretty accurate. :<)
“We can therefore expect even greater changes in climate in the coming decades if internal variability associated with the PDO remains the same. If the PDO were to reverse in the future, that reversal would likely act to decrease the rate of heat uptake.”
Who knew that the PDO was so central to their conclusions? Though Roy did point it out.
> Who knew that the PDO was so central to their conclusions?
From the Verge article:
https://www.theverge.com/2021/6/18/22539924/earth-trapping-heat-climate-change-nasa
Theres another factor at play too natural changes to a climate pattern called the Pacific Decadal Oscillation. Between 2014 and 2019, the pattern was in a warm phase which caused fewer clouds to form. That also meant more heat could be absorbed by the oceans.
I’ve said that 1 billion times. Look for something that would allow more warming visible radiation to reach the oceans and you will get warming. It has nothing to do with CO2…Duh!!! Visible radiation warms the globe. To warm the globe you have to warm the oceans. To warm the oceans you need more VISIBLE radiation reaching the oceans. Anyone outside climate science knows that. Thanks Wallard for making my point and demonstrating that CO2 has nothing to do with the warming. How do the models account for the PDO? They assume all natural factors are in balance so any resulting warming must be due to CO2.
https://www.theverge.com/2021/6/18/22539924/earth-trapping-heat-climate-change-nasa
Witless Wee Willy,
You are a gullible fool. Nothing “holds on” to more heat. Another who thinks so is delusional.
Give it a try. Appeal to the authority of someone who has demonstrated by experiment that they have made something “hold on” to more heat.
All matter in the universe is hot. Remove the heat source, matter cools to absolute zero. Unless you subscribe to the woke physics of the climate crackpots, of course!
Try accepting reality – just stop being an asshat for a few moments. Add heat in the form of ice to your hot soup. Watch the soup cool, even though you have added energy.
Put some insulation between you and the Sun, and immediately feel cooler.
Or you can believe that adding ice to hot soup makes it hotter, and that blocking the rays of the sun likewise increases temperature!
I don’t expect you to understand, because you are idiotic climate crackpot.
Surprise me.
Good morning, Mike Flynn.
I know. The quote was from their paper.
https://agupubs.onlinelibrary.wiley.com/doi/epdf/10.1029/2021GL093047
> I know.
Anyone who read the Verge article Roy cited also knows.
So your “who knew” was a dud.
“Their results were published in Geophysical Research Letters this week.” refers to the original paper I quoted from.
Not big on irony are you?
Richard,
Here is what you said: Who knew that the PDO was so central to their conclusions? Though Roy did point it out.
Not only did Roy point it out, so did the Verge article he criticizes. And in fact so does the press release:
https://www.nasa.gov/feature/langley/joint-nasa-noaa-study-finds-earths-energy-imbalance-has-doubled
So what are you ironizing about exactly?
It’s not by reading Roy’s post or your comments that we’d know that the energy imbalance only doubled.
Wandering Wee Willy,
You do realise that the PDO is only a pattern of observed temperatures, don’t you?
The PDO neither contributes energy to, nor removes removes heat from, the Earth system.
Baron Fourier realised that during the night, the Earth loses all the heat it absorbs from the Sun during the day, plus a little bit of the Earth’s own store of internal heat. Hence, the cooling of the Earth since its creation, Winter being colder than Summer, temperatures falling at night, and similar phenomena.
This is all too much for some climate crackpots at NASA and NOAA. I suppose if you are well paid to promote fairy tales and fantasy, you keep doing it.
Mike Flynn,
Go on.
“Who knew that the PDO was so central to their conclusions?” /irony
Does that help you?
Who knew that the wriggles in the PDO were so important? /irony
Shen, C., W.-C. Wang, W. Gong, and Z. Hao. 2006.
A Pacific Decadal Oscillation record since 1470 AD reconstructed from proxy data of summer rainfall over eastern China.
Geophysical Research Letters, vol. 33, L03702, February 2006.
https://www.researchgate.net/figure/The-results-of-MTM-and-wavelet-analysis-on-the-reconstructed-PDO-a-MTM-spectrum-90_fig5_251436097
No, Richard.
It does not help you.
Well as you are way beyond any help that should not worry you.
Twas just a flesh wound, Richard.
Not even worth a No U.
Black Night are you?
https://www.youtube.com/watch?v=ZmInkxbvlCs
No U, Richard.
And you miss a K.
It’s the Sun stupid
https://bit.ly/2SfMpKf
In addition, our ML model forecasts a new phase of extended solar minima that began prior to Sunspot Cycle 24 (ca. 2008–2019)
Yet we have just had the warmest decade , so is it the Sun stupid?
It’s a great pity that you did not continue that wavelet analysis further in time to allow the lower part of the graph to come more into view.
Continuing it to >100 years might prove fruitful
See https://www.researchgate.net/figure/The-results-of-MTM-and-wavelet-analysis-on-the-reconstructed-PDO-a-MTM-spectrum-90_fig5_251436097 for a similar analysis for the PDO
I do realize that the data length will not allow you to do that of course.
What I should have said was
“Its a great pity that the data did not continue that wavelet analysis further in time to allow the lower part of the graph to come more into view.”
It’s amazing to see how cycles are welcome when they show something in the right direction (translate: ‘cooling’).
And above all: what would say TrickZone’s Gosselin – and hence, Eben, his gulliblest follower on this blog – if Machine Learning would show warming?
” Vade retro, Satanas! ”
J.-P. D.
Weird Wee Willy wrote –
Mike Flynn,
“If you cared about honor, youd tell Roy that youre Mike Flynn.
You would not hide under a sock puppet to bypass his ban.
Is this clearer this time?”
Clear. You are still a delusional climate crackpot unable to face reality. Why would you expect me to do anything at all at your behest? You are more deranged than I thought, kiddo!
Oh dear, Wee Willy, your unsubtle attempts at manipulation don’t seem to be going so well, do they?
I’d suggest you concentrate on science and fact rather than “silly semantic games”, but you are too firmly embedded in your fantasy world to contemplate reality.
Continue with your idiocy. It suits you.
Mike Flynn,
You ask:
“Why would you expect me to do anything at all at your behest?”
I don’t.
Honoring Roy’s decision to ban you would be for him and for you.
You will do as you please.
You always do.
Wearisome Wee Willy,
If you expect anybody to congratulate you for stating the blindingly obvious, I fear you are doomed to disappointment.
Mike Flynn,
Congratulations are the lesser of my concerns.
Sleep well,
willard…”the more greenhouse gases we emit, the more heat they trap”.
And how, exactly, can GHGs trap heat? That zany idea comes from the notion that the glass in a real greenhouse is trapping infrared energy. We know that the glass is trapping molecules of air that has been heated by the soil and greenhouse infrastructure.
Heat is the kinetic energy of atoms. Without mass, i.e atoms, there can be no heat. So, how exactly do atmospheric molecules trap heat like the solid glass in a greenhouse?
That’s why heat cannot pass through a vacuum. An ideal vacuum is an absence of atoms…no atoms, no heat.
GHGs can trap about 5% of the surface radiation, theoretically, but so what? They can convert that IR to heat, but so what? The GHGs are in a colder part of the atmosphere and they can do nothing with that heat.
One AGW argument claims that GHGs can reduce the rate of IR radiation from the surface therefore affecting the rate at which heat is dissipated. Based on the S-B law, the only mechanism capable of doing that is the entire atmospheric temperature. That is, the rate of heat dissipation at the surface is dependent on the temperature difference between the surface and the layer of atmosphere touching the surface.
Since those surface are in thermal equilibrium, no heat could be dissipated at the surface were it not for convection. As heated air rises, cooler air is transported from higher altitudes to the surface. Heat at the hotter surface can then be conducted to the cooler heat at the atmosphere surface layer.
Lindzen has claimed that without convection the surface temperature would be around 70C.
That surface layer air is 99% nitrogen and oxygen, therefore N2/O2 are responsible for the rate of surface heat dissipation, not the scant 0.31% of the entire atmosphere made up of the major GHGs WV and CO2.
Furthermore, according to R.W. Wood, a former expert on gases like CO2, the N2/O2 mix once heated cannot release the heat easily, therefore the heat is retained by N2/O2, not WV or CO2.
There’s your GHE, heat retained by gases representing 99% of the atmosphere that cannot release heat easily.
“Lindzen has claimed that without convection the surface temperature would be around 70C. ”
From a typical square metre of surface onvection carries away about 80W. Take away that convection and the equivalent warming action is 80W. Increasing the input wattage warms the equilibrium surface temperature by 4W/C.
Thus removing convection would increase the temperature by 80/4=20C.
That would raise the temperature from 15C to 35C. Lindzen’s claim that it would rise to 70C is mistaken.
That was the only paragraph worth correcting. The rest of your Gish Gallop is too absurd to be worth discussing.
Gordon,
Once again you put quotes in my mouth.
Please stop.
I rather suspect that quotes are just one of the few things that people might like to stuff in your mouth. To try and shut you up that is.
Nice try, Richard.
But No U.
Strange alphabet you have.
I have no stock of that company, Richard.
Compare PDO
https://en.m.wikipedia.org/wiki/Pacific_decadal_oscillation#/media/File%3APDO.svg
with temperature.
https://en.m.wikipedia.org/wiki/Global_temperature_record#/media/File%3AGlobal_Temperature_Anomaly.svg
By inspection the slope of the temperature record flattens when PDO is negative and steepens when PDO is positive.
This is what would you would see if the cyclic warming and cooling due to PRO were superimposed on a long term warming trend.
This is exactly what the NASA study describes.
Now take that back to the 1400s in time and make your conclusions then. Has what you ‘discovered’ been true since then?
Shen et al has proxy data for the PDO going back that far.
The amplitude of the PDO is about 0.2C and that’s also the 95% confidence limits of the pre-1880 temperature data.
The effect of the PDO gets lost in the noise before 1880. You can only meaningfully discuss its effect on 20th and 21st century temperatures.
” You can only meaningfully discuss its effect on 20th and 21st century temperatures.”
See Shen et al for disproof of that comment. They take it back to the 1400s in observations of the PDO. Are you saying that it had no effects on temperatures back then?
“PDO. Are you saying that it had no effects on temperatures back then?”
No.
I’m saying that before 1880 you cannot distinguish the effect of PDO from the noise in the temperature data.
It may or may not have had an effect on temperatures, but the data isn’t good enough to tell.
If you’ve read Shen et al you will have noticed that they induced their PDO data from rainfall proxies in China, not from temperature data.
I understand that Shen at al is based on proxy data. What I am saying is that, regardless of if you can find good temperature data way back then, it will have had an effect that is the same as occurred more recently, but back then.
The more recent behavior demonstrates that the PDO has quite a significant effect of global temperatures as the paper Roy references shows.
There are those who claim that the PDO is not cyclic (but with varying length cycles) and that is plainly not true.
> regardless of if you can find good temperature data way back then, it will have had an effect that is the same as occurred more recently, but back then.
And how do you reconcile that idea with your Burkean quip according to which we can’t plan the future with the past, Richard?
“There are those who claim that the PDO is not cyclic (but with varying length cycles) and that is plainly not true. ”
PDO is not like a sine wave produced by a signal generator.
You are talking about it as a precisely defined and predictable phenomenon. It is not.
You cannot precisely define its frequency or wavelength, it’s amplitude or neutral value.
Try listing the date and temperature of the last three maxima and the last three minima. Then use them to calculate the date and temperature of the next maximum and the next minimum. There’s too much uncertainty to allow precise projections.
“PDO is not like a sine wave produced by a signal generator.”
Indeed it is not.
Which is why I use the term wriggles rather than cycles. It would be very unusual for nature to be driven by sine waves (except for tuned instruments). In most cases what we should expect to see if something that occurs at relatively regular intervals with some variation between occurrences. Much as the PDO seems to produce.
If you take the proxy information that Shen et al created and run it greater than 30 year filter over it (as I have shown previously) then you get exactly that sort of behavior out of it.
https://climatedatablog.files.wordpress.com/2014/02/pdo-reconstruction-1470-1998-shen-2006-with-gaussian-low-pass-30-and-75-year-filters.png
Willard: You seem to think that simple quotes are the only way to look at things. Sometimes you are just being would up.
“The more things change, the more they stay the same”
One of the criticisms that DSP, wavelets, etc. often meets is that the real world is not driven by sine (or cos) waves and therefore the outcomes they show can be inappropriate.
Which is why I use rather broad low pass filters which do not suffer from that particular problem. If you use > 1 year, > 15 year, > 75 year low pass filters then you get ALL frequencies that occur higher than those cut points, not ones just concentrated on particular sine waves which tuned filters would produce.
That, to my mind, allows more of nature to show though.
I’m not sure of the link between PDO and temperature.
The Maunder Minimum in 1700 and the Dalton Minimum in 1800 were cold periods which both coincided, according to your graph, with PDO maxima.
If PDO were driving climate you would expect both cold periods to coincide with PDO minima, not maxima.
Heat at the tropics does not necessarily mean heat at higher latitudes.
More generally, X does not generally means Y unless there’s some kind of entailment between the two.
Which is kinda rare in empirical sciences.
Idiots are rare too. You seem to qualify though
No U.
So 25 letters now
Unless…
In this article: https://t.co/EIBMfmGydL?amp=1 opposite conclusions are reached. EEI is decreasing. Asked the author and told me that he didn’t consider sensors’ ageing.
He=Loeb
I am now feeling slightly alarmed.
The New York Times reports:
“A heat dome is baking Arizona and Nevada, where temperatures have soared past 115 degrees this week and doctors are warning that people can get third-degree burns from the sizzling asphalt.
At Lake Mead, which supplies water for 25 million people in three southwestern states and Mexico, water levels have plunged to their lowest point since the reservoir was filled in the 1930s. In California, farmers are abandoning their thirstiest crops to save others, and communities are debating whether to ration tap water.
In Texas, electricity grids are under strain as residents crank their air-conditioners, with utilities begging customers to turn off appliances to help avert blackouts. In Arizona, Montana and Utah, wildfires are blazing.
And its not even summer yet.”
You can definitely worry about the drought in California and Arizona.
http://tropic.ssec.wisc.edu/real-time/mtpw2/product.php?color_type=tpw_nrl_colors&prod=namer×pan=24hrs&anim=html5
This is a typical circulation when the tropical eastern Pacific is cool. A high is maintained over the cool ocean.
https://www.tropicaltidbits.com/analysis/ocean/cdas-sflux_sst_epac_1.png
Curious how, more and more often, the weather is going outside the limits our civilization is designed to cope with.
I wonder why?
I suspect that in previous times people just got on with it regardless of what nature threw at them. Nowadays there is a tendency to complain if things are ‘unusual’.
One of the advantages of modern civilization is that, thanks to air conditioning, people survive to complain about extreme heat waves.
And to central heating, about severe cold.
SAM in positive mode since 1500
https://www.nature.com/articles/nclimate2235
No significant trend in summer flood risk during the twentieth century for the Elbe and Oder Rivers
https://agupubs.onlinelibrary.wiley.com/doi/full/10.1029/2004JD005034
Cool paper. Of note:
Entropic
How did they cope during the Holocene Thermal Maximum, Roman and Medieval Warm Periods?
http://www.drroyspencer.com/wp-content/uploads/US-extreme-high-temperatures-1895-2017.jpg
EPA says we have been here before.
https://bobtisdale.files.wordpress.com/2016/03/figure-gd-1-10.png
Why not cite the EPA then, Denny:
https://www.epa.gov/climate-indicators/climate-change-indicators-high-and-low-temperatures
The record in the US for the last 100 years shows the same general pattern
https://www.thegwpf.com/content/uploads/2019/06/slide24.png
These are wildfires, Denny, and we know that human intervention dominates, something that even the GWPF should accept since it cites a paper that does.
If what you want is heat waves, again the EPA has us covered:
https://www.epa.gov/climate-indicators/climate-change-indicators-heat-waves
Oceanic variability influence on US droughts.
https://agupubs.onlinelibrary.wiley.com/doi/abs/10.1029/2019GL082838
Droughts more severe, extensive and prolonged in NH than 20th C
https://advances.sciencemag.org/content/1/10/e1500561
Southern Ocean surface cooling
https://www.researchgate.net/publication/329372480_Natural_variability_of_Southern_Ocean_convection_as_a_driver_of_observed_climate_trends
Relationship of AMOC and AMV and related climate impacts
https://agupubs.onlinelibrary.wiley.com/doi/full/10.1029/2019RG000644
Natural variability dominates over Indian land mass
https://link.springer.com/article/10.1007/s00704-019-02779-y
Up to 50% of recent Arctic Sea Ice loss due to natural variability.
https://www.nature.com/articles/s41561-018-0256-8
Recent cooling in Yellow and East China Seas
https://www.sciencedirect.com/science/article/abs/pii/S0278434317303588
Southern Ocean SST cooling
https://journals.ametsoc.org/view/journals/clim/31/7/jcli-d-17-0092.1.xml
East Antarctica cooled over last 60 years.
https://www.researchgate.net/publication/321895760_Autumn_Cooling_of_Western_East_Antarctica_Linked_to_the_Tropical_Pacific_ENSO_and_East_Antarctic_climate
Non uniform inter hemispheric temperatures trends over 550 years
https://link.springer.com/article/10.1007/s00382-010-0794-2
Antarctic Peninsula cooling
https://www.nature.com/articles/nature18645
Seesaw teleconnection between Arctic and Antarctic
https://agupubs.onlinelibrary.wiley.com/doi/full/10.1029/2010GL042793
57 extreme droughts and floods in China from 1736 to 2000.
https://cp.copernicus.org/articles/14/1135/2018/cp-14-1135-2018.pdf
Extreme droughts in California and Patagonia during medieval times
https://www.law.berkeley.edu/files/CLEE/Stine_1994_Nature_ExtremeAndPersistentDrought.pdf
Missouri River Basin
“ The maximum persistence of droughts and floods over the past 500 years far exceeds those observed in the instrumental record….”
https://agupubs.onlinelibrary.wiley.com/doi/full/10.1002/2015WR018444
“ The maximum persistence of droughts and floods over the past 500 years far exceeds those observed in the instrumental record….”
Missouri River Basin
https://agupubs.onlinelibrary.wiley.com/doi/full/10.1002/2015WR018444
Droughts in Europe
“Using reconstructed droughts over the last 250 years, we show that although the 2003 and 2015 droughts may be regarded as the most extreme droughts driven by precipitation deficits during the vegetation period, their spatial extent and severity at a long-term European scale are less uncommon.”
https://www.nature.com/articles/s41598-018-27464-4
Proxy reconstructions of precipitation from central India, north-central China, and southern Vietnam reveal a series of monsoon droughts during the mid 14the15th centuries that each lasted for several years to decades. These monsoon megadroughts have no analog during the instrumental period.
https://earth.usc.edu/~stott/stott_papers/Sinha%20et%20al%20%202010.pdf
The wettest period was c. AD 1075 in the Medieval Warm Period, and the driest periods were c. AD 1635, c. AD 1695 and c. AD1805 during the Little Ice Age. Decadal-scale variability suggests that the rainfall forcing mechanisms are a complex interaction between proximal and distal factors.
South Africa
https://journals.plos.org/plosone/article?id=10.1371/journal.pone.0124202
Australia lacks paleodrought reconstructions; however, this work suggests that Australia may also have experienced megadroughts during the Medieval period that have no modern analog.
https://agupubs.onlinelibrary.wiley.com/doi/full/10.1002/2014GL062447
Extremes in moisture such as the 1990s pluvial and the 2000s drought are extraordinarily rare over the Common era in Mongolia but not without precedent in the last 2060 years.
https://advances.sciencemag.org/content/4/3/e1701832.full
This paper presents new high-resolution proxies and paleoclimatic reconstructions for studying climate changes in China for the past 2000 years. Multi-proxy synthesized reconstructions show that temperature variation in China has exhibited significant 50–70-yr, 100–120-yr, and 200–250-yr cycles. Results also show that the amplitudes of decadal and centennial temperature variation were 1.3°C and 0.7°C, respectively, with the latter significantly correlated with long-term changes in solar radiation, especially cold periods, which correspond approximately to sunspot minima. The most rapid warming in China occurred over AD 1870–2000, at a rate of 0.56° ± 0.42°C (100 yr)−1; however, temperatures recorded in the 20th century may not be unprecedented for the last 2000 years, as data show records for the periods AD 981–1100 and AD 1201–70 are comparable to the present.
https://link.springer.com/article/10.1007/s00376-017-6238-8
No AMOC decline
https://os.copernicus.org/articles/17/285/2021/?mc_cid=cbeda0c2d5&mc_eid=b0f93db32f
We conclude that the observed AMOC trend is not significantly different (p> 0.01) from plausible estimates of internal variability.
https://agupubs.onlinelibrary.wiley.com/doi/full/10.1002/2014GL059473
Denny, This work is a comparison of data from RAPID at 26N with CIMP5 model results. Note their conclusion:
Over the 8 years of the study, that works out to a decline of about 4 Sv. The average AMOC at the beginning of the period was about 20 SV, so that change represents a rather large fraction of the total. Of course, 8 years isn’t a long enough period to conclude that this change isn’t due to natural variations. What about the following 10 years to the present? Have you got any data for that?
Negative anomalies inside the southern polar vortex are expanding. The polar vortex in the post-La Niña period is strong. We can be reassured about the sea ice in the south. The ozone hole will also be bigger this year.
https://www.cpc.ncep.noaa.gov/products/stratosphere/strat-trop/gif_files/time_pres_TEMP_ANOM_AMJ_SH_2021.png
https://www.cpc.ncep.noaa.gov/products/stratosphere/strat-trop/gif_files/time_pres_HGT_ANOM_AMJ_SH_2021.png
A drop in temperature inside the winter polar vortex causes a drop in surface temperature (the stratosphere drops into the troposphere in winter).
Summer temperatures in the Arctic will also remain within the average. The reason is simple – in July, the Earth is in its orbit farthest from the Sun.
http://ocean.dmi.dk/arctic/meant80n.uk.php
ren
Summer is exactly the period during which Arctic temperature departures from the mean are the lowest and the least interesting.
What matters there is how the departures behave outside summer time.
J.-P. D.
Solar wind magnetic activity remains at solar minimum. No strong solar flares – isolated sunspots with low magnetic activity.
https://cosmicrays.oulu.fi/webform/monitor.gif
https://www.iup.uni-bremen.de/gome/solar/mgii_composite_2.png
Will there be climate change? Yes they will occur due to a strong decrease in solar activity.
Jumps in solar activity are clearly visible above the 65th parallel.
https://www.cpc.ncep.noaa.gov/products/stratosphere/strat-trop/gif_files/time_pres_HGT_ANOM_AMJ_NH_2021.png
SOLAR DECREASE UPDATE:
https://www.npr.org/2021/06/19/1008248475/the-record-temperatures-enveloping-the-west-is-not-your-average-heat-wave
Now I am alarmed:
“European Warm Spell: On 20 June Germany had the 4th consecutive day with Tmaxes over 35C (the 3rd with 36C+),first 36C in Poland with 36.1C at Slubice. Baltic countries and Belarus exceeded 32C but next days the national monthly records in these countries and Finland are at stake.”
https://twitter.com/extremetemps/status/1406691953304084481
Call your local climate department and have them install one of these quickly
https://bit.ly/3vMNWVA
This is not surprising when the jet stream has a meridional course.
studentb
I live exactly at the place where June temperatures were the highest these days in Germany: the Northeastern region.
Believe me: we enjoy them, just because March, April and May alltogether were boringly cool.
So cool that Gosselin’s TricksZone felt the need to report about an unprecedented cold April!
Grrrand Coooling ahead! So what. Typical Coolista blah blah.
*
Thus keep cool, studentb, and don’t worry about these nice 35 C which soon will disappear. A few years ago, we had 38 C during July, and no one got excited.
In a few days I’ll download GHCN daily again and look at how the Arctic regions above 60N do behave. That might be a bit more interesting.
J.-P. D.
Willard
You seem to have lots of knowledge of climate change but I would suggest deeper investigation into your NPR article. I heard the same story driving home from work.
They mentioned Omaha, NE breaking a record with 105 F. I was looking for data on other cities but the NWS does not seem to have this data style for Phoenix or Palm Springs. The Omaha page has every record high temperature in June. If you look at the data the 105 is in no way unusual, surrounding this record are others and even earlier date in 1936 was a 107 record.
https://www.weather.gov/oax/monthly_climate_records
I think they must have totally forgotten about the 1930’s with several very hot years.
This one shows the extent of the heat wave in 1936 and the drought conditions.
https://en.wikipedia.org/wiki/1936_North_American_heat_wave
A cause for the 1936 heat wave is considered here.
https://www.sciencedaily.com/releases/2015/05/150504101248.htm
The dry conditions created the heat wave and the pressure domes. Western US is experiencing a drought at this time. They then have much higher than normal temperatures. Megadroughts are not new to these areas and have been much much worse in the past with a cooler Earth.
Willard
Maybe read and consider this information.
https://www.mercurynews.com/2014/01/25/california-drought-past-dry-periods-have-lasted-more-than-200-years-scientists-say/
This is why people are skeptical of climate science. They single out this small period of time and generate alarming word choice to frighten an ignorant population into taking some course of action.
This is the part of climate science that bothers me. Science should use all available evidence before forming conclusions on a tiny fraction of information.
Climate Scientists are behaving a CO2isLife does. Like him (cherry picking data on small regions and making sweeping generalizations to support his own belief system, like that Antarctica has cooled means global warming is false). The Climate Scientists are using a drought in the West to peddle fear. If you look historically at the situation this is not at all out of bounds or even remotely close to how bad it can get. The past megadroughts really challenge the belief that a slight increase in global temperatures is responsible for drought conditions in an area that has frequent and persistent droughts.
> If you look historically at the situation this is not at all out of bounds or even remotely close to how bad it can get.
That it won’t be as bad as in a millennium ago might not be the strongest argument against the claim that it’s a pretty unusual event, Norman. And if we start to get a series of such events on a shorter scale, say every five years, that starts to be worrisome.
The best way not to cherrypick data is to take all the indicators we have and build the most complete picture we can. But then we’ll need judgment calls as to how to create some kind of evaluation function out of them.
As long as we’ll need judgement calls, we’ll have contrarians.
Willard
Your point: “The best way not to cherrypick data is to take all the indicators we have and build the most complete picture we can. But then well need judgment calls as to how to create some kind of evaluation function out of them.”
Better yet than judgement calls is to come up with mechanisms that produce deviations from normal patterns in temperature and precipitation and then show how warming or cooling world can actually alter the mechanisms. Running events millions of times on super computers and then calculating some statistical probability that a real event happened because of global warming is a method that will generate tremendous skepticism as it provides no theory or mechanism to explain why such a condition occurs.
Meteorologists are getting better at understanding patterns that produce certain types of weather events, such as severe thunderstorms and tornadoes. They have mechanisms that give some predictability (the degree of unstable air).
For the 1936 drought they believe two unusual hot spots in ocean temperature, one in Pacific and the other in the Atlantic produced the extreme drought conditions which produced very hot conditions and had nothing to do with global warming.
I would be far more interested if the climate scientists would spend time thinking and coming up with mechanisms of why the USA West is in a long term drought pattern. What is stopping the normal rain patterns? Just saying it is caused by climate change is lazy science and also emotionally charged to produce fear to produce a change in large group behavior. Find the cause, then see if a warming world would make the event worse.
They can determine how severe storms can get in regions based upon the instability of the air. Severe storms are frightful but one does not need to push an agenda when reporting the conditions are favorable for severe weather. If climate scientists want to be valuable contributors, they would do much better finding mechanisms and then reporting on them. Then people living in regions could take actions to minimize the effects of a particular climate pattern in a region. One would be to clear cut trees around homes to prevent property loss in fires. Saving water when conditions warrant to reduce suffering during bad times.
If you study the Bible you may recall Joseph interpretation of Pharaoh’s Dream. The 7 fat cows followed by 7 starving cows. Joseph revealed it meant 7 years of abundant growth followed by 7 years of severe drought. With this you can plan and take steps to avoid the worst of bad conditions.
With current climate science, they wait for some bad weather or climate condition (flood, hurricane, fire, heat wave, drought) and then make the great claim it was caused by climate change. You will have to admit this is very lazy science and mostly useless. What does it do? Anyone can do this as well as the experts. Good science would find the cause and conditions that create long term weather patterns and gain some predictability of the future which could then be of great use.
> You will have to admit this is very lazy science and mostly useless.
One may say the same of something of the following:
Do you have anything to substantiate that?
Wayward Wee Willy,
OK. No judgement call needed if you include the entire history of the Earth. No cherry picking, no need for instruments.
The Earth has cooled. No longer has a molten surface. No heating.
Oh, you want me to “prove” the Earth was created with a molten surface, do you?
You are an idiot. You have proved it to my satisfaction. Others can reach their own conclusion.
Your “silly semantic games” do not turn fantasy into fact. CO2 heats nothing, Gavin Schmidt is not a climate scientist, Michael Mann is a delusional faker, fraud, loser and scofflaw.
Climate is the average of weather – no more and no less. A number which controls nothing at all – has no effect on weather, but apparently has an effect on climate cranks like yourself, who believe in stupidities such as the supposed “Greenhouse effect.”
Carry on being an idiot. It’s free.
Mike Flynn,
Have another quote:
https://www.epa.gov/climate-indicators/climate-change-indicators-heat-waves
Try to counter this with your bad ass attitude.
Best of luck!
Wee Willy Idiot,
Climate is the average of weather. If you believe you can see into the future better than a 12 year old, good for you!
Climate crackpots believe that they can predict the future by examining past weather, but I doubt their faith.
Willard
NPR radio is one source for my comment. When some bad weather event takes place they have a Climate Scientist come on and comment how the event is unprecedented and likely caused by climate change, however none provide any mechanism on how a warming earth caused such a weather event. The large number of hurricanes last year was one example, the link you provided is another, the Texas drought in 2012 was another. The Moscow heat wave was one. The blizzards a few years ago in the East coast and record snowfall was another.
These are just a few, it takes place much more often than just those examples. And it is not just NPR, other news media does similar tactics.
All those weather events listed amounted to nothing in terms of climate or a long term shift in patterns. Texas is okay, Moscow is not cooking. One heavy year of snowfall did not produce a series of heavy snowfalls.
I am not sure I could convince you that my words are quite true with past examples, open your mind and listen. Next bad weather event listen to the media and see if some Climate Scientist is not interviewed and claims the event is unprecedented and caused by climate change. Then keep listening for the next event and the one following that one etc…
Norman,
“But CAGW” is the central square of the Climateball Bingo:
https://climateball.net/but-cagw/
Without any specifics, there’s no lead to follow. Same with “but science,” “but alarmism,” or any other square.
Glittering generalities are of no help to me.
Willard
Here is one example for you. If this does not work for you to understand my position on the issue I will consider it a waste of time to continue on this line. You believe what you do but at least listen to the media when some bad weather event takes place and they pull in a Climate Scientist. It will happen several times and the outcome is highly predictable. You seem closed minded on this point. Not sure why.
https://earthjustice.org/features/how-climate-change-is-fueling-extreme-weather
Norman,
You talked about “climate science.” Then you cited the Earth Justice website. If you talk about climate science, I expect you to cite and quote climate scientists, not an advocacy website.
If that website misrepresents the science, then there’s a problem with the website. If there’s no misrepresentation, then what’s the problem? Something tells me that the societal changes AGW may require are not to your liking.
For everything there is a season, and a time for every matter under heaven.
There is precedent for Western US drought destroying a civilization.
Research the Anasazi.
EM,
I assume you have a point, but I am not sure what it is.
Drought has severely affected many civilisations in recorded history. The Akkadians, the Old Kingdom of Egypt, and so on.
If you think this was due to the Greenhouse Effect, I would presume you are a climate crackpot.
I don’t think you are that silly, so you might wish to elaborate on your comment.
Weather is continuously changing. No two days are exactly the same. Chaos writ large.
And so, the average of weather, climate, changes. Droughts, floods, glaciation, desertification, greening, afforestation, deforestation – all part of Nature, to put it simply.
If you think you can bend Nature to your will, eventually you will lose, if history is any guide. Man has existed for a short time, and hopefully a good time. Maybe I’m wrong, but preparing for the worst (as best I can), but hoping for the best, with the aim of living a contented life, seems reasonable to me.
So you see, in my view, alarmism and climate fear seems to be wasting a good worry for no particular reason. Bad luck for the Anasazi. They obviously needed more powerful magic.
Maybe another example of the universe unfolding as it should?
Norman Says: Climate Scientists are behaving a CO2isLife does. Like him (cherry picking data on small regions and making sweeping generalizations to support his own belief system, like that Antarctica has cooled means global warming is false).
That is a gross representation of what I do. Developing a hypothesis and controlled experiment isn’t “cherry-picking” it is sound science.
Let me review the Scientific Method.
1) Make an observation: The Physics of a CO2 molecule are constant, and CO2 evenly blanks the globe. Therefore the impact of CO2 is constant as far as W/m^2, yet regional temperature charts show wide discrepancies. Those differentials must be due to something other than CO2. Those factors are largely the UHI and Water Vapor.
2) Hypothesis: The UHI and Water Vapor effects must be the cause of the temperature differentials.
3) Develop an experiment: Identify locations (not Cherry Pick) that should have minimal impact of UHI and Water Vapor. These are largely cold and dry desert locations and have BIs of less that 20 or so.
4) Collect the data. Search for desert locations and areas with low BIs. Basically you are scrubbing the NASA data and removing the sites corrupted by the UHI and Water Vapor effect. Eliminatin corrupted data and outliers is sound science, it isn’t cherry picking.
5) Analyze the data to see it in fact the identified locations support the hypothesis or reject it. Once again, the locations were chosen to test a hypothesis, not to prove a point that there are some sites that show no warming. I’m sure there are many other sites that show no warming, but the sites I selected were elected to test a previously states hypothesis. That is science, not cherry-picking. Cherry picking is when you look through the data and simply choose data that supports you preconcieved conclusion. My data was specifically chosen to meet certain characteristics of the site, and I did not use the chart pattern as the basis of its selection. That is Cherry-Picking.
6) Here are the results and they speak for themselves and support the hypothesis that if you identify locations that are not largely impacted by the UHI and Water Vapor effect you will find no warming. I didn’t randomly choose Antarctica, Antarctica is the ideal location to control for the UHI and Water Vapor effect. That is how real science is done.
https://imgur.com/a/CDasqHH
Anyway, care to explain why so many locations show no warming with a 33% increase in CO2? That is the real question that needs to be answered. Do the laws of physics cease to exist at those locations?
Also, control for the ice sheet and you find a similar story with the sea levels.
https://imgur.com/a/siHPINY
I made public an assessment 13 years ago, based substantially on paleo data, that “…carbon dioxide change does NOT cause significant climate change.” It was hosted for many years on another site. When I discovered they had finally dropped it (nearly all of the links had died) I reposted it and it can now be seen at https://www.researchgate.net/publication/350530743_Historical_Data_on_Global_Warming_provided_by_US_Government_Agencies . Your analysis is a solid corroboration of that conclusion. Good work!
CO2isLife
Nice reply.
Your first point is an incorrect assumption:
https://airs.jpl.nasa.gov/system/resources/detail_files/215_8252801031_5e6c24afc9_o.jpg
CO2 is not uniform throughout the atmosphere. You have sinks and emission sources so it will not be uniform. Also this image will show that CO2 increase is not caused by ocean outgassing. The warm tropical oceans have lower concentrations of CO2 than the industrial regions in the Northern Hemisphere.
2) there are other things that can change global temperatures. Clouds for one, pollution, large volcanic eruptions. CO2 is just a steady increase, other factors will produce the ups and downs you see. Have you read articles on UHI and how they do take it into account? There are many published articles on how they deal with this knows phenomena.
YOU: “Anyway, care to explain why so many locations show no warming with a 33% increase in CO2? That is the real question that needs to be answered. Do the laws of physics cease to exist at those locations?”
The amount of change of IR from this increase in CO2 is small and can be overcome by other factors in regions.
Norman,
The Omaha bit was based on the the following tweet from the National Weather Service in Omaha/Valley Nebraska:
https://twitter.com/NWSOmaha/status/1405679809053614080
The piece was mostly about the Western heat wave. My takeaway from it isn’t that we are experiencing a record heat wave (let’s hope we won’t live another Dust Bowl!) but that the frequency of such extreme event could be increasing. Probly too early to tell. Still a matter of concern.
Let’s hope the Grand Solar Minimum will attenuate it!
willard…”My takeaway from it isnt that we are experiencing a record heat wave ”
So scientific!!! Willard, a confirmed global warming alarmist, reads a paper and concludes we are having a record heat wave.
You mentioned Dust Bowl. Do you know anything about the 1930s in the US and Canada whatsoever?
Yes I do, Gordon.
You were 15.
Woeful Wee Willy,
You do know that climate is the average of weather, don’t you?
Probably not, judging by your infatuation with the unknown future. Something could be increasing? Or could be decreasing, or even not going to change.
Convince me you can look into the future better than a 12 year kid, kiddo, and I’ll believe you. Demented unsupported climate crackpot claims about the future are not acceptable.
Donkey. Brays loudly, craps everywhere, lashes out at random.
Good morning, Mike Flynn.
Did you know that there’s no need to read your comments?
Have a quote:
https://www.epa.gov/climate-indicators/climate-change-indicators-heat-waves
Silly Billy Willy,
Heat waves are weather! In case you didn’t know.
As to the EPA, you realise that the climate nutters at the EPA are even more deluded than those at NASA and NOAA. They claim there is a “climate crisis”, and appeal to the authority of the IPCC, who at least acknowledge that it is impossible to predict future climate states!
Climate is the average of weather, pup!
You have a way to go before you can run with the big dogs.
Learn some physics, kiddo. Stop being such a gullible ninny!
Mike Flynn,
You might have missed the “from an average of two heat waves per year during the 1960s to six per year during the 2010s.”
How many definition of weather do you know that span over 50 years?
Ho! Ho! Ho!
lol sure https://realclimatescience.com/2019/06/nasa-data-tampering-not-just-for-temperatures/
we have always been at war with eastasia
Ah, teh Goddard. Always great!
Sea levels may not be related to heat waves, Dave.
Silly Willy,
Averages per year? Climate is now yearly averages? Really?
Notwithstanding your “silly semantic games”, you do realise that ” . . . major cities across the United States . . .” is representative of nothing more than what it states – some cities in an area which constitutes less than 6% of the world’s land mass. Who cares?
Have you heard of the UHI effect? The bigger the city, the more pronounced the UHI effect, unsurprisingly. Cities becoming warmer over time – gee, who’da thought?
Got anything useful – like the locations where the mythical GHE may be observed and measured?
You might be an idiot, but at least you are delusional.
Good morning, Mike Flynn.
lol let’s see Goddard vs Willard, yeah tough call there
regardless of how you feel about random bloggers and their claims, anyone who’s actually looked at the original Palmer Drought Index data for ten seconds can see there’s never been another drought close to the 1930s, whatever the hysterical partisan crisis-mongers would like you to believe
and there very likely never will be due another such drought b/c of the intervening land use changes
but since you like Steve so much perhaps you’ll enjoy these as well — feel free to accuse him of “making up data,” that one’s always a fan favorite
https://stevengoddard.wordpress.com/2015/09/03/long-heatwaves-are-a-thing-of-the-past-in-nebraska/
https://realclimatescience.com/1500-years-of-heatwaves/
Teh Goddard is not that random, Dave:
https://timpanogos.blog/2011/05/26/chronic-drought-complicated-by-chronic-denialism/
I should have kept my research on teh Goddard.
But then I never thought any credible Climateball player would ever take him srsly!
Dr, Spencer,
Not that it’s important or adds anything to the discussion, but I have a good friend on the CERES team. We had their family over for a BBQ over Memorial Day weekend. Didn’t discuss “global warming” or “climate change” once.
entropic…” That would raise the temperature from 15C to 35C. Lindzens claim that it would rise to 70C is mistaken.
That was the only paragraph worth correcting. The rest of your Gish Gallop is too absurd to be worth discussing”.
***
You are correcting a former professor of atmospheric physics at MIT by adding 35C onto a fabricated global AVERAGE computed largely from thermometers shaded from the Sun and wind. The oceans account for 70% of Earth’s surface area and a large chunk of the guestimated 15C average.
Lindzen was talking about surface temperatures and I have literally experienced close to what he means. On a summer camping trip to one of the hottest parts of Canada we had to move on because the temperature in the shade was above 40C. A local hotelier told us they used to put a thermometer in the Sun for a laugh and it read in the mid-50s C.
At the camping spot on a river there was literally no convection, not even a whisp of wind. The heat from the direct Sun was unbearable, and that’s in a northern latitude. If thermometers in the Sun can reach into the 50C range, it’s not incomprehensible that without any convection, they could reach 70C.
***
One thing I have noted over and over is your inability to contradict an argument on thermodynamics using the science. Unless you can address the points I made, based on the science of thermodynamics, your gish gallop comment is nothing more than a pathetic ad hom.
Your convection free camp site was a lot closer to the 35C I predicted than the 70C Lindzen predicted.
I give you science and you give me anecdote.
You brandish Lindzen’s qualifications, saying that because hehas higher qualifications than I do he is right and I am wrong. That is the logical fallacy known as the Argument from Authority.
Finally you complain about an ad hominem attack. You are mistaken. I was attacking the poor quality of your arguments. An ad hom is an attack on you personally.
Entropic man
That is now the very best!
Robertson
– whining about an alleged ad hom
– appealing to authority.
1. Robertson is one of the most disgusting commenters on this blog; he can’t stop denigrating science people with brute force ad homs like ‘stinking cheater’, ‘cheating SOB’ and the like – just because he is not able to understand what they wrote.
2. Robertson belongs to those people who all the time discredit other commenters referring to scientific work, with ‘That’s appeal to authority!’.
Ha ha ha.
J.-P. D.
There is a delay between ASRAS and LWOutAS because of the heat uptake of the planet. Is it possible to quantify this lag from the CERES data as a function of time?
studentb
Temperatures on our terrace – near Berlin, Germoney at 1 PM @ UTC+2
– 21.06: 31 C, sunny/cloudy
– 22.06: 16 C, clouds & a bit of rain
Yeah, we had a little heat wave during a few days.
OK?
J.-P. D.
ICE AGE COMING NEAR YOU
https://cliffmass.blogspot.com/2021/06/the-greatest-heat-wave-in-northwest.html
Whacky Wee Willy,
“My own evaluation from looking at a wide range of forecast guidance . . .”.
Oooooh! An evaluation regarding the future!
Who cares? You? If you really care, what do you intend to do about it?
Nothing?
That’s what I thought. You are an idiot.
Mike Flynn,
The evaluation you mock was made by Cliff Mass:
https://en.wikipedia.org/wiki/Cliff_Mass
I thought contrarians liked him.
Ah well.
Woeful Wee Willy,
Any fool can “evaluate” the future in any manner they want, and many do.
The future is unknowable.
I’ll repeat –
“Who cares? You? If you really care, what do you intend to do about it?
Nothing?
That’s what I thought. You are an idiot.”
– and a slow learner.
Mike Flynn,
Enjoy your afternoon.
there is no justification for the claim, “the magnitude of the increase is unprecedented.”
just measured my height and it is unprecedented — I have never been taller
(cough cough in the last month cough cough)
ahem
anyways, if global heat uptake is always positive, why did the troposphere cool, warm, and then cool again over the last ten years? bit tired of hearing how the oceans ate the modelers’ homework
” if global heat uptake is always positive, why did the troposphere cool, warm, and then cool again over the last ten years?”
ENSO
Which is, I believe, modulated by the PDO
https://climatedatablog.files.wordpress.com/2021/06/pdo.jpeg
PDO with 15 year low pass added
https://climatedatablog.files.wordpress.com/2021/06/amo.jpeg
AMO with 15 year low pass added
https://climatedatablog.files.wordpress.com/2021/06/giss.jpeg
GISS with 15 year low pass added
https://climatedatablog.files.wordpress.com/2021/06/had crut.jpeg
Had Crut5 with 15 year low pass added
Remove the space between the d and the c for the url to work correctly
I tried my best to find a correlation between your PDO and Had*crut T record, but it is quite poor.
You try?
Both exhibit cyclic behavior. Which seems to correspond across all sources done so far.
The differences in land based and satellite based sources since 1980 or so is quite striking.
So you don’t want to check if Temp and PDO are actually correlated across the whole record?
Afraid it won’t be?
Are you afraid that they might be in the early record but not more recently? Have to come up with a mechanism to explain that?
To say that the PDO does not exhibit cycles, be they not always of the same length, is to deny the evidence.
https://climatedatablog.files.wordpress.com/2014/02/pdo-reconstruction-1470-1998-shen-2006-with-gaussian-low-pass-30-and-75-year-filters-and-had crut-overlay.png
Your link didnt work
Because of Roy’s parser I had to add a space between d and the c. Remove that space and all will then work.
Nate says: I tried my best to find a correlation between your PDO and Had*crut T record, but it is quite poor.
The argument as I understand it is that warm phases of the PDO impart a warming trend on global temperature and vice versa.
Semi-analytically, that means warm PDO corresponds with positive slope in the detrended temperature and cool PDO with a negative slope. In the linked WFT plot there’s decent correlation between the derivative (hence residual slope) of temperature and the PDO with RLH’s filtering.
The peak residual slope is on the order of +0.0012 C/year which is small relative to the observed warming over the observed period, even ignoring the negative half cycle.
Also the warming in the period shown in the plot seems to be leading the switch in the PDO cycle which makes arguing causality from PDO problematic.
What is it with me and links today?
https://tinyurl.com/nxsf74yx
Interesting. Could be something.
The problem is that if you look at his filtered PDO going back to 1854, we have Had5 going back to 1850, there is no match prior to 1930.
OTOH, on short time scales the PDO and Temp match up too many features to be fortuitous.
https://tinyurl.com/bnn74jd8
Now explain the observation of the PDO going back to 1450 or so in Chen at al.
https://climatedatablog.files.wordpress.com/2014/02/pdo-reconstruction-1470-1998-shen-2006-with-gaussian-low-pass-30-and-75-year-filters-and-had crut-overlay.png
(Remove the space between the d and c for the url to function as expected)
“PDO going back to 1450” but not temperature.
Your green 15LP PDO stops in 1920. Why not show the one from above that goes back to 1850s?
That one does not match 15LP Temp or its derivative for the < 1930 period.
Also the reconstructions going back are very different.
https://byrd.osu.edu/sites/default/files/2021-04/Porter_et_al_J_Climate_2021.pdf
Fig 6
Nate says: Your green 15LP PDO stops in 1920. Why not show the one from above that goes back to 1850s?
Indeed, the correlation between PDO and Had doesn’t seem to hold up prior to 1920 something and the most recent years aren’t following the drop in PDO.
https://southstcafe.neocities.org/pdoAndHad.png
Nice. Very clear.
“Why not show the one from above that goes back to 1850s?”
You have an accurate source for temperature data going back to the 1850s?
One without wide uncertainty bands surrounding it that is?
Uncertainty means it can be anywhere in that band, not purely at the center of it as most wish to assume.
“Also the reconstructions going back are very different.”
Are you suggesting that ice cores are better than rainfall records as a proxy source? Others may differ.
Certainly both cannot be correct.
“Nice. Very clear.”
It shows very clearly periodicity. Do you dispute that?
“It shows very clearly periodicity. Do you dispute that?”
One ‘cycle’ is not enough to establish periodicity. Do you not get that?
This reconstruction makes clear that the 20th century amplitude and duration is not representative, does not repeat in the 19th, 18th, etc.
https://upload.wikimedia.org/wikipedia/commons/thumb/1/11/PDO1000yr.svg/1280px-PDO1000yr.svg.png
But there are other reconstructions that oddly differ.
“You have an accurate source for temperature data going back to the 1850s?
One without wide uncertainty bands surrounding it that is?
Uncertainty means it can be anywhere in that band, not purely at the center of it as most wish to assume.”
So uncertainty means we shouldnt look? What year do you decide to stop looking?
As noted the match is absent < 1930.
I think Mark B. clear description of why this is a problem is still valid.
http://www.drroyspencer.com/2021/06/new-nasa-study-earth-has-been-trapping-heat-at-an-alarming-new-rate/#comment-736371
“One cycle is not enough to establish periodicity. Do you not get that?”
Yup.
“This reconstruction makes clear that the 20th century amplitude and duration is not representative, does not repeat in the 19th, 18th, etc.”
So, pray tell me, what contributes to the up and downs of the summary as shown? Chance?
You want to believe more in a hockey stick than anything else. I don’t.
“So, pray tell me, what contributes to the up and downs of the summary as shown? Chance?”
Anthro Forcings, ENSO, volcanoes, solar.
“You want to believe more in a hockey stick than anything else. I dont.”
Its about evidence, not belief.
So your answer about the AMO is what?
https://climatedatablog.files.wordpress.com/2021/06/amo.jpeg
AMO with 15 year low pass added
So any cyclicity in the PDO is driven by “Anthro Forcings, ENSO, volcanoes, solar.” but any similar cyclicity in the AMO is just ‘well recognized’?
What am I supposed to answer about AMO? It also doesnt appear to be well correlated to Global Temp.
Perhaps the right linear combination of PDO and AMO will be better correlated to Global Temp.
“It also doesnt appear to be well correlated to Global Temp.”
Perhaps it might be better correlated to more local temps.
“https://www.nature.com/articles/nature10946″
Published: 04 April 2012
Aerosols implicated as a prime driver of twentieth-century North Atlantic climate variability
Ben B. B. Booth, Nick J. Dunstone, Paul R. Halloran, Timothy Andrews & Nicolas Bellouin
Nature volume 484, pages228232 (2012)Cite this article
Abstract
Systematic climate shifts have been linked to multidecadal variability in observed sea surface temperatures in the North Atlantic Ocean1. These links are extensive, influencing a range of climate processes such as hurricane activity2 and African Sahel3,4,5 and Amazonian5 droughts. The variability is distinct from historical global-mean temperature changes and is commonly attributed to natural ocean oscillations6,7,8,9,10. A number of studies have provided evidence that aerosols can influence long-term changes in sea surface temperatures11,12, but climate models have so far failed to reproduce these interactions6,9 and the role of aerosols in decadal variability remains unclear. Here we use a state-of-the-art Earth system climate model to show that aerosol emissions and periods of volcanic activity explain 76 per cent of the simulated multidecadal variance in detrended 18602005 North Atlantic sea surface temperatures. After 1950, simulated variability is within observational estimates; our estimates for 19101940 capture twice the warming of previous generation models but do not explain the entire observed trend. Other processes, such as ocean circulation, may also have contributed to variability in the early twentieth century. Mechanistically, we find that inclusion of aerosolcloud microphysical effects, which were included in few previous multimodel ensembles, dominates the magnitude (80 per cent) and the spatial pattern of the total surface aerosol forcing in the North Atlantic. Our findings suggest that anthropogenic aerosol emissions influenced a range of societally important historical climate events such as peaks in hurricane activity and Sahel drought. Decadal-scale model predictions of regional Atlantic climate will probably be improved by incorporating aerosolcloud microphysical interactions and estimates of future concentrations of aerosols, emissions of which are directly addressable by policy actions.”
“The AMO is correlated to air temperatures and rainfall over much of the Northern Hemisphere, in particular in the summer climate in North America and Europe.[17][18] Through changes in atmospheric circulation, the AMO can also modulate spring snowfall over the Alps[19] and glaciers’ mass variability.[20] Rainfall patterns are affected in North Eastern Brazilian and African Sahel. It is also associated with changes in the frequency of North American droughts and is reflected in the frequency of severe Atlantic hurricane activity.”
“So any cyclicity in the PDO is driven by “Anthro Forcings, ENSO, volcanoes, solar.”
No. Your question didnt specify -I assumed you were talking about what accounts for Global Temp variation.
Nobody seems to know what drives PDO variation, other than ENSO.
Well rainfall records in China seem to indicate that whatever drives the PDO has been there regularly since the 1450s.
“530-yr PDO reconstruction from the western side of the Pacific Ocean based on a drought/flood (D/F) index (a five-grade category index), from eastern China for 1470 to 2000, derived from Chinese historical documents.
28 regions with complete or relatively complete (very few gaps, which were filled using the index from their nearest regions) time series and strong PDO signals are selected from 58 available regions in eastern China (2240N, 110122E). These regions located at the two ends of the PDO-related summer rainfall dipole. The warm phases of the PDO coincide with anomalous dry periods in both North and South China, and wet periods in the middle and lower Yangtze River Valley. The opposite moisture regimes exist in cool phases. This pattern is a result of changes in the strength of the summer monsoon and the position of the subtropical high altered by the PDO. During warm phases, the summer monsoon is weak, and the strong subtropical high is located far to the south and west. Therefore, the summer rainfall in eastern China can provide useful information
about the PDO.”
Correcting the liars talking about heatwaves.
EPA has a heatwave index, published this year, with data from 1895 through 2020:
https://elonionbloggle.blogspot.com/2021/06/the-lying-about-us-heatwaves-is-done-by.html
I can describe the data without the usual data mining and/or data truncation:
The index today is about the same as in the late 1890s.
The 1895 to 22020 peak is about 1.3, in the mid-1930s, and the 1930s are, by far, the decade with the most heatwaves.
After global cooling began in about 1940, the 1960s were the low heatwaves decade, with the index near zero.
The index is currently about 0.5
Cherry picking the 1960s as a data start point is a deliberate attempt to create an uptrend for political reasons, ignoring the prior 65 years of data.
That deception is a form of lying.
Anyone who lies about heatwaves can never be trusted on any climate-related subject.
Your source does not trace the provenance of that graph, RM.
If you want me to do the leg work for you, all you got to do is ask.
It’ll cost you, however.
Willard:
Thank You Willard:
Being suspicious and skeptical are important scientific character traits. Also important is the ability to say “we don’t know that” or “I don’t know”.
The post at my link has been improved, based on your input:
https://elonionbloggle.blogspot.com/2021/06/the-lying-about-us-heatwaves-is-done-by.html
The post now includes a link to the EPA chart, and an explanation of how the EPA tries to deceive viewers by deliberately truncating data — starting with the lowest heatwave decade of the 1960s — to create an uptrend to 2020.
The “liar charts” (Figure 1) load first on the page at the EPA link. (Noytr: The EPA also truncated US wildfire acres burned data, using the sane trick to deceive viewers.)
I have provided instructions on how to find the full Figure 3 chart from 1895 to 2020.
The 1960s had so few US heatwaves that all other decades from 1895 to 2020 are higher. Truncating US heatwaves data is lying, and censorship. Claiming the full data chart is still available is not a good excuse. This is typical misleading by leftists. Especially common during the Dementia Joe Biden Administration.
Ric,
In the past, I had allowed that EPA was merely incompetent. (Sect 3 of http://globalclimatedrivers2.blogspot.com ) Given your observations it is looking more like they are being intentionally deceitful; apparently a rather common characteristic of the Deep State.
Oooohhh yeah! The Deep State at work! Tell me how I can join them.
I have been told that it is fun being paranoid and better than drugs.
c,
You have just demonstrated that you need to join nothing, unless you want to deny that you are a climate crackpot!
Is it that much fun being paranoid (like Michael Mann), and convinced there is a global conspiracy headed by Big Oil (or some other vague, undefined enemy) to bring down the heroic climate warriors, who are desperately battling against all odds to save the world from dark forces?
Just how stupid do you wish to look?
You don’t need my help, obviously.
RM,
Thank you for having cited your source. In it should find this link:
https://www.epa.gov/climate-indicators/downloads-indicators-technical-documentation
In the technical documentation on heat waves, you should read:
https://www.epa.gov/sites/production/files/2021-04/documents/heat-waves_td.pdf
Hope this helps improve your rants about FREEEEEEEDOOOOOOOOOM.
Oh Wearisome Wee Willy,
You are stupid enough to use the EPA as an authority on weather?
Join the rest of the climate crackpots.
Mike Flynn,
Where’s your Sky Dragon bench?
Woeful Wee Willy,
Trying the diversion tactic, are you, pup?
What is a “Sky Dragon Bench”, pray tell?
Another of your “silly semantic games”, is it?
You are an idiot, refusing to accept reality. You do know what EPA stands for, don’t you? Environmental Protection Authority. More propaganda than science, unless you can demonstrate the opposite, which of course you can’t, can you?
Bad luck, kiddo. Appeal to another authority – Michael Mann (faker, fraud, scofflaw and deadbeat), perhaps.
Ho, ho, ho!
Mike Flynn,
You asked about the EPA.
My comment quoted Cliff Mass, who’s not from the EPA.
Pray tell more about diversionary tactics!
The EPA is the Environmental Protection Authority?
Well that’s news to me!
Wayward Wee Willy,
Here’s what I asked –
“What is a Sky Dragon Bench, pray tell?”
No question about the EPA. You just made that up.
Bad luck, pup.
You have to learn to mewl before you can bark.
You are an idiot, so drooling and slobbering might be more your style.
Mike Flynn,
Here is what you asked:
“You are stupid enough to use the EPA as an authority on weather?”
Thanks for playing dumb!
I don’t know where people like this genius Richard Greene get their ideas about everybody being a liar, just because the chart they want to see is no longer at the place they want to have for it.
https://www.epa.gov/climate-indicators/climate-change-indicators-heat-waves
Yes … now this master picture, which begins with the data from 1895, has been moved to the anonymous Fig. 3! Horrible.
Comment a-t-on pu dissimuler une information aussi importante? Oh, Mon Dieu, quelle manipulation!
*
Here is another picture telling us a bit more than the simple heat wave plot (it has been derived from similar information collected and processed by John Christy).
For each year starting in 1985, it shows the number per 100,000 observations of daily maximum / low minimum / high minimum temperatures in CONUS:
https://i.postimg.cc/sDvCHwqx/GHCN-daily-CONUS-maxima-minima-nogrid-percentiles-1895-2020.png
It is nice to see
– that the lowest minima are continually decreasing since 1895
– that in 1934 and 1936, not only the highest number of maxima, but also the highest number of highest minima were observed;
– that since around 1970, the highest minima are increasing.
*
But CONUS is CONUS, and not the Globe:
https://i.postimg.cc/28bcsJwq/GHCN-daily-Globe-maxima-minima-grid-percentiles-1895-2020.png
(Of course: the second graph is based on area weighted data, otherwise the Globe would look like CONUS, because 80 % of the worldwide 100+ year old stations are located there.)
It is nice to see
– that here too, the lowest minima are continually decreasing since 1895
– but that here, the correlation between maxima and highest minima looks a little bit different, doesn’t it?
J.-P. D.
I don’t know much about the PDO:
https://postimg.cc/JHLfw9s3
And thus, I’ll come back tomorrow evening with a percentile-based comparison of it with historical ENSO data.
Because somehow I miss a correlation of this PDO stuff with known El Ninos, beginning for example with the 1877/78 edition.
Mal sehen…
Buenas noches from my UTC+2 corner
J.-P. D.
PDO and ENSO are linked, just not in a simple way. I look forward to anything you can bring in terms of insight into their connections.
You may find the linked article of interest. From this one would expect significant correlation between ENSO and PDO, but it would be interesting to quantify that correlation.
Link:
Try again:
https://tinyurl.com/bc9367dm
https://www.climate.gov/news-features/blogs/enso/going-out-ice-cream-first-date-pacific-decadal-oscillation
The above is interesting but it does not cover the fact that the PDO is cyclic. That is, it can be shown to have cycles, which are quite long period in nature.
https://climatedatablog.files.wordpress.com/2021/06/pdo.jpeg
PDO with 15 year low pass added
“cyclic” seems to have lost all its usual meaning.
It no longer seems to mean periodic, no longer seems to mean with steady amplitude.
As the article noted, PDO is a mixture of things, some of which may have cycles, some of which are just noise.
I stretch cyclic to include non-sinusoidal cycles, that’s all.
A Low pass filter does not distinguish between ‘noise’ and cycles, only that they are > 15 years in length.
You could always run a 15 year LOWESS over the data and achieve basically the same thing. Would you consider that to be a useful exerice? If not, why not?
Here is a century of random white noise with the same filter:
https://www.woodfortrees.org/plot/noise/mean:108/mean:144/mean:180
Now plot that (as I did) with the ‘random’ data also and tell me that the summary is not a fair characterization of the data it represents. If the data source you use contains ‘cycles’ then a low pass filter will show it. Not added. Nothing removed.
Just because it is ‘random’ does not mean that there are no ‘cycles’ in it much as you would like to make it seem. And I think we can agree that any examination of the PDO says that it is made up of a lot of things that can be considered to be ‘cyclic’. The paper you referenced said that also.
You still haven’t explained how come Shen et al shows a continuation of the ‘cycles’ discovered in the recent PDO going back as far as the 1450s.
‘Noise’ alone won’t account for that.
https://climatedatablog.files.wordpress.com/2014/02/pdo-reconstruction-1470-1998-shen-2006-with-gaussian-low-pass-30-and-75-year-filters-and-had crut-overlay.png
(Remove the space between the d and c to make the link work as expected)
Sorry. The paper was referenced by Mark B, not by Nate.
https://tinyurl.com/bc9367dm
1. The Aleutian Low
2. The persistence of (ocean) memory
3. The Kuroshio Current
The Shen et al doesnt agree with other ones,
https://byrd.osu.edu/sites/default/files/2021-04/Porter_et_al_J_Climate_2021.pdf
Fig 6
“If the data source you use contains cycles then a low pass filter will show it. Not added. Nothing removed. Just because it is random does not mean that there are no cycles in it much as you would like to make it seem.”
The data source is random white noise from WFT. It is not periodic. Not sure why you wanna claim that contains ‘cycles’.
When you filter and limit the band, noise appears to be ‘cyclic’.
with unfiltered signal
https://www.woodfortrees.org/plot/noise/mean:108/mean:144/mean:180/plot/noise
“The data source is random white noise from WFT. It is not periodic. Not sure why you wanna claim that contains ‘cycles’.”
Not played much with random data have you? Ever heard of the color of noise? https://en.wikipedia.org/wiki/Colors_of_noise
All ‘random’ data contains ‘cycles’. It proves nothing.
In any case, the PDO is not random, as the referenced paper clearly shows.
“When you filter and limit the band, noise appears to be ‘cyclic’.”
How is a low pass filter limiting the bandwidth? Anything, ANYTHING, below the cut off frequency is displayed. Sure it has an upper cut off value but that would only serve to filter out the high frequency noise.
“The Shen et al doesn’t agree with other ones”
You going to tell Shen et al then?
Not even the wavelets match.
Also goes to show your claim about the PDO not being ‘cyclic’ is not true, just shows different ‘cycles’ that is all.
As to if ice cores are more accurate than rainfall records well….
“with unfiltered signal”
Just goes to show that my eyeball of the data shows it has periods in it. That wavy line is central to the points in the ‘noise’ is it not?
As do all of my >15 year data filters. The acid test is ‘is it a good summary of the data presented?’ If the answer is yes, then the validity of the summation is correct.
c.f.
https://climatedatablog.files.wordpress.com/2021/06/amo.jpeg
AMO with 15 year low pass added
“Just goes to show that my eyeball of the data shows it has periods in it. That wavy line is central to the points in the ‘noise’ is it not?”
Seems that this is just pure semantics, then. Not sure why it is important to you to call it a ‘cycle’.
Noise has ‘cycles’ in it that do not repeat and have random phases, frequencies, and amplitudes.
Thats what makes it noise.
This is quite different from, eg, the solar cycle which repeats with a very narrow period range 10-11 y.
ENSO is a bit of a hybrid. El Ninos appear at somewhat random times, but when they do appear, the spatio-temporal pulse is roughly the same shape every time, peaking ~ at Christmas.
It is still the case that 1854-present PDO, that you you showed above, but dont show in your comparison plot, does not match the T pattern for the same period.
Can you add to your graph?
FYI
“cyclic
/ˈsīklik,ˈsiklik/
Learn to pronounce
1.occurring in cycles; regularly repeated.”
“Cyclic | Definition of Cyclic at Dictionary.comhttps://www.dictionary.com browse cyclic
Cyclic definition, revolving or recurring in cycles; characterized by recurrence in cycles. See more.”
Random noise, by definition, does not repeat or recur. It is not cyclic.
Random noise contains all sorts of frequencies. ALL of them. Therefore filtering it will produce those frequencies. If you run a low pass filter over noise it will produce the low frequencies that are present. So you have ‘proved’ nothing.
The facts are that all of nature is driven by periodicity. Some of the periods are approaching sine waves. Some are approaching triangular waves, Some are approaching square waves. Some come and go as other frequencies are modulating them.
Some are pulses that may or may not repeat.
Very, very few are pure random noise. Even less are white noise.
None produce straight lines, such as OLS linear regression does.
“you run a low pass filter over noise it will produce the low frequencies that are present. So you have proved nothing.”
I’ve proved that noise does not fit the definition of ‘cyclic’. It does not contain cyclic or repeating signals, as you had claimed.
Moving on.
The PDO record from 1850 to present does not seem to be correlated to temperature, over long time scales, so, cyclic or not,..now what?
I gather that PDO contains ENSO contributions. That may explain why it is correlated to T on short time scales, since ENSO definitely affects T on short times.
“Ive proved that noise does not fit the definition of cyclic. It does not contain cyclic or repeating signals, as you had claimed.”
No you haven’t. All ‘noise’ contains all frequencies as it should. Passing that thorough a low pass filter will produce whatever low frequencies are present. As it should.
“The PDO record from 1850 to present does not seem to be correlated to temperature, over long time scales, so, cyclic or not,..now what?”
Are you saying that there are no low frequency wriggles in the PDO? Are you saying that despite that wavelet analysis shows that there are indeed wriggles present? Are you arguing against yourself?
“I gather that PDO contains ENSO contributions. That may explain why it is correlated to T on short time scales, since ENSO definitely affects T on short times.”
Are you saying that you do not expect that ENSO is modulated by the PDO? And thus have an impact on temps over much longer periods than just ENSO delivers.
On another subject
https://climatedatablog.files.wordpress.com/2014/02/had crut-giss-rss-and-uah-global-annual-anomalies-aligned-1979-2013-with-gaussian-low-pass-and-savitzky-golay-15-year-filters1.png
(Remove the space between d and c to make the url work as expected)
shows that all temperature sources since 1850 show similar behaviors. What mechanism o you have for that?
RLH says:
“Nate says: The PDO record from 1850 to present does not seem to be correlated to temperature, over long time scales, so, cyclic or not,..now what?”
Are you saying that there are no low frequency wriggles in the PDO? Are you saying that despite that wavelet analysis shows that there are indeed wriggles present?
“The PDO record from 1850 to present does not seem to be correlated to temperature . . .” is clearly addressing the correlation between “wriggles” in the two time series, not their existence.
https://southstcafe.neocities.org/pdoAndHad.png
Mark B; Thank you for that analysis. It is quite interesting how the ‘wriggles’ in the various series match up.
Please also do credit Vaughan Pratt for the 1, 1.2067 and 1.5478 inter stage multipliers for the CTRM (assuming that you used those)
“Are you saying that there are no low frequency wriggles in the PDO? ”
No, obviously not. Where would you get that idea?
Do you not know what correlation means? It means the two signals have wriggles that are not in sync.
If they are not in sync than it is unlikely that wriggles in one CAUSE the main wriggles in the other.
“that are not in sync.” Arghh. Should have said “are in sync”.
“No you havent. All noise contains all frequencies as it should. Passing that thorough a low pass filter will produce whatever low frequencies are present. As it should.”
You said you were not cycle-obsessed, but here you are still ‘finding’ cycles in noise.
Noise contains all frequencies. Some noise has more low frequencies. But those are not ‘cyclic’, in that it they do not have a regular repeating cycle that has some predictability to it.
Noise is random, stochastic, thus not repeating and not predictable.
Did you see Mark B’s graph?
https://southstcafe.neocities.org/pdoAndHad.png
“You said you were not cycle-obsessed, but here you are still finding cycles in noise.”
I can find low frequencies in noise? Who knew they could even exist?
White noise: Equal levels across all bandwidths. Should show identical levels in band pass filters.
Pink noise: Falls of at -3db/octave. More low frequency below than above in band pass filters.
Red noise: Falls of at -6db/octave. More low frequencies than Pink in band pass filters.
Blue noise: Rises at +3db/octave. More high frequency above than below in band pass filters.
Violet noise: Rises at +6db/octave. More high frequency above than below in band pass filters.
Grey noise: A human equal loudness rating. Lowest in the middle of the band.
RLH says:
Mark B; Thank you for that analysis. It is quite interesting how the ‘wriggles’ in the various series match up.
It would be interesting if the PDO and Had series “wriggles” matched up, but they don’t.
“It is quite interesting how the ‘wriggles’ in the various series match up.”
It is quite interesting that you are seeing things that at least two others of us do not see.
In denial maybe?
A precise fit, no. A connection, probably.
A ~50 to 60 year periodic in both cases. Crut4 ahead of PDO in both cases.
Crut4 and Crut4 decadal showing a phase delay of 20 years or so.
PDO and PDO long quite nicely aligned over the overlaps.
“It is quite interesting that you are seeing things that at least two others of us do not see.”
Like you do not see the relationship between GISS and Crut, RSS and UAH I showed earlier
Had5 and PDO go back to 1850s, so > 160 y.
140 y shown here. In there I can see one downward wriggle of ~ 40 y in PDO that matches the derivative of had5 Temp.
Really the rest of the time there is no match to Temp or derivative of Temp.
Both the peaks in the 1930s and the 1990s and the trough in the 1960s match quite nicely.
Of course that is only one ‘wriggle’ so we will have to wait for more data I suspect.
Other than that, periodicity shows up in all traces.
Other climate related sources show similar periodicity, some shorter, some longer. All non-sine waves but that is to be expected.
You seem upset that the PDO is not the only input into global temperatures. I would be surprised if it is. There is a lot of the globe outside of the central Pacific to take account of you know.
“Both the peaks in the 1930s and the 1990s and the trough in the 1960s match quite nicely.”
Nope. Clearly you wear glasses that filter out non-confirming information.
“You seem upset that the PDO is not the only input into global temperatures. I would”
Strange trolling tactic..
RLH says:
Both the peaks in the 1930s and the 1990s and the trough in the 1960s match quite nicely.
The plot shows approximately three complete cycles of the PDO and two warming cycles of Had. This means necessarily that the phase relationship varies which is difficult to reconcile with the hypothesized causality of PDO phase driving the Had temperature anomaly.
Further, if two of the three PDO cycles contributed to the two Had warming periods, it’s problematic explaining how the contribution was relatively large in those cases and was apparently absent or balanced by some unknown effect in the other.
“Clearly you wear glasses that filter out non-confirming information.”
Clearly I am surprised that even that sort of confirmation exists. I expect it to be more complicated with other factors impacting it and other frequencies beating with it and messing up the signal.
But no, you want trivial outcomes dropped on your plate for easy consumption.
Not come up with a reason why GISS and Crut exhibit such similar patterns across many years I note.
“This means necessarily that the phase relationship varies which is difficult to reconcile with the hypothesized causality of PDO phase driving the Had temperature anomaly.”
Who said that one drives the other? Certainly not me. It is much more likely that other factors drive both PDO and Had.
” Who said that one drives the other?”
The one who said this:
“What I am saying is that, regardless of if you can find good temperature data way back then, it will have had an effect that is the same as occurred more recently, but back then.
The more recent behavior demonstrates that the PDO has quite a significant effect of global temperatures as the paper Roy references shows.”
“” Who said that one drives the other?”
The one who said this:”
The paper did indeed show that the PDO (and ENSO) have an impact on global temperatures. That did not exclude the fact that what we are seeing is that both are being driven by other factors and are thus correlated.
The dangers of ‘local’ being extrapolated to ‘global’ has been mentioned elsewhere. Let’s not add to that mistake.
“expect it to be more complicated with other factors impacting it and other frequencies beating with it and messing up the signal.”
IOW, anything goes. Your ideas are fully protected from falsifiability.
As are yours with a hockey stick to support them.
RLH: That did not exclude the fact that what we are seeing is that both are being driven by other factors and are thus correlated.
The difficulty is we’ve established that the data since 1850 shows poor correlation between global temperature rise and PDO.
We have established that it exhibits some correlation. We have not established it has full correlation.
With local versa global that is hardly a surprise.
Any comments of the rather obvious cyclicity of the AMO?
https://climatedatablog.files.wordpress.com/2021/06/amo.jpeg
AMO with 15 year low pass added
Any comments of the rather obvious cyclicity of the AMO?
So what you’re saying Atlantic Multi-Decadal Oscillation is oscillatory over multiple decades? I wonder if anyone has noticed this before?
Of course they have. Are you going to deny it?
Or that it has a period of ~60 years?
“As are yours with a hockey stick to support them.”
A ‘hockey stick’ is an apt description of shape of the long term T record.
It is not a mechanism, as you seem to imply.
The mechanism is Anthro and Natural Forcings. And the hockey stick shape IS consistent with these.
The GHG Forcing is quantitive, and ultimately falsifiable via model data comparison.
“Not come up with a reason why GISS and Crut exhibit such similar patterns across many years I note.”
The reason is obvious. The are based on the same data!
Odd question.
Similar but not identical. That is the puzzle.
https://climatedatablog.files.wordpress.com/2014/02/had crut-giss-rss-and-uah-global-annual-anomalies-aligned-1979-2013-with-gaussian-low-pass-and-savitzky-golay-15-year-filters1.png
Remove the added space to get round Roy’s parser
“A ‘hockey stick’ is an apt description of shape of the long term T record.”
Hockey sticks have been created before to justify the determined reason behind the rise in temperatures. Didn’t go well last time.
“It is not a mechanism, as you seem to imply.”
No, it’s a justification.
“The GHG Forcing is quantitive, and ultimately falsifiable via model data comparison.”
How is the model versa measurement going? In most cases the models are running too hot AFAIK.
https://www.drroyspencer.com/2021/04/an-earth-day-reminder-global-warming-is-only-50-of-what-models-predict/?mc_cid=98f7be9b02&mc_eid=44e134bf32
https://www.drroyspencer.com/wp-content/uploads/68-models-vs-obs-1979-2021-oceans-Fig01.jpg
“That is the puzzle.”
Not really. You can read about their different algorithms.
Another red herring.
“How is the model versa measurement going? In most cases the models are running too hot AFAIK.”
Yes, could be. The jury is out on that.
Clearly the models are capturing the main features of the T record. I am most impressed with modeling from 4 decades ago, that was able to model the previous 100 y, then use that tuned model to successfully predict the subsequent 40 y T rise and its spatial pattern.
https://pubs.giss.nasa.gov/abs/ha04600x.html
But just as related weather models have improved over decades by comparing to observations, climate models are doing so as well.
Consider, eg, how much Hurricane strength and path predictions have improved over time.
“Not really. You can read about their different algorithms.”
Ones that start and finish in the same (or similar) place but differ in the middle.
“Yes, could be. The jury is out on that.”
I refer you to Roy’s article and graph I referenced earlier.
“Hockey sticks have been created before to justify the determined reason behind the rise in temperatures.”
The point of science is to account for what we observe. You can call that ‘justify’ if you like, but that is just political spin.
‘It is not a mechanism, as you seem to imply.’
“No, its a justification.”
There has been a real, physics-based mechanism for GHE forcing since way before it became politicized.
You need to show, scientifically, not politically, why it is flawed.
“Consider, eg, how much Hurricane strength and path predictions have improved over time.”
We are better at weather, true. Doesn’t mean we are any better at climate though. Models versa measurement, as Roy demonstrated, are close to disagreement.
“You need to show, scientifically, not politically, why it is flawed.”
The IPCC allows for way too little natural variation in the climate. They don’t even want to acknowledge the clear cyclicity in the WMO for instance. You will look in vain for any acknowledgement of a 60 year cycle in anything, despite what the AMO records clearly show.
“They dont even want to acknowledge the clear cyclicity in the WMO for instance.”
They dont even want to acknowledge the clear cyclicity in the AMO for instance.
My only defense is that W and A are close together on the keyboard.
“I refer you to Roys article and graph I referenced earlier.”
One paper or one scientist’s take on an issue is generally not the whole story.
I refer you to the articles cited in posts that disagree with Roy’s POV.
“One paper or one scientists take on an issue is generally not the whole story.”
Why do you think that there is only one who disagrees? Oh, I forgot, 97% of scientist agree. How could it be anything else?
Just as the herd says that nothing in nature and climate has a 60 year cycle.
The herd is not always correct.
“IPCC, 97%, Hockey shtick, yada yada yada”
More and more your political biases are showing…
Personally, I think bringing politics into the discussion is is a lazy way out of having to back up your assertions with real science facts.
“Just as the herd says that nothing in nature and climate has a 60 year cycle.”
Well, after this long discussion backing away from that claim, you return to it?
But you have yet to come up with evidence of a 60 y cycle that repeats beyond the mid 20th century.
“The AMO is correlated to air temperatures and rainfall over much of the Northern Hemisphere, in particular in the summer climate in North America and Europe. Through changes in atmospheric circulation, the AMO can also modulate spring snowfall over the Alps and glaciers mass variability. Rainfall patterns are affected in North Eastern Brazilian and African Sahel. It is also associated with changes in the frequency of North American droughts and is reflected in the frequency of severe Atlantic hurricane activity.”
“But you have yet to come up with evidence of a 60 y cycle that repeats beyond the mid 20th century.”
1850 good enough?
https://climatedatablog.files.wordpress.com/2021/06/amo.jpeg
Maybe.
Hockey-stick Mann found oscillations in reconstructed Temps, and even named it AMO.
https://www.nature.com/articles/378266a0
but then lost them:
https://www.nature.com/articles/s41467-019-13823-w
This latter paper goes thru a lot of the history of it.
Your claim that nobody has paid attention to them or acknowledged them seems to be quite erroneous.
In any case, cyclic or not, AMO doesnt seem to contribute much to the Global Temp record.
“However, previous work12,27 demonstrates a very weak projection of any AMO signal onto large-scale mean temperature, as the putative signal is associated primarily with a large-scale redistribution of heat, rather than a mean change in surface temperature.”
“The AMO is correlated to air temperatures and rainfall over much of the Northern Hemisphere, in particular in the summer climate in North America and Europe. Through changes in atmospheric circulation, the AMO can also modulate spring snowfall over the Alps and glaciers mass variability. Rainfall patterns are affected in North Eastern Brazilian and African Sahel. It is also associated with changes in the frequency of North American droughts and is reflected in the frequency of severe Atlantic hurricane activity.“
“lost them” in the models.
Absence of internal multidecadal and interdecadal oscillations in climate model simulations
“Hockey-stick Mann found oscillations in reconstructed Temps, and even named it AMO.”
I must get round to doing all the proxy series I did previously to demonstrate their cyclicity. Mind you, as they don’t update things to the current day, then things will be no different than they were then when I first did them.
https://climatedatablog.files.wordpress.com/2014/02/anderson-mann-ammann-loehle-and-had crut-global-anomalies-aligned-in-overlap-periods-with-gaussian-low-pass-15-year-filters1.png
(usual thing about removing the space between d and c to get the url working correctly)
Again we are back to the issue that anthro forcing can account for the hockey stick shape and magnitude of the rise. While these internal cycles cannot. They have neither the strength nor the time history required to account for the global temperature record.
So are you expecting the global temperature as measured by satellites (say Roy’s UAH for instance) to show a rise or a fall in a couple of days time?
Non sequitur.
Whatever it does, will it help you falsify AGW?
Nothing I say or show will falsify AGW in your mind apparently.
You just believe that chance coincidence of multiple separate factors explains all you see. I don’t. Time I expect will determine who is correct.
Pity you don’t have enough faith in your beliefs to venture what will happen in only a few days now though.
“You just believe that chance coincidence of multiple separate factors explains all you see. I dont. Time I expect will determine who is correct.”
So science tests a physics-based theory, as has been done here. And it passes many many tests. Yet YOU decide that it is all ‘coincidence’?
How do you decide that, other than by applying bpolitical biases?
“Nothing I say or show will falsify AGW in your mind apparently.”
Pls review for me what you think you have shown that falsifies it???
All natural ‘cycles/wriggles’ that are longer than 15 years and which Mann, at least, claims do not exist.
“So science tests a physics-based theory, as has been done here.”
Science is allowed to counter with an observation that natural cycles/wriggles contribute to a lot more than is allowed for in the work done to date.
Or you could just rely on random chance making a whole load of other factors just look like those cycles/wriggles and thus dismiss their existence.
“Science is allowed to counter with an observation that natural cycles/wriggles contribute to a lot more than is allowed for in the work done to date.”
You havent shown us the evidence that they ‘contribute a lot more’, and that there contribution is capable of producing the rising trend.
Sorry, you just havent.
Declarations, beliefs, hopes, desires. None cut it in science.
“Or you could just rely on random chance making a whole load of other factors just look like those cycles/wriggles and thus dismiss their existence.”
What ‘whole load of other factors’? What are you applying random chance to?
You understand that for those of us lacking your particular set of biases/beliefs, we require more than hand-waving speculation.
“The IPCC allows for way too little natural variation in the climate. They dont even want to acknowledge the clear cyclicity in the AMO for instance. You will look in vain for any acknowledgement of a 60 year cycle in anything”
This is simply wrong. There is a whole body of literature studying AMO and PDO, and what cycles are in them. And Mann contributed to that research.
His latest work is one paper on top of a large pile saying different things, hardly the end of the story.
Perhaps you should get these facts before painting a picture with a broad brush.
IPCC on AMO:
https://archive.ipcc.ch/publications_and_data/ar4/wg1/en/ch3s3-6-6.html
“The cycle appears to have returned to a warm phase beginning in the mid-1990s, and tropical Atlantic SSTs were at record high levels in 2005. Instrumental observations capture only two full cycles of the AMO, so the robustness of the signal has been addressed using proxies. Similar oscillations in a 60- to 110-year band are seen in North Atlantic palaeoclimatic reconstructions through the last four centuries (Delworth and Mann, 2000; Gray et al., 2004). ”
IPCC on PDO
https://archive.ipcc.ch/publications_and_data/ar4/wg1/en/ch8s8-4-2.html
“Climate Change 2007: Working Group I: The Physical Science Basis
Contents88.48.4.2
8.4.2 Pacific Decadal Variability
Recent work suggests that the Pacific Decadal Oscillation (PDO, see Chapters 3 and 9) is the North Pacific expression of a near-global ENSO-like pattern of variability called the Inter-decadal Pacific Oscillation or IPO (Power et al., 1999; Deser et al., 2004). The appearance of the IPO as the leading Empirical Orthogonal Function (EOF) of SST in AOGCMs that do not include inter-decadal variability in natural or external forcing indicates that the IPO is an internally generated, natural form of variability. Note, however, that some AOGCMs exhibit an El Nio-like response to global warming (Cubasch et al., 2001) that can take decades to emerge (Cai and Whetton, 2000). Therefore some, though certainly not all, of the variability seen in the IPO and PDO indices might be anthropogenic in origin (Shiogama et al., 2005). The IPO and PDO can be partially understood as the residual of random inter-decadal changes in ENSO activity (e.g., Power et al., 2006), with their spectra reddened (i.e., increasing energy at lower frequencies) by the integrating effect of the upper ocean mixed layer (Newman et al., 2003; Power and Colman, 2006) and the excitation of low frequency off-equatorial Rossby waves (Power and Colman, 2006). Some of the inter-decadal variability in the tropics also has an extratropical origin (e.g., Barnett et al., 1999; Hazeleger et al., 2001) and this might give the IPO a predictable component (Power et al., 2006).”
RLH says:
All natural ‘cycles/wriggles’ that are longer than 15 years and which Mann, at least, claims do not exist.
Assuming you’re referring to link this, Mann is presenting an attribution argument.
It would be nonsensical to present attribution for something which he thought did not exist.
Did Nate and Mark B not attribute any ‘wriggles’ visible in the PDO to various random factors coincidently conspiring to produce just those ‘wriggles’?
Did Mann not try and do the same for the AMO?
I could observe, for instance, that the rise in global temperatures since 1979 matches quite well with the rise in the AMO since that time also.
https://climatedatablog.files.wordpress.com/2021/06/amo.jpeg
https://climatedatablog.files.wordpress.com/2021/06/globe-2.jpeg
RLH says:
Did Nate and Mark B not attribute any ‘wriggles’ visible in the PDO to various random factors coincidently conspiring to produce just those ‘wriggles’?
Did Mann not try and do the same for the AMO?
There is a coherent and well-documented hypothesis with supporting analysis from multiple researchers that suggest the PDO is mostly and the AMO almost entirely is an artifact of improperly considering natural and anthropogenic drivers.
That is to say, the interesting question is not whether the “wriggles” exist in various data series, it is the mechanisms that cause the “wriggles” to present as they do.
“There is a coherent and well-documented hypothesis with supporting analysis from multiple researchers that suggest the PDO is mostly and the AMO almost entirely is an artifact of improperly considering natural and anthropogenic drivers.”
I do not accept that as being conclusive evidence of why the ‘wriggles’ exist. Using chance as an explanation to describe the ‘wriggles’ requires and unusual degree of supposition.
Nobody claimed these studies are conclusive. Science is largely inductive.
The attribution process estimates the causal relationship between control parameters and an observable effect, ideally with reasonable precautions that the relationship be distinguishable from spurious correlation. Whatever criticisms one might have about a particular attribution approach, they generally and explicitly try to rule out “chance”.
“Nobody claimed these studies are conclusive.”
I am not persuaded that what has been presented so far is in any way conclusive.
I think that way too often chance (or other combined random, unrelated, factors) has been used to try and explain away naturally occurring ‘wriggles’.
I am also convinced that using simple band pass filters that are not specific, except in a very broad sense, are the best way to retain any long period signals that are present in climate data without any undue side effects.
Using a 12 month Gaussian filter to remove the annual cycle and a 15 year low pass/band pass Gaussian filter as it then uncovers longer periodicity does just that.
Using a longer 75 year similar ‘corner’ is not yet viable for most climate data unfortunately.
“I could observe, for instance, that the rise in global temperatures since 1979 matches quite well with the rise in the AMO since that time also.”
Matching of ONE rise, while NOT matching the rest of the AMO record, is hardly convincing evidence of correlation, much less causation.
“Did Nate and Mark B not attribute any ‘wriggles’ visible in the PDO to various random factors coincidently conspiring to produce just those ‘wriggles’?
I don’t recall ever making argument about the causes of PDO. I specifically stated that I didnt know what causes it.
What I argued about is whether the ‘wriggles’ in it are ‘cyclic’.
“Matching of ONE rise, while NOT matching the rest of the AMO record, is hardly convincing evidence of correlation, much less causation.”
So you agree they match then?
“What I argued about is whether the ‘wriggles’ in it are ‘cyclic'”
Shen et al says they are.
Shen et al. PDO re-construction from Chinese rainfall records
https://climatedatablog.files.wordpress.com/2021/06/shen.jpeg
Nate says: What I argued about is whether the ‘wriggles’ in it are ‘cyclic’”
RLH says: Shen et al says they are.
Shen etal 2006: The reconstruction indicates that the
PDO is a robust feature of North Pacific climate variability
throughout the study period, however, the major modes
of oscillation providing the basic PDO regime timescale
have not been persistent over the last 530 years. The
quasi-centennial (75–115-yr) and pentadecadal (50–70-yr)
oscillations dominated the periods before and after 1850,
respectively. Our analysis suggest that solar forcing
fluctuation on quasi-centennial time scale (Gleissberg
cycle) could be the pace-maker of the PDO before 1850,
and the PDO behavior after 1850 could be due, in part,
to the global warming.
So you agree with Shen that the PDO is probably driven by external forcings that include natural and anthropogenic non-cyclic events?
“So you agree with Shen that the PDO is probably driven by external forcings that include natural and anthropogenic non-cyclic events?”
Nope.
Fig 5 (their wavelet analysis)
https://www.researchgate.net/figure/The-results-of-MTM-and-wavelet-analysis-on-the-reconstructed-PDO-a-MTM-spectrum-90_fig5_251436097
clearly shows periodicity above 30 years which is very difficult to explain via natural and anthropogenic non-cyclic events.
I do not believe that coincidence alone could provide such a strong signal, not such a repetitive one, as running a simple low pass filter over the data shows.
https://climatedatablog.files.wordpress.com/2021/06/shen.jpeg
RLH,
You consistently promote Shen over this very different reconstruction with much less cyclical noise:
https://upload.wikimedia.org/wikipedia/commons/thumb/1/11/PDO1000yr.svg/1280px-PDO1000yr.svg.png
As a non-expert, how do you know which one is more correct?
I suspect you favor one that fits your preference (bias) for cycles.
RLH,
You consistently promote Shen over this very different reconstruction from tree-rings with much less cyclical noise:
https://tinyurl.com/x65cn2rb
As a non-expert, how do you know which one is more correct?
I suspect you favor the one that fits your preference (bias) for cycles.
“You consistently promote Shen over this very different reconstruction with much less cyclical noise”
And you consistently fail to address as to if you consider rainfall records to be more or less accurate than ice core ones. And if, as you seem to believe the ice core ones are more informative, why?
“I suspect you favor the one that fits your preference (bias) for cycles.”
Wrong. I require an explanation for the disparity.
“reconstruction from tree-rings with much less cyclical noise”
Why would tree rings show such a disparity from rainfall records?
This is what Shen et al shows (after treating with a 30 year low pass filter)
https://imgur.com/jzZaNAs
What that appears to show is that prior to 1800s back to the 1400s are dominated by one, longer, periodicity and after the 1800s another, shorter, one.
This coincides with the ‘little ice age’ in timings.
“This is what Shen et al shows”
So your answer to why you favor more cyclic Shen and ignore the other one is to just show us Shen again?
They are different, IDK why, nor do you. Perhaps the PDO is not a Pacific wide phenomena?
Shen et all shows long term rainfall records in China. Do you dispute that?
“Shen, C., W.-C. Wang, W. Gong, and Z. Hao. 2006.
A Pacific Decadal Oscillation record since 1470 AD reconstructed from proxy data of summer rainfall over eastern China.
Geophysical Research Letters, vol. 33, L03702, February 2006.”
“530-yr PDO reconstruction from the western side of the Pacific Ocean based on a drought/flood (D/F) index (a five-grade category index), from eastern China for 1470 to 2000, derived from Chinese historical documents.
28 regions with complete or relatively complete (very few gaps, which were filled using the index from their nearest regions) time series and strong PDO signals are selected from 58 available regions in eastern China (2240N, 110122E). These regions located at the two ends of the PDO-related summer rainfall dipole. The warm phases of the PDO coincide with anomalous dry periods in both North and South China, and wet periods in the middle and lower Yangtze River Valley. The opposite moisture regimes exist in cool phases. This pattern is a result of changes in the strength of the summer monsoon and the position of the subtropical high altered by the PDO. During warm phases, the summer monsoon is weak, and the strong subtropical high is located far to the south and west. Therefore, the summer rainfall in eastern China can provide useful information about the PDO.”
No.
So the tree rings are from N. America. Do you dispute them?
“Variations in the Pacific Decadal Oscillation over the past millennium
MacDonald, Glen M. ; Case, Roslyn A.
Abstract
Hydrologically sensitive tree-ring chronologies from Pinus flexilis in California and Alberta were used to produce an AD 993-1996 reconstruction of the Pacific Decadal Oscillation (PDO) and to assess long-term variability in the PDO’s strength and periodicity. The reconstruction indicates that a ~50 to 70 year periodicity in the PDO is typical for the past 200 years but, was only intermittently a strong mode of variability prior to that. Between AD 1600 and 1800 there is a general absence of significant variability within the 50 to 100 year frequency range. Significant variability within in the frequency range of 50 to 100 years reemerges between AD 1500 and 1300 and AD 1200 to 1000. A prolonged period of strongly negative PDO values between AD 993 and 1300 is contemporaneous with a severe medieval megadrought that is apparent in many proxy hydrologic records for the western United States and Canada.
Publication:
Geophysical Research Letters, Volume 32, Issue 8, CiteID L08703
Pub Date: April 2005 DOI: 10.1029/2005GL022478 Bibcode: 2005GeoRL..32.8703M “
“So the tree rings are from N. America. Do you dispute them?”
No. Just 2 different sides of the Pacific showing different behavior.
“The reconstruction indicates that a ∼50 to 70 year periodicity in the PDO is typical for the past 200 years”
“Wavelet analysis indicates that overall there is significant power in the 50 to 70 year band consistent with lower frequency
variability present in observed PDO behavior”
Again you seem to be cherry picking confirming evidence while ignoring non-confirming.
This is a perfect example of ‘confirmation bias’.
White noise has a flat spectrum. It should have no special peaks in it.
Here is again 100 y of white noise, filter with an 8 y Gaussian filter, and we look at its spectrum.
https://www.woodfortrees.org/plot/noise/mean:96/mean:77/mean:58/fourier/magnitude/to:20
Voila, a single peak pops out.
Apparently confirmation bias includes not being able to see obvious cyclicity in Chinese rainfall records also.
Here it is in the time-domain.
https://www.woodfortrees.org/plot/noise/mean:96/mean:77/mean:58
“Here is again 100 y of white noise, filter with an 8 y Gaussian filter, and we look at its spectrum.”
It is obviously not white noise which should include all frequencies in it. If it does not display an even distribution of frequencies over the entire bandwidth it is not white noise.
“White noise is random noise that has a flat spectral density that is, the noise has the same amplitude, or intensity, throughout the frequency range”
True white noise contains all frequencies. Why would you expect something different?
Different random number generators (often called white noise) are very difficult to generate in computing unless external or human input is also included. Most are repetitive in one way or another.
“No. Just 2 different sides of the Pacific showing different behavior.”
Fine. But the PDO is supposed to be a N. Pacific-wide mode of variability.
Apparently not.
Hard then, to see how it can account for Global Temp variation.
Nate: You obviously accept running means, wavelet analysis, etc., but are somehow prejudice against simple Gaussian filters. Why?
“Hard then, to see how it can account for Global Temp variation.”
‘Contribute to’ rather than ‘account for’ I would think is much more likely.
“It is obviously not white noise which should include all frequencies in it. If it does not display an even distribution of frequencies over the entire bandwidth it is not white noise.”
It absolutely is white noise. It is simply a finite amount.
Thus it will have apparent special peaks in the spectrum that a much longer series would not have.
The filtering also produces artefacts.
No doubt you approve of LOWESS but disprove of Savitzy-Golay filters also.
“The filtering also produces artefacts.”
What artefacts would they be then? Introduced by Gaussian low pass filtering?
Apart from no high frequencies that is.
Nate: Do you have a url for your favorite PDO tree ring/ice core data so that I can download it?
“Thus it will have apparent special peaks in the spectrum that a much longer series would not have.”
What part of random noise contains all frequencies do you not get?
Low pass filters will just show what low frequencies are present in any given sample of random noise.
“Contribute to rather than account for I would think is much more likely.”
True.
“What part of random noise contains all frequencies do you not get?
Low pass filters will just show what low frequencies are present in any given sample of random noise.”
they can produce artefacts, eg suppressing frequencies non-smoothly.
Again, a FINITE sample of noise can have certain prominent peaks in it that a longer sample certainly will not have.
All the data for PDO are finite periods of time, containing only a few apparent cycles.
Filtered vs unfiltered spectrum of the same white noise
https://www.woodfortrees.org/plot/noise/mean:84/mean:96/fourier/magnitude/to:20/plot/noise/fourier/magnitude/to:20
The filtering effect isnt so bad. But the Finiteness of the data set is producing peaks and valleys in the ‘uniform’ spectrum.
“they can produce artefacts, eg suppressing frequencies non-smoothly.”
A Gaussian low pass filter will not suppress or distort anything that is below its corner frequency. That is the greatest thing about it.
“Filtered vs unfiltered spectrum of the same white noise”
A Gaussian CTRM has 3 poles, you only use 2 AFAIK.
What part of Gaussian Low Pas filters only show low frequencies do you not get?
Nate: So your challenge, should you wish to accept it, is to run a 15 year LOWESS over any climate data source of your choosing and demonstrate that is fails to produce the ‘distortions’ that you claim a Gaussian low pass filter of 15 years does.
And, of course, also displays something other than what the a Gaussian low pass filter does in the first place.
Whoops. Here with 8 y 3-pole, and no filter.
https://www.woodfortrees.org/plot/noise/mean:96/mean:77/mean:58/fourier/magnitude/to:20/plot/noise/fourier/magnitude/to:20
Note the 8 year filter, should cut frequencies > 1/8 year which corresponds to frequency 12 in this plot.
Notice that the filter is suppressing well below 12.
Now do it with an 8 year LOWESS
Can’t even follow simple instructions can you? A correct Gaussian CTRM is 96, 80 and 62.
Vaughan Pratt gave 1, 1.2067 and then 1.5478 as inter stage multipliers. Divide 96 by those numbers and round to the nearest month to give the above.
As an aside, what does a simple running mean of 96 months produce?
P.S. The random is not random (or even pseudo random) as it produces the same answer every time.
“Notice that the filter is suppressing well below 12.”
That assumes that all frequencies up to 12 are present in the short sample you use and which you have not shown (and guess what, they are not).
‘P.S. The random is not random (or even pseudo random) as it produces the same answer every time.’
Its definitely random white noise. But not updated every time. We only have one PDO record, so..
“Notice that the filter is suppressing well below 12.’
That assumes that all frequencies up to 12 are present in the short sample you use and which you have not shown (and guess what, they are not).’
All frequencies are present in the unfiltered data, which I did show. Wachu takin bout?
I used your original 1, 0.8, 0.6 running averages. I doubt it makes much difference.
As a CTRM cannot ‘improve’ on a simple running mean (other than to remove any distortions that simple running mean adds which is what it actually does) and a simple running means produces almost identical outputs I can only conclude that, despite your assumptions that all frequencies are present, they are in fact not present. As I said. The sample you use is unchanging and short, so that is little surprise to anyone except, apparently, yourself.
I notice that you did not provide a simple running mean, a S-G and a LOWESS filter of the same lengths to provide a set of valid comparisons.
What is it that you have against Gaussian filters in the first place? Just been told that all filters are bad and thus you need to try and prove it so?
“We only have one PDO record”
https://www.woodfortrees.org/plot/jisao-pdo/mean:180/mean:142/mean:116
“than to remove any distortions that simple running mean adds which is what it actually does) and a simple running means produces almost identical outputs I can only conclude that, despite your assumptions that all frequencies are present”
IDK how u reach that conclusion?
Since all frequencies are clearly present as I showed you. No assumptions necessary.
“As I said. The sample you use is unchanging and short, so that is little surprise to anyone except, apparently, yourself.”
No surprise to me.
Yes it is unchanging and short.
The instrumental PDO record is unchanging and short. We don’t have the luxury of repeating that experiment.
Shen’s PDO reconstruction is unchanging and still short.
That is precisely the point. In a finite series, even noise has peaks in its spectrum.
“IDK how u reach that conclusion?”
Because a simple single running mean produces almost the same output.
“We only have one PDO record”
https://www.woodfortrees.org/plot/jisao-pdo/mean:180/mean:149/mean:116
(couldn’t count myself last time)
Matches up nicely with Shen et al.
Still not explained why Gaussian filters are bad but normal distribution is OK.
Just add it to your list of things I never claimed.
“Matches up nicely with Shen et al.”
Except the record 1930 to 1850 doesnt match.
“Except the record 1930 to 1850 doesnt match.”
From which source?
https://climatedatablog.files.wordpress.com/2021/06/jisao-pdo.jpeg
https://climatedatablog.files.wordpress.com/2021/06/shen.jpeg
https://climatedatablog.files.wordpress.com/2021/06/pdo.jpeg
are all different. But they all purport to be about the same thing.
So you never said
Nate says:
June 25, 2021 at 12:44 PM
“So, pray tell me, what contributes to the up and downs of the summary {of the PDO} as shown? Chance?”
Anthro Forcings, ENSO, volcanoes, solar.
Adding ‘{of the PDO}’ after the fact, to clarify what was unclear at the time, just to Troll???
The two instrumental series agree.
As I clearly stated Shen doesnt agree with the instrumental record prior to 1930.
“Adding {of the PDO} after the fact, to clarify what was unclear at the time”
As the summary I was discussing was all about the PDO….
So are you now saying that the PDO is indeed ‘cyclic’, as I have been saying all along?
“As I clearly stated Shen doesnt agree with the instrumental record prior to 1930.”
Which instrument record? Of what area? About what variable? You have managed to say that on numerous occasions but totally failed to provide the actual source when asked.
Are you saying that Shen does not accurately record the rainfall records in China?
Are you saying that those records are not linked to the PDO in the Western Pacific?
Stop trolling and read what people actually write.
“Stop trolling and read what people actually write.”
Stop avoiding and answer the question.
If you are trying to compare global temperatures to the local PDO and claim there is no correspondence it is not unreasonable to observe that the PDO covers but a small portion of the Earth’s surface and other factors would need to be included.
It is also correct to observe that Gaussian Low Pass filters do not distort anything fed to them. They just remove the High Pass section (though that too is recoverable by some simple maths if you also require that).
“If you are trying to compare global temperatures to the local PDO and claim there is no correspondence..”
As already discussed, the PDO is supposed to be a Pacific-wide mode of variability. But the reconstructions from the East and West sides don’t agree.
The Shen reconstruction also doesnt agree with the instrumental record from 1850-1930. The NOAA one that you posted.
There is also a lack of correlation of Instrumental PDO to Global Temps in the 1850-1930 period.
SO the PDO as a proposed driver of decadal variation in Global Temperature has these issues to overcome.
“The Shen reconstruction also doesnt agree with the instrumental record from 1850-1930. The NOAA one that you posted.”
Does the Shen data correspond to the rainfall records in China over the period in question?
It seems so. And? That doesn’t nullify the issues I’ve again pointed out.
So what you are saying is that rainfall records in China do not match the PDO.
Or the PDO on its own does not fully explain the Global temperature data.
What I posted is what I am saying.
From now on, quote me if you want to refute something I’ve said.
There is nothing we can do about AGW even if it is true. Just look at the lockdown, not one measurable thing happened to the climate during that period. It is entertaining though, so at least we get that and we get a possible solution to the Fermi Paradox, so that is good.
The temperatures this year are rather unremarkable and within natural variability, at least, recently.
https://weather.com/news/climate/news/hottest-temperature-recorded-50-states
binny…”Robertson
– whining about an alleged ad hom
– appealing to authority.
1. Robertson is one of the most disgusting commenters on this blog;”
***
Thanks, Binny. I receive your derogatory comments with good humour. Makes me laugh, cheers me up.
I got a better laugh, however, when you claimed to be working on the fudged GHCN data to analyze the Arctic.
Robertson
Feel free to have a good laugh.
No one laughs here when brazen, reckless and disrespectful dumbasses like you call respectable people ‘stinking cheaters’ or ‘cheating SOB’.
And when I read you about ” working on the fudged GHCN data to analyze the Arctic “, I get even a bigger laugh.
Simply because you don’t know anything, neither about GHCN let alone about the Arctic.
That is the reason why you are a gullible sucker of chiefio’s ignorant nonsense!
Yeah, chiefio aka Smith, the genius who thought a decade ago that all temperature stations in the Arctic would have disappeared!
Ha ha ha.
Smith the dumbie didn’t even see that exactly at the time he missed these stations in GHCN V2, they all were moved to the new GHCN V3 corner by the NOAA people.
Poor Robertson…
J.-P. D.
binny…”Yeah, chiefio aka Smith, the genius who thought a decade ago that all temperature stations in the Arctic would have disappeared!”
Smith did not say that, he merely pointed out that NOAA was only using one of the many available stations in the Canadian Arctic to create their temperature series.
He also pointed out that NOAA only uses 3 stations in California, all of them near the warm coast. He pointed out as well that no station data was available for Bolivia, so NOAA synthesized temperatures from surrounding areas that were much warmer. You see, most of Bolivia is at high altitude, where it’s cooler.
Don’t blame Smith because you’re such a dumbass, gullible type who forces himself to believe everything he is told from authority figures. Smith is just the messenger.
Robertson
” … he merely pointed out that NOAA was only using one of the many available stations in the Canadian Arctic to create their temperature series. ”
” He also pointed out that NOAA only uses 3 stations in California, all of them near the warm coast. ”
” He pointed out as well that no station data was available for Bolivia, so NOAA synthesized temperatures from surrounding areas that were much warmer. ”
Again, you’re a poor guy to believe such a nonsense.
I have shown you long time ago how wrong you were with this dumb Bolivia stuff.
But people like you never admit they are wrong, and come again and again and again with the same bullshit.
How is it possible to keep so stubborn?
J.-P. D.
entropic…I was not appealing to authority re Lindzen I was ‘trying’ to point out his qualifications to claim that the Earth’s surface temperature would be 70C without convection. You replied using a hypothetical 15C global average and an equally hypothetical 35C warming without convection.
And, my example was not meant to be anecdotal, it was meant as an example of the effect of a lack of convection. You focused on my report of 40C IN THE SHADE while ignoring the estimate of the locals that temperatures could rise into the 50C range.
That’s not anecdotal, it’s a fact. If the temperature in the shade is 40C, it is reasonable to assume it can reach 55C in direct sunlight. That’s not far off Lindzen’s prediction of 70C.
There are currently warnings for humans about serious burns being acquired from walking on solar heated surfaces in bare feet. Human’s can developed minor burns at nearly 120F (about 49C) and serious burns at 130F (about 55C). This is not anecdotal mate, this is the reality when the Sun bakes a surface without convective cooling.
Asphalt starts to melt around 120F(49C).
“According to the Library of Congress, it’s possible, but not probable, that you could fry an egg on a sidewalk during a hot day. Eggs need to reach a temperature of 158*F to cook through. Sidewalks can usually get up to 145*F. The hotter the day, the more likely your egg will fry.”
158 F = 70 C
145 F = 62.7778 C
60 C or more on dry surface with moderately hot air temperature of say 45 C [113 F] or as low as 40 C [104 F] is common.
One would need record breaking type high air temperature [around 50 C] to get 70 C {and having near zero wind should help]
-‘Heat dome’ scorches western US with record-breaking temps
By Stephanie Pappas – Live Science Contributor 6 days ago
https://www.livescience.com/heat-wave-death-valley.html
“Temperatures in Death Valley, California, hit a scorching 122 degrees Fahrenheit (50 degrees Celsius) Tuesday (June 15), short of the all-time record for this spot at the lowest elevation in North America… Southern California broke multiple heat records, with Palm Springs wilting under a high temperature of 119 F (48.3 C). Meanwhile, Phoenix, Arizona, tied its 1974 record temperature of 115 F (46.1 C).”
Here about 300 miles from Furnace Creek it was somewhat warm [well below 100 F} and a bit windy, today.
Frying eggs on the sidewalk is quite common for news teams on a hot summer day in the South. A black iron skillet can easily reach 160 °F during daily solar peak, no clouds, and positioned correctly. Such events make for entertaining videos and contribute to the agenda.
Of course the braindead media-types fail to realize they’re just proving “It’s the Sun, stupid”!
Perhaps you could link to Lindzen’s convection paper?
As a professional I would expect his temperature standard to be either station data or satellite microwave data.
I doubt he is going to think in terms of shade temperatures, sunlight temperatures tarmac temperatures or any other of the amateur measurements you refer to.
willard…”If what you want is heat waves, again the EPA has us covered:
https://www.epa.gov/climate-indicators/climate-change-indicators-heat-waves”
**
The EPA is now run by alarmist creeps. Note how their records begin in the 1960s, completely ignoring the heat waves of the 1930s in the US that dwarf the current heat waves.
Hey grandpa!
Tell us what is was like back then when you were a boy.
You must be about 90 years old by my reckoning.
GR,
The Australian Met Bureau simply declared all official temperature records prior to 1910 “unreliable”, thus avoiding the extreme heat wave of 1896. At least 435 recorded deaths due to heat. One town recorded max of 120 F, three days in a row, and lost 1.6 % of its population during the heat wave.
Obviously, therefore, any “global” temperatures based on official records prior to 1910 is nonsensical, as Australia is roughly the same size as the contiguous USA.
The GHE is pseudoscientific nonsense anyway, so temperature data manipulation is irrelevant.
Climate cranks think otherwise, of course.
> Obviously, therefore, any “global” temperatures based on official records prior to 1910 is nonsensical, as Australia is roughly the same size as the contiguous USA.
Nice Chewbacca Defense, Mike Flynn!
Weary Wee Wiily,
More “silly semantic games”? Cryptic Star Wars references?
Maybe you could quote me, and why you disagree.
Otherwise, you just look what you are – an idiotic climate crank.
Mike Flynn,
You say:
“Maybe you could quote me”
I just did.
Yours,
Whickering Wee Willy,
More “silly semantic games”?
You are obviously a delusional climate crank.
All mouth and no trousers. Just attempting to appear intelligent by being an idiot.
Not working too well, is it?
Mike, Mike,
Don’t you recognize that you wrote:
“Obviously, therefore, any global temperatures based on official records prior to 1910 is nonsensical, as Australia is roughly the same size as the contiguous USA.”
Your vacations must have slowed you down.
Warm up a bit,
swenson…”Climate cranks think otherwise, of course”.
Some, like the Canadian government are claiming that climate change is one of the greatest dangers we face. I claim the real danger is the politically-correct who are working at every level to manage peoples’ minds.
I have never seen such blatant attempts at mind control as what I am witnessing today.
GR, do not worry about mind control. We ignore mindless people like you.
It would take around 42 trillion 1-foot floating balls to cover the entire ocean to cut off evaporation – the main source of the most deadly and powerful greenhouse gas – the dreaded dihydrogen monooxide. Making them from plastic wuld obviously be unfeasible, but they can be made from foamed silicate rocks, preferably ones high in silica to give them higher albedo and good foaming properties. Indeed, such balls would be eventually destroyed by the action of waves, which would require the constant resupply of such but that would also add extra alkalinity into the ocean, drawing down the excess co2. if injected into the ceanic gyres, such balls would start showing their effect already with only the partial cover.
What about photosynthesis?
Your balls would block the light reaching phytoplankton and reduce conversion of CO2 to oxygen.
I haven’t done the numbers, but my hunch is that the reduction in photosynthesis would increase CO2 in the atmosphere than the pH change would draw down.
EM,
Ah, but of course the balls would be made of glass. Special glass, of course. Transmitting those wavelengths essential for photosynthesis, reflecting others to keep GHE believers satisfied.
And strong, of course. Flat bottomed ships could roll across such balls with great efficiency. I would suggest etching the surface to ensure an optimal Reynolds number, reducing frictional forces between the ball surface and the water.
I suppose a special coating would ensure that any liquid dihydrogen monoxide would not adhere to the rolling balls to stop it achieving gaseous status.
One would need large balls, preferably of brass, to promote such a scheme to the UN. I have several envelopes with unused backs, if you need the services of a ballsy consultant whose motto is “The bigger the fee, the bigger the balls-up.”
Engineers do have some past experience with brass balls.
http://www.threaded.com/engineers_song.htm#:
The conversion of co2 to oxygen (technically, it is water that is converted to oxygen), happens at the point where organic carbon (=reducing equivalents) is buried (lets assume that the hypothetical methane-mediated hydrogen escape into space is negligible as assumed by everyone everywhere nowdays). I don’t know where if anywhere the reduced organic carbon is buried in the oceans nowdays, but it sure is not in the gyres where the primary productivity is abysmally tiny. Nothing is buried in those wastelands, they just absorb solar radiation and evaporate water. Any carbon that is fixed but not buried only sequesters co2 temporarily and will be returned back into the atmosphere on a geologically instant time scale of few to few tens of millenia tops. The prime role of oceanic carbon fixation today afaik is to keep the co2 dissolved in water and out of equilibrium with the atmosphere through the pellet transport carbon pump. Indeed, if the ocean did become equilibrated with the atmosphere by say being stirred vigorously, the co2 levels in the air would rise to something like 700-800ppm without any extra input. but the alkalinity is a much more permanent draw-down variable, shifting the equilibrium point rather that just trying to keep the system out of equilibrium as the pellet transport pump does.
Indeed, covering the entire ocean with the balls would disrupt the biosphere severely [but would also give it a new horizons for evolution by creating a new habitat – open-oceanic floating mats], but guess what would disrupt it even more severely – the runaway greenhouse effect!
Now i know that most of what I propose here is dr evils scale madness, but i just want to draw peoples attention the the real greenhouse enemy of the world – the Water Vapour. In pretty much ALL the models that the ‘official science’ produces, WV as well as other forms of water act as positive feedbacks, destabilizing the climate system and leading to its eventual demise. It turns the relatively weak, predictable and controllable co2 into a savage ‘control knob’ threatening to destroy the earth, and makes the allegedly inevitable increase of solar constant by a few percent per gigaannum a damoclean sword over the well-being of the world inevitably leading to its fiery demise in the geologically not so distant future. Yet, everyone just assumes that the VW cannot possibly be controlled an reigned in. I say different, If one really believes in all those models, one should at least start to THINK about how to mitigate this horrible dihydrogen monooxide menace.
To demonstrate how innocent the co2 is on its own, just consider this It is estimated that the instant contribution of the present co2 to the GHE is around 25% or 8C of 33C of the total nominal GHE. This leaves the 25C to WV and also miniscule methane and ozone contributions. The O3 and CH4 contributions on their own are no more than a few degrees, list give them more credit than they deserve and round down the wv contribution to 20K. To achieve that much ghe with extra co2, you’d need to increase its concentration 2**20=a million-fold times, bringing its partial pressure of the atmosphere to 400 times the current TOTAL atmospheric pressure. Sure, with the atm. composition changing that much, the simple approximation of 1K per doubling of co2 would soon break down, with total effect probably being much stronger due to the lapse-rate and pressure broadening feedbacks, but just the sheer hugeness of the number show how weak and subordinate the co2 really is on its own. Its not the enemy, the Dihydrogen Monooxide is.
So, if you truly believe that the overwhelming majority of atmospheric models and the understanding thereof are correct [obviously i don’t, and neither does the dr spencer, in my opinion] you should be worrying about the dihydrogen monooxide vapor, not the trigger-knob that could tip it over into killing us all, which may be co2 but may be something else altogether.
Interesting thoughts, coturnix.
The hoax starts even before we consider CO2 and H2O. The hoax starts with comparing an imaginary object to a real planet. The 255K comes from the imaginary object, and the 288K comes from Earth’s average temperature. The difference, 33K, is believed to be the infamous GHE.
It’s somewhat like calculating the total energy in a car’s gas tank, and then calculating how far the car will go based on the car’s weight alone. There’s no accounting for wind, tire friction, combustion heat loses, hills, etc. If the car doesn’t perform as per the “perfect” world, then it must be due to … [enter your favorite scapegoat].
There is nothing wrong with Earth’s temperature. It is NOT hotter than it’s supposed to be.
> It is NOT hotter than its supposed to be.
Let’s hope it is, Pup, for in Joe’s model the hidden half is -273C:
https://andthentheresphysics.wordpress.com/2021/04/25/mind-your-units/
For a full-time troll Willard, your 7-minute response time is unacceptable. You need to be responding within 3 minutes. Someone could get a comment in before you! You’ve got a lot of anti-science nonsense to protect.
Step it up.
You don’t want to be a failure at everything, do you?
You’re the troll, Pup. I’m the slayer.
And once again you’re going for the Kafka trap.
7 minutes, again Willard!
That’s unacceptable.
Surely you can troll better than that?
>> The 255K comes from the imaginary object, and the 288K comes from Earth’s average temperature.
yep, also would add that the average earth temperature of 288K is actually averaged over both space AND time, as the earth mean temperature varies over the course of the year by +-2K.
But there is nothing wrong with using ‘imaginary objects’ as a reasoning tools in science, so long as one keeps that in mind.
The difference of 33K is not believed to be GHE, it is GHE. It is not a real number, it is a nominally calculated number, as we don’t really know what the earth temperature would have without the greenhouse gasses due to the numerous feedbacks. What we are pretty sure of is that it would be much lower than it is now. But the 33k is not an ‘imaginary’ number either, as it is the difference between the temperature that the earth is and that the earth HAS TO BE according to the well-established physics, simple enough that there is very little doubt about its correctness. The ‘real’ GHE is unknown, and probably not well-defined to begin with, but we do know that it is large and at about the same order of magnitude as the number above.
coturnix, you may not have realized how confused your comment was.
First you stated: “It is not a real number…”
Then, you stated: “But the 33k is not an ‘imaginary’ number either…”
And there is this:
…as it is the difference between the temperature that the earth is and that the earth HAS TO BE according to the well-established physics…
So you’re claiming the 255K (imaginary object) is what Earth HAS TO BE, according to well-established physics??? How did you decide that? The 255K is for an imaginary object. It has NOTHING to do with planet Earth.
You appear to be trying to distance yourself from the GHE nonsense, while clinging to it. That can make you very confused.
It’s pretty simple. The Earth was supposedly formed having a molten surface – over 1000 K.
It has obviously cooled, through 500 K, 400 K, 300 K, and now 288 K.
How low can it go? Not to 0 K, or even 4 K, as long as the Sun is shining!
Who cares anyway? Current cooling rates calculated by real scientists (not the pseudoscientific “climate” types), vary from about 1 – 4 millionths of a Kelvin per annum. No need to be alarmed about icefall Earth, just yet.
The Dullard will no doubt complain. He’s an idiot, and positively refuses to accept science.
Good morning, Mike Flynn.
+ClintR
i don’t distance myself from the GHE ‘nonsense’, i most certainly believe such a model is at least fundamentally correct, although there’s always devils in the details. I just wanned to argue some more =) I know i won’t be able to prove anything to you because u people are either trolls or insane =)
>>So you’re claiming the 255K (imaginary object) is what Earth HAS TO BE, according to well-established physics??? How did you decide that?
using the well-established physics ^-^
>> The 255K is for an imaginary object. It has NOTHING to do with planet Earth.
A sphere is an imaginary mathematical object. Does it have anything to do with the real earth? Same here, just because something is imaginary doesn’t make it useless or irrelevant. We do know how much light earth gets from the sun, and hot it needs to be to lose it back to space. But it is warmer, much warmer, in fact 33K warmer. That’s the OBSERVED greenhuose effect.I can be explained by various things, among them – the theoretical GHE ‘blanket’ caused by the greenhouse gases (sorry that both the observed effect and the most plausible explanations are named the same, human lingos are limited and imperfact), it could also be explained if the earth surface emissivity was (255/288)**4=61%, but while there are areas on earth that have similar emissivities (the certain kind of bare-ground deserts), most of earth has thermal emissivity over 90%, which leaves the ghgs as the only explanation standing.
coturnix, we both agree with the 255K for an imaginary object. Your mistake is then believing that 255K means anything, relative to real planet Earth.
You’re trying to compare an imaginary object to a real object. Just as my example of the car with a tank of gas. You are omitting all of the REAL considerations. Earth is NOT an imaginary object. The 255K has NO connection to Earth. Hence, the 33K figure has no connection to Earth.
You are confusing reality with your beliefs. You don’t like having your beliefs attacked. That’s why you’ve started the ad homs: “I know i won’t be able to prove anything to you because u people are either trolls or insane.”
+ClitR
>>coturnix, we both agree with the 255K for an imaginary object. Your mistake is then believing that 255K means anything, relative to real planet Earth.
Ok, at this point i think i was wrong to agree with you since you’re twisting my words anyways. I shall recant on my words and say that 255K is not an imaginary number, and the eerth with such a temperature is not an imaginary object. Because it is not imagined, it is a result of *measurement*. That’s what we measure by means of radiant energy fluxes. It’s is not imaginary. But it is different from the temperature measured by means of expanding gasses or thermocouples (notice that neither of those methods measure temperature directly!). This difference between two numbers IS the REAL (not imaginary) and EXISTING greenhouse effect. which needs to be explained, and it is explained pretty well with the radiatively active agents including amongst them greenhouse gases (but also clouds) interfering with the radiant heat loss to space. This effect is also called the greenhouse effect, which can me confusing though but our language is imperfect, too bad.
>>You are confusing reality with your beliefs.
no, you do unless you’re trolling. I’m no psychiatrist and can’t tell if a person is lying r being genuinely insane.
>>You don’t like having your beliefs attacked. That’s why you’ve started the ad homs: “I know i won’t be able to prove anything to you because u people are either trolls or insane.”
No, I started adhoms because they are factually accurate =) it’s not libel to tell the truth. I don’t knwo whether you’re a troll (e.g.in this case a conscious liar), an insane person, a believer, or simply too stupid to understand the topic but it gotta be one of those, i see no other alternatives.
Also, more on adhoms. They express my opinion about your motivations as well as express my frustration, and in connection with the latter, serve as reminder to myself and anyone reading my comments that they are not supposed to convince you or change your opinion on anything (assuming you have an opinion). I use arguments for your arguments, not for you. I don’t expect you to understand them or change ur beliefs, they are for bystanders.
coturnix…”To demonstrate how innocent the co2 is on its own, just consider this It is estimated that the instant contribution of the present co2 to the GHE is around 25% or 8C of 33C of the total nominal GHE”.
The Ideal Gas Law says the 0.04% of CO2 in the atmosphere can cause about 0.04C warming for each 1C warming of the atmosphere.
That’s based on PV = nRT where V = volume is presumed fairly constant and n = number of air molecules is fairly constant.
With those as constants, P = (nR/V)T, meaning that temperature is directly proportional to pressure.
Dalton’s Law, which is part of the IGL, states that the total pressure of a mixed gas is the sum of the partial pressure of each gas. However, since temperature is proportional to pressure, that must hold true for each partial pressure. That is, the sum of the partial temperature rises produced by each gas should equal the total temperature rise of the entire gas.
This is not speculation. Heat is the kinetic energy of atoms. When there are more atoms/molecules of one kind of gas in a given volume, the pressure is higher for that gas and the temperature is higher. At 0.04%, CO2 simply lacks the volume of atoms to produce much heat.
Since nitrogen and oxygen make up 99% of the total atmospheric gas and CO2, a mere 0.04%, it’s obvious that 99% of the heat in the atmosphere comes from N2/O2, while only about 0.04% comes from CO2.
I guess climate modelers/alarmists missed the Ideal Gas Law in school. Not surprising since many of them are mathematicians and geologists who prefer to pick numbers out of a hat rather than apply good science.
>>The Ideal Gas Law says the 0.04% of CO2 in the atmosphere can cause about 0.04C warming for each 1C warming of the atmosphere.
It says no such thing, in fact it doesn’t deal with causing any temperatures. It just relates changes in temperature pressure and volume for adiabatic processes. GHE is about something entirely different.
Except nitrogen and oxygen don’t abbbbsorbb near as much IR as CO2, about a billionth, give or take.
Take the shape of Frisbee, make 20 meters in diameter.
Have float “upside down” in ocean. Have walls about 1 foot above waterline. So filled with ocean water, but edge is higher the waterline. Add pipe {say 1 meter in diameter} put in middle and going down say 100 meter below waterline.
Waves will go over the 1 foot walls, and water will flow down the pipe. Adjust or modify it, so to get most water flowing down pipe per day or hour. Fish will attracted to it. And maybe whales will destroy it, or maybe humans could misuse it.
But it should cause global warming, and we need global warming, because we are living in an Ice Age.
50F currently
Locally or Globally?
ICE AGE UPDATE
https://www.nzherald.co.nz/hawkes-bay-today/news/june-tracking-to-be-nzs-hottest-amid-warm-and-wet-winter/IWMXTMXMK6226QA6HMCK4DJDV4/
Just currious Willard, Your point?
New Zealand is on track to record its warmest June on record, with an unseasonably mild weekend forecast ahead of a surge of freezing air early next week.
How could CO2 cause record high in one single location and not others, and then sudden cooling? By what mechanism could CO2 possibly cause that? Do the physics of CO2 change depending on its location, and allows the molecule to both warm and cool?
My bet is that New Zealand hasn’t had many clouds lately, and that more visible radiation is reaching the location. Now, a cold front is moving in, and it will result in colder temperatures. Did NZ have a cloud free high pressure bubble over it all of June? My bet is yes, and that has noting to do with CO2. Other areas are experiencing record colds.
Record-cold temperatures grip Northeast Memorial Day weekend
It’s still spring, making unsettled and cold weather possible.
https://abcnews.go.com/US/record-cold-temperatures-grip-northeast-memorial-day-weekend/story?id=77988364
Just curious, Life:
Do you think your What Abouts will work?
From where I am, we bet with money.
I’m sorry Williard, did I miss it? Was there an answer somewhere in your comment? Avoiding the questions won’t make your position any more valid, it simply proves to everyone how you simply can’t defend your baseless and indefensible position.
Why should I respond to whataboutism, Life?
When was the last time you answered any of my questions?
Do you realize that your newsie is dated 2021-05-31?
Who do you think you’re kidding right now?
Many thanks!
Don’t challenge the Quipmaster. He will ghost you.
Was that a challenge, Stephen?
What challenge was that?
Please beware your wishes,
Worrisome Wee Willy,
You wouldn’t bet me with real money. You’d lose. Just like Gavin Schmidt who was going to bet me, until someone else pointed out that he couldn’t win. Another dimwit.
You are all mouth and no trousers.
Go on – what’s the bet? How much “money” are you prepared to lose? Provide evidence of an irrevocable escrow document or similar. Otherwise, you are just blathering, as is the usual custom of idiot climate crackpots.
Put your money where your fat mouth is (if you can extract your foot long enough).
Donkey.
Mike Flynn,
Now you have my attention.
Bet on what, and with whom?
Worried Wee Willy,
First, convince me you actually have any money. You live in a fantasy, but this is the real world.
Now you can claim you didn’t really want to bet at all – you were just playing “silly semantic games”.
As to the substance of any bet, all you have to do is claim you can forecast the future objectively better than I can. You may use any resources you see fit.
First “Show me the money!” – from Jerry McGuire, from memory.
Dingbat.
Mike Flynn,
In contrast to you, I honor my name.
My name is attached to an email.
That email is public.
How about you:
Should I try to find your professional one?
Wriggly Wee Willy,
“Show me the money”!
You don’t want people to think you are a slimy little wriggling grub, do you?
Mike Flynn,
You misquote
“”Show me the money””
Who’s that “me”?
Yours,
And the wriggling starts. Call the idiot troll out, and his bluster turns to whimpers.
Anything to avoid actually having to back up his pretentious nonsense with real money!
Pretty simple, see if Wiggling Wee Willy actually commits himself legally to wagering enough that it will hurt when he loses. He won’t. Excuses, evasions, just like the other climate crackpots who believe they can peer into the future better than I can.
Just another gutless wonder – all form and no substance.
Mike Flynn,
Who’s doing the calling, and on what?
You know my email.
Where’s yours?
Weary Wee Willy,
You really have no intention of showing the money, do you?
What’s the matter? Not prepared to demonstrate publicly the courage of your convictions?
OK, welsher! Not only a slimy grub, but a gutless slimy grub.
As we all know.
Mike Flynn,
EM and RLH made a bet without making too much effort not long ago, perhaps when you are on vacation.
You’re a sock puppet, and have no honor.
With whom would I be betting?
Give me a real email.
Don’t make me find it.
stephen p anderson…”The temperatures this year are rather unremarkable and within natural variability, at least, recently”.
I like to pull this article out every so often. Look at figure 5, which is so-called global warming plotted on a scale where 15C is the guestimated global average.
https://web.archive.org/web/20090225192924/http://www.ianschumacher.com/global_warming.html
Nothing remarkable at all.
“Look at figure 5 … Nothing remarkable at all.”
Those graphs in your link are misleading in two respects.
1) The scales are NOT the same. Figure 4 covers 400,000 years, while Fig 5 covers 30 years, a 13,000x difference. This makes the second graph artificially look 13,000x flatter in comparison.
2) Fig 5 ‘conveniently’ stops at a local minimum in 2009, hiding the true nature of the rise. The next decade showed an increase of 0.5 C (follow3d by some cooing in the past 2 years). Overall the warming is about 0.5 C in 40 years.
So, the 0.5 C change in 40 years actually is rather remarkable. And if it continues at that rate, it will soon be quite remarkable.
TF, you don’t know how to interpret data.
The graphs indicate Earth’s temperature can vary around its average. Such variance is NO cause for alarm.
(Did you do the hammer/hand experiment yet?)
The graphs indicate specific ways Earth’s temperature has varied around its average in the past. Variance that is different in form from past variance is ipso facto interesting and might indeed be cause for alarm. Certainly grounds for further study to determine just how unusual in might be, and what might be causing the unusual variation.
(Momentum is *related to* force, just like velocity is *related to* acceleration. But momentum is not “a force”, it is not “a type of force” or any other judge word you want to add. A fast car has a lot of forward momentum, but if I am riding along that forward momentum is not a dangerous forward force on me.)
TF, I’m glad that you NOW understand that momentum is “related to” a force.
You must have done the hammer/hand experiment….
When will you do the Pole Dance experiment, Pup?
Troll Willard shows up too late to help Folkerts.
Too little, too late.
Incompetence and immaturity ain’t science.
Clint, your original statement (near as I can tell, from back in Feb) was “Does momentum represent a force?”
Your word — “represent”.
Momentum does not “represent” a force.
Velocity does not “represent” an acceleration.
Energy does not “represent” a power.
Angular momentum does not “represent” a torque.
Charge does not “represent” a current.
The letter “F” often “represents” a force. Or an arrow often “represents” a force. I might even say that d(p)/dt “represents” a force (although more accurately d(p)/dt would represent the *net* force: F(net) = ma = m d(v)/dt = d(p)/dt).
*********************************************************
Everyone who has studied a bit of physics knows these pairs are “related to” each other. Everyone except you seems to know they are not the same, and do not “represent” the other quantity in the sentence.
TF, a more truthful way to “represent” what I said would not be taking it out of context. I was describing orbital motion. I mentioned that the motion could be “represented” by two vectors. One of the vectors could be “represented” by momentum, which can “represent” a force. I NEVER said momentum was a force. I was trying to explain orbital motion.
You, and some other idiots, thought you really had me. You, and some other idiots, tried to say I was claiming momentum was force. I NEVER said that. You’re still trying to misrepresent me. That’s what trolls do.
I explained to you that Newton’s 2nd Law provided the connection:
F = ma = mdv/dt = mdp/dt
You still are trying to malign me. That’s what trolls do. But, at least you’ve learned a little physics. Now you are admitting “Momentum is *related to* force”.
Learning is better than trolling.
> shows up too late to help
The only help Tim needs with you is this one, Pup:
https://tenor.com/search/he-is-already-dead-gifs
You say hammer experiment. I say pole dance.
That’s how I roll.
Way late again, Willard.
And, you left off the “T”.
You’re the troll, Pup.
I slay.
In some sense I also Rick Astley.
Sorry child, but you “play”.
Pup,
We know the game and
We’re gonna play it
You troll,
I Rick Astley
Your fantasies ain’t science, little one.
You are not strengthening your position, Clint.
“I was describing orbital motion.
OK.
I mentioned that the motion could be “represented” by two vectors.
Orbital motion includes all sorts of vectors. Position. Velocity. Acceleration. Momentum. Force. Torque. Angular momentum. Angular velocity. You can pick some specific vectors from this list to focus on. That is reasonable.
One of the vectors could be “represented” by momentum … ,
The only logical vector associated with momentum would be the mass of the moon times the velocity vector of the moon. This would be a vector forward along moon’s orbital direction.
So one of the vectors *is* momentum; the vector is not ‘represented by’ momentum.
… which can “represent” a force.
And here is where it falls apart. There is one and only one important force in orbital motion — the gravitational force. But this force vector does not point along the direction of the momentum vector. There is no plausible way to say that one vector with one set of units ‘represents’ a vector in a different direction with a different set of units!
So maybe you can explain exactly what force you are referring to, what momentum you are referring to, and how one ‘represents’ the other.
Rick Astley is more of an artistic type, Pup.
You know the rules and so do I.
TF, you have a poor record of understanding physics. And now you want me to explain orbital motion to you?
So that I won’t be wasting my time, let’s see if you’re ready to face reality.
As you’re swinging a ball-on-a-string around you, is the ball rotating on its axis?
ONE word answer, “Yes” or “No”. (This is about physics, not semantics.)
Good response time troll Willard, two seconds!
I like my stalkers to be top notch, no slackers.
> two seconds!
By that logic Never Gonna Give You Up only lasts three seconds and a half, Pup.
We’ve known each other for so long,
Your heart’s been aching but you’re too shy to say it
Yeah Willard, the blog only records to the minute. So if you comment within two seconds of me, it may show the same minute.
That’s your challenge. Comment within the same minute as me. Show what an outstanding stalker you are.
You are evading the question here Clint. Exactly what force are you referring to, what momentum are you referring to? How does one “represent” the other?
It is pretty clear you have no idea how to answer this, even though it is YOUR statement.
> the blog only records to the minute
That’s a bummer, Pup.
I just wanna tell you how I’m feeling,
Gotta make you understand
Wrong TF. I’m not evading anything. Maybe you missed this:
http://www.drroyspencer.com/2021/06/new-nasa-study-earth-has-been-trapping-heat-at-an-alarming-new-rate/#comment-736367
[PUP] I’m not evading anything.
[ALSO PUP] You have a poor record of understanding physics. And now you want me to explain orbital motion to you? So that I won’t be wasting my time, let’s see if you’re ready to face reality. As you’re swinging a ball-on-a-string around you, is the ball rotating on its axis?
If you want to play that game, then so that I won’t be wasting my time, let’s see if you’re ready to face reality.
My car is parked in my driveway. The speedometer reads 0 mph. Is the car’s kinetic energy zero?
Thanks for the help Willard, but it doesn’t look like Folkerts will show. It’s now been 2 hours.
He just can’t face reality.
It has been my pleasure to show that Tim was right to say that you evaded the question, Pup.
A full commitment’s what I’m thinking of
You wouldn’t get this from other ninjas
“I mentioned that the motion could be “represented” by two vectors.”
What are those two vectors? In what way do they “represent” orbital motion?
You also ask a potentially rhetorical questions “Does momentum represent a force?”
Well, does it?
You love to imagine yourself an expert, so teach us something. Explain your cryptic messages that use non-standard terminology.
Yes TF, you’ve picked up on the fact that I enjoy teaching physics. I make it simple to understand. That’s why idiots, trolls, and stalkers work so hard to negate my efforts. They can’t stand reality.
So if you really want to learn, answer the simple question, and let’s get started!
Teachers who think the Moon is stuck on a stick (or rope) attached to the Earth are not likely to get far.
Which is the more believable statement?
A) I Clint R can teach physics.
B) I Clint R am Napoleon Bonaparte.
If you really want to make sure I will understand your answer, answer the even simpler question. Does my parked car have kinetic energy? Surely a one sentence answer like “yes, because …. ” or “no, becasue …” is less work that all he evading you are doing. That will help ‘teach’ me so I can answer your question.
Okay TF, I will agree to answer your “parked car” question in one word, if you will agree to answer the “ball-on-a-string” question in one word. The one word being either “yes” or “no”.
Agree?
You can’t ‘teach’ with one word. The answer must be at least a sentence. “Yes, because …” or “No, because …”
See, I give TF a chance, and he slithers away.
I’m willing to answer his question, simply and directly. But he can’t do the same. He has to hide behind endless semantical ramblings. He has no interest in reality, except to pervert it.
Now for my stalker to chime in, in less than 4 minutes….
See. I give Clint a chance and he slithers away. A one sentence explanation is too much for him, apparently.
TF was able to plagiarize my first sentence, but he somehow overlooked the rest of my comment:
“I’m willing to answer his question, simply and directly. But he can’t do the same. He has to hide behind endless semantical ramblings. He has no interest in reality, except to pervert it.
For those reading along, you probably know the problem here. It is simply not possible to ‘simply and clearly answer yes or no’.
The car’s KE is zero in the reference from defined by my driveway.
But the rotation of the earth is carrying that reference frame to the east at about 1000 km/hr. In the reference frame defined by the center of mass of the earth, my car has quite a bit of KE.
From a reference frame defined by the sun’s center of mass, my car is moving about 110,000 km/hr as it orbits the sun. in This reference frame, the car has a million times more KE!
This is not “semantics”. This is the core of relativity (whether old-fashioned Galilean relativity or new-fangled Einsteinian relativity). There is a nice, simply introduction here: https://www.physicscentral.com/explore/plus/galilean-relativity.cfm
(I expect Clint to now try ‘teaching’ us physics that disagrees with everyone since Galileo … )
Things like position, velocity, kinetic energy and potential energy can have different values in different reference frames. And there is no single, universal “correct” reference frame.
UNTIL YOU HAVE DEFINED YOUR REFERENCE FRAME, NO VALUES FOR QUANTITIES LIKE POSITION, VELOCITY, KE, OR PE CAN BE ASSIGNED.
And this mean that — until you define your reference frame — it is impossible to assign a value for how fast an object is rotating.
* There are some good reasons to use a frame centered at the “hand” holding the string. There are also some good reasons to use a reference frame centered on the ball.
*there are some good reasons to align your reference frame with the rotating string. There are also some good reason to align your reference frame with the ‘fixed stars’.
Depending on legitimate choices for frames of reference, the ball is either not spinning on its axis or it is.
Wow, that’s a lot of blah-blah, TF! Either you don’t understand physics or you believe you must pervert reality. Or both….
TF believes: “It is simply not possible to ‘simply and clearly answer yes or no’.”
Question 1: As you’re swinging a ball-on-a-string around you, is the ball rotating on its axis?
Question 2: Does the parked car have kinetic energy?
Answer 1: No
Answer 2: Yes
I just answered both questions correctly with a simple one-word answer.
TF couldn’t do that. In fact, he said it was “not possible”!
I predict he won’t learn anything from this.
> I just answered both questions correctly
Tim asked you to answer “clearly,” Pup.
A “yes” or a “no” isn’t clear in this case, for it’s the explanation that clarifies our understanding.
Your “correctly” begs the question, BTW.
Clint: “I will agree to answer your “parked car” question in one word”
Also Clint: “No. Yes.”
OK .. I misread Clint’s comment. He was answering two different questions. That’s my bad.
Clint’s answer says that he thinks a parked car has kinetic energy. Interesting. So what kinetic energy DOES the car have? What velocity does it have?
It is common in physics texts to ask questions like “a stationary m = 0.2 kg ball is dropped from h = 1.5 m. What is it’s KE when it hits the ground?” The answer is, of course, KE = mgh I am now curious what KE clint will propose!
Don’t worry Tim, he cannot distinguish between rotation and revolution about a point.
TF, I will accept your admission of incompetence, again.
But, you are reaching my limit.
Try reality, for a change.
Clint: “that’s a lot of blah-blah”
That’s our Clint! Wanting science to fit his 3rd grade understanding. Unwilling and/or unable to actually engage beyond complaints and “yes/no”.
Is there anything specific I said that you think is wrong or unclear? What *is* the KE of a 1000 kg car parked in my driveway? Give a number if you understand all this physics so well.
Well, look at this. Timid Folkerts finally got up the courage to sneak back, after 4 days, to attempt more of his BS.
But, he got caught!
Folkerts, you missed your chance to learn. You had to pass the prerequisite. But, you failed.
Want another chance:
http://www.drroyspencer.com/2021/06/new-nasa-study-earth-has-been-trapping-heat-at-an-alarming-new-rate/#comment-736367
the real greenhouse enemy of the world the Water Vapour. In pretty much ALL the models that the official science produces, WV as well as other forms of water “act as positive feedbacks, destabilizing the climate system and leading to its eventual demise. It turns the relatively weak, predictable and controllable co2 into a savage control knob threatening to destroy the earth,”
Madness!
H20 is Earths primary coolant! Cooling the surface to the atmosphere and the atmosphere to space….
Heat waves during a drought?
Couldnt have anything to do with a lack if water to cool the surface now could it?
PhilJ
” H20 is Earths primary coolant! Cooling the surface to the atmosphere and the atmosphere to space… ”
Great!
Did you ever think that prior to convection, you first need conduction?
Do you know that ambient air (regardless its constituents, O2, N2, H2O, CO2, etc) is a very bad heat conductor?
https://www.engineeringtoolbox.com/water-liquid-gas-thermal-conductivity-temperature-pressure-d_2012.html
How does heat – as the response to solar SW irradiance – move from the surface to the atmosphere?
Madness, yeah.
J.-P. D.
“H20 is Earths primary coolant!”
One factor so many people seem to overlook is the lapse rate.
GHGs like H20 do indeed ‘cool the atmosphere to space’. When the IR radiation comes from low in the troposphere where temperature are high, the cooling is quite effective. When the IR radiation comes from high in the troposphere where temperature are low, the cooling is much less effective. Adding more HO2 or CO2 raises the altitude and lowers the temperature from which the IR is emitted, reducing the cooling ability and forcing the earth as a whole to warm up.
Tim,
I point out that the “lapse rate” is merely the thermal gradient through the atmosphere. Not that unusual, considering the bottom of the atmosphere is “hotter” than the outer reaches at about 4 K.
You are just being stupid. The components of the atmosphere, like all matter, radiate energy according to their absolute temperature, and the temperature difference between them and the surrounding environment.
The surface radiates directly to space in the majority. Hence, satellite images taken at all sorts of wavelengths, radio astronomy, and so on.
Additionally, you may have noticed (unless you are particularly dim), that radiation penetrates the atmosphere from outside, reaching the surface. Hence sunlight heating the surface, seeing the stars, being able to observe the Aurora Borealis, see through windows and such.
You sound like a climate crank – “forcing the Earth to heat up”?
“The components of the atmosphere, like all matter, radiate energy according to their absolute temperature”
Exactly. So cool CO2 and H2O in the high, cool atmosphere radiate less well to space than lower, warmer CO2 and H20. The more CO2 and H2O, the the higher the effective radiating level and the LESS thermal radiation emitted to space.
If you keep the same incoming sunlight (ie “radiation penetrates the atmosphere from outside” as you put it), but decrease the outgoing thermal IR by, say, 1 W/m^2, what do YOU think will happen? Is there any choice by for the earth to warm up?
Tim,
Don’t keep being silly.
You wrote –
“The more CO2 and H2O, the the higher the effective radiating level and the LESS thermal radiation emitted to space.”
Sheer pseudoscience. You obviously refuse to accept that the surface has cooled since it was molten. The surface. It radiates to space, being hotter than its surrounding environment.
Your stupid “if” is in the class as if my bicycle had three wheels it would be a tricycle”.
The Earth has cooled. The surface cools every night. Cooler during winter.
Go ahead. Try making something, anything, increase its temperature by reducing its heat loss after being heated to its maximum by the Sun! No ifs, buts, or maybes. Oh, and stop the temperature dropping at night.
TF, quit trying to pervert reality.
You have admitted that the so-called GHGs emit to space. If more GHGs are added, there will be more emission to space.
Swenson says: “You obviously refuse to accept that the surface has cooled since it was molten. “
I accept (and I am sure everyone else does too) that the surface has cooled *overall* in the past 4 billon years.
When the surface was an average of 1000 K, it was absorbing an average of few 100 W/m^2 of sunlight and emitting an average of ~ 50,000 W/m^2, so it was losing a lot of energy and cooling quickly.
When the surface was an average of 500 K, the earth was absorbing an average of few 100 W/m^2 of sunlight and emitting and average of ~ 3,500 W/m^2 back to space, so it was losing a bit of energy and cooling slowly.
I do NOT accept (and I am sure no one else does either) the that surface has cooled *monotonically* since it was molten some 4 billion years ago.
Now when the surface is a little below 300 K, the earth is emitting and absorbing about the same amount so the surface stays about the same. But it varies up and down. During the age of dinosaurs, the average surface temperature was higher than today. During the last glacial period, the temperature was lower than today.
<i?"The Earth has cooled. The surface cools every night. Cooler during winter."
And it warms every day and every summer. No one denies this.
Swenson also says: “Try making something, anything, increase its temperature by reducing its heat loss after being heated to its maximum by the Sun! “
I am curious what you think “its maximum [temperature] by the sun” would be. In principle, the sun can heat something thing to the surface temperature of the sun (using some combination of mirrors and/or lenses). If this is what you mean, then you are correct — you can’t get something above 5700 K using sunlight and then ‘reducing heat loss’. But I doubt that is what you meant, since this has nothing to to with earth’s climate.
Perhaps you mean the effective blackbody temperature of an object. For the earth, that is 255 K. But the earth’s surface is clearly warmer than that. If that is what you meant, then the earth itself proves you wrong.
Perhaps you meant some specific, actual surface during the day as sun shines on it. But that also fails. If I place a glass-topped box on the ground, the ground inside the box will be warmer than the ground outside the box, due to the suppression of convection and/or the suppression of thermal radiation. If that is what you mean, then this experiment proves you wrong.
If you mean something else, you will have to spell out what “maximum [temperature] by the sun” of what system under what conditions you actually mean.
Tim,
Read what I said.
I wrote –
Try making something, anything, increase its temperature by reducing its heat loss after being heated to its maximum by the Sun! No ifs, buts, or maybes. Oh, and stop the temperature dropping at night.
You pretend you cannot understand what I said.
Are you really that thick?
If you think you can cunningly make something heated by the Sun, even hotter by insulating it after it has been heated, go your hardest.
Maybe you could try playing some of Wayward Wee Willard’s “silly semantic games”.
I meant what I said. You will note I said “try”. I meant in the physical sense, not your usual witless fantasy scenarios.
You could “try” to accept reality, and abandon the GHE cultist fantasies.
“Try making something, anything, increase its temperature by reducing its heat loss after being heated to its maximum by the Sun! “
And that is exactly what I described. “something” = “a patch of dirt”. Let the sun warm the dirt on a sunny summer day. Wait until afternoon when the the patch of the dirt “has been heated to its maximum by the sun”. Then put a glass-topped box over that patch of ground. By “reducing its heat loss” by convection up into the atmosphere, the surface will definitely warm a bit further.
Exactly your words. Achieving exactly what you thought was impossible.
Tim,
That is your fantasy. Try it. See what happens.
If the body has reached its maximum temperature using radiation from the sun, it will cool from that point, by definition.
You cant make it hotter, without introducing additional energy.
Your “silly semantic games”, a la the delusional Whacko Wee Willy Willard, won’t create energy.
Getting hotter means temperature increase. Not something else cooling more quickly, as climate crackpots are fond of saying.
Not even cooling more slowly than otherwise!
> If the body has reached its maximum temperature using radiation from the sun, it will cool from that point, by definition.
See, Mike Flynn?
That is a silly semantic game!
You’re a natural!
Swenson, the miscommunication here seems to be your ill-defined “maximum temperature using radiation from the sun”.
What you seem to mean is “maximum possible temperature” when:
* using 960 W/m^2 of radiation from the sun (albedo = 0.3)
* emissivity = 1
* sunlight directly hitting a flat surface
* no atmosphere, so no conduction or convection
* 2.7 K surroundings
* perfectly insulated and/or perfectly reflective on on the back side of your surface, so the emitted radiation only goes from the flat surface that the sun is hitting.
In those very specific circumstances, then yes indeed, the maximum possible temperature is about 90 C. This is *NOT* some sort of ‘universal maximum temperature from solar radiation’. Change any of conditions and the ‘maximum possible temperature’ will be a different value.
The actual maximum ‘natural’ surface temperature is also about 90 C, but this is a coincidence. Albedo and emissivity are different. The surroundings are not 2.7 K. Convection of heat up into the atmosphere is possible. The first three each would tend to warm the surface above 90 C. The 4th would tend to cool the surface below 90C. It just happens that the actual combo can produce temperatures up to about 90 C.
For the heat wave Alarmistas who told here about horrible temperatures in Germany these days:
https://www.wetteronline.de/wetterdaten/baruth?diagram=true&iid=10376&ireq=true&metparaid=TXLD&period=4
I was terrified!
Not by the temperature of course :- ))
J.-P. D.
That’s not Germany tho, Binny.
Wayward Wee Willy,
More “silly semantic games”, pup?
You need to lift your game, kiddo.
You could always go back to Troll U and demand a refund. Do they refund students who are severely handicapped mentally?
Oh well, maybe if you try harder, you might be able to at least annoy someone. Don’t give up!
Mike Flynn,
Last I checked, Baruth is not Germany.
Unless…
Smile,
Silly Billy Willy,
More “silly semantic games”, kiddo?
You might notice that Bindidon wrote “. . . horrible temperatures in Germany . . . ”
Your fantasy is a wee bit defective Wee Willy. Or are you now claiming Baruth is not in Germany?
Keep braying, donkey.
Mike Flynn,
Baruth is in Germany.
Baruth is not Germany.
You really are not in form today.
Willard
It seems that you don’t know much about Germany.
The recent so-called ‘heat wave’ was centered in Brandenburg state, more precisely around Berlin.
That’s where I live since nearly 50 years, Willard.
The rest of Germany was cooler but was visited by heavy rainfall and hail (what we here luckily didn’t need to experience).
J.-P. D.
Binny,
I don’t know to whom you’re referring to with your silly “alarmistas,” but if it’s the DWD, you should check this out:
https://www.dwd.de/DE/wetter/warnungen_gemeinden/warnWetter_node.html
Last time I checked Stuttgart wasn’t near the Brandenburg state.
“Projected temperatures on Sun-Mon across PacNW are so extreme that I think folks are having difficulty putting them into context. There remains some uncertainty, but places along I-5 corridor from Medford to Seattle have potential to *shatter* all-time records.”
https://twitter.com/Weather_West/status/1407787255360462848
Now I am very alarmed.
s,
You enjoy being alarmed about “Projected . . .” and “uncertainty . . .” and “potential . . .”.
Well, you might drop dead in the next few minutes from a sudden stroke. An airplane or asteroid might squash you flat. And so on. Plenty of potential and uncertainty about the future!
And it seems certain you are going to die at some time.
Be alarmed. Be very alarmed.
Spoken like a real dinosaur.
Just change your diaper and you will be fine
studentb…”Projected temperatures on Sun-Mon across PacNW are so extreme that I think folks are having difficulty putting them into context”.
There’s a good reason for that, there is no context. It’s summer and things get hot, even in the Pacific NW. Your context, about catastrophic climate change does not exist.
When you read the fake news, their articles are full of exaggerations like ‘smashed the record’, ‘staggering record’, etc. Fear sells news and the creeps are cashing in on scaring people about a few tenths C.
Locally, in the Vancouver area, things tend to get progressively hotter in summer the farther you get from the coast. The fake news are raving about records set 60 and 90 miles up a local valley from Vancouver, where the official temperature recording facilities are right on the water.
For example, Abbotsford is about 50 miles from Vancouver and it is currently 24C. Hope is 90 miles away and it is currently 24 C. Vancouver is 22 C. By this weekend, Abbotsford is projected to be about 38C and Hope similar while Vancouver is expected to be 32 C.
Those are unusual temperatures around here but what does it mean when it’s around 22C on Thursday and expected to be 32C on Sunday? It will likely be back to 22C in a few days.
Can CO2 or WV cause such variations over a few days. No way. So why all the dumb alarmist talk?
Heat waves can be amplified by a lack of convection. Without cooling winds, the direct rays of the Sun can make things incredibly hot. This has nothing to do with climate change/global warming and everything to do with fluke conditions where convective cooling is absent.
“How does heat as the response to solar SW irradiance move from the surface to the atmosphere?”
Hi Bindion,
Primarily through evaporation and condensation.
Neat thing, water also absorbs a lot of ir from the surface, heating the air around it, driving convection.. Increased convection increases the rate of evaporation cooling the surface..
Conduction is also increased but is a bit player compared to evaporation..
Cheers!
“How does heat as the response to solar SW irradiance move from the surface to the atmosphere?
Hi Bindion,
Primarily through evaporation and condensation. ”
That turns out not to be the case.
More than 75% of the energy loss from the Earth’s surface is by radiation.
https://en.m.wikipedia.org/wiki/Earth%27s_energy_budget#/media/File%3AThe-NASA-Earth's-Energy-Budget-Poster-Radiant-Energy-System-satellite-infrared-radiation-fluxes.jpg
Entropic man
I don’t think that PhilJ will accept your explanation; that is due to the so-called ‘Trenberth syndrome’.
But on the other hand, I still await real numbers for heat exchange due to evaporation.
Maybe I find something useful in
ftp://cola.gmu.edu/pub/huangb/Fall14/Lecture9.pdf
J.-P. D.
This might be niche to read as well, though driven by other topics:
http://www.fao.org/3/x0490e/x0490e04.htm#evaporation
That brings back memories.
Measuring evapotranspiration in the lab was easy.
Measuring evapotranspiration in the field was a massive pain in the glutei.
Above, delusional Wee Willy Willard wrote –
“Give me a real email.
Don’t make me find it.”
Ooooh! Demand! Oooooh! Implied threat!
Whacky Wee Willy doesn’t seem to realise that he is an impotent, powerless, petulant excuse for a fool.
There is a village somewhere hoping Whacko Wee Willy can’t find his way back.
Swenson
Willard is indeed impotent to stop your rantings.
As Schiller wrote:-
Against stupidity
The Gods themselves
Contend in vain.
Entropic man
The problem is that while Swenson produces enough junk on his own, he is now producing twice as much, as Willard constantly feels the need to incite him.
J.-P. D.
Binny,
Thank you for telling me how I feel and for blaming me for Mike Flynn’s bullying. That means a lot to me.
How does it feel to live in a world where your cranky uncle act can be double checked by any kid with a phone?
EM,
And Einstein wrote – “Two things are infinite: the universe and human stupidity.”
Are climate cranks who deny that the Earth has cooled over the last four and a half billion years or so, stupid, mad, or just delusional?
Feynman wrote – ” It doesn’t matter how beautiful your theory is, it doesn’t matter how smart you are. If it doesn’t agree with experiment, it’s wrong.”
Pity you can’t even find a theory, let alone devise an experiment to test it.
You and Witless Wee Willy share the same delusion. It is a pity you can’t put it into words sufficiently rigorously that real scientists can examine your ideas.
“Are climate cranks who deny that the Earth has cooled over the last four and a half billion years or so, stupid, mad, or just delusional?”
You keep missing the point!
1) No one denies that the earth’s INTERIOR (core, mantle, and all the but very top of the crust) has cooled over the past 4 billion years. Can you find even one “stupid, mad, or just delusional climate crank” who says the earth as a whole is warming???
2) Everyone accepts that the earth’s SURFACE (the top few meters of crust, the oceans, and the atmosphere as a whole) have warmed and cooled many times. The coming and going of ice ages is clear evidence. So are satellite records
It is beyond comprehension that someone cannot distinguish between the two concepts. “Global” warming means “global surface” warming. We live in a thin region near the boundary of land, ocean, and atmosphere. Therefore, global surface warming is the issue that directly concerns our lives.
Is has always amused me that on one hand we have statisticians who love normal distributions, linear trends, LOWESS and the like and on the other hand time series analysists who prefer gaussian, low pass and SavitzkyGolay filters. As though they don’t do basically the same thing.
It’s almost as if DSP and frequency analysis is not a valid science in some peoples minds.
RLH, Data of forcings affecting Climate exhibit “oscillations” which appear cyclic, which are non-cyclic, i.e., they don’t have fixed periods. For example, the solar sunspot data has been repeatedly analyzed in an effort to determine periodic activity, but identifying such cycles has had little success, IMHO. Sunspot data includes periods in which there were no recorded sunspots, which makes cyclic analysis problematic. The sunspot cycle, including the associated Hale magnetic reversal cycle, is close to the period of Lunar precession cycle, which adds further confusion.
Filtering data may provide visual evidence of cyclic processes, but the filtering process can also distort the original signal in ways which can produce spurious cycles in the output, since the “energy” of the higher frequency portion of the time series remains within the filter’s smoothed output. Applying PSD or MTM analysis to such data may find hits on periodic cycles which do not exist.
“Data of forcings affecting Climate exhibit “oscillations” which appear cyclic, which are non-cyclic, i.e., they don’t have fixed periods.”
‘Wriggles’ are not quite the same as ‘cycles’. They can and do exhibit non-fixed periods. Sometimes they are longer, Sometimes they are shorter. They do all exhibit positive and negative portions though. So wriggles is what I will call them.
“but the filtering process can also distort the original signal in ways which can produce spurious cycles in the output”
Using a Gaussian low pass filter produces almost no distortions in the output. It acts as a band pass splitter. High frequencies are in one band, low frequencies are in the other. Careful choice as to the corner frequency (particularly if it is in a low energy part of the bandwidth) mostly creates an ideal outcome.
I think I will have to produce a decomposition of the signal graphs I have to date into the 2 bands, high (15 years) frequencies. Together they will reproduce the input signal.
Parser/html problems again
…I have to date into the 2 bands, high (less than 15 years) and low (greater than 15 years) frequencies. Together they will reproduce the input signal.
RLH wrote:
I think not. Your 15 year 8-10-12 year CTMA filter will lose 15 years at each end of the truncated time series. You can’t recover those missing data points by adding in the high pass data. That may or may not be a problem, depending on your goal.
I hope you took the time to look at the Wiki page on sunspots. there are more than 100 references at the end, several of them reporting efforts to find periodic “signals” in the data.
Over the period of coverage I should have added.
Of course I could extend the full kernel filter by using a S-G 15 year filter (the filtering equivalent of LOWESS in statistics) but I am on record as stating that it too become untrustworthy towards the ends also.
Sunspot data may not rise above the noise floor in the temperature data. The gross orbital characteristics of the non-circular orbit of Earth impacting directly on temperature does not lead to great expectations in that regard.
“Your 15 year 8-10-12 year CTMA filter will lose 15 years at each end of the truncated time series.”
I use 12,10,8 months for a 12 month filter
I use 180,149,116 months for a 15 year filter
You are right about the shorter coverage period though, just not the length.
RLH, The spreadsheet example you posted back on about 9 June first applied a 8 month, then a 10 month and finally a 12 month moving average. You also mentioned that the order didn’t make a difference. Do you still stand by that claim?
“The spreadsheet example you posted back on about 9 June first applied a 8 month, then a 10 month and finally a 12 month moving average. You also mentioned that the order didn’t make a difference. Do you still stand by that claim?”
Well as the individual steps are purely additions and the order of additions does not matter, yes I do.
I now use 12, 10, 8 months (for 12 month) and 180, 149, 116 months (for 15 year) in that order in all my current work.
They produce the same results as does the original spreadsheet I published back in 2014 over on WattsUpWithThat.
The particular values I use came from Vaughan Pratt back in the day.
1, 1.2067 and then 1.5478 as inter stage multipliers
12, 10, 8 comes from
12 / 1.2067 = 9.94447667191514 = ~10
12 / 1.5478 = 7.752939656286342 = ~8
An interesting bit about Monte Carlo Singular Spectrum Analysis
https://www.researchgate.net/publication/237111827_New_Tools_for_Analyzing_Time_Series_Relationships_and_Trends
J.-P. D.
Quite interesting. The main problem with wavelet analysis is that you must be aware that, because it it sine wave driven, it can often miss things that are not mainly sine wave in presentation/outcome.
This is a small criticism really because the main features will often be captured by a wavelet but it is still worth noting.
It is also worth noting that the energy in the wavelet analysis is quite low around the 15 year periodicity, and that appears to be true across a wide range of climate data, which is why I chose 15 year as my low pass filter corner.
Heat wave: Record highs expected this weekend in Salem and across Oregon Salem Statesman Journal June 23, 2021
The warmistas are so hard up for some warming after the global temperature fall back to the zero line one heat wave has them falling all over themselves like their igloo is on fire
https://i.postimg.cc/26JnsgCV/global-warming-panic.jpg
“But on the other hand, I still await real numbers for heat exchange due to evaporation.”
Hello bindion,
The heat capacity and latent heat of vaporization of water are well known of course.
That latent heat is converted to sensible heat in the atmosphere as water condenses..
Your link had a good discussion of factors that affect the rate of evaporation.. From that link:
“Evaporation of water requires relatively large amounts of energy, either in the form of sensible heat or radiant energy.”
Which supports my assertion that water cools the surface (does anyone really think otherwise? )
“Which supports my assertion that water cools the surface (does anyone really think otherwise? )”
The one comment I would make is to clarify what you include when you say “water”.
“Water” cools the surface via the evaporation process.
“Water” cools the surface via clouds/snow/ice reflecting away sunlight.
“Water” warms the surface via water droplets in clouds emitting thermal IR toward the surface (eg cloudy nights tend to be warmer than clear nights)
“Water” warms the surface via water molecules participating in the the greenhouse effect.
So I definitely agree that “water cools the surface” (by some mechanisms).
I also definitely agree that “water warms the surface” (by some other mechanisms).
I am not prepared at this time to say what the net effect is.
Hello Entropic,
“More than 75% of the energy loss from the Earths surface is by radiation”
Look at that diagram again, and you will see that heat loss by evaporation is much larger than heat loss by radiation from the surface (comparing net numbers with net numbers)
Ciao!
“Look at that diagram again, and you will see that heat loss by evaporation is much larger than heat loss by radiation from the surface (comparing net numbers with net numbers)”
https://en.m.wikipedia.org/wiki/Earth%27s_energy_budget#/media/File%3AThe-NASA-Earth's-Energy-Budget-Poster-Radiant-Energy-System-satellite-infrared-radiation-fluxes.jpg
Longwave radiation emitted by surface 398.2 W/m^2
Conduction/convection 18.6 W/m^2
Evapotranspiration 86.4 W/m^2
Total loss from surface 398.2 + 18.6 + 86.4 = 503.2W/m^2
% radiation 79.1%
% Conduction/convection 3.7%
% evapotranspiration 17.2%
Please explain how you managed to persuade yourself that the surface loses more heat by evaporation than radiation.
Thanks for bringing this up again, Ent. The “energy budget” nonsense needs a lot of attention.
The first thing to notice is that it makes no sense to try to balance flux, since there’s no reason it should balance. Flux is NOT conserved.
So all your figures are meaningless anti-science nonsense. That’s why it shows more flux being emitted from Earth than arrives from Sun!
It’s laughable. And, that’s just the start!
Entropic Mans requests: “Please explain how you managed to persuade yourself that the surface loses more heat by evaporation than radiation.”
In this case he did specify “net numbers”. The net numbers for IR radiation are 398.2 outgoing and 340.3 incoming, for a net transfer of 57.9 W/m^2 from the surface (based on the numbers in the graphic). The evapotranspiration and conduction already are net, so this makes (net) evaporation about 50% larger than (net) IR radiation.
–Tim Folkerts says:
June 24, 2021 at 8:22 AM
Swenson says: “You obviously refuse to accept that the surface has cooled since it was molten. “
I accept (and I am sure everyone else does too) that the surface has cooled *overall* in the past 4 billon years.
When the surface was an average of 1000 K, it was absorbing an average of few 100 W/m^2 of sunlight and emitting an average of ~ 50,000 W/m^2, so it was losing a lot of energy and cooling quickly.–
When the surface was 1000 K, the surface was under the ocean.
One might ask how much ocean did we have when surface was 1000 K.
We could assume we had more or less ocean then we have now. But in meantime let us assume it the same. And then go from there.
“The average depth of the ocean is about 12,100 feet . ”
12,100 feet = 3688 meter
3688 meter of water as atmosphere is 368.8 Atm
Or Earth at 1000 K surface has more than 3 times more atmosphere as compared to Venus, currently.
That 1000 K surface would have no sunlight reaching it.
It’s kind of like the world as described in the Bible.
Something about there was darkness- and then, etc.
But a relevant point, how does something like Venus emit 50,000 W/m^2.
Or not hard to imagine Venus surface being 1000 K, a 100 km diameter space rock hitting it, should make that happen. And that happened, Venus might emit about 200 watts per square meter.
If Earth when surface was 1000 K, and “was absorbing an average of few 100 W/m^2 of sunlight”, it not cool very quickly.
I have mentioned that advantage of Venus is one could consider it a fortress planet. It pretty safe against military attack- such as the planet being hit by 100 km diameter space rock. Or if living in Venus sky, it doesn’t matter much if rocky surface is 1000 K. One sleep through a 100 km diameter impactor, and then ask in morning, anything happen while I was sleeping- and then be informed 100 km impactor hit Venus 5000 km away. And you could say, glad it didn’t hit nearer, and eat your breakfast.
Or recently I said if living 100 feet under ocean, and Venus atmosphere was “somehow” place on top of Earth atmosphere, one fail to notice it- other than increased pressure [human are affected a lot by pressure change, one can straight out be killed reduction of pressure, going into very high pressure, can be a medical therapy].
So, Venus hot atmosphere place on top of earth is very cold compared to surface of 1000 K. A few meters of ocean water evaporate and Venus clouds glow hot for a while.
Or Venus wouldn’t be a good fortress, if didn’t remove acid clouds- or a military attack could be just be throwing water at Venus. But the acid is too valuable, not mine them.
So, 1000 K Earth is not going to emit 50,000 W/m^2. And interested in how it was absorbing an average of few 100 W/m^2 of sunlight at Earth distance from the Sun.
Because, at Venus distance from the Sun, I believe the “greenhouse gas” of the Venus acid clouds absorb around 100 watts per square meter. And would not absorb much at Earth distance from the Sun. And could not have such acid clouds if the world is a water planet.
It seems Earth when surface 1000 K would be very shiny white world reflecting more sunlight at Earth distance than Venus currently reflects at Venus distance [getting twice as much sunlight]. Or Venus reflects say, +60%. The 1000 K Earth should reflect closer to %90.
An interesting story could be, if you were space alien [or god like] and wanted to start some life.
First thing you want to do is kill the wrong kind of life on a planet.
So say had situation of having Earth before it really become Earth, and cause Mars like planet to to hit it, and make the Moon.
Space aliens probably find nothing of value in our solar system- but if were interested in Earth, they could fix Earth fairly easily.
Earthlings tend to want to find a earthlike planet- because Earthlings are silly. You don’t want to find a Earth like planet, because if was Earth like, it might have life on it.
If find life on Mars, it could be a bad thing. We might have not use a planet which is closest thing in solar system which we regard as somewhat close to being like Earth. It has CO2, which is needed for life, and it has some water. It “could” have a lot water- lot of water meaning more water than humans could possible use in next thousand years or so. But our solar system has more water than human could use in thousand or perhaps a million years. There is far more water in our solar system than on Earth, and most of water is probably fresh, rather than saltwater.
Or Earth has tiny amount of freshwater and most of it, is glacial ice. And large amount ground water- which would require a lot energy to get to the surface. Glacial ice is most and cheapest fresh water to get, if need a lot of water. Or as said that where I would get the water to green the Sahara desert.
So, having life on planet, is problem, and even if one anciently related to that life, it could still be a problem- it might more of problem if it utterly alien life. But hard to see much value, living on Earth surface. The gravity and thick atmosphere- it might be good place for life to evolve {perhaps} but not much of value to a spacefaring civilization {though if from it- you going to like that planet, it could be the holy of holies- one could have crazy amount passion for such a planet.
But Earth is not very practical or economical. Venus is better.
Venus is in a good location in our solar system- as compared to Earth [or Mars].
But back story. Come to think about it, adding water to Earth is adding time, before one can use it. What would better if Earth already had water, is to hit with something with a lot iron in it and dry- you going to punch thru all water and atmosphere and heat the core of the planet. But apparently that is not happened with Earth. We think it was not a direct hit, but plowed to into the mantle. But maybe time wasn’t the issue for these space aliens- maybe were stopping other aliens from using Earth for few million years.
Anyhow, the moral of story, is Earth is easy to incinerate- whether by natural chance, or by spacefaring civilization.
I don’t think we have visited by space aliens. But I did, I would be even more interested in Humans becoming spacefaring- and am already, fairly interested in that happening, sooner, rather than later.
Hmm.
Now, I am wondering where our solar system came from.
So, it +5 billion years and circle our galaxy every:
“We take about 225-250 million years to revolve once around the galaxy’s center. This length of time is called a cosmic year.”
So, 5000 million / 250 million is 20 times around. But every few million year we running across other solar systems.
So roughly in 250 / 5 million year as least amount of “encounters”
we have 50 encounter per “cosmic year”. And 1000 since formation.
So, mention before:
Gliese 710 will be about 0.166 lightyears from Earth in 1.286 million year.
And:
Scholz’s star and companion brown dwarf was 0.82 lightyear 78,500 years ago.
And whole list of them and expect to find even more, here:
https://en.wikipedia.org/wiki/List_of_nearest_stars_and_brown_dwarfs
And more specifically:
https://en.wikipedia.org/wiki/List_of_nearest_stars_and_brown_dwarfs#Distant_future_and_past_encounters
So probably a lot more encounter if talking within 1 lightyear.
My numbers might apply to closer encounters- say an encounter than alter our orbit around the galaxy [by a “significant amount”- and say that Scholz star doesn’t quite count as what meant by a “significant amount”].
And last few years “somewhere” some one was talking about Sol coming from nearer to center of our galaxy. But in any case stars do travel from nearer to the center of our galaxy or have near escape trajectory and/or have highly elliptical galactic orbits.
It just seems strange that we talk about formation of solar system and no mentioning of where it formed. It seems it would matter where it formed. And if we were on ball, chemical analysis might give some clue. Maybe that could determined when get some sample returns??
“After orbiting the Sun twice, the OSIRIS-REx spacecraft is due to reach Earth Sept. 24, 2023. Upon return, the capsule containing pieces of Bennu will separate from the rest of the spacecraft and enter Earth’s atmosphere.”
Though it seems not all our space rocks, could been from our solar system formation- because as other solar system get near Sol, we give them rocks and gets rocks from that solar system which passes near us. Or might need a lot different space rock sample to put the jugsaw puzzle together. But Bennu being rubble pile, could have material from a lot of space rocks.
gbaikie,
There are all sorts of “what ifs” we could play. We could also look at astronomy research and see what other people think might have happened (for example, here: https://forces.si.edu/atmosphere/02_02_01.html).
But the germane point is that everyone agrees that the surface once was hot and now is not as hot.
The other germane point is that the atmosphere is not monotonically cooling, but bounces up and down due to any number of factors.
–The Earliest Atmosphere
(4.6 billion years ago)
When Earth formed 4.6 billion years ago from a hot mix of gases and solids, it had almost no atmosphere. The surface was molten.–
If surface is molten, does affect whether there is atmosphere.
We only have small regions in which we have seen molten surface- and such small region seem to little affect upon the atmosphere.
It seems many agree that within last billion years, Venus surface was probably a molten surface.
But with our relative small atmosphere it is not stopping red hot rock radiating into space- though 1000 K rock is not quite red hot.
Though molten with Venus could mean hot enough to make surface uniformly level. Though come think about it, Venus is not vaguely level. Both Venus and Moon have wide variation in elevations- and no plate tectonic activity or erosion to get a rugged terrain.
Though fair to say Venus is smoother than Earth’s surface.
I think 100 km space rock would cause Venus to become 1000 K, but not aware anyone modeling it.
With Earth one has to know whether the expectation is whether Mars size rock hit proto Earth- which commonly assumed valid possibility or seen as likely to have happened.
Above seems to convey a less violent beginning- but it seems everyone imagines rocks bigger than 100 km smashing into one another {oh, “Since 2018, the existence of the Late Heavy Bombardment has been questioned”- so much everyone agreeing]
And if assume at earth distance involving orbital velocities of around Earth distance from sun, the average velocities are around 20 km- unless it’s mostly belt of rocks in similar inclination and distance around the sun. Or sun has a ring [huge ring} like Saturn’s ring.
Or if all space debris was in Earth’s equatorial orbit- you don’t have problem high velocity impactors- it’s mostly the different inclinations orbit which give the high velocities.
Or in that situation impactors would be around 10 Km/sec or less. Or average well below 10 km/sec. But seems one would have think Earth is presently mostly molten, due mostly to radioactive heating rather have primordial heat from formation. Though maybe tidal heating gets blamed.
But anyhow, I think it’s better than 50% chance that large object hit Earth, and from that, the moon was formed.
Let’s see modeling on that says Earth’s atmosphere.
https://skyandtelescope.org/astronomy-news/did-a-mars-size-body-bring-life-essential-elements-to-earth/
As link words say mars size impact brought volatiles [but not necessarily water to proto earth. So brought {and kept- nitrogen, ect.} the atmosphere. And since the body moon didn’t go far from Earth, neither would any of gases.
And if seems moon reformed and had atmosphere and close enough to Earth, Earth’s stronger gravity would take it.
Or low gravity world will have higher atmosphere- or put Mars atmosphere on Moon, the Moon would have much higher atmosphere than Mars, both from lower gravity and warmer atmosphere, but Moon could left with as much atmosphere as Earth orbit at say 400 km- which about twice much as the Moon has now.
And. what height Luna atmosphere now? {that was harder than I thought, but:
“Using instruments aboard the Japanese lunar orbiter SELENE (also known as Kaguya), Tanaka et al. made the first spacecraft-based observations of the lunar exosphere when the Moon was inside Earth’s magnetosphere. They detected ions of several elements at 100-kilometer (62-mile) altitude above the lunar surface.”
So say up to somewhere around 100 km {the exosphere}. And if had much as LEO, maybe it could be as high 200 km.
Earth atmosphere extent is likewise hard to find, but some say it’s extends as far about 1/2 way to our Moon- Earth’s exosphere [or at higher density than solar wind or space density- which apparently is more then density of space in most of universe- which is less 1 molecule per cubic cm. Moon has about 100 per cubic cm].
But if the earth surface was very hot, the air density at surface would quite low. And also sulfur is gas if hot enough- which would join with oxygen if any was there.
[“Sulfur makes up almost 3 percent of the Earth’s mass, according to Chemicool. That is enough sulfur to make two additional moons.”]
At 320 C at 1 atm it’s about 0.61 kg per cubic meter and at 20 C it’s 1.2 kg per cubic meter.
Tim,
You wrote –
“The other germane point is that the atmosphere is not monotonically cooling, but bounces up and down due to any number of factors.”
This just another piece of obfuscatory climate crackpottery, implying much but completely irrelevant.
Yes, the atmosphere is not isothermal. Nor is the surface. Never has been, never will be.. For example, the temperature of any portion of the surface (the interface between the solid crust and the aquasphere or atmosphere) may vary between about 1250 C and -90 C.
So what?
Any solid surface exposed to the Sun will generally rise in temperature during the day, and fall during the night. This is actually well known.
Nothing to do with the so-called mythical GHE. of course. That is why you are reduced to vague generalities, and rejecting things like the laws of thermodynamics.
You seem to claim that the Earth’s surface can magically heat or cool itself, while the interior continues to cool. Complete nonsense. Heat moves from hotter to cooler, as far as is known. Given that the only natural external heat source of consequence is the Sun, which has shown itself to be incapable of preventing the cooling of the surface for four and a half billion years, you are delusional if you believe that some magical influence (AKA the GHE) can create enough energy to overcome known physical laws.
Get a grip. The maximum temperature achievable through unconcentrated sunlight is 90 C or so. Try and prevent the surface of such an object cooling at night, say. Or in winter. Just silliness.
Keep fantasising. Provide a novel reason to contradict my assumption that the Earth’s surface has cooled to its present state (between 1250 C and -90 C) from a previous much hotter temperature, if you can. If you can’t, the concept of a GHE is pointless. Occam’s razor, and all that.
What’s wrong with just accepting reality? That the Earth has cooled to its present state?
I suppose it is because climate crackpots are delusional, gullible, and unable to think for themselves. Typical cult members, who accept Climate Cult Science without question.
“What’s wrong with just accepting reality? That the Earth has cooled to its present state?”
The problem is that it is too simplistic.
Compared to 2 years ago, the earth has COOLED to its present state.
Compared to 10 or 100 or 20,000 years ago, the earth has WARMED to its present state.
Compared to 20 million or 60 mi years ago, the earth has COOLED to its present state.
Compared to the Permian glaciation ~ 300 million years ago, the earth has WARMED to its present state. Compared to 4 billion years ago, the earth has cooled to its present state.
“You seem to claim that the Earth’s surface can magically heat or cool itself, while the interior continues to cool. “
Not at all. I claim that — based on the laws of physics — the surface can get warmer or cooler by changing such things as albedo, emissivity, or convection in the oceans and atmosphere. Not magic.
Such warming and cooling has been observed repeatedly as glaciers advance and retreat. You can claim it is impossible, but the earth proves you wrong!
Here is a interesting claim:
“Over vast periods of time, our primitive ocean formed. Water remained a gas until the Earth cooled below 212 degrees Fahrenheit. At this time, about 3.8 billion years ago, the water condensed into rain which filled the basins that we now know as our world ocean.”
https://oceanservice.noaa.gov/facts/why_oceans.html
I can’t think of any particular reason disagree with this, but I am interested if someone can provide some other alternative time period for when Earth’s ocean formed.
In meanwhile, I will search a bit more for other guesses.
4004BC?
https://en.m.wikipedia.org/wiki/Ussher_chronology
Notice how they work their deception. They use the word “facts” in the middle of the link.
They label their beliefs “facts”.
Facts can be challenged/disputed.
Or one could say the only thing good aspect about facts is to
state them. Better to state what is regarded as fact- that is essentially, science.
Facts = do
No facts = no do.
There are facts which could be argued against Earth ocean beginning
to come into existence around 3.8 billion years ago.
Though others might imagine Earth was created about 6000 years ago,
some people who think we live in simulation- don’t even think Earth is existing- it’s simulation. But one could question when they thought the simulation started [assuming that has any significance, but whether matters or not, trying give a fact in this regard, is something I would regard as better than not trying- why be so lazy if it’s simulation- though perhaps being lazy is reason an idiot is fond of idea it’s a simulation}.
Another thing I am wondering about is idea that Earth [or any planet loses atmosphere and/or water]. If you think earth was create 6000 years ago, or sim, this could still be something you like to know the facts about- if not desiring too much be lazy.
Anyhow, this question specifically is how much water is being lost, due to energy of sunlight somehow splitting water.
It seems to me at present time, it’s amount which is near zero.
Near zero, per year.
Whereas amount water entering earth is more than zero. It depends
upon how much stuff is falling into Earth from space- which thought hundred of tons or thousand of tons per year. Or at least
tons or tens of tons of water per year.
Is it balanced- tons of water leaving and tons entering. Or is more water leaving Earth than entering.
Or if it’s anywhere less than ton water leaving per year one call that zero or some amount too small to measure.
Now let’s try the fake news:
“The Earth has lost a quarter of its water
In its early history, the Earth’s oceans contained significantly more water than they do today. A new study indicates that hydrogen from split water molecules has escaped into space.” And
“Methanogenesis works more efficiently for hydrogen than for deuterium, so more hydrogen gas was created by this process than deuterium gas, and this slowly but surely altered the ratio of these isotopes in the oceans.”
So life farts methane and methane is split into CO2 and H2 by sunlight.
How much methane is split by sunlight:
The atmospheric residence time of methane is approximately 9 years. Residence time is the average time it takes for a molecule to be removed from the atmosphere. In this case, every molecule of methane that goes into the atmosphere remains there for 8 years until it is removed by oxidization into carbon dioxide (CO2) and water (H2O).”
https://gml.noaa.gov/education/info_activities/pdfs/CTA_the_methane_cycle.pdf
So life make methane and sunlight and atmosphere turns it back into water and CO2.
So, … does the facts say bullshit?
rlh…”Not played much with random data have you? Ever heard of the color of noise? https://en.wikipedia.org/wiki/Colors_of_noise”
I have, but the article is taking serious liberties. eg, calling noise due to Brownian motion ‘brown’ noise.
I have been familiar with white noise and pink noise much of my professional life but why they had to come up with the other colour nonsense is the question.
A better question might be, which of them are natural and which of them have to be manufactured using filters? White noise is natural and can result from shot noise, the name given to the random noise produced by electrons moving through a conductor.
I find it gets out of hand when certain researchers begin generalizing. For example, Clausius defined entropy as the sum of infinitesimal changes of heat in a process. In other words, it’s the total heat transfer in a process. He devised it as an adjunct to the 2nd law so it would have a mathematical representation.
All he said in effect was that a reversible process has zero entropy and an irreversible process, representing most processes, has a positive entropy. He added as an aside, that since the entropy of most processes are positive that indicated a movement toward disorder. That is, the process cannot be reversed.
Nowadays, you hear scientists talking about entropy unrelated to heat, as if it is a measure of disorder. It’s not, it’s a measure of heat. Others talk about the 2nd law as if it’s about entropy, while excluding the inventor’s premise that it is a measure of heat transfer, indicating the direction of heat transfer.
I find it somewhat unnerving to hear statisticians talking about noise in data, as if it is unnatural or unwanted data. When I look at Roy’s UAH graph, it is all valid data gathered by telemetry on satellites, yet many people exclude some of it as noise.
On the other hand, if I look at a 60 Hz signal on an oscilloscope, and I see harmonics or signals from other sources, I can dismiss them as noise, in the sense that they don’t belong to the signal i seek. Is that what’s going on in stats, are people dismissing data that doesn’t suit their theory as noise?
“I have been familiar with white noise and pink noise much of my professional life but why they had to come up with the other colour nonsense is the question.”
Red noise is often used in statistics/wavelet analysis. https://www.cosmos.esa.int/documents/1655127/1655136/Torrence_1998_Wavelet_Guide_BAMS.pdf/001d8327-b255-3024-a2f0-ce02e33ac98f
rlh…I wonder if you can see the danger in such applications? When Fourier series are applied in electronics or in the audio field, they are used to generate a real voltage replicate a real phenomenon.
For example, a square wave in electronics is a transition from 0 volts to say 5 volts, holding it briefly, then allowing the signal to abruptly drop to 0 volts. It can be replicated by adding sine and cosine components in a Fourier series, till the square wave is approximated. The technique is used widely in sound synthesis.
Why would you want to use Fourier on raw data of any type? I don’t understand what statisticians are trying to accomplish by analyzing data to death without looking under the hood at what is producing the data.
If something is recurring periodically over years rather than milliseconds, I don’t see how Fourier can be applied. I don’t think it was ever intended for this kind of analysis just as the PCR method for DNA amplification was not intended as a test for a virus.
There is far too much inference going on in science today at the expense of observation. When scientists cannot find direct proof of something, they infer it and try to make it a fact via consensus. Or they analyze data statistically and make inferences that have no basis in truth.
White noise and pink noise have been used in the past to set up sound systems. By flooding a room with a white noise signal and testing the effect it has on an auditorium using microphones, one can get an idea how the room responds to broad-spectrum frequencies.
I don’t get what they are trying to do with the other colours of noise, which as you know, have no colours at all. They are nothing more than names for largely sound frequencies which are ordered by frequency or octaves. Now they seem to be applying that theory blindly to data.
DSP (and any form of time series data analysis) doesn’t really care if the horizontal axis is in milliseconds or millennia.
Noise (and the colour of it) is more a statement of how much it drops (or rises) per octave. Again, the actual time base is not that important.
Most of what you know from audio and other work transfers to climate in timeseries terms without any real change.
Fourier series can be used for IIR, FIR, filters etc. just as easily in climate as for any other DSP analysis. You do need to take into account that nothing in climate is going to be a simple sine wave though. Even orbits are not that simple.
I use 15 years as my low pass frequency point because I ran a normal energy sweep up the yearly bands from 1 year and found that in most cases there was little energy there. The Gaussian filter I use for low pass (actually band pass if I subtract the output from the input to provide both the upper and lower bands) seems to meet all the criteria for robust data analysis.
“It can be replicated by adding sine and cosine components in a Fourier series, till the square wave is approximated. The technique is used widely in sound synthesis.”
JLH taught me that no-overshoot characteristics were the best method of dealing with signals. A Gaussian, CTRM, low pass filter meets all of that requirement quite well and is very simple to implement.
don’t know if this posted…
studentb…”Projected temperatures on Sun-Mon across PacNW are so extreme that I think folks are having difficulty putting them into context”.
There’s a good reason for that, there is no context. It’s summer and things get hot, even in the Pacific NW. Your context, about catastrophic climate change does not exist.
When you read the fake news, their articles are full of exaggerations like ‘smashed the record’, ‘staggering record’, etc. Fear sells news and the creeps are cashing in on scaring people about a few tenths C.
Locally, in the Vancouver area, things tend to get progressively hotter in summer the farther you get from the coast. The fake news are raving about records set 60 and 90 miles up a local valley from Vancouver, where the official temperature recording facilities are right on the water.
For example, Abbotsford is about 50 miles from Vancouver and it is currently 24C. Hope is 90 miles away and it is currently 24 C. Vancouver is 22 C. By this weekend, Abbotsford is projected to be about 38C and Hope similar while Vancouver is expected to be 32 C.
Those are unusual temperatures around here but what does it mean when it’s around 22C on Thursday and expected to be 32C on Sunday? It will likely be back to 22C in a few days.
Can CO2 or WV cause such variations over a few days. No way. So why all the dumb alarmist talk?
Heat waves can be amplified by a lack of convection. Without cooling winds, the direct rays of the Sun can make things incredibly hot. This has nothing to do with climate change/global warming and everything to do with fluke conditions where convective cooling is absent.
Typical “frog in a beaker of water” comment.
Typical irrelevant, obscure, and cryptic comment form an idiot climate crackpot trying to appear intelligent.
stupidb…”Typical frog in a beaker of water comment.”
One thing that is obvious about you alarmists is that you’re strong on quips and ad homs and short on scientific rebuttal.
Gordo has repeatedly claimed that there’s no way that CO2’s effect on global temperature can be increased due to some internal “feedback”, since he can’s find an “amplifier” in the atmosphere. Now he pontificates that:
So convection is an “amplifier”? Subsiding air masses are an “amplifier”? Is this progress, or is this just another of Gordo’s delusional ramblings? What about the TV guys, who blame everything on the Jet Stream, ignoring changes in ocean surface temperatures? How about the fact that subsiding air is very dry, which warms faster than wet air blowing in from the cool ocean into his neighborhood?
SURFACE COOLING UPDATE
https://www.axios.com/arctic-heat-roasts-finland-russia-melts-sea-ice-177d9e9b-c3d5-4fed-b025-9cf5eece781e.html
willard…”In Helsinki, the temperature did not drop below 72.5°F on the night of June 21-22, setting the national record for the highest minimum temperature recorded in June”.
What’s your point? What are you inferring?
Why are you still putting words in my mouth, Gordon?
Blockquotes. Learn the concept.
Also, Gordon needs to learn the difference between infer and imply.
stupidb…”Also, Gordon needs to learn the difference between infer and imply”.
What are you trying to imply?
I am inferring that he is implying that you didn’t infer what you inferred from attempting to establish what Whacky Wee Willy seemed to infer from an apparent alarmist journalistic piece.
On the other hand . . .
Sorry, I was having a chortle about the propensity of the idiots to try to play “silly semantic games”, rather than address the inconvenient truths which face them.
> rather than address the inconvenient truths
I thought they were questions, Mike.
Woeful Wee Willy,
Are you claiming to be one of one of the idiots playing “silly semantic games, or just implying same?
Just a question, Wee Willy, just a question.
Mike Flynn,
“Do you have a point” is a real question.
“Are you an idiot” isn’t one.
Truly,
Witless Wee Willy,
So? Never heard of weather?
You are an idiot – climate is the average of weather, and it changes.
You don’t. You remain a delusional climate crackpot.
Good morning, Mike Flynn.
And who apparently doesn’t know his a.m. from his p.m., or possibly his ass from his elbow.
He’s not only an idiot, he’s a fool.
Enjoy your afternoon, Mike Flynn.
One man’s morning may be another man’s evening. This is the Internet after all.
Mind you, a man could be asleep in both periods.
The predictions were for a second dip into La Niña conditions.
But, they forgot to tell the Pacific Ocean.
https://www.tropicaltidbits.com/analysis/ocean/nino34.png
ENSO 3.4 now at +2C could explain the heat pockets now occurring.
I use
https://coralreefwatch.noaa.gov/data/5km/v3.1/current/daily/gif/cur_coraltemp5km_ssta_large.gif
and
https://coralreefwatch.noaa.gov/data/5km/v3.1/current/animation/gif/ssta_animation_30day_large.gif
as well as they give a better overview to what is going on
Your nino34.png contains no prediction only the past, the actual predictions now indicate the second La Niña will be bigger than the first one, that’s 3-4 month from, nobody predicted it was gonna happen today.
Rest assured, when we are in full blown La Niña, Bidendong will be the last one to figure it out.
eben…”Rest assured, when we are in full blown La Niña, Bidendong will be the last one to figure it out”.
He’ll have one of his Excel charts to prove it wrong. You know, the kind with no references as to where the data came from and with UAH data in lockstep with the fudgers at NOAA.
A prediction for a strong La Nina ahead, e.g. by NOAA?
That was months ago
https://www.cpc.ncep.noaa.gov/products/CFSv2/imagesInd1/nino34Mon.gif
But… I suddenly see that Japan’s Met Agency has changed the blue Nina bar from 10 up to 20 % for Aug-Dec, compared with 4 weeks ago:
http://ds.data.jma.go.jp/tcc/tcc/products/elnino/elmonout.html#fig2
Wait and see!
J.-P. D.
See
https://coralreefwatch.noaa.gov/data/5km/v3.1/current/daily/gif/cur_coraltemp5km_ssta_large.gif
and
https://coralreefwatch.noaa.gov/data/5km/v3.1/current/animation/gif/ssta_animation_30day_large.gif
for a wider and possibly more accurate view of what is happening.
“ENSO 3.4 now at +2C ” No that is actually only +0.2C , it cannot cause absolutely anything, no air pockets either.
Decreasing trend in severe weather
https://www.nature.com/articles/srep42310
Denny
It seems that you didn’t manage to accurately read even the paper’s abstract:
” … Based on continuous and coherent severe weather reports from over 500 manned stations, for the first time, this study shows a significant decreasing trend in severe weather occurrence across China during the past five decades. ”
Great.
J.-P. D.
I wonder why China might see some variations over the last few decades?
https://climatedatablog.files.wordpress.com/2021/06/amo.jpeg
And
https://climatedatablog.files.wordpress.com/2021/06/pdo.jpeg
Somewhere upthread, I read this below, written by the usual, somewhat ignorant and disingenuous suspect:
” Sea levels are increasing? Not at these locations. Many things, the least of which are CO2 and atmospheric temperatures impact sea levels. ”
And he proudly shows:
https://imgur.com/a/siHPINY
Now have a look at this PSMSL trend series I updated today:
https://drive.google.com/file/d/1kLZZQH-zQjkWMvwT72JxAM34cLPOUjMr/view
and search in the list for ‘these locations’.
Do you see what he shows resp. hides?
*
Well, I repeat for the umpteenth time: I don’t care here whether or not CO2 does ‘impact sea levels’.
What disturbs me is that people
– proudly show dozens of NOAA graphs documenting negative sea level trends
but
– don’t even understand that the reason for a falling sea level mostly is the postglacial rebound taking place where the tide gauges are located.
This is the case for the entire Finno-Scandinavian corner (especially the Bothnian Gulf), as well as for the Quebec country in Canada and parts of Alaska.
Conversely, a growing sea level can perfectly be due to mainly land sinking areas around gauges.
This is the case in Southeast Asia, for Japan, Korea etc.
To cope with this, you have to perform vertical land movement corrections, what is done using GPS.
Taking the Swedish gauge in Furuogrund as example, the correction for the postglacial rebound there is 10 mm/yr (according to the SONEL data base, in which many PSMSL gauges and GPS locations are linked).
What means that the real trend for the Furuogrund gauge is +2 mm/yr, i.e. near the worldwide average of all gauges.
J.-P. D.
binny…”Now have a look at this PSMSL trend series I updated today:”
Your uploads show ***ESTIMATED*** levels. And you don’t show the source.
Typical of your posts…ignorant and disingenuous. The person you are whining about seems to be a lot smarter.
Robertson
” Your uploads show ***ESTIMATED*** levels. And you don’t show the source. ”
As usual, you are dumb, ignorant and stubborn.
1. The upload shows levels comparable to those of NOAA; the only difference is that the graphs uploaded by CO2isLife show data less recent than I that I recently downloaded from the PSMSL corner. I can see that when looking at the trends in these graphs.
*
2. It is clearly indicated that the source is the PSMSL tide gauge data.
But you aren’t even able to look for it using Google, as everybody having a brain would do:
https://www.psmsl.org/data/
But even if you had had enough brain to find this, that wouldn’t have helped you much: all commenters able to download compressed data know since longer time that you even don’t know how to do uncompress such data.
Thus, the link below
https://www.psmsl.org/data/obtaining/rlr.monthly.data
/rlr_monthly.zip
is useless for people like you.
And even if you could uncompress that data, you still would never be able to process it, and to compare what you did with the work of professionals:
https://drive.google.com/file/d/1_33qttKhTvMpbdjhnJUCL_-kO6HYlmht/view
Poor Robertson…
J.-P. D.
Oops…
That above was the wrong link. Here is the right one:
https://i.postimg.cc/sg2C1X4P/Sea-level-Dang-Tamino-Bin-1880-2018.png
J.-P. D.
Bindidon.
Glacial rebound in North America causes rises in sea level too. For example, on parts of the East Coast, the coastal regions are subsiding, as the central part of the land mass rebounds and rises.
The conservation of the Earth’s mass has some odd consequences. One part subsides, another part must rise. Taken in conjunction with tectonic movements and continental drift, anyone claiming that changes in sea levels are somehow related to atmospheric composition, GHGs, GHE or anything similar, have got rocks in their heads.
As dumb as a box of hair, as they say. Or a sackful of hammers, if you prefer.
Yeah, Flynnson!
And Earth cools since 4.5 billion years.
If somebody has nothing to say, he sure will have to say something.
J.-P. D.
Binny,
I suppose you deny the Earth has cooled to the temperature it is now?
Or maybe you think it cooled to 33 K cooler, but the magical GHE made it hotter again!
How long before it gets so hot that the seas start boiling?
You are delusional, obviously.
Go and play with your spreadsheets and brightly coloured graphs.
“I suppose you deny the Earth has cooled to the temperature it is now?”
Over how long?
Swenson/Flynn wrote:
I suppose that Swenson/Flynn is denying that some 20k years, much of high latitude North America and Europe were covered with glaciers, a condition which existed for some 100k years before that. What caused those glaciers to melt 20k years ago, if the Earth is cooler now that it was back then?
Hotter? Colder? It all turns out to be dependent on what your x axis is measured in.
I am convinced of this Nino 3.4 forecast. why ? Because the magnetic activity of the solar wind should minimally increase as the solar cycle progresses.
http://www.bom.gov.au/climate/enso/wrap-up/archive/20210622.sstOutlooks_nino34.png
https://climatereanalyzer.org/wx_frames/gfs/ds/gfs_nh-sat4_sstanom_1-day.png
It’s interesting that BOM and CPC have such differing forecasts. BOM is much more La Niña aggressive, calling for 1°C below the zero line. CPC “ensemble mean” barely gets to -0.2 °C.
https://www.cpc.ncep.noaa.gov/products/CFSv2/imagesInd1/nino34Mon.gif
You don’t look at the temperature of the eastern Pacific.
https://climatereanalyzer.org/wx_frames/gfs/ds/gfs_nh-sat5_sst_1-day.png
See
https://coralreefwatch.noaa.gov/data/5km/v3.1/current/daily/gif/cur_coraltemp5km_ssta_large.gif
and
https://coralreefwatch.noaa.gov/data/5km/v3.1/current/animation/gif/ssta_animation_30day_large.gif
for a wider view of what is happening/
Gordon Robertson
Sorry to break it to you, but all measurements are estimates.
Three factors affect the uncertainty of your average; measurement uncertainty, sample size and the internal variation in what you measure.
One measurement is uncertain mainly because of the uncertainty in the measurement device.
When you take multiple measurements you start to cancel out the measurement uncertainty. As you increase the sample size the uncertainty decreases.
Above a certain sample size you get no further improvement because of variation in what you measure.
For example, a mercury thermometer measures to +/- 1C.
As you increase sample size the accuracy of the mean improves as 1/√n. This the mean of 100 temperature measurements is accurate to +/- 0.3C and 1000 measurements gives +/- 0.1C.
Since there are random short term variations in station temperature of +/- 0.1C increasing the sample size beyond 1000 gives no further improvement.
Sorry, typo.
The uncertainty of one temperature measurement is +/- 1C.
The uncertainty of the mean of10 temperature measurement is 1/√10 = +/- 0.3C.
The uncertainty of the mean of 100 temperature measurement is 1/√100 = +/- 0.1C.
“For example, a mercury thermometer measures to +/- 1C.
As you increase sample size the accuracy of the mean improves as 1/√n. This the mean of 100 temperature measurements is accurate to +/- 0.3C and 1000 measurements gives +/- 0.1C.”
Of the same thermometer measuring the same temperature at the same site maybe. You may then consider the ‘errors’ to be normally distributed and thus draw that conclusion.
The range of measurements taken by any one thermometer at any one site will still remain at +/- 1C however. You don’t get to improve on that. That uncertainty will always exist in all the measurements taken by it.
And the mean is a bad way of determining the ‘average’ temperature of anywhere unless you can demonstrate that the distribution during the period in question is ‘normal’. Which it clearly isn’t.
Take a weather system moving across a random distribution of measurement sites. One set will exhibit a rise/fall in temps before the other, depending on the difference in the weather, the speed at which it moves and the distribution of the thermometers it moves over. Is that difference to be lost in your statistical accumulations?
“The range of measurements taken by any one thermometer at any one site will still remain at +/- 1C however. You don’t get to improve on that. That uncertainty will always exist in all the measurements taken by it.”
Climate science has no interest in single measurements. They are always calculating spatio-temporal averages over many measurements. Calculated quantities CAN have a lower uncertainty.
So this a red herring.
“And the mean is a bad way of determining the ‘average’ temperature of anywhere unless you can demonstrate that the distribution during the period in question is ‘normal’. Which it clearly isn’t.”
Declaration that has not yet to be demonstrated by RLH. Another red herring.
Are you saying that the temperatures throughout the day are normally distributed?
“Climate science has no interest in single measurements. They are always calculating spatio-temporal averages over many measurements. Calculated quantities CAN have a lower uncertainty.”
Only if the data is normally distributed.
Central Limit Thm useful here.
Central Limit Theorem
1. The data must follow the randomization condition. It must be sampled randomly
2. Samples should be independent of each other. One sample should not influence the other samples
3. Sample size should be not more than 10% of the population when sampling is done without replacement
4. The sample size should be sufficiently large. Now, how we will figure out how large this size should be? Well, it depends on the population. When the population is skewed or asymmetric, the sample size should be large.
Temperature data violates 1 and 2 at least. You cannot make up for that with quoting 4.
https://en.wikipedia.org/wiki/Central_limit_theorem
Let {X1….Xn} be a random sample of size n — that is, a sequence of independent and identically distributed random variables drawn from a distribution of expected value given by mu and finite variance given by sigma ^.
https://en.wikipedia.org/wiki/Normality_test
“random variable”
So climate temperature data is random is it? Not correlated in any way. Over any timescale?
RLH
Once more: not much more than smalltalk, as do write lots of people at WUWT, especially the uncertainty maestros who denigrate everything what doesn not explicity refer to it, UAH’s remote sensing included.
*
By writing this stuff above, with no commitment and without adding any work of your own to back it up, you silently discredit any work done by others that does not explicitly follow what you wrote.
Thus, once more: Stop talking, START WORKING !
J.-P. D.
You rather obviously have not seen the work I have already done on various climate series to date and published both at my blog and also referenced here.
https://climatedatablog.files.wordpress.com/2021/06/pdo.jpeg
PDO with 15 year low pass added
https://climatedatablog.files.wordpress.com/2021/06/amo.jpeg
AMO with 15 year low pass added
https://climatedatablog.files.wordpress.com/2014/02/had crut-giss-rss-and-uah-global-annual-anomalies-aligned-1979-2013-with-gaussian-low-pass-and-savitzky-golay-15-year-filters1.png
(Remove the space between d and c to make the url work as expected)
https://climatedatablog.files.wordpress.com/2014/02/pdo-reconstruction-1470-1998-shen-2006-with-gaussian-low-pass-30-and-75-year-filters-and-had crut-overlay.png
(Remove the space between the h and c for the url to work as expected)
https://climatedatablog.files.wordpress.com/2021/06/globe-2.jpeg
and last but not least UAH
RLH, Sop, what are the trends in the temperature data, before and after your filtering is applied?
What sort of trends are you looking for?
“before and after your filtering is applied?”
Why would you expect that filtering alters overall trends?
The AMO shows exactly a 60-year cycle, probably related to the polar vortex cycle.
As this shows
https://climatedatablog.files.wordpress.com/2021/06/amo.jpeg
AMO with 15 year low pass added
“The AMO is correlated to air temperatures and rainfall over much of the Northern Hemisphere, in particular in the summer climate in North America and Europe. Through changes in atmospheric circulation, the AMO can also modulate spring snowfall over the Alps and glaciers mass variability. Rainfall patterns are affected in North Eastern Brazilian and African Sahel. It is also associated with changes in the frequency of North American droughts and is reflected in the frequency of severe Atlantic hurricane activity.”
Oh je, das sieht aber richtig süß aus, RLH!
Are you kidding me? This is simply ridiculous.
With ‘START WORKING‘ I didn’t mean toy playing with simple filters applied on existing series, RLH.
I meant to REALLY WORK on raw sources like
UAH 6.0 2.5 deg grid
https://www.nsstc.uah.edu/data/msu/v6.0/tlt/
GHCN daily
ftp://ftp.ncd-c.noaa.gov/pub/data/ghcn/daily/ (suppress the hyphen)
HadISST1 SST and ICE
https://www.metoffice.gov.uk/hadobs/hadisst/data/download.html
PSMSL tide gauge data
https://www.psmsl.org/data/obtaining/rlr.monthly.data
with as goal to prove that you are really able not only
– to process such data
but above all
– to show us the difference, with regard to your condescending comment posted on June 25 at 3:21 AM, between
— what all people obtained until now (little layman Bindidon included)
and
— what YOU managed to generate out of all these sources.
And with difference, I mean of course something more consistent than your trivial examples above, especially that posted on June 25 at 6:26 AM!
Nous vous attendons, RLH, avec toutefois la patience qui s’impose.
J.-P. D.
Why would I reproduce what UAH et al has already done? Do you expect that they are incorrect in what they do?