The Version 6.0 global average lower tropospheric temperature (LT) anomaly for August, 2021 was +0.17 deg. C, down slightly from the July, 2021 value of +0.20 deg. C.
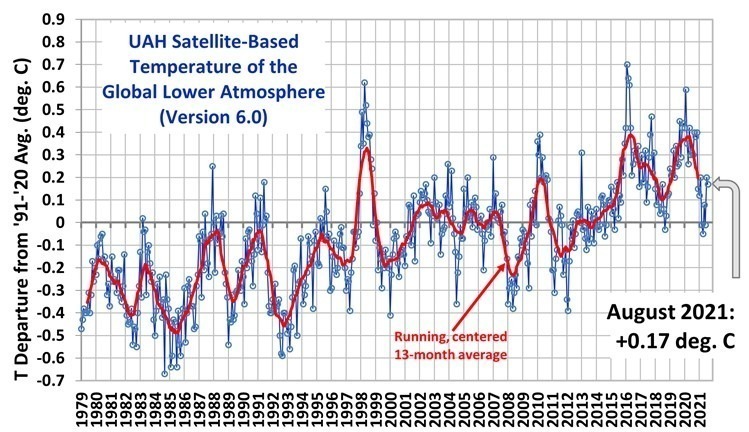
The linear warming trend since January, 1979 has now dropped slightly, at +0.13 C/decade (+0.12 C/decade over the global-averaged oceans, and +0.18 C/decade over global-averaged land).
Various regional LT departures from the 30-year (1991-2020) average for the last 20 months are:
YEAR MO GLOBE NHEM. SHEM. TROPIC USA48 ARCTIC AUST
2020 01 0.42 0.44 0.40 0.52 0.57 -0.22 0.41
2020 02 0.59 0.74 0.45 0.63 0.17 -0.27 0.20
2020 03 0.35 0.42 0.27 0.53 0.81 -0.95 -0.04
2020 04 0.26 0.26 0.25 0.35 -0.70 0.63 0.78
2020 05 0.42 0.43 0.41 0.53 0.07 0.84 -0.20
2020 06 0.30 0.29 0.30 0.31 0.26 0.54 0.97
2020 07 0.31 0.31 0.31 0.28 0.44 0.27 0.26
2020 08 0.30 0.34 0.26 0.45 0.35 0.30 0.24
2020 09 0.40 0.42 0.39 0.29 0.69 0.24 0.64
2020 10 0.38 0.53 0.22 0.24 0.86 0.95 -0.01
2020 11 0.40 0.52 0.27 0.17 1.45 1.09 1.28
2020 12 0.15 0.08 0.21 -0.07 0.29 0.44 0.13
2021 01 0.12 0.34 -0.09 -0.08 0.36 0.50 -0.52
2021 02 0.20 0.32 0.08 -0.14 -0.65 0.07 -0.27
2021 03 -0.01 0.13 -0.14 -0.29 0.59 -0.78 -0.79
2021 04 -0.05 0.05 -0.15 -0.28 -0.02 0.02 0.29
2021 05 0.08 0.14 0.03 0.06 -0.41 -0.04 0.02
2021 06 -0.01 0.31 -0.32 -0.14 1.44 0.63 -0.76
2021 07 0.20 0.33 0.07 0.13 0.58 0.43 0.80
2021 08 0.17 0.27 0.08 0.07 0.33 0.83 -0.02
The full UAH Global Temperature Report, along with the LT global gridpoint anomaly image for August, 2021 should be available within the next few days here.
The global and regional monthly anomalies for the various atmospheric layers we monitor should be available in the next few days at the following locations:
Lower Troposphere: http://vortex.nsstc.uah.edu/data/msu/v6.0/tlt/uahncdc_lt_6.0.txt
Mid-Troposphere: http://vortex.nsstc.uah.edu/data/msu/v6.0/tmt/uahncdc_mt_6.0.txt
Tropopause: http://vortex.nsstc.uah.edu/data/msu/v6.0/ttp/uahncdc_tp_6.0.txt
Lower Stratosphere: http://vortex.nsstc.uah.edu/data/msu/v6.0/tls/uahncdc_ls_6.0.txt
Thanks for this update! It would be great if we could get the confidence intervals for the trend. Point estimates should never be published without confidence intervals. Keep up the good work!
The 95% confidence intervals for the trend can be found once the August data are updated on this site: http://www.ysbl.york.ac.uk/~cowtan/applets/trend/trend.html
They usually wait until the official records are published.
SE is +/- .05 meaning a range of .085 per decade to .185 per decade.
Looking at the data it appears the SE is generated by natural variation. And since it appears that natural variation has been mostly in a positive trend since 1980 it seems likely the actual man made trend leans toward a significantly lower rate of warming, but thats been well known (IPCC et al) for a long time. Just that such information is really tough on budgets explaining the high volume of political hyperbole surrounding the science to keep the coffers full.
Confidence intervals for the trend are the most difficult to estimate, because decisions have been made, for example, about what satellite is drifting in its calibration and which isn’t. If we included the one we think is drifting, then the trend would change. Can we be sure it’s the one drifting, and not the other satellite? No, not absolutely sure. But I don’t know how to evaluate that uncertainty as a confidence interval. I believe some people call this “structural uncertainty”. This is a major reason why the RSS trends differ from our (UAH) trends (except in the tropics, where they are pretty close to one another).
Roy W Spencer
You are obviously right.
But the uncertainty you are talking about is not what we miss in what you publish, namely a simple standard error calculation.
It does not need to be as elaborate as what Kevin Cowtan or Nick Stokes provide in their trend calculation software.
Simply what Excel provides would be enough…
Not everybody visiting your blog has Excel, Libre Office Calc or the like on his computer.
J.-P. D.
Bindidon says: It does not need to be as elaborate as what Kevin Cowtan or Nick Stokes provide in their trend calculation software.
Simply what Excel provides would be enough
As far as I know the Excel estimate for trend uncertainty fails with autocorrelated data. The appendix to Foster/Rahmstorf 2011 discusses this issue and a formulation for trend uncertainty with autocorrelated data series which is the basis for Cowtan’s calculator.
In any case this gives the uncertainty of the trend estimate given a data series that is presumed to be unbiased. Structural uncertainty is a different animal. The best treatment of this in this context is Mears etal 2011.
Things differ if you are just using the measurements as recorded and the ‘true temperature’ that you think they represent.
Mark B
” As far as I know the Excel estimate for trend uncertainty fails with autocorrelated data. ”
Thanks, this is known to me.
The point was discussed ad nauseam at WUWT years ago, as Nick Stokes tried to eplain that to ‘specialists’ like… the Third Viscount, yeah.
I compared both here:
http://www.drroyspencer.com/2021/09/uah-global-temperature-update-for-august-20210-17-deg-c/#comment-827600
But if you compare Excel’s trend for e.g. UAH since Dec ’78 with Kevin Cowtan’s, you obtain the same value for both trend and SE.
*
” Structural uncertainty is a different animal. The best treatment of this in this context is Mears et al 2011.”
YES.
For data like this, the issue of correlation comes into determining the ‘goodness’ of fit, and the error on fit parameters.
Straight lines always show a bad fit.
@Bindidon
the earth is 57,308,738 square miles. There are roughly 30,000 land surface stations globally. They would need to have a measurement range of 1,910 square miles.
do you still want to talk about confidence intervals? Do you believe the 30,000 surface stations more accurately portray the global temperature? Do the land surface stations have better range? How?
To recap:
Bindidon thinks a drifting satellite that can measure the entire globe is less accurate than 30,000 land surface stations, only 7,000 of which have long term records.
This is a major reason why the RSS trends differ from our (UAH) trends (except in the tropics, where they are pretty close to one another).
There are a lot of satellites up there now.
There are various GPS installations by different organizations and countries.
While some may be reluctant to share data I am sure overall in this field the more cross correlation the better.
I am sure you know pretty much exactly where the satellites are or should be.
The amount of drift should be pretty obvious in a range of uncertainty that you are happy about, or otherwise you would not be able to give functional data.
This leads to the question not of uncertainty but what is it about the uncertainty that RSS has chosen to use?
There must be reasonable guidelines around drift and position or else one does not have a functioning system.
If there are major discrepancies using standardized systems someone is not following the rule book.
I note an incorrect comment below by Willard about outliers. I believe you have to correlate your data with the other known ground and balloon data and are happy doing so.
As does RSS.
RSS did a major change to their drift assumptions to realign their data with the warming data form the ground systems which to me would seem the reason for the difference.
This would have taken the form of adjustments to their drift data to make their temperature readouts higher?
angech
” RSS did a major change to their drift assumptions to realign their data with the warming data form the ground systems which to me would seem the reason for the difference. ”
Where do you have that stuff from? WUWT?
Roy Spencer has clearly explained that it has nothing to do with any alignment on surface data.
RSS and UAH differ on which NOAA satellites do give the correct data.
Anything else is cheap polemic.
RSS and UAH differ on which NOAA satellites do give the correct data.
No Bindinon, that is not what he said.
The data is correct whichever satellites they use.
Can we agree on that?
What Dr Spencer did say is that the interpretation of the satellite positions differs between the two groups.
The interpretation of which one is drifting [in fact they are all drifting a bit] and how to reconcile the accurate readings with the positions is the problem [uncertainty]
Bindinon
“RSS and UAH differ on which NOAA satellites do give the correct data.”
Not correct?
December 2019, the UAH linear temperature trend 1979-2019 shows a warming of +0.13 C/decade.
For comparison, a different group, Remote Sensing Systems (RSS), also analyzes the MSU data. From their data: the RSS linear temperature trend shows a warming of +0.208 C/decade.
Christy et al. asserted in a 2007 paper that the tropical temperature trends from radiosondes matches more closely with their v5.2 UAH-TLT dataset than with RSS v2.1.
Much of the difference, at least in the Lower troposphere global average decadal trend between UAH and RSS, had been removed with the release of RSS version 3.3 in January 2011, at which time the RSS and UAH TLT were now within 0.003 K/decade of one another. Significant differences remained, in the Mid Troposphere (TMT) decadal trends. In June 2017 RSS released version 4 which significantly increased the trend from 0.136 to 0.184 K/decade substantially increasing the difference again
“RSS and UAH differ on which NOAA satellites do give the correct data.”
Around 2000-2005 they do.
Hugo…”It would be great if we could get the confidence intervals for the trend”.
***
Why do you need a confidence level for real data? That requires an error margin and UAH usually publishes an error margin.
Robertson
Thanks for showing us all how dumb, brazen and ignorant you are.
Bindidon,
Your personal criticism of Robertson is unfortunate. The reality is that any measure of standard error and associated confidence limits is a function of the assumed statistical model. As such it is an assumption-based estimate. In contrast, the monthly and 13-month moving averages are point measures that are a function of what was actually measured. There will be errors in those measurements but no statistical technique can tell you what those errors might be. In fact, all of the statistical measures assume the measurements themselves were made without error. In contrast, the statistical analysis is all about trying to estimate the extent to which the natural and real variability in the system over time as measured is fundamental to the real system or simply due to random chance. Errors such as those created by satellite drift, which are created by systemic features of the measuring system are not amenable to statistical analysis. This is a key reason why RSS and UAH can come up with different estimates.
To understand which is the most reliable, you have to identify the detailed measuring protocols used by each system and then make a subjective judgement as to which is likely to be the more reliable. Given that this process is subjective rather than objective, reasonable people can come to different conclusions as to which system they prefer.
Bindi is an arrogant psychopath. That’s what arrogant psychopaths do.
KeithW
Sorry, I’m afraid that do don’t know ANYTHING about Gordon Robertson, who is a persistent denialist of anything he subjectively feels a need to discredit: Lunar spin, Einstein, relativity, viral diseases, GHE, etc etc etc.
*
” That requires an error margin and UAH usually publishes an error margin. ”
That was the point here, where Robertson publishes nonsense as usual.
What we here were discussing about was not measuring uncertainty based on systemic errors and the like, but… simply a little information about the standard error many asked for since quite a while.
And, as you can see, there was some agreement about that, wasn’t it? Simply look at:
http://www.drroyspencer.com/2021/09/uah-global-temperature-update-for-august-20210-17-deg-c/#comment-827729
*
If you were permanently stalked by an Ignoramus like Robertson, you certainly wouldn’t keep so pretty cool, Sir.
Rgds
J.-P. D.
Anderson
Under an ‘arrogant psychopath I rather understand those people who name bloodthirsty dictators like Augusto Pinochet ‘Leftists’.
People like you, Anderson.
“psychopath.”
Really, Stephen, swinging for the fences and striking out there…
Maybe you need to adjust your meds??
It’s his nature. He’s a leftist like you.
Unfortunately there are no meds to fix ignorance.
“The reality is that any measure of standard error and associated confidence limits is a function of the assumed statistical model. As such it is an assumption-based estimate. In contrast, the monthly and 13-month moving averages are point measures that are a function of what was actually measured. There will be errors in those measurements but no statistical technique can tell you what those errors might be. In fact, all of the statistical measures assume the measurements themselves were made without error. In contrast, the statistical analysis is all about trying to estimate the extent to which the natural and real variability in the system over time as measured is fundamental to the real system or simply due to random chance.”
Agreed.
August has been the opposite to July in the UK, more like winter. Struggling to see a warming world driven by CO2, I wished.
Same in Japan.
Similar in Germany, August wasn’t terribly nice.
But looking backwards in the archive of our weather web site gave this:
1. 2021 since March
https://postimg.cc/LJpCMc67
2. 2014 since March
https://postimg.cc/MccWJfGd
OK, 2021 is a bit worse, but not really by much.
This years weather in SW Scotland has been cool which is reflected in the poor growth in plants and crops. April and May were c. 2 deg C below long term average. June was mediocre and cool. July had some nice weather and a mini heatwave in August wk 1 my central heating kicked in for at least one morning and several mornings in wk4 August (not evenings though).
Plant and crop performance while not exclusively warmth related (sunshine and precipitation also) does give a very good integrated/average proxy to warmth, especially grass. I follow when the green keepers start to cut the greens on our coastal link golf courses. Grass only starts to grow as soil temperatures approach 10 deg C, last year was late to start growing this year was late to start growing. Autumn is harder to gauge but spring grass growing is a big proxy indicator which in this region includes the Gulf Stream warming effect. Our British Met office proclaims all events they can as all global warming and ignore the obvious cold story…..
As a physicist graduate I am taking much more interest in the science proper. I am appalled as what is passed as science when it is clearly not. Thank goodness for people like Dr Spencer prepared to publish data for people like me to investigate the science as best I can somI may develop an informed opinion and position.
AGW porn is AMOC stops and the UK glaciates. Climate change is something that cant be judged locally, only globally. No doubt the earth has warmed some the past 150 years, but no doubt its not a linear relationship to atmospheric carbon and if there are cycles then quantifying them remains a key challenge, along with adequately accounting for UHI and feedbacks. The other certainty is too much of climate mitigation creates higher prices which reduces living standards from what they could be. Most people are not in favor of trading that certain downside for uncertain upside.
0.13 vs 0.14, due to rounding of the ..fifth decimal point? LOL! Yet it had to happen at some point, if climate is stagnant and again within the 1998-2015 envelope.
Again I have to point out to the fact, it is a warming starting in the 1970s and very well aligns with increase of air travel.
“Again I have to point out to the fact, it is a warming starting in the 1970s and very well aligns with increase of air travel.”
It also aligns with swearing on TV.
I am pretty certain that declined in the last years, because PC and so on. Unlike swearing however, cirrus clouds, even the artificial ones, produce a significant GHE.
Has it been quantified? Is it significant compared to AGW?
Well that would be AGW anyhow, I mean Avionic Global Warming 😉
I yet have to work on that, so I can not give you a quantification. My guess however is, that it will dominate CO2 forcing by far, since all the patterns of warming fit perfectly to it. And I do know CO2 can not be responsible, for its ECS potential is hugely exaggerated. That is both in regard to pure 2xCO2 forcing (only 2W/m2, or 0.53K instead of 3.7W/m2 and 1.1K), as well as vapor feedback.
https://greenhousedefect.com/the-holy-grail-of-ecs/the-2xco2-forcing-disaster
On the other side the IPCC vigorously downplays the contrail effect, suggesting some ludicrous 0.01W/m2 of forcing or so.
“My guess however is, that it will dominate CO2 forcing by far,”
IOW, No, not at all. It could well be much smaller.
“since all the patterns of warming fit perfectly to it.”
Got measurements?
You seem comfortable attributing GW to your non-quantified speculation?
That aint science.
“And I do know CO2 can not be responsible”
Is that also based on a guess? It disagrees with lots of published work.
@Nate
“My guess..” .. “That aint science”
That is very smart! It is like me giving you the answer, you repeating what I just told you, and then teaching me over the answer I just gave you. Probably the most insanly stupid thing one could only imagine. What is your IQ again? A little recommendation from me to you..
https://www.youtube.com/watch?v=wKjxFJfcrcA
“It could well be much smaller.”
Or larger. You need something to back that direction up.
“then teaching me over the answer I just gave you”
Yep, looks like you had no idea that drawing conclusions, as you did, based on qualitative guesses is a non-starter in the physical sciences.
Everyone ought to apply skepticism to ‘science’ provided by political-agenda-driven blogs, which have no requirement to back up their claims with true facts and evidence.
“The reality is that any measure of standard error and associated confidence limits is a function of the assumed statistical model. As such it is an assumption-based estimate. In contrast, the monthly and 13-month moving averages are point measures that are a function of what was actually measured. There will be errors in those measurements but no statistical technique can tell you what those errors might be. In fact, all of the statistical measures assume the measurements themselves were made without error. In contrast, the statistical analysis is all about trying to estimate the extent to which the natural and real variability in the system over time as measured is fundamental to the real system or simply due to random chance.”
Btw. if I say “guess”, that means educated guess, based on a lot of insights which I can not communicate within a few lines. Generally my “guess” exceeds the certainty level of the IPCC’s “very high confidence”.
I have only started to explore the subject, and how the contrail warming has been downplayed. Obviously we can guess the “why”. Here is a great find from NASA:
“This result shows the increased cirrus coverage, attributable to air traffic, could account for nearly all of the warming observed over the United States for nearly 20 years starting in 1975”
https://www.nasa.gov/centers/langley/news/releases/2004/04-140.html
LOL! Sure you would not want that to spread, if you try to fool everyone into “it can only be CO2” ;)))
“Generally my ‘guess’ exceeds the certainty level of the IPCC’s ‘very high confidence’.”
Sure. You have already admitted that this effect has not been quantified.
So your ‘certainty’ about its significance in comparison to GHG effects, which are quantified, simply makes no sense!
This is just one more ‘How to prove all of Climate Science wrong with this one simple trick’, click bait, to add to the growing list.
Read some papers, if any, that estimate the magnitude of this effect. Then come back and make an actual argument.
@Nate
..says the troll who posted no less than 50(!) times on this thread alone. Is trolling a full time job? Who pays you?
Good question:
https://greenhousedefect.com/contact
“50(!) times”
Way less than 238 of the top poster.
A lot of posters seem to double, triple, and quadruple-down on their misinformation, as you do.
Reminder:
https://twitter.com/airscottdenning/status/1118628870641594370
Being an “outlier” doesn’t automatically make UAH numbers wrong.
You are an outlier in this comments section.
That doesn’t automatically make you wrong.
You are wrong.
But not because you are an outlier!
More generally, Troglodyte, being an X does not automatically make a Y.
willard…”UAH is a ridiculous outlier”.
***
Will you refrain from posting propaganda on this scientific site? Besides, I have Twitter blocked and cannot access any drivel posted there. Why would any serious person post there?
Thank you for your concerns, guy who keeps posting tin foil stuff.
Willard: Starting at 1 again I see.
The Only Trick of Roy’s One-Trick Pony (v.3):
0. Almost suggest something relevant;
1. When challenged, brag;
2. When pinned down, Just Ask Questions;
3. When countered, try to insult
1.
Yawn, I guess that makes the SSTs another outlier. Almost identical and unaffected by UHI, etc.
https://woodfortrees.org/plot/uah6/from:1979/to/plot/uah6/from:1979/to/trend/plot/hadsst3gl/from:1979/to/offset:-0.35/plot/hadsst3gl/from:1979/to/offset:-0.35/trend
Oh yeah, over 70% of the planet’s surface as well. The most likely situation is the highly adjusted surface land data is wrong.
You were saying?
https://woodfortrees.org/plot/best-lower/from:1979/to/plot/uah6/from:1979/to/trend/plot/hadsst3gl/from:1979/to/plot/hadsst3gl/from:1979/to
Richard,
Why are you comparing UAH GLOBAL T trend to surface OCEAN T trend?
UAH Ocean Trend is lower than Global or Land.
UAH trends
Global 0.14
Land 0.18
Ocean 0.12
The linear warming trend since January, 1979 has now dropped slightly, at +0.13 C/decade
Some will get real busy now, You gonna have to reslice redice your numberz
Yes Eben!
In my UAH spreadsheet, the trend went down from 0.1351 to 0.1350!
Oh dear! I dare to keep at 0.14 C / decade. Thousand apologies!
Roy Spencer very probably uses a different tool, calculating trend in a slightly different way, moving a bit below 0.135 and thus, when rouding to 2 places after the decimal point, down from 0.14 to 0.13 C / decade.
But I guess the difference between old and new trend in his data won’t be terribly higher.
I have never heard of rounding down to odd from 0.135.
The rules I have used are .5 rounds to make the previous digit even, or always round .5 up.
Methinks something is shabby in Denmark.
Denmark? Ooops.
Maybe you misunderstood me.
What I meant was that, if Roy Spencer had e.g. 0.135 / decade at the end of July and 0.134 at end of August, rounding to 2datdp gave 0.14 last month, and… 0.13 now.
OK?
Yes, OK
I didn’t see all the digits, I thought he was rounding .135 to .13
binny…”Roy Spencer very probably uses a different tool, calculating trend in a slightly different way…”
***
No Binny, Roy is a professional with a degree in meteorology and applies statistics correctly. You are a hacker who uses Excel incorrectly.
Robertson
Thanks for showing us all how dumb, brazen and ignorant you are.
Looks like the Arctic is the warmest place on earth right now (relatively speaking), but the ice refuses to melt away to oblivion like the global warming alarmists say it is. On August 31, 2021 the National Snow and Ice Data Center measured the sea ice extent at 5,218,000 km^2. That is 910,000 km^2 higher than on the same day last year, and is 1,489,000 km^2 higher on the same day back in 2012 when the record minimum occurred. The more the alarmists claim the Arctic ice is melting away, the more nature proves them wrong. 2021 will make 9 years in a row that the annual Arctic ice extent minimum is higher than the 2012 minimum. Eventually, the Arctic ice extent record low of 3,387,000 km^2 will have to be broken if the Arctic ice is indeed melting away. 9 years and counting – it isn’t happening. I think this is a natural multi-decadal cycle. Humans have very little, if any to do with the Arctic ice.
I was an operational weather forecaster for 40 years. What do you geo-scientists think?
Thanks for that. I’m going to guess that there there will be no downward trend with the soon to come summer min ice extent, since 2007.
Ya think?
That is exactly what I think. From 2007 to 2021, the annual sea ice minimum will be a flat line. You will hear nothing in the mainstream news media about the Arctic ice or Greenland this year. Forget Antarctica!
Rob Mitchell
Though I’m not a geo-scientist, I nonetheless dare to reply.
*
Firstly, it makes few sense to look at a single day and to compare the extents in several years for that day. This is subject to much variation.
From my layman point of view, the more correct method is to build, for recent years / averages, the mean of the year and of the averages till that day, here Aug 31:
81-10 12.63
2012 11.78
2021 11.60
2020 11.51
2017 11.48
2018 11.45
16-20 11.45
2016 11.42
2019 11.37
Here you see that 2012, though having had the most impressive melt season, is on second place, just below the 1981-2010 average.
This is simply due to the fact that (ignored by all Alarmists), 2012 had a very impressive recovery season as well (see graph below).
2021 is on third place, but not by much.
*
Secondly, it makes also few sense to take, as was done during decades, the September average as a comparison level, giving 2012 as the lowest.
The reason why it has stopped to be you see here:
https://drive.google.com/file/d/1QBlh325tHF-4NRlWsHf_6sgskO_ipyse/view
You see on the chart how 2012 behaved during the winter.
And since 2019 you see, for the year’s sea ice minimum, an amazing shift toward the year’s end.
This is the reason why September 2012 no longer is lowest on a monthly chart:
https://drive.google.com/file/d/1l97i–7Y_ZQXgROnNCeC6vlwQbEHTEWi/view
Lowest is now October 2020.
*
And what the Alarmists deliberately ignore as well, is how 2012 behaved… in the Antarctic :- )
https://drive.google.com/file/d/1PdqOctb7zaMgvdMdX2sId1g_o7U13mM-/view
During 2012, the Antarctic sea ice extent practically didn’t go below the 1981-2010 average.
*
And finally, we look in the global sea ice extent till Aug 31:
81-10 22.27
2012 21.72
2021 21.39
2016 20.94
2020 20.83
16-20 20.48
2018 20.46
2019 20.07
2017 20.07
We will see whether or not 2021 is the beginning of a new era…
binny…”From my layman point of view,…”
***
You omitted a few adjectives…you mean:
“From my biased, alarmist, layman point of view,…”.
Robertson
Thanks for showing us all how dumb, brazen and ignorant you are.
August of 2016 was hotter than this year’s, right? Unlinke July.
Yes. But the change year on year swings back and forth.
https://climatedatablog.files.wordpress.com/2021/08/uah-month-on-month.jpeg
“This is the reason why September 2012 no longer is lowest on a monthly chart:
https://drive.google.com/file/d/1l97i–7Y_ZQXgROnNCeC6vlwQbEHTEWi/view
Lowest is now October 2020.”
October 2020 was the biggest deviation (downward) from normal (for any month). September 2012 is still the lowest Arctic sea ice extent in absolute terms, for the satellite record.
barry
You are ‘plain right’ : 3.34 vs. 3.71 M.
I confess: I don’t look very often at absolute data, because so many climate data sources (hum hum: beginning with… UAH) do not show them :- )
Your link sez: ‘Page not found’; here is my most recent one:
https://drive.google.com/file/d/1J9kx750_CtARv4sKfXBddRnkZm3E2U4v/view
But I have to protect Roy Spencer from my own ‘criticism’: he at least offers the possibility of recovering absolute values from anomaly and climatology data, even if that is no trivial job.
Best regards from Germoney
J.-P. D.
Format note:
I copied that link direct from your post along with the text.
Copying the link removes one of the 2 hyphens in it, breaking the link. This also happens if I copy and paste the link from your post into an address bar. So you can only open the link by clicking it in your post – or adding back in the hyphen in the address bar.
Annoying website.
The Arctic ice melt has clearly slowed down between 2007 and 2021. I am eager to see if there is indeed a “new era” coming up.
Rob Mitchell
I understand what you mean… but it is a fact that you keep fixated on the melt season
2012 9 3.57
2020 9 3.92
2007 9 4.27
2019 9 4.32
2016 9 4.51
2011 9 4.56
2015 9 4.62
2008 9 4.69
2018 9 4.71
2017 9 4.80
while not looking at the recovery season.
Would you do that, by looking at yearly averages combining the two, you then would see the following:
2016 10.16
2020 10.18
2019 10.21
2018 10.35
2017 10.40
2012 10.42
2007 10.50
2011 10.51
2015 10.59
2010 10.73
Source
ftp://sidads.colorado.edu/DATASETS/NOAA/G02135/north/monthly/data/
But let me add that the Antarctic sea ice is in best form!
Willard
Eco worriers never apologise for there mistakes. They just make up more outlandish claims.
Your opinion that UAH is an outlier because it doesn’t agree with your religious views is just another mistake.
UAH simply report the data not comment on its implications.
> UAH simply report the data
We’re at Roy’s, Mark:
https://www.drroyspencer.com/2021/02/a-tribute-to-rush-limbaugh/
Will
Speaking of religion, what is your favorite kind of pew? Oak or Maple?
You tell me, o-puppy:
https://climateball.net/but-religion/
What has politics to do with science?
La Niña on the way.
http://www.bom.gov.au/archive/oceanography/ocean_anals/IDYOC007/IDYOC007.202108.gif
https://www.tropicaltidbits.com/analysis/ocean/nino3.png
one wishes,
Pretty much all of the ENSO forecasts sites think so.
You can literally calculate those 95% confidence intervals yourself. All of the raw data is provided, and if I recall correctly, is about plus minus 0.01C per decade.
There is a purely statistical confidence interval, assuming all variation is random. That one is indeed straightforward to calculate yourself. Someone linked o a site that provides that result.
http://www.ysbl.york.ac.uk/~cowtan/applets/trend/trend.html
There is also the issue of whether the satellites are providing accurate data. If there is a systematic trend in the satellites, that would need to be added/subtracted to get the true trend. This one cannot be calculated yourself without detailed knowledge of the satellites and their sensors.
tim…”There is also the issue of whether the satellites are providing accurate data”.
***
Propaganda from those alarmists trying to discredit sat data. Besides, you have a nerve raising such a possibility when the surface record has been altered to the point it is fiction.
Gordon,
ALL data has uncertainly! This is not ‘discrediting the data’, merely agreeing with Dr. Roy (and every other scientist and engineer) that real measurements have uncertainty.
http://www.drroyspencer.com/2021/09/uah-global-temperature-update-for-august-20210-17-deg-c/#comment-827340
“If there is a systematic trend in the satellites, that would need to be added/subtracted to get the true trend.”
If there is no systematic trend in the satellites, which seem to agree pretty well with each other over the last decade at least, then your comment is pointless speculation.
The point is they disagree on the long term trend by a lot, as Roy duly noted.
“The point is they disagree on the long term trend by a lot, as Roy duly noted.”
If you split the period into 2 portions, then the differences in the last decade or so are minor indeed.
Before 2000 and after 2005 RSS and UAH track each other quite well. It is the period between 2000 and 2005 that they differ radically.
Just around the time (2003) that Roy has said they use/include different satellites.
RLH,
Your assumption that UAH must be correct and higher in quality can only be based on your biases and beliefs, not the science.
Again, the error-bar on 10 y trend is larger than the trend, thus 10 y is simply not sufficient to test models of AGW tropospheric warming.
Over a term long enough to do that, > 20y, the analyses differ dramatically.
Therefore researchers in the field cannot use satellite-measured tropospheric warming to reliably test their models. The quality of the data simply isnt good enough.
Now I expect you will double-down as usual.
Nate: You appear not to trust anything that Roy says.
In addition
https://www.woodfortrees.org/plot/uah6/from:2016/trend/plot/uah6/from:2017/trend/plot/uah6/from:2018/trend/plot/uah6/from:2019/trend/plot/uah6/from:2020/trend
shows that 3 out of 5 recent yearly trends are downwards.
And the slope is increasing as we get closer to the present.
“Nate: You appear not to trust anything that Roy says.”
Again RLH, you should be able to understand this.
Science is judged on the EVIDENCE, not the person.
As I said elsewhere, I know that I am not expert enough to judge whether RSS group or UAH group has done the troposphere T analysis better.
As I’m sure many climate scientists who are not specialists in remote sensing are not able to judge either.
Do you feel qualified to make that judgement?
Then we are left with a rather huge systematic uncertainty in the troposphere T trends, at the moment.
As compared to the surface data trends, the analysis by a half dozen or more different, independent, groups are all much closer together. There is more of a consensus of the evidence.
As far as the trend fitting, you seem to be as stubbornly digging in your heels as the non-spinner Lunatics.
Ive shown you several times the flip-flopping of trends, and huge error bars on trends of short duration. This is pretty basic.
I have pointed out repeatedly that ENSO is well understood and measurable contributor to short-term variation. It can be treated as noise on top of whatever underlying long-term trend is there, which is of interest for testing climate change models.
Given your previous emphasis on filtering out short-term noise with 15 y LP filters, in order to better ‘see’ the climate change signals, you SHOULD understand this.
Nate: What I was meaning was put much more elegantly by others.
The reality is that any measure of standard error and associated confidence limits is a function of the assumed statistical model. As such it is an assumption-based estimate. In contrast, the monthly and 13-month moving averages are point measures that are a function of what was actually measured. There will be errors in those measurements but no statistical technique can tell you what those errors might be. In fact, all of the statistical measures assume the measurements themselves were made without error. In contrast, the statistical analysis is all about trying to estimate the extent to which the natural and real variability in the system over time as measured is fundamental to the real system or simply due to random chance.
I agree that errors are a function of the assumed model.
Another concept is overfitting, which is what I have been calling ‘fitting noise’.
https://en.wikipedia.org/wiki/Overfitting
Underfitting is related.
They make the point that Overfitting may produce what looks like a good fit to most wiggles of the data, but will have POOR predictive skill.
How do we know which model is best to use for Global T data?
It is the model that is likely to have the best predictive skill.
The relevance here to your linear fits to short-periods is that these fits will have POOR predictive skill.
We know that because their slopes need to change year after year. They have no predictive skill a year or two later.
Whereas a linear fit over a long enough period does have reasonably good predictive skill for a (not too long) subsequent period.
https://www.woodfortrees.org/plot/gistemp/from:1970/to:2000/trend/plot/gistemp/from:2000/mean:12
Although ENSO is “variability in the system over time as measured is fundamental to the real system”
I think that there is no way to model and predict its behaviour beyond 6 months.
What would you fit it with, a polynomial? Whatever model you choose will have poor predictive skill.
Thus, if your goal is test climate model success over decades, it is best to treat ENSO as short duration noise.
“POOR predictive skill.”
Like an OLS fit over the last decade predicted the drop in temperatures over the last few years.
All straight lines are a bad fit to almost anything.
Well the PDO exhibits this behavior since the 1800s.
https://climatedatablog.files.wordpress.com/2021/08/pdo.jpeg
I am not sure a straight line is of much use there.
“Like an OLS fit over the last decade predicted the drop in temperatures over the last few years.”
As explained, but no surprise–point missed–, the drop in temperatures was due to ENSO, which is not predictable beyond 6 months and cyclic. It CAN thus be treated as noise.
“All straight lines are a bad fit to almost anything.’
What would you have used as a replacement? A polynomial to ‘fit’ all the wiggles?
Read about Overfitting.
Whatever you use would have to have better predictive skill than a straight line.
Tell me then, what specifically, would you have used?
“Well the PDO exhibits this behavior since the 1800s.”
So now the short-term noise that you cared so much about ‘fitting’ can be filtered out? Removed?
Ha ha ha ha…
Everything starts from somewhere. Who are you to say this is any different? IF (and I agree it is if) this trend continues until next year, how long does it have to continue before you admit that it happened?
“ENSO, which is not predictable beyond 6 months and cyclic. It CAN thus be treated as noise.”
You do know that ‘random walk’ can be influenced by the smallest of offsets don’t you?
It is the accumulation of ‘noise’ that matters, not the noise itself.
?? Again with: if pigs fly next year, what will you say then??
There are flying pigs?
Are you suggesting that the temps will rise? If so, when?
“It is the accumulation of noise that matters, not the noise itself”
Huh?
Noise is noise. It doesnt ‘accumulate’.
“You do know that random walk can be influenced by the smallest of offsets dont you?”
Why do you think a random walk is appropriate for this system? Evidence?
“There are flying pigs?”
Apparently you think so.
ENSO is a cyclic phenomena with a persistence time of 11 months, and beyond that is unpredictable. After 11 months or so, it is as likely to produce warming or cooling.
You seem to believe it has suddenly changed its stripes.
You believe that if it is producing a cooling trend right now, that it is likely to persist into the future.
IOW you believe that pigs can now fly.
Not pointless speculation. Merely acknowledgement that instruments are not perfect. Dr Roy (like any scientist or engineer) has to make judgement calls about the quality of the measurements. Dr Roy: “… decisions have been made, for example, about what satellite is drifting in its calibration and which isnt. ”
The ‘true uncertainly’ is a combination of random variations and systematic errors. That is a fact of life in science and engineering.
And which satellites to include or not as he said.
Solar activity very low. No strong solar flares and a decrease in UV radiation in the 25th solar cycle.
https://www.iup.uni-bremen.de/gome/solar/mgii_composite_2.png
https://www.iup.uni-bremen.de/gome/gomemgii.html
Large drop in winter temperatures in the upper stratosphere and temperatures in the southern hemisphere.
https://www.cpc.ncep.noaa.gov/products/stratosphere/strat-trop/gif_files/time_pres_TEMP_ANOM_JAS_SH_2021.png
https://seaice.uni-bremen.de/data/amsr2/today/extent_s_running_mean_amsr2_previous.png
The rather unusual blocking seen in the lower stratosphere to the north, in my opinion, foreshadows early Arctic air attacks in the mid latitudes.
https://www.cpc.ncep.noaa.gov/products/stratosphere/strat-trop/gif_files/time_pres_HGT_ANOM_JAS_NH_2021.png
It seems to me that few people understand how the stratospheric polar vortex interferes with circulation in the troposphere during the winter season.
“Stratospheric Intrusions are when stratospheric air dynamically decends into the troposphere and may reach the surface, bringing with it high concentrations of ozone which may be harmful to some people. Stratospheric Intrusions are identified by very low tropopause heights, low heights of the 2 potential vorticity unit (PVU) surface, very low relative and specific humidity concentrations, and high concentrations of ozone. Stratospheric Intrusions commonly follow strong cold fronts and can extend across multiple states. In satellite imagery, Stratospheric Intrusions are identified by very low moisture levels in the water vapor channels (6.2, 6.5, and 6.9 micron). Along with the dry air, Stratospheric Intrusions bring high amounts of ozone into the tropospheric column and possibly near the surface. This may be harmful to some people with breathing impairments. Stratospheric Intrusions are more common in the winter/spring months and are more frequent during La Nina periods. Frequent or sustained occurances of Stratospheric Intrusions may decrease the air quality enough to exceed EPA guidelines.’
https://i.ibb.co/D444qH3/zu-sh-1.gif
My (and Entropic man’s) prediction of +0.20 for August looks pretty good. Anybody like to take away our bragging rights?
Well, I *did* make three predictions: 0.17, 0.13, and 0.21 based on three simple statistical calculations. And the average did turn out to be spot on!
(I know this is largely good luck, but I will take at least a little credit. Based on the same techniques, the predictions for next month will be an even more boring 0.17, 0.18, and 0.21.
Maybe I will add one or two slightly more sophisticated statistical models — but I know that all of the ones I envision will give numbers close to 0.21 for next month.)
> the average did turn out to be spot on!
Imagine if it was the median, Tim: you would have been even more spot on!
hahaha
As I said, this was a fair amount of luck. Sort of like predicting 5 heads if you flip a coin 10 times. It is a very ‘safe’ prediction, but it is still unlikely to actually be correct. I made a few ‘safe’ predictions, and they all turned out to be quite good.
https://www.woodfortrees.org/plot/uah6/from:2016/trend/plot/uah6/from:2017/trend/plot/uah6/from:2018/trend/plot/uah6/from:2019/trend/plot/uah6/from:2020/trend
3 out of 5 recent yearly trends are downwards.
Sounds similar what to 5 coin flips would give….
And the more recent the trend the steeper the slope.
As they say noise will be noise..
And, like ‘random walk’, noise accumulates into trends.
ENSO is not a random walk. It is cyclic, and returns to equilibrium regularly.
Care to venture for next month?
At this stage I will go with +0.17. But will update it towards the end of the month.
Me too. But I suspect that 0.17c is high as the current trend line of the measurements shows lower.
“current trend line of the measurements shows lower.”
The current 6 month trendline is UP
The current 3 year trendline is DOWN
The current 10 year trendline is UP
The current 42 year trendline is UP
It just depends which trendline you use as to which direction you would predict for next month. Some statistical analysis might be able to tease out just which sort of time frame is best.
If you believe that the globe has a memory longer than one year, up to a decade or more, then you need to adopt the low pass filtering system rather than OLS straight trend lines.
As the next month is more likely to be influenced by the immediately past one (auto-correlation) more recent trends are more likely to produce accurate predictions in the short term.
https://www.woodfortrees.org/plot/uah6/from:2016/trend/plot/uah6/from:2017/trend/plot/uah6/from:2018/trend/plot/uah6/from:2019/trend/plot/uah6/from:2020/trend
3 out of 5 recent yearly trends are downwards.
As noted, RLH has taken his eye off the climate-change ball and is now chasing noisy squirrels.
As noted elsewhere
“The reality is that any measure of standard error and associated confidence limits is a function of the assumed statistical model. As such it is an assumption-based estimate. In contrast, the monthly and 13-month moving averages are point measures that are a function of what was actually measured. There will be errors in those measurements but no statistical technique can tell you what those errors might be. In fact, all of the statistical measures assume the measurements themselves were made without error. In contrast, the statistical analysis is all about trying to estimate the extent to which the natural and real variability in the system over time as measured is fundamental to the real system or simply due to random chance.”
It is interesting to see how the drop in stratospheric temperature causes the ozone hole to grow rapidly.
https://www.cpc.ncep.noaa.gov/products/stratosphere/strat-trop/gif_files/time_pres_TEMP_ANOM_ALL_SH_2020.png
https://www.cpc.ncep.noaa.gov/products/stratosphere/polar/gif_files/ozone_hole_plot.png
GLOBAL COOLING UPDATE
Fueled by warmer-than-normal water in the Gulf of Mexico, Hurricane Ida destroyed homes, uprooted trees and cut off power to more than 1 million residents. It battered Mississippi and the already storm-ravaged state of Louisiana, and officials there say they expect the death toll to increase in the coming days.
Hurricane Ida was just the latest in back-to-back storms that have slammed Louisiana in recent years. But Katharine Hayhoe, chief scientist at the Nature Conservancy and professor at Texas Tech University, said an important distinction is not the frequency of the storms but their severity.
https://www.ctvnews.ca/climate-and-environment/climate-change-is-making-hurricanes-stronger-slower-and-wetter-ida-checked-all-the-boxes-1.5567642
Continuing the increase in Atlantic Cat 4s and 5s.
#4 #4/year #5 #5/y
18511900 13 0.26
19011950 29 0.58 9 0.18
19511975 22 0.88 6 0.24
19762000 24 0.96 7 0.28
20012020 31 1.4 14 0.7
“Major hurricanes” are Category 3, 4 and 5.
You conveniently forgot about category 3.
Scratch your own itch, RG.
Logically, it is possible that CAT 3 numbers go down.
Think about it. What used to be CAT 3 are now moving into the CAT 4 and CAT 5 categories. They go up while CAT 3 numbers go down.
(unless CATs 1 and 2 are stepping up also).
Cat 4 and 5 are the strongest hurricanes. Most of them hit somewhere, if not the US. Lately there have been significantly more of these strongest ones.
Pretty simple.
Feel free to add the middle cat 3s, whatever floats your boat, RG.
No scientific reason to limit to US-48 strikes, which makes the stats much worse.
Nate
Maybe a better resource than wikipedia article.
Here:
http://tropical.atmos.colostate.edu/Realtime/index.php?arch&loc=global
Globally it does not seem much change in hurricanes since 1980. You can go to different basins. The longest record is North Atlantic, it seems to show an increase in major hurricanes. There does seem to be a cyclic behavior to hurricanes. Like one of the known long term ocean cycles like an AMO or other. So you will get increases in frequency then a lowering.
You can look at accumulated cyclone energy and it does not seem to show any significant increase globally.
Check it out and see what you think.
Thanks for that resource!
Check this out:
https://tropical.colostate.edu/forecasting.html
Tell me what you think.
Willard
As I already stated to Nate, the North Atlantic seems to show an increase in major hurricanes but the global frequency does not show this. Apart from one anomalous year (2015) which had almost 40 recorded Major Hurricanes (Cat 3+) the rest of the time series (1980-2020) does not show any meaningful increase in hurricane frequency. It does show a cyclic pattern that your link ascribed to ENSO.
http://tropical.atmos.colostate.edu/Realtime/index.php?arch&loc=global
I don’t think this years forecast (though above average) will add much to the overall pattern of hurricanes.
http://tropical.atmos.colostate.edu/Realtime/index.php?arch&loc=northatlantic
Since the Global Hurricane count is not showing an upward trend but the North Atlantic basin is, then another factor could be at play for this basin other than global warming. Warmer water can intensify hurricanes but a number of other factors are needed. Do you have evidence that the other factors needed have increased because of a warmer climate? It should reflect in global numbers.
Willard or Nate
I will provide links to 4 of the global hurricane metrics and you explain what you see as an upward trend.
Named Storms Global from 1980-2020
http://tropical.atmos.colostate.edu/Realtime/index.php?arch&loc=global
Hurricanes Global from 1980-2020
http://tropical.atmos.colostate.edu/Realtime/index.php?arch&loc=global
Cat 3+ Hurricanes Global from 1980-2020
http://tropical.atmos.colostate.edu/Realtime/index.php?arch&loc=global
Accumulated Cyclone Energy Global from 1980-2020
http://tropical.atmos.colostate.edu/Realtime/index.php?arch&loc=global
Willard or Nate
I guess you will have to create your own graphs of the different metrics. I tried the links and they only go to the global named storms and not the unique graphs. If you take the time to go through the global graphs let me know which you think shows an upward trend. I do not see one, that does not mean one is not there. If you pinpoint one I can then spend time and put the data on an Excel sheet and have it find a trend.
> Apart from one anomalous year (2015) which had almost 40 recorded Major Hurricanes (Cat 3+) the rest of the time series (1980-2020) does not show any meaningful increase in hurricane frequency.
Every single indicator in the 2021 forecast from your own source are above the 1991-2020 average, Norman:
https://tropical.colostate.edu/forecasting.html
In a nutshell, that’s more
– Named Storms
– Named Storm Days
– Hurricanes
– Hurricane Days
– Major Hurricanes
– Major Hurricane Days
– Accumulated Cyclone Energy
As for the overall trends in extreme events, here are the official predictions:
https://www.gfdl.noaa.gov/global-warming-and-hurricanes/
That does not mean it’ll increase every single year or that it’ll beat every single year since the 1800’s. But it still means that minimizing what’s coming will cost money.
Detection and attribution questions are secondary to reinsurers.
Willard
Your link was for the prediction of Atlantic Basin hurricanes. Again I pointed out that region seemed to show an increase in hurricane activity.
The link I posted was for GLOBAL! Consider the difference.
The second part of your post deals with Global but it is forecasts. The current evidence I linked to does not show such increases on any of the metrics in 40 years of global warming.
https://www.counton2.com/wp-content/uploads/sites/7/2021/06/1987_yearly_temperature_anomalies_from_1880_to_2019-1.jpeg
The graph shows the Earth surface had warmed 1 C from 1980 to 2020 but the global hurricane metrics did not reflect change.
Norman,
You are right that different metrics show different things.
Kerry Emmanuel at MIT, has done thorough analysis, and detected strengthening trends, as have others.
https://www.pnas.org/content/117/24/13194
Clearly warmer water over depth is both predicted and happening with GW, as well as more atmospheric water vapor.
With Ida, we saw a rapid intensification (RI) when the storm went over water that was anomalously warm over depth. This RI apparently is a recent phenomenon.
Other factors besides warmer waters are important, and seem cyclic, but not predicted, AFAIK, to trend in a cancelling way to warming effects.
“In order for rapid intensification to occur, several conditions must be in place. Water temperatures must be extremely warm (near or above 30 C, 86 F), and water of this temperature must be sufficiently deep such that waves do not churn deeper cooler waters up to the surface. Wind shear must be low; when wind shear is high, the convection and circulation in the cyclone will be disrupted.[2] Dry air can also limit the strengthening of tropical cyclones.[3]”
Wiki
“Your link was for the prediction of Atlantic Basin hurricanes. Again I pointed out that region seemed to show an increase in hurricane activity.”
I wonder if La Nina had anything to do with that.
Norman,
My own guess is that if you have an itch, you scratch it.
You can always do like our Hall Monitor and Just Ask Questions and see how it goes.
My analysis shows that Willard is an idiot.
Willard the Dullard:
The trend of US land falling major hurricanes,
from 1900 through 2020, is DOWN.
A quote might be nice, RG.
Here’s what it looks like:
Op. Cit.
willard…”Hurricanes — also called tropical cyclones or typhoons outside North America — are being made more intense by the warming ocean, which studies have shown has absorbed approximately 90% of the planet’s excess heat trapped by human-produced greenhouse gas emissions”.
***
Last I heard, the excess heat in the ocean propaganda came from Trenberth after he lamented that global warming had stopped. He suggested the ‘missing heat’?? was being hidden in the oceans.
Heat, being related to atoms/molecules, cannot be trapped by atoms/molecules, especially molecules making up 0.04% of the atmosphere. Glass, as a solid structure created from atoms, can block heat, but no gas can trap it, hence your study is pseudo-science.
> Last I heard
Easy for you to say, Gordo: you’re not listening!
Willard the Dullard
You remain clueless, as usual.
The temperature differential between the tropics and the Arctic is the best indicator of the quantity of bad storms in the Northern Hemisphere.
That differential has declined since the 1970s.
And that change would be a good explanation for why severe storms, that affected the US, have declined, including the longest period, in years, with no major (Cat. 3+) hurricane making US land fall (2005 to 2017)
The US /= The Northern Hemisphere
There appears to be an increase in storm severity across the Atlantic basin.
You can make this statistic go away by ignoring most of the storms in the Atlantic basin and only look at those that make landfall in the US.
This was Roy’s trick for years. You’ve learned it well, grasshopper.
Reply to Barry (there was no reply button on his comment)
US land falling hurricanes are the ONLY hurricanes likely to have accurate data before the use of weather satellites in the 1970s.
A total count of hurricanes will miss many hurricanes that did not make US land fall,
There will be inaccurate data before the 1970s.
The use of satellites significantly increased detection of non land falling hurricanes, creating an uptrend of hurricane counts after the 1960s from that better detection.
Total hurricanes are perfect if you prefer inaccurate data to support a false narrative. US land falling hurricanes are much more accurate.
In addition to hurricanes, strong tornadoes (F3+) in the US have been in a down trend since 1954.
These downtrends of violent weather events were are expected from the declining temperature differential between the Arctic and the tropics, since the 1970s.
Remember that the Arctic had more global warming than any other are of our planet, while the tropics had much less warming, resulting in a smaller temperature differential.
[RICHARD] There will be inaccurate data before the 1970s.
[ALSO RICHARD] US droughts and heat waves peaked in the 1930s.
Troglodytes say the darnedest things.
Richard,
(there’s a limit to how many sub-replies this site allows, and we reached it, hence no reply buttons)
If you believe the data is not good enough prior to the 1970s, then only use data from the satellite period. My point isn’t changed by that.
http://climatlas.com/tropical/global_running_ace.png
Because there are few Cat3+ storms every year, and the Atlantic basin is a much larger area than the US coast, US landfalling hurricane data is a poor proxy for basin-wide activity of ‘bad storms’. During the satellite period there are plenty of years where there were Cat3+ storms in the Atlantic without a single one hitting the US coast. Yet Roy thought fit to make repeated observations, as if it said something about climate change rather than, say, the variation in storm tracks.
You had stated:
“The temperature differential between the tropics and the Arctic is the best indicator of the quantity of bad storms in the Northern Hemisphere.”
The US /= NH
The majority of Cat3+ hurricanes do not hit the US coast. US landfalling hurricanes are poor proxy data for testing this assertion.
And why limit to the US anyway, when you have landfall data for other countries? This always seemed a peculiarly USer-centric way of approaching the issue.
http://climatlas.com/tropical/global_running_ace.png
says that the NH Cyclone energy is the lowest it’s been for 5 years and about the same as it was in 1972.
Graph also says that the trend is increasing overall in the NH.
So does this graph, where it’s clearer:
http://climatlas.com/tropical/global_annual_ace.png
It’s the trend that matters. If data is highly variable, comparing a few points is absolutely meaningless. I don’t know why you do that. It looks like you want to present a certain narrative, and if the trend doesn’t help you (because you DO use trends when they tell the story you seem to prefer), then you, RLH, pick and choose data points that sell your narrative.
The year to date N Atlantic accumulated cyclone energy is 142 per cent above normal (1981 to 2010 average), and it was also above normal in 2020.
If I wanted to sell a narrative of increasing hurricane energy, those would be handy statistics to pitch to the uninformed. Comparing them to other data points and even the 30-year baseline is absolutely meaningless regarding the overall trend.
“In addition to hurricanes, strong tornadoes (F3+) in the US have been in a down trend since 1954.”
Red herring
Tornadoes are not strongly influenced by ocean temperatures the way hurricanes are.
Concern about after > 1970s satellite obs? Fine. Start in 1970. The result is an increase in strength of Atlantic Hurricanes.
barry says:
September 3, 2021 at 7:18 PM
And why limit to the US anyway, when you have landfall data for other countries? This always seemed a peculiarly USer-centric way of approaching the issue.
Why not look at all tropical cyclones and decide whether there’s a trend or not. Merely Google “ryan maue hurricane graphs” and select images.
Did you notice where my links came from, Steve? Ryan’s was the first place I looked.
barry says:
September 15, 2021 at 8:43 AM
Did you notice where my links came from, Steve? Ryan’s was the first place I looked.
Your right, I didn’t read all 71 of your posts.
Two links are in the 2 posts of mine immediately above your reply. You’d have to have read the first one of the 3 posts I’d made in this fairly short sub thread, and skipped the next 2 to miss it.
Shooting from the hip again?
The above statement summarizes one chart in this article:
https://climaterealism.com/2021/08/fess-up-washington-post-actual-data-doesnt-show-climate-change-made-ida-worse/
Proving a negative existential is notoriously hard, Troglodyte, but if you refuse to see something, anything, well eyeballing a graph drowned in noise is the way to go.
Try this instead:
https://www.cnn.com/2021/08/30/weather/hurricane-ida-climate-change-factors/index.html
Please RTFR.
Nothing from the UN IPCC can be trusted.
Their purpose in life is to make always wrong predictions of climate doom, and they have been doing so since 1988.
Gullible fools, like you, always believe them !
Did you ever stop to wonder why the UN would talk about the past four decades … when data are available for far more than four decades?
Like most Climate Alarmists, the trick is to pick a low point in the data, in a deliberate effort to show a rising trend. Prior data are then truncated, or not mentioned.
The US has often done that for wildfire acres burned and heatwaves — both very high in the 1930s. So they truncate those 1930s data and start the chart at a low point, perhaps in the 1960s !
Just like the IPCC does.
This trick fools the believers, and the gullible, like you.
Kerry Emanuel at MIT, has done thorough analysis, and detected Hurricane strengthening trends, as have others.
https://www.pnas.org/content/117/24/13194
Your blog source dismisses his appraisal of Hurricane Ida.
“Nothing from the UN IPCC can be trusted.”
“Gullible fools, like you, always believe them”
Let’s see Denialist blog vs. IPCC.
Well, IPCC comprehensively summarizes the published peer-reviewed research, like the paper above, and gives lengthy references.
Political-agenda-driven blogs, like the one you cited, are under no obligation to be truthful, factual, comprehensive, or substantiate their claims with evidence.
Therefore people ought to apply skepticism to what they read there. AT LEAST as much as they do to the IPCC.
Else, they are gullible fools…
willard…”Fueled by warmer-than-normal water in the Gulf of Mexico, Hurricane Ida destroyed homes,…”
***
It’s weather, Willard, late summer weather.
Here’s how Katharine words it, Gordo:
Roy’s Denizens should love this conservative voice of reason.
It has long been known that La Nina causes more and bigger hurricanes in the Atlantic. How far that extends to ‘continuously below the center’ as we are now after a La Nina has not been explored so far.
2. When pinned down, Just Ask Questions;
Willard: 1.
W
Katharine for a quote. That’s reassuring. Talk about being desperate. What next ? Madonna?
FYEO, o-puppy:
http://www.katharinehayhoe.com/
Willard the Dullard
US droughts and heat waves peaked in the 1930s.
I thought you might want to know some facts.
Maybe not.
Droughts tend to involve less water than the extreme events we’re discussing right now, Troglodyte.
As far as “what about” squirrels go, that’s not even a good try.
The immediately past La Nina has no effect on this according to Willard.
I might need to add “puts things in mouths” to your one-trick, pony.
How can 1 trick by 4 or 5 tricks than?
Its the severe weather that indicates cooling. At the end of the Medieval Warm period there were severe storms and floods. Strong frequent hurricanes is an indicator of cooling.
Look at this paper:
https://www.zum.de/whkmla/sp/0708/shin/shin2.html#sf
it might interest you.
I lack idle time to deeply go into it.
I make it 0.1350 to 4 significant figures, but to more digits it’s 0.1349671, which would round to 0.13.
I have doubts about rounding to 2 significant figures whilst at the same time given a month by month update. The trend was rising month by month for some time and then falling month by month, whilst the comments say no change. Then a sudden rise or fall is reported as if there’s just been a big change.
Bellman
Exactly!
Until now, I had linear estimate numbers with at most 4 datdp in the UAH spreadsheet; adding one gives indeed 0.13 when rounded to 2 datdp.
*
” I have doubts about rounding to 2 significant figures whilst at the same time given a month by month update. ”
Exactly again!
You see that in Eben’s comment above:
http://www.drroyspencer.com/2021/09/uah-global-temperature-update-for-august-20210-17-deg-c/#comment-827168
You gonna need a bigger data slicer
The bottom line is with all you numbers dicing and misaligned chart making you don’t know anything about what those numbers actually mean or anything about how climate works and can not predict absolutely anything
Eben
All we can discern here is the level of your subcutaneous agressivity.
Manifestly, you did not understand even a bit of what I wrote.
Ever noticed how the ignorant are always aggressive?
bellman…”I make it 0.1350 to 4 significant figures, but to more digits its 0.1349671, which would round to 0.13.”
***
Huh!!! When I went to school 0.1349671 always rounded up to 0.14. 5 rounds up, not down.
Robertson
Here again, you show how ignorant and pretentious you are.
Manifestly, you aren’t even able to look at what Excel or similar do when rounding such numbers… let alone how rounding works anyway.
Bellman is absolutely right, Robertson!
https://www.calculatorsoup.com/calculators/math/roundingnumbers.php
https://en.wikipedia.org/wiki/Rounding#Floating-point_rounding
binny…”I make it 0.1350 to 4 significant figures, but to more digits its 0.1349671, which would round to 0.13″.
***
Bellman said, “I make it 0.1350 to 4 significant figures, but to more digits its 0.1349671, which would round to 0.13”.
Sorry, it rounds to 0.14. You don’t need the entire number, all you need is the 9. It rounds the 4 up to 5 and that 5 round 0.135 up to 0.14.
Try that on a spreadsheet and see what it brings. You should NEVER rounds things twice. That has been the source of much contention.
Or put another way …
0.1349671 is 0.0049671 away from 0.13
0.1349671 is 0.0050329 away from 0.14
It is closer to 0.13, so it rounds to 0.13. This isn’t rocket science.
Gordon,
Excel rounds to 0.13
The Engineer Police are knocking again.
Robertson
Here again, you show how ignorant and pretentious you are, and above all, that you are absolutely UNWILLING TO LEARN.
Why don’t you at least START learning, by putting 0.1349671 into
https://www.calculatorsoup.com/calculators/math/roundingnumbers.php
“When I went to school 0.1349671 always rounded up to 0.14. 5 rounds up, not down.”
Nope! No school ever taught that. Heck, there is not even a “5” to be found in that number!
It seems you are thinking something like
0.1349671 rounds to 0.134967
0.134967 rounds to 0.13497
0.13497 rounds to 0.1350
0.1350 rounds to 0.135
0.135 rounds to 0.14
But that is backwards. You look at the most accurate
* 0.135 (exactly) rounds using some rule (Like “round up” or “round even”.)
* anything even *slightly* larger (like 0.13501) rounds up.
* anything even *slightly* smaller (like 0.13499) rounds down.
” It seems you are thinking something like… ”
Exactly.
Robertson never reads anything. He merely ‘thinks’.
At best, he would check the content for the presence of what he wants to discredit – or vice versa.
x.0, x.1, x.2, x.3, x.4 round down
x.5, x.6, x.7, x.8, x.9 round up
Half of each.
close,
but x.0 doesn’t round
the rule I was taught to use
x.0 nothing no rounding
x.1, x.2, x.3, x.4 all round down
x.6, x.7, x.8, x.9 all round up
even.5 round down
odd.5 round up
no bias
x.0xxx, x.1xxx, x.2xxx, x.3xxx, x.4xxx round down
x.5xxx, x.6xxx, x.7xxx, x.8xxx, x.9xxx round up
If you want more precision.
This goes back to adding 0.5 and then truncating which will make 0.5 round up.
RLH,
The rounding rules should not add bias.
Take 100 integers between one and ten
Take the average
Pair them off, and average each pair and round to a single digit.
Now take the average.
Is it higher than the first average?
My rounding rule likely gives the same average.
Yours does not, it adds bias.
Bob: As virtually all computer rounding uses the add 0.5 and then truncating method which will make 0.5 round up you are fighting against them, not me.
Typically this is of the form
float x = 0.5f;
float y = (int)(x + 0.5f);
or similar.
Then virtually all computer rounding adds bias, it is then up to me to eliminate that bias when calculating things.
Which I do.
The round .5 to make the previous integer even was the rule I learned as a chemist.
Go argue with the IEEE 754 standards committee then.
I should add that, in floating point numbers, exactly 0.00…. and 0.50… are statistically very unlikely. You are always cautioned to never compare things to 0 in floating point.
The problem comes in when your instrument only has accuracy to two decimal points. (Go ahead and try to read your thermometer to accuracy of 0.5C).
The 6 decimal points come from averaging thousands of readings.
Its not valid to assume the 6 decimal points number is correct.
“The 6 decimal points come from averaging thousands of readings.”
Only if the errors are randomly distributed in a normal distribution.
Ken,
1) The satellite thermometers (and modern weather station thermometers) are not ‘your backyard thermometer’. They can have precision better than +/- 1 or +/- 0.5.
2) Averaging many measurements can give better precision than the precision of any single measurement. Even if each individual measurements is only good to +/- 1 degree, if you average 100 measurements, the average will be accurate to within ~ 0.1 degrees. See ‘standard error of the mean”.
3) Yes, 6 decimal places is indeed more than can be justified, even with good thermometers and 1000’s of measurements. But since computing power is so cheap, we might as well calculate extra ‘guard digits’ and only do rounding at the end. Start with 0.13497 and round to 0.13; don’t round 0.13497 up to 0.135 and then round *that* up to 0.14.
“Averaging many measurements can give better precision than the precision of any single measurement. Even if each individual measurements is only good to +/- 1 degree, if you average 100 measurements, the average will be accurate to within ~ 0.1 degrees. See standard error of the mean’.”
If, and only if, the errors are randomly distributed in a normal distribution.
“If, and only if, the errors are randomly distributed in a normal distribution.”
1) All sorts of distributions would work — normal, uniform, triangular, binomial …
2) If we are only interested in *changes* then the results are even more robust. I could give 100 badly mis-calibrated thermometers to 100 people and ask them to measure the temperature of a room to the nearest degree. The numbers might vary by a few degrees — maybe between 71F and 78F with an average of 74.4F. If the average was 74.9F an hour later, I could be pretty sure the room really was warmer by about 0.5F, even though individual values were in a range of +/- several degrees! Even though about half the poeple gave exactly the same answer as they did before.
https://xkcd.com/1132/
Yep! XKCD is always fun and informative. Statistics is almost always more complicated and subtle than it might first appear.
“If we are only interested in *changes* then the results are even more robust. I could give 100 badly mis-calibrated thermometers to 100 people and ask them to measure the temperature of a room to the nearest degree.”
If they cluster on the floor in one corner then the result would most certainly not be the true average of the whole room.
And it would still rely on those miss-aligned thermometers errors being normal distributed about a common center. If they were all off by 4 degrees in one direction then what you would have is not the actual temperature either.
And if they all had errors that were range dependent then all chances of getting useable results are out the door.
Got any suggestions as to why USCRN has differences between Tmean and Taverage differ on a continuous but repeatable basis site by site? They don’t. I asked them already, And those thermometers are very accurate indeed.
“If they cluster on the floor in one corner … “
If every thermometer was in one corner, then we could be measuring the temperature of that corner. I’m not saying you can measure one thing and then say you know something else you didn’t measure.
“If they were all off by 4 degrees in one direction then what you would have is not the actual temperature either.”
But I wasn’t talking about actual temperatures: “If we are only interested in *changes* … ” Whether the temperature goes from 70.4 to 70.9, of from 74.4 to 74.9, the change will still be 0.5 degrees.
“And if they all had errors that were range dependent then all chances of getting useable results are out the door.”
Now that *would* be a problem. We have to have at least some confidence in the consistency of the thermometers.
“Got any suggestions as to why USCRN has differences between Tmean and Taverage differ …
I have not studied this particular data set, nor how they did their calculations. So I can’t comment specifically. I can say that since they are apparently reporting two different things calculated two different ways, it is perfectly reasonable that that the answers might be different.
“If every thermometer was in one corner, then we could be measuring the temperature of that corner. Im not saying you can measure one thing and then say you know something else you didnt measure.”
So you agree that Nyquist coverage in space/volume is important.
“I have not studied this particular data set, nor how they did their calculations. So I cant comment specifically. I can say that since they are apparently reporting two different things calculated two different ways, it is perfectly reasonable that that the answers might be different.”
Tmean is the ‘normal’ (Tmax+Tmin)/2. Taverage is the ‘true’ average of the temperatures at 5 min intervals over a day.
The problem is not that they are different, but that the difference is site by site specific.
The range (the difference between min and max) will affect the outcome but that still leaves the constant offset to the figures unexplained.
“So you agree that Nyquist coverage in space/volume is important.”
Certainly.
“The problem is not that they are different, but that the difference is site by site specific.”
This is not surprising. It probably also varies by season.
This all would get very complex to analyze. Much more than we could hash out in a random blog post. You could jump in and try to do a better analysis yourself, or contact the scientists involved to share your ideas. (But I suspect they have thought of all your possible issues already.)
“This is not surprising. It probably also varies by season.”
It does not. Nor by Latitude, Elevation, Relative Humidity and a lot more.
“contact the scientists involved to share your ideas. (But I suspect they have thought of all your possible issues already.)”
I have. And they say they have not considered it at all.
“I have. And they say they have not considered it at all.”
Given that there ARE published papers on the matter, obviously you havent contacted all of them!
“Given that there ARE published papers on the matter, obviously you havent contacted all of them!”
Strange then that the USCRN Program Manager did not refer to them when asked. I would have thought he was the ideal person to know.
Can you provide any actual links? That deal with Taverage and Tmean being in such an odd relationship across USCRN stations.
“It does not [vary by season]. Nor by Latitude, Elevation, Relative Humidity and a lot more.”
Really? That seems like an awfully broad assertion. Any given day, “it” (the relationship between Tmean and Taverage) could be different. Taverage could be above or below Tmean. One month the average of Tmean might be above the average of Taverage and another month it might be below. Are you truly 100% confident there are no patterns that might be seen from summer to winter?
I bet (given access to their data sets) I could find seasonal differences (and probably several of the others you mention).
I use averages of each 5 mins in each day over the whole 20 years or so that they have been running, so any seasonal differences are moot.
You can just use the time field (LST preferably) to do that quite easily.
I have imported all of the USCRN data, Monthly, Daily, Hourly and SubHourly into an SQL database, so doing so is just a matter of writing the right query.
You can also then look for a match on the Daily columns for Tmean and Taverage and their difference and none of those criteria I have listed produce the same order. Not even close.
USCRN data is freely available to all who want it.
I published quite a range of USCRN graphs showing the differences between Tmean and Taverage (and a Tmedian also) on my blog recently
Try this
https://climatedatablog.files.wordpress.com/2021/07/uscrn-combined-carrizozo.jpeg
and a load of previous postings.
“across USCRN stations.”
The two papers I saw were about China, specifically because they has a different daily sampling method than Tmax and Tmin.
This might be one https://journals.ametsoc.org/view/journals/apme/58/10/jamc-d-19-0001.1.xml
Nate: That doesn’t address your assertion that there were papers published about the constant differences between Tmean and Taverage on USCRN sites on a site by site basic does it?
There are none that I have found.
So ‘Given that there ARE published papers on the matter, obviously you haven’t contacted all of them!’ is false.
Nate:
“Overall, the present analysis indicates that the previously applied method to calculate daily and monthly mean temperature using Tmax and Tmin significantly overestimates not only the climatological mean of the national stations and mainland China on a whole, but also the upward trends of surface air temperature at most of the stations and in the country. In particular, because the data of monthly mean temperature as calculated using Tmax and Tmin have been widely used in studies of long-term change in global land and regional average surface air temperature, the biases as revealed in this work should be carefully considered in future studies.”
Not looking good for your favorite Tmean usage is it?
“your assertion that there were papers published about the constant differences between Tmean and Taverage on USCRN”
Uggggh. Just stop making up BS.
“the biases as revealed in this work ”
1. read the whole paper, youve missed some things
2. Find out what other papers have found.
3. Do they agree?
You missed this part
“relative to the standard average temperature of four time-equidistant observations”
This was your comment to my observation about the USCRN data
“‘I have. And they say they have not considered it at all.’
Given that there ARE published papers on the matter, obviously you havent contacted all of them!”
As I was referring to USCRN, then your comment and subsequent follow-up about other series is kinda pointless.
“You missed this part
‘relative to the standard average temperature of four time-equidistant observations'”
You missed the part about it not being about USCRN.
RLH says: ‘… Tmax and Tmin significantly overestimates not only the climatological mean of the national stations and mainland China on a whole, but also the upward trends of surface air temperature at most of the stations and in the country…’
It’s refreshing that you’ve apparently come to embrace linear trends and trend significance tests if only for the moment. Maybe you can help me reconcile how Liu etal is reporting much narrower trend confidence for a limited geographic region than one gets with the global data sets.
OK maybe so.
I thought your issue was with Global Warming, not just US warming.
The US is 1.5% of the Globe.
I thought the Tmax Tmin issue was a global one, and historically the data we have available.
Also USCRN is not GISS, Berkeley or Had, who are the ones doing the analysis of data.
“In particular, because the data of monthly mean temperature as calculated using Tmax and Tmin have been widely used in studies of long-term change in GLOBAL LAND and regional average surface air temperature, the biases as revealed in this work should be carefully considered in future studies.”
USCRN is way more accurate in their measurements than anything that GISS, Berkeley or Had use.
“Its refreshing that youve apparently come to embrace linear trends and trend significance tests if only for the moment.”
I am fighting fire with fire. Doesn’t mean for a minute that I accept that it has significant meaning.
Are you contending that the ‘ends’ of the data are less well known than the middle?
“I thought your issue was with Global Warming”
My issue is with 2 things.
1. I do not accept that the data presented gives the accuracy claimed.
2. I do not accept that the majority of what we see is purely human driven.
“I thought the Tmax Tmin issue was a global one, and historically the data we have available.”
The issue with Tmean is widespread and historic but what I contend is that an uncertainty needs to be added to those figures (+0.6c/-1.5c if USCRN is to be believed).
I see no reason why the US should be different to the rest of the world. They just have in USCRN the most accurate figures.
If Tmaxmin is used historically, we can’t undo that. If the same method is used throughout, then how much does that bias a local trend? Not much. Global? Negligibly.
The folks analyzing the data worry about a bias when something changes in the method of measurement. They try to correct for that. Has that happened?
“If Tmaxmin is used historically, we cant undo that.”
We can acknowledge that using Tmaxmin is inaccurate. At least 20% (or so) of the ‘error’ between the ‘true’ temperature and Tmaxmin can be explained by Latitude (see elsewhere). That could be used to correct the assumed figures and perhaps provide a better insight to the real picture.
Other, more accurate than 20%, characteristics might easily be provided that would effect things even more.
And? An offset is NOT a trend.
“If the same method is used throughout, then how much does that bias a local TREND?”
So tell what offset and in which direction the USCRN sites decide Taverage is different to Tmean. On a site by site basis.
Latitude can be considered to cause 21% of that difference. What causes the rest?
Perhaps we should apply that 21% Latitude ‘error’ to ALL Tmean usage worldwide, both historic and present.
That will mean adjusting both actual values and trends to compensate.
“Considering the larger number of stations in the US and in historical time, we may speculate that the error in the minmax method was at least as large as indicated here, and most probably somewhat larger, since many stations have been shown to be poorly sited (Fall et al, 2011). The tendency in the USCRN dataset to have about equal numbers of underestimates as overestimates is simply accidental, reflecting the particular mix of coastal, noncoastal, Northern and Southern sites. It may be that this applies as well to the larger number of sites in the continental US {as well as the world}, but there is likely to be a bias in one direction or another in different countries, depending on their latitude extent and RH levels.
This error could affect spatial averaging. For example, the Fallbrook CA site with the highest positive DeltaT value of 1.39 C is just 147 miles away from the Yuma site with one of the largest negative values of -0.58. If these two stations were reading the identical true mean temperature, they would appear to disagree by nearly 2 full degrees Celsius using the standard minmax method.”
That was said 9 years ago and the record has nearly doubled since then.
Source??
Is it finding or estimating the size of the effect on TRENDs?
RLH is quoting from this WUWT article, which is actually a well done analysis of some aspects of the average, min/max thing.
RLH didn’t quote the next paragraph which speculates that this probably doesn’t affect long term trends although at the time of publication, there were only a few years of USCRN data. With almost another decade of data, there’s little evidence that it does.
The article doesn’t address anomalies, but the same applies, that is if the shape of the temperature distribution doesn’t change, there’s no significant difference between mean and average anomalies.
Here’s some charts for Fallbrook and Yuma USCRN stations:
uscrnFallbrookAnomalies.png
uscrnYumaAnomalies.png
As was noted, 21% of the ‘error’ can be attributed to Latitude. Should we add that correction in addition to the well known cosine weightings?
Mind you, that still leads 79% to be ascribed to ‘uncertainty’ for all Tmean uasge.
Fallbrook distributions
https://climatedatablog.files.wordpress.com/2021/09/uscrn-diffs-fallbrook-5-ne.jpeg
Yuma distributions
https://climatedatablog.files.wordpress.com/2021/09/uscrn-diffs-yuma-27-ene.jpeg
And, like Blinny, everybody seems happy to use straight OLS lines for spherical geometry (i.e. Latitude). Not sure why.
What you are saying is that 0.135 rounds up and 0.134 rounds down which I agree with.
The 2sigma statistical error is 0.05 so…0.135 means somewhere from 0.085 to 0.185
http://www.ysbl.york.ac.uk/~cowtan/applets/trend/trend.html
And as Roy noted, the full error is likely greater.
You mean like this?
https://imgur.com/pqm8RKA
Not quite like that, RLH.
The statistical uncertainly involves an uncertainly not just in the off-set, but also in the slope. This leads to curved uncertainty bounds, not straight lines like you have.
Over the time period I used the difference is minor I think.
Slope error is not as you show and not minor.
In any case Cowtan has calculated it well.
That depends of it you are trying to find the ‘true temperature’. If you are just after the trend of the actual measurements then what I have shown is quite sufficient.
Infilling missing results to get to the ‘true temperature’ can cause as much distortion as it brings. The actual figure can be quite different to that calculated.
I’ll settle for actual measurements and their trend and leave the guesswork to others.
“actual measurements and their trend” have actual statistical error, whether you understand that or not!
“actual measurements and their trend have actual statistical error, whether you understand that or not!”
Of course they do. What I was suggesting is that such errors are distributed either side of the trend lines and do not accumulate towards the ‘ends’ to produce curves.
That comes from the part where the ‘true temperature’ is then estimated, not from the measurements themselves.
“What I was suggesting is that such errors are distributed either side of the trend lines and do not accumulate towards the ends to produce curves.”
IDK what you are trying to say, but the error on slope is larger than you have portrayed it.
Cowtan calculated it correctly. Try his tool on UAH for various start and end points. You will see wildly different trends for 3 or 5 y durations. These are illustrative of the large error on trend that he finds.
http://www.ysbl.york.ac.uk/~cowtan/applets/trend/trend.html
“That comes from the part where the true temperature is then estimated, not from the measurements themselves.”
IDK what you are getting at here?
“Cowtan calculated it correctly.”
Cowtan uses extrapolation and infilling from the actual measurements to attempt to discover the ‘true temperature’.
In other words, ‘inventing’ data where none is actually measured.
Nate: Are you saying the the ‘ends’ of the data are less well known than the ‘middle’?
As has been noted elsewhere
“The reality is that any measure of standard error and associated confidence limits is a function of the assumed statistical model. As such it is an assumption-based estimate. In contrast, the monthly and 13-month moving averages are point measures that are a function of what was actually measured. There will be errors in those measurements but no statistical technique can tell you what those errors might be. In fact, all of the statistical measures assume the measurements themselves were made without error. In contrast, the statistical analysis is all about trying to estimate the extent to which the natural and real variability in the system over time as measured is fundamental to the real system or simply due to random chance.”
“Cowtan calculated it correctly.”
Yes. Yes he did. Your complaint about ‘infilling’ on one set has no relevance to this!
By now your stats paragraph has been posted 11 times. You don’t think that is enough?
tim…”“When I went to school 0.1349671 always rounded up to 0.14. 5 rounds up, not down.”
Nope! No school ever taught that. Heck, there is not even a “5” to be found in that number! ”
***
Tim, old chap, you are being obtuse. Of course I was referring to changing 0.1349671 to two decimal places. Does that need to be said? That’s what rounding up means.
Someone earlier had inferred that after 0.135, the number was rounded down to 0.13. I was taught that a 5 rounded up, as in 0.135, to 0.14.
Always nice chatting to you, however.
“Of course I was referring to changing 0.1349671 to two decimal places”
… and rounding 0.1349671 to two decimal places is 0.13, not 0.14.
Sure you could “round up” from 0.134 or 0.131 and get 0.14, but that is not what we are talking about here.
0.14 could mean anything from 0.135 to 0.145, but in reality since May 2020 when it went up to 0.14, it has never been more than 0.138. The current trend is only 3 thousandths of a degree per decade less.
In reality I don’t think there’s been any significant change in the overall trend this century, given the large uncertainty.
Bellman
Again, you are correct.
Here is Cowtan’s estimate UAH6.0 LT for 2000-now:
0.157 ± 0.128 °C/decade (2σ)
https://drive.google.com/file/d/1l1mw0BvVbMgVkltgYATsRX3T_Ua96eGu/view
*
Captain Climate’s claim posted upthread, saying that everybody can compute a trend today: that might be correct for longer series, but for 20 years this does not seem to be the case.
Here is the estimate with SE produced by an Excel-like tool:
0.157 ± 0.016
Hmmmh…
This all highlights one of the many problems with “significant digits” as a way of presenting data. It is MUCH better to indicate the value and the uncertainty explicitly.
If the data is 0.130 +/- 0.005, then write it that way.
If the data is 0.135 +/- 0.005, then write it that way.
If the data is 0.140 +/- 0.005, then write it that way.
If the data is 0.135 +/- 0.02, then write it that way.
If the data is 0.135 +/- 0.001, then write it that way.
Writing “0.14” or “0.13” only *implies* an uncertainty of +/- 0.005, when using an overly simplistic method of error analysis.
All thermometers used for historic temperature analysis should have at least x.x +/- 1.0c then.
I guess that depends. A careful person with a good thermometer 100 or 200 years ago could record a temperature to 0.5 C or even 0.1 C.
But most measurements probably we more like +/- 1 as you suggest.
“But most measurements probably we more like +/- 1 as you suggest.”
The majority tends to win, especially when we consider averages that include them.
When averages of many numbers are included, the uncertainty of the average gets smaller than the uncertainty of the individual numbers. So the “majority” helping to home in on a more certain result.
Again we are back to ‘normal distributions’ and random placements.
If they are all off in some random fashion then the accuracy does not get any better.
For instance, USCRN publish Daily series for their stations with Tmean (traditional) and Taverage (accumulation of 5 second data) being part of that data.
On a site by site basis they are off by a fairly constant amount, one with the other. But it is site by site. Why? No-body can say.
Random but systematic I should say.
For instance at one end we have
https://imgur.com/9YAbPuw
and the other
https://imgur.com/RaIHTP1
Also available at
https://climatedatablog.files.wordpress.com/2021/09/53151_fallbrook_5-ne.jpeg
and
https://climatedatablog.files.wordpress.com/2021/09/04140_lewistown_42-wsw.jpeg
Along with a distribution over the years they have been open.
https://climatedatablog.files.wordpress.com/2021/09/uscrn-diffs-fallbrook-5-ne.jpeg
and
https://climatedatablog.files.wordpress.com/2021/09/uscrn-diffs-lewistown-42-wsw.jpeg
I had no idea of how much the Augts anomaly would go down wrt July’s, but in the previous thread I wrote it would, on the base of
https://drive.google.com/file/d/134HW_g8ensDzrWyHgHKWz45fR4UqGb_8/view
5 months displacement wrt ENSO still seem to be a valuable point of view.
2016 was by far a hotter August than 2021, right?
Yeah.
That was due to the strong El Nino WE HAD IN 2015/16 (the third biggest ENSO event since 1979, after 1982/83, 1997/98).
The UAH figures have been trending down since then
https://www.woodfortrees.org/plot/uah5/from:2016
You used the wrong data, and the graph stopped late 2017 as a result.
https://www.woodfortrees.org/plot/uah6/from:2016
Indeed I did. Still shows a decline for the last few years though.
https://www.woodfortrees.org/plot/uah6/from:2016/trend
Not too surprising when selecting your start point as the highest bunch of anomalies in the record.
I guess you know what happens when you start with the second highest year in that record. It was a taking-point for any years.
https://www.woodfortrees.org/plot/uah6/from:1998
“No warming since 1998!”
Ah, the god old days.
Any explanation as to why the rate of slope is increasing as we get closer to the present?
Yes, when you are fitting noise, the slope changes year to year. If so, it will have NO predictive value!
Try to use your short trends with the downward slope, let them continue into the future, and they fail within a couple of years.
Thats how you know you are fitting noise.
Your ‘fit’
https://www.woodfortrees.org/plot/uah6/from:2016/trend/plot/uah6
https://www.woodfortrees.org/plot/uah6/from:2016/trend/plot/uah6/from:2016
Matches quite well.
https://www.woodfortrees.org/plot/uah6/from:2016/trend/plot/uah6/from:2016
Matches quite well.
“The reality is that any measure of standard error and associated confidence limits is a function of the assumed statistical model. As such it is an assumption-based estimate. In contrast, the monthly and 13-month moving averages are point measures that are a function of what was actually measured. There will be errors in those measurements but no statistical technique can tell you what those errors might be. In fact, all of the statistical measures assume the measurements themselves were made without error. In contrast, the statistical analysis is all about trying to estimate the extent to which the natural and real variability in the system over time as measured is fundamental to the real system or simply due to random chance.”
“Matches quite well”
Nope, dimwit, you did not put it to the test!
You need take a fit line and extend it to predict the next years.
Go back to previous period and try to reliably ‘predict’ what came next.
Given that the short term trend lines flip flop like a fish on the ground, we can infer that they will fail to reliably predict.
See above
“The reality is that any measure of standard error and associated confidence limits is a function of the assumed statistical model. As such it is an assumption-based estimate. In contrast, the monthly and 13-month moving averages are point measures that are a function of what was actually measured. There will be errors in those measurements but no statistical technique can tell you what those errors might be. In fact, all of the statistical measures assume the measurements themselves were made without error. In contrast, the statistical analysis is all about trying to estimate the extent to which the natural and real variability in the system over time as measured is fundamental to the real system or simply due to random chance.”
“Go back to previous period and try to reliably predict what came next.”
https://www.woodfortrees.org/plot/uah6/from:2020/trend/plot/uah6/from:2019/trend/plot/uah6/from:2018/trend
What would you say the next period brings?
I dont what you think that is demonstrating?
If the trend changes year to year, how the hell is it going to be able succeed in to PREDICTING what comes next?
Go back to 2010. Fit a trend line to the next 5 y2010-2015 , Did that do a good job of predicting the 5 y after that, 2015-2020?
Do the same for 2011-2016, did it do any better predicting 2016-2021?
No
https://www.woodfortrees.org/plot/uah6/from:2010/to:2015/trend/plot/uah6/from:2010/plot/uah6/from:2011/to:2016/trend
Because 5 y trends are too short, and are simply fitting noise.
RLH,
“Any explanation as to why the rate of slope is increasing as we get closer to the present?”
https://www.woodfortrees.org/plot/uah6/from:1998/plot/uah6/from:1998/trend/plot/uah6/from:2000/trend/plot/uah6/from:2003/trend/plot/uah6/from:2005/trend/plot/uah6/from:2008/trend/plot/uah6/from:2010/trend/plot/none
I don’t know what you’re talking about. I graphed my best interpretation of your reply.
What I do know is that short-term trends tell you nothing about any underlying trend in global temperature data. You need multidecadal periods, not interannual. This is because of the variability in the data.
“No warming since 1998” is the same refrain as “No warming since 2016.”
An utter cherry pick.
And when we have another year that beats 2016 and the trend from that year is upwards, then people like you will start saying “no warming from 202X.”
Been there, done that. You learned nothing, obvously.
From this sequence
https://www.woodfortrees.org/plot/uah6/from:2018/plot/uah6/from:2018/trend/plot/uah6/from:2019/trend/plot/uah6/from:2020/trend
what is you prediction for next year and why?
“Because 5 y trends are too short, and are simply fitting noise.”
But you insist that 15 year low pass filters are of no use.
Nate: Got any reasons why Tmean is so inaccurate when compared to Taverage for daily temperatures? And why the difference is related to Latitude (21% or better).
https://climatedatablog.files.wordpress.com/2021/09/latitude.jpg
There’s no way yet to predict weather that far out. I thought you were interested in climate.
“But you insist that 15 year low pass filters are of no use.”
Nope never did.
I simply pointed out that your use of them REMOVES the short term noise that you are overly focused on now.
Its a contradiction.
“Nate: Got any reasons why Tmean…”
When cornered, change the subject! And ask a question!
That is not the subject of this thread.
The subject is why do you keep insisting that fitting linear trends to short-term noise is valuable for predicting the future, when it clearly, demonstrably, is not?
Fitting linear trends to > 20y does seem to have predictive value.
Looking forward to thoughts and comparison between UAH global and the new IPCC report out.
Ok, I understand now… just the statistical error of the regression slope.
Roy W Spencer
Exactement, Monsieur Spencer!
Merci d’avance – for all of your readers who cannot get the information themselves: -)
And as Bellman pointed out, 3 digits after the decimal point would be a big advantage.
Rgds
J.-P. D.
0.17c to 0.1c and 0.25c.
I call that a ‘split the difference’.
https://imgur.com/NAbRRnH
August was hotter in 2016 than on this year’s, right? Unlinke July.
2020 08 0.30
…
2021 08 0.17
but we’re warming I tell you.
but the 0.17 and 0.30 is the difference to the month before right? I is not the actual temperature of the globe (sorry – learning here).
These are global anomalies.
That is, the difference between each month and the sum of the same months in a reference period of 30-years (1991-2020) averaged.
Ricardo
” but the 0.17 and 0.30 is the difference to the month before right? ”
No.
All the UAH numbers you see in the thread are anomalies, i.e. departures from the mean of the current reference period (since Jan 2021: 1991-2020), out of which seasonal dependencies (‘the annual cycle’) have been removed.
The mean absolute temperature computed by UAH for the lower troposphere is about -9 degree C.
binny…”The mean absolute temperature computed by UAH for the lower troposphere is about -9 degree C”.
***
Another Binny lie. You did not mention the altitude at which the -9C applies.
Robertson
Thanks for showing us all how dumb, brazen and ignorant you are.
You, calling me liar? That is, from a person lying every day on this blog, the very best joke.
If you would pay attention to what happens instead of endlessly writing what you ‘think’ (quotation marks necessary here), then you would know this:
UAH LT global average annual cycle
Mon. Kelvin
JAN 263.037
FEB 263.108
MAR 263.299
APR 263.721
MAY 264.324
JUN 264.966
JUL 265.288
AUG 265.108
SEP 264.471
OCT 263.786
NOV 263.273
DEC 263.072
to be found in
http://www.drroyspencer.com/2016/03/uah-v6-lt-global-temperatures-with-annual-cycle/
That was the climatology for 1981-2010. Average absolute temperature was near 264 K, i.e. around -9.20 C.
Now, wrt 1991-2020, the Celsius average is a bit higher, -9.05 C.
The average altitude of the measurements you could compute yourself – if you were able to do that; but you Ignoramus of course aren’t.
It is around 4 km.
Why do you never learn anything, Robertson?
“It is around 4 km.”
i.e. Above the turbulent boundary layer that most of the ground based thermometers sit in.
No wonder they produce slightly different figures.
> we’re warming I tell you.
You got that one right.
Sure idiot, 0.17c is warmer than 0.30c for certain. Not.
The predicate is “warming,” dummy.
The indicator is an anomaly.
An anomaly is an anomaly. Next you will be saying they don’t represent anything.
According to you an anomaly of 0.30c is colder than one of 0.17c.
https://imgur.com/xj5Dg6P
“but were warming I tell you.”
RLH continues to hyperventilate over month to month noise.
Nate continues to ignore any downward trend. No matter if it is years long.
https://www.woodfortrees.org/plot/uah5/from:2016
Or
https://www.woodfortrees.org/plot/uah6/from:2016
Nate: Do you disagree with the OLC trend line?
https://imgur.com/xj5Dg6P
Every OLC trend line has statistical error, which seems to not be your cup of tea.
“Nate continues to ignore any downward trend. No matter if it is years long.”
Here are example trends since 2016, 17, 18 and the whole record.
https://www.woodfortrees.org/plot/uah6/from:2018/trend/plot/uah6/from:2016/trend/plot/uah6/from:2017/trend/plot/uah6
If your short-term trend line flops around like a fish out of water, just by changing the start by 1 year, then it should be obvious that it has no significance to long term climate change.
Downwards trends have to start somewhere. Are you saying that this downwards trend will vanish before mid next year?
“Every OLC trend line has statistical error”
There are 2 errors involved. 1 is the error in the measurements. The other is the measurements to the ‘true temperature’.
“Are you saying that this downwards trend will vanish before mid next year?”
I cannot predict ENSO reversal dates. You?
But as I showed you before, the average persistence-time for NINO 3.4 is ~ 11 months. Unless you think that behavior has fundamentally changed, we can expect it to reverse pretty soon.
By pretty soon I assume you mean next year as most forecast seem to indicate that.
https://www.cpc.ncep.noaa.gov/products/NMME/current/images/nino34.rescaling.ENSMEAN.png
Or for the full set
https://www.cpc.ncep.noaa.gov/products/NMME/current/images/nino34.rescaling.NMME.png
An thus, whenever it does reverse, global T will respond in kind..
Your claim was “we can expect it to reverse pretty soon”. Are you now saying that next year (1/3 of the year away) is pretty soon?
With the August anomaly, we now have in UAH 6.0 LT eight consecutive anomalies in 2021 which are lower than those for the same months in 2020.
Here is a list of years for which the same holds:
name| year
—-+—–
uah | 1982
uah | 1984
uah | 1989
uah | 1992
uah | 1999
uah | 2008
uah | 2011
uah | 2017
*
Nothing really unusual, as it seems.
I anticipate the somewhat stubborn reply, but that doesn’t matter much. The reply won’t erase the list :- )
Nor this graph
https://imgur.com/xj5Dg6P
With an uncertainty added to the trend line
https://imgur.com/pqm8RKA
binny…”Here is a list of years for which the same holds:”
***
Then you are supporting the claim by RLH that it is cooling in 2021.
I can tell you one thing, the summer in Vancouver, Canada came in with a bang and is exiting with a whimper. Night temps are below 10C and any evidence of heat waves is long gone.
Robertson
” Then you are supporting the claim by RLH that it is cooling in 2021. ”
Thanks for showing us all how dumb, brazen and ignorant you are.
Exactly the contrary is the case, Robertson. But you lack the experience necessary to understand.
You simply write, without thinking even a bit.
Radiant energy absorbed by ghg other than water vapor is redirected to WV molecules via thermalization. The WV molecules, because of 1200 to one gradient, surface to tropopause, radiate much of it to space. End result is the only ghg that has a significant effect on climate is WV. WV trend, measured and reported by NASA/RSS at http://data.remss.com/vapor/monthly_1deg/tpw_v07r01_198801_202101.time_series.txt has been increasing about 49% faster than calculated in Global Climate Models and can explain all of human contribution to warming. https://www.researchgate.net/publication/338805648_Water_vapor_vs_CO2_for_planet_warming_14
dan…”Radiant energy absorbed by ghg other than water vapor is redirected to WV molecules via thermalization”.
***
What are the other atmospheric molecules, making up about 99.6% of the overall atmosphere, doing while all this is going on…spinning their wheels? Those molecules are part of the total gas and the Ideal Gas Law cannot be put away while people focus on radiation alone.
Most heat on the planet is distributed by oceans and the atmosphere from the Tropics. The transport medium in the atmosphere is nitrogen and oxygen, with CO2 barely transporting any. Along the way, as the hotter gases and water from Tropics mingles with cooler water and air in higher latitudes, both north and south, heat is dissipated naturally. Heat is dissipated naturally in the atmosphere as heated air rises.
Why are you not accounting for natural heat dissipation and the solar energy required to maintain the oceans and the atmosphere at their current elevated levels?
I’m trying to say it’s a lot more complicated than just WV and CO2.
GR,
You should understand this stuff better than you are indicating. Did you not understand what “ghg other than water vapor” means? It means ALL ghg other than WV. All gasses in the atmosphere, mostly oxygen, nitrogen and argon, are constantly warmed by gaseous conduction with ghg molecules that warmed because they have absorbed radiation energy and constantly cooled by gaseous conduction with ghg molecules that cooled because they have emitted radiation. Gaseous conduction is how energy moves wrt wave number. Thermalization is ghg absorbing radiation and sharing the energy with surrounding molecules.
I am not sure what you mean by ‘dissipated’. I presume you mean by convection rather than violation of the first law. Energy leaves the surface mostly by evaporation of water. A net energy balance that I did patterned after Kiehl &Trenberth’s is at http://consensusmistakes.blogspot.com . It shows about 2/3 is from evaporation. As to transport medium in the atmosphere, well, yes the air moves around by advection but a lot of the energy is released as latent heat when the WV condenses.
The only way that energy can leave the planet is by radiation. I consider stuff only from the standpoint of global averages which is appropriate in assessing global warming. I do not address how the energy moves around the planet. I do get the change in average global temperature which intrinsically accounts for “natural heat dissipation and the solar energy” and is comparable to reported values and output from GCMs.
The increase in WV, mostly (about 90%) from increasing irrigation can account for all of the climate change attributable to human activity. The measured WV increase trend is about 49% steeper than calculated in GCMs.
willard…”Heres how Katharine words it, Gordo:
Weve always had hurricanes, weve always had heat waves, weve always had floods and droughts, but what climate change is doing is loading the weather dice against us, ”
***
Do you always fall for propaganda? Climate is not a driver, its a result defined by humans. Some claim climate is the average of weather over 30 years. Some, like Tony Heller, have claimed there is no precise definition for climate.
When someone claims climate change is loading weather, that person is an alarmist extraordinaire.
Here is an actual map of how hardiness zones have changed from 1990 to 2006.
Tony Heller is as usual, full of it.
Hardiness zones are the de facto definition of climate.
https://www.arborday.org/media/mapchanges.cfm
But how much of that’s ‘natural’ and how much is ‘CO2’?
All of it and then some, the natural part is the cooling part, which is overwhelmed by the CO2 and anthropogenic parts.
Says you. How is it that part of the map shows cooling instead of warming? Is CO2 not able to get there?
See under the Differences tab.
A very small part of the map shows cooling.
Didn’t your strawman of CO2 must be heating everywhere get busted already.
A very small part of THAT map shows cooling.
Nothing says that this hasn’t all happened before.
Wait a second,
You have evidence this has happened before?
Can you prove you have stopped beating your wife?
RLH says: Says you.
Actually, it’s according to the most prominent coherent explanation of the phenomena. “bobdroege”, to my knowledge, hasn’t done attribution work, he just agrees with virtually everyone who has done so.
How is it that part of the map shows cooling instead of warming? Is CO2 not able to get there?
The map shows “hardiness zones”, not temperature. Hardiness zones are largely defined by the low temperature extremes not the average temperature.
The blue zones on the map are largely arid regions at elevation that are becoming more arid. This has the effect of increased probability of lower overnight temperature anomalies even as the average temperature anomaly is increasing.
Mark B: You fail to address the most important part of the observation. Nothing shown says that this has not all happened before. Perhaps many times.
RLH,
Wait just a second,
“Can you prove you have stopped beating your wife?”
Well no I can’t but your claim was something else
“Nothing says that this hasnt all happened before.”
You are claiming that is has happened before.
Again, where is your evidence?
Where’s your evidence it hasn’t?
RLH,
Ah, I see we are playing games.
I don’t have evidence it hasn’t because I provided evidence that it has.
Teh Goddard is not worth my time, Gordo.
Get new material.
1.
Dear Experts,
please, may I ask a silly question (I am only a layman, a dilettant): What would be the importance of the UAH data? Why would be UAH relevant for the climate research?
Thank for your answer (help) in advance. Any link to an article/study with explanation would be also highly wellcome.
hari…”What would be the importance of the UAH data? Why would be UAH relevant for the climate research?”
***
Why am I sensing a set up?
UAH data comes from satellites with telemetry capable of covering 95% of the Earth’s surface. The telemetry technology is based on well-established science related to the temperature of oxygen and the radiation frequencies it gives off at certain temperatures at certain altiudes.
Surface stations cover only the land surfaces, which account for no more than about 30% of the surface area. Surface-based ocean temperatures are garnered from different sources and the oceans are terribly under-represented. That is not a problem with UAH data/technology. That fact alone likely explains why UAH data sets read lower than surface data sets.
The relevance to climate research is obvious. The UAH data is far more accurate than surface data and is not showing the catastrophic warming predicted by alarmists who gather surface data.
Many THX you and all others answering my silly question.
The first thermometer was invented around 1650.
Any thermometer records that exist were started since that invention.
The longest thermometer record that I am aware of is the Central England Temperature (CET).
Most of the temperature records are from USA and Europe. Most of the records only go back to 1850.
The thermometer records are all we have to determine if the global temperature is changing (warmer or colder). As you might understand the records are by no means indicative of the global temperature.
Satellites have the advantage of providing global coverage. Too, the theory says that the clearest signal of global warming or cooling is going to be found in the lower troposphere.
UAH and RSS are the only satellite data sets that provide global temperature anomaly data. The only thing that comes close is Radiosonde balloon data.
UAH matches the balloon data more closely than does RSS.
UAH data is of prime importance in determining if and by how much global temperatures are changing.
You can find all sorts of Youtube video featuring John Christy and Roy Spencer explaining their work on UAH data.
> You can find all sorts of Youtube video featuring John Christy and Roy Spencer explaining their work on UAH data.
You can also find a guy who studied John & Roy’s products right here at Roy’s:
https://journals.ametsoc.org/view/journals/atot/34/1/jtech-d-16-0121.1.xml
You can even ask him questions!
Before 2000 and after 2005 RSS and UAH agree quite well. It is the difficult period around 2003 that causes much of their differences. Caused by RSS using a satellite that UAH discarded.
This has all been covered before.
Where’s the Auditor when we need him?
Being an idiot like Willard?
When will you audit why did the UAH discard the satellite, dummy?
So you don’t accept what Roy said on the matter?
http://www.drroyspencer.com/2019/04/uah-rss-noaa-uw-which-satellite-dataset-should-we-believe/
“Despite the most obvious explanation that the NOAA-14 MSU was no longer usable, RSS, NOAA, and UW continue to use all of the NOAA-14 data through its entire lifetime and treat it as just as accurate as NOAA-15 AMSU data. Since NOAA-14 was warming significantly relative to NOAA-15, this puts a stronger warming trend into their satellite datasets, raising the temperature of all subsequent satellites measurements after about 2000.”
“the UAH v6 results are preliminary and a fifth revision has now been released as v6beta5 (v6b5) (Spencer 2016).”
So for the last 5 years you have decided that you know best and that Roy doesn’t have a clue about what he says.
Even though the article I pointed you to is in 2019, 3 years later.
https://science.house.gov/imo/media/doc/Christy%20Testimony_1.pdf?1
Funny that they mention MMH.
29 Mar 2017. Getting closer to 2019 but still not quite there yet.
Baby steps:
https://www.nsstc.uah.edu/aosc/testimonials/ChristyJR_Written_160202.pdf
2 Feb 2016. Not good enough.
Baby steps:
https://www.nsstc.uah.edu/aosc/testimonials/ChristyJR_Written_151208_app.pdf
Willard: 1.
Baby steps:
https://www.nsstc.uah.edu/aosc/testimonials/ChristyJR_Written_151208_app.pdf
Vintage 2015-12-08.
Contrarians have a tiny bench.
More baby steps:
https://www.nsstc.uah.edu/aosc/docs/ChristyJR_SenateEPW_120801.pdf
Vintage 2012-08-01.
Willard: More 1.
Baby steps:
https://www.youtube.com/watch?v=XZzYAAB0nkU
Vintage 2011-03-31.
Tiny tiny tiny bench.
Still at 1. Idiot.
“UAH and RSS are the only satellite data sets that provide global temperature anomaly data.”
AIRs does too. But tis record is still quite short.
https://climatedatablog.files.wordpress.com/2021/08/airs7.jpeg
Ken
I’ll answer a bit more about this post later on.
1. You forgot to mention NOAA’s STAR time series (close to UAH 6.0, but observing TMT and not TLT, he he):
ftp://ftp.star.nesdis.noaa.gov/pub/smcd/emb/mscat/data/MSU_AMSU_v3.0/Monthly_Atmospheric_Layer_Mean_Temperature/Global_Mean_Anomaly_Time_Series/
*
When you speak about balloon data, you ignore that they mean a very small, restricted subset of the worldwide IGRA network (over 1500 units), namely the RATPAC subset, consisting of 85 (EIGHTY FIVE) units:
https://tinyurl.com/ebbu63sz – thanks, tinyURL!
RATPAC is highly homogenized using techniques (RICH, RAOBCORE) developed over a decade ago at the Vienna University by Leopold Haimberger and team.
Their work was strongly influenced by satellite data, he he.
NOAAs STAR time series tracks RSS not UAH really.
“Diurnal drift effect in TMT was corrected using the scaled RSS model-based diurnal anomaly datasets (Mears et al. 2003, ftp://ftp.ssmi.com/msu/data/diurnal_cycle/). For MSU, A scaling factor of f=0.875 was used to multiply the RSS MSU channel 2 diurnal anomaly dataset to minimize the intersatellite differences
over land for a best merging. For AMSU-A, a scaling factor of f=0.917 was used to multiply the RSS AMSU-A channel 5 diurnal anomaly dataset to minimize the intersatellite differences over land for a best merging.”
Another issue regarding the comparisons of the UAH data with the balloon records results from the fact that the UAH data is an average over a wide range of altitude, whereas the balloon data is taken at discrete points in pressure level. To compare these two data types, the balloon data must be processed with a model to simulate the “bulk” emissions as measured from orbit.
For the UAH, the ever favorite LT product is created from three separate channels of data, the process uses a model based algorithm to combine those three data sets. The resulting equation for the LT is applied for all latitudes and seasons, which is dubious, IMHO, given the considerable changes in the atmosphere between seasons at extra tropical latitudes. The one-size-fits-all equation may be based on another model of temperate atmospheric conditions, the US Standard Atmosphere, though Roy and John haven’t made that clear in their writings. If the UAH LT is “tuned” for the mid-latitudes, the result may not accurately represent tropical or polar trends. Worse, it’s well known that the high altitudes over the Antarctic result in a strong influence on the MT and especially the LT, but this problem is ignored by UAH.
To my mind, there’s considerable uncertainty regarding the satellite data. I challenge anyone to provide a convincing analysis to favor one satellite record over the other three.
That all depends if you just treat the series as being consistent with themselves or if you are trying to determine the ‘true temperature’ instead.
“To my mind, there’s considerable uncertainty regarding the satellite data. I challenge anyone to provide a convincing analysis to favor one satellite record over the other three.”
Habibullo Abdussamatov is a wise man with regards to the climate. He knows that CO2 is a bit player. The Russians don’t have the same political interference. Their climate model is projecting the lowest warming and closely matches UAH.
UAH also matches Radiosonde more closely than the others.
So we have two analysis that favor UAH over other data sets.
Ken
” UAH also matches Radiosonde more closely than the others. ”
Why do you tell that again?
This NOT TRUE.
UAH matches ONLY those radiosondes whose data was homogenized to better fit to… satellite data.
But even that isn’t enough.
Look at this graph I made out of RATPAC-B at 700 hPa (the atmospheric pressure closest to UAH), RSS 4.0 LT and UAH 6.0 LT:
https://drive.google.com/file/d/1zR6wh8k4vZWYVpkwbnJD7fh4aF5sY_Co/view
You can clearly see that UAH shows, wrt RATPAC-B and RSS4.0, a downdrift like in many similar comparisons.
See the paper. It says Radiosonde and UAH are close.
UPDATE ON MICROWAVE-BASED ATMOSPHERIC TEMPERATURES FROM UAH
John R. Christy, Roy W. Spencer and Daniel Braswell
University of Alabama in Huntsville, Huntsville, Alabama USA
Ken, Your paper appears to be from a conference in 2004. I don’t find evidence that it was published or peer reviewed. That period was still version 5.x, not the present version 6. The data mentioned ended with 2001, so the AMSU data had not been added. The last version 5.6 indicated greater warming than the present 6.0.
Do tell us, which version was more accurate and why do you think so.
Well this
https://www.drroyspencer.com/2015/04/version-6-0-of-the-uah-temperature-dataset-released-new-lt-trend-0-11-cdecade/
is what Roy published about v6.0 when it was released.
Do you have any specific questions about it that were not addressed at that time?
Here could be one:
https://www.drroyspencer.com/2015/04/version-6-0-of-the-uah-temperature-dataset-released-new-lt-trend-0-11-cdecade/#comment-190723
Was the code for UAHv6 ever published?
You can read about it at https://www.drroyspencer.com/wp-content/uploads/Version-61.pdf
Willard: April 30, 2015 at 4:12 PM
https://www.drroyspencer.com/wp-content/uploads/APJAS-2016-UAH-Version-6-Global-Satellite-Temperature-Products-for-blog-post.pdf
Willard: 1.
https://link.springer.com/article/10.1007/s13143-017-0010-y
“UAH Version 6 global satellite temperature products: Methodology and results”
Published: 07 March 2017
https://www.researchgate.net/publication/314265190_UAH_Version_6_global_satellite_temperature_products_Methodology_and_results
“UAH Version 6 global satellite temperature products: Methodology and results”
Ken
You really don’t know much about those radiosondes which were said ‘fitting well to satellites’.
I perfectly recall a paper by Christy and al. dated 2006, where they explained to have isolated 31 radiosondes (most of them in the US, and a few ‘US controlled’ outside, on some Pacific islands.
The paper described how the data of these radiosondes was analyzed and subsequently ‘homgenized’ with… satellite data.
I extracted these 31 units out of the IGRA data set (probably in 2015) and their average showed on all 13 atmospheric levels (from 1,000 hPa down to 30 hPa in the lower stratosphere) trends even lower than those of the 85 RATPAC-B station data.
Thus please stop telling me how good UAH and radiosondes ‘fit together’.
I get a big, big laugh.
RLH, I read those papers when they were published. That’s the reason I have repeatedly expressed concerns such as the ones I gave above. As Barry pointed out, there was much left out of their description, which the layman reader (that includes you) would not be aware of.
Here’s another example for you to chew on. How do S & C make the transition from a 1×1 deg grid for the MSU to the final 2.5×2.5 deg array product, a non-integer transformation. And, why didn’t they continue this process with the AMSU data? Better yet, why didn’t they just keep the 1×1 grid array and then use the 1×1 deg grid for the higher resolution AMSU data? One would think that the resulting division of the array into land and ocean areas would have been much more accurate.
Have you asked them?
RLH, I would prefer that they provide answers to my question(s) in public. So far, I’ve had few replies from Roy to my repeated questions posted on this forum. My comment up thread is one such example, posted on the second day after the new monthly data was posted.
Perhaps Roy is repulsed by all the troll poop which appears around here.
RLH,
I’ve read al those documents, thanks. Here is the full paper BTW.
https://sci-hub.se/https://doi.org/10.1007/s13143-017-0010-y
None of those docs provide the code, nor indicate where it may be found.
You asked,
“Well this
https://www.drroyspencer.com/2015/04/version-6-0-of-the-uah-temperature-dataset-released-new-lt-trend-0-11-cdecade/
is what Roy published about v6.0 when it was released.
Do you have any specific questions about it that were not addressed at that time?”
Yes. The request for the code was made then and many other times before and since.
This is the same request made of other temperature data set providers, and all their code is online so that other scan test and use it.
Not so for UAH.
“The request for the code was made then and many other times before and since.”
Do you have any founded reason to believe that the treatment they use (which they have described in their methodology) is wrong?
Do you have any actual, real, evidence to support your claim?
RLH asks:
Sure. The early years of the MSU channel 3 data exhibited many days of missing data, which UAH noted in their earlier work. That’s one reason that the RSS’s channel 3 series, aka: TTS, excludes data before 1987. But, the UAH analysis somehow produces a complete series for TP, in spite of the missing data. Of course, the TP series is a major component of the calculation for LT, so any fudging of the TP would also impact the LT series as well.
“The early years of the MSU channel 3 data exhibited many days of missing data, which UAH noted in their earlier work.”
So from that you conclude that the whole of their data is more suspect than RSS. Despite RSS using a plainly out of range satellite around 2000-2005.
RLH wrote:
The RSS V4 data included both NOAA-14 from July 1995 thru
Dec 2004 and NOAA-15 data from and August 1998 thru Dec 2010. Problems with NOAA-14 have been well studied over the years. You might want to read Mears & Wentz (2009a) for an example of the extensive efforts to merge the data sets. They also address the NOAA-9 “warm target” problem, which is another difference between RSS and UAH.
As I have said earlier, before 2000 and after 2005 both RSS and UAH agree with each other quite well.
https://woodfortrees.org/plot/uah6/to:2000/offset:0.2/plot/rss/plot/uah6/from:2005/offset:0.45
RLH, Your graph does not provide an explanation for the apparent jump, which could be in either time series. Two can play the graphing game:
https://woodfortrees.org/plot/uah6/to:2002/trend/offset:0.266/plot/rss/to:2002/trend/plot/uah6/from:2002/trend/offset:0.37/plot/rss/from:2002/trend
Both periods show RSS with a larger warming trend than UAH.
Both periods show RSS with a slightly larger warming trend than UAH.
I guess the next few years will show who is correct.
RLH,
“Do you have any founded reason to believe that the treatment they use (which they have described in their methodology) is wrong?
Do you have any actual, real, evidence to support your claim?”
What the hell are you talking about?
You asked if there were any unanswered questions regarding the latest major revision to UAH. I replied that they don’t make the code available. Other groups do.
I don’t have the skill to check their work. Consequently, I am unable to say which data have more fidelity to the property being measured. Imagine what I surmise about you when you challenge me to defend a “claim” I never made.
You seem to think that UAH are superior for some reason. It’s patently obvious that you also don’t have the skill to determine the validity of one data set against another. How about adopting a more reasonable and appropriately modest view and simply cease prefer one over another? Would it kill you to operate within your limits? Meanwhile, it just looks like bias from you.
“UAH data is of prime importance in determining if and by how much global temperatures are changing.”
UAH data represent a small period of time — 42 years — in the past — that has no predictive value for the next 42 years …
Just like the temperature trend from 1910 to 1940 did not predict the temperature trend from 1940 to 1976 …
And the temperature trend from 1940 to 1975 did not predict the temperature trend from 1975 through 2020.
In addition, the “pause” (flat trend) from 2003 to mid-2015 did not predict the warming from mid-2015 through 2020.
H,
If that is your best attempt at a “gotcha”, you need to work a little harder.
Climate is the statistics of weather. No need for research, dummy.
Try again. Maybe you could ask if Michael Mann’s IQ is lower than Gavin Schmidt, or not.
What is your opinion? It would be nice if you could provide a link in support.
Idiot!
Mike Flynn,
Metamorphosis Facultative.
tim f…”ALL data has uncertainly! This is not discrediting the data, merely agreeing with Dr. Roy ”
***
Understood, I took university lab classes as well and had to state error margins for recorded data. We called them error margins (+/-) to indicated an acceptable error.
Confidence levels are a different matter altogether. They are normally guestimates used in statistical theory to offer a probability the observations from the data have the stated degree of accuracy.
There is no need for such probability with real data. You don’t measure a length with an error margin of +/- 0.001 metres then claim your measurement is ‘likely’ accurate, with such and such a confidence level. You have already stated it is accurate, not likely accurate.
Confidence levels are employed when there is doubt, such as the stupid claims by GISS and NOAA that 2014 was the hottest year ever. Was it or wasn’t it? If you need to offer a 0.48 (NOAA) or 0.38 (GISS) probability that it was the hottest year then you’re a bs. artist abusing statistics to tell a lie.
I always envy you lab based physicists, with your stable environments and instruments that measure to much greater precision than the variability in what you measure.
You might be able to measure the length of a 100mm steel rod to +/-0.001mm in the lab.
Perhaps it would do you good to mount the same steel rod on the deck of a ship and measure its length every hour during a voyage from Australia to Norway via the Arctic.
Temperature changes alone would make the length a variable. I hope your measuring instrument is durable enough to withstand tropical cyclones and blizzards, and can still measure to +/-0.001mm under all field conditions.
Temperature compensation of +/-0.001mm over, say, 30.0c to -30.0c is not trivial.
There are three types of numbers used in global average temperature compilations — a statistic, not a measurement.
Actual measurements (real data)
Adjusted measurements (not real data — an estimate of what the actual measurements would have been if done correctly)
Infilled numbers (not real data — guesses of what the measurements would have been, if there had been any measurements)
Infilling can not be verified by later measurements, so remains the weak link for surface data.
But also a much smaller weak link for satellite data.
Infilling for satellite data is roughly 5%, and for surface data is at least 20% ( please provide a current percentage if you have one — this doesn’t get media coverage ! )
Perhaps even more important than adjustments and infilling is the integrity of the scientists doing the statistical compilations.
My vote is to trust UAH more than the others.
In addition to the potential for distortions of reality by infilling, surface temperatures have insufficient land surface coverage before 1950 and insufficient sea coverage before the use of ARGO floats about 20 years ago.
There is, no doubt the average temperature is warmer than in the cold late 1600s, but the measurement precision has been weak before the 1950s.
Not that measurements of the past climate can be used to predict the future climate, as I discussed in a prior comment.
So whether the correct warming trend since the 1970s was +0.13 degrees per decade, or +0.15 degrees C. per decade, doesn’t matter that much. Although the arguments here seem endless.
The need to acknowledge Nyquist in both time and space should not be ignored, even for areas where you have coverage.
> Nyquist
DRINK!
1.
Whenever the eastern Pacific is cool and La Nina develops the risk of hurricanes in the western Atlantic increases. This is because high pressure remains over the cooler ocean, which directs hurricanes in the Gulf of Mexico to the north.
https://www.tropicaltidbits.com/analysis/ocean/nino12.png
https://i.ibb.co/09rjsQ7/cdas-sflux-ssta-epac-1.png
High surface temperatures in the western Atlantic continue to be seen, which could provide energy for hurricane development.
https://www.tropicaltidbits.com/analysis/ocean/cdas-sflux_sst_atl_1.png
I use
https://coralreefwatch.noaa.gov/data/5km/v3.1/current/animation/gif/ssta_animation_30day_large.gif
to get an impression of what is happening at sea,
Arctic is 0,83C above.
I have another source: http://ocean.dmi.dk/arctic/meant80n.php
Conflicting information that requires explanation.
This is a signal of a drop in stratospheric temperature above the 65th parallel.
https://i.ibb.co/614BwQn/01mb9065.png
That is normal.
For H2O the latent heat of fusion is 80 times larger than the specific heat of water.
When the Arctic goes above 0C the extra heat goes into melting ice rather than warming air and water.
Summer temperatures above 80N in Summer will not go much above 0C until most of the Arctic ice melts.
In a few months, the temperature anomaly of the troposphere will drop to 0 C. All it takes is for the anomaly in the Arctic to drop.
http://www.bom.gov.au/climate/model-summary/archive/20210831.nino_summary_4.png
It does take while for sea surface temperatures to reflect in the air above them but essentially yes.
I should point out that one is tropics centered (ENSO) and the other a global figure (UAH).
Eben
Perhaps your God heard your complaint that Henri didn’t hit New York hard enough and gave you Ida?
https://www.bbc.co.uk/news/world-us-canada-58417442
For those interested, I have a comparison of trends for:
GISS Model-E versus ERA5/Raob/MSU here:
https://climateobs.substack.com/p/vertical-profiles-of-climate-change
(See figures 5a,5b,5c,5d,5e)
UAH MSU tends to be broadly consistent with model/reanalysis/raob/RSS in: 1)stratospheric cooling, 2) tropospheric warming, 3)Arctic maxima.
The observations and reanalysis diverge from the model in the ‘hot spot’.
The MSU layer heights are approximations only for comparison of relative trends with height.
For the relatively brief twenty-first century, there is some indication of greater than modeled warming and consistent warming of the hot spot region.
It is possible that the twenty-first century has coincided with increased absorbed solar radiation, the subject of an upcoming post.
“The changes of cloud cover are not particularly well measured. Clouds can have very brief lifetimes of changing morphology and constituency. The discrepancies between the model and reanalysis of cloud cover changes mean that both cannot be accurate, and that we cannot preclude both from being inaccurate. Because cloud cover largely determines the amount of solar energy earth absorbs, we do not know how much of earth energy balance is determined by greenhouse gas forcing in comparison to perhaps natural fluctuation of cloud cover.”
Climate Observer
Thanks, interesting at a first glance, well worth a second, deeper reading.
Lasse
” Conflicting information that requires explanation. ”
There is no real conflict visible so far, because you can’t compare DMI’s data with UAH’s data for several reasons.
1. UAH observes the lower troposphere at an altitude of about 4 km, with a mean global temperature of about 264 K.
2. UAH’s Arctic region is 60N-82.5N
3. These 0.83 C are the difference, for the month August, of 2021 compared with the mean of all August months between 1991 and 2020 as reference period.
4. But DMI shows on this page (the English version is better I think)
https://tinyurl.com/4xe6fhte
that:
– they consider only temperature data measured above 80N;
– their reference period is 1958-2002.
5. DMI’s data is based on reanalysis, is thus indirect data; UAH evaluates brightness measurements directly.
Thus, everything is different.
*
Satellite observation from the spacecrafts used by NOAA don’t allow for daily series like that provided by DMI.
Here is therefore a monthly comparison of a few years with the mean for 1991-2020, using absolute data reconstructed out of UAH anomalies and climatology (August 2021 is not available yet in the grid data):
https://tinyurl.com/cvyan36h
Though differing by much, the series nevertheless show some coherence, especially when we compare 2020/21 with 1979!
I don’t recall the place in polarportal.dk where to find the data source; otherwise I would have superposed it above the UAH series:
https://tinyurl.com/4u6uh4p2
Then we could really compare the two.
*
Anyway, the DMI graph below perfectly shows the situation in the Arctic:
https://tinyurl.com/2k66vv7s
no warming during the summer, very well during the winter.
looks like some profit-taking this month, as investors reap the recent mini-rally… does this bull market have legs? keep an eye on the La Chupacabra index, as well as Atlantic Meridianal gold flows
but look guys, bottom line, despite all the hype to the contrary, this stock is a loser — has never met the gaudy cash flow projections of analysts at HansenGiss or Ipcacack
and they STILL keep saying it’s going to take off any day now, flood the whole market
“oh sure the stock underperforms the S&P 500 by around 1000% percent over its lifetime, but they’re turning the corner now! things are looking up! way up! they’ll be the hottest thing ever!”
be serious guys, no stock that recently traded below its 1988 high is doing well, okay? there are SERIOUS management problems
A new management would indeed be a good idea for we need better contrarians:
https://agupubs.onlinelibrary.wiley.com/doi/abs/10.1029/2019GL085378
The models are so accurate. Not.
“Because cloud cover largely determines the amount of solar energy earth absorbs, we do not know how much of earth energy balance is determined by greenhouse gas forcing in comparison to perhaps natural fluctuation of cloud cover.”
Even those who support them agree they are running too hot.
Zeke still found that climate models published over the past five decades were skillful in predicting subsequent GMST changes, dummy.
If you want accuracy, check out my One-Trick Pony algorithm.
Weird Wee Willy,
“Zeke still found . . . ”
Are you sure Zeke would be capable of finding his bum – even if he used both hands?
He’s as dim as you – not the brightest bulb in the box. Just another self promoting climate crackpot.
Mike Flynn,
Meek Fencer.
Ask him.
Woebegone Wee Willy,
So you’re not sure that Zeke could find his bum using both hands?
I didn’t think so, dummy.
How about you? Smarter than Zeke, are you? That wouldn’t be hard – well, for any rational person, anyway. I’m not sure about you.
Who do you respect more, Gavin or Zeke? With reasons.
https://www.science.org/news/2021/07/un-climate-panel-confronts-implausibly-hot-forecasts-future-warming
“U.N. climate panel confronts implausibly hot forecasts of future warming”
“In advance of the U.N. report, scientists have scrambled to understand what went wrong and how to turn the models, which in other respects are more powerful and trustworthy than their predecessors, into useful guidance for policymakers. “It’s become clear over the last year or so that we can’t avoid this,” says Gavin Schmidt, director of NASA’s Goddard Institute for Space Studies.”
The Only Trick of Roys One-Trick Pony (v.3):
0. Almost suggest something relevant;
1. When challenged, brag;
2. When pinned down, Just Ask Questions;
3. When countered, try to insult
1.
I admit of course that sometimes, I look for texts convincing me, and post them in the hope their contents might convince others.
But… why looking for potentially nebulous texts, when you have true data at hand?
Thus I wonder why persons commenting here think they can write:
” NOAA’s STAR time series tracks RSS not UAH really. ”
just because they found a text matching their subjective impression, instead of first looking at the true data available:
1. UAH 6.0 LT
https://tinyurl.com/2h5w8uy5
2. RSS 4.0 LT
https://tinyurl.com/4ccnz7yh
3. NOAA STAR MT
https://tinyurl.com/4amyaz5e
*
Isn’t it more appropriate to first look at available data, and to compare it using tools whose reliability is known since 40 years?
https://drive.google.com/file/d/1MkiR2sdBUxUWWkfNZp5LjjOyDN2-q7C_/view
Even if here, eye-balling clearly shows a lot, the linear estimates for 1979-now, in C / decade, explain it best:
UAH TLT: 0.13
NOAA TMT: 0.16
RSS TLT: 0.22
” NOAA’s STAR time series tracks RSS not UAH really. ”
Yeah.
Oh. I forgot to mention a further estimate
UAH TMT: 0.10
Tout le monde a compris, n’est-ce pas?
There own readme in their own words says so.
“Diurnal drift effect in TMT was corrected using the scaled RSS model-based diurnal anomaly datasets (Mears et al. 2003, ftp://ftp.ssmi.com/msu/data/diurnal_cycle/). For MSU, A scaling factor of f=0.875 was used to multiply the RSS MSU channel 2 diurnal anomaly dataset to minimize the intersatellite differences
over land for a best merging. For AMSU-A, a scaling factor of f=0.917 was used to multiply the RSS AMSU-A channel 5 diurnal anomaly dataset to minimize the intersatellite differences over land for a best merging.”
But what do I know. I just take their own words.
Missed one.
There own readme in their own words says so.
Diurnal drift effect in TMT was corrected using the scaled RSS model-based diurnal anomaly datasets (Mears et al. 2003, ftp://ftp.ssmi.com/msu/data/diurnal_cycle/). For MSU, A scaling factor of f=0.875 was used to multiply the RSS MSU channel 2 diurnal anomaly dataset to minimize the intersatellite differences
over land for a best merging. For AMSU-A, a scaling factor of f=0.917 was used to multiply the RSS AMSU-A channel 5 diurnal anomaly dataset to minimize the intersatellite differences over land for a best merging.
But what do I know. I just take their own words.
Ha ha haaah
Until now, no one was able to post a graph showing my bad boy’s crazy manipulation.
Here it is:
https://drive.google.com/file/d/1M0NtcZ2NGkBM6MBQkpH1zJABGpClR1D_/view
Now indeed, we see NOAA STAR nearer to RSS than to UAH:
UAH TMT: 0.10
RSS TMT: 0.14
NOAA TMT: 0.16
But this does not change much to the fact that UAH TLT looks more like a TMT series.
Until now, I didn’t care much about AIRS.
Maybe we should add it to the UAH LT / RRS LT pair, in order to see how the three look like?
So you are not interested in what NOAA STAR say about their own figures. I’m sure you know best.
“Maybe we should add it to the UAH LT / RRS LT pair, in order to see how the three look like?”
That would be something useful.
Though why you choose 36 month running means escapes me.
USCRN data is freely available to all who want it.
So is BoM raw data
That was a misplaced reference to someone saying that ‘if only they could get their hands on USCRN data’.
Rightyo then.
barry…”So is BoM raw data…”
***
Come on, Barry, no one is interested in second hand, fudged NOAA data.
barry
I get a big laugh when I see the Ignoramus Robertson one more time boasting about
” … in second hand, fudged NOAA data “.
He is so stupid and ignoŕant that
– he even does not understand that BoM manages its own data, which is subsequently used by NOAA (e.g., in GHCN daily)
and
– suprisingly never speaks about fudged data when that same data is used by e.g. John Christy!
Yes, Gordon once again is totally wrong. Raw data for Australian weather stations are available online via BoM. BoM provides data to NOAA, not the other way around.
The guy is an idiot.
NIWA also publicly provide raw data from stations that have not moved.
https://niwa.co.nz/our-science/climate/information-and-resources/nz-temp-record/temperature-trends-from-raw-data
GLOBAL COOLING UPDATE
The number of weather, climate and water extremes are increasing and will become more frequent and severe in many parts of the world as a result of climate change, said Mr. Taalas. That means more heatwaves, drought and forest fires such as those we have observed recently in Europe and North America.
More water vapor in the atmosphere has exacerbated extreme rainfall and flooding, and the warming oceans have affected the frequency and extent of the most intense tropical storms, the WMO chief explained.
WMO cited peer-reviewed studies in the Bulletin of the American Meteorological Society, showing that over the period 2015 to 2017, 62 of the 77 events reported, revealed a major human influence at play. Moreover, the probability of heatwaves has been significantly increased due to human activity, according to several studies done since 2015.
The Atlas clarifies that the attribution of drought events to anthropogenic, or human, factors, is not as clear as for heatwaves because of natural variability caused by large oceanic and atmospheric oscillations, such as El Nio climate pattern. However, the 2016-2017 East African drought was strongly influenced by warm sea-surface temperatures in the western Indian Ocean to which human influence contributed
https://news.un.org/en/story/2021/09/1098662
The globe has indeed been cooling lately/ For the last few years or so. Get over it.
We’ll tell you when we’ll have the Doritos conversation, Richard.
Willard: 1.
willard…”The number of weather, climate and water extremes are increasing and will become more frequent and severe in many parts of the world as a result of climate change, said Mr. Taalas”.
***
Propaganda, Willard, propaganda.
The UN has been butt-kissing since the 1960s, trying to create a world government so they can divert tax funds to poorer nations. Noble sentiment, but there’s no need to do it via the perversion of science.
Where is the UN now, as Afghani’s struggle to deal with the oppression of the Taliban? That’s their primary mandate, world peace. Why are they wasting everyone’s time spreading propaganda about a non-existent climate crisis?
The UN was hoodwinked into accepting the catastrophic global warming fraud by UK PM Margaret Thatcher. Besides trying to ruin the working class and sending them into poverty, she needed to sort out the UK coal mining unions. Get it, coal…emissions…global warming. More recently, Theresa May tried to hasten the UK’s decline into poverty and now Boris Hitler is trying to finish off the country by depriving Brits of their democratic freedom.
Thatcher had a degree in chemistry and she pulled the wool over the eyes of the member nations at the UN re the CAGW fraud. They fell for it and they are still trying to peddle the unvalidated climate model meme upon which the IPCC was founded.
Willie isn’t hoodwinked. He is a paid-for propagandist. Ignore his propaganda; I do.
Yet here you are, Troglodyte.
So are you. Idiot.
For “But CAGW” it’s another door, Gordo:
https://climateball.net/but-cagw/
For “But Politics” it’s another still:
https://climateball.net/but-politics/
Since all you throw is tin foil, you can’t help me improve those page.
Sorry.
Willard: 1.
Off topic. Here is youtube discussion about COVID restrictions. Data expert calls out corruption. The discussion is with Max Bernier who is leader People’s Party Canada. There is an election in Canada and Max is running but this discussion is apolitical.
There are a lot of parallels with COVID narrative and Climate Change narrative.
https://www.youtube.com/watch?v=sk9kLILgzkU
Literally nothing out of the ordinary is happening.
My city has been in lockdown for 2 months and a worldwide vaccination effort is ongoing in response to the most calamitous pandemic in 100 years.
Dunno what the fuck you’re talking about.
Whacky Wee Willy,
So the drought in Brazil is due to all that extra water vapour in the atmosphere, is it?
Or maybe not?
If illogical stupidity was an Olympic event, the podium would be too small to hold you and the rest of the climate crackpot dummies.
Carry on with your nonsensical links.
Mike Flynn,
Midstream Footnote.
Wrong page.
Woeful Wee Willy,
“Wrong page?”
Have you descended to new depths of obscurantism?
Or just being your usual sloppy self, perhaps.
Mike Flynn,
Mammoth Forger.
Search for “Brazil” on this page.
Wearisome Wee Willy,
No. Search for it yourself, if you want to.
Not my fault if you have the memory of a retarded goldfish. If you deny that Brazil is suffering from drought conditions, you must be a delusional climate crackpot. If you believe that the drought is due to “more water vapour . . .”, good for you!
You maybe an idiot, but at least you are in denial of reality.
Definitely no mention of Brazil. Is he suffering from delusions?
Or……
Caipirinha is Brazil’s national cocktail, made with cachaa (sugarcane hard liquor), sugar, and lime. The drink is prepared by mixing the fruit and the sugar together, then adding the liquor.
Mike Flynn,
Matchbox Flintstone.
Willard: Idiot.
The Only Trick of Roy’s One-Trick Pony (v.3):
0. Almost suggest something relevant;
1. When challenged, brag;
2. When pinned down, Just Ask Questions;
3. When countered, try to insult
1.
tim…”A careful person with a good thermometer 100 or 200 years ago could record a temperature to 0.5 C or even 0.1 C”.
***
Yes, but to make the measurement scientific they would have to include an error margin. They would not supply a confidence level that their reading was accurate.
We have to leave such chicanery to NOAA and GISS, who made absurd claims that 2014 was the hottest year ever based on a probability of 0.48 and 0.38 respectively.
You always repeat the same war stories, uncle Gordo.
Can’t you get new ones?
Don’t sell Max short:
https://www.cbc.ca/news/canada/bernier-quits-cabinet-post-over-security-breach-1.723124
Don’t sell him shorts either.
May 26, 2008
Make that 2008-05-27:
> News of Couillard’s former relationships with two criminal figures spilled into public view on May 7. She said the past three weeks have been “extremely difficult” and that she spent the first three days hunkered down behind drawn blinds.
https://www.thestar.com/news/canada/2008/05/27/he_destroyed_my_life_girlfriend_says.html
Funny that they were talking of a “girlfriend” back then.
Oh, wow. So recent.
The Only Trick of Roy’s One-Trick Pony (v.3):
0. Almost suggest something relevant;
1. When challenged, brag;
2. When pinned down, Just Ask Questions;
3. When countered, try to insult
Willard: 1.
swenson…”Not my fault if you have the memory of a retarded goldfish…”
***
We must refrain from using politically-incorrect accusations, especially if we work for the CD-C. That would be an intellectually-challenged goldfish.
If you could stop promoting conspiratorial crap, Gordo, that’d be great.
If you could stop being an idiot, that would be even better.
ken…”There are a lot of parallels with COVID narrative and Climate Change narrative.
https://www.youtube.com/watch?v=sk9kLILgzkU “.
***
Thanks, Ken, excellent video. There are parallels between covid and climate change, both are based in fear, which, as the speaker in the video claims, distorts a person’s ability to think rationally.
Yep. Both seem to get the conspiracy theorists working overtime..
Don’t sell Max short:
https://www.cbc.ca/news/canada/bernier-quits-cabinet-post-over-security-breach-1.723124
Don’t sell him shorts either.
May 26, 2008
The Only Trick of Roy’s One-Trick Pony (v.3):
0. Almost suggest something relevant;
1. When challenged, brag;
2. When pinned down, Just Ask Questions;
3. When countered, try to insult
Willard: 1.
I am not afraid of COVID or Global Warming. The data doesn’t support fear.
I am very afraid of the extraordinary popular delusions and the madness of crowds that are demanding the erosion of my rights and freedoms because of their irrational fears about COVID and Global Warming.
Its pretty clear that people making decisions about matters such as vaccine passports and carbon taxes have no clue about the science based on the empirical data.
I thought you were afraid of GLOBAL COOLING, Kennui.
You are unlikely to die of GW but to die from Covid is much more likely.
There are numerous stories of those who did not believe in Covid only for them to realize way too late that it was indeed real.
Ken said he was not afraid of COVID.
And that their were irrational fears of COVID.
He did not say COVID does not exist.
Or does not kill anyone.
Your response is weak.
Tell that to the families of those who have already died from Covid.
Odds are less than 1:10000.
I believe COVID is nasty for some people. But most of us won’t die even if we do get infected.
“Positivity rates were highest in teenagers and young adults, but hospital admissions and deaths were highest among the elderly”
Ken
I am watching your video. I think it is the same lies as already proven, by evidence, to be false. They just make assertions in total ignorance. You can believe these type of people. I reject their points.
I did have Covid last year. I was sick for 3 weeks. It is much worse than any other sickness I have ever had.
But that is just my experience with it.
There is other larger information showing how stupid these two jokers are.
https://ourworldindata.org/covid-hospitalizations
You can see hospitalization data showing how incredibly dishonest those jokers are. Please don’t think they are telling you anything but blatant lies.
They say NO EVIDENCE. What total dishonest liars they are.
If you look at my link you can see hospital rates start going up, then masking or lockdowns take place and rates drop. They stop these actions and rates go up. Really basic reality here. There lies cannot change what is real.
Also, you may not care about Covid. That is your choice. But consider the people who are working in the Health Industry. You can ignore the sick. If you or people you care about do not have it, no biggie to you. But that does not help the health care workers, they cannot ignore the reality like your lying bozos.
The Right-Wing liars have to be the worst of human nature. They know they are lying but do it anyway and lots of people end up dying that would not have to. Sick minds I think.
Norman volunteers: “I did have Covid last year. I was sick for 3 weeks.”
Trump had Covid about the same time, and was well in 3 days.
Maybe Norman just likes being sick….
Stay classy, Pup.
Clint R
It has different degrees of effect on people. Trump was given experimental drugs and was very sick.
Individual cases and the impacts on them is only one small part of the larger picture of why this is a major issue.
First it is an infectious disease. The Delta variant is much more infectious than the first strain so more people will get infected if nothing is done to mitigate. If you like reality, as you claim, look at the Hospitalization graphs and the numbers in ICU units. It grows on an exponential scale until some mitigation efforts are taken. The Health Care workers are the ones pleading with Governors to take action to lower the numbers.
Not sure what point you are trying to make. Looks really stupid as is normal for your posts.
“Norman” does not like being sick! That is why I got vaccinated so I don’t have to go through another round. But you most certainly enjoy your stupidity. You seem to enjoy swimming in a pool of stupidity and fishing in the pond to pull our ever more stupid posts. Your never ending stupidity is amazing. This blog with you, Gordon Robertson and Swenson shows how really stupid humans can be. Interesting to see, not good, but interesting.
Norman, your tangled anti-science spills over into your mis-understanding of medical issues. You don’t recognize that politicians and news media have NO understanding of reality.
At least you’ve got butt-sniffers like Dud watching out for you.
Birds of a feather, as they say….
Clint R
I thought videos of this nature were kind of made up for humor.
https://www.youtube.com/watch?v=kLDvM–1TLc
Your stupid posts make me think people really are stupid.
Your last post was a mindless waste of effort. Just stupid, not purpose, no point. Just stupid content. Endless from you it would seem.
I doubt you could post an intelligent or thoughtful comment.
You have not in hundreds of posts.
The science is that people who have been sick with COVID have better immunity than they will ever get from a vaccine. Once you have natural immunity there is no benefit from taking the vaccine.
That is a point seriously missing from the vaccine passport discussion. Canada sent a citizen back to France where she is a resident because she didn’t have a vaccine passport. She did have proof of naturally acquired immunity.
Its the ‘stupid’ in stories like this that really wind me up.
Ken
Sorry to disagree with you but real scientists and researchers are investigating this situation. They monitor the level of antibodies (for Coronavirus) in the blood.
Having been sick with the virus, a person is protected for a period of time. The researchers are finding out how long that time frame is.
https://www.genengnews.com/news/sars-cov-2-antibodies-persist-for-months-after-infection/
It does not seem to be an endless protection.
Norman, it’s always amazing how you want to pervert reality.
You tried to make this current flu worse than “evah”, by claiming you were sick for 3 weeks. I gave you an example of someone that was only sick 3 days.
So what do you do? You tried to claim it is different for everyone.
Sorry Norman, that ain’t science.
“Maybe Norman just likes being sick.”
Clint is really an overachiever at being an asshole.
Troll Nate impresses us with his incompetence and immaturity.
Nothing we haven’t seen before….
rlh…”Diurnal drift effect in TMT was corrected using the scaled RSS model-based diurnal anomaly datasets (Mears et al. 2003…)
***
If I remember correctly, the error was within the error margin stated by UAH.
That doesn’t alter the fact that they explicitly state RSS in their readme.
rlh…”That doesnt alter the fact that they explicitly state RSS in their readme”.
***
UAH and RSS worked together to solve the problem. That was in the days before RSS sold out to NOAA.
By accident, I looked at the end of a discussion up-thread between Nate and RLH.
From RLH you can – really! – read:
” ‘Cowtan calculated it correctly.’
Cowtan uses extrapolation and infilling from the actual measurements to attempt to discover the ‘true temperature’. ”
One hardly could behave more dishonest.
*
Simply because ‘extrapolation and infilling’ indeed were used by Kevin Cowtan and Robert Way in an analysis of Had-CRUT4.
You clearly can see that in their paper
Coverage bias in the Had-CRUT4 temperatures series and its impact on recent temperature trends (2014)
https://tinyurl.com/4unra7pm
*
But… what does that have to do with the work Kevin Cowtan did when Implementing his trend computer?
https://tinyurl.com/krf5uu7n
Does Genius RLH KNOW that this software is based on interpolation and infilling?
Or is he simply ‘guessing’ about that?
Anyway, this is simply below the belt. Disgusting.
*
let us look at Cowtan’s real work, best seen when comparing (global) trends (i.e., linear estimates), in C/decade, for longer vs. shorter time periods (sorted by decreasing SE).
1. 1980 – now
RSS 4.0 LT: 0.215 ± 0.052
Karl 2015 (global): 0.163 ± 0.048
UAH 6.0 LT: 0.135 ± 0.050
GISS surf: 0.189 ± 0.038
NOAA surf: 0.166 ± 0.037
Had4CWKrig: 0.186 ± 0.035
BEST surf: 0.194 ± 0.031
2. 2000 – now
Karl 2015 (global): 0.141 ±0.164
RSS 4.0 LT: 0.231 ± 0.134
UAH 6.0 LT: 0.157 ± 0.128
NOAA surf: 0.199 ± 0.120
Had4CWKrig: 0.208 ± 0.102
GISS surf: 0.229 ± 0.100
BEST surf: 0.228 ± 0.082
The data sets in the list, completed with infilling were:
– Had4CWKrig
– Karl 2015 (global).
*
We all can see here the difference between
– Cowtan’s trend computation work, taking account of lots of things which matter when ‘trend’ing time series (beginning with autocorrelation)
and
– the rather simple job done by Excel and the like (where trends for 2000-now are similar, but with vanishing SE compared with Cowtan’s).
*
In a previous thread, RLH proudly claimed: ‘I learned statistics’.
Maybe he did.
But in superficially discrediting the work done by others (instead of scientifically contradicting that work), he seems to be much better than in statistics.
Are you going to contest that ‘slope error’ needs to be considered when doing a simple OLS trend on measurement data?
The slope may be between the upper or lower ends of the data, (2 ways) but beyond that nothing is known. Certainly it does not add a ‘curve’ as described.
The ‘ends’ of the data are no less well known than the ‘middle’.
The slope may be between the upper or lower ends of the data plus the uncertainty.
RLH
One more time, you hide what you wrote behind other things.
I guess you would rather like to die than to express an apology to your poorish lie concerning Dr Kevin Cowtan’s work.
By the way, RLH: this guy knows about 1,000,000 time more about statistics than you could ever learn till death.
I note what you say and give it an appropriate weighting.
Alternatively you could suggest that simple straight lines are not a solution and that something else, like low pass filtering, is more appropriate for ‘natural’ data.
Instead of endlessly boasting you pseudo-knowledge about slopes, I propose you to LEARN:
https://moyhu.blogspot.com/2013/09/adjusting-temperature-series-stats-for.html
“the best remedy is to instead use, say, annual averages. Little information will be lost, and the autocorrelation will reduce.”
I wonder why I use 12 month gaussian filters (at least) in all my work. Must be by accident.
P.S. No information is ‘lost’ by bandpass pass filtering unless you decide to discard one of the bands. And that is then down to you not the methodology.
So you agree that the ‘ends’ are less certain than the ‘middle’ Interesting.
As others put (better than me)
“The reality is that any measure of standard error and associated confidence limits is a function of the assumed statistical model. As such it is an assumption-based estimate. In contrast, the monthly and 13-month moving averages are point measures that are a function of what was actually measured. There will be errors in those measurements but no statistical technique can tell you what those errors might be. In fact, all of the statistical measures assume the measurements themselves were made without error. In contrast, the statistical analysis is all about trying to estimate the extent to which the natural and real variability in the system over time as measured is fundamental to the real system or simply due to random chance.”
Sorted out how to do daily averages yet and why double rounding is considered so bad?
I have the daily profiles for the USCRN data now. Interested?
WBAN,Name,Latitude,Longitude,Elevation,Mean,Average,Difference
04140,”Montana Department Fish, Wildlife & Parks, Judith River WMA”,46.88,-110.28,5070,4.78,5.47,0.69
53139,Death Valley National Park (Stovepipe Wells Site),36.6,-117.14,84,25.49,26.13,0.64
96404,”FWS, Tetlin National Wildlife Refuge (Seaton Roadhouse site)”,62.73,-141.2,2000,-1.73,-1.17,0.56
04136,”US Fish & Wildlife Service, Turnbull NWR (Headquarters Site)”,47.41,-117.52,2267,7.32,7.85,0.52
53154,”U.S. Army, Yuma Proving Ground (Redbluff Pavement Site)”,32.83,-114.18,620,23.47,23.99,0.52
…
92827,Archbold Biological Station,27.15,-81.36,150,22.9,22.22,-0.68
04237,Olympic National Park (Bishop Field Site),47.51,-123.81,286,10.05,9.38,-0.68
12987,Lower Rio Grande Valley NWR (La Sal Del Rey),26.52,-98.06,64,24.04,23.34,-0.7
92826,Big Cypress National Preserve (Ochopee Headquarters Vista Site),25.89,-81.31,4,24.54,23.56,-0.98
53151,San Diego State Univ`s Santa Margarita Ecological Reserve (Old Mine Road),33.43,-117.19,1140,18.87,17.51,-1.36
The Only Trick of Roy’s One-Trick Pony (v.3):
0. Almost suggest something relevant;
1. When challenged, brag;
2. When pinned down, Just Ask Questions;
3. When countered, try to insult
Willard: 1.
My browser tells me that on August,17 I posted this stuff on this blog:
https://drive.google.com/file/d/13fZbOg4aUS1zL-wQagK5R2YvPBCB3Yif/view
I still await
– your version of the graph
and if they don’t differ by more than tiny bits
– your explanation for the spatial dependencies of the two comparisons.
Others have suggested that Latitude was the answer, but they determined that it only explained a small portion of it. But, as always, you know better.
“Figure 5 suggests that the error has a latitude gradient, decreasing from positive to negative as one goes North. Indeed a regression shows a highly significant (p<0.000002) negative coefficient of 0.018 oC per degree of latitude (Table 1, Figure 6). However, other variables clearly affect DeltaT as shown by the adjusted R2 value indicating that latitude explains only 21% of the observed variance.</strong"
My memory tells me that I have posted this before but again, as always, you ignore anything that which does not meet your views.
I have the full 138 currently active stations (I removed those that have closed or are considered experimental) with Latitude, Mean and Average if you wish.
Taken from USCRNs own daily data so not subject to +/- 0.1c rounding error that using the hourly data brings as you do.
You never learn from your errors do you but continue on blindly as though others can show you nothing. Including USCRN.
RLH
OK, you seem to have good reasons not to present a graph like I did. Your decision.
I of course accept what people say about the correlation between latitude and differences between average and mean data.
NO, no and no: I do NOT know better. I look at data, that’s all.
It just appeared a bit strange to me that the inverse correlation existed between average and median data as well.
Here are the sources of the graph, for 228 USCRN stations:
1. Average minus mean aka (TMIN+TMAX)/2
https://drive.google.com/file/d/1EAOU5Agp9wfctMbPtp7vEQ2Z9_xrlZBQ/view
2. Average minus median
https://drive.google.com/file/d/1YeCrVkvcP2dw6uTl9y-89pdTlwn25BRb/view
Unluckily, we use different station names, what makes the comparison a bit difficult; but the top of your list perfectly matches mine.
Of course, I did not switch to subhourly data. With poor 16 Mbit/sec, it took me quite a while to download the hourly stuff, and that was enough.
*
I still don’t know why you keep so teachy and arrogant with your meaning:
” Taken from USCRNs own daily data so not subject to +/- 0.1c rounding error that using the hourly data brings as you do.
You never learn from your errors do you but continue on blindly as though others can show you nothing. ”
What errors?
Here is, again and again, the graph comparing my daily averaging of USCRN’s hourly data with their own daily data:
https://drive.google.com/file/d/1sbOZ6MfyYa5LllVMdPFNryucNsFiTDS1/view
I did of course not use the rounding for computations; it was just there to draw the tiny difference plot on the graph, oh Noes.
How can you tell us that these ridiculous differences would play any role?
They move from -0.07 till + 0.06 C, with the medians for negative and positive differences being -0.02 and +0.03 C.
A comparison of the two time series using ordinary least squares needs 8 (EIGHT) digits after the decimal point to show differing numbers: 0.25302598 C / year versus 0.25302603!
And you try to discredit what I do on the base of some ‘double rounding’… Wow. Sorry: that’s really poorish.
No idea what’s the matter with you.
*
Finally, you still owe a clear proof for your claim that the median is a better way to describe averages than is the mean.
I searched for many sources and all of them said: “The median is strongly recommended for highly skewed data”.
Like for example the average income.
But when you build, using your control data output for V&V, a temperature distribution for the 24 hours for two stations and the entire average of all stations, you obtain this:
https://drive.google.com/file/d/1TFosZhWOev-Xv4DyHx0j5C3XSOffWizw/view
Nothing skewed to be seen at all.
And anyway, the difference between average, mean and median when looking, for example, at DWD’s Germany data of over 600 stations is simply insignificant.
*
When will you finally present a graph showing, for the average of all USCRN stations, the difference between hourly average, median and mean?
“only 21% of the observed variance.” will give you the line you plot. Doesn’t mean that you are completely right though.
“I searched for many sources and all of them said: The median is strongly recommended for highly skewed data.
Like for example the average income.”
Like all skewed data sets, of which income may be one..
“the entire average of all stations”
You do realize that the error is nearly equally distributed with negative being favored slightly. This means that averaging them all will nearly remove the problem.
Doesn’t make it go away, just hides it so that you don’t have to worry.
Until you can come up with a solid set of reasons, you have ‘proved’ next to nothing. And, no, latitude does not cut it.
“Here is, again and again, the graph comparing my daily averaging of USCRNs hourly data with their own daily data:”
You persist in your errors don’t you. As USCRN and I have explained, the Daily and Hourly rounded data is accumulated from their 5 min periods. Rounded data (which you should never do twice) if you use them in subsequent calculations will produce exactly the ‘errors’ you see.
The Daily data is accurate. Your attempted reconstruction from Hourly figures is not.
Until you can explain why 2 stations below are so consistently different you prove nothing.
https://climatedatablog.files.wordpress.com/2021/09/04140_lewistown_42-wsw.jpeg
https://climatedatablog.files.wordpress.com/2021/09/53151_fallbrook_5-ne.jpeg
https://climatedatablog.files.wordpress.com/2021/09/uscrn-diffs-lewistown-42-wsw.jpeg
https://climatedatablog.files.wordpress.com/2021/09/uscrn-diffs-fallbrook-5-ne.jpeg
There are 138 USCRN stations that are marked as active and not closed or experimental.
04140,”Montana Department Fish, Wildlife & Parks, Judith River WMA”,46.88,-110.28,5070,4.78,5.47,0.69
53139,Death Valley National Park (Stovepipe Wells Site),36.6,-117.14,84,25.49,26.13,0.64
96404,”FWS, Tetlin National Wildlife Refuge (Seaton Roadhouse site)”,62.73,-141.2,2000,-1.73,-1.17,0.56
04136,”US Fish & Wildlife Service, Turnbull NWR (Headquarters Site)”,47.41,-117.52,2267,7.32,7.85,0.52
53154,”U.S. Army, Yuma Proving Ground (Redbluff Pavement Site)”,32.83,-114.18,620,23.47,23.99,0.52
04138,Golden Spike National Historic Site (Visitor Center Site),41.61,-112.54,4951,8.58,9.06,0.48
26563,Kenai National Wildlife Refuge (Kenai Moose Research Center),60.72,-150.44,282,1.6,2.07,0.47
03062,”NPS, Valles Caldera National Preserve”,35.85,-106.52,8716,4.82,5.27,0.46
04994,Agassiz National Wildlife Refuge (Maintenance Shop Site),48.3,-95.87,1150,3.43,3.86,0.43
96406,”FWS, Nowitna National Wildlife Refuge (Lake Site)”,64.5,-154.12,259,-0.72,-0.29,0.43
04130,Glacier National Park (St. Mary Site),48.74,-113.43,4555,4.26,4.68,0.41
03074,Jornada USDA ARS Experimental Range (Jornada Headquarters Site),32.61,-106.74,4327,15.59,15.98,0.39
94081,South Dakota School & Public Lands,45.51,-103.3,2883,6.43,6.81,0.38
96409,”BLM, Toolik Field Station”,68.64,-149.39,2461,-6.84,-6.48,0.36
53136,Nevada Test Site (Desert Rock Meteorological Lab),36.62,-116.02,3284,17.65,18.01,0.36
94645,Aroostook National Wildlife Ref. (Fire Training Area),46.96,-67.88,737,3.92,4.24,0.33
94060,Fort Peck Indian Res. (Poplar River Site),48.3,-105.1,2085,4.92,5.25,0.33
26562,Lake Clark National Park,60.19,-154.31,321,2.16,2.5,0.33
54810,Michigan State University (Upper Peninsula Experiment Station),46.33,-86.92,875,4.92,5.23,0.31
04139,”Sheldon National Wildlife Refuge, (Little Sheldon Site)”,41.84,-119.63,6500,6.42,6.73,0.31
03048,Sevilleta National Wildlife Refuge (LTER Site),34.35,-106.88,4847,14.96,15.26,0.3
04137,”Bannack State Park, Old Freight Road Site”,45.15,-113,5971,3.87,4.16,0.3
25380,”The Nature Conservancy, Gustavus Forelands Preserve”,58.42,-135.69,20,5.14,5.43,0.29
94077,Agate Fossil Beds National Monument (Visitor Center Site),42.42,-103.73,4406,7.24,7.52,0.28
94644,University of Maine (Rogers Farm Site),44.92,-68.7,127,6.43,6.71,0.28
53131,Sonora Desert Museum,32.23,-111.16,2733,21.21,21.48,0.27
04128,Northern Great Basin Experimental Range (Rainout Site),43.47,-119.69,4583,7.45,7.71,0.26
04127,ARS NW Watershed Research Cntr. (Reynolds Creek Site),43.2,-116.75,3950,9.45,9.7,0.25
54797,University of Rhode Island (Peckham Farm Site),41.47,-71.54,106,9.78,10.03,0.25
25522,”NPS, Katmai National Park (Contact Creek)”,58.2,-155.92,661,2.83,3.08,0.25
94088,”Bear Lodge Ranger Dist, Black Hills NF (Massengale Flats Site)”,44.51,-104.43,5792,5.06,5.3,0.24
26564,”Arctic Slope Regional Corporation, Ivotuk Airstrip”,68.48,-155.75,1909,-7.22,-6.98,0.24
64758,Cornell University (Harford Teaching & Research Center),42.44,-76.24,1228,7.71,7.95,0.23
94084,Des Lacs National Wildlife Refuge (HB-4 Site),48.96,-102.17,1842,3.45,3.67,0.23
25711,NOAA National Weather Service St Paul,57.15,-170.21,20,1.91,2.13,0.22
54903,Necedah National Wildlife Refuge (Rynearson Dam No. 2),44.06,-90.17,933,7.6,7.81,0.21
54796,University of Rhode Island (Plains Road Site),41.49,-71.54,115,10,10.2,0.2
23583,”City of Aleknagik, Aleknagik Airport”,59.28,-158.61,80,1.31,1.5,0.19
94075,Mountain Research Station INSTAAR Univ. of CO (Hills Mill),40.03,-105.54,9828,1.91,2.11,0.19
26655,NANA Regional Corp Red Dog Mine,68.02,-162.92,942,-3.32,-3.13,0.19
54932,Audubon Center of the North Woods,46.11,-92.99,1130,5.62,5.79,0.18
56401,”BLM, Paxson Airport”,63.02,-145.5,2669,-1.83,-1.64,0.18
94078,Nature Conservancy (Red Canyon Ranch),42.67,-108.66,5773,7.94,8.12,0.18
96405,”Eyak Corporation, Cordova”,60.47,-145.35,83,5.15,5.32,0.17
64756,Institute of Ecosystem Studies (Environmental Monitoring Station),41.78,-73.74,413,9.58,9.74,0.16
04126,Craters of the Moon NM & Preserve (Headquarters Area),43.46,-113.55,5920,6.39,6.55,0.16
54811,Northern Illinois Agronomy Research Center,41.84,-88.85,861,8.94,9.09,0.15
27516,NOAA Earth System Res. Lab. Observatory at Utqiagvik (formerly Barrow),71.32,-156.61,15,-9.62,-9.48,0.14
96408,”NPS, Denali National Park (Wonder Lake Campground Site)”,63.45,-150.87,2225,-0.39,-0.25,0.14
03739,Anheuser Busch Coastal Res. Ctr. Univ. of VA (Oyster),37.29,-75.92,29,15.19,15.31,0.13
26565,”AK Department of Natural Resources, Haul Road)”,70.16,-148.46,30,-6.03,-5.91,0.12
53138,Great Basin National Park (Gravel Pit Site),39.01,-114.2,6617,9.57,9.68,0.11
63855,Univ. of Tennessee (Plateau Research and Education Center),36.01,-85.13,1913,12.69,12.8,0.11
54937,”North Dakota State University, Central Grasslands (Sec. 14 Site)”,46.77,-99.47,1920,4.85,4.96,0.11
25381,”NOAA, National Weather Service (Annette Island)”,55.04,-131.58,105,8.24,8.34,0.11
96407,”FWS, Selawik National Wildlife Refuge (Cabin Site)”,66.56,-159,22,-1.41,-1.31,0.1
54795,University of New Hampshire (Thompson Farm Site),43.1,-70.94,63,8.54,8.63,0.09
04125,John Day Fossil Beds Nat`l. Mon.(Sheep Rock Hdqs.),44.55,-119.64,2245,11.75,11.83,0.09
03761,Stroud Water Research Center,39.85,-75.78,400,11.94,12.03,0.09
26494,NOAA / NESDIS (FCDAS),64.97,-147.51,1140,-0.06,0.02,0.08
93243,Kesterson Reservoir (US Bureau of Reclamation),37.23,-120.88,78,15.68,15.77,0.08
23909,”White River Trace Conservation Area (Stand 4, Compartment 7)”,37.63,-91.72,1198,12.74,12.82,0.08
26656,”FWS, Yukon Delta National Wildlife Refuge (South Volcano Lake)”,61.34,-164.07,153,0.37,0.44,0.07
54808,Univ. of Illinois (Bondville Environ. & Atmos. Resrch. Stn.),40.05,-88.37,700,10.94,11.01,0.07
54794,University of New Hampshire (Kingman Farm Site),43.17,-70.92,119,8.61,8.68,0.07
22016,Big Bend National Park,29.34,-103.2,3494,20.04,20.1,0.06
23906,Aransas National Wildlife Refuge (Weather Site),28.3,-96.82,15,21.37,21.43,0.06
13301,University of Missouri (Forage Systems Research Station),39.86,-93.14,833,11.77,11.8,0.03
03054,Muleshoe National Wildlife Refuge (Headquarters Site),33.95,-102.77,3742,14.66,14.7,0.03
94074,Ag. Res. Svc. Central Plains Exp. Range (SGS LTER at CSU),40.8,-104.75,5390,8.72,8.75,0.03
03063,USDA Comanche National Grassland,37.86,-103.82,4386,11.48,11.51,0.03
04131,Grand Teton National Park,43.66,-110.71,6466,2.94,2.96,0.02
94080,Theodore Roosevelt National Park (Painted Canyon Site),46.89,-103.37,2771,6.4,6.42,0.02
53149,”Capitol Reef National Park, Goosenecks Road Site”,38.3,-111.29,6204,10.78,10.8,0.02
63838,University of Kentucky (Woodford County Site),38.09,-84.74,891,13.15,13.16,0.01
53974,Kansas State University (Konza Prairie Biological Station),39.1,-96.6,1137,12.96,12.97,0.01
94059,Fort Peck Indian Res. (Give Out Morgan Site),48.48,-105.2,2643,5.66,5.66,0
53927,Oklahoma State University (Efaw Farm Site),36.13,-97.1,888,15.38,15.39,0
54851,North Appalachian Experimental Watershed (CRN site),40.36,-81.78,1120,10.78,10.77,-0.01
54856,”OSU, Ohio Agricultural Research & Development Center (Snyder Farm Site)”,40.76,-81.91,1102,10.59,10.58,-0.01
25382,”FS, Tongass National Forest (Yakutat)”,59.5,-139.68,26,4.53,4.52,-0.01
53155,Babbitt Ranches (Meridian Site),35.75,-112.33,5990,11.41,11.39,-0.01
63857,Sand Mountain Research / Extension (Northwest Pasture),34.28,-85.96,1152,15.38,15.36,-0.02
63869,”Auburn University, Gulf Coast Research and Extension Center”,30.54,-87.87,95,19.13,19.1,-0.03
23904,”LFST Br. Exp. Stn.,Univ.of AR, Div.of Agriculture(Field #1)”,35.82,-91.78,455,14.76,14.73,-0.03
53132,”BLM, Appleton-Whittell Research Ranch”,31.59,-110.5,4811,15.62,15.57,-0.04
04990,EROS Data Center,43.73,-96.62,1594,7.43,7.4,-0.04
94996,Audubon Society (Spring Creek Prairie Site),40.69,-96.85,1372,11.07,11.03,-0.04
63898,”Feldun-Purdue Agricultural Center, (Pasture 17 Site)”,38.88,-86.57,760,12.53,12.49,-0.04
54902,Neal Smith NWR (NOAA Station Site),41.55,-93.28,921,9.88,9.84,-0.04
54854,”National Weather Service, Gaylord”,44.9,-84.72,1461,6.27,6.22,-0.05
54933,”The Nature Conservancy (Samuel H. Ordway Prairie, Hdq. Site)”,45.71,-99.12,1957,5.89,5.83,-0.06
94995,University of Nebraska (Prairie Pines Site),40.84,-96.56,1189,10.91,10.85,-0.06
03072,”Ft. Chadbourne Foundation, (Foundation Entrance Site)”,32.04,-100.24,1997,17.78,17.72,-0.06
03733,Canaan Valley Resort State Park (Cabins Area),39.01,-79.47,3390,8.37,8.3,-0.07
53152,Univ. of California – Santa Barbara (Coal Oil Point Reserve),34.41,-119.87,18,14.95,14.88,-0.07
53926,Oklahoma State Univ. (Ag. Research Farm Site),36.11,-97.09,890,15.97,15.87,-0.09
23803,”MSU, MAFES, North MS R&E Center, (North MS Branch)”,34.82,-89.43,484,15.58,15.47,-0.1
25630,USGS Shumagin Magnetic Observatory,55.34,-160.46,240,4.97,4.86,-0.11
94085,Fort Pierre National Grassland (Chester West),44.01,-100.35,2124,8.38,8.23,-0.15
63856,Cumberland Island National Seashore (Stafford Field),30.8,-81.45,25,20.17,20.01,-0.16
92821,”NASA Kennedy Space Center, SLF Mid-Field Site”,28.61,-80.69,3,22.29,22.14,-0.16
23908,Shawnee Trail Conservation Area,37.42,-94.58,952,14.03,13.86,-0.17
25379,USGS Sitka Magnetic Observatory,57.05,-135.32,78,6.41,6.25,-0.17
94079,Gudmundsen Sandhills Laboratory (Site 1),42.06,-101.44,3740,9.06,8.88,-0.17
63849,Mammoth Cave National Park (Job Corps Site),37.25,-86.23,790,14.55,14.37,-0.18
04236,”DOI, William L. Finley NWR (East end of Field 22)”,44.41,-123.32,312,11.26,11.07,-0.19
03759,Thomas Jefferson Foundation,37.99,-78.46,1177,13.95,13.75,-0.2
63850,”University of GA, Phil Campbell Sr Natural Resource Conservation Center”,33.78,-83.38,741,17.07,16.82,-0.25
04141,South Slough National Estuarine Research Reserve (Frederickson Marsh Site),43.27,-124.31,12,10.32,10.07,-0.25
03758,Duke Forest – Duke University,35.97,-79.09,562,15.53,15.29,-0.25
03060,Black Canyon of the Gunnison National Park (Vernal Mesa),38.54,-107.69,8402,6.19,5.94,-0.25
53968,NASA (National Scientific Balloon Facility),31.77,-95.72,383,19.66,19.38,-0.28
63858,”Auburn University, Black Belt Research and Extension Center”,32.45,-87.24,193,17.91,17.62,-0.29
94082,Dinosaur National Monument (Hdq. Maintenance Site),40.24,-108.96,6062,9.68,9.38,-0.29
03067,The Nature Conservancy Kansas (Smoky Valley Ranch),38.87,-100.96,2870,11.87,11.56,-0.3
03055,OK Panhandle Research & Extn. Center (Native Grassland Site),36.59,-101.59,3266,14.02,13.72,-0.3
53960,University of Louisiana at Lafayette (Cade Farm),30.09,-91.87,35,20.15,19.84,-0.31
63831,Mississippi State University (Coastal Plain Exp. Station),32.33,-89.07,374,17.4,17.08,-0.32
03047,Sandhills State Park,31.62,-102.8,2724,19.03,18.71,-0.32
53878,NC Mtn. Horticultural Crops Res. Ctr. (Backlund Site),35.41,-82.55,2103,13.25,12.93,-0.33
63826,Clemson University (Edisto Research & Edu. Ctr.),33.35,-81.32,317,17.97,17.63,-0.33
03728,SCDNR (Santee Coastal Reserve),33.15,-79.36,9,18.62,18.27,-0.35
53150,”Yosemite National Park, (Crane Flat Lookout)”,37.75,-119.82,6620,10.23,9.88,-0.35
93245,University of California – Davis (Bodega Marine Laboratory),38.32,-123.07,63,12.05,11.66,-0.39
63829,Robert W. Woodruff Foundation (Ichauway-Dubignon Site),31.19,-84.44,156,19.39,19,-0.39
53961,Upper Ouachita National Wildlife Refuge,32.88,-92.11,88,17.7,17.31,-0.39
03061,Mesa Verde National Park (Far View Site),37.25,-108.5,8034,8.91,8.44,-0.47
63828,Robert W. Woodruff Foundation (Ichauway-George Site),31.31,-84.47,176,18.97,18.49,-0.48
04222,Whiskeytown National Recreation Area (RAWS Site),40.65,-122.6,1418,16.15,15.63,-0.51
23907,Balcones National Wildlife Refuge (Flying X Ranch),30.62,-98.08,1361,20.07,19.55,-0.52
53877,North Carolina Arboretum (Bierbaum Site),35.49,-82.61,2151,12.84,12.31,-0.53
04223,North Cascades National Park (Marblemount),48.54,-121.44,407,10.1,9.54,-0.56
92827,Archbold Biological Station,27.15,-81.36,150,22.9,22.22,-0.68
04237,Olympic National Park (Bishop Field Site),47.51,-123.81,286,10.05,9.38,-0.68
12987,Lower Rio Grande Valley NWR (La Sal Del Rey),26.52,-98.06,64,24.04,23.34,-0.7
92826,Big Cypress National Preserve (Ochopee Headquarters Vista Site),25.89,-81.31,4,24.54,23.56,-0.98
53151,San Diego State Univ`s Santa Margarita Ecological Reserve (Old Mine Road),33.43,-117.19,1140,18.87,17.51,-1.36
USCRN Stations in tab separated format.
WBAN COUNTRY STATE LOCATION VECTOR NAME LATITUDE LONGITUDE ELEVATION STATUS COMMISSIONING CLOSING OPERATION PAIRING NETWORK STATION_ID
03047 US TX Monahans 6 ENE Sandhills State Park 31.62 -102.8 2724 Commissioned 2004-01-11 19:00:00.0 Operational USCRN 1019
03048 US NM Socorro 20 N Sevilleta National Wildlife Refuge (LTER Site) 34.35 -106.88 4847 Commissioned 2004-01-11 19:00:00.0 Operational USCRN 1020
03054 US TX Muleshoe 19 S Muleshoe National Wildlife Refuge (Headquarters Site) 33.95 -102.77 3742 Commissioned 2004-04-22 20:00:00.0 Operational USCRN 1067
03055 US OK Goodwell 2 E OK Panhandle Research & Extn. Center (Native Grassland Site) 36.59 -101.59 3266 Commissioned 2004-04-22 20:00:00.0 Operational USCRN 1068
03060 US CO Montrose 11 ENE Black Canyon of the Gunnison National Park (Vernal Mesa) 38.54 -107.69 8402 Commissioned 2004-09-07 20:00:00.0 Operational USCRN 1109
03061 US CO Cortez 8 SE Mesa Verde National Park (Far View Site) 37.25 -108.5 8034 Commissioned 2006-01-05 19:00:00.0 Operational USCRN 1232
03062 US NM Los Alamos 13 W NPS, Valles Caldera National Preserve 35.85 -106.52 8716 Commissioned 2005-02-10 19:00:00.0 Operational USCRN 1138
03063 US CO La Junta 17 WSW USDA Comanche National Grassland 37.86 -103.82 4386 Commissioned 2004-09-07 20:00:00.0 Operational USCRN 1110
03067 US KS Oakley 19 SSW The Nature Conservancy Kansas (Smoky Valley Ranch) 38.87 -100.96 2870 Commissioned 2006-01-05 19:00:00.0 Operational USCRN 1231
03072 US TX Bronte 11 NNE Ft. Chadbourne Foundation, (Foundation Entrance Site) 32.04 -100.24 1997 Commissioned 2007-02-22 19:00:00.0 Operational USCRN 1130
03074 US NM Las Cruces 20 N Jornada USDA ARS Experimental Range (Jornada Headquarters Site) 32.61 -106.74 4327 Commissioned 2007-06-10 20:00:00.0 Operational USCRN 1307
03075 US NM Dulce 1 NW BIA Branch of Forestry 36.93 -107 6806 Non-comissioned 2011-03-03 19:00:00.0 Abandoned USRCRN 1650
03076 US CO Grand Junction 9 W NPS, Colorado National Monument 39.1 -108.73 5806 Non-comissioned 2014-05-31 20:00:00.0 Closed USRCRN 1651
03077 US AZ Holbrook 17 ESE NPS, Petrified Forest National Park (NADP site) 34.82 -109.89 5613 Non-comissioned 2014-05-31 20:00:00.0 Closed USRCRN 1652
03078 US CO Eads 16 ENE NPS, Sand Creek Massacre National Historic Site 38.54 -102.5 3967 Non-comissioned 2014-05-31 20:00:00.0 Closed USRCRN 1653
03079 US CO Saguache 2 WNW Saguache Municipal Airport 38.09 -106.17 7823 Non-comissioned 2014-05-31 20:00:00.0 Closed USRCRN 1654
03080 US NM Reserve 1 W FS, Gila National Forest (Reserve Ranger Station) 33.71 -108.77 5842 Non-comissioned 2014-05-31 20:00:00.0 Closed USRCRN 1655
03081 US UT Tropic 9 SE Kodachrome Basin State Park 37.51 -111.97 5895 Non-comissioned 2014-05-31 20:00:00.0 Closed USRCRN 1656
03082 US NM Carrizozo 1 W Carrizozo Municipal Airport 33.64 -105.89 5366 Non-comissioned 2014-05-31 20:00:00.0 Closed USRCRN 1658
03083 US CO Stratton 24 N Liberty School, Kirk 39.65 -102.62 4212 Non-comissioned 2014-05-31 20:00:00.0 Closed USRCRN 1660
03084 US CO Center A 4 SSW Colorado State University (San Luis Valley Research Center) 37.7 -106.14 7678 Non-comissioned 2014-05-31 20:00:00.0 Closed USRCRN 1701
03085 US AZ Bowie 23 SSE NPS, Chiricahua National Monument (NADP site) 32 -109.38 5133 Non-comissioned 2014-05-31 20:00:00.0 Closed USRCRN 1671
03086 US CO Springfield 6 WSW FS, Comanche National Grassland near Springfield 37.38 -102.71 4557 Non-comissioned 2014-05-31 20:00:00.0 Closed USRCRN 1698
03087 US NM Santa Fe 20 WNW NPS, Bandelier National Monument 35.82 -106.31 7258 Non-comissioned 2014-05-31 20:00:00.0 Closed USRCRN 1704
03088 US CO Woodland Park 14 WSW NPS, Florissant Fossil Beds National Monument 38.91 -105.26 8535 Non-comissioned 2014-05-31 20:00:00.0 Closed USRCRN 1696
03089 US CO Rocky Ford 1 ESE Colorado State University (Arkansas Valley Research Center) 38.03 -103.69 4170 Non-comissioned 2014-05-31 20:00:00.0 Closed USRCRN 1695
03090 US NM Taos 27 NW FS, Carson National Forest (Tres Piedras Ranger Station) 36.65 -105.97 8151 Non-comissioned 2014-05-31 20:00:00.0 Closed USRCRN 1692
03091 US CO Kim 9 WSW FS, Comanche National Grassland near Kim 37.21 -103.5 5870 Non-comissioned 2014-05-31 20:00:00.0 Closed USRCRN 1697
03092 US NM Raton 26 ESE NPS, Capulin Volcano National Monument 36.77 -103.98 7232 Non-comissioned 2014-05-31 20:00:00.0 Closed USRCRN 1714
03093 US CO Genoa 35 N Woodlin School 39.78 -103.51 4764 Non-comissioned 2014-05-31 20:00:00.0 Closed USRCRN 1711
03094 US NM Clayton 3 ENE FS, Kiowa and Rita Blanca National Grasslands near Clayton 36.47 -103.12 4885 Non-comissioned 2014-05-31 20:00:00.0 Closed USRCRN 1707
03095 US NM Mills 6 WSW FS, Kiowa and Rita Blanca National Grasslands near Mills 36.06 -104.35 5866 Non-comissioned 2014-05-31 20:00:00.0 Closed USRCRN 1708
03096 US CO Rifle 23 NW BLM Roan Plateau 39.76 -108.12 7550 Non-comissioned 2014-05-31 20:00:00.0 Closed USRCRN 1713
03097 US NM Mountainair 2 WSW FS, Cibola National Forest (Mountainair Ranger Station) 34.51 -106.27 6489 Non-comissioned 2014-05-31 20:00:00.0 Closed USRCRN 1716
03098 US CO Eagle 13 SSE Sylvan Lake State Park 39.48 -106.73 8605 Non-comissioned 2014-05-31 20:00:00.0 Closed USRCRN 1733
03099 US CO Craig 30 N BLM near Craig 40.94 -107.6 6518 Non-comissioned 2014-05-31 20:00:00.0 Closed USRCRN 1728
03728 US SC McClellanville 7 NE SCDNR (Santee Coastal Reserve) 33.15 -79.36 9 Commissioned 2004-01-19 19:00:00.0 Operational USCRN 1030
03733 US WV Elkins 21 ENE Canaan Valley Resort State Park (Cabins Area) 39.01 -79.47 3390 Commissioned 2004-01-11 19:00:00.0 Operational USCRN 1024
03739 US VA Cape Charles 5 ENE Anheuser Busch Coastal Res. Ctr. Univ. of VA (Oyster) 37.29 -75.92 29 Commissioned 2004-04-22 20:00:00.0 Operational USCRN 1085
03758 US NC Durham 11 W Duke Forest – Duke University 35.97 -79.09 562 Commissioned 2007-06-10 20:00:00.0 Operational USCRN 1347
03759 US VA Charlottesville 2 SSE Thomas Jefferson Foundation 37.99 -78.46 1177 Commissioned 2007-05-04 20:00:00.0 Operational USCRN 1346
03761 US PA Avondale 2 N Stroud Water Research Center 39.85 -75.78 400 Commissioned 2006-09-28 20:00:00.0 Operational USCRN 1123
04125 US OR John Day 35 WNW John Day Fossil Beds Nat’l. Mon.(Sheep Rock Hdqs.) 44.55 -119.64 2245 Commissioned 2004-06-07 20:00:00.0 Operational USCRN 1145
04126 US ID Arco 17 SW Craters of the Moon NM & Preserve (Headquarters Area) 43.46 -113.55 5920 Commissioned 2004-01-11 19:00:00.0 Operational USCRN 1021
04127 US ID Murphy 10 W ARS NW Watershed Research Cntr. (Reynolds Creek Site) 43.2 -116.75 3950 Commissioned 2004-01-11 19:00:00.0 Operational USCRN 1022
04128 US OR Riley 10 WSW Northern Great Basin Experimental Range (Rainout Site) 43.47 -119.69 4583 Commissioned 2004-01-25 19:00:00.0 Operational USCRN 1023
04130 US MT St. Mary 1 SSW Glacier National Park (St. Mary Site) 48.74 -113.43 4555 Commissioned 2004-01-11 19:00:00.0 Operational USCRN 1046
04131 US WY Moose 1 NNE Grand Teton National Park 43.66 -110.71 6466 Commissioned 2004-08-12 20:00:00.0 Operational USCRN 1107
04136 US WA Spokane 17 SSW US Fish & Wildlife Service, Turnbull NWR (Headquarters Site) 47.41 -117.52 2267 Commissioned 2007-09-27 20:00:00.0 Operational USCRN 1467
04137 US MT Dillon 18 WSW Bannack State Park, Old Freight Road Site 45.15 -113 5971 Commissioned 2007-09-27 20:00:00.0 Operational USCRN 1468
04138 US UT Brigham City 28 WNW Golden Spike National Historic Site (Visitor Center Site) 41.61 -112.54 4951 Commissioned 2007-12-18 19:00:00.0 Operational USCRN 1507
04139 US NV Denio 52 WSW Sheldon National Wildlife Refuge, (Little Sheldon Site) 41.84 -119.63 6500 Commissioned 2008-07-29 20:00:00.0 Operational USCRN 1532
04140 US MT Lewistown 42 WSW Montana Department Fish, Wildlife & Parks, Judith River WMA 46.88 -110.28 5070 Commissioned 2008-09-04 20:00:00.0 Operational USCRN 1612
04141 US OR Coos Bay 8 SW South Slough National Estuarine Research Reserve (Frederickson Marsh Site) 43.27 -124.31 12 Commissioned 2008-10-01 20:00:00.0 Operational USCRN 1610
04143 US UT Provo 22 E FS, Uinta-Wasatch-Cache National Forest (Hub Guard Station) 40.28 -111.23 7808 Non-comissioned 2014-05-31 20:00:00.0 Closed USRCRN 1746
04222 US CA Redding 12 WNW Whiskeytown National Recreation Area (RAWS Site) 40.65 -122.6 1418 Commissioned 2004-01-25 19:00:00.0 Operational USCRN 1015
04223 US WA Darrington 21 NNE North Cascades National Park (Marblemount) 48.54 -121.44 407 Commissioned 2004-01-25 19:00:00.0 Operational USCRN 1017
04236 US OR Corvallis 10 SSW DOI, William L. Finley NWR (East end of Field 22) 44.41 -123.32 312 Commissioned 2006-11-29 19:00:00.0 Operational USCRN 1234
04237 US WA Quinault 4 NE Olympic National Park (Bishop Field Site) 47.51 -123.81 286 Commissioned 2006-11-29 19:00:00.0 Operational USCRN 1233
04990 US SD Sioux Falls 14 NNE EROS Data Center 43.73 -96.62 1594 Commissioned 2004-01-11 19:00:00.0 Operational USCRN 1009
04994 US MN Goodridge 12 NNW Agassiz National Wildlife Refuge (Maintenance Shop Site) 48.3 -95.87 1150 Commissioned 2004-01-11 19:00:00.0 Operational USCRN 1039
12987 US TX Edinburg 17 NNE Lower Rio Grande Valley NWR (La Sal Del Rey) 26.52 -98.06 64 Commissioned 2004-04-22 20:00:00.0 Operational USCRN 1066
13301 US MO Chillicothe 22 ENE University of Missouri (Forage Systems Research Station) 39.86 -93.14 833 Commissioned 2005-10-26 20:00:00.0 Operational USCRN 1142
21514 US HI Mauna Loa 5 NNE Mauna Loa Obsv., NOAA Earth Systems Res. Lab.,Global Mon. Div. 19.53 -155.57 11179 Experimental Operational USCRN 1187
21515 US HI Hilo 5 S University of Hawaii Waiakea Experiment Station 19.64 -155.08 622 Experimental Operational USCRN 1186
22016 US TX Panther Junction 2 N Big Bend National Park 29.34 -103.2 3494 Commissioned 2007-06-10 20:00:00.0 Operational USCRN 1306
23583 US AK Aleknagik 1 NNE City of Aleknagik, Aleknagik Airport 59.28 -158.61 80 Commissioned 2020-10-12 20:00:00.0 Operational USCRN 1801
23801 US AL Troy 2 W Troy 31.79 -86 472 Experimental Operational Alabama-USRCRN 1552
23802 US AL Thomasville 2 S Thomasville 31.88 -87.73 350 Experimental Operational Alabama-USRCRN 1551
23803 US MS Holly Springs 4 N MSU, MAFES, North MS R&E Center, (North MS Branch) 34.82 -89.43 484 Commissioned 2008-04-03 20:00:00.0 Operational USCRN 1570
23904 US AR Batesville 8 WNW LFST Br. Exp. Stn.,Univ.of AR, Div.of Agriculture(Field #1) 35.82 -91.78 455 Commissioned 2007-02-22 19:00:00.0 Operational USCRN 1129
23906 US TX Port Aransas 32 NNE Aransas National Wildlife Refuge (Weather Site) 28.3 -96.82 15 Commissioned 2008-04-01 20:00:00.0 Operational USCRN 1387
23907 US TX Austin 33 NW Balcones National Wildlife Refuge (Flying X Ranch) 30.62 -98.08 1361 Commissioned 2008-04-03 20:00:00.0 Operational USCRN 1386
23908 US MO Joplin 24 N Shawnee Trail Conservation Area 37.42 -94.58 952 Commissioned 2007-08-02 20:00:00.0 Operational USCRN 1407
23909 US MO Salem 10 W White River Trace Conservation Area (Stand 4, Compartment 7) 37.63 -91.72 1198 Commissioned 2007-08-02 20:00:00.0 Operational USCRN 1406
25379 US AK Sitka 1 NE USGS Sitka Magnetic Observatory 57.05 -135.32 78 Commissioned 2013-07-21 20:00:00.0 Operational USCRN 1166
25380 US AK Gustavus 2 NE The Nature Conservancy, Gustavus Forelands Preserve 58.42 -135.69 20 Commissioned 2013-07-24 20:00:00.0 Operational USCRN 1780
25381 US AK Metlakatla 6 S NOAA, National Weather Service (Annette Island) 55.04 -131.58 105 Commissioned 2013-07-24 20:00:00.0 Operational USCRN 1787
25382 US AK Yakutat 3 SSE FS, Tongass National Forest (Yakutat) 59.5 -139.68 26 Commissioned 2017-09-04 20:00:00.0 Operational USCRN 1796
25522 US AK King Salmon 42 SE NPS, Katmai National Park (Contact Creek) 58.2 -155.92 661 Commissioned 2013-07-24 20:00:00.0 Operational USCRN 1788
25630 US AK Sand Point 1 ENE USGS Shumagin Magnetic Observatory 55.34 -160.46 240 Commissioned 2010-09-06 20:00:00.0 Operational USCRN 1670
25711 US AK St. Paul 4 NE NOAA National Weather Service St Paul 57.15 -170.21 20 Commissioned 2013-07-22 20:00:00.0 Operational USCRN 1143
26494 US AK Fairbanks 11 NE NOAA / NESDIS (FCDAS) 64.97 -147.51 1140 Commissioned 2013-07-22 20:00:00.0 Operational USCRN 1008
26562 US AK Port Alsworth 1 SW Lake Clark National Park 60.19 -154.31 321 Commissioned 2010-09-06 20:00:00.0 Operational USCRN 1691
26563 US AK Kenai 29 ENE Kenai National Wildlife Refuge (Kenai Moose Research Center) 60.72 -150.44 282 Commissioned 2011-09-11 20:00:00.0 Operational USCRN 1753
26564 US AK Ivotuk 1 NNE Arctic Slope Regional Corporation, Ivotuk Airstrip 68.48 -155.75 1909 Commissioned 2015-09-28 20:00:00.0 Operational USCRN 1791
26565 US AK Deadhorse 3 S AK Department of Natural Resources, Haul Road) 70.16 -148.46 30 Commissioned 2015-09-28 20:00:00.0 Operational USCRN 1793
26655 US AK Red Dog Mine 3 SSW NANA Regional Corp Red Dog Mine 68.02 -162.92 942 Commissioned 2011-09-11 20:00:00.0 Operational USCRN 1754
26656 US AK Bethel 87 WNW FWS, Yukon Delta National Wildlife Refuge (South Volcano Lake) 61.34 -164.07 153 Commissioned 2019-09-22 20:00:00.0 Operational USCRN 1800
27516 US AK Utqiaġvik formerly Barrow 4 ENE NOAA Earth System Res. Lab. Observatory at Utqiaġvik (formerly Barrow) 71.32 -156.61 15 Commissioned 2013-07-21 20:00:00.0 Operational USCRN 1007
37201 RS SA Tiksi 4 SSE Roshydromet Observatory at Tiksi 71.58 128.91 30 Non-comissioned 2018-11-05 19:00:00.0 Closed USCRN 1789
53002 US NM Artesia 2 WNW Artesia Municipal Airport 32.85 -104.45 3501 Non-comissioned 2014-05-31 20:00:00.0 Closed USRCRN 1729
53003 US NM Grants 2 S NPS, Northwest New Mexico Interagency (BLM, FS, NPS) Visitor Center 35.11 -107.83 6443 Non-comissioned 2014-05-31 20:00:00.0 Closed USRCRN 1730
53004 US UT Bluff 32 NW NPS, Natural Bridges National Monument 37.6 -109.98 6428 Non-comissioned 2014-05-31 20:00:00.0 Closed USRCRN 1731
53005 US CO Buena Vista 2 SSE Central Colorado Regional Airport 38.81 -106.12 7933 Non-comissioned 2014-05-31 20:00:00.0 Closed USRCRN 1735
53006 US AZ Amado 23 W FWS, Buenos Aires National Wildlife Refuge 31.69 -111.44 3300 Non-comissioned 2014-05-31 20:00:00.0 Closed USRCRN 1734
53007 US CO Colorado Springs 23 NW FS, Rocky Mountain Research Stations (Manitou Experimental Forest) 39.08 -105.08 7872 Non-comissioned 2014-05-31 20:00:00.0 Closed USRCRN 1736
53008 US NM Clovis 7 N Ned Houk State Park 34.51 -103.17 4316 Non-comissioned 2014-05-31 20:00:00.0 Closed USRCRN 1703
53009 US NM Ramah 9 SE NPS, El Morro National Monument 35.04 -108.36 7164 Non-comissioned 2014-05-31 20:00:00.0 Closed USRCRN 1739
53010 US UT Monticello 24 NW BLM Indian Creek 38.14 -109.61 5025 Non-comissioned 2014-05-31 20:00:00.0 Closed USRCRN 1745
53011 US AZ Tsaile 1 SSW Dine College 36.29 -109.21 7071 Non-comissioned 2013-06-23 20:00:00.0 Closed USRCRN 1741
53012 US UT Blanding 26 SSW BLM near Sand Island Recreation Area 37.26 -109.6 4390 Non-comissioned 2014-05-31 20:00:00.0 Closed USRCRN 1742
53013 US UT Cedar City 18 SSE NPS, Zion National Park (Kolob Canyons) 37.45 -113.22 5096 Non-comissioned 2014-05-31 20:00:00.0 Closed USRCRN 1743
53014 US UT Mexican Hat 10 NW BLM near Muley Point 37.25 -109.98 6364 Non-comissioned 2014-05-31 20:00:00.0 Closed USRCRN 1744
53015 US NM Hagerman 10 ESE BLM near Hagerman 33.08 -104.16 3552 Non-comissioned 2014-05-31 20:00:00.0 Closed USRCRN 1748
53016 US NM Vaughn 36 SSE BLM near Ramon 34.13 -104.93 5034 Non-comissioned 2014-05-31 20:00:00.0 Closed USRCRN 1749
53017 US NM Aztec 43 E FS, Carson National Forest (Jicarilla Ranger District) 36.74 -107.21 7024 Non-comissioned 2014-05-31 20:00:00.0 Closed USRCRN 1747
53019 US AZ Whiteriver A 1 SW BIA, Whiteriver, Fort Apache Tribe (Fire Management Facility) 33.82 -109.98 5173 Non-comissioned 2014-05-31 20:00:00.0 Closed USRCRN 1750
53022 US NM Elida 14 SW BLM near Kenna 33.8 -103.84 4313 Non-comissioned 2014-05-31 20:00:00.0 Closed USRCRN 1771
53023 US UT Spanish Valley 25 SW NPS, Canyonlands National Park (Island in the Sky) (NADP site) 38.31 -109.85 6275 Non-comissioned 2014-05-31 20:00:00.0 Closed USRCRN 1776
53024 US NM Las Vegas 6 NE Las Vegas Municipal Airport 35.66 -105.14 6847 Non-comissioned 2014-05-31 20:00:00.0 Closed USRCRN 1773
53025 US NM Hachita 7 ESE BLM near Hachita 31.88 -108.2 4652 Non-comissioned 2014-05-31 20:00:00.0 Closed USRCRN 1781
53026 US NM Pinon 8 SSE BLM near Pinon 32.51 -105.33 5456 Non-comissioned 2014-05-31 20:00:00.0 Closed USRCRN 1784
53131 US AZ Tucson 11 W Sonora Desert Museum 32.23 -111.16 2733 Commissioned 2004-01-11 19:00:00.0 Operational USCRN 1011
53132 US AZ Elgin 5 S BLM, Appleton-Whittell Research Ranch 31.59 -110.5 4811 Commissioned 2004-01-11 19:00:00.0 Operational USCRN 1010
53136 US NV Mercury 3 SSW Nevada Test Site (Desert Rock Meteorological Lab) 36.62 -116.02 3284 Commissioned 2004-06-07 20:00:00.0 Operational USCRN 1049
53138 US NV Baker 5 W Great Basin National Park (Gravel Pit Site) 39.01 -114.2 6617 Commissioned 2004-06-28 20:00:00.0 Operational USCRN 1106
53139 US CA Stovepipe Wells 1 SW Death Valley National Park (Stovepipe Wells Site) 36.6 -117.14 84 Commissioned 2004-06-07 20:00:00.0 Operational USCRN 1105
53149 US UT Torrey 7 E Capitol Reef National Park, Goosenecks Road Site 38.3 -111.29 6204 Commissioned 2007-12-18 19:00:00.0 Operational USCRN 1509
53150 US CA Yosemite Village 12 W Yosemite National Park, (Crane Flat Lookout) 37.75 -119.82 6620 Commissioned 2007-12-18 19:00:00.0 Operational USCRN 1508
53151 US CA Fallbrook 5 NE San Diego State Univ’s Santa Margarita Ecological Reserve (Old Mine Road) 33.43 -117.19 1140 Commissioned 2008-06-08 20:00:00.0 Operational USCRN 1528
53152 US CA Santa Barbara 11 W Univ. of California – Santa Barbara (Coal Oil Point Reserve) 34.41 -119.87 18 Commissioned 2008-09-20 20:00:00.0 Operational USCRN 1529
53154 US AZ Yuma 27 ENE U.S. Army, Yuma Proving Ground (Redbluff Pavement Site) 32.83 -114.18 620 Commissioned 2008-09-02 20:00:00.0 Operational USCRN 1590
53155 US AZ Williams 35 NNW Babbitt Ranches (Meridian Site) 35.75 -112.33 5990 Commissioned 2008-07-29 20:00:00.0 Operational USCRN 1613
53156 US AZ Phoenix 7 S South Mountain Regional Park 33.34 -112.08 1404 Non-comissioned 2014-05-31 20:00:00.0 Closed USRCRN 1661
53159 US AZ Cameron 25 SSE NPS, Wupatki National Monument (Woodhouse Mesa) 35.5 -111.34 4807 Non-comissioned 2014-05-31 20:00:00.0 Closed USRCRN 1705
53160 US AZ Camp Verde 3 N NPS, Montezuma Castle National Monument (Water Tank Butte) 34.61 -111.84 3434 Non-comissioned 2014-05-31 20:00:00.0 Closed USRCRN 1694
53162 US AZ Coolidge 5 W NPS, Casa Grande Ruins National Monument 32.99 -111.53 1425 Non-comissioned 2014-05-31 20:00:00.0 Closed USRCRN 1706
53163 US NM Socorro 17 WSW FS, Cibola National Forest (Magdalena Ridge Observatory) 33.97 -107.18 10486 Non-comissioned 2014-05-31 20:00:00.0 Closed USRCRN 1715
53164 US AZ Page 9 WSW NPS, Glen Canyon National Recreation Area (Lees Ferry) 36.86 -111.6 3254 Non-comissioned 2014-05-31 20:00:00.0 Closed USRCRN 1710
53165 US UT Delta 4 NE Delta Municipal Airport 39.38 -112.5 4761 Non-comissioned 2014-05-31 20:00:00.0 Closed USRCRN 1717
53166 US UT St. George 15 NE BLM near White Reef 37.21 -113.37 3417 Non-comissioned 2012-09-26 20:00:00.0 Closed USRCRN 1721
53167 US UT Midway 3 NE Utah Valley University (Wasatch Campus) 40.54 -111.41 5748 Non-comissioned 2014-05-31 20:00:00.0 Closed USRCRN 1722
53168 US AZ Ajo 29 S NPS, Organ Pipe Cactus National Monument 31.94 -112.8 1661 Non-comissioned 2014-05-31 20:00:00.0 Closed USRCRN 1726
53169 US AZ Kayenta 16 WSW NPS, Navajo National Monument 36.68 -110.54 7274 Non-comissioned 2014-05-31 20:00:00.0 Closed USRCRN 1727
53170 US AZ Heber 3 SE FS, Sitgreaves National Forest (Black Mesa Ranger Station) 34.39 -110.56 6625 Non-comissioned 2014-05-31 20:00:00.0 Closed USRCRN 1702
53171 US UT Milford 42 WNW FS, Rocky Mountain Research Stations (Desert Range Experimental Station) 38.59 -113.75 5255 Non-comissioned 2014-05-31 20:00:00.0 Closed USRCRN 1740
53172 US AZ Lake Havasu City 19 SE Buckskin Mountain State Park 34.25 -114.13 416 Non-comissioned 2014-05-31 20:00:00.0 Closed USRCRN 1737
53173 US NM Nageezi 18 SSW NPS, Chaco Culture National Historical Park 36.03 -107.9 6449 Non-comissioned 2014-05-31 20:00:00.0 Closed USRCRN 1738
53174 US UT Price 3 E Carbon County Airport 39.6 -110.75 5835 Non-comissioned 2014-05-31 20:00:00.0 Closed USRCRN 1755
53176 US AZ Gila Bend 3 ENE Gila Bend Municipal Airport 32.96 -112.66 780 Non-comissioned 2014-05-31 20:00:00.0 Closed USRCRN 1756
53180 US AZ Kingman 8 NE Kingman Airport 35.25 -113.93 3425 Non-comissioned 2014-05-31 20:00:00.0 Closed USRCRN 1775
53181 US AZ Safford 5 NNE Safford Regional Airport 32.85 -109.63 3176 Non-comissioned 2014-05-31 20:00:00.0 Closed USRCRN 1774
53182 US OK Goodwell 2 SE Oklahoma Panhandle State Univ., School of Agriculture (Permanent Pasture) 36.56 -101.6 3282 Non-comissioned Operational USCRN 1772
53183 US AZ Fredonia 7 SSE BLM near Fredonia 36.85 -112.45 5147 Non-comissioned 2014-05-31 20:00:00.0 Closed USRCRN 1782
53184 US AZ Meadview 7 N NPS, Lake Mead National Recreation Area (Pearce Ferry Airport) 36.09 -114.04 2938 Non-comissioned 2014-05-31 20:00:00.0 Closed USRCRN 1783
53185 US UT Beaver 15 E FS, Fishlake National Forest (Big Flat Ranger Station) 38.27 -112.37 10132 Non-comissioned 2014-05-31 20:00:00.0 Closed USRCRN 1785
53877 US NC Asheville 8 SSW North Carolina Arboretum (Bierbaum Site) 35.49 -82.61 2151 Commissioned 2000-11-13 19:00:00.0 Operational 53878 USCRN 1026
53878 US NC Asheville 13 S NC Mtn. Horticultural Crops Res. Ctr. (Backlund Site) 35.41 -82.55 2103 Commissioned 2000-11-13 19:00:00.0 Operational 53877 USCRN 1027
53926 US OK Stillwater 2 W Oklahoma State Univ. (Ag. Research Farm Site) 36.11 -97.09 890 Commissioned 2004-01-11 19:00:00.0 Operational 53927 USCRN 1005
53927 US OK Stillwater 5 WNW Oklahoma State University (Efaw Farm Site) 36.13 -97.1 888 Commissioned 2004-01-11 19:00:00.0 Operational 53926 USCRN 1006
53960 US LA Lafayette 13 SE University of Louisiana at Lafayette (Cade Farm) 30.09 -91.87 35 Commissioned 2004-01-11 19:00:00.0 Operational USCRN 1013
53961 US LA Monroe 26 N Upper Ouachita National Wildlife Refuge 32.88 -92.11 88 Commissioned 2004-01-11 19:00:00.0 Operational USCRN 1012
53968 US TX Palestine 6 WNW NASA (National Scientific Balloon Facility) 31.77 -95.72 383 Commissioned 2004-01-11 19:00:00.0 Operational USCRN 1018
53974 US KS Manhattan 6 SSW Kansas State University (Konza Prairie Biological Station) 39.1 -96.6 1137 Commissioned 2004-01-11 19:00:00.0 Operational USCRN 1047
54794 US NH Durham 2 N University of New Hampshire (Kingman Farm Site) 43.17 -70.92 119 Commissioned 2004-01-11 19:00:00.0 Operational 54795 USCRN 1041
54795 US NH Durham 2 SSW University of New Hampshire (Thompson Farm Site) 43.1 -70.94 63 Commissioned 2004-01-11 19:00:00.0 Operational 54794 USCRN 1040
54796 US RI Kingston 1 NW University of Rhode Island (Plains Road Site) 41.49 -71.54 115 Commissioned 2004-01-11 19:00:00.0 Operational 54797 USCRN 1042
54797 US RI Kingston 1 W University of Rhode Island (Peckham Farm Site) 41.47 -71.54 106 Commissioned 2004-01-11 19:00:00.0 Operational 54796 USCRN 1043
54808 US IL Champaign 9 SW Univ. of Illinois (Bondville Environ. & Atmos. Resrch. Stn.) 40.05 -88.37 700 Commissioned 2004-01-11 19:00:00.0 Operational USCRN 1037
54810 US MI Chatham 1 SE Michigan State University (Upper Peninsula Experiment Station) 46.33 -86.92 875 Commissioned 2005-04-06 20:00:00.0 Operational USCRN 1113
54811 US IL Shabbona 5 NNE Northern Illinois Agronomy Research Center 41.84 -88.85 861 Commissioned 2004-01-11 19:00:00.0 Operational USCRN 1038
54851 US OH Coshocton 8 NNE North Appalachian Experimental Watershed (CRN site) 40.36 -81.78 1120 Commissioned 2007-01-25 19:00:00.0 2016-09-18 20:00:00.0 Closed USCRN 1125
54854 US MI Gaylord 9 SSW National Weather Service, Gaylord 44.9 -84.72 1461 Commissioned 2007-12-18 19:00:00.0 Operational USCRN 1426
54856 US OH Wooster 3 SSE OSU, Ohio Agricultural Research & Development Center (Snyder Farm Site) 40.76 -81.91 1102 Commissioned 2016-12-12 19:00:00.0 Operational USCRN 1797
54902 US IA Des Moines 17 E Neal Smith NWR (NOAA Station Site) 41.55 -93.28 921 Commissioned 2005-02-10 19:00:00.0 Operational USCRN 1116
54903 US WI Necedah 5 WNW Necedah National Wildlife Refuge (Rynearson Dam No. 2) 44.06 -90.17 933 Commissioned 2005-03-09 19:00:00.0 Operational USCRN 1114
54932 US MN Sandstone 6 W Audubon Center of the North Woods 46.11 -92.99 1130 Commissioned 2007-09-27 20:00:00.0 Operational USCRN 1447
54933 US SD Aberdeen 35 WNW The Nature Conservancy (Samuel H. Ordway Prairie, Hdq. Site) 45.71 -99.12 1957 Commissioned 2007-09-27 20:00:00.0 Operational USCRN 1446
54937 US ND Jamestown 38 WSW North Dakota State University, Central Grasslands (Sec. 14 Site) 46.77 -99.47 1920 Commissioned 2008-09-04 20:00:00.0 Operational USCRN 1611
56401 US AK Glennallen 64 N BLM, Paxson Airport 63.02 -145.5 2669 Commissioned 2014-07-20 20:00:00.0 Operational USCRN 1790
63826 US SC Blackville 3 W Clemson University (Edisto Research & Edu. Ctr.) 33.35 -81.32 317 Commissioned 2004-01-11 19:00:00.0 Operational USCRN 1029
63828 US GA Newton 8 W Robert W. Woodruff Foundation (Ichauway-George Site) 31.31 -84.47 176 Commissioned 2004-01-11 19:00:00.0 Operational 63829 USCRN 1032
63829 US GA Newton 11 SW Robert W. Woodruff Foundation (Ichauway-Dubignon Site) 31.19 -84.44 156 Commissioned 2004-01-11 19:00:00.0 Operational 63828 USCRN 1033
63831 US MS Newton 5 ENE Mississippi State University (Coastal Plain Exp. Station) 32.33 -89.07 374 Commissioned 2004-01-11 19:00:00.0 Operational USCRN 1036
63838 US KY Versailles 3 NNW University of Kentucky (Woodford County Site) 38.09 -84.74 891 Commissioned 2004-01-11 19:00:00.0 Operational USCRN 1028
63849 US KY Bowling Green 21 NNE Mammoth Cave National Park (Job Corps Site) 37.25 -86.23 790 Commissioned 2004-06-28 20:00:00.0 Operational USCRN 1031
63850 US GA Watkinsville 5 SSE University of GA, Phil Campbell Sr Natural Resource Conservation Center 33.78 -83.38 741 Commissioned 2004-06-07 20:00:00.0 Operational USCRN 1111
63855 US TN Crossville 7 NW Univ. of Tennessee (Plateau Research and Education Center) 36.01 -85.13 1913 Commissioned 2005-04-06 20:00:00.0 Operational USCRN 1121
63856 US GA Brunswick 23 S Cumberland Island National Seashore (Stafford Field) 30.8 -81.45 25 Commissioned 2005-04-26 20:00:00.0 Operational USCRN 1120
63857 US AL Gadsden 19 N Sand Mountain Research / Extension (Northwest Pasture) 34.28 -85.96 1152 Commissioned 2005-06-09 20:00:00.0 Operational USCRN 1119
63858 US AL Selma 13 WNW Auburn University, Black Belt Research and Extension Center 32.45 -87.24 193 Commissioned 2005-07-24 20:00:00.0 Operational USCRN 1122
63862 US AL Valley Head 1 SSW Valley Head 34.56 -85.61 1020 Experimental Operational Alabama-USRCRN 1266
63866 US AL Guntersville 2 SW Guntersville Radio Station 34.33 -86.31 620 Experimental 2013-12-15 19:00:00.0 Closed Alabama-USRCRN 1269
63867 US AL Cullman 3 ENE North Alabama Horticultural Research Center 34.19 -86.79 800 Experimental Operational Alabama-USRCRN 1267
63868 US AL Courtland 2 WSW Lawrence County Airport 34.66 -87.34 575 Experimental Operational Alabama-USRCRN 1268
63869 US AL Fairhope 3 NE Auburn University, Gulf Coast Research and Extension Center 30.54 -87.87 95 Commissioned 2006-09-28 20:00:00.0 Operational USCRN 1124
63891 US AL Clanton 2 NE Chilton County Airport 32.85 -86.61 584 Experimental Operational Alabama-USRCRN 1326
63892 US AL Gainesville 2 NE Heflin Lock 32.83 -88.13 107 Experimental Operational Alabama-USRCRN 1327
63893 US AL Greensboro 2 WNW Hale County Jail 32.71 -87.62 280 Experimental Operational Alabama-USRCRN 1328
63894 US AL Muscle Shoals 2 N Muscle Shoals TVA 34.77 -87.63 530 Experimental Operational Alabama-USRCRN 1366
63895 US AL Russellville 4 SSE Russellville 34.45 -87.71 720 Experimental Operational Alabama-USRCRN 1297
63896 US AL Scottsboro 2 NE Scottsboro 34.69 -85.99 636 Experimental Operational Alabama-USRCRN 1296
63897 US AL Selma 6 SSE Craig Field Airport 32.33 -86.97 157 Experimental Operational Alabama-USRCRN 1329
63898 US IN Bedford 5 WNW Feldun-Purdue Agricultural Center, (Pasture 17 Site) 38.88 -86.57 760 Commissioned 2007-12-18 19:00:00.0 Operational USCRN 1510
63899 US AL Brewton 3 NNE Brewton 31.14 -87.05 170 Experimental Operational Alabama-USRCRN 1550
64756 US NY Millbrook 3 W Institute of Ecosystem Studies (Environmental Monitoring Station) 41.78 -73.74 413 Commissioned 2005-03-09 19:00:00.0 Operational USCRN 1118
64757 CA ON Egbert 1 W Environment Canada CARE site 44.23 -79.78 807 Experimental Operational USCRN 1112
64758 US NY Ithaca 13 E Cornell University (Harford Teaching & Research Center) 42.44 -76.24 1228 Commissioned 2005-03-09 19:00:00.0 Operational USCRN 1117
73801 US AL Northport 2 S Oliver Lock & Dam 33.21 -87.59 150 Experimental Operational Alabama-USRCRN 1632
73802 US AL Highland Home 2 S Highland Home 31.91 -86.31 614 Experimental Operational Alabama-USRCRN 1630
73803 US AL Talladega 10 NNE Talladega Municipal Airport 33.57 -86.05 525 Experimental Operational Alabama-USRCRN 1631
92821 US FL Titusville 7 E NASA Kennedy Space Center, SLF Mid-Field Site 28.61 -80.69 3 Commissioned 2005-06-09 20:00:00.0 Operational USCRN 1141
92826 US FL Everglades City 5 NE Big Cypress National Preserve (Ochopee Headquarters Vista Site) 25.89 -81.31 4 Commissioned 2007-06-10 20:00:00.0 Operational USCRN 1128
92827 US FL Sebring 23 SSE Archbold Biological Station 27.15 -81.36 150 Commissioned 2008-04-01 20:00:00.0 Operational USCRN 1530
93243 US CA Merced 23 WSW Kesterson Reservoir (US Bureau of Reclamation) 37.23 -120.88 78 Commissioned 2004-06-07 20:00:00.0 Operational USCRN 1050
93245 US CA Bodega 6 WSW University of California – Davis (Bodega Marine Laboratory) 38.32 -123.07 63 Commissioned 2008-07-29 20:00:00.0 Operational USCRN 1531
94059 US MT Wolf Point 34 NE Fort Peck Indian Res. (Give Out Morgan Site) 48.48 -105.2 2643 Commissioned 2004-04-22 20:00:00.0 Operational 94060 USCRN 1002
94060 US MT Wolf Point 29 ENE Fort Peck Indian Res. (Poplar River Site) 48.3 -105.1 2085 Commissioned 2004-01-25 19:00:00.0 Operational 94059 USCRN 1001
94074 US CO Nunn 7 NNE Ag. Res. Svc. Central Plains Exp. Range (SGS LTER at CSU) 40.8 -104.75 5390 Commissioned 2004-01-11 19:00:00.0 Operational USCRN 1014
94075 US CO Boulder 14 W Mountain Research Station INSTAAR Univ. of CO (Hills Mill) 40.03 -105.54 9828 Commissioned 2004-01-11 19:00:00.0 Operational USCRN 1045
94077 US NE Harrison 20 SSE Agate Fossil Beds National Monument (Visitor Center Site) 42.42 -103.73 4406 Commissioned 2004-01-11 19:00:00.0 Operational USCRN 1025
94078 US WY Lander 11 SSE Nature Conservancy (Red Canyon Ranch) 42.67 -108.66 5773 Commissioned 2004-08-12 20:00:00.0 Operational USCRN 1144
94079 US NE Whitman 5 ENE Gudmundsen Sandhills Laboratory (Site 1) 42.06 -101.44 3740 Commissioned 2005-03-09 19:00:00.0 Operational USCRN 1115
94080 US ND Medora 7 E Theodore Roosevelt National Park (Painted Canyon Site) 46.89 -103.37 2771 Commissioned 2005-03-09 19:00:00.0 Operational USCRN 1139
94081 US SD Buffalo 13 ESE South Dakota School & Public Lands 45.51 -103.3 2883 Commissioned 2005-03-09 19:00:00.0 Operational USCRN 1140
94082 US CO Dinosaur 2 E Dinosaur National Monument (Hdq. Maintenance Site) 40.24 -108.96 6062 Commissioned 2004-09-07 20:00:00.0 Operational USCRN 1108
94084 US ND Northgate 5 ESE Des Lacs National Wildlife Refuge (HB-4 Site) 48.96 -102.17 1842 Commissioned 2007-01-25 19:00:00.0 Operational USCRN 1235
94085 US SD Pierre 24 S Fort Pierre National Grassland (Chester West) 44.01 -100.35 2124 Commissioned 2007-01-25 19:00:00.0 Operational USCRN 1236
94088 US WY Sundance 8 NNW Bear Lodge Ranger Dist, Black Hills NF (Massengale Flats Site) 44.51 -104.43 5792 Commissioned 2007-09-27 20:00:00.0 Operational USCRN 1487
94092 US CO Akron A 4 E USDA Central Great Plains Research Station 40.15 -103.14 4542 Non-comissioned 2014-05-31 20:00:00.0 Closed USRCRN 1657
94094 US CO Meeker 15 W Rio Blanco Lake State Wildlife Area 40.08 -108.19 5761 Non-comissioned 2014-05-31 20:00:00.0 Closed USRCRN 1712
94096 US UT Vernal 23 SSE FWS, Ouray National Wildlife Refuge 40.13 -109.64 4674 Non-comissioned 2014-05-31 20:00:00.0 Closed USRCRN 1778
94097 US UT Grantsville 12 WNW BLM, Skull Valley (Muskrat Fire Station) 40.63 -112.67 4578 Non-comissioned 2014-05-31 20:00:00.0 Closed USRCRN 1777
94098 US UT Manila 18 ESE FS, Ashley National Forest (Dutch John) 40.92 -109.38 6536 Non-comissioned 2014-05-31 20:00:00.0 Closed USRCRN 1786
94644 US ME Old Town 2 W University of Maine (Rogers Farm Site) 44.92 -68.7 127 Commissioned 2004-01-11 19:00:00.0 Operational USCRN 1034
94645 US ME Limestone 4 NNW Aroostook National Wildlife Ref. (Fire Training Area) 46.96 -67.88 737 Commissioned 2004-01-11 19:00:00.0 Operational USCRN 1035
94995 US NE Lincoln 8 ENE University of Nebraska (Prairie Pines Site) 40.84 -96.56 1189 Commissioned 2004-01-11 19:00:00.0 Operational 94996 USCRN 1004
94996 US NE Lincoln 11 SW Audubon Society (Spring Creek Prairie Site) 40.69 -96.85 1372 Commissioned 2004-01-11 19:00:00.0 Operational 94995 USCRN 1003
96404 US AK Tok 70 SE FWS, Tetlin National Wildlife Refuge (Seaton Roadhouse site) 62.73 -141.2 2000 Commissioned 2012-09-23 20:00:00.0 Operational USCRN 1779
96405 US AK Cordova 14 ESE Eyak Corporation, Cordova 60.47 -145.35 83 Commissioned 2018-09-17 20:00:00.0 Operational USCRN 1798
96406 US AK Ruby 44 ESE FWS, Nowitna National Wildlife Refuge (Lake Site) 64.5 -154.12 259 Commissioned 2015-09-28 20:00:00.0 Operational USCRN 1792
96407 US AK Selawik 28 E FWS, Selawik National Wildlife Refuge (Cabin Site) 66.56 -159 22 Commissioned 2016-09-06 20:00:00.0 Operational USCRN 1795
96408 US AK Denali 27 N NPS, Denali National Park (Wonder Lake Campground Site) 63.45 -150.87 2225 Commissioned 2016-09-06 20:00:00.0 Operational USCRN 1794
96409 US AK Toolik Lake 5 ENE BLM, Toolik Field Station 68.64 -149.39 2461 Commissioned 2018-09-17 20:00:00.0 Operational USCRN 1799
NA US VA Sterling 0 N Sterling HCN 38.97 -77.48 287 Test-site 2008-02-19 19:00:00.0 Closed USCRN 1305
UN US AK Denali 27 N NPS, Denali National Park (Wonder Lake Campground Site) 63.45 -150.87 2225 Test-site 2016-09-06 20:00:00.0 Operational USCRN 7794
UN US AK Selawik 28 E FWS, Selawik National Wildlife Refuge (Cabin Site) 66.56 -159 22 Test-site 2016-09-06 20:00:00.0 Operational USCRN 7795
UN US AK Glennallen 64 N BLM, Paxson Airport 63.02 -145.5 2669 Test-site 2014-07-20 20:00:00.0 Operational USCRN 7790
UN US AK Ruby 44 ESE FWS, Nowitna National Wildlife Refuge (Lake Site) 64.5 -154.12 259 Test-site 2015-09-28 20:00:00.0 Operational USCRN 7792
UN US AK Ivotuk 1 NNE Arctic Slope Regional Corporation, Ivotuk Airstrip 68.48 -155.75 1909 Test-site 2015-09-28 20:00:00.0 Operational USCRN 7791
UN US AK Deadhorse 3 S AK Department of Natural Resources, Haul Road) 70.16 -148.46 30 Test-site 2015-09-28 20:00:00.0 Operational USCRN 7793
UN US AK Aleknagik 1 NNE City of Aleknagik, Aleknagik Airport 59.28 -158.61 80 Test-site 2020-10-12 20:00:00.0 Operational USCRN 7801
UN US AK Toolik Lake 5 ENE BLM, Toolik Field Station 68.64 -149.39 2461 Test-site 2018-09-17 20:00:00.0 Operational USCRN 7799
UN US AK Cordova 14 ESE Eyak Corporation, Cordova 60.47 -145.35 83 Test-site 2018-09-17 20:00:00.0 Operational USCRN 7798
UN US TN Oakridge 0 N ATDD test site 36 -84.24 UN Test-site Non-operational USCRN 1147
UN US AK Tok 70 SE FWS, Tetlin National Wildlife Refuge (Seaton Roadhouse site) 62.73 -141.2 2000 Test-site 2012-09-23 20:00:00.0 Operational USCRN 7779
UN US AK Bethel 87 WNW FWS, Yukon Delta National Wildlife Refuge (South Volcano Lake) 61.34 -164.07 153 Test-site 2019-09-22 20:00:00.0 Operational USCRN 7800
UN US AK Gustavus 2 NE The Nature Conservancy, Gustavus Forelands Preserve 58.42 -135.69 20 Test-site 2013-07-24 20:00:00.0 Operational USCRN 7780
UN US AK King Salmon 42 SE NPS, Katmai National Park (Contact Creek) 58.2 -155.92 661 Test-site 2013-07-24 20:00:00.0 Operational USCRN 7788
Was it really, REALLY necessary to pollute the blog with that stuff, RLH?
No one is interested in looking at that, except yourself.
Why didn’t you at least upload this thoroughly uninteresting info, thus reducing your nonsensical flood to a simple link, like I did?
I know which USCRN stations are active, RLH.
No one here needs your manic urge to continuously teach others.
You’re acting just like Robertson, who ruthlessly fills this blog with hundreds of lines that say nothing but his self-centered views.
Try
https://drive.google.com/file/d/1znsyrbD7q1jWSl1ZklEyUXZ0slnA_3EA/view
for a pdf of the stations you listed with accurate daily data
Still not prepared to acknowledge that you shouldn’t use already rounded data in any subsequent calculations without accepting that what you do will contain ‘errors’ are you?
“I know which USCRN stations are active, RLH.”
But continue to use stations that are closed or experimental regardless.
P.S. As Latitude is a spherical calculation, shouldn’t your ‘fit’ be something other than a straight line?
Now that Roe is dead, when can we get a rehearing on the ruling that co2 is a pollutant?
There is more to the world than one state in the USA.
rlh…”There is more to the world than one state in the USA”.
***
Whatever you do, don’t stand up in a bar in Amarillo, Texas and shout that out.
In the rest of the world it will pass without notice.
My understanding is that Roe vs. Wade is still the law. SCOTUS just refused to accept the first objection to the new law from Texas, claiming that the lower courts have not ruled on it yet. Just one round in a long, pointless game. SCOTUS may yet agree that the law is unconstitutional.
The statement concluded:
” Now that Roe is dead… ”
Aha.
It seems to me you think like the brazen Trumpie boy, who was 100% sure that when he’d have brought Amy Coney Barrett into SCOTUS, she would do anything possible to legitimize his lazy illegal intentions.
He was at least 110 % wrong.
Thus wait a little, Darwin Wyatt, before claiming such nonsense.
And the amazing hypocricy here is that the very same people who say things like
“There is nothing more important than your unfettered liberty. Without it you are nothing more than a slave.”
in reference to mask mandates and public health measures
will be all-in for the government taking over control of a woman’s body, no matter how some man’s sperm happens to get into it.
Liberty is apparently only for men.
GLOBAL COOLING UPDATE
https://www.science.org/news/2021/07/un-climate-panel-confronts-implausibly-hot-forecasts-future-warming
The globe has indeed been cooling for the last few years or so. Get over it.
Bob was here:
https://www.drroyspencer.com/2021/08/uah-global-temperature-update-for-july-2021-0-20-deg-c/#comment-805906
How is 5 years worth of monthly data only 2 data points?
https://www.woodfortrees.org/plot/uah6/from:2016
https://www.woodfortrees.org/plot/uah6/from:2016/trend
Idiot.
3 out of 4:
The Only Trick of Roy’s One-Trick Pony (v.3):
0. Almost suggest something relevant;
1. When challenged, brag;
2. When pinned down, Just Ask Questions;
3. When countered, try to insult
Well done!
1.
Someone else put it better than I could.
“The reality is that any measure of standard error and associated confidence limits is a function of the assumed statistical model. As such it is an assumption-based estimate. In contrast, the monthly and 13-month moving averages are point measures that are a function of what was actually measured. There will be errors in those measurements but no statistical technique can tell you what those errors might be. In fact, all of the statistical measures assume the measurements themselves were made without error. In contrast, the statistical analysis is all about trying to estimate the extent to which the natural and real variability in the system over time as measured is fundamental to the real system or simply due to random chance.”
“In fact, all of the statistical measures assume the measurements themselves were made without error.”
Hmmm. Big hmmm.
Nate: What I was meaning was put much more elegantly by others.
“The reality is that any measure of standard error and associated confidence limits is a function of the assumed statistical model. As such it is an assumption-based estimate. In contrast, the monthly and 13-month moving averages are point measures that are a function of what was actually measured. There will be errors in those measurements but no statistical technique can tell you what those errors might be. In fact, all of the statistical measures assume the measurements themselves were made without error. In contrast, the statistical analysis is all about trying to estimate the extent to which the natural and real variability in the system over time as measured is fundamental to the real system or simply due to random chance.”
Oops. Not intended to be posted here as it duplicates what was said above.
Hmmm away idiot.
You’re in my thread, dummy.
You have more than 170 comments so far.
There are 470 responses or so.
That’s 36% of the responses.
Is it because you still have not digested being spanked about the meaning of NULL?
3 value logic is beyond your ken. I know that is because you are an idiot.
“Youre in my thread”
You’re on Roy’s site.
You’re not Roy’s Hall Monitor, dummy.
> 3 value logic is beyond your ken
https://www.drroyspencer.com/2021/08/uah-global-temperature-update-for-july-2021-0-20-deg-c/#comment-827751
Not only you’re 74 years old, Richard, but you’re a pretentious twat.
Willie Boy,
Richard is posting facts. You post propaganda.
Go start your own site then idiot.
“Previous approaches have treated various interpretations of null values”
There can be no ‘interpretation’ of things that are ‘unknown’.
Unless you claim to be a physic I suppose.
Psychic. Damn autocorrect.
> There can be no “interpretation” of things that are “unknown”.
Is this some kind of joke, Richard?
NULL is only one possible result of an SQL search.
How *you* interpret that result is up to you.
Here’s a little puzzle for you:
How do you evaluate (p & non-p) in 3-valued logic?
“NULL is only one possible result of an SQL search.”
Wrong. A NULL is inserted in a field when nothing is know about the value at that point. i.e. It is and unknown value.
“SQL uses a three-valued logic: besides true and false, the result of logical expressions can also be unknown. SQLs three valued logic is a consequence of supporting null to mark absent data. If a null value affects the result of a logical expression, the result is neither true nor false but unknown.
The three-valued logic is an integral part of Core SQL and it is followed by pretty much every SQL database.”
“How do you evaluate (p & non-p) in 3-valued logic?”
By adding in ‘unknown’ to the 2 value set.
“NULL is equal to nothing, even NULL is not equal to NULL because each NULL could be different.”
> By adding in “unknown” to the 2 value set.
You’re already in a 3-value logic, dummy.
Please give me the result of p & non-p in a 3-value logic of your choice.
I’m sure you already know there are many, right?
> part of Core SQL
See what happens when an MS coder pretends to be a computer scientist.
An intriguing enigma:
“If the contents of a table are displayed through a database query tool such as SQL Server Management Studio the fields containing SQL NULL values will show the text “NULL”. However, this is just a visual indication, as those fields do not actually contain the text that is displayed.”
p, non-p & unknown
“However, this is just a visual indication, as those fields do not actually contain the text that is displayed.”
This is because the value of NULL is unknown.
p and non-p are known values. A very small subset of the universe about which most is unknown.
> p and non-p are known values
Nope.
Try again.
Are you saying that p and non-p are unknown. That’s interesting.
Variables can have many values, dummy.
“Three-valued logic has been in the SQL standard from the beginning. It is an integral and widely supported aspect of SQL.”
“Variables can have many values”, one of which is unknown.
It’s a simple puzzle, dummy.
Allow me to help. Find the three-value logic that SQL implements. Build the truth table.
You should realize why I gave you that puzzle to solve.
What’s a sentinel value, btw?
And A & B
If any input is false then false, otherwise if any input is unknown, unknown.
Or A | B
If any input is true then true, otherwise if any input is unknown, unknown.
Not A
True is False.
False is True.
Unknown is Unknown.
All the other logic can be built from the above.
“In computer programming, a sentinel value (also referred to as a flag value, trip value, rogue value, signal value, or dummy data) is a special value in the context of an algorithm which uses its presence as a condition of termination”
Nothing to do with logic per se.
That’s better, dummy.
Now try A & NOT A.
> Nothing to do with logic
Something to do with NULL, dummy.
An NULL cannot be used as a sentinal value as its value is unknown.
And A & B
If any input is false then false, otherwise if any input is unknown, unknown, otherwise true.
Or A | B
If any input is true then true, otherwise if any input is unknown, unknown, otherwise.
Not A
True is False.
False is True.
Unknown is Unknown.
All the other logic can be built from the above.
A & Not A
A = true, A & Not A is unknown
A = false, A & Not A is unknown
> And A & B
No, dummy: A & NOT A.
And please, not “And” and “&”.
Try again.
> An NULL cannot be used as a sentinal value
“From the perspective of databases and data warehousing, reserving certain values to mark a null (or NA) is widely considered unacceptable. NaN is valid data, as is INT32_MIN and other common values used as sentinels.
Most SQL systems store the null-ness of value using an extra bit or byte. File formats like Apache Avro and Parquet have a separate null/not-null encoding.”
A & Not A (Can also be written as A and Not A, A AND Not A, A && Not A and a few others)
A = true, A & Not A is unknown
A = false, A & Not A is unknown
A = Unknown, A & Not A is unknown
Physical representation of True, False and NULL (or their equivalents) is not the consideration, the fact that the logic is 3 valued is.
> A = true, A & Not A is unknown
If A is true, Not A is false, so A and Not A is false.
If A is false, Not A is true, so A and Not is false.
Here’s your last chance:
Try with A = NULL.
The value of NULL is Unknown so I have covered that already.
Anything that includes an Unknown and is not already decided (like a false to any input to an AND or a true to any input to an OR) will always come out as Unknown.
A is Unknown.
Not A is Unknown.
A & Not A is Unknown.
The truth table for A & NON-A is False, False, and NULL, dummy.
Which means that for your three-valued logic saying one thing and its opposite isn’t always false. Same for a simple statement like A & A. So your pet logic has no tautology or contradiction.
Some powerful logic you got there. There are three-valued logics in which there are. I’ll let you find them.
NULL represents an Unknown value. Idiot.
NULL is not equal to NULL (i.e. the 2 things cannot be compared directly) which kinda throws your description into a problem.
What is more important than climate change?
Just about everything.
Can my lawn grow better, more important.
Is China emitting the most CO2 and creating the most pollution
turning China into waste dump, important.
Not really.
What is more important is the extraordinary popular delusion and the madness of the crowds that think climate change is a threat.
Its the same mob mentality that is driving the completely irrational anti-science approach to COVID.
Rights and Freedoms are being eroded by COVID response and there is a large following (extinction rebellion for example) that thinks we should be locking down society because of CO2 emissions too. Your ration of energy would be determined by how important you are to society.
There is nothing more important than your unfettered liberty. Without it you are nothing more than a slave.
ken…”There is nothing more important than your unfettered liberty. Without it you are nothing more than a slave”.
***
You’re right. I wonder what has become of the spirit and courage of US, Canadian, UK and other Allies who stood up to Hitler in WWII? Why is everyone so suddenly willing to accept lame excuses for lockdowns?
You can bet that dossiers are being compiled on us for daring to post such material.
Well being a slave depends upon a lot on the master, dems are lousy masters.
Think about the poor woman that worked for Ms Clinton.
And Dem governor throwing phones at people, the list is endless.
Generally one should avoid working for any boss, but particularly, a boss who is a batshit crazy totalitarian Lefty, who can not even manage to live in their own skin, and are quite angry if someone is sneaking around trying to have a good time- on their dime!!
Dementors are the Dems.
So the question which ended Rome.
Slaves. Or Christian, or Both.
Slaves are also, about corrosive moral effect they have.
You might end up like Clinton.
A whole society of full of Clintons, yuck!
Cuomo or Clinton which is worse?
I don’t really want to find out.
And Biden will have his dog bite you.
Regarding this:
— gbaikie says:
–September 4, 2021 at 12:16 AM
Well being a slave depends upon a lot on the master, dems are lousy masters.–
One can roughly say civilization which has slavery, could be civilization which had worse problems than slavery. Or there was benefits to having slavery which include it being “good” for the slaves themselves. Or the big problem with a society with slaves, is it can seriously worsen. So the Egyptian civilization was not “bad” because it had slavery, but it worsened “probably” as one reasons. One has general story of Jews, who were slaves, who rebelled, and left the “comforts” of one of highest civilization currently in existence, to travel thru deserts to the “promised land” or they went “back” land they used live in- going to their “homeland”- the land given to them by God, which they left.
They were not dragged away, rather they chose to go to Egypt, though due to war in general, some were also captured and brought and sold in Egypt – as were all kinds “of peoples”.
One can also call apprenticeship is similar, children were given {note that children were givable} so that children could learn a useful “trade”.
Main difference is a matter of the Laws regarding [or “lacks rights of apprentices”]. And human rights- is not a new thing- making it a central part of a government is not even “new”- or founders knew history, they stole ideas from history- mainly Greek, and Romans “stole” from Ancient Greeks and was more books were Roman- church monks were quite busy copying things. Though of course they were mainly, Brits- Magna Carta and the then current happenings of British parliament. {though not like they were ignoring the superpower France or rest of Europe}
Of course history “warned” about problems with having slaves- or the lack of rights. The nobleness of farmers the big thing with the ancient Rome, as was Spartacus, Greek {A slave system, in which slaves could “advance” to become “leadership”- thought one could see it as sort of like to the Game of Thrones- though these weren’t farmers- I guess some kind weird cross dressing with the famous Chinese bureaucrats. And all mixed in with Lord of Rings and Porn – so a global hit}.
So currently, have human trafficking. One rightly say this
is evil, but the fundamental “problem” is our laws- which promotes or enables it.
Very similar or same thing as our “War on Drugs” “effort” {or madness] with it’s laws.
“There is nothing more important than your unfettered liberty. ”
Nonsense My liberty to wave my fists around ends where your nose begins.
Further than that if you want to avoid a charge of intimidation.
When there are people taking your rights away the liberty to wave your fist around ends at the back of their skull.
USA 2nd Amendment rights are quite clear about that.
USA 2nd Amendment rights only apply in the USA.
Bill of Rights 1689 too.
There is natural law to defend against oppressive government.
‘defend against an oppressive govt’. Does that mean Jan 6 style ‘defense’?
“Bill of Rights 1689 (UK)
The Bill of Rights 1689 is an iron gall ink manuscript on parchment. It is an original Act of the English Parliament and has been in the custody of Parliament since its creation. The Bill firmly established the principles of frequent parliaments, free elections and freedom of speech within Parliament known today as Parliamentary Privilege. It also includes no right of taxation without Parliament’s agreement, freedom from government interference, the right of petition and just treatment of people by courts. The main principles of the Bill of Rights are still in force today – particularly being cited in legal cases and was used as a model for the US Bill of Rights 1789. Its influence can also be seen in other documents establishing the rights of humans, such as the United Nations Declaration of Human Rights and the European Convention on Human Rights.”
“Rights and Freedoms are being eroded by COVID response and there”
I know mask mandates are like another Holocaust!
Go back to a time and place when rights and freedoms were guaranteed,Ken, before children were oppressed with polio vaccines and were free to get polio..
Maybe try the jim crow deep south before 1970, the ww2 internment camps, or the 1918 Spanish flu pandemic.
–Ken says:
September 3, 2021 at 9:58 PM
What is more important is the extraordinary popular delusion and the madness of the crowds that think climate change is a threat.–
Well, this has always happened.
This is the default condition.
One could claim that people have wanted to solve this problem, but there no evidence they have been successful, and one could make a case that all such efforts have worsen it.
But it seem it’s hard measure this in order say with any kind of certainty whether it’s got much worse or better.
I think people in general use manage to get more “real news” and there used to be more “accountable” for the lying- and sometimes involved tar and feathers- and one can talk about endless clutter and noise of Ads. Very hard to imagine this is helping anything.
And then, we could talk education in general- which is bad, hard imagine it getting much worse.
This is measurable, have long got these sorry results.
We have test results and etc.
binny…”I perfectly recall a paper by Christy and al. dated 2006, where they explained to have isolated 31 radiosondes (most of them in the US, and a few ‘US controlled’ outside, on some Pacific islands”.
***
What does it matter where a radiosonde in located, do you think a radiosonde in the atmosphere over the US reads differently than a radiosonde elsewhere?
UAH is comparing the radiosonde correlation between altitude and temperature. That’s a global constant as is witnessed by the lapse rate. If the sat data matches 31 radiosondes that’s good enough.
I have read Swannie’s whines on this as well. He is misinformed as to the operation of satellite AMSU units just as he is misinformed about the 2nd law.
Robertson
Thanks for showing us all how dumb, brazen and ignorant you are.
You never read that paper, and thus don’t know anything about what I wrote.
” If the sat data matches 31 radiosondes that’s good enough. ”
Especially when they were carefully chosen, and then homogenized to fit the satellite data, huh?
You aren’t even able to detect circular reasoning.
As usual, you merely show off with stupid blah blah.
Gordo, Thanks for including me in your comment. If you can document errors in my comments about the AMSU, please do so. Of course, your other comment about my understanding of the 2nd Law is wrong as well, I’ve never said that it’s wrong. Net transfer of energy is always from a warmer source to (or thru) a colder sink.
willard…”For 2100, in a worst-case scenario, that would reduce a raw 5°C of projected warming over preindustrial levels to 4.2°C”.
***
Notice how the IPCC weenies now use the word ‘projected’? In the 3rd assessment they stated that future climate states cannot be predicted. That did not stop them using unvalidated climate models to predict idiotic scenarios as you have outlined.
They got away with it till expert reviewer Vincent Gray pointed out the obvious: unvalidated models cannot predict. The IPCC sheepishly changed ‘predict’ to ‘project’. This immediately puiqued the interest of Bob Droege, a good alarmist who loves sheep.
Now the propagandists are using unvalidated computer models to predict disaster from covid unless people give up their democratic rights, wear masks, practice social distancing, and in general, behave like sheeple. That word again, Bob will be by soon, he never misses a good sheep story.
puiqued??? Would that be piqued???
Gordo,
Not Vincent Gray again:
https://www.desmog.com/vincent-gray/
You really need new material.
>You really need new material.
Look in the mirror.
Here, Troglodyte:
https://www.ipcc.ch/report/sixth-assessment-report-cycle/
Brand new!
willard…”Not Vincent Gray again:”
***
Desmogblog??? Get serious, propagandists funded by a convicted criminal.
A search of 22,000 academic journals shows that Gray has never been published in a peer-reviewed journal on the subject of climate change. Gray has published peer-reviewed scientific work on coal, his most recent article having been published 17 years ago.
They also say – follow the money!
You’re a tough customer, Gordo:
https://en.wikipedia.org/wiki/Vincent_R._Gray
Wikipedia is a good source of information for some thing, but it must be double checked because there is a lot of false or questionable information posted by people with an agenda.
Gordon,
Just tell me, within 10 orders of magnitude, how many possible climate states are there?
Therein may lie a clue as to why the IPCC said that.
“In the 3rd assessment they stated that future climate states cannot be predicted.”
You don’t understand what the IPCC said.
Be a responsible human being, mask up, get vaccinated, so we all can put this epidemic behind us.
Do your civic duty.
Nobody is trampling your democratic rights by asking that you be vaccinated and wear a mask in public areas.
Hey Gordon,
Why don’t you reply?
You know I don’t take any authority figures word on anything, I am anything but a sheep.
But I do think you are overdo for a shearing.
Ground state at minus infinity.
Geez, where did you come up with that?
You will swallow anything if it argues against AGW.
nate…”Both seem to get the conspiracy theorists working overtime”.
***
One thing I have noticed about you alarmists is how much you appeal to authority. A tiny fraction of 1% of any population world-wide dies from an unexplained contagion and governments world-wide use that as an excuse to lock down populations.
Rather than become informed about the need to lock down, you, like a good alarmist, gets in line, kneel down, and worship your authority figures.
No one with an objective mind could watch the video by Nick Hudson of https://www.pandata.org/team/ without being curious as to the validity of their data. You, on the other hand, write them off as conspiracy theorists without bothering to verify what they have to say.
I had already verified much of what Hudson had to say in Ken’s video and I did it by reading established virologists, scientists, and doctors.
There will always be gullible, naive people like you around and you will smugly support the status quo because you are scared to the point where you cannot think objectively.
Gordon Robertson
I watched Ken’s video and both are dishonest. You won’t accept hard-working honest researchers but every lunatic crackpot is infallible.
Your list of established experts is composed of very dishonest people. Most pushing their contrarian lies in order to promote products and make money. They are like the snake oil salesmen many got conned by. They get people, like you, to believe everyone is lying and misleading you (the establishment) but they are the lone truth tellers. Buy their miracle products (that are worthless). It is an old game.
Sorry old-timer you never learned much in your long life. You are the gullible naiver person who DOES NOT think objectively at all. You just look for any lunatic against the established views (like you do with Einstein even though his ideas have been experimentally verified many times by many people). You are the thoughtless follower being led around by any lunatic contrarian. You never evaluate what they say, but just repeat their nonsense over and over.
Interestingly the ‘snake oil’ sales are masks and vaccines.
The essential uselessness of masks is found throughout the preponderance of literature about masks.
Israel has the highest uptake of vaccine and there it is found to be not working as advertised.
> throughout the preponderance of literature about masks.
Citation needed.
Ken
I recommend you read this material. A lot of false news and distortions. This information will help you see through the bad actors out there.
https://www.wbaltv.com/article/fact-check-debunking-misinformation-about-face-masks/37306178
Ken
Information of the Covid status in Israel.
https://www.haaretz.com/israel-news/israel-vaccine-data-how-many-have-already-been-inoculated-for-covid-1.9626604
The conclusion is vaccines do work. They work by priming the immune system. They are not 100%. You lower the odds of severe illness with vaccines so they work as advertised.
More evidence (I really do not know what you are using as source material for you claims…in this case I agree with Willard, show the sources of the data behind your claims. I am thinking they are based upon dishonest people).
https://www.sciencenews.org/article/covid-coronavirus-vaccines-hospital-cases-rates-unvaccinated
If the charts are valid in this link, it is highly irrational to conclude that vaccines are not working.
2. Moon’s Mean Surface Temperature calculation
Tmean.moon
Surface temp..Tmin..Tmean..Tmax
Kelvin……..100.K…220.K…390.K
So = 1.361 W/m² (So is the Solar constant)
Moon’s albedo: amoon = 0,11
Moon’s sidereal rotation period is 27,32 days. But Moon is Earth’s satellite, so the lunar day is 29,5 days
Moon does N = 1/29,5 rotations/per day
Moon is a rocky planet, Moon’s surface irradiation accepting factor Φmoon = 0,47
(Accepted by a Smooth Hemisphere with radius r sunlight is S* Φ*π*r²*(1-a), where Φ = 0,47)
cp.moon = 0,19cal/gr oC, moon’s surface specific heat (moon’s surface is considered as a dry soil)
β = 150 days*gr*oC/rotation*cal – it is a Rotating Planet Surface Solar Irradiation Absorbing-Emitting Universal Law constant
σ = 5,67*10⁻⁸ W/m²K⁴, the Stefan-Boltzmann constant
Moon’s Mean Surface Temperature Equation Tmean.moon:
Tmean.moon = [ Φ (1 – a) So (β*N*cp)¹∕ ⁴ /4σ ]¹∕ ⁴
Tmean.moon = { 0,47 (1 – 0,11) 1.361 W/m² [150* (1/29,5)*0,19]¹∕ ⁴ /4*5,67*10⁻⁸ W/m²K⁴ }¹∕ ⁴ =
Tmean.moon = ( 2.488.581.418,96 )¹∕ ⁴ = 223,35 K
Tmean.moon = 223,35 Κ
The newly calculated Moon’s Mean Surface Temperature differs only by 1,54% from that measured by satellites!
Tsat.mean.moon = 220 K, measured by satellites.
https://www.cristos-vournas.com
As they say – as hard as you try, you cannot polish a turd.
DMT,
And yet, climate cranks keep attempting to present highly polished turds as gold, don’t they?
Have you seen the one about CO2 being the thermostat controlling the world’s temperature? How about Michael Mann printing up his own Nobel Prize certificate?
Some of these climate crackpots are so dumb that they don’t know the difference between reality and fantasy, let alone turds and gold. They take the turd every time, admiring its highly polished patina, and breathing in its aroma, passing it from hand to hand like a precious gem.
What a pack of bumbling buffoons!
Mike Flynn,
Masterminding Fart.
You can polish a turd, even admire it, but at the end of the day it is still a turd.
They’ve been polishing GHE for decades. They’ve worn thru the shine.
GLOBAL WARMING UPDATE!!
“Global warming is actually causing COLDER winters because its making the polar vortex stretch south into US, Europe and Central Asia, report finds.” – MIT.
The miracle of CO2 continues!
Silly Swenson.
Increasing CO2 is the cause.
Global warming is the effect.
Climate change is the consequences.
I realise that In your simplistic worldview temperatures should only increase,
In the complex reality temperatures can sometimes go down as well as up.
EM,
So “global warming” is actually “not global warming”, is that it?
Or does increased CO2 cause “something”, but you can’t really say what it is?
Maybe you could try to quantify the effect of CO2 on weather (as climate is the statistics of weather), but your brain would explode, wouldn’t it? Best shut your mouth. Better to let people think you are a climate crackpot, rather than open your mouth and prove it!
Carry on being an idiot.
Mike Flynn,
Mathematizing Mystic.
“Increasing CO2 is the cause.
Global warming is the effect.
Climate change is the consequences.”
I’m on board.
Increased CO2 is a cause of global (tropospheric) warming which has some predictable effects.
We should think about what those effects are.
A warming troposphere ( and a cooling stratosphere ) are direct effects of radiative forcing.
A maxima of Arctic warming follows INdirectly, because a warmer troposphere alone means increased advective warming of the Arctic, even if the amount of mass exchanged were constant. By the same means, perhaps increased polar precipitation is implied because of increased water vapor availability.
Other imagined effects, however, including most headline grabbing extreme events are not at all supported by observations or critical thought.
Global average temperature is not a term in the equations of motion. The dynamic range of motions is naturally very large anyway, which explains most variation. Further, the long list of tragic weather disasters of the past serve to remind the thinking that weather disasters occurred when global tropospheric temperatures were lower. There’s no rational basis for imagining that returning to such temperatures will reduce any disasters.
McGee,
“Other imagined effects”
Well the arctic now has less much sea ice coverage. The polar to equator T gradient has reduced.
The Hadley circulation which produces deserts has widened to higher latitudes.
Are you certain that weather patterns should remain unchanged in a warmer world?
Hi Nate.
Well the arctic now has less much sea ice coverage.
Well, yes – this coincides with Arctic warming.
The polar to equator T gradient has reduced.
So this is not so clear.
“The” gradient that coincides with jet streams is much smaller than the pole to equator. Such dynamics are in part determined by those very dynamics.
Further, while the pole-to-equator temperature gradient appears to have decreased at the surface, it is modeled to increase at the height of the jet streams, around 200 millibars.
Further still, all this is in the context of seasonal variation. Gradients and jet streams vary over the course of a year with the seasons. And the dynamic fluctuation within a given month is still quite large.
So, no, its not apparent that there are significant changes in this regard.
The Hadley circulation which produces deserts has widened to higher latitudes.
This is unfounded.
There is no such physical entity as a “Hadley cell”.
This is a model construct – a model which has grave errors.
There are, of course, maxima of subsidence in the subtropics, but they have seasonal maxima during the hemispheric winter which is completely contrary to the narrative of warming increasing subsidence.
Polar air masses at the surface migrate all the way to the equator. The differences become washed out with surface ocean modification, but it is the subsidence associated with these elongated polar high pressure areas that describes the sub-tropical subsidence and not some mythical “Hadley Cell”.
Are you certain that weather patterns should remain unchanged in a warmer world?
My confidence occurs for a reason.
That reason is that while some factors, such as global warming appear likely, the other factors governing climate,
namely insolation, earth orbit and rotation, the extent and alignment of the oceans and mountains, will remain relatively constant in the long term means. It is these constant factors that determine that there will be jet streams, the basins into which jet stream waves will prefer, the ITCZ, the transport of moisture, etc. etc.
It’s not that there are zero changes, but they don’t appear significant, particularly in the face of natural wave variations.
“some mythical ‘Hadley Cell’.”
Sounded authoritative up to this BS.
You list properties of the Hadley Cell that indeed exist, but because it also has variation, that makes it ‘mythical’?
Well can you cite anything that agrees with you, and gives you your confidence that nothing changes in a warmer world?
Nate,
can you show me a real Hadley cell?
Not a conceptual model cartoon, and
not the subsidence, but actual observation of the circulation?
If they exists, it should be easy.
If you can’t show me a real one, then I’m gonna say they don’t exist.
Polar air masses, especially over the ocean basins, routinely travel to the equator – and even cross.
This reality is in direct contrast to the closed “cell” diagrams which don’t allow for cross cell transport.
“not the subsidence”
Strong equatorial convection is a signature.
Subsidence in subtropical latitude bands with resulting persistent deserts is a signature.
The trade winds are another.
These are indicators of a global circulation pattern.
Does this average general circulation pattern not exist? Its a myth?
“don’t allow for cross cell transport”
Again, the General circulation is the average pattern.
Nate,
here’s a pretty good view, at least on 6 September 2021:
https://earth.nullschool.net/#current/wind/surface/level/orthographic=65.81,-16.16,427
These are surface streamlines.
One can trace at least partial streamline all the way from Antarctica to the Bay of Bengal near India.
Also interesting:
https://earth.nullschool.net/#current/wind/surface/level/orthographic=-105.03,-11.38,427
Streamlines from 50S west of Chile connect to the ITCZ at 15N west of Mexico.
You’ve inspired me to examine the cell conceptual models in the reanalysis data in a more formal way.
This will takes some time, but I’ll post the results here.
“General circulation is the average pattern.”
That’s probably a good distinction.
There’s no such physical entity as a “Hadley Cell” though statistical abstractions might occur.
The reason it’s a snare is that the real cells are more likely the polar high pressure air masses, which we CAN identify and ARE real physical entities. Over the oceans, unlike the misleading conceptual model of closed cells, polar high pressure systems can and do traverse from the poles to the equator. Actually they can cross the equator. This explains the ITCZ and the subtropical subsidence and even the statistics that people conceive of in these models.
“Theres no such physical entity as a Hadley Cell though statistical abstractions might occur.”
Not sure what that means. It is a pattern of mass circulation, as real as any other.
And it has consequences, as discussed.
Here’s a good reminder of the difference between statistical spatial and temporal means and reality.
Consider precipitation, especially in terms of the ocean basins:
https://en.wikipedia.org/wiki/Precipitation#/media/File:Precipitation_longterm_mean.gif
Things can be different between annual-monthly-instantaneous.
You can say, gee look at the dry eastern ocean basins.
But at the same time, you have consider the rainy western ocean basins.
The dynamic convergence associated with individual air mass paths explain this much better than the ill-considered conceptual models.
Sure, what I see is consistent with the Gen Circulation pattern. The pressure bands follow the seasonal oscillation of maximum of insolation. This is a well known.
And?
“You can say, gee look at the dry eastern ocean basins.
But at the same time, you have consider the rainy western ocean basins.”
Agree. Isnt that just the trade winds carrying ocean vapor west to the East Coasts of continents?
McGee…”Increasing CO2 is the cause.
Global warming is the effect.
Climate change is the consequences.
Im on board”.
***
All that’s onboard is another butt-kissing alarmists regurgitating the pseudo-science of authority figures.
Where’s your scientific proof that CO2 has anything to do with anything? Not a shred of evidence anywhere related to the atmosphere.
No, I’ve run, and marginally understand radiative transfer models.
You may have missed the nuance.
Global warming can be real but exaggerated.
“We should think about what those effects are.”
Current GHG reduces direct thermal radiation to space by 342Wm-2.
Doubling the amount of CO2, a minor GHG, from 400 ppm to 800 ppm, a process that will take two centuries, will, according to Schwarzschild equations, further reduce direct thermal radiation to space by another 3 Wm-2.
I think the effect of doubling of CO2 in the atmosphere won’t have any measurable effect on climate.
You can wax poetic about ‘radiation forcing’ but if such forcings are not already apparent with 342Wm-2 of GHG effect then why would they become apparent with a further 3Wm-2?
See William Happer’s article ‘radiation transfer’ for details.
Ken,
Don’t neglect to consider the past radiative forcing increase.
While radiative effects have been understood for centuries, the work of Syukuro Manabe was very important.
Manabe made predictions based on his ( among the first ) general circulation models from the 60s and 70s.
Remember, the RAOB era began in 1958 when the record was too brief to analyze trends for those early models.
Three of those predictions ( 1:tropospheric warming, 2: stratospheric cooling, 3: Arctic maxima ) are borne out to lesser or greater degree by reanalysis, raobs, and MSU including UAH.
They are borne out for the RAOB era, for the MSU era, and for the twenty-first century so far.
I have analyzed these data sets that you may see here:
https://climateobs.substack.com/p/vertical-profiles-of-climate-change
So there is correlation of ‘global warming’ with radiative forcing. Correlation is not, of course, causation, but for the uncontrolled experiment called climate, this may be the best we can do.
‘Global warming’ being real doesn’t mean all the scare stories are real. ‘Climate change’ can be real, but exaggerated, which makes it a perfect political tool, because even though it may be benign for a century or more, politicians can still trot out imaginary disaster, or logically worse, apply confirmation bias of the masses toward ‘climate change’.
There are reasons to worry less about climate change
(https://www.amazon.com/dp/B09BCGLTVV)
342W/m2 No.
Where from?
The TOA emits 240 W/m2. The surface @ 288K on ave emits 390 W/m2. The difference is 150 W/m2. The GHE is 150 W/m2. Much of that is due to feedbacks.
The added 3 W/m2 does not include feedbacks.
Let’s look at the SSW in the middle of the previous winter. The highest spike is visible at the top of the stratosphere (0.1 hPA). As the graph shows, the temperature of the upper stratosphere was very low in December, and there was a spectacular drop in temperature in February. The low temperature at the top of the stratosphere is logical because of the strong decrease in UV radiation, so why such a sudden jump in temperature at the stratosphere-mesosphere boundary? The nature of the SSW is, in my opinion, completely unknown and occurs at altitudes where the influence of the troposphere is excluded.
https://www.cpc.ncep.noaa.gov/products/stratosphere/temperature/01mb9065.png
Sorry should be 1 hPa.
hey, ren…just saying hello.
LOL
The organ grinder saying hello to his monkey!
GLOBAL COOLING UPDATE
With 212 comments out of the 520 we can read as of now, Richard has 41% of the contribution so far.
Well done, Richard!
Will he be able to keep pace?
Stay tuned tomorrow!
Willard has 100% (or nearly) of the idiocy on here.
The Only Trick of Roy’s One-Trick Pony (v.4):
0. Almost suggest something relevant;
1. When challenged, brag;
2. When pinned down, Just Ask Questions;
3. When countered, try to insult
1.
“The billions of dollars spent by the fossil fuel industry on propaganda and its acceptance by know-nothing elements on the right caused incalculable damage. They might have followed Margaret Thatcher, who warned in 1989 of C02 admissions leading to climate change “more fundamental and more widespread than anything we have known”. The desire of business to protect profits and the vanity of politicians and pundits, who saw themselves as dissidents fighting the consensus rather than fanatics enabling destruction, helped to waste two decades of valuable time.
I put “denier” in quotes at the top of this piece because the enemies of science (and of us all) are endlessly malleable shapeshifters. Once they can no longer deny the existence of man-made global warming, they shift and keet on shifting so no one can ever pin them down. In this, they mirror the defenders of slavery 230 years ago, who created the modern world’s first corporate PR campaign and provided an example for all who have followed.
…
The comparison isn’t harsh. One day, the attack on climate science will be seen as shocking as the defence of human bondage. Indeed, that day should have long passed. They are overwhelmingly old men or, in the case of Lawson, a very old man. They grew up in a 20th century where the carbon economy was natural: the way the world was and would always be. Slavery was equally natural to the plantation owners and slave traders of Georgian Britain. It had always existed, everywhere on Earth”
Nick Cohen, The Guardian
Unimaginative leftist propaganda.
stephen…”Unimaginative leftist propaganda”.
***
The reason I urge people to be careful with the leftist propaganda bit is that Thatcher was an uber-right winger. So was Schwarzeneggar, from Nazi stock, when he was California governor, while implementing Draconian carbon emission regulation. He is now advising people to accept the covid fraud without complaint.
This is not about right wing/left wing, it is far more sinister. We now have factions, many of them right wingers, wanting to replace democracy with Chinese-style totalitarianism. They are the politically-correct, a minority who want to shove their myopic beliefs down everyone’s throats.
dmt…”They might have followed Margaret Thatcher, who warned in 1989 of C02 admissions leading to climate change…”
***
Margaret Thatcher was a liar and one of the most dangerous Prime Ministers the UK ever encountered wrt the working class and the poor.
Her warning was not geared toward a scientific understanding, it was created as a blatant lie to fool the idiots in the UN. Thatcher, on the advice of an advisor, was deliberately lying to the UN in an attempt to have the UN declare CO2 emissions, as related to coal, a danger to global warming. Her ultimate goal was to stifle the UK coal miners, a despicable act.
Thatcher had no evidence whatsoever and she managed to have John Houghton, a protege and climate modeler installed as the first co-chair of the IPCC. Since its inception, the IPCC has peddled propaganda from unvalidated climate models in lieu of hard science using the scientific method.
Artificial gravity station to 500 km by 400 km orbit at 28 degree inclination.
Falcon 9 launches it and falcon 9 dragon to bring crew to it.
The first crew going it, could spend about 2 weeks there, maybe as much as 1 month.
The first crew would not provide all information regarding how much artificial gravity is needed and it’s long term effects, it counts as adventure- if crew merely get into it.
It would take more the single trip to the station.
Though it’s not comparable to ISS. It’s 1/500th of the cost- and tax payers don’t need to pay for it.
And could it enable more successful Mars crew explorations.
Could be a better “testbed” as what some people say, lunar exploration could be for Mars.
{But NASA still need to explore the Moon to determine if has water}
The station is put on top of falcon 9 second stage and second stage doesn’t separate from it.
Falcon 9 second stage is 12 feet in diameter, as is station.
Falcon 9 second stage is 12 feet diameter and 41.33 feet tall and station adds 90 feet to equal 131.33 feet or about 40 meters in total length.
40 feet of bottom of station is a large tank of air.
Above the tank are the areas where crew could stay.
Above the 12 feet diameter part is 8 feet diameter and 7 feet tall, where crew could enter it.
And when crew enter it, there would be no air, and after shutting door, it would be pressurized.
When pressurized, the crew go inside the pressurized station which has 6 floors.
Dragon spacecraft is not going dock with/into the station, the crew would use spacesuits to get to it.
Once in station, they could then make it spin.
One could attach rope to the dragon which could make the station and the dragon spin.
It not designed or intended to spin faster than .4 gee. And don’t need very strong rope to do that with mass of dragon capsule.
Or could spin it without using dragon spacecraft.
This station empty mass is less than 10,000 kg [excluding mass of second stage- 4 tons] and a falcon 9 rocket
can launch more than 10,000 kg of payload to LEO.
Crew could spend a fair amount time, unpacking 5 ton of payload which was lifted with the station.
One could have tons of containers water stored in the solar flare shelter and crew could remove them to
put in other rooms have enough space in the shelter so crew could use the room.
Crew unpacks and sets up things, and maybe make it spin up to .2 gee- and de-spin it- so could live in it for week or two at say .2 gee. And then leave.
And the next crew could stay a couple months. Or next crew could bring up a lot payload up, do a lot of stuff- and maybe spend 6 months up there. A practical thing could be to install more solar panels- as station doesn’t start with much electrical power- so install new solar panels which would track the sun.
But what would be more fun, is refueling the attached second stage, and getting this station out of LEO.
[I didn’t really, want it in LEO, but to lift it with Falcon 9, LEO was only real option.]
If use Falcon Heavy, instead one could put it into higher orbit. But it’s harder to get crew to it.
So, one way to look at it, is it spends some time in LEO, until ready to have long crew stays in artificial gravity, and then you put into a 20,000 by 200,000 km orbit. With the falcon stage attached to station, if was fully refueled, it’s more than enough get to that orbit- or anywhere- if not full of a lot stuff.
rlh…”And A & B
If any input is false then false, otherwise if any input is unknown, unknown”.
***
Not trying to argue with you, just questioning the meaning of unknown.
In digital logic, the 1s and 0s are represented by voltages. In the older +5 volt systems, the 1 = 5 volts and 0 = 0 volts. However, there were ranges involved.
If a voltage was 0 to 0.8 volts it was considered a 0. Don’t recall the range for 5 volts but I seem to recall it extended down to 4.8 volts. So, the region from 0.8 volts to 4.8 volts was regarded as an unknown, or undefined region.
I worked a lot with Karnaugh maps and truth tables in digital electronics. The definition I remember for an AND logic gate was:
A B (A&B)
1 1 1
1 0 0
0 1 0
0 0 0
The AND gate to me works when both inputs are 1s, or +5 volts. Your representation strikes me as being better applied to a NAND gate.
It figured the formatting would get lost.
In 3 value logic terms the meaning of Unknown is just that, Unknown.
If you want to implement in a physical fashion then you could consider it to be around the threshold value between 1 and 0, where noise could make it either by chance.
There is no guarantee that one Unknown value could be compared to any other Unknown value and give the same answer again.
The combining of NULL/Unknown with True, False is as I have described.
3 Value logic
And A & B
If any input is false then false, otherwise if any input is unknown then unknown, otherwise true.
Or A | B
If any input is true then true, otherwise if any input is unknown then unknown, otherwise false.
Not A
True is False.
False is True.
Unknown is Unknown.
All the other logic requirements can be built from the above.
To go to one of the ‘impossible’ scenario’s which Willard thinks are so clever we also get
A & Not A
A = true, A & Not A is unknown
A = false, A & Not A is unknown
A = unknown, A & Not A is unknown
Most AIs and sensible humans would recognize this as being correct.
rlh…”A & Not A
A = true, A & Not A is unknown
A = false, A & Not A is unknown
A = unknown, A & Not A is unknown
Most AIs and sensible humans would recognize this as being correct.
***
If you have an AND gate with one input equals A and the same A applied through an inverter (not A) to the other AND gate input, then the A presented to the other AND gate input is ‘not A’.
Here’s your truth table for the AND gate
A…..(not A)…..(A & not A)
1…..0……….0
0…..1……….0
There are only two entries because you only have one data stream comprised of 1s and 0s.
Every time you present a 1 at the A input the output is 0.
Every time you present a 0 at the A input the output is 0.
Don’t see any value in the circuit but it works. If you had a stream of 1s and 0s applied to the A input and you just wanted to count the bits without using circuitry to differentiate a 1 from a 0, you could run the 0 output into a counter. I think there are much better ways of doing that but the input A & (not A) would work on an AND gate.
If you supply an AND gate with both 1 (A) and 0 (NOT A) or 0 (A) and 1 (NOT A) at the same time then the answer will always be 0. See above about the answer being 0 (false) if either of the 2 inputs is false.
What Willard was talking about is an apparent conundrum which could result in either/both true or false on the output. This is easily solved by stating the output is Unknown instead.
Hence the AI comment.
> Most AIs and sensible humans would recognize this as being correct.
That’s just dumb, Gordo:
When P is false, Not-P is true and their conjunction is false – a conjunct is only true when both propositions are true.
rlh…”Most AIs and sensible humans would recognize this as being correct”.
***
What I am posting here is straight out of digital electronics theory as taught in engineering classes at university. I have applied this theory in practice and it is the same theory used in AI.
Again, I am not trying to debate your point about the logic, which I think is correct. It’s just not the way logic is presented in digital electronics. There is no such thing as an unknown input in DE, only an undefined input if the input voltage is out of bounds.
If I recall correctly, in some Karnaugh map applications and in some truth tables, they flag certain input combinations as illegal, for want of a better word. That seemed to apply with more complex gate structures using different logic gates like AND, OR, NOR, NAND, XOR, etc.
For example, if you have a flip-flop circuit that contains different combinations of logic gates, certain inputs to the entire circuit are not allowed since they lead to instability.
BTW…in digital electrons, most chip based applications use NAND and NOR because it’s easier to implement them on a silicon chip.
I know.
“There is no such thing as an unknown input in DE, only an undefined input if the input voltage is out of bounds.”
In that case undefined equals Unknown.
N(ot)AND and N(ot)OR are just combinations of the above describe logic.
The point was originally that 2 value logic has serious limitations and possible conundrums. 3 value logic has neither.
> N(ot)AND and N(ot)OR are just combinations of the above describe logic.
It’s the other way around, dummy.
3 valued logic where the 3 values are true, false and unknown.
And
If any input is false then false, otherwise if any input is unknown then unknown, otherwise true.
Or
If any input is true then true, otherwise if any input is unknown then unknown, otherwise false.
Not
True is False.
False is True.
Unknown is Unknown.
All the other logic requirements can be built from the above.
“Its the other way around”
There is not way round you are an idiot.
Boolean logics are a combination of NAND or NOR, dummy, not the other way around.
And you still have to own your:
https://www.drroyspencer.com/2021/09/uah-global-temperature-update-for-august-20210-17-deg-c/#comment-832027
Dr. Edwin X. Berry’s Preprint #3 revision has been accepted for publication by Atmosphere. If you care anything about science, read it. It is an outstanding paper. Also, please see the back and forth with Jerry Elwood in the comments section. It was a very educational back and forth. Jerry Elwood is no slouch, but Berry had the math and evidence on his side. He used IPCC’s own data to falsify their carbon cycle model. This by itself falsifies AGW theory. Game over.
https://edberry.com/blog/climate/climate-physics/preprint3/#comment-97606
USCRN stations distributions versa Taverage-Tmean
By Latitude
https://climatedatablog.files.wordpress.com/2021/09/latitude.jpg
By Solar
https://climatedatablog.files.wordpress.com/2021/09/solar.jpg
By Min/Max range
https://climatedatablog.files.wordpress.com/2021/09/min_max-range.png
By Relative Humidity
https://climatedatablog.files.wordpress.com/2021/09/relative_humidity.jpg
You may notice the numerous outliers and wide spread of values in all of those treatments which means that none of them are the whole answer.
15 minutes
Posted on September 3, 2021 by curryja | 74 Comments
by Judith Curry
https://judithcurry.com/2021/09/03/15-minutes/#more-27827
“Slide 2 IPCC
The climate crisis can be summarized as:
Its warming
The warming is caused by us
Warming is dangerous
We need to urgently transition to renewable energy to stop the warming
Once we stop burning fossil fuels, sea level rise will stop and the weather won’t be so extreme”
Over thousands of years, it is cooling.
Global climate was better thousands of years ago.
When a region the size of US was grassland, and is now, sand.
When there was grassland, it better than the sand.
When there was large areas forest in polar region, and then they become frozen stumps. The climate of forest rather than frozen stumps, is better.
Basic climate stuff, is cooling is a drier and colder world.
We live in a drier and colder world. And it could become drier and colder, and no one has given any plans of how we “might” stop the world from getting drier and colder.
Transition to burning more wood, making wind mills and solar farms is utter idiocy.
Using more nuclear energy is not idiotic. China plans on using more nuclear energy in to future.
China is currently on a path of Peak Coal. China does not have much coal and is using Coal at rate no country has ever done before. Discussing Peak Coal or Oil is retarded in regards to US- US has amounts and is not using these resources at the alarming rate that China is currently doing.
So, endless yack, about US, crickets about China.
But China is developing more Nuclear Energy, because that is really their only sane option. But it’s very likely they will not do this quick enough- despite China’s huge advantage of not having opposition to making nuclear energy- as all other countries in the world, have.
Using the resources in space, is better pathway, then using nuclear energy on the surface planet Earth. I not against nuclear energy, though might be oppose to it, if we had made more progress exploring Space.
NASA has had zero excuse for not exploring the Moon, decades ago.
NASA has had reasons to delay exploring Mars- and have endless promotion doing what they are not ready to do.
The ONLY reason we might be ready to explore Mars, pretty soon.
Is due to Elon Musk. What Musk did, was something NASA “could in theory had done”, 30 years ago.
Or the Starship is basically, a direction that Space Shuttle could have went. But Space Shuttle was made by a stupid bureaucracy in combination with a stupid Congress. It should be noted, that it’s
possible Starship will not work. And current US bureaucracy is a mixed bag, in terms helping or hindering. Or there has some changes which give hope {but it could be a false hope}. The biggest hope, is miles failures, and maybe this track record, could powerfully suggest, something should be done, differently. What different is attempts to “get it right” are being done. We getting a lot attempts and it’s not just SpaceX.
So, for next couple decades, I would favor nuclear energy until we find out the other options.
gbaikie…you missed the best part…
“So whats wrong with the crisis narrative? It is my assessment that
Weve vastly oversimplified both the problem and its solutions
The complexity and uncertainty surrounding climate change is being kept away from the public and policy debates.
Rapid reductions in emissions are technologically and politically infeasible on a global scale
And it overemphasizes the role of climate change in societal problems, distracting from real solutions to them.
norman…”I watched Kens video and both are dishonest. You wont accept hard-working honest researchers but every lunatic crackpot is infallible.
Your list of established experts is composed of very dishonest people. Most pushing their contrarian lies in order to promote products and make money”.
***
You are one of the most obtuse and myopic posters on Roy’s blog. Prove to me that any source I have posted is dishonest. I even quoted Dr. Luc Montagnier to you, with his admission that HIV is harmless to a healthy immune system yet you are inferring he is a liar too. I quoted Dr. Kary Mullis, who invented the PCR method used in the covid test claiming PCR cannot be used as a diagnostic tool as it is being used. You called him a liar too.
In Ken’s video link there is an excellent exposure of collected covid data. It’s available to everyone as it has been available to me and you. Yet you are incapable of reading the data and reaching an objective conclusion.
Here in British Columbia, Canada, we have a bit over 5 billion people and about 1800 people have died reportedly of covid. The statisticians don’t explain the conditions experienced by each person who died so we are forced to take their word for it, which I am loathe to do.
Anyway 18oo deaths out of 5 millions people is about 0.036%. You can’t even call that a pandemic yet the wannabee dictators running our province have engaged in lock downs, imposed mask and distancing regulations and are now targeting the unvaccinated through the introduction of vaccine passports.
In the video, Nick Hudson of pandadata.org showed comparisons between countries like the UK with a total lock down and countries like Sweden with no lock down. He compared North Dakota to South Dakota, where one is locked down and the other not. The statistics are virtually the same between locked down vs not locked down.
Why do people like you automatically follow what you are told by corrupt medical authorities? Fauci stated in March 2020 that mask were no good against a virus. The CD*C said the same. Later, he stated adamantly that a virus is never spread by people who show no symptoms. Yet, here we are with people being forced to wear masks and perfectly healthy, unvaccinated people being blamed for spreading covid.
This is how the Nazis began in Germany circa 1932. They did not force their way into power, they were voted in. German’s flocked to rallies to hear Hitler belching nonsense and they cheered him on. The Nazis got a foot hold because the majority of Germans believed them and supported them.
Now we have politicians belching similar nonsense about protecting the fragile and promoting front line workers as heroes. It’s their bleeping job for cripes sakes.
Today with covid, even though the data proves it is not a dangerous concern, the majority are hysterically supporting the status quo paradigm, even though it is full of holes.
The Nazis began throwing dissidents in concentration camps and no one objected. Of course, if they did, they were thrown in as well. The same thing is going on right now in North America the only difference being they have not built the concentration camps yet.
They have discussed something just as bad, they have talked about building centres to house people who have tested positive.
Are you effing crazy, Norman? Are you so stupid that you cannot look for yourself and see our right deteriorating before our eyes. In Germany, before anyone noticed, it was far too late.
Whether you are pro or con, you should be questioning such extreme measures and the ostracizing of scientists who speak out against the covid fraud. We have blanket censorship by the media and you don’t give a hoot.
Robertson
” I even quoted Dr. Luc Montagnier to you, with his admission that HIV is harmless to a healthy immune system yet you are inferring he is a liar too. ”
YOU, Robertson, are the absolute LIAR here.
Montagnier NEVER ‘admitted’ that HIV is harmless to a healthy immune system.
You disgusting liar repeat that lie since years on this blog. A lie you probably picked out of some contrarian blog.
When will you finally stop lying, Robertson??
Robertson
” The Nazis began throwing dissidents in concentration camps and no one objected. ”
And stop right now talking about Nazis on this blog: you don’t know anything about them, and it is disgusting to compare today’s German government with them.
Pfui Deibel, Robertson. Sie erzählen hier nur die allerletzte Scheiße.
>it is disgusting to compare today’s German government with them
?????Where is he doing that?
Is it disgusting to compare the French, Canadian, Chinese, or Australian governments with them?
Robertson is actually comparing the US gov with the Nazis. It’s a piss-poor undergraduate thing to say, but as he’s a senior I’m putting his ramblings down to early dementia.
An alert senior should know much better than to bandy comparisons with Nazi Germany.
No, Robertson is comparing the behavior of the Democrats with Nazis. It is a good comparison and always has been.
You’re just as demented as he is.
“as an online discussion grows longer (regardless of topic or scope), the probability of a comparison involving Nazis or Adolf Hitler approaches 1.”
Godwin’s Law.
–Anyway 18oo deaths out of 5 millions people is about 0.036%. You cant even call that a pandemic yet the wannabee dictators running our province have engaged in lock downs, imposed mask and distancing regulations and are now targeting the unvaccinated through the introduction of vaccine passports.–
It’s definitely a pandemic.
Gordon please make effort.
It’s a pandemic that WHO failed at stopping, and encouraged it’s spread. Gordon you sounding as stupid and evil as WHO.
WHO claimed it wasn’t contagious. And you are essentially saying
the same thing. There certainly could be more lethal diseases, but air borne, as category, is bad stuff. It the kind of stuff that should have seriously alarmed, WHO.
At least you are not charged with the responsibility to stop global pandemics, and instead caused it to spread more than if WHO did not even exist as organization- an over paid organization to do this one simple task.
gbaikie…”Its definitely a pandemic.
Gordon please make effort.
Its a pandemic that WHO failed at stopping, and encouraged its spread. Gordon you sounding as stupid and evil as WHO.
WHO claimed it wasnt contagious. And you are essentially saying the same thing”.
***
I have made a huge effort, studying the science from experts and the math for hour after hour. I have been doing this since 1983. It is you and other like you who are operating out of sheer emotion while ignoring the facts.
0.035% deaths IS NOT A PANDEMIC!!!! As one doctor put it, it is endemic, meaning it’s like the seasonal flu. Corona viruses have been with us for decades yet the propagandists are touting this as a novel, or new virus. That’s a blatant lie. We are being lied to daily and most people swallow it because they lack the ability to read and comprehend.
Covid 2019 has not even been physically isolated. It was the same for HIV, as admitted by Dr. Luc Montagnier, who won a Nobel for discovering it. He admitted that he inferred the virus because he could not see it on an electron microscope.
Montagnier used retroviral theory that was not even 10 years old when he applied it, reasoning there must be an unseen, undetectable virus lurking somewhere. He REASONED that strands of RNA in a sample must be from HIV and that stupid theory has replaced a method that required a virus be seen on an electron microscope.
His theory was accepted carte blanche by the Reagan administration WITHOUT PEER REVIEW!!!
These days, Montagnier has changed the narrative. He now claims AIDS is caused by oxidative stress due to lifestyle and that HIV is a harmless virus to a healthy immune system. It’s the same for covid, it is harmful only to a tiny fraction of 1% of any population and no one has proof to the contrary.
The data proves what I am saying, I have no interest in hysterical, knee-jerk reactions based on hearsay evidence or unvalidated computer models.
We are living in times of scientific fascism where small groups of scientists create paradigms and enforce them using propaganda, censorship, and other fear tactics. Roy and John of UAH have encountered these fascists, who have actively tried to prevent them publishing papers. Dr. Peter Duesberg had his career ruined for speaking the truth about HIV/ADS. Barry Marshall, an Australian researchers was ostracized and ridiculed for claiming, correctly, that duodenal ulcers are caused by bacteria that can live in stomach acid.
A head doctor in Manitoba, Canada was recently fired, without reason, for questioning a proposed hospital plan to vaccinate children. Dr. Andrew Kaufman was fired for questioning covid theory.
Because HIV could not be seen or detected, a PCR test was developed based on the lame theory of Montagnier. The inventor of the PCR method, Kerry Mullis, told them the PCR method did not apply to isolating a virus or proving an infection because it could not amplify what could not be seen on an EM. The ignorant bastards are still using that method and no one can prove what the tests are measuring.
Guess what? Fauci was involved in the first HIV PCR test. Mullis called him a liar in public for claiming the test measured an HIV viral load and Fauci lacked the courage to sue him for obvious reasons. Mullis, the inventor of PCR, would have eaten him in court.
That was the position of Fauci in early 2020, that covid was harmless in general, until the idiots started listening to the other idiot Neil Ferguson, who put out a model claiming astronomical deaths if we did not immediately start practicing social distancing and wearing masks.
That’s what the hysteria is based on, an unvalidated computer model prediction.
That same idiot, using the same unvalidated models, made similar stupid claims going back to 2002 about SARS, bird flu, swine flu, and mad cow disease and he was not even close. He was so far off with his predictions that he might as well not have made them. The question is, why did politicians listen to the idiot this time?
Covid does not affect children…why??? Epidemiologist Johan Giesecke, an advisor to the WHO, claimed it’s usually the other way around, that children catch the flu and pass it to adults. Why do we suddenly have an inferred virus that does not affect children?
Why are 80% of deaths anywhere related only to seniors and those suffering poor health? Before we had the lock down here in Canada, the death rate was the same as it was afterward. Why is that out of everyone tested in Canada, only 3% tested positive? Why are 99.5% of people world wide simply not affected by covid?
BTW…the number for AIDS deaths were similar, a tiny fraction of 1%. Those deaths as revealed by the CD*C, year after year, showed that 90% of AIDS deaths were related to two high-risk groups: homosexual males and IV drug users. Yet, when Peter Duesberg, a distinguished virologist pointed out that truth, his career was ruined.
Come on man, use your brain and get off the hysterical emotions. No healthy person will be affected by covid and no person who shows no symptoms can spread it.
“0.035% deaths IS NOT A PANDEMIC!!!! As one doctor put it, it is endemic, meaning its like the seasonal flu. Corona viruses have been with us for decades yet the propagandists are touting this as a novel, or new virus. Thats a blatant lie. We are being lied to daily and most people swallow it because they lack the ability to read and comprehend.”
So, you must very pleased by the World Health Organization non actions. And thought Trump was racist because he blocked air travel from China. And I guess simply hated Europeans, as only explanation for later blocking their air travel.
So you want to call it endemic:
— (of a disease or condition) regularly found among particular people or in a certain area.
“complacency is endemic in industry today”–
A china endemic?
another:
: an organism that is restricted or peculiar to a locality or region : an endemic organism
I don’t think that what Trump meant by Chinese virus- he meant it seemed to originate from somewhere in China and not to mean it would stay in China or only effect Chinese people. Or why he wanted to stop all air travel.
Anyhow it seems by using the word, endemic you at least are suggesting it’s a disease [or non specific, condition, as in complacency].
More:
Synonyms & Antonyms for endemic
Synonyms: Adjective
aboriginal, autochthonous, born, domestic, indigenous, native
Antonyms: Adjective
nonindigenous, nonnative
Which suggests you think the idea of it created in lab as utter nonsense. As that would suggest the opposite of endemic.
I tend think there is good chance it started in Wuhan lab.
Also because object to novel, this also indicate you don’t think it was created.
So, is that generally in accordance with what meant to say?
gbaikie…”Which suggests you think the idea of it created in lab as utter nonsense. As that would suggest the opposite of endemic”.
***
The reason I think it was not created in a lab is that the researchers who announced the contagion admitted they had not isolated a virus. They claimed only an association between the contagion and a virus. In fact, the scientist credited with inventing the RNA-PCR test for covid, Christian Drosten, admitted the same thing, that he had not physically isolated a virus.
The Wuhan researchers took samples from an infected person’s lungs. As Dr. Andrew Kaufman pointed out, the residue they extracted from the lungs would be full of other contaminants, part of which likely contained the RNA they use to identify covid.
There is no proof that the RNA used to identify covid, HIV, etc., comes from a virus. In fact the RNA represent only a few strands of a complete genome. The fraudsters took those strands and worked on them in a computer model to piece together what they thought was the genome for covid.
Researchers argued for 50 years over the shape of the measles genome. Why?? If they had the virus they’d have the genome. As Stefan Lanka pointed out in his court case in which he convinced a German court that no scientific evidence exists to claim a measles virus, there is no identifiable measles virus. How then can they agree on the make up of a genome when they don’t have the measles virus?
Lot of fraudulent science happening today.
“The reason I think it was not created in a lab is that the researchers who announced the contagion admitted they had not isolated a virus. They claimed only an association between the contagion and a virus. In fact, the scientist credited with inventing the RNA-PCR test for covid, Christian Drosten, admitted the same thing, that he had not physically isolated a virus.”
I would ask where do you think it started.
But I am guessing that you think nothing started.
And if nothing started, that would be my main reason it could not
start in lab or anywhere.
And that nothing starting is also very strong argument for it not spreading around the world.
Gordon Robertson
YOU: “I even quoted Dr. Luc Montagnier to you, with his admission that HIV is harmless to a healthy immune system yet you are inferring he is a liar too”
https://www.youtube.com/watch?v=rZXmMaMt43c
16:44 of this video. Montagnier says that a healthy immune system can kill off the virus in a few weeks. It does not mean it is harmless.
https://www.fredhutch.org/en/news/center-news/2015/12/HIV-super-survivors.html
Of those infected by HIV only 5% are able to stop the progress with their immune systems. The rest, without medical help, will progress to AIDS.
norman…”Of those infected by HIV only 5% are able to stop the progress with their immune systems. The rest, without medical help, will progress to AIDS”.
***
Only high risk groups like male homosexuals and IV drug users get AIDS and they account for over 90% of AIDS deaths. It was a travesty that the WHO blamed poor African suffering from malnutrition, contaminated water, and infectious diseases like malaria, called wasting syndrome, as harming themselves through sexual transmission of a virus.
If there was justice on this planet the WHO and their ilk would be in jail for being the criminals they are.
Gordon Robertson
https://www.3newsnow.com/news/coronavirus/flatwater-free-press-nebraska-doctors-despondent-as-preventable-covid-wave-slams-state?fbclid=IwAR3cU1CBI3cKu-C5mddk9alPQmd61D7Y5MjSOSae4DN7FcUneO-ANtrGRsg
A reminder:
“Nobel disease is a hypothesized affliction that results in certain Nobel Prize winners embracing strange or scientifically unsound ideas, usually later in life.[1][2] It has been argued that the effect results, in part, from a tendency for Nobel winners to feel empowered by the award to speak on topics outside their specific area of expertise[3][4] combined with a tendency for Nobel winners to be the kinds of scientists who think in unconventional ways.[5]”
https://en.wikipedia.org/wiki/Nobel_disease
#4 on the list
“Luc Montagnier
Montagnier won the 2008 Nobel Prize in Physiology or Medicine. In 2009, in a non-peer-reviewed paper in a journal that he had founded, Montagnier claimed that solutions containing the DNA of pathogenic bacteria and viruses could emit low frequency radio waves that induce surrounding water molecules to become arranged into ‘nanostructures’. He suggested water could retain such properties even after the original solutions were massively diluted, to the point where the original DNA had effectively vanished, and that water could retain the ‘memory’ of substances with which it had been in contact — claims that place his work in close alignment with the pseudoscientific tenets of homeopathy. He further claimed that DNA sequence information could be ‘teleported’ to a separate test tube of purified water via these radio waves. He explained this in the framework of quantum field theory.[10][2][11] He has supported the scientifically discredited view that vaccines cause autism and has claimed that antibiotics are of therapeutic value in the treatment of autism.[6]”
RLH
Thanks for playing with a 2nd or 3rd order mean in your latitude distribution plot.
A mean which, by the way, doesn’t show anything else than a less dense CRN station population in Alaska, and therefore is not only useless but also misleading and distracting.
I still prefer the linear estimates explaining the spatial dependency of both ‘average minus mean’ and ‘average minus median’ data:
https://drive.google.com/file/d/13fZbOg4aUS1zL-wQagK5R2YvPBCB3Yif/view
And… where the heck is your median corner?
The USCRN team is very certainly 100 % right when computing, for the spatial dependency, an amount of 21 %; but that does not change anything to my claim for the existence of this dependency as such.
*
Moreover, I’m still awaiting your complete files showing sorted station data averages for
– average minus mean temperature like in
https://drive.google.com/file/d/1EAOU5Agp9wfctMbPtp7vEQ2Z9_xrlZBQ/view
and especially
– average minus median like in
https://drive.google.com/file/d/1YeCrVkvcP2dw6uTl9y-89pdTlwn25BRb/view
Please avoid polluting the blog with hundreds of lines again, by uploading files and posting here merely a link to them, like I did.
*
In addition, I would still appreciate a graph from your side, plotting the difference averages for all stations from 2002 till now, that is similar to
https://drive.google.com/file/d/1bROlI9vVCBE4ZFEfBhrcEyVaznDbrKtB/view
and confirms or contradicts what my graph shows, namely a temporal dependency of ‘average minus mean’ versus ‘average minus median’.
If namely that temporal dependency wouldn’t exist, the two differences would peak synchronously, instead of being displaced in time.
*
Above all: please do finally stop your endless, counterproductive, distracting critique concerning differences between own daily averages of CRN hourly data and their daily data.
Please concentrate instead on what matters, namely the comparison of the two differences mentioned above:
– hourly average minus hourly mean
– hourly average minus hourly median.
From where you obtain it doesn’t matter to me. The main thing is that you can finally cope with it.
Thanks in advance.
“Thanks for playing with a 2nd or 3rd order mean in your latitude distribution plot.”
The Tmean and Taverage come straight from the USCRN Daily Data.
rlh…”The Tmean and Taverage come straight from the USCRN Daily Data”.
***
If you take away Binny’s bean counting apparatus he’s lost. He fails to grasp that you can look at the raw data and derive meaning without leaping into convoluted statistics.
Heck, I can look at Roy’s graph and grasp the meaning visually without understanding advanced statistics theory. Mind you I took a course in advanced engineering probability and statistic but it was relegated to the bottom of my priorities due to the focus on math (calculus, linear algebra and vector calculus) and physics. I enjoy the application of statistics, or any math, but finding the time to get right into it would have required it being part of my work.
I recall sitting in the cafeteria before a P&S final and having a guy from my class, who was a math whiz, rush over to my table and sit down, He immediately started to thumb through his textbook, and unable to contain my curiosity, I asked what he was doing.
He replied that he was studying for the exam. Doh!!! Since he began at the beginning of the book, I asked if he was studying the entire course for the first time, from the beginning. He confirmed. Pissed me off that he went in and aced the exam whereas I barely scraped through.
He had such a strong background that he could attend lectures and take it all in while getting by on doing the problem sets. He was straight out of high school whereas I had been out of university, returning as a mature student. Many would argue with the mature bit.
Got bleary-eyed drunk before an astronomy exam and struggled mightily. Went up to ask the prof during the exam how kilometres there were in a parsec, a unit of radian measure. He just smiled and shook his head. I went to see him later and he asked what happened, my term work was good and I had passed all my midterms. When I told him, he laughed. Put me through based on my term work.
“Please concentrate instead on what matters, namely the comparison of the two differences mentioned above:
hourly average minus hourly mean
hourly average minus hourly median.”
Not interested. Stats books say, as you have noticed. that Tmedian is always the correct choice if the distribution is unknown in advance. At worst it is the same as Tmean if you happen to have a ‘normal’ distribution.
“In addition, I would still appreciate a graph from your side, plotting the difference averages for all stations from 2002 till now”
Did you see me say that as the distribution of the errors was nearly symmetrical with just a small bias towards the negative, any such averaging would be useless. It would just serve to hide the problem, not explain it.
“Above all: please do finally stop your endless, counterproductive, distracting critique concerning differences between own daily averages of CRN hourly data and their daily data.”
You mean you still won’t admit that your conclusions were wrong.
“Moreover, Im still awaiting your complete files showing sorted station data averages for”
I did that already but just in case you missed it (and to correct and error my csv to pdf convertor added)
https://1drv.ms/b/s!AtY8zZqh6Agxg8NbP6suKM8sCMUEZg
“I still prefer the linear estimates explaining the spatial dependency of both average minus mean and average minus median data:”
So you think that a straight line is a good fit for spherical geometry. Explains a lot of things.
Here is a peer reviewed paper that corroborates what I have been asserting for years: That water vapor controls the climate and CO2 has no significant influence. The sun matters because it provides the energy to drive the water vapor into the atmosphere http://thelightfootinstitute.ca/imglib/Earth_temp_paper.pdf
Statements therein include:
“In other words, the non-condensing GHGs are passive and do not affect Earth’s temperature because they are always rendered ineffective by the much larger warming by water vapor.”
“The increase in temperature over the decades mid-1970s to 2011 was caused by an increase in water vapor and not by an increase in CO2.”
“Carbon dioxide and the other non-condensing greenhouse gases (GHGs) as in Figure 3 are small, passive, and have no effect on the Earth's temperature.”
A recent update of my work which focuses on the observation that WV controls climate because it has been increasing faster than possible from just planet warming is at https://www.researchgate.net/publication/338805648_Water_vapor_vs_CO2_for_planet_warming_14
Your hypothesis would not conflict with Berry. However, it would conflict with Vournas’. What are your thoughts on his theory?
I am failing to see a theory anywhere.
The greenhouse effect theory is not a theory.
But general idea is Earth would be colder {33 C colder}
without greenhouse gases.
This is batshit crazy.
Though I politely call it a cargo cult.
The cargo cult was charming- and the greenhouse effect theory
is committee meeting. Which always, always, lacks any charm.
Committee meeting is where stupidest people can’t avoid it.
Infested with crackpots and brown nosers.
And thieves, idiotic thieves, but one keep in mind their are thieves. Bad, immoral, dumb, thieves. Like the D student, Al Gore.
Where is other theories?
I don’t have a theory. I just listen to people who are somewhat
reasonable. I care mothing about the topic. It’s merely a bit annoying. I was interested is idea of terraforming Mars.
I solved that problem, and I moved on.
The solution was to ignore everything ever said regarding the greenhouse effect theory. And terraforming Mars is infected with such nonsense.
Anyhow, what is known is the ocean average temperature controls global climate. It’s not really a theory. More of a fact.
The other fact is we are in an Icehouse global climate.
No mention of any of this obvious, in the greenhouse effect theory.
Greenhouse effect cultists, call O3 a greenhouse gas. That like saying Jesus was a Wall Street banker.
How much wrong does it, need?
Now, does CO2 have any warming effect. Warming effect means, causing a more uniform global temperature.
Earth in it’s Ice Age is not vaguely uniform in terms of it’s temperature. If it was uniform, it’s not an Ice Age.
It seems possible. But there seems a quite ways it’s does this and the obvious thing, is, we had increase in CO2 levels and no one knows how much or if the rising CO2 levels have increased the global average air temperature of 15 C.
But it’s claimed the more 90% of all global warming has warmed the entire ocean [by a tiny weenie amount} those that say this, know the temperature of entire ocean, matters. As I know it.
But I don’t see an extremely warm ocean of 5 C, attacking me with excessive hotness. And ocean average is 3.5 C [5 C ocean is end of world, terror for some people. And I would say it’s a big change- or hopeful sign of some warmth- but also doomed to cool again, but could take longer than some civilizations have lasted].
In terms of water vapor, most water vapor has always been in the tropics. Tropical zone is 80% ocean. What else is relevant?
IPCC’s carbon cycle model is a theory. Their theory is that natural carbon has remained at 280ppm in the atmosphere for several thousand years, and all the increase from 280ppm to 415ppm is human-caused. If this is falsified, then the whole GHE is caput. Berry has falsified it, by the way.
Berry work does not disprove GHE. GHE is caused by water vapor. WV increase of 1.49 percent per decade has been caused by irrigation increase. Warm water over an area 4 times the area of France.
Governor Newsom is in lead on stopping farmers from getting water, most the pack want to destroy, electrical first, and then attack the farmers. Newsom doing both, and letting all forests burn.
Vournas ignores GHE. If there is no GHE there can be no ghg. That is demonstrated to be wrong.
dan…”Here is a peer reviewed paper that corroborates what I have been asserting for years: That water vapor controls the climate and CO2 has no significant influence’.
***
I have no problem with your theory Dan, it’s just the nagging question of how WV, making up about 0.31% of the atmosphere, can produce so much heat.
The Ideal Gas Law makes it clear that is not possible. The basis of the IGL for a gas with relatively constant volume is that heat is produced based on the mass percent of the constituent gas. That’s based on Dalton’s Law of Partial Pressures wherein pressure is directly proportional to temperature with a constant volume.
Nitrogen and oxygen between them make up nearly 99% of the mass percent of atmospheric gases. It stands to reason that N2/O2 account for 99% of the heat.
Yes, I agree. Water vapor is more abundant than CO2, but both are in trace amounts and not enough to warm the atmosphere. Vournas’ theory trumps.
Clouds and their immediate vicinity say otherwise.
There are lots of clouds at the poles.
rlh…”Clouds and their immediate vicinity say otherwise”.
***
Prove it. Clouds are modeled as small lakes of water because they are comprised of larger droplets of water. There is no proof that these water droplets are affecting global warming.
For one, clouds are claimed to reflect solar energy, therefore it seems they won’t be absorbing much of it. Where do they get their heat? Clouds form due to condensation where heat is given off.
Clouds will be at a cooler temperatures than the surface hence incapable of absorbing radiation from the warmer surface.
Unfortunately, there is no comprehensive theory that demonstrates how clouds affect global warming.
Inside clouds there is a significant increase in relative humidity. To 100%.
That means that the presence of water vapor by definition.
“Clouds will be at a cooler temperatures than the surface hence incapable of absorbing radiation from the warmer surface.”
Huhh??
Magic these clouds it seems.
“Unfortunately, there is no comprehensive theory that demonstrates how clouds affect global warming.”
There is no comprehensive theory.
A clouds make them pee the pants.
Judith Curry has looked at clouds.
stephen…”Vournas theory trumps”.
***
Moral: Never argue with a wise Greek bearing gifts of scientific wisdom.
I thought the moral was never accept Greek gifts, Gordo.
Please advise.
No advice needed. Willard is an idiot.
GR,
WV molecules dont produce heat they slow the flow of energy from surface to TOA. More WV molecules means more energy is in the atmosphere at any time. That means the atmosphere is warmer.
http://thelightfootinstitute.ca/imglib/Earth_temp_paper.pdf
“Earths Temperature Versus the Sun, Water Vapor and CO2”
DOI Not Found
The “paper” is not in google scholar, either.
I doubt it has been peer-reviewed, and no proof that it has actually been submitted to a reputable journal.
See for yourself. This is the DOI given at the link:
10.29169/1927-5129.2021.17.05
Paste it into the DOI search engine:
https://www.doi.org/
I note that the DOI includes the date?? Highly unusual. So I then searched for the journal under some of the major science portals that rank journals. Of several checked, only one mentioned the journal, and it had 2 reviews (reputable journals get hundreds).
Looks like a vanity journal that publishes if you pay.
I went to the bother of checking it out, because the very first sentence in the abstract is utter BS.
“The IPCC report Climate Change 2013: The Physical Science Basis (AR5) has two opposing claims as causes for an increase in the Earths temperature in the decades leading up to 2011.”
Barry,
Your post is an example of disinformation. The key word ‘doi10.29169’ in GOOGLE produces the abstract of the paper with option to download it as a pdf. If you had looked where he said, you would have seen exactly what he said you would. It is what he used in his analysis:
From AR5, Physical Science Basis (RF = radiative forcing), Summary for policy makers
p.13 The total anthropogenic RF for 2011 relative to 1750 is 2.29 [1.13 to 3.33] W m−2 (see Figure SPM.5), a
p.42 The magnitude of the observed global change in tropospheric water vapour of about 3.5% in the past 40 years is consistent with the observed temperature change of about 0.5°C during the same period, and the relative humidity has stayed approximately constant.
It is NOT BS.
Some Journals, including Nature and AMS charge to publish. I didn’t find where SETpublisher charges.
No disinformation in my post. Everything I said was true.
I put exactly what you said in google – not a method I would undertake to assess the provenance of a supposed published paper!! – and got a bunch of abstracts, not one of which was the one you mentioned.
Here is the google search string I got following your instruction:
https://tinyurl.com/bxp8fe2x (this website doesn’t like some of the string, apparently, so it is shortened to a tinyurl)
Sure you’re not seeing it because your browser remembered the page you previously visited?
Anyway, the paper is nor listed in google scholar, nor is the doi listed in the DOI search engine. Anyone can check that fr themselves. I wonder if you bothered. Probably not or you would have said something about it, being an honest interlocutor willing to be candid in a frank discussion. Right?
What I said about the journal was true. You can look for yourself and see how many mentions it gets in the reputable master lists. Don’t forget to check the impact factor – if you can find it.
As for IPCC 2013. The Summary for Policymakers only has 29 pages. Yet the water vapour quote is from page 42???
So as usual with this shit, I google and find the quote you provided actually comes from the Technical Summary.
How did you not know this? Because you didn’t check the source.
(Just briefly here – fuck you. At least do some basic homework if you’re going to post and then defend this guff)
And what does the Technical Summary say on page 42?
The paragraph within which the quote you cited appears begins with this illuminating sentence.
“Because the saturation vapour pressure of air increases with temperature, it is expected that the amount of water
vapour in air will increase with a warming climate.”
IOW, warmer air temperatures increase the amount of water vapour, according to the IPCC, and “is consistent with” means that the increase in water vapour is consistent with the amount of temperature change.
The authors of the so-called paper got cause and effect the wrong way around. Either they are incredibly stupid, because the text from the IPCC is VERY clear, or they are lying either to themselves or to their readers by saying the IPCC has “two opposing claims as causes for an increase in the Earth’s temperature.”
Yes, it IS BS.
If this submission typifies your dedication to facts and careful scholarship, then shove your “propaganda” where you imagine I think it should go.
Don’t waste people’s time with this crap. Please. It takes you a few seconds to post bull. It takes honest people more time to unlace it (luckily not too long this time). I’m not wasting any more on this.
Should have said “disinformation” where I said “propaganda.”
(At least one of us will correct the record)
Barry,
I tried a GOOGLE search for doi10.29169 from a cold boot and got nothing useful, probably same as you got. I know GOOGLE censors stuff they disagree with so I tried searching on Duckduckgo and got nothing there either. So apparently you are right about my browser remembering. I did a GOOGLE search on the exact title and eventually led to the paper in Researchgate. The DOI or where it is published or impact factor are not important to me. I judge papers on their content not by how popular they are. Peer review and some journals can usually keep out the incompetent stuff but the shortfall is that they are likely to block anything that seriously challenges their perceptions.
You were looking in the wrong place for the verification of what you called “utter BS”
The correct place to look is the “Physical Science Basis” as I said. Apparently you didn’t do “some basic homework”
If you will look where you were told you will indeed find that yes the IPCC makes ”two opposing claims as causes for an increase in the earth’s temperature.” The two claims are 29 pages apart.
I hope your post doesn’t typify “your dedication to facts and careful scholarship . . .”
The only way to avoid ever making a mistake is to never do anything. I apparently got misled by my browser.
The WV increase trend of the numerical data reported by NASA/RSS is about 25% higher than calculated in GCMs. Because the GCMs don’t account for another source for WV, they must be using temperature increase alone. They cannot both be correct. Besides, the WV increases because of the saturation vapor pressure vs temperature for water. Temperature increase of the water can force more WV into unsaturated air. When the saturation vapor pressure is more than the partial pressure of WV in the atmosphere at surface level the WV increases (limited by saturation in the air). If the atmosphere gets warmer it takes more WV for saturation.
Dan, you seem to not know what you are talking about. I found the quote you provided in the Technical Summary, which is one section of the “Physical Science Basis” comprising 14 chapters, the SPM and other sections. It’s also referred to as WG1, or Working Group One.
https://www.ipcc.ch/report/ar5/wg1/
Go and look for the quote – page 42 of the Technical Summary. You will see the paragraph in which it sits and my correct quote of the first sentence which explains that WV rises as a result of temperature rise, and that the paper you cited therefore baldly.misrepresents the IPCC.
Do the fucking homework you lazy ass
Stop being so demonstrably wrong. Stop posting misinformation.
Here’s the paragraph. I don’t trust you to check yourself.
“Observations of Water Cycle Change
Because the saturation vapour pressure of air increases with temperature, it is expected that the amount of water vapour in air will increase with a warming climate. Observations from surface stations, radiosondes, global positioning systems and satellite measurements indicate increases in tropospheric water vapour at large spatial scales (TFE.1, Figure 1). It is very likely that tropospheric specific humidity has increased since the 1970s. The magnitude of the observed global change in tropospheric water vapour of about 3.5% in the past 40 years is consistent with the observed temperature change of about 0.5C during the same period, and the relative humidity has stayed approximately constant. The water vapour change can be attributed to human influence with medium confidence.”
Do you think for one second that the quote you provided, that appears in the middle of this paragraph, indicates that global temperature has risen due to an increase in WV?
If so, you are as stupid – or deceitful – as the authors of the paper you cited.
Utter. B. S.
And I am truly done with this you lazy time-waster.
I wonder if you are always an arrogant asshole or only if you think someone has made a mistake. Perhaps you are putting on a show because you are afraid that you might be wrong.
Apparently you found the 49+ mb file at https://www.ipcc.ch/site/assets/uploads/2018/03/WG1AR5_SummaryVolume_FINAL.pdf
On page 42 I see that you found the second quote and bolded it. The NASA/RSS data trend shows WV increase of 5% in 34 months so my guess is that they extracted the 3.5% in 4 years from one of the faulty GCM models.
The first quote doesn’t have the word ‘claim’ in it either. Both quotes are just observations of data. Apparently you got all tense because he used the word ‘claim’ instead of ‘observed’ or something.
Perhaps given your apparent bias, you failed to benefit from his work. The object of Lightfoot’s paper was to determine the contribution of each gas to planet warming. Using their observations he found that the main contributor to planet warming was WV increase and contributions from CO2 and other ghg were insignificant. In all your ranting, you never pointed out where that conclusion was wrong.
““The IPCC report Climate Change 2013: The Physical Science Basis (AR5) has two opposing claims as causes for an increase in the Earths temperature in the decades leading up to 2011.”
THAT is what I quoted as BS. The first sentence of the abstract. That is what you are trying to defend. The IPCC paragraph that contains the quote that you cited to defend the position is clear: higher temps leads to more WV. Your authors reverse cause and effect when quoting the IPCC in this section.
Utter. B.S.
Enough.
ken…”Current GHG reduces direct thermal radiation to space by 342Wm-2″.
***
I agree with a lot of the stuff you are saying but we need to get on the same page re the science. For one, there is no such thing as thermal radiation. Heat cannot be transferred via radiation, the process is more complicated and it’s important to understand it.
Heat on a surface, like a mass, is converted to electromagnetic energy AND IS LOST in the conversion. In other words, the surface emitting the EM cools. The energy moving through space has nothing to do with heat and its properties are nothing like the properties of heat, which requires atoms in a mass.
EM is comprised of an electric field perpendicular to a magnetic field and it has a certain frequency. Heat is the kinetic energy of atoms and cannot exist without mass. Until EM comes in contact with a lower energy mass it can heat nothing and it carries no heat.
If the radiated EM contacts a surface that is cooler than the emitting surface, the EM will be absorbed, and that will raise the temperature of the target surface. That’s because electrons at a lower energy level are driven to a higher energy level when they absorb it. That increases their KE, which is heat.
Conversely, if the EM contacts a surface that is hotter than the emitting surface, the electrons in that surface will ignore the EM. If electrons are sitting at a higher energy level on a target, EM from a lower temperature emitter lacks the energy and/or frequency to drive the electrons any higher.
Heat is not transferred between objects by radiation, heat is lost in one object and gained in the second, however the gained heat is produced within the target. No heat moves through space.
Secondly, it is not true that GHGs reduce radiation to space by 342 W/m^2. At best, GHGs absorbed about 5% of emitted surface radiation, which is not heat. Remember, the heat was lost at the surface during conversion.
It’s dodgy science like this that allows alarmists to spread their propaganda. They make it up as they go along just as covid alarmists fabricate their propaganda while trying to ensure that skeptics are never heard.
It’s a form of scientific fascism.
“if the EM contacts a surface that is hotter than the emitting surface, the electrons in that surface will ignore the EM.”
So the energy is just lost? I think not.
RLH, Gordo’s been repeating his claim ever since I presented my Green Plate demos back in 2018. He still hasn’t come up with an explanation for the warming I observed in the Blue Plate. It’s part of his claim that “warming by back radiation” violates the 2nd Law. He may have been an electrical engineer, but he isn’t a Mechanical Engineer, where IR radiation shields are accepted practice.
swannie…”RLH, Gordos been repeating his claim ever since I presented my Green Plate demos back in 2018. He still hasnt come up with an explanation for the warming I observed in the Blue Plate…”
**
Swannie the comedian. I have explained it at least a dozen times.
The warming is a result of blocking the ability of a body to dissipate heat.
In your first experiment, you placed a surface closely over a heated surface. Before placing the 2nd surface, the heated body had reached an equilibrium with the atmosphere. When you inserted your 2nd unheated body, you blocked convection and radiation from the heated body, therefore its temperature rose.
In your second experiment in a vacuum, you recorded the temperature of a plate in place in the vacuum chamber. Then you raised a metal plate in front of it in close proximity, effectively blocking half the radiation from the stationary body. By blocking its ability to dissipate heat via radiation you caused its temperature to rise.
Gordo, My final “cookie sheet” demonstration added a fan to promote convection from the heated plate. The difference between the high IR transmission food wrap and the metal cookie sheet was due to the difference in IR transmission of the two materials. The same was true for the Green Plate demo, where convection was effectively eliminated, when the Green plate was placed to intercept the IR from the Blue one, causing back radiation from Green to Blue, the Blue then warmed. There’s no “blocking” of the emissions from the Blue, that’s your own delusional excuse.
Hughes debunked you.
where tho
Search for "Geraint Hughes Green Plate Effect"
Thanks:
https://www.drroyspencer.com/2019/12/cmip5-model-atmospheric-warming-1979-2018-some-comparisons-to-observations/#comment-417216
Since Wilhelm referred to your favorite content farm, he can only be right!
Ah, no substantive response. Understood. Just Willard being Willard.
That’s where you’re wrong, Kiddo. Your handwaving lacked substance. My response was more than commensurate.
I can add more:
https://wattsupwiththat.com/2017/08/20/a-consensus-of-convenience/#comment-2133555
Ah, no substantive response. Just Willard being Willard. Understood.
pups, You still don’t understand that Hughes’ experiment was hopelessly flawed.
Firstly, he used a mechanical vacuum gauge instead of a much better electronic one, so he could not support any claim regarding suppression of convection due to the vacuum within his tube. Second, he used an ordinary immersion digital thermometer to measure his heated (blue) plate, with the tip sitting in a larger diameter “well” with contact only at the tip of the device. Third, he didn’t measure the temperature of his green plate. Fourth, he had to open his device to add the green plate, then evacuate again, both times gathering data soon after turning on the vacuum pump. With my setup, it took quite a while for the system to reach equilibrium, at which point, I raised the Green plate and recorded the change in temperature of both plates.
No, pups, Hughes didn’t “debunk” my demonstration.
1) The gauge is adequate to ensure there was sufficient vacuum in the tube.
2) So?
3) The blue plate temperature is all that needed to be measured.
4) Even so, if the addition of the green plate caused the blue plate to be at a higher temperature, it would have been recorded. It was not.
Additionally, your setup featured a large weight which was moved in and out of view of the blue plate:
https://principia-scientific.com/greenplate-effect-it-doesnt-happen/#comment-28851
DREMT
On another thread by Geraint Hughes I questioned his set-up. He was not controlling the temperature of the surrounding glass. Glass is a very good IR emitter (average glass 0.92 in the IR bands) via this chart:
https://www.thermoworks.com/emissivity-table
His glass surrounding structure was hot. The IR the glass would emit to the plates would negate the very effect he was investigating. I suggested to him that he not use two plates (one heated and one not) but just vary the temperature of the surrounding glass and wee if it effected the temperature of the heated plate on the inside.
I am not sure why you have difficulty understanding radiant energy transfer.
EMR travels in all directions from an emitting surface. It is converted into thermal energy when it is absorbed by a surface.
If you have two objects they radiate EMR toward each other. Both will absorb and emit EMR.
It really is valid physics. Attempting to change it does not make a valid point. The complete deranged lunatize Joe Postma cannot grasp simple heat transfer physics. When you explain it to him he wigs out to the max. Do not be a Joseph Postma, an irrational cult leader.
Norman, Swanson had "surrounding glass" also.
DREMT
Yes Swanson did indeed have glass surrounding his plates. However E. Swanson showed the temperature as a variable in the experiment.
Geraint’s glass was at the temperature of the plates. It was hot glass. E. Swanson’s was not.
https://app.box.com/s/5wxidf87li5bo588q2xhcfxhtfy52oba
If the jar temperature is as warm as the heated plate it will emit as much IR as the plate and hence there would be not change in temperature for a non-heated plate in the glass. It would have reached the same temperature.
You can do a very simple experiment (even keep air in the container).
Put a heat lamp inside a jar with a plate above it. Monitor the plate temperature. Once it reaches a steady-state temperature start altering the temperture of the surrounding glass. Maybe cooling it with ice and then warming it with hot water. If changing the temperature of the outside glass alters the temperture of the heated plate it would prove to you Geraint Hughes is incorrect as are Postma and all the rest who do not actually understand real heat transfer.
"Geraint’s glass was at the temperature of the plates. It was hot glass."
How do you know?
pups, thanks for reminding us about all that fluff from Zoe Phin, including the canard about the mass of the lead filled weight. Those with any serious interest can read all the posts in the thread. While we’re at it, we are reminded that pups is just another incarntation of “Huffingman”, an previous obnoxious troll around here who apparently can’t post these days.
No, I am not who you think I am.
DREMT
I believe I asked him about the glass in his second experiment in the comments. When I looked at his second post it had no comments remaining. Not sure why all the comments were removed.
OK, Norman. I very much doubt he said that the glass of his apparatus was as hot as the heated plates, but never mind.
rlh…”if the EM contacts a surface that is hotter than the emitting surface, the electrons in that surface will ignore the EM.
So the energy is just lost? I think not”.
***
I did not say it was lost, I merely said it was ignored. We know the energy does not simply disappear.
Maybe I am giving too much credit to electrons in claiming they can ignore energy that has insufficient intensity or frequency to raise them to a higher energy levels. However, it is such science upon which the 2nd law of thermodynamics is based.
In quantum theory, the electron action is well documented both theoretically and mathematically. The energy level between electron orbitals is a potential difference measured in eV. The orbitals are defined so that the lowest level, ground state is at minus infinity. and zero is defined as the distance an electron must be to be outside the influence of the positive nucleus.
Since the PD increases from ground state outward, there must be a gain in kinetic energy between the same states. If a higher PD is PD2 and a lower PD is PD1, then the energy emitted by the electron in dropping between those states is PD2 – PD1 = hf = KE. So, a quantum of EM emitted in such a scenario is Planck quantum factor h times the frequency of the electron at the higher orbital level.
If the EM is incoming, the same applies. The energy of the EM required to raise the electron to a higher orbital energy level, hence a higher KE, must be at least PD2 – PD1 in the receiving atom. If that energy is coming from a cooler source it means that PD2 – PD1 is already too low to affect the electron, so it is ignored.
That is the orbital energy level, en masse, is a measure of the KE of the whole, hence the heat of the whole. That’s why when electrons emit EM en masse the body must cool. Or, if the electrons absorb EM en masse, the body must warm. Therefore PD2 -PD1 will always be lower in a cooler body than in a hotter body.
This upholds the 2nd law claim that heat can never be transferred by its own means from a cooler body to a hotter body, The 2nd law applies to all modes of heat transfer: conduction, convection, and radiation.
Gordo, As a non-theoretical physicist, if the IR energy emitted is a function of discrete transitions between each atom’s electron “orbits”, why does the IR spectrum of emissions from a solid body exhibit a continuous spectrum peaking at one frequency with declining intensity to each side of that frequency?
That would seem to imply that there is a continuous range of your orbital transitions all emitting at once. From this, one might think there’s no reason that said body at a higher temperature couldn’t absorb the IR radiation from a lower temperature body, the incoming radiation interacting with those atomic “orbits” of atoms which had just shifted to a lower state after emitting an IR photon.
The incoming IR radiation isn’t ignored, it’s absorbed.
swannie…”why does the IR spectrum of emissions from a solid body exhibit a continuous spectrum peaking at one frequency with declining intensity to each side of that frequency?”
***
Because the IR radiation comes from bazillions of atoms of different substances that radiate at different frequencies and have different temperatures.
If you get to the atomic level, you find that hydrogen, for example, radiates and absorbs at discrete frequencies and each frequencies is directly related to specific orbital energy levels over which the electron can jump.
You can see from the following that the element sodium radiates at very specific frequency bands.
https://www.chem.uci.edu/~unicorn/old/H2A/handouts/PDFs/sodium.pdf
Gofdo is confused again. He ignored the basis of my comment regarding the IR emission spectra from solid (or liquid) materials, jumping to that from gasses, which are widely known to exhibit discrete “lines” in their emission spectra.
Again, Gordo, any material which emits IR radiation at some wavelength will also absorb at that wavelengths. That fact does not violate the 2nd Law.
“I did not say it was lost, I merely said it was ignored. We know the energy does not simply disappear.”
So we have a choice then. Either the energy was reflected or it was transmitted unchanged (as though the mass was transparent).
RLH, No, the IR radiation energy is absorbed, unless the material is transparent at those wavelengths.
Well it has to be 1 out of the 3.
Gordon Robertson
ken…”Current GHG reduces direct thermal radiation to space by 342Wm-2″.
***
I agree with a lot of the stuff you are saying but we need to get on the same page re the science. For one, there is no such thing as thermal radiation.
***
Thermal radiation is electromagnetic radiation generated by the thermal motion of particles in matter. All matter with a temperature greater than absolute zero emits thermal radiation. Particle motion results in charge-acceleration or dipole oscillation which produces electromagnetic radiation.
The thermosphere has very hot thermal radiation and thermosphere has no temperature.
Sun’s corona [1 million C] is also similar.
They share the same low density.
CO2 is very part of Earth atmosphere, or it’s low density within
the higher density of N2 and O2 gases.
Or Mars with it’s low density atmosphere of 25 trillion tons of CO2
has higher CO2 density than Earth has by around factor of 30.
Yeah, we need to get on the same page:
https://ddears.com/2021/01/12/dr-happer-explains-effects-of-co2/
ken…”Yeah, we need to get on the same page:”
***
OK, I’ll play your game for the moment, although you are refusing to think for yourself and using Happer as an authority figure.
I don’t disagree with Happer in an overall sense I just disagree with his methodology in explaining science. He uses generalizations and claims that can be easily disproved.
For example, he claims early in his article…
“Atmospheric concentrations of carbon dioxide, methane, nitrous oxide and other greenhouse gases are slowly increasing. Some say this will soon cause runaway global warming of Earths surface. Few realize how little scientific support there is for this concern”.
He admits there is little scientific evidence to support this theory then he goes on to apply the theory. On the other hand, a scientist from early in the 20th century, R. W. Wood, who was a world renowned expert on gases like CO2, said he could not see how CO2 in such a low concentration could be related to warming in the atmosphere. Happer makes it sound like such warming is a fait accompli and on the other hand he claims it is bad science.
Can’t have it both ways. If a trace gas is incapable of causing catastrophic warming it is incapable of the radiation blocking claimed by Happer, for the same reason.
I agree with this statement from Happer…
“The representative decrease of clear-sky thermal radiation to space from doubling carbon dioxide concentrations, 3 Wm-2, is an important number to remember. Other important numbers are the mean solar flux, 1360 Wm-2 or the 91 Wm-2 change in this flux from summer to winter. If 3 Wm-2 sounds small in comparison, it is indeed very small. Great efforts are needed to concoct a scientific argument that 3 Wm-2 is worth worrying about”.
This statement is too generalized and lacking a good scientific basis…
“Despite its thinness, the Earths atmosphere, together with the oceans that cover about 70% of the Earths surface, have a very large effect on how the heat from the Sun returns to space. This is because the atmosphere and the oceans transport heat very efficiently by convection from equatorial regions, where the yearly-averaged solar heating is maximum, to the poles where there is minimum heating”.
The heat from the Sun is a poor scientific statement. There is no heat delivered from the Sun through space. The heat causes by EM radiation from the Sun is created on the Earth. You may think my objection trivial but Happer’s words are the basis of much of the misunderstanding of the 2nd law and how heat is transferred.
The EM from the Sun is not the same EM that leaves. The lower frequency IR that leaves in a product of the conversion of high intensity SW solar radiation by surface mass to a much lower intensity, lower frequency terrestrial radiation.
Furthermore, Happer does not explain the mechanism by which only trace gases radiate to space and how they can accomplish the vast amount of heat dissipation required from the surface.
Once again, poor science…
“There is nothing to convect heat into the vacuum of outer space. So solar heat must eventually return to space as thermal radiation. But the heat can be emitted thousands of miles from where it was absorbed”.
Heat cannot be emitted!!! He admits heat cannot be transferred (convected) through the vacuum of space then he claims heat can be ’emitted’.
More bad science…
“The emission rate of thermal radiation by cloud tops or by land and ocean surfaces is proportional to T4, the fourth power of the absolute temperature T. As we discuss below, the emission of thermal radiation to space is more complicated and more affected by greenhouse gases in cloud-free areas of the Earth”.
The emission ‘rate’ is not T^4. That represents the INTENSITY of thermal radiation emitted by a surface of area, A. In fact, the emission rate is dependent on a temperature difference between two masses. The S-B equation has nothing to do with the rate of heat dissipation, it merely indicates the intensity of the radiation due to a surface temperature, T.
S-B was developed by Stefan. He based his theory on the work of Tyndall, who heated a platinum filament electrically, noting the different colours it gave off at different temperatures ranging from about 700C to 1400C. Another scientist related the colours to EM frequencies and from that Stefan managed to related the EM and their relationship to temperatures. He found the relationship was to the 4th power.
However, T^4 applies only in that temperature range.
That has nothing to do with cloud top radiation intensities. S-B applies in the range 700C – 1400C and scientists have taken great license by applying it to different temperatures.
The emission rate of clouds or any other surfaces is related to the difference in temperature between that surface and the surrounding atmosphere. That surrounding atmosphere is 99% nitrogen and oxygen, and it has to be O2 and N2 that control the rate of surface radiation or any other surface radiation.
Happer loses the context by harping on about CO2, WV, etc., forming a symphony. This is not a serious article.
In conclusion, Happer talks in generalities without focusing on a specific explanation. You don’t strike me as the type who will receive such criticism objectively, you will dismiss my effort without doing your own research.
I have arrived at my opinions over decades and I have done that from a strong scientific background. At the same time, I believe nothing, not even my own opinions. Every opinion is open to error but you have yet to begin examining the errors in your own opinions.
If you take affront at this, you have no future in science. A real student of science would research the theories that counters my arguments, if they are there.
IIRC the classic definition of energy was “capacity for doing work”. Early in my education I was taught that a quantity of energy could be converted from one form to the same quantity in another form.( less a small but inevitable loss as heat due to LOT)
Perhaps you would care to discuss the different forms that energy takes as it moves into through and out of Earth’s surface oceans and atmosphere.
While I think Happer has missed several critical points, we see here another delusional rant from Gordo who wrote:
Gordo claims to have “a strong scientific background”, but completely misses the well known facts about the IR emissions from O2 and N2, which are nearly zero in the atmosphere. The measured spectral emissions from space above TOA include major contributions from the greenhouse gases, in spite of the fact that they are small fractions of the total mass.
Perhaps Gordo should read the references in Happer’s piece (as will I, later).
O2 and N2 are not as efficient as emitting IR as are the GHGs, which is why O2 and N2 hold on to the bulk of the heat, making the surface warmer than it would otherwise be.
Besides, every Dragon crank knows that adding GHGs would increase emissivity, not decrease it.
"Ron C. says: May 3, 2014 at 3:33 pm
Another way to put the issue.
The CO2 hysteria is founded on a false picture of heat flows within the climate system. There are 3 ways that heat (Infra-Red or IR radiation) passes from the surface to space.
1) A small amount of the radiation leaves directly, because all gases in our air are transparent to IR of 10-14 microns (sometimes called the “atmospheric window.” This pathway moves at the speed of light, so no delay of cooling occurs.
2) Some radiation is absorbed and re-emitted by IR active gases up to the tropopause. Calculations of the free mean path for CO2 show that energy passes from surface to tropopause in less than 5 milliseconds. This is almost speed of light, so delay is negligible.
3) The bulk gases of the atmosphere, O2 and N2, are warmed by conduction and convection from the surface. They also gain energy by collisions with IR active gases, some of that IR coming from the surface, and some absorbed directly from the sun. Latent heat from water is also added to the bulk gases. O2 and N2 are slow to shed this heat, and indeed must pass it back to IR active gases at the top of the troposphere for radiation into space.
In a parcel of air each molecule of CO2 is surrounded by 2500 other molecules, mostly O2 and N2. In the lower atmosphere, the air is dense and CO2 molecules energized by IR lose it to surrounding gases, slightly warming the entire parcel. Higher in the atmosphere, the air is thinner, and CO2 molecules can emit IR and lose energy relative to surrounding gases, who replace the energy lost.
This third pathway has a significant delay of cooling, and is the reason for our mild surface temperature, averaging about 15C. Yes, earth’s atmosphere produces a buildup of heat at the surface. The bulk gases, O2 and N2, trap heat near the surface, while CO2 provides radiative cooling at the top of the atmosphere."
Isn’t that when Roy wrote Skeptical Arguments that Dont Hold Water, Kiddo?
The comment was not even from this blog, C*nto.
Not my problem, Kiddo.
Will the green plate be your last dance?
Asking for a friend.
Ignoring you for a friend, C*nto.
That’s where you’re wrong, Kiddo.
O2 and N2 aren’t absorbing IR. They absorb heat at the surface thru conduction and move it up into the atmosphere thru convection.
Agreed.
Keep in mind the article is an attempt to distill the essentials from his paper into an article that most people can understand.
Here is the source document: https://arxiv.org/pdf/2006.03098.pdf
Ken, van Wijngaarden and Happer’s article contains quite a bit of complicated details of physics which would take a PhD to sort out.
Funny thing, right off the bat, I saw something I think to be clearly wrong. They wrote:
.
What’s this? H2O has 10 times the density of CO2 or N2O? Not so from basic chemistry, the well known PV=nRT. Perhaps they mean to say “concentration” or “mass fraction”, not density. Be that as it may, the rest of their effort is much beyond my level of understanding.
Gordo,
Happer’s not saying the theory is true. He’s saying if it were true, it still isn’t a problem. Happer is also one of the contributors to Berry’s paper that falsifies AGW. I don’t think Happer believes CO2 is a problem.
This leads back to your formula being untenable on 2 grounds.
The first that it allows for a planet to be either having no rotation or infinite rotation breaking the speed of light.
The second is your use of terms to get to an eighth power.
SB to the forth power is hard enough to visualise and uses up every last bit of wriggle room in third dimensional mathematics.
It is physically and mathematically impossible to work in terms of powers to the eight for calculations.
Just looking at it makes one shudder.
Take it down to quantum terms where these concepts do exist and a lot of your stuff might be fine.
You have put a lot of time , thought and effort in, appreciated.
The concept of a more even spread of temperature with rotation leading to the temperature approaching the maximum permitted temperature for energy in, energy out is correct
The moon is rotating 27 to 29 days in its orbit around the sun depending on your choice of frame. This is easily shown by the fact that it over that time the sun gets to irradiate both sides in turn
The moon does not technically rotate in its travel around the earth as shown by the fact that the same side always faces the earth.
Isolate the two structures together and you will never see a rotation
In other words you are assigning the moons rotation as it orbits the sun to a fictitious mathematical orbit of the earth.
If one looks at the two bodies in isolation which is what you are doing in your other rotational calculations.
“The moon does not technically rotate in its travel around the earth”
The Moon rotates once on its own axis for every orbit of the Earth.
That issue has been settled. The moon does not rotate on its own axis.
Only in your tiny, tiny clique. The rest of the world accepts that the Moon rotates.
…but not on its own axis.
And so you’re proven wrong, Kiddo:
https://www.drroyspencer.com/2021/08/uah-global-temperature-update-for-july-2021-0-20-deg-c/#comment-831875
I was just saying goodbye on that thread, C*nto. I never said I was going to stop commenting.
The rest of the world accepts that it rotates on its axis, once per orbit of the Earth.
I doubt most people in the world are informed or particularly care on the matter either way, RLH.
That’s where you’re wrong, Kiddo. Unless you can provide a mathematical model for your crank Dragon intuitions, you got not case.
Here’s where you left your homework:
Yes, I was glad you left by agreeing with me that “orbital motion without axial rotation” is motion like the “moon on the left”, and not the “moon on the right”:
https://upload.wikimedia.org/wikipedia/commons/5/56/Tidal_locking_of_the_Moon_with_the_Earth.gif
And that the reason was “physics”.
That’s where you’re wrong, Kiddo:
https://www.drroyspencer.com/2021/08/uah-global-temperature-update-for-july-2021-0-20-deg-c/#comment-831863
Considering that your Master Argument does not contain any claim that pertains to physics, it can’t support any physical conclusion.
Your version of my supposed "Master Argument" is simply a collection of small snippets of quotes I have made, taken out of context. Some of them (for example, IMPOSSIBLE) are not even my own words at all. It’s sweet that you hang on (or try to twist) my every word to this extent, but it’s not really anything resembling my full argument. You have left out all the physical arguments made by myself and others, relating to the mechanics of orbital motion itself (e.g. the discussions surrounding "Newton’s Cannonball", many of Gordon’s, Clint R and Swenson’s comments, etc. etc.). If you leave out the physics, don’t blame me for it.
That’s where you’re wrong, Kiddo:
You can’t claim that the Master Argument is a collection of snippets in one sentence and in the next claim that some of them are not snippets at all.
Every single claim can be supported.
You said them more than a thousand times.
Besides, Pup never makes any argument, most of Gordo’s crap is barely coherent, and if you need to rely on Mike Flynn for your physics, well best of luck!
Nevertheless, you are free to refer to any physical point you made that would support your argument. The argument you tried in that other thread ain’t it:
https://www.drroyspencer.com/2021/08/uah-global-temperature-update-for-july-2021-0-20-deg-c/#comment-831339
Please, do continue to try to lie about what I said.
Call me a liar, and the discussion is over.
That’s where you’re wrong, Kiddo:
That you’ll do all by yourself.
Please support your claim that I was agreeing with you that orbit without spin is like the moon-on-the-left and not the-moon-on-the-right.
That is just how it read to me. But you do have trouble expressing yourself clearly.
That’s where you’re wrong, Kiddo:
https://www.drroyspencer.com/2021/08/uah-global-temperature-update-for-july-2021-0-20-deg-c/#comment-831216
So you’re trolling once again.
No, specifically the comment quoted at 12:22 PM. The way that read to me, at the time (over on the other thread), seemed like agreement. Obviously I knew that it would not turn out to be the case, but there you go.
You’re obviously trolling, Kiddo, for here’s what I said earlier:
https://www.drroyspencer.com/2021/08/uah-global-temperature-update-for-july-2021-0-20-deg-c/#comment-831028
P1 and P2 are true, and of course C follows.
I know what you said, Willard, but you finished with what looked like an agreement. The comment I referred to previously. That is just how it read. Still does. But you say you disagree, so that is fine.
That’s your opinion, Kiddo.
Your inference is wrong: your conclusion is about physics and your two premises are about geometry.
The two premises are also falsified by just about every mathematical model we have of two bodies, one being the satellite of the other.
All wrong, Willard.
That’s your opinion, Kiddo.
Should be easy to show where you have any physics component in