The Version 6.0 global average lower tropospheric temperature (LT) anomaly for November, 2021 was +0.08 deg. C, down substantially from the October, 2021 value of +0.37 deg. C.
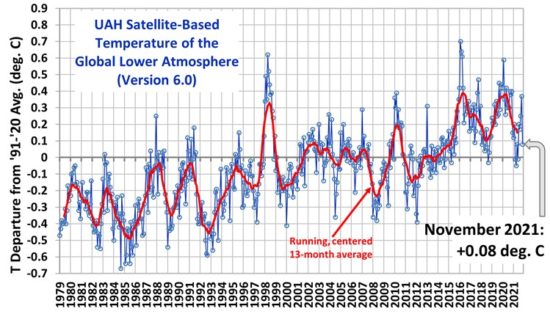
The linear warming trend since January, 1979 remains at +0.14 C/decade (+0.12 C/decade over the global-averaged oceans, and +0.18 C/decade over global-averaged land).
Various regional LT departures from the 30-year (1991-2020) average for the last 23 months are:
YEAR MO GLOBE NHEM. SHEM. TROPIC USA48 ARCTIC AUST
2020 01 0.42 0.44 0.40 0.52 0.57 -0.22 0.41
2020 02 0.59 0.74 0.45 0.63 0.17 -0.27 0.20
2020 03 0.35 0.42 0.27 0.53 0.81 -0.95 -0.04
2020 04 0.26 0.26 0.25 0.35 -0.70 0.63 0.78
2020 05 0.42 0.43 0.41 0.53 0.07 0.84 -0.20
2020 06 0.30 0.29 0.30 0.31 0.26 0.54 0.97
2020 07 0.31 0.31 0.31 0.28 0.44 0.27 0.26
2020 08 0.30 0.34 0.26 0.45 0.35 0.30 0.24
2020 09 0.40 0.42 0.39 0.29 0.69 0.24 0.64
2020 10 0.38 0.53 0.22 0.24 0.86 0.95 -0.01
2020 11 0.40 0.52 0.27 0.17 1.45 1.09 1.28
2020 12 0.15 0.08 0.21 -0.07 0.29 0.44 0.13
2021 01 0.12 0.34 -0.09 -0.08 0.36 0.50 -0.52
2021 02 0.20 0.32 0.08 -0.14 -0.65 0.07 -0.27
2021 03 -0.01 0.13 -0.14 -0.29 0.59 -0.78 -0.79
2021 04 -0.05 0.05 -0.15 -0.28 -0.02 0.02 0.29
2021 05 0.08 0.14 0.03 0.06 -0.41 -0.04 0.02
2021 06 -0.01 0.31 -0.32 -0.14 1.44 0.63 -0.76
2021 07 0.20 0.33 0.07 0.13 0.58 0.43 0.80
2021 08 0.17 0.27 0.08 0.07 0.33 0.83 -0.02
2021 09 0.25 0.18 0.33 0.09 0.67 0.02 0.37
2021 10 0.37 0.46 0.27 0.33 0.84 0.63 0.06
2021 11 0.08 0.11 0.06 0.14 0.50 -0.42 -0.29
The full UAH Global Temperature Report, along with the LT global gridpoint anomaly image for November, 2021 should be available within the next several days here.
The global and regional monthly anomalies for the various atmospheric layers we monitor should be available in the next few days at the following locations:
Lower Troposphere: http://vortex.nsstc.uah.edu/data/msu/v6.0/tlt/uahncdc_lt_6.0.txt
Mid-Troposphere: http://vortex.nsstc.uah.edu/data/msu/v6.0/tmt/uahncdc_mt_6.0.txt
Tropopause: http://vortex.nsstc.uah.edu/data/msu/v6.0/ttp/uahncdc_tp_6.0.txt
Lower Stratosphere: http://vortex.nsstc.uah.edu/data/msu/v6.0/tls/uahncdc_ls_6.0.txt
On another note, the next New Moon is December 4 02:43 EST and it’s a Super Moon, as it is near perigee (04:57:42 EST) and it’s also going to produce a solar eclipse. The result is near maximum tidal stress, which may (or may not) produce interesting results. Some researchers claim that earthquakes are influenced by Lunar tides. If so, things might get interesting in a couple of days.
Glad I don’t live in California!
There’s not been much earthquake activity today, accept for the massive eruption of Mt Semeru in Indonesia. Early media reports suggest it happened at about the time of the Solar Eclipse and Lunar perigee, about 14:30 local time (07:30 GMT) according to the BBC.
There may be some climate impact from the eruption, depending on the volume of sulfate lofted into the Stratosphere.
Here’s some coverage:
https://abcnews.go.com/International/wireStory/indonesias-semeru-volcano-erupts-spews-huge-ash-cloud-81554692
https://www.bbc.com/news/world-asia-59532251
https://www.cnn.com/2021/12/04/asia/indonesia-mount-semeru-eruption-intl/index.html
The event at Semeru was a pyroclastic flow – NOT an eruption.
Deep sea Anglerfish just washed up San Diego beach. Harbinger of big earthquake.. they say. Soon we’ll find out.
But hey Roy, thank you for the update. We are freezing up here in Finland and lakes are already frozen (neighbours are icefishing) one month earlier than normal.
SQ: PHILIPPINES PLATE IS BANGING ON THE PACIFIC PLATE TWISTING IT SO THAT IT IS DRIVING THE PACIFIC PLATE DEEPER INTO THE SUBDUCTION ZONE OF THE NORTH AMERICAN PLATE IN THE CASCADIA
Yeah, definitely something is going on.. watch out for this.
Sorry if this is a dumb rookie question but is the underlying data set that UHA derives its anomaly data from available? I presume there must be at least 12 monthly absolute temperatures from some year in the past.
UAH (apologies for the typo)
“LT departures from the 30-year (1991-2020)” The anomaly data is derived from the UAH data itself – the last 30 years.
Yes I see the “LT departures from the 30-year (1991-2020)”, but surely there must be some absolute temperature data somewhere in the system.
Anomalies (which are a comparison to a similar period covering 30 years previously) do not require any absolute data as such. They just compare the differences, now to then.
Occasionally Roy does produce an absolute data series as a reference which can be added to the Anomaly set if required.
Thanks, RLH, that’s exactly what I’m after. Do you have a link to any absolute data series Roy has made available in the past?
Blinny has published one recently
https://drive.google.com/file/d/1GYWNHBLQFRetPEJ-83c1Oeh-n8PbERt0/view
Maybe Binny could link me to the actual numbers as I can’t do much with a graph. But many thanks for posting that link, RLH.
Just a quick follow up, RLH. Is it not odd that Binnys graph shows the Earth is warmest when it is farthest from the sun?
Consider that warming is going to occur over land faster than it does over ocean. When Earth is closest to the sun it is summer in the Antarctic. Most of SH is ocean. So no its not odd that earth is warmest when it is farthest from the sun.
“Is it not odd that Binnys graph shows the Earth is warmest when it is farthest from the sun?”
You would have to do a land/ocean correction first/as well as there is more in one hemisphere than the other.
Ken says:
December 2, 2021 at 2:07 PM
"Consider that warming is going to occur over land faster than it does over ocean. When Earth is closest to the sun it is summer in the Antarctic. Most of SH is ocean. So no its not odd that earth is warmest when it is farthest from the sun."
That land warms faster than the ocean doesn't really hold water (sorry) in that hand-wavey argument as land will also cool faster. Surely therefore, on average, one would expect an increased insolation (when Earth is closest to the sun) to cause an increased average temperature irrespective of land/ocean ratio. I'm more inclined to think the difference in albedo, influenced by clouds and ice, between the hemispheres could explain why the NH is warmest even though it is farthest from the sun during its summertime. In that respect the land/ocean differences will have an effect. This would seem to fit with the Dubal and Vahrenholt (2021) paper that's discussed at length elsewhere in this discussion thread. In that paper it notes that the NH has 64% cloud cover, while the SH has 70%. I suspect the SH also has more ice cover than the NH during their respective summertimes.
I don’t think the absolute values are publicly available. But if it helps I think the absolute baseline is around -10 C.
Phil Harrison
” Maybe Binny could link me to the actual numbers as I can’t do much with a graph. ”
You are right! Coming soon, I’ll generate the time series anew.
I’m not aware of an official UAH baseline. However, there are gridded monthly absolute temperatures at this link:
https://www.nsstc.uah.edu/data/msu/v6.0/tlt/tltmonacg_6.0
A couple months back, I computed a monthly global baseline temperature for the UAH TLT period 1990-2020 from that dataset as follows:
Month 1 : 263.179
Month 2 : 263.268
Month 3 : 263.427
Month 4 : 263.843
Month 5 : 264.448
Month 6 : 265.099
Month 7 : 265.418
Month 8 : 265.233
Month 9 : 264.637
Month 10 : 263.945
Month 11 : 263.406
Month 12 : 263.191
Here’s an example with the UAH December gridded baseline.
Oh…that’s nice. I’m not sure how I missed that file. I think that is the absolute 1991-2020 baseline right?
I believe so. There is file documentation further up in the directory tree, but it doesn’t give code to read the tltmonagc files per se.
From context I believe the block identification line prior to each grid block (e.g.”1 9101 12012 LT” in the first line of the file) is saying
1 – month of year averaged
9101 – year 91 / month 01 is the start of averaged months
12012 – year 120 (from 1900 baseline) / month 12 is the end of averaged months
LT – Lower Troposphere product
Mark B
Many thanks for that info on tltmonacg_6.0. I've managed to import it into a spreadsheet so I can try to reproduce your monthly global baseline temperatures. In your post you get:
Month 1 : 263.179
However I can't reproduce that. I get:
Month 1 : 258.547
I just did a simple average across the 16 columns and 594 rows for month 1, obviously ignoring the pre and post blocks of '-9999's. Doing the 4th root, mean, 4th power gets a mean temperature slightly higher but still nowhere near your 263K. I'm obviously doing something wrong. I'd be very grateful for some guidance.
I think I realise my mistake. The surface area will reduce as latitudes head towards the poles so I need to adjust the averaging to accommodate that.
Success. I get a very slightly different value for month 1 by averaging the temperatures:-
Month 1 : 263.12
But close enough to think I’m doing the same calculation as Mark B.
However, I suspect averaging temperatures is not ideal since radiated energy is proportional to temperature to the 4th power (as per S-B). Converting the temperatures to radiated energy, then averaging, then back to temperature gives:-
Month 1 : 263.84
i.e slightly warmer. Maybe that is more accurate.
Mark B
Thanks a lot.
Could you repost the link to your wonderful graphics representing the UAH 6.0 LT grid for, if I well remember, August 2021?
Here’s November: uahTltNovember2021AnomalyGrid.png
Thank you very much, Mark B. Perfect work mixing a run over UAH’s grid data and its graphical representation.
Merci beaucoup – Vielen Dank.
That plot is done in Python using the free and open source “cartopy” package originally developed by the UK Met office, so the hard work is mostly done by others who have been generous enough to share the fruits of their labor.
Mollweide projections, being equal area, are much more ‘correct’ that Mercator.
Mark B
With reference to your computed monthly global baseline temperature I see month 7 (July) is the warmest. Isn’t that when the Earth is farthest from the Sun? I’m probably missing something that’s going to make me look spectacularly dumb!
My understanding is that July is the warmest because land temperatures have much larger seasonal swings than oceans and there is much more land area in the northern hemisphere. Thus the warmest absolute global temperature is in the middle of northern hemisphere summer.
You’ll notice from the December gridded baseline graphic that land area in the northern hemisphere is cool relative to the ocean at the same latitude and the reverse for the southern hemisphere.
Thanks for that, Mark B. I guess I didn’t expect land would have such a significant effect. I’m trying to understand the seasonal shape of the CO2 curve and it’s relationship with Earth’s orbit.
The annual CO2 cycle is related to seasonal vegetation growth, not to the Earth’s orbit. If it were related to apogee/perigee of the orbit there would be two cycles per year.
As I understand it, the annual CO2 cycle is related to sea surface temperature as well as land temperature and plant life. Given that 70 percent of Earths surface is sea, I would expect a signal in the CO2 cycle that is associated with sea temperature changing with the distance of the Earth from the sun. I guess it may be easier to see in SH sea temperature data. I presume that can be extracted from the UAH absolute temperature data.
“Given that 70 percent of Earths surface is sea, I would expect a signal in the CO2 cycle that is associated with sea temperature changing with the distance of the Earth from the sun.”
The annual outgassing signal:
https://i.postimg.cc/kGgnSb7S/Annual-CO2-Cycle-driven-by-Sun-and-Ocean.jpg
Thanks, Bob. Your link to an annual outgassing signal is very interesting. Are there any references to the data for that?
Normalized annual cycles derived from monthly averages:
Insolation (daily adj-obs flux):
ftp://ftp.geolab.nrcan.gc.ca/data/solar_flux/daily_flux_values/F107_1947_1996.txt
ftp://ftp.geolab.nrcan.gc.ca/data/solar_flux/daily_flux_values/F107_1996_2007.txt
ftp://ftp.geolab.nrcan.gc.ca/data/solar_flux/daily_flux_values/fluxtable.txt
Coral Sea:
http://www.bom.gov.au/web01/ncc/www/cli_chg/timeseries/sst/0112/cor/latest.txt
Niño3:
https://psl.noaa.gov/gcos_wgsp/Timeseries/Data/nino3.long.data
CO2:
ftp://aftp.cmdl.noaa.gov/products/trends/co2/co2_mm_mlo.txt
I can’t open those ftp links, Bob. Maybe access to those files isn’t enabled for a guest login to the ftp server.
Phil you’re going to need an ftp client like FileZilla to obtain files from an ftp site, as several browsers stopped supporting ftp transfers last year.
https://www.filezilla-project.net
Bob, still no luck using the FileZilla. No worries, I’ll see if I can find that data somewhere else.
Bob, I found the data at CelesTrak.com instead. Their ftp works fine in my browser.
Just in case its of use, the CelesTrak.com page with the insolation data is
http://celestrak.com/SpaceData/SpaceWx-format.php
In a Mercator projection which distorts the poles as contributing as mush effect as the much larger area that the tropics do.
Mollweide projections ush as Roy uses, being equal area, do not do that.
Phil Harrison
From RLH:
” Anomalies (which are a comparison to a similar period covering 30 years previously) do not require any absolute data as such. They just compare the differences, now to then. ”
*
RLH told you a lot of nonsense.
*
Roy Spencer does not publish absolute data, only anomalies wrt to the mean of the current reference period.
Anomalies exist in two different variants:
– monthly latitudinal and regional averages (the files you see on top of each monthly report thread)
– a monthly 2.5 degree grid containing the monthly anomaly for each grid cell, together with a 12-month 2.5 degree grid containing the climatology, i.e. for each grid cell the 30-month average according to the reference period.
To obtain absolute data is easy: like anomalies are computed as the subtraction of the climatology data from the original absolute values, these in turn can be obtained back by adding to each anomaly, cell after cell, the cell’s climatology data of the corresponding month.
The grid data for the lower troposphere (lt) is in
https://www.nsstc.uah.edu/data/msu/v6.0/tlt/
– anomalies
the files ‘tltmonamg.1978_6.0’ till (currently) tltmonamg.2021_6.0
– climatology
the file ‘tltmonacg_6.0’
The same structure as above is present for the three other atmospheric layers:
– mid troposphere (mt)
– tropopause (tp)
– lower stratosphere (ls).
“RLH told you a lot of nonsense”
And yet you post an absolute series for UAH monthly absolute (see below) and then claim it is not possible.
Not unusual for you.
RLH
” And yet you post an absolute series for UAH monthly absolute (see below) and then claim it is not possible. ”
Could you manage to exactly what you mean?
What is not possible?
Such comments claiming about what I wrote, but carefully avoiding any real reference to where I wrote it: that is indeed not unusual for you.
“Here is the UAH 6.0 LT time series for Dec 1978-Oct 2021, in absolute form:
https://drive.google.com/file/d/1TyfZM5OM4JJI-wh-6hHZby-cnt-gmTHD/view”
Now you see it.
“‘Anomalies (which are a comparison to a similar period covering 30 years previously) do not require any absolute data as such. They just compare the differences, now to then.’
RLH told you a lot of nonsense.”
Now you don’t.
Tell me how the anomalies are not a comparison to previous data then.
RLH, if you are not able to correctly, unequivocally formulate you insinuations, I will have to ignore them.
Tell me how anomalies are not comparisons to previous data, absolute or not.
RLH
” Tell me how anomalies are not comparisons to previous data, absolute or not. ”
I never wrote anything about that.
Why should I? The first time I had to do with anomalies was in 2008, and the first time I generate anomalies out of absolute data was 2015.
*
Look at your completely useless, nonsensical answer, in which Phil Harrison asks about absolute values, not about teaching him what he may have known longer than you:
” Phil Harrison says:
December 2, 2021 at 9:55 AM
Sorry if this is a dumb rookie question but is the underlying data set that UHA derives its anomaly data from available? I presume there must be at least 12 monthly absolute temperatures from some year in the past.
RLH says:
December 2, 2021 at 11:20 AM
Anomalies (which are a comparison to a similar period covering 30 years previously) do not require any absolute data as such. ”
But… you never admit anything.
“Anomalies (which are a comparison to a similar period covering 30 years previously) do not require any absolute data as such”
As many have pointed out before anomalies, like all differences, can be created without any reference to absolute data.
RLH
I forgot that you wrote another nonsense:
” And yet you post an absolute series for UAH monthly absolute (see below) and then claim it is not possible. ”
1. Where did I claim what ‘is not possible’ ?
*
” Not unusual for you. ”
2. Thanks for your subtle, insinuating polemic based on nothing valuable.
Blinny one of theses days you will admit that you cannot calculate averages accurately from already rounded data, but then again maybe you won’t.
Bindidon says:
December 2, 2021 at 12:50 PM
"Anomalies exist in two different variants:
– monthly latitudinal and regional averages (the files you see on top of each monthly report thread)
– a monthly 2.5 degree grid containing the monthly anomaly for each grid cell, together with a 12-month 2.5 degree grid containing the climatology, i.e. for each grid cell the 30-month average according to the reference period.
To obtain absolute data is easy: like anomalies are computed as the subtraction of the climatology data from the original absolute values, these in turn can be obtained back by adding to each anomaly, cell after cell, the cell’s climatology data of the corresponding month."
Many thanks, Bindidon, for that guidance. It's definitely helping me get off the ground with all this fabulous data provided by Dr Roy.
I'm not quite getting the relationship between the 2.5 degree segments across the globe and the 648×16 arrangement of the cells in the climatology and anomaly files. 648×16 corresponds to (I'm presuming) the sun facing half of the Earth which has 10368 x 2.5 degree segments. But where in 648×16 is, say, the tropics, or NH etc? I'd much appreciate any help on that.
Phil Harrison says:
December 23, 2021 at 8:56 AM
"I'm not quite getting the relationship between the 2.5 degree segments across the globe and the 648×16 arrangement of the cells in the climatology and anomaly files."
Update on that – I found a file that explains the format albeit for v5.6 but I presume it has not changed in v6.0.
https://www.nsstc.uah.edu/data/msu/docs/readme.msu
So the first block of '-9999's, 27 rows by 16 columns = 432 values. Each 72 values read in sequence 16+16+16+16+8 is the first 2.5 degree row. 8+16+16+16+16 is the second 2.5 degree row. 432 values in the '-9999' block is therefore 6 rows (15 degrees) where measurements are out of range of the satellite. If that all sounds like gobble-de-gook, apologies! If it's wrong, please put me right.
Correction – its 144 values, or 9 rows of 16, that represent each 2.5 degree of latitude I believe.
Phil Harrison
Sorry, I didn’t see this message.
You should move downthread with such news so we all can see them.
*
Your thoughts about this card puncher-like format are correct.
Each month consists of a 2.5 degree grid (72 * 144 data units: anomalies in anomaly files tltmonamg.xxxx_6.0, or absolute data in the climatology file tltmonacg_6.0).
Data units are 5 characters long.
The three southernmost resp. northernmost latitude bands do not contain valuable data in UAH6.0 (they did in UAH5.6).
Hence these 432 unit long series of ‘undefined’ i.e. ‘-9999’ at the beginning resp. the end of each month.
The climatology file has exactly the same layout as a complete year (12 month grids).
This format is valid for UAH5.6
https://www.nsstc.uah.edu/data/msu/t2lt/
and for all four atmospheric layers below
https://www.nsstc.uah.edu/data/msu/v6.0/
so you can generate time series for all five corners using the same software.
And that is how the absolute data for UAH 6.0 LT looks like:
https://drive.google.com/file/d/1j7EXbsXowdUvNz0BAZfBvG41PfFdVXeV/view
and the same data shown relative to its mean, allowing a comparison with the anomalies:
https://drive.google.com/file/d/1ifspSttvKBu240iBi_ErhtABhVv1XsV7/view
I can’t recall any absolute time series showing not only nearly the same trend as the anomalies derived out of it, but a trend even a tick higher…
Many thanks indeed, Bindidon, for providing that absolute data graph. I need access to open the second link but it looks like the first link is what I’m after if I can get at the actual numbers. I’m guessing the absolute data must have come from tltmonacg_6.0 which is in some format that I can’t open (I’m using a Mac – hopefully that isn’t the reason why). Could you link me to those absolute numbers in a csv or txt form?
Phil Harrison
No :- ( I can’t.
This is, as far as I know, the only available source. It reminds me the good old IBM card punchers we used 50 years ago :- )
I wrote 5 years ago some software reading and processing that data, and it is evident that Mark B must have done the same ugly job.
Apologies, I forgot to open access by everybody for the second link. Updated.
Linear trends are the ultimate in low pass filters.
Here is the UAH 6.0 LT time series for Dec 1978-Oct 2021, in absolute form:
https://drive.google.com/file/d/1TyfZM5OM4JJI-wh-6hHZby-cnt-gmTHD/view
Many thanks, Bindidon. That’s just what I’m after.
Dr. Spencer: Have you and Dr. Christy been able to determine the size of the error bars on your observed warming trend (i.e. the red trendline)? If not, isn’t your satellite data technically still compatible with a ‘true’ warming trend substantially less than +0.14 C/decade, perhaps even zero?
Dr Spencer, i have a stupid question (yes, questions can be stupid).
The terms “stupid”, “dumb”, etc. seem too vague and lack distinct meaning. All too often “stupid” and “dumb” are used as a pejorative judgment of the asker. I prefer these: appropriate, naïve, whimsical, rhetorical, hypothetical, and inappropriate.
(That odd “naA-ve” is “naive”. It seems this site doesn’t do extended characters.)
Actually I find that the extended character set works sometimes. And then when I look again it doesn’t.
WizGeeker
” It seems this site doesnt do extended characters. ”
You are right: these are never represented. Whenever you see them in a comment, that is then due to the person posting having managed to make them visible.
I use a somewhat tedious method:
https://mothereff.in/html-entities
transforms the spec chars into UTF8 sequences, like here:
é à ô ä ö ü ß ± °C
etc etc etc
“You are right: these are never represented”
Half of the time I see the umlaut, the rest of the time I see garbage.
” Whenever you see them in a comment, that is then due to the person posting having managed to make them visible. “
That would be fine except I have seen the umlaut in the post above. Both there and not.
Currently it is naïve but I also seen it as naïve.
You still didn’t manage to understand.
And behave exactly as… Robertson.
You still wont accept that I have seen both on the same exact post at different times with my own eyes.
I can confirm that the very same post can show umlauts and other special characters on one viewing, and then show gobbledygook on the next. I have no idea what the mechanism is (Roy just logging in and visiting the site is the only think I can think of?) but the same post can show the 2 different character sets (normal and gobbledygook) many times after each refresh of the page.
I owe an apology: I did not understand RLH’s words correctly.
But now, looking at
https://www.drroyspencer.com/2021/12/uah-global-temperature-update-for-november-2021-0-08-deg-c/#comment-1054624
I confirm too that these dumb Russian comments appear sometimes suddenly in correct Cyrillic alphabet.
https://mothereff.in/html-entities as recommended by Bindidon works a treat for me. I find it a breeze to use.
Cheers
I’m glad to help with such little tricks.
oops, pressed the wrong button.
First, let’s do some back of the envelope estimation. Say, a characteristic wavelength for a thermal radiation at the typical earthly temperatures is around 15 micron=15e-6m~=1.5e-3cm. Then the typical distance between molecules would be given as, for 22.6L/mol=22600cm3/mol for a gas at the typical earthly conditions, hence the density is 6.02e23/22600=2.67e19 molecules/cm3, for approx 3e6 molecules per cm of linear density. This gives, for a typical thermal radiation, the 3e6(m/cm)*1.5e-3(cm)/2~=2.25e3 molecules per half-wavelength, or 11.4e9 = eleven billion molecules per one cubic half-wavelength of the typical thermal radiation. Interesting, the molecules in the gas are pretty close together it seems! Of course, in the real atmosphere, the major radiatively-active aka greenhouse gases only constitute a small fraction of the total gases, typically varying between 1 in 10000 for co2 or wv at the tropopause to 1 in 100 (or even down to 1 in 25) for wv at the surface, thus the actual number of GHG molecules located within the half-wavelength of each other ranges from roughly 1 to 100 millions, and +- 2 order of magnitude if we account for the fact that the thermal radiation covers the range of wavelengths, for a total range thus being roughly in the range of 10000 to 10 billion molecules at any time within the near-field of any emitting or =gnibrosba= molecule.
From the simple estimation above, it seems fair to say that even in a fairly diluted greenhouse gasses at the earth surface conditions, the individual molecules cannot possibly be thought of as “radiatively” isolated from one another, yet all the explanations of the radiative processes in atmospheric gasses presented to the ‘common’ people who are not smart enough to delve into the intricacies of the quantum electrodynamics, always treat the radiating gasses as a set of material points radiatively interacting among themselves only through the far-fields. I understand that at least some of the non-far-field interaction is taken into account as the effects of line pressure-broadening and collisional-narrowing, as well as collision-induced =noitprosba=, yet it seems to me that all these effects try to account for the influence of the electromagnetically-finite size of the gas molecules on their interaction with far-fields only.
And now for the stupid question: how certain are ‘the scientits’ that the near-field interaction among molecules of radiative gasses is fully accounted for, and that it does not have any subtle yet nontrivial and significant effect on the radiative properties of the atmospheres??
regardless of whether i get any useful answer to the question, I sure hope that this comment of mine will flame-up the mindless discussion that the denizens of this blog are known for ^-^
coturnix
You speak about ‘near surface’.
What concerns
– the influence of trace gases on radiation
and
– the molecule density around them
it is evident that H2O aka WV is there of interest.
But if I understand well a French paper
https://tinyurl.com/mwew486v
I read about the {of course, non existing} GHE, CO2’s effect begins above the tropopause, when H2O disappears due to precipitation.
Is your computation above then still correct, when you move up to the lower stratosphere?
>> You speak about near surface.
to put it into context, i’m not asking about very high or low pressures or temperatures, just of what is found in the troposphere
>> the influence of trace gases on radiation
all gasses are important, even nitrogen, but indeed i’m asking about something different
>> the molecule density around them
i’m pointing out that even in the relatively rarified dry air at the top o the ptroposphere there tonnes of molecules of the GHG in the near-field zone of each other. In the tropical lower troposphere that number goes up into billions.
>> it is evident that H2O aka WV is there of interest.
yes, because it is most important and misunderstoon GHG
>> But if I understand well a French paper
well, I don’t for obvious reasons.
>> I read about the {of course, non existing} GHE
why not existing?
>> CO2s effect begins above the tropopause, when H2O disappears due to precipitation.
irrelevant
>> Is your computation above then still correct, when you move up to the lower stratosphere?
I just did a simple order-of-magnitude back of the envelope calculations of the numbers of GHG molecules in air under the typical tropospheric conditions, and noted that even in the very dry winter air there would still be ALOT of them located close enough to one another to be in the near-field zone of each other.
The question of the tropopause however is interesting…. at the tropopause the air density is typically 5 to 10 times lower than at the surface, and co2 is typically 1 in 2500 molecules, thus the 11e9 molecules per cubic half-wavelength need to be divide by 2500 and then by 125 to 1000 to get the numbers for the co2 at the TOTT, which gives between 4.5 and 35 thousand molecules of co2 adjacent to any given co2 molecules under those conditions.
For the WV using the https://www.processsensing.com/en-us/humidity-calculator/ we get that at 10% of atmospheric pressure and -60C, the partial pressure of the saturated WV is at the meager 1pa, or around 100,000 molecules per set volume. At -80, that falls by 20 more times, bringing the number to around 5000-6000 molecules of wv within the near-field region of any emitting or absorbing molecule at any given time. Still a very large number, though.
>> I read about the {of course, non existing} GHE
why not existing?
That was sarcasm.
Absolutely right. In fact global temperature in the first half of 20th century (1900-1950) was not less than at least 30% warmer than 2nd half of the 20 th century and early 21st century (1950-2021), which is evident from IPCC observed data at table 13.1 & 13.2 and figure 13.7b & 13.4d of chapter 13 (Sea Level Changes) WG1AR5 , besides EPA published data of heat wave index of USA ( from 1896-2021).
@ Sanjib Dutta Roy says:
“In fact global temperature in the first half of 20th century (1900-1950) was not less than at least 30% warmer than 2nd half of the 20 th century and early 21st century (1950-2021)”
_____________________________________________
No. First half of the 20th century temperatur was much COLDER.
“30% warmer” is a meaningless value.
Measured in the Kelvin scale or Fahrenheit you will get a different result. And you’re talking about anomalies. The baseline is semi-arbitrary.
Percentage values don’t work for this metric.
Finally, the 5-month La Nina lag kicks in.
The current La Nina cycle is a very weak one which seems to have already peaked, so well have another 4~5 months of global cooling to around -0..2~-0.3C and then global temps will start to rise again from around April May as a new El Nino cycle develops towards the end of next year.
Itll be interesting to see if we get another weak El Nino cycle, to be likely followed followed by a strong La Nia cycle, which we havent had since 2010 (on average, there is a strong La Nia cycle every 10:years or so)..
The AMO will likely start its 30-year cool cycle in a few years, and the PDO seems to have already entered its 30-year cool cycle, so long-term global temp trends for the next next 30 years should soon gradually start cooling as thy did from 1880~1913 and 1945~1979 during past PDO/AMO cool ocean cycles
Leftists will have some serious explaining to do in about 5~8 years from now brrrr.
In November of last you predicted -0.2 to -0.3 C on the 1981-2010 baseline. Now you are predicting -0.2 to -0.3 C on the 1991-2020 baseline which is equivalent to about -0.32 to -0.42 C on the 1981-2010 baseline. How confident are you about an even lower prediction given a weaker La Nina than you predicted last year especially given that your prediction from last year ended up being wrong?
Bdgwx, since we now know the warming of the 21st century was due to increased solar energy and the oceans have warmed to a deeper level as a result, I tend to agree that it will be more difficult to achieve low anomalies during La Nina years.
Assuming the clouds have returned back to normal, it will take a few years for the oceans to cool. Maybe if we see a La Nina in the mid 2020s it will be cooler.
BDGWX-san:
As you said, in November 2020, I predicted that the back-to-back La Nina cycles would likely cause the UAH6.0 temp anomalies to fall to -0.2C~-0.3C, which is most likely will happen by March or April of 2022.
CMIP6 mean global temp anomaly projections by March 2022 will be around 1.39C and increasing at a trend of around 0.30C/decade…
Well, CMIP6 will be hilariously devoid from reality by about 4 or 5 standard deviations by March of next year, and I will likely be spot on…
So whose projections closer reflect reality? CMIP6 projections of 1.37C or my projections -0.20C~-0.30C?
BTW, for everyone’s edification, please post Dr. Spencer’s explanation that changing UAH 6.0’s baseline has caused UAH6 global warming data to be cooler by 0.12C compared to the previous baseline…. I don’t recall Dr. Spencer ever saying that..
Cheers..
Dr. Spencer informed readers of the change here.
http://www.drroyspencer.com/2021/02/uah-global-temperature-update-for-january-2021-0-12-deg-c-new-base-period/
You can average the 1981-2010 and 1991-2020 periods yourself and confirm the difference.
We are scoring your original prediction as it was made at the time from the 1981-2010 baseline.
Bdgwx-san:
Nowhere in the link you posted did Dr. Spencer say UAH 6.0 is -0.12C cooler than the precious trend-year base UAH 5.0
Simply repeating a lie doesnt magically make it true
BTW, who is the We in We are scoring.. are you referring to?
Are you King of some country Im not aware of?
Several contributors here took the data and worked out the difference per month, between the old baseline and the new.
If you look at the anomaly update prior to the update with the new baseline, you can see how the anomalies in the table are quite different.
http://www.drroyspencer.com/2021/01/uah-global-temperature-update-for-december-2020-0-27-deg-c/
http://www.drroyspencer.com/2021/02/uah-global-temperature-update-for-january-2021-0-12-deg-c-new-base-period/
If you compare all the months from 2020, this is how they changed between Dr Spencer’s January and February updates.
January update:
2020 01 +0.56
2020 02 +0.75
2020 03 +0.47
2020 04 +0.38
2020 05 +0.54
2020 06 +0.43
2020 07 +0.44
2020 08 +0.43
2020 09 +0.57
2020 10 +0.54
2020 11 +0.53
2020 12 +0.27
February update:
2020 01 +0.42
2020 02 +0.59
2020 03 +0.35
2020 04 +0.26
2020 05 +0.42
2020 06 +0.30
2020 07 +0.31
2020 08 +0.30
2020 09 +0.40
2020 10 +0.38
2020 11 +0.40
2020 12 +0.15
See how every anomaly is at least 0.1 C cooler in the February update? That’s because the baseline changed.
Each month has a slightly different baseline change (because they are worked out month by month). There is a brief discussion and monthly offset values given (by averaging and subtracting) here:
http://www.drroyspencer.com/2021/02/uah-global-temperature-update-for-january-2021-0-12-deg-c-new-base-period/#comment-605685
“some serious explaining to do in about 5~8 years from now brrrr.”
Yep. It is always 5-8 years away. Has been for at least 20 y.
Nate-san:
Climate changes are already happening: Greenland Ice mass loss is decreasing, Arctic Summer Minimums are increasing, Atlantic SSTs are falling, Pacific SSTs are falling, severe winters are becoming more common, there as a 19-year Hiatus from 1996~2025 savedminkynbynthe 2015/16 Suoer El NIno event, Antarctic Land Ice Mass has, until recently, been gain8g mass (Zwally 2021), no global increasing trends for 100:years for: Hurricanes, typhoons, cyclones, droughts, floods, tornadoes, hail, subs tropical storms (IPCC AR5 Report), SLR stuck at around 10” per century, etc.
The only place CAGW currently exists is in failed CMIPS 6 model outputs…
It’s CAGW advocates that always say climate Armageddon is in 5 years, but recently these wild predictions have been extended to 30~50 years so these crazy grant-mongers will have ling retired before their laughable and failed predictions crash and burn…
Nate, the AMO and PDO have been mostly positive for the last 25 years. They will eventually cycle back.
How large are each of their effects on global temperature?
We will see won’t we.
Nate, it appears the AMO and PDO may provide almost all of the variability seen over decades. NASA CERES shows a strong correlation of the PDO with cloud variation which would explain how it’s phases influence the temperature.
https://www.mdpi.com/atmosphere/atmosphere-12-01297/article_deploy/html/images/atmosphere-12-01297-g003-550.jpg
https://agupubs.onlinelibrary.wiley.com/cms/asset/31d00f80-62b9-4aff-8fb0-6d857fa2171a/grl62546-fig-0004-m.png
Nothing left for poor little CO2 and the greenhouse effect.
“almost all of the variability seen over decades. NASA”
Can you show the claimed strong correlation of either one or both to the last 50 y of T rise? I dont think so.
You have only shown the short term correlation to ENSO, which is well known. That is not the 50 y T rise.
“We will see wont we”
Indeed confirmation of this ‘certain’ mechanism is always coming in the near future.
And if the conjunction of AMO and PDO together does indeed show some decrease, what then?
“Mark B says:
On NCEP surface data I expect November UAH TLT to come in a bit below September but above August, say 0.22 +/-0.05C”
No decrease there then.
Nate asks, “Can you show the claimed strong correlation of either one or both to the last 50 y of T rise?”
Yes, it is more than obvious.
1) The latest warming starts in 1977 when the PDO goes positive.
2) Additional warming in mid 1990 associated with AMO going positive.
3) PDO goes negative in 2006 leading to an extended hiatus in warming.
4) PDO goes positive again in 2014 ending the hiatus and leading to additional warming.
That takes care of about 45 of your 50 years. Of course, you can also go back further and see the mid 20th century cooling occurred when both the AMO and PDO were negative and the early 20th century warming when they were positive.
Keep in mind the long term warming started back in the 17th century which implies there is a small underlying effect. I call it the millennial cycle. One possible cause of this effect is salinity variability.
Richard M,
“Nate asks, ‘Can you show the claimed strong correlation of either one or both to the last 50 y of T rise?’
Yes, it is more than obvious.
1) The latest warming starts in 1977 when the PDO goes positive.
2) Additional warming in mid 1990 associated with AMO going positive.
3) PDO goes negative in 2006 leading to an extended hiatus in warming.
4) PDO goes positive again in 2014 ending the hiatus and leading to additional warming.
That takes care of about 45 of your 50 years.”
Not sure why you can’t show that visually.
Here are T (SH), T(NH) and AMO.
https://tinyurl.com/yxh328vy
We can see there is little correlation between T(SH) which always rises, and AMO.
There is a strong correlation between T(NH) and AMO.
Naturally because AMO is derived from a large region of the NH.
But notice, that while T(NH) and AMO match to 1960, throughout the century they separate more and more as time goes on.
The AMO cannot account for the rise of the last half century.
Does PDO account for it?
https://tinyurl.com/4hs7rapn
Nope. I don’t see how.
We can scale PDO to match some short-duration correlated features, such as 1875-1980, and 2015-2020, but it cannot account the rise of the last 50 y.
This match to short-term features is due to ENSO, and because PDO and ENSO are connected.
Arggh
‘such as 1875-1980’ should be ‘such as 1975-1980’
in fact both PDO and AMO appear to contribute to that one.
I think this scaling of PDO produces a better match to short term features such as rise 75-80 and down-up from 2005-2020
https://tinyurl.com/2p8t72p2
but again, cannot account for the 50 y rise.
Nate, you missed the part about the underlying warming. Since it is also ocean based, you need to detrend the AMO and PDO to see their specific effects. Here’s a reference for the AMO.
https://climatedataguide.ucar.edu/climate-data/atlantic-multi-decadal-oscillation-amo
Yep, that seems reasonable given that AMO is a regional mode, cyclic, and the amplitude is known. Its effect is not even evident in the SH.
That is exactly what is done for ENSO.
Here’s the rationale:
“The increasing human influence on climate, mainly through changes in atmospheric composition, produce global warming. Many variables and climate indices are therefore influenced by associated climate changes and any analysis of variance can be dominated by the recent trends. It is therefore desirable to remove the trends to examine the underlying variability and associated patterns. One approach has been to fit a linear trend to a time series of an index, but this is a seriously flawed procedure because (i) it depends on the length of the time series; (ii) it implies the trend goes on indefinitely into the future and into the past; and (iii) there is no such trend evident in the earlier part of the 20th Century. A relatively simple approach instead is to use the global mean time series as a primary indicator of the non-stationary component, and remove that from each grid point prior to carrying out an analysis. This approach has been shown to work effectively by using model results, where the cause of the non-stationarity is known. A good example is the AMO, which is based on an index of area average SST over the North Atlantic from 0 to 60N (see Trenberth and Shea (2006)).”
“Nate, you missed the part about the underlying warming. Since it is also ocean based, you need to detrend the AMO and PDO to see their specific effects.”
I think the point is this, Richard, if two things are correlated we don’t know which one is the driver.
But if a REGIONAL warm-cool cycle is the driver, it only makes sense that it should be much larger than the response of the entire Globe.
This is certainly the case for ENSO. The warming and cooling cycle of the central Pacific is up to +- 2 C, while the Globes response is +- 0.2 C.
Thus if we subtract the smaller ‘response’ of the whole globe from the regional cycle, the ‘driver’, it should not remove the ‘driver’ signal. At most, it should remove a small fraction of it.
“And if the conjunction of AMO and PDO together does indeed show some decrease, what then?”
What then, indeed?
The rise in global temp, and its spatial pattern, of the last 40 y was quantitatively predicted 40 y ago, as a consequence of expected CO2 rise over that period, and indeed has agreed with that prediction in many respects quite closely.
This doesnt convince you.
So if there is a brief cooling episode, (it will obviously have to be << 40 y long for any of us to observe it) and it seems to correlate to some arbitrary mix of AMO and PDO, then THAT will convince you?
Of what?
Why the latter but not the former?
You will need to predict beforehand, quantitatively, the magnitude of cooling per unit of AMO and per unit of PDO.
I will let the actual measurements speak for themselves. It looks like the models for predicting the future and sadly amiss.
Nate, prediction of a 50-50 odds event is hardly convincing. Especially since there are other possible causes as I outlined above. More to the point, the CERES data shows all the 21st century warming is explained by natural causes. There’s nothing left for anything else.
This is not some other theory. This is empirical data captured over the past 20 years. It’s not up for debate. You are denying scientific fact.
“{More to the point, the CERES data shows all the 21st century warming is explained by natural causes. ”
Nope. Doubling down on an already debunked claim.
“I will let the actual measurements speak for themselves. It looks like the models for predicting the future and sadly amiss.”
?? Yes the evidence is always in the future.
You offer no alternative quantitative prediction for AMO or PDO. That means whatever happens can fit your prediction.
Quite lame.
If you maintain an infinite barrier to acceptance of evidence in favor of AGW, but then have little or no barrier to acceptance of alternatives, then isnt that revealing a strong bias?
Nate, hardly a “debunked claim”. The data is very clear.
the root cause for the positive TOA net flux and, hence, for a further accumulation of energy during the last two decades was a declining outgoing shortwave flux and not a retained LW flux. – Hans-Rolf Dbal and Fritz Vahrenholt, October 2021, journal Atmosphere, Radiative Energy Flux Variation from 20012020.
Denial is not the same as debunking.
Yes it has been debunked, and you had no answers.
“The point is this, the EEI is NOT Global warming. It is simply the IMBALANCE in outgoing and incoming flux.
Even if it remained CONSTANT the Earth would still be warming.
It could be constant if the GHE was increasing and the temperature was increasing exactly enough to balance out the added GHE.
And he notes that ‘a decrease in outgoing longwave radiation (OLR) due to increases in trace gases and water vapor’, IOW the increasing GHE, is still happening.”
And this:
http://www.drroyspencer.com/2021/12/uah-global-temperature-update-for-november-2021-0-08-deg-c/#comment-1047960
“Hans-Rolf Dbal and Fritz Vahrenholt, October 2021, journal Atmosphere, Radiative Energy Flux Variation from 2001 – 2020”
Yes, that’s the paper being discussed. Always was. For some reason certain commenters keep trying to introduce Loeb et al.
The reason Nate quotes the Loeb paper is because Loeb et al made up some numbers based on a model and uses them in an unscientific deflection of the facts.
Nate then references EEI which again is just a computation and not really related to the key measurements. This is typical of the unscientific alarmist cult. The data was clear.
“The declining TOA SW (out) is the major heating cause (+1.42 W/m2 from 2001 to 2020)’
Yup, an actual measurement and MORE THAN ENOUGH ENERGY TO ACCOUNT FOR ALL OF THE WARMING. In fact, using IPCC claims it would account for about 1.2 C of warming (40% of the 3.7 W/m2 claimed to cause 3.2 C).
That 1.2 C was reduced to about .3 C by an increase in outgoing IR and the fact the IPCC number is not real to begin with, but Nate wants to claim even more warming was produced by GHGs (around .4 C) that was also eliminated by some mystical, unknown feedback.
Nate is simply ignoring the actual measured data and hanging onto words from his priests. Typical cultist.
“The reason Nate quotes the Loeb paper is because Loeb et al made up some numbers based on a model and uses them in an unscientific deflection of the facts.”
Hilarious.
https://terra.nasa.gov/people/dr-norman-g-loeb
Norman Loeb is the lead scientist on the CERES project. He is THE expert on all things CERES.
While Richard M. is ….not.
Richard,
You reference EEI here:
“Nate, EEI is a measure of the energy changes that could produce warming (or cooling if negative).”
Now you say:
“Nate then references EEI which again is just a computation and not really related to the key measurements. This is typical of the unscientific alarmist cult. The data was clear.”
So???
Nate once again ignores the real, measured data and resorts to deflection.
It doesn’t matter where Loeb works. You really are digging deep. The data doesn’t care. Are you saying he intentionally misreported the data? Or do you agree the data is valid? If so, why are you ignoring it?
And, it’s not me who is claiming to be an expert. I’m simply repeating what the data shows. Why do you continue to ignore the data?
Finally, Nate pulls two different comments by me out of two different contests. Hilarious nonsense just to avoid discussing the real issue … the data. Once again, why do you continue to ignore the data?
I think everyone sees what is happening. Nate has no defense for his continued “oh look there’s a squirrel” comments.
“I’m simply repeating what the data shows.”
Incorrectly, Richard, since you simply make up words in your comments that the authors of the CERES data analyses do not write. Quote them verbatim and learn about the earthen GHE, the EEI, and that the authors:
“could identify the effect of the anthropogenic greenhouse gas emissions from 2001 to 2020 in the “Clear Sky” LW”.
“Are you saying he intentionally misreported the data?”
Nope. But you are claiming he “made up some numbers”
and is doing an “unscientific deflection of the facts”
Yeah, riiiiight.
I’ll let readers decide who (you or Loeb) is more likely to be making up stuff and being unscientific here.
Ball4, learn that the authors state
“The drop of cloudiness around the millennium by about 1.5% has certainly fostered the positive net radiative flux.”
Ball4, I quoted the data. Here it is again.
“The declining TOA SW (out) is the major heating cause (+1.42 W/m2 from 2001 to 2020)”
I should add the other important data.
“It is almost compensated by the growing chilling TOA LW (out) (−1.1 W/m2).”
Keep in mind the time period of the D/V paper is different than the Loeb et al paper. You seem to be confused which I have been quoting. Not surprised.
I can’t help Loeb understand basic physics. His claim is incorrect. He got some numbers from a model. That isn’t an “effect”. Although, it wouldn’t surprise me he needed to add this nonsense into the paper to get it published. He was sloppy. Typical of many climate papers.
My point remains unchanged. The actual measured increase in energy from the sun (+1.42 W/m2) is far more than necessary to cause the warming seen over this period. So far I haven’t seen you or Nate address this. All you do is deflect.
Furthermore, the cooling IR (-1.1 W/m2) is supposed to contain the greenhouse effect increase from almost 50 PPM increase in CO2. Where did it go?
Of course, once you accept this reality, there is nothing left to cause warming from increases in CO2/CH4. The climate field is left with 25 years with no evidence of any man made warming.
Nate,
“Nope. But you are claiming he “made up some numbers””
I said the numbers came out of a model. As such they are in a sense “made up”. And, since the model is only part of a larger system which he incorrectly ignores, he is ultimately responsible for the fact those numbers have no physical meaning.
“and is doing an “unscientific deflection of the facts””
Yup, I was right on the money. By adding in incomplete model results and claiming that demonstrates GHGs were part of the reason we warmed, Loeb et al was deflecting from the real story behind the data. The measured data only supports solar energy as the cause of the warming.
“Ill let readers decide who (you or Loeb) is more likely to be making up stuff and being unscientific here.”
I have already shown everything I stated is factual. All the data I used is quoted from the D/V 2021 published paper. Loeb et al admit they used a “radiative transfer model” to “compute” the GHG claims.
So, let’s stick to the actual data. We can discuss the problems with radiative transfer models at another time.
Good job DREMT, quoting verbatim the authors. Your summary clip is consistent with the internal variability authors write being shown in CERES data:
“Anthropogenic forcing, internal variability, and climate feedbacks all contribute to the positive trend in EEI (Earth’s Energy Imbalance).”
Authors go on to tell DREMT enthalpy changes show: “a possible correlation of cloud cover shifts such as the one around the millennium with the AMO (Atlantic Multidecadal Oscillation)…As shown in Figure 13, the heating phases coincide with the AMO change from negative to positive.”
There are something like 9 listed drivers of climate change AGW being only one of them and “”cloud thinning”, as discussed by several other authors [36–38] should be understood, because it could accelerate the warming trend.”
—–
Bad job writing misinformation Richard M by simply making up “The actual measured increase in energy from the sun (+1.42 W/m^2)” when authors actually write: “The ASR trend cannot be explained by changes in incoming solar radiation, as the trend in incoming solar flux is negligible (-0.053 W m-2 decade-1)
& even in Richard’s own clip authors write: “The declining TOA SW (out) is the major heating cause (+1.42 W/m^2 from 2001 to 2020)” and “Most of the ASR trend is associated with cloud and surface albedo changes.” i.e. internal variability.
Ball4, I do get a good laugh when I see such ignorance on display. I didn’t make anything up.
Oh, it appears you think the solar radiation absorbed by Earth is different when it increases due to a reduction in clouds? That is truly hilarious.
It’s still “from the sun”, bumpkin. Yes, it still originated at the sun. It is not LW energy produced on earth and supposedly reduced by the greenhouse effect.
The author’s differentiate between incoming solar energy and outgoing solar energy for a reason. And they make it clear the sun itself is not radiating more energy. But they aren’t claiming there is any difference in the energy level or the place of origin. The energy is “from the sun”. That you thought there was a difference is quite telling.
Fact is, I’ve been promoting internal variability for over a decade. I’ve even mentioned it previously in other comments under this article. So, it appears we are in agreement. The changes in clouds (likely driven by major ocean cycles), “i.e. internal variability”, are driving the climate.
“I cant help Loeb understand basic physics. His claim is incorrect. He got some numbers from a model. That isnt an ‘effect’. Although, it wouldnt surprise me he needed to add this nonsense into the paper to get it published. He was sloppy.”
Here we go again with random blog poster, Richard, accusing the CERES lead scientist of not understanding basic physics, doing CERES data analysis wrong, and being sloppy, without evidence.
Which one understands basic physics, CERES data and its proper analysis?
And which one is posting unsubstantiated BS?
What say you dear readers?
Richard M, Dr. Loeb’s radiative physics demonstrated understanding is much superior to yours thus Richard is correct writing “I can’t help Loeb understand basic physics.” as Nate’s comment points out.
“…it appears you think the solar radiation absorbed by Earth is different when it increases due to a reduction in clouds?”
What I commented demonstrates Richard does a bad job commenting due to writing Richard’s own words of misinformation on earthen radiative physics: “The actual measured increase in energy from the sun (+1.42 W/m^2)” vs. Dr. Loeb and co-authors good job of writing: “The ASR trend cannot be explained by changes in incoming solar radiation, as the trend in incoming solar flux is negligible (-0.053 W m-2 decade-1)”.
The changes in clouds (likely driven by major ocean cycles), “i.e. internal variability”, are in part driving the climate in the period(s) observed along with “a decadal increase in the rate of energy uptake by Earth from mid-2005 through mid-2019, which we attribute to decreased reflection of energy back into space by clouds and sea ice and increases in well-mixed greenhouse gases and water vapor.”
They’re just going to keep repeating themselves until they get the last word, Richard M. It’s what they do (for a living).
People here who post science errors, distortions, cherry-picks, false claims, should expect rebuttals and corrections.
When they double-down and triple down with more science errors, distortions, cherry picks, and false claims, they should not be at all surprised to get further rebuttals and corrections.
When they stop posting BS, there will be no need for rebuttals and corrections.
Its that simple.
“I said the numbers came out of a model. As such they are in a sense ‘made up’. And, since the model is only part of a larger system which he incorrectly ignores, he is ultimately responsible for the fact those numbers have no physical meaning.”
So you KNOW that the modeling they did was not an appropriate part of the analysis? You KNOW that he is incorrectly ignoring something? What? You KNOW that these numbers have no physical meaning?
Many observational papers incorporate models.
Roy Spencer uses models to correct his satellite data for things like orbital decay, diurnal variation, and ocean/ice reflections, altitude temperature profiles, in order to determine LT and MT temperatures?
They’re just going to keep repeating themselves, and falsely accusing others of what they do themselves, until they get the last word, Richard M. It’s what they do (for a living).
“The drop of cloudiness around the millennium by about 1.5% has certainly fostered the positive net radiative flux.”
I looked up the paper by the people responsible for that cloudiness data. They do not trust that the trends seen in it are real.
“Thus, both datasets indicate a negative global temporal trend (although with different magnitudes) in CFC over the period. However, if we compare with results from all
15 available surface stations (synoptic observations) we see only a trend in the difference
between the two datasets meaning that only satellite results have a negative trend in
Fig. 14 (bias trend shown in lower panel).”
They put various other caveats on the data, that are not mentioned by Dubal and Var..
“Thus,
results in Fig. 14 are more representative for the Northern Hemisphere than for the
entire globe. Nevertheless, we do not see signs of a large negative trend in cloudiness
for this restricted surface observation dataset. Another interesting fact is that if looking exclusively at daytime and night-time results from CLARA-A1 (not shown here), no
25 trends are seen as opposed to results for the total satellite-based dataset. However,
it must be noted that CFC values are considerably lower at night pointing at different cloud detection efficiency day and night. Consequently, we might suspect that the
trend seen for both satellite datasets in Fig. 13 might at least partly be explained by
changes in the temporal sampling of observations throughout the period.
The introduction of morning-evening satellites in the 90s, and even a slight dominance
of morning-evening satellites during the last ten years, could be responsible for creating this trend in global cloud amounts. Future editions of the CLARA dataset need to
address these limitations, through either solving the temporal sampling differences or
5 by the use of mitigation methods.”
cloudiness data paper https://acp.copernicus.org/preprints/13/935/2013/acpd-13-935-2013.pdf
It is hilarious to watch Nate and especially Ball4 deny science. Both of them cannot understand these two very simple papers and what they are telling us.
” the root cause for the positive TOA net flux and, hence, for a further accumulation of energy during the last two decades was a declining outgoing shortwave flux and not a retained LW flux.” – Hans-Rolf Dbal and Fritz Vahrenholt, October 2021, journal Atmosphere, Radiative Energy Flux Variation from 20012020.
” the observations show a trend in net downward radiation of 0.41 0.22 W m−2 decade−1 that is the result of the sum of a 0.65 0.17 W m−2 decade−1 trend in absorbed solar radiation (ASR) and a -0.24 0.13 W m−2 decade−1 trend in downward radiation due to an increase in OLR ” – Loeb et al, Geophysical Research Letters, June 2021, Satellite and Ocean Data Reveal Marked Increase in Earths Heating Rate
Both the them are clearly pointing to solar energy as the cause of warming in the 21st century. Both specifically state it is not an increase in LWIR (the carrier of the greenhouse effect) that increase in energy content.
“not a retained LW flux” and “-0.24 0.13 W/m2”
There is it. Right in the abstracts of both papers. Now, I don’t expect either Nate or Ball4 to stop their rampant science denial. It’s part of their belief system. IOW, it’s their religion.
So I am going to rebut what Richard just posted because it is not correct.
DREMT will whine that this is just getting the last word, but that is of course idiotic.
“not a retained LW flux. Hans-Rolf Dbal and Fritz Vahrenholt, October 2021, journal Atmosphere, Radiative Energy Flux Variation from 20012020.
SO first of all, Richard, that part of the statement is NOT DATA and just unsupported opinion.
You want us to look at and understand the DATA in these papers. Here is the key data in Loeb that is worthwhile to try to understand.
https://agupubs.onlinelibrary.wiley.com/cms/asset/5655c3cb-e0d2-4f20-aadd-b26cb466ae36/grl62546-fig-0003-m.png
And its caption:
“Attribution of Clouds and the Earth’s Radiant Energy System net top-of-atmosphere flux trends for 2002/092020/03. Shown are trends due to changes in (a) clouds, (b) surface, (c) temperature, (d) combined contributions from trace gases and solar irradiance (labeled as ‘Other’), (e) water vapor, and (f) aerosols. Positive trends correspond to heat gain and negative to loss. Stippled areas fall outside the 5%95% confidence interval. Numbers in parentheses correspond to global trends and 5%95% confidence intervals in W m−2 decade−1.
This shows the TRENDs for the various components of the fluxes. Positive number means the Earth is gaining energy.
All are GAINS except TEMPERATURE. The WATER VAPOR and OTHER include gains due to the GHE of water vapor and trace gases including CO2. OTHER also includes a (-.05 W/m^2/dec) due to a slight reduction in solar irradiance.
Notice in the absence of the GHE the TEMPERATURE would be causing a NET loss in LW output due to warming of the surface and atmosphere, of
“-0.56 W/dec.”
But the total LW loss was stated in the paper:
“−0.24 0.13 W m−2 decade−1”.
Clearly there was LW flux retained by the GHE to have decreased the total LW loss due to warming.
This CONFIRMS the statement in the abstract that:
“This trend is primarily due to an increase in absorbed solar radiation associated with decreased reflection by clouds and sea-ice and a decrease in outgoing longwave radiation (OLR) due to increases in trace gases and water vapor.”
Thus the statement in the other paper, “not a retained LW flux.” is misleading at best.
Richard,
This selected period of time also happens to be dominated by a shift from strong La Nina in the middle to strong El Nino at the end. As Loeb discussed, this explains several features of the data, including warmer water and reduced clouds over the Eastern Pacific, which results in > ASR but also > OLR.
This particular pattern would not be repeated over a longer stretch of time, eg 50 y.
“An additional factor that explains the trend in net TOA flux is the shift from a negative to a positive PDO index in 2014 (Figure 4a). The PDO is a large-scale climate pattern associated with substantial shifts in sea-surface temperatures (SSTs) and clouds and has been previously linked to variability in the EEI as estimated at the TOA by satellite data (Loeb, Thorsen, et al., 2018). Following the shift in the sign of the PDO index in 2014, the Nio3.4 index peaked during the winter of 2015/2016, reflecting a major El Nio event (Figure 4b). SSTs started to rise in 2012 and have remained above average through 2020 (Figure 4c). Variations in SST closely track both the PDO and Nio3.4 indices, with correlation coefficients 0.80 and 0.72, respectively. In the positive phase of the PDO, SST increases are pronounced over the eastern Pacific Ocean, which causes a decrease in low cloud amount and an increase in ASR along the eastern Pacific Ocean (Loeb, Thorsen, et al., 2018). After 2014, the ASR trend shows a factor of 4 increase over that prior to 2014. An increase in thermal infrared emission to space slightly offsets the increase in ASR, so that the trend in net flux after 2014 is reduced to 2.5 times that prior to 2014.”
Richard’s 8:10am opinion is yet more misinformation since that comment continues to be clearly not based on all the CERES data as the authors show in the paper(s) clips I’ve already provided.
NB: To better learn about SW and LW wavelengths in microns, Richard should read, understand, comment according to Sec. 2 of the Dubal paper since: “it is of some importance to realize the wavelength channels in CERES” and find “..stretching vibrations of H2O and CH4 including their overtone and combination band spectra fall into SW. Even the asymmetric stretching vibration of carbon dioxide falls into the SW.” Thus:
“..increase in the rate of energy uptake by Earth from mid-2005 through mid-2019, which we attribute to decreased reflection of energy back into space by clouds and sea ice and increases in well-mixed greenhouse gases and water vapor.”
Ball4 quotes something from one paper and then says “Thus:” and puts in a quote from the other paper!
Keep actually reading the paper(s) DREMT you will understand climate physics better with each read.
http://www.drroyspencer.com/2021/12/uah-global-temperature-update-for-november-2021-0-08-deg-c/#comment-1054607
Dubal and Vahrenholt state that the role of the GHE over the period is “certainly not dominating”.
Good job DREMT; good practice to quote the authors verbatim.
Bad practice for you to mangle quotes together from two different papers, without stating which quote comes from which paper.
http://www.drroyspencer.com/2021/12/uah-global-temperature-update-for-november-2021-0-08-deg-c/#comment-1054607
Good job reading both DREMT.
#2
Bad practice for you to mangle quotes together from two different papers, without stating which quote comes from which paper.
Ball4,
Looks like he’s ‘just going to keep repeating himself, and falsely accusing others of what he does himself, until he gets the last word”
I wonder why it’s alright for Ball4 to mangle quotes together from two different papers, without stating which quote comes from which paper? Is there a science reason for that, do you think, dear readers?
http://www.drroyspencer.com/2021/12/uah-global-temperature-update-for-november-2021-0-08-deg-c/#comment-1058772
I see DREMT figured out which one; most other readers can too but I am doubtful about Clint R and Gordon, they don’t appear capable. I’ll let DREMT inform them.
Troll.
I see this thread has gone completely off the rails. Neither Ball4 or Nate can make even close to an intelligent comment on the papers. They are simply grasping at straws.
What’s funny is, even if you accept the model based numbers from the Loeb et al paper, you still have the problem of what happened to all that solar energy from the decrease in clouds. Why didn’t it warm a lot more than it has?
In addition, why did the solar warming correlate almost perfectly with the PDO switch in 2014. The warming only occurred during the 2014-2020 time frame. Total greenhouse gas warming would have been stronger during the 2x longer 2001-2014 period.
On top of that, models were already running way too hot and now this means they are running even hotter. In fact, they are clearly now outside the 5-95% bounds when you adjust the data for the cloud changes.
Bottom line is climate science itself has been shown to be working off a false premise.
What false premise would that be Richard M? DREMT does drive a lot of threads off the rails.
“Why didn’t it warm a lot more than it has?”
You don’t specify “it” Richard. Should help figure “it” out reading Loeb discussion in “3 .2. Attribution of EEI Trends” and then in conclusions: “The positive trend in EEI is a result of combined changes in clouds, water vapor, trace gases, surface albedo, and aerosols, which exceed a negative contribution from increasing global mean temperatures.”
In Loeb 2018, for the period July 2005 – June 2015, mean net TOA flux is 0.71 +/- 0.10W m-2. The uptake of solar energy by Earth for this period in W/m^2 (uncertainties at the 95% confidence level):
1) 0.61 +/- 0.09 Argo ocean data to depth 1800m
2) 0.07 +/- 0.04 ocean depths below 1800m, and
3) 0.03 +/- 0.01 from ice warming and melt and atmospheric and lithospheric warming.
“I see this thread has gone completely off the rails. Neither Ball4 or Nate can make even close to an intelligent comment on the papers. They are simply grasping at straws.”
I made specific science-based points, so not sure what your problem is, Richard. Did you not understand them?
“What’s funny is, even if you accept the model based numbers from the Loeb et al paper, you still have the problem of what happened to all that solar energy from the decrease in clouds. Why didn’t it warm a lot more than it has?”
How do you know how much it ‘should have’ warmed?
“In addition, why did the solar warming correlate almost perfectly with the PDO switch in 2014. The warming only occurred during the 2014-2020 time frame.”
It is well known that super El Ninos cause extra warming, and strong La Nina’s like prior to 2014, cause cool episodes.
As Loeb explained, and I discussed, this causes changes to clouds and sea surface temperature over the Pacific, that increased SW solar input, and increased LW output.
“Total greenhouse gas warming would have been stronger during the 2x longer 2001-2014 period.”
There are natural T variations, like ENSO, that don’t go away with AGW, Richard.
It is really a strawman to assume that only GHG warming should be operating.
Nate and Ball4 continue to use guesses, models and estimates in an attempt to rescue their faltering climate pseudo-science.
The Loeb et al 2021 paper even admits most of their paper is guess work.
“the ocean heating rate estimate centered at mid-2005 is the estimate of ocean heat content anomaly”
“net heat uptake rate is estimated”
“the 02,000 m ocean heat uptake is from an estimate”
“the 02,000 m ocean volume for which the first-guess estimate”
“as a first guess at ocean heat content”
“The input variables are those used in the surface flux calculations in the CERES EBAF Ed4.1 (Kato et al., 2018) consisting of adjusted input values provided in the CERES SYN1deg Ed4.1 product that are ‘tuned’ to force a match”
They then use this data to “create” imaginary energy flows. Even then they have high error temperature based radiation estimates. Only fools would accept this kind of obvious pseudo-science.
This is why the D/V 2021 paper is far better. They stick with the actual CERES measurements when discussing energy flows. For example,
“The outgoing TOA LW flux shows a different trend. Figure 6 reveals the increasing LW flux which is much steeper over the clouds (0.35 + or – 0.13 W/m2 per decade) than over the clear sky (0.04 + or – 0.1 W/m2 per decade) which is essentially constant.”
This and several NH/SH variations demonstrate that Loeb et al produced nonsense when they claimed GHGs produced a consistent forcing. Why would GHGs produce differences between hemispheres? What’s clear is almost all of the changes were related to cloud changes. Here’s the bottom line:
“Hence, the rise of the greenhouse gas concentration from 2001 to 2020 had a measurable effect on the LW flux in the Clear Sky, covering about 1/3rd of the Earth surface. In the cloudy part, about 2/3rd, this effect was much smaller, if significant at all.”
How could GHGs have no effect in cloudy areas? Simple, the only GHG that matters is water vapor and there is very little above clouds. However, there is plenty in the clear sky areas and the amount increased over the measured time period.
So, once again the actual, measured data from multiple CERES satellites demonstrate no evidence of any increasing energy gain from non-condensing greenhouse gases.
The Loeb et al 2021 paper even admits to readers their estimates are such that the readers can be 95% confident the true natural value lies within the range shown in the paper.
“(Loeb et. al 2021) claimed GHGs produced a consistent forcing.”
Search paper on “consistent forcing” = 0 hits. Richard M needs to show where this claim is made by the paper’s authors.
Richard M writes: “What’s clear is almost all of the changes were related to cloud changes.”
Almost? All actual changes in EEI in the period would be:
“The positive trend in EEI is a result of combined changes in clouds, water vapor, trace gases, surface albedo, and aerosols, which exceed a negative contribution from increasing global mean temperatures”.
“How could GHGs have no effect in cloudy areas?”
Richard changes the paper’s words from “this effect was much smaller” in his own clip from the paper to Richard’s words “no effect” and later writes “no evidence” when the paper presents the evidence from data with 95% confidence.
As Richard writes, only fools would accept Richard’s kind of obvious pseudo-science.
Richard,
We get it. You have a certain belief, and thus you read any paper with the aim of confirming that belief, and all else is just noise and can be ignored.
You see quotes you like, and you ignore other ones that don’t fit your beliefs.
If instead you read papers with the aim of understanding the science of climate and finding out what is actually happening, then you would do much better and be acting like a scientist.
There are several problems.
1. The system being studied is COMPLEX.
2. Collecting this kind of data is hard.
3. It requires analysis, modeling, and interpretation, which is not simple.
4. It has error bars.
You would like it all to be simple.
You see an increasing OLR and an increasing SW input and say Aha! That disproves the GHE!
1. No, because the increase in OLR was hardly as big as the error on the measurement.
2. No, because the question is how much would it rise in the absence of increasing GHG.
3. No because, Temperature rose which produces an increasing OLR, so we need to know how much it would have risen without GHG.
4. When T rise is accounted for, we see that some of the LW output must have been blocked by GHG.
5. No, Short term measurements have big variability. There is natural warming and cooling going on.
6. An increasing SW input is not a problem for AGW. It is supposed to happen with ice-albedo feedbacks, and is a consequence of El Nino.
You can’t ignore all of that, and just pretend that the only thing that should be happening is GW due to the GHE.
Ball4 once again demonstrates his inability to understand the papers under discussion. Here’s the latest nonsense.
“Search paper on “consistent forcing” = 0 hits. Richard M needs to show where this claim is made by the paper’s authors.”
OK, here’s what the authors’ said.
“Contributions from trace gases are uniform everywhere”
I can only shake my head that anyone could be this dense. I often use general words that describe what the authors found. Maybe you should learn how to read and understand simple English.
Nate also comes back with some anti-science excuses.
“You have a certain belief, and thus you read any paper with the aim of confirming that belief, and all else is just noise and can be ignored.”
Nice projection. We see it in all your comments.
“You would like it all to be simple.”
Not at all. I do however, like to net out what the paper is showing us in as simple a way as possible.
You dont like what that analysis shows so you look for anything that you can take out of context to confirm your beliefs. The rest of your comment is just excuses to allow you to ignore what the data is clearly showing.
Richard’s words of course have a different meaning than the authors words since “Contributions from trace gases are uniform everywhere” as Fig.3(d) shows uniform trend from “well-mixed greenhouse gases (WMGG)” & “In addition to anthropogenic radiative forcing by WMGG, EEI is influenced by…”
“This and several NH/SH variations demonstrate that Loeb et al produced nonsense when they claimed GHGs produced a consistent forcing. Why would GHGs produce differences between hemispheres?”
Why not? NH and SH have very different land/water distribution. Land warms faster than ocean. Again, you want the Earth to behave in a simpler way than it does.
Heres the bottom line:
“Hence, the rise of the greenhouse gas concentration from 2001 to 2020 had a measurable effect on the LW flux in the Clear Sky, covering about 1/3rd of the Earth surface. In the cloudy part, about 2/3rd, this effect was much smaller, if significant at all.”
“How could GHGs have no effect in cloudy areas? Simple, the only GHG that matters is water vapor and there is very little above clouds. However, there is plenty in the clear sky areas and the amount increased over the measured time period.”
Again Richard you are assuming YOU understand how clouds should behave and it should be simple, when in reality their behavior wrt to LW radiation is complicated and a topic of research.
Some types of clouds cause cooling, others warming. Clouds at night block LW output. Clouds in the day ALSO reflect sunlight.
Climate science wants to understand better what clouds are doing, thats the purpose of the satellite measurements.
“So, once again the actual, measured data from multiple CERES satellites demonstrate no evidence of any increasing energy gain from non-condensing greenhouse gases.”
Uhhh, now who’s over-interpreting the data to confirm one’s beliefs.
Ball4 claims “Richard’s words of course have a different meaning than the authors words”.
Say what? What is the difference between “uniform” and “consistent”? They both are saying the exact same thing. And, it is different than what was found in the D/V paper where there was a big difference between the hemispheres.
The point (once again and I’ll type slowly for Ball4) is that Loeb et al used a model to produce their data and that’s why they found uniform/consistent results. There is no actual data that shows the non-condensing GHGs.
Unlike climate cultists like Ball4, I base my views on real data, not on made up data such as found in Loeb et al.
Nate states, “Again Richard you are assuming YOU understand how clouds should behave and it should be simple”
I’m simply interpreting the data. Since there was little change in the LWIR in cloudy areas while we know CO2 levels increased significantly, what other interpretation makes sense?
Clouds are near blackbody absorbers. They already absorb almost all the LWIR so it makes no difference what the gases below them do. In addition, we know the surface radiation is 100% absorbed within 100 meters. Hence, there’s nothing for any additional GHGs to do at lower altitudes.
It was always higher altitudes that were supposed to drive the increases in the GHE. But, in the actual data we find no evidence it exists. The clouds do a nice job of showing this. If non-condensing GHGs had an effect it would show up above the clouds.
What this also means is the increase in the GHE found by D/V in the clear sky areas was due to an increase in water vapor. There really is a positive feedback to warming, there just isn’t any warming induced by CO2.
I probably went too far in saying this was evidence of no warming produced by CO2. For the reduced LWIR above clouds found in the D/V paper there’s another explanation as well. Dr. William Gray proposed that any kind of increased DWIR will increase convection which drives cloud tops higher in the atmosphere and extracts more water vapor.
http://tropical.atmos.colostate.edu/Includes/Documents/Publications/gray2012.pdf
Both of these would reduce LWIR. Higher cloud tops would build into colder air and hence radiate at a colder temperature. Less water vapor would also absorb/radiate less LWIR. Hence, you could have these compensating for increased LWIR in the non-condensing GHGs such as CO2.
The net effect is the same. No warming. It also fits better since we know there’s more CO2 at higher altitudes. Also keep in mind the higher winds at these altitudes will tend to lower the water vapor in the clear sky areas thus producing a negative feedback there.
Put together this would lead to no warming effect over 2/3 of the planet and a reduced warming over the other 1/3. Climate sensitivity to CO2 would be at most .2-.3 C and this may be reduced even further by other negative feedback.
“It was always higher altitudes that were supposed to drive the increases in the GHE. But, in the actual data we find no evidence it exists. The clouds do a nice job of showing this. If non-condensing GHGs had an effect it would show up above the clouds.”
But how would you know it is there or not with the multiple effects clouds have?
Since clouds have complicated behavior, it makes perfect sense that the GHE can be observed most clearly in clear sky situations.
“What this also means is the increase in the GHE found by D/V in the clear sky areas was due to an increase in water vapor.”
Unfounded assumptions in here, Richard, thst are not in the data. This some sort of feeling of yours that fits your beliefs. Why is that OK?
” There really is a positive feedback to warming, there just isnt any warming induced by CO2.”
And again more assumptions.
“Loeb et al used a model to produce their data…There is no actual data that shows the non-condensing GHGs.”
No Richard, you are wrong. Look at Fig. 3d.
Loeb et. al.:”Contributions from trace gases are uniform everywhere (Figure 3d)” is data shown from instruments (CERES radiometers) over time and space “Attribution of Clouds and the Earth’s Radiant Energy System net top-of-atmosphere flux trends for 2002/09-2020/03.”
Loeb’s use of “Uniform everywhere” = the trend in trace WMGG (non-condensing GHG) warming was observed & measured (note: NOT modeled) to be the same spatially across the globe in the period.
Richard’s use of “consistent” = unchanging in nature is wrong because there WAS a data driven change in nature i.e. a warming trend observed in CERES data from “(d) combined contributions from trace gases of 0.22 +/- 0.05 W/m^2 during the observation period with 95% confidence the true natural value is in the interval range.
Unlike Loeb et. al., Richard M bases views on opinions by writing his own words instead of the authors words from the data hence Richard M simply ignores instrumentally measured data from the Clouds and the Earth’s Radiant Energy System.
“I probably went too far in saying this was evidence of no warming produced by CO2. ”
Thanks for that, Richard.
Clouds are indeed complicated.
https://isccp.giss.nasa.gov/role.html
Richard M writes an opinion: “What this also means is the increase in the GHE found by D/V in the clear sky areas was due to an increase in water vapor. There really is a positive feedback to warming, there just isn’t any warming induced by CO2.”
Loeb et. al. 2021 Figure 3 shows Richard’s opinions are wrong since the data measured over time and space from Clouds and the Earth’s Radiant Energy System shows net top-of-atmosphere has flux trends for 2002/09-2020/03 with 95% confidence nature’s true value lies in the range for the period observed and measured:
Water vapor trend Fig. 3(e): +0.31 +/- 0.19 W/m^2
Trace gases trend Fig. 3(d): +0.22 +/- 0.05 W/m^2
Richard M’s written opinions on EEI changes cannot be relied upon.
NB: For EEI trend changes, the figures show contributions from trace gases are uniform everywhere globally and global contributions from water vapor trends are predominantly positive, particularly over land.
Ball4 still hasn’t caught on. The CERES data is only divided into LW and SW buckets. There is no way to determine which part of the LW bucket is due to water vapor or other GHGs.
The breakdown into different buckets for water vapor and other GHGs by Loeb et al is nothing more than a conjecture based on other information. To their credit they specify where they get the information. However, that conjecture may or may not be valid. As I’ve already indicated, part of that conjecture is based on a model.
As a result, any published result that uses this conjecture is not empirical evidence. Hence, it is not all that useful. It still could be right but would need some real experimental evidence.
OTOH, the D/V paper sticks with the empirical data broken down into two buckets. That is why their results are so much more important.
It’s nice that Nate admits that “clouds are complicated”. That doesn’t change the results where the most obvious ‘solution’ is that the effect of CO2 is very small.
It certainly doesn’t fit with the media representation that global warming from our emissions is “unequivocal”.
I realize true believers like Nate and Ball4 will hold on to their 5% chance. I’ll go with the 95% likelihood that a true atmospheric scientist such as Dr. Gray was right. He theorized both a mechanism and the result. The EMPIRICAL data demonstrates that result is happening. This is known as experimental verification.
In Richard’s unsupported opinion: “As I’ve already indicated, part of that conjecture is based on a model.”
Part of? A conjecture? No. To have any credibility at all, Richard will have to show where the authors use the word “conjecture” (he can’t) and show using the authors words that only “part of” the CERES results are based on instrumental data.
The D/V paper and Loeb et. al. results are the same, from the same Clouds and the Earth’s Radiant Energy System instrumental data (but immaterial slightly different periods) so one paper cannot possibly be “so much more important” than the other – that’s just Richard M’s opinion as everyone has one & to which he is entitled – but Richard’s not entitled to his own facts or words different than the authors when discussing their paper.
Ball4 asks “Part of? A conjecture? No. To have any credibility at all, Richard will have to show where the authors use the word “conjecture” (he can’t) and show using the authors words that only “part of” the CERES results are based on instrumental data.”
I already explained it to you. Clearly, you don’t understand the scientific method.
Now, I’ll highlight a major difference between the 2 papers since you obviously haven’t read (or understood) either one.
“The TOA net fluxes over the “Clear Sky” and “Cloudy Areas” exhibit, as expected, a striking difference (Figure 8). The former has a strongly positive (“heating”) net flux whereas the latter has a large negative (“cooling”) value.” – D/V 2021
Yup, the clouds are acting exactly as Dr. Gray explained it in the link I posted previously.
Richard shows a clip from D&V 2021 then fails to follow-up with a clip from Loeb 2021 showing any “major difference”.
Btw, Dr. Gray’s paper only “hypothesizes that it is variations in the global ocean’s Meridional Overturning Circulation (MOC) that are the primary driver of climate change over the last few thousand years’ which is a very different period than either of these two papers covering the satellite era observed climate data. Dr. Gray’s paper is entirely silent on CERES data which include nature’s actual hydrological cycle not any hypothesis.
Dr. Gray’s paper criticizes GCMs Richard, where the two papers which use CERES data under discussion here are not about GCMs. Richard should pick a paper using satellite era data on the same subject in the same period so no “hypothesizing” over thousands of years is necessary in any criticism.
Richard has selected an inappropriate period & hypothetical paper to factually conclude: “Yup, the clouds are acting exactly as Dr. Gray explained it in the link I posted previously.”
Not sure why some words got bolded, my text didn’t use tags on some of those words, this site does have its text editor issues.
“What this also means is the increase in the GHE found by D/V in the clear sky areas was due to an increase in water vapor.”
“There is no way to determine which part of the LW bucket is due to water vapor or other GHGs.”
Which is it, Richard?
“I realize true believers like Nate and Ball4 will hold on to their 5% chance.”
Not sure where you get 5% from?
I am not a ‘true believer’.
Science is about the evidence, not beliefs.
I do find many consistent pieces of evidence that are convincing to me that AGW is happening.
But there a rea lot of unknowns about the strength of feedbacks, about clouds, about tipping points, about ocean cycles.
“Yup, the clouds are acting exactly as Dr. Gray explained it in the link I posted previously.”
Richard, interesting. But I would caution that this is just one idea. There are many papers w different cloud models. Eg Lindzen’s is well known and debated. Read some more.
Still responding! Exactly as I predicted.
Apparently it is not ok to debate a topic for more than a couple of days, unless you are DREMT, who keeps them going for years!
Yes, DREMT runs in circles chasing his tail often repeating already debunked comments along with his mind reading results.
Spending time understanding relativity could correct a lot of DREMT’s mistaken science but running in circles is easier, less work, while a very entertaining benefit for more astute blog readers.
Exactly as I predicted. Paid to lie on blogs to their intellectual and moral superiors, getting the last word is part of their job description. That’s why beating them at their own game is so satisfying. Every time I get the last word, it’s killing them.
Ball4 obviously didn’t read or understand Dr. Gray’s work. He mentions parts of the paper completely unrelated to our current discussion. He completely missed the relevant sections. It is obvious Ball4 didn’t even notice the paper was from a decade ago.
Once again this highlights how useless it is to debate someone who has no understanding of science.
Nate is correct that Dr. Gray’s ideas are only one possible explanation of the CERES results. I also stated another explanation which is CO2 has no warming capability at all because its radiation is part of a much larger atmospheric energy flow that is self regulating.
The biggest problem for climate alarmists is still the fact that the solar energy gain, caused mainly by the cloud reduction, was sufficient to cause all of the warming over the 20 year period. If someone were to take UAH data and correct it for the warming potential of that energy it would likely end up showing a cooling trend.
With no evidence of any increase in greenhouse warming despite significant increases in CO2 and CH4, the entire theory is at best incomplete and at worst completely wrong.
So, Richard M, fill us in on which parts of the 2012 paper hypotheses over thousands of prior years you claim IS completely relevant to the measured satellite era data discussion in the 2 papers.
Unfortunately for Richard now there IS measured evidence for the increase in trace gases causing greenhouse warming in the satellite era in the two papers. In fact, there was enough measured evidence in 1938 that the then prediction for increase in global temperature due increase in CO2 ppm was proven accurate by 2013 so Dr. Gray could have noticed and reported on that but he didn’t.
Im going to step over the paranoid-delusional person, who is sharing that his main purpose for being here is… to troll his many perceived enemies.
Now, back to the science discussion with someone who wants to continue discussing science,
Richard,
“The biggest problem for climate alarmists is still the fact that the solar energy gain, caused mainly by the cloud reduction, was sufficient to cause all of the warming over the 20 year period.”
How do you know it was sufficient? How do you know how much warming should have occurred?
https://agupubs.onlinelibrary.wiley.com/cms/asset/982cfcbf-43f4-49dd-be20-2ab9758e2b95/grl62546-fig-0002-m.png
We can see in fig a and b that all the gain in ASR and reduction of downwelling LW happened during the 5 y transition from the La Nina period to the El Nino period.
It is already well known that during strong El Ninos (2015-16) there is a burst of global warming.
Clearly what we can learn from this paper is that extra solar gain is part of an El Nino. The other part is warmer water and heating of the troposphere. With warmer water, warmer troposphere, and less clouds there is greater OLR.
In the La Nina period of 2008-13, presumably the opposite should have been happening. Extra cooling, more clouds, less OLR.
So this is explaining pretty well the figure and why ASR jumps and downwelling LW decreases during a short period.
Richard,
Found this paper discussing the Tropics CERES results for the period 2003-2013, leading up to the La Ninas.
They see a decreasing trend in OLR during the period, and explain it in terms of El Nino and La Nina.
https://agupubs.onlinelibrary.wiley.com/doi/full/10.1002/2017JD027002
“Trends of tropical (30°N–30°S) mean daytime and nighttime outgoing longwave radiations (OLRs) from the Clouds and Earth’s Radiant Energy System (CERES) and the Atmospheric Infrared Sounder (AIRS) are analyzed using data from 2003 to 2013. Both the daytime and nighttime OLRs from these instruments show decreasing trends because of El Niño conditions early in the period and La Niña conditions at the end. However, the daytime and nighttime OLRs decrease at different rates with the OLR decreasing faster during daytime than nighttime. The daytime-nighttime OLR trend is consistent across CERES Terra, Aqua observations, and computed OLR based upon AIRS and Moderate-Resolution Imaging Spectroradiometer (MODIS) retrievals. To understand the cause of the differing decreasing rates of daytime and nighttime OLRs, high cloud fraction and effective temperature are examined using cloud retrievals from MODIS and AIRS. Unlike the very consistent OLR trends between CERES and AIRS, the trends in cloud properties are not as consistent, which are likely due to the different cloud retrieval methods used. When MODIS and AIRS cloud properties are used to compute OLR, the daytime and nighttime OLR trends based upon MODIS cloud properties are approximately half as large as the trends from AIRS cloud properties, but their daytime-nighttime OLR trends are in agreement. This demonstrates that though the current cloud retrieval algorithms lack the accuracy to pinpoint the changes of daytime and nighttime clouds in the tropics, they do provide a radiatively consistent view for daytime and nighttime OLR changes. The causes for the larger decreasing daytime OLR trend than that for nighttime OLR are not clear and further studies are needed.”
“Leftists will have some serious explaining to do in about 5~8 years from now brrrr.”
Physics doesn’t care about politics. The fact that you infect your mind with these associations shows that you don’t care about physics.
Barry-san:
You’re correct that true science should not care about politics, however, CAGW is a polical phenomenon, and not a physical one…
In about 5~8 years, the PDO/AMO ocean cool cycles should finally drive a stake through the heart of this CAGW political hoax, which has sucked so much blood out of taxpayers since this myth was started in 1988…
It’s amazing what lies Leftists are willing to subsidize and promote for the goal of stealing $10’s of trillions and usurping control and power over virtually every aspect of our daily lives…
The acronym CAGW is a political construct made by critics of AGW. Pure rhetoric.
Your protestation that science should be free of politics is made hollow by the term you chose.
What follows in your comments is yet more politics. That increased atmospheric CO2 should increase surface temperatures is a matter of physics, not politics, and the science for that well predates 1988.
Barry-san:
The silly Anthropogenic Global Warming Cult that preaches higher CO2 levels will destroy the world has always been a politicalconstruct, not a physical one..
CAGW simply clarifies the death cults failed prophesy
Do you believe in climate change? LOL! What a jokeas if climate is a god
“Do you believe in climate change?”
What has ‘belief’ got to do with it?
I note the changing of the seasons. Summer and Winter provide two different climates where I live.
The science on ice ages and long-term global climate change is robust. I accept the current state of understanding.
The greenhouse effect is real and demonstrated and the physics behind it is sound.
You wish to talk about qualitative statements and belief. That is your choice, not mine.
The acronym “CAGW” is a political construct made by critics of AGW. An acronymic straw man. Pure rhetoric.
Your protestation that science should be free of politics is made hollow by the term you chose.
What follows in your comments is yet more politics.
That increased atmospheric CO2 should increase surface temperatures is a matter of physics, not politics, and the science for that well predates 1988.
Looks like the cold air is locked up in the Arctic. Maybe backradiation is taking a break.
RWT
Backradiation very certainly is not the source of Arctic warming.
Maybe the Arctic oceans cooled down a bit, or the advection streams moving in the lower troposphere poleward from the Tropics weakened accordingly.
RWT, back-radiation never takes a break. It is always confusing climate cultists. They still seem to deny the obvious reaction that eliminates any effect.
From what I can see most of them are in total denial of the latest CERES data showing all the 21st century warming (and then some) was due to an increase in solar energy.
… due to decreased reflection of energy back into space by clouds and sea ice and increases in well-mixed greenhouse gases and water vapor.
Ref. Loeb et. al. in GRL 10/2021.
Ball4, did you see how they came up with the “well-mixed greenhouse gases”?
“… F is the flux calculated using the NASA Langley Fu-Liou radiative transfer model ”
Oh, they used a model. They did not “find” any evidence of warming from greenhouse gases, they used models to produce a value.
But the measured data shows the following.
the observations show a trend in net downward radiation of 0.41 0.22 W m−2 decade−1 that is the result of the sum of a 0.65 0.17 W m−2 decade−1 trend in absorbed solar radiation (ASR) and a −0.24 0.13 W m−2 decade−1 trend in downward radiation due to an increase in OLR
IOW, outgoing IR cooled the planet.
The model is used for constraining radiative transfer calculations to instantaneous observations of irradiance (and radiance) from the CERES instruments.
Your limited clip in part shows the measured data.
Assessing all calibrated CERES measured data for planetary heat uptake leads to the key point of the paper:
Anthropogenic forcing, internal variability, and climate feedbacks
all contribute to the positive trend in EEI.
Ball4, you obviously didn’t understand what you wrote. They used the model to redefine (“constraining”) what the data meant. LOL. That is not a measurement. The model tells you nothing about the data. It only gives you a small window into one atmospheric process while ignoring everything else.
What the data tells you is two-fold.
1) More solar energy was added to the atmosphere than was required to produce the warming measured over the 20 year period.
2) Some of the warming was reduced by an increase in outgoing LW radiation. This is the very radiation that is supposed to be “trapped” by increasing CO2.
The claim that greenhouse gases produced some of the warming is pure nonsense. There is zero evidence that supports that claim. Want to know what really happened?
Increases in greenhouse gases did produce more downwelling radiation as the model indicates. However, this was quickly countered by increases in all of the atmospheric energy transport mechanisms. Something the model ignores. For every action there’s an equal and opposite reaction. Newton may not have known about radiation, but he knew science. The same types of forces that apply to his Laws of Motion also apply within the atmosphere.
As a result the energy radiated to space was based on the temperature of the upward radiation from greenhouse gases. It increased because the temperature increased. The downward radiation was irrelevant.
Richard, your debate fails because you can’t even agree with yourself let alone the CERES data.
You claim: “Increases in greenhouse gases did produce more downwelling radiation as the model indicates” with you having been told (by the paper’s authors) the model is constrained to the CERES data.
which contradicts your own claim:
“that greenhouse gases produced some of the warming is pure nonsense.”
Any reply should make consistent factual scientific sense finding something wrong with the Oct. paper in GRL so that Richard can publish a rebuttal to:
“Increasing well-mixed greenhouse gases (WMGG) have led to an imbalance between how much solar radiant energy is absorbed by Earth and how much thermal infrared radiation is emitted to space.”
“Anthropogenic forcing, internal variability, and climate feedbacks all contribute to the positive trend in EEI.”
Ball4, I must apologize for assuming you had at least a basic understanding of physics. My mistake. I should have specified when my comment was referring to basic physics vs. the paper. Clearly, you could not tell the difference.
When I stated that “Increases in greenhouse gases did produce more downwelling radiation” I was referring to well known radiation physics. Hence, whatever the author’s stated had nothing to do with this statement of fact and could hardly contradict my claim.
BTW, “the Oct. paper in GRL” you mentioned doesn’t exist. I suspect you meant the June paper by Loeb et al. The Oct. paper is in the journal Atmosphere. The comments in Loeb et al are not my problem. They are words unsupported by any data. I have no idea why you would repeat them.
Since Richard admits having “no idea” about the data writing “words unsupported”, he can find the data supporting Loeb et. al. words which contradict Richard’s claims – from the Geophysical:
“10.1029/2021GL093047 RESEARCH LETTER
Data Availability Statement
CERES_EBAF Ed4.1 was obtained from the CERES ordering page at http://ceres.larc.nasa.gov/order_data. php. PDO index data were obtained from https://climexp.knmi.nl/data/ipdo.dat and accessed on November 3, 2020. Nino3.4 index data are from ESRL/NOAA obtained from https://psl.noaa.gov/data/correlation/nina34.data. Ocean heat content anomaly data used to determine the in situ EEI were obtained from https://oceans.pmel.noaa.gov. Partial radiative perturbation anomalies were obtained from https://ceres. larc.nasa.gov/ceres-prp-anomalies.php.”
The GRL paper author’s have already done the work to show Richard the CERES data in total does in fact support the author’s words:
“Increasing well-mixed greenhouse gases (WMGG) have led to an imbalance between how much solar radiant energy is absorbed by Earth and how much thermal infrared radiation is emitted to space.”
“Anthropogenic forcing, internal variability, and climate feedbacks all contribute to the positive trend in EEI.”
Again, trying to make it about Loeb et al rather than Dubal and Vahrenholt. Very odd.
Yes, the Loeb paper, which is the originator of the data being discussed, was introduced by Ball4.
from the Dubal paper they interestingly indicate:
“At this point, we describe the direct observation of the greenhouse effect, namely by comparing the ‘Clear Sky’ LW upwelling radiation (Figure 11d) and the outgoing TOA LW flux (Figure 6a, left side). The first is rising with +1.22 ± 0.22 W/m2 per decade, the latter trend is literally flat with +0.04 ± 0.10 W/m2 per decade. Hence, in the absence of clouds, a large portion of this additional upwelling LW radiation is absorbed by the increasing greenhouse gas concentration (CO2 has increased from 371 to 414 ppm obtained from https://gml.noaa.gov/webdata/ccgg/trends/co2/co2_annmean_mlo.txt (accessed on 29 July 2021), water from 10.44 to 10.71 g/kg at 1000 mbar from 2001 to 2020 obtained from https://psl.noaa.gov/cgi-bin/data/timeseries/timeseries1.pl, (accessed on 29 July 2021). We have applied the Lambert–Beer’s law and correlated the logarithmic ratio of the outgoing TOA LW flux and the ‘Clear Sky’ LW upwelling flux with the rising greenhouse gas concentrations and found a very good linear correlations for CO2 (R2 = 0.92) and water vapor (R2 = 0.72).”
Basically what they are saying here is that at least in the clear sky, the GHE is very real, can be observed, and agrees with theoretical expectations.
All the deniers of the GHE should perhaps read this paper that Richard and DREMT like so much.
Another very good & rare if not unique feature of that paper, Nate, is they define their words SW and LW bands in terms of actual frequency.
Another interesting part of the paper, Ball4, is that they state:
"The data shown in Figure 1, Figure 2 and Figure 3 suggest that the root cause for the positive TOA net flux and, hence, for a further accumulation of energy during the last two decades was a declining outgoing shortwave flux and not a retained LW flux. The dominating influence of a declining TOA outgoing SW is not in line with the assumption that the global warming in the last 20 years is primarily caused by holding back the LW due to the greenhouse effect. As discussed below, the greenhouse effect plays a role, however, for the period 2001–2020 at TOA it was certainly not dominating.”
You have to remember that the GHE is supposedly a warming effect. In other words, warming has to occur as a result of any changes in the LW flux. What evidence is there that the observed changes in the LW flux contributed to the warming? It’s just assumed that it must have had some effect. Yet we know from experiment (eg. Seim & Olsen) that changes in LW flux do not necessarily result in any warming!
Decent (near enough) verbatim quote from the paper in quotation marks DREMT, not vague there.
However, DREMT’s last paragraph again shows DREMT admitting to being misinformed and vague – this time by not using verbatim words from yet another paper. Quote any and all paper(s) verbatim DREMT.
No valid criticism from Ball4 means my comment remains successfully unchallenged.
Seim & Olsen:
“The Greenhouse Effect was simulated in a laboratory setup, consisting of a heated ground area and two chambers, one filled with air and one filled with air or CO2. While heating the gas the temperature and IR radiation in both chambers were measured. IR radiation was produced by heating a metal plate mounted on the rear wall. Reduced IR radiation through the front window was observed when the air in the foremost chamber was exchanged with CO2. In the rear chamber, we observed increased IR radiation due to backscatter from the front chamber. Based on the Stefan Boltzmann’s law, this should increase the temperature of the air in the rear chamber by 2.4 to 4 degrees, but no such increase was found. A thermopile, made to increase the sensitivity and accuracy of the temperature measurements, showed that the temperature with CO2 increased slightly, about 0.5%.”
Good job DREMT uses a verbatim quote from a paper.
In order to avoid being misinformed & vague, DREMT must use words verbatim from any paper so find DREMT’s latest paper investigates a lab GHE w/verbatim quote “The Greenhouse Effect was simulated in a laboratory setup” where the optical depth of the apparatus is shown on the order of 100cm.
However, the published paper being discussed in this thread uses the actual earthen optical depth for the real earthen GHE as observed from CERES and its authors do show with data according to DREMT’s verbatim clip the earthen “greenhouse effect plays a role” to prevent DREMT from being misinformed by a lab GHE investigation.
It is particularly interesting that the S&O authors DREMT seemingly relies upon have not made a fortune manufacturing the world’s very first actual physical black body as the authors claim to have measured a black body (if this site displays quote verbatim):
“We are in an advantageous situation since we can measure the IR radiation and the temperature of Styrofoam when it is heated! This was done and we found that, in our experimental setup, the value of ε was measured to be 1.0 +/- 0.025”
Sure, Ball4’s a skillful sophist. That’s why he’s been employed for so long, polluting climate threads all over the internet with his drivel, under various pseudonyms. But beneath all the bluster, he has no comment on S & O worth responding to. Ultimately, does he dispute this:
"In the rear chamber, we observed increased IR radiation due to backscatter from the front chamber. Based on the Stefan Boltzmann’s law, this should increase the temperature of the air in the rear chamber by 2.4 to 4 degrees, but no such increase was found"?
We will likely never know, as a direct answer from Ball4 is the last thing we’re ever going to get.
The sophists congregate at an appropriately named DREMT website, not me. Thanks for admitting you have no proper rebuttal here DREMT.
I don’t dispute the 2.4-4 numbers are just announced as a “should”: “The change in observed backscatter radiation should give us a measurable temperature increase of 2.4 to 4 K by using the Stefan Boltzmann law” – DREMT just accepts 2.4-4C is correct on faith.
Not interested in a lab GHE paper, back to the regularly scheduled earthen GHE paper(s).
You made no argument to rebut, sophist.
Some people here are claiming, without evidence, that the papers showed that the GW that occurred in this period could be attributed only to SW radiation.
That is False.
The globe warmed in the period, and the papers showed an increasing abs*orp*tion of LW and SW radiation, thus by 1LOT, it can be surmised that both SW and LW led to warming.
To assume that only SW radiation obeys 1LOT is of course quite silly.
Ball4, did you bother to go look at https://ceres. larc.nasa.gov/ceres-prp-anomalies.php?
It the results of an analysis. It is not measured data. They told you that in the paper as well.
“For non-cloud contributions, the effect on the flux (δF) due to some perturbation Δx of variable x is computed using a centered finite difference by averaging the backward finite difference:
urn:x-wiley:00948276:media:grl62546:grl62546-math-0001
(1)
with the forward finite difference:
urn:x-wiley:00948276:media:grl62546:grl62546-math-0002
(2)
where x, y1,,yN are gridded monthly mean input variables to radiative transfer model calculations …”
“F is the flux calculated using the NASA Langley Fu-Liou radiative transfer model …”
Do you know what the words “computed”, “calculated” and “model” mean? It’s obvious you have no clue.
Guess what? The entire problem with climate science lies in misunderstanding the output of radiative transfer models. Using them to “adjust” the data simply applies the same misunderstanding to these results. And, from a scientific point of view it is meaningless.
Like Nate, you are ignoring the actual measured data and it’s obvious why you are doing it. The data does not support AGW.
“Like Nate, you are ignoring the actual measured data”
No Richard, we are not.
All data requires analysis and interpretation. Thats what papers are for.
You need to understand what that analysis and interpretation is saying.
The CERES data is not adjusted to the model Richard, the authors tell you that: “The model is used for constraining radiative transfer calculations to instantaneous observations of irradiance (and radiance) from the CERES instruments.”
It is only Richard M ignoring some of the CERES data in that the authors use all of it to “identify the effect of the anthropogenic greenhouse gas emissions from 2001 to 2020 in the “Clear Sky” LW”.
Ball4 is now openly mangling together discussion of the Loeb paper with a quote from the Dubal & Vahrenholt paper. He also leaves out part of the quote:
“We could identify the effect of the anthropogenic greenhouse gas emissions from 2001 to 2020 in the “Clear Sky” LW part but not in the “Cloudy Areas” and not in the SW. At the same time, we find, in accordance with the analysis of Loeb et al. [14] and Ollila [18], that the major changes for the TOA energy budget during this period of time stemmed from the clouds for SW and LW, as well as the ground temperature in the LW.”
Good job DREMT by quoting authors verbatim, you should advocate Richard M do the same. The CERES data papers discussed use the same data and complement each other though they use such slightly different periods that it is immaterial.
The “Clear Sky” LW part covers only about 1/3 of the Earth’s surface and the “cloudy areas” 2/3. You’d think it would be noteworthy that they only found a “measurable effect on the LW flux” by greenhouse gas emissions for 1/3 of the planet…and even then there is no evidence that this “measurable effect on the LW flux” led to any of the observed warming over the period, and some evidence (e.g. Seim & Olsen) that it would not lead to warming.
Some people here would really like us to stop paying attention to the paper authored by the CERES Principal Investigator, Loeb, discussing the very same CERES data set as the others.
Why?
Is there a science reason for that?
“and even then there is no evidence that the ‘measurable effect on the SW flux’ led to any of the observed warming.”
Some people like to cherry pick and spin..
Thanks for admitting you have no proper rebuttal here Ball4.
“Maybe backradiation is taking a break.”
Maybe weather is not taking a break from being variable.
Global warming is the greatest thread to mankind. Despite la nina and low solar activity a +0,08C anomaly. In the upcoming years we will probably see a significant increase in the warming trend
Markus, humans have added CO2 to the atmosphere for about 120 years, and the global average temperature has changed +1 degree if you trust the VERY rough estimates for 1880.
NO ONE WAS HARMED.
You have no idea what will happen in the upcoming years.
Nor does anyone else.
But even if the upcoming 45 years have just as much global warming as the past 45 years, it will be completely harmless.
People who predict the future climate and, imagine bad news should be ignored. You are one of them.
Temperatures plummeted by 3C in a decade at the start of the Little Ice Age 1300 – 1850. Europe lost half its population.
Any cooling scenario would be much worse than any warming scenario.
Recall too that Holocene has mostly been warmer than now.
3C is way higher than anything I’ve seen. I believe the Tambora eruption only yielded a 1 C drop. Can you post a link to the global temperature reconstruction that you are referring to here?
I’ve seen claims varying from 1C to 4C cooling. Here is Easterbrook stating its 4C: https://wattsupwiththat.com/2011/01/24/easterbrook-on-the-magnitude-of-greenland-gisp2-ice-core-data/
Easterbrook uses Dr. Alley’s data. It’s only for one site in Greenland so it’s no where close to be a global temperature reconstruction. The change in temperature from 1300-1850 AD is confined to a 0.5 C range. If you go back to around 1000 AD that range expands to 1.5 C.
“But even if the upcoming 45 years have just as much global warming as the past 45 years, it will be completely harmless.”
Its safe to say it will do little harm to RG..
Nate
Please provide a list of people harmed in any way by the mild global warming in the past 45 years.
If you can’t name any people harmed, because there were none, please provide a list of the damage done to our planet you believe was caused by the mild warming in the past 45 years that was unlike damage in any prior 45 year period.
There is evidence that Hurricane Harvey was a record rain and deadlier flooding event as a result of AGW. There is evidence that the western US is warmer and drier, and therefore making forest fires much worse, and deadlier, as a result. There is evidence that the Himalayan glacier, a primary water source for Asia is receding as a result. On and on.
How are you certain these things are NOT related to AGW?
Ken, Europe’s population loss in the 14th century was the result of the arrival of the PLAGUE, not the Little Ice Age. The same thing happened in Iceland, though later in the century.
Cooling causes crop failure and famine.
Famine results in weakened immune systems. People are more vulnerable to pandemics such as Plague.
Plague wiped out people from every strata of society. Social unrest results.
Social Unrest for long periods will trigger wars.
Europe lost half its population directly due to crop failure and indirectly to the fall out effects.
Ken
You are a bit too superficial here.
Ireland for example lost at least a million inhabitants, but that was not due to cooling.
” 1847 famine in Ireland
From 1845 to 1849 there were many bad harvests in Europe due to the potato blight, which led to famine. In 1847 Ireland was particularly hard hit. In the face of hunger, the Brodverein was founded in Germany, the forerunner of the later Raiffeisen cooperatives.
The years 1845 to 1849 were difficult times for a large part of Europe’s population, who mostly lived in poor conditions. The potato rot pathogen, which was previously unknown in this country, was introduced from North America around 1840.
In continental Europe it led to some bad harvests during the years mentioned. The rural population in particular suffered from it. However, several periods of drought followed, which quickly put an end to the fungus on the continent. Because the mushroom needs a cold and humid climate to thrive. ”
*
Another example is the giant eruption of Mount Samalas on Lombok island, Indonesia in 1257, VEI 7/8.
It had hard consequences on year later in Europe: London for example lost 1/3 of its population due to hunger.
*
Thus, a deeper investigation is needed.
I am sure you can find any number of examples similar to the potato blight and Mount Salmas.
The famine that occurred at the start of the little ice age was due to heavy rain, shorter growing seasons, and extreme weather events, (kinda sorta like what has been happening Europe, China, and British Columbia) Places like Greenland got too cold to sustain any crops. Places like Norway lost acres of cropland that became too marginal to sustain crops. Places like most of Europe had many years of low returns on any grain crop you might care to mention.
Crops like Potatoes were adopted in Ireland precisely because they provide a more certain crop outcome. UK in particular proved a lot more ready to adapt to root crops and new agricultural methods while places like France suffered.
Ken
In the sum I agree, that’s evident.
@Ken
“Any cooling scenario would be much worse than any warming scenario.”
___________________________________
It doesnt matter, what would be worse, since we have no choice between both of them.
The coming warming will be bad enough, to slow it down.
Markus, you appear to be unaware of the latest NASA CERES data which did not detect any increase in greenhouse warming over the last two decades. Man made global warming appears to be nothing but pseudo-science.
The warming we have seen was most likely due to the positive phases of the AMO and PDO which will likely now turn negative. No warming is likely for decades.
The has been an slight underlying ocean warming which is now about 400 years long. That should help keep the global temperature up for awhile. Once again, humans were not the cause.
From CERES data in GRL key points:
Anthropogenic forcing, internal variability, and climate feedbacks
all contribute to the positive trend in EEI (Earth’s Energy Imbalance)
Richard,
You are misunderstanding what the paper is about.
“Earth’s Energy Imbalance (EEI) is a relatively small (presently ∼0.3%) difference between global mean solar radiation absorbed and thermal infrared radiation emitted to space. EEI is set by natural and anthropogenic climate forcings and the climate system’s response to those forcings. It is also influenced by internal variations within the climate system. Most of EEI warms the ocean; the remainder heats the land, melts ice, and warms the atmosphere. We show that independent satellite and in situ observations each yield statistically indistinguishable decadal increases in EEI from mid-2005 to mid-2019 of 0.50 0.47 W m−2 decade−1 (5%95% confidence interval). This trend is primarily due to an increase in absorbed solar radiation associated with decreased reflection by clouds and sea-ice and a decrease in outgoing longwave radiation (OLR) due to increases in trace gases and water vapor. These changes combined exceed a positive trend in OLR due to increasing global mean temperatures.”
The point is this, the EEI is NOT Global warming. It is simply the IMBALANCE in outgoing and incoming flux.
Even if it remained CONSTANT the Earth would still be warming.
It could be constant if the GHE was increasing and the temperature was increasing exactly enough to balance out the added GHE.
And he notes that “a decrease in outgoing longwave radiation (OLR) due to increases in trace gases and water vapor”, IOW the increasing GHE, is still happening.
All nonsense! The EEI is just more of the AGW nonsense, on steroids. It starts with violations of the laws of physics, and ends up with estimates, assumptions, and guesses.
Nate,
Maybe you deny the obvious fact that the Earth no longer has a molten surface.
You are in good company. It escaped the notice of intelligent people such as Carl Sagan, James Hansen, Gavin Scmidt and other climate crackpots.
They somehow managed to convince themselves that a formula giving the Earth’s surface temperature as 255 K was not a denial of reality.
For example, before the first liquid water formed, the average surface temperature was above 373 K. The climate crank “formula” gives – 255 K! When the surface was molten, once again the stupid “formula” gives – 255 K!
And now, when the surface temperature is manifestly about 288 K, the ridiculous “formula” gives, once again, 255 K.
No EEI, you fool – at least none that creates “global warming”. Don’t believe me?
Put a pot of hot water in direct sunlight. Come back in a year, or a decade, or a century, and see how much it has warmed up due to your imaginary EEI.
It doesn’t really matter, does it? You can’t even say where this “GHE” may be observed, measured, or documented. A mystical “effect” that can’t be demonstrated indoors, at night, or reproduced in a laboratory! Must be a “climate science” effect, hidden from normal science.
Carry on.
[laughing]
Nate, EEI is a measure of the energy changes that could produce warming (or cooling if negative).
“an imbalance between how much solar radiant energy is absorbed by Earth and how much thermal infrared radiation is emitted to space.”
What they found is the energy imbalance during the years investigated was due to an increase in SW (solar energy) which was somewhat compensated for by an increase in IR. Both of these are in direct conflict with greenhouse warming.
Greenhouse warming occurs when solar energy stays constant and outgoing IR decreases.
The biggest problem is the solar warming energy was more than enough to account for ALL of the warming. What happened to the greenhouse warming? If it was still happening in parallel it should have added even more to the warming seen. However, what actually happened was increased outgoing IR to reduce the solar warming.
There was no decrease in outgoing IR. It went up.
The outgoing terrestrial LW IR is going back up to equilibrium with the incoming system absorbed solar SW IR:
“Most of this excess energy (about 90%) warms the ocean, with the remainder heating the land, melting snow and ice, and warming the atmosphere.”
From all imbalance causes, calibrated CERES data show: “a decadal increase in the rate of energy uptake by Earth from mid-2005 through mid-2019, which we attribute to decreased reflection of energy back into space by clouds and sea ice and increases in well-mixed greenhouse gases and water vapor.”
“There was no decrease in outgoing IR. It went up.”
Nope, that is not what the paper says, Richard. Quote it.
You are misinterpreting the paper in several ways.
EEI is simply the imbalance between incoming and outgoing.
Example, my oven is on with the door open. Lots of heat is escaping out the open door, so it reaches only 250F inside when the incoming and outflowing heat reaches balance. EEI is 0.
Then I close the door. The closed door is now blocking more of the outflow. Now there is large EEI and the temperature rises.
But now, as the temperature continues to rise, the EEI is going down! T keeps rising until the EEI reaches 0.
For Earth, the EEI does not need to be RISING for GW to be happening. In fact, it could remain constant or even DECREASE while global temps continue to rise.
The equivalent of closing the oven door for Earth is the GHE, which is slowly increasing. If its increase is matched by the increase in temperature, the EEI could be constant.
“There was no decrease in outgoing IR. It went up.”
Yes, total OLR has been increasing since at least 1985:
https://mdpi-res.com/d_attachment/remotesensing/remotesensing-10-01539/article_deploy/remotesensing-10-01539.pdf
“In this paper, decadal changes of the Outgoing Longwave Radiation (OLR) as measured by the Clouds and Earth’s Radiant Energy System from 2000 to 2018, the Earth Radiation Budget Experiment from 1985 to 1998, and the High-resolution Infrared Radiation Sounder from 1985 to 2018 are analysed. The OLR has been rising since 1985, and correlates well with the rising global temperature.”
From the paper:
“It can be expected that the OLR rises with increasing global temperature. This is a mechanism
by which earth can return to a climate equilibrium after an initial perturbation by an external
radiative forcing. Our measured value of dOLT/dT can be compared with the model values
from [15]. If earth were a blackbody without an atmosphere, the derivation of the Planck curve yields
dOLT/dT = 3.3 W/m2K. Inclusion of the water vapour feedbackif earth warms, its atmosphere
contains more water vapour, which strengthens the greenhouse effect and yields a clear-sky
dOLT/dT = 2.2 W/m2K. dOLT/dT is determined for 19 General Circulation Models (GCMs) in
Table 10 of [15].”
And??
*Automatic Response*
I have put Nate on ignore (for the last two years now).
Yet another DREMT red-herring appeal to authority.
#2
*Automatic Response*
I have put Nate on ignore (for the last two years now).
Its quite simple, if you don’t want to respond to my posts, the stop responding to my posts!
#3
*Automatic Response*
I have put Nate on ignore (for the last two years now).
“Dont believe me?
Put a pot of hot water in direct sunlight. Come back in a year, or a decade, or a century, and see how much it has warmed up due to your imaginary EEI.”
No one believes your strawmen have anything to do with this discussion.
“What they found is the energy imbalance during the years investigated was due to an increase in SW (solar energy) which was somewhat compensated for by an increase in IR. Both of these are in direct conflict with greenhouse warming.
Greenhouse warming occurs when solar energy stays constant and outgoing IR decreases.
The biggest problem is the solar warming energy was more than enough to account for ALL of the warming. What happened to the greenhouse warming? If it was still happening in parallel it should have added even more to the warming seen. However, what actually happened was increased outgoing IR to reduce the solar warming.
There was no decrease in outgoing IR. It went up.”
Well…that’s that.
“…solar warming energy…”
Unfortunately for DREMT in the recent report: “Radiative energy flux data, downloaded from CERES, are evaluated with respect to their variations from 2001 to 2020…This leads together with a reduced incoming solar of -0.17 W/m^2 to a small growth of imbalance of 0.15 W/m^2 .”
That IS that. DREMT admits to remaining misinformed on the period’s CERES data.
I was just quoting Richard M, Ball4. That’s what the quotation marks were for. According to the paper itself:
“Radiative energy flux data, downloaded from CERES, are evaluated with respect to their variations from 2001 to 2020. We found the declining outgoing shortwave radiation to be the most important contributor for a positive TOA (top of the atmosphere) net flux of 0.8 W/m2 in this time frame. We compare clear sky with cloudy areas and find that changes in the cloud structure should be the root cause for the shortwave trend.”
…and:
“The TOA net flux was +0.75 W/m2 in 2020. The data shown in Figure 1, Figure 2 and Figure 3 suggest that the root cause for the positive TOA net flux and, hence, for a further accumulation of energy during the last two decades was a declining outgoing shortwave flux and not a retained LW flux. The dominating influence of a declining TOA outgoing SW is not in line with the assumption that the global warming in the last 20 years is primarily caused by holding back the LW due to the greenhouse effect. As discussed below, the greenhouse effect plays a role, however, for the period 2001–2020 at TOA it was certainly not dominating.”
DREMT admits being misinformed since per the paper quotation incoming solar went down in the period, so DREMT should go and argue with Richard M.
It would help DREMT to read & quote from the paper at first (like DREMT did at 6:28 pm) – a practice which would have helped Richard M comment correctly also.
Paper: “the greenhouse effect plays a role”.
So DREMT’s Well…that’s that. was misinformed as DREMT has admitted.
Good to see DREMT actually reading and quoting the paper though, keep up that best practice.
Richard M did not say incoming solar went up, so there is nothing for me to argue with Richard M about. What Richard M said was that there was an “increase in SW (solar energy). There was indeed an increase in ASR (Absorbed Solar Radiation) since there was less SW out at TOA. Thus Richard M is correct and Ball4 attacks a straw man.
Richard M’s “solar warming” meant in context same as increased incoming solar, DREMT, but incoming solar decreased per the paper. DREMT doesn’t even understand the climate lingo.
Go argue with Richard M not me, as I quoted from the paper. Correctly quote from the paper not Richard M who DREMT already admitted misinformed DREMT.
Ball4 will not be able to quote Richard M as saying that incoming solar increased because Richard M did not say that incoming solar increased. Ball4 continues to attack the same straw man even when it is brought to his attention.
In fact, if Ball4 searches further upthread, he will find Richard M writing correctly:
“the root cause for the positive TOA net flux and, hence, for a further accumulation of energy during the last two decades was a declining outgoing shortwave flux and not a retained LW flux”
DREMT, your clip is the paper’s authors writing and Richard M’s verbatim quoting so of course Richard M’s quote is correct.
Right. So you will stop bashing your straw man about increased incoming solar?
I did not start. Go argue with Richard M being incorrect about “solar warming” per the paper’s data and admittedly misinforming DREMT with words unsupported by that data.
“Solar warming” as in “warming due to an increase in ASR”, Ball4. Nowhere did Richard M write that incoming solar radiation increased, so I do not need to argue with Richard M.
That’s wrong DREMT. Go argue with Richard M vs. the paper.
http://www.drroyspencer.com/2021/12/uah-global-temperature-update-for-november-2021-0-08-deg-c/#comment-1042419
Nowhere did Richard M write that incoming solar radiation increased, so I do not need to argue with Richard M.
DREMT again claims he is not responding to me, while again responding to me!
http://www.drroyspencer.com/2021/12/uah-global-temperature-update-for-november-2021-0-08-deg-c/#comment-1051696
Clearly he is obsessed and cannot look away.
“which was somewhat compensated for by an increase in IR. Both of these are in direct conflict with greenhouse warming.”
FALSE.
“It can be expected that the OLR rises with increasing global temperature. This is a mechanism
by which earth can return to a climate equilibrium after an initial perturbation by an external
radiative forcing. Our measured value of dOLT/dT can be compared with the model values
from [15].”
“Paper: “the greenhouse effect plays a role”.
So DREMT’s Well…that’s that. was misinformed as DREMT has admitted.”
No, Ball4, DREMT was not misinformed. As the paper makes clear:
“The dominating influence of a declining TOA outgoing SW is not in line with the assumption that the global warming in the last 20 years is primarily caused by holding back the LW due to the greenhouse effect. As discussed below, the greenhouse effect plays a role, however, for the period 2001–2020 at TOA it was certainly not dominating.”
In other words, according to the authors the GHE plays only a minor role…and even then, from their discussion of the GHE, they conclude:
“Hence, the rise of the greenhouse gas concentration from 2001 to 2020 had a measurable effect on the LW flux in the “Clear Sky”, covering about 1/3rd of the Earth surface. In the cloudy part, about 2/3rd, this effect was much smaller, if significant at all.”
Barely an effect for 2/3 of the Earth’s surface.
So they are concluding that the GHE plays only a minor role, for about 1/3 of the Earth’s surface!
Once again any enhanced GHE warming was only hypothetical, since although they claim to have observed some “measurable effect on the LW flux in the “Clear Sky”, covering about 1/3 of the Earth surface”, they cannot demonstrate that this change in the LW flux led to any warming. Think of the Seim and Olsen experiment. Change in LW flux measured, but no warming as a result!
“a decadal increase in the rate of energy uptake by Earth from mid-2005 through mid-2019, which we attribute to decreased reflection of energy back into space by clouds and sea ice and increases in well-mixed greenhouse gases and water vapor.”
Yep,
So one of the predicted feedback mechanisms of AGW, reduced sea-ice and increase in albedo is observed in the 2000s, and the deniers think this is somehow evidence against AGW.
…and Ball4, just in case you get “confused” and start quoting Loeb et al, the paper being discussed is this one:
https://www.mdpi.com/2073-4433/12/10/1297/htm
Dubal and Vahrenholt.
Before someone butted into the discussion, Richard M, Ball4, etc and I were discussing the Loeb paper. All of Richards comments refer to this paper.
My stalker, typically, has no idea what was even being discussed…that is just one of the many reasons I eventually had to put him on ignore. His obsessive “last-worder” trolling is another one, as he will surely continue to demonstrate…
DREMT admitted being misinformed but has corrected understanding on own by quoting verbatim from a published paper. Good job DREMT, stick with that practice of verbatim quoting and you will better understand the measured GHE and the measured EEI.
Note: in some written comment stuff DREMT just makes up stuff that isn’t in the published paper proving again DREMT is misinformed.
“DREMT admitted being misinformed”
No such event occurred.
“Note: in some written comment stuff DREMT just makes up stuff that isn’t in the published paper proving again DREMT is misinformed.”
Example?
Examples:
“in other words…”
“GHE warming was only hypothetical”
And that’s not anywhere near all examples. DREMT routinely makes up words not found in the paper(s) under discussion thus admitting DREMT has been misinformed that DREMT’s (or other commenter) written made up words were actually in the papers.
To write a good, well-informed comment when discussing paper(s), quote the paper’s words verbatim DREMT, don’t make up ANY words on your own.
Explain how you would interpret the paper any differently than how I did. What do you actually disagree with? Or are you just deliberately keeping your criticism as vague as possible?
I noticed that when DREMT butted into the conversation, he introduced yet another paper to back up his claims,
“Yes, total OLR has been increasing since at least 1985:
https://mdpi-res.com/d_attachment/remotesensing/remotesensing-10-01539/article_deploy/remotesensing-10-01539.pdf”
and that was fine.
while when Ball4 had, prior to that, introduced the Loeb paper which is the origin of all the data and analysis being discussed, THAT was somehow violating the law.
“Yes, thats the paper being discussed. Always was. For some reason certain commenters keep trying to introduce Loeb et al.”
As ever, DREMT’s hypocrisy is on full display.
No interpretation is ever necessary DREMT when you use the author’s verbatim words. I disagree when DREMT just makes up words the authors do not write – that’s when DREMT admits to being misinformed.
Quote any and all paper(s) verbatim DREMT. I reasonably agree with the paper’s authors words not necessarily DREMT’s made up, unquoted words.
Ah, so you are just deliberately keeping your criticism as vague as possible.
Nothing deliberately vague since I use the paper(s) words (and DREMT uses when quoting verbatim) which are not vague DREMT; they are precise enough if you bother to pay attention.
Ball4, you seem to have no valid criticisms of my interpretation of the paper. In fact your only criticism seems to be that I used my own words to express my own interpretation! Typically bizarre Ball4 behavior. I expect you will keep responding for several hours though, as you tend to be quite a relentless troll.
“The dominating influence of a declining TOA outgoing SW is not in line with the assumption that the global warming in the last 20 years is primarily caused by holding back the LW due to the greenhouse effect. As discussed below, the greenhouse effect plays a role, however, for the period 20012020 at TOA it was certainly not dominating.”
thanks DREMT, quite interesting, will have to delve into that one further
The paper(s) authors have valid criticisms of DREMT’s interpretation of the paper (as I’ve verbatim quoted the authors) along with even Richard M. Go argue with those folks DREMT (2:44 pm) & try to learn more about earthen radiative physics in the process since:
driving the climate in the period(s) observed are “a decadal increase in the rate of energy uptake by Earth from mid-2005 through mid-2019, which we attribute to decreased reflection of energy back into space by clouds and sea ice and increases in well-mixed greenhouse gases and water vapor.”
You’re welcome, td.
OK so the paper clearly indicates that this statement
“the latest NASA CERES data which did not detect any increase in greenhouse warming over the last two decades. Man made global warming appears to be nothing but pseudo-science.”
is FALSE.
“Markus, you appear to be unaware of the latest NASA CERES data which did not detect any increase in greenhouse warming over the last two decades.”
True, Richard M. No warming can be attributed to an enhanced GHE without making some assumptions. They claim to have observed some “measurable effect on the LW flux in the “Clear Sky”, covering about 1/3 of the Earth surface”, but they cannot demonstrate that this change in the LW flux led to any warming. Think of the Seim and Olsen experiment. Change in LW flux measured, but no warming as a result!
AGAIN, DREMT is following me around and responding to my posts wherever they are. Looks like he is becoming my stalker!
*Automatic Response*
I have put Nate on ignore (for the last two years now).
“I have put Nate on ignore” but apparently that is simply not true, since quite obviously DREMT is still following me around and responding to my posts.
*Automatic Response*
I have put Nate on ignore (for the last two years now, but it hasn’t stopped him from following me around and responding to my posts over all that time).
“No warming can be attributed to an enhanced GHE without making some assumptions. They claim to have observed some measurable effect on the LW flux in the ‘Clear Sky’, covering about 1/3 of the Earth surface”, but they cannot demonstrate that this change in the LW flux led to any warming. ”
Oh really? But they can demonstrate the increased abs*orbed solar led to warming?
Nope.
There simply was warming during the same period that abs*orbed solar and the LW flux both changed.
And somehow the fact of ‘clear sky’ LW flux somehow means it doesnt count!
This is the famous cherry pick what you like/dismiss what you don’t two-step.
*Automatic Response*
I have put Nate on ignore (for the last two years now, but it hasn’t stopped him from following me around and responding to my posts over all that time, posting his usual mix of false accusations, misrepresentations, and insults).
As DREMT tries vainly to keep up the pretense that he is not responding to me, by following me around and responding to me!
Hilarious!
#2
*Automatic Response*
I have put Nate on ignore (for the last two years now, but it hasnt stopped him from following me around and responding to my posts over all that time, posting his usual mix of false accusations, misrepresentations, and insults).
“I have put Nate on ignore” as DREMT again fails to ignore me and does respond to me, because he simply MUST get the last word!
*Automatic Response*
I have put Nate on ignore (for the last two years now, but it hasnt stopped him from following me around and responding to my posts over all that time, posting his usual mix of false accusations, misrepresentations, and insults, desperate to get the last word wherever he can).
And there we have it.
It is quite astonishing that DREMT accuses other people of trying to get the ‘last word’ when in fact HE is the poster who literally works overtime, to get in the last word, more often than all others, mostly to say nothing!
What is the best word for that tendency to accuse others of what you yourself do more than anyone?
Hypocrisy? Being an asshole? Readers, you decide.
So go ahead, DREMT, use your not at-all-automatic response to satisfy your weird need to have the last word.
*Automatic Response*
I have put Nate on ignore (for the last two years now, but it hasnt stopped him from following me around and responding to my posts over all that time, posting his usual mix of false accusations, misrepresentations, and insults, desperate to get the last word in wherever he can, always the biggest hypocrite on this blog).
Here is a quote from
https://climatesense-norpag.blogspot.com/2021/08/c02-solar-activity-and-temperature.html
“As shown in references 1-10 above, the anthropogenic CO2 Radiative Forcing concept on which the climate models’ dangerous warming forecasts are based is inappropriate for analyzing atmospheric temperature changes. Solar sourced energy flows in and out of the Inter Tropical Convergence Zone provide the net negative feedback which has kept the earth within a narrow temperature range for the last 600 million years. The effects on temperature and climate of major meteorite strikes, periods of flood basalt outpourings and major volcanic eruptions are superposed on this solar sourced background. The sample lengths in the IPCC reported model studies are too short. The models retrofit from the present back for only 100 – 150 years when the currently most important climate controlling, largest amplitude, “solar activity” cycle is millennial. The relevant system for comparison should include the entire Holocene.
Most importantly the models make the fundamental error of ignoring the very probable long- term decline in solar activity and temperature following the Millennial Solar Activity Turning Point and activity peak which was reached in 1990/91 as shown in Figure 5. The correlative UAH 6.0 satellite TLT anomaly at the MTTP at 2003/12 was + 0.26C. The temperature anomaly at 2021/11 was + 0.08 C. (34) This satellite data set shows that there has been no net global warming for the last 18 years. As shown above, these Renewable Energy Targets in turn are based on model forecast outcomes which now appear highly improbable. Science, Vol 373,issue 6554 July2021 in”Climate panel confronts implausibly hot models” (35) says “Many of the world’s leading models are now projecting warming rates that most scientists, including the modelmakers themselves, believe are implausibly fast. In advance of the U.N. report, scientists have scrambled to understand what went wrong and how to turn the models…… into useful guidance for policymakers. “It’s become clear over the last year or so that we can’t avoid this,” says Gavin Schmidt, director of NASA’s Goddard Institute for Space Studies.”
The global temperature cooling trends from 2003/4 – 2704 are likely to be broadly similar to those seen from 996 – 1700+/- in Figure 2. From time to time the jet stream will swing more sharply North – South. Local weather in the Northern Hemisphere in particular will be generally more variable with, in summers occasional more northerly extreme heat waves droughts and floods and in winter more southerly unusually cold snaps and late spring frosts.”
We are having a 1980s type winter in the UK, they can huff and puff all they like, but the planet is cooling. The sun is the driver.
Winter’s only 2 days old – it’s a bit early to be comparing it to the 1980s. In the mean time we’ve just had one of the warmest autumns in the MET Office record.
I am guessing you believe Covid19 has been isolated as well. Oh dear and voted to remain the EU.
” I am guessing you believe Covid19 has been isolated as well. ”
Aha. One more denialist, who should visit the Robert-Koch-Institute in Germany, and from there continue to these many many hospitals in the country who try to keep these stoopid nonvaccinated denialist people alive.
Abstract 10712: Mrna COVID Vaccines Dramatically Increase Endothelial Inflammatory Markers and ACS Risk as Measured by the PULS Cardiac Test: a Warning
Steven R Gundry
https://www.ahajournals.org/doi/10.1161/circ.144.suppl_1.10712
Ken
” COVID Vaccines Dramatically Increase Endothelial Inflammatory Markers… ”
Nice to inform us.
The use of Moderna by young men under 30 in Germany is no longer advised due to heart muscle inflammation.
*
But … why do you mention vaccination problems, but not the other way around: the problems that result from no vaccination?
How many people, do you think, are suffering of long term post-COVID diseases, and how many die?
My age cohort is 99.43% recovery once infected with COVID.
The risk is clearly higher with older people.
99.43% versus unproven 14% increase in heart attack risk.
UK has 10000 excess deaths not due to COVID; mostly heart and stroke.
Censorship is rampant making it difficult to know whether I am getting good information or not.
Lots of rumors that people who are vaccinated are getting just as sick as unvaccinated.
One such rumor is that Vaccines are destroying natural immunity and not just to COVID.
To Vaccinate or not is a tough call.
https://www.zerohedge.com/covid-19/over-42000-adverse-reaction-reports-revealed-first-batch-pfizer-vax-docs
Yeah, and abandoning human rights is the “final solution” , Endlsung?
“99.43% versus unproven 14% increase in heart attack risk.”
Uhh, this is Im sure a case study in how to lie with statistics.
How bout the number of heart attacks vs the number of Covid deaths?
“Lots of rumors that people who are vaccinated are getting just as sick as unvaccinated.
One such rumor is that Vaccines are destroying natural immunity and not just to COVID.
To Vaccinate or not is a tough call.”
Really, gonna make your health decisions based on rumors?
Particularly with the internet, misinformation, ie rumors are rampant.
Yes Tim, I do and did. Thanks for crediting me with some intelligence.
” The sun is the driver. ”
Aha.
And… how do you explain why Had-CRUT and the AMO give such poor correlation with the Sun Spot Number?
https://i.postimg.cc/j5Zkmxfm/SSN-AMO-undetr-Had-CRUT4-6-1880-2019.png
The graph is a bit outdated, but a revision couldn’t change anything.
The Sun is Earth’s one and only energy source, but that does not mean it drives the climate.
It would do so if there were neither oceans nor an atmosphere.
“The Sun is Earth’s one and only energy source, but that does not mean it drives the climate”
Well it does supply the energy for sure.
Watch Carl Otto Weiss. He describes how climate is the result of cycles that, similar to any other waves, add up when on positive phase and add down when on negative phase. Its not just solar; its AMO, PDO, and a host of other cycles. https://www.youtube.com/watch?v=tAELGs1kKsQ
tim wells…”We are having a 1980s type winter in the UK, they can huff and puff all they like, but the planet is cooling. The sun is the driver.”
***
Of course the Sun is the driver, ask anyone on an Arctic (or Antarctic) winter’s day when there is no Sun. It will likely be about -50C.
I have experience -50C on the Canadian Prairies, and except for the fact the oil in my car had frozen (no block heater) and it would not start, it was bearable as long as the Sun was shining. The minute the Sun went down, you had better get indoors real quick.
BTW…solved the no start problem by taking the battery indoors at night and not letting the car sit around too long during the day without warming it up.
Tim Wells,
“We are having a 1980s type winter in the UK, they can huff and puff all they like, but the planet is cooling. The sun is the driver.”
One month into Winter, and mean December temperature for the UK is 5.3C, 1.05C warmer than the 1980s average. Only one December in the 80s was warmer than 2021.
USCRN for Nov 2021
https://climatedatablog.files.wordpress.com/2021/12/uscrn-daily-values.jpg
https://climatedatablog.files.wordpress.com/2021/12/uscrn-contiguous-daily-values-3.jpg
“On NCEP surface data I expect November UAH TLT to come in a bit below September but above August, say 0.22 +/-0.05C.”
https://www.drroyspencer.com/2021/11/uah-global-temperature-update-for-october-20210-37-deg-c/#comment-1037929
“UAH Global Temperature Update for November, 2021: +0.08 deg. C.”
That didn’t age well.
rlh…”That didnt age well”.
***
Close enough.
0.22 +/-0.05C is close to +0.08 deg. C?
Not even to the 0.1C if rounded.
La Nina.
https://coralreefwatch.noaa.gov/data/5km/v3.1/current/animation/gif/ssta_animation_30day_45ns.gif
Proof that the warm water headed toward the Pacific coast near Vancouver, Canada is causing the rain and warm weather up here.
Polar vortex blockage in the lower stratosphere.
https://i.ibb.co/qWX5qmx/gfs-t100-nh-f00.png
https://earth.nullschool.net/#2021/12/06/0200Z/wind/isobaric/70hPa/orthographic=-2.33,98.44,340
Arctic air attack in Europe.
http://tropic.ssec.wisc.edu/real-time/mtpw2/product.php?color_type=tpw_nrl_colors&prod=europe×pan=24hrs&anim=html5
Very high levels of galactic radiation indicative of a very weak solar wind.
https://cosmicrays.oulu.fi/webform/monitor.gif
Wooooaah!
https://tinyurl.com/477yxf7e
(‘coldest’ night around Germoney’s Berlin for the next 2 weeks)
You might be surprised.
https://i.ibb.co/CbvChpP/hgt300.webp
Give it up, ren.
All the time you post such pictures you yourself can’t correctly interpret, but nothing of what you think they mean does happen here around us.
Maybe in Poland, Belarus, Russia, North of Norway, Sweden, Finland, Northern America?
binny…”Give it up, ren.
All the time you post such pictures you yourself cant correctly interpret…”
***
ren is light years ahead of you and the rest of us with his understanding of meteorology.
Coldest November since 2013, equal 10th warmest overall.
Equal 3rd biggest month to month drop in anomaly, biggest October to November drop.
For true believers of the Monckton Pause, it has returned to starting in January 2015, making it 6 years 11 months old.
Wonder if there will be as much skepticism of UAH this month.
bellman…”For true believers of the Monckton Pause, it has returned to starting in January 2015, making it 6 years 11 months old”.
***
I don’t see why it has to begin anew. The initial flat trend was from 1998 – 2015, and that included the 1998 extreme. Why can’t we just add on to the 18 years flat trend and call it a 21 year flat trend?
Because it’s not a flat trend. Trend since the start of the old pause is 1.1C / decade. Not much different to the overall trend.
What will Australia’s summer be like?
https://i.ibb.co/XY1mz5D/gfs-T2ma-aus-27.png
As usual Ren. Beautiful one day, perfect the next.
Heavy snowfall in the UK tonight. The children will get their snow before Christmas.
Arctic air…dropping to -4C in northern Scotland. Down on the south coast, in the Plymouth/Cornwall areas it is 11C and 13C respectively.
Snow Pillow Data for Wolf River BC is showing way above normal snow for November 2021. https://aqrt.nrs.gov.bc.ca/Report/Show/Snow.3B17P.Automated%20Snow%20Weather%20Station%20Graph/
This just in: Winter heat wave sets December records in four U.S. states, Canada
swannie…”This just in: Winter heat wave sets December records in four U.S. states, Canada…”
***
You have already made a fool of yourself claiming heat can be transferred from cold to hot by its own means. Why add to it by calling temperatures in the range of 10C warming? Although the Vancouver temperature for December is listed as 7C, it varies from freezing (occasionally…when Arctic air descends) to 12C.
Every year in winter (late Autumn to late Winter) we have balmy days in the Pacific Northwest. We live on the Pacific Ocean and it moderates our temperatures. The reason it has been warmer than average is the rain storm produced by La Nina. It has forced warmer air from the warmer Pacific regions into our area. We call it the Pineapple Express because the rain produced always brings warmer temperatures.
Same last summer. NOAA has blamed our mini heat wave on a forming La Nina.
BTW…in the same region, it is currently 4C at 7:30 in the evening. Is that global cooling?
Yes, Ken…
… but in Northern Germany, our snow is way below normal since 10 years.
Suddenly , that zero line doesn’t look so far does it ?
https://www.drroyspencer.com/2021/11/uah-global-temperature-update-for-october-20210-37-deg-c/#comment-1037607
Remember that the zero line you were convinced would be cross was based on the 1981-2010 baseline which is about 0.13 lower than the 1991-2020 baseline.
bdg…alarmist propaganda. When it cools, you alarmists always have an excuse.
Ha ha ha…
For ignoramus Robertson, even UAH’s data is ‘alarmist propaganda’.
How dumb is one allowed to be here?
SC25 update, first comparison with only SC24 for clarity, second comparison with last 5 cycles for context
https://i.postimg.cc/BbM3k89f/comparison255.jpg
https://i.postimg.cc/FR6gZpzM/comparison251.jpg
rlh…”Blinny has published one recently”
https://drive.google.com/file/d/1GYWNHBLQFRetPEJ-83c1Oeh-n8PbERt0/view
***
You do mean Binny, as in Bindidon? I thought you had more sense that to post trash from him. He references the graph as ‘reconstructed’ data since 2015 then along the x-axis he marks it from Jan to Dec.
In the title he lists the following…
-mean 1981 – 2010 yellow
-mean 1991 – 2020 blue
-1998 gold
-2015 – 2020 various colours
-2020 grey
-2021 black
Binny has sunk to a new low. What kind of a trash graph had the x coordinates listed in months and the graphics listed across varies years, ranging back to 1981?
He has 1998 listed in gold as the only curve that can fit on a graph with the x-axis marked from Jan – Dec, yet 1998, being the 2nd warmest year in that era, is drawn as being cooler than the others.
I have claimed in the past that Binny fudges data but this is the Mother of all Fudges.
swannie…”Ken, Europes population loss in the 14th century was the result of the arrival of the PLAGUE, not the Little Ice Age. The same thing happened in Iceland, though later in the century.”
***
And you don’t think the plague might have been related to freezing temperatures?
Same thing with the Spanish flu, being compared to covid. It happened just as soldiers were returning from living in horrid conditions in trenches, whereby the soldiers developed all sorts of contagious illnesses.
Because modern epidemiologists can’t get over their need for another Spanish flu to prove their pitiful worth, they have invented a new plague/Spanish flu in the form of covid. And our politicians have been stupid enough to allow them to take over our democracies to practice their pseudo-scientific theories.
Covid ended about two years ago yet we will still be in lockdown conditions 20 years from now unless we vote out the cretins running our countries and replace them with people who understand science.
Gordo pontificates again without actually checking the facts. It’s well documented that a major outbreak of the Spanish Flu in 1918 in a US army training camp located in Kansas with a large number of new recruits. as usual with such matters, the actual progression of the disease around the Earth is not well documented, but it would appear that the US may have been the source. Here are some theories:
https://www.knowledgesnacks.com/articles/spanish-flu-origin/
Viruses mutate. It’s called evolution, sort of like what may have resulted in ourselves.
E. Swanson
Maybe this paper interests you:
Genesis and pathogenesis of the 1918 pandemic H1N1 influenza A virus
Michael Worobey, Guan-Zhu Han, and Andrew Rambaut (2014)
https://www.pnas.org/content/111/22/8107
Here’s another interesting part of the scientific investigation:Scientists Describe How 1918 Influenza Virus Sample Was Exhumed In Alaska
Swanson and Bindidion, do you braindead cult idiots know as much about medical issues as you do about physics?
That would be zilch.
“And you don’t think the plague might have been related to freezing temperatures?”
Err, no. A nasty disease that we now know is spread by fleas and lice. Arrived in Europe from the East following the trade routes in 1347, starting in the Mediterranean area. Spread north and west over the next 2 to 4 years.
Freezing temperatures seem to have pretty well nothing to do with it – started out in quite warm places and spread into colder ones over time. More to do with poor personal hygiene and person-to-person contact.
Gordon Robertson
YOU: “Covid ended about two years ago yet we will still be in lockdown conditions 20 years from now unless we vote out the cretins running our countries and replace them with people who understand science.”
I agree you are a cretin who does not understand science. Science is evidence based not opinion based and not based upon unproven conspiracy theories.
I can Thank God you have no position of Authority or Power. You can post foolish and ignorant opinions on blogs. Good that is the limit of your abilities.
Look at the real evidence. This is what people that run countries are viewing. Not some mindless cretin’s opinion like yours that is based upon nothing but what it can make up.
Evidence: Not what you are interested in at all.
https://www.healthsystemtracker.org/brief/covid19-and-other-leading-causes-of-death-in-the-us/
Norman, are your “people that run countries” lying to you again?
Have you had your 17th “booster” yet?
Remember, you fall for anything — as in the “real 255K surface”.
Clint R
This time you are a complete ignorant idiot. Your opinions are offensive and stupid please shut up once. You are a real asshole. My older sister just went into the Hospital with Covid. Your sick and twisted opinions show you to be a cold arrogant idiot. You play your stupid games here. I have had enough of your childish behavior grow up will you.
Norman, with your track history I doubt you even have a sister.
But, if you do, why didn’t your “people that run countries” protect her?
You love governments but you hate reality. That’s NOT going to work for you in the long run.
Have you had your 17th “booster” yet?
Remember, you fall for anything — as in the “real 255K surface”.
No warming for at least 19 years now.
Chic Bowdrie
” No warming for at least 19 years now. ”
Oh, really?
May I suppose you still belong to the people who draw a line across Roy Spencer’s graph upthread, and see it’s flat?
Welcome to the Third Viscount’s fantasy world!
I just had a look in my UAH data on the HD, and let it compute the trend for 2002-now:
0.16 +- 0.02 C / decade
If needed, no problem to restrict the graph above to that period, to draw a linear trend line and to post a link to the generated graph, so you can really see it.
Bindidon,
I don’t care what your trend says. The trend doesn’t make it any warmer than it was 20 years ago. You cannot guarantee continued warming. It’s only your blind faith in the global-warming religion that makes you doubt no warming for 20 years or so.
Temperatures go up and they go down as they have for 20 years and 20 centuries.
And just so you don’t misunderstand, I don’t claim any cooling or warming in the future. I am agnostic about the future of global temperatures. Based on science, not trends, it seems unlikely that CO2 has much effect anymore, therefore no need to keep crying wolf.
Chic Bowdrie
” The trend doesn’t make it any warmer than it was 20 years ago. ”
Sheer nonsense. A hind-cast is a hind-cast. { d followed by c}
When you say: ” No warming for at least 19 years now “, that means that you simply ignore even what Roy Spencer perfectly calculates. Feel free to do.
*
” You cannot guarantee continued warming. ”
I never claimed that on any blog wherever. Where is that in my text?
*
” Its only your blind faith in the global-warming religion that makes you doubt no warming for 20 years or so. ”
I have no blind faith in anything, it is only in your imagination.
You know nothing about me, at best the lies about me made here by ignoramus-in-chief Robertson and his lieutenant Clint R.
I have nothing to do with your ‘global-warming religion’, let alone with the inverse ‘Global Cooling’ religion permanently propagated on lots of blogs.
*
” Based on science, not trends, it seems unlikely that CO2 has much effect anymore, therefore no need to keep crying wolf. ”
I was quite sure you would come along with your ridiculous hint on CO2.
Did I mention that bloody CO2 anywhere?
*
You are a typical example of people who permanently feel the need to react with their Pavlovian CO2 reflex to indications of undeniable warming – regardless of whether it is of natural or human origin.
I apologize for my reply to your comment, and will manage to avoid that in the future.
I apologize for assuming you subscribe to the man-made global warming meme. I thought you did.
As for the sheer nonsense, I think it is nonsense to think that a trend makes observations any warmer or cooler than they are. What do you see in the trend that makes 2021 any warmer than 2002?
Today, on the 5th day of Summer it is actually colder than a few of the days we had last Winter.
So if a I drew a line from on of those warmer days in Winter to this day in Summer we would see that Summer is actually colder than Winter???
No, that would be making Chic’s mistake of confusing weather and climate.
Each annual average temperature of Earth’s surface is variable like the temperature of the days in the year where you live. So even if the globe is warming, you will get some years that are relatively cool, and will be similar to the annual temperature many years ago. Just like this day early in Summer is colder than that day last Winter. But if you think that this cold day means that Summer isn’t happening, then you…. are Chic Bowdrie.
I’m not talking about one day, Barry. Don’t be daft. I’m looking at the average of a year 19 years ago which is roughly the same temperature as this year within a reasonable error.
No need to get out your calculator or wax philosophically about weather vs. climate. It’s simply not any warmer now than it was 19 years ago. Period.
Better luck next year.
On the journey from Winter to Summer the daily temperature goes up and down, down and up.
On the journey from a cooler globe to a warmer one the annual average temperature will go up and down, down and up.
That’s why this Summer day can be cooler than some days last Winter, even though Summer is warmer than Winter.
That’s why this year can be as cool as a year 20 years ago, even if the world is warming.
Your observation doesn’t carry any meaning with respect to global climate change.
Just as my observation that today is a colder Summer day than a couple of days last Winter says nothing about whether Summer is hotter than Winter.
But if you take all the data from last Winter to this first week in Summer, you will see that overall it has warmed.
If you take all the data from 19 years ago till now, you see that overall it has warmed.
You mistake weather for climate. Global climate is measured in decades. You’re using only 2 years, and the variability from year to year (0.5C at most) is larger than the overall trend for the period you nominated (0.3C).
So it can easily be warming at the linear rate and we can still see 2 years at similar temperature 20 years apart. We could even see 2 years of similar temps 30 years apart if the linear warming rate of the last 19 years continues for another 11. That’s because the variability from one year to another is large enough for that to happen. It doesn’t cancel the warming trend – it’s just weather variability doing it’s thing.
I should have known better than to take Chic’s word for it.
2002 = 0.08 C
2021 = 0.12 C to date
You have to go to 2010 to find a year as warm (or warmer) than 2021 to date.
But never fear! There is always 1998, the year of the strongest el Nino of the 20th century. That was warmer than 2021 to date, and no doubt will still be so after the December data rolls in.
UAH data, of course.
“Your observation doesnt carry any meaning with respect to global climate change.”
It wasn’t meant to originally, Barry, but it gets more meaningful the more convoluted your arguments against my factual observation get.
“If you take all the data from 19 years ago till now, you see that overall it has warmed.”
That’s like saying my bank balance should be greater than it was 20 years ago, despite withdrawing the whole balance today. Feel free to keep on convoluting.
No, it’s nothing like a bank account. In a bank account you can see all the money there. In the global energy budget, you only see a fraction of the heat in the lower troposphere, which is where you are trying to do your accounting.
A more robust bank account for planet Earth is the global oceans, which have the lions share of the Earth’s heat energy.
As long as you only use two data points, you’ll keep getting this wrong. You don’t strike me as completely stupid, so I think you’re just trolling. If you actually mean what you say, then you are one dumb sob.
Maybe, like bobdroege, you’d like to conjure up some ocean heat from the past or future to correct the data. Make it a little colder in the past, a little warmer now so that observations match the trend? Where have we seen that before?
I’m not getting the data from two time periods wrong. It is what it is. You are simply convoluting the meaning of that data. Imagining what might have been or will be is not science.
Ok, so you really are that dumb. You assume that the total energy in the climate system is contained in the lower troposphere.
Here is the global ocean heat content data for people who are not dumb.
https://www.ncei.noaa.gov/access/global-ocean-heat-content/
You can’t measure ocean heat as accurately as the lower troposphere, barry. Keep on convoluting, imagining, thinking wishfully, and calling me dumb. I’m not moved.
Data is what it is, not what you think it will be.
I started with 1000 shares. Over time the returns afforded me the opportunity to buy more shares. The market goes up and down, but the number of shares increases. I’ve automated returns into buying more shares.
The lower troposphere is the value of my shares, going up and down with the market.
The global energy budget is my entire portfolio, which has grown in size.
The market gets three very bad quarters in a row and the value of my shares is now what it was some years ago.
But I have more shares now, so when the market rebounds the value of my shares will be higher than before.
I would be mistaken to think that I am suddenly in exactly the same position I was some years ago, just because of the dollar value of my shares. I am actually better off, even though the day-today and year-to-year vagaries of the stock market make it seem otherwise on this day. I have more shares than I did.
The lower troposphere temperatures are affected by the vagaries of day-to-day and year-to-year weather. But there is an underlying warming. The global energy budget has more shares than before. We had a really cold month that is nearly as cold as a month 19 years ago, but that doesn’t tell you anything about the heat in the whole climate system. And all the evidence in the system corroborates the underlying warming (sea level rise, ocean heat content rise, melting global land and sea ice, surface warming, changing seasonal patterns and flora/fauna migration patterns etc etc).
I’m sorry, Chic. If you can’t understand the flaw in your understanding here, then the conclusion draws itself.
My advice to you, Chic, is to stay away from casinos. You might get on a winning streak and think that therefore the house odds are always in your favour. That’s the fallacy you’re running with here – that a random event for one component indicates the state of the whole system.
barry,
It’s ironic that you are invoking the betting meme. You are the one who conjures up the ocean heat and argues for warmer temperatures ahead. I don’t doubt that possibility, but at the moment the lower troposphere is no warmer than it was about 20 years ago. No theory or trend or gift from Santa will change that.
“The lady doth protest too much, methinks.”
Chic, it’s no good if you can’t accurately describe what your co-interlocutor said.
“You are the one who conjures up the ocean heat and argues for warmer temperatures ahead.”
I haven’t in our conversation argued for warmer temperatures ahead. That is something you just fabricated about the conversation.
And yes, the trend is significant, not something you can disregard just because it is inconvenient.
If next month goes up by 0.5 C, then according to your model of how global temperatures evolve, the Earth will have increased its temperature in one month, and also increased by the same amount over 19 years.
This is stupid. Not only is it mathematically impossible, it denies that there is heat inertia in the climate system. And that is the whole problem with your view. You think climate is an instantly changing phenomenon.
It’s clear now you can’t grasp the topic.
“If next month goes up by 0.5 C, then according to your model of how global temperatures evolve, the Earth will have increased its temperature in one month, and also increased by the same amount over 19 years.”
No, not the whole Earth. Only the lower troposphere will have increased 0.5 C in one month and the average yearly temperature by roughly a twelfth of that. That is not only mathematically possible, it is what actually happens. No conjuring necessary.
There is no problem with my view, only your opinion of it. You argue that heat inertia means warmer temperatures ahead. That is speculation, no matter how likely. Now let’s see you spin that otherwise.
Chic: “You cant measure ocean heat as accurately as the lower troposphere, barry. ”
“You are the one who conjures up the ocean heat and argues for warmer temperatures ahead.
Barry: “I havent in our conversation argued for warmer temperatures ahead. That is something you just fabricated about the conversation.”
Chic: “You argue that heat inertia means warmer temperatures ahead.”
Ahhh, brings up ‘fond’ memories of the many varied ridiculous claims and dishonest debate tactics of Chic.
Nate, the King of Obfuscation, strikes again. This time taking quotes from several comments out of context. You need to crawl back under your rock or somewhere else where the sun doesn’t shine.
Chic,
“No, not the whole Earth. Only the lower troposphere will have increased 0.5 C”
Why then do you talk about “global” warming while referring to data from the lower troposphere?
Monthly LT temperatures are to long-term global climate change what waves are to the tides.
The variability in monthly LT data can be as great as +/- 0.3 C from month to month.
The current linear trend for the complete data set is 0.14 C/decade. So, 0.28C over 20 years (you targeted 2 data points roughly 19 years apart).
The variability is larger than the trend, so no conclusions can be drawn if any two data points have the same value. More testing needed. Maybe some trend analysis?
2002 to present: https://i.imgur.com/6CQbMRD.png
0.157 C/decade (+/- 0.148)
The linear trend is higher than for the whole data set, but the uncertainty is greater, yielding a statistical possibility of a very slight warming over the 19-year period of 0.01 C. But the same uncertainty also allows for a 0.3 C warming over 20 years.
On the matter of whether or not the globe is warming, comparing two months LT data out of the whole record to claim something about global climate change is nonsense. You can’t tell which way the tide is going just from two waves.
The argument we’re having doesn’t require an investigation of causes, nor am I interested. It distracts from the point we’re discussing.
barry,
I never claimed to be talking about global temperatures, as in land and ocean and lower troposphere. Should we include the whole atmosphere and underground temps as well?
My original comment referred to what I only eye-balled as no warming in 19 years. Coincidentally, November of 2002 was exactly the same temperature as the past month. You calculated for a whole year and found a 0.04 C difference between 2002 and 2021, but also a warmer year in 2010. OK fair enough. You proved my eye sight wrong on a yearly average basis.
Now here’s where you are short-sighted. The month-to-month variability has nothing to do with whether or not one month is statistically different than another month. That would be dependent on how accurate UAH measurements are. So Nov 2021 was the same as Nov 2002 within that error. One might even argue that a similar statistical difference between the average of the two years means my eye-balling wasn’t so bad either.
Trends in whether data are essentially predictions when applied to the future. They do not tell you what the data was or will be at any time. They cannot tell you what the difference between any two data points is.
The wave/tide analogy is not an acceptable spin. Neither is your statistical analysis. Try again. Or don’t, and stop me having to waste my time pointing out flaws in your trivializations.
“I never claimed to be talking about global temperatures”
But you’ve been talking about global temps throughout this thread.
“No warming for at least 19 years now…
Its only your blind faith in the global-warming religion that makes you doubt no warming for 20 years or so…
I am agnostic about the future of global temperatures. Based on science, not trends, it seems unlikely that CO2 has much effect anymore…”
You wrote above:
“Trends in whether data are essentially predictions when applied to the future.”
No one in this discussion is using trends to predict anything. That’s YOUR preoccupation.
But the linear trend analysis of the data we have shows a clear warming over the period 2002 to present. This is a much more robust way of testing for a change in the system than comparing two data points when the data is highly variable.
I’m fairly sure you know this and can’t fathom why you’re still arguing about it.
The wave/tide and cold Summer day/warm Winter day are very apt analogies. The point is that if you ignore all the data you can get a misleading impression (that high tide is lower than low tide, that Winter is as warm as or warmer than Summer) if you only use a couple of data points.
That these operate on different time scales is immaterial – the variability in the data itself is common between all three metrics, and is the reason you can get a warmer day in Winter than in Summer, a low-tide wave peak that is higher than a high-tide trough, and a month in lower tropospheric temp data that is the same value as one 19 years previous, even if the lower troposphere has been warming.
The error of using just two data points is not only well-discussed in climateball, it should be obvious to anyone with half a brain and a modicum of concentration.
We just had a week of Summer days here where several were colder than Winter warm days this year. If I believed your model I would have to conclude that Summer is no longer warmer than Winter all of a sudden, and that the seasonal heat build-up that has accumulated in the upper ocean nearby suddenly vanished.
But I know it is the vagaries of weather that give us these anomalous results. A linear trend of temperatures from Winter to Summer would give us a more accurate picture of what’s really happening regarding climate.
barry,
OK, you wanna believe I think UAH measurements of the lower troposphere are something other than what they are.
OK, you wanna use trends to argue the lower troposphere is warming even though it is almost back to what it was 19 years ago, but you’re not predicting any future warming.
OK, you wanna believe that actual measurement data from two months, both constrained within instrumental error of their true average values, are meaningless because measurements taken during other months are variable.
OK, you wanna believe that a high tide somewhere and a low tide somewhere says something about sea level that is analogous to actual global measurements of the lower troposphere taken in Novembers 19 years apart. Or that a winter being the same temperature as a summer shows that the actual equivalence of those two similar months must be a mistake.
OK, you wanna believe that a discussion on climate ball and among half brains constitutes a consilience of evidence that equating two actual measurements that are exactly the same is erroneous.
I believe nothing I write will persuade you otherwise. As for the weather, I think I already agreed that the year of 2021 was a whopping 0.04 C warmer than 2002 and therefore the lower troposphere is not the same temperature as it was 19 years ago. Hopefully that will satisfy you, but I’ll give you the last word in any case.
“OK, you wanna believe that… equating two actual measurements that are exactly the same is erroneous.”
Nope.
Taking two “measurements” (they are inferred values, actually) of a small component of a larger system and claiming something about the whole system based on that is erroneous.
Claiming a trend in variable data based on just two of hundreds of data points is erroneous. And that IS what you are doing. You are saying that the trend is flat – no warming.
“I’m looking at the average of a year 19 years ago which is roughly the same temperature as this year within a reasonable error.
No need to get out your calculator or wax philosophically about weather vs. climate. It’s simply not any warmer now than it was 19 years ago. Period.”
So I looked at the average of a 10 year period ending 20 y ago, and the same average over 10 y ending today. It is useful to smooth out all the year to year ENSO variation.
The 10 y UAH average ending today is 0.29 C warmer than the one ending 20 y ago.
I did the same analysis for GISS surface data. The current 10 y period is 0.43 C warmer than the one from 20 y ago.
http://www.columbia.edu/~mhs119/Temperature/
Pitiful.
The King of Obfuscation points out penetrating insight into the intuitively obvious.
Get lost.
You think the warming in the record revealed by my 10 year average is ‘intuitively obvious’?
I think I agree.
Not sure why you need to have a meltdown over it.
Linear trends are the ultimate in low pass filters.
Chic, the period you mention shows no change in avg. weather temperature i.e. red,blue in top post.
Added ppm CO2 effect of interest is on climate – the black line through 0 in top post which Dr. Spencer recently moved up in accord with the added ppm CO2 during the black line period.
Huh? Are you agreeing with me or just babbling?
“Based on science, not trends, it seems unlikely that CO2 has much effect anymore, therefore no need to keep crying wolf.”
A trend is used in climate science, eg to compare observations and models. Roy does this regularly.
So they are not like two different alternatives.
Still up to your old obfuscation tricks, eh, Nate?
Still posting dubious arguments. And still have no answers when people point out the glaring flaws.
“So they are not like two different alternatives.”
Actually, they are different. The trend in the UAH data is an extremely poor fitting model limited to a relatively narrow time frame, which says nothing about the future, while observations are reality.
Don’t involve Dr. Spencer in your obfuscatory modus operandi.
Here, on one of Robertson’s latest ‘comments’ on this Dec 2021 thread, you can see how tremendously dumb, ignorant and arrogant he is:
https://www.drroyspencer.com/2021/12/uah-global-temperature-update-for-november-2021-0-08-deg-c/#comment-1042286
He looks at the following graph:
https://drive.google.com/file/d/1GYWNHBLQFRetPEJ-83c1Oeh-n8PbERt0/view
whose purpose is to show some superposed years and averages of periods, using UAH’s absolute data reconstructed out of their 2.5 degree grid anomalies, and climatology (the 30-year average of the current reference period).
Now look at his remark concerning the graph:
” Binny has sunk to a new low.
What kind of a trash graph had the x coordinates listed in months and the graphics listed across varies years, ranging back to 1981?
He has 1998 listed in gold as the only curve that can fit on a graph with the x-axis marked from Jan Dec, yet 1998, being the 2nd warmest year in that era, is drawn as being cooler than the others.
I have claimed in the past that Binny fudges data but this is the Mother of all Fudges. ”
*
As you can see, he really did not understand even half a bit of what the graph shows.
And instead of simply asking, he starts ranting, insulting and lying…
No wonder for an ignoramus who dared to insult Andrew Motte, the great man who translated Newton’s Principia from Latin to English, a text Robertson didn’t understand anything of, with the words
” In other words, Motte was a cheating SOB. ”
No wonder for an ignoramus who dares to compare his megatrivial, pseudoscientific ‘thoughts’ about Moon’s spin, with the genial work of Newton, Mayer, Lagrange, Laplace and that of hundreds of scientists who followed them.
*
All what Robertson is able to do is to distort, discredit, denigrate everything what he is not even able to understand.
The graph is quite clear.
I dont know what his mental defect is.
Yeah the graph is easy to follow. That’s a bunch of different years with the absolute temps month by month for each, done by taking the anomaly value and restoring it to an absolute value. 1998 is still the second highest if you average all the months for each year and compare, which apparently Gordon is unable to figure out. This is not difficult stuff.
1000 miles further south.
December will see a further drop in troposphere temperatures due to two reasons:
1. La Nina will bring a global decrease in water vapor in the troposphere;
2. Very high levels of galactic radiation will cause an increase in snowfall in the northern hemisphere.
“These plot present time series (updated daily) of the current amount of water stored by the seasonal snowpack (cubic km) over Northern Hemisphere land areas (excluding Greenland).”
https://www.ccin.ca/home/sites/default/files/snow/snow_tracker/nh_swe.png
The Peruvian Current will remain very cold throughout December.
https://www.tropicaltidbits.com/analysis/ocean/nino12.png
What is the second order trend for the 1979-2021 temperature data?
Ivar Satre (the blog doesn’t accept the full UTF8 charset)
Here is a graph with the linear and the quadratic fits for UAH, with annotated functions:
https://drive.google.com/file/d/1o52rRZPApPmrcgcdoAcpZWofXB_MTYsh/view
The time series must have a quadratic factor anyway because the linear trend increases (it was 0.12 C / decade at the end of 2015).
Of course: to derive any prediction out of the quadratic factor is absolutely hypothetical and therefore 100 % useless. There might be a cooling in 2,5,10 years, lasting 20 years, what makes the prediction obsolete.
But, just for fun: if we compute the result of the function for 100 years, we obtain right now a temperature increase prediction of 1.9 C for 2121.
Bindidon beat me to it, but this is my plot of UAH TLT.
Over the years I added some curve fits to illustrate the how various memes have (not) held up.
The 2nd order fit was something Dr Spencer added “just for fun” to one of these monthly updates a few years back when it showed apparent deceleration. The term wasn’t significant then and it isn’t significant now.
UAHTLT.png
Mark B
” The term wasnt significant then and it isnt significant now. ”
I agree: it doesn’t look very significant.
I just had some fun in computing the result for x = 1200 (months).
And it is as it is: 1.9 C in 100 years…
As your 2nd order poly shows very similar to mine, you should, after all, obtain the same result :- )
Northern sea ice extent on 01/12/2021.
https://i.ibb.co/2dPF69d/N-daily-extent-hires.png
In the coming days, there will be a rapid freezing of Hudson Bay on the west side.
https://www.timeanddate.com/weather/canada/churchill/ext
Why would land and water temperature trends be modeled with different linear rates of heating? Shouldnt they just be separated by a constant? It seems obvious that its impossible for land and water temps to diverge over several decades at different linear rates
When the amount of water vapor in the troposphere decreases (La Nina), temperatures on the continents near the surface increase in summer due to more sunshine; the opposite is true in winter, the lack of water vapor in the air causes a sharp drop in nighttime temperatures at mid-latitudes.
The surface temperature of the open ocean ranges from -2 to 32 degrees C.
Mark Dranias
In my opinion, this might be due to the fact that while land masses and oceans both radiate the incoming solar SW back to atmosphere and space, the oceans have a higher reemissivity rate than the land masses.
That in turn should imho result in the land masses increasing their temperature, while that of the oceans decreases because more radiation means more cooling.
It is also possible that water evaporation over the oceans increases faster than evaporation over land masses, which would then increase the trend difference.
Wind (and hence evaporation) is higher over the Oceans than it is over land.
https://www.windguru.cz/map/?lat=28.304380682962783&lon=4.042968750000001&zoom=3
I think this is an interesting question, but I don’t see why it’s obvious that it’s impossible for the change in temperatures of the air over water and over land to diverge over several decades at different linear rates. Why should the response to forcing converge in less than a several decade time frame? I mean I could certainly imagine that it might but is it really so obvious without studying the question that it should?
Mass and heat capacity of oceans is much greater than that of air, oceans take much more energy and time to warm than atmosphere. That’s why sea surface has a slower multidecadal rate of warming compared to land, and why deeper ocean temps have a (much) lower trend than than both in terms of degrees C/F.
If the atmosphere stopped warming it would take a few decades for the upper ocean to warm enough to equilibrate.
In two days there will be a splitting of the polar vortex in the upper troposphere into two centers consistent with the geomagnetic field to the north. This phenomenon is associated with a very weak solar wind.
This will cause an influx of lows from the north over Europe and heavy snowfall.
https://www.tropicaltidbits.com/analysis/models/icon/2021120306/icon_z500_mslp_nhem_17.png
UAH yearly superpositions of absolute temperatures updated, including October:
https://drive.google.com/file/d/1rhVica1eUmTWIFj0m6cC1jC-GKZdMZwi/view
We can see that while till June, the absolute temperatures kept near the new reference period, they later increased and kept above it.
Nonetheless, 2021 remains also in absolute form cooler than 2020, we see this when comparing the black and the gr[ae]y lines.
Differences Jan-Oct
-0.30
-0.39
-0.35
-0.30
-0.34
-0.30
-0.11
-0.13
-0.15
-0.01
Sea ice extent anomaly updates
1. Boreal
https://drive.google.com/file/d/1QBlh325tHF-4NRlWsHf_6sgskO_ipyse/view
2. Austral
https://drive.google.com/file/d/1PdqOctb7zaMgvdMdX2sId1g_o7U13mM-/view
3. (1) + (2)
https://drive.google.com/file/d/1DnrnCfQjICj21o1gOeFMbMI1xsF0nZoj/view
There’s global warming where I live.
https://www.bbc.co.uk/news/uk-northern-ireland-59489484
The past is not the future.
Ice age missing link.
The CO2 Dome buster & Source of SSW, (Sudden Stratospheric Warming).
I dont believe in Sudden Stratospheric Warming. I prefer to think PSW is a more suitable title, (Predictable Stratospheric Warming). It happens following huge snow fall events. Unfortunately,
it positions itself in the darkness of the Arctic & Antarctic. This will be heat lost to the background
almost absolute zero temperatures of deep space.
Laws of physics, and the mechanical upward transportation of heat AKA (convection).
These factors combine to dismantle the global warming theory during the Grand Solar Minimum.
The science isnt settled yet. Everything hasnt been considered. The theory below is a glaring omission. You can bet this upcoming winter will be more severe than last years record setting winter.
The thermal exchange zone is growing hypothesis!
What is the thermal exchange zone?
It is the area in the northern hemisphere where the upcoming winters snowfall is destined to melt off in the following spring and summer.
Ice doesnt just melt. It leaches out of the atmosphere 144 BTUs of warmth for every pound of ice that melts. As snow creeps further to the south or to the north in The Southern Hemisphere, the thermal exchange zone expands, gets deeper and remains in effect for a longer duration. It also increases the Albedo of the planet. The net effect is the lowering of global temperatures.
Excess moisture in the atmosphere is the chief cause forcing vertical atmospheric convective currents into hyper drive. Vertical currents bring cold down and warmth upward.
The earth is rapidly casting off heat.
In an atmosphere where there is 1/3 warmth and 2/3 freezing, this mixing and inverting of the atmosphere Is ominous on the surface parts of the planet.
According to the GSM experts as the cosmic rays increase, a result of being in a GSM, they will produce more moisture aloft. More moisture aloft combined with a dormant sun has us heading towards ice build up & the lowering of sea levels. If at some point, and I hope its soon, the moisture aloft reduces, then the melt off will exceed the growth and we are heading back to an interglacial period.
GSM = excess moisture in the atmosphere =
a parallel convective current joining long wave radiation in the dissipation of heat into space.
The formation of snow in the upper atmosphere has a six-fold compound cascading cooling impact. One thing happens it snows, but the impact is multiplied by six.
1. The state change from water to ice deposits heat in the upper atmosphere. It is being deposited at the rate of 144 BTUs per pound of water that is converted to snow at the very minimum. This deposited heat will be dissipated into and radiated off into the background temperature of space which is estimated to be -455*f
2. Snow fall is a key episode governing and controlling the cooling process. For the vertical current to provide cooling there must be a separation between the heat absorbed by the upper atmosphere and the ice that was created when the upper atmosphere surrendered part of its volume of cold or lack of heat. The gravity driven falling snow provides the separation from the heat that was deposited in the upper atmosphere or left behind during the snow formation and state change from liquid to solid. The snow fall also causes an updraft that draws even more heat up from the surface of the earth.
3. The snow makes a color change to the surface of the earth. The Albedo of the planet is increased. During the advancing spring, sun light will strike the surface of the snow at an obtuse angle reflecting it back into space instead of the earth absorbing that vital warmth. The greater the snow accumulations, the more sunlight is reflected back into space.
4. When the snow on the ground finally melts it absorbs 144 BTUs per pound of snow, which robs the earth of some of the warming provided by the sun.
5. The snow melt increases the wetted surface of the earth creating even more opportunity for excess moisture in the atmosphere. Excess moisture creates the possibility of still more snow. Vicious cycle.
6. The process of water evaporation in and of itself has a cooling effect. The greater the moisture, or the wider the area the moisture covers, the greater the evaporation & the greater the cooling
7. Lastly just physical damage but that wont cause the earth to discharge additional heat. The previous six will. The greater the volume of snow, the more acute all of these impacts become. Regenerative feedback. A cooling earth would suggest even more opportunities for additional snow formation. Until this chain is broken by the dormant sun returning to its normal radiance or there is so much cold & snow that the atmosphere becomes arid, the thermal decline will continue deepening.
A snow storms thermal exchange rate with the upper atmosphere is roughly eight times that of a rain storm because of the state change properties of converting water to ice and ice to water. A snow storm 200 miles wide would be the thermal exchange equivalent of a 1600 mile wide rain storm.
Having said that it is important to be reminded that almost all rainstorms start out as snow. Under current conditions with excess moisture in the atmosphere, vertical currents are in play 24/7 in both hemispheres lowering the freeze altitude.
Most people can readily see ocean currents and their thermal exchange impacts but vertical currents are completely ignored. Not a good idea when their thermal exchange capability is amped up by the state change properties of water to ice & ice to water.
Ocean currents are a closed system that merely redistribute temperature. Vertical currents are open at the upper end providing an escape portal for heat to exit the earth.
Simply put vertical currents are ushering thermal energy from the earth to the cold blackness of space at an alarming rate.
Ironically the driving force producing an ice age is the formation of ice.
If the AGW crowd says the snow and cooling is caused by global warming, then run away global warming is impossible. They are likely to say just about anything
except the truth. At this very moment many people are at risk of freezing or starving because the worlds governments have been preparing for a fairytale world instead of dealing with reality. What is reality? We may be facing a very cold future for which no preparation has been made. World leaders have deliberately or stupidly led us and themselves to the wrong
conclusion on climate.
Everything has not been considered.
Art Horton
Why don’t you write an article (including of course all the data essential to support your hypothesis), for example in the ‘Research Gate’ corner?
*
Btw, not only glacier calving increases at Greenland’s coasts; according to Promice, a subdivision of the Danish DMI, the snow melting increases as well. Greenland looses more snow through melting than snow falls.
If that snow melting, according to your claim above ‘leaches out of the atmosphere 144 BTUs of warmth for every pound of ice that melts‘: should then the lower troposphere not show a corresponding temperature decrease over time?
But… it doesn’t. I just checked, using the UAH grid data, that the grid cells above Greenland show a linear estimate of
0.21 C / decade.
*
Moreover, you seem to start from the assumption that solar energy will soon decline.
That was predicted years ago, but might become obsolete in a near future.
Anyway, Mr Sunny Boy currently isn’t quite willing to go asleep:
https://i.postimg.cc/3Rg58B5Z/Solar-flux-F10-SC25-vs-SC24.png
Very low solar activity.
CLS Solar Radio Flux at 10.7 cm, Time Series
https://i.ibb.co/kqGvmWb/Screenshot-2.png
https://lasp.colorado.edu/lisird/data/cls_radio_flux_f107/
Yet another ‘how to show climate change is all wrong with this one simple trick’!
There are dozens of these, and each one is different and somehow each one is the KEY SIMPLE thing being missed by those dumb climate scientists.
This is part of the normal water cycle and convection of heat into the upper atmosphere.
The vapor-liquid transition releases most of the heat.
Indeed in a warmer world with a larger GHE the upper atmosphere needs to warm to radiate the same amount from a higher altitude.
Climate GCM models include such effects. Can you show that they don’t?
GW is happening more or less as predicted, while global cooling is not.
So why do you suggest the INM-CM5 model does not show as much warming as all the others but still corresponds better to the actual measurements?
RLH, Did you see my comment? Notice the way that the analysis treated the sat data in an equal manner in an effort to remove differences due to each group’s processing. They don’t need to compare the UAH LT versus the RSS TLT.
So please identify which actual models used in CMIP6 were running colder than the satellite series. Either of them.
RLH, Did you read the report, or are you going to keep insisting on cherry picking one model over all the others? You might also go back and read THIS REPORT from 2017, which questions the S&C version of reality.
E. Swanson
Thank you for reminding me of that excellent paper, it was gone from my ‘screen’.
“Did you read the report, or are you going to keep insisting on cherry picking one model over all the others?”
Yes I read it. What I was asking was which actual models (any of them) are running colder than the measurements.
RLH, Your question side steps the question of which “measurements” you think are the most accurate and therefore the standard against which one might answer that question. As I pointed out before, the graph to which you refer presents model results after they have been modified to simulate the MT time series, which is known to exhibit a cold bias due to stratospheric influence.
The two papers I referenced present two other methods for comparisons between the models and the satellite data. S&C still refuse to recognize that the data over the Antarctic is deeply flawed, which is, for me, one of several reasons to downplay their results. Sorry to say, your infatuation with the UAH presentation(s) taints your credibility.
ES: The paper you quoted shows that the models straddle the measurements (of all sorts). Why is it that you cannot quote the rates for those models and the corresponding rates for the measurements?
“Climate models have, on average, simulated substantially more tropical tropospheric warming than satellite data, with few simulations matching observations.”
“All of the observational and reanalysis points lie at the lower end of the model distribution”
https://agupubs.onlinelibrary.wiley.com/doi/pdf/10.1029/2020EA001281
“Pervasive Warming Bias in CMIP6 Tropospheric Layers”
R. McKitrick and J. Christy
“The tendency of climate models to overstate warming in the tropical troposphere has long been noted. Here we examine individual runs from 38 newly released Coupled Model Intercomparison Project Version 6 (CMIP6) models and show that the warm bias is now observable globally as well. We compare CMIP6 runs against observational series drawn from satellites, weather balloons, and reanalysis products. We focus on the 19792014 interval, the maximum span for which all observational products are available and for which models were run using historically observed forcings. For lower‐troposphere and midtroposphere layers both globally and in the tropics, all 38 models overpredict
warming in every target observational analog, in most cases significantly so, and the average differences between models and observations are statistically significant. We present evidence that consistency with observed warming would require lower model Equilibrium Climate Sensitivity (ECS) values”
RLH, McKitrick & Christy’s paper displays one of those areas to which I have objected. When comparing the satellite data with balloon and reanalysis data, they mention applying a mathematical computation using varying layers to simulate the LT and the MT. But when they discuss the model results, there’s no mention of using a similar mathematical computation. To me, that omission is either a gross editing failure or an intentional effort to produce inappropriate comparisons. Of course, they don’t document the weighting function(s) used either, though perhaps it might be found in one of the references. If so, one might expect to see some mention of a earlier document, but, there’s nothing.
They apparently average the UAH and the RSS LT data, glossing over the fact that RSS provides no data poleward of 70S and also excluded regions with high mountains in their product.
“To me, that omission is either a gross editing failure or an intentional effort to produce inappropriate comparisons”
So you must be correct. And they are wrong. Quite simple isn’t it?
I assume that you have brought these objections forward appropriately and obtained some answers.
RLH, I’ve raised similar complaints about the weighting of the data on this web site. Those questions have never been answered. McKitrick is the lead author, not John Christy, so why don’t YOU ask him about it instead of defending their work without question?
As I’ve noted before, the other groups analyzing the data explicitly note that they adjust the model output, for example, this quote from Santer (2021):
Since RLH has not replied, here are some further comments.
McKitrick posted a link to his data as a large XL spreadsheet with one sheet for each model run and a sheet for observations. For each model run, the data appears to be simulated MSU/AMSU data, though that’s not clearly stated, and all extend thru 2050. All the other numbers are derived from those initial input, probably provided by John Christy.
The observation data extends thru 2018 for all but one apparently updated thru 2019, judging by the different formatting for some of the 2019 values. Mckitrick calculated trends for the observation data covering first 1979-2019 and then 1979-2014. In the report they claim that
It is indeed inexplicable that McKitrick used only data thru 2014, given that they had complete information thru 2018 and only a few data series were missing 2019 data. It would appear that they intentionally decided to downplay the impact of the 2016 El Nino, which resulted in stronger trends in the observational data, compared with the 79-14 results they reported.
Do I suggest that? Not to my knowledge.
So why if the INM-CM5 model closely represents temperatures on both RSS and UAH do you not accept it as being accurate?
??
Very low solar activity.
https://i.ibb.co/RgFDrrw/Screenshot-1.png
Bindidon
Why not 2008-2011 and 2018-2021?
You are comparing arbitrarily only two years.
SC24 started in December 2008, and SC25 started in December 2019.
Bindidon, the lowest level of solar radio flux occurred in 2018.
https://i.ibb.co/V98Nx04/Screenshot-2.png
That is exactly the point where I was earlier, and then got told that I should compare the two cycles by setting them ‘start over start’.
When I have some idle time, I’ll make a graph again comparing the two on the base of their respective F10.7 minima.
This is also confirmed by the Bremen Center.
https://www.iup.uni-bremen.de/gome/solar/mgii_composite_2.png
https://www.iup.uni-bremen.de/gome/gomemgii.html
You can’t compare Bremen’s Mg II and F10.7.
You can compare SSN and F10.7
You are very wrong.
“The Extreme UltraViolet (EUV) emissions that impact the ionosphere and modify the upper atmosphere track well with the F10.7 index. Many Ultra-Violet emissions that affect the stratosphere and ozone also correlate with the F10.7 index. And because this measurement can be made reliably and accurately from the ground in all weather conditions, it is a very robust data set with few gaps or calibration issues.”
https://www.swpc.noaa.gov/phenomena/f107-cm-radio-emissions
Here I show for the umpteenth time what imho is to be understood by correlation:
https://i.postimg.cc/gjrzK2M7/SSN-vs-F10-7cm.png
The two do not correlate with
https://www.iup.uni-bremen.de/gome/solar/mgii_composite_2.png
as I do understand and use that word.
Moreover, the end of a cycle and the start of a new one are not at all defined by the least solar flux value.
This is governed by completely different, more complex observations.
Look in
https://www.astro.oma.be/en/december-2019-confirmed-as-starting-point-of-the-new-solar-activity-cycle/
The number of spots at the start of the 25th solar cycle (2021) is lower than at the start of the 24th solar cycle (2011).
https://i.ibb.co/mH7xPF5/ises-solar-cycle-sunspot.png
And ???
Did you look at all cycle pairs in the last 100 years to ensure this is worth to be mentioned anyway?
https://www.spaceweatherlive.com/en/solar-activity/solar-cycle/historical-solar-cycles.html
Shows all the cycles we have measured so far (from cycle 1 to 25).
He keeps posting his little cherry picked snippets so you can’t tell how misaligned and out of context it is
Typical destructive polemic.
Nothing is cherry-picked here, Eben, and you should know that.
The comparison ‘start over start’ is, after all, exactly the same as that what you post.
smell that? nothing in the world smells like that
I love the smell of falsified global circulation models in the morning
smells like… victory
Don’t buy a house in the low flood plane with no drainage
https://youtu.be/v9hycWGvzpI
But that’s exactly why people do build there! regular floods and/or mudslides make for fertile soils, while in a similar fashion, regular explosive volcanic eruptions also make for fertile soils near volcano. It is why the island of java, being the size of the state of new york (a bit smaller actually), hosts nearly 150 million people. Stable, steady climate leads over millions of years to the depletion of the soils creating infertile scrublands like most of the australian interior.
That must be devastating. Crops destroyed? Mass deaths? Drought?
Some expressed a desire for global warming theory.
Let’s over facts.
Over last 5000 years looks like long term cooling effect and
no evidence of this trend turning around.
The warmest period in Holocene was when we had arctic summer ice free polar sea ice and existing frozen stumps in arctic which were growing were once living trees. And current sandy Sahara Desert was
grasslands, forest, lands and rivers. Or Sahara Desert was in wet phase which lasted thousands of years.
And in the last 5000 years it has never become as warm as during this period which is called the Holocene climatic Optimum.
In terms of theories, it’s thought if Sahara Desert were to become as wet as it was, it would cause a significant amount of global warming. As having summer ice free polar sea conditions.
Or with either of them Green Sahara or ice free arctic would cause significant warming. And one could assume both would cause more global warming then just one of them occurring.
Or I did not make these theories, it more of what is commonly known or not disputed.
Another theory is we are in icehouse climate. Again, commonly known, nor has been disputed. And an icehouse global climate is where have polar icesheet which doesn’t melt during the year or regarded as “permanent” [though glaciers/icesheets are always constantly changing and flowing/moving]. AND the average temperature of entire ocean is cold. So, 34 million years old Antarticia is believed to started forming icesheet and as important the ocean became colder until the present time.
So, that 34 million period is called the Late Cenozoic Ice Age or also called, Antarctic Glaciation.
https://en.wikipedia.org/wiki/Late_Cenozoic_Ice_Age
https://en.wikipedia.org/wiki/Greenhouse_and_icehouse_Earth
And I think these theories are mostly right. Or facts will change as things are discovered, but broadly correct.
I would say in about last 2 million years, during the time Greenland was becoming a “permanent” icesheet- though mainly icesheet in terms Icehouse global climate regards to icesheets on continent, and Greenland is called the largest Island- we have been in the coldest period in last 34 million years.
And coldest mainly refers to the ocean being coldest.
And in Holocene I think/believe the ocean has been around about 4 C and currently the average temperature of ocean is about 3.5 C.
And it claimed and not disputed, that during past interglacial periods the ocean has warmed up to about 4 C.
And I would say that if interglacial period did not have ocean of about 4 C, it should not be called an interglacial period.
Or interglacial periods climb out glacial period quite steeply and reach a peak ocean temperature, and over many thousands of years the ocean cools and enters a glaciation period. And count as glaciation period one needs large ice sheet on North American.
Or if large continental ice sheet does not develop it’s not glaciation period.
Other things known is that CO2 level are not related to causing interglacial periods or Glaciation periods.
And the hysteria regarding CO2 is a religious matter.
Coherency in written communication is highly valued. Yours needs work.
“Coherency in written communication is highly valued. Yours needs work.”
It seems to me that you are overly optimistic about a possibility of me getting paid for my written communication.
But what I read generally from writers is that written communication is not highly valued.
And it seems to me if “coherency in written communication was highly valued”, we would be getting more of it- and not be getting less of it.
But nevertheless, I appreciate your encouragement.
Global climate is mostly about the Earth’s Ocean.
And even though I discussed the Sahara Desert, and it is large land area of 8,600,000 sq km- and is in an important part of world. I would say that Sahara Desert’s climate is caused by global climate rather than being a causal factor of global climate.
But in terms global air temperature, a Green Sahara Desert should have large effect upon global air temperature.
But it seems, we like the drunk looking for his keys under the lamp post. And are saying global air temperature is the same thing as global climate {rather than a proxy of it}.
But in terms a human concern, Sahara Desert becoming wetter, would be pointed to as huge example of climate change. Or if it was wetter and then become drier, it would be cited as an example of enormous climate change.
But the simple point is, we are currently after the peak high temperature of the Holocene, and doesn’t seem likely we going to have a Green Sahara within our 1000 year future {unless human make the Sahara Desert green, again}
Back to another issue.
I am interested in Mars exploration, and I have never been interested in living on Mars.
And recently I been wondering, what would have to be different about
living on Mars, which cause me to want to live on Mars.
Loosely speaking I would rather live on Mercury as compared to Mars- though it’s hard to get to Mercury from Earth. But it doesn’t matter much if I want to live on Mars, it’s that other people want to live
on Mars. And lots of people want Mars to be explored. That other people want to live on Mars, makes me happier. Though I am not worried that I will or could somehow discourage people from wanting to live on Mars, nor do wish advocate Mercury exploration and settlement, though tend to think Lunar exploration could lead more interest in Mercury, and lunar polar exploration I regard as most immediate and important.
Now, there things we don’t know, and there could be danger related to living in Mars gravity. But I would say I tend to be optimist, and so rather health problems of low gravity, it seems possible it’s better to live in lower gravity. Or I have said in past that low gravity might be appealing to older people. A lot of older people die by falling and hurting themselves. And I am growing older, maybe that could be factor in wanting to live on Mars. Also, radiation hazard is less of worry if one is older, as it could be more of long-term risk rather than short term issue.
I was saying our Moon hasn’t been explored.
And some might say it the most explored body in solar system {even including Earth}. Well, it’s true Earth has also not been explored with +7 billion people on it {I blame governments}. And I think Mars exploration could encourage more exploration of Earth.
What could help with statement of unexplored aspect of Earth is that 70% it is covered with deep ocean, but one also say, just land area of Earth lacks exploration.
And if we didn’t have US, Earth would less explored than it is. US is a product of exploration, but exploration of Earth which found America, had lots countries which didn’t help much with the exploration of Earth. So, it’s possible that exploration of Mars will not lead to nation which explores Mars and the rest of the universe.
But people who live on Mars would need to quite stupid, to not explore Mars, a lot.
“Over last 5000 years looks like long term cooling effect and
no evidence of this trend turning around. ”
“And in the last 5000 years it has never become as warm as during this period which is called the Holocene climatic Optimum.”
That turns out not to be the case.
http://railsback.org/FQS/FQS22katoFutureTemps03.jpg
I agree with you about the 5000 year long term natural cooling trend.
However you have ignored the artificial warming trend in the 20th and 21st century. This has brought us to temperatures warmer than at any time during the Holocene.
Incidentally, the graph is a few years old. We are currently 1.1C above the pre-industrial temperature and 0.7C above the Holocene Optimum.
Oops.0.5C above Holocene Optimum.
Ent, did you ever wonder where those people went to buy their thermometers 12000 years ago?
No, you never questioned it because your faith is completely in your cult. Beyond that, you can’t think for yourself.
Pup,
Proxies are like sockpuppets. They replace the REAL thing when one can’t use the REAL thing.
“That turns out not to be the case.
http://railsback.org/FQS/FQS22katoFutureTemps03.jpg ”
Even Michael Mann said splicing was wrong-
but it didn’t stop him from doing it.
We don’t even know what the global air temperature is currently.
And certainly, didn’t know it 50 years ago.
Global average temperature, for decades before I was in elementary school, was about 15 C.
It’s possible it’s currently, actually 14 or 16 C.
Global land surface temperature “might” be close 10 C.
Northern land might be about 12 C and Southern about 8 C {mostly due to the unmeasured Antarctica}. And we have average global ocean surface temperature, which is somewhere around 17 C.
And ocean surface temperature is probably more uncertain than land.
But I made easy.
Does green Sahara increase global temperature?
Are you are doubting the fact that Sahara desert was green?
How about if Sahara is green, would it mean a much higher global water vapor? Agree or disagree?
Btw, around time of elementary school I told it was likely human activity, made the Sahara into a desert. And this clap-trap still is said.
So were this to be believed, the primitive and low population of Humans, caused a huge climate change.
They froze Earth.
Witches causing cold weather, and a small population of native Americans killed off all the larger faun.
Seems I missing something else, but anyhow…
gbaikie…”around time of elementary school I told it was likely human activity, made the Sahara into a desert”.
***
All sorts of that elementary school propaganda in modern climate alarmist theory.
Have you encountered the Orbital Monsoon Hypothesis?
Basically the North African Monsoon follows the amount of insolation in the Northern Hemisphere.
When insolation peaks the NAM is strong and the Sahara is wet.
When insolation is minimal the NAM is weak and the Sahara is dry.
The main driver is the Milankovich precession cycle. When the Northern Hemisphere tilts toward the Sun at perihelion (shortest distance to the Sun) you get maximum insolation. This occurs when the Earth passes perihelion in June.
When the Northern Hemisphere tilts away from the Sun at perihelion you get minimum insolation. This occurs when the Earth passes perihelion in December.
Perihelion is currently on January 2nd, so the NAM is currently close to its minimum and the Sahara is dry. 10,000 years ago the NAM was close to its maximum and the Sahara was wet.
https://en.m.wikipedia.org/wiki/North_African_climate_cycles
https://pwg.gsfc.nasa.gov/stargaze/Sprecess.htm
Yes.
But other than tilt, I thought possible than warmer surface ocean above tropics could function similar to tilt. Or higher tilt warms these waters more. Or doesn’t matter how the ocean waters are warmed, just that they are warmer.
Oh that pic again – Kindergarten level climate shystering
Eboy can’t stay in his lane once again.
Willard, please stop trolling.
Now that Roy has updated the whole series here are the graphs for Nov 2021
https://climatedatablog.files.wordpress.com/2021/12/uah-1.jpeg
https://climatedatablog.files.wordpress.com/2021/12/uah-north-pole.jpeg
https://climatedatablog.files.wordpress.com/2021/12/uah-northern-ex.jpeg
https://climatedatablog.files.wordpress.com/2021/12/uah-northern-hemi.jpeg
https://climatedatablog.files.wordpress.com/2021/12/uah-south-pole.jpeg
https://climatedatablog.files.wordpress.com/2021/12/uah-southern-ex.jpeg
https://climatedatablog.files.wordpress.com/2021/12/uah-southern-hemi.jpeg
https://climatedatablog.files.wordpress.com/2021/12/uah-tropics.jpeg
https://climatedatablog.files.wordpress.com/2021/12/uah-2.jpeg
https://climatedatablog.files.wordpress.com/2021/12/uah-long-term.jpeg
https://climatedatablog.files.wordpress.com/2021/12/uah-residuals-1.jpeg
https://climatedatablog.files.wordpress.com/2021/12/uah-month-on-month.jpeg
https://climatedatablog.files.wordpress.com/2021/12/uah_lt.jpg
https://climatedatablog.files.wordpress.com/2021/12/uah_mt.jpg
https://climatedatablog.files.wordpress.com/2021/12/uah_tp.jpg
https://climatedatablog.files.wordpress.com/2021/12/uah_ls.jpg
binny…”As you can see, he really did not understand even half a bit of what the graph shows”.
***
I understand perfectly well. You created a graph showing the abscissa in months over a year then inserted graphs for ranges covering decades. In other words, you lack even a basic understanding of how graphs are made.
Since the aim of your presentation was to compared temperature series in absolute temperatures, you failed miserably. You ended up showing one of the hottest years in the recent records as colder than all the rest.
binny in response to chic bowdrie…”May I suppose you still belong to the people who draw a line across Roy Spencers graph upthread, and see its flat?”
***
The IPCC admitted in their 5th assessment that the trend was flat from 1998 – 2012…15 years. I extended that to 18 years, based on a visual examination which comes down to visually averaging the data.
If you look at Roy’s graph above, between roughly 2007 and 2011, you can see an approximate inverted sine wave. That tells you immediately that the average was roughly zero between those years. Extending back to 2002, it’s roughly the same.
The 1998 spike is narrow while the following curve below the baseline is wide, Again…roughly a zero trend. The IPCC saw all that as a flat trend and I can see it visually.
Cripey, do I have to teach you everything?
When you see Roy’s trend of 0.14C/decade, that’s statistical trend based purely on the numbers. It does not represent the physical reality. UAH knows that and covered the difference in the 33 year report. However, UAH live in a scientific world where such statistical trends are required and I’m sure they don’t have the time to get into the esthetics.
Robertson
In the recent years, you got enough replies about this your endlessly repeated nonsense.
I am grasshopper; eager to learn.
However, You aren’t my teacher.
Ken
I’m over 70, and still learn every day in lots of domains.
Some like Robertson don’t (want to) learn anything further (that would be kinda appeal to authority).
They simply repeat the same stuff all the time, be it wrt weather/climate, 2Lot, Einstein, viruses, the Moon, etc etc etc.
Boring.
maguff…”Here is an abridged (a mere 3,949 pages) progress report on the greenhouse gas warming experiment currently underway, complete with a few thousand references:
https://tinyurl.com/Greenhouse-gas-warming
Enough said.
***
The IPCC’s logic is as follows: we have noted an increase in atmospheric greenhouse gases since 1850, therefore it is certain that humans are causing the accompanying warming.
They advise us further that the Summary for Policymakers is fact, and can be trusted. They don’t advise us they have a mandate to only look at human causes of warming, not natural causes.
The document begins by referencing a working group then slyly switch the focus to the Summary for Policymakers. They don’t tell us the Summary, written by 50 politically-appointed lead authors, has amended the working group’s report to reflect the views of the 50 lead authors.
Maguff, in his stupidity, actually believes this propaganda since he is clearly incapable of doing the required research to see the IPCC are a load of politically-motivated hosers.
Robertson, shut up about “doing the required research.” Here’s what you recently posted:
“There is no such thing as a molecular vibration.” http://www.drroyspencer.com/2021/11/uah-global-temperature-update-for-october-20210-37-deg-c/#comment-1038736
thus negating the whole field of Molecular Spectroscopy and blissfully confirming your ignorance.
Ed Berry on CO2 and how the IPCC got it wrong.
https://edberry.com/blog/climate/climate-co2/the-impact-of-human-co2-on-atmospheric-co2/
What factor is NOT part of the effective temperature formula that so dramatically affects the actual temperature of the moon?
Why is the actual mean temperature of the moon so much lower than the effective temperature?
NASA lists the effective temperature of the moon at 270.6 kelvin.
The mean temperature of the moon at the equator is 220 kelvin.
With no atmospheric effects, why is the surface temperature so much lower than the effective temperature predicts?
What factor is NOT part of the effective temperature formula that so dramatically affects the actual temperature of the moon?
I’ll tell you what it is:
It is the Φ -the planet solar irradiation accepting factor.
For smooth surface Moon Φ= 0,47.
Te.correct.moon = [ Φ (1-a) So /4σ ]¹∕ ⁴
Te.correct.moon = [ 0,47 (1-0,11) 1.362 W/m² /4*5,67*10⁻⁸ W/m²K⁴ ]¹∕ ⁴ =
Te.correct.moon = [ 0,47 (0,89) 1.362 W/m² /4*5,67*10⁻⁸ W/m²K⁴ ]¹∕ ⁴ =
Te.correct.moon = [ 2.510.168.871,25 ]¹∕ ⁴ =
Te.correct.moon = 223,83 Κ
This simple example clearly demonstrates the CORRECTNESS of the Φ -the planet solar irradiation accepting factor.
For smooth surface planets, like Moon, Φ= 0,47.
Conclusion:
From now on, for every smooth surface planet and moon, we should take in consideration instead of the planet blackbody effective temperature Te , the corrected values of the planet blackbody effective temperature – the Te.corrected.
Table of results for Te and Te.corrected compared to Tsat and to Rotations/day for smooth surface planets and moons with Φ=0,47
Planet…….. Te…. Te.corrected…..Tsat…Rot/day
Mercury…..440 K…….364 K…..340 K…0,00568
Moon………270 K……224 K…..220 K…0,0339
Earth………255 K…….210 K…..288 K….1
Mars……….210 K……174 K…..210 K…0,9747
Europa…….95,2 K……78,8 K…102 K…0,2816
Ganymede..107,1 K…..88,6 K…110 K….0,1398
https://www.cristos-vournas.com
Cristos,
All of them are very close except Mercury. All are within 3C except Mercury. Which term might be off?
Stephen,
All are within 3C, please explain what is within 3C with what?
The Te.corrected.mercury = 364 K is calculated for Mercury’s Semi-major axis which is 0,387 AU.
But half of the time, Mercury comes closer to the sun at its Perihelion of 0,307 AU.
The fact Mercury’s orbit has high eccentricity e = 0,205 partly explains the bigger, than might be expected, difference between the calculated Te.corrected.mercury = 364 K and the measured Tsat = 340 K .
Stephen
“Which term might be off?”
The table of results for Te and Te.corrected compared to Tsat and to Rotations/day for smooth surface planets and moons with Φ=0,47 does not have, for further comparison the column of cp and the column of (N*cp) in sixteenth root.
I have a page in my site “ALL PLANETS TEMPERAT” – I have collected all the data in one Table there.
https://www.cristos-vournas.com
The difference between Tmean and Tsat.
Yes, for Mercury the calculated Tmean = 325,83 K and the satellite measured Tsat =340 K.
The fact Mercury’s orbit has high eccentricity e = 0,205 partly explains the bigger, than might be expected, difference.
For all planets the Tmean is calculated for the Semi-major axis.
Measured for Mercury the Tsat =340 K might be performed at a time Mercury was on the same as Earth side of sun. At that side of its orbit Mercury, due to its eccentricity, happens to be closer to the sun.
Thank you for noticing.
https://www.cristos-vournas.com
–Conclusion:
From now on, for every smooth surface planet and moon, we should take in consideration instead of the planet blackbody effective temperature Te , the corrected values of the planet blackbody effective temperature the Te.corrected.–
Other than Earth, because it has an ocean, what planet is smooth?
What is meant by smooth?
One could call the lunar smooth because it’s pounded into dust but you also say a rough surface because pounded into dust by all kinds different size rocks, but because most common impactor is dust or micrometeorites and biggest rocks are in timeframe of millions of years, it’s smooth?
Anyhow I assume error is related lack exploration of the Moon, while imagining the Moon has been explored, when it hasn’t.
Smooth for planet doesn’t mean polished. It doesn’t mean smooth on microscopical level – the mirror like.
Smooth for planet means not effectively capturing solar energy.
An example of rough planet surface is a dense urban area. Solar beams, when hitting walls, get reflected in downward direction, until, after multiple reflections being completely absorbed. See how dark it is in the streets of the cities.
https://www.cristos-vournas.com
“Smooth for planet means not effectively capturing solar energy.
An example of rough planet surface is a dense urban area.”
Well, few natural terrains are similar dense urban areas. Or seems one needs erosion to come close. I tend imagine Madagascar. But also, was just listening video on Mercury and apparently Mercury surface is thought to have a lot of volatiles {or has a lot of Sulphur and has ancient surface] which in what seems like small regions somehow boil off over millions of years of time.
But anyhow, Earth is very effective at capturing solar energy, the earth’s ocean in particular- and obviously it’s atmosphere also. The UHI effect of urban areas seems largely connected having an atmosphere and related air convective processes.
The moon is roughly like a region bombarded by heavy artillery a million year ago, in environment which not vaguely as erosive as Earth surfaces. Like a flat dry rock area with insane amount heavy artillery- millions of years ago. Mercury is roughly the same as our Moon. Mars has wind erosion as major erosion factor {again over millions of years- and also an insane amount heavy artillery. And these planets retain the evidence of very large impactors which hidden by erosion- and plate tectonic activity on Earth.
Also Mars thin atmosphere stops the micrometeorite impacts which are a major feature of the Moon and Mercury.
In terms broad scale elevation changes, Moon, Mars, and Venus are not smoothed by having an Earth’s ocean. Mercury smoothed due to cooling and some rock plates caused contraction erasing some impact craters over billions of years {though I guess also true with Moon or Mars, and maybe Venus- though its surface is said to be young}.
Φ is the spherical shape and roughness coefficient.
Because of the planet spherical shape Φ cannot be less than 0,47;
We have (theoretically) Φ for different planets’ surfaces varying
0,47 ≤ Φ ≤ 1
In practice planets have either Φ=0,47 or Φ=1
And we have surface average Albedo “a” for different planets’ varying
0 ≤ a ≤ 1
Notice:
Φ is never less than 0,47 for planets (spherical shape).
Also, the coefficient Φ is “bounded” in a product with (1 – a) term, forming the Φ(1 – a) product cooperating term.
So Φ and Albedo are always bounded together. The Φ(1 – a) term is a coupled physical term.
https://www.cristos-vournas.com
Hmm.
I was looking from amount shadow there was in lunar polar region and didn’t find an answer, instead I got the amount of permanent shadow:
https://agupubs.onlinelibrary.wiley.com/doi/full/10.1029/2002GL016180
Which was interesting:
” A detailed analysis of all fresh looking simple craters larger than 1 km within 12° of the pole was undertaken. The total number of craters mapped was 832.
These craters have a total surface area of approximately 12,500 km2 representing roughly 3% of the lunar surface poleward of 78°. Using equation 1 to calculate the amount or permanent shadow associated with these craters yields 7500 km^2. This number is significantly larger than the previous estimates of 530 km^2″
So, craters “fresh looking”, 1 km or larger are 3% of area and
amount 12,500 square km.
And I guess 97% of area is about 416,666 square km or total area
416,666 + 12,500 square km equals total 429,166 square km.
[And California is 423,970 square km}
So, I wanted to know how much of “California size” area is in shadow and gives me how much is calculated to be in permanent shadow. And obviously the amount in shadow is larger than in permanent shadow- or didn’t find what looking for, but it was interesting anyhow. Particularly the part where it was thought 530 square km vs 7500 square km calculation. {though another estimate was “and 2650 km2 [Margot et al., 1999]”
For south pole:
“A detailed analysis of all fresh looking simple craters larger than 1 km, within 12° of the pole identified 547 craters. These craters have a total area of 11,200 km2 which represents just under 3% of the total lunar surface south of 78°S. Using equation 1 to calculate the amount of permanent shadow associated with these craters yields a lower limit of permanent shadow of 6500 km2. This compares with 3300 km2 [Bussey et al., 1999], and 5100 km2 [Margot et al., 1999].”
Anyhow there seems more interest in south pole of Moon, and I wonder if it’s misguided.
Anyhow this talking down 78 degrees, and I generally regard 80 degrees or higher as lunar polar region even though strictly speaking the polar circle should at 88.5 degrees.
So, question remains in given hour on the Moon, how much percentage is 78-degree latitude and higher in shadow?
As this relates to near morning and evening when sun is 12 degrees above the horizon {15 degrees is Earth or Lunar hour]. Or hour after dawn how is the land in shadow.
Now when the sun is at 15 degree or less, it’s not heating a level surface of the Moon or Mercury by much. Though it would heat the side of vertical rock with a full sunlight intensity.
But curious at equator before the sun has risen for an hour how is land in shadow. Or on earth glowing sky adds lighting.
Wiki:
“On the Moon, permanent shadow can exist at latitudes as low as 58°; approximately 50 permanently shadowed regions exist in the 58°- 65° latitude range for both lunar hemispheres.
The cumulative area of permanently shadowed lunar regions is about 31 thousand km2; more than half of it is in the southern hemisphere”
https://en.wikipedia.org/wiki/Permanently_shadowed_crater
It seemed likely they could be that low, I didn’t know they found them at 58 degree latitude.
Still not getting idea of how much shadow is in polar region at given point in time, other general characterization of mostly dark with islands of light.
But getting a better idea of why I don’t know:
“Over the past decade, LRO’s NAC, as well as JAXA’s Kaguya Terrain Camera(TC), have used longer CCD exposure times to acquire optical images of PSRs with acceptable SNRs, however, the spatial resolution of these images (long exposure NAC: ~20–40 m/
pixel long exposure TC: ~10 m/pixel) is strongly limited by the movement of the satellite and is not able to close the strategic gap posed by the lack of optical, high-resolution images (<10 m/ pixel) that are required to study and understand the rover-/astronaut-scale geomorphology and trafficability of PSRs.
The current lack of knowledge of PSRs poses a risk to future
ground exploration missions. Small lunar PSRs are top-priority
sites targeted by a number of future robotic and crewed missions,
for example, by NASA’s Artemis program, including the VIPER
(Volatiles Investigating Polar Exploration Rover) and Artemis III
missions. Without high-resolution data and imagery (<5 m/pixel), the meter-scale geomorphology of PSRs remains unknown, and this complicates mission planning and generates questions such as: Where can a given PSR be entered safely?"…
Here, we address the strategic need for low-noise, high resolution optical images of PSRs by focusing on improving the
quality of the short exposure, full-resolution regular- and
summed-mode NAC images. We develop a state-of-the-art low light denoising tool which we call HORUS—Hyper-effective nOise Removal U-net Software—that is capable of removing the high levels of noise in these images, unlocking the entire LRO NAC image archive for PSR-related science and exploration."
https://www.nature.com/articles/s41467-021-25882-z.pdf
And:
https://smartwatermagazine.com/news/max-planck-society-max-planck-gesellschaft/artificial-intelligence-now-provides-sharper-images
In this morning’s headlines:
http://www.drroyspencer.com/2021/12/uah-global-temperature-update-for-november-2021-0-08-deg-c/#comment-1044545
maguff…GR..”There is no such thing as a molecular vibration….thus negating the whole field of Molecular Spectroscopy and blissfully confirming your ignorance”.
***
You still don’t understand that a molecule id a definition for two or more atomic nucleii bonded by electrons. Therefore any molecule is an aggregate of atomic nucleii bonded by electrons in different arrangements.
Here
s CO2….again!!!!……
O=====C=====O
Please pay attention.
The dashed lines represent ELECTRONS that bond the two oxygen atoms to the carbon atom. There are two dashed lines representing the two electrons involved in each bond.
It’s a linear molecule unlike water which has two hydrogen atoms at an angle of 104.45 degrees as their bond angle, with an oxygen atom. Therefore it would look similar to CO2 except the two hydrogen bonds would be bent into an angle of 104.45 degrees rather than horizontal.
Don’t know if the following will work via the Net.
O
/ \
H H
Note, only one line for bond since only one electron is involved.
It is the electrons and protons in atoms, and the charge between them, that define the atomic shapes. That’s true for any combination of electrons and their nuclei whether it involves two atoms or the estimated 204 billions atoms in the DNA macro-molecule.
https://michaelgr.wordpress.com/2008/04/06/how-many-atoms-to-encode-the-human-genome/
The only particles in either arrangement that can emit or absorb EM are the electrons belonging to either nucleus or shared between them. All visible light in the universe is produced by electrons, not molecules per se.
When anyone talks about a molecule radiating or absorbing EM they are referring to the electrons making up the molecular bonds. Some scientists are aware of that but some are ignorant of that fact and do us the disservice of creating the illusion there is something magical in a molecule, like a black box, that can radiate and absorb energy.
It is easier to describe and define aggregations of electrons/nuclei using a name, and that name is molecule.
testing with different browser…
Don’t know if the following will work via the Net.
O
/ \
H H
Note, only one line for bond since only one electron is involved.
nope…lost the spacing before O (x2) and between the H atoms (x4)
Geez, Gordon, crack a chemistry text if you want to blather on about molecular bonding.
Each molecular bond has two electrons, not one, you are way out of your lane.
“When anyone talks about a molecule radiating or absorbing EM they are referring to the electrons making up the molecular bonds. Some scientists are aware of that but some are ignorant of that fact and do us the disservice of creating the illusion there is something magical in a molecule, like a black box, that can radiate and absorb energy. “
You don’t understand anything do you? Water is a polar molecule which means it has a permanent dipole, whereas CO2 for example has a vibration-induced dipole, and thus H2O is much more IR active than CO2.
If you want to discuss this with me then go “do the required research first.” I have neither the time nor the desire to school you on this also.
maguff…”You don’t understand anything do you? Water is a polar molecule which means it has a permanent dipole, whereas CO2 for example has a vibration-induced dipole, and thus H2O is much more IR active than CO2″.
***
I am not discussing this with you, I am revealing to others how abysmally ignorant you are on the subject.
Where do the vibrations come from? Do you think in your abysmal ignorance this is like an unbalanced flywheel?
The vibrations come from the interaction of +ve and -ve charges between the protons in the nucleus and electrons. Also, vibration is caused by any charges close to each other. Remember, +ve charges repel each other as do -ve charges.
In covalent bonds that sets up a natural vibration and since molecules are atoms bonded together, any time charges get close to each other they attract or repel. However, it’s not always a straight attraction/repulsion, the bonds tend to vibrate. Molecular vibration is usually bond vibration due to electrons.
At other times there is a -ve to -ve repulsion and at others a +ve to +ve repulsion. The shape of the molecule comes largely from the negative charges of the electrons. In a probability cloud where electrons are more likely to be found in a water molecule, the higher negative charge is nearer to the oxygen molecule.
And guess why? The oxygen atoms has far more electrons than the sole electron in the hydrogen atoms. The O2 electrons push the hydrogen atom off to a 104.45 degree angle. But they don’t just push them away, there is an inherent vibration in the bond shape. When water molecules interact with other water molecules there is a +ve to +ve interaction, which is weaker than the -ve to -ve and -ve to +ve interactions.
Vibration is all about charges.
In a molecule, there are other inter-atomic interactions that lead to vibration but its all about *ve and -ve charges.
No sir, I have no interest in discussing this with someone with your arrogance and stupidity. My input is merely to reveal the bs you are posting.
“In a probability cloud where electrons are more likely to be found in a water molecule, the higher negative charge is nearer to the oxygen molecule.”
I thought you didnt buy quantum mechanics Gordon?
http://www.drroyspencer.com/2021/12/uah-global-temperature-update-for-november-2021-0-08-deg-c/#comment-1047892
Whatever you say Ken.
But your claim was ‘there have only been…’ so its not a big problem and no need for interventions.
But now you dont deny the interventions worked and led to low numbers.
So your logic is circular.
Arrgh wrong place
P.s.: you dishonestly misrepresented my original comment by editing the quote. You are a shameless liar.
My original comment: http://www.drroyspencer.com/2021/12/uah-global-temperature-update-for-november-2021-0-08-deg-c/#comment-1046237
No misrepresentation.
An influx of Arctic air over the Great Lakes in three days.
https://i.ibb.co/xGT1vhS/gfs-isen290-K-us-13.png
https://i.ibb.co/Sm5qrzN/ecmwf-z500-mslp-namer-4.png
Lets see where it might be cooler in December.
https://www.nsstc.uah.edu/climate/2021/November2021/202111_Map.png
Robertson
I’m in a better mood today than yesterday, and I’m trying to help you, even though you keep insulting me.
You wrote:
” Since the aim of your presentation was to compared temperature series in absolute temperatures, you failed miserably. You ended up showing one of the hottest years in the recent records as colder than all the rest. ”
Maybe you are the only one here who doesn’t understand such a simple graph.
*
But at least you are now in real progress: in comparison with your previous comment:
” Binny has sunk to a new low. What kind of a trash graph had the x coordinates listed in months and the graphics listed across varies years, ranging back to 1981? ”
you have in between at least understood why the abscissa contains the 12 months of a year, while years (plus two means of 30 year-periods) are listed within the graph.
Good, Robertson! Weiter so, aus Ihnen kann vielleicht doch noch was werden…
*
Continue to learn, Robertson, and look at the graph once more:
https://drive.google.com/file/d/1rhVica1eUmTWIFj0m6cC1jC-GKZdMZwi/view
Don’t you see that 1998 was in July the hottest of all years?
Why should 1998 have been hotter than all others for all months of that year? Is there any reason for that?
Why are you not also surprised by the fact that 2020’s absolute temperatures were in July hotter than 2016, which is the hottest in Roy Spencer’s graph?
Why was 2021, a cool year, in absolute form hotter in October than were both 2016 and 1998?
Oh Noes! How can that be?
*
And now look at a very similar graph that is made up of anomalies rather than reconstructed absolute values:
https://drive.google.com/file/d/12nS8-UAHjEZWM-VRXI8S8q4H2-aBw3Zd/view
You see?
Now your hottest year 2016 is back on top, but not in July. Why?
Why is the blue mean suddenly a straight line, while the yellow one is not?
Oh Noes! How can that all be?
Yeah. Anomalies with annual cycle removal really are strange animals.
*
Btw, Robertson: when you write
” Since the aim of your presentation was to compared temperature series in absolute temperatures, you failed miserably. ”
why don’t you email Roy Spencer and ask what he thinks of my ‘miserable failure’ ?
Why don’t you call your mom in here for a back-up you Bindidork
As usual, Eben produces polemic one millimeter above the belt.
Why aren’t adult enough to avoid such stoopid comments?
Binny,
May I quote you?
“Why arent adult enough to avoid such stoopid comments?”
Ooooh, Flynnson comes out again!
Wonderful.
Did you recently put CO2 between your thermometer and the Sun, Flynnson?
Binny,
May I quote you again?
“Ooooh, Flynnson comes out again!
Wonderful.
Did you recently put CO2 between your thermometer and the Sun, Flynnson?”
binny…”Im in a better mood today than yesterday…”
***
Glad I cheered you up.
You are light years away from those who can.
Oh… no further reaction!
It seems that now, Robertson finally managed to understand the graph.
I totally agree: 2021 is all you want just not a pretty warm year, and so it looks like the UAH LT time series (and possibly about LT too, I didn’t check).
A warm winter (at least where I live) followed by a spring below lowest expectations, a mitigated summer, and a somewhat disappointing autumn.
Our usual holiday corner in Southern Spain was visited by absolutely unusual, sometimes stormy, northwesterly winds.
But to those however who, for whatever reason, want to lead us to believe that it is the beginning of a Global Cooling, I propose to have a look at a comparison of 2021 with e.g. 2011, which was also not at all a warm year according to UAH anomalies.
The absolute values look like this:
https://drive.google.com/file/d/1nAKEwIgGb37Y6ssIVdXOVw3wxmHvEuw4/view
Looking at the red vs. the black plot tells a lot.
” … and so it looks like in the UAH LT time series… “
So a fairly pedestrian year by current standards was still warmer than the average for the last decade.
https://xkcd.com/1321/
But cooler than the last 5 or 6.
Counting the 1980 peak, there have been eight new UAH record temperatures in 41 years. That spaces new records an average of 5.1 years apart.
The last peak was in 2016, five years ago.
You haven’t even reached the average time between records yet. Aren’t you wetting your knickers rather prematurely?
Are you suggesting that what I said was untrue?
RLH,
Of course not. He wrote –
“Aren’t you wetting your knickers rather prematurely?”
Just the usual immature innuendo, and attempted gratuitous insult, when he is caught out.
All par for the course for delusional climate crackpots.
entropic…”Counting the 1980 peak, there have been eight new UAH record temperatures in 41 years”.
***
There was no record in 1980. The anomaly was negative, significantly below the 1990 – 2020 baseline. The only two significant records occurred in 1998 and 2016. For some reason, the ’98 record came and went within a year but the 2016 peak lingered on.
Definite evidence of natural sources in both since alleged CO2 warming cannot operate like that.
RLH
“Are you suggesting that what I said was untrue?”
True but not significant. Five years without a new record month is routine in the UAH dataset.
It certainly does not prove your on going subtext claiming that UAH is showing a long term cooling trend.
True but not significant
So true then.
It certainly does not prove your on going subtext claiming that UAH is showing a long term cooling trend.
I am purely observing what the data itself shows. Accurately as you have agreed.
Mind you, 5 to 6 years is not long term, except when compered to a year or a month.
What is really funny is that when you show a temperature time series with values increasing within a time span of 5-6 years, thousand skeptics will answer you:
” Don’t mind, little boy, that’s OK, it was way way warmer 10,000 years ago or so. ”
But when somebody tells it’s cooling since 5-6 years, all skeptics agree.
Nice.
Let’s have a look at a descending sort of the yearly averages for UAH LT since 2000.
We have, directly before 2021 – except 1998 (0.33 C) – four of the five warmest years of the whole UAH record.
2016: 0.39 C
2020: 0.36
2019: 0.30
2017: 0.26
2010: 0.19
2015: 0.14
2021: 0.11
2018: 0.09
2002: 0.08
2005: 0.06
2003: 0.05
2014: 0.04
2007: 0.02
2013: 0.00
2001: -0.02
2006: -0.02
2009: -0.04
2004: -0.05
2012: -0.09
2011: -0.12
So, if a year suddenly behaves different and is cooler than the five years above it: is that significant as a hint on cooling?
{ Btw, 2021 was over the year not cooler than 2018, that’s one year out. }
Hmmmh.
If we see in a few years that the temperatures have continued to drop like thy did after 2010, due to a La Nina much stronger than the current one
https://psl.noaa.gov/enso/mei/#data
then yes: the 2021 cooling might well be viewed as significant.
I’m convinced, when looking at the numbers, that this cooling trend story, solely based on 2021 data, is premature.
And it’s always good to keep in mind that UAH produces the coolest temperature series available (due to the way how the atmospheric layers are averaged into the ‘LT’ product), and that the lower troposphere after all is not the surface.
“the lower troposphere after all is not the surface”
But all those who know about weather use the layer above the turbulent boundary layer as being the one that correlates well over longer distances.
The last few years of UAH look like this
https://imgur.com/wwOqMJy
The layer above the turbulent boundary layer is not less turbulent than the latter.
Temperatures are varying there a quick as at the surface, producing high deviations in time series.
Moreover, the uncertainties accumulated during the process of a satellite-borne sounding of O2 emissions are by far higher than those existing at the surface. There is plenty of publication about that.
It is known since long a time that the quality of the correlation between points spatially differing is not restricted to any place on Earth.
The best technique used until now consists of removing the seasonal dependencies (aka the annual cycle) locally point by point, by computing the anomalies wrt a global reference period but out of a baseline local to the point, what allows for a far better correlation over long distances than when using absolute data, including differently elevated points.
*
A typical example is the comparison, over the period 1979-2021, of
– a surface series constructed out of, on average over the years, 14,500 GHCN daily stations worldwide, whose anomalies are area weighted into about 2,000 cells of a 2.5 degree grid a la UAH, and are then subject to latitude weighting using a formula giving results similar to UAH’s
with
– a lower troposphere series constructed out of the about 3,000 cells of UAH’s 2.5 degree grid on which a land mask is applied, available in UAH’s monthly report (data column 2),
both based of course on the same reference period: 1991-2020.
https://drive.google.com/file/d/1ZvoKQfJHq14k2IQaGdUfKBk9Ps2JnZ7P/view
Who knows how the origin of these anomaly series – the absolute data – looks like, is always wondering about their similarity.
Unfortunately, I didn’t find yet in my spreadsheet guy (a pale copy of Excel) any user interface allowing me to accurately compute the correlation factor between the two.
“The layer above the turbulent boundary layer is not less turbulent than the latter”
The layers in the LT above the surface boundary layer are indeed less turbulent in the main than the layer below. That is why correlations can be observed over large distances. A fact that is used by weather people to produce their forecasts and has done for centauries. Sure there are lows, highs, ridges, etc. which produce large scale movements and differences but they are on a different scale to those down below.
You only have to look at wind over sea and over land to see that. Over the sea the surface boundary layer is much thinner and it is bulk air movements that govern things. Over land the velocities are lower. Close to the surface it is friction with the ‘static’ surface that governs things and that produces more turbulence lower down.
All sailors know that the air higher up moves in a more regular pattern.
Gordon Robertson
A record is a month warmer than any other month in the dataset.
If you take only the El NIno peaks of 1980, 1998 and 2016 as records, that gives an average spacing of 18 years and makes RLH’s implied cooling trend based on five year’s data even less probable than I suggested.
The data says that this year is lower than the last 5 to 6. That is a fact.
https://climatedatablog.files.wordpress.com/2021/12/uah-2.jpeg
> The data says
Filters ain’t data, dummy.
The last few years of UAH look like this (unfiltered)
https://imgur.com/wwOqMJy
Low pass filters of data present a clearer picture of the data without distortions.
Linear trends are the ultimate in low pass filters (though using infinity is not that useful).
> The last few years of UAH look
You made them look like this, dummy.
The picture accessed via
https://imgur.com/wwOqMJy
is correct.
Pictures ain’t correct or incorrect, dummy.
They’re just pictures.
“The data says that this year is lower than the last 5 to 6.”
Nope.
https://imgur.com/wwOqMJy
Willard
” Pictures ain’t correct or incorrect, dummy.
They’re just pictures. ”
Could you please stop this incompetent blah blah?
The picture represents numbers correctly derived from UAH’s monthly data.
The dummy here: that’s you, sorry.
Binny,
Je vais te le dire juste une fois:
Crisse-moi patience, parce que tu vas me trouver.
According to Willard even adding things up produces distortions. Unless it shows a rise in which case it is a fact.
Willard: Je ne parle pas Franscais
Barry: 2018 is at best the same as this year (within any reasonable margin of error and this year is not even finished yet), the rest since 2014 are indeed higher.
“Pictures aint correct or incorrect”
Now graphs (not pictures) that show data are not good enough for Willard. Unless they show warming in which case they are fine.
If we want to know if the underlying GW trend is continuing or has been interrupted, we need to consider the effect of ENSO history.
ENSO produces swings of +- 0.15 in the 13 mo. average. With a trend of 0.14C/decade, ENSO should dominate over trend for periods < 1 decade.
Looking at ENSO history, with 2021 and 2018 dominated by modest La Nina, 2016 by super El Nino, 2019-20 by modest El Nino, the result that 2021 and 2018 are the lowest since 2015 should come as no surprise.
There is no evidence (yet) of an interruption in the underlying GW trend.
> Now graphs (not pictures) that show data
You made the graph, dummy. To make the graph, you selected, then processed data. There were choices in that pipeline.
Then you interpreted your graph. You allowed yourself some uncertainty, some margin for error. You also miscalculated, as Barry spotted.
Data does not “tell” anything. You’re not a data truth-teller. You’re just a little Climateball rookie that lacks the courage to say clearly what you think and to own your contrarianism.
” Crisse-moi patience, parce que tu vas me trouver. ”
Voilà qui m'a vachement l'air d'être du québécois.
Qui me trouve, l'a bien cherché. Tant pis pour lui ou elle…
a me va, mon beau champion. T’aurais pas d.
Tu me passes un bon temps de Ftes!
Willard, please stop trolling.
The eruption of the Semeru volcano in Java.
https://youtu.be/hHG6FTzEg5w
binny…”They simply repeat the same stuff all the time, be it wrt weather/climate, 2Lot, Einstein, viruses, the Moon, etc etc etc.”
***
The thing that is incredible is that you cannot even begin to rebut anything I have said. Your entire arsenal is ad homs, insults, whining, and appeals to authority.
I would think that by age 70 you might be asking some serious questions rather than absorbing everything others want you to think.
” Your entire arsenal is ad homs, insults, whining, and appeals to authority. ”
Says Robertson, the specialist of ad homs, insults, and… appeal to the authority of contrarian blogs.
binny…”Says Robertson, the specialist of ad homs, insults, and appeal to the authority of contrarian blogs”.
***
Not so, the evidence in my past posts reveal that 99% of the time I try to rebut with scientific evidence. Every so often I have a bad hair day and take a shot for no apparent reason.
I am constantly aware of an appeal to authority. If I must use a name for reference I try to show I understand what the reference source is talking about.
It would be nice if you’d at least make an effort to follow suit. I don’t mind you taking shots at me, in fact, I get a good laugh out of your insults. Would be nice if you’d accompany them with a minimal effort to show you understand what you are talking about, in your own words.
Robertson
” Not so, the evidence in my past posts reveal that 99% of the time I try to rebut with scientific evidence. ”
This is a pure lie, Robertson.
Apart from citations of Clausius (of course not the recent one at the apogee of his great work in 1887! the one of 1854…), you never rely to anything scientific, let alone would you rebut anything ‘with scientific evidence’.
*
You are a nobody related to science, manifestly suffering from a catastrophically oversized ego.
How else can one explain that you have the audacity to feel elevated above all the scientific knowledge of the last few centuries, and to claim, for example, that Newton, Einstein and many others were wrong?
And that only because you dare to think that your megatrivial, pseudoscientific ‘results’ are better than their eminent works you don’t even understand anything of!
You’re definitely insane, Robertson. Visit a neurologist before it’s too late.
entropic…”Theres global warming where I live.
https://www.bbc.co.uk/news/uk-northern-ireland-59489484 ”
***
According to UAH that’s not true. You had different heat domes hanging over you but it was far from global. In fact, you were right on the edge of them for some reason.
The MET office are alarmists and it seems, liars. Note that most of the planet has cooled or remained unchanged for November 2021, despite claims by lying alarmists that November was a record hot month.
Zoom in for detail.
https://www.nsstc.uah.edu/climate/2021/September2021/202109_Map.png
https://www.nsstc.uah.edu/climate/2021/october%202021/202110_Map.png
https://www.nsstc.uah.edu/climate/2021/November2021/202111_Map.png
C,mon, Gordo. Think.
EM does not live in the stratosphere.
Willard, please stop trolling.
Why the polar vortex is still active in Australia.
https://i.ibb.co/Nxyw0jT/mimictpw-ausf-latest.gif
Re-posting…lost my place.
maguff…”You dont understand anything do you? Water is a polar molecule which means it has a permanent dipole, whereas CO2 for example has a vibration-induced dipole, and thus H2O is much more IR active than CO2″.
***
I am not discussing this with you, I am revealing to others how abysmally ignorant you are on the subject.
Where do the vibrations come from? Do you think in your abysmal ignorance this is like an unbalanced flywheel?
The vibrations come from the interaction of +ve and -ve charges between the protons in the nucleus and electrons. Also, vibration is caused by any charges close to each other. Remember, +ve charges repel each other as do -ve charges.
In covalent bonds that sets up a natural vibration and since molecules are atoms bonded together, any time charges get close to each other they attract or repel. However, it’s not always a straight attraction/repulsion, the bonds tend to vibrate. Molecular vibration is usually bond vibration due to electrons.
At other times there is a -ve to -ve repulsion and at others a +ve to +ve repulsion. The shape of the molecule comes largely from the negative charges of the electrons. In a probability cloud where electrons are more likely to be found in a water molecule, the higher negative charge is nearer to the oxygen molecule.
And guess why? The oxygen atoms has far more electrons than the sole electron in the hydrogen atoms. The O2 electrons push the hydrogen atom off to a 104.45 degree angle. But they don’t just push them away, there is an inherent vibration in the bond shape. When water molecules interact with other water molecules there is a +ve to +ve interaction, which is weaker than the -ve to -ve and -ve to +ve interactions.
Vibration is all about charges.
In a molecule, there are other inter-atomic interactions that lead to vibration but its all about *ve and -ve charges.
No sir, I have no interest in discussing this with someone with your arrogance and stupidity. My input is merely to reveal the bs you are posting.
And, no, I did not misquote you. I quoted exactly what you said.
You are lying POS.
My original comment:
http://www.drroyspencer.com/2021/12/uah-global-temperature-update-for-november-2021-0-08-deg-c/#comment-1046237
How you quoted me:
http://www.drroyspencer.com/2021/12/uah-global-temperature-update-for-november-2021-0-08-deg-c/#comment-1046980
So no, he did not misquote you.
Gordo sure did, Kiddo.
*Automatic Response*
I have put Willard on ignore.
*Automatic Response*
DREMT is wrong as usual.
There was no misquote. Gordon said, "maguff…GR…" before the quote. GR is obviously Gordon Robertson. So he’s made us aware that what he is quoting comes from both Gordon and Tyson. It’s obvious from context who said what. Certainly there is no need to be calling anyone a "lying POS".
C’mon, Gordo hasn’t clearly identified who said what, and the lying part is what the evidence suggests.
… as there is also no need at all to name anyone a ‘blithering idiot’, a ‘braindead cult idiot’, let alone a ‘cheating SOB’.
Your are as usual blind on the ‘right eye’, DREMT, exactly like when you restrict your tedious
“Xxxx, please stop trolling’
always to the same group of persons, while carefulling omitting the others trolling exactly as much.
There was no misquote.
That’s where you’re wrong, Kiddo.
*Automatic Response*
I have put Willard on ignore.
*Automatic Response*
DREMT is wrong as usual.
There was no misquote. Talk about a fuss over nothing.
If ocean levels are rising, why can’t we see it?
https://youtu.be/WTRlSGKddJE
maguff…”If ocean levels are rising, why cant we see it?”
***
Why are these propaganda videos made by anonymous sources featuring an idiot who speaks like a British ponce?
In the video he refers to ‘respected’ scientific journals without acknowledging the journals are policed by climate alarmists who work hard to reject input by skeptical scientists.
Just ask Roy, or John Christy of UAH. John has the misfortune of having a paper he co-authored rejected for review by IPCC idiots. The paper had already been published, for cripes sake, but the idiot Phil Jones of Had-crut and his partner Keven Trenberth, both Coordinating Lead Authors with the power to reject papers had discussed in advance their desire to reject this paper. Trenberth had already forced a journal editor to resign over his interference in peer review.
When Richard Lindzen, MIT professor, called a journal to ask why there was a holdup in the publication of a paper, the editor told him essentially, the delay was related to his skeptical views.
Maguff, I am wondering how someone could become as naive as you.
Hey Dr. Spencer – just a heads up:
The link to Latest Global Temp. Anomaly up at the top takes one to the update page – it’s displaying the October graph. Just fyi.
It is the last entry in the blog heading
“Latest Global Temp. Anomaly (November ’21: +0.08C)”
that still leads to Oct’s data.
https://www.uah.edu/ resolves but not http://www.nsstc.uah.edu
And now it does
“True but not significant”
So true then.
“It certainly does not prove your on going subtext claiming that UAH is showing a long term cooling trend.”
I am purely observing what the data itself shows. Accurately as you have agreed.
Mind you, 5 to 6 years is not long term, except when compered to a year or a month.
“The data says that this year is lower than the last 5 to 6. That is a fact. ”
I did a quick check. You could have said the same in 1987, 1993-1987 and 2003-2015.
That is 17 years out of 43 and none of them was the start of a long term cooling trend.
Why do you expect 2021 to be different?
EM,
Saying that because something has occurred before, does not make it any less true.
Over the longest term possible, the Earth has cooled from a molten state to its present temperature. No cherry picking at all. The chaotic nature of Nature means that places like Antarctica can go from temperate to 4 km of ice, or that other places can go from temperate to arid deserts.
As to predicting the future, why do you expect that anybody can predict the future better than you can? Or a reasonably competent 12 year old, for that matter
Both you and a child can “predict” that the Sun will rise, that winter will be colder than summer, and that a particular aeroplane will reach its destination intact. Such “predictions” are pointless and useless.
Even the IPCC acknowledged that it is not possible to predict future climate states. I assume you believe you can, otherwise you would not be so determined to support the mythical CO2 “greenhouse effect”.
Your faith is strong, its factual basis not quite so strong.
If it is impossible to predict future temperature, why do you keep telling me that the future will be cooler?
But this year is not the coolest out of the last 5 or 6. That title belongs to 2018.
https://imgur.com/wwOqMJy
But if we get a VERY cold December 2021 could become the coldest year of the last 7.
barry…”But if we get a VERY cold December 2021 could become the coldest year of the last 7″.
***
I know we are a very small part of the world here in Vancouver, Canada, but December has started out ominously cold. The two week forecast calls for more of the same.
La Nina just kicked us with severe flooding due to rain blowing in from the Pacific, and the idiots in the Environment Canada Climate Change department have blamed it on climate change. We have one week of excess rain over the long term, and that constitutes climate change in their bewildered minds.
Now, the same La Nina is creating below average temperatures, aided by Arctic air. However, the Arctic air has not completely set in, we are just on the edge of it. When it sets in, you know it.
“But this year is not the coolest out of the last 5 or 6. That title belongs to 2018”
You allow a margin of error normally but when it become inconvenient you don’t.
This year (so far) is cooler by far than the majority of the last 6 years and the sixth is barely different. Happier now?
I think we’d all be happier with accurate reporting.
entropic…”Why do you expect 2021 to be different?”
***
Even the IPCC admitted that future climate states cannot be predicted. However, ENSO varies with the phase of the Pacific Decadal Oscillation. Recently, we have experienced far more El Ninos than La Ninas and although two years in a row of LNs is not proof of anything it COULD be indicating a change in phase of the PDO, leading to more LNs than ENs for a while.
Tsonis et al did a study in which they linked the phases of various ocean oscillations to warming/cooling. They did not say how long or how severe the changes in warming/cooling would last but they could produce another Little Ice Age.
Suppose the AMO, the PDO, the AO, ENSO, etc., go out of phase and things cool off. Could that produce an effect leading to 400 years of cooling? Of course, the opposite could prove true as well, like with the Medieval Warm Period, but maybe we just had that warming and it only lasted 150 years.
It is known that the LIA occurred in two stages over 400+ years. There were volcanic eruptions involved and solar minimums. What happens if a negative phase of the ocean oscillations aligns with volcanic activity and solar minima?
“What happens if a negative phase of the ocean oscillations aligns with volcanic activity and solar minima?”
You get extreme weather events. Heavy rain. Periods of extreme heat and cold. Unstable weather. Shorter Growing Seasons. All of which will directly impact crops. 2 – 4C global cooling. Ice advances. Sea levels drop. People will die in the billions.
Russia will invade Ukraine because they need the food security. Lots of other wars will break out for similar reasons. Breakdown in global trade.
Gordon Robertson
“Even the IPCC admitted that future climate states cannot be predicted. ”
If prediction is impossible, why do presume to predict cooling?
To offset your predicted warming?
I’m not the one saying that it is “impossible to predict the future behaviour of the system.” Nor am I the one predicting warming; I am the one projecting warming.
I’m a great believer in precise language, so let’s try another attempt to educate RLH and Gordon.
A prediction is a precise statement. “The global average temperature anomaly in 2050 will be 1.8C. ”
A projection is a conditional estimate. “If CO2 emissions follow this pattern over the next thirty years and other factors vary thus, the global average temperature will probably be between 1.7Cand 1.9C.
See the difference. A projection is a definite number. A projection is a probability.
It is impossible to precisely predict a future temperature. It is possible to project the probable range in which the future temperature will be.
The tide goes up and down predictably. Its a cycle.
The 4 seasons pass every year. Its a cycle.
We know there are cycles in ocean currents and on the sun.
The geological proxy data is pretty clear there are cycles in the climate.
Its hard to sort the effect of one cycle away from the other but if you have enough data Fourier Transform can separate out the cycles.
The addition of cycles is easy enough to see when you go to the beach. There will be a series of waves. One or two of the waves will be significantly larger than others and one or two waves will be significantly smaller than others.
So that addition of ocean and solar cycles, particularly the larger cycles that take decades and centuries to take place, also applies to warming and cooling cycles.
There are several prominent scientists who have warned of imminent cooling. Their argument are rather more compelling than the AGW hypothesis. So I presume to predict cooling.
IPCC is wrong because they look only at CO2. CO2 is not a factor in any cycle. Further, I think they are willfully wrong; anything UN has a political agenda.
Ent is a “great believer in precise language”. That’s why he gets so confused with his own words: “A projection is a definite number. A projection is a probability.”
He’s also a “great believer” in the AGW nonsense, and that passenger jets fly backwards.
Beliefs ain’t science.
Clint R
Thanks for spotting the typo.
It should, of course, have been
“See the difference. A prediction is a definite number. A projection is a probability.”
Ken
Could you link to a list of the cycles involved; their periods, amplitudes and current phases.
I’d also like to see an analysis of their combined effect in the recent past and into the future.
Are you familiar with the Camp Century cycles?
Have you read William Burrough’s book on climate cycles?
https://www.cambridge.org/core/books/weather-cycles/124AE7B1DFA087E0308D2A38F7AFBF9D
“Could you link to a list of the cycles involved; their periods, amplitudes and current phases.
I’d also like to see an analysis of their combined effect in the recent past and into the future.”
Here is Carl Otto Weiss making a presentation ‘Climate change is due to natural cycles’: https://schillerinstitute.com/media/carl-otto-weiss-le-changement-climatique-est-du-a-des-cycles-naturels/
“The tide goes up and down predictably. Its a cycle.”
There goes a man who has never had to predict if a boat will clear a bar at the entrance to a harbor. Sure tides go up and down on a cycle but the precise measurement is not as easy to determine.
To offset your projected warming?
I saw upthread Bindidon making one of his snarky comments about the Moon issue he doesn’t understand. It’s coming up on two years that he has been in full denial of reality. He clings to astrology from over 300 years ago. He doesn’t understand orbital motion, or any science it seems. And he can’t learn.
For those without a physics background, the simple analogy of a ball-on-a-string explains “orbital motion without axial rotation”. For those with a physics background, an analysis of the vectors explains it.
You have to be a braindead cult idiot to reject reality.
You are the braindead idiot who rejects reality.
rlh…”You are the braindead idiot who rejects reality”.
***
It’s sad that someone like you with a masters degree, and the ability to be in touch with intelligence, resorts to dismissing science without providing any scientific argument to backup his dismissal.
Intelligence is not something that a person has, or that can be owned. Intelligence is transient in that it can be blocked by conditioning. We all have access to intelligence but in your reply to Clint, you have opted to block it while resorting to a conditioning related to an appeal to authority.
Sad.
Refusing to accept good and well accepted science is what you and Clint both have in common it seems.
I use his own words to reflect his stupidity.
The cult meltdown continues.
They lost the Moon issue as it was revealed they don’t understand any of the physics involved. They lost the AGW issue because they can’t identify how the atmosphere can warm the surface. They throw stuff against the wall, like the “real 255K surface” nonsense, hoping something will stick. Fail….
But, it gets even worse for them. Now UAH global has dropped to 0.08C!!!
That’s why this is so much fun.
It is you who do not accept and distort the science.
RLH continues his meltdown. He claimed he understood vectors, but he can’t solve the simple problem.
He got caught again.
As I have said, I deal with adding and subtracting vectors all the time. So far I have been quite good at it.
I also deal with large free floating masses all the time and well understand inertia, acceleration, etc. that those inevitably bring.
RLH claimed he understood vectors, but he can’t solve the simple problem.
He’s all troll, no science.
I understand vectors quite well thanks despite your claims otherwise.
I just took some minutes to get the top 10 of the plummeting temps from month to month in UAH, and see, OMG:
2013 2: 0.34
1984 9: 0.33
2021 11: 0.29
2001 9: 0.29
1983 6: 0.29
2007 2: 0.26
1988 10: 0.26
2020 12: 0.25
2017 11: 0.25
2000 1: 0.25
I tell you: Grrrrand Cooooling Aheadddd!
Maintenant, il est temps d’aller au lit!
Binny,
You wrote –
“I tell you: Grrrrand Cooooling Aheadddd!”
Ah, you claim to be able to predict the future! I don’t believe you. Faith will not overcome fact.
Maybe you could try sarcasm. Do you think ignoring reality will make it go away?
The reality is that the future is unknowable – unless you are a climate crackpot, of course.
binny…”I tell you: Grrrrand Cooooling Aheadddd!”
***
I have seen no one on this blog predict a certain amount of cooling, what we skeptics are asking is “Where’s the predicted warming”?
In the past 20+ years since 1998, when the trend broke through the baseline with a bang, the trend has become essentially flat. There was another climate Big Bang in 2016, but since then we have descended slowly to the baseline again.
All in all, I think we can claim 20+ years of no average warming. I hope it doesn’t cool to any extent,I just don’t see any evidence of anthropogenic warming, now, or in the past 20+ years.
Gordon Robertson
“All in all, I think we can claim 20+ years of no average warming. ”
https://www.woodfortrees.org/plot/uah6/from:2001/to:2022/every/plot/uah6/from:2001/to:2022/every/trend
I think not. That,’s a linear trend of 0.18C/decade for the last two decades.
Linear trends are the ultimate in low pass filters. Using infinity does not make things clearer.
Perhaps you could try a polynomial?
I suspect you would find that the rate of change is accelerating.
Polynomials are another ‘infinity’ based construct. Try fitting a polynomial to a sine wave.
“I have seen no one on this blog predict a certain amount of cooling”
Then you have been spectacularly blind.
Scott R: “… happy to publically post my forecast of -0.2 on UAH within 5 years right here on this blog.”
Salvatore del Prete (in 2011, no less): “… The trend downward is continuing and this is going to go on for years in a irregular pattern.”
Samurai: “… the PDO, AMO, NAO, and AOO will all soon be entering their respective 30-year ocean cool cycles, and a 50-year Grand Solar Minimum event already started this year, which will all contribute to causing a 30-year global cooling trend.”
Salvatore: “… 2016 will not be s warm as 2015, and 2017 will not be as warm as 2016.”
I’ve saved a small list of entries like this from this blog. There have been literally hundreds, if not thousands, of cooling predictions made on this blog. I’ve got 10 just from Salvatore, and that’s not a fraction of the amount of cooling predictions he’s given out just by himself. You will no doubt soon see Eben predicting cooling again – or maybe you really can’t see these regular, all too familiar posts.
barry
Thanks, I pretty good recall Salvatore del Prete, who, after having been disappointed so many years by the Globe falsifying his ‘predictions’, now might have a big come back soon…
Eben clearly needs more support.
It is odd how Hansen’s 1988 prediction over a 30 year period was off by maybe a tenth of a degree (if that) and it has been described as “completely wrong”, “utter failure”, “debacle”, etc. Yet when contrarians make predictions that are so astonishingly bad that they can’t even get the direction of the temperature change correct over a few years time they are considered brilliant and held up as fine examples of how climate science predictions could be improved if only scientists were smart enough to listen to them.
German has a lot of nice idioms fitting to a whole panoply of situations.
Best fit here: ‘bierernst’.
And by the way, we see here again that most ignoramuses are blind on the ‘right’ eye.
maguff…”You are lying POS”.
***
Maguff goes into a red-herring meltdown. He tries to divert attention from his ignorance of science by claiming I misquoted him. My quote had nothing to to do with anything, it was a simple reference to what he wrote.
Where have we seen this before? Ah, yes. In the hockey stick investigation both NAS and statistics expert Wegmann were appointed by the US government to investigate MBH 98, the paper from the authors of the hockey stick.
When Wegmann filed his report, seriously harming MBH and claiming a nepotic relationship between Mann and Chapter 9 of the IPCC review structure, Bradley of MBH claimed Wegmann had plagiarized him by quoting his work in his report.
Excuse me? Wegmann is investigating his work, uses a quote from his work, and that is plagiarism? Bradley ignores the fact that MBH have just been scewered as incompetent statisticians, by an expert statistician, and rather than defend their work they cry foul re plagiarism? Losers!!!
In a similar manner, I make a fool of Maguff by revealing his abysmal ignorance of molecular structure and he comes back at me with a red-herring argument that I misquoted him.
I did not, he claimed molecules can vibrate by some hidden mechanism and arrogantly insisted I needed to study the basics of molecular theory. When I revealed his utter stupidity and ignorance about molecules he called me a POS for misquoting him.
I think maguff is not only emotionally unstable, he suffers from delusions about his competency in science. Then again, the entire field involving climate alarmists are emotionally unstable. That says nothing about the politicians who rely on these twits.
> red-herring
C’mon, Gordo. You keep using these words. They do not mean what you make them mean.
You indeed claim that “There is no such thing as a molecular vibration.” Which means you still are saying stuff:
https://scholar.google.com/scholar?hl=fr&as_sdt=0%2C5&q=molecular+vibration&btnG=
Research. Then think.
willard…”You indeed claim that “There is no such thing as a molecular vibration.” Which means you still are saying stuff:”
***
I have made my position clear. The word ‘molecule’ is nothing more than a name for an aggregation of atomic nucleii and the electrons that bond them together. Speaking of a molecule as having properties besides those of the nucleii and the electrons is plain stupid.
However we need to name each molecule based on the elements that make it up and the manner in which the atomic nucleii are joined by shared electrons, or in the case of ionic bonds, in the shared charges. Also, we need to classify molecules based on their energy levels, etc. Obviously each atom in a molecule adds energy.
When people claim that a molecule vibrates, they mean the structure of electrons and nucleii vibrate. And that vibration is related mainly to the bonding electrons, since it is the bonds they form that vibrate and rotate.
The bonding electrons are also subject to the laws of quantum theory posited by Bohr in 1913. That means only the electrons absorb and emit EM. There is no mysterious black box in a molecule emitting and absorbing EM, it is the electrons in the atoms, not only the bonding electrons but all electrons within the atoms. Therefore, when a molecule is said to absorb or emit EM, especially related to vibration or rotation, it is actually the electrons related to the nucleii that are radiating and emitting EM.
Look…EM = ‘electro’ – ‘magnetic’ energy and it just so happens that electrons radiate an electric and magnetic field when they move, whether through free air or in transitions between atomic orbital levels. It’s a no-brainer where EM comes from.
I have the same argument with the use of the word energy or the phrase kinetic energy. We know nothing about energy, only that it operates via different mechanisms. All we can do is observe and measure the effect energy has on mass.
When that energy is in motion, we call it kinetic energy and that applies to all forms of energy. That means energies we know nothing about are moving, therefore, there is nothing magical about the phrase kinetic energy. However, one form of energy, heat, is closely related to kinetic energy, it is the KE of atoms.
Climate alarmists try to deflect attention to that truth by changing the word ‘heat, to the word ‘energy’. Then they claim the 2nd law can be satisfied if a mystical ‘balance of energy’ is positive. In that manner, alarmists can claim that heat can be transferred from a cooler atmosphere to a warmer surface, without using the word heat.
If they use the word heat, as in heat transfer, then the 2nd law must apply. That means heat can never, by its own means, be transferred cold to hot, as the AGW theory implies. Alarmists get around that by calling heat ‘energy’, which is a mysterious inference that heat and electromagnetic energy are one and the same, and that by unscrupulously adding them to get a ‘net energy’, they claim incorrectly that the 2nd law is satisfied, even though heat is being transferred cold to hot, by its own means.
The 2nd law applies only to heat and any ‘net’ must be a summation of heat quantities. In that context, heat can only be transferred, by its own means, from hot to cold.
AGW kaput!!!
> I have made my position clear.
C’mon, Gordo. That’s not a position, it’s a rant.
“Molecular vibration” occurs in more than 35K papers.
You’re not Humpty Dumpty. Not even Dumbty. That’s Kiddo.
willard…”Molecular vibration occurs in more than 35K papers”.
***
You don’t have the intelligence to discuss this Willard. Better to go play with your cat.
C’mon, Gordo:
https://en.wikipedia.org/wiki/Molecular_vibration
There’s even a Wiki entry on the concept you deny exists.
Think.
Willard, please stop trolling.
> Wegmann is investigating his work, uses a quote from his work, and that is plagiarism?
C’mon, Gordo:
https://neverendingaudit.tumblr.com/tagged/WegmanHoax
If you can’t even spell Ed’s name properly, you should not go there.
Think.
willard…this is nothing more than a collection of whines. One of them asks if the Wegman report was peer reviewed. Is that the kind of insanity that pervades your mind? Since when does an expert investigator report require peer review?
Wegman was appointed by the US government to investigate a report by Canadians McIntyre and McKitrick that they found serious errors in the statistical methods used in the hockey stick report. It was not easy for M&M, who were ignored by alarmist Susan Solomon of the IPCC to the point she became exasperated and passed it on to the government. Solomon actually ordered Chapter 9 to investigate and they ignored her. Chapter 9, run by Mann’s buddies, ignored her.
The IPCC is run by climate alarmists and getting any kind of investigation going is wrought with problems. That did not prevent M&M from persisting till a real investigation was performed. Good for them.
The National Academy of Science did part of the investigation and they went easy on MBE98. They limited their 1000 year range to 400 years and disqualified their entire 20th century tree proxies, rendering their conclusions meaningless, since there was no blade for the hockey stick.
The IPCC immediately abandoned the hockey stick, limiting it from 1850 onward, then re-drawing it with so many error bars it became known as the spaghetti graph. They re-instituted the Little Ice Age and the Medieval Warm Period that Mann et al had obliterated.
Since then, apologist deniers have stepped forward trying to prop up MBE with red-herring arguments. Your link points to one of the worst of them.
I have heard all the whines, which amount to nothing more than red-herring arguments that bypass the obvious, that MBE98 was seriously flawed and their 1990’s unprecedented warming over the past 1000 years was a lie.
> One of them asks
C’mon, Gordon. Your throat clearing is getting silly.
It’s MBH. It was published in 1999. The Wegman Report has been asked by Barton. It was a political hit job. And it failed. Ed did not audit the Auditor’s work. He hired students to write his report. They patch wrote it. Worse than your comments if possible.
Here’s a cookie.
https://statmodeling.stat.columbia.edu/2011/06/08/further_wegman/
At least get your facts straight. Better, think.
willard…”At least get your facts straight”.
***
Better check with the IPCC. They dropped the hockey stick graph and its associations like a hot potato after NAS and Wegman got through debunking it.
You live in an alarmist dreamland, Willard, always making excuses for the political, alarmist liars/propagandists.
The evidence is clear, Mann et al tried to prove unprecedented warming for 1000 years and failed miserably. When Mann was asked why he replaced declining proxy temperatures in the 1960s with real data he claimed that was kosher.
That’s Mann’s ‘trick’ Willard, ‘hide the decline’. The head of Had-crut, Phil Jones, bragged in the Climategate emails about using Mann’s trick. Of course, he did not realize anyone else would ever see his chicanery.
When Jones was investigated by a tribunal made up of his supporters, none of that chicanery was allowed into the hearing. The guy who could do the most damage, Steve McIntyre, was not allowed to testify.
You support a load of alarmist shysters, Willard.
willard…”At least get your facts straight”.
***
Better check with the IPCC. They dropped the hockey stick graph and its associations like a hot potato after NAS and Wegman got through debunking it.
You live in an alarmist dreamland, Willard, always making excuses for the political, alarmist liars/propagandists.
The evidence is clear, Mann et al tried to prove unprecedented warming for 1000 years and failed miserably. When Mann was asked why he replaced declining proxy temperatures in the 1960s with real data he claimed that was kosher.
That’s Mann’s ‘trick’ Willard, ‘hide the decline’. The head of Had-crut, Phil Jones, bragged in the Climategate emails about using Mann’s trick. Of course, he did not realize anyone else would ever see his chicanery.
When Jones was investigated by a tribunal made up of his supporters, none of that chicanery was allowed into the hearing. The guy who could do the most damage, Steve McIntyre, was not allowed to testify.
You support a load of alarmist sh.y.ters, Willard.
> They dropped the hockey stick graph
C’mon, Gordo:
https://www.ipcc.ch/report/ar6/wg1/downloads/report/IPCC_AR6_WGI_Full_Report.pdf
You have one chance to retract that porky.
Think.
> [The Auditor] was not allowed to testify.
Another porky:
https://publications.parliament.uk/pa/cm200910/cmselect/cmsctech/memo/climatedata/uc3202.htm
I’m starting to think you’re just a monomaniacal mythomaniac, Gordo.
W
That wasn’t a long absence. Things were bland without you. There wasn’t the, how you say, pizazz.
Pozzo, my little personal sock puppet,
Nay not worry, I won’t be away for long.
Ta.
Gordon’s butchery of facts continues unabated.
“They dropped the hockey stick graph and its associations like a hot potato”
As soon as the same team updated their work the IPCC went with the improved version. That’s how science works. MBH reconstructions are still in the IPCC to this day. And they now include the Southern Hemisphere – small wonder the IPCC went with fully global reconstructions as they became available.
And the multitude of global and NH reconstructions since 1999 tell much the same story as the original MBH reconstruction of the past 1000 years of surface temperatures.
Yes, Wegman’s report was plagiarised, as was his follow-up paper on paleoclimatologists’ social networks, which was ultimately retracted. There are more insightful criticisms of MBH98/99 than Wegman’s effort.
There has been much made about how much of the global warming has been mitigated by heat transfer into the oceans. Does not the same thing take place between the land and the atmosphere?
So then, why do we only keep track of global atmospheric temperatures when the ground has by far the greatest heat capacity?
Has anyone got a dataset of historic ground temperatures at varying depths? If so, I would expect the data to be much more damped than the atmospheric temperature data, and it should show long term trends more clearly.
keijo…”Has anyone got a dataset of historic ground temperatures at varying depths? ”
***
You raise an excellent point but climate alarmists and their government bosses don’t care about science. They have some religious-based belief they are right and they are determined to leave us all freezing in the dark.
There you go.
“https://www.ncei.noaa.gov/products/paleoclimatology/borehole”
And what the borehole data can tell you.
https://www.e-education.psu.edu/earth103/node/752
Sun warms the surface, that’s science. The atmosphere warming the surface is “beliefs”.
Beliefs ain’t science.
https://b-ok.cc/book/814256/60b49f
EM,
You really should read before linking.
From your link –
“In our case, for distance, we are talking about depth in the Earth, and the center of the Earth is very hot — about 5000°C. The surface, instead, is quite cool at 15°C, so heat from the Earth tends to flow out to the surface, and this process is cooling the Earth very slowly.”
Gee. Even your appeals to authority support me.
Unfortunately, they also believe in some physical impossibilities, so no wonder you link to them.
“Sun warms the surface, thats science. The atmosphere warming the surface is ‘beliefs’.
Beliefs aint science.”
Optics IS science.
Atmospheric physics IS science.
Heat transfer physics IS science.
Science is still science, even if Clint doesnt believe in it.
Troll Nate, false accusations aim’r science.
Schuckmann et al. 2020 is relevant to your question.
https://essd.copernicus.org/articles/12/2013/2020/
The same thing takes place with the land and cryopshere.
The very first sentence of the abstract tells us it’s all going to be nonsense: “Human-induced atmospheric composition changes cause a radiative imbalance at the top of the atmosphere which is driving global warming.”
Beliefs ain’t science.
Scientific knowledge is a bunch of justified beliefs, Pup.
Do the Pole Dance Experiment.
“Scientific knowledge” must be observed, measured, verified, demonstrated, and repeatable. Worthless trolls like you wouldn’t even know where to start.
That rules out much if not all you have said then.
Dear Pup,
Your “observed, measured, verified, demonstrated, and repeatable” all refer to justifications. Just as I said.
Just make sure you go slow on the “demonstrated” part, as empirical sciences ain’t no geometry.
I like it when you’re in violent agreement with me.
Worthless trolls like you wouldn’t even know where to start.
I would start here, Pup:
https://www.drroyspencer.com/2021/12/uah-global-temperature-update-for-november-2021-0-08-deg-c/#comment-1051128
If you prefer:
https://climateball.net/but-science/
Plato already anticipated your move!
See, you worthless trolls don’t have a clue.
You’re the troll, Pup. In fact you’re the lowest of them all.
A silly sock puppet.
Do the Poll Dance Experiment.
Wrong, Dud.
You troll here all the time, with NOTHING. You’re worse than Norman. At least he tries to fake a knowledge of science. You can’t spell the word. You can’t even spell “pole”.
All you offer is your adolescent puppet-dancing nonsense.
You’re a worthless troll that will continue here endlessly, unless I break it off.
Someone has to be the adult in the room.
Clint R
Your unwanted of opinion of me is rejected. Go pound sand up your ass. You are a complete dick of a person and I have nothing more to discuss with you.
Interesting meltdown, Norman. You no longer attempt to fake a knowledge of science. You no longer link to things you don’t understand.
Just pure meltdown. I like it.
Also, your obsession with my body parts should concern you, if you were not a pervert.
For your own good, Pup, you really should stop pontificating about science. For you have NOTHING to say about that.
Do the POLE Dance Experiment.
And Norman, does this final meltdown mean you concede that there is no “real 255K surface”?
It’s kinda like nothing is working for you, huh?
Clint R
Kind of like I don’t want to talk with someone as sick mentally as you are. Yes I have not only one REAL sister, asshole, I have two and my older sister was fairly ill from Covid and was in the hospital. My younger sister had milder symptoms of losing taste and smell for a couple weeks. I also had Covid. You need a life you are so mental. I guess your goal in life is to be a continuous idiot.
Barf out more idiot words, post more stupid thoughts. Or raise the intelligence of this blog several points by no longer posting here.
Again you are very stupid and childish. Not sure what your actual age is but you act like a five-year-old.
Norman, you “have nothing more to discuss”, then you start one of your mindless rants.
You can’t get anything right.
Do the POLL Dance Experiment, PUP.
Maybe a more common sense approach would help.
Consider a sealed glass stovetop where the element is below some glass.
It is turned on to high, so that you can see the element glowing bright red.
At a point above the surface you measure the radiation emitted.
Is it all coming from the same surface?
Or is some of it coming from the element and some coming from the glass?
If you don’t have any common sense, let me put your hand on the glass and you tell me if it is hot or not.
Dumbasses will be dumbasses, there’s no point.
But it is funny.
The glass stovetop is a “real surface”, braindead bob. (Notice I can give a simple and direct answer.)
Now, where’s your “real 255K surface”?
You missed the point Clint R,
All the radiation isn’t coming from the glass surface.
Poof, there goes another one.
The “point”, braindead bob, is that you have no “real 255K surface”. You’ve got NOTHING.
You won’t understand the physics, so you can ignore the rest of this comment.
The glass is emitting IR, as it warms a pot or pan by conduction. The glass is a “real surface”. Visible wavelengths pass through glass. The burner warms the glasstop, and the glasstop warms the cooking equipment. An easy test is to turn the burner off and notice the glasstop continues to emit.
The glasstol is a REAL surface. There is no such thing as your “real 255K surface”.
You continue to miss the point Clint R
All the radiation coming from the Earth is not coming from a “surface”
Just like all the radiation coming from the stovetop is not coming from the glass surface, some of it is coming through the glass surface from the heating element below.
You just can’t understand the simple facts.
There is no requirement for there to be a real surface to have a measurable temperature.
Sorry you don’t understand
Somebody alert Bindiclown it is snowing in Germoney
https://www.drroyspencer.com/2021/11/uah-global-temperature-update-for-october-20210-37-deg-c/#comment-1037467
Oh thanks Eben for reminding me that yesterday we indeed got the very first snow this year.
We had terrible amounts: a bit less than 2 cm here and there.
Of course, I’m fully aware that elsewhere in our good ol’ Germoney, there will be a lot of corners with real snowfall.
*
Btw, Eben: it’s pretty pretty cold in Lapony aka Sami land:
https://tinyurl.com/3ar7tutc
Yesterday, -35 C in Karasjok (Norway), -40 today in Namaikka (Sweden).
But… for those who might think the Globe is cooling because of such temperatures, just a hint: when it doesn’t get cold in Lapony end of November the latest, something is ‘plain wrong’ there.
Here are, for the recent past, a few GHCN daily outputs from stations in Norway, Sweden, Finland, all above 65N and between Tromsö and Murmansk:
https://www.google.com/maps/@68.5582348,25.7029524,6z?hl=en
FIE00146543 63-82 2013 12 9 -39.7
SWE00140958 63-80 2013 12 9 -39.7
SWE00140960 63-80 2013 12 9 -39.4
NOE00111336 63-81 2013 12 9 -39.2
SWE00137440 63-80 2013 12 9 -39.1
SWE00137440 63-80 2013 12 8 -38.7
FIE00146543 63-82 2013 12 8 -38.4
SWE00140958 63-80 2013 12 8 -38.2
FIE00146508 63-82 2002 11 29 -38.0
FIE00146508 63-82 2013 12 9 -37.9
FIM00002801 63-80 2013 12 9 -37.7
And for even more recent years. a bit warmer:
NOE00111327 63-81 2016 12 4 -35.8
FIE00146762 63-82 2019 12 9 -35.4
NOE00105498 63-82 2016 12 4 -34.9
SWE00140960 63-80 2016 12 4 -34.9
NOE00105498 63-82 2019 12 9 -34.7
SWE00140958 63-80 2016 12 4 -34.7
NOE00105498 63-82 2016 12 6 -34.5
NOE00111327 63-81 2016 12 6 -34.4
NOE00111336 63-81 2016 12 4 -34.2
FIE00146762 63-82 2016 12 4 -34.0
But for 2020, the lowest temperature was definitely too warm there:
NOE00111327 63-81 2020 12 8 -23.3
Of course: many stations in the corner had far colder temperatures during the XXth century.
The Sami folks therefore sure won’t fear a bit about 2021 becoming cold again.
And we enjoy… this:
https://tinyurl.com/4sfwf876
Bye bye, Ebengenius!
Bindidong totally triggered by his once again failed forecast starts posting rows of numbers as if it is going to make the snowfall disappear
https://youtu.be/yZWX4c1mXpc
You can write your stubborn blah blah as long as you want.
The only result is that you appear here more and more as a duplicate of the other ignoramus Clint R.
Your permanent ranting against my wrong La Nina impression I have admitted months ago, looks perfectly like his ‘ball-on-a-string’.
Again: we have NO SNOW AT ALL where I live, and about 5 C above mean, basta ya!
Bindidon, when you don’t understand La Niña and the simple ball-on-a-string analogy, you don’t understand much about science.
Do you even know what snow is?
He lives in different Germany , where it never snows
Eben
” He lives in different Germany , where it never snows ”
The Germans call such a sentence “German humor” (i.e. none).
*
I repeat: our last winter deserving that name was in 2010.
In that year, we had – for our region, here is not Montana – plenty of snow (many times 20-30 cm, and lots of snow shoveling on the sidewalk).
Since then, like boastful bloggers use to say: not much more than zero, nada, zilch.
*
Btw… You can’t stop ridiculing me about La Nina but the prediction about Western and Northern Europe you posted a week ago was laughable as well.
Extremely cold in Lapony, -35/-40 C at the end of November! So what. I know you don’t like to look at the past, but…
FIE00146508 63-82 2002 11 29 -38.0
NOE00111327 63-81 2002 11 29 -37.5
NO000097250 63-82 2002 11 29 -37.0
RSM00022106 63-84 2002 11 30 -36.6
FIE00146508 63-82 2002 11 28 -36.1
One day, you will come along with a post about ‘Horribly cold in Siberia’ with -50 C at the Werchojansk station in January.
Regardless of what our resident, most verbose, pseudo-scientist believes (I’m looking at you GR):
Basic Chemistry. If you don’t understand what MCGuffin wrote then you don’t have the basic knowledge needed to discuss anything here.
That looks like a misplaced comment :- )
TM,
Some idiot wrote – “This is why carbon dioxide absorbs and emits infrared (IR) radiation, while nitrogen and oxygen molecules do not.”, and you were stupid (or deluded) enough to believe.
All matter above absolute zero radiates IR. And guess what – all matter absorbs IR. Some better than others.
Sure, some molecules can be made to vibrate, through various mechanisms. Piano strings, wineglasses, vocal cords can also be made to vibrate. Just like molecules, they don’t spontaneously vibrate. This is just silly.
Maybe you should choose to appeal to authority.
” Some idiot wrote ‘This is why carbon dioxide absorbs and emits infrared (IR) radiation, while nitrogen and oxygen molecules do not.’, and you were stupid (or deluded) enough to believe.
All matter above absolute zero radiates IR. And guess what all matter absorbs IR. Some better than others. ”
*
As always, Flynnson manages to be even a bit more ignorant than his pseudoskeptic mate-in-chief Robertson.
When considering all gases’ wrt their atmospheric abundance, trace gases like H2O and CO2 absorb and reemit IR way by dimensions better than N2 and O2.
CO2 vs N2: 2.5E+12
CO2 vs O2: 3.3E+7
H2O vs N2: 1.0E+12
H2O vs O2: 1.3E+7
*
Yes, Flynnson.
Putting CO2 between a thermometer and the Sun makes the thermometer hotter, doesn’it?
There is only one guy who is ‘stupid (or deluded)’ enough to believe what Contrarians say: you.
Bindidon, what is this nonsense, “CO2 vs N2: 2.5E+12”?
Where did you get it? What do you believe it means?
Binny,
You wrote –
“Putting CO2 between a thermometer and the Sun makes the thermometer hotter, doesnit?”
No. Don’t be stupid. Reducing the amount of radiation reaching a thermometer reduces the temperature of the thermometer.
What has your bizarre remark to do with my statement that all matter above absolute aero radiates IR? Nothing at all?
By the way, removing the CO2 from a sample of air changes its temperature not one iota. The air continues merrily radiating just as much IR as ever. A clever experimenter named John Tyndall showed just this, more than a hundred years ago.
Carry on with your delusional thinking. If you run short on fact, maybe you could try irrelevant diversions, appeals to irrelevant authority, or even feeble attempts at sarcasm or gratuitous insults!
It’s hard to imagine how people like the one currently nicknamed ‘Swenson’ can believe we would here be all so dumb that we wouldn’t be able to search, within all threads posted by Roy Spencer since beginning of 2018, for sentences like
” Do you think that putting CO2 between a thermometer and the Sun makes the thermometer hotter? ”
and see that Swenson and Flynn are exactly the same person.
Bindidon, what is this nonsense, “CO2 vs N2: 2.5E+12”?
What do you believe it means? Where did you get it?
” Bindidon, what is this nonsense, “CO2 vs N2: 2.5E+12”? ”
This is the difference, for CO2 and N2, of their ability to absorb and reemit IR at an latitude of 10 km, of course by taking into account their respective abundance in the atmosphere.
N2 is nearly as inert wrt IR as is argon.
Everything what you either don’t understand or accept is for you automatically nonsense.
What is your source for that nonsense?
How are you measuring ability to absorb at 10km “latitude”?
Do you have any clue what you’re talking about?
Gordon Robertson at 9:06 PM
http://www.drroyspencer.com/2021/12/uah-global-temperature-update-for-november-2021-0-08-deg-c/#comment-1049471
”… he claimed molecules can vibrate by some hidden mechanism and arrogantly insisted I needed to study the basics of molecular theory.”
I would suggest that you study the theory of molecular vibrational states; and being the quintessential anachronism that you are, may I recommend:
INTRODUCTION TO QUANTUM MECHANICS With Applications to Chemistry. By Pauling and Wilson, McGRAW-HILL, 1935.
When you are ready to come into the 21st century, start by spending a few minutes with Professor Field in this video: https://www.youtube.com/watch?v=_iSqhxWjkq8.
Study hard!
TM,
You are confused. As are many people who should know better.
About as ignorant of reality as those who insist that CO2 can only emit radiation of certain specific frequencies. These types do not understand the interaction between light, (radiation at all frequencies), and matter.
Go away and understand that to which you refer.
Your opinion is duly noted.
TM,
Statements of fact, plus a direction.
Disbelieve one, and ignore the other, as you wish.
The facts don’t care what either one of us opines. I’m content with that. How about you?
If you find my comments objectionable, please call this number to complain: 1-800-EAT-SHIT.
TM,
Why should I find your comments objectionable? Are you powerful and important?
No, just another anonymous delusional climate crackpot. I generally decline to feel offended, upset, or annoyed by anonymous climate crackpots. I am surprised that you think I would accord your comments sufficient worth to find them objectionable.
Maybe you have a higher opinion of your importance than I do.
Carry on.
Alternatively, you can text AND_DIE to 1-800-EAT-SHIT.
Welcome to “meltdown”, TM.
You’ve got a lot of company.
funny man!
Earlier, Wonky Wee Willy Willard wrote –
“I’m starting to think . . . “.
I find that hard to believe, although sometimes previously unthinkable things have happened.
I hope that Wee Willy’s epiphany will bear fruit for him.
Mike Flynn,
Merry Festivus,
Merry Festivus!
Cheers.
Weary Wee Willy claimed that he had started to think.
I found it hard to believe.
Judging by his comment, my finding stands.
Mike Flynn,
Merry Festivus,
To think and to think of something are two different usages.
One is transitive, the other is not.
Tis the season!
Oh! Oh! Oh!
Wee Willy Wanker,
And you do neither with any competence, by the look of your comments.
I see another episode of self-abuse ended satisfactorily for you, judging by the “Oh! Oh! Oh!”
An interesting ejaculation, in both senses of the word, I suppose.
Maybe you should concentrate on what you do well.
Ho! Ho! Ho!
Mike Flynn,
Mike Flynn everyone!
*The crowd cheers.*
And justly so, even if they are equally as delusional as you.
Who is Mike Flynn?
Mike Flynn,
Mike Flynn,
You ask-
“Who is Mike Flynn?”
You are:
http://www.drroyspencer.com/2019/01/if-the-polar-vortex-is-due-to-global-warming-why-are-u-s-cold-waves-decreasing/
Cheers.
swenson…”Weary Wee Willy claimed that he had started to think”.
***
That could prove dangerous. Might set off a chain-reaction andinfect other alarmists.
Blizzard over Hawaii! Beaches full of snow!
The day after tomorrow is coming soon.
{/sarc}
Standard response of climate crackpot short on facts –
“Go pound sand up your ass. You are a complete dick of a person and I have nothing more to discuss with you.”
Well done, Norman. Very mature and rational to a climate crank, I suppose. Were you fragile enough to allow yourself to be offended or upset by words from an anonymous person?
Are all climate cranks so emotionally retarded?
swenson…”Standard response of climate crackpot short on facts ”
***
The alarmists have potty mouths and a complete disrespect for Roy. Maguff has gone into hysterics against both of us, using foul language in a display of his inability to discuss science. rationally.
–2 Dec, 2021
US LNG exports hit record highs as global gas crunch persists
Author Corey Paul
Natural gas deliveries to U.S. LNG export terminals surged to record levels in the waning days of November, topping 12 Bcf/d as strong global gas demand continued to incentivize operators to run their facilities at full bore.–
https://wattsupwiththat.com/2021/12/06/us-lng-exports-hit-new-record-highs/
Interesting article
Earlier, Wee Willy Willard wrote –
“C’mon, Gordo:
https://en.wikipedia.org/wiki/Molecular_vibration
There’s even a Wiki entry on the concept you deny exists.
Think.”
From Wikipedia –
“A molecular vibration is excited when the molecule absorbs energy, ΔE, corresponding to the vibration’s frequency, ν, according to the relation ΔE = hν, where h is Planck’s constant. A fundamental vibration is evoked when one such quantum of energy is absorbed by the molecule in its ground state. When multiple quanta are absorbed, the first and possibly higher overtones are excited.”
A simplification, and as such, not particularly useful. Lies one tells to children – or climate cranks. Mind you, “molecular vibrations” do not occur spontaneously, so the quote is at least specific in that regard. Needless to say, molecular vibration is unrelated to the mythical GHE.
swenson…”From Wikipedia –
“A molecular vibration is excited when the molecule absorbs energy, ΔE, corresponding to the vibration’s frequency, ν, according to the relation ΔE = hν, where h is Planck’s constant.”
***
For one, this is false. Electron transition cause no vibration, it is the bonds made up of electrons that produce vibration. The bonds can stretch/contract, either symmetrically or asymmetrically, or they can vibrate back and forth like the hands on a clock.
I have confirmed this during my electronics studies and during a year of organic chemistry I studied. Both theories are similar, since they are based on the Bohr atom model. I did not get it in my early days of studying electronics, or even when I took the year of organic chemistry, that I was actually studying basic quantum theory.
To clarify transitions, delta E is the potential energy between orbital energy levels around a nucleus. Only electrons can inhabit those energy levels. These levels were postulated by Bohr then proved mathematically by Schrodinger in his famous wave equation.
A molecule per se, has no such transitional states.
delta E = hf is Bohr’s relationship based on Planck’s quantum number, h. E represents the potential difference through which an electron must rise or fall when it absorbs or emits a photon of electromagnetic energy. The parameter, f, represents the frequency of the electron based on it angular frequency in its orbit.
Bohr arrived at this theory while investigating the absorp-tion and emission spectra of the hydrogen atom. No one could explain why the absorp-tion/emission occurred in discrete frequency spikes. That led Bohr to speculate it was electrons moving between discrete quantum energy levels that caused the discrete absorp-tion/emission spectra.
Look up Balmer and Lyman series for hydrogen.
In any molecule, there are several possibilities from which delta E can be derived. Any electron in any atom making up a molecule can change through a number of potential energy levels. Also, when EM strikes a molecule there is nothing else in the molecule that can absorb EM except electrons.
In other words, atoms don’t stop behaving like atoms because they become part of a molecule.
Wikipedia are misleading people by claiming it is the molecule emitting and absorbing when in fact it is the electrons making up the constituent atoms of a molecule that are doing it.
“the bonds made up of electrons that produce vibration”
So individual atoms cannot have a temperature? Only molecules? I think not.
> Wikipedia are misleading people by claiming it is the molecule emitting and absorbing when in fact it is the electrons making up the constituent atoms of a molecule that are doing it.
C’mon, Gordo. First sentence:
https://en.wikipedia.org/wiki/Molecular_vibration
Srsly.
Gordon,
“In other words, atoms dont stop behaving like atoms because they become part of a molecule.”
Well the electrons do go from being in atomic orbitals to being in molecular orbitals.
So you got that going for you.
maguff…”I would suggest that you study the theory of molecular vibrational states; and being the quintessential anachronism that you are, may I recommend:
INTRODUCTION TO QUANTUM MECHANICS With Applications to Chemistry. By Pauling and Wilson, McGRAW-HILL, 1935″.
***
I have studied the theory at depth, at a university level, in both organic chemistry and electrical engineering. I am also aware of Pauling’s covalent bonding theory since it is employed widely in organic chemistry and electronics.
When you study molecules in organic chemistry, you do so at the atomic level. You study the bonds between atoms and how they can form different shapes. The only time ‘molecule’ comes into the discussion is to identify one arrangement of nucleii/electron bonds, from others. Or as a summation of bond energies and other energies contributed by each atom in a molecule.
Rather than talking down your nose, you might try reading related material yourself. You are in an indefensibly position and trying to save face.
BTW..Pauling introduced quantum theory to North America. He actually went to Europe to learn it during its infancy. He was already an expert on molecular shapes based on xray diffraction and he had to modify the current quantum theory to make it fit his understanding of molecules based on experience.
You might look up Pauling on electronegativity since it plays a major role in molecular shapes.
So, you studied Organic Chemistry in the curriculum for Electrical Engineering? A very unorthodox path for an electrical engineer if true.
I’m reminded that not long ago you claimed to have taken a year of Astronomy, the kind of Astronomy that doesn’t require Math according to your post.
The way you describe your education it sounds like it’s a mile wide and one foot deep. But I digress.
My “position,” which you call indefensible, is simply that molecules have vibrational energy states. You wrongly claim that:
“There is no such thing as a molecular vibration.” http://www.drroyspencer.com/2021/11/uah-global-temperature-update-for-october-20210-37-deg-c/#comment-1038736
I’ve given you references for your benefit, but you chose to ignore them. Good for you!
I should know better than to engage you in discussion.
maguff…”So, you studied Organic Chemistry in the curriculum for Electrical Engineering? A very unorthodox path for an electrical engineer if true”.
***
Engineering begins after 1st year is complete, 1st year engineering being a general engineering course. I did not start electrical engineering till 3rd year university. I took organic chemistry in relation to 1st year courses.
I took astronomy as an elective in one of my engineering years. In first year, I had already completed a required 1st year course in English (grammar and literature) at night school, so I had an open slot for an elective. I also took 3 years of psychology as an elective during my engineering years. I actually applied for a Music minor but the music admissions prof, being rather effeminate, took one look at my engineering jacket and said, “definitely not”!!!
With regard to molecular vibrations, you miss my point. There is nothing in a molecule that can vibrate other than the electron bonds binding the individual atom nucleii together. Yours is a semantics argument. Physically-speaking, there is no such thing as a unit called a molecule. It is simply a name for an aggregation of atomic nucleii bonded by shared electrons, or in the case of something like NaCl, with an ionic bond, electron-related charges.
I am fully aware of the nomenclature related to molecules but when it is claimed a molecule vibrates, rotates, or emits/absorbs EM, the reference is actually to the protons making up atomic nucleii and the electrons that bond them together.
When you draw a molecule, you do as follows:
O=====C=====O
Actually, O=C=O will suffice. The double dash tells you there are two electrons being shared.
That’s the CO2 molecule but as you can see it is made of two oxygen nucleii, one carbon nuclei, and the shared electrons that bond them together. The dashes represent the double bonds of electrons.
Any vibration or rotation is related to the electron bonds and any EM emission/absorp-tion is related to ANY of the electrons making up the electron orbitals around the nucleii.
You can stick to visualizing a molecule as a black box in which rotation, vibration, and emission/absorp-tion is going on, but I prefer the actuality. I was raised on electron theory as an adult, and I prefer to deal with electrons and nucleii rather than mythical black boxes. Of course, I need to use the word molecule to differentiate one atomic arrangement from the other.
Dunning Kruger:
https://www.youtube.com/watch?v=JziEOUvs7SQ
Gordon,
“Actually, O=C=O will suffice. The double dash tells you there are two electrons being shared.”
Actually the double dash tells you that it is a double bond, which means there are 4 electrons being shared by the Carbon atom and the Oxygen atom, for that bond.
The bond length can stretch and twist and bend, those are the vibrations we are talking about, they are indeed real.
Organic Chemistry isn’t even a first year course for a Chemistry Major, I should know, I have a Chemistry Degree.
TM,
The phrase “vibrational energy states” is just jargon, unless you can show some relevance to something.
And, of course, you can’t.
Just like saying a piano string has “vibrational energy states”.
So? Just more diversionary climate crackpottery.
You really have no idea what you are talking about, do you?
duly noted.
O=C=O.
There are 6 degrees of freedom in a CO2 molecule.
You might try pretending your head is a lump of coal and your hands are lumps of oxygen.
up and down
forward and back
inward and outward.
The first two do not involve a change in length of the bond. They simply expand and contract as per the gas law.
The third involves bending the bond. It is this characteristic that allows CO2 and other molecules with similar structure to absorb and radiate IR energy making them greenhouse gases.
N2 O2 are bipolar molecules. They expand and contract as per the gas law. Sure they absorb and emit some IR; as has been pointed out, everything does. But they are not efficient absorbers or emitters and don’t contribute as greenhouse gases.
Vibrational energy states does matter. LED goes from 0 state to 1 state and emits light. Its unique in that the ramp up is almost instantaneous. Everything has an emissivity rate (see Hottel emissivity chart)
CO2 has a slower emissivity rate but it does emit IR at the same frequency as was absorbed. Most of the heat energy absorbed is transferred to other molecules O2 and N2 in billions of collisions as the CO2 molecule expands and rises as per gas law.
One error ‘The first two do not involve a change in length of the bond’. It actually does change in length as the molecule expands and contracts according to gas law.
Linear molecules use the 3N-5 rule, non-linear molecules use the 3N-6.
So CO2 has 4 modes of vibration.
And the Ideal Gas Law treats all gases, molecules or atoms, as point particles.
Swenson,
A piano string does have vibrational energy states, and they are different in different piano strings, due to size, length, and tension, thus different pitches.
You can use the same quantum mechanics equations to solve piano string problems.
b,
And once you stop applying energy to the piano string, it stops vibrating.
As does a CO2 molecule. I presume you thought you were making a point, but you were just demonstrating climate crank silliness.
As to “quantum mechanics equations”, you have never used any to solve anything. How about I propose a piano string “problem”, and you solve it.
Show your work. (Only joking, of course)!
Swenson,
“you have never used any to solve anything. How about I propose a piano string “problem”, and you solve it.”
You want to bet on that?
I still have my Quantum Mechanics textbooks, they are full of Harmonic Oscillator problems.
And dumbass, even when the piano string stops vibrating, that’s still a vibrational energy state, it’s the one with zero energy.
bdg…”Schuckmann et al. 2020 is relevant to your question.
https://essd.copernicus.org/articles/12/2013/2020/
The same thing takes place with the land and cryopshere.”
***
Seriously primitive argument. Noted the name of James Hansen in the list of co-authors.
“The difference between incoming solar radiation and outgoing radiation, which is the sum of the reflected shortwave radiation and emitted longwave radiation, determines the net radiative flux at TOA. Changes of this global radiation balance at TOA the so-called Earth energy imbalance (EEI) determine the temporal evolution of Earth’s climate: If the imbalance is positive (i.e., less energy going out than coming in), energy in the form of heat is accumulated in the Earth system, resulting in global warming or cooling if the EEI is negative”.
***
For one, there is no ‘net’. A net would be a summation of the pertinent frequencies/wavelengths in the shortwave spectrum, for example, if the energy struck a reflective surface. There is simply no way the terrestrial outgoing IR frequencies/wavelength can be summed with the incoming since they are in different frequency/wavelength bands. Furthermore, there are orders of magnitude difference in intensities between the two.
This is a ridiculous argument presented by people who neither understand heat nor EM. It’s obvious that the radiation in cannot equal the radiation out since much of the heat created by the incoming is stored in the atmosphere, the surface, and the oceans. There is a delay involved and that account for the warming.
The warming is about storage of heat, not radiation.
This theory is just plain wrong. It does not account for heat stored in the atmospheric gases N2 and O2, nor the circulation of heat by the atmosphere and oceans. Just last summer, we had a dome of heat trapped over southern British Columbia in Canada and it was obviously nor radiating anything to space. It couldn’t, it was 99% N2/O2, gases that don’t radiate IR.
CO2 and WV in the mix did nothing to cool the dome.
Gordon,
Less bullshit please!
“There is simply no way the terrestrial outgoing IR frequencies/wavelength can be summed with the incoming since they are in different frequency/wavelength bands. ”
Each wavelength will have an intensity, which can be converted to energy, and then the energies of all the wavelengths can summed.
There is this thing Newton invented, called integration, perhaps you have heard of it.
“Each wavelength will have an intensity, which can be converted to energy, and then the energies of all the wavelengths can summed.”
Flux converted “correctly” to energy can indeed be added, as energy is conserved. But, then it can no longer be considered as flux. Flux does NOT add.
For example, an ice cube emits about 300 W/m^2. If that ice cube has a total area of 0.01 m^2, then it is emitting 3 Watts, or 3 Joules/second. Then, two such ice cubes would be emitting 6 Joules/second, but ONLY 300 W/m^2. More energy is being emitted, but only the same flux is being emitted.
That’s why two ice cubes can NOT warm an object above the temperature of the ice. 100 ice cubes can NOT warm an object above the temperature of the ice. Believing more energy means higher temperature is one of the many flaws in the AGW nonsense.
Non of your bullshit about ice cubes Clint R.
That has nothing to do with increasing CO2 causing the surface to warm.
It’s just your misunderstanding of Science.
It’s the Sun, what’s doing the warming, not a bunch of ice cubes.
And it’s the CO2 slowing the rate of cooling.
Only someone braindead could write such conflicting words:
“…increasing CO2 causing the surface to warm.”
“It’s the Sun, what’s doing the warming…”
But bob’s incompetence reminded me of another clarification needed.
Just as two ice cubes can’t warm an object above the temperature of the ice, because fluxes don’t add, the same would be true with Sun and the sky. That is, 300 W/m^2 from the sky and 600 W/m^2 from Sun does NOT result in 900 W/m^2. It only results in 600 W/m^2.
Clint R
“300 W/m^2 from the sky and 600 W/m^2 from Sun does NOT result in 900 W/m^2. It only results in 600 W/m^2. ”
Where does the 300W/m^2 go? It can’t disappear because that would be a 2LOT violation. You claim that it can’t be absor*bed by the surface because fluxes can’t add. So where does it go?
Ent, I cant teach physics to braindead cult idiots. When someone claims that passenger jets fly backwards, just to protect their cult beliefs, they can’t learn. They’re braindead.
As an example, see if you can face reality long enough to answer your own question, with the appropriate changes:
If you pour water uphill, where does it go? It can’t disappear because that would be a 2LOT violation. You claim that it can’t go uphill, so where does it go?
I’ll just go back to my reductio ad absurdum remark.
The name of the NBC series is Friday Night Lights, not Friday Night Light.
Because it takes more than one light to light a football field, and that is evidence that fluxes do indeed add.
bobdroege,
Have you found any evidence that CO2 is slowing the rate of cooling the planet? I would like to see it. I thought we were having a warming trend. But, from the data above, it looks as though the planet has cooled back down to about the same as it was nearly 20 years ago. Yet, CO2 continues to increase, right?
Sorry bob, more things you can’t understand.
More lights on a football field mean more REFLECTED light to your eyes. More light is not being created. More lights are being turned on. The flux does NOT add.
If you weren’t braindead, I could give you some simple examples to better explain. So this is just for anyone else.
Consider measuring a section of the sky with the proper instrument. You measure east, north, west, and south around a spot directly over your head. Each of the four measurements is made 15° off vertical. All four measurements are 300W/m^2.
Does that mean you are receiving 1200 W/m^2? If not, why not?
Chic,
If you do a regression to remove the variability due to noisy stuff like ENSO, you would find that it’s about .35 C warmer than 20 years ago.
Don’t compare El Nino years to La Nina years.
And yes there is evidence that CO2 has slowed the rate of cooling, because it has warmed without any increase in the heat source, that being the Sun.
Sorry Clint R,
Now you are just being too stupid for words.
More lights means more lights
More lights means more energy
More lights means there more light, which means there’s more flux, so the quarterback can see the receiver, and the receiver can see the ball.
Kinda hard to catch a football in the dark, don’t you think?
You pose another problem, problem is it only shows how stupid you are.
“Consider measuring a section of the sky with the proper instrument. You measure east, north, west, and south around a spot directly over your head. Each of the four measurements is made 15 off vertical. All four measurements are 300W/m^2.
Does that mean you are receiving 1200 W/m^2? If not, why not?”
Is that how you add vectors, Victor?
See braindead bob, I knew you couldn’t understand.
bobdroege,
“If you do….”
I didn’t and won’t do that regression. Let’s see you do it.
Are you aware of any data showing OLR has NOT increased in accordance with that expected from temperature increase? And are you aware that absorbed solar radiation increases irrespective of any change in the sun’s output?
bob,
You wrote –
“And its the CO2 slowing the rate of cooling.”
Unfortunately for the retarded climate crackpots, cooling is cooling. No rising temperature.
For example, night time. Sometimes the cooling is fast and extreme, as in arid tropical deserts. Sometimes slower, as under the canopy of dense tropical rainforests.
You really have no clue, do you?
Chic,
“Are you aware of any data showing OLR has NOT increased in accordance with that expected from temperature increase? And are you aware that absorbed solar radiation increases irrespective of any change in the sun’s output?”
Yes, I am aware of that.
https://www.pnas.org/content/115/41/10293
Gee Swenson,
“For example, night time. Sometimes the cooling is fast and extreme, as in arid tropical deserts. Sometimes slower, as under the canopy of dense tropical rainforests.”
Thanks for telling me where to find the greenhouse effect!
Fizzix guru Bil Gaede explains temperature
https://youtu.be/VshOCw4GfTQ
> “Lets say you are right and the average planetary temperature increases with rotation. That means that when I compare a non-rotating planet to a rotating planet, the rotating planet has a higher temperature. That means the rotating planet is radiating more energy than a non-rotating planet. Where does the additional energy come from? Its not coming from the rotation the planet.”
We do not have tidally locked to sun planets or moons – every planet and moon in solar system is a rotating celestial body.
So we do not have measured data for non-rotating planets to compare with rotating.
But we have measured data for existing rotating planets and moons, some rotating faster and some rotating slower.
So we can compare those planets with different rotational spin the measured surface temperatures – and we have observed, and we have discovered the Planet Surface Rotational Warming Phenomenon.
https://www.cristos-vournas.com
Let’s compare a faster rotating Earth (N = 1 rotation/day) with the slower rotating Moon (N = 1 /29,53 rotation/day = 0,03386 rotation/day).
Earth has higher than Moon average surface Albedo (a =0,306 vs a = 0,11).
As a result Moon has to “absorb” 28 % larger amount of the solar SW incident energy than Earth.
It means, on the average surface area, Moon’s surface emits 28 % more IR EM outgoing emission energy than Earth’s surface.
Nevertheless, Earth’s measured average surface temperature is 288 K. Moon’s average surface temperature is 220 K.
The very big 288 K – 220 K= 68C difference is explained by the Earth’s higher rotational spin (29,53 times higher) plus by the Earth’s surface higher average specific heat (5 times higher).
Therefore, the Earth’s higher than Moon’s (N*cp) product is what makes Earth a much warmer planet than Moon.
Earth (N*cp) /Moon (N*cp) ratio is 29,53*1/0,19 = 155,42 times higher!
What more illustrative example !!!
Moon IR radiates 28 % more IR outgoing EM energy than Earth, but, nevertheless, Moon’s measured average surface temperature is 68C lower than that of Earth.
To conclude with:
Earth has 155,42 times higher (N*cp) product, and Earth has 68C higher average surface temperature.
And, not to forget, Earth “absorbs” 28 % less incident SW EM solar energy.
It is obvious, that we are ABSOLUTELY right, and the average planetary temperature increases with rotation.
https://www.cristos-vournas.com
“Nevertheless, Earth’s measured average surface temperature is 288 K. Moon’s average surface temperature is 220 K.”
Christos, Earth has an optically thick atm. affecting surface temperatures! Our moon does not.
Thus earthen measured Tse Te = 288K 255K = 33K GHE
Our moon’s measured equatorial Tequilibrium avg. Ts (depends on rotation speed) = 240K 210K
Your analytical work, if right, needs to agree reasonably well with measured data and so far your analytical work does not do so. The correct analysis work to learn why your work is incorrect can be found in a basic text book on the subject.
Here’s Braindead4 with his “real 255K surface” nonsense again. It’s a carryover from last month, where he couldn’t identify where it exists.
I predict he will hide behind another smokescreen.
No smokescreen needed, after a month+ Clint R clearly still admits in writing hasnt located the earthen 255K measurements despite other commenters providing clues.
The earthen 255K measured data should only take a few hours to understand even including the time to find and download the relevant, reliable papers. Clint is just not capable of doing so.
Clint is a reliable entertainer though performing routinely as the blog laughing stock.
As predicted, Braindead4 produces another smokescreen.
And now, he’s switching from “real 255K surface” to “255K measured data”. He knows he’s beat.
That’s why this is so much fun.
No meaningful switch Clint, there is a real measured earthen 255K surface for you to still locate.
Thanks for the great entertainment admitting you cannot do so. Thus admitting you have not studied even the basics of climate.
Hopefully adding the signs from 1:13pm for data Clint R admits cannot find:
Thus earthen measured data Tse – Te = 288K – 255K = 33K GHE
Our moon’s measured data equatorial Tequilibrium (no dependance on rotation speed) – measured avg. Ts (depends on rotation speed) = 240K – 210K
As our moon’s rotation speed increases in the limit avg. temperature rises due the non-linearity of S-B:
Equatorial Tequilibrium (no dependance on rotation speed) – avg. Ts (depends on rotation speed) = 240K – 240K = 0
A non-existent surface has a non-existent temperature. So 288K – [null] = 288K.
A non-existent surface can’t be measured at 255K Clint R, but the earthen Te HAS been measured by satellite radiometer data so the 255K surface does exist.
Except that surface doesn’t exist for Clint who admits Clint can’t find that surface & has to routinely ask others to locate it. Very funny all those Clint R antics.
Wrong Braindead4. You can’t measure a non-existent surface. What is confusing you is the “modeling”. An outgoing flux of 240W/m^2 is “modeled”, but there are NO meaningful measurements. Earth’s average outgoing flux is unknown. (And, flux doesn’t “average” anyway.)
It’s all cult nonsense, and you’ve swallow every drop of it.
“..but there are NO meaningful measurements.”
Clint R admits not knowing of the measurements in climate basics, so given Clint R’s lack of study much of climate appears to be “cult nonsense” like Clint claiming jets can fly backwards. Remember Clint: dogs bark at what they do not know.
Now back to Clint’s regularly scheduled entertainment, leave the climate basics to the adults in the room.
Braindead4, you’re evading the issue, again.
There is no “real 255K surface”. There are no meaningful measurements of Earth’s actual emission. If you had anything, you’d produce it.
You’ve got NOTHING.
Thanks for admitting Clint R still hasn’t found or understood the easily accessible meaningful climate basics real measurements and has yet to understand the earthen real 255K radiometer measured surface. Thus, Clint R’s climate comments are not well founded & totally lack credibility.
Back to entertainment specialist for Clint R.
NB for Clint: Passenger jets don’t fly backwards.
There is no “real 255K surface”. There are no meaningful measurements of Earth’s actual emission. If you had anything, you’d produce it.
You’ve got NOTHING.
You’re braindead.
“the average planetary temperature increases with rotation. ”
But why does Earth rotate once per day and has a surface temperature of 288K while Venus rotates once every 243 days and has a surface temperature of 733K?
Surely, as the faster spinner, Earth should be warmer than Venus?
he’s no idee what he’s talkinbout.
the the average planetary temperature increases with rotation. is only true for an atmosphere-less bodies, to which the idea of the average temperature isn’t even applicable that much on a count that what meteorologists talk about when they talk about ‘surface temperature’ is actually not the skin temperature of the hard surface but rather the temperature of the atmospheric boundary lair. With the moon, it not having any atmosphere, the idea of the average temperature as it is used on earth isn’t directly applicable to to begin with.
However, if the bodie has a thick enough atmosphere to have circulation, it would be slower rotating bodies that are warmer than the faster rotating ones, because of the momentum conservation hindering the heat flow from the equator to the poles on the faster spinning planet.
Of course, none of that directly applies to venus as its surface temperatures that are hot enough to melt zinc are hot for a different reason. the slower rotation of venus probably does contribute to it, but i don’t think that contribution is of any significance.
Bien vu – well balanced remark.
For those that haven’t learned “The Faster a Planet Rotates, the Warmer its Average Temperature” please read:
http://www.drroyspencer.com/2016/09/the-faster-a-planet-rotates-the-warmer-its-average-temperature/
Christos curve fits the known measured data using a fudge factor to get the correct avg. T answer for Earth surface while Dr. Spencer shows the correct answer based on fundamentals.
For Venus, as the planet rotates faster its average temperature would increase as Dr. Spencer shows but Venus’ equilibrium temperature would not change as that equilibrium is independent of rotation rate.
Venus is not being heated at its rocky surface, rather it’s heated at its cloudy surface which has a day of about 4 to 5 days. As Venus has a fast global wind, ie:
“Venus is well-known for its curious super-rotating atmosphere, which whips around the planet once every four Earth days. ..”
But if Venus atmosphere spun faster [due rocky surface spinning faster or whatever] it would be a bit warmer.
Likewise if Venus had less sunlight, atmosphere would spin less than “once every four Earth days”.
And if Venus rocky surface was heating, then it’s atmosphere move but not spin as a “super-rotating atmosphere”
Venus at Earth distance would have a less “super-rotating atmosphere” and eventually screech to a stop. And become colder than Earth.
Comparing bodies with different atmospheres in terms of rotation speed makes no sense. Theoretically, rotating faster would make a given planet warmer, because extreme temperatures cause a body to be cooler than it would be with more uniform temperatures.
Thank you, gentlemen.
I’m quite happy with the argument that, all else being equal, a faster rotating body with no atmosphere has a higher average temperature.
I was trying to be satirical about his attempt to make rotation the only variable controlling surface temperature.
We need an irony emoji!
Here it is
https://tinyurl.com/4pak9sbj
So we are agreed that a borehole should show a consistent linear increase in temperature with depth. If we are going from a stable 15C at the surface to 5000C at the centre, 6000km down, you would expect the rate of change to be
5000-15 / 6000 = 0.8C/kilometre
If the surface temperature is stable at 15C the 0.8C/kilometre increase would continue all the way from the surface at 1km depth it would be 15.8C
If the climate cooled to 14C, the near surface temperature would decrease and the warming over the first km would increase to 15.8-14 = 1.8C.
If the climate warmed to 16C at the surface the gradient would reverse and the gradient would be 15.8-16 = -0.2C of cooling.
Boreholes are tending to show cooling over the first km instead of warming, independent evidence that the climate is warming.
So cooling is “independent evidence” of warming?
That’s right out of the cult handbook.
It’s very simple.
A surface cooling temperature trend increases the temperature gradient in the borehole.
A surface warming temperature trend reduces or reverses the temperature gradient in the borehole.
Reality is simple, Ent. Sun warms the surface.
Your beliefs are what is convoluted, “Cooling is ‘independent evidence’ of warming?”
Outer space cools the surface too.
Hmm.
https://en.wikipedia.org/wiki/Geothermal_gradient#/media/File:Temperature_schematic_of_inner_Earth.jpg
RLH
Thank you, that”s very useful. The gradient from surface to lithosphere is much steeper than in my thought experiment, so the effect I described would take place over the first 25 metres instead of the first kilometre.
“Negative geothermal gradients occur where temperature decreases with depth. This occurs in the upper few hundreds of meters near the surface. Because of the low thermal diffusivity of rocks, deep underground temperatures are hardly affected by diurnal or even annual surface temperature variations. At depths of a few meters, underground temperatures are therefore similar to the annual average surface temperature. At greater depths, underground temperatures reflect a long-term average over past climate, so that temperatures at the depths of dozens to hundreds of meters contain information about the climate of the last hundreds to thousands of years. Depending on the location, these may be colder than current temperatures due to the colder weather close to the last ice age, or due to more recent climate change.”
Clint R missed the point completely, as usual.
I didn’t miss the point, Ent. You got caught practicing witchcraft again.
EM,
More from your “borehole” link –
“When the surface temperature becomes colder, heat flows up from the ground, cooling the ground, and this cooling is transmitted downward slowly.”
Complete nonsense. Cooling does not get “transmitted”.
The authors are delusional. Anyone who believes “borehole” nonsense is similarly retarded.
Accept reality. Thermal gradients go from hot to cold – with absolute zero as the lower limit.
“Geothermal gradient is the rate of temperature change with respect to increasing depth in Earth’s interior. As a general rule, the crust temperature is rising with depth due to the heat flow from the much hotter mantle; away from tectonic plate boundaries, temperature rises in about 2530 C/km (7287 F/mi) of depth near the surface in most of the world”
RLH,
I assume you made a typo. 2530 C/km? Maybe 25-30 C/ km would be more likely.
Just in case lurkers get confused – especially climate cultists!
“Maybe 25-30 C/ km”
Yup. Just quoting something that the blog automatically shortens is how that happens.
Just as (72-87 F/mi) gets altered.
EM,
Why would anybody agree with you that fact should be abandoned for fiction?
Why would a borehole show a linear increase with depth at 0.8 C/km? The measured geothermal gradient varies around the globe, but is roughly 25 C per km, in the top part of the crust.
Obviously, the gradient will vary depending on thermal characteristics of the rock along the gradient, and conditions beneath the crust in the mantle.
You cannot measure the temperature of a “hole”, and measuring the temperature of the surface surrounding the hole is just silly. The hole is full of something, let us say air. The air temperature varies widely around the world, which will affect the temperature of the surface/air interface within the hole. I hope silly donkeys don’t just lower a thermometer down a hole and measure the temperature of the thermometer! Tell me it ain’t so!
As to the influence of the Sun, this is generally imperceptible beyond 10 m or so, and even seasonal variations cannot be measured. All fairly straight forward, and in accord with the laws of Nature, as currently understood.
So carry on believing cult nonsense if you wish. Heat does not descend from the ocean surface to the depths, and neither does ground surface cold “move” towards the interior of the Earth.
Accept reality.
if you can’t use thermometers in boreholes, how do you know that the temperature increases with depth at 25C/km ?
What method of measurement do you use?
EM,
Who said you can’t use thermometers in boreholes?
Not me, that’s for sure!
Of course, you can measure the temperature of the crust at depth. I’ll let you look up how it can be done. Or, look up why gold mines cannot be efficiently mined at extreme depth.
I’m right, you’ll find.
Try another type of gotcha. It’s all you’ve got now, by the look of it.
Swenson
You just wrote
“You cannot measure the temperature of a hole, and measuring the temperature of the surface surrounding the hole is just silly. The hole is full of something, let us say air. The air temperature varies widely around the world, which will affect the temperature of the surface/air interface within the hole. I hope silly donkeys dont just lower a thermometer down a hole and measure the temperature of the thermometer! ”
That looks like a denial that you can use thermometers in boreholes.
Retired Petroleum Engineer here who, having drilled several hundred wells around the world, can attest that every hole drilled is surveyed for various geophysical measurements including temperature.
EM,
I really don’t care what you think something “looks like”.
If you disagree with something I said, maybe you could supply some verifiable facts to support your opinion. Others can then make up their own minds.
If you can’t even quote my words to support your bizarre opinions, you will just “look like” a climate crank.
TM,
Maybe you could inform others as to precisely what you measured in the holes, and the circumstances. As an example, measuring the drill head temperature would be pointless if you were interested in the rock temperature you were drilling through. Measuring casing temperature would be similarly pointless.
How did you ensure that the drilling process had precisely no impact on the temperature of the rocks being drilled through? What about the precision, accuracy, and resolution of the measurements?
You can’t remember, can you? What a pity!
If you appeal to your own authority, you must expect to prove your expertise.
Swenson,
Quit it with the shtick, man! If you have a question, ask it clearly, concisely and directly.
That said, there are two ways to directly survey a borehole: while drilling and post drilling (open-hole). There is also a third phase (cased-hole), if and when petroleum has been found and the borehole becomes a well to be used for production over several decades.
The basic measurements of interest to the engineer are porosity, fluid saturations, rock mechanical properties, and temperature.
Due to the hostile subsurface environment, redundancy is built into all the measurements. For example acoustic and nuclear for porosity; conductivity and resistivity for saturation; fluid and rock sample extraction for direct examination of the host reservoir and its contents.
A producing well will be surveyed many times over its life primarily for bottom-hole pressure, temperature, distribution of fluid influx from the rock, and changes in fluid composition with depletion.
The minute the drill-bit first hits a formation its properties begin to change. Overburden stress is lifted, the drilling fluid cools the rock, pore pressure is altered, clays react with the drilling fluid. All these effects are known and expected to occur, and much research has gone into recognizing and adjusting for them.
If it was easy [you] anybody could do it.
Entropic man says:
December 7, 2021 at 8:47 AM
“the average planetary temperature increases with rotation.
But why does Earth rotate once per day and has a surface temperature of 288K while Venus rotates once every 243 days and has a surface temperature of 733K?
Surely, as the faster spinner, Earth should be warmer than Venus?”
…………………………
The answer:
The method I use is “Planet Temperatures Comparison Method”.
Let’s see what we have here, when comparing Venus’ mean surface temperature 733K (N= 1/243 rot/days) and Earth’s mean surface temperature 288K (N= 1 rot/day).
Venus is a gases planet!
………………………..
Venus’ Without-Atmosphere Mean Surface Temperature calculation.
R = 0,723 AU, is the Venus distance from the sun in astronomical units
1/R = 1,9130
Venus albedo: avenus = 0,76 Bond
Venus is a gases planet, Venus solar irradiation accepting factor Φvenus = 1
β = 150 days*gr*oC/rotation*cal is the Rotating Planet Surface Solar Irradiation INTERACTING-Emitting Universal Law constant
1/243 rotations /per day, is the planet’s Venus sidereal rotation spin.
On the Venus atmosphere winds are 60 times faster than the planet’s Venus sidereal rotation spin. Since Venus has very thick atmosphere and being considered a gases planet, the Venus’ rotation spin will be calculated as
N = 60* 1/243 = 60/243 = 0,24691 rotations per day
cp.venus = 0,19 cal/gr*oC, it is because the surface is regolith dry soil
σ = 5,67*10⁻⁸ W/mK⁴, the Stefan-Boltzmann constant So = 1.362 W/m (So is the Solar constant)
Venus Without-Atmosphere Mean Surface Temperature Equation Tmean.venus is:
Tmean.venus = [ Φ (1-a) So (1/R) (β*N*cp)∕ ⁴ /4σ ]∕ ⁴
Τmean.venus = [ 1(1-0,76)1.362 W/m 1,9130*(150 days*gr*oC/rotation*cal *0,24691rotations/day*0,19 cal/gr*oC)∕ ⁴ /4*5,67*10⁻⁸ W/mK⁴ ]∕ ⁴ =
Τmean.venus = [ 0,24*1.362 W/m1,9130*(150*0,24691*0,19)∕ ⁴ /4*5,67*10⁻⁸ W/mK⁴ ]∕ ⁴ =
= [ 0,24*1.362 W/m1,9130*(1,6287) /4*5,67*10⁻⁸ W/mK⁴ ]∕ ⁴ =
Τmean.venus = ( 4.490.620.150,82 )∕ ⁴ =
Tmean.venus = 258,87 K
And we compare it with the
Tsat.mean.venus = 735 K, measured by satellites.
What we see here is that planet Venus has a strong greenhouse warming effect due to the greenhouse gas CO2 96,5 % high content in the Venus’ atmosphere.
Venus’ atmosphere ground density D = 65 kg/m.
Earth’s atmosphere ground density is only D = 1,23 kg/m
and the greenhouse gas CO2 is only the 0,04 % very tiny trace content in the Earth’s atmosphere.
https://www.cristos-vournas.com
“What we see here is that planet Venus has a strong greenhouse warming effect due to the greenhouse gas CO2 96,5 % high content in the Venus atmosphere.
Venus atmosphere ground density D = 65 kg/m.
Earths atmosphere ground density is only D = 1,23 kg/m
and the greenhouse gas CO2 is only the 0,04 % very tiny trace content in the Earths atmosphere.”
Agreed, though 0 .04% is still enough to trigger 33C warming.
But if you agree with the greenhouse effect, why try to explain the temperature differences entirely by rotation rate?
Ent, you have to remember the AGW nonsense is “global”. The perversion of science is pervasive. It is taught in schools. It is constantly echoed in the media. Many governments fully accept it.
The purpose is to make us all braindead. The cult dogma is very effective. You see cult idiots even claiming passenger jets fly backwards!
Hard to believe, huh?
The laughing stock of the blog, Clint R, is the only commenter claiming jets can fly backwards. Not hard to believe given Clint admits not knowing the basics of climate and yet comments on a Climate blog.
The informed, critical commenters here understand Clint admits not understanding the basic science and assign the appropriate zero credibility to Clint’s comments. Keep up the great entertainment Clint.
Braindead4, if I link you to where Ent has made such claims, will you agree to not comment here for 90 days?
“The purpose is to make us all braindead.”
Yes it certainly worked on Clint!
Troll Nate has NOTHING, again.
EM,
You wrote –
“Agreed, though 0 .04% is still enough to trigger 33C warming.”
Well, no. Not unless you believe that the Earth cooled to 33C less than it is now, and then miraculously warmed up. And yes, “warmer than it otherwise would be” is just nonsense spouted by climate crackpots.
The Earth has managed to cool from the molten state to its present temperature, whatever that is. The nonsensical notion that an “equation” “proves” that the Earth “should be” some other temperature is just specious nonsense. That same stupid “equation” “proves” that the earth never had a molten surface, which it apparently did.
Accept reality. Adding CO2 to a gas changes the temperature of the gas not one jot. Removing CO2 makes no difference either. What do you conclude from this?
I conclude that CO2 has no warming effect at all. Tyndall’s experiments back me up.
And you?
Tyndall’s experiments used boiling water for the warming effect; without that effect the CO2 would have stayed at room temperature as Swenson notes.
Tyndall adding CO2 just trapped more of that boiling water warming effect in Tyndall’s tube with thermometers inserted getting warmer just like our atm.
B,
Don’t be stupid. Read and comprehend Tyndall. He showed that temperature fell when the CO2 prevented IR from reaching the “thermometer” – which was not in the tube!
You may be referring to something else not involving CO2, but a completely separate matter.
By the way, Tyndall used a variety of heat sources, and if you had bothered to look, noticed that different gases and liquids showed different opacities to what we now recognise as differing IR wavelengths.
Anyone interested in the facts relating to Tyndall’s work in many fields can read Tyndall’s books for themselves. I believe I am correct about Tyndall’s experimental results, as recorded in the 1905 edition of “Heat – A mode of motion”, by John Tyndall.
“(Tyndall) showed that temperature fell when the CO2 prevented IR from reaching the “thermometer” – which was not in the tube!”
You are incorrect & a source of misinformation Mike..errr I mean Swenson:
Tyndall 1861: “I subsequently had the tube perforated and thermometers screwed into it air-tight. On filling the tube the thermometric columns rose, on exhausting it they sank, the range between the maximum and minimum amounting in the case of air to 5 degrees FAHR.”
For the experiments reported in 1861, Tyndall used boiling water for a constant IR source – he had experimented with higher temperature sources but could not control a constant enough temperature for his needs.
Ball4,
I can only assume you are referring to some of the things that Tyndall subsequently revised in later years. In some cases, after 1861, Tyndall discovered his measurements were incorrect (for reasons which later became evident), or that his experimental setup was defective in one way or another.
Like any rational person, over the next 30 years, Tyndall changed his ideas as he became aware of new facts. If you want to stay in 1861, be my guest.
Suffice it to say, nowhere did John Tyndall state or find that increasing the amount of CO2 between a heat source and a thermometer made the thermometer hotter. Maybe you were confused by “. . . I must slightly warm the defective face of the pile. This is done without any difficulty by a large Leslie’s cube of lukewarm water, placed at a distance ; the needle is now at zero.”
Unless you understand what “defective face of the pile”, means, or even what the relevance of “the needle is now at zero” is, it is easy to become confused. Of course the passage is irrelevant to any supposed “greenhouse effect”.
Anyone can read Tyndall’s books. He made copious amendments and corrections over his lifetime, and six editions of the book I mentioned were printed. If you want to ignore these facts, go your hardest.
“The Earth has managed to cool from the molten state to its present temperature, whatever that is.”
Well, the youngest and thinnest crust which covers 70% is the ocean floor.
The ocean temperature is averaging about 3.5 C.
Ocean floor in the most volcanically active and erupting lava is quickly cooled by the cold ocean.
Did Earth manage to cool faster because it has ocean or slower because it has ocean?
I don’t know answer.
It seems Earth absorbs more sunlight because it has ocean.
But does it radiate more energy to space because it has ocean?
It hard to imagine that Earth has lost more of its heat because it has an ocean.
I don’t know.
Swenson, The earth cooling to molten state hypothesis doesn’t work because rock doesn’t transfer radiation very well. The fact of there still being a molten core after billions of years of cooling is proof. Earth cooling from molten state has naught to do with climate observed today.
Ken,
Not hypothesis, as far as I know. Fact, according to Wikipedia – “Over time, the Earth cooled, causing the formation of a solid crust, and allowing liquid water on the surface.”
Seems reasonable to me. How would you explain the geothermal profile otherwise?
Quite apart from that, you said ” . . . rock doesnt transfer radiation very well.”
Perfectly correct, but completely irrelevant. Slow cooling still results in a drop in temperature, does it not?
The British physicist Lord Kelvin calculated the age of the Earth by assuming a completely molten ball of rock, and used measurements of radiation below the range of solar influence.
His calculation of twenty million years (later revised to forty million years) was incorrect. Lord Kelvin was ignorant of the radiogenic process (amongst other things).
The presence of a molten core merely shows that the earth is still cooling. There is no such thing as a perfect insulator, so an object (the core) around 5000 K, exposed to the Sun from a distance of 150,000,000 km or so, will cool, no matter how well insulated it is. Fact.
As a matter of fact, even a pot of hot water at 100 C, placed in direct sunlight, will cool.
You don’t know what you are talking about.
By the way, climate is just the statistics of weather. No more, no less.
Sorry to break the news to you Swenson, but the core of the Earth is not molten.
The outer core is molten, but the center of the tootsie roll is solid.
–As a matter of fact, even a pot of hot water at 100 C, placed in direct sunlight, will cool.
You don’t know what you are talking about.
By the way, climate is just the statistics of weather. No more, no less. —
Climate is weather. Global climate is not weather.
The global climate has been icehouse global climate
and should remain an icehouse global climate for a long time.
Or 34 million years ago was around the beginning of the icehouse global climate and about 2 million ago, the icehouse global climate became colder.
If you put a pot of hot water at 100 C in insulated box, it takes longer to cool. If put insulated box with pot of hot water is sunlight, it will cool slower then and without the sunlight.
Whether ocean kept earth warmer than without the ocean, is as I said, not clear to me.
Water is a good coolant, water also great insulator if water is not having convection of heat {not rising much due to a uniformity of water density, though the bottom of ocean is not a tomb of stillness, either}. And it seems one could set off nuclear bomb, in deep ocean water, and not get any heat from it coming to the surface. And impactors hitting the ocean, the ocean will absorb a lot that energy- going make big wave, and etc., but ocean should retain more energy compared striking a land surface.
Or lots factors and no doubt some unknown factors.
Also the factor as you mentioned not just cooling but also Earth is a nuclear reactor, the crust of earth in addition rock of mantle is generating heat. And Land has all that radioactive granite. And space delivering heavy material to Earth crust- or what we mostly mine, fell from the sky
Climate sheistering update
https://youtu.be/hs-K_tadveI
Ah yes, anonymous youtube videos. Eben’s educational sources.
Is that it? Is that all you’ve got, anonymous barry?
His name is John Shewchuk , it is right on his channel , his website has his bio including his picture,
http://www.climatecraze.com/aboutus.php
Dingle barry on the other hand is just a trolling debil who doesn’t know what he is talking about
Eben,
Relating to weather (and climate is just statistics of weather, of course) climate cranks prefer to believe non-meteorologists like Gavin Schmidt, Michael Mann, James Hansen, or any other delusional troubadour claiming to be a “climate scientist”.
barry lives in a fantasy, where reality is determined by barry’s erratic mental processes.
Maybe he will venture his thinking in dismissing the opinion of a meteorologist on matters meteorological.
John Shewchuk criticises NOAA’s use of USHCN for its national temperature data. NOAA hasn’t used that data set since 2014.
Typical of cockamamie sources.
You ‘skeptics’ give credence to absolute rubbish. And you are shameless about it. The major fault in the video is easily verifiable, but not only will you NOT verify, you’ll just ignore the gross error and spout further pablum.
barry, does NOAA claim CO2 is “heating the planet”?
“The major fault in the video is easily verifiable, but not only will you NOT verify, you’ll just ignore the gross error and spout further pablum.”
And here comes Clint with the distraction from topic. You ‘skeptics’ are so predictable.
No barry, this IS the topic. Does NOAA claim CO2 is “heating the planet&