
 Home/Blog
The Version 6.0 global average lower tropospheric temperature (LT) anomaly for September, 2022 was +0.24 deg. C, down slightly from the August, 2022 value of +0.28 deg. C.
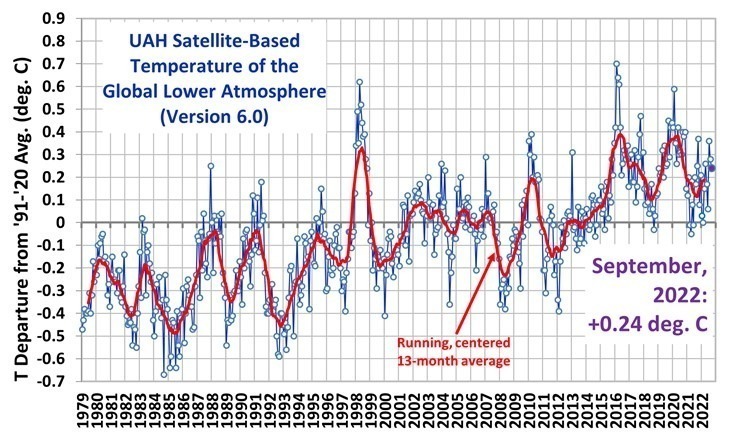
The linear warming trend since January, 1979 still stands at +0.13 C/decade (+0.11 C/decade over the global-averaged oceans, and +0.18 C/decade over global-averaged land).
Various regional LT departures from the 30-year (1991-2020) average for the last 21 months are:
YEAR MO GLOBE NHEM. SHEM. TROPIC USA48 ARCTIC AUST
2021 01  0.12  0.34 -0.09 -0.08  0.36  0.50 -0.52
2021 02  0.20  0.32  0.08 -0.14 -0.66  0.07 -0.27
2021 03 -0.01  0.13 -0.14 -0.29  0.59 -0.78 -0.79
2021 04 -0.05  0.05 -0.15 -0.28 -0.02  0.02  0.29
2021 05  0.08  0.14  0.03  0.06 -0.41 -0.04  0.02
2021 06 -0.01  0.30 -0.32 -0.14  1.44  0.63 -0.76
2021 07  0.20  0.33  0.07  0.13  0.58  0.43  0.80
2021 08  0.17  0.26  0.08  0.07  0.32  0.83 -0.02
2021 09  0.25  0.18  0.33  0.09  0.67  0.02  0.37
2021 10  0.37  0.46  0.27  0.33  0.84  0.63  0.06
2021 11  0.08  0.11  0.06  0.14  0.50 -0.43 -0.29
2021 12  0.21  0.27  0.15  0.03  1.63  0.01 -0.06
2022 01  0.03  0.06  0.00 -0.24 -0.13  0.68  0.09
2022 02 -0.00  0.01 -0.02 -0.24 -0.05 -0.31 -0.50
2022 03  0.15  0.27  0.02 -0.08  0.22  0.74  0.02
2022 04  0.26  0.35  0.18 -0.04 -0.26  0.45  0.60
2022 05  0.17  0.24  0.10  0.01  0.59  0.23  0.19
2022 06  0.06  0.07  0.04 -0.36  0.46  0.33  0.11
2022 07  0.36  0.37  0.35  0.13  0.84  0.55  0.65
2022 08  0.28  0.31  0.24 -0.04  0.59  0.50 -0.01
2022 09  0.24  0.43  0.06  0.03  0.88  0.69 -0.29
The full UAH Global Temperature Report, along with the LT global gridpoint anomaly image for September, 2022 should be available within the next several days here.
The global and regional monthly anomalies for the various atmospheric layers we monitor should be available in the next few days at the following locations:
Lower Troposphere: http://vortex.nsstc.uah.edu/data/msu/v6.0/tlt/uahncdc_lt_6.0.txt
Mid-Troposphere: http://vortex.nsstc.uah.edu/data/msu/v6.0/tmt/uahncdc_mt_6.0.txt
Tropopause: http://vortex.nsstc.uah.edu/data/msu/v6.0/ttp/uahncdc_tp_6.0.txt
Lower Stratosphere: http://vortex.nsstc.uah.edu/data/msu/v6.0/tls/uahncdc_ls_6.0.txt


So disappointed.
Oh well, next month then.
” So disappointed. ”
About what, angech?
Do you miss some harsher cooling?
I am presently raising another $33,000 or many months from home by doing terribly honest and easy on-line sports activities from home. The month comes from this interest at home.~te30″~ im currently interacting in short throughout this interest and creating plenty of cash online victimization the usable helpful resource of by using the balance at intervals
the given stats system http://doingwork12.blogspot.com
Not so disappointing when you understand that lower Antarctic sea ice will reduce albedo and lead to some additional warming. Since Antarctic sea ice melts away quickly, this will have an influence for about one more month. It also appears to be heading back into normal range.
Of course, lower Arctic sea ice levels will kick in about that time. That’s been normal for about the last 20 years and it may actually start increasing soon as the AMO is due to cycle back into its cool phase within a few years.
“lower Antarctic sea ice will reduce albedo”
Yes that is a well known feedback effect of warming.
And?
Nate, it sure seems to be a fickle feedback (can I copywrite that phrase?). It resisted for decades prior to 2015 and has since cycled between helping and hurting the warming.
On top of that, the greenhouse effect over Antarctica itself is supposed to be negative (cooling). That means cooler air flowing off the continent and reinforcing sea ice accumulation.
I’d suggest not holding your breath. It’s only helped “the cause” for about a year and is back within the normal range at present.
Also, I think the recent warming is primarily in the NH.
7th warmest September in the UAH data set. Apart from 1997, all warmer Septembers have been since 2016.
My tentative prediction for the year remains at 0.185 C. It looks increasingly likely that 2022 will be warmer than 2015, makin it the 7th warmest year, but still a chance it will beat 2010 for 6th place.
And the UAH data set is HUUUUGE!
Not.
Other data sets are longer but apparently unreliable. UAH is apparently reliable but too short.
/ sarc
It takes very little work to rubbish everything.
The US value also stands out. +0.88 is the second warmest September in USA48 and the warming rate for that month is +0.4C per decade. Fall (autumn – Sep/Oct/Nov) is the fastest warming season in the US. Not sure why that might be.
Bellman,
If its gotten a degree warmer over a century, it is actually more remarkable that the latest year is cool enough to be in 7th place of the last 43 data points..
Have you forgotten the La Nina? Think that might make a difference?
BobdesbonddesMidasdesAntonin, please stop trolling.
The “Monckton Pause” still starts in October 2014, and so expect excitable posts about it lengthening by a month. In truth I doubt the start date will change by much until it disappears, so the pause will continue to”grow” just by the passing of time.
The pause will likely accelerate this winter. With another La Nina and less influence from reduced Antarctic sea ice, the anomalies are likely to be close to zero.
Not sure how a pause can accelerate, RM.
Please advise.
The pause extends both backwards and forwards. The forward extension is fixed, but the backwards extension is dependent on each months anomaly.
OK.
Little Willy, please stop trolling.
Oh, relax about “The Pause”, it’s just a simple demonstration of the inadequacy of climate change activist science – if CO2 was the Earth’s thermostat then the temperatures would have a steadier increase instead of the three current steps visible in the satellite data. There will probably be another step up, say, in 2036 give-or-take, but that is just based on eye-balling the data without looking at AMO, ENSO or anything else.
I’ve very relaxed about “The Pause”. It doesn’t exist, and I’ve yet to be shown any evidence to the contrary. It’s a just a piece of statistical slight of hand. I just find it amusing how it allows self proclaimed skeptics, to demonstrate how un-skeptical they can be be when it suits them.
It has been a number of years since I have looked at the pause. (I think I last looked at it in 2017.) But if you say that there is no evidence that it has existed and if you say that is a piece of statistical slight of hand, then you do not understand it. There have been periods of pauses — significantly long pauses — but the longest pauses in the past have ended. And there is no evidence that this current will not also end.
The pauses over the past 25 years can inform a person if they are open minded. The first pause from 1997-2015 is still hard to explain if climate sensitivity is high. The warming that ended that pause is directly attributable to a PDO phase change in 2014 which appears to have caused cloud thinning.
After the PDO induced warming we went right back into another pause. This leaves 1-2 years in the last 25 years with any warming. What happened 25 years ago? That was when the AMO phase change occurred.
There’s a perfectly natural correlation with all the warming we have seen for decades. While there is an underlying small warming if you look back to 1850, it is certainly not something to fear and could be simply a return to more normal amounts of solar energy being absorbed in the oceans than what occurred during the Little Ice Age.
“After the PDO induced warming we went right back into another pause. This leaves 1-2 years in the last 25 years with any warming.”
But no cooling. That means NET warming over the period.
As you say PDO oscillated during the period. An upward trend plus an oscillation is fully expected to have plateaus, what you call pauses.
“This leaves 1-2 years in the last 25 years with any warming.”
This is in any case incorrect. At least half the years were warming years.
FYI, here is a comparison between RSS, and PDO plus a linear trend of 0.5C over 24 y.
https://www.woodfortrees.org/plot/rss/from:1997/mean:12/offset:-.15/plot/jisao-pdo/from:1997/mean:12/scale:0.15/detrend:-0.5
You can clearly see the same ‘Pauses’ in both, while clearly there must be an underlying warming trend present, in both.
“If CO2 was the Earth’s thermostat then the temperatures would have a steadier increase instead of the three current steps visible in the satellite data.”
No reason to believe they are steps when you’d see the same behaviour with a rising trend punctuated by el Ninos.
And no reason at all to think that CO2 warming should be a monotonous rise in terms of air temperatures.
Could easily have shortened this reply to “No reasoning.”
More rain in Australia and Europe. Snow in the mountains. Cool tropics.
Just about non-stop rain in Japan for almost a year, fwiw.
There is usually a 5 month lag between ONI and the TLT response. 5 months ago the ONI was -1.1. Yet 2022/09 came in above the trendline. If we’re already riding above the trendline despite the strong La Nina then what is going to happen when ENSO goes neutral or even positive?
This is a weak La Nia and there is no end in sight.
http://www.bom.gov.au/archive/oceanography/ocean_anals/IDYOC007/IDYOC007.202210.gif
Err…”strong La Nina” should have been “moderate La Nina”.
It’s the Antarctic sea ice which has kept anomalies higher the last 4 months. Since most of that ice melts every SH summer, it won’t have as much influence over the next 6 months.
I fully expect El Nino in 23-24 but we could also see the Antarctic sea ice return to normal.
“Fully” expect?? So …. a 100% certainty then?
bobdesbonddesMidasdesAntonin, please stop trolling.
Winter is approaching in the northern hemisphere.
https://i.ibb.co/fGLyfXs/gfs-world-ced2-t2anom-1-day.png
https://i.ibb.co/F4VcKYV/gfs-world-ced2-sst-1-day.png
You don’t need fancy graphics to know that!
Still effects from Hunga-Tonga?
Such As??
Stratospheric water vapor injection
Over Antarctica yes:
https://www.severe-weather.eu/global-weather/cold-anomaly-stratosphere-polar-vortex-volcanic-cooling-winter-influence-fa/
Frank Olsen, Thanks for noting that long piece. As Bindidon notes below, there’s a strong cooling found in the UAH Lower Stratosphere (LS) satellite data. The data from RSS for their TLS South Mid-Latitude also shows a sharp cooling spike for 2022 on top of the long term cooling trend. The RSS Mid-Latitude data is for 25s to 60S.
E. Swanson
The 2.5 degree grid for the LS layer:
https://drive.google.com/file/d/1n6rXv2cSP0mRCE2nJ4DHeflLVmvF0jmD/view
This seems to confirm the information presented by Frank Olsen.
*
What I never have understood is why such effects appear over Antarctica.
Below you see what happened in November 1991, 5 months after Pinatubo:
https://drive.google.com/file/d/1Id_W_PkNvzMitD2EnID7mX-DxuhxwhX6/view
Maybe it’s due to huge poleward advection streams coming from the Tropics, or similar things.
Bindidon wrote:
Don’t forget the Ozone Hole. Most of the ozone is formed in the tropics and then avected toward the poles via the Brewer-Dobson Circulation. Lots to digest in that link…
I am presently raising another $33,000 or many months from home by doing terribly honest and easy on-line sports activities from home. The month comes from this interest at home.~te40″~ im currently interacting in short throughout this interest and creating plenty of cash online victimization the usable helpful resource of by using the balance at intervals
the given stats system http://doingwork12.blogspot.com
From Frank Olsen’s link:
” Cooling on this scale has not been seen in modern satellite records, so this is a significant event. ”
I suppose that in the article they didn’t consider UAH’s data for the lower stratosphere (LS) – because it tells quite a different thing.
*
Performing, in the UAH document for LS
https://tinyurl.com/26wyepxz
an ascending sort over the land column of the Antarctic zone (‘SoPol’, 60S-82.5S) gives on top of the list
yr / month / SoPol / land / ocean
2020 11 -8.78 -13.45 -6.57
what we have to compare with this year’s August:
2022 8 -1.43 -1.42 -1.44
Generating the 2.5 degree grid output for November 2020 then gives this:
https://drive.google.com/file/d/1OmfOvfVuY8zJJZ0pVu0NihQT49KMGsbf/view
shows indeed a considerably deeper cooling in the LS layer than happened in August 2022.
707 grid cells (all in the Antarctic) have an anomaly below -10 C.
This is what I would call ‘unprecendented’.
Unfortunately, I’m not aware of any similar grid source I could use for a comparison.
*
Source for UAH’s LS grid data:
https://www.nsstc.uah.edu/data/msu/v6.0/tls/
(files tlsmonamg.1978_6.0 till tlsmonamg.2022_6.0)
RSS shows for the Antarctic (with, at the LS level, the same latitudinal zone as UAH: 60S-82.5S)
https://images.remss.com/msu/graphics/TLS_v40/plots/RSS_TS_channel_TLS_Southern%20Polar_Land_And_Sea_v04_0.png
data similar to UAH:
https://drive.google.com/file/d/1_Gh1hX8hLGzStjz2KHghVw0Fl-m4ttEk/view
Maybe the article referred to by Frank Olsen deals with altitudes above the lower stratosphere observed by RSS and UAH; after all, Honga-Tonga’s injections reached 50 km altitude.
Bindidon, Note that the graph for the RSS TLS Southern Polar data has a range of -10 K to +10 K, whereas the southern Mid-Latitude plot has a range of -2 K to +2 K, which is 5 times less. The MSU/AMSU polar data is typically very noisy, so there’s not much to learn from it, IMHO.
Also, Olsen’s link displays graphs indicating the greatest cooling is between 30S and 60S, outside of the area of the Southern Polar data.
” Also, Olsens link displays graphs indicating the greatest cooling is between 30S and 60S, outside of the area of the Southern Polar data. ”
Plain correct! I agree, it’s the same corner as shown by UAH:
https://drive.google.com/file/d/1n6rXv2cSP0mRCE2nJ4DHeflLVmvF0jmD/view
I was just a bit irritated by the sentence
” Cooling on this scale has not been seen in modern satellite records, so this is a significant event. ”
*
There is no zonal time series in UAH restricted to 30S-60S or 30N-60N, but it’s easy to do that when you wrote a piece of software doing such things by using their grid data.
1. Chart
https://drive.google.com/file/d/1shh03uRxU1jnA4NnB9k3lTBB1VWAcBeS/view
2. Ascending sort of the time series:
2022 8 -2.85
2015 8 -2.23
2008 8 -2.12
2015 9 -1.82
2022 7 -1.78
2021 7 -1.71
2008 7 -1.67
1989 8 -1.62
2006 7 -1.52
2001 8 -1.51
August 2022 clearly is lowest since beginning.
But as we can see, it’s not quite unusual…
Such as:
https://www.livescience.com/tonga-eruption-water-vapor
“”We estimate that the excess water vapor is equivalent to around 10% of the amount of water vapor typically residing in the stratosphere,” which is the biggest increase scientists have ever seen, researchers wrote in the new paper, published online July 1 in the journal Geophysical Research Letters. The water vapor may remain in the stratosphere for around half a decade, the researchers wrote.”
DR ROY SPENCER (and any readers willing to learn):
If you’d like to know why the red line on your graphs shows net global cooling due to the decline of the superimposed natural 60-year cycle that is regulated by the effect of the Sun and planets on cosmic ray intensity (such rays assisting cloud formation) and if you want to know about my world-first discovery that enables a correct explanation of temperatures in the core of the Moon, the surfaces of Venus and Earth and the temperatures at the base of nominal planetary tropospheres then you have only to read …
https://www.researchgate.net/publication/324664270_Comprehensive_Refutation_of_the_Radiative_Forcing_Greenhouse_Hypothesis
and
https://www.researchgate.net/publication/337915619_Cogent_and_irrefutable_reasons_why_carbon_dioxide_cannot_warm_Earth
PS: May I use your temperature graphs in major court action soon to take place in Australia following several FOI’s to the CSIRO?
I see that there have been 60 new reads of my first paper above
today since I posted this comment. They are probably mostly silent readers here.
https://www.researchgate.net/publication/324664270_Comprehensive_Refutation_of_the_Radiative_Forcing_Greenhouse_Hypothesis
TO DUG –
https://tinyurl.com//banned-by-roy
TO DUG, AGAIN
https://tinyurl.com/banned-by-roy
No physics in any of your comments, so no need to reply.
Your “May I use your temperature graphs in major court action soon to take place in Australia following several FOI’s to the CSIRO” does not look like a physics question to me, Dug.
Did you finally send a C&D letter to Judy?
Still no physics from you. I guess your belief is that physics doesn’t need empirical support. The question was addressed to Roy and his graphs support the prediction I made and archived in August 2011 on my first climate website (visited by over 73,800) …
“From 2003 the effect of El Nio had passed and a slightly declining trend has been observed. This is the net effect of the 60-year cycle starting to decline whilst the 934 year cycle is still rising. By 2014 the decline should be steeper and continue until at least 2027. (This statement was archived 22 August 2011 here)”
Still another response from you, Dug.
Found the threat back:
https://judithcurry.com/2015/02/12/open-thread-24/#comment-675543
Do you seriously think Judith Curry has a correct understanding of entropy? As for you, you haven’t even read my paper about this, or my article on Loschmidt who was right beyond a shadow of a doubt because the gravito-thermal effect is a direct consequence of the Second Law of Thermodynamics. But I don’t expect you to ever understand why as you will never read my material on this. That’s your loss. That’s why you can’t explain what process raises the Venus surface temperature on the sunlit side. For silent readers the refutation of the pathetic climatology attempts to prove Loschmidt wrong is on the “WUWT Errors” page on my second climate website http://climate-change-theory.com
I think Judy has the correct understanding of sock puppetry, Wendy.
You might also like:
https://climateaudit.org/2012/01/26/another-ipcc-demand-for-secrecy/#comment-323283
There are other papers for those genuinely interested …
https://www.researchgate.net/publication/337915638_Understanding_Josef_Loschmidt's_Gravito-_Thermal_Effect_and_thus_Why_the_Radiative_Forcing_Greenhouse_Hypothesis_is_False
and
https://www.researchgate.net/publication/318008633_Planetary_Core_and_Surface_Temperatures
Reminds me of the last phase of a slight negative global trend from about 2001 to about 2015. So if that is an analogy then about 8 to 10 years more of this and then a giant El Nino phase and step up to the next plateau? This would potentially be an accurate time to compare climate models performance to data because it is getting near the center of the plateau. The pattern is a lot like a step function
All the warming occurred due to natural cycles which will now be trending more negative. ENSO activities tend to mask these natural cycle transitions.
The 1997 super El Nino hid the 1995-97 AMO warm phase transition while the 2015-16 super El Nino hid the PDO phase change right before it.
I don’t see much contribution to the trend from natural cycles. The model UAH = -0.32 + [1.6*log2(CO2)] + [0.12*ENSOlag5] + [0.14*AMOlag2] + [0.01*PDOlag2] – [5.0*AODvolcanic] fits with an RMSE of 0.13 C which is only 0.03 higher than the Christy et al. 2003 assessed uncertainty of 0.10 C. The PDO contribution to the variation is 1/14 the contribution from AMO. Removing PDO, AMO, and ENSO from the model we get a best fit with 1.7 multiple on CO2. That means natural cycles are only contributing about 1/16 of the warming trend at least with this trivial 5 component model. If you want to me test other models let me know.
The PDO index is highly influenced by ENSO. Since we have non-neutral ENSO values about half the time, the PDO index is compromised during those periods.
ENSO is almost entirely noise and as I indicated tends to mask the influence of real climate factors. A simple model is therefore not really possible.
The real world is not always as simple as we would like.
“All the warming occurred due to natural cycles which will now be trending more negative.”
Uhh…. except PDO has been in down for awhile..nowhere to go but up.
https://www.ncei.noaa.gov/access/monitoring/pdo/
I use the JMA PDO data.
https://www.data.jma.go.jp/gmd/kaiyou/data/db/climate/pdo/pdo.txt
It was positive 2014-2020. Only turned negative with the current La Nina. The PDO tends positive during El Nino events and negative during La Nina events. You need to see where it goes when ENSO is neutral. Still TBD.
Love JMA data. Like Toyota won’t go all in on EV because they don’t buy the hype part of the growth models and acknowledge ICE sales will persist for longer, JMA seems objective to me and able to see through the hype.
PDO is a tricky beast because it depends on what filter or running average duration you apply to define it. You have to smooth out the El Nino in negative PDO phase and vice versa. Then I do believe there is a negative neutral and positive phase just like higher frequency El Nino.
So it’s better suited for looking back because the smoothing window is so large.
Similar to the low warming trend, there is a bit of cooling between major El Nino and the step up defines the warming. I think global cooling would be a longer plateau (extra few years) or a reduced step up. It will be subtle if global warming trend stops. If it does stop then CO2 is probably not linked to positive feedbacks and the forcing is reaching its maximum at 450ppm CO2 or so. Basically a new equilibrium with more clouds and a total of 1.5C total warming or so from CO2.
“except PDO has been in down for awhile..nowhere to go but up.”
Except for this month at least that is not true.
https://climatedatablog.files.wordpress.com/2022/10/pdo.jpeg
Looks down low to me…
Moderately negative in all sets since 2020.
weakly negative 2017-2019. Strongly negative since 2020.
” … while the 2015-16 super El Nino hid the PDO phase change right before it. ”
This is not the first time for me to suspect you to talk lots of superficial blah blah without being aware of the real situations.
ENSO and PDO have the very same origin, as you can see with a comparison of PDO and MEI data:
https://drive.google.com/file/d/1Vo2LXFNMd1ripgz99FQc2Svxq01U8ahx/view
The two may differ here and there, but their correlation is evident.
When PDO changes phase, be sure ENSO does as well.
Well as ENSO is scheduled for La Nina until next year, does that mean that the (low) PDO is likewise?
https://climatedatablog.files.wordpress.com/2022/10/pdo.jpeg
Bindidon, it is true that ENSO and the PDO are interrelated. However, the PDO has meaning when ENSO is neutral. This tells us what unique conditions the PDO represents. It takes a little more thought to work your way through it.
Science is not always simple.
I am presently raising another $33,000 or many months from home by doing terribly honest and easy on-line sports activities from home. The month comes from this interest at home.~te50″~ im currently interacting in short throughout this interest and creating plenty of cash online victimization the usable helpful resource of by using the balance at intervals
the given stats system http://doingwork12.blogspot.com
solar cycles comparison chart
https://i.postimg.cc/76w2nggS/solar-cycle-comparison.png
I see some Solar scientists, the ones that predicted very high SC25, starting to signal the arrival of the Solar maximum already, this is only two month after I and Ren first called it,
that is very surprising , I didnt expect them to come around so quickly.
Sorry, but the forecast of circulation during La Nia applies to summer circulation rather than winter circulation. Winter circulation in the Northern Hemisphere depends on the polar vortex pattern established in October. It is already known that the stratospheric polar vortex will be unstable and flattened over the Bering Sea. Winter in Europe may be warmer, but there is a likelihood of a sudden warming of the stratosphere. Since the solar wind is quite variable (jumping) the jet current will loop, so precipitation forecasts are highly uncertain, as in autumn.
The polar vortex pattern indicates the possibility of cold fronts descending on the southern US in winter.
https://i.ibb.co/3R6kJ5Q/gfs-z50-nh-f00.png
“As a strong cold front moves through, the jet stream will quickly sink out of Canada and well south of the region, allowing polar air to spill southward and eastward,” AccuWeather Senior Meteorologist Mike LeSeney explained.
https://cms.accuweather.com/wp-content/uploads/2022/10/cold-front-update.jpg?w=632
The surface temperature across the equatorial Pacific is 0.4 degrees C lower than the 1971-2000 average, and the temperature in the Nino 4 region is very low, foreshadowing a long La Nina. Certainly until the end of winter in the northern hemisphere.
https://i.ibb.co/t4QsPGQ/gfs-world-ced2-sstanom-1-day.png
https://www.tropicaltidbits.com/analysis/ocean/nino4.png
What will autumn be like in the southern hemisphere? Long and cool.
https://www.cpc.ncep.noaa.gov/products/stratosphere/strat-trop/gif_files/time_pres_TEMP_MEAN_ALL_SH_2022.png
https://www.cpc.ncep.noaa.gov/products/stratosphere/polar/gif_files/ozone_hole_plot.png
SOI changes from 2020.
https://i.ibb.co/f24J9v8/soi30.png
Where did they disappear to?: Russian MP says 1.5 mln military uniforms are missing
“Russias MP for Zabaykalsky region lieutenant general Andrey Gurulev has said that 1.5 million sets of military uniform had gone missing, reports local outlet Tayga.info.”
https://novayagazeta.eu/articles/2022/10/02/where-did-they-disappear-to-russian-local-pm-says-1-5-mln-military-uniforms-are-missing-news
Linked from https://instapundit.com/
It is mystery.
I think related to CIA bureaucrats having a faddish for them and paying far more money than they would pay for any dress.
So, it went down a bit, and I thought it would go up a bit, due
to the cooler weather I am having.
I wonder if this works:
https://wattsupwiththat.com/2022/10/01/what-is-milankovitch-theory-what-is-it-not-and-what-can-we-learn-from-it/#comment-3612492
If so I wrote without enough coffee and probably didn’t mistype much- there is some, but I like the gist of it
Well, they have given Sept yet:
https://gml.noaa.gov/ccgg/trends/
For people that say it’s important, they are slackers.
The “monopoly” of measuring global CO2 from volcanic mountain and
they are lazy.
NASA is similar- they don’t do the paperwork. The only people who write, anything- can’t anyone to pay them for their bad novels.
NASA PR, sucks, but in terms of archives, it’s roughly non existent.
You know the reason is they are paid too much.
If want a bureaucracy which works, you need a bunch of monks.
Of course one has to be strict with the monks, or god knows what trouble they can discover.
It seems the religious climate cargo cult is being whacked a lot but like any lazy monks, they can take a beating. Unlike mere bureaucrats, I hope getting paid enough.
If think the end of world has something to do CO2 level, how you be bureaucrat and not report on CO2 levels.
Of course with any religion, most of it, is virtue signaling.
Maybe they wait to asked for it. If someone is asking for it, maybe that mean it’s important. Their thankless job, can something like a thank you.
What the heck are you whining about? https://gml.noaa.gov/ccgg/trends/monthly.html
yes can they be adding to a monthly number, when month ends?
how is hours or days late, better?
Maybe it is some Hawaiian holiday
September 2022: 415.95 ppm
September 2021: 413.30 ppm
https://gml.noaa.gov/ccgg/trends/
I fail to see the obstacle… https://youtu.be/pNQPLewGR9k
gbaikie
” The monopoly of measuring global CO2 from volcanic mountain and
they are lazy. ”
*
The only one who is lazy, and above all incredibly ignorant: that’s you.
How is it possible to still ignore such facts as
https://gml.noaa.gov/webdata/ccgg/trends/global_trend.png
published years and years ago?
Your post is as arrogant and as stupid as the trash endlessly posted by Robertson about time dilation, the lunar spin, viruses, temperature time series and lots of other things like the Russian aggression war against Ukraine.
THANK YOU!
Lazy?
Thank you!
I thought I typed way too much.
Here, you are wanting me to type a lot more.
But we in Ice Age and the topic is a bit boring.
” I see some Solar scientists, the ones that predicted very high SC25, starting to signal the arrival of the Solar maximum already… ”
Who are these ‘Solar scientists’, why are they kept anonymous?
And where can we find their publication confirming that they have started signaling that impending SC25 maximum?
*
I know of a group that predicted a very high amplitude of the SC25, due to an incorrect calculation for the terminator of the last 22 year Hale cycle (and hence of the SC24): McIntosh et alii.
https://link.springer.com/article/10.1007/s11207-020-01723-y
They reduced their prediction, which however still is around 190, way above many other predictions:
https://en.wikipedia.org/wiki/Solar_cycle_25#Predictions
We could see McIntosh & alii as kinda Zharkova’s counterpart, located at the opposite end of the prediction spectrum.
Weak autumn for solar panel power in Europe.
https://i.ibb.co/mG3SYTW/gfs-cape-eur72.png
I will tell you After you answer this
https://www.drroyspencer.com/2022/07/uah-global-temperature-update-for-june-2022-0-06-deg-c/#comment-1332151
Would that count:
https://wattsupwiththat.com/2020/10/06/new-prediction-of-solar-cycle-25/#comment-3098239
Willard
I really recall people having claimed that SC25 would keep below SC24 from the beginning, but can’t find back to the place where I read that.
My bad.
*
But your WUWT link was pretty welcome!
Check out Javier’s lyrics a bit below
https://wattsupwiththat.com/2020/10/06/new-prediction-of-solar-cycle-25/#comment-3098236
which is close to what I remember, albeit far less drastic:
” We should therefore expect SC25 to be slightly less active than SC24, but not much. Perhaps 10-20 % less active. ”
*
Babbling Edog can avoid my question for as long as he wants.
Bindiclown made up totally bull zshitt claim that “many people claimed SC25 would stay from the beginning below SC24” in order to try to defend his misaligned misshifted charts he keeps posting
Thats all there is to it.
He has deluded himself into believing that the SC25 ramp up ahead of the official prediction “Red Line” is sure indication that SC 25 will be much stronger than SC24.
But when properly aligned you can see the two cycles run perfectly together, in practical sense you could hardly get any better fit than this .
https://i.postimg.cc/nLKZLshM/Clipboard012.jpg
Also nice to see the Bindi’s Forecasting gurkengruppe member #4 Willtard is back to sidekicking in Bindidong’s threads.
The fun will continue
1. ” … in order to try to defend his misaligned charts he keeps posting ”
For the third time: show us where I posted misaligned charts, babbling Edog!
Until now, you were not able to to that. Thus you are a liar.
*
2. ” I see some Solar scientists, the ones that predicted very high SC25, starting to signal the arrival of the Solar maximum already… ”
Stop your prepubescent blah blah, babbling Edog, and manage to finally answer my question below:
Who are these ‘Solar scientists’, why are they kept anonymous?
And where can we find their publication confirming that they have started signaling that impending SC25 maximum?
Does that count as someone who claims that SC25 will be lower than SC24, Eboy:
https://wattsupwiththat.com/2016/12/21/solar-cycle-25-amplitude-prediction/
I’m glad you’re having fun.
Thanks Willard
I didn’t read Archibald’s guest post in 2016, but that was indeed the place I saw links to later on.
Good job.
Babbling Edog now might better understand the strong connection between pushing GSM ideas and the Heartland+GWPF love affair:
https://www.heartland.org/about-us/who-we-are/david-archibald
Binny,
Given up on the GHE, have you?
Maybe you realised that predicting GHE heating by dissecting four and a half billion years or so of global GHE cooling was likely to make you look deranged.
What’s the latest? Peering into a crystal ball? Examining the entrails of dead animals? How about casting runes, or reading the Tarot cards?
Or you could just believe the IPCC who stated that it is not possible to predict future climate states.
Are you really a member of the gurkengruppe (yes, I had to look it up to confirm my guess), as well as a certifiable SkyDragon?
Oh well, back to poring over your historical records.
“I really recall people having claimed that SC25 would keep below SC24 from the beginning, but cant find back to the place where I read that”
You can’t find them because they don’t exist , because you lie and make up zshitt claiming people said things they never did.
But if you think you can then I will answer, that’s the deal,
So try harder Bidenito, try harder.
Interestingly NASA SC25 forecast straight from their website
– The maximum of this next cycle measured in terms of sunspot number, a standard measure of solar activity level could be 30 to 50% lower than the most recent one.
So NASA must have the strongest Heartland+GWPF love affair of all
So Babble on, Babble on …….
How about James, Eboy:
https://wattsupwiththat.com/2018/02/09/forecast-for-solar-cycle-25/
Are you saying he does not exist?
It’d be sad if PeterD did not exist:
https://wattsupwiththat.com/2019/12/12/deep-solar-minimum-on-the-verge-of-an-historic-milestone/
Weary Willard,
Still believe that people can look into the future? How do you know that they are not just guessing – like any 12 year old child can?
Babble about educated guesses if you like, but then you might have to say that stock market crashes, military catastrophes, economic collapses all occurred because the future sellers were not educated enough!
How educated does a climate scientist need to be, to predict that the GHE which caused four and a half billion years or so of cooling, is now going to cause the planet to warm?
Even a 12 year old wouldn’t fall for that one. Gullible SkyDragon cultists, on the other hand, believe any nonsense served up to them – by a faker fraud, scofflaw and deadbeat, in the case of Michael Mann PhD.
You really are a gullible little SkyDragon, aren’t you?
Looks like Eboy knows about DaveA:
https://wattsupwiththat.com/2020/04/22/solar-cycle-25-has-started/#comment-2974835
Willard the nitwit troll strikes again –
“Looks like Eboy knows about DaveA:”
Very erudite and informative – not.
Willard is still trying to avoid admitting that the GHE caused four and a half billion years or so of cooling of the Earth.
He can duck, dodge, and divert, but he still can’t avoid reality!
Not getting a lot of support is Wee Willy – even from other SkyDragons.
How sad is that?
.
Anyone who believes Postma’s first paper on the Sky Dragon site for Principia Scientific International (PSI) could read my refutation of Postma on the “PSI Errors” page of my second climate website visited by over 3,800 at…
http://www.climate-change-theory.com/PSI.html
Oh, Dug:
https://cliscep.com/2019/01/14/the-two-faces-of-denial/
But if we throw Mike Flynn into the mix, that should be an amusing 1%!
” You cant find them because they dont exist , because you lie and make up zshitt claiming people said things they never did. ”
Babbling Edog, you are really a dishonest Idiot.
Willard just showed two of the places I myself had forgotten in between:
1. Javier 2020
https://wattsupwiththat.com/2020/10/06/new-prediction-of-solar-cycle-25/#comment-3098236
2. Archibald 2016 (a much worse and lower SC25 prediction than Javier’s)
https://wattsupwiththat.com/2018/02/09/forecast-for-solar-cycle-25/
How is it possible to be so dumb and dishonest?
And this is babbling Edog’s next lie:
1. ” He has deluded himself into believing that the SC25 ramp up ahead of the official prediction Red Line is sure indication that SC 25 will be much stronger than SC24. ”
Where did I claim such nonsense?
*
2. ” But when properly aligned you can see the two cycles run perfectly together, in practical sense you could hardly get any better fit than this .
https://i.postimg.cc/nLKZLshM/Clipboard012.jpg ”
This is my monthly SSN graph I show updates of since over one year:
https://drive.google.com/file/d/1b54YWRqBlvD9W7moPt3nX7ByqHNPV2-W/view
and the same stuff with the Modern Maximum during SC19 above them:
https://drive.google.com/file/d/1nXwN72HFEd0GzqlC0tQUYv5vsKCcBc3o/view
*
And here is the daily data:
https://drive.google.com/file/d/1Yu9G_SqfDMF3upJnOh_EmW6RLjHeuA5a/view
Where did I show any ramping up?
All you are able to do is polemic and blah blah below the belt.
Little Willy, please stop trolling.
I am listening to Scott, but I don’t much patience.
He says US has bad energy policy.
Well US Dept Energy only gets 31.7 billion per year, what do you
expect. I would expect if it got 1/2 as much, US might get
a better policy. If not, at least you save few billion dollars per year.
What would a good US energy policy?
Well I have a question, can you mine oceanic Methane Hydrates.
I don’t know how many decades, that has been a question.
What the answer? Fusion energy has hopeless for a lot more
decades of this question, and not being answered.
One might say fusion has a better excuse, but at least they keep on saying, we have it, in the next decade.
I don’t think anyone imagines, a government will be making cheap fusion energy. Not 10 year from now, or ever. rather whether governmental research can find a way to make happen for any amount time- and far from making cheap fusion energy.
It’s similar to lunar water mining, we trying to determine if it’s mineable and NOT whether a government can mine lunar water.
A government can’t mine any kind of methane- never mind whether it’s hundreds of meter below the ocean surface. Nor can mine gold or lunar water. Nor can a government make Fusion energy cheap.
So, is ocean methane Hydrate mineable. And when and where.
So, we have a bad US energy policy because we paid Dept of Energy too much money to do utterly nothing vague important.
But Scott was probably going to talk about something, more insane, in regards to solar and wind and the preventive of nuclear energy use.
Fusion vs Methane Hydrate which more important?
If want some crazy monopoly on Energy, and cause global poverty- I would think Fusion energy is more important.
But if want the world to weathier, less wars, and roughly a better world, I think Methane hydrate would be more important than Fusion energy.
And in terms CO2 reduction, what have worked is better efficiency, nuclear, and natural gas use.
Since governmental policy has opposed this and for other kind governmental policy [involving trillions dollar wasted make essentially toxic waste- the US government has only increased CO2 emissions. As has EU government policy said to be about reducing global CO2 emission, when it obviously is not.
One could blame the global satellite market for making solar panels which they need for satellites. But in terms access to vast potential of usable energy- the space environment has endless potential.
So, it seems US should be quicker at exploring the Moon and then exploring Mars- if a govt actually wants to do something related to lowering CO2, rather everyone else actually doing something about lowering CO2 emission.
Or govt has chance of doing something, important. But it seem govt
is running out time, to be significant players in space exploration.
It could bad lesson for future, if it shown a govt can do something useful- so, good work NASA in delaying doing anything important.
Thanks also goes to FAA. And every other part of US government.
There was talk of greening of Sahara desert and I wanted an update,
but I got this instead:
“In the future, the Sahara and Sahelian regions could experience more rainfall than today as a result of climate change. Wetter periods, termed African humid periods, occurred in the past and witnessed a mesic landscape in place of todays hyperarid and semiarid environment. Such large past changes raise the question of whether the near future might hold in store similar environmental transformations, particularly in view of the growing human-induced climate, land-use, and land-cover changes.
…”
https://www.sciencedirect.com/science/article/pii/S2590332220301007
So, I got distracted.
Who else thinks “the Sahara and Sahelian regions could experience more rainfall than today as a result of climate change.”
Which doesn’t matter much if it takes 100 years or more, so the question is how soon will have much more noticeable effect.
Or if at some point, say 10 years from now, if you do search, than one could something like, the Sahara has been greening a lot more, like 1 million square km.
Or related question is, there are attempting to green the Sahelian regions, in 10 years, which will green more, human effort or nature?
Anyhow next couple down is report which looks older than 10 years,
again, I wanted something more recent, but:
“This article will show an example of a positive effect of warming.
The people living in the Sahel, a semiarid area just south of the Sahara desert, spanning the entire African continent from the Atlantic Ocean to the Red Sea, were suffering from several devastating droughts and famines between the late 1960s and the early 1990s.
The draughts were triggered by decreases in rainfall from the early 1950s to the mid-1980s.1 Global warming was supposed to increase the frequency and severity of the droughts, which would make crop-growing unviable and cause even worse famines.2 According to the
United Nations, the outlook for the people in the Sahel was bleak.
The Sahel is greening
However in sharp contrast to this gloomy outlook, it seems that global warming has exactly the opposite effect on the Sahara and the Sahel. The Sahara is actually shrinking, with vegetation arising on land where there was nothing but sand and rocks before.”
https://www.thegwpf.org/images/stories/gwpf-reports/mueller-sahel.pdf
Whatever, but what about something happening in 2020+?
I am first to say we don’t get news, but doesn’t seem very hard to say something about it.
Something like, but less boring:
Could the Sahara ever be green again?
By Donavyn Coffey
published September 27, 2020
And more old stuff:
https://www.climamed.eu/wp-content/uploads/files/Greening-of-the-Sahara.pdf
2006 is mentioned:
https://www.nature.com/scitable/knowledge/library/green-sahara-african-humid-periods-paced-by-82884405/
I was ignoring videos, but I guess I have to look it:
https://www.youtube.com/watch?v=Z1yM8uxkEQw
It’s ok, but thinks solution is littering Sahara with toxic waste
https://www.youtube.com/watch?v=dFHmVfhLluM
Planted 2 million trees
https://www.youtube.com/watch?v=S3FVyv27h3Y
A bit amusing. Mostly blather, and selling tourist destination,
Sahara will save us and murder us. Lot’s of drooling.
3 videos was more than I wanted to watch.
I think I rather get the wisdom from posters who have lots of opinions about climate issues. And what are religious views climate cargo cult members.
For some reason, La Nina has driven hot water and air from the Tropics into the northern Pacific.
All current warming is caused by ocean oscillations.
Gordo, What’s the average of an “oscillating” voltage, such as a sine wave of fixed amplitude? Does it increase with time?
swannie….your question is dumb and worded like a gotcha.
The red curve on Roy’s graph shows two sine-like waves back to back and as you know, the average is zero. That means we’ve had no warming since 2015.
There was a sudden and unexplained warming of about 0.25C in 2015. Ignoring that, we’ve had no warming trend since 1998, some 24 years.
That 2015-2016 warming coincides really well with an El Niñ.
Swanson is just another braindead cult idiot. If you remember, he’s the one that claimed he “built satellites”, but doesn’t have a clue about orbital motion. He’s also the one that performed two “demonstrations” that demonstrated he didn’t know anything about radiative physics.
He’s so incompetent and immature that he tries to mimic worthless willard!
They’re so desperate.
Where’s Graham, Pup?
I miss him already.
Little Willy, please stop trolling.
If el ninos are the repeated cause of step ups in global warming, then we should have had several degrees of warming since 1900.
Obviously, el Ninos don’t cause long term global warming, just transient spikes.
Which, imposed on a warming trend, could look like ‘steps’…
One more time, Robertson repeats the same mistake.
How could we have any warming since 2015 when 2016 has shown the highest anomaly since series begin in 1978?
Some idea, you genius?
Gordo, your comment is structured as though you were trolling. Of course, the average of a sine wave is zero. But, what does that have to do with ENSO and global temperatures, which have been demonstrated to be warming for decades? As grammie pup noted, your “sudden and unexplained warming” is the result of the strong El Nino in 2016.
ENSO has not shifted in peak El Nino temperatures since 1878.
ENSO by definition doesn’t have any long-term change.
are you now going to argue that there is, contrary to what you just said, a change in ENSO over the long term, RLH?
“Ignoring that, weve had no warming trend since 1998, some 24 years.”
So ignoring the warming, we’ve had no warming?
Actually in about half the years there was warming, and overall a NET warming.
The PDO (www.data.jma.go.jp/gmd/kaiyou/data/db/climate/pdo/pdo.txt) went positive in February 2014. That led to cloud thinning as seen in CERES data. As a result, more solar energy reached the surface and led to 6 years of warmer temperatures. Appears that is now over.
Ocean cycles are exactly what has been driving climate change.
There is another tropical storm, called Paine:
https://www.nhc.noaa.gov/?epac
I guess that was the one which had 80% of forming
And Atlantic got one with 70% chance forming in next 48 hours:
https://www.nhc.noaa.gov/?atlc
And Orlene hurricane apparently weaken to tropical storm at landfall.
Is warm up there? It’s not very warm here {and getting below 15 C at night].
Solar wind
speed: 565.4 km/sec
density: 11.05 protons/cm3
Daily Sun: 04 Oct 22
Sunspot number: 144
The Radio Sun
10.7 cm flux: 155 sfu
Thermosphere Climate Index
today: 15.76×10^10 W Neutral
Oulu Neutron Counts
Percentages of the Space Age average:
today: +1.1% Elevated
48-hr change: +0.0%
https://www.spaceweather.com/
POSSIBLE CANNIBAL CME EVENT: According to NOAA forecasters, multiple CMEs are heading for Earth. ETA: Oct. 4th. This could be a “Cannibal CME” event. Take a look at this NOAA model. Cannibal CMEs form when a fast-moving CME devours one or more slower CMEs ahead of it. The combined cloud contains tangled magnetic fields that can do a good job sparking auroras.
Well probably not going get any here, but Canadians could have something to watch
I can’t imagine the Neutron count not lowering
SSN for Oct 4 at 144?
Here is SILSO’s Estimated SSN for October:
2022 10 01 2022.749 99 12.2 19 24
2022 10 02 2022.752 124 14.2 23 28
2022 10 03 2022.755 158 18.9 31 37
2022 10 04 2022.758 160 16.6 24 30
No reason to get excited of course.
It might take a bit longer, but roughly I agree.
And roughly, I believe that agrees with Zharkova
Solar wind
speed: 526.7 km/sec
density: 10.58 protons/cm3
Daily Sun: 05 Oct 22
Sunspot number: 153
The Radio Sun
10.7 cm flux: 155 sfu
Thermosphere Climate Index
today: 16.10×10^10 W Neutral
Oulu Neutron Counts
Percentages of the Space Age average:
today: +1.2% Elevated
48-hr change: -0.3%
Lots of big spots- most in north and less in south.
Some northern spots going farside, soon and large northern
group which just came from farside seems rather menacing-
mainly because it’s big and it seems to me, it might get bigger
Solar wind
speed: 475.2 km/sec
density: 7.45 protons/cm3
Daily Sun: 05 Oct 22
Sunspot number: 153
The Radio Sun
10.7 cm flux: 155 sfu
Thermosphere Climate Index
today: 16.21×10^10 W Neutral
Oulu Neutron Counts
Percentages of the Space Age average:
today: +2.5% Elevated
48-hr change: +1.0%
Yeah about same, expect neutron count went up
which only thing I care about, Which could not imagine
it going up- and it did.
Maybe it’s temporary- and I don’t care about temporary
as care about week or more time of it- +5 for more than a week
will bump up space radiation effect on people. Though massive
ejection of highish velocity particles is the more acute radiation
problem, but that’s why you solar flare shelter in any ship
with crew in it and crew might need to hold up in it for a day or so.
Though if could know more precisely about about them, you could spend less time confined in this small space, waiting for dangerous time to pass.
Why did it. It seems it’s the holes, wiki:
“A coronal hole is a temporary region of relatively cool, less dense plasma in the solar corona where the Sun’s magnetic field extends into interplanetary space as an open field. Compared to the corona’s usual closed magnetic field that arches between regions of opposite magnetic polarity, the open magnetic field of a coronal hole allows solar wind to escape into space at a much quicker rate. This results in decreased temperature and density of the plasma at the site of a coronal hole as well as an increased speed in the average solar wind measured in interplanetary space.”
Oh, yeah, I know what it is:
OH SNAP! A MAGNETIC FILAMENT ERUPTS (UPDATED): Yesterday, Oct. 4th, a 200,000-km long filament of magnetism in the sun’s southern hemisphere erupted. Snapping like a rubber band, it hurled part of itself into space:”
So these sending a lot particles {solar flare] but I probably not at same speed- so most will take days to get, but ones going a lot faster, have already arrived and increased the Neutron Count.
So the high count should be for a brief period of time.
So fastest could be 1/10th of light so 8 min times 10 = 80 mins
and but 1/100th speed of light is probably high enough to cause a measurable of neutron counts.
I would guess this +2.5% Elevated is less of issue to airline crew, ISS, and any crew going to Mars.
Solar wind
speed: 502.6 km/sec
density: 9.62 protons/cm3
Daily Sun: 06 Oct 22
Sunspot number: 151
The Radio Sun
10.7 cm flux: 161 sfu
Thermosphere Climate Index
today: 16.21×10^10 W Neutral
Oulu Neutron Counts
Percentages of the Space Age average:
today: +2.7% Elevated
Solar Max conditions- other than Neutron Counts
Solar wind
speed: 489.3 km/sec
density: 9.33 protons/cm3
Daily Sun: 06 Oct 22
Sunspot number: 139
The Radio Sun
10.7 cm flux: 161 sfu
Thermosphere Climate Index
today: 16.49×10^10 W Neutral
Oulu Neutron Counts
Percentages of the Space Age average:
today: +3.8% Elevated
48-hr change: +2.7%
Solar wind
speed: 499.5 km/sec
density: 6.97 protons/cm3
Daily Sun: 07 Oct 22
Sunspot number: 139
The Radio Sun
10.7 cm flux: 156 sfu
Thermosphere Climate Index
today: 16.52×10^10 W Neutral
Oulu Neutron Counts
Percentages of the Space Age average:
today: +4.4% Elevated
So, typical solar max conditions and
Neutron Counts are high
And:
“LONG DURATION SOLAR FLARE (UPDATED): Sunspot AR3116 erupted today, Oct. 7th, producing a long-duration M1-class solar flare. The explosion lasted more than 3 hours, giving it plenty of time to lift a CME into space. However, SOHO coronagraphs have detected no significant CME emerging from the blast site.”
https://www.spaceweather.com/
The red curve on Roy’s graph shows two sine-like waves back to back, the average is zero starting at 2015. That means we’ve had no warming since 2015.
There was a sudden and unexplained warming of about 0.25C in 2015 related to the super EN in 2016. Ignoring that, we’ve had no warming trend since 1998, some 24 years.
Yes, Gordon, as I predicted would be the case back in August 2011 – level temperatures until at least 2027. See earth (dash) climate (dot) com where my prediction has not been edited …
“From 2003 the effect of El Nino had passed and a slightly declining trend has been observed. This is the net effect of the 60-year cycle starting to decline whilst the 934 year cycle is still rising. By 2014 the decline should be steeper and continue until at least 2027. (This statement was archived 22 August 2011 here)”
> Ignoring that
C’mon, Gordo. You can ignore four things before breakfast. I’m sure you could say that we had no warming since the molten Earth at least.
Do better.
As usual, ignorant Dumbie Robertson only looks at ‘El Nino’s, while forgetting all ‘La Nina’s.
Dumb, dumber, dumbest.
Drop all ENSO and all volcanic events off a temperature time series, and you discover that the remaining trend is 70% of the original one.
I am presently raising another $33,000 or many months from home by doing terribly honest and easy on-line sports activities from home. The month comes from this interest at home.~px100~ im currently interacting in short throughout this interest and creating plenty of cash online victimization the usable helpful resource of by using the balance at intervals
the given stats system https://fixjob11.blogspot.com
Little Willy, please stop trolling.
Interesting that despite the triple dip La Nina the August and September UAHv.6.0 temperatures are above the long term trend.
https://woodfortrees.org/plot/uah6/from:1779/to:2023/every/plot/uah6/from:1979/to:2023/every/trend
Where is all the predicted cooling?
One conjecture is that the Hunga-Tonga volcano is over-riding this La Niña. If that’s correct, we should see drops in UAH as the effects of the volcano lessen, and La Niña continues.
We can be certain the temperatures are not being held up by nonsense like GHE, or “heat creep”.
Entropic man
” Where is all the predicted cooling? ”
*
In Roy Spencer’s following thread, I replied to Ireneusz Palmowski aka ren, using the chart below:
https://drive.google.com/file/d/1DQhVp9KN5ZHxKRL3RmnhawJmPfSNn1Eg/view
It seems to fit your question as well, because the problem is the same: many people, especially on this blog, are 100% convinced that ENSO signals and temperatures are automatically correlated signals.
Some think even that if the trend of SSTs used to compute an ENSO index decreases, there can’t be really any warming.
OMG.
So do tell me how less warming in the tropics has no effect as most of the energy placed into the system occurs between 30N and 30S?
Which Tropics are you talking about?
A reduction in Antarctic sea ice appears to be the main reason for the slightly warmer anomalies. The Tonga eruption also may be a factor.
more support for the CERES claims of shortwave budget dominating since 2000
implying the best planning scenario for next 50 years is somewhere between a random walk and a continuation of the satellite-era trend
obliquity-driven reglaciation fortunately probably still a couple millennia away, though even a few decades of cooling could reverse some of the historic gains in crop yields
total accumulated waste from all warming reduction attempts (voluntary and coerced) stands at tens of trillions of dollars and millions of excess deaths, or roughly equivalent to the COVID pandemic or a major regional war, and rising quickly
great fodder for centuries of studies on moral panics
” … stands at tens of trillions of dollars and millions of excess deaths … ”
Typical nonsense written by one of these Supermaga Specialists, without a shadow of a proof sustaining that nonsense.
if you look outside, there’s a crowd of starving Sri Lankans with some evidence to share
What do these poor starving Sri Lanka people have to do with your text based on discrediting science?
td…there is serious corruption in politically-driven science. Outright lies.
We have an apologist for them, Bindidon, the other respondent to your post at this time. Binny thinks it’s cool to lie to people since he does it all the time.
… says Putin’s endless butt-kisser, who discredits, denigrates and insults all people who think otherwise than his trivial blah blah.
Robertson even called Andrew Motte, Newton’s great translator of Principia, a “cheating SOB” (son of a bitch to those who don’t know what that means) just because he wasn’t able to read Newton’s perfect Latin text correctly, and thought that Motte had mistranslated Newton.
“more support for the CERES claims of shortwave budget dominating since 2000”
What support?
By coincidence I was reading this post on CERES. You might enjoy the insight.
https://www.realclimate.org/index.php/archives/2022/09/a-ceres-of-fortunate-events/
Best paper coving the CERES data is Dubal/Vahrenholt 2021.
https://www.mdpi.com/2073-4433/12/10/1297/htm
Not at all surprised that real climate spews nothing but science denial. Admitting reality is getting harder and harder for them.
Did you read the article? It covers the same ground as the paper you linked and even mentions the paper which you deem to be the “best,” for reasons unmentioned.
https://www.holidayatthesea.com/music/dire-straits-rockpalast-1979?format=amp
However, some areas may still see their first snowflakes of the season since temperatures will drop to low enough levels.
In the Lower 48, snow could first occur across portions of Minnesota and northern Michigan Thursday night before pushing eastward into the Northeast to start the weekend. However, despite the sudden surge of cold air, the snow is likely to be very light and is unlikely to accumulate.
https://www.accuweather.com/en/weather-forecasts/blast-of-winterlike-cold-on-the-way-for-midwest-northeast/1257697
BREAKING NEWS
Graham is back:
https://www.drroyspencer.com/2022/10/no-climatologists-did-not-forget-the-sun-was-shining/#comment-1374781
This makes my day!
\o/
Little Willy, please stop trolling.
I am presently raising another $33,000 or many months from home by doing terribly honest and easy on-line sports activities from home. The month comes from this interest at home.~px110~ im currently interacting in short throughout this interest and creating plenty of cash online victimization the usable helpful resource of by using the balance at intervals
the given stats system https://fixjob11.blogspot.com
WordPress claims this post is a duplicate but I cannot see the original. I searched for it using words pertinent to the post. I am posting in parts to see if that helps.
***
rlh…”ENSO has not shifted in peak El Nino temperatures since 1878″.
***
I am not arguing there is no underlying warming. Obviously EN peaks are built on a warming since 1850. However, a visual inspection of Roy’s graph shows no trend from 1998 onward. I am basing that on the assump.tion that the 0.25C warming in 2015 – 2016 is not global warming but an unexplained anomaly related to an extreme EN.
Equally obvious, the research into ENSO, the PDO, and AMO, etc., is in its infancy. The PDO was not discovered till the 1990s, previously being called the Great Pacific Climate Shift due to a sudden up.tick in global temps of 0.2C in 1977 that no on has ever explained. It has not dissipated to date.
part 2…
Odd that it posts in parts but does not show up as a complete post.
These sudden up.ticks, including the one circa 2002, account for unexplained warming of at least 0.5C since 1977. I would not expect re-warming from the Little Ice Age to have a linear trend, so maybe these up.ticks are some sort of response to the overall re-warming.
Besides the paper by Tsonis et al that equated global warming/cooling to ocean oscillations like those listed above,the study has never been replicated, to my knowledge. I am willing to bet no one can get funded for such a study.
swannie…”Gordo, your comment is structured as though you were trolling. Of course, the average of a sine wave is zero. But, what does that have to do with ENSO and global temperatures, which have been demonstrated to be warming for decades? As grammie pup noted, your sudden and unexplained warming is the result of the strong El Nino in 2016″.
***
I am referring to the step warming of about 0.25C circa 2015. I get it that the EM temporarily drove global temps up nearly 1C, but the process left a residual of 0.25C, which is unexplained. Then the trend flattened at abut 0.25C for 6 years.
You cannot include that step warming as part of a 4 decade trend. Not a linear trend with such discontinuities in it.
Gordo’s trolling again. Where does he find his “step warming of about 0.25C circa 2015”. Such a jump does not appear in the UAH LT data. Perhaps he is thinking of the 2016 spike from El Nino that year, but who knows what’s in his brain?
swannie…look at the previous 18 years on Roy’s graph going back to 1998. In 2015, the series rose above the baseline and should have returned to the baseline following the 2016 EN.
It didn’t, rather it settled out with a new flat trend about 0.25C above the baseline. Why??? CO2 could not produce such a warming in a year?
Same thing happened after the 1998 EN.
Here’s a graphical view that shows the quick rise. You can argue exactly how much is PDO (2/2014 phase change) and how much was the El Nino.
Ask me again, where is the superdeveloping La Nina ???
https://bit.ly/3EiJrKo
https://www.msn.com/en-au/news/techandscience/la-ni%C3%B1a-s-shock-return-suggests-important-details-are-missing-in-climate-models/ar-AA12BQmq
When the first article begins with “It’s the first time in a century that La Nia has stuck around for so long” you know there is no point reading further.
Are you a member of Bindidong’s forecasting Gurkentruppe ?
Seriously? Is that all you have to offer in rebuttal?
Did you actually read the article? If so, did you stop and wonder at the obvious incorrect statement? Or did you swallow it despite the strong stench, because it was the story you needed?
Your second post accusing me of not actually reading the article is direct contradiction to the first post where you claim there is no point reading it.
I say there is no point debating a debil who types posts like this
If I ask “are you dumb” am I accusing you of being dumb?
And if I say there is no point in ME reading your article, does that relieve you of the responsibility of YOU reading BEFORE I MADE THAT COMMENT an article that YOU ARE ENDORSING?
On a separate issue … Are you dumb?
bobdesbonddesMidasdesAntonin, please stop trolling.
Babbling Edog, with each such post you show a bit better what a bad boy you are.
0% science, 100% polemics.
aq…”When the first article begins with Its the first time in a century that La Nia has stuck around for so long you know there is no point reading further”.
***
Explain, s’il vous plait. The article makes far more sense than your brief analysis.
When someone makes a nonsense claim you know they have no idea what they are talking about.
For example, when someone claims that the moon’s phases are causes by the earth’s shadow.
bobdesbonddesMidasdesAntonin, please stop trolling.
Here we see what kind of ‘sources’ the babbling Edog is a gullible follower of:
” Carly Cassella is a Journalist at ScienceAlert. A science reporter with a background in neuroscience, she’s especially comfortable writing about health and medicine, but also loves covering nature, space, and the environment. ”
Anyone having experienced babbling Edog’s love to insult others can perfectly imagine what he would post if I dared to present a climate report written by a journalist ‘especially comfortable writing about health and medicine’.
Anyone!
Bindiclown’s posts age the best
http://www.drroyspencer.com/2021/05/uah-global-temperature-update-for-april-2021-0-05-deg-c/#comment-709017
According to this there have been 3 longer la ninas since only 1950…
https://origin.cpc.ncep.noaa.gov/products/analysis_monitoring/ensostuff/ONI_v5.php
What data is this wellness writer looking at?
She’s looking at a WMO press release and getting it wrong.
https://tinyurl.com/2jka48yg
WMO says first trip-dip la Nina THIS century (ie since 2001).
Stupid writer says first trip-dip la Nina IN A century.
She clearly hasn’t looked at any actual data before tapping away at her keyboard, and apparently has difficulty with reading comprehension.
Super forecaster Dinglebarry sidekicking and reminding us his great forecasting skilz
http://www.drroyspencer.com/2021/06/biased-media-reporting-on-the-new-santer-et-al-study-regarding-satellite-tropospheric-temperature-trends/#comment-726374
Trying to deflect from the gormless error in the article you linked won’t work.
I’m delighted that you keep linking to my old comment demonstrating the opposite of what you keep saying when you link it.
You’re still a f/w, Eben.
–The linear warming trend since January, 1979 still stands at +0.13 C/decade–
And:
“The New Pause Lengthens to 8 Years”
So when will it decrease to +0.12 or go back up to +0.14 C/decade?
Does seem like decreasing to +0.12 at least in the short term is
more likely?
Even if Europe burns down it’s forest due to their bad policies, that Global CO2 will increase much nor global CO2 levels going to rise much.
Not that CO2 levels have had any significant effect.
What seems to me which is having an effect is our cold ocean which
has average temperature of 3.5 C.
If our ocean average temperature was .5 C warmer, or ocean was 4 C
that would have an effect.
It seems to me that if ocean was 4 C there would a large increase in global average temperature.
And it seems global CO2 levels would be much higher.
NASA and NOAA both think that more than 90% of all warming effect from rising CO2 levels is warming our cold ocean.
But our ocean is much bigger than most imagine and it take a very long time to increase it’s average temperature.
I tend to think it possible humans will living on Mars before the ocean warms by .1 C
I have been thinking it would be possible to live in a warmer environment on Mars, then anyone is now living in.
This of course is quite easy if we find lots of underground area
on Mars- and this is certainly possible.
But I think if find mineable water on Mars this could be better way
to live in warmer environment.
Now, Martians might not want live in environment warmer than Earth is- and would be easier. But recently I have been wondering how one could live is warmer environment.
Mars has lot water- in terms of what 1 million Martians could need but it the amount that matters, it’s costs make the water available
to use.
Or we could say there is shortage of fresh water on Earth, but what meant is there is shortage of cheap enough fresh water.
And cheap enough is about $3 per cubic meter of water.
And for mineable water on Mars, the cost has to be about $1000 per cubic meter of water or it better if cheaper, that about as high as one could pay for water on Mars. Or as I usually say $1 per kg of water. Or use larger volumes, the US uses about 600 billion cubic meter of water per year. So, one say how much, how much per million cubic meter of water, which is less than $1 billion dollars per million cubic meter, is what would call mineable Mars water.
By the mineable water in regards to the Moon, is about $500 per kg
or less. Or with larger amounts, 500 billion dollar for a million cubic meter of water.
But lunar water has this high value, because the water would be to make rocket fuel. And it’s incorrect to talk such high volumes of water in regards to the Moon for number of reason. One reason is if one make lunar rocket fuel you significantly lower the cost to go to the Moon. and there the cost to mine lunar water lowers significantly. Instead you could say the first, 10,000 cubic meter
of lunar water could be around as high as $500,000 per cubic meter
which is 5 billion dollar, but next 10,000 could 1/2 the price and
by time you mined a million cubic meter it’s 1/10th the price or $50 per kg.
So if go to Mars and only mine, 10,000 cubic meter of water you going to cause the water to be more expensive, instead you have thinking
in terms 1 million cubic meter of water per year, and better if you mine 1 billion cubic meter of water per year.
So if spent $1 billion dollar in order to get to point of mining 1 billion cubic meters per year within a period of time of few year,
you could be making money.
This comparable to mining water in the Sahara desert:
https://en.wikipedia.org/wiki/Nubian_Sandstone_Aquifer_System
“The Great Man-made River Project (GMMR) in Libya makes use of the system, extracting substantial amounts of water from this aquifer, removing an estimated 2.4 km3 of fresh water for consumption and agriculture per year.”
Or 2.4 billion cubic meter of water per year.
So if living in a lake on Mars and water temperature is 20 C, that as
warm as living on Earth. But lake was 30 C, that would be warmer than Earth.
30 C water has much higher water vapor pressure than 20 C water- so
it’s hard to do.
But I think some people might like it better.
So one could 10 C lake, and people could live with that, and 20 C
lake might be warm enough for most people, but some people might prefer a 30 C lake. I don’t think anyone wants a lake as warm as
40 C [though lots people want a spot where the water is like a hot tub- but that is different than in living in it}.
And it seems to me that water partial pressure is same on Mars as on Earth.
And wiki gives a chart:
https://en.wikipedia.org/wiki/Vapour_pressure_of_water
So: 20 C is 0.0231 Atm and 30 is 0.0419 Atm
And as a reference, Mars average surface pressure is 0.095 psi
0.0231 Atm is 0.33957 psi at 20 C and 30 C at 0.0419 Atm is 0.61593 psi or 0.33957 vs 0.61593 psi
In terms of weight, Mars weight, is less. But in term of force or
psi it’s same [pounds per square inch of force}.
Or you need more than 4 feet ice on Mars to equal the force of 0.61593 psi. Though you could use cable attached anchor into the ground to provide the force- I rather, not, but could use some cables
in various places.
And as said, Mars water has to cheap, regardless if you want to live in a lake. Or if living in a cave and I assume you growing food, you need Mars water to be $1 per kg or less, to live on Mars.
And you also need electrical power power to only costs about 10 times the cost as on Earth. But over time, one needs to lower Mars water and power prices. Or within 50 years, you should be able to hope for Mars water and power to be cheaper than Earth’s price
Despite beginning this decade almost wholly with La Nina, the average for the 2020s so far is +0.226, compared to the 2010s average of +0.121.
The linear trend is +0.134 per decade. Given that it is written to 2dp, it has to rise 9 times as far to drop to 0.12 as it has to rise to reach 0.14.
Even if the next 15 months (taking us to the end of 2023) were all zeros, the linear trend would stay at +0.13, and the 2020s average would stay ahead of the 2010s average.
Perhaps you you actually do some simple research instead of relying on ‘feelings’.
Edit: It has to FALL 9 times …
I know it’s close to .014 C per decade, because it wasn’t long ago, it dropped from .014 C per decade to .013 C.
I just want to encourage the climate cargo cult believers, by giving them advantage.
Or giving them a handicap because they have always wrong over last few decades.
But it’s good thing you helping the people who think we going to cool a lot any time soon.
“Even if the next 15 months (taking us to the end of 2023) were all zeros, the linear trend would stay at +0.13, and the 2020s average would stay ahead of the 2010s average.”
We recently had below zeros and not many were particularly excited about it. But it seems 15 month in row at zero or below, would something to actually be excited about.
I would guess that returns us to the Pause, or becoming the greatest pause ever.
And I think you are mistaken.
But mean around -.4 C for two months in next 6 months which one could be tempted to say looks a cooling trend, is which starting.
I am asking about the short term or within the next 6 months.
More than a year is too boring. You got to write it down- and people forget, etc.
But anyhow, I agree in short term the odds favor .014 rather than .012
Heads up – we won’t go close to getting a month of -0.4. The forecasts are all for a third straight low-end moderate La Nina, and a short-lived one at that. The last month to reach -0.4 was Jan 2000, in the middle of a strong La Nina. The next bunch were in 1991-93 as a result of Pinatubo. Then 1989, another strong La Nina. The last one not explainable by a strong La Nina or VEI6 eruption was in 1986.
You talk about always being wrong, yet over that time you have continually been saying what WILL happen, but other than the expected response to La Nina it has never eventuated. Given that individual months are not predicted when dealing with climate, the only one who has been wrong so far is you.
How about you actually commit – what will be the average of the next 20 ENSO-neutral months (allowing for the 5-month lag at the start and end in determining whether a month is ENSO-neutral), assuming no VEI6 (or tropical VEI5) eruption?
(A) 0.3
I’m happy with a probability distribution for your response.
Here’s mine, to the nearest %:
(A) 0%
(B) 0 %
(C) 0%
(D) 0%
(E) 2%
(F) 8%
(G) 80%
(H) 10%
For some reason the options were cut out of the post. Here they are again:
(A) less than -0.3
(B) -0.3 to -0.2
(C) -0.2 to -0.1
(D) -0.1 to 0
(E) 0 to 0.1
(F) 0.1 to 0.2
(G) 0.2 to 0.3
(H) greater than 0.3
–Heads up we wont go close to getting a month of -0.4.–
So in next 6 months we won’t get close to -.4
And write that down as not low as -.35 C
It probably possible to go down to -.35 C and go up enough
to get to average .014 C per decade within 6 months.
So, when you think we return to .014 C per decade?
–You talk about always being wrong, yet over that time you have continually been saying what WILL happen, but other than the expected response to La Nina it has never eventuated. Given that individual months are not predicted when dealing with climate, the only one who has been wrong so far is you.–
I sort of, would liked to have predicted this famously long La Nina,
but I didn’t.
But I did say, or “predicted” that La Nina over in term causes global warming. Which I might be wrong about, but I don’t think so.
I also imagined that La Nina would cause more hurricanes- and obviously, that was wrong. Maybe the lack of hurricanes because it was sort a long duration.
But if predicted it would have been just a lucky guess.
I don’t know how to predict a La Nina, which not saying anything
because no one can.
But rather I don’t even try to predict them, but many try to do this. Or thought it was quite safe to predict La Nino is associated with more hurricane activity in the Atlantic.
But now, I have learned to be more uncertain about such assumptions.
Is there a reason you cannot post a probability distribution and comment on mine?
I really don’t care if or when it goes up to 0.14. The trend over the past 15 years (180 months) is +0.29.
–or predicted that La Nina over in term–
or predicted that La Nina over long term
or I think La Nina both warms entire ocean and allows more sunlight energy to be absorbed.
I think anything which warms the average temperature of our 3.5 C
ocean is global warming.
But it might work better if La Nina wasn’t so long.
But I pretend to be space cadet, rather than a weather guy.
We are in Ice Age and the Ice Age will continue and quite interested
in why anyone would think warming is bad.
Or 1 C warming has not been bad, and 1 C cooling is obviously known to everyone to be very bad.
–Antonin Qwerty says:
October 6, 2022 at 9:07 PM
Is there a reason you cannot post a probability distribution and comment on mine?
I really dont care if or when it goes up to 0.14. The trend over the past 15 years (180 months) is +0.29.–
Most people interested in climate, think 15 years is too short of time period. They like 30 years.
I think 30 year is far too short of time period in regards to global climate temperature.
My view is quite simple we are recovering or have recovered from the Little Ice Age. We have been in 5000 year cooling period,
This long term trend will continue.
I also have a wild idea [which isn’t that wild] that our cold ocean will not allow high CO2 levels.
And what might be a more crazy idea, I think China has reached Peak Coal.
So, US didn’t reach Peak anything, but China and other countries have reached Peak Coal- France did it, about century ago.
End of LIA vs Modern warming – what causes you to make your assumption about which is the cause and which is the effect?
The purpose of mentioning the trend was simply to show that there is no evidence for a slowdown in warming. Consider that done.
Nevertheless, it is interesting that you demand an extended period to judge an acceleration of warming, yet you lot assert that a couple of years’ slowdown due to La Nina is evidence for a cooling trend. You people seem to have a problem with consistency in your arguments.
Anyway, your comment suggests that you don’t believe in the proposed climate effects of the proposed “GSM”, so that is one positive.
–End of LIA vs Modern warming what causes you to make your assumption about which is the cause and which is the effect?
The purpose of mentioning the trend was simply to show that there is no evidence for a slowdown in warming. Consider that done.–
I don’t know what caused the cooling of LIA.
But would say LIA lasted for a long time, and some people think it lasted a shorter time.
I think it would be important [scientifically] to get better idea of what exactly caused it.
I am aware various ideas but I would not count them as theories.
But there number ideas and they about the intense amount volcanic activity [there is idea it matters what rock in involved] and solar activity but they are ideas/clues {which could or probably, wrong}.
There evidence of slow down, it’s sometimes call the pause.
Global warming hiatus:
https://en.wikipedia.org/wiki/Global_warming_hiatus
–Nevertheless, it is interesting that you demand an extended period to judge an acceleration of warming, yet you lot assert that a couple of years slowdown due to La Nina is evidence for a cooling trend. You people seem to have a problem with consistency in your arguments.–
There is no you people.
There isn’t even “you people” who believe the global warming is problem that we should waste trillion dollars ineffectively doing anything to reduce CO2 levels.
There a fair amount of agreement we should not burn down forests to make electrical power- because that is just too stupid.
It should be obvious to anyone reading my comment that it was not the cause of the LIA that I was talking about, but the cause of ITS END.
I asked you why you believe that the end of the LIA caused the current warming, as opposed to increased greenhouse warming causing the end of the LIA.
Did “the pause” last as long as 30 years? If not, shouldn’t your previous argument cause you to disregard this as “evidence”? See what I mean by inconsistency?
There is most definitely “you people”. This blog site was set up specifically to cater to you people.
“It should be obvious to anyone reading my comment that it was not the cause of the LIA that I was talking about, but the cause of ITS END.”
It’s generally agreed that the end of the LIA was 1850 AD.
So, this generally means something prior to 1850 AD ended it.
And generally regarded that it was about 50 years earlier than 1850 AD.
Of course just because “everyone agrees”, doesn’t make it true.
But I accept this, unless I can find some evidence which disagrees with it. So little agreement on when it started, lots of agreement on the time it ended- or that exact date is commonly given.
Now, some people argue that AGW in terms environmental changes, but LIA was not first cold period which there was recovery from.
Or LIA is largely important because it so recent- or it should easier to determine what was the cause. But generally it’s considered due to natural variability, and ideas about less volcanic eruption and changes in the sun’s activity.
But we know what happenned, massive retreat of temperate glaciers, globally. And there was fair amount interest and lots of studying of glaciers at that time.
But more important to me, is ocean became a bit colder and sea levels fell during this time.
I probably had it bookmarked, but that was years ago and many unrecovered hard drives ago. Assuming internet doesn’t forget, it’s out there somewhere. Going give a try. I didn’t find what remembered but here is other stuff:
https://www.kwaad.net/SeaLevel-MiddleAges-LittleIceAge.html
“I asked you why you believe that the end of the LIA caused the current warming, as opposed to increased greenhouse warming causing the end of the LIA.”
No one know how much warming is caused by rising CO2 levels there seems to be a focus on the time after 1950. IPCC said there were very confident it was more that .2 C
But there endless pages IPCC reports to read if want more opinions about it.
It’s my opinion if they thought it was important they would make it a lot easier for billions of people to read it.
**There is most definitely you people. This blog site was set up specifically to cater to you people.**
This blog is where global temperature by satellite is published.
So “you people” is people who want the most recent measurement of global temperature- almost always published as soon as possible.
Sometime posters help a bit- but mostly not.
Instead endless debate about the spin of the Moon.
Breaking into sentences to figure out which word is getting my comment blocked:
There us no general agreement, because there was no definitive end.
Many say it continued up to the 1910s, which makes sense because temperatures were falling from the 1850s to the 1910s.
There is the evidence you are looking for.
(Apparently Mr Spencer has blocked the word H-a-d-c-r-u-t. What possible reason could there be for that.)
Putting that all together now that I know the issue:
There is no general agreement, because there was no definitive end. Many say it continued up to the 1910s, which makes sense because H-a-d-c-r-u-t temperatures were FALLING from the 1850s to the 1910s. There is the evidence you are looking for.
If it was just about posting monthly updates then it would be done on the UAH site. No, this site is definitely about enabling denial.
And blame your buddies for continuing to push the moon nonsense, one in particular who is responsible for refusing to let it die.
“(Apparently Mr Spencer has blocked the word H-a-d-c-r-u-t. What possible reason could there be for that.)”
It is the d next to the c
“There is no general agreement, because there was no definitive end.”
It is mot the future I am talking, rather it what already has occur.
The projections have already been proven to be wrong.
What is wrong with d next to c?
And my comment about the LIA was entirely about the past (1850s-1910s), so no idea what you are referring to there.
Roy use a blacklist of verboten words instead of dealing with the problem at the source. Nobody knows that list. It has been conjectured that the initial of that poster have been blacklisted:
https://tinyurl.com/banned-by-roy
Superdeveloping La Nina called – Can you see me now ???
https://i.postimg.cc/K8KRyM7Z/mei-lifecycle-current.png
Not yet:
https://psl.noaa.gov/enso/mei/img/mei_lifecycle_current.png
Should be official soon.
Wot ??? Are we suppose to wait for your slow brain to catch up with updates ?
Looks like Bindidog bit own ankle this time
Babbling Edog
” Are we suppose to wait for your slow brain to catch up with updates ”
Antonin Qwerty already asked you:
” Are you dumb? ”
Thus I don’t need to.
You are such an idiot.
And I’m 100% sure that my brain a a lot faster than yours.
SpaceX launched 4 crew to ISS, and starlink group of satellites which was 45th SpaceX launch this years. Musk said he would do 1 per week and done 1 per week. Musk also said could up 60 launches this years, looks like could get 59 if scheduled launches successful launch and are on time. Or looks falcon-9 launch to the moon has been delayed into next year. Or since is issue payload not ready, maybe SpaceX will find another customer or launch more Starlink satellites by the end of year, but just 59 launches is a crazy amount rocket launches in a year.
But what the world is waiting for is the first Starship launch and I suppose what Musk wants is a year in which 10 starships are successfully launched. Which will again mark a crazy amount of Saturn V class rockets launching in a year. And once that happen, we get more crazy with 100 starship launches in the year, the then Starship launch every day, and big dream of 3 starship launches per day: [+1000 per year]. Which could happen in next 5 to 10 years.
Or there will be problems- really hard problems which take a long time to resolve, or worst fundamental problem requiring basically a different rocket development.
Or similar fundamental problem, there could be significant improvement in the starship- such as using titanium rather than stainless steel or using carbon fiber [which musk was going to do, but rejected the plan, as was too expensive- at least in terms of the development of this radical and fundamentally different, rocket.
Oh, new is that Blue Orgin is going ahead with New Glenn rocket using methane rockets. The idea was always on back burner, and there is not
a lot difference to between liquid Methane and Liquid Hydrogen.
But it seems everyone doing Methane rockets, now. And there no doubt in my mind that Methane rocket for the first stage is better than LH2 engine first stage, But I would say that about the second stage rocket. Or I think New Glenn should be methane first stage and LH2 on second stage- but you roughly can use same engines. Not unforeseeable that SpaceX with use LH2 in it’s second stage, but probably not right away, or Starship most launches will be to LEO and wants fill the second stage more hundred satellite [200 or 300??} and LH2 takes up more volume. And another thing is Starship second stage is a first stage on the Moon or Mars. Or since Starship is basically a “space shuttle to Mars” it might never use LH2 in it’s second stage [unless second stage is made of titanium or carbon fiber].
Or I would say the era of using LH2 first stage rockets, is over.
Like India has one, I expect it to be altered to Methane, also.
The Tonga explosive eruption may be the explanation for the Northern Hemisphere heat waves this summer
Ahhh – no.
Water vapor from the Tonga eruption will reflect heat back to earth
https://www.youtube.com/watch?v=Ky6fZCUyJQM
So to sum it up, Scott say we all belong in prison AND
Drug users should be in separate civilization.
Which is new thought to me, I think we should have better prisons.
Now you might say if we had better prisons more people would commit
crimes to go to prison. But you need to commit crime to go prison
you could simply ask to in prison, and if not there for crime, you can later ask to let out of prison.
It should not be too hard to make prisons more enjoyable.
You of course know where this going, right?
No, not have the prison on Mars.
That is completely wrong.
Instead prison could be an ocean settlement.
So, prisoners could live on a beach- and go surfing or
fishing or just kick back on a sandy beach.
Of course the obvious issue, is what do you do if prisoners
don’t want other prisoners in their prison.
It’s not as though criminals get along with each other.
Well, it seems, you need a “normal prison” at the ocean settlement which are guarded by other prisoners. So, one criminal can easily
cause another criminal to go to prison for say 1 month- even criminal
in prison can cause a prison guard to go prison for a month. Though if one chose to be in the ocean settlement prison, it’s easy to put
them in prison, but they decide to leave whole ocean settlement prison. So non criminal in prison can put in jail, but decide they just leave this ocean settlement [and never come back, unless do their time in it’s prison. And of course one have more than one ocean settlement prison which also has it’s own jail. So person who wants
to be prison can effectively be kicked out one, and decide to go to another ocean settlement prison.
And ocean settlement prisons, can send someone to jail for longer time than 1 month, but it wouldn’t easy, you have to have trial and be able to appeal the ruling and etc. So can have capital punishment, but capital punishment could like how it is done now, it could go all the way to supreme court. But there no reason to make jail in the prison, not nice. Say can’t go surfing as much- a lot better than current prisons.
But these are prisons- you have to stay in the ocean settlement, but if you are “good prisoner” you earn the right to move to another
ocean settlement prison. Or criminals don’t choose their ocean settlement prison, unless earn that right to choose. Maybe they have
friends in another prison. And prisons you sent to, are male or female. And prisons you can choose can be male and female prisons, and such male and female prison can put you into male or female prisons- in terms going jail by other prisoner putting you in jail.
And you have ocean settlement for people who want to take drugs.
And after serving time, and if a “good prisoner”, you could work and drug ocean settlements- because drug users are probably not very capable doing stuff which needs to done. Of course anyone could decide to work in prison or drug settlement or instead deciding to be in prison, you decide to do work in these ocean settlements.
And anyone in prison could decide to “get a job” and make money- assuming they can find the work.
And this is roughly like a low income ocean settlement, but such people own their real estate property and are not prisoners.
Probably start with low income ocean settlement, because need people who are smarter to live in “new environment” with various problems to solve- as with Mars settlements, but with Mars you need people who are lot smarter [or lot people will be killed due to too much stupidity] maybe later, drug users could live in Space.
Hurricane sheistering update
https://youtu.be/yBee7RaP-lw
When you shut down your oil production without thinking it through
https://youtu.be/5vpP-B5JaM4
Or – No Oil for Joe
https://youtu.be/heS-qut9ek4
It has been routine to give a US president drugs, but Joe has been given a lot of drugs.
Before he was given a lot drugs and he was younger, Joe didn’t think anything through.
The Saudis Snub Biden Again
https://wattsupwiththat.com/2022/10/06/the-saudis-snub-biden-again/
I think the main problem is Joe thinks he can make argument, at best
he might get sympathy- if the was less rude and he could hold his tongue- many older leaders have managed to do this.
Arabz are shafting Biden
https://bit.ly/3SQb95J
https://bit.ly/3CjG2Za
From Wikipedia (a web site discredited by most Pseudoskeptics but to which they endlessly refer to when it fits their narrative):
” In 2009, John P. Abraham criticized Monckton’s claims in a lecture at Bethel University, and Monckton filed disciplinary charges alleging academic dishonesty against Abraham.
The University of St Thomas’s lawyers wrote to Monckton that
‘The University of St Thomas respects your right to disagree with Professor Abraham, just as the University respects Professor Abraham’s right to disagree with you. What we object to are your personal attacks against Father Dease, and Professor Abraham, your inflammatory language, and your decision to disparage Professor Abraham, Father Dease, and The University of St Thomas. ‘
The latter was in response to an interview in which Monckton characterized Abraham as ‘a wretched little man’, the university’s president Dease as ‘a creep’, and the University of St. Thomas as ‘a half-assed Catholic bible college’. ”
And that is the kind of guy Roy Spencer names an allegedly ‘brilliant mathematician’, and invites to post his meanings on this science blog!
Sorry: that’s definitely too much.
You are on the wrong thread.
I mean, it makes you look at a half-assed, wretched, creepy coward.
He is the biggest creep on this board
He did follow my advice.
So, I can’t complain.
Yuou have it all wrong, guys: I immediately saw that this was the wrong thread, and posted the stuff again at the right place.
And as I tried to post ‘Sorry, wrong thread’, the blog refused the post.
gbaikie can write his discrediting nonsense
” I mean, it makes you look at a half-assed, wretched, creepy coward. ”
as long as he wants.
Doesn’t disturb me.
You are the biggest creep on this board, not because you misplaced a post
Very very good stuff from a 15 year old chap, babbling Edog!
But… I at least avoid to use fecal language as you do all the time.
Oh, you are having problems, also.
It encourages me to make shorter post.
So, there is an upside to it.
Is place turning into twitter.
I don’t like twitter.
Musk has bought twitter.
Maybe Roy should move all this to
a twitter account.
Wait, the NASA Logo on SpaceX’s Rocket Looks Completely Messed Up
Wait, that doesn’t look right at all.
https://futurism.com/the-byte/nasa-logo-spacex-rocket-messed-up
I think it looks, better.
What is the most obvious thing which happens if global air temperature were to be 5 C warmer.
And I will provide one answer, nights would be warmer.
But unlike what the climate cargo cult says, this can’t happen any time soon- unless maybe if Joe Biden starts a nuclear war.
Every one says we are currently at highest risk of nuclear war.
And you all know, what Obama said about Joe Biden, right?
What do you think the highest chance of having a nuclear was in the past, and what do think it is now?
“What is the most obvious thing which happens if global air temperature were to be 5 C warmer.”
Huge sea level rise leading to mass migration away from coasts and destruction of civil, hydro and agricultural infrastructure, longer, hotter heat waves, prolonged drought in some areas, increased rainfall in others, monster hurricanes.
“But unlike what the climate cargo cult says, this cant happen any time soon”
Why do AGW ‘skeptics’ just completely fabricate things about what mainstream science says?
gbakie, you won’t be able to supply any reference to even a semi-reputable source projecting that global air temps will warm by 5C any time soon or by the end of this century, so I won’t bother asking for it.
ipcc RCP8.5
Which gives us 3.5 C warming from now to the end of the century.
And is the highest (mean) projection based on unabated GHG emissions with no mitigating factors whatsoever.
If govt is paying to burn down forests, there are no “helpful” mitigating factors.
Wind and solar are not reducing CO2 emission, the only thing lowering
CO2 emission is natural gas- govt doesn’t support it.
Also nuclear power, which govt are shutting down.
But regardless of how much government tries to increase CO2, RCP8.5
would never happen.
You got the RCP8.5 estimate wrong. By 43%
But you don’t seem to be able to admit it.
Your last comment not only avoids dealing with that it is barely coherent.
The US and other countries have managed to stabilise or lower their emissions over the last few years. Other countries have risen. Point is, neither you nor anyone else knows the trajectory of global CO2 emissions over the next 80 years.
None of the IPCC projections see global temp rise of 5C by the end of this century.
This is a case where asking a better question is what’s needed.
” … if Joe Biden starts a nuclear war. ”
Biden very certainly won’t start any nuclear war.
The only one who will do that because it will be his very last option to appear as the winner of his newest aggression against Ukraine: that’s Putin of course, and I’m sure you know that.
We can be happy in Europe that the US – under Biden’s government – help Ukraine against this woeful Russian war, because the US have much more industrial and military power than all European states taken together.
All what we here recall concerning the Trumping boy’s words about Putin’s aggression was, soon after it began: ‘Putin is genial!’.
I believe you quoting me, but my post disappeared.
It seems I can post. but it might be disappeared, later.
Of course, I can’t edit, nor make anything disappear.
If I could edit, I would correct my mistyping and misspelling.
No comments other posters successfully referred to can disappear, gbaikie.
You just need to look for
” Joe Biden starts a nuclear war ”
in the thread (copy the text and type it into the search field after having entered CTRL-f) and you immediately find
https://www.drroyspencer.com/2022/10/uah-global-temperature-update-for-september-2022-0-24-deg-c/#comment-1377258
Ah right.
I found them.
But I also have making posts that don’t appear.
And thought I reaching a new thing. It’s one thing to
not have post, post. And it’s completely different if post
and it appears it disappears.
So, I been having problem of it not posting- like you did, but
it somewhat normal for this happen- been happening for years.
As said I thought it went to new level- but I posted in Aug, when thought posted in Sept.
Scrolling too fast thru top two longish articles- which only posted in a few times.
I thought might have been related linking to the name which must not named- related poster question of why D and C can’t be put together and I couldn’t post anything after trying that.
So turned off and on my computer, and then I could post- but I thought they then just disappeared. Which is like, wow!
But back to: “if Joe Biden starts a nuclear war”
Joe is poking, an obviously insane bear.
There are always options rather then fighting a war- and when someone is using your weapons… Well we weren’t happy that Soviet Union or Russia, was arming all the conflicts in the world, either.
Russia should be last to complain- but not just Putin, and whole
Russia people are crazy. And you say their media is fake, but they are all arguing to use nukes.
Meiv2 for Sept 2022
https://climatedatablog.files.wordpress.com/2022/10/meiv2.jpeg
MEI’s original presentation is way more understandable than the stuff posted above, whose primary intention very certainly is NOT to show MEI’s data.
Thus it’s much better to use the original:
https://psl.noaa.gov/enso/mei/img/mei_lifecycle_current.png
Put in a wider historical context (including MEI v1) gives this:
https://drive.google.com/file/d/1OFB3GczUOmJ-T1IwbmVFa3NuRaWpSIaO/view
When summing, for each La Nina event, all MEI index values being below the -0.5 Nina treshold, and sorting the sums, we obtain:
1892: -54.67
1908: -52.22
1973: -48.71
1954: -40.45
1915: -38.97
1998: -37.66
1873: -36.82
2020: -36.12
2010: -32.99
1970: -25.29
2007: -24.58
1949: -24.45
Means that in a few months, the current edition will have bypassed all those observed since 1979.
” Means that in a few months … ”
I’d better written
” Means that next month… “
Looks like Bindidong finally figured out – after one year, that it is better to wait for the current La Nina to actually finish before comparing it to the previous ones.
Who said you can’t teach old Bindidog new trix
As usual, the babbling Edog behaves as dumb as possible… he manifestly never saw this chart’s previous stages.
No wonder! He’s so busy discrediting, slandering, insulting that he doesn’t have any bit of idle time to behave properly.
I propose him to ‘dissect the past’, and to search for all occurrences of
https://drive.google.com/file/d/1OFB3GczUOmJ-T1IwbmVFa3NuRaWpSIaO/view
posted in comments on this blog since the first stage.
They nevertheless will all show the same, as I update the Google Drive chart data below the links.
When Bindiclown realized his epic La Nina forecasting fail he tried to spin it into some kind of dispute how strong it was going to be , something that nobody even argued about ,
Only problem , he decleared La Nina to be over and tried to compare it as a small one to the previous ones long before it ended , he is in for some surprise ,
it turns out he lost even to his own strawman argument , that takes some doing,
Just because you don’t like the presentation does not make the data wrong in any way.
The data and the graph shows exactly what meiv2 says.
Composed in exactly the same way as all the other climate series of course.
RLH says: Just because you dont like the presentation does not make the data wrong in any way.
Your “S-G projection” is a quadratic extrapolation of data that you and everyone else agrees has cyclic properties. The central projection to something on the order of -1.7 C for your alleged “5 year low pass” curve is really unlikely.
The maths is what it is. The S-G is effectively an OLS extension of the data beyond that of the CTRM reach. It shows, both high and low, what is the likely range of the CTRM is going forward.
Are you disputing S-G? If so, that would indeed be a claim worth making in detail.
RLH says: Are you disputing S-G? If so, that would indeed be a claim worth making in detail.
I’m saying it’s not a great choice for extrapolating the ends of a time series with cyclic characteristics. As above, it’s essentially fitting a quadratic to something that clearly isn’t well modeled as quadratic.
S-G is not based on a quadratic. It is based on an OLS straight line.
RLH says: S-G is not based on a quadratic. It is based on an OLS straight line.
It’s based on local fitting using a polynomial of “order N”. An order 1 fit would be a straight line, but you’re using an order 2 polynomial and one could use higher order polynomials.
“Its based on local fitting using a polynomial of ‘order N'”
“This is achieved, in a process known as convolution, by fitting successive sub-sets of adjacent data points with a low-degree polynomial by the method of linear least squares”
The degree in this case is order 2. So not order N at all.
If you want to see how S-G progresses then see the diagram in
https://en.wikipedia.org/wiki/Savitzky%E2%80%93Golay_filter
https://en.wikipedia.org/wiki/Savitzky%E2%80%93Golay_filter#/media/File:Lissage_sg3_anim.gif
which shows a higher order than 2 being used. The effect that I am using is that shown in effect by the red line. The circles are what the CTRMs plot.
Again this stupid ‘Internal server error’. Thus:
https://drive.google.com/file/d/1DnRO34-jpgbkqtonGwC6_8byvRooG3JK/view
instead.
“(apart from this ‘S-G projection’ which is a stupid manipulation:”
So S-G, by showing what is most possibly going to happen, is a manipulation. Blinyy outdoes himself as usual.
“Furthermore, your intentional omission of the lines connecting the time-series data points makes your running averages seem like the only way to represent a time-based structure within a set of points lacking exactly that structure.”
Making up lines that are not supported by any data is a much better way according to Blinny. Quelle Surprise.
” Making up lines that are not supported by any data… ”
This is so stubborn, so opinionated.
Linsley Hood seems to know it better than the rest of the world.
Nobody on earth – except for a few know-it-alls like you – would be interested in representing a time series as an unstructured set of points that looks like it was generated by a random number generator, and of which nobody can understand what actually is behind.
I repeat, Linsley Hood: the only reason for you to keep the time series invisible is that all people can focus 100% on your “work” and think that this is a sine qua non for understanding the whole.
Duh.
“This is so stubborn, so opinionated”
No, this is factual as everybody else knows. There is no data on the points that make up the lines except at the ends.
“So S-G, by showing what is most possibly going to happen”
I agree with Mark b, most improbable.
The MEI also seems to be overestimating the significance of the current La Nina.
It is not close to the strength of the 2011-12 one.
So you disagree with meiv2 but do not give any details on how it is wrong.
“I agree with Mark b, most improbable”
You do understand how S-G works don’t you. It is an OLS trend over shorter and shorter timescales as it reaches the end of its data. I have allowed for that in this graph by extending the uncertainty as it gets closer to the end.
The CTRM figures cannot be in dispute as they are just simple averages (with very limited in band distortions – see VP).
“So you disagree with meiv2 but do not give any details on how it is wrong.”
The MEI has several inputs that are not SST.
The current La Nina is weak/moderate, although long in duration. But its effects on global temperature has been weak, while the 2010-12 La Nina was strong and its effect on global T was strong.
The current MEI seems to be close to that of Fall 2010. While in Fall 2010, the Nino 3.4 was -1.6, the current Nino 3.4 is -0.85.
https://origin.cpc.ncep.noaa.gov/products/analysis_monitoring/ensostuff/ONI_v5.php
“The MEI has several inputs that are not SST”
I (and everybody else knows that see meive2 page – “The bi-monthly Multivariate El Nio/Southern Oscillation (ENSO) index (MEI.v2) is the time series of the leading combined Empirical Orthogonal Function (EOF) of five different variables (sea level pressure (SLP), sea surface temperature (SST), zonal and meridional components of the surface wind, and outgoing longwave radiation (OLR)) over the tropical Pacific basin (30S-30N and 100E-70W)”)
So which of the above values is it that is causing the dip?
“You do understand how S-G works dont you.”
I do. It is a probabilistic extrapolation based solely on data of the last few months, but it has no input from the understanding of ENSO dynamics.
It is like using the local weather data of the last few weeks and extrapolating thru November, while not considering the expected seasonal cooling.
It doesnt contain ENSO specific probabilities based on an understanding of how ENSO works and has historically behaved.
That extra information shows your predictions to be unlikely.
https://www.cpc.ncep.noaa.gov/products/predictions/90day/tools/briefing/unger.pri.php
“It is a probabilistic extrapolation based solely on data of the last few months”
What has an OLS to do with extrapolation? S-G uses a short term OLS to create a series of points of how CTRMs are likely to extend. If more future data is higher than the average/center going forward then then actual trend of CTRMs will be towards the high end. If it is lower, then it will be towards the low end. No magic needed or used.
Did you miss the point? It does not consider ENSO dynamics at all. It does not account for ENSO model predictions.
“So which of the above values is it that is causing the dip?”
You tell me. Why are mei and Nino3.4 so different now?
You’re the one calling meiv2 into question, not me.
“Why are mei and Nino3.4 so different now?”
They are not different. Both show a cooling currently.
“Youre the one calling meiv2 into question, not me.”
Im saying MEI and nino3.4 SST are giving different assessment of the strength of the La Nina at the moment.
You favor MEI calling the La Nina strong.
But the effect of ENSO on Global T must be more directly related to SST, which has been weak-moderate, and is predicted to continue at that level and finally dissipate in Jan-Feb.
“Im saying MEI and nino3.4 SST are giving different assessment of the strength of the La Nina at the moment”
So which do you favor and importantly why?
Most of the time MEI seems fine.
But as I stated : “Global T must be more directly related to SST, which has been weak-moderate”.
And again, your SG projection (is it for 12m or 5 y?) is showing MEI reaching levels BELOW the 2010-11 level. This is physically unlikely given the known behavior of ENSO.
Recall 2010-11 La Nina:
“The 20102012 La Nia event was one of the strongest on record. It caused Australia to experience its wettest September on record in 2010, and its second-wettest year on record in 2010.[2] It also led to an unusual intensification of the Leeuwin Current,[3] the 2010 Pakistan floods, the 20102011 Queensland floods, and the 2011 East Africa drought. It also helped keep the average global temperature below recent trends, leading to 2011 tying with 1997 for the 14th-warmest year on record.”
Nate says: . . . the 2010 Pakistan floods . . .
Not sure this one helps the argument. 🙂
Yep. That one.
The severe 2010-11 flooding in Australia apparently showed up in sea level.
https://sealevel.colorado.edu/
Since a few seasons I post a chart showing UAH6.0’s monthly data for superposed years and reference periods as absolute temperatures instead of anomalies wrt the current reference period.
I didn’t update the chart since last February and was a bit surprised when looking at the now updated 2022 plot:
https://drive.google.com/file/d/1FYbNtCu0-FUyCHzjYgR3UXeNrskjkzDY/view
because of the absolute July value, surprisingly bypassing that of 2016.
And indeed, the top10 of a descending sort of the July months in the absolute time series shows
1998 7 265.797
2022 7 265.773
2020 7 265.723
2016 7 265.673
2019 7 265.667
2021 7 265.618
2010 7 265.615
2018 7 265.587
2017 7 265.581
2002 7 265.519
Only July 1998 (which is, in absolute data, the highest value of the time series) kept above July 2022, which is followed by 2020, coming even before 2016.
All 7 years starting with 2016 are in the top10.
I didn’t expect that, to say the least.
Maybe e.g. Mark B or MrZ could have some idle time to confirm or infirm this.
Source
https://www.nsstc.uah.edu/data/msu/v6.0/tlt/
I didn’t compute from the gridded data, but the July absolute temperature should have the same order as the July anomaly, which your list does.
I guess I will explain global climate. This explains pretty well:
“Throughout Earth’s climate history (Paleoclimate) its climate has fluctuated between two primary states: greenhouse and icehouse Earth. Both climate states last for millions of years and should not be confused with glacial and interglacial periods, which occur as alternate phases within an icehouse period and tend to last less than 1 million years. There are five known Icehouse periods in Earth’s climate history, which are known as the Huronian, Cryogenian, Andean-Saharan, Late Paleozoic, and Late Cenozoic glaciations.”
https://en.wikipedia.org/wiki/Greenhouse_and_icehouse_Earth
And we in icehouse period.
It does describe greenhouse global climate:
A “greenhouse Earth” is a period during which no continental glaciers exist anywhere on the planet.Additionally, the levels of carbon dioxide and other greenhouse gases (such as water vapor and methane) are high, and sea surface temperatures (SSTs) range from 28 C (82.4 F) in the tropics to 0 C (32 F) in the polar regions. Earth has been in a greenhouse state for about 85% of its history.”
We are certainly not in greenhouse global climate, rather we been in
last of five: the Late Cenozoic glaciations and have been for 33.9 million years and the last couple millions of the Late Cenozoic Ice Age have been coldest time of the Ice Age we have been in.
And the temperatures given for a Greenhouse Climate, as in: 28 C in tropics and 0 C in polar regions don’t really do much to describe
greenhouse global climate.
If paying attention, one might notice the tropics is about the same temperature as our tropics is presently. But most people reading that might easily miss that.
The tropics in general do not change much whether it’s ice house global climate or greenhouse global climates and what changes a lot is the polar regions and region near the polar regions temperatures.
And 0 C in polar region might not mean much. As compared to saying the sea level temperature within the polar region “never” drop below 0 C. Which a lot different than the world we a living in. But it can be 1 C at sea level and well below freezing 1000 meter higher than than sea level. Or one could certainly have snow in the polar region- unless polar region has no higher elevations within it.
And since our warm tropics, has glaciers, a Greenhouse Global Climate could likewise have tropical glaciers [at higher elevations].
Or said differently, long, long ago, in times when Earth had the highest average temperatures [far higher than 15 C] one could still go skiing. You might even have better skiing than you have, now, in the coldest time in last many tens of millions of years.
A greenhouse global climate main difference is the global temperature is far more uniform. The night times and the winters are much warmer.
And global water vapor is twice as much as we have now- about same in tropics, but much higher in 60% of the rest of the world.
And all this is caused because the average temperature of the ocean is not cold.
I just started watching this:
https://www.youtube.com/watch?v=RWq-ngg7JC8
Ukrainian mobilisation & force generation – Featuring General Ben Hodges (Ret.)
And past ones have been quite detailed- perhaps a bit boring with the details, but I liked them.
Oops: Renewable Energy Costs Shut Down Solar Cell Manufacturing in Europe
https://wattsupwiththat.com/2022/10/08/oops-renewable-energy-costs-shut-down-solar-cell-manufacturing-in-europe/
“Essay by Eric Worrall
First published on JoNova; Despite green claims renewables are the cheapest form of power, renewable manufacturers are struggling to survive Europes soaring energy prices.”
…
“The obvious question, if renewables are so cheap, why dont these plants relocate to a large plot of land, disconnect from the grid, and power their manufacturing facilities from their own low cost renewable energy products?
Seems an obvious solution but for some reason renewable manufacturers seem to be choosing to shutter their plants, rather than switching to consuming their own product.”
https://wattsupwiththat.com/2022/10/08/oops-renewable-energy-costs-shut-down-solar-cell-manufacturing-in-europe/
Of course the same question applies to China.
Btw price of Coal in China has lowered a bit:
https://tradingeconomics.com/commodity/coal
To $385 per US ton but my original price point of China Peak was $300 or more and it’s been that high for last 7 months
No one needs to buy all that wind and solar power stuff in China.
But all do.
Reminds me France 2 1/2 years ago: the government asked many French manufacturers to produce FFP2 masks.
As these then became mandatory, all concerned instances bought Chinese products due to laws enforcing them to buy products as cheap as possible.
And the French manufacturers were left with millions of masks.
*
Don’t forget however that you obtain at WUWT information about renewables from a site 100% financed by Heartland and the GWPF, two corners 100% financed by… the fossil fuel industries, nuke included.
*
The Russian invasion war against Ukraine of course is, from the point of view of the available primary energy sources, nothing really good for Europe.
But it will enforce the European nations to get rid of fossil fuel over the long term.
How is it possible to produce electricity by burning browncoal in 2022? And by the way destroying dozens of localities just because that bullshit lies below them?
How is it possible to build an economy upon natural gas sold by a fundamentally dictatorial country like Russia?
It was time to wake up in Germany.
“The Russian invasion war against Ukraine of course is, from the point of view of the available primary energy sources, nothing really good for Europe.”
Scott Adams says it’s about lithium.
Apparently Ukraine has a lot of lithium.
But US has a lot- it’s just environmental laws make
to too expensive to mine.
So, it continue, with cult. Such as make CO2 elsewhere, to reduce
global CO2 levels. Burn down forests and call it renewable biofuels.
Politicians just love this kind of “work”.
Is this hurricane season about over?
https://www.nhc.noaa.gov/?atlc
Julia is a weak hurricane and soon to make landfall.
Started late and will end early?
Or will continue to Xmas, just to continue to be weird.
https://www.youtube.com/watch?v=he2thPRcpQc
Artificial Gravity is Critical for Mars Exploration & Beyond – SpaceX Starship can make this happen!
Marcus House
I was thinking it wouldn’t get to the stick artificial gravity station but near the end, it did. But didn’t call a stick.
The problem with that stick is the nuclear power.
I see no reason to use nuclear rockets- and the nuclear part of
it, costs a lot money, whereas a stick artificial gravity could be
very cheap.
The nuclear power stick is a very old idea and reason for it was make
a large distance between crew and nuclear reactor. 🙂
And the artificial gravity was more of an after thought.
It’s also weird, because the common claim about nuclear rockets is
they get to Mars in 60 days. Or if one do it in 60 days, mirogravity and space radiation is not really a problem.
Anyhow I share Marcus’ “surprise” that we have not done this yet.
But didn’t like all the other weird and unnecessary other ideas about artificial gravity space stations. Donuts.
I think what we have to test is what is the shortest stick needed for Mars gravity- which “could be” done with two dragon and some rope- if the space capsules are less 10 tons, the rope doesn’t need to be that strong
I was thinking of Venus, again.
Of various things, but I ran across question, how much does it
rain on Venus?
As compared to Earth.
The same as Earth? 1/100th the amount of Earth?
Or more than Earth?
No idea.
I have wondered how much lightning is on Venus.
Which again, I have no idea how much it compared to amount lightning on Earth.
But not really thought about how much it rains, before.
Which I think might be more important than amount lightning
Sprites on other planets
https://ui.adsabs.harvard.edu/abs/2009AGUFMAE43A0253Y/abstract
Rains on different worlds:
https://www.zmescience.com/other/science-abc/rain-titan-earth-neptune/
Hmm. No amount is ventured as a guess.
But they all like to say Venus is like hell.
It seems one have wear shades if in sunlight as high as clouds, and
very dim at rocky surface- beyond the rain.
I have small chance rain on Monday.
How much sulphuric acid is on Venus?
https://space.stackexchange.com/questions/8002/how-much-sulphuric-acid-is-on-venus
[[To be more specific with the question. 20 ppm of water means 9.61015 kg H2O in total (Venus’ atmosphere’s mass is 4.81020 kg). Is there less or more sulphuric acid?]]
Answer:
Assuming 80% of H2SO4 in these droplets gives a total of about
9.10^13 kg H2SO4.
Thus the total amount of water in the atmosphere of Venus would be: 5.910^15 kg.
So Less acid than water.
And it seems less clouds than Earth.
But it could rain more on Venus even though there is less clouds.
Couldn’t it be the more heating the more raining?
So intense sunlight [heating] and you could fast addition of water to
acid [more heating] and droplet gets to big and it falls.
But if could be like hail, falls, but lifted up, and falls again, and again, and some point falls into deep hot atmosphere and “explodes”?
So only in the tropics does it get intense sunlight.
Hail is rare on Earth.
But Venus is like Earth, one get most the sunlight in the tropics.
Though with Venus you might a lot more sunlight in Tropics as compared to Earth.
With Earth it doesn’t rain much if you exclude the tropics. With Venus maybe more 90% of raining [which never hits the ground] occurs in Tropical area of Venus.
Does more intense sunlight make it rain more, or rain less.
Let’s make prediction if rains more [or lot!] in tropical daytime
the clouds should look denser. And night clouds will be more uniform and less dense.
What about opposite? It rains very little. Why would it rain very little?
I am saying above it rains little because happenning in small area of the planet. So opposite is acually it rains very little in the Venus tropics [within 30 degrees north and south of where sun is at zenith] during the daytime.
And if rains more somewhere why does it rain. So global wind, will race away from the sun and it cross past sunset [past across terminator line] and it might dump the most amount when this happens.
Or we have the general question why does it rain- though that it rains at all, does not seem certain.
In our tropics rain occurs like clockwork, Venus might more like desert, it has raining seasons and has droughts. So rains on Venus it’s more related to a freak event.
EVERY TRIAL LAWYER IN AMERICA SIGHS, PUTS DOWN PORSCHE CATALOG. PayPal Pulls Back, Says It Wont Fine Customers $2,500 for Misinformation after Backlash.
https://news.yahoo.com/paypal-policy-permits-company-fine-143946902.html
Well, that good news for paypal- I thought they would be dead, soon.
I never was hip enough to use it, but nevertheless I was going to miss it- for some weird reason.
” … but nevertheless I was going to miss it- for some weird reason. ”
PayPal was successfully launched by your Space X idol Elon Musk.
There were quite few involved, but Musk one of most well known,
I think another guy involved was interested at one point in ocean settlements- it seemed to me, that it was mostly related to political reasons. Thiel? Yeah, Thiel Capital. Peter Thiel.
“PayPal went public on 15 February 2002 and was sold to eBay for $1.5 billion in October of that year. Thiel remained CEO of the company until the sale. His 3.7% stake in the company was worth $55 million at the time of acquisition.” He was the main guy. But lots young turks were involved.
I think it was that money that Elon Musk almost went bankrupt with trying make the Falcon 1 work.
Speaking of Russia, Musk wanted to put a greenhouse on Mars. He went to Russia, to get cheap launch {Russia and China were the cheapest launch providers at the time} but the rocket was too expensive, so Musk decided to make rockets.
Putting greenhouse on Mars, was good idea. But I think putting an artificial gravity “thing” in orbit, would and still is a better idea. I would lengthen the Falcon-9 second stage, and use it as a stick artificial gravity station which might do up to Mars gravity.
So, first try 1/10th and then 1/6th [Moon] and then work up to Mars
gravity. A 1/10th of Earth has never been done. And Mars gravity is needed if thinking of doing settlements on Mars.
NASA could pay for it, but Musk could do it without NASA being involved. It dollar value is mostly a PR thing. And Musk wants SpaceX
to train astronauts [it’s doing it now] and it something crew could “train on”. Plus, you refuel the second stage, and after training in LEO, fly it anywhere- Venus, Mars, Earth high orbit.
With station you could use, “cubes” of water for radiation protection- they do it with ISS.
But I was just wondering if you can make “cubes” of LOX. Or cube of Kerosene is easy. But can make them for cryogenic liquids [LOX, Liquid Methane, even Liquid Hydrogen]. Since you making gravity- you use hoses to transfer rocket fuel. Or you could make bunch of metal boxes/tanks.
Anyhow with station and thinking store water cubes, and install after
crew dock with it in orbit. And could bring up more cubes of water to add more shielding. But you could do something like this with LOX- not for shielding but refueling.
I’m waiting for the UAH’s September data for the lower stratosphere, as the August data showed some really unusual cooling between the Tropics’ and the South Pole’s latitude bands:
https://drive.google.com/file/d/1n6rXv2cSP0mRCE2nJ4DHeflLVmvF0jmD/view
Where was the Hunga Tonga-Hunga Ha apai eruption? Did all the extra water vapor it released cause this dip?
Solar Cycle maximum
https://youtu.be/25PBCQMwBAo
Here you see Greenland’s SMB chart for September 2022, showing mass loss and mass gain during the month:
http://polarportal.dk/fileadmin/polarportal/surface/SMB_combine_SM_acc_EN_20220930.png
And here you see UAH’s global grid chart for the September 2022 anomalies:
https://www.nsstc.uah.edu/climate/2022/September2022/202209_Map.png
May I assume that no one has overlooked the 3.5C+ or 4.5 C+ anomaly regions over much of Greenland?
What do you think about any possible relation between the two charts?
Well the SMB graph shows slightly more gain this year than loss overall….
Please have a look at this happily, consistently, perfectly sidewaysing SC25:
https://drive.google.com/file/d/1WZBizGNdZJLDKBU_5flhNVsvWBYBKLXT/view
Is it not plain beautiful?
Dites-moi tout!
So what will the number of spots be for October ???
I’m 100% sure you’ll soon guesstimate that number.
I have no interest in such stoopid games.
so why are you talking out of your ass about it
Oh… again your fecal language?
Keep alone with that, babbling Edog.
Solar wind
speed: 396.5 km/sec
density: 0.10 protons/cm3
Daily Sun: 11 Oct 22
Sunspot number: 134
The Radio Sun
10.7 cm flux: 163 sfu
Thermosphere Climate Index
today: 16.77×10^10 W Neutral
Oulu Neutron Counts
Percentages of the Space Age average:
today: +4.7% Elevated
48-hr change: +0.1%
https://www.spaceweather.com/
Very little wind at moment
All spots northern, these “fake” spots going
to farside, maybe it go spotless- southern is spotless
and was were most spots where happen.
Is normal that south and north to take turns?
Looks like a solar max except for Neutron Counts which high
levels of GCR for any crew going to Mars.
It has been a solar max to travel to Mars, yet.
The next 1/2 of month could be slow- so sideways is
possible
Nobody is going to Mars
Nobody is going to Mars, now.
Just robotic missions, now and for decades.
Nobody is going to Moon, now.
First some robot, then land crew on Moon and
then people go to Mars.
It seems to me, we should test living in artificial Mars
gravity before we sent people to Mars.
It also seems we could/should find a way to Mars faster.
It is claimed nuclear rockets can get to Mars in 60 days,
I don’t believe we can make nuclear rockets to send crew to
Mars in 60 days. And I don’t like nuclear rockets.
I think US military likes nuclear rockets. US military could
even have nuclear rockets [because they classify it] But if
military wants nuclear they build them and cease selling the idea
that NASA should build them. NASA can’t build chemical rockets- unless you count SLS as building a rocket- decades late, tens of billion dollar over budget. But nevertheless I would want NASA to launch SLS which might happen before the end of year. I gave it 70%
chance of that happening but now it seems there is less chance- maybe 60% of getting to point of lift off before end of year.
I think there 40% chance Starship gets a lift off before Nov- Musk say trying before end Oct but probably take to Nov.
It seems need static fire with 33 engines, highest so far is 7 engine static fire. Some say next will be 20 engine static fire.
Getting 33 engine seems difficult.
If remember correctly highest number of rockets fired by rocket was a russian rocket and it was 30 and it failed, badly. Though Falcon Heavy has 3 first stage rocket which do, 9 times 3, 27 engine which should be the highest number rockets firing and successful getting to orbit. SpaceX going to launch a couple falcon Heavy for US military before end of year. One might say, SpaceX are the experts on multiple rocket engine firing.
I guess Falcon Heavy must have done 27 static fire, but I don’t remember it. I should look that up. But I got to go.
So looked and couple times, but this is interesting:
SpaceX used to conduct static fire tests before every launch, but not anymore. Why is that?
https://www.elonx.net/spacex-used-to-conduct-static-fire-tests-before-every-launch-but-not-anymore-why-is-that/
Used to do them with payloads on the rocket- and still will, sometimes.
So, it seems only one which can determine whether Starship does 33 engine fire, would be SpaceX.
Because SpaceX tests the Raptor engine, an insane amount of times- individually, on test stands.
And they are only ones which really know the test results.
So, it appears they will do more static fires and the may go up to 20 or more. And they may do 33 engines. But if 33 engines do you it with the payload?
It seems they might launch with 1/2 the satellite payload. If doing it with 1/2 payload, you might not need 33 engines. As wild guess, you might need 18. So test fire 18 without payload, test fire 18 with payload, and then launch, use 18, and try to use up 33 engines after you left the pad. Depending how it goes, but you increase the payload
until you doing Max payload. But more important then the amount payload and getting to point of reusing the first stage, and next, reusing second stage.
SSN at 134 today? Wow!
Here is SILSO’s Estimated SSN
2022 10 10 2022.774 113 14.4 34 38
2022 10 11 2022.777 99 8.7 23 30
SSN at 72 today? Wow!
What a dumb ass
Wow! Wow! Wow!
Dropped to 62
What a dumb ass
Still counting sunspots ?
I got 40 just now
Got any more of them wows ?
So cycle 25 is gonna be over in few more days?
Solar wind
speed: 386.0 km/sec
density: 3.71 protons/cm3
Daily Sun: 11 Oct 22
Sunspot number: 72
The Radio Sun
10.7 cm flux: 163 sfu
{fairly compared to sunspots}
Thermosphere Climate Index
today: 16.77×10^10 W Neutral
{I believe highest thermosphere has
energized in cycle 25- low orbits decay faster
and clears orbital space debris faster}
Oulu Neutron Counts
Percentages of the Space Age average:
today: +4.7% Elevated
48-hr change: +0.1%
https://www.spaceweather.com/
Still fairly weak solar wind and is the same date as
the one above with Sunspot number: 134
Anyhow in couple days it lower more as most it near farside
And I wouldn’t too surprised if we a day or two spotless days within a week. Though would only be slightly more surprise if we 150 sunspots again in a week or two.
I am calling it, bumpy
Solar wind
speed: 359.7 km/sec
density: 0.55 protons/cm3
Daily Sun: 12 Oct 22
Sunspot number: 72
The Radio Sun
10.7 cm flux: 150 sfu
Thermosphere Climate Index
today: 16.81×10^10 W Neutral
Oulu Neutron Counts
Percentages of the Space Age average:
today: +5.3% Elevated
https://www.spaceweather.com/
–POSSIBLE CLOSE ENCOUNTER WITH A CME: NOAA forecasters say that a slow-moving CME might pass close to Earth today (Oct. 12th). It left the sun five days ago. The near miss could shove solar wind plasma onto Earth’s magnetic field, sparking auroras around the Arctic Circle.–
Well is slow moving CME slowing down the solar wind??
If so it could CME is like a dam and we should high density so.
If not dam maybe like drunk wandering around interfering with the traffic. Or Solar wind affecting it, the CME is attracted to the wind? Or a huge balloon pushed by wind?
Solar wind
speed: 386.4 km/sec
density: 14.41 protons/cm3
Daily Sun: 14 Oct 22
Sunspot number: 57
The Radio Sun
10.7 cm flux: 141 sfu
Thermosphere Climate Index
today: 16.80×10^10 W Neutral
Oulu Neutron Counts
Percentages of the Space Age average:
today: +6.0% Elevated
48-hr change: +0.7%
GEOMAGNETIC ACTIVITY: A CME may have just passed Earth, not hitting, but nevertheless unsettling our planet’s magnetic field. Solar wind data from NOAA’s DSCOVR spacecraft show an unexpected upsurge in dense magnetized plasma around UT midnight on Oct. 13-14
So everything but Neutron Counts is solar max conditions
going to say counts on way down. And spots going down, but will not
be spotless and new spots have emerged [and “could grow”].
Solar wind
speed: 557.6 km/sec
density: 10.40 protons/cm3
Daily Sun: 15 Oct 22
Sunspot number: 51
The Radio Sun
10.7 cm flux: 121 sfu
Thermosphere Climate Index
today: 16.94×10^10 W Neutral
Oulu Neutron Counts
Percentages of the Space Age average:
today: +3.7% Elevated
48-hr change: -2,2%
Spots didn’t grow, could go spotless within couple days.
I going to guess going back to having more southern sunspot.
Or seem it was mostly southern and think it will swing back to
mostly southern.
And despite my guessed “coming” lower sunspot activity, Neutron count will lower even more- in next couple days.
Who do you think wants your fake chart anyway
Babbling Edog
1. You seem to view your little, personal, simple-minded way of thinking as this blog’s mainstream.
While this is partly correct, as you are a proponent of global cooling ‘theories’, and some commenters therefore appreciate what you write (but only about that stuff), there are luckily other people reading and posting on this blog, who disagree with what you think and write, and whose intelligence is far above your low ‘ass’ level.
2. Concerning this ‘fake chart’ accusation, I remind you that you never managed to prove it, e.g. by showing what is wrong in the chart, or, even better, by posting a link to the same chart you finally became able to show a corrected version of.
3. Who, do you think, wants this primitive fecal language you all the time fill this blog with?
Here is the August 2022 monthly 2.5 degree anomaly grid for UAH’s atmospheric layer ‘TP’, the Tropopause, located just below ‘LS’, the lower stratosphere:
https://drive.google.com/file/d/1Z1T2Fuw1Qp1gjf3_SnUq-0ywCGy-RqEg/view
Compare it to the LS data above it:
https://drive.google.com/file/d/1n6rXv2cSP0mRCE2nJ4DHeflLVmvF0jmD/view
and draw your own conclusions.
When the UAH team publishes the September data, I’ll generate the two grid charts again.
Don’t forget to update your nonsense hyperbolic F10.7cm Radio Flux chart
Still with the rectangular grid I see which just serves to place emphasis at the poles and diminish the equator.
Still blathering about what is here completely irrelevant, instead of trying to argue about what is relevant, namely a possible TP/LS correlation within 30S-60S.
*
And by the way, Linsley Hood: why do you still stalk me about your ridiculous, opinionated Mollweide vs Mercator fixation, instead of generating YOURSELF that grid data, and displaying it as you like?
“completely irrelevant”
So you are not claiming that the areas at the top and the bottom being distorted is not relevant to the real surface of a globe, purely that it does not matter.
Idiot.
Why not display the Tissot Indicatrix for both projections?
When will you stop stalking me with your utter lies like
” So you are not claiming that the areas at the top and the bottom being distorted is not relevant to the real surface of a globe, purely that it does not matter. ”
I never did ever claim that; I ONLY DISPLAY A RECTANGULAR MATRIX OF GRID CELLS, and nothing else.
You are not only a stubborn opinionated person, Linsley Hood.
You are also a disgusting liar who permanently insinuates what others in fact do not think let alone claim.
I thought you would have finally refrained from that ridiculous behavior; that is manifestly not the case.
I repeat
And by the way, Linsley Hood: why do you still stalk me about your ridiculous, opinionated Mollweide vs Mercator fixation, instead of generating YOURSELF that grid data, and displaying it as you like?
So why not display the Tissot Indicatrix for both projections?
“I ONLY DISPLAY A RECTANGULAR MATRIX OF GRID CELLS”
Which serves to distort the poles at the expense of the equator as the Tissot Indicatrix shows.
Absolute debils in charge of the world
https://youtu.be/ak1gsqJlo5I
Who will be the first to call fourth La Nina ?
Who will be the first to call a EL Nino for 2023?
Solar cycle maximum
https://youtu.be/qBxq0VGc0Fw
Wooaaaah
2022 10 07 154
2022 10 08 143
2022 10 09 120
2022 10 10 113
2022 10 11 98
2022 10 12 99
2022 10 13 79
2022 10 14 78
2022 10 15 42
Megahyperbolic hockeysticky SSN decrease!
OhMy.
https://tinyurl.com/2pvf23jd
Grrrand Solaaar Mmminimum aheaddd, if not even worse.
Try to fit this into your great 10.7 flux chart hyperbolic red line
Do it yourself, babbling Edog:
https://drive.google.com/file/d/1a_P–5ic1YyyBkzOdZ56IaAf6XI8_Qeg/view
Even bonus straight line included , I will print this out , frame it, and hang it on the wall
Ok , I improved your chart by extending your hyperbolic prediction
https://i.postimg.cc/ZqDW7RrY/Solar-flux-F10-SC25-vs-SC24-for-the-babbling-Edog.png
Something very interesting here , when you see a big step change in the data like this it , it has likely to do with the way the data is collected – processed – manipulated, rather than the data itself.
I don’t believe it’s real
https://i.postimg.cc/02JtmjRs/d1-gfs-gta-daily-2022-10-15.gif
Ok, we’ll file that in the feelings and beliefs bin in the back of the shed.
Typical for those I name the ‘Pseudoskeptics’ is that they doubt about everything they dislike, though being of course absolutely unable to disprove what they discredit and denigrate, for example:
https://oz4caster.wordpress.com/cfsr/
What climate explanation do you have for the approximately 0.5c reduction/step change in global temperatures in April/May of this year?
“climate explanation”
I think you mean weather explanation. And why do you feel you need one?
Part of the story is that in the warm months, with the melting of sea ice, the artic surface reaches the temperature of a glass of ice water, 0C. This is a very steady T, during summer, thus the anomaly in the arctic summer is close to 0.
Whereas in the winter months, with sea ice cover complete, the T can fall below 0 C, and VARY considerably.
The anomaly in Arctic winter is often 5 C or more.
https://ocean.dmi.dk/arctic/plots/meanTarchive/meanT_2020.png
This addition to the anomaly in arctic winter is significant globally. There should be a noticeable drop in anomaly as we enter the NH warm months.
So you are saying that this is just normal for this time of the year.
Point out where this has happened before in this graph
https://oz4caster.files.wordpress.com/2022/10/d4-gfs-gta-daily-2014-2022-10-16.gif
P.S. Anomalies take care of regular, seasonal, changes in the data.
Yep there is a dip in each summer in your graph, though more gradual than this year.
Show me where on the above graph from 2014 onwards that a similar step change has happened.
Is it your claim that that rate of change that was observed, 0.5 C/week, is impossible?
Why?
Again, you guys keep pushing your incredulity as if it is a valid argument, when it really isnt.
So show me where on the above graph from 2014 onwards that a similar step change has happened.
And it is not possible? Why?
Yet again you would like to assign significance to noise. But can’t find any thing actually significant about it.
Oh well!
The planet temperature cannot change by half a degree withing the span of one day
Weather (synchronized) does not happen on a global basis either.
The average planet surface temperature is about 3.5 C which doesn’t change by .1 C within hundred years.
If talking about global air surface and particularly the daytime high average temperature [which was somehow magically measured accurately- which isn’t happening] can change by about .5 C [or 1 F] in a day.
We living in 33.9 million year ice age, it’s temperature has cooled
over the 10 of millions of years by about 3 C and global average surface air temperature has cooled by about 8 C and recently has have periods of thousands of years which have cooled by about as much as 16 C.
“cannot change by half a degree withing span of one day”
No need. Its more like a week.
https://oz4caster.files.wordpress.com/2022/10/d1-gfs-gta-daily-2022-10-18.gif
You’ll notice rapid oscillations nearly that much in the period before that drop, and on other occasions.
Eben, your incredulity of what you think cannot happen is noted. But its not an argument, is it..
So what is your explanation for the -0.5c downwards step offset? It has held at that negative level (with small oscillations) for more than a few months now.
Again. Why do I need an explanation for observed data that YOU feel is incredible.
First you need to explain why such a change cannot happen.
Nothing is impossible, apparently. A step change of 0.5c falls into that description, apparently.
It takes real talent in logic to go from 0.5C/week is possible, to therefore anything is possible!
That graph is computed from reanalysis data whose principle utility is in near term forecasting. It isn’t really intended for use as a long-term climate analysis tool and one must be careful interpreting it in that context. It is interesting to look at in the general sense because it has frequent updates (every 6 hours) so one can get a feel for how a particular month is progressing long before the monthly datasets like UAH come out.
If the surface datasets Had, GISS, NOAA, etc differ from the reanalysis, it’s probably some oddity in the reanalysis.
The best would be to generate the same daily data out of another source, e.g. GHCN daily.
But I use GHCN daily only to generate monthly data, but rawer than GHCN V4, BEST, NOAA or similar.
So, your response is that reanalysis data has at best an inaccuracy of +-0.5c. Useful to know that.
Indeed, one could produce a daily temperature series for a more direct comparison and it might well turn out that the alleged shift is “real”.
The bigger point is that the reanalysis data and processing is not guaranteed to be homogeneous and/or to undergo identical processing for the full time series.
So, your response is that reanalysis data has at best an inaccuracy of +-0.5c over the whole time series. Useful to know that.
Where did he say that?
Nowhere? So you made it up, then?
Useful to know that.
Mark B said that reanalysis data was inaccurate in detail over the whole time series. Do you dispute that?
“The bigger point is that the reanalysis data and processing is not guaranteed to be homogeneous and/or to undergo identical processing for the full time series.”
So obviously you made up the 0.5 C number out of thin air. As we’ve come to expect.
In any case, no one is showing evidence that the 0.5 C/week change isn’t real, and isn’t possible.
So?
https://oz4caster.files.wordpress.com/2022/10/d1-gfs-gta-daily-2022-10-19.gif
0.8c to 0.3c is a -0.5c step change.
P.S. There is a difference between a -0.5c change and a -0.5c STEP change.
Great leaps of invention here.
https://oz4caster.files.wordpress.com/2022/10/d2-gfs-grta-daily-2022-10-21.gif
You can see here a steep rise just happening, and that it is mostly due to the Arctic’s rise of 3C or so.
As you notice the Arctic anomaly was low all summer, as usual. It then rises and varies dramatically during the cold seasons, for the reasons I noted above.
Global T, recent rise.
https://oz4caster.files.wordpress.com/2022/10/d1-gfs-gta-daily-2022-10-21.gif
And it continues..
https://oz4caster.files.wordpress.com/2022/10/d1-gfs-gta-daily-2022-10-22.gif
That trippple La Nina – it’s all caused by climate change
The talking heads say so
https://youtu.be/fsTmnNDH2Ig?t=152
–POWERFUL GAMMA-RAY BURST MADE CURRENTS FLOW IN THE EARTH: Astronomers have never seen anything like it. On Oct. 9, 2022, Earth-orbiting satellites detected the strongest gamma-ray burst (GRB) in modern history: GRB221009A. How strong was it? It caused electrical currents to flow through the surface of our planet. —
https://www.spaceweather.com/
Solar wind
speed: 538.6 km/sec
density: 8.83 protons/cm3
Daily Sun: 18 Oct 22
Sunspot number: 84
The Radio Sun
10.7 cm flux: 126 sfu
Thermosphere Climate Index
today: 16.94×10^10 W Neutral
Oulu Neutron Counts
Percentages of the Space Age average:
today: +2.6% Elevated
Yeah, I felt it
I didn’t.
I must be insensitive.
You are not an alien
Solar wind
speed: 429.1 km/sec
density: 4.02 protons/cm3
Daily Sun: 19 Oct 22
Sunspot number: 50
The Radio Sun
10.7 cm flux: 114 sfu
Thermosphere Climate Index
today: 16.76×10^10 W Neutral
Oulu Neutron Counts
Percentages of the Space Age average:
today: +3.1% Elevated
It seems it could take a few more month before 25 gets very active and it seems Oct will be sideways and Neutron Counts will remain
+3 or more, and Thermosphere Climate Index will be around
17 x 10^10. And the spots going to farside, and could get a day or two of spotless.
I’m just waiting for chart-making Bindiclown to figure out how to put a kink into his epic hyperbolic Red Line
https://i.postimg.cc/ZqDW7RrY/Solar-flux-F10-SC25-vs-SC24-for-the-babbling-Edog.png
There is only one clown here, babbling Edog, and that’s you.
https://www.nhc.noaa.gov/?atlc
No more Atlantic storms. Season appears over.
I got another tropical depression in Pacific:
https://www.nhc.noaa.gov/?epac
Roslyn
It looks weak and slow- not likely make it cloudy and/or rainy where live.
Solar wind
speed: 420.0 km/sec
density: 7.92 protons/cm3
Daily Sun: 20 Oct 22
The Radio Sun
10.7 cm flux: 113 sfu
Thermosphere Climate Index
today: 16.50×10^10 W Neutral
Oulu Neutron Counts
Percentages of the Space Age average:
today: +3.4% Elevated
48-hr change: +0.6%
3126 is somewhat big, but it’s most of it. Could grow or
shrink, but it’s near equator and will get to farside in few days
” The planet temperature cannot change by half a degree withing the span of one day ”
*
Of course: one could easily find the data source out of which the CFSR plot
https://i.postimg.cc/02JtmjRs/d1-gfs-gta-daily-2022-10-15.gif
was generated.
However, it seems enough to take a closer look to see that the 0.6C drop in April lasted more like 12 days.
*
Here is, for the period Jan 2021-Jun 2022, a chart with a daily plot of GHCN daily anomalies wrt the daily means within 2011-2020:
https://drive.google.com/file/d/1VAklId23KaCkVl8Nr7ayNgZi16UaDGrP/view
Though the two plots show similar things (global daily data since September 2021), they differ considerably:
– the GHCN plot is based solely on land station data, and thus does not reflect oceanic inertia;
– it is made out of raw, ungridded data, as opposed to CFSR’s reanalysis data;
– the reference period is 2001-2020 instead of 1979-2000.
*
What is here of interest is what they have in common, namely sharp discontinuities.
In the GHCN plot, there is a big drop in 2022 e.g. between March 2 and March 10:
Year M D: Temp | Base | Anom
2022 3 2: 6.04 | 3.42 | 3.04 (C)
2022 3 3: 5.50 | 3.88 | 2.55
2022 3 4: 3.62 | 4.30 | 0.65
2022 3 5: 3.32 | 4.81 | -0.10
2022 3 6: 3.18 | 5.23 | -0.70
2022 3 7: 2.44 | 5.55 | -1.86
2022 3 8: 1.08 | 5.95 | -3.73
2022 3 9: -0.14 | 6.28 | -5.37
2022 3 10: -0.72 | 6.38 | -6.27
The global average of all absolute temperatures measured by over 15,000 stations every day goes down and down while the 20-year baseline moves up and up; the addition of the two results in an big anomaly drop of over 10 C!
Conclusio: if raw raw data shows such discontinuities, what then is the reason to doubt about reanalysis data?
*
N.B. The absolute average temperatures are mainly due to the extreme dominance of US station data and the lack of gridding.
Apos, mistake: the baseline for the aforementioned days is
3.00 (C)
2.95
2.97
3.42
3.88
4.30
4.81
5.23
5.55
It’s a bit late here…
None of this corresponds to the -0.5c continuous downwards shift in the reanalysis data, only that the global temperatures can vary by that amount.
Show me where on the above graph from 2014 onwards that a similar step change has happened.
Another nice little step change in global (monthly) temperature data…
https://drive.google.com/file/d/1_-mxrUTjgNVZOJlymj_ZlwD_DIbMyb0R/view
Anomaly averages in the ungridded data
– 2001-2012: +0.38 C
– 2013-2022: -0.53 C
The blue plot, however is merely a statistical artifact, because it shows a combination of about 9,000 US stations located within about 10 Mio km^2, with nearly the same number of stations outside the US, but located within… about 140 Mio km^2.
Thus, the blue plot represents something like the Globe as kinda US’ backyard.
Distributing all station data over e.g. a 2.5 degree grid (like that of UAH) and averaging the grid cell data prior to computing the monthly averages, gives the red plot.
Anomaly averages in the gridded data
– 2001-2012: -0.01 C
– 2013-2022: +0.01 C
In the blue plot, 9,000 US stations compete with 9,000 stations outside of the US; in the red plot, 220 US grid cells compete with 2,000 cells outside.
Source
https://tinyurl.com/yrd92bbd
I thought that reanalysis data is gridded.
No one told it isn’t.
I hope the Sun wakes up and follows Bindiclowns Megahyperbolic red line because otherwise I don’t know how he will kink it and bend it
https://i.postimg.cc/Dw7GkRC5/Clipboard0122.jpg
There is only one clown here, babbling Edog, and thats you.
–By Eric Ralph
Posted on October 20, 2022
In 15 hours, SpaceX has rolled a new Starship to its South Texas launch and test facilities, reassembled the worlds largest rocket, launched Starlink satellites to orbit, and recovered a reused Falcon 9 booster in port.–
https://www.teslarati.com/spacex-starship-rollout-starship-stack-starlink-launch-13-hours/
So SpaceX has launched 48 rockets in 2022, and probably end up launching around 60 in 2022 [not including any Starship test launches]. Starlink which is suppose to serve rural areas in US which has low internet speeds, is providing faster internet for many countries in Europe. Northern Japan are now allowed to use it, South Korea will soon be allowed and it thought India will allowed within a year or two. As of Sept 22 there about 700,000 users, I would guess there will be about million by the end of the year. And there another starlink launch before the end of year. But starlink will really take off, if Starship successfully launches it’s test launch- which might happen next week. Though it might take another month.
If it does take another month, there will probably be, 3 Starship ready for launch. Right now, roughly there two “ready” to launch but they have be tested first. Probably around Monday next week they will have wet rehearsal- test everything other than the engines firing. And if goes well, next is the static engine firing, and then the launch.
Anyhow, Musk predicted he might get 60 launches, and chance of that happening are pretty good. He said maybe before Nov, they launch starship, if not, early Nov. It seems if every goes as planned, and nothing much is learned from test launch, we might see 1 or 2 additional Starship launches this year. But it more likely a lot will learned and it could take to 2023 before the second launch is tried.
In terms SLS launch- I have not heard of anything encouraging about it, so going to say at best 50% chance it launches as planned.
So, there is chance neither SlS or Starship launches in 2022, probably less than 50% both launch in 2022, better than 50% chance
one of them launches.
And weather can easily delay both or either of them. SLS would be more effected by weather. SLS has to launch at certain launch window, Starship doesn’t- weather could delay Starship by a week or two, weather could delay SLS by months.
I am getting more organized, I bookmarked weather in boca chica- and for KSC. Anyhow weather in Boca Chica doesn’t look bad, but not great, either.
Weather where I living looks cold- so cold it could kill my dwarf lemon, so must remember to bring the little sucker in. I forgot once and it looked completely dead and didn’t recover fully- I would guess no lemons from it for at a year or two- assuming I don’t forget to bring the sucker in and it just dies.
Tonite it just gets down to the global average temperature of 59 F,
tommorrow is suppose to drop to 49 F, and Monday it’s forecasted for 37 F. And stay near freezing [at night] for rest of week.
37 F might not kill it, but it could be a wrong forecast and/or it’s just not good for the little bugger- which is not far from death’s door. But I am not going worry about tonight.
Also it seems tropical storm Roslyn which is far away, but seems to get a bit stronger. And there is probably small chance it might become a hurricane and even effect my weather and “somehow” Boca Chica weather. And there is chance of tropical/hurricane starting in the Atlantic:
https://www.nhc.noaa.gov/?atlc
Which far away from anything- maybe Canada or Europe.
Solar wind
speed: 366.6 km/sec
density: 9.59 protons/cm3
Daily Sun: 21 Oct 22
Sunspot number: 33
The Radio Sun
10.7 cm flux: 116 sfu
Thermosphere Climate Index
today: 16.50×10^10 W Neutral
Oulu Neutron Counts
Percentages of the Space Age average:
today: +3.7% Elevated
https://www.spaceweather.com/
Looking more like sideways for Oct, but
maybe it won’t go spotless.
And it seems if crew were going to Mars
they would getting more GRC radiation
and I wonder if that huge burst of Gamma rays could
have had bad health effects, also.
Solar wind
speed: 399.2 km/sec
density: 5.79 protons/cm3
Updated 22 Oct 2022
Sunspot number: 60
The Radio Sun
10.7 cm flux: 109 sfu
Oulu Neutron Counts
Percentages of the Space Age average:
today: +3.5% Elevated
https://www.spaceweather.com/
More spots in south, none in north
South are quickly growing.
It seems to switch back and forth from
south to north.
Maybe get spotless during the time it switches- and
seems when it switches, spots appear and grow fast,
or later on they don’t grow, but rather fade, until
switch south to north or north to south.
But anyhow, Roslyn is now a Hurricane:
https://www.nhc.noaa.gov/?epac
115 mph sustained wind- it might do something.
Anyways, I have not had enough coffee, yet.
Recently I have thinking of how to launch the BFR
also called Starship, with my crazy thing I call a pipelauncher.
A pipelauncher is an enormous pipe and the top being capped- and
holds air in it, and floats vertically in the ocean.
Since they are large diameter, they have to very strong and not
have a lot mass. So very strong and light, and in the corrosive ocean- one should have it made of titanium.
But I thought one might start with a strong aluminum alloy- the same alloy used by Falcon-9. Which imagine would survive the ocean for
a few years [titanium should last for decades- but it’s expensive and
it’s heavier than aluminum. Or titanium is good, if want heat resistance and it lasted a long time in the marine environment].
I was thinking it would be nice to get out of the Age of Steel and
into Age of Titanium, but like aluminum which was very expensive, titanium is currently too expensive. But since the space environment
could have cheap electricity in say about 2 decades- that could start the Age of Titanium. So cars, and flying cars, made of titanium, dropped from space into your driveway- sort of thing.
Anyhow the pipelauncher to launch BFR, is a bit more complicated than a large pipe. I had make what call a staged pipelauncher to handle something as big as BFR. Though that is mostly about using less liquid air. Liquid Oxygen or Nitrogen or both: liquid air turns into gaseous air very quickly if dump into water [or the surface of the ocean]- but works better if warmer water, so also hot water as hot water you get from hot water tank you use to wash dishes and take shower from- or not boiling water, hot. So around 80 C- though could be 100 C though it also be 20 C. It could be 110 C, but I assume about 80 C is good enough.
So, with big diameter pipe, and could call the 9 meter diameter starship, not very big pipe, 9 meter diameter can handle air pressure higher than 100 psig but requires a very strong pipe or thick walled pipe for larger diameters.
Starship 9 meter diameter can handle more than 100 psig- but it’s not very big.
Most people would say something 9 meters [or 29.5 feet] is as big as house- suggesting it is quite big. I call it a big pipe in terms of making ocean breakwaters, but not very big if lifting a rocket [particularly if lifting the launch pad and launch tower, also].
Anyhow, the 5000 ton BFR, is challenging, but adding to a tower which weigh as much or more, is annoying/frustrating.
Or this isn’t adding much speed, but a kind of want around 100 mph added. It should be noted that pipelauncher must add some speed, but say 50 mph is enough {and easier].
But what wanted to mention is that anything launching from the ocean
should or maybe must have a breakwater.
Or before trying to use pipelauncher to lift BFR, I thought one would
use floating breakwaters.
Musk plan is to launch from an oil platform- something designed to operate in open ocean. And didn’t think a pipelauncher or oil platform “needed” a breakwater, but thinking that now.
I was thinking you would- mainly I was thinking about people living/staying there would want or need it.
I do know hundreds people do live on oil platforms.
People can deal with small amounts motion, but can 120 meter tall rocket handle small motions.
So I was wonder what is limit and trying to make it so it was the least, and thinking what size waves does need to designed to deal with in order to launch a rocket.
Spent hours thinking this, then realized, my other crazy hobby is breakwater, and with breakwater not worried about 10 feet waves.
So don’t design it so it can handle, say 3 foot wave, but rather do the friggin obvious and put it within breakwater, where waves are not a inch high- unless it’s weather so bad you would never launch in it anywhere.
So, my claim is oil platforms need floating breakwater in order to launch a Starship rocket from.
Ok so there different types of oil platforms:
https://www.treehugger.com/types-of-offshore-oil-rigs-4864111
They list 6 types. And one type is sort of like a pipelauncher- which is called Spar Platform:
“Named after the tall, vertical “spar” (aka mast) of a sailing ship, spar-platform rigs use a single, wide-diameter cylinder to support a surface deck from the sea floor. A typical spar platform in the Gulf of Mexico has a 130-foot-wide cylinder, and about 90 percent of its overall structure is hidden underwater. Spar cylinders are available at depths up to 3,000 feet, but existing technology can extend this to about 10,000 feet, making them one of the deepest-drilling types of offshore rigs in use.”
Though it’s description seems to suggest having them go down to
the ocean floor, and/or I see no reason to make them 3000 to 10,000 feet [914.4 to 3048 meters] tall. Btw 130 foot = 39.624 meter
The pipelauncher for BFR had wide top deck of 22 meter [72 foot] but main tallest part of pipelauncher part was 13 meters [42.65 feet] in diameter and 200 meter tall. Or pipelauncher is spar or spar buoy type thing.
And they “work” kind of like a keel of sailing boat/ship.
[And as I sometimes like to say, based on 1000 year old technology.]
So, another one is called, Jack-Up Rig. Which sits on bottom of ocean. I would say a Jack-Up Rig might not need breakwaters. But a number of Jack-Up Rigs have been destroyed by hurricanes- but there
lots old and different types of Jack-Up Rigs. And I would say it depends on ocean depth. They are: “For smaller, shallower offshore oil deposits that don’t warrant a permanent platform, or for drilling exploratory wells,” Or if in the right amount of “shallow water” they might be stable enough.
But in regards Spacex oil platforms
“The ENSCO 8500 series are semi-submersible rigs. What this means is that they dont sit on the bottom of the ocean like a drilling platform (which sits atop a tower) or a jack up (which has extendable legs to sit on the sea floor). They differ from drilling ships in that they sit on pontoons that are pushed under the water, below the waves, which gives them greater stability. Theyre often anchored to the sea floor with a cable to keep them in roughly the same place and stay coupled to the wellhead, but in some cases they stay put with thrusters or a combination of the two.”
https://cleantechnica.com/2021/01/21/more-about-spacexs-oil-rigs/
I think ENSCO 8500 series needs floating breakwaters.
The “Experts” are catching up on the third La Nina , No Zshit
https://wattsupwiththat.com/2022/10/21/scientists-warn-of-a-rare-third-year-la-nina/
Pick your model
High definition full screen recommended
https://youtu.be/8XqW4iUMopA
https://youtu.be/xvnbP6vX1So
The historical part of the Multivariate ENSO Index (MEI) begins in Jan 1871:
https://drive.google.com/file/d/1AeK8oGGqzX27K60aYAn4JWDho-8lhwMl/view
A superposing overview of all La Ninas having lasted at least two consecutive winters:
https://drive.google.com/file/d/1OFB3GczUOmJ-T1IwbmVFa3NuRaWpSIaO/view
Here is the list of all triple La Ninas since then, named by starting year and sorted by the sum of their consecutive monthly indices (all below -0.5, the La Nina treshold):
1892: -54.67 | 40
1908: -52.22 | 41
1973: -48.71 | 36
1954: -40.45 | 31
1915: -38.97 | 31
1998: -37.66 | 36
1873: -36.82 | 33
The third column shows the number of consecutive months.
*
It is clear already now, when looking at forecasts, that the youngest 2020 edition
2020: -36.12 | 28
will, in a few months, have bypassed at least 1873 and 1998:
NOAA (Nino3+4)
https://www.cpc.ncep.noaa.gov/products/CFSv2/imagesInd3/nino34Mon.gif
Tokyo Climate Center (Nino3)
https://ds.data.jma.go.jp/tcc/tcc/products/elnino/elmonout.html#fig2
Actually, the 1998 edition should have been taken off the triple dip list because of two months (August and September 2000 at -0.08 and -0.36 respectively).
Oh là là! Quelle honte.
Az long as there is no superdeveloping La Nina we should be OK
Az long as the babbling Edog keeps pretty dumb, we should be OK indeed.
When Bindiclown realized his epic La Nina forecasting fail he tried to spin it into some kind of dispute how strong it was going to be , something that nobody even argued about ,
Only problem , he declared La Nina to be over and tried to compare it as a small one to the previous ones long before it ended , he is in for some surprise ,
it turns out he lost even to his own strawman argument , that takes some doing,
Stop your utter lies, babbling Edog.
I admitted at least one year ago my 100% mistake in giving the TCC Nino3 forecasts more weight than to NOAA’s Nino3+4 predictions.
You are really a dumb, dishonest stalker.
Ask me again
https://www.drroyspencer.com/2022/05/uah-global-temperature-update-for-april-2022-0-26-deg-c/#comment-1279572
Eben got stuck at the 5th grade bully stage.
You don’t have even enough sense to wait for the present La Nina to finish before you compare it to the past ones
Scatterplot Sensitivity
https://wattsupwiththat.com/2022/10/21/scatterplot-sensitivity/
The best of the thread was Izaak Walton’s comment and the discussion following:
https://wattsupwiththat.com/2022/10/21/scatterplot-sensitivity/#comment-3624979
Walton is absolutely right.
“This is perhaps clearly seen near the poles. Europe is warmed by the gulf stream meaning for example that the UK is 5 degrees warmer than the coast of Canada at the same latitude. So an additional W/m^2 of sunlight in the UK is not going to make much difference since it wont change the stream of the gulf stream.”
Izaak Walton
Well, generally agree, “W/m^2 of sunlight in the UK is not going to make much difference”
I have a host of reasons it would not make any difference.
Or someone saying that makes wonder if they understand things as I do.
But I would ask, what is most important reason +W/m^2 of sunlight to UK or -W/m^2 of sunlight to UK would make no difference.
Who said hurricane season was over
https://youtu.be/J-C0cFmvjVg
The model sez otherwize
https://youtu.be/R0v955XlhtQ
Hurricane season usually refer to Atlantic {in US} because normally
that is where most of the action occurs.
But as cargo cult believer might say, we having global climate change.
Anyhow, Roslyn could mess up Starship testing.
She should come me, she might warm me up.
Though Roslyn seems to stronger than the earlier hurricane hitting nearly in same area, it seems it is fading fast like the other one. And Boca Chica doesn’t have good weather, but unclear how much effect it will have on testing.
Solar wind
speed: 514.9 km/sec
density: 12.99 protons/cm3
Daily Sun: 23 Oct 22
Sunspot number: 55
The Radio Sun
10.7 cm flux: 105 sfu
Thermosphere Climate Index
today: 16.70×10^10 W Neutral
Oulu Neutron Counts
Percentages of the Space Age average:
today: +3.3% Elevated
Southern spots are not growing but appear to be weakening- I think could have spotless, soon
My weather is cold and forecasted to cold- below average global temperature but not forecasted to freeze next week.
https://www.google.com/search?channel=fs&client=ubuntu&q=weather
Has been having strong gusting winds and is clear and will clear
in next few days.
Spotless unlikely, but another move sideways
It seems to be about 50% we have 30 sunspots or less within 2 days.
And I would guess about 1/3 chance spotless within few says.
Solar wind
speed: 482.4 km/sec
density: 6.69 protons/cm3
Daily Sun: 24 Oct 22
Sunspot number: 65
The Radio Sun
10.7 cm flux: 108 sfu
Oulu Neutron Counts
Percentages of the Space Age average:
today: +3.2% Elevated
https://www.spaceweather.com/
3126 got bigger- but it’s going to farside
And it appear old spots in northern hemp are coming around from farside
Solar wind
speed: 426.3 km/sec
density: 2.87 protons/cm3
Daily Sun: 25 Oct 22
Sunspot number: 46
The Radio Sun
10.7 cm flux: 115 sfu
Thermosphere Climate Index
today: 16.82×10^10 W Neutral
Oulu Neutron Counts
Percentages of the Space Age average:
today: +3.0% Elevated
It seems it’s the northern hemisphere to rescue.
3131 has come around from farside and it is not small
and might grow larger.
So, no small chance of spotless any time soon.
It seems Oct will be sideways, but is it the lull
before the storm,
It seems unlike Oct, Nov could start off slow and build,
and that rather than sideway, Nov has a bit uptick and then
builds in coming months?
Oh what do these guys say:
“Forecast of Solar and Geomagnetic Activity
24 October – 19 November 2022
Solar activity is expected to be low or very low levels throughout
the outlook period. There is a slight chance for M-class activity
(R1-R1 Minor-Moderate) on 27 Oct – 10 Nov due to active regions with
M-class flare history that are scheduled to return to the visible
disk. ”
https://www.swpc.noaa.gov/products/weekly-highlights-and-27-day-forecast
It seems it agree with my wild guess, except I am expecting to pick
up, somewhere around the 10th of Nov.
Of course it might also just fall like a rock.
I have a plan to throw Starship like a lawn dart with a pipelauncher
at about 100 mph.
No reasonable rocket engineer would like it.
And my newest faddish is to make the ocean dead still for a rocket launch.
What might be overly excessive is to launch it from freshwater lake
in the ocean.
Not enough coffee, yet.
Putting off the lake.
Got to float mechazilla.
I am guessing it needs to be wider.
But I need more coffee.
So floating mechazilla wasn’t hard.
I would note that catching a rocket on ocean is different
than on land- obviously failure means a wet rocket.
I have had 1/2 cup of coffee, so far.
But launching a lake still seems excessive.
But getting more idea of launching within breakwater
area, might be something to spend some time on.
And should think about a breakwater for oil platform,
because no one is crazy enough to do pipelauncher
at time soon.
Though another possibly is focusing only on pipelauncher
which appear less crazy.
Also weather in Boca Chica last nite appears very bad,
today, it seems there is less forecast of thunderstorms.
It was constant thunderstorms and now it’s less than 1/2:
ttps://weather.com/weather/tenday/l/Boca+Chica+TX+USTX1783:1:US
Or seemed just bad for next 10 days on 10 day forecast, and now, it’s just not very good.
Oh there 70% chance of tropical storm in Atlantic:
https://www.nhc.noaa.gov/?atlc
And on my side the Cat 4 is long gone and nothing else going on.
My forecast is just more cold, but no freezing. It close to freezing last nite and brought lemon tree in.
Anyhow could try pipelauncher for something smaller than Starship
or breakwater for oil platform that will launch Starship.
hmm.
Solar cycle Maximum
https://youtu.be/5M-I7-dE1WQ
Nice post ! Absolutely loved it!
Drywall Contractor Richmond, BC
Oct 24: still no September zonal let alone grid data.
Mais que se passe-t-il à Huntsville en Alabama?
*
Do the layers above the mid troposphere suddenly create problems, making the calculation of LT data out of the three layers above less and less plausible?
Please keep in mind that LT is since 2015 no longer a result of O2 microwave observation, due to problems at grid cell level, and thus has become a 100% synthetic product, calculated as follows:
LT = 1.538*MT 0.548*TP + 0.010*LS
A comparison of the original LT data with a time series created using the above formula speaks for itself:
https://drive.google.com/file/d/1tJDjs0VwqeusqbBtD3eO3eyxuepoPRR1/view
Sources: the ‘uahncd~c’ files in the four atmospheric layer subdirectories of
https://www.nsstc.uah.edu/data/msu/v6.0/
Missing minus sign:
LT = 1.538*MT – 0.548*TP + 0.010*LS
So if you don’t get your grid data does it mean your predictions stop being exactly inverted ???
Babbling Edog
1. I don’t predict anything, and you know that.
2. What the heck does grid data have to do with the fact that UAH’s LT time series isn’t a result of direct observation but a synthetic composition of MT, TP and LS observations according to the formula above?
When will you stop stalking me with your mix of polemics und ignorance?
When will you ? you go first
Where is the superdeveloping La Nina , I miss it
https://youtu.be/06KdEydouaY
Climate shystering lesson 202 – intermediate level
https://youtu.be/zM2kL4U0ZCs
Goldman Sachs Jeff Currie: $3.8 Trillion of Investment in Renewables Moved Fossil Fuels from 82% to 81% of Overall Energy Consumption in 10 Years
Economist Jeff Currie of Goldman Sachs (Global Head of Commodities Research in the Global Investment Research Division): Heres a stat for you, as of January of this year. At the end of last year, overall, fossil fuels represented 81 percent of overall energy consumption. Ten years ago, they were at 82. So though, all of that investment in renewables, youre talking about 3.8 trillion, let me repeat that $3.8 trillion of investment in renewables moved fossil fuel consumption from 82 to 81 percent, of the overall energy consumption. But you know, given the recent events and whats happened with the loss of gas and replacing it with coal, that number is likely above 82. The net of it is clearly we havent made any progress.
https://wattsupwiththat.com/2022/10/25/goldman-sachs-jeff-currie-3-8-trillion-of-investment-in-renewables-moved-fossil-fuels-from-82-to-81-of-overall-energy-consumption-in-10-years/
An estimate of the societal costs of nuclear energy in GERMANY (not: worldwide), including, since 1955
– research
– development
– processing, maintenance
– search for appropriate final storage places for highly contaminated waste
but excluding
– dismantling of decommissioned plants
– vitrification of waste (from rods and highly contaminated plant parts, such as reactor kernels and primary cooling systems)
– final waste disposal
made on the basis of all available documents, gives in the sum:
1 trillion Euro.
Study made by Greenpeace (the German nuclear industry refused several times to do the job).
*
This sum is very low compared with the nuclear situation in France, because our neighbour has in addition to process dismantling and waste disposal of
– two preprocessing sites (conversion of yellow cake into UF6, enrichment to obtain 3.5% U235);
– two reprocessing sites to obtain Pu239 (and U235 not subject to fission yet) out of used fuel rods: La Hague and Marcoule, the latter one incredibly contaminated due to the early military context).
*
Hmmmh.
My gut feeling: the costs of the switch to more renewables will NEVER reach those FINALLY generated by the nuclear industry.
*
One reason for my feeling, gbaikie, is as follows.
During the 1970’s, France started planning and realization of a 4th generation plant (Superphenix in Creys-Malville, 1.2 GW, based on liquid sodium cooling).
Their naive idea was to produce Pu239 out of blankets containing non-fissile U238 (byproduct of U235 enrichment) by neutron shot occurring during fission processes.
After 20 years of huge problems everywhere (but especially in the primary cooling system (5,500 tons of extremely dangerous liquid sodium continuously kept at 850 C) and 10 billion Euro invested, it was decided in 1997 to definitely shutdown the plant, and to start dismantling at some ‘appropriate’ moment.
The cost of the complete dismantling was guesstimated in 1977 at 300 million francs (less than 50 million euros).
The dismantling started in 2007, with a new guesstimate of… 1.5 billion, and was planned to end in 2027.
The 1.5 billion has already been used up for 10 years and the end is now planned for the late 2030s.
Maybe you understand now…
“made on the basis of all available documents, gives in the sum:
1 trillion Euro.”
Today’s dollars {or today’s Euro’s] or what cost at time of construction and time of maintenance and refuel. Also and/or does it including borrowing costs.
But roughly it doesn’t seem like “unexpected”.
Whereas the cost of over 40 billion dollar for SLS development, surprised me, I thought it was 20 to 30 billion. But maybe they are including improved upper stage, which wasn’t allowing for. Or maybe they are even allowing for that. Any way you look at it, SLS was a big mistake, but I hope they launch the damn thing.
In terms of nuclear we need to at least get to South Korea nuclear power program cost. Which is only stellar, in comparison to US, France and all other nuclear energy programs.
But it seems we should do better than what South Korea did.
If can’t match South Korea- hire South Korea.
But that is sort of a joke, even a cruel joke- the problem is political and not actually an technical issue.
Though political is also issue with solar and wind, also.
But without the political solar can’t work in Germany, also unless you just talking about residential solar water heating- which something done a lot in Germany- and I guess supported with government money- which btw is not done in the US.
gbaikie
You don’t have a bit of an idea of what happens in Germany.
What concerns solar for example: nearly every medium company has solar panels on its roof, and the amount of private houses increases similarly since 20 years.
No sun? And? Switch to gas, fuel, public electricity net.
Sun? Back to the local production.
That’s all, the rest is simple-minded polemics.
— Bindidon says:
October 26, 2022 at 4:38 PM
gbaikie
You dont have a bit of an idea of what happens in Germany.–
Germany is geographical location which gets about 1/4 the amount of solar energy reaching it. Spain is slightly better. UK as bad as Germany.
In terms of global climate, the tropics [40% of earth surface] receives more than 1/2 of the sunlight reaching earth’s surface- and it’s cloudy] the 60% receives less than 1/2.
At and near polar region, one gets very little sunlight. Germany is near the polar region.
Canada is also lousy place to harvest solar energy. As is the northern US. The rainy State of Washington is about as bad as UK.
Most of China is also bad, as is Japan. India is 1/3 the size of China, land prices are high- real estate in general is a mess. Not good for solar or wind.
–This sum is very low compared with the nuclear situation in France, because our neighbour has in addition to process dismantling and waste disposal of
two preprocessing sites (conversion of yellow cake into UF6, enrichment to obtain 3.5% U235);
two reprocessing sites to obtain Pu239 (and U235 not subject to fission yet) out of used fuel rods: La Hague and Marcoule, the latter one incredibly contaminated due to the early military context).
*
Hmmmh.–
Well. I think there can some agreement about France ambitious effort
at reprocessing nuclear fuel. In hindsight it looks like US took the better course- of course US wasted unknown amounts of tens of billions of dollars on an equally crazy idea of idea storing it in a mountain- which came to absolutely nothing. And part of that madness was safely transporting the nuclear waste.
Which I guess is also issue France reprocessing nuclear waste- and they are importing it [and I am not sure which nations they have decided NOT to import it from].
This is roughly my problem with nuclear, anything. Fusion, nuclear rockets, etc. Government has to be deeply involved with it.
And for instance I want the Moon to be mined- BUT NOT by NASA.
NASA seems to imagine it can build rocket cheaply and that it somehow it imagines, it can mine water {which hard to do] or that it could mine anything, at all, is utterly crazy.
With space there is little reason for government to involved much with space nuclear power plants. Or government involved significantly with mining space rocks, makes more sense than nuclear reactor on the Moon- and Moon is a good place to impact nuclear waste {which would be very bad idea to do on Earth]. Said differently a nuclear meltdown on lunar surface is not much of a worry- other than losing the the valuable reactor.
Of course nuclear reactors in Earth orbit, is a bad idea. L-1 or L-2 would be, ok, but medium or low orbit- forget about it. Of course nuclear rockets would be in Low Earth orbit.
Anyhow, what Germany can do or can not do, does not much matter much globally, it is a small population which is declining.
Nuclear in terms major source electrical power for rest of world is
unlikely to be large portion of energy mix- unless mass produced like UK is attempting to do, but even then it’s unlikely to be 40% or more.
Though if it was 30% it would still be huge amount.
Instead it seems most of electrical power in the future will using natural gas.
But in the time frame of +50 years it’s possible that more 1/2 of electrical needed globally could be from space environment.
And in 100 years, Earth energy use could small fraction of human energy use.
Solar wind
speed: 340.0 km/sec
density: 18.10 protons/cm3
Daily Sun: 26 Oct 22
Sunspot number: 72
The Radio Sun
10.7 cm flux: 116 sfu
Thermosphere Climate Index
today: 16.79×10^10 W Neutral
Oulu Neutron Counts
Percentages of the Space Age average:
today: +2.6% Elevated
https://www.spaceweather.com/
3131 seems to gotten bigger, it’s pretty big, but not
monster, yet.
I wondering whether we going to move away from alternating
between spotless north or southern hemispheres, anyhow got
spots in both but pretty weak.
Though if this was a normal solar max, it wouldn’t be getting anywhere near to very active part of solar max. Or to say it somewhat like cycle 24, is close enough to what it’s doing. And including the high Neutron Counts {I believe}.
I am more interested in Neutron Counts, and they have lowered a bit
but I don’t expect them break thru +0 Elevated, though it might happen by mid November.
In terms hurricanes [east Pacific or Atlantic, there is a chance of one forming in Atlantic:
https://www.nhc.noaa.gov/?atlc
And if did, maybe threaten North eastern US.
But unlikely.
I have guess about what temperature we going to get on Nov 1
It has not been much of hurricane season, which would tend to make think it might be colder, but I have been colder, and usually means warmer, I guess it will down a bit, going guess. .05 C
which some people might imagine is a lot.
Just to be clear: +0.05 C
Rats, September was +0.24 C and October will be +0.05 C
is my guess.
Or one might think I meant +0.24 C minus +0.05 C {= +0.19 C} or you could I thought I meant -0.05 C.
Finally, I believe that is clear enough- though I am probably way wrong- and prefer when I am wrong- because maybe I learn something and it’s amusing when people say I am wrong, when they didn’t even try to guess. But if they guess right, it’s also fun.
Not even close to spotless, but with average 90 and a week to go, it might still drop to around 85, which would be a perfect sideways move,
Or as Bindiclown would say , way ahead of the red line
Well, will next month of Nov will stay way ahead of the red line or continue sideways?
No or few spotless in Nov?
As I said, the I think it could pickup in second 1/2 of Nov.
And if that happen Dec could be like 24, lots of month around 125 spots. But also like 24 lots months dropping near 50.
24 cycle didn’t have a month over 150.
There is only one clown on this blog, babbling Edog.
That’s you, and you know it.
Solar wind
speed: 426.4 km/sec
density: 6.72 protons/cm3
Daily Sun: 27 Oct 22
Sunspot number: 78
The Radio Sun
10.7 cm flux: 122 sfu
Thermosphere Climate Index
today: 16.74×10^10 W Neutral
Oulu Neutron Counts
Percentages of the Space Age average:
today: +3.0% Elevated
48-hr change: +0.2%
3131 not monster, yet
Spots are growing= and 3126 going to farside
Solar wind
speed: 513.9 km/sec
density: 8.52 protons/cm3
Daily Sun: 30 Oct 22
Sunspot number: 97
The Radio Sun
10.7 cm flux: 134 sfu
Thermosphere Climate Index
today: 16.50×10^10 W Neutral
Oulu Neutron Counts
Percentages of the Space Age average:
today: +3.3% Elevated
48-hr change: +0.3%
3131 hasn’t got overly excited.
According to Youtube [below]
we suppose to get spot coming from farside
in south. And northern hemisphere is fairly impressive-
and could grow more.
Not exactly going as I expected 🙂
Not going to try to predict Nov.
But it seems we still a go, in terms of solar
grand minimum. But I would prefer not to have a
solar grand minimum.
The only upside, is it could force, trying to find a fast travel
time to Mars. But I hope it doesn’t involve nuclear rockets.
Germany Is Dismantling A Wind Farm To Make Way For A Coal Mine
https://oilprice.com/Latest-Energy-News/World-News/Germany-Is-Dismantling-A-Wind-Farm-To-Make-Way-For-A-Coal-Mine.html
“The dismantling of at least one wind turbine at the wind farm close to the German coal mine Garzweiler, operated by energy giant RWE, has already started. RWE says that lignite, or brown coal, has been mined from the Garzweiler coalfields for over 100 years.
RWE also said at the end of September that three of its lignite-fired coal units that were previously on standby would return to the electricity market on schedule in October.”
I think burning coal or trees is only a short term fix
Linked from: https://instapundit.com/
In case that wouldn’t be evident enough to you
This decision is, as well as that keeping alive the last 3 nuke plants till next April, is due to Putin’s warrior aggression against Ukraine and the subsequent shutdown of gas delivery by Gasprom.
Yes, well it too bad we lack the global leadership to end this dumb war.
If dems get destroyed in the coming election, something might done about it.
Your are living in a fatal illusion.
If the Reps win, then only due to the Trumping boy’s MAGA manipulation.
This would be the end of US’ help in Ukraine, hence the end of Ukraine itself.
Then begins Russia’s real war against democracy in Europe.
A fatal illusion is that this war could end?
Assuming one had good enough global leadership.
“If the Reps win, then only due to the Trumping boys MAGA manipulation.”
Even CNN is saying this.
“This would be the end of US help in Ukraine, hence the end of Ukraine itself.”
If you review history, Trump gave Ukraine weapons to defend themselves- unlike Obama.
Trump also spend a lot money to build up US military stockpile, which means Biden could hand out weapons- if he wanted to.
Trump also insisted NATO members spend more on military- which also could be useful, now.
Being weak, does not help in terms of leadership- quite the opposite.
“Then begins Russias real war against democracy in Europe.”
What part of global leadership to end the war, do you not understand.
–There is some irony in that. Musk has been viciously attacked as a Putin puppet for floating peace proposals, with many intelligence community types and Leftists in general accusing him of being a Putin puppet.
That is nonsense, of course. Musk was clearly proposing potential off ramps that would allow Putin to exit the battlefield more gracefully than a complete defeat would allow him, because it is widely feared that Putin would rather drop tactical nuclear weapons than face a humiliating and potentially, for him, fatal loss in the war. Short of total military defeatwhich would include destroying the capability to rebuild a militarywars end through negotiations in most cases.–
https://hotair.com/david-strom/2022/10/28/elon-musks-other-enemy-vlad-putin-n506458
Linked from: https://instapundit.com/
Which said:
–LIKE HIS OTHER ENEMIES, AN OLD MAN OUT OF TOUCH: Elon Musks other enemy: Vlad Putin. There is some irony in that. Musk has been viciously attacked as a Putin puppet for floating peace proposals, with many intelligence community types and Leftists in general accusing him of being a Putin puppet.
They accuse everyone of being a Putin puppet, usually because theyre Xi puppets. Also, Russia cant shoot down enough Starlink satellites to offset even just the launch from this week.–
Meteorite that smashed into Mars shook planet
https://www.marsdaily.com/reports/Meteorite_that_smashed_into_Mars_shook_planet_NASA_says_999.html
“The image is impressive, showing blocks of ice that were spewed up onto the planet’s surface around the 492-foot (150-meter) wide and 70-foot (21-meter) deep hole.”
It seems like a lot water from a shallow hole in the Mars tropics.
More signs that Mars could have mineable. But you would need to drill
to depth where there is liquid water [which might quite deep at this site]. Though maybe collecting boulder of ice on the surface from an impactor could be mining Mars water
“And though meteorite impacts on Mars are not rare, “we never thought we’d see anything that big,” Ingrid Daubar, who works on the InSight and MRO missions, told reporters at a press conference Thursday.
Researchers estimate that the meteorite itself would have measured between 16 to 39 feet across. An object of that size would have disintegrated in Earth’s atmosphere before falling to the ground here. ”
I would expect 16 feet across would be monthly thing with Mars and much smaller rocks are going to impact mars surface on a weekly basis and making much smaller craters. Though something as large 39 feet is rarer- years.
Oh, one way to mine Mars water, can involve using a nuclear reactor’s waste heat and melting ice under the surface.
Sort of, like fracking.
Never been, done before- that I am aware of. And might not work very well, but it might work.
solar maximum
https://youtu.be/TdGZuGd1gIA
Think how exciting and fun it will be, if people were going to live on Mars.
Having NASA go to Mars would be somewhat exciting and fun, but it would a lot better if people were going to live on Mars.
Elon Musks saying one reason to have settlements on Mars {which he says are self sustainable] is needed- at least at some point in time, and his view the sooner the better, but it’s effect upon humankind is more important.
What exciting about NASA exploring Mars with crew exploration, is largely hopefully about a government doing anything, other the normal oppression and causing wars.
About the only thing a government has done, which had any value was landing in the Moon. Though reason the US government did it, was related to winning the cold war. It was PR and it was cheap way to win the cold war. Compared to cost of warfare, it was dirt cheap.
They a number things a government could do which wasn’t evil- it could determine how mine methane hydrates in the ocean.
But that not happening. Less useful would be determining if fusion energy can work. Again, not happening.
It seems in terms of government doing anything useful [starting a global pandemic not useful, nor was lockdown and preventing children to go to school], the US govt is having most progress with exploring the Moon. One has to give NASA credit for subsiding SpaceX- you might saying they were “pushed into” doing it [with a fair amount of kicking and screaming], but they did it.
And NASA is subsidizing Starship, because Musk decided the Starship could be regarded as lunar lander for crew, and cheap one compared to any other proposed crew lunar landers.
I don’t agree that Mars could actually be self sustainable. I will say Mars fans have focused on Mars being self sustainable, but I don’t think any nation on Earth can be “self sustainable”.
And I think Mars would be “dependent” on Venus orbit. And Venus orbit is dependent on Mars, Earth/moon and space rocks.
And it’s possible that Venus orbit could have trillion people living in it.
But it depends on unknown things.
Mars settlements also depend on unknown things.
So, first, we have explore the Moon and if NASA can do this fairly easy thing, then explore Mars.
Nobody is going to mars
SpaceX Falcon Heavy Launches USSF-44 Mission
https://www.youtube.com/watch?v=wu113S1yy2M
Launching at 1 hour and 39 mins.
World’s largest rocket launches couple classified Military satellites.
Hopefully we get a SLS launch which will then be largest rocket, and Starship launch appears to be delayed until Dec, which then will the be largest rocket in the world. And years into future SLS will get highest payload which can lifted to High Earth or escape trajectories
without refueling in LEO.
Starship after it refuels in LEO, will largest payload capacity to higher orbits. And probably take a year or two, before Starship will be refueled in orbit.
Artemis 1 moon rocket ‘ready to go’ for Nov. 14 launch, NASA says
By Brett Tingley
published about 6 hours ago
https://www.space.com/nasa-artemis-1-moon-mission-officials-confident-nov-14-launch
“While SLS has been in the VAB for the past five weeks, NASA engineers have been replacing SLS flight termination system hardware, recharging Orion’s batteries, and replacing payload batteries, including the ones in some of the mission’s 10 ridealong cubesats.”
Another weekly review:
https://www.youtube.com/watch?v=Xv_52DB8Qf8
–SpaceX Starship Flight Plan Update by NASA, Amazing Falcon Heavy, Hotbird 13-G & Mengtian Module–
There was number of things which interesting. The bit regarding Amazon was quite “hopeful” in many respects.
One reason is, it seems another rich guy seems to be in a hurry.
And it seems New Glenn will happen, sooner rather then later [or never]. I like having a stable full of Heavy boosters [even including China effort in that regard].
It seems like good news for Nobody going to Mars, sooner, rather than later.
I wish Russia would stop the stupid war, they could doing more in space- and space, is what is actually important for Russia’s interests.
Grand solar minimum maximum
https://youtu.be/Hy8wI_onFbE
We need some fun today, so I’m posting SSNs usual SC25><SC24 chart including October, but this time using 4th order polynomial means instead of the megahyperbolic 3rd:
https://drive.google.com/file/d/1Barz6fsUF0NxRQrZ8dDUCVREAkFTeFwM/view
Jetzt ist die Welt wahrscheinlich wieder in bester Ordnung.
It went to your trash.
Exactly where it belongs
gbaikie
I’m exactly as much interested in your meaning about what I do as I am in babbling Edog’s meaning: zero dot zero.
I clicked on your link.
And reported what the message said.
Did it again.
Said it was in owners trash
“No preview available
File is in owner’s trash”
You are trying too hard, his amateurish butchered chart are worthless trash anyway
Almost tomorrow.
Solar wind
speed: 464.9 km/sec
density: 9.54 protons/cm3
Sunspot number: 56
The Radio Sun
10.7 cm flux: 134 sfu
Thermosphere Climate Index
today: 16.68×10^10 W Neutral
Oulu Neutron Counts
Percentages of the Space Age average:
today: +3.2% Elevated
48-hr change: +0.1%
ALL QUIET: There are four sunspots on the sun today. All four have stable magnetic fields unlikely to explode. NOAA forecasters say there is a 5% chance of M-class flares and no more than 1% chance of X-flares on Oct. 31st.
https://www.spaceweather.com/
Hmm, got tropical storm, Lisa:
https://www.nhc.noaa.gov/?atlc
Weather at boca chica, not good:
https://tinyurl.com/5y5n5z7v
lightening now and tomorrow
And windy and rainy rest of week
My weather is cold and small chance of snow.
Solar wind
speed: 517.1 km/sec
density: 10.23 protons/cm3
[strong]
Sunspot number: 63
The Radio Sun
10.7 cm flux: 128 sfu
Updated 02 Nov 2022
Thermosphere Climate Index
today: 16.70×10^10 W Neutral
Oulu Neutron Counts
Percentages of the Space Age average:
today: +3.4% Elevated
Lisa is hurricane and Martin is another Hurricane added.
https://www.nhc.noaa.gov/?atlc
[Lisa might affect Starship testing]
I guessed Nov temperature wrong, it went up a tiny amount.
Only 2 months of La Nina left to drop the global temp below 10th highest.
Australia doing its part.
Now aLL WE NEED ARE land and UAH to arrive at that result.
Surely under zero this month Roy.
Temperature drop effect is known to be delayed by 4-5 month so you have 6 month to wait, sit tight until then
Is we mix the oceans forcing cold water to the surface we could cool down the world and also absorb more CO2.
Could be powered by giant windmills or nuclear reactors pushing compressed air deep down the oceans.
There it is, another step sideways
https://i.postimg.cc/0NHP3CJX/Clipboard01.jpg
I’m very very happy, because I find this article, thank you very much has been sharing this information! Siding Contractor in Victoria BC
Someone guessed correctly:
The New Pause Lengthens to 8 years 1 Month
https://wattsupwiththat.com/2022/11/03/the-new-pause-lengthens-to-8-years-1-month/
“The trend on the entire dataset during the 527 months from December 1978 to October 2022 is 0.59 C, equivalent to a modest and beneficial 1.34 C/century: [Our graph]
If global warming were to continue at 0.134 C/decade for 77 years to the turn of the next century, there would be just 1 C more global warming this century. Is that a crisis, emergency, catastrophe, cataclysm or apocalypse? No. It is a good thing.”
It would be a good thing. But it seems unlikely we will be that fortunate.
I think we finished recovering from the Little Ice Age and the trend will lessen. And we got 1/2 of doubling CO2 and don’t think our cold ocean will allow another 1/2. And the largest CO2 emitter is China and it’s already reached peak coal.
And even if China find more, their population is declining.
Solar wind
speed: 616.6 km/sec
density: 18.45 protons/cm3
{strong}
Daily Sun: 03 Nov 22
Sunspot number: 49
The Radio Sun
10.7 cm flux: 130 sfu
Oulu Neutron Counts
Percentages of the Space Age average:
today: +3.8% Elevated
48-hr change: +0.4%
https://www.spaceweather.com/
Still think it could pick up by mid Nov, but
maybe get few spotless days before it
Solar wind
speed: 479.2 km/sec
density: 6.13 protons/cm3
Daily Sun: 05 Nov 22
Sunspot number: 81
The Radio Sun
10.7 cm flux: 118 sfu
[flux seems low]
Thermosphere Climate Index
today: 16.45×10^10 W Neutral
Oulu Neutron Counts
Percentages of the Space Age average:
today: +4.2% Elevated
The north appears active and South is taking a
break.
I don’t think it’s going to pick much anytime soon.
It hasn’t been a good time to having crew going to
Mars.
Let’s look at actual windows to Mars:
2022.6033 8 7 2022 leaving Earth on simple hohmann
arriving:
2023.3120 4 22 2023
That window has past, and about 2 years before another
I mentioned another way**, via Venus:
2023.3779 5 16 2023
From Earth to Venus
I don’t enough about these orbital things but
if not doing a simple, one might able leave before May 2023
and maybe it’s after, but it seems one get to Venus orbit before:
2023.7779 10 10 2023
And from Venus leave to Mars:
2024.0427 1 15 2024
and get there to Mars before:
2024.6381 8 20 2024
So, one return within short period to Earth
2024.5561 7 20 2024
So have get mars a month or two ahead of the time it takes with
simple
**https://www.thespacereview.com/article/4467/1
But other that crazy, 2024 somewhere summer
Which of course NASA will not do- it’s is not planned to have crew on Moon before 2025. But someone could possibly do it in 2023 or 2024- but they were that crazy, GCR would the least of worry.
So leaves fall of 2026 as Earth to Mars {or via Venus] as next window. Which everyone would agree is tail end of cycle Max 25
Anyhow it’s possible we don’t have Solar Grand Minimum, and NASA plans of +2030 doesn’t have the Solar Grand Minimum issue.
Or fast Mars and/or having enough shielding.
But going to Mars will depend in many ways what on found on the Moon.
And in terms of Moon- you want quiet sun.
Superdeveloping La Nina called – Can you see me now ???
https://i.postimg.cc/T30KG7XB/mei-lifecycle-currentc.png
Nice post