
 Home/Blog
In my last post (Part IV) I showed how urbanization (as measured by population density) affects GHCN monthly-average Tmax and Tmin near-surface air temperatures during the warm season in the Northern Hemisphere. We are utilizing a technique that recognizes rural thermometer sites can experience large spurious warming with very small increases in population density, as has been known for over 50 years.
The urban heat island (UHI) effects on Tmin averaged 3.5 times as large as on Tmax, an unsurprising result and qualitatively consistent with previous studies. Also, I showed that the homogenization procedure NOAA uses to adjust the Tmax and Tmin temperatures caused greater UHI effects compared to raw (unadjusted) data, a result I cannot explain.
Again I will emphasize that these UHI warming results are based upon spatial comparisons between neighboring stations, and do not say anything quantitative about how much urbanization effects have spuriously warmed long-term temperature trends over land. That is indeed the goal of our study, but we have not reached that point in the analysis yet.
Here in Part V of my series on UHI I just want to show the difference between U.S. and non-U.S. stations, in this cased for adjusted (homogenized) Tmin data. This is shown in the following two plots, which are the same except the second plot has a logarithmic scale in population density.
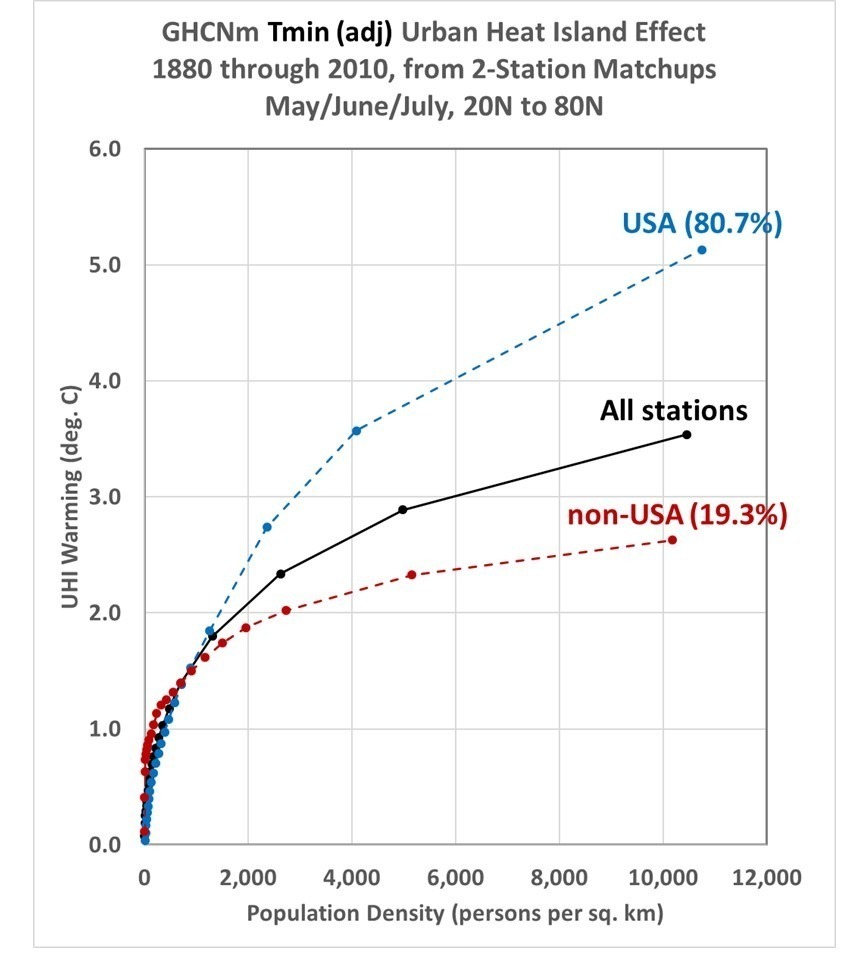
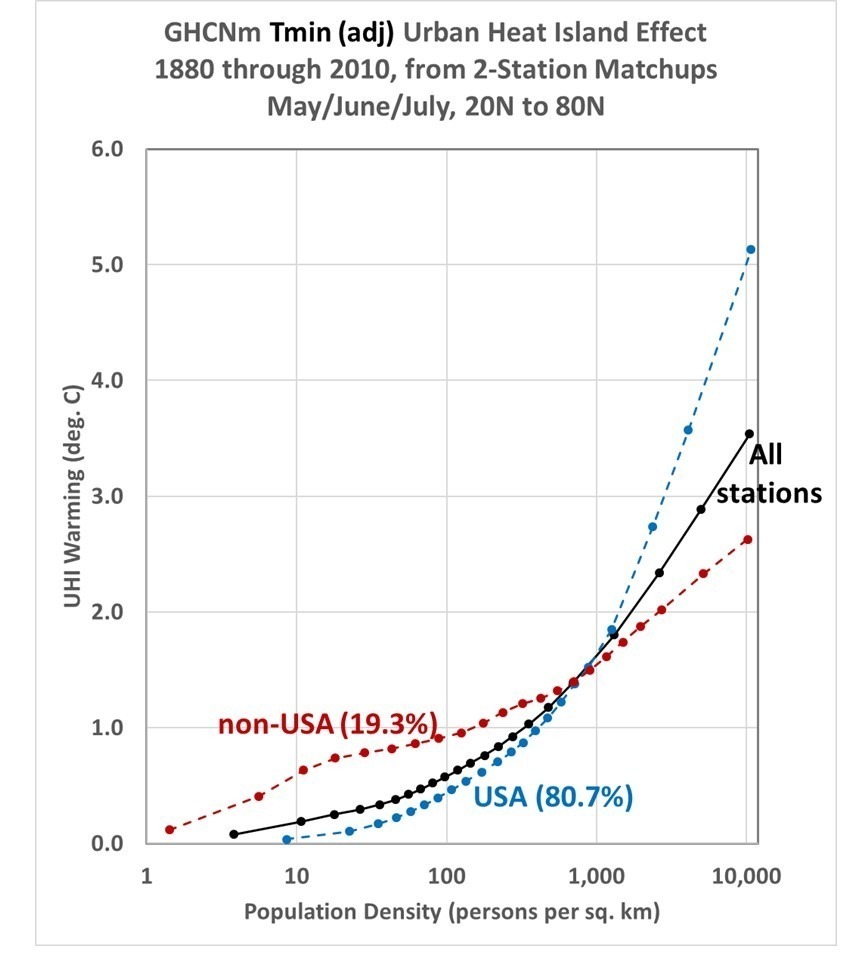
The non-U.S. stations have a more rapid rise in UHI warming at very low population densities than the U.S. stations do, but less rapid warming at high population densities. Possible reasons for this include country differences in thermometer siting and differences in waste heat generation. I’m sure you can think of other possible reasons.
As can be seen most (over 80%) of the GHCN 2-station matchups come from the U.S. Other countries have considerably fewer 2-station matchups, for example Canada (7.8% of the Northern Hemisphere total), Japan (4.7%), Turkey (2.8%), South Korea (1.3%), and China (1.1%). These low totals are not necessarily due to a lack of stations, but to a lack of station pairs within 150 km and 300 m elevation of each other needed for my current method of analysis.


“Also, I showed that the homogenization procedure NOAA uses to adjust the Tmax and Tmin temperatures caused greater UHI effects compared to raw (unadjusted) data, a result I cannot explain.”
I think it is because though the adjustment is meant allow for the UHI, it is actually the opposite. There is a certain pattern of “cutting all corners” in climate science. They may look like small, individual mistakes, but the margins add up.
I may have a partial answer. The buildings in the USA are more likely to be newer and taller, the streets and sidewalks tend to be wider, and air conditioning units may be more common when compared to older buildings outside the USA in established areas.
So the wealthier the population the higher the UHI?
EM,
Is that a question or a gotcha?
I’ll apologise in advance if it’s a genuine question, but often commencing a supposed question with “So . . .” is a prelude to a gotcha.
In any case, it might well be that “wealth” can be defined in terms of per capita energy usage (and heat generation as a consequence) in particular areas.
I think the variables involved make any exact calculations difficult, if not impossible. However, the speculation that anthropogenic global warming is due to anthropogenic heat production seems more reasonable than some sort of indefinable GHE which apparently had no warming effect at all for four and a half billion years.
What are your thoughts?
More snow in the mountains of California and on the Great Lakes.
https://i.ibb.co/JrFWZ7s/mimictpw-namer-latest.gif
First time this spring in the UK we have managed to hit 15C for more than a couple of days. Net Zero is killing us, its being done for a totally fake and fraudulent reason, while they spray our skys with chemtrails. There is a massive difference between contrails and chemtrails.
tim w…It has become obvious the net zero movement is about something other than science and has a political, underlying motivation. The IPCC are scoundrels leading the propaganda.
I think there may be mental issues involved as well. Many of the eco-weenies come across to me as mentally unhinged. The policies offered by some Green politicians seem to come straight from a looney bin.
Re contrails/chemtrails, did you check out the cloud formations I posted which look like furrows in a plowed field.
You should come into Sheffield, they are all for the clean air zone, but call us tinfoiler hatters for objecting to chemtrails. I think you have to be insane to support Net Zero.
The important question is this…do you support Wednesday or United?
☺ ☺
I like United.
30 years in the RCAF … I’ve seen a few contrails…. Chemtrailers drive me Knuts… Yah, nuts with a capital “K”! No amount of science or expertise will sway them… When they post pics of perfectly parallel contrails I try to explain that there are “highways” in the sky and the jets all fly over the radio-navigation beacons… They are evenly spaced and when the air mass moves the contrails end up like that, and if they have two different paths at different angles over the beacon, the moving air mass will have a crosshatch pattern…
test ća;
doesn’t work.
Where is everybody???
Since heating and air conditioning move heat around, Ive wondered if a more accurate temperature record of high population density locations would average inside and outside temperatures. What percentage of Manhattan is indoors and temperature-regulated for human comfort.
urbanization leads to the urban heat island effect, causing localized temperature increases in urban areas due to factors like heat-absorbing surfaces, changes in land use, waste heat, and altered wind patterns. Understanding and addressing the UHI effect is essential for climate monitoring, urban planning, and public health considerations in growing urban areas.
There will be more snow in the California ranges and on the Great Lakes.
google