
 Home/Blog
When computing temperature trends in the context of “global warming” we must choose a region (U.S.? global? etc.) and a time period (the last 10 years? 50 years? 100 years?) and a season (summer? winter? annual?). Obviously, we will obtain different temperature trends depending upon our choices. But what significance do these choices have in the context of global warming?
Obviously, if we pick the most recent 10 years, such a short period can have a trend heavily influenced by an El Nino at the beginning and a La Nina at the end (thus depressing the trend) — or vice versa.
Alternatively, if we go too far back in time (say, before the mid-20th Century), increasing CO2 in the atmosphere cannot have much of an impact on the temperatures before that time. Inclusion of data too far back will just mute the signal we are looking for.
One way to investigate this problem is to look at climate model output across many models to see how their warming trends compare to those models’ diagnosed equilibrium climate sensitivities (ECS). I realize climate models have their own problems, but at least they generate internal variability somewhat like the real world, for instance with El Ninos and La Ninas scattered throughout their time simulations.
I’ve investigated this for 34 CMIP6 models having data available at the KNMI Climate Explorer website which also have published ECS values. The following plot shows the correlation between the 34 models’ ECS and their temperature trends through 2023, but with different starting years.
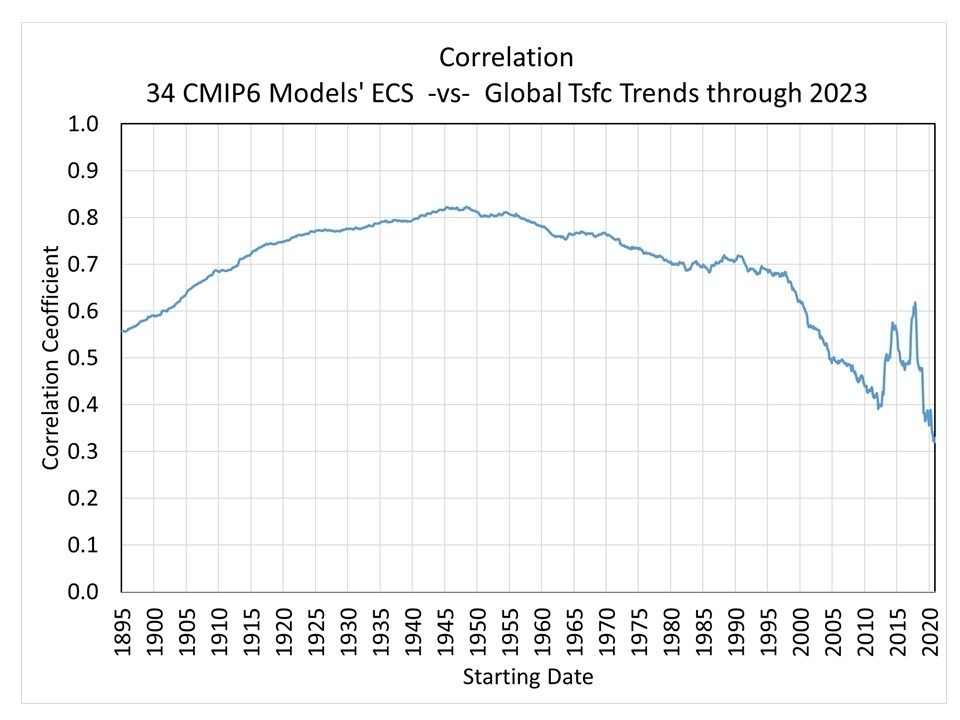
The peak correlation occurs around 1945, which is when CO2 emissions began to increase substantially, after World War II. But there is a reason why the correlations start to fall off after that date.
The CMIP6 Climate Models Have Widely Differing Aerosol Forcings
The following plot (annotated by me, source publication here) shows that after WWII the various CMIP6 models have increasingly different amounts of aerosol forcings causing various amounts of cooling.
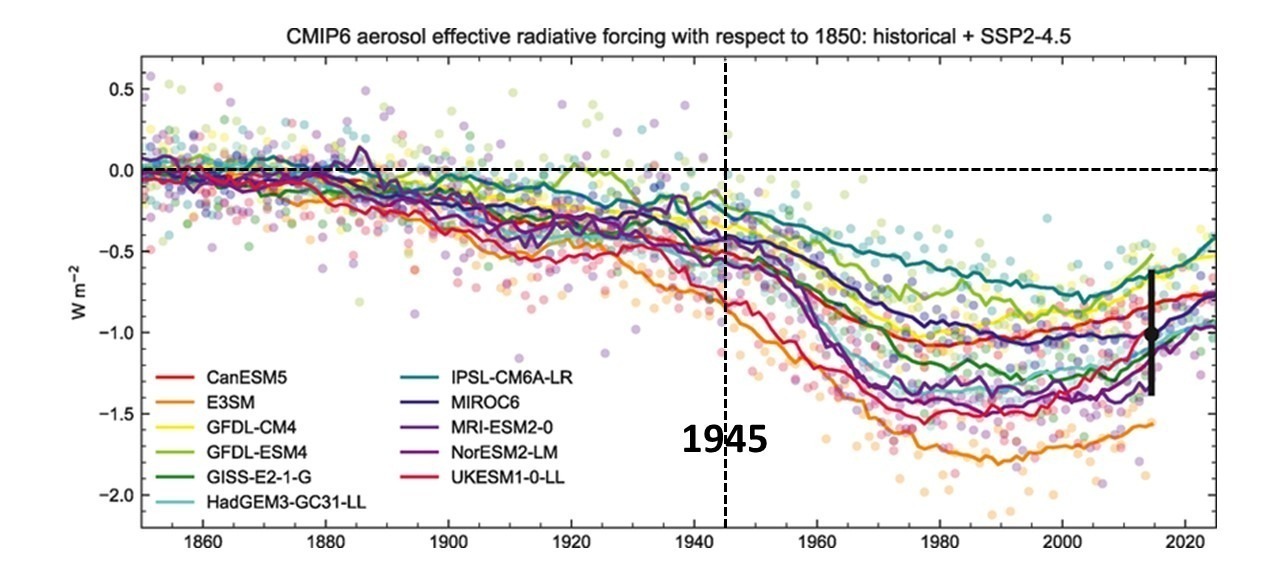
If those models had not differed so much in their aerosol forcing, one could presumable have picked a later starting date than 1945 for meaningful temperature trend computation. Note the differences remain large even by 2015, which is reaching the point of not being useful anyway for trend computations through 2023.
So, what period would provide the “best” length of time to evaluate global warming claims? At this point, I honestly do not know.


Aren’t you sort of verifying the models on the same data that was used to build the models? Perhaps the models correlate well with the time period from 1945 onward because that is the time period of most interest to fit by those who created the models. The modelers know a priori when CO2 began to be emitted in large quantities by mankind. It’s a bit like TV manufacturers matching their brightness output with the reference output extremely well on the standard window sizes. From this admittedly cynical but perhaps relevant point of view, one could argue that the correlation falls off with shorter and longer time periods because of the difficulty of maintaining the basic underlying premise of the models outside the primary focus of their creation and tuning. That would imply the models may be fundamentally poor, using fundamentally in a literally sense not a rhetorical sense. The trouble is there really is nothing in all of climate modeling to prevent this type of bias.
So, what period would provide the “best” length of time to evaluate global warming claims?
UAH efforts provide the best evaluation of global warming over the last 40+ years. But that “warming” is ALL natural.
Use the CO2 forcing equation ( 5.35ln(C/Co) to calculate the warming due to a certain amount of added CO2.
You find that there is a 25 year lag between the release of the CO2 and its full effect appearing in the temperature record.
That suggests that you need at least 25 years of data. Why not be conservative and use the customary 30 years of data used to calculate climate averages?
That nonsense “forcing equation” is nothing more than curve fitting. The coefficient, 5.35, was chosen to fit. Because the equation doesn’t work, they invented “ECS”, which is nothing more than added fudge factor.
You can do the same thing with many other “forcings”. I remember years ago Dr. Spencer related UFO sightings to “global warming”. You could use the growth of ice cream stores, like Baskin-Robbins, Haggen-Daz, Dairy Queen, etc.
My favorite is women’s suffrage! Relate the growth in women voting to global warming. NOW, you’re talking some REAL science!!!
Dr Spencer wrote –
“So, what period would provide the “best” length of time to evaluate global warming claims? At this point, I honestly do not know.”
If warming is seen as one thermometer reading being higher than another, any time period will do.
However, “global warming” generally insinuates some unstated heating due to CO2 or other atmospheric components. The Earth has cooled over the past four and a half billion years, so atmospheric heating can be dismissed.
Warming is easily explained – it’s due to heat. Lots of people generating lots of heat. All energy use is eventually reduced to “waste heat”. Too low a temperature to extract any work. Goes to space, never to be seen again.
At least one study has been done, finding about a correlation of about 0.9 between rising energy use and rising temperatures, in two island nations after their respective industrial revolutions – the UK and Japan. I assume Dr Spencer is aware of other similar studies.
Whatever the source of “global warming”, a greenhouse effect which nobody can describe, nor support experimentally, does not appear a likely candidate.
Dr. Spencer,
You write:
“I realize climate models have their own problems, but at least they generate internal variability somewhat like the real world, for instance with El Ninos and La Ninas scattered throughout their time simulations.”
I’m particularly curious about the ‘at least they generate internal variability somewhat like the real world’ part. Would you mind sharing a source that backs up that claim?
Also, perhaps you’d be interested in evaluating the rate of change over time in your satellite data. All credit goes to bdgwx; he’s the one that made this graph.
https://drive.google.com/file/d/1FTpN74AppvOKLzllhkuhI4HLEM4hBWi9/view?usp=share_link
The observed rate is not consistent with a persistent forcing; it gradually slows over time, evident in ‘The Pause’ signature. Justifying this trend as consistent with persistent forcing necessitates a model. While models can be helpful, they are not a reflection of reality. It’s imperative for humanity to be humble and acknowledge this fact. We must come to terms with the understanding that there are limits to our knowledge, and we cannot know everything.
May I recommend the online textbook “Introduction to Climate Dynamics and Climate Modelling.” Sadly it’s web address is not accepted by Roy’s website.
Thank you, Ent.
Ent, you got tricked again. That reference is all about the GHE nonsense. It starts off with Earth as a black body. They’ve got Earth at 255K! Every time you see such nonsense, you should know it ain’t science.
Why do you reject reality?
It actually starts with a description of the climate system and its components, Puffman.
Why do you keep lying?
Has anyone tried to tease out cycles from UAH data using FFT?
Statistically sample means are normally given as a mean and 95% confidence limits. The 95% confidence limits indicate a 95% probability that the mean of the variable being sampled is within those limits.
Means are regarded as significantly different when the probability that the two sample are from the same population drops below 5%.
A quick and dirty way of spotting a significant difference is when the 95% confidence limits of two means do not overlap.
Dr Spencer quotes a warming rate of 0.15C/decade. No 95% confidence limits are mentioned. I’ll assume confidence limits of +/-0.1C (probably conservative).
How many decades will it take to see a statistically significant temperature trend?
A hypothetical worked example. The decadal average for 2001-2010 was anomaly 0.15C +/- 0.1C. For 2011-2020 it was 0.3C +/- 0.1C.
The range for the earlier mean is between 0.05C and 0.25C. For the later mean the range is between 0.2C and 0.4C.Since the two ranges overlap there is no significant difference between the two adjacent decades.
Now let’s try the difference between the 1991-2000 decade (0C +/- 0.1C) and the 2011-2020 decade (0.3C +/- 0.1C).
The earlier range is between -0.1C and 0.1C. The later range is between 0.2C and 0.4C. Since the two 95% confidence ranges do not overlap was can be confident that 2011-2020 was significantly warmer than 1991-2000, confirming that there is a genuine warming trend.
Based on this, two decades of data is too short a period to be confident that there is a warming trend. Three decades is sufficient.
Ent, you don’t need all that blah-blah. UAH shows Earth is in a warming trend.
Why is that so hard to understand?
Not just UAH. The twelve month moving average measured by Copernicus just went over 1.5C warmer than preindustrial times.
https://www.bbc.co.uk/news/science-environment-68110310
EM,
Not surprising – man-made heat is vastly greater than pre-industrial times.
Thermometers react to heat, not gas.
Some people believe in a GHE, but they can’t actually describe what the GHE is supposed to do.
Mike Flynn,
A thermometer is “sensitive” when it absorbs as little heat as possible from the item it is trying to measure.
Your point has nothing to do with what EM said.
EM,
Not surprising man-made heat is vastly greater than pre-industrial times.
Thermometers react to heat, not gas.
Some people believe in a GHE, but they cant actually describe what the GHE is supposed to do.
Really?
Copernicus has the ability to measure temperatures hundreds of years before it was launched?
CO2 has lagged temperature since the Earth was created but somehow magically it changed since the 1970’s. CO2 has lagged temperature in both short and long, time scales. All the data indicate this fact. Ent and his leftist brethren ignore this fact or claim it has magically changed.
“CO2 has lagged temperature in both short and long, time scales. ”
Except on those occasions, notably mass extinctions and the Industrial Revolution, when release of CO2 led to an increase in temperature.
The feedback works both ways.
EM,
“when release of CO2 led to an increase in temperature.”
No, additional heat leads to an increase in temperature.
Accept reality.
Entman,
CO2 lagged temperature in the 19th Century and it lags temperature today.
https://www.jstor.org/stable/44397310
there is no question that humans have caused in part the rise in co2 levels. but that, as predicted by Svante Arrhenius has been a huge boon to mankind. it does seem unlikely that co2 is responsible for warming of the climate as the climate warmed at virtually an identical rate from 1911 to 1944 as from 1980 to 2013 or 1990 to present. the only difference is the warm spell is 10 years longer.
since we can’t explain the early 20th century warming and fossil fuel burning escalated by an order of magnitude too much is missing to be making drastic decisions. there is always a desire to run the world and without clear danger that is what needs to be put back in the holster.
.
Unless and until Gill gets all the sammiches he requests, no kid will be allowed on his lawn.
And he has an infinite amount of sammiches to request.
Dr Spencer
Looking at the graph in your earlier post their is another problem.
https://www.drroyspencer.com/wp-content/uploads/Lower48-annual-CMIP6-vs-obs.jpg
Assuming that the 95% confidence limits for the model ranges and the NOAA observations are all +/-0.1C, then only models 0.2 C warmer than NOAA will show a significantly different warming rate.
Of 27 models only two showed significantly faster warming than observations. This is not strong evidence that the models are running hot.
The whole aerosol thing is far worse. About 1/3 of Earth’s surface is above 20N. This northern third is where almost all aerosol pollution occurs and thanks to its short life span, it is also where it stays. If aerosols, as with AR6 in 2019, cancelled 1/3 of anthropogenic GHG forcing, the question is, why there should be (or should have been) warming in this northern third at all?
Yes, it would explain warming in the tropics and the south, but not in the north. In opposition to the theory, we have a strict north-south divide in the warming trend, with most warming in the north and least warming in the south.
Sorry, but reality is strictly falsifying AGW theory.
https://greenhousedefect.com/contrails/aerosols-in-climate-science
Because F-(F/3) does not equal zero.
F-(F/3) DOES equal zero since F=0.
But F – F/3 * 3 = 0
Weird math.
You talking about AGW?
–When computing temperature trends in the context of global warming we must choose a region (U.S.? global? etc.) and a time period (the last 10 years? 50 years? 100 years?) and a season (summer? winter? annual?).–
I think it should be Tahiti. Last 60 years.
What else is more important?
A satellite orbiting planet measures the planet’s every point surface temperature.
At day-time the satellite measures the instantly induced by sun the surface temperature.
At night-time the satellite measures the planet surface “the warmth” temperature.
When the measured temperatures being averaged over the entire planet surface – it is the planet average surface temperature (Tmean) – it is the mean surface temperature.
–
https://www.cristos-vournas.com
What is an average?
Thank you, RLH, for your response.
“What is an average?”
Because not all the measurements are the same, we can average them, to see what we shall have (on average).
–
Now, when we have for two different celestial bodies the average surface temperatures so much different
Earth Tmean =288K
Moon Tmean =220K
We have to find out why it is happening so.
Is Earth on average warmer than Moon?
Yes, Earth is on average warmer than Moon.
But why Earth is on average warmer than Moon?
Because Earth rotates faster, and Earth is able to absorb much more solar energy, than Moon.
–
Thank you again.
–
https://www.cristos-vournas.com
When a planet rotates faster, its surface absorbs more solar energy. Thus the planet becomes on average warmer.
–
https://www.cristos-vournas.com
“US climate scientist Michael Mann wins $1m in defamation lawsuit”
Single point alignments, including intersecting slopes, will be more sensitive to model and observation variance than alignments over a period, such as the 30-year in Plot C.
Single point alignment choices have been (IMO) an issue with a number of Dr. Christy’s charts. Those are never the most appropriate choice.
100% agreed.