
 Home/Blog
The goal of reaching “Net Zero” global anthropogenic emissions of carbon dioxide sounds overwhelmingly difficult. While humanity continues producing CO2 at increasing rates (with a temporary pause during COVID), how can we ever reach the point where these emissions start to fall, let alone reach zero by 2050 or 2060?
What isn’t being discussed (as far as I can tell) is the fact that atmospheric CO2 levels (which we will assume for the sake of discussion causes global warming) will start to fall even while humanity is producing lots of CO2.
Let me repeat that, in case you missed the point:
Atmospheric CO2 levels will start to fall even with modest reductions in anthropogenic CO2 emissions.
Why is that? The reason is due to something called the CO2 “sink rate”. It has been observed that the more CO2 there is in the atmosphere, the more quickly nature removes the excess. The NASA studies showing “global greening” in satellite imagery since the 1980s is evidence of that.
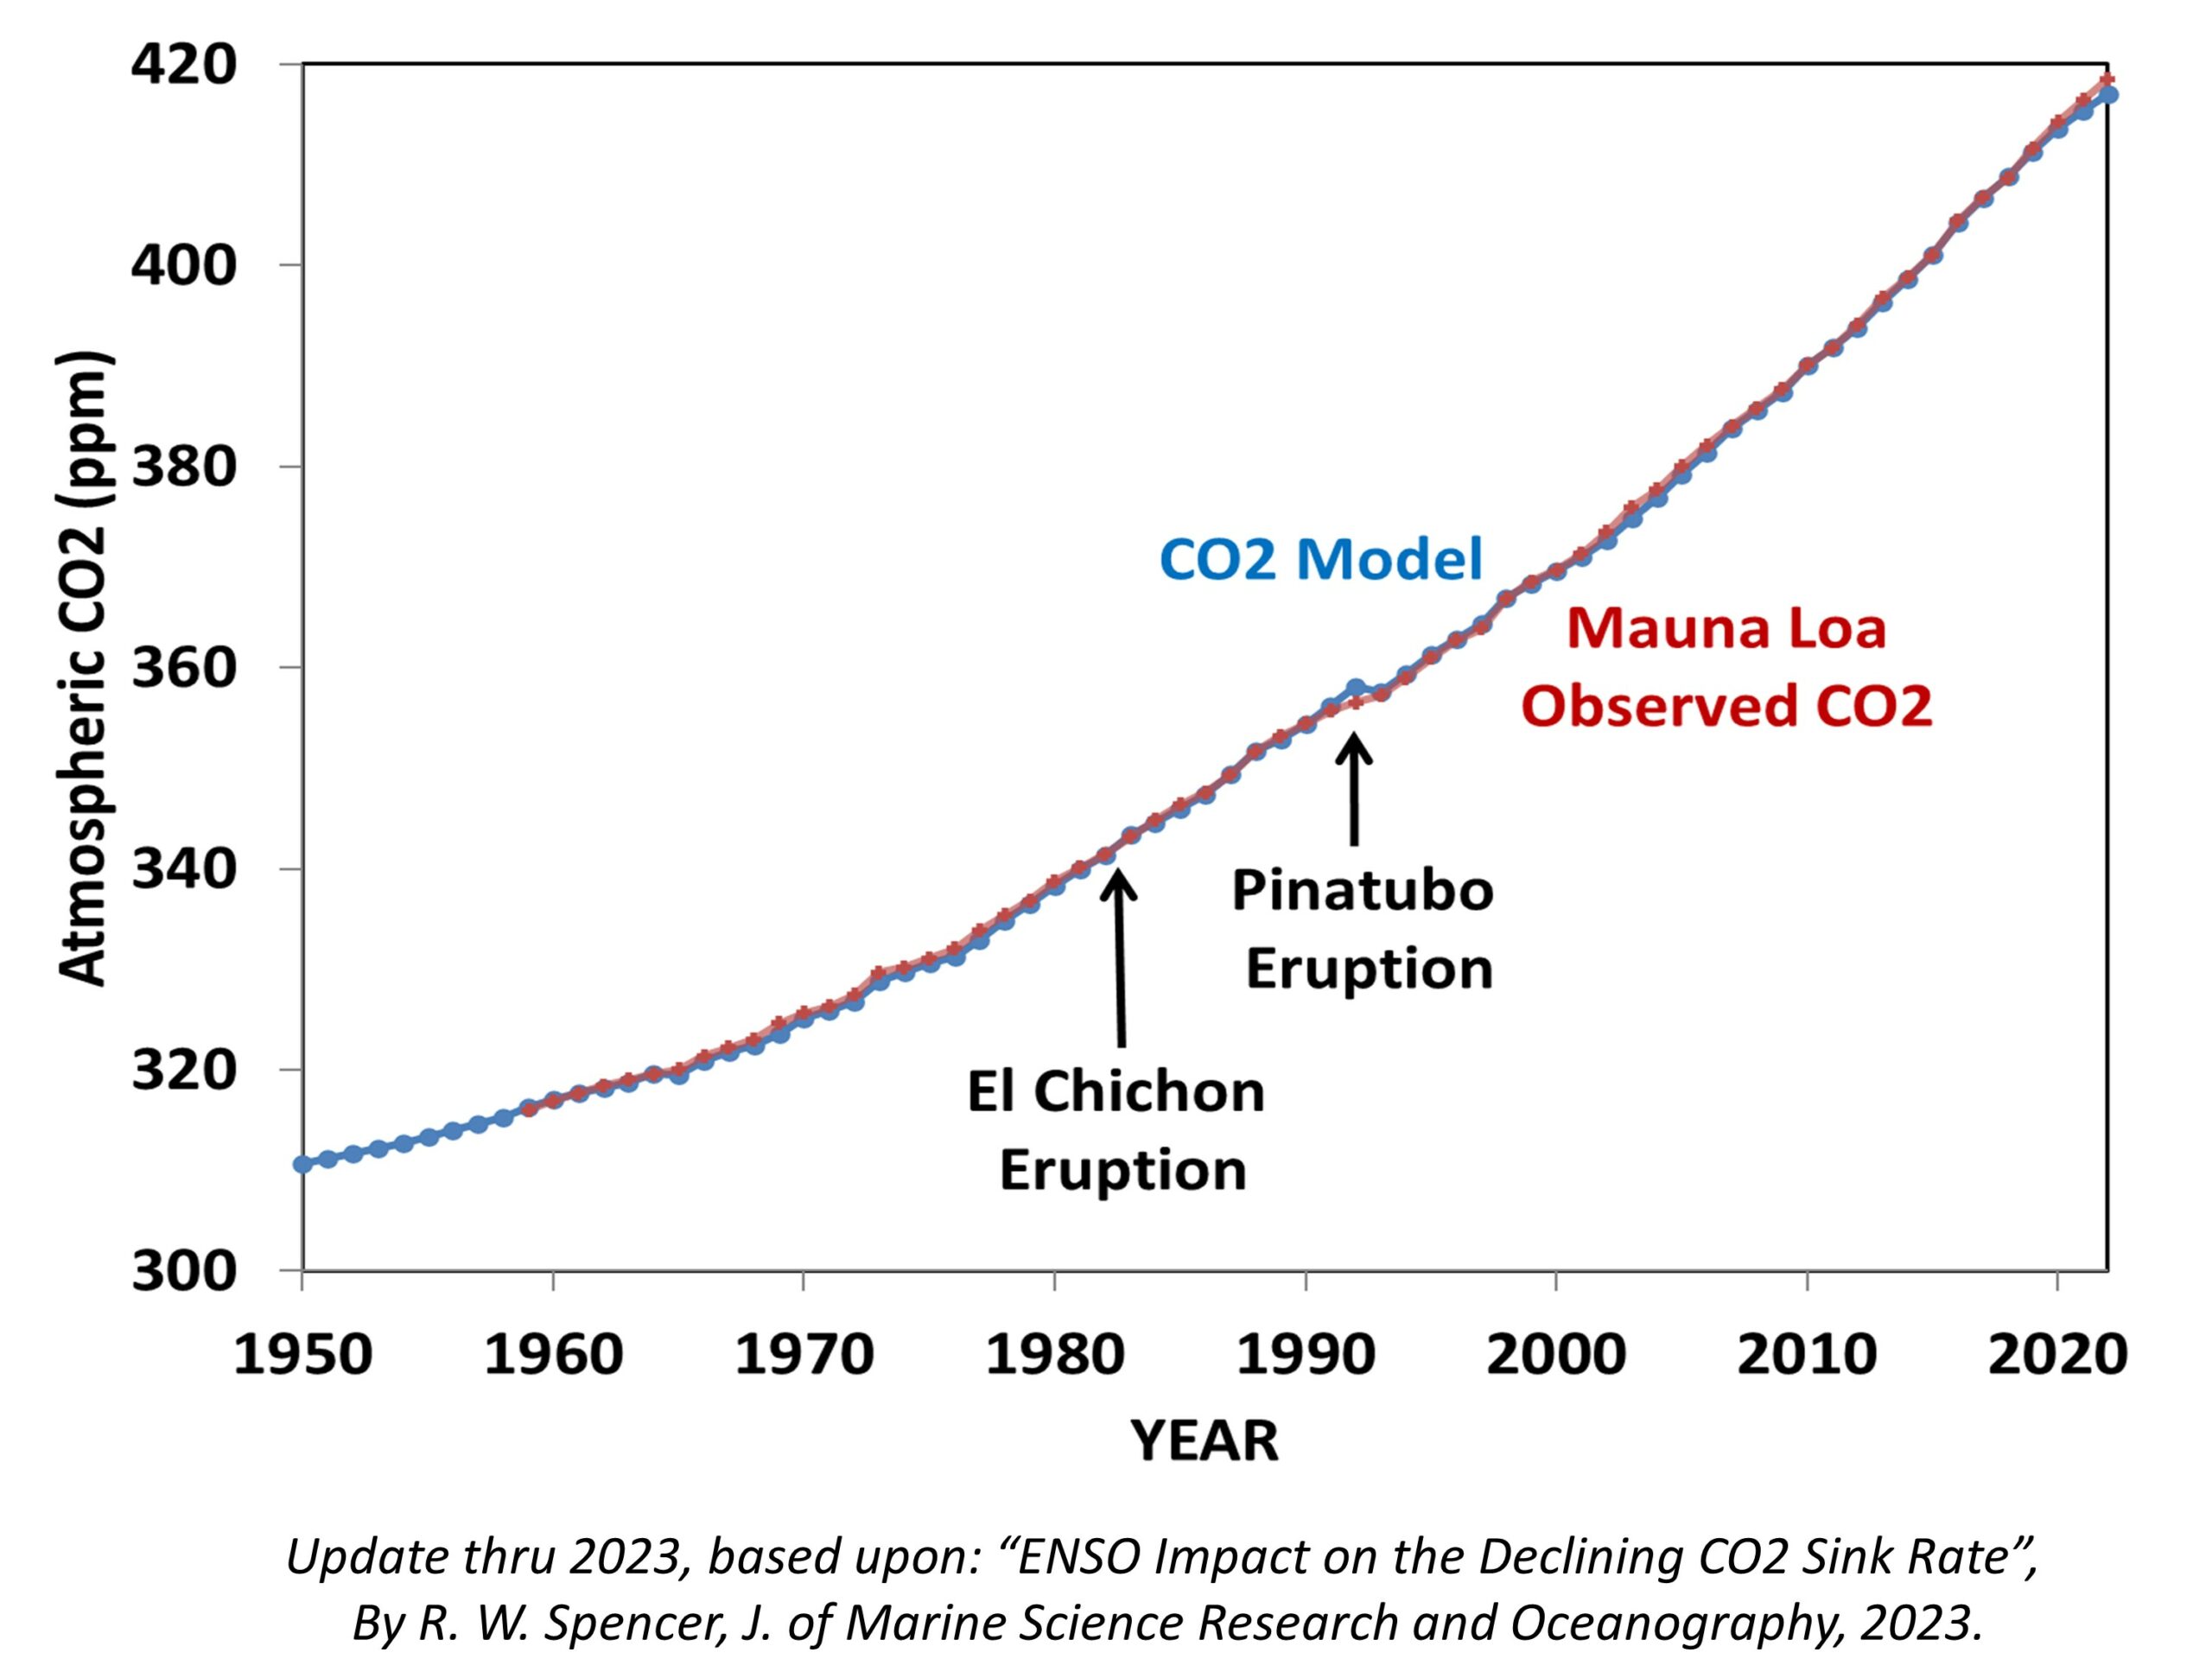
Last year I published a paper showing that the record of atmospheric CO2 at Mauna Loa, HI suggests that each year nature removes an average of 2% of the atmospheric excess above 295 ppm (parts per million). The purpose of the paper was to not only show how well a simple CO2 budget model fits the Mauna Loa CO2 measurements, but also to demonstrate that the common assumption that nature is becoming less able to remove “excess” CO2 from the atmosphere appears to be an artifact of El Nino and La Nina activity since monitoring began in 1959. As a result, that 2% sink rate has remained remarkably constant over the last 60+ years. (By the way, the previously popular CO2 “airborne fraction” has huge problems as a meaningful statistic, and I wish it had never been invented. If you doubt this, just assume CO2 emissions are cut in half and see what the computed airborne fraction does. It’s meaningless.)
Here’s my latest model fit to the Mauna Loa record through 2023, where I have added a stratospheric aerosol term to account for the fact that major volcanic eruptions actually *reduce* atmospheric CO2 due to increased photosynthesis from diffuse sunlight penetrating deeper into vegetation canopies:
What Would a “Modest” 1% per Year Reduction in Global CO2 Emissions Do?
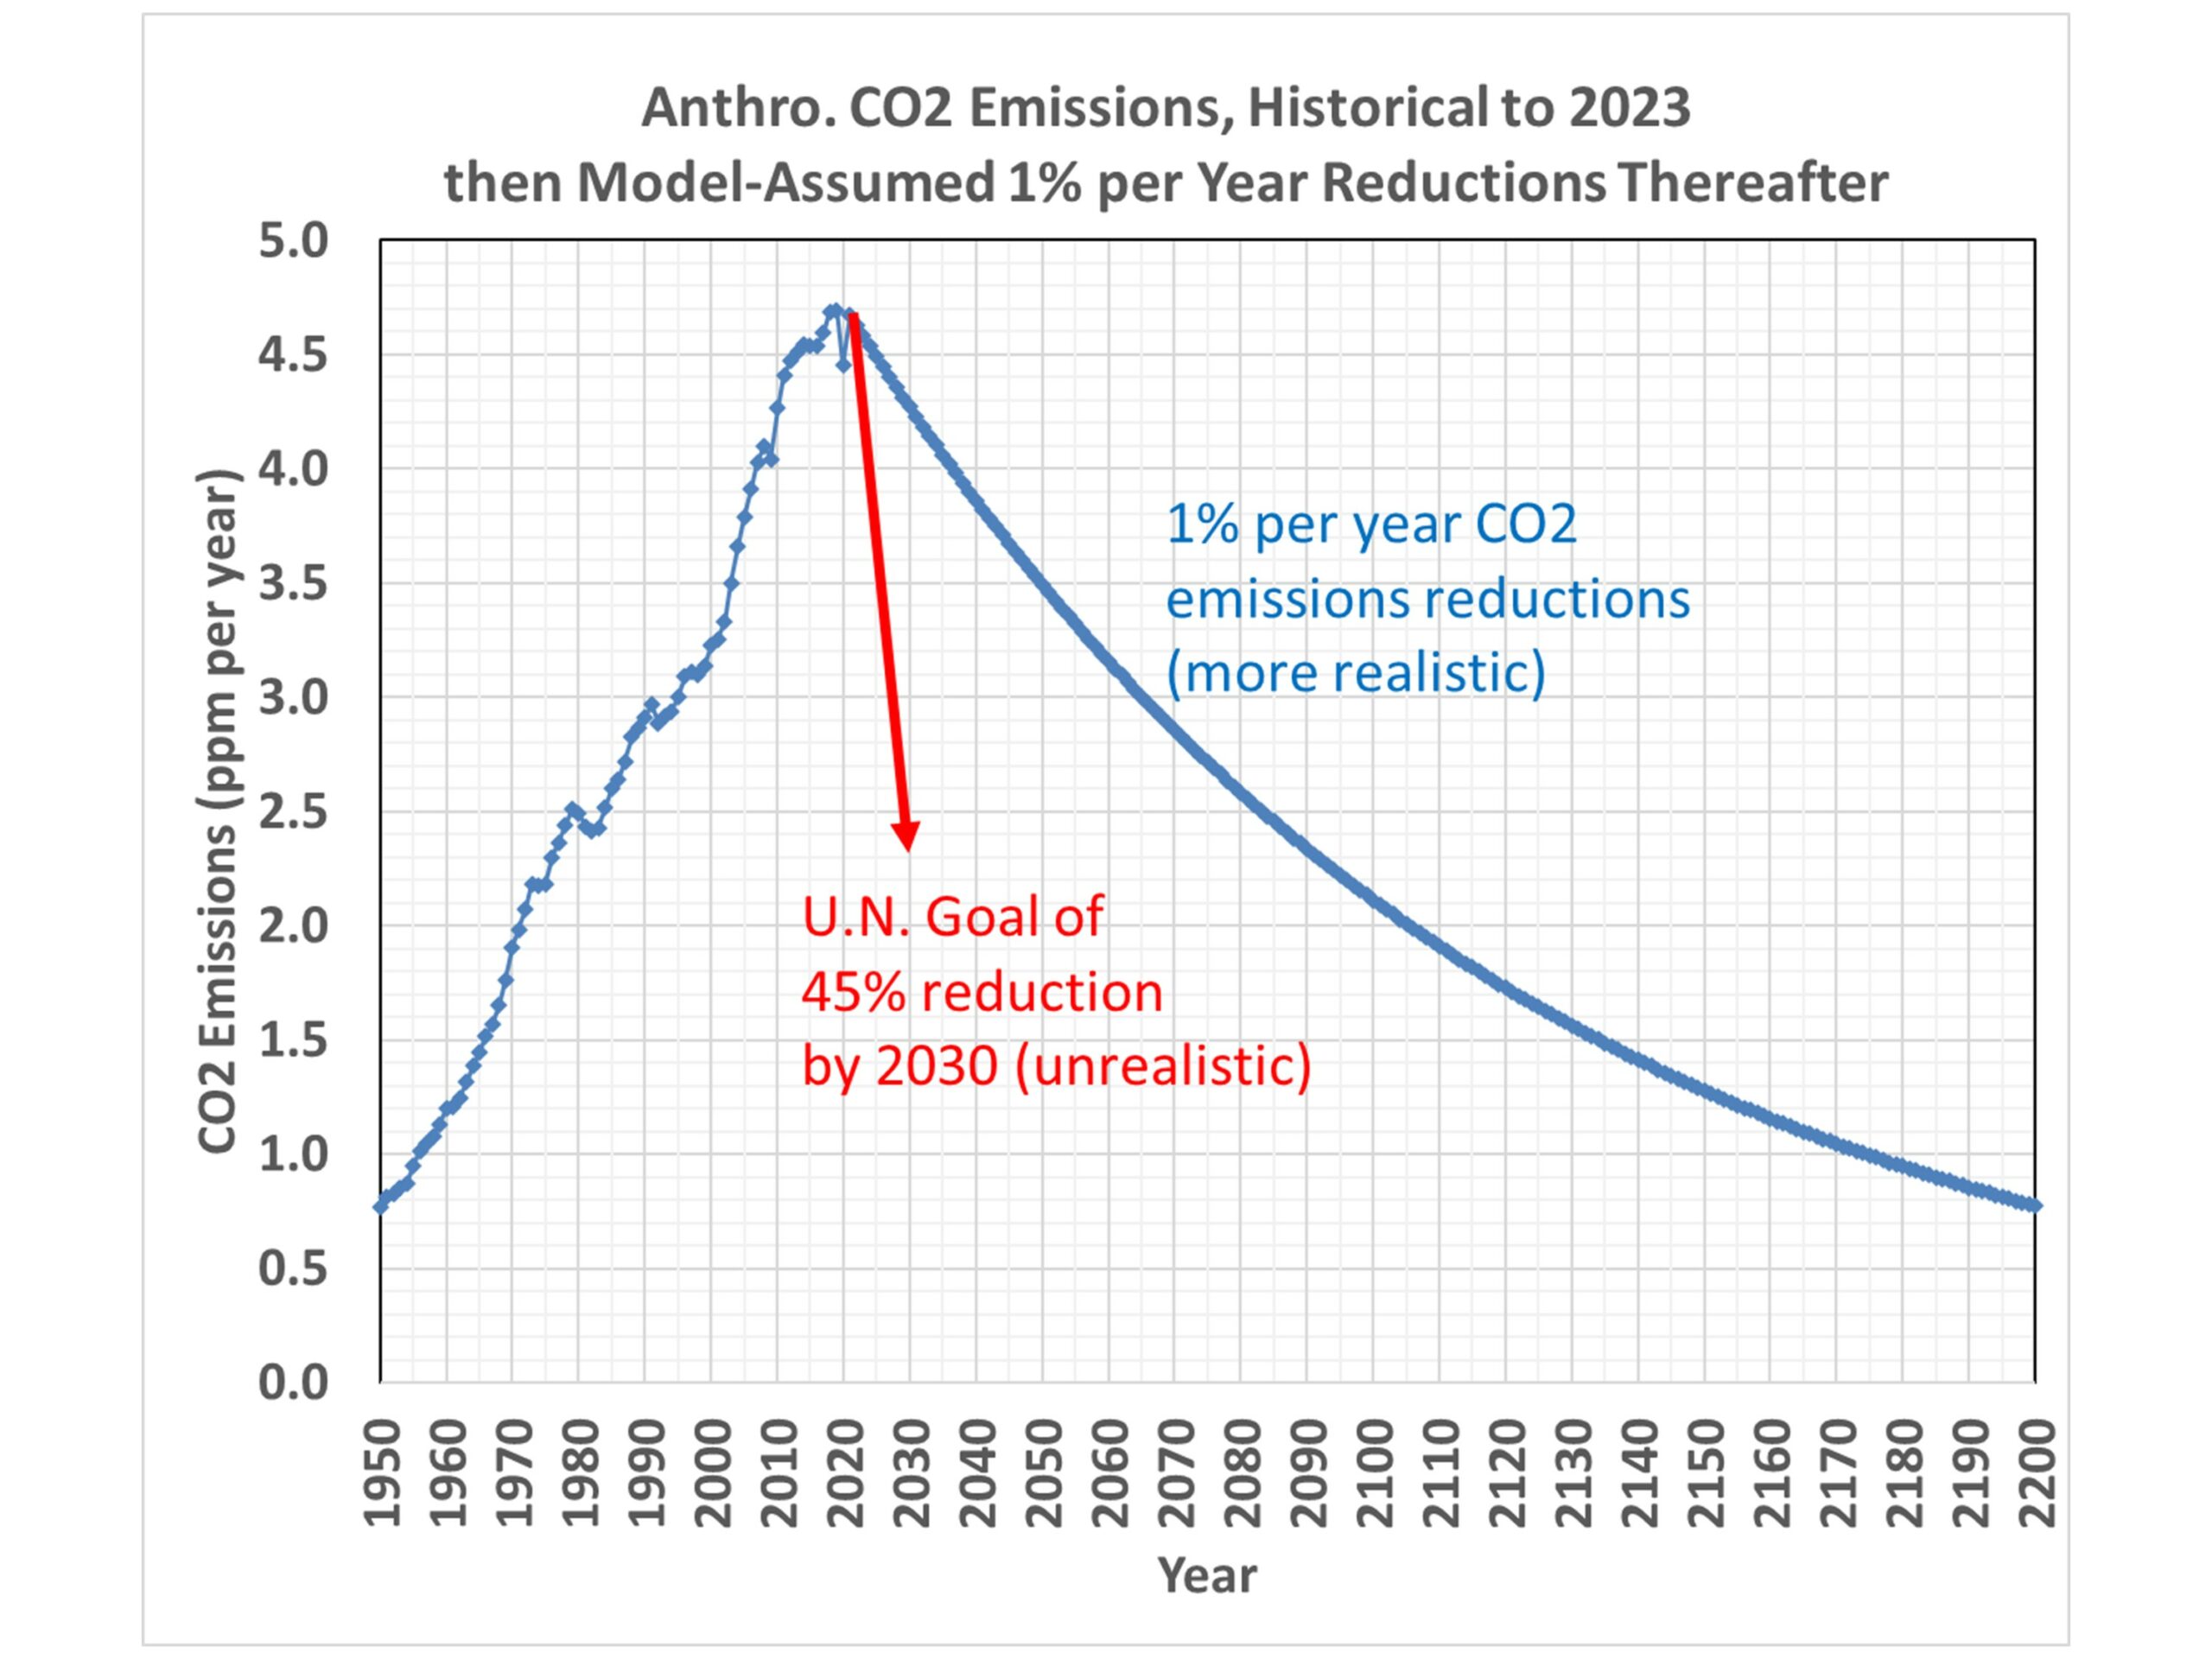
The U.N. claims that CO2 emissions will need to decline rapidly to achieve Net Zero by mid-Century. Specifically, they say 45% reductions below 2010 levels will need to be made by 2030, and Net Zero will need to be achieved by 2050, in order to limit future global warming to the (rather arbitrary) goal of 1.5 deg. C.
But let’s look at what a much more modest reduction in CO2 emissions (1% per year) would do to future atmospheric CO2 concentrations. Here’s a plot of the history of global CO2 emissions, and how that trajectory would change with 1% per year reductions from 2023 onward. (Even this seems optimistic, but we can all agree the U.N.’s goal is delusional),
When we run the CO2 model with these assumed emissions, here’s how the atmospheric CO2 concentration responds:
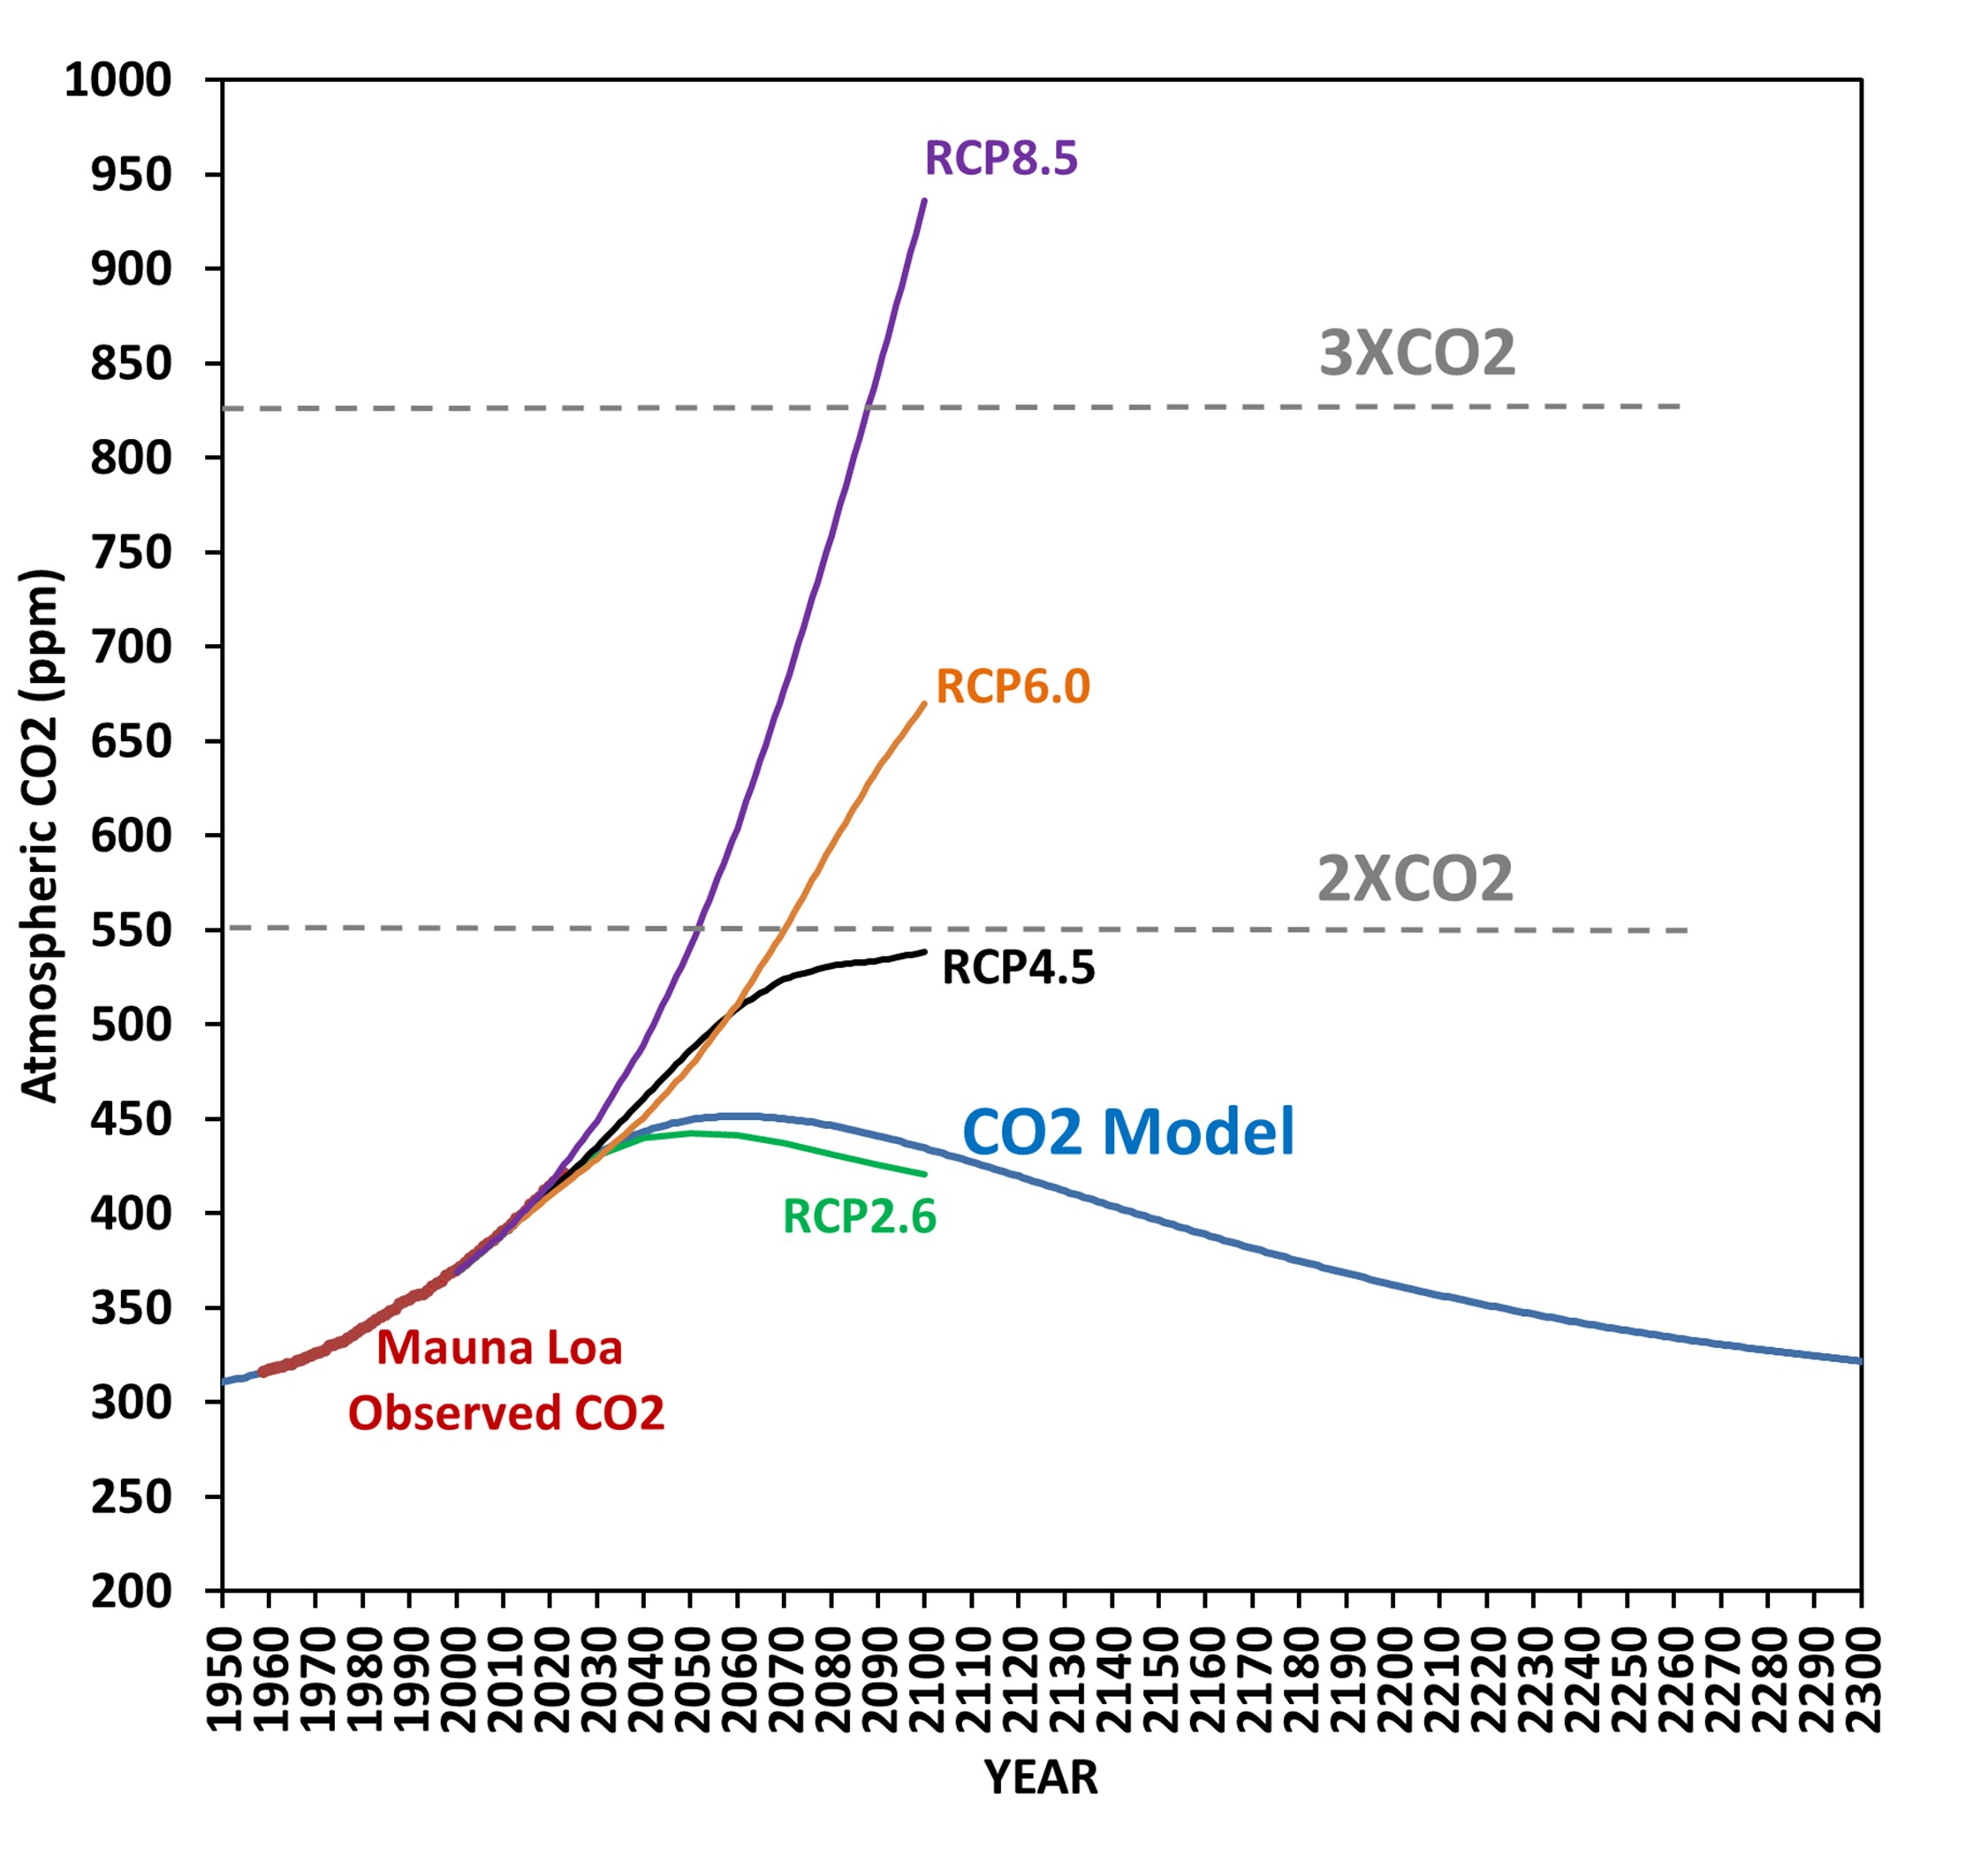
Even though the CO2 emissions continue, atmospheric CO2 levels start to fall around 2060. Also shown for reference are the four CMIP5 scenarios of future CO2 emissions, with RCP8.5 often being the one used to scare people regarding future climate change, despite it being extremely unlikely.
The message here is that CO2 emissions don’t have to be cut very much for atmospheric CO2 levels to reverse their climb, and start to fall. The reason is that nature removes CO2 in proportion to how much excess CO2 resides in the atmosphere, and that rate of removal can actually exceed our CO2 emissions with modest cuts in emissions.
I don’t understand why this issue is not being discussed. All of the Net Zero rhetoric I see seems to imply that warming will continue if we don’t cut our CO2 emissions to essentially zero. But that’s not true, because that’s not how nature works.


“nature removes an average of 2% of the atmospheric excess above 295 ppm (parts per million)”
Does it? Even after emissions cease? I don’t think you demonstrated that.
Here is why. Each year there is an addition, x, of new CO2 to the atmosphere.
It takes some months for this x to equilibrate with the ocean, land, and bio surfaces, the so-called fast-equilibrating reservoirs.
Then only ~ x/2 of the added CO2 remains in the atmosphere. The rest is circulating in the fast reservoirs.
The evidence is that the surface ocean has nearly the same concentration of CO2 as the atmosphere.
With the stop of new emissions, there remains near equilibrium between the atmosphere and the fast reservoirs. Thus there is no (or much lower) driving force to remove atmospheric CO2 to these reservoirs.
The recovery of the atmosphere must wait for the slow removal to the deep ocean.
Nate:
The 2% per year would include all time scales of CO2 removal, fast or slow, at least on the time scale of the Mauna Loa measurements (60+ years). There is no evidence yet of a long-term change in that value (see my published paper for evidence of that), as also evidenced by the first plot I showed.
You said, “With the stop of new emissions, there remains near equilibrium between the atmosphere and the fast reservoirs.” I don’t see how you can believe that. “Global greening” takes time… Nature can’t immediately deal with all of the “excess” CO2 in the atmosphere… it handles it gradually… which is why 2%/yr isn’t 100%/yr.
-Roy
At least w respect to the surface ocean, there is near equilibrium with the atmosphere.
https://climexp.knmi.nl/data/ico2.png
Ocean surface concentration tracking the atmosphere and currently 422 ppm. Hence the driving force for CO2 transfer from atmosphere to ocean will be removed, and then reverse, soon after emissions stop.
And the surface ocean is the bottleneck to the ultimate removal of all the excess carbon to the deep ocean.
For land bio, there is probably a range of times scales for equilibration, from daily to annual to decades.
Whatever it is, I guess it also becomes source sometime after emissions stop.
That data is called “globally averaged marine surface CO2 concentration, from ESRL”
Nate,
The KNMI and IPCC use the Bern and similar models to show a saturation of the different reservoirs for CO2 uptake.
That is only the case for the ocean surface, by far not for more permanent storage in vegetation (C3 plants have their optimum uptake at over 1,000 ppmv) and absolutely not for the deep oceans.
The second point is that the Bern and similar models see the ocean surface as limiting the exchange between atmosphere and deep oceans. That is the case for some 90% of the ocean surface, which isolates the atmosphere from direct access to the deep oceans.
For about 5% there is a direct sink from the surface into the deep oceans and 5% show a direct upwelling, bypassing any limiting of the ocean surface.
The main sinks are near the poles where especially the THC (thermohaline circulation) in the N.E. Atlantic sinks lots of water, already premixed with deep ocean waters by storms and waves, together with some 40 PgC/year CO2 directly from the atmosphere into the deep oceans.
As the ocean surface in general is only 7 μatm below atmospheric, its sink rate is very limited, including the Revelle/buffer factor if seawater. At the THC sink place, the pCO2 of the waters is at only 150 μatm or 275 μatm below atmospheric…
There is no possibility that this sink gets saturated in the far future…
See Feely et al:
https://www.pmel.noaa.gov/pubs/outstand/feel2331/mean.shtml
Ferdinand,
Thanks for that. I had been looking for this data:
“As the ocean surface in general is only 7 μatm below atmospheric, its sink rate is very limited, including the Revelle/buffer factor of seawater.”
That is what I was trying to convey to Roy Spencer.
As you correctly point out,
“That is the case for some 90% of the ocean surface, which isolates the atmosphere from direct access to the deep oceans.
For about 5% there is a direct sink from the surface into the deep oceans and 5% show a direct upwelling, bypassing any limiting of the ocean surface.”
Do you agree then, that at least for the ocean, “nature removes an average of 2% of the atmospheric excess above 295 ppm (parts per million)” would not continue if anthro emissions of CO2 were to stop?
Nate,
“Do you agree then, that at least for the ocean, nature removes an average of 2% of the atmospheric excess above 295 ppm (parts per million) would not continue if anthro emissions of CO2 were to stop?”
Why would it stop? As long as the waters in the N.E. Atlantic don’t stop sinking in the deep oceans, there is no reason at all that the sink rate would reduce. The sink rate is directly in ratio to the pCO2 difference at that point and the pCO2 at of the sink place remains that low, partly due to the cold temperatures and partly as the waters there are already mixed in with deep ocean water, which is highly undersaturated for CO2.
The current distribution of the sink rate is:
About 2.5 PgC/year in the oceans, of which 0.5 PgC/year in the ocean surface and 2.0 PgC in the deep oceans.
About 2.5 PgC/year in more permanent growth of the biosphere.
Human contribution today: near 10 PgC/year, which results in about 5 PgC/year increase in the atmosphere. With halving the human contribution there is no increase in CO2 anymore…
You see, even 5% of the ocean surface takes 4 times more CO2 away, than 90% of the rest of the surface… Just a matter of pCO2 difference, caused by temperature and turbulence…
It all is a matter of dynamic equilibrium: at average 295 ppmv in the atmosphere, the sink rate near the poles and the upwelling near the equator are in equilibrium at around 40 PgC/year…
See: http://www.ferdinand-engelbeen.be/klimaat/klim_img/deep_ocean_air_zero.jpg
Based on the “thinning” of the human 13C/12C “fingerprint” by deep ocean circulation…
The point in the Bern model is the problem of the averages: they calculate the ocean surface as an average all over the oceans, which makes that the surface gets the bottleneck for the CO2 transport to the deep oceans, but don’t take into account the direct connections via the THC and other sinks…
Ferdinand,
Thanks, can you show me where you get these data from?
“The current distribution of the sink rate is:
About 2.5 PgC/year in the oceans, of which 0.5 PgC/year in the ocean surface and 2.0 PgC in the deep oceans.
About 2.5 PgC/year in more permanent growth of the biosphere.”
“Why would it stop? As long as the waters in the N.E. Atlantic dont stop sinking in the deep oceans, there is no reason at all that the sink rate would reduce. The sink rate is directly in ratio to the pCO2 difference at that point and the pCO2 at of the sink place remains that low, partly due to the cold temperatures and partly as the waters there are already mixed in with deep ocean water, which is highly undersaturated for CO2.”
I don’t understand this. Why would the PCO2 difference matter ONLY in the NE Atlantic.
It should be the average pCO2 difference over the global ocean that matters.
“As long as the waters in the N.E. Atlantic dont stop sinking in the deep oceans, there is no reason at all that the sink rate would reduce. ”
Sure, that is part of the sink rate from the surface waters to the deep ocean.
But before that is the sink from the atmosphere to the surface waters, which is the bottleneck due to Revelle Factor.
And THAT is driven by pCO2 ~ 7 ppm. Which will each 0 shortly after anthro emissions cease.
No as long as the atmosphere is above 295 ppm there will be a sink into the oceans, the sink does not care about emissions it cares about the atmospheric – ocean gradient, just likes ohms law determines a current.
“the sink does not care about emissions it cares about the atmospheric ocean gradient, just likes ohms law determines a current.”
And the gradient is 7 ppm, not 130 ppm.
The fact that the model above, with a single 50 year decay constant, must use 295 ppm as ‘equilibrium’ when ice core data shows it is lower, tells us that some fraction of the added CO2 from a century ago persists far longer than expected for the single decay constant model.
Which is what the Bern model is all about.
Equilibrium concentration is the temperature dependent henry law as is visible in the ice cores. At 16 ppm per degree, with 1 degree temperature rise since pre-industrial gives 295 ppm.
The long awaited sink saturation is still not visible in the mauna loa record.
So you don’t agree with Ferdinand:
“As the ocean surface in general is only 7 μatm below atmospheric”
The gradient ocean surface -atmosphere is not the bulk cause of the observed rising sink, as Ferdinand can acknowledge.
So in pre-industrial times, the ratio of ocean carbon to atm carbon was about 37,000/600 = 62, so 1.5 % in the atmosphere and 98.5 % in the ocean.
So we can expect that carbon added to the atmosphere will, in equilibrium, divide up with the ocean in equilibrium, with a similar small percentage left in the atmosphere.
But currently all the emitted anthro carbon over the last century or so has divided up leaving ~ 50 % in the atmosphere and ~ 25% in the ocean.
SO clearly we are very far from equilibrium with the ocean.
Yet the pCO2 in the surface ocean is only 7 ppm below pCO2 = 420 ppm in the atmosphere, 140 ppm above pre industrial. So pCO2 in ocean is ~ 413 ppm, ~ 133 ppm above preindustrial (presumably).
So it would appear according to added pCO2, that the ocean-atm are already 133/140 = 95% of the way to equilibrium!
How can that be?
Clearly the vast majority of added carbon in the ocean is near the surface. The atm is nearly in equilibrium with it.
But it will be a long time before it distributes from the surface to the deep ocean.
Nate, Actually we can see the anthropogenic co2 flowing directly into the southern deep ocean in this NS slice across the atlantic, very much similar to the basaltic subduction zones.
https://www.climate.gov/news-features/featured-images/cruises-cut-slice-through-atlantics-carbon-pie
Nate, you make the common mistake of the averages… As the Bern and similar models do… You can drown in “average” 2 cm water, if most is 1 cm deep and at one edge there is a hole of 2 meter deep…
There is a clear distinction between the well-mixed ocean surface layer and the deep oceans.
The ocean surface layer is fast mixed with the atmosphere, but limited in uptake: 10% of the atmosphere in app. 1,000 PgC in the ocean surface. Or 0.5 PgC/year when the atmosphere increases with 5 PgC/year.
That is the fast cycle.
Then we have the direct mixing with the deep oceans, completely bypassing what happens at the surface (that is the main error in the Bern model!) near the poles. The N.E. Atlantic with the THC sink place is the most extreme form, but several sink places near the South Pole are as well active:
https://www.science.org/doi/10.1126/science.aab2620
That cycle is a lot slower than the direct mixing with the ocean surface, but no limit like the Revelle/buffer factor is in sight, as the (extreme) low pCO2 at several places show.
The pCO2 difference between atmosphere and ocean surface in average may be only 7 μatm, but that is completely unimportant as only the local pCO2 difference at the sink places is what directly connects the atmosphere with the deep oceans.
Together with the similar sink rate in more permanent vegetation, the overall e-fold sink rate Tau is about 50 year, or 2%/year net removal for the pCO2 difference with the “old” equilibrium…
Ferdinand,
You don’t seem to have read my last post. The point of it was that the near surface ocean is close to equilibrium with the atm. While the deep ocean is very far from equilibrium.
Typical estimates are that it takes > 1000 years to equilibrate.
And that is consistent with the fact that about 50 % of the emitted carbon has remained in the atmosphere. But when reach equilibrium, only ~ 2% should remain and the rest will be in the deep ocean.
How do you determine that of the 2.5 Pg/yr, taken up by the ocean, that only 0.5 Pg/yr is in the surface waters?
“The pCO2 difference between atmosphere and ocean surface in average may be only 7 μatm, but that is completely unimportant as only the local pCO2 difference at the sink places is what directly connects the atmosphere with the deep oceans.”
That makes no sense, because sinking rate must be multiplied by AREA, and that is a tiny area. In fact sinking goes on in many locations.
Dr.Roy and friends
It seems you guys are still not getting it. I think CO2 is simply a red herring. Nothing at all fits. In my latest research project, I am looking at the warming rate of cities nearby the sea/ocean. It appears that the warming rate of the water is greater or equal than the warming rate of the relevant city. So, I am asking everyone now: what came first: the chicken or the egg? Is the heat coming from the water going up, or is it coming from the atmosphere coming down? Please let me know. Best to leave a reply on my own website (click on my name) or on climategate.nl
Many thanks to anyone who can help me with my project.
It’s even more complicated than that. It’s a great oversimplification to say half a year’s human activity emissions gets absorbed that year, because what’s absorbed that year is a much smaller fraction than 1/2 of that year’s emissions plus smaller still fractions of the emissions of each of the prior years going back to when burning fossil fuels started increasing atmospheric CO2.
Exactly. Which is why I don’t understand how “airborne fraction” ever got legs as a useful statistic. -Roy
Henry’s law seems very simple, but the Henry’s law Constant is affected by parameters such as temperature and ionic strength. Another difficulty involves the diffusion rate of CO2 in deep ocean water. A further complication is the equilibrium between CO2, carbonic acid, and the carbonate ion.
The rate of CO2 entering (avoiding the banned word) the ocean is complex, and like many aspects of climate science, simple equations derived from laboratory analysis do not translate very well to the real world that is complex.
Tim S,
And phytoplankton avidly gobble up any CO2 they come across. Then they madly reproduce, creating more CO2 gobblers. Restrict CO2, restrict the plankton population (plus whatever they provide food for – pretty much all higher life in the oceans, one way or another).
By suppressing plankton using CO2 starvation, you need to accept that the human population which depends on sea life, also needs to be culled, to avoid humans also starving.
But hey, who cares about humans? Certainly not fanatical GHE cultists!
I dont understand why this issue is not being discussed. All of the Net Zero rhetoric I see seems to imply that warming will continue if we dont cut our CO2 emissions to essentially zero. But thats not true, because thats not how nature works.
Obviously it’s being discussed because in other models that is how it works.
The model that you’ve presented is essentially a curve fit over a subset of the available data and is known to fail outside of the training period, so it’s probably not a good basis for drawing conclusions for anything but the log-linear increase in CO2 that it was trained for.
It’s only a curve fit in the sense the adjustable parameters are optimized to reproduce the Mauna Loa observations. It’s an actual time-dependent CO2 budget model. And no matter what has happened since CO2 observations began in 1959, there has been no obvious deviation from this observational fact: Each year, nature removes 2% of the atmospheric excess over 295 ppm. It works when CO2 was low, it works now that CO2 is high. Nature has no idea how much CO2 humans emit each year; instead, nature responds to how much “excess” CO2 is in the atmosphere (which is why some of the extra is absorbed), and the simple model reflects that. It’s not my invention… others before me have published on the CO2 sink rate. I discovered it independently, then found others have discussed it in recent years, e.g. here: https://bg.copernicus.org/articles/16/3651/2019/
“And no matter what has happened since CO2 observations began in 1959, there has been no obvious deviation from this observational fact: Each year, nature removes 2% of the atmospheric excess over 295 ppm.”
But the fact of ‘295 ppm’ appears to be equilibium tells us that what was emitted a century ago has persisted much longer than the 50 y the model expected.
“It works when CO2 was low, it works now that CO2 is high. Nature has no idea how much CO2 humans emit each year; instead, nature responds to how much excess CO2”
But the ocean pco2 is only 7 ppm below the atmosphere, so nature can only respond to that much smaller ‘excess’.
“But the fact of 295 ppm appears to be equilibium tells us that what was emitted a century ago has persisted much longer than the 50 y the model expected.”
And what was emitted around the turn of the 20Th century was rather small.
But what has been emitted around the turn of the 21st century was not.
So a century from now, the new ‘equilibrium’ the above model would require will be ~ 400 ppm or so.
Nate,
What happens at the ocean surface is of little interest, as that has very little impact on the total removal.
What Roy has shown, is the the net sink rate is a fixed 2% of the extra CO2 above the 295 ppmv equilibrium for the current average ocean surface temperature. That is a linear process, backed by observations in the field.
The fact that the yearly human emissions increased linear over time resulted in a constant increasing CO2 level in the atmosphere, which results in a constant increasing sink rate and a surprisingly constant ratio between “airborne fraction” and human emissions.
Pure coincidence and only the result of the increasing human emissions.
If humans remained constant at 10 PgC/year, the level in the atmosphere would further increase until the net sink rate also gets 10 PgC/year.
At a constant 5 PgC/year, no further increase, even today. Thus as Dr. Spencer said: with most scenario’s there is absolutely no zero emission needed…
No. As I noted in the next article, the emissions have grown ~ exponentially since 1900.
And the math indicates that the cumulative emissions (the integral of emissions) grew with the same exponential dependence.
And the atm concentration, as a result, grew exponentially.
So we cannot tell if the annual sink rate is ~ a constant fraction of emissions, or a constant fraction of cumulative emissions, or a constant fraction of atm concentration (as he models it).
“Ferdinand Engelbeen says: What Roy has shown, is the the net sink rate is a fixed 2% of the extra CO2 above the 295 ppmv equilibrium for the current average ocean surface temperature. That is a linear process, backed by observations in the field.”
I don’t agree that he’s shown that. What he’s done is an optimum fit of the Mauna Loa record for a particular equation form including the “equilibrium” CO2 level (solved to 295 ppmv).
From ice core data, however, we know the preindustrial CO2 levels were more like 270 ppmv, so the model clearly fails outside the training interval of the Mauna Loa era. Moreover, we know that the Mauna Loa era started well after the start of significant anthropogenic contribution to atmospheric CO2 flux, so it’s not clear how this simple model could hope to resolve an “equilibrium level” with the system in a transient mode even if such a thing made physical sense.
Is the proposition that the 2% (above 295ppm) removal remains the same even as emissions drop?
If so, is there a physical basis for that supposition?
Barry,
The uptake of CO2 in water is directly proportional to the CO2 pressure difference between the partial CO2 pressure (pCO2) in the atmosphere and the equilibrium pCO2 of the ocean waters.
That is independent of the inputs. If the inputs are larger than the uptake, the levels in the atmosphere still will increase. If inputs and uptake are equal, no further increase and with lower inputs, the levels will sink, until inputs and uptake are equal again.
See Feely et al:
https://www.pmel.noaa.gov/pubs/outstand/feel2331/maps.shtml
The net uptake is a function of ΔpCO2
Similarly, the extra growth of plants also seems more or less linear with the extra CO2 above the 295 ppmv equilibrium with the ocean surface for the current average ocean surface temperature per Henry’s law.
For a linear process, there is a simple rule for the calculation of the e-fold decay rate:
Tau = disturbance / effect
Which holds for any time frame. That can be plotted and gets values of around 2%/year of the disturbance or a Tau of around 50 years for the past 60+ years of accurate measurements.
See: http://www.ferdinand-engelbeen.be/klimaat/klim_img/acc_decay.jpg
“The uptake of CO2 in water is directly proportional to the CO2 pressure difference between the partial CO2 pressure (pCO2) in the atmosphere and the equilibrium pCO2 of the ocean waters.”
Why the difference with the ‘equilibrium pCO2’ of the ocean, and not with the present value of the ocean pCO2, which you noted above was 7 ppm below the atmospheric pCO2?
Nate:
“Why the difference with the equilibrium pCO2 of the ocean, and not with the present value of the ocean pCO2”
Good question, as I wondered myself about that point…
According to Le Chatelier’s principle, a dynamic reaction in equilibrium will react on a disturbance by changing the reaction towards a reduction of the disturbance.
In all cases, that is compared to the equilibrium without disturbance, even if a new equilibrium is formed, including the disturbance.
Or we can look at the other side: the 7 μatm for most of the surface only removes 10% of the disturbance, while 5% of the surface with the highest pCO2 difference removes 4 times more.
Or practical (as I have done): look at the results: with a 3-fold increase in pCO2 difference with the “old” equilibrium since 1958, also the net sink rate increased a 3-fold, proving that the ratio is with the “old” equilibrium…
See the link in the above answer to Barry…
Ferdinand,
This doesnt make much sense to me. The ocean CO2 flux is supposed to be driven by the pCO2 difference, all over the globe.
Of course it might vary with local surface winds and mixing rates.
“Or we can look at the other side: the 7 μatm for most of the surface only removes 10% of the disturbance, while 5% of the surface with the highest pCO2 difference removes 4 times more.”
This doesnt make any sense. How do you know this?
Yes. Nature doesn’t know how much CO2 humans emit from year to year! It only knows how much is in the atmosphere. That’s what all of this is based upon!
-Roy
“Yes. Nature doesnt know how much CO2 humans emit from year to year!”
Agreed
“It only knows how much is in the atmosphere. Thats what all of this is based upon!
-Roy”
And it knows how much is in the surface ocean, and only responds to the difference with the atmosphere, which is only 7 ppm.
Nate,
As repeatedly said, the ocean surface is of very limited interest in the whole carbon budget.
The main sinks are in more permanent storage in vegetation and directly in the deep oceans, bypassing the ocean surface without limit… At the main sink places the pCO2 difference is up to 275 μatm, far beyond the 7 μatm of the average…
The net sink rate in the ocean surface is measured as increase in DIC (dissolved inorganic carbon) at about 10% of the increase in the atmosphere or 0.5 PgC/year for an increase of 5 PgC/year in the atmosphere.
The net sink rate in vegetation is known from the oxygen balance and is around 2.5 PgC/year
The remaining gap of 2.0 PgC/year is what goes directly into the deep oceans, backed by 13C/12C ratio changes and trace chemicals.
Ferdinand,
“For a linear process, there is a simple rule for the calculation of the e-fold decay rate:
Tau = disturbance / effect
Which holds for any time frame. That can be plotted and gets values of around 2%/year of the disturbance or a Tau of around 50 years for the past 60+ years of accurate measurements.”
Could that steady relationship be mostly or partly a result of the steady increase in atm CO2? Such that if that steady rise were to change, the relationship may change too?
Barry,
As long as the deep oceans or vegetation are not saturated in their uptake (which is the case for over 1,000 ppmv for vegetation and not in centuries for the deep oceans), I suppose that the uptake remains linear with the difference in pCO2 between atmosphere and water, either ocean surface water or plant alveolar water…
The limiting step in both cases seems to be the diffusion speed of CO2 in water, which is very low and can be enhanced by wind and waves for its mixing in or chemical reactions caused by photosynthesis…
It doesn’t look like that the increase in the atmosphere itself has any influence on the ratio between uptake and pCO2 difference, it remained about the same, despite an around threefold increase in pCO2 difference and uptake between 1958 and today in the Mauna Loa figures…
“It doesnt look like that the increase in the atmosphere itself has any influence on the ratio between uptake and pCO2 difference”
And Im agreeing that uptake is proportional to pCo2 difference.
But without emissions, the pco2 difference will quickly tend to 0, and then reverse.
every 1,000 years the earth corrects it self. and notice the ones saying what the ppl need to do, while they take their private jets .
The data for the CO2 uptake by the biosphere:
https://tildesites.bowdoin.edu/~mbattle/papers_posters_and_talks/BenderGBC2005.pdf
See Fig. 7 at the last page.
The data for the ocean surface uptake:
https://tos.org/oceanography/assets/docs/27-1_bates.pdf
Figure 3 and table 2: about 10% change in DIC (total inorganic carbon) of the change in the atmosphere over the same period.
Both figures extrapolated to 2020.
Net uptake by the biosphere can be calculated via the oxygen balance, and should be around 2.5 PgC/year today.
Net uptake by the ocean surface is measured at a few stations and follows the Revelle/buffer factor, or for 5 PgC increase in the atmosphere, that gives 0.5 PgC increase in the ocean surface.
The gap between observed increase in the atmosphere and human emissions then is what the deep oceans did take away.
There is a nice graph of the partitioning between the reservoirs for the period 1990-2000:
http://www.ferdinand-engelbeen.be/klimaat/klim_img/bolingraph.gif
I have seen a more recent update of that graph, but until now didn’t find the origin…
The pCO2 difference matters everywhere and that is exactly the problem with the Bern model, which assumes an averaged (near) static difference in pCO2 of only 7 μatm between atmosphere and ocean waters all over the globe, compared to a dynamic equilibrium, where there are huge differences in pCO2 between the equator (as CO2 source) and the poles (as CO2 sink). It is the latter which removes extra CO2 out of the atmosphere to return (in part) some 1,000 years later. That can be seen in the “thinning” of the 13C/12C human fingerprint, but also in the 14C decay of the 1950-1960’s atomic bomb tests… What goes into the deep is the quantity and isotopic composition of today, what returns is the quantity and composition of ~1,000 years ago (with some isotopic shift at the air-water border and reverse).
While e.g. the original equilibrium in both cases is exactly the same at 295 ppmv, in the case of a static equilibrium, the speed of uptake/release remains the bottleneck over the full surface, while in a dynamic equilibrium, the speed of uptake and release is lead by the most extreme edges…
“Net uptake by the ocean surface is measured at a few stations and follows the Revelle/buffer factor, or for 5 PgC increase in the atmosphere, that gives 0.5 PgC increase in the ocean surface.”
That doesnt makes sense since the ocean takes up ~ 27 % of emissions.
“The gap between observed increase in the atmosphere and human emissions then is what the deep oceans did take away.”
Nope, since the ocean surface waters has been growing in carbon content in lock step with the atm.
So it is not all being taken to the deep ocean.
Nate,
The total uptake by the oceans indeed is about 1/4 of the current emissions, but the uptake by the surface layer is limited by the Revelle/buffer factor to 0.5 PgC/year. The remainder of 2 PgC/year gets into the deep oceans, bypassing the surface at the sink places…
That is the difference between the 7 μatm overall difference between atmosphere and surface layer and the 275 μatm difference at the sink places…
The 0.5 PgC in the surface layer is what is measured. The deep ocean exchange is very difficult to be directly measured (although tracer chemicals and isotopic changes do give similar estimates), but anyway must fill the gap between net uptake in vegetation (based on the oxygen balance) and what is measured in the ocean surface.
“The total uptake by the oceans indeed is about 1/4 of the current emissions, but the uptake by the surface layer is limited by the Revelle/buffer factor to 0.5 PgC/year. The remainder of 2 PgC/year gets into the deep oceans, bypassing the surface at the sink places”
No. no no.
There is no bypassing of the surface. The NET uptake of the surface layer feeds the NET uptake of the deep ocean.
Remember that the deep ocean upwells carbon in the tropics, so it is only the NET going to the deep ocean that is of interest.
In the 90s the total ocean NET uptake was 3 PgC/year
https://www.pmel.noaa.gov/pubs/outstand/feel2331/images/table02.gif
The net atm-ocean surface flux must be larger than the NET sunk to the deep ocean because the carbon content of the surface layer is growing.
Still you need to show me data for the NET going to the deep ocean.
This source indicates the ocean uptake by year
https://marine.copernicus.eu/ocean-climate-portal/ocean-carbon-uptake
They say it is currently 2.5 pg/yr
“Net uptake by the ocean surface is measured at a few stations and follows the Revelle/buffer factor, or for 5 PgC increase in the atmosphere, that gives 0.5 PgC increase in the ocean surface.”
I doesnt mean it has been removed to the deep ocean, it means that much of the CO2 gets converted to other forms of carbon (DIC) in the surface ocean.
Nate,
You still see the ocean surface as one layer with the same composition and temperature all over the world. That is exactly the error of the averages, as also is the case in the Bern and similar models.
The ocean surface is by far not one “average” static layer, but has extreme differences in pCO2 between the equator (up to 750 μatm) and the poles (down to 150 μatm), due to temperature and bio-life.
There are direct connections between the atmosphere and the deep oceans, which are not reduced at all with the Revelle factor or other limits. The only limit is the pCO2 difference and the speed of uptake, which depends of thorough mixing by wind and waves, as the diffusion speed of CO2 in water is very low.
Further, all figures are in PgC, carbon, no matter the form that carbon gets in the different compartments.
DIC in seawater is the sum of carbon in pure, dissolved CO2 (1%), bicarbonates (90%) and carbonates (9%).
The increase in DIC (thus inorganic carbon in all its forms) of the ocean surface is 10% of the increase in the atmosphere or 0.5 PgC/year for 5 PgC/year CO2 increase in the atmosphere.
The oceans absorb some 2.5 PgC/year as you have found.
If the surface only gets 0.5 PgC/year increase, where do you think the rest of the 2.5 PgC/year goes?
“Net uptake by the ocean surface is measured at a few stations and follows the Revelle/buffer factor, or for 5 PgC increase in the atmosphere, that gives 0.5 PgC increase in the ocean surface.”
I think it is the % increase in the total carbon content of the ocean surface that is reduced by Revelle factor by a factor of 10 relative to the % increase in the atmosphere.
And it should be the % increase in the water that determines the % increase in the transport of carbon to the deep ocean. And this % increase is 1/10 th that of the atmosphere.
Thus we can understand that the increase in carbon sunk to the deep ocean has not kept up with the increase in carbon in the atmosphere.
There is the matter that Dr. Spencer’s model, which he published on his blog, is one with a specific rate of exponential decay of CO2 (with half life about 30 years) doing a good fit with data of atmospheric CO2 growth rate and emissions from human activity. This matter is in combination with another matter, that when atmospheric surplus above some equilibrium point and manmade emissions are both similarly increasing at similar approximately exponential rate, the “atmospheric surplus” is consistent with many decay curves for each year’s manmade emissions such as a Bern model one, not only an exponential decay curve. A Bern model that fits the data would indicate same result of an emissions policy as an exponential decay model that fits the data in the short term, but in longer term a fitting Bern model indicates atmospheric CO2 growth above what would happen if the exponential decay model is correct.
Although it’s popular, I don’t think using exponential decay is a useful way to think about the atmospheric CO2 budget, and I have never used it. It just happens to be a good mathematical approximation to what is going on physically and biologically. The “sink rate” is a better, and more physically-based, concept because it reflects how nature responds to “extra” CO2 in the atmosphere. Nature (e.g. forests) respond to how much CO2 is in the atmosphere, not to assumed decay profile. It is also a more appropriate way to model the behavior of the system on a year-to-year basis.
-Roy
If the decay rate of each year’s emissions is by a non-exponential curve, then sink rate (as in fraction of each year’s emissions) would only be a constant (or fairly so) percentage of atmospheric surplus if emissions and atmospheric surplus above a prior equilibrium are both (fairly so) growing at similar exponential rates.
A change from exponential growth of emissions, large and sustained enough to cause a noticeable change from exponential growth of atmospheric surplus, would cause the sink rate (at percent per year of atmospheric surplus) to change if decay of each year’s emissions is over many years and by a curve significantly different from exponential decay.
*** Don, while your reasoning makes no sense to me, why not go ahead and put your model in a spreadsheet (or whatever programming language you like), adjust whatever free parameters you want, and show me how your ideas (1) result in the observed Mauna Loa record of CO2, and (2) produce a trajectory of future CO2 concentrations given a 1%/yr reduction in CO2 emissions? -Roy
Dear Roy,
There is no discrepancy between an exponential decay and a linear sink rate:
If the data show a rather fixed percentage between disturbance from a dynamic equilibrium and its effect, you have an exponential decay…
Until now, one can’t say that the Bern and similar models are wrong, as neither the deep oceans or vegetation are saturated.
If that happens (in the year 2500 or so…) then the sink rate will change from proportional to the disturbance towards other values, but until now, there is no saturation visible in vegetation and near impossible for the deep oceans.
If the latter would absorb all human emissions until now, that would increase the deep ocean content with about 1%. After full equilibrium that would increase the atmospheric CO2 also with 1% or 3 ppmv above equilibrium, or 298 ppmv… Back to less green on earth…
This seems like a remarkable good empirical fit. Kudos.
My one concern is with the 295 ppm base line. If 295 ppm is some ‘natural base line’, then wouldn’t nature also ADD 2% for any deficit BELOW 295? So for example, if CO2 were 280 ppm, there is deficit of 15 ppm. 2% of 15 ppm is 0.3 ppm, CO2 should *rise* by 0.3 ppm. Basically, CO2 would tend toward 295 ppm/
But there seems to have been a long period when CO2 was fairly steady around 280 ppm. It is an odd step-function with no obvious reason that I can think of.
280 ppm –> nature does nothing
290 ppm –> nature does nothing
295 ppm –> nature does nothing
300 ppm –> nature pulls out 0.1 ppm
305 ppm –> nature pulls out 0.2 ppm
It’s to do with chemical Equillibria. The further the process is from the equilibrium point the faster the chemical change will be.
There will be limiting factors such as diffusion from the surface and the sea temperature will have an effect.
But the overall effect is the sea has much more capacity to absorb the CO2 than the climate modellers give it credit for.
Mark,
“But the overall effect is the sea has much more capacity to absorb the CO2 than the climate modellers give it credit for.”
The sea is teeming with phytoplankton, of course, furiously gobbling up CO2, and returning the O2 to the atmosphere.
NASA agrees “Phytoplankton growth depends on the availability of carbon dioxide, sunlight, and nutrients.”
Cut back CO2, cut back O2 going into the atmosphere, cut back mammalian life, I suppose!
Not such a good thing, in my opinion.
Mark, Certainly rates of reactions vary and depend on a wide number of variables. My three issues are:
1) 295 ppm and 2% are from empirical fits (and the el nino correction is a third empirical parameter). Empirical fits can sometimes provide fresh insights, but they can also just a pretty good approximations that fits over some limited time frame.
2) There is a step function (0% below 295 ppm, 2% above 295 ppm). Nature rarely has step functions.
3) 295 ppm is not “equilibrium”. Equilibrium had been around 280 ppm for centuries.
Tim Folkerts,
1. The 2% is not only from an empirical fit, as Dr. Spencer shows, it is also the observed decay rate over the past 60+ years of exact measurements: around 50 years e-fold decay rate or a half life time of around 35 years for any excess CO2 level above the 295 ppmv.
2. There is no step function. Below 295 ppmv, if humans invented a huge scale CO2 absorber, the oceans (and probably vegetation) will add CO2 to the atmosphere…
3. The 280 ppmv was at the depth of the LIA, since then ocean temperatures increased and the equilibrium also increased and per Henry’s law should be around 295 ppmv today.
The influence of temperature on CO2 (pressure/solubility) levels in water changes with about 16 ppmv/K, as can be seen even over glacial and interglacial periods over de past 800,000 years.
Here for Vostok:
http://www.ferdinand-engelbeen.be/klimaat/klim_img/Vostok_trends.gif
Where the ratio is about 8 ppmv/K for Antarctic temperature changes, or around 16 ppmv/K for global temperature changes.
Tim,
You wrote –
“My three issues are: . . .”
Good for you! Issue away – do you think anyone values your opinions, or do you just suffer from delusions of grandeur?
Notwithstanding your “issues”, have you addressed the main issue – that you cannot even describe the GHE?
How hard can it be for a chap of your intellect?
Swenson, the problem is not with a ‘chap of my intelligence’, the problem is with a ‘chap of your intelligence’.
I have described the GHE multiple times at multiple levels. 1000’s of others have done the same in textbooks and around the internet. It is not our fault you fail to grasp the basics after such a long time.
The 295 ppm value is that which best fits the Mauna Loa data, in its observed range…. roughly 315 to 415 ppm Given any realistic future emissions scenario, it’s doubtful we will go below the Mauna Loa value in 1959, 315 ppm… especially in the next 40 years. The equilibrium value hundreds of years ago was no doubt somewhat different.
“The equilibrium value hundreds of years ago was no doubt somewhat different.”
But if that is the case, why isn’t the equilibrium value higher than it was 50 years ago? If anthropogenic CO2 has already raised the value from 280 ppm to 295 ppm between ~1800 and 1959, it seems that the equilibrium value should continue to rise. Why not 2% of 300 ppm now, or 310 ppm?
I realize that your fit is quite good, but I am always a bit dubious of purely empirical fits.
Tim,
We are now at 425 ppmv, the difference in uptake between 295 and 305 ppmv as baseline would be less than 10% on a value of 2.5 ppmv/year uptake, which has a variability of +/- 1.5 ppmv/year. Simply not detectable.
But if you wish, you can calculate the change in baseline yourself with the formula of Takahashi, which holds for any water, independent of its composition.
If you know the pCO2 at one temperature, you can calculate the pCO2 at another temperature:
∂ln pCO2/∂T=0.0423/K
Or easier to follow:
(pCO2)sw @ Tnew = (pCO2)sw @ Told x EXP[0.0423 x (Tnew Told)]
See:
http://www.sciencedirect.com/science/article/pii/S0967064502000036
The change in pCO2 with temperature also holds for the average temperature of all oceans.
Ferdinand, thanks for your reply. You make a good point that shifting the base line from 295 ppm to 280 PPM or 310 ppm would be a relative small correction at current levels.
Still, shifting that baseline would change the fit, and change the ‘steady 2%’ result.
It seems without the mad increase of CO2 emission from China, Global CO2 levels would have already, leveled off.
Roy Spencer
CO2 “sink rate”
There is a flaw in your model. You are assuming that CO2 that moves from the atmosphere into the ocean or biomass sinks disappears. It does not. It accumulates in the sink.
The three sinks, atmosphere, ocean and biosphere contain different amounts of carbon. The atmosphere contains about 50% of the circulating carbon. Ocean and biomass contain 25% each.
The three sinks are in equilibrium and carbon released into one reservoir will redistribute to the others until equilibrium is restored.
We release CO2 into the atmosphere equivalent to increasing CO2 concentration by 4ppm/year. Half of that, 2ppm equivalent, transfers to the ocean and biomass reservoirs to maintain the equilibrium. The remaining 2ppm equivalent stays in the atmosphere, which is why we observe an annual increase of 2ppm.
Your hypothesis implies that the equilibrium between the three reservoirs will change in the future, with a higher percentage of circulating CO2 being stored in the oceans and biomass and a smaller percentage in the atmosphere.
I’m not aware of any evidence to support this. Please explain.
EM,
You wrote –
“We release CO2 into the atmosphere equivalent to increasing CO2 concentration by 4ppm/year” – by burning fossil fuels which nature previously removed from the atmosphere, and sequestered for man’s used – man having recently appeared on Earth, and evolving to take advantage of nature!s storage of fossil fuels
To complicate an already complex issue, CO2 is utilised by photosynthetic plant life, which produces O2, without which we all die, and carbohydrates – without which we all die. Oh, and combustion of hydrocarbons results in pure H2O, as well.
At around 180 ppm of CO2, plants start to die, so it makes sense (to me, at least) to ensure that atmospheric CO2 levels never fall below 400 ppm or so, given nature’s past demonstrated efficiency at removing CO2 from the air, and locking it away as fossil fuels, chalk cliffs and all the rest. Like limestone deposits, for example.
Unfortunately, fanatical GHE cultists desire the extermination of all life on the planet by removing CO2 from the air we breathe.
Possibly not the smartest thing the human race could do.
Net zero? The cumulative intelligence of fanatical GHE cultists, and their followers,
“Unfortunately, fanatical GHE cultists desire the extermination of all life on the planet by removing CO2”
You think going back to the CO2 levels that we had for most of human history, would exterminate all life?!
Very strange.. Pls explain.
Unfortunately, fanatical GHE cultists desire the extermination of all life on the planet by removing CO2 from the air we breathe.
For those who understand, no explanation is necessary. For those who do not, no explanation is possible.
Which are you?
Nate, please stop trolling.
Obviously you have no evidence to support your absurd alarmist claims of ‘extermination’, do you.
So no need to double down further.
Unfortunately, fanatical GHE cultists desire the extermination of all life on the planet by removing CO2 from the air we breathe.
For those who understand, no explanation is necessary. For those who do not, no explanation is possible.
Which are you?
Nate, please stop trolling..
Swenson,
You lose all credibility when you insult and make asinine statements like:
Unfortunately, fanatical GHE cultists desire the extermination of all life on the planet by removing CO2.
For those who understand, no explanation is necessary. For those who do not, no explanation is possible.
Which are you?
Nate, please stop trolling.”
If you can’t use data or science to have a thoughtful civil discourse, then may be best to remove yourself from the conversation, otherwise you present yourself as ignorant and petty.
Just my two cents, take it or leave it.
– Casey
To help you visualise, think of the three Carbon reservoirs as three aquarium tanks. The ocean and biomass reservoirs each have a water surface area of 1_square foot. The atmosphere tank has an area of 2 square feet.The three tanks are connected by syphons so they settle to an equilibrium with the water levels equal.
Now add 1 litre of water to the atmosphere tank.
The volume of water in the atmosphere tank increases as does it’s water level. Water flows through the siphons into the other two tanks. At equilibrium all three tanks are at the same higher level. The atmosphere tank has gained 500 ml. The ocean and biomass tanks have each gained 250 ml.
EM,
Visualise this – vast amount of biogenic fossil fuel in the crust. Even vaster amount of various carbon compounds – shells, chalk, limestone.
If nature didn’t sequester all that carbon from the atmosphere, how did it get there? Who cares anyway?
Do you?
Ent, there is a flaw in your attempt to rebut Spencer.
Much of the CO2 that enters the ocean “disappears”. It becomes seashells.
Your false claims ain’t science. Passenger jets do NOT fly backward!
You don’t accept science or reality. You can’t learn. Why are you even here?
Recently, several strong volcanic eruptions in Indonesia.
https://www.youtube.com/watch?v=pIXvxkhLR4w&ab_channel=GeologyHub
Still frosty nights in the Midwest. Temperatures in Europe have dropped as much as 10 C below the multi-year average. The ice in the Barents Sea is not melting. Below Australia, a blocking high with cold nights will continue in Australia until the end of April.
“Below Australia, a blocking high with cold nights will continue in Australia until the end of April.”
Wanna bet?
https://i.ibb.co/LhdHz8D/ventusky-pressure-20240430t1800.jpg
https://i.ibb.co/ryqTmC7/ventusky-pressure-20240503t1200.jpg
https://i.ibb.co/B46vzfS/ventusky-temperature-anomaly-2m-20240419t0300.jpg
I have come to much the same conclusion as Roy Spencer
https://www.researchgate.net/publication/371220923_The_airborne_fraction_of_anthropogenic_CO2_emissions_A_mistaken_concept
Rgnvaldur Hannesson
Rognvaldur:
Thank you for this, I was not aware of your work! I’m glad I’m not the only “crazy one”!
-Roy
Earths CO2 reservoirs atmosphere, oceans, plants/soil continually exchange CO2 at rates considerably greater than humans release new CO2 into the atmosphere. These natural exchange rates tend to be steady unless disturbed by, e.g. addition of human CO2. An increase in atmospheric CO2 increases the rate of exchange into other reservoirs at a magnitude proportional to the amount the equilibrium exchange rate has been disturbed. As the CO2 content of other reservoirs (e.g., ocean, plants/soil) increases, the rate at which they exchange CO2 back into the atmosphere will also increase. All three CO2 reservoirs strive for a new, natural equilibrium rate that never materializes because humans (and sometimes Nature) keep adding more CO2 to the atmosphere. Therefore, the rate at which excess CO2 leaves the atmosphere depends on several factors, including changes in the natural CO2 exchange rates among reservoirs as reservoir CO2 concentrations change, which in turn are dependent on natural CO2 exchange rates within individual reservoirs, such as deeper ocean mixing and carbon movement between living plants and various non-living soil components.
Potentially damaging frosts and freezes coming to Midwest, Northeast
Preventative action may be needed for tender plants, vineyards and orchards as cold waves will deliver episodes of frosts and freezes prior to the end of April in the Midwest and Northeast.
https://www.accuweather.com/en/winter-weather/potentially-damaging-frosts-and-freezes-coming-to-midwest-northeast/1642234?fbclid=IwZXh0bgNhZW0CMTAAAR3txmtBW9bVJGZO3P9HzNgbPi8HYnR33QodHWo1OUQ2DfrB-52gi5XrZaM_aem_AeiJwtdyYlwstV8-77oFrpAvJ3K3kV2gc6ecM4xi_JEglGVd4eHHA2AC-4HrS_3a2eXyizNkA6ZYQgLjd913aN80
As my father was a farmer, we were taught not to plant until after Memorial day.
Atmospheric CO2 concentration will fall when we enter the next global cooling trend. We probably can’t reach 550 ppm, which is believed to be the ideal concentration for plants.
Maybe there’s a reason 550 ppm not really ideal….
Clint,
I believe Michael Mann was asked what he thought the optimum level of atmospheric CO2 was. He scuttled away like a cockroach, refusing to commit himself to anything definite.
A reasonable course of action, showing he might be silly, but he’s not stupid!
The constitution of the atmosphere changes. Life adapts to take advantage of the environment, from the archaea which survive in temperatures above 120 C, to cryophiles who can reproduce at -20 C. It looks like the atmosphere can’t get hot enough to kill existing life, but can certainly kill by cold.
More than 99.9% of life which has existed on Earth is estimated to be extinct. I guess the environment changed in some way or another. Homo sapiens is a very recent species – might just be a momentary flicker in the grand scheme of the universe.
Who knows?
Paleontologists found buttercups in the stomachs of frozen wooly mammoths in the tundra. Please explain.
Jack,
“Paleontologists found buttercups in the stomachs of frozen wooly mammoths in the tundra. Please explain.”
I wish I could. Must have been cold resistant buttercups, I suppose. Remains have been found under the ice in Antarctica. Maybe the mammoth didn’t realise that buttercups are poisonous, though. “All Ranunculus (buttercup) species are poisonous when eaten fresh, but their acrid taste and the blistering of the mouth caused by their poison means they are usually left uneaten.”
What’s your thinking? Aliens? Mammoths are immune to buttercup poisoning?
The University of Alaska doesnt know how the mammoths became frozen, either. It says “No one has ever satisfactorily explained how the Beresovka mammoth and other animals found frozen in the subarctic could have been frozen before being consumed by predators of the time.”
I have an explanation for the frozen mammoths, of course, but Im sure nobody is interested.
Perhaps there is an explosion of clams and coral- no one is safe.
I have never heard any on the alarmist side say what CO2 level would be adequate or optimum. It’s yet another reason I think they are clueless.
If increases help plants then good.
Obviously the pre 1900 value, 280 ppm, was adequate for humans to flourish for many millennia.
Nate,
“Obviously the pre 1900 value, 280 ppm, was adequate for humans to flourish for many millennia.”
At one time, the Israeli government limited the food supplies to Gaza, to a point considered to be adequate for humans –
“The food calculation, made in January 2008, applied the average daily requirement of 2,279 calories per person, in line with World Health Organisation’s guidelines, according to the document.”
Adequate is not optimal. What is wrong with 500 or 600 ppm CO2? Maybe you believe that all the ice will vanish from Antarctica, due to increased CO2, allowing more food to be grown, is that it?
Why do you hate the thought of adequate food for an increasing population? Maybe you support the racial superiority thoughts of Svante Arrhenius, without realising that you might be the first to go!
[laughing at clueless fanatical GHE cultist]
Nate, mammals evolved when co2 was a lot higher. So shouldn’t that be considered as the optimum?
Can any one remember the levels??
“What is wrong with 500 or 600 ppm CO2?”
So you suggest we go ahead and try this untested modification of the Earth?
If we could enhance food production for humans with such a global experiment, WITHOUT any other negative consequences, then sure.
Humans have done such experiments before, not globally, but over large regions.
Large scale use of coal and oil. We got extreme air pollution that led to many extra deaths, eg in the UK in the 1950s.
Large scale plowing up of the prairie for agriculture. We got the Dust Bowl.
Large scale damming of rivers for hydroelectricity. We are now seeing the damage to river and ocean ecosystems and fisheries.
So can you promise no negative consequences? Have you thought it through?
I am doubtful.
https://news.ucsc.edu/2023/12/ancient-carbon-dioxide.html
Nate,
You wrote –
“So can you promise no negative consequences? Have you thought it through?”
No negative consequences from what? Putting back into the atmosphere what was taken from it in the past?
What “negative consequences” are you talking about? You are just scare-mongering for no good reason at all, aren’t you? You fanatical GHE cultists just run around crying “Doom! Doom! Thrice doom!”, pretending you can look into the future.
Nobody can predict the future state of a deterministic chaotic system. The IPCC agrees with me that it is not possible to predict future climate states.
Go on, show that both the IPCC, and I, are wrong – you don’t seriously believe that you know what “negative consequences” will ensue from restoring CO2 levels to their previous state, do you?
I’m pretty sure that you don’t have Godlike powers, but feel free to demonstrate that I am wrong.
[derisive snort at Nate the fortune seller]
EM,
From your quite useless link –
“This cast some doubt on the relationship between CO2 and temperature. However once the consortium excluded estimates they deemed the least dependable, they determined that CO2 was actually quite higharound 600 to 700 parts per million, comparable to what could be reached by the end of this century.”
The “consortium” excluded “estimates” they didn’t like. Our guesses are better than your guesses?
You must be quite mad, if you think that guesses are facts. They aren’t – as Feynman said “It doesn’t matter how beautiful your theory is, it doesn’t matter how smart you are. If it doesn’t agree with experiment, it’s wrong.”
How are you getting along with trying to describe the GHE? Not too well? Why am I not surprised?
Keep trying.
“What negative consequences are you talking about?”
I explained and gave you examples. Are you unable to read?
“You are just scare-mongering for no good reason at all, arent you?”
No, that was what you did when you claimed plants and humans would starve if we go back to the levels of CO2 that we had through most of human history.
where can I find more about the best CO2 level for plants? that’s a very accessible number to compare to the present CO2 scare. and what is GHE?
For most of the last 2 million years the CO2 concentration has been 200ppm.
It’s not relevant anyway. Most plant growth is limited by light intensity, temperature or nutrient and water availability.
Even 200ppm provides more CO2 than the plants can normally use.
Research the Law of Limiting factors.
“For most of the last 2 million years the CO2 concentration has been 200ppm.”
Oh really?
EM, please stop trolling.
Entropic man is a MONKEY.
Arctic air masses are falling over Central Europe far to the south.
https://i.ibb.co/zHFR7D0/gfs-z100-nh-f168-1.png
I have looked at this topic:
https://blackjay.net.au/the-tyranny-of-digital-models/
Its humorous to see people dive into the weeds of ocean sink rates and other micro issues while missing the big picture. We are living in a CO2 starved world right now (past 20 million years). At 150 ppm, all plants and life die. The historical CO2 levels for this planet beyond 20 million years and been in the thousands of ppms. This is where we should be. Optimal levels for plant growth are 1000-1200 ppm. Levels inside an average home are about 1,000 ppm. We are coming out of an ice age right now, the planet has been gradually warming for 10,000 years and thats good. CO2 levels increase as result of warming, not the other way around. Historical CO2 increases always FOLLOW a warming period, they never PRECEDE one. The primary driver by many orders of magnitude over all greenhouse gases is solar impacts. Completely external to our earth and out of our control. NASAs website used to clearly state this for many years before being removed as it didnt comply with the political narrative. People freak out because CO2 levels have gone up 150 ppm in a 150 or so years. People say its unprecedented. No its not, levels have been as high as 9,000 ppm with abundant life on earth. Even if we stopped all emissions of CO2, levels are still going to rise as the vast majority comes out of the ocean as it warms as result of the planet air warming. Glaciers will melt as we continue to come out of the current ice age (this is normal). Sea level (relative to land level) will continue to rise as it has been doing for 10,000 years now. And no it is not accelerating recently, its been constant and steady. A warmer planet with higher CO2 means better crop yields, more abundant life, and more livable land on the planet. People die from the cold, not from milder temperatures. This is all a political driven fallacy that has mushroomed into a multi billion dollar industry that many peoples livelihood depends on continuing this myth. So there is now great financial and political incentive to push this narrative and censor the facts of the matter. Just ask any professor who has stated these factsthey are not refuted, they are fired and blacklisted.
Honest comments/questions here intended for open civil discourse. Feel like a lot of theese are straw man arguments.
Of course life existed with higher levels of CO2, that is not debated. Cambrian explosion for example, however, life did not exist on land during that period. Yes cold temps kill more humans more than hot temps. But as I said these seem to be ‘straw man arguments’ to me. The question isn’t if life can exist if CO2 continues to rise, the question is how does it impact human life. Polar ice caps didn’t exist during this higher level CO2 periods, however, sea rise from melting caps would significantly impact coastal cities worldwide. Humans may be able to escape heat stroke but have more difficulty surviving without food that results from changing climates/droughts/monsoons etc. Refugees that result from flooding and loss of land have a more challenging time surviving…. etc. To argue cold kills more than hot is completely disregarding the actual concern.
Financial gain??? to me it seems this entire conversation is driven by the industries capitalizing on the burning of fossil fuels. Researchers would be conducting research and getting paid their dismal University salaries either way. The professors that leave and become ‘spokespeople’ for the oil industry on the other hand increase their salaries. Data is hard to come by for that as most scientists that become ‘spokespeople’ are unwilling to discuss their financial status and throw it back a the ‘elite institutional professors’.
As far as a ‘good’ CO2 level, what do you all think? The question is good for what? and for who? For humans? 200 – 350ppm maybe? At least good for how humans have established themselves on the planet and currently exist.
Just my thoughts, feel free to ignore or not. Best to all.
Casey
Casey,
Why not let nature take its course?
Do you believe that replacing CO2 previously removed from the atmosphere is “bad”, or “evil”?
I believe the future is unknowable, but I’m willing to be convinced otherwise. What do you think?
“Why not let nature take its course?”
You mean stop polluting the lands and rivers and the air with man-made chemicals and emissions?
Ah, but we are of nature aren’t we? So all our doings are nature taking its course.
This includes any and all efforts to mitigate our pollution.
Nature is already “taking its course.”
barry,
You are free to stop polluting the lands and rivers and the air with man-made chemicals and emissions, if you wish.
As you say, mankind is part of the environment.
I, on the other hand, am free to “pollute” as much as I wish. Others seem to share my views, and provide potable water, electricity, steel, concrete, and all sorts of other goods and services for my use and comfort.
Your “man-made chemicals and emissions” are part of nature taking its course, as you say.
You seem to be agreeing with me that allowing nature to take its course is not only desirable, but inevitable. Fanatical GHE cultists are free to tell me how to live my life, and I am free to ignore them – and tell them how gullible and ignorant they are.
By the way, is there anything wrong with “man-made chemicals and emissions”? Apart from releasing noxious farts in a crowded lift, of course – that’s bad form! I actually emit CO2 on a regular basis. I hope you don’t mind.
Temperatures in the Midwest on the morning of April 20.
https://www.ventusky.com/?p=44.3;-95.5;4&l=temperature-2m
None of you people actually know how CO2 works in our atmosphere. I dont think anybody does. Im just going to keep enjoying eating beef and driving my gasoline burning V8 truck.
https://www.metlink.org/resource/the-changing-carbon-cycle/
Roy, good article. Thanks
Temperature anomalies in Australia.
https://i.ibb.co/dQWWmsb/ventusky-temperature-anomaly-2m-20240421t0900-26s137e.jpg
Temperature anomalies are worthless.
Thank you for this long needed countering of the Net Zero mistake.
Also the wrong focus on ECS, with an equilibrium time of 500 years, instead of the lower TCR is something to emphasize more often.
The latter is what we get today, the former is what we get tomorrow. What did you want to emphasise?
Many interesting charts on global carbon budget.
https://robbieandrew.github.io/GCB2023/
https://robbieandrew.github.io/GCB2023/PNG/s50_2023_Global_Sources_and_Sinks.png
I find it interesting that the Land carbon flux varies so much, from year to year. Some years, eg 2002, 50 % lower than average.
https://robbieandrew.github.io/GCB2023/PNG/s56_2023_ESSD21_Fig07.png
But in the model above the flux is supposed to driven by the difference between PCO2(present) and the equilibrium value 295 ppm.
But of course that difference doesnt vary by 50% year to year.
Nate,
Interesting figures, especially slide 58 in the first link: the source rate and sink rate still are in near perfect equilibrium…
The land carbon flux is very vulnerable to changes in temperature and humidity (rain patterns during an El Nio) and in the case of volcanic eruptions (Pinatubo) an increase in photosynthesis, thanks to light scattering by the volcanic dust.
All together, that are short-time changes of 1-3 years and their highest impact is not more than +/- 1.5 ppmv around the 105 ppmv increase since 1958.
“Nate,
Interesting figures, especially slide 58 in the first link: the source rate and sink rate still are in near perfect equilibrium”
If the sinks include the atmosphere..
This is just a statement of conservation of mass.
Not sure what you conclude from this?
To thine own self be true. Then as day follows night, thy cannot be false to another.
Speaking of night and day, that Canadian Greenpeace founder points out that the temperature shifts several times 1.5 C daily.
If Zharkova’s Solar models are correct, a major cooling era is soon upon us.
There are greater factors of climate change ignored in the CO2 debate.
They are not ignored, either in the “debate” or in actual research. But ‘skeptics’ regularly complain without merit that this is so.
To thine own self be true. Then as day follows night, thou cannot be false to another.
Speaking of night and day, that Canadian Greenpeace founder points out that the temperature shifts several times 1.5 C daily.
If Zharkova’s Solar models are correct, a major cooling era is soon upon us.
There are greater factors of climate change ignored in the CO2 debate.
Cjones1,
Zharakova’s paper was retracted for good reason, and no not a conspiracy to promote green energy. It was significantly flawed in many, many aspects. Discussed on many locations on the internet but if you would like to seek out yourself you can start here and explore on your own.
https://pubpeer.com/publications/3418816F1BA55AFB7A2E6A44847C24
Data / Facts / Common Sense Matter!
All the best,
Casey
Casey,
You wrote –
“Data / Facts / Common Sense Matter!”
Yes, of course. I am not sure what you are trying to discuss.
Maybe you could clarify. The amount of CO2 in the atmosphere is obviously orders of magnitude less than it used to be – transformed into coal, oil, and gas.
Man is putting it back into the atmosphere. Are you opposed to this on religious or political grounds. You seem short on data, facts, and common sense.
Thanks.
Some “scientists” are just as easily bribed to fabricate results as some political appointees are to push false agendas.
This is when the science becomes irrelevant.
The scientists know they are publishing studies with false results, and will actually defend them.
Why?
Money
Bryan,
You wrote –
“The scientists know they are publishing studies with false results, and will actually defend them.”
Maybe they are just ignorant, but don’t realise it. As Richard Feynman said of scientists “The first principle is not to fool yourself and you are the easiest person to fool.”
As I know, to my great sorrow and embarrassment, in the past.
Oh well, onward and upward.
Brian
Fabricated results become obvious very quickly, because they are like jigsaw pieces which don’t fit. As soon as anyone else tries to use or extend that research they find that it cannot be replicated or disagrees with other data.
EM,
You wrote –
“Fabricated results become obvious very quickly . . .”
Not necessarily so. William McBride initially sounded the alarm over the dangers of Thalidomide (limbless children etc), even though animal research and modelling said the drug was safe enough to be sold without prescription.
Unfortunately, he got a bit carried away later, and thought other drugs were similarly dangerous, and published a paper in 1981 supporting his conclusions. He fabricated and falsified data when reality didn’t agree with his thinking. He wasn’t struck off the medical register until 1993.
People are easily fooled. It’s easier to go along with the crowd. Look at the GHE – nobody can describe it, but many highly educated and otherwise rational people believe in it!
I tend to believe that unless confirmed by experiment, speculation is just that. Time might tell if the speculation is right or wrong.
Actually it seems his fraud came to light almost immediately,
Coauthors “Vardy and French say they knew nothing of the paper until they received copies from the publisher. They were concerned that the number of rabbits tested and the doses of drug given were wrong, and that the examination of fetuses was misrepresented. Not satisfied with McBrides replies to their questions, they resigned from Foundation”
“In 1982, the matter was taken to the foundations research advisory committee, which asked McBride to
withdraw the paper. He refused.”
Just took awhile for justice.
Nate,
“Actually it seems his fraud came to light almost immediately,”
And nothing happened, as you say, for quite some time.
Phlogiston, caloric, the luminiferous ether, the GHE – not necessarily fraud, just ignorance.
Are scientists who believe in these things fools or frauds? Is creating “data” by infilling, estimating or some artifice, fraud or foolishness?
What do you think?
Climate change is real. In fact it changes 4 times a year. Has for quiet a while.
Huh, when I relate the seasons to climate the ‘skeptics’ don’t like it. I see I need to make a rhetorical point in line with their views to make the relationship palatable for them.
“Huh, . . . ”
barry, please stop trolling.
I think you removed my last comment.
You do know that censorship of the truth is a bad thing.
You can remove this one also.
Bryan,
There are a few words that wont normally allow the comment to post. Maybe the automatic censor leapt into action.
Roy,
I recently published in the Internet Magazine Wynias Week an article (see link below) that came to essentially the same conclusion. Specifically, a reduction of 40% of the current CO2 emission rates would keep global warming at around the 1,5 degrees lower limit of the Paris Agreement. No need for Net Zero, that is a flawed concept. Sorry, the article is in Dutch, but Google Translate works miracles.
https://www.wyniasweek.nl/ons-klimaatbeleid-is-onnodig-restrictief-en-kostbaar-en-ook-nog-eens-in-strijd-met-het-akkoord-van-parijs/?pdf=54600
Jacques:
Thank you for the link!
-Roy
Jacques,
The 1.5C limit is meaningless. The GAT index published each month isn’t at all representative of the real world.
When physical measurements of temperature are averaged for an hourafternoon, night, etc.they’re not representative of that interval. Over the course of an hour, the temperature at a given station can fluctuate by 10F. Taking 10-second averages and averaging them every 5 minutes will produce the overall average of that fluctuation, not the actual highest temperature of the hour nor the variability of the hour, which also shouldn’t be discarded as an irrelevant detail when discussing changes in climate.
Rocky terrains have more thermal inertia due to the slow heat release of sand, and as a result, the hourly average at a given station will represent a different distribution of variability than a station located near a coast, where the difference in warming rates between land and ocean creates a temperature gradient.
The averaging process extends through stations all around the world with different hourly rates of temperature, owing to the change in climate. The averaging discards all such detail. It can show us we are warming, but it doesn’t reveal the rate over time and, as a result, the cause because it doesn’t even conform to the construct of time.
Walter, you are focusing on the details of the moss on a single tree, while missing that there is an entire forest.
Nate,
When one tree gets knocked over, it falls on another tree, and that tree onto another
And?…then whole forest falls over? C’mon.
Most of it does.
Averaging temperature by the same intervals globally assumes a uniform rate of temperature change across all locations, which doesn’t reflect reality.
“Averaging temperature by the same intervals globally assumes a uniform rate of temperature change across all locations, which doesnt reflect reality.”
No it doesnt. Where do you get such a strange idea?
It is just math.
Nattering Nate,
You wrote “It is just math.”
Well, that clears that up, doesn’t it?
Is the GHE “just math” too? Or can’t you actually describe the GHE in a way?
What a pity.
Nate,
Rather than repeat myself, feel free to just join this thread. It’s pretty much the same conversation:
https://www.drroyspencer.com/2024/04/uah-global-temperature-update-for-march-2024-0-95-deg-c/#comment-1663874
There seems to be concern from fanatical GHE cultists about the amount of CO2 in the atmosphere.
I wonder why none of them are capable of giving a cogent reason why replacing CO2 in the atmosphere by burning sequestered fossil fuels is bad for humanity?
More CO2 and H2O (the other product of hydrocarbon production) mean more plant life.
Seems win-win to me. Electricity, potable water, copious bread and wine. What’s not to like?
Of course, some miserable doomsaying cultists will cry “Evil! Evil!”. They can’t abide bounteous nature, and people enjoying themselves. They’re a strange lot.
For people worried about ocean “acidification” –
“Phytoplankton provide organic matter for the organisms that comprise the vast majority of marine life. They do this by consuming carbon dioxide that would otherwise dissolve in the sea water and make it more acidic.” – Nature, 2012.
Also (same source) – “They provide food, directly or indirectly, for virtually every other marine creature. They emit much of the oxygen that permeates our atmosphere. Their fossilized remains, buried and compressed by geological forces, are transformed into oil, the dense liquid of carbon that we use to fuel our cars, trucks and buses.”
The plankton (whose current biomass can only be guessed at) removed enough CO2 from the atmosphere in the past to create oil, which we are now putting back into the atmosphere, providing more food for more plankton to remove it from the atmosphere, and make it into oil again!
Only joking, nobody really knows how it all staggers from point to point, let alone what will happen in the future – given that in a deterministic chaotic system, the approximate present does not determine the approximate future.
Of course , fanatical GHE cultists are convinced that CO2 is “evil”, for some reason. Because humans emit CO2 with every breath, they are also “evil”, and doomed therefore. Hard argument to refute – anything can be deemed “evil”, if it suits your purpose. You are “good”, therefore anybody who disagrees must be “evil”. And what is “good” today, may be “evil” tomorrow – just look around you.
In the meantime, the universe just keeps keeping on. No “good”, no “evil”, just reality.
Here endeth the sermon.
Completely lost in all of the endless chatter about climate change is the glaring fact that CO2 levels have only increased by 1.29 parts per 10,000 since 1880. That’s TOO TINY to have had any measurable impact on temperature! Show me a lab experiment that moved the thermometer after adding such a tiny amount of CO2 to the test chamber.
Atmospheric CO2 has increased by 50% since 1880.
Since you are announcing that small amounts can’t have any impact, Try injecting LSD into your bloodstream at 1.29 parts per 10,000. Report your findings. If you’re feeling particularly game, try arsenic.
You are lying with statistics. Is it 50% of something or 50% of next to nothing? Answer: 50% of next to nothing. It went up 50% from 290 parts per million to 419 parts per million. That translates to an increase of 1.29 parts per 10,000. Teeny tiny! Insignificant!
Then you conflated biology with physics. Apples to oranges. You cannot compare LSD to greenhouse effect. LOL! Show me a lab experiment that demonstrates that adding 1.29 parts CO2 to 10,000 parts atmospheric air moves the thermometer. Does not exist.
“Teeny tiny! Insignificant!”
That’s what she said.
Those are purely your feelings of incredulity, Alex, but not actual valid arguments.
Make one atom iron or titanium, out of every 10,000 aluminum atoms, and you turn aluminum oxide into a dark blue sapphire.
Then it can abs.orb nearly all yellow in sunlight shining on it. And get warm as a result.
Alex asked –
“Show me a lab experiment that demonstrates that adding 1.29 parts CO2 to 10,000 parts atmospheric air moves the thermometer.”
You started waffling about sapphires!
What are you? A fanatical GHE cultist, or something?
Why do you need to do it in a lab, Swenson.
Why not just add it to the atmosphere and see what happens?
Oh, snap, we have already done that experiment.
bumbling bobby,
“Why do you need to do it in a lab, Swenson.
Why not just add it to the atmosphere and see what happens?
Oh, snap, we have already done that experiment.”
You are obviously not very bright, are you? As Feynman said “It doesn’t matter how beautiful your theory is, it doesn’t matter how smart you are. If it doesn’t agree with experiment, it’s wrong”.
You arent seriously claiming that increasing the amount of CO2 in the atmosphere makes thermometers hotter, are you? Referring to Feynman, Id have to say that you don’t have a theory at all, you are not very smart, and you have ho experiment anyway!
Feynman also said “one cannot prove a vague theory wrong.” Smart fellow – agrees with me. Irrelevant in your case, of course. You have no theory – vague or otherwise, as I mentioned before.
You don’t seem to be convincing many others that your IQ exceeds your shoe size by a significant amount, but feel free to demonstrate otherwise.
Swenson,
We have added CO2 to the atmosphere and the temperature has gone up.
That blows a hole in your 4.5 billion years of cooling hypothesis.
Because that hypothesis does not agree with facts.
The observed warming due to the increase in CO2 does agree with the Greenhouse Effect Theory.
We added CO2 to the atmosphere and the atmosphere got moar hotter moar better.
How does that Maypo taste?
Drooly, not too drooly, or too drooly?
You said “Why not just add it to the atmosphere and see what happens?
Oh, snap, we have already done that experiment.”
Your response is a perfect example of circular reasoning. You are assuming that the very thing being questioned is settled. Science 101: Correlation does not prove causation? First of all, we don’t know if temperatures have increased since the industrial revolution. The reconstructed data says NO warming. Oh snap! Even if there has been warming, we don’t know WHAT caused it. Only liars do. It could be the sun. What makes NO sense is the notion that a TEENY-TINY increase in CO2 would cause most of their claimed 1.2 degrees warming. Until you provide a confirmative lab experiment (there is none), there is no reason to believe that teeny-tiny can cause something. This is common sense.
“We infer that the efficiency of the sinks in absorbing CO2 from the atmosphere is decreasing at approximately 0.54 % yr−1.”
https://bg.copernicus.org/articles/16/3651/2019/
You specifically reference this article above and it shows efficiency of carbon sinks decreasing. But then you roll out and plug your overly simplified (undergrad thesis project level) model anyway? And you’ll carry on ignoring the impacts temperature is already having on climate disasters (ever heard of wild fires and land use change?) and carbon sinks (permafrost melt and the exponentially increasing methane concentration?)…
Interesting article on fossil fuels buying US Universities and influence in them
https://amp.theguardian.com/us-news/2024/apr/21/louisiana-state-university-oil-firms-influence
You’re providing plenty of evidence that they’re teeth are sunken deep into Alabama too!
Jimbo, you sound like you believe the cult’s alarmist crap. Obviously you’ve never studied the relevant physics. Before you freak out, you need to understand atmospheric CO2 can NOT raise Earth’s average surface temperature (288K).
Do you understand that simple fact?
I think you need at least a full primary school education to enter this conversation. Ask mum and dad before you use the internet next time ok?
Unfortunately Jimbo, you don’t “think”. If you used your brain you would realize this is about science, not cult beliefs and childish tactics.
Now once again, do you understand that CO2 can NOT raise the temperature of Earth’s 288K surface?
” I think you need at least a full primary school education to enter this conversation. Ask mum and dad before you use the internet next time ok?
Sound advice. Were you talking to yourself in a mirror?
Jimbo, please stop trolling.
Jimbo, I have to ask if this is a joke? You are attempting to insult Dr. Spencer with a trashy tabloid news media story that has zero relevance to his high quality scientific work. Do you know any science? Do you have anything of value to contribute to this topic?
tRAsHy TAbLoID NewS medIA
Op. Cit.
I am sorry Willard, but this is another example of children trying to participate in an adult conversation. First, the attempt to smear Dr. Spencer has no relation to the work he does. Second, the story does not accurately state the way the real world works.
The trash talk is coming from this source among others: Robert Mann, political commentator and former LSU journalism professor.
The official comment is this:
Asked to comment, the Institute for Energy Innovations director, Brad Ives, defended the partnerships, as did the oil majors. Two more companies have since entered into partnerships with the Institute for Energy Innovation, said Ives.
Ives of LSU said its Institute for Energy Innovation is no different to similar institutes across the US, including the Texas Bureau of Economic Geology, which performs research supported by corporate donors. I think researchers saying that somehow having corporate funding for research damages the integrity of that research is a little far-fetched, Ives said.
Asked about the relationship with the institute and industry, Karsten Thompson, the interim dean of the College of Engineering at LSU said: To me, its not a conflict at all. Its a partnership because theyre the ones that are going to make the largest initial impacts on reducing CO2 emissions.
Don’t be sorry, TS. Instead of being a mouthpiece for the industry, be informative and relevant:
https://thelensnola.org/2024/04/19/lsus-fossil-fuel-partnerships/
You can call them paRTerSHiP if you want.
Doesn’t change a thing.
Whacky Wee Willy,
“You can call them paRTerSHiP if you want.”
Have you gone quite mad?
Willard, please stop trolling.
Tim,
Are you saying your authority figures cannot be criticized?
Nate, I somehow thought you were a rational person. My apologies.
Willard, I am going shock you with some facts. Biofuels do not just grow on trees. They have to be chemically processed. Crude oil also has to been chemically processed. It turns out that the oil companies have some very talented people who are working on the production of Biodiesel and other fuels. The collaboration between these companies, that you fantasize as being evil, and the academic world is useful to provide various technologies and products for society.
Willard, there is hope for you. I suggest you move away from you keyboard for a brief time, go out into the world, and meet different people. The fact is that the world is very diverse. Your website based on stereotypes is not useful or productive. It does not represent reality. The various scientists and engineers who work for the oil companies are not evil people. They are making useful contributions to society.
Dear TS,
There is nothing shocking with your irrelevant listicle of factoids, nor with your unsollicited advice for that matter.
In return, for a guy who pretends to be intelligent, you don’t contribute much. Have you thought of carrying your weight on the Climateball field?
Just a thought.
Ta.
“Have you thought of carrying your weight on the Climateball field?”
Willard, please stop trolling.
If you are having these unpleasant thoughts about the claimed state of the Earth, then why comment, and why even bother to continue reading about climate change? Continuous exposure to it certainly does you no good.
“Youre providing plenty of evidence that theyre teeth are sunken deep into Alabama too!”
Jimbo, please stop trolling.
Jimbo,
From that link:
“We infer that the efficiency of the sinks in absorbing CO2 from the atmosphere is decreasing at approximately 0.54 % yr−1”
They deduce that from a trend with a noise level of 50% of the trend… Their endpoint is in 2016, with a strong El Nio…
Sorry, but one more year with a strong La Nia can change the results completely in the other direction…
The fact that Roy Spencer’s model above, with a single 50 year decay constant, must use 295 ppm as ‘equilibrium’ when ice core data shows it is lower, tells us that some fraction of the added CO2 more than 50 y ago persists far longer than expected for the single decay constant model.
The Bern model includes both short decay times, 1.2 y, 18 y, which account for the exchange with fast land and ocean reservoirs, and longer decay times 173 y, > 1000 y, for account for slower processes like deep ocean storage and mineralization.
Nate,
There is no “climate equilibrium”.
Climate is just numbers – the statistics of historical weather observations.
You may be a fanatical GHE cultist, unable to describe the GHE, or just an ignorant and gullible person who believes anything at all.
Which one are you?
[yes, that’s a gotcha. I grovel in mortification]
“There is no climate equilibrium.”
Declaring stuff again? Why?
Nate, so you believe that climate should be in equilibrium, why?
Nate,
When I wrote “There is no climate equilibrium”, you trolled “Declaring stuff again? Why?”.
You obviously have no appreciation of the way the scientific method works (you can look it up if you feel like it).
You apparently take no notice of the IPCC which states “The climate system is a coupled non-linear chaotic system, and therefore the long-term prediction of future climate states is not possible.”
If you are really seeking knowledge, and unable to find answers elsewhere, I will do my best to help. It’s my duty to assist those less capable than myself.
You may be a fanatical GHE cultist, unable to describe the GHE, or just an ignorant and gullible person who believes anything at all.
Which one are you? Let me know before asking me to explain things like the reason why “climate equilibrium” is just another nonsense phrase.
Carry on.
Regarding Dr. Spencer’s assertion that:
“The NASA studies showing ‘global greening’ in satellite imagery since the 1980s…”
Reading beyond the headlines you’ll find that:
rkady, in which countries is the green revolution occurring?
Certainly not in Africa, didn’t see any combine harvesters etc at work.
NASA study is about plant growth increasing, nothing to go with hippy dippy organic farmers.
“rkady, in which countries is the green revolution occurring?”
From the link I gave you:
Imagine how smart you’d be if instead of whining about “ hippy dippy organic farmers” you’d spend more time reading!
Arkady, why on gods green planet would I read any Nature article as they have fully signed up to the CAGW unscientific cult. They have been know to fail submissions that are even vaguely anti CAGW. When people have tweaked their work to be more compliant, hey presto, they get their submission accepted & published.
Your previous links all seems to be carefully selected to bolster your position.
Perhaps if you bothered to look at how Africa is benefitting from the slight increase in CO2 you would have a more balanced view of the world.
Ark, all of the reasons you supplied are “anthropogenic”.
Thanks for acknowledging mankind is greening the planet.
Notice that increased CO2 was not mentioned, which pokes a big hole in Roy’s assertion that greening and the CO2 sink rate are linked.
Ent, your belief that plants don’t use CO2 goes right along with your belief that passenger jets fly backward.
Hey Puffman,
Riddle me this –
https://bg.copernicus.org/articles/18/4985/2021/
Why are contrarians forgetting to mention that models underestimate browning?
“Why are contrarians forgetting to mention that models underestimate browning?”
Models?
Willard, please stop trolling.
EM,
“which pokes a big hole in Roys assertion that greening and the CO2 sink rate are linked”
What? Plants feed on CO2. Plants reproduce. Yes, they need more than just CO2, just like humans need more than just O2.
If you don’t believe that coal, oil, and gas are the result of plants extracting CO2 from the air, what is your explanation?
“Greening” is a measure of chlorophyll, expressed as leaf area.
What do leaves do in Autumn? They decay and return the absorbed CO2 to the atmosphere. Show me the evidence that
a) the increased greening is due to increased CO2 rather than increased temperature or more intensive agriculture.
b) that the increased greening has increased the land CO2 sink rate.
Let’s see evidence rather than simplistic opinions.
EM,
You wrote –
“Show me the evidence that . . . “.
Why would anybody do that? If you don’t believe what someone says, just demonstrate that they are in error.
If you don’t want to accept that plants don’t suffer if their food supply is restricted, that is your right. You don’t seem to like CO2 being added to the atmosphere, but you can’t seem to say why! Do you think restoring CO2 to previous levels will have adverse effects for humanity?
Seems like the sort of wishful thinking that fanatical GHE cultists indulge in.
Ent doesn’t understand biology, just like he doesn’t understand physics.
a) Ent doesn’t understand that plants make chlorophyll from CO2.
b) Ent doesn’t understand that plants make leaves and stems (cellulose) from CO2.
He’s also the one that believes passenger jets fly backward!
Worse yet, he can’t learn….
Again Clint can’t stay in his lane.
Plants make sugar and oxygen out of CO2.
They need other ingredients to make chlorophyll.
Namely nitrogen and magnesium.
Blundering bobby,
You wrote –
“Again Clint cant stay in his lane.
Plants make sugar and oxygen out of CO2.
They need other ingredients to make chlorophyll.
Namely nitrogen and magnesium.”
Plants make sugar and oxygen out of CO2? That would be a nifty trick.Even a simple monosaccharide contains quite a lot of hydrogen. Maybe you need to engage your brain before hammering your keyboard.
bobdroege, please stop trolling.
Just add water Swenson.
Yes I left that out.
Bumbling bobby at his usual finest. After trying to correct me, admits he was wrong (as usual) –
“Just add water Swenson.
Yes I left that out.”
Maybe bobdroege should think before playing his silly semantic games, trying to appear intelligent.
He’s the sort of fanatical GHE cultist who would write “Putting more CO2 between the Sun and a thermometer makes the thermometer read moar hotter moar better.”, trying to describe the GHE, and then eventually claim that he was only trying to be an annoying troll.
He still can’t describe the GHE, of course. What a dummy!
Arkady,
If you believe that putting CO2 back into the atmosphere is “bad”, do you have a reason based on science? If you don’t, you’ll just be seen as another fanatical GHE cultist – who can’t even describe the GHE!
How pathetic would that look?
See also the study of Kees Lepair, who independently came to the same results
https://www.clepair.net/oceaanCO2-4.html
And of course Peter Dietze already more than twenty years ago.
Excellent article. What will the alarmist say WHEN we do fall back into a glacial period?
‘We’ didn’t burn enough oil/coal?
No worries.
“Predicted changes in orbital forcing suggest that the next glacial period would begin at least 50,000 years from now.”
Probably should save our coal until then.
When will La Nina happen?
Nate,
You wrote –
“Probably should save our coal until then.”
Nothing stopping you, is there?
Save away. Feel free to starve while you freeze in the dark, metaphorically speaking.
richard williams
And what will YOU say if a giant magma chamber like these below Yellowstone or the Campi Flegrei near Naples, Italy, suddenly explodes?
Bonny,
You wrote –
“And what will YOU say if a giant magma chamber like these below Yellowstone or the Campi Flegrei near Naples, Italy, suddenly explodes?”
That would depend where he was, I guess. What do you think? It’s your gotcha, after all.
Corrolary: Net Zero already occurs at a global CO2 emission of 20 GtCO2/y.
Still dubious
Too many predictions here
I always bet against them
If CO2 greens the planet, plants will absorb more CO2
But if oceans get warmer they will absorb less CO2
“Too many predictions here
I always bet against them”
What? All of them? Even ones you disagree with?
Richard Greene
Correct.
*
By the way, 100% off topic: I recently read one of your comments at WUWT, ranting against anomalies vs. absolute data, even those published by UAH.
Here is a superposition of UAH’s absolute and anomaly data, in which the two series were shown ‘as is’ but of course relative to their respective mean, as they otherwise would differ by about 260 K:
https://drive.google.com/file/d/1zMrnVDsGrI63WWKdlKmt2ez_RWvNpyag/view
*
Now if you were to scale the anomalies to the interval of the absolute values, you would see exactly what you incomprehensibly disagree with.
Binny still thinks that he can make an effective point about the validity of data by just converting it to a different form.
One of the two kids hidden under Walter R. Hogle’s dad’s trenchcoat still thinks that mind probing is effective.
“One of the two kids hidden under Walter R. Hogles dads trenchcoat still thinks that mind probing is effective.”
You sound like you have both of your hands firmly down the front of your trousers.
Willard, please stop trolling.
Mike Flynn,
You sound like a silly sock puppet stuck on repeat.
Do continue, silly sock puppet!
Willard,
You continue to confuse Swenson with “Mike Flynn”.
Hogle
” Binny still thinks that he can make an effective point about the validity of data by just converting it to a different form. ”
Now you are the one who behaves like a dumb monkey.
I didn’t convert anything in the graph.
You apparently are not experienced enough to understand what the graph was about.
Hogle (2)
” You continue to confuse Swenson with ‘Mike Flynn’. ”
Willard didn’t confuse anyone.
You lack the historical experience needed to grasp that Swenson aka Amazed aka Mike Flynn are three pseudonyms of one and the same guy.
Walter R. Hogle says the darnedest things:
https://judithcurry.com/2016/05/01/climate-hustle/#comment-782714
Cheers.
Willard is a monkey.
Response from Binny trying to avoid addressing a commenter’s point –
“You lack the historical experience needed to grasp that Swenson aka Amazed aka Mike Flynn are three pseudonyms of one and the same guy.”
Willard, on the other hand, quotes Mike Flynn, pointing out that CO2 has no miraculous heating powers at all – for some bizarre reason known only to the feckless and peculiar Wee Willy. He has a habit of appealing to authorities who support me, rather than him.
Wonky Wee Willy has mastered the difficult exercise of putting his foot in his mouth, and then shooting himself in the foot!
Somewhat like his odd “description” of the GHE – “not cooling, slower cooling”. No wonder none of the GHE cultists are even prepared to come out and say that the GHE results in warming! Just look at their strenuous efforts to avoid reality.
I shouldnt take pleasure in watching the mentally disabled furiously gnashing their teeth while they tie themselves in knots because I refuse to use their preferred synonym, but I must admit to sniggering at their pointless efforts. Bad form, I know.
Still no GHE. Not even a tiny bit. The Earth has cooled to its present temperature, and the surface does so every night – losing all the heat of the day, plus a little of the Earth’s internal heat.
Mike Flynn,
Mike Flynn:
https://judithcurry.com/2015/02/24/naruc-panel-discussion-on-climate-change/#comment-678042
Silly sock puppet!
Cheers.
Response from Binny trying to avoid addressing a commenters point
“You lack the historical experience needed to grasp that Swenson aka Amazed aka Mike Flynn are three pseudonyms of one and the same guy.”
Willard, on the other hand, quotes Mike Flynn, pointing out that CO2 has no miraculous heating powers at all for some bizarre reason known only to the feckless and peculiar Wee Willy. He has a habit of appealing to authorities who support me, rather than him.
Wonky Wee Willy has mastered the difficult exercise of putting his foot in his mouth, and then shooting himself in the foot!
Somewhat like his odd “description” of the GHE “not cooling, slower cooling”. No wonder none of the GHE cultists are even prepared to come out and say that the GHE results in warming! Just look at their strenuous efforts to avoid reality.
I shouldnt take pleasure in watching the mentally disabled furiously gnashing their teeth while they tie themselves in knots because I refuse to use their preferred synonym, but I must admit to sniggering at their pointless efforts. Bad form, I know.
Still no GHE. Not even a tiny bit. The Earth has cooled to its present temperature, and the surface does so every night losing all the heat of the day, plus a little of the Earths internal heat.
I see that you wear Mike Flynn’s comment “Obviously, its in your trousers, and you have been playing with it far too frequently!” like a badge of honour. Good for you! Put both hands down the front of your trousers, and you could pleasure yourself twice as hard, I guess.
Or you could alternate hands, and get some other fanatical GHE cultist to give you a hand from time to time, so to speak.
[laughing at deranged fool]
Richard Greene,
You wrote “Still dubious”.
If that’s the best you can do your opinions certainly are.
We all can admire the incredibly high level of arguments when looking at genial replies to a comment posted by Entropic man.
Charles Jordan asked for the best CO2 level for plants, and Entropic man answered:
” For most of the last 2 million years the CO2 concentration has been 200ppm. ”
Genial replies:
1. Swenson aka Mike Flynn
” Oh really?
EM, please stop trolling. ”
2. walterrh03 aka Walter R. Hogle
” Entropic man is a MONKEY. ”
*
Yeah. That’s the ‘science’ level on this blog… no scientific contradiction is needed here!
*
I’m honest: I didn’t check for these ‘last 2 million years’.
But this picture below tells us that Entropic man can’t have been that wrong:
https://science.nasa.gov/wp-content/uploads/2023/12/co2-graph-083122_scaled_scrunched.jpg?w=1536&format=webp
*
And moreover, I never have seen any scientific contradiction to e.g. Joseph W. Chamberlain’s work:
1. Elementary, Analytic Models of Climate (1979)
https://ntrs.nasa.gov/api/citations/19790010343/downloads/19790010343.pdf
2. Theory of planetary atmospheres : an introduction to their physics and chemistry (in collaboration with Donald M. Hunten).
https://archive.org/details/theoryofplanetar0000cham
In these publications, Chamberlain clearly explains the role of CO2.
*
The only reactions to Chamberlain’s huge work came from this blog’s dumbest poster, Gordon Robertson, who of course never has read even anything of it, but was perfect in discrediting and denigrating.
Binny,
Apparently, Charles Jordan asked for the best CO2 level for plants, and Entropic man answered:
Entropic Man avoided the question, and hypothesised – For most of the last 2 million years the CO2 concentration has been 200ppm.”
Here’s a Canadian Government answer –
“The level of 1000 PPM CO2 is very close to the optimum level of CO2 required, given no other limiting factor, 1200 PPM, to allow a plant to photosynthesis at the maximum rate.”
Whom to believe? Even Stanford University has “How long will it be at the present level of CO2 depletion until most or all of life on Earth is threatened with extinction by lack of CO2 in the atmosphere? If humans had not begun to unlock some of the carbon stored as fossil fuels, less than 2 million years from today! Human emissions of carbon dioxide have saved life on Earth from inevitable starvation and extinction due to lack of CO2.”
You can believe some fanatical GHE cultists at NASA if you like.
To sum up, in general 1000 -1200 ppm seems optimal for most plants, and is employed in commercial greenhouses.
From a Nature scientific report –
“While recent studies have explored new crop-localised enrichment methods, burning fossil fuels and directly releasing the resulting CO2 into greenhouse air remains the most widely utilised method for CO2 enrichment.”
Increasing CO2 levels by burning fossil fuels. Win-win. If you can’t accept science and reality, don’t blame me.
Mike Flynn,
The Government of Manitoba is not the Government of Canada, a planet is bigger than the average greenhouse. And you forgot to mention that this optimality level is only for photosynthesis, with a very big ceteris paribus clause.
Are Aussies not supposed to have studied parliamentary systems in high school?
Silly sock puppet!
Flynnson
Prove this information wrong:
https://science.nasa.gov/wp-content/uploads/2023/12/co2-graph-083122_scaled_scrunched.jpg?w=1536&format=webp
instead of blathering and discrediting.
Wonky Wee Willard,
You wrote –
“The Government of Manitoba is not the Government of Canada, a planet is bigger than the average greenhouse.”
None of your silliness addresses the optimal level for CO2 for plant growth. You avoid the question entirely, because you are a fanatical GHE cultist, who can’t even describe the mythical GHE.
Oh dear, don’t you like reality? Go and create your own, if you wish. You can be wise and powerful, rather than ignorant and impotent.
Willard, please stop trolling.
Binny,
You must be supremely ignorant and gullible, if you unquestioningly believe that anyone (especially the fanatical GHE cultists employed by NASA) has actually measured atmospheric CO2 levels to produce the brightly coloured graphical nonsense to which you link.
It’s about as silly as blindly believing in a GHE which no one at all can describe.
Measurements are measurements. Can you provide any measurements to back up your silly NASA graphic? Next thing you’ll be asking me to “prove” that Trenberth’s NASA graphic showing a flat Earth with all continents simultaneously illuminated with the same intensity of sunlight is “wrong”!
Just how ignorant and gullible are you?
As usual, no proof for any mistake in NOAA’s graph; only arrogant and discrediting blathering stuff from the ignorant Flynnson boy.
Binny,
So you can’t produce any measurements to back up the NASA graph? Colour me unsurprised!
Notwithstanding the lack of data to support the NASA fantasy graphic, why do think it has any meaning or relevance?
Are you one of those people who is opposed to putting a portion of the CO2 sequestered by nature, back into the atmosphere? If you think CO2 is so evil, maybe you should stop exhaling it into the atmosphere with every breath.
You can’t describe the GHE, and you stated that the idea that increasing CO2 levels in the atmosphere would result in increased thermometer temperatures was, in your words “Nonsense”!
What are you trying to say, Binny?
Are you so short on facts that you are reduced to inanities like “only arrogant and discrediting blathering stuff from the ignorant Flynnson boy.”? Well, gee, that will convince people of your vast intellectual prowess, won’t it?
[laughing at Obersturmbannfuhrer Bindidon, trying to stop the rest of the population from enjoying the benefits of nature’s fossil fuel bounty]