
 Home/Blog
The Version 6.1 global average lower tropospheric temperature (LT) anomaly for April, 2025 was +0.61 deg. C departure from the 1991-2020 mean, up a little from the March, 2025 anomaly of +0.57 deg. C.
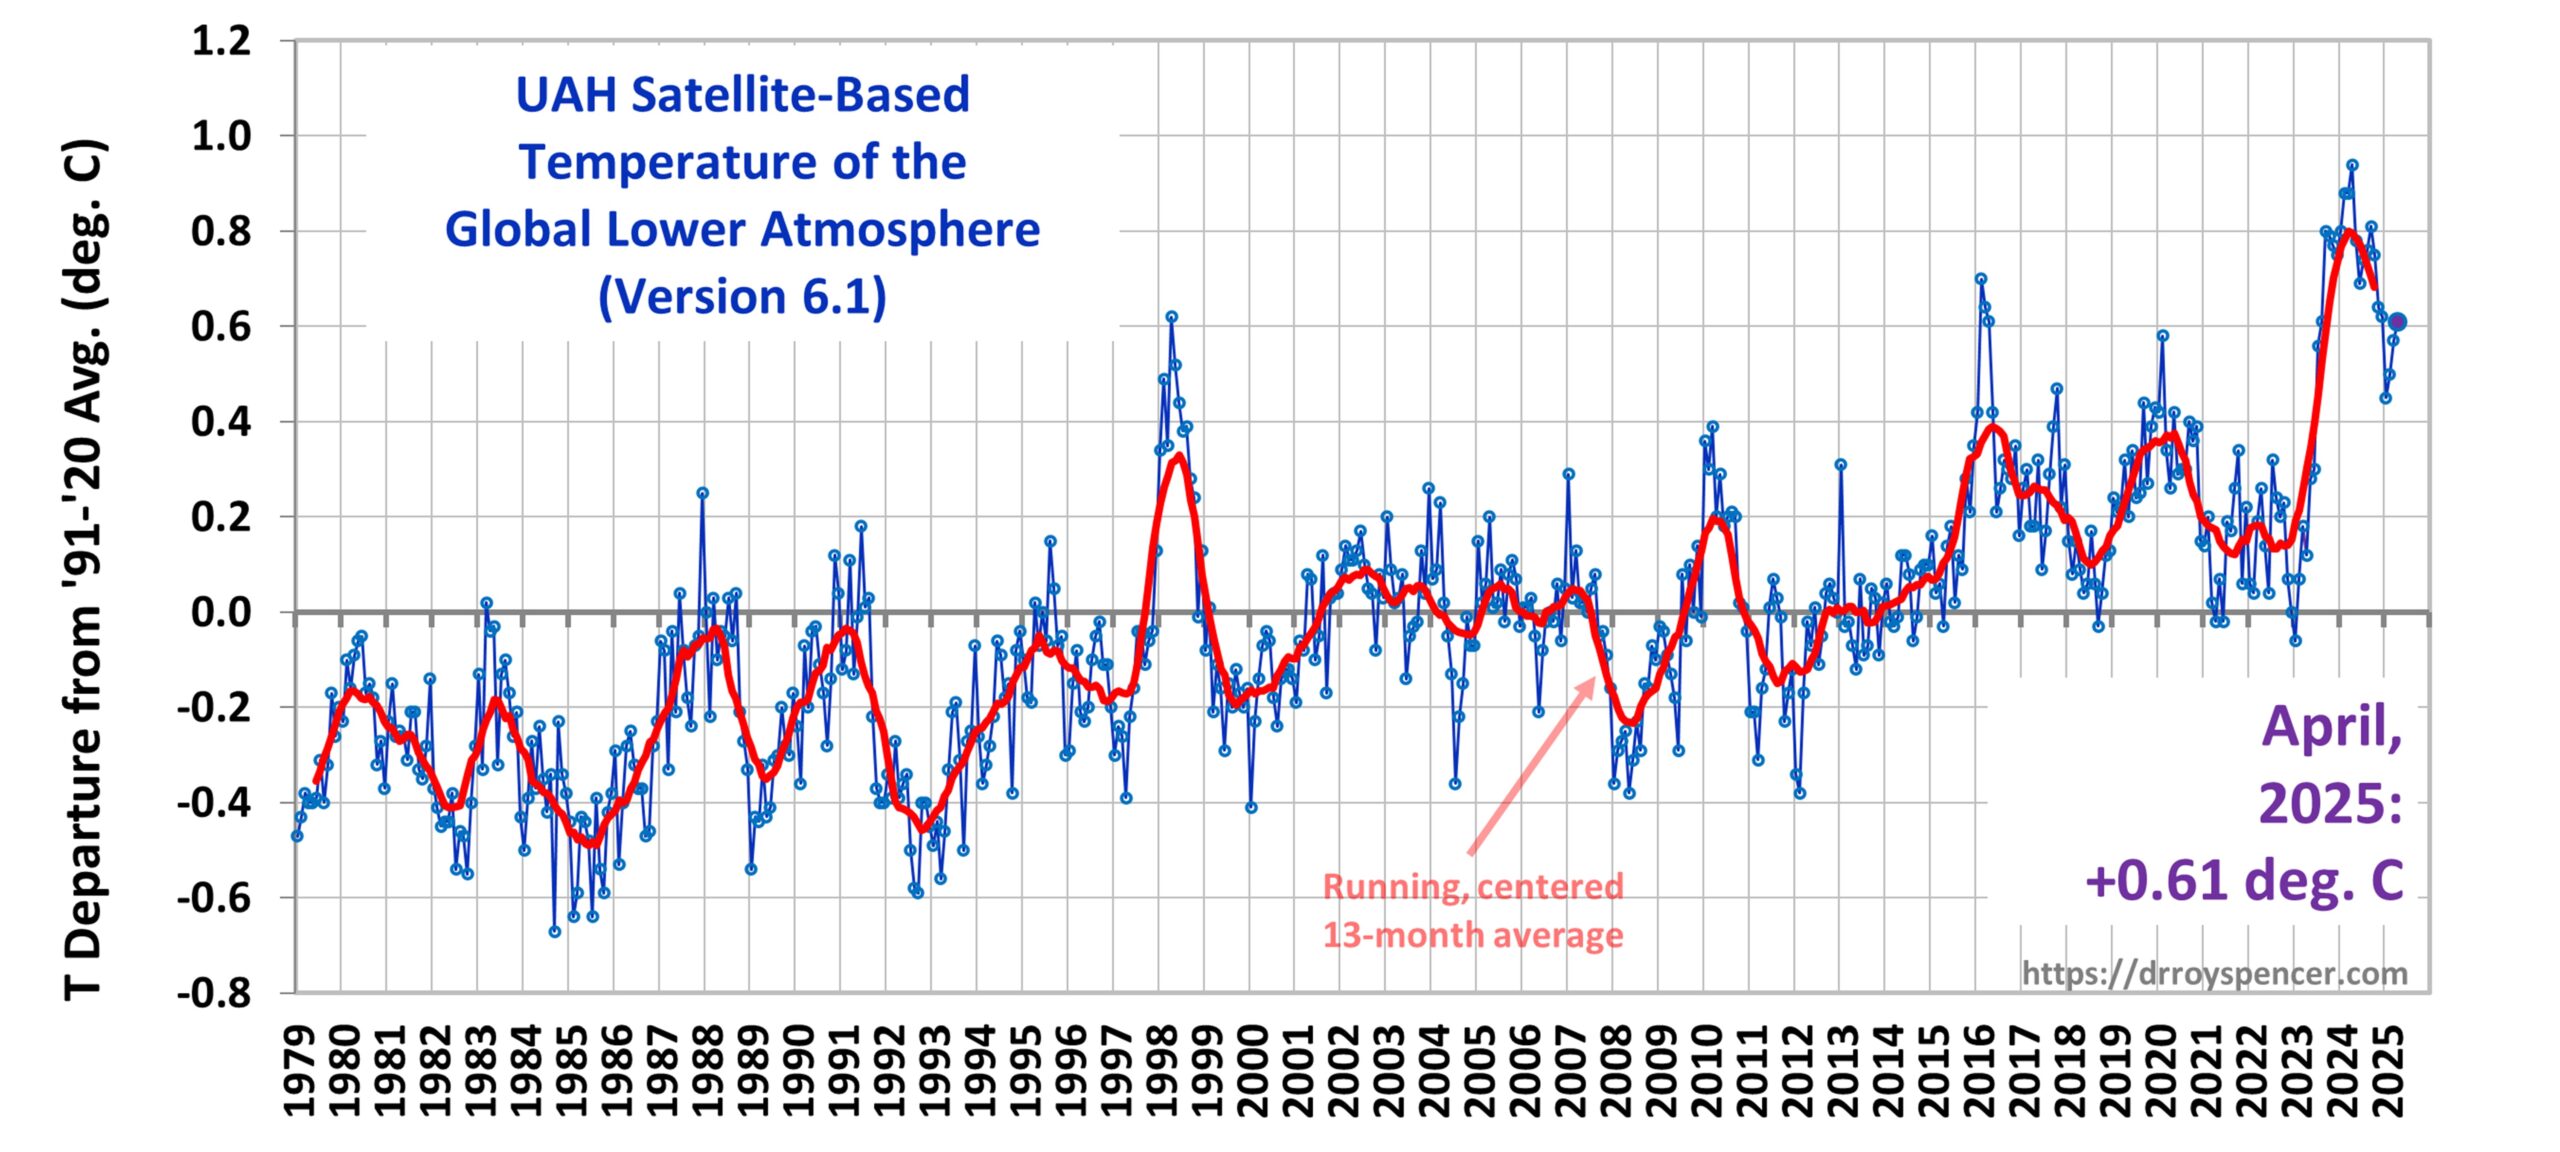
The Version 6.1 global area-averaged linear temperature trend (January 1979 through April 2025) remains at +0.15 deg/ C/decade (+0.22 C/decade over land, +0.13 C/decade over oceans).
The following table lists various regional Version 6.1 LT departures from the 30-year (1991-2020) average for the last 16 months (record highs are in red).
| YEAR | MO | GLOBE | NHEM. | SHEM. | TROPIC | USA48 | ARCTIC | AUST |
| 2024 | Jan | +0.80 | +1.02 | +0.58 | +1.20 | -0.19 | +0.40 | +1.12 |
| 2024 | Feb | +0.88 | +0.95 | +0.81 | +1.17 | +1.31 | +0.86 | +1.16 |
| 2024 | Mar | +0.88 | +0.96 | +0.80 | +1.26 | +0.22 | +1.05 | +1.34 |
| 2024 | Apr | +0.94 | +1.12 | +0.76 | +1.15 | +0.86 | +0.88 | +0.54 |
| 2024 | May | +0.78 | +0.77 | +0.78 | +1.20 | +0.05 | +0.20 | +0.53 |
| 2024 | June | +0.69 | +0.78 | +0.60 | +0.85 | +1.37 | +0.64 | +0.91 |
| 2024 | July | +0.74 | +0.86 | +0.61 | +0.97 | +0.44 | +0.56 | -0.07 |
| 2024 | Aug | +0.76 | +0.82 | +0.69 | +0.74 | +0.40 | +0.88 | +1.75 |
| 2024 | Sep | +0.81 | +1.04 | +0.58 | +0.82 | +1.31 | +1.48 | +0.98 |
| 2024 | Oct | +0.75 | +0.89 | +0.60 | +0.63 | +1.90 | +0.81 | +1.09 |
| 2024 | Nov | +0.64 | +0.87 | +0.41 | +0.53 | +1.12 | +0.79 | +1.00 |
| 2024 | Dec | +0.62 | +0.76 | +0.48 | +0.52 | +1.42 | +1.12 | +1.54 |
| 2025 | Jan | +0.45 | +0.70 | +0.21 | +0.24 | -1.06 | +0.74 | +0.48 |
| 2025 | Feb | +0.50 | +0.55 | +0.45 | +0.26 | +1.04 | +2.10 | +0.87 |
| 2025 | Mar | +0.57 | +0.74 | +0.41 | +0.40 | +1.24 | +1.23 | +1.20 |
| 2025 | Apr | +0.61 | +0.77 | +0.46 | +0.37 | +0.82 | +0.85 | +1.21 |
The full UAH Global Temperature Report, along with the LT global gridpoint anomaly image for April, 2025, and a more detailed analysis by John Christy, should be available within the next several days here.
The monthly anomalies for various regions for the four deep layers we monitor from satellites will be available in the next several days at the following locations:


Note the 10-year and 30-year moving averages over at https://datagraver.com/climate-data-set-uah/
They represent the important takeaway from the data. The short-term ‘noise’ is quite irrelevant from a CLIMATE perspective.
yet, without the monthly measurements, we would not have long-term averages. Kind of like living in a tiny town with 555 voters… would you say, “my vote doesn’t count anyway”?
Yes, I’m familiar with averages. Obviously we need measurements to calculate averages and I linked to a site that explicitly lists the UAH data as the input to the calculation of the averages.
The point I was making was that it is important to see the ‘forest’ (climate change) rather than the the ‘trees’ (monthly temperature fluctuations). I get the impression that many people commenting here don’t see the forest for all the trees, so to speak.
The current long term (think decades) global warming is around twenty times faster than the most rapid warming we’re aware of in Earth’s past, like the PETM and the deglacializations.
Just a slight rise which will fall in six years or so.
There is no significant warming since 1550 (the oldest tree rings I’ve seen). No proxies say that there is. Take NOAA’s 114 pristine stations, and we have no warming (at all) even over the last 20 years! It’s all cobblers.
Gladden,
Prior to 1979 UAH measurements, there were no decadal moving averages, let alone reliable globally averaged temperature measurements. On what did you base your claim of twenty times faster warming now than in any prior equivalently short time periods?
Ah, but without monthly numbers, people couldn’t get worked up into a froth about them on the regular, providing them with an opportunity to form communities and to ‘other’ their political opponents, providing a sense of belonging and superiority.
The 10-year averaging is rather interesting. The 30-year average is not much better that just taking the first year and the last year and drawing a line. There is no way to make any real sense out of 45 years of accurate data satellites, if the goal is to compare that to previous surface data. For example, there was the mini-warming in the 1930s and 1940s, and the genuine pause from about 1960 to 1990. There is no way to know what the satellite data might have shown if it was available.
The 10-year averaging is rather interesting. The 30-year average is not much better that just taking the first year and the last year and drawing a line. There is no way to make any real sense out of 45 years of accurate data from satellites, if the goal is to compare that to previous surface data. For example, there was the mini-warming in the 1930s and 1940s, and the genuine pause from about 1960 to 1990. There is no way to know what the satellite data might have shown if it was available in those years.
“The 30-year average is not much better that just taking the first year and the last year and drawing a line.”
You’ll get a fake trend, not an average.
“The 30-year average is not much better that just taking the first year and the last year and drawing a line.”
You’ll get a fake trend that way, not an average.
Gadden: you are ‘familiar with averages’ and then compare two derived rates from two completely different time periods that have entirely different temporal resolution. Sure, if the data sets are both from normal distributions, that MIGHT be OK, but even then, it’s going to impact the uncertainty in those averages, and that feeds much bigger uncertainty ranges in the rates of change.
Most skeptics doubt our modern data sets capture the full range of natural variability to determine what the ‘climate change’ signal is. Certainly with regards to any purported warming from fossil fuels.
I’ve yet to see any evidence natural variability is normally distributed, there is no plausible mechanism to think it would be, and yet it is a fundamental assumption comparing different data sets.
List NATURAL mechanisms realistically capable of warming Earth’s global multidecadal average temperature by one degree C over a century or so. Go!
Gadden, those might be the same “NATURAL mechanisms” that warmed Earth after all the ice ages, huh?
But rather than just throwing crap against the wall, why not explain from First Principles how 15μ photons from the atmosphere can warm a 288K surface?
Clint R,
The warming after the ice ages was indeed some of the most rapid global warming periods we know of in Earth’s past. However, even their MOST RAPID subphases were around twenty times slower than what’s happening over the recent 50 years, so try again. List natural mechanisms capable of producing anything like today’s warming.
And if you don’t know how increased CO2 can make Earth warmer, try Google. Or a textbook.
Sorry Gadden, but you’re still just throwing crap against the wall hoping something will stick.
It would take much more energy to warm Earth out of an ice age than to warm it “one degree C over a century or so”. So your desperate point, that this recent warming can not be natural, is bogus.
And trying to hide behind Google and unspecified textbooks is just lame. Obviously you don’t have a background in physics. You can’t explain from First Principles how 15μ photons from the atmosphere can warm a 288K surface? (Hint: They can’t.)
“List NATURAL mechanisms realistically capable of warming Earth’s global multidecadal average temperature by one degree C over a century or so. Go!”
Increased UV insolation of the oceans
Increased Geothermal output
“List NATURAL mechanisms realistically capable of warming Earth’s global multidecadal average temperature by one degree C over a century or so. Go!”
Increased UV dosing of the oceans
Increased Geothermal output
Nah. Been fully supported. Fully explained by both me and Barry.
Of course we understand that no evidence or logic will ever be good enough to alter your beliefs.
So we get complete departure from sanity and reality.
Nate suffers a complete departure from even remotely posting in the right place.
“There’s absolutely nothing I don’t understand about your story.”
Obviously false, since you keep absurdly saying that I am trying to ‘manipulate’ the RHTE.
And you keep trying to ignore the heat source.
If you understood any of this then you could tell us how you would incorporate the Sun’s heat into this problem instead of trying to ignore it!
“Every word I said was correct.”
Your absurd posts demonstrate the opposite.
“Nate, for the eighth time of asking,
please support your contention re the radiative heat transfer equation that both TH and TC can increase, so long as there is a heat source present.”
You cannot understand basic heat transfer as explained multiple times.
That is your problem.
The departure from competence continues.
… especially in many of the comments from DREMT and Clint R.
The “absolutely bonkers” (Nate term) Ball4 returns, absolutely out of the blue, for no reason at all.
Thus far you have offered no sensible rebuttal to these facts and logic that leads to our unavoidable conclusion.
Yet you avoid our conclusion by taking the position that, simply, facts and logic don’t work for you.
And yes there are math courses in which students learn to solve differential equations eg those that involve heat flow equations, and in solving these students learn that there are different boundary conditions.
Boundary conditions matter. A constant heat flux into one boundary is one example of a boundary condition, and a different result is obtain than if the boundary condition is a fixed temperature.
I doubt very much this will help you since you don’t do math.
But you can enjoy all sorts of videos about them.
https://www.google.com/url?sa=t&source=web&rct=j&opi=89978449&url=https://www.youtube.com/watch%3Fv%3D3pWXlPDGWcE&ved=2ahUKEwjnuM_MwLKNAxUJF1kFHV3oBcEQwqsBegQIKxAF&usg=AOvVaw1hblIev-yRr2KEEr48ubQg
You are deliberately posting in the wrong place.
Desperate times, I guess.
Can you just admit that you cannot find anything to support your claim that a heat source heating the Earth’s surface cannot increase its temperature TH and that of the atmosphere TC?
You mentioned that at night the suns heat is gone and the Earth surface TH cools.
Conversely we know that during the day with the sun out, both TH and TC rise.
So can you explain how this happens, given that no heat has been added to the RHTE?
Still posting in the wrong place!
Funny you should mention the Green Plate Effect, Nate. As I explained to barry, the GPE should help you understand that it “can’t be both”.
But, you can never admit when you’re wrong, so we’ll be here for another month or so, probably.
After all that, I then stupidly post in the wrong place, too!
Oh well. I take it back. Looks like Nate posting in the wrong place was not deliberate, after all. I do apologise.
And like clockwork, regardless of all his arguments proven wrong and/or absurd, he’ll still pat himself on the back in the last word.
You sure will, Nate. You sure will. I assume you were talking about yourself there, as we know you love trying to get the last word, and certainly your arguments were proven wrong and/or absurd by the simple fact that the Green Plate Effect shows even if we take the back-radiation warming/insulation mechanism as being “correct”, then the GHE still “can’t be both”!
Equal 3rd warmest April. Tied with 2016, and close to 1998. Easily the warmest non El Nino year.
Year Anomaly
1 2024 0.94
2 1998 0.62
3 2016 0.61
4 2025 0.61
5 2019 0.32
6 2020 0.26
7 2022 0.26
8 2005 0.20
9 2010 0.20
10 2017 0.18
My projection for 2025 increases slightly to 0.48 +/- 0.15C. This makes it more likely that 2025 will be warmer than 2023. I have is at about 75% that 2025 being the second warmest year. But again, given the unusual patters we are seeing at the moment, that should be taken with a large pinch of salt.
A similar month wrt ENSO history would be April, 2017, which was a whopping 0.43 lower.
It’s surpring that at this point in 2023 April was 0.5C colder.
Equal 3rd warmest April and warmest non-El Nino year. The ten warmest Aprils are now:
Year Anomaly
1 2024 0.94
2 1998 0.62
3 2016 0.61
4 2025 0.61
5 2019 0.32
6 2020 0.26
7 2022 0.26
8 2005 0.20
9 2010 0.20
10 2017 0.18
(Sorry if this is a repeated comment. I’ve posted twice before but neither showed up. I’m now trying a different browser.)
This is the equal 3rd warmest April. Tied with 2016. It is the warmest non-El Nino April.
Year Anomaly
1 2024 0.94
2 1998 0.62
3 2016 0.61
4 2025 0.61
5 2019 0.32
6 2020 0.26
7 2022 0.26
8 2005 0.20
9 2010 0.20
10 2017 0.18
The recent slight UAH increase is from tropical warming since January.
https://www.cpc.ncep.noaa.gov/products/analysis_monitoring/enso_advisory/figure02.gif
Of more interest is the faster NH trend than any other region.
https://i.postimg.cc/Y9tfd3H8/UAH-LT-Regional-Trends.jpg
“Of more interest is the faster NH trend than any other region.”
It is well-known that land surface warms faster than ocean surface. And it’s also well-known that the northern hemisphere has much more land than the southern hemisphere, so it’s hardly surprising that it warms faster.
S. George Philander
An accurate map is “reality”. Believing CO2 can warm the planet is a “belief”.
Beliefs ain’t reality.
The atmospheric greenhouse effect was discovered in the 19th century. Without it, Earth would be around 30 degrees C colder than it is. I suggest you read up on Fourier, Foote, Tyndall and Arrhenius.
Sorry Gadden, but it was more like “imagined”.
Imagination ain’t science.
If you can’t show how CO2 can warm Earth’s 288K surface, then you’re just mired in false beliefs.
It’s basic physics. See for example any atmospheric science textbook.
1. Earth receives sunlight such that it is not at absolute zero temperature.
2. Earth radiates infrared radiation (thanks to it’s nonzero temperature) towards space.
3. Greenhouse gas molecules in the air absorb some of the outgoing infrared radiation and then deliver that energy to the air, making the air warmer than it OTHERWISE would have been. (Without the greenhouse gases, the infrared radiation (and thus the energy contained therein) would go straight to space in a fraction of a second.)
Gadden,
Show us your evidence that this happening. Also, show your evidence that the Earth is a black body and that the emissivity is 0.95.
Gadden,
I don’t thing the Atmospheric Green House Effect has ever been discovered. It has been hypothesized. Can you provide some evidence that CO2 causes 59F of warming? Can you provide some evidence the Earth behaves as a black body? Can you provide some evidence that the Earth’s Emissivity is 1.
Gadden, you seem to be confusing “air/atmosphere” with CO2.
Earth’s emitted infrared can indeed warm the atmosphere (as does Sun). But CO2 is only about 0.04% of the atmosphere.
But the cult claims CO2 can warm Earth’s 288K surface. And, that’s wrong.
I’ve noticed a new trend amongst GHE proponents is to now argue that the GHE is the surface warming the atmosphere, via CO2.
As we know, no two GHE proponents can agree on a single definition of what the GHE actually is. Sometimes it’s the atmosphere warming/insulating the surface, via CO2, sometimes it’s the surface warming the atmosphere, via CO2. Sometimes it involves the “Effective Emission Height” and the lapse rate. Sometimes they try to combine that with one of the other explanations. Sometimes not.
And yes, we understand all the different versions of the GHE that have been proposed over the years. That’s how we know they’re all wrong. The fact that there are so many different versions of the GHE just shows that it’s ultimately all nonsense.
Now, lots of people can respond saying their “one true definition” of the GHE is the “correct”one.
When I put insulation in my house because of the cold Winters, I might say that the insulation keeps me warmer.
With insulation, warmer, without insulation, colder – insulation warms me.
But a thermodynamic nitpicker will validly say that it is the heater that warms me, not the insulation.
A third commentator might say that without the physical boundaries of the space (walls, floor, ceiling) the heater would do very little to keep me warm, so it is the environmental conditions that make me warmer.
With all this disagreement, it still remains the case that the addition of insulation makes for a warmer me on those cold nights with the heater on.
The physics works regardless of the description.
Nice try, barry…but no, that’s not it at all. There aren’t GHE proponents saying the Sun does the warming rather than the CO2, then others saying it’s the CO2. That’s not the dispute. There are actual different mechanisms posited for the GHE. Then the various GHE proponents don’t ever argue amongst themselves about it. You can see even in the comments so far just under this article alone, Gadden’s description of the GHE is not the same as Arkady’s. Although both involve the surface warming the atmosphere via CO2, which even in itself is not the normal way around!
If people out in the world use inexact analogies to explain some science, then the science must be wrong!
If critics us bad analogies to explain some science, and can easily knock those down, then the science must be wrong!
If people out in the world explain science in different ways, then the science must be wrong!
If the real science explanation relies on a lot of math that critics can’t follow, then the science must be wrong.
That is the usual crap being sold around here.
Where did “analogies” come from!? Not me.
And no, the fact that there are so many different versions of the GHE floating around isn’t the reason there’s no GHE. All versions of the GHE have been comprehensively debunked ad nauseam. That’s a separate issue, and one that won’t be re-discussed now.
No, the fact that there are so many different versions of the GHE floating around should just be a bit of a wake up call to anyone still believing in it in 2025.
Sorry, but arguing that the GHE is the surface warming the atmosphere via CO2 is completely and fundamentally different to arguing that the GHE is the atmosphere warming/insulating the surface via CO2. Trying to sweep such an obvious and massive difference under the rug, as if it’s nothing, is pretty disgraceful behaviour.
And, that’s what we’ve come to expect.
The two explanations are not mutually exclusive, just a different way of describing the flow of radiation and heat (two different properties).
Skeptics, on the other hand, come up with ‘reasons’ that the GHE isn’t real that are mutually contradictory.
Educated skeptics like Roy Spencer, Richard Lindzen, John Christie, Roger Pielke Snr, Anthony Watts, allagree that the GHE is real, and that all else being equal,more GHGs = more surface warming.
Only the cranks are left saying otherwise. This science is so well established it is taught in grade school.
“The two explanations are not mutually exclusive, just a different way of describing the flow of radiation and heat (two different properties).”
The two explanations I’m specifically calling out are the one from Gadden saying that the surface warms the atmosphere via CO2, and the other (the more typical GHE explanation) that generally says the atmosphere warms/insulates the surface via CO2. How can you say those two are not mutually exclusive!?
If you were referring to Gadden’s vs. Arkady’s explanation, sure, they’re not mutually exclusive, just very different. Not sure why it doesn’t bother you that people have such different explanations for an effect that is supposed to be both “settled science” and “basic physics”.
If science doesn’t make sense to you, chances are there is some gap in your basic science knowledge.
So if I put insulation in my attic, and my furnace is heating my house, then the insulation itself will get warmer than the outside air.
And my house will be warmer than without the insulation.
Either the GHE is the surface warming the atmosphere via CO2, or it’s the atmosphere warming/insulating the surface via CO2. Can’t be both. Make up your minds and stop trying to condescend to people that are more intelligent than you.
“Can’t be both”
Why not?
Just your gut feeling, we know.
“I’m specifically calling out are the one from Gadden saying that the surface warms the atmosphere via CO2…”
Well let’s see it then.
“Earth radiates infrared radiation (thanks to it’s nonzero temperature) towards space.
3. Greenhouse gas molecules in the air absorb some of the outgoing infrared radiation and then deliver that energy to the air, making the air warmer than it OTHERWISE would have been. (Without the greenhouse gases, the infrared radiation (and thus the energy contained therein) would go straight to space in a fraction of a second.)”
And what you call a contradiction…
“the other (the more typical GHE explanation) that generally says the atmosphere warms/insulates the surface via CO2.”
Both refer to the insulative effect of CO2 in the atmosphere.
The GHE warms both the surface and the (lower) atmosphere directly.
You’ve incorrectly mischaracterised these alternate explanations as either the surface warming the atmosphere, or the atmosphere warming the surface.
Note Gadden’s terminology. The land sends radiation to the atmosphere. Gadden describes the warming of the atmosphere due to GHGs, not the surface.
This explanation doesn’t contradict your ‘typical’ example, it is simply incomplete.
Nate and barry take contradictory lines of response, adding to the humour.
“contradictory lines of response”
Not at all.
Nate accepted that the two descriptions of the GHE were:
1) The surface warming the atmosphere via CO2.
2) The atmosphere warming/insulating the surface via CO2.
barry did not accept that. He said I was mischaracterising the descriptions as the above.
Now Nate says he and barry don’t disagree.
Hilarious!
Nah, just you lacking reading comprehension and seeking distraction.
We agree that the descriptions are not mutually exclusive.
We both agree that your “Can’t be both” has no logical rationale.
Well, that’s not true, Nate…you disagree on what I explained you disagree on.
And, obviously the two descriptions are mutually exclusive, so it “can’t be both”. That’s also why barry was trying to claim I was mischaracterising the descriptions rather than taking the line of response you are taking.
This is a nice example that you will simply say anything when defending your cause, though, so thanks for your dishonesty display.
The contradiction is all in your head, Clint.
The surface is on average warmer than the atmosphere, so in classical thermo the warmth flow if in the direction surface to atmosphere. Gadden doesn’t refer to that, he/she just refers to the radiation emanating from the surface intercepted by the atmosphere.
Gadden states correctly that the GHGs [and by collision other molecules] in the atmos absorb and re-emit radiation, causing the atmosphere to be warmer than if these GHGs were not there.
This is not in contradiction to the reality that the atmosphere also radiates downwards, adding to the sum of energy the surface receives.
The ‘greenhouse’ effect is the reason the surface emits more energy than is absorbed from the sun by the atmosphere. How can energy be added like this, in contravention of the 1st Law?
It is not a contravention. The atmosphere slows the rate at which heat escapes from the surface to space (via radiative processes). As the good Dr Spencer has pointed out many times, a warmed object gets warmer either by acquiring more energy, or by shedding energy at a slower rate.
There’s no contradiction here, just different descriptions focussing on different aspects on a dynamic process.
The surface IS responsible for sending IR at certain wavelengths that are readily intercepted by GHGs. GHG stake the warmth from the surface and absorbs it. Gadden is right.
The atmosphere then re-radiates in all directions including downward, making the surface warmer than it would be without GHGs.
Through all of this, the NET flow of energy is always from the heated surface to the cooler atmosphere. ‘Heat’ in the classic sense flows one way: the energy that radiation provides is emitted and absorbed in all directions.
Ah, so I’m no longer “mischaracterising” the descriptions. barry has walked back his previous line of response, completely, and silently switched to Nate’s line of response in saying that there’s no contradiction between 1) and 2).
Well, if the GHE is the surface warming the atmosphere via CO2 and it’s the atmosphere warming/insulating the surface via CO2, the obvious question is: why would the warming ever stop!?
That’s a rhetorical question, but I have a feeling barry will attempt an answer anyway…
“barry has walked back his previous line of response”
Nope, you’ve invented that along with the supposed contradiction.
OK, barry! Let’s settle it, then.
Are the 1) and 2) descriptions accurate, as Nate tacitly agreed, or are they mischaracterisations, as you said?
I fail to see how I mischaracterised anything, but that’s what you suggested.
I’ve already explained 1) and 2). You mischaracterised 1) in an attempt to make them mutually exclusive.
“You mischaracterised 1)”…
…so, you do disagree with Nate. Nate had no problem with either 1) or 2), he simply said they weren’t mutually exclusive. So, first of all, I’m correct that you and Nate disagree. Thanks for that.
Now, onto the supposed mischaracterisation of 1). Gadden said, of the supposed 33 K warming/insulation of the Earth’s surface due to the GHE, that:
“1. Earth receives sunlight such that it is not at absolute zero temperature.
2. Earth radiates infrared radiation (thanks to it’s nonzero temperature) towards space.
3. Greenhouse gas molecules in the air absorb some of the outgoing infrared radiation and then deliver that energy to the air, making the air warmer than it OTHERWISE would have been. (Without the greenhouse gases, the infrared radiation (and thus the energy contained therein) would go straight to space in a fraction of a second.)“
That’s all he said. That’s correctly characterised as “the surface making the atmosphere warmer via CO2/GHGs” as far as I’m concerned. Nate obviously thought so, too.
Dr Roys Emergency Moderation Team,
A warmer lower atmosphere would obviously make the surface warmer, if all other energy fluxes to/from the surface are unchanged.
You also need to understand that the GHE can be described at microscopic level (interaction between infrared photons and GH molecules, warming the troposphere and thus the surface) and macroscopic level (reduced net infrared radiation from Earth’s surface due to increased back radiation atmosphere-to-surface, causing warming of surface.
These explanations don’t contradict each other.
Sure, Gadden, the supposed 33 K GHE is the surface warming the atmosphere via GHGs, and it’s also the atmosphere warming/insulating the surface due to GHGs. There’s no contradiction, or problem, because you guys emphatically say so.
Faux controversy. No actual problem with the GHE has been identified.
This discussion isn’t about identifying problems with the GHE, as I already said. Nate’s dishonesty display continues.
Ok, once you figure out what your point is, if any, let us know.
As I said, the point is that the inconsistencies in the account of the GHE should be a wake up call to anyone still believing in it in 2025. It should be setting off people’s BS detectors.
After all, for years (decades even) what people questioned about the GHE was the idea of the upper, cooler levels of the troposphere warming or insulating the warmer lower levels, or the surface itself, via GHGs. It was always that idea of “cold warming hot” that people questioned. It’s like the GHE proponents have just turned around and said, “OK then…you know what, let’s just say the GHE is the surface warming the atmosphere, via GHGs, instead! Nobody cares so long as we’re saying CO2 causes warming, after all.”
And nobody does care. You guys can just say whatever you want. To hell with consistency! So long as “CO2 causes warming”, the description doesn’t seem to matter!
So to summarize your point, it would be:
“If people out in the world explain science in different ways, then the science must be wrong!”
No, Nate. I already went over this. If you cannot debate honestly, don’t bother to respond.
“The fact that there are so many different versions of the GHE just shows that it’s ultimately all nonsense.”
So you don’t agree with this anymore?
“for years (decades even) what people questioned about the GHE was the idea of the upper, cooler levels of the troposphere warming or insulating the warmer lower levels, or the surface itself, via GHGs. It was always that idea of “cold warming hot” that people questioned.”
Which just illustrated ignorance of basic heat transfer.
Again, insulation in my attic is cooler than my house, yet it can result in a warmer house!
“It’s like the GHE proponents have just turned around and said, “OK then…you know what, let’s just say the GHE is the surface warming the atmosphere, via
GHGs, instead! Nobody cares so long as we’re saying CO2 causes warming, after all.”
Again ignorance of how insulation works explains why someone would think this is somehow inconsistent.
The evidence is plain that T have been rising at both the surface and as we see above with UAH, in the troposphere. Which is predicted by the theory.
Which can be explained by
I stand by that (in its full, original context), and I stand by this:
“And no, the fact that there are so many different versions of the GHE floating around isn’t the reason there’s no GHE. All versions of the GHE have been comprehensively debunked ad nauseam. That’s a separate issue, and one that won’t be re-discussed now.
No, the fact that there are so many different versions of the GHE floating around should just be a bit of a wake up call to anyone still believing in it in 2025.”
Now, either start debating honestly, or stop responding.
And you say this
“the point is that the inconsistencies in the account of the GHE should be a wake up call to anyone still believing in it in 2025. It should be setting off people’s BS detectors.”
Only for people who are ignorant of basic heat transfer, and generally have no idea what they are talking about.
“All versions of the GHE have been comprehensively debunked ad nauseum.
Perhaps in your mind only. Not at all in reality.
Nate, Gadden wrote a summary of what he believed to be the GHE. He had first, condescendingly, written:
“The atmospheric greenhouse effect was discovered in the 19th century. Without it, Earth would be around 30 degrees C colder than it is. I suggest you read up on Fourier, Foote, Tyndall and Arrhenius.“
Then he wrote his summary of the GHE, which none of them would have agreed was a correct summary of the GHE:
“It’s basic physics. See for example any atmospheric science textbook.
1. Earth receives sunlight such that it is not at absolute zero temperature.
2. Earth radiates infrared radiation (thanks to it’s nonzero temperature) towards space.
3. Greenhouse gas molecules in the air absorb some of the outgoing infrared radiation and then deliver that energy to the air, making the air warmer than it OTHERWISE would have been. (Without the greenhouse gases, the infrared radiation (and thus the energy contained therein) would go straight to space in a fraction of a second.)“
Note that you wouldn’t find the GHE being described that way in any atmospheric science textbook, either. Now, I pointed out this inconsistency. Rather than simply agreeing, and maybe pointing out to Gadden that his summary was BS, you and barry jumped in to defend him, butting heads as you did so. You then lied about your disagreement with barry, and have been scrabbling about trying to dig your way out of the hole Gadden created ever since!
Nobody knows why you do this to yourselves.
“Note that you wouldn’t find the GHE being described that way in any atmospheric science textbook, either.”
Wrong. Nothing wrong with it.
And have you ever cracked an atmospheric science textbook?
No you have not. So why are you such nonsense?
Just can’t help yourself, can you, Nate?
Go on, then. Prove me wrong. Link to any online atmospheric science textbook with that as the GHE description.
Oh, wait. You already would have done so, if you could.
Let me help you out, Clint.
Clint: “Either the GHE is the surface warming the atmosphere via CO2, or it’s the atmosphere warming/insulating the surface via CO2. Can’t be both.”
Nate: ” ‘Can’t be both’
Why not?
Just your gut feeling, we know.”
barry: “You’ve incorrectly mischaracterised these alternate explanations as either the surface warming the atmosphere, or the atmosphere warming the surface.”
And
“You mischaracterised 1) in an attempt to make [1 and 2] mutually exclusive.”
My first response took the dichotomy as a whole and called it a mischaracterisation – the mischaracterisation was that the positions are mutually exclusive.
My second response pinpointed the mischaracterisation of Gadden’s remarks in your attempt to mutually exclude the 2 positions.
I hold that in the various descriptions someone could say the surface ‘warms’ the atmosphere in the classical thermo sense (heat flows that way), and then the GHE operates in the atmos. NB This was NOT what Gadden said.
But I think it is invalid to say the surface causes the atmosphere to be warmer than it would be without GHGs, which appears to be the mischaracterisation you appear to hedging at.
What Nate “tacitly” agreed with regarding your first condition in the remark quoted at the top of this post – which was what he was replying to – he can explain if he wants. For that is the only possible point of contention left standing here.
I know you relish disagreements among your intellectual adversaries, so I wish you the best of luck that Nate and I actually disagree. What fanfare should ensue!
Meanwhile, barry can’t even get my name right, let alone can he write a coherent comment.
Soz about mistaking you for Clint, DREMT.
And soz you couldn’t understand the post.
I’ve read your May 5th comment of 5:30 AM half a dozen times, and how I was supposed to know you meant:
“my first response took the dichotomy as a whole and called it a mischaracterisation – the mischaracterisation was that the positions are mutually exclusive”
from this:
“You’ve incorrectly mischaracterised these alternate explanations as either the surface warming the atmosphere, or the atmosphere warming the surface“.
I have no idea. I’m not a mind-reader. I can only go by your words…and your words suggested to me you were saying that both the 1) and 2) descriptions were mischaracterised. You then later confirmed you thought 1) was mischaracterised, which I took to be you silently dropping your objection to 2).
I still don’t know why you think 1) is mischaracterised. Perhaps it would help if you wrote, in a single sentence, how you would characterise Gadden’s GHE summary, instead.
So, just like Nate…when called upon to back up his BS, barry runs away.
Let’s quote Gadden yet again:
“2. Earth radiates infrared radiation (thanks to it’s nonzero temperature) towards space.
3. Greenhouse gas molecules in the air absorb some of the outgoing infrared radiation and then deliver that energy to the air, making the air warmer than it OTHERWISE would have been. (Without the greenhouse gases, the infrared radiation (and thus the energy contained therein) would go straight to space in a fraction of a second.)”
Gadden is saying GHGs warm the atmosphere.
The view you say is “traditional” is that the atmosphere warms the surface. What you mean, I presume, is that GHGs in the atmosphere warm the surface.
GHGs in fact cause both the surface and the atmosphere to be warmer than if there were no GHGs.
So there is no contradiction, just two incomplete, yet valid enough descriptions.
Your trick is to take these two descriptions, tweak the first and say 1) the surface warms the atmos 2) the atmos warms the surface.
Here is where you first clearly deviated from Gadden’s statement.
“Sorry, but arguing that the GHE is the surface warming the atmosphere via CO2 is completely and fundamentally different to arguing that the GHE is the atmosphere warming/insulating the surface via CO2.”
Gadden is NOT saying the surface is warming the atmosphere via CO2. That’s your twist. Gadden speaks of surface radiation intercepted by GHGs, and it is the presence of GHs that is the cause of warming, not some mumbo jumbo about the surface being the cause.
Every description of the GHE agrees that the primary source of IR for the greenhouse effect comes from the surface. Gadden simply articulated that. There is no contradiction.
“Your trick is to take these two descriptions, tweak the first and say 1) the surface warms the atmos 2) the atmos warms the surface”
Your trick here is to misrepresent me, leaving out the “via CO2/GHGs” that I included in both 1) and 2) from the very beginning. Even before I wrote them out to Nate as 1) and 2).
“Gadden is saying GHGs warm the atmosphere“
Too vague. That could include warming/insulation of the lower levels of the atmosphere from higher, cooler levels of the atmosphere, via GHGs, but Gadden makes no mention of that.
“The surface warming the atmosphere via GHGs” is more specific. And, it’s the correct characterisation of what he said. But, you just love to falsely accuse me of misrepresentation. Not even Gadden said I had misrepresented him. He just added to his summary, after the event!
“The view you say is “traditional” is that the atmosphere warms the surface. What you mean, I presume, is that GHGs in the atmosphere warm the surface.”
What I mean is what I actually said, not your misrepresentation. What I actually said was, “the atmosphere warming/insulating the surface via CO2/GHGs”. Which, once again, is the correct characterisation.
“This discussion isn’t about identifying problems with the GHE, as I already said.”
So its only about who said what, when and why, in this discussion. IOW it is about nothing of significance.
It is purely about DREMT tro.lling.
This thread should die of natural causes.
Unable to prove me wrong, Nate returns anyway to troll the thread by pretending I haven’t explained to him, twice already, what my point is.
And still no answer for
“‘Can’t be both’
Why not?”
Confirming that this thread has no point.
Yet DREMT will try to keep it alive indefinitely.
1) My point doesn’t actually rely on all these different descriptions of the GHE being mutually exclusive, in any case. It was barry who tried to introduce the idea that the descriptions should be mutually exclusive.
2) I did actually already suggest a reason why it “can’t be both”. Nate just obviously hasn’t been paying attention, again.
Nope. Nothing to see in this thread to support ‘cannot be both’. It has become quite pointless and boring.
Yes there is, Nate. If I point you to the comment, will you stop commenting for 3,650 days?
Or you could just scroll up and find it yourself.
No interest in more of your BS.
It’s already been explained why this is all about your ignorance of basic heat transfer.
Why are you responding, then? I never asked for your input. And, every single thing you’ve said has been worthless.
“It was barry who tried to introduce the idea that the descriptions should be mutually exclusive.”
Do you not understand the phrase you used?
“Can’t be both”
Or do you not know that this phrase is the very definition of mutual exclusivity?
“The two explanations are not mutually exclusive, just a different way of describing the flow of radiation and heat (two different properties).”
That was you, barry, introducing the idea that these descriptions needed to be mutually exclusive, long before I said “can’t be both”.
In fact, mutual exclusivity has nothing to do with my point. My point was simply that there are multiple different versions of the GHE out there, and that fact alone should be setting off people’s BS detectors. I think Gerlich and Tscheuschner documented 14 different versions of the GHE in their paper, and that’s different versions of the GHE from “official” sources, not just “people on blogs”. “People on blogs” obviously have many more different versions. And, G & T was 15 years ago now, so there’s been even more versions since then, from all sources.
Gadden brought up a silly version of the GHE, I was right to pick him up on it, and you and Nate wrongly jumped into defend him, bumping heads as you did so. Here we are, still.
DREMT,
It doesn’t matter if I knew what your premise was before you spelled it out – “Can’t be both” is the epitome of mutual exclusivity. That WAS your thrust. And if it wasn’t, do I get credit for making you take it up?
There are multiple explanations for many scientific phenomena that appear different, but are either different levels of complexity, or targeted for different audiences on complex subjects.
Thus, you can explain light using the ray model (optics), or wave theory, or quantum theory (photons).
Thus, you can explain gravity from Newton’s laws (force), or Einstein’s relativity (spacetime curvature) or quantum field theory (gravitons). Each of this has utility not only as explanations, but can be applied to concrete uses. Neither are ‘wrong’.
Thus, you can explain thermodynamic phenomena using classical thermo (to a point), or with statistical mechanics (discrete energy fluxes).
To argue that a scientific field is suspect because there are multiple different explanations for the same phenomena is simply to misunderstand science.
So, we have the “insulation” explanation of the GHE, where the word “trapped” gets used, even though it is an imprecise description of the action of radiative transfer.
This is a classical thermo explanation.
Then we have the “back radiation” explanation, where the sum of radiation from the GH atmosphere and insolation determines the average temperature of the surface.
This is a statistical mechanics explanation.
Then we have the “emission altitude” explanation, which goes into more detail, adding the complexity of radiative/convective physics to the description.
This is applied thermodynamics, incorporating lapse rate, radiative transfer and convection.
THEN you get internet explanations from people who are not experts, but repeat in part or in full what they’ve read.
Gadden’s explanation did not mention the surface warming the atmosphere at all, whether with or without CO2 as a mechanism. That was your twist. Gadden specifically said that the surface radiated IR, which was then intercepted by CO2 in the atmosphere, which then warmed the atmosphere. An incomplete, but not incorrect description.
His description is not incompatible with saying radiation from the surface is intercepted by GHGs, and some of it redirected downwards, warming the surface.
On the contrary, both the atmosphere and the surface are warmed by GHGs. YES, it can be both – if you characterise these views accurately, instead of cooking up a fake mutual exclusivity.
Just noticed this from upthread…
“So, just like Nate… when called upon to back up his BS, barry runs away.”
Schoolyard taunts. Really?
I reply when I have time. Maybe you don’t have a job?
They’re different mechanisms, barry. All the various different descriptions of the GHE. Different mechanisms. Nice waffling screed, but still doesn’t address my point. You can’t, because I’m right.
And, I stand by my “can’t be both”. I explained why, as well. In a comment to you…and, you never responded to that part of the comment.
No point pursuing that line, though, because you’re still falsely accusing me of misrepresenting Gadden.
Ridiculous.
“They’re different mechanisms, barry.”
No. The mechanism is always the same – the absorp.tion of IR. The differing general descriptions have different degrees of complexity, and/or differing analogies.
“And, I stand by my ‘can’t be both’.”
Good for you!
“you never responded to that part of the comment”
Yes I did, more than once, when I pointed out you tried to create a false mutual exclusivity.
Gadden did not say the surface warms the atmosphere via CO2. That was, and remains, your spin.
Quote the exact bit where Gadden says the surface warms the atmosphere. You can’t. Because all you can quote is them saying that the surface gives off radiation.
“waffling screed”
Nope. I pointed out several well-known examples of scientific phenomena being described in different ways or through different lenses. Direct rebuttal to your contention that having multiple explanations means the phenomenon is phony.
I then gave three alternate explanations of the GHE that are all valid, and at different levels of complexity, describing the lenses through which the differing descriptions were viewed.
Either you can’t understand a cogent rebuttal or it’s too well argued for you to dismantle.
“waffling screed” = I just want to dismiss it with no effort.
barry, it’s a Gish gallop, again. So many different things wrong, not enough hours in the day.
One thing at a time. I have not misrepresented Gadden. I’m so sick of hearing from you that I’ve put “spin” on what he said. I’ve been completely honest, throughout. I explained why I think my characterisation is correct. I’m not interested in us endlessly repeating ourselves.
Since you cannot accept that it is the correct characterisation, you will not understand that you haven’t responded to my explanation of why it “can’t be both”.
“The mechanism is always the same – the absorp.tion of IR.”
There’s quite a lot more to the mechanism of a typical GHE version than just “the absorp.ton of IR”, barry. You’ve just taken the only common thing between the various mechanisms posited and declared it’s the totality of the mechanism!
Most GHE descriptions are “top down” – in other words, it’s higher levels of the atmosphere warming/insulating lower levels of the atmosphere/the surface itself, via GHGs. Like it or not, Gadden’s description is “bottom up” – it’s the surface warming the atmosphere via GHGs. It really is a fundamentally different mechanism being proposed, here.
I think you understand that the GHE cannot be both a “top down” phenomenon and a “bottom up” phenomenon. This is why, rather than deal with the contradiction and the rather obvious problem of “if it were both, why would the warming ever stop?”, you keep instead asserting that I’m misrepresenting Gadden. That way, you get to put words in Gadden’s mouth yourself, describing a version of what you think he means that you can then claim doesn’t contradict the “top down” description.
Whether you do that knowingly, in other words, “with intent to deceive”, or whether you’re just fooling yourself, I’m not sure. If you would do me the courtesy of assuming that I’m genuine, I would be more inclined to return the favour.
“Note that you wouldn’t find the GHE being described that way in any atmospheric science textbook, either.”
Nonsense. The GHE is explained as warming the atmosphere as well as the surface. Here, from the EPA.
“The Earth gets energy from the sun in the form of sunlight. The Earth’s surface absorbs some of this energy and heats up. That’s why the surface of a road can feel hot even after the sun has gone down—because it has absorbed a lot of energy from the sun. The Earth cools down by giving off a different form of energy, called infrared radiation. But before all this radiation can escape to outer space, greenhouse gases in the atmosphere absorb some of it, which makes the atmosphere warmer.”
That is practically what Gadden wrote. There is an additional sentence in that paragraph.
“As the atmosphere gets warmer, it makes the Earth’s surface warmer, too.”
https://archive.epa.gov/climatechange/kids/basics/today/greenhouse-effect.html
As I said, Gadden’s description isn’t wrong or contradictory, it is simply incomplete.
Here’s another one:
“Remember that the surface radiates the net equivalent of 17 percent of incoming solar energy as thermal infrared. However, the amount that directly escapes to space is only about 12 percent of incoming solar energy. The remaining fraction – a net 5 – 6 percent of incoming solar energy – is transferred to the atmosphere when greenhouse gas molecules absorb thermal infrared energy radiated by the surface. When greenhouse gas molecules absorb thermal infrared energy, their temperature rises.”
https://earthobservatory.nasa.gov/features/EnergyBalance/page6.php
This source also goes on to say that the warmer atmosphere radiates groundward, causing the surface to heat up.
The defining mechanism of the greenhouse effect is the absorp.tion of infrared radiation by greenhouse gases. A complete explanation of every flow-on effect could fill several chapters, including radiative-convective changes, a changed lapse rate with increased GHGs, how molecular absorp.tion works, pressure broadening of IR absorbent molecules and the ‘wings’ of these molecules, transfer of energy by molecular collision, the vertical structure of the atmosphere and the rising emission altitude (TOA), statistical mechanics….
The GHE is complex. People describe it by analogy, or describe a portion of the effect for brevity.
This gives you the opportunity to make a dopey claim that because there are different explanations, the science must be suspect.
But many phenomena are explained in various ways through various lenses and at different levels of complexity,depending on the audience. However, only the GHE seems to excite controversy in your mind for this.
I mean, it is a really weak argument – that the science is suspect because of variations in the explanations of it. If that is the case, then relativity theory is complete bunkum. So is quantum theory.
“I think you understand that the GHE cannot be both a “top down” phenomenon and a “bottom up” phenomenon.”
This is a faux contradiction. The radiative environment of the GHE depends on emissions from the ground to the atmosphere, and from the atmosphere in all directions, including groundward. It’s a constant interchange, not an either/or.
So, barry:
1) Proves that Gadden’s explanation cannot be found in any atmospheric science textbook, just as I said. It’s missing the part where higher, cooler parts of the atmosphere warm lower, warmer parts of the atmosphere, or the surface itself, via GHGs. Thanks, barry.
2) Reiterates his false claim that “absorp.tion of IR” is the totality of the GHE mechanism.
3) Says that the GHE is very complex, contradicting Gadden’s claim that it is “basic physics”.
4) Says that my argument is “dopey” and “weak” whilst falsely comparing the GHE to entire fields of science such as quantum mechanics.
5) Falsely compares the “top down”/“bottom up” contradiction to transfer of IR radiation rather than the warming I’m talking about. I’m aware that IR radiation is transferred between the surface and atmosphere, and vice versa, barry. That’s not the problem. Try again.
Let’s assume that Gadden was correct that his “bottom up” view of the GHE really was the whole thing – that he wasn’t missing the most contested part of it.
If that had been what was presented to me from the beginning of my time learning about the GHE, then I might not initially have questioned it at all. After all, the warming is in the “right” direction. No need to worry about any “2LoT violations”.
I would have eventually questioned it, though, based on:
a) How it could be responsible for 33 K of warming when the atmosphere also cools to space via GHGs.
b) How the surface itself could be warmer than it would otherwise be if it’s warming the atmosphere via GHGs.
“Let’s assume that Gadden was correct that his “bottom up” view of the GHE really was the whole thing.”
But it’s not the whole thing. It’s just one part of the whole.
However, it’s now clear how you constructed the false dichotomy.
Gadden spoke in terms of radiative transfer, not heat in the classic thermo sense, which you are trying to squeeze his remarks into.
He says “infrared radiation” from the surface.
You say “warming” from the surface.
Not the same, DREMT.
I thought we established long ago that EM radiation isn’t heat.
And you’ve danced away from two-way radiative transfer for some years now, even though you’ve been shown it in online texts and at MIT.
Still stubbornly trying to shoehorn your purblind view of the matter.
“But it’s not the whole thing. It’s just one part of the whole.”
Gadden presented it as the whole of his GHE explanation. He only added to it later, when rightfully called on it. Gee whizz you guys go to the ends of the Earth to defend each other.
“Gadden spoke in terms of radiative transfer, not heat in the classic thermo sense, which you are trying to squeeze his remarks into. He says “infrared radiation” from the surface. You say “warming” from the surface.”
No, barry. I have correctly characterised his explanation of the GHE as “the surface warming the atmosphere via GHGs”. He mentions IR radiation from the surface being absorbed by GHGs and the air being warmer than it would otherwise be, as a result.
“I thought we established long ago that EM radiation isn’t heat.”
I did. Yet you keep trying to treat it as though it were heat. Whilst falsely accusing me of doing the same! Funny. Then you accuse me of dancing away from two-way IR radiation transfer. Another false accusation.
barry, the GHE cannot be the surface warming the atmosphere via GHGs and the atmosphere warming/insulating the surface via GHGs. That would be IR radiation transferred between the two getting treated as though it were heat!
“I’m aware that IR radiation is transferred between the surface and atmosphere, and vice versa, barry. That’s not the problem. Try again.”
Good. Then it should be no problem for you to understand why if the atmosphere gets warmed by radiation from the surface via CO2 abs.orption, then in turn the surface will be warmed by radiation from the (warmer) atmosphere, which is a characteristic of insulation.
Again, nobody has a problem understand that our body warms our blanket, and yet our blanket warms our bodies.
Nate explodes back onto the scene out of absolutely nowhere, utterly incapable of staying away.
We can all understand the idea of IR radiation flowing two ways, both from the surface to the atmosphere and from the atmosphere to the surface. Of course, if both atmosphere and surface are supposed to warm as a result, we can only conclude that both streams of IR radiation are being wrongly treated as “heat”.
“Explodes”?? Hardly.
Again, nobody has a problem understanding that our body warms the blanket.
Yet the warmer blanket is what our body must now cool to, instead of the cold air, and thus we feel warmer with the blanket.
This is the basic operation of insulation.
When CO2 abs.orbs IR from the surface, Gadden is correct that it must warm the atmosphere.
And as he noted, the warmer atmosphere, to which the surface now cools to, will
make the surface warmer.
Yet only DREMT has a problem understanding this.
It’s just not difficult
Nate, why bother repeating yourself?
Yes, I understand what you’re saying. That’s how I know it’s wrong. I explained why it’s wrong, and you had no response except to repeat what you had said previously!
Just leave me and barry to it. You’re obviously worn out from too many arguments. You’ve offered absolutely nothing worthwhile to this discussion.
“Yes, I understand what you’re saying.”
Good, cuz it should be easy to understand.
“That’s how I know it’s wrong.”
Oops!
” I explained why it’s wrong”
OMG. No you didn’t.
I understand how insulation works, but this:
“Then it should be no problem for you to understand why if the atmosphere gets warmed by radiation from the surface via CO2 abs.orption, then in turn the surface will be warmed by radiation from the (warmer) atmosphere, which is a characteristic of insulation.”
ain’t insulation. It’s a two-way exchange of IR radiation. And, in any two-way exchange of radiation between “things”, both “things” do not get warmer as a result. Because, if they did, that would be “heat” getting transferred in two directions at once.
I have now explained why you’re wrong, twice.
“And as he noted, the warmer atmosphere, to which the surface now cools to, will
make the surface warmer.”
You have had years to learn that there are two temperatures in the basic radiative heat loss equation. TH and TC.
Same goes for convective heat loss from the surface.
If TC increases than the heat loss from the surface is now reduced.
Same heat input.
Even very slow learners could figure out that results in a warmer
surface.
“You have had years to learn that there are two temperatures in the basic radiative heat loss equation. TH and TC”
Indeed. TH will be the surface, TC the atmosphere. As all agree, there is radiative exchange between TH and TC. The problem is, you have stated that as a result of this exchange, both TH and TC will be warmer. That’s quite obviously not how it works, Nate. That would involve “heat” being transferred in both directions!
Keep trying to walk back what you said whilst being condescending, though. Most amusing.
“Indeed. TH will be the surface, TC the atmosphere. As all agree, there is radiative exchange between TH and TC.”
Good, but you left out the key part that TC is warmer.
“The problem is, you have stated that as a result of this exchange, both TH and TC will be warmer.”
Yep just as when I put on a blanket with TC, it gets warmer because my heat warms it, and because now TH-TC is less, my heat loss is reduced, and my skin gets warmer!
“That’s quite obviously not how it works, Nate. That would involve “heat” being transferred in both directions!”
Wrong!
Obviously it is how it works with the blanket, where heat is only transferred from TH to TC.
WRONG. Because you IGNORE that there is heat source heating TH–in both cases.
source
This was your statement, Nate:
“Then it should be no problem for you to understand why if the atmosphere gets warmed by radiation from the surface via CO2 abs.orption, then in turn the surface will be warmed by radiation from the (warmer) atmosphere, which is a characteristic of insulation.”
No mention of a “heat source” there, is there?
You are responsible for your own words. Not me. What you wrote is wrong, for the reasons I have explained.
We can get onto your new “heat source” story once you’ve admitted you were wrong with your original story.
“No mention of a ‘heat source’ there, is there?”
Because the focus was on the interaction between surface and atmosphere,so that’s what was talked about.
As well all well know that the sun is the ultimate source energy, we argue in good faith that it doesn’t need to be repeated while we look at one aspect of the radiative transfer.
But when a correspondent seems to forget this part of the equation – as you did – then we remind. And then you think you are saying something salient when you complain this was ‘missing’ from the argument.
This is the kind of thing you say when you’ve run out of ideas.
You’re trying to make me responsible for Nate’s words, barry. I’m not, though.
What Nate said was wrong, for the reasons I explained. I want him to admit that, before I continue.
Of course, I have a response in mind for his new “heat source” story. But first, I want him to admit his original story was wrong.
Yep, DREMT has nowhere to go with this argument. He has to admit that there is no problem with the heat flow in the GHE.
But he will as always try to distract.
“Because you IGNORE that there is heat source heating TH–in both cases.”
I left it out earlier, wrongly assuming that DREMT was aware of it already.
Naturally DREMT wants to try to score imaginary points off of this omission.
But regardless, the sun is there as the heat source of the Earth’s surface.
And there is just no getting around this fact.
As always, Nate lacks the maturity to admit when he’s wrong. He doesn’t want to be held accountable for his own words in the same way that I am.
Meanwhile, the question is obvious – Nate and barry want to introduce the Sun into the radiative heat transfer equation…but, where does it go? The equation only has TH and TC, and those are already “in use” with the surface and the atmosphere, respectively. This is where “the science” ends, and Nate and barry just plain start making stuff up…
“Nate and barry want to introduce the Sun into the radiative heat transfer equation…but”
Nobody said the sun was part of radiative heat transfer equation between the Earth surface and the atmosphere. But it is part of the energy balance equation. It IS responsible for heating the Earths surface.
Just as my body is the heat source with the analysis of the blanket insulating.
Just as the furnace is the heat source in analysis of heating a home.
Are you really going to pretend that you weren’t aware of the sun and the role it plays here?
See what I mean? They just make it up as they go along. They won’t support any of it with a physics text. It’s all just argument by analogy, and gaslighting (e.g. “you’re stupid if you don’t understand that…”)
“Nobody said the sun was part of radiative heat transfer equation between the Earth surface and the atmosphere.”
Oh, good. In that case this:
“You have had years to learn that there are two temperatures in the basic radiative heat loss equation. TH and TC. Same goes for convective heat loss from the surface. If TC increases than the heat loss from the surface is now reduced. Same heat input. Even very slow learners could figure out that results in a warmer
surface.”
is consigned to the dustbin, where it belongs.
“But it is part of the energy balance equation“
The what now!?
OMG,
You earlier:
“Indeed. TH will be the surface, TC the atmosphere. As all agree, there is radiative exchange between TH and TC.”
Now, all “is consigned to the dustbin, where it belongs”
Stuck in a pickle, you just start wildly denying everything, common sense, physics, even that the sun is a heat source.
What next? Your mother is not your mother?
Sorry that there is a GHE, and you
havent found anything wrong with it.
Are you having a stroke, Nate? Where did I deny the Sun was a heat source?
There is a two-way radiative exchange between the atmosphere and the surface. The radiative heat transfer equation, with TH as the surface and TC as the atmosphere, makes it perfectly clear that both TH and TC will not increase. That would violate both 1LoT and 2LoT.
That should be the end of it. That proves my “can’t be both” is correct.
But, instead, you introduce your “heat source” story. Where, oh where, in any physics text in the land, does it state that the presence of a heat source means that both TH and TC can increase!?
Support your BS.
“The radiative heat transfer equation, with TH as the surface and TC as the atmosphere, makes it perfectly clear that both TH and TC will not increase.”
How so? Where is it in the equation telling you any such thing?
While you’re at it, explain why with the blanket both TH (the skin of a person) and TC (the blanket) both warm?
Why doesn’t it imply that heat is flowing from TC to TH?
As the equation shows, Q decreases as the hot “thing” cools by transferring “heat” to the cool “thing”, which “warms”. That’s the way “heat transfer” works. Q tends towards zero. Only TC should increase. If both TH and TC were to increase as the result of a two-way radiative exchange, energy would have to be created (violating 1LoT) and TC would have to be warming TH (violating 2LoT).
This is where you now introduce your “heat source” as an input to TH…but there is no room for it in the equation…so, you just start making stuff up.
DREMT,
If we are unable to find a physics textbook reiterating Gadden’s remarks – that CO2 warms the atmosphere – what would you conclude from this?
That Gadden is wrong?
That CO2 does not make Earth’s atmosphere warmer than without CO2?
What would be your conclusion here?
Gadden’s remarks are correctly characterised as “the surface warming the atmosphere via GHGs”.
This is what I asked you guys to support, re the radiative heat transfer equation:
“Where, oh where, in any physics text in the land, does it state that the presence of a heat source means that both TH and TC can increase!?”
Do so, or concede I’m correct that it “can’t be both”.
I haven’t been able to find an online copy of a textbook on atmospheric physics. If you know of one that I can link to, please let me know.
If I understand you correctly, if I find a textbook saying that the GHE makes the surface warmer, but not the atmosphere warmer (via CO2/GHGs), then you will conclude the latter is incorrect, reading to “it can’t be both.”
If I found 2 textbooks on atmospheric physics and both propositions were iterated in one and the other, but not both, would you then agree it “can be both?” Or do you need both propositions to be in one textbook?
Just don’t want the rug pulled out from under me if I make the effort.
I have said twice what I want you to support. It does not have to be an atmospheric physics text. Any physics text will do. Go to the section on radiative heat transfer. Find the radiative heat transfer equation. Find anything to support the contention that with a heat source present, both the TH term and the TC term can increase in a radiative exchange. That is what you guys have to support. That’s now the third time I have asked.
“As the equation shows, Q decreases as the hot “thing” cools by transferring “heat” to the cool “thing”, which “warms”. That’s the way “heat transfer” works. Q tends towards zero. Only TC should increase.”
Yes if there were no heat source heating the surface at TH. But we know there is. And we know that Q does not tend toward zero.
“If both TH and TC were to increase as the result of a two-way radiative exchange, energy would have to be created (violating 1LoT) and TC would have to be warming TH (violating 2LoT).”
Again, only if you IGNORE the sun heating the Earth.
Why would you do that?
“This is where you now introduce your “heat source” as an input to TH…but there is no room for it in the equation…so, you just start making stuff up.”
It is obviously there. It is just not in the equation. Because it is a flow from the sun to TH…not TH to To TC.
Your ignorance of basic heat transfer is on display here.
The rad heat transfer equation only tells you the flux between sources at temperature TH and TC.
It tells us nothing about how those T are determined by external influences. Such as in this case by the Sun.
“As the equation shows, Q decreases as the hot “thing” cools by transferring “heat” to the cool “thing”, which “warms”. That’s the way “heat transfer” works. Q tends towards zero. Only TC should increase.”
Yes if there were no heat source heating the surface at TH. But we know there is. And we know that Q does not tend toward zero.
“If both TH and TC were to increase as the result of a two-way radiative exchange, energy would have to be created (violating 1LoT) and TC would have to be warming TH (violating 2LoT).”
Again, only if you IGNORE the sun
heating the Earth.
Why would you do that?
“This is where you now introduce your “heat source” as an input to TH…but there is no room for it in the equation…so, you just start making stuff up.”
It is obviously there. It is just not in the equation. Because it is a flow from the sun to TH…not TH to To TC.
Your ignorance of basic heat transfer is on display here.
The rad heat transfer equation only tells you the flux between sources at temperature TH and TC.
It tells us nothing about how those T are determined by external influences. Such as in this case by the Sun.
Again: “What is your ‘heat source story’?
What role does the sun play in determining the temperature of the Earths surface TH? In your view.
I keep telling you that you are ignoring the sun as a heat source.
And you deny it.
“Are you having a stroke, Nate? Where did I deny the Sun was a heat source?”
But then you turn around and do it again!
“Q tends towards zero. Only TC should increase. If both TH and TC were to increase as the result of a two-way radiative exchange, energy would have to be created (violating 1LoT) and TC would have to be warming TH (violating 2LoT).”
Right there when you say: “energy would have to be created”
Wrong! Because again you pretend that there is no heat source from the sun heating TH.
You act as if only the heat flow OUT from the surface to the atmosphere determines TH.
This is obviously wrong.
Because it is the NET Energy input that determines whether TH increases stays the same or decreases.
This is determined by the adding the input from the heat source and subtracting the output to the atmosphere.
TH of the Earth surface is obviously being maintained or increasing.
And thus Q the heat flow to TC does not tend toward 0.
Nate, we already know it’s your assertion that with a heat source present, in the radiative heat transfer equation both TH and TC can increase as the result of a radiative exchange. There’s no point you continuing to assert it over and over again. You need to support it. So, for the fourth time of asking, please do so. Otherwise, all will assume you are simply making it up.
Well there is no point in your repeatedly pretending that there is no heat source from the sun heating TH.
Nor is there any point in repeatedly pretending that only the heat flow OUT from the surface to the atmosphere determines TH.
Nor is there any point in you absurdly suggesting that the heat flow from the Earth surface will tend to 0.
Nor is there any point in repeatedly asserting that energy would need to be transferred from the TC or created, for TH to rise, while never explaining how both a person AND a blanket covering the person could both warm.
We’ll just have to leave at you making no sense whatsoever.
Nate, you’ve said that all of this:
“As the equation shows, Q decreases as the hot “thing” cools by transferring “heat” to the cool “thing”, which “warms”. That’s the way “heat transfer” works. Q tends towards zero. Only TC should increase. If both TH and TC were to increase as the result of a two-way radiative exchange, energy would have to be created (violating 1LoT) and TC would have to be warming TH (violating 2LoT).”
is correct, so long as there is no heat source present. With a heat source, you claim it’s all different. I’m asking you to support that claim. After all, if a heat source makes such a huge difference, you’d expect it to be front and centre in any physics text on radiative heat transfer. Should be easy for you to support, then.
So, for the fifth time of asking, please support your contention re the radiative heat transfer equation that both TH and TC can increase, so long as there is a heat source present.
“With a heat source, you claim it’s all different. I’m asking you to support that claim. After all, if a heat source makes such a huge difference, you’d expect it to be front and centre in any physics text on radiative heat transfer”
So you need a physics textbook to tell you that the sun heats the Earth, and ultimately determines how warm it gets?
One of the most basic equations of climate science is energy balance, that equates abs.orbed solar input to IR output, if T is to be steady.
I know you’ve seen it.. It is based on 1LOT, which I assume you know
Here:
https://www.noaa.gov/jetstream/atmosphere/energy
1LOT
“The first law of thermodynamics defines the internal energy (E) as equal to the difference of the heat transfer (Q) into a system and the work
(W) done by the system.
E2 – E1 = Q –
We have emphasized the words “into” and “by” in the definition. Heat removed from a system would be assigned a negative sign in the equation.”
https://www.grc.nasa.gov/WWW/K-12/BGP/thermo1.html
Nate, for the sixth time of asking, please support your contention re the radiative heat transfer equation that both TH and TC can increase, so long as there is a heat source present.
Also, earlier you mentioned “the energy balance equation”. I Googled “what is the energy balance equation?” and received this in the Google AI overview:
“The energy balance equation describes the relationship between energy intake and energy expenditure in the body. Essentially, it boils down to: Energy Intake – Energy Expenditure = Energy Balance. When energy intake (calories consumed) is greater than energy expenditure (calories burned), the body experiences a positive energy balance, often leading to weight gain. Conversely, a negative energy balance (more calories burned than consumed) results in weight loss.”
Seems you were making stuff up again.
Energy balance: watch first couple minutes:
https://youtu.be/0HmPT7RHPDw?si=o6q-7OuTy2lUp9ZE
Nate, for the seventh time of asking, please support your contention re the radiative heat transfer equation that both TH and TC can increase, so long as there is a heat source present.
DREMT, you said of Gadden’s description of the GHE:
“Note that you wouldn’t find the GHE being described that way in any atmospheric science textbook”
That’s what I’ve been looking for – a science textbook saying that GHGs in the atmos warm the atmosphere, with IR provided by the surface.
“For this idealized case, sunlight shines through the atmosphere and reaches the Earth’s surface, where a portion is reflected and a portion is absorbed, causing the surface to warm. IR emitted from the warm Earth is totally absorbed by the atmosphere, causing the atmosphere to warm.”
This is from Practical Meteorology, by Roland Stull, a college/university level science textbook.
If you have a problem with the idealised scenario, then Stull goes on a little later:
“As discussed in the Satellites & Radar chapter, Earth’s atmosphere is partially transparent for the 8 to 14 um range of infrared radiation (IR) wavelengths and is mostly opaque at other wavelengths. If all the IR emissions upward from Earth’s surface, suppose that 89.9% is absorbed and 10.1% escapes to space (Fig. 21.5). Thus, the atmosphere will not warm as much, and in turn, will not re-emit as much radiation back to the Earth’s surface.”
Does this warming of the atmosphere by GHGs due to interception of upwelling IR from surface match Gadden’s description?
“1. Earth receives sunlight such that it is not at absolute zero temperature.
2. Earth radiates infrared radiation (thanks to it’s nonzero temperature) towards space.
3. Greenhouse gas molecules in the air absorb some of the outgoing infrared radiation and then deliver that energy to the air, making the air warmer than it OTHERWISE would have been. (Without the greenhouse gases, the infrared radiation (and thus the energy contained therein) would go straight to space in a fraction of a second.)”
Yup.
Here is another science text saying the atmosphere is warmed by GHGs.
“…greenhouse gases warm not only the Earth’s surface,
but the entire troposphere.”
Atmospheric Science: An Introductory Survey
John M Wallace and Peter V. Hobbs.
The book of course explains that GHGs intercept surface IR for the GHE, right in line with Gadden’s description.
Both texts also say that the surface is warmed by GHGs.
Both things are true, and atmospheric physics textbooks cover this.
So Gadden is correct, just incomplete, and it is no contradiction that upwelling IR is intercepted by GHGs, warming both the atmosphere and the surface.
Also, these texts provide reference than the sun provides energy to a system that warms both the surface and the atmosphere in the presence of GHGs.
“To make our Earth-system model be slightly more realistic, add an atmosphere of uniform absolute temperature TA everywhere (Fig 21.4). Suppose this atmosphere is opaque (not transparent) in the IR, but is perfectly transparent for visible light. For this idealized case, sunlight shines through the atmosphere and reaches the Earth’s surface, where a portion is reflected and a portion is absorbed, causing the surface to warm. IR emitted from the warm Earth is totally absorbed by the atmosphere, causing the atmosphere to warm. But the atmosphere also emits radiation: some upward to space, and some back down to the Earth’s surface (a surface that absorbs 100% of the IR that hits it). This downward IR from the atmosphere adds to the solar input, thus allowing the Earth’s surface to have a greater surface temperature Ts than with no atmosphere. This is called the greenhouse effect”
Practical Meteorology: An Algebra-based Survey of Atmospheric Science
Roland Stull
DrEMT, How bout you provide support for your so-far-unsupported claim that the radiative heat transfer equation in some way prevents both TH and from increasing.
So far, you offered that it would require energy creation or heat flow from TC to TH, but this is poppycock because the heat source (the sun) provides plenty of energy to the Earth’s surface at TH.
Let’s clarify something. The RHTE expresses the heat flow between two bodies in terms of their temperatures TH and TC.
It has nothing in it to tell us about the values of TH and TC, other than in your imagination.
Now that you understand Energy Balance from the video, you should understand that TH reaches a steady value when the NET of input – output heat flow =0.
The input is the solar heat flux Qin. The output, Qout, is heat loss rate by radiation and convection to the atmosphere at TC.
The RHTE tells us that if TC increases then the heat loss Qout from TH to TC will decrease. (same for convection)
If so, and the solar input Qin remains fixed, then the NET to the surface is positive, and TH will increase.
“We can all understand the idea of IR radiation flowing two ways, both from the surface to the atmosphere and from the atmosphere to the surface.”
Great! We have no problem.
Lest we forget – there is also the sun providing energy to this system. For the purposes of the GHE, it provides energy to the surface.
“Of course, if both atmosphere and surface are supposed to warm as a result, we can only conclude that both streams of IR radiation are being wrongly treated as “heat”.”
Correct! If you are using the term heat in the classic thermo sense, it only flows from warmer to colder environs. In this sense, the surface is ‘warming’ the atmosphere, not the opposite.
Now, if we interfere with the system by slowing the rate at which heat escapes from the surface to space, then the surface must warm up. And it’s not just ‘alarmists’ that say this, it is exactly what Dr Spencer says, who should know a thing or two about atmospheric physics.
“Again, temperature is the result of energy gain AND energy loss. If you reduce the rate of energy loss, temperature will rise… even if the energy input is the same.”
https://www.drroyspencer.com/2015/06/what-causes-the-greenhouse-effect/
All analogies are imperfect, but the blanket analogy will do here. The body provides the heat (analog to sun), and the blanket (atmosphere) warms when given energy by the body. The skin (surface) beneath the blanket also warms, because the rate of skin heat loss is slowed by the blanket.
And that is what the atmosphere does regarding the surface of the planet.
There is a reason that the average temperature of the total surface of planet Earth is warmer than it would be if there were no atmosphere. And the reason IS the atmosphere – which slows down the rate at which heat from the surface escapes to space.
In colloquial terms, the surface gets warmer or cooler when the atmosphere does. And some critics seem to mistake this less technical language for a problem in the science.
But physics is not undone when anyone says that blankets make us warmer, even though heat is not flowing from the blanket to our skin. The 2nd Law is not repealed by such language. So why does this become an issue with the GHE?
I made it clear, seven times, exactly what I was asking them to support. Obviously, they can’t support it! So I can only conclude that my “can’t be both” is correct.
barry helpfully provides some more evidence that Gadden misrepresented the GHE through omission of the most contested ideas.
Nate apparently believes his little 1LoT video taught me anything new, and also believes that it allows him to abuse the radiative heat transfer equation. It didn’t, and doesn’t. It’s exactly as I said – there is simply no room in the equation for the Sun! And that’s where “the science” ends, and these guys “making stuff up” begins.
barry’s second response reveals he’s a little behind in the discussion. We’ll wait for him to catch up.
“Nate apparently believes his little 1LoT video taught me anything new, and also believes that it allows him to abuse the radiative heat transfer equation. It didn’t, and doesn’t”
Ok. You didn’t want THOSE answers.
Because you know the sun doesn’t heat the Earth.
The RHTE eqn is the one equation to rule them all.
1LOT can be neglected.
Earth’s surface can never warm.
This is the kind of insanity we get when DREMT is in a deep hole and refuses climb out to face reality.
You’re the one in a hole, Nate. You have a nice story, a nice narrative…but you can’t support it. That’s the thing. All you can do is twist my words…but people can see through that.
Radiative heat transfer just plain doesn’t work the way you guys want it to.
Oh well.
“Radiative heat transfer just plain doesn’t work the way you guys want it to.”
Of the three of us, only you think it determines the temperatures, TH and TC.
The problem is that temperatures are the inputs to this equation, not the outputs.
If you think it can tell us the temperatures, explain how.
No substantial reply to the physics texts I provided, just assertions and complaints that I’m not doing what you asked of Nate.
Here’s what you said to me about Gadden’s description.
“Note that you wouldn’t find the GHE being described that way in any atmospheric science textbook”
I provided quotes and links to authoritative websites https://www.drroyspencer.com/2025/05/uah-v6-1-global-temperature-update-for-april-2025-0-61-deg-c/#comment-1704440>here, describing the GHE the same way Gadden did.
You dismissed that on the premise that it did not include upper and lower parts of the atmosphere – which was nothing to do with Gadden’s description, it was just a new fabrication of yours about what Gadden said.
So let’s ignore your inventions and once more quote Gadden:
“1. Earth receives sunlight such that it is not at absolute zero temperature.
2. Earth radiates infrared radiation (thanks to it’s nonzero temperature) towards space.
3. Greenhouse gas molecules in the air absorb some of the outgoing infrared radiation and then deliver that energy to the air, making the air warmer than it OTHERWISE would have been. (Without the greenhouse gases, the infrared radiation (and thus the energy contained therein) would go straight to space in a fraction of a second.)”
Compare with:
“sunlight shines through the atmosphere and reaches the Earth’s surface, where a portion is reflected and a portion is absorbed, causing the surface to warm. IR emitted from the warm Earth is totally absorbed by the atmosphere, causing the atmosphere to warm.”
Roland Stull: Practical Meteorology
That’s the same description.
There is no upper and lower atmosphere mentioned. There is no “surface warming the atmosphere” mentioned. These were both your fabrications. Gadden only mentioned warming in relation to the surface being warmed by the sun, and the atmosphere by GHGs. The interaction between surface and atmosphere was described in terms of energy; infrared radiation.
So now I’ve provided 4 references, 2 of which are physics textbooks, that confirm Gadden’s description of GHGs warming the atmosphere due to infrared radiation from the Earth.
The physics sources also say that the GHE warms the surface.
So there is no contradiction except in your mind: which is prone to mischaracterizing what people say in order to construct “issues.”
As for whatever you are talking about with Nate, if you are arguing about both the surface and the atmosphere warming together under the GHE, the 2 physics textbooks I’ve cited confirm that.
“sunlight shines through the atmosphere and reaches the Earth’s surface, where a portion is reflected and a portion is absorbed, causing the surface to warm. IR emitted from the warm Earth is totally absorbed by the atmosphere, causing the atmosphere to warm. But the atmosphere also emits radiation: some upward to space, and some back down to the Earth’s surface (a surface that absorbs 100% of the IR that hits it). This downward IR from the atmosphere adds to the solar input, thus allowing the Earth’s surface to have a greater surface temperature than with no atmosphere. This is called the greenhouse effect”
“Of the three of us, only you think it determines the temperatures, TH and TC.”
As I said, all you can do is twist my words. What I actually said, on the subject of the RHTE, in my comment of May 15th at 1:04 AM, you agreed with; but said it only applied if there was no heat source present. In which case, you already agree that it “can’t be both” when the Sun goes down. I’m just trying to get you to support your claim re the RHTE that both TH and TC can increase when there’s a heat source present, but we both know full well that you can’t. So, that’s the end of it. barry says:
“You dismissed that on the premise that it did not include upper and lower parts of the atmosphere – which was nothing to do with Gadden’s description, it was just a new fabrication of yours about what Gadden said.”
You are completely confused, barry. I’m not fabricating anything about what Gadden said. He described the GHE, in its entirety, as the surface warming the atmosphere via GHGs. I said you would not find the GHE being described that way in any atmospheric science text, and you have proven me correct, because that is not the entirety of the GHE description that you have found in the texts. The descriptions you found all go on to include the most contested ideas of the GHE – such as the atmosphere warming/insulating the surface via GHGs – as well.
Gadden misrepresented the GHE through omission of the most contested ideas.
What I find interesting about this is, you GHE proponents go the ends of the Earth to defend each other, and to defend the GHE, but scientists shouldn’t be doing that. Stephen Anderson made an interesting point the other day – as scientists, you should all be trying your hardest to tear the GHE to shreds. You should be trying to falsify the theory. The only way in which any scientist should ever defend this theory is to defend it from misrepresentation – but, Gadden is the one misrepresenting it, and I am the only one trying to set him straight!
As for your comment on my discussion with Nate – if you’re not following it, don’t bother to comment on it…but, we both know you’re only pretending not to be following it. Stop playing dumb.
Well now you’re saying what I’ve said all along – that Gadden’s description is incomplete.
I said that days ago. Looks like you’re catching up.
And yes, the GHE warms both the atmosphere and the surface – as you now acknowledge textbooks say.
Yes – it can be both! It IS both.
You still haven’t acknowledged that Gadden never said the surface “warms” or “heats” the atmosphere. All he said was that the surface sent energy to the atmosphere.
Why is it so hard to admit what anyone can see when they read his description?
DREMT,
Would you clarify something?
Please define and explain heat flow when a blanket is put on a living body and the skin warms up. If the skin warms up, but the blanket is colder than the skin, explain the direction of heat flow.
I would ask you to explain why, if the skin gets warmer, the direction of heat flow is NOT from the blanket to the skin.
I’m hoping to cut through the haze with a clear comment on this from you.
1) As previously explained, Gadden’s GHE description is correctly characterised as “the surface warming the atmosphere via GHGs”.
2) Gadden misrepresented the GHE through omission of the most contested ideas.
3) It “can’t be both”. Stop playing dumb over my argument with Nate.
4) I will not be discussing analogies. They’re just a distraction.
1) You’ve never admitted that Gadden does not say the surface warms the atmosphere, but instead says it sends energy in the form of IR to the atmosphere. Can’t even admit that this was the language he used, and not your language. The avoidance of this point gets louder each time you avoid it.
2) “Gadden misrepresented the GHE through omission of the most contested ideas.” – He didn’t misrepresent. The atmosphere IS warmed by the presence of GHGs intercepting IR from the surface. He didn’t add that this in turn warms the surface. That is not an either/or, can’t be both problem. I’ll bet $1000 if you asked him he would say, ‘of course this also causes the warming of the surface.’
4) I will not be discussing analogies. They’re just a distraction.
Bollocks. You’ve discussed analogies at length in the past.
I think you know that if you give an honest answer to the process of heat flow with the blanket you’ll stump your own criticism of the GHE.
I’ll answer for you, chicken.
The reason the heat flow is from the skin to the blanket, even though the skin is made warmer by the presence of the blanket, is that the skin is on average warmer than the blanket, and heat flows from hot to cold, even if both bodies get warmer or colder. As long as the skin is warmer than the blanket, heat will always flow that way.
So why does the skin get warmer? Because its rate of heat loss is reduced by the blanket.
GHE works the same way. The heat flow never reverses from cold to hot, because at all times the surface (av temp) is warmer than the atmosphere.
It’s also the case for the Green Plate/Blue Plate. Green plate slows heat loss from blue plate. Anything that has its rate of heat loss slowed must warm up, if the object is being warmed by a constant heat source.
Musn’t forget the constant heat source. The warming effect doesn’t happen without it.
“I’m just trying to get you to support your claim re the RHTE that both TH and TC can increase when there’s a heat source present”
Fully explained now several times by me and Barry. Fully supported by links, ie on 1LOT, energy balance, which you claim to understand.
These show that with a steady heat source (input) AND a reduced heat loss (output), that TH of the Earth’s surface has no choice but to increase.
It is very simple math, and any high schooler could understand it.
Why can’t you?
We know why. No amount of evidence or logic can change your beliefs. So you have to play dum.
barry, I’m a patient man, but you’re starting to test me.
1) You’re quibbling over semantics, and nobody else agrees with you. “The surface sending radiation to the atmosphere, which, via GHGs, results in it being warmer than it would otherwise be” equals “the surface warms the atmosphere via GHGs”.
2) Gadden misrepresented the GHE through omission of the most contested ideas. I don’t know why you’re covering for him.
4) This is all I have to say about your obsession with blankets. If the much-discussed GHE back-radiation warming/insulation mechanism actually worked, then “blanket insulation” would work the same way. Everybody would note that blankets insulate, radiatively, in exactly the same way as is proposed for the GHE. But, “blanket insulation” doesn’t work that way. Which kind of says it all, really.
“the much-discussed GHE back-radiation warming/insulation mechanism actually worked, then “blanket insulation” would work the same way. Everybody would note that blankets insulate, radiatively”
DREMT, the guy who invokes endless analogies (BOS, magnets, airplanes) for the Moon in orbit, refuses to consider one here.
Again he works hard to miss the point that the blanket obeys the same laws of physics 1LOT, 2LOT, and general principles, insulation restricts heat flow, heat flows from hot to cold, as the GHE.
-In both cases heat loss is reduced by an increase in TC.
-In both cases there is a heat source supplying input heat to TH.
-In both cases this results in a positive energy imbalance at TH, which causes TH to rise.
DREMT has notably not pointed out any faults with these points or logic.
He simply tells us that these simple facts and logic don’t satisfy him.
But this is his personal issue. Not sciences.
I knew Nate would try to pretend that he’d provided the support I asked for. He’s as predictable as he is dishonest.
And, my point about blankets went over his head, or at least that’s what he’s trying to pretend.
Not worth my time.
“The surface sending radiation to the atmosphere, which, via GHGs, results in it being warmer than it would otherwise be” equals “the surface warms the atmosphere via GHGs.”
I’m afraid I am going to continue to be precise with language, because you are misusing language to argue your case. More on that in the next post.
Gadden did indeed neglect to ADD that the surface is ALSO warmed by the presence of GHGs. But he didn’t misrepresent the GHE. You can find the same description as his in many places, as I showed you on science websites, and these DON’T all refer to the warming of the surface as well.
An GHE explanation that omits warming of the surface does not contradict that occurring. If I tell you that stepping on the gas pedal will allow more fuel and air into the combustion chamber, adding more power to the engine, I haven’t misrepresented ICE dynamics just because I neglected to mention the engine will rev faster.
Regarding precise language, there are two ways of using the word ‘warmed’. One is colloquial – “I am warmed by this blanket,” and one is under the banner of classical thermodynamics, where only a warmer object can warm a cooler one.
You borrow from the colloquial usage to argue that the classical definition is betrayed and therefore the science is wrong. Your main error is to treat radiation as “heat” in the classical thermo sense. EM radiation is not heat in that sense at all. It is energy.
You will find in many physics texts that the flow of heat is determined by subtracting the
EM radiation is omnidirectional. The flow of heat is unidirectional. In radiative transfer the flow of heat is ONLY determined by which body is warmer (emitting more EM) than another.
"Assuming that an object with a temperature T1 is surrounded by an environment with uniform temperature T2, the net rate of heat transfer by radiation is
Q̇_net / t = εσ(T₁ − T₂)
where ε is the emissivity of the object alone… When T₂ > T₁, the quantity
Q̇_net / t
is positive; that is, the net heat transfer is from hot to cold."
https://courses.lumenlearning.com/suny-physics/chapter/14-7-radiation/
I can find plenty more science sources saying the same thing.
Thus, even if a cooler body gets warmer in the presence of an even warmer body, the flow of heat will always be established by the relative temperatures, not by any individual vector of radiation.
“Gadden did indeed neglect to ADD that the surface is ALSO warmed by the presence of GHGs. But he didn’t misrepresent the GHE. You can find the same description as his in many places, as I showed you on science websites, and these DON’T all refer to the warming of the surface as well.”
Then these places are also misrepresenting the GHE through omission of the most contested ideas.
“An GHE explanation that omits warming of the surface does not contradict that occurring.”
An explanation doesn’t change whether or not something happens, barry. It’s just an explanation. But, if you’re going to miss out the most contested ideas from your explanation, then you’re still misrepresenting the GHE and making it seem less contestable than it really is.
“Regarding precise language, there are two ways of using the word ‘warmed’. One is colloquial – “I am warmed by this blanket,” and one is under the banner of classical thermodynamics, where only a warmer object can warm a cooler one. You borrow from the colloquial usage to argue that the classical definition is betrayed and therefore the science is wrong”
False accusation.
“Your main error is to treat radiation as “heat” in the classical thermo sense. EM radiation is not heat in that sense at all. It is energy.”
False accusation.
You then go on to continue to treat your grandmother how to suck eggs, even citing the radiative heat transfer equation that I’ve discussed extensively with Nate, and you’ve been pretending not to follow/understand.
Why such long, rambling, wishy-washy posts, barry? Are you still reeling from my last response on number 4)? I notice that you’ve quietly dropped the subject…
“-In both cases heat loss is reduced by an increase in TC.
-In both cases there is a heat source supplying input heat to TH.
-In both cases this results in a positive energy imbalance at TH, which causes TH to rise.”
This explains in easily understood language how TH can rise due to the laws of physics and simple logic.
“DREMT has notably not pointed out any faults with these points or logic.”
Now he says
“Not worth my time.”
Translation: he still has no answers and still cannot point to any problems with our explanation.
He simply whines that its not what he was looking for.
Awww..
Unable to provide the necessary support for his position, and unable to even address my point about the blanket analogy, Nate continues to just make stuff up.
DREMT,
We know very well that both Rad heat transfer and convective heat transfer will decrease if TC increases.
Thus you are unable to even address my points about why the blanket analogy contains the same laws of physics and key heat transfer principles at work in the atmosphere.
My point about the blanket analogy refutes yours.
False. We rely on radiative heat flow from hot to cold, in agreement with the RHTE.
Your complaint has no merit.
Self soothe with pure denial.
Here it is again, Nate, for you to deny and ignore:
“4) This is all I have to say about your obsession with blankets. If the much-discussed GHE back-radiation warming/insulation mechanism actually worked, then “blanket insulation” would work the same way. Everybody would note that blankets insulate, radiatively, in exactly the same way as is proposed for the GHE. But, “blanket insulation” doesn’t work that way. Which kind of says it all, really.”
Read it and weep. Reality just hit you in the face with a shovel.
Nowhere in your ‘explanation’ are any of these points of agreement between the blanket and the GHE addressed:
-In both cases heat loss is reduced by an increase in TC.
-In both cases there is a heat source supplying input heat to TH.
-In both cases this results in a positive energy imbalance at TH, which causes TH to rise.
This explains in easily understood language how TH can rise due to the laws of physics and simple logic.
All we need to know about radiation is that heat loss by radiation is reduced with an increase in TC.
Let’s check:
https://courses.lumenlearning.com/suny-physics/chapter/14-7-radiation/
Yep!
So your argument ‘but radiation doesn’t work that way’ is unsupported..
Nate…are you just playing dumb, or do you really not understand? It doesn’t matter how many times you repeat your narrative…if it were actually correct, it would work with blankets. Blankets would insulate radiatively. But, “blanket insulation” doesn’t work that way. That means you’re wrong. How much simpler can I make it?
“All we need to know about radiation is that heat loss by radiation is reduced with an increase in TC.”
Wrong, that is not “all we need to know”. You assume that if TC increases, TH will also increase, in the presence of a heat source. But, the radiative heat transfer equation has no room for that heat source! So, you try to manipulate the equation and start adding inputs to TH even though you have no precedent to treat the RHTE this way. You cannot support it. You cannot link to a physics textbook’s radiative heat transfer section where they treat the RHTE in this manner.
And, you don’t care.
“Wrong, that is not “all we need to know”. You assume that if TC increases, TH will also increase, in the presence of a heat source.”
Stop gaslighting.
Nowhere are we assuming any such thing.
We are applying 1LOT, energy balance to the surface at TH. You claim to understand what this means. Do you or don’t you?
“But, the radiative heat transfer equation has no room for that heat source! So, you try to manipulate the equation and start adding inputs to TH even though you have no precedent to treat the RHTE this way.”
Again you make the absurd claim that we are trying to modify the RHTE.
Why do you keep saying this stoppidity?
For the 47th time, the RHTE simply tells us the heat loss with TH and TC as INPUTs.
The equation is not being manipulated in any way. It stands on its own to tell us the rad heat loss.
But 1LOT is needed as explained a billion times, to determine whether TH is steady, or in this case will increase due to the positive energy imbalance caused by the heat source.
Remember the video you claimed to understand?
Do you really think the heat source should be ignored?
Look, if cannot wrap your mind around these simple concepts, then you need stop arguing.
There’s absolutely nothing I don’t understand about your story.
Every word I said was correct.
Nate, for the eighth time of asking, please support your contention re the radiative heat transfer equation that both TH and TC can increase, so long as there is a heat source present.
barry: ““Your main error is to treat radiation as ‘heat’ in the classical thermo sense. EM radiation is not heat in that sense at all. It is energy.”
DREMT: “False accusation.”
Not at all. I read through your conversation with Nate last night, and you said:
“Only TC should increase. If both TH and TC were to increase as the result of a two-way radiative exchange, energy would have to be created (violating 1LoT) and TC would have to be warming TH (violating 2LoT).”
If I am falsely accusing you of treating a single vector of radiation as ‘heat’ in the classic thermo sense, then you must agree that TC (temperature of cold object?) cannot warm TH.
The direction of heat flow between two radiatively interacting bodies is always from the warmer object to the colder, regardless of whether both heat up or cool down, or only one does.
As long as TH is warmer than TC in all those scenarios, the flow of heat is ALWAYS TH to TC, and never the reverse.
And you know I can produce numerous science texts corroborating.
I have already produced science texts explaining the GHE, which corroborates what you are asking Nate to provide. Sun = energy source: more GHGs slow the escape of heat to space, raising the temperature of both the surface and the atmosphere.
Why do you not have a problem with both the blanket and the kin warming with a heat source, but you do have a problem with the GHE?
Could it be that you are assigning the property of “heat” to a single vector of radiation after all?
“Not at all. I read through your conversation with Nate last night, and you said:
“Only TC should increase. If both TH and TC were to increase as the result of a two-way radiative exchange, energy would have to be created (violating 1LoT) and TC would have to be warming TH (violating 2LoT).””
And, Nate agreed that is correct, but said it was only correct if there were no heat source present. So, already, you and Nate should understand that it “can’t be both” when the Sun goes down every night. That’s already quite a big deal.
Now, you and Nate need to support the contention re the radiative heat transfer equation that both TH and TC can increase, in the presence of a heat source. As I asked you already:
“I have said twice what I want you to support. It does not have to be an atmospheric physics text. Any physics text will do. Go to the section on radiative heat transfer. Find the radiative heat transfer equation. Find anything to support the contention that with a heat source present, both the TH term and the TC term can increase in a radiative exchange. That is what you guys have to support. That’s now the third time I have asked.”
https://www.drroyspencer.com/2025/05/uah-v6-1-global-temperature-update-for-april-2025-0-61-deg-c/#comment-1704932
Nate, I understand your story just fine. And, you cannot support your claims. In fact, you can’t even place your comments correctly.
The you tell us, where is the sun’s heat going? Is it a heat source for the Earth?
The Sun heats the Earth, Nate. Yet, according to your story, the Earth would also warm/insulate the Sun!
Ok, so you are now ok with having the sun’s heat added as an input to the Earth’s surface at TH.
Then you no longer claim:
“But, the radiative heat transfer equation has no room for that heat source! So, you try to manipulate the equation and start adding inputs to TH even though you have no precedent to treat the RHTE this way.”
Ok.
Then that was the main thing had objected to in our analysis.
We all agree that the RHTE is valid. Thus if TC increases, the heat loss from TH to TC will decrease.
And you already said you understand energy balance, then with the heat INPUT to TH constant, as before, then the energy balance to TH is POSITIVE.
And therefore Th must warm.
If you disagree with any of this, explain why.
“Then you no longer claim:
“But, the radiative heat transfer equation has no room for that heat source! So, you try to manipulate the equation and start adding inputs to TH even though you have no precedent to treat the RHTE this way.”
Ok.”
Wrong. I still “claim” the same thing (actually I simply state the reality that that’s the case, it’s not really a “claim”).
The RHTE has no room for the Sun if the surface is TH and the atmosphere is TC. Once again, that is where “the science” ends, and you “making stuff up” begins.
I understand your story, always have. It’s not exactly difficult to follow. I simply point out that you cannot support your story.
And, I reiterate my point about the blanket analogy, which you have both run away from.
And, I reiterate that it’s absurd that your story leads to the Earth warming/insulating the Sun.
In fact, it’s more than simply “absurd”.
Your story already has TH increasing as a result of an increase in TC. But, you also expect us to believe that TSun then increases as a result of the alleged increase in TH!
So, now the Sun is warmer…does it heat the surface more, which in turn warms the atmosphere more, leading to another increase in TH, and a further increase in TSun!?
I mean…is this why G & T referred to such descriptions as a “perpetuum mobile of the second kind?”
“The RHTE has no room for the Sun if the surface is TH and the atmosphere is TC. Once again, that is where “the science” ends, and you “making stuff up” begins.:
OMG, it is the now classic DREMT flip-flop.
‘has no room for the Sun’ WTF are you talking about?
In any case this is bonkers. Absolutely nothing is added to the RHTE!
Simply, we all agree that ”
The Sun heats the Earth, Nate.”
And the rest follows from that.
And no, nothing about the sun heats the Earth is ‘made up’.
Where do you come up with this nonsense?
Nate’s had another stroke, and is unable to read, again.
“The Sun heats the Earth, Nate.”
Ok, then its heat is added to the Earth surface at TH.
“But, the radiative heat transfer equation has no room for that heat source! So, you try to manipulate the equation and start adding inputs to TH even though you have no precedent to treat the RHTE this way.”
But then no, it’s heat is not added to the Earths surface at TH!
Which is it? You make the call, and this time stick with it.
And again ‘RHTE has no room for the heat source’?? WTF?
Nobody but you is saying such nonsense.
Calm down, Nate.
There are only two terms in the RHTE. So, if TH is the surface and TC the atmosphere, then there is no room for the Sun in that equation. Sorry that this seems to upset you so much.
Please at least try to support your claim that, wrt the RHTE, both TH and TC can increase in the presence of a heat source.
Go to the radiative heat transfer section of any physics textbook, and try to find some support for it. At least try to find some worked examples where radiative exchange between two surfaces is treated differently with a heat source, than without! Otherwise we can only assume it makes no difference.
“There are only two terms in the RHTE. So, if TH is the surface and TC the atmosphere, then there is no room for the Sun in that equation.”
Glad to hear it, since no one is trying to put the sun or its heat into the equation, this is a strawman.
Again, for the slow learners, the RHTE simply tells us the heat loss from TH to TC, with those temperatures as inputs.
1. This we know that if TC increases, the RHTE tells us the heat loss from TH will decrease.
APART from this equation, other laws of physics must be satisfied, such as 1LOT. Thus we know 1LOT must be satisfied for the Earth’s surface.
2. Given the sun’s fixed input of heat flow to the Earth’s surface, and the reduced heat loss from it to TC, we know from 1LOT that the Earths surface must GAIN thermal energy, and thus warm.
And thus far you have offered no sensible rebuttal to these facts and logic.
So what you are telling us, simply, is that facts and logic don’t work for you.
“Otherwise we can only assume it makes no difference”
You will assume that heat input makes no difference to temperature?
Brilliant..
“Glad to hear it, since no one is trying to put the sun or its heat into the equation, this is a strawman…”
…and yet, you must have said a dozen times now that the Sun is a heat input to TH, and TH is a term in the RHTE.
Regardless, reiterating your story a thousand times is not going to provide any support for it. Can you really not even find any worked examples using the RHTE where the presence or absence of a heat source makes a difference?
Can you just admit that you cannot find anything in the radiative heat transfer section of a physics text to support:
1) The idea that wrt the radiative heat transfer equation, both TH and TC can increase in the presence of a heat source.
2) The idea that radiative exchange between two surfaces is treated differently with a heat source present, than without.
because such support does not exist?
Arrrgh
https://www.drroyspencer.com/2025/05/uah-v6-1-global-temperature-update-for-april-2025-0-61-deg-c/#comment-1705000
So no, you cannot admit it.
https://www.drroyspencer.com/2025/05/uah-v6-1-global-temperature-update-for-april-2025-0-61-deg-c/#comment-1705009
Idk why…maybe thread too long..
Nate, you’ve said that all of this:
“As the equation shows, Q decreases as the hot “thing” cools by transferring “heat” to the cool “thing”, which “warms”. That’s the way “heat transfer” works. Q tends towards zero. Only TC should increase. If both TH and TC were to increase as the result of a two-way radiative exchange, energy would have to be created (violating 1LoT) and TC would have to be warming TH (violating 2LoT).”
is correct, so long as there is no heat source present. With a heat source, you claim it’s all different. I’ve asked you over ten times to support that claim. You cannot. So, I conclude that what I wrote is also correct in the presence of a heat source. If you come back with anything other than a link to the radiative heat transfer section of a physics text supporting your claim, then I’ll just keep repeating this comment. Thank you, and good day.
“is correct, so long as there is no heat source present. With a heat source, you claim it’s all different.”
Yes, the established laws of physics, specifically 1LOT, tells us that a heat source heats things!
“I’ve asked you over ten times to support that claim. You cannot.”
Totally False. I supported it multiple times with basic physics and simple logic, which you claim to understand, and cannot refute.
“So, I conclude that what I wrote is also correct in the presence of a heat source.”
Why would you repeatedly declare yourself to be so ignorant?
How is it possible for anyone to think that a heat source does not heat?
How do you explain the rise in surface temperature that we all experience everyday when the solar heat source is turned on in the morning?
Nate, when the Sun rises in the morning, three separate radiative exchanges take place:
1) Between the Sun and the surface. In the RHTE, TH is the Sun, and TC the surface. TC will increase as a result of this exchange, TH will not increase.
2) Between the Sun and the atmosphere. In the RHTE, TH is the Sun, and TC the atmosphere. TC will increase as a result of this exchange, TH will not increase.
3) Between the surface and the atmosphere. In the RHTE, TH is the surface, and TC the atmosphere. TC will increase as a result of this exchange, TH will not increase.
If you think both TH and TC will increase in any one of the above radiative exchanges, in the presence of a heat source, then please provide support from the radiative heat transfer section of a physics text.
“Nate, when the Sun rises in the morning, three separate radiative exchanges take place:
1) Between the Sun and the surface. In the RHTE, TH is the Sun, and TC the surface. TC will increase as a result of this exchange, TH will not increase.”
Great. The sun is the heat source for the surface. You and science prove the obvious.
And you clearly understand how the sun causes the surface to be warmer, than without the heat source.
Then you should be able understand perfectly well that for #3, with the surface temperature now called TH, that solar heat source is applied to the surface with TH.
And you should be able to understand that the whether the TH of the surface warms or cools is entirely dependent the balance of input heat from the sun and the output heat to the sky at TC, to satisfy 1LOT.
So your earlier claim that the heat source makes no difference is obviously wrong.
So your claim earlier that the heat source should not change any of this:
“Q decreases as the hot “thing” cools by transferring “heat” to the cool “thing”, which “warms”. That’s the way “heat transfer” works. Q tends towards zero. Only TC should increase.
makes no sense whatsoever.
With the solar heat source, TH need not cool because its heat lost to TC is replaced by the heat source.
Nate, try to understand that there is no room in 3) for the Sun. There are only two terms in the RHTE, and they are taken up by the surface and the atmosphere. You are, once again, wanting to treat the Sun as an input to TH…but the Sun’s radiative exchange with the surface is covered in 1). Not 3).
Please stop repeating explanations of your story, which is already well understood, and has been for many, many years.
As you’re still trying to claim that both TH and TC can increase in 3), as a result of the radiative exchange, and in the presence of a heat source, then you need to provide support for that idea from the radiative heat transfer section of a physics text. It’s abundantly clear by now that you cannot do so.
“You are, once again, wanting to treat the Sun as an input to TH”
Your semantic obfuscation again.
I stated the sun’s heat is an input to the Earth’s surface, which in your #3 is labeled TH.
Whether you put it # 1 makes no difference, the sun’s heat is input to the Earths surface, and therefore has a determinative effect on its temperature.
When you state in #1 that the sun increases the T of the surface, you must assuming that the sun’s input is greater than its heat loss via #3.
“When you state in #1 that the sun increases the T of the surface, you must assuming that the sun’s input is greater than its heat loss via #3.”
No, Nate. I don’t need to assume anything about 3), in 1). As I said, they are three separate radiative exchanges that occur as the Sun rises each day. In 1), with view factors taken into account, the Sun will be providing heat radiatively to raise the temperature of the Earth’s surface. In 3), the Earth’s surface will be providing heat radiatively to raise the temperature of the atmosphere. It’s only according to GHE proponents that in 3) the Earth’s surface temperature also increases! So, that’s what you have to support. Exactly as I’ve said all along:
“Find anything to support the contention that with a heat source present, both the TH term and the TC term can increase in a radiative exchange”.
You can find nothing in the radiative heat transfer section of a physics text to support that contention, can you, Nate?
And, you can find nothing to support the idea that radiative exchange between two surfaces is treated differently with a heat source present, than without.
So, we can assume it isn’t treated differently.
“No, Nate. I don’t need to assume anything about 3), in 1).”
If the T of Earth’ surface does not depend on both the input heat gain from the sun and the output heat loss from the Earth surface to the atmosphere, then how would you determine if it is warming or cooling or stable?
So to be clear, you are denying that 1LOT needs to be satisfied?
“And, you can find nothing to support the idea that radiative exchange between two surfaces is treated differently with a heat source present, than without.”
You need to stop putting-up/knocking-down this strawman.
Quote me saying anywhere that the radiative exchange is not still governed by the RHTE.
For extremely slow learners: the RHTE cannot, by itself tells us what the temperature inputs to it will be.
One needs both inputs and outputs to bodies to determine if the T of a body is increasing, decreasing or stable.
Your claim that you know whether TH of the Earth’ surface is increasing is based only on ignoring this fact.
I’m not attacking any straw men, Nate. It’s you that keeps twisting my words. You have consistently argued throughout that in 3), as the temperature of TC increases, so too will TH, in the presence of a heat source. I’m asking you to support your claim, from the radiative heat transfer section of a physics text. You obviously cannot, as I’ve asked you about fifteen times now.
“I’m not attacking any straw men, Nate.”
But notice you cannot quote me saying what you claim I am saying. That is clearly a strawman.
“You have consistently argued throughout that in 3), as the temperature of TC increases, so too will TH, in the presence of a heat source.”
Yep, I notice you fail to mention the reason for that, that I’ve explained a billion times.
It is that 1LOT is applicable, matters, and must be satisfied.
And I noticed that you evaded answering these two questions:
“If the T of Earth’ surface does not depend on both the input heat gain from the sun and the output heat loss from the Earth surface to the atmosphere, then how would you determine if it is warming or cooling or stable?
So to be clear, you are denying that 1LOT needs to be satisfied?”
OK, Nate. I’ll do you a deal. I’ll answer your questions, if:
1) You admit that I’m not misrepresenting you.
2) You admit that you’ve been misrepresenting me throughout the entire discussion.
3) You admit that you can’t provide what I’m asking for, because it doesn’t exist.
4) You admit that means it “can’t be both”, even when the Sun’s up.
“1) You admit that I’m not misrepresenting you.”
How can I when even you cannot quote me saying what you are misrepresenting me as saying?
All of this off topic distraction.
It is clear that you have no answers for how you would find out if a temperature is rising or falling without looking at its balance of energy inputs and outputs.
It is unclear why you don’t make use of 1LOT as Barry and I know is necessary.
You are missing a good opportunity to articulate your thinking.
How exactly have I supposedly misrepresented you? I’m so sick of your false accusations.
Nevermind the distraction.
The main remaining issue is that you cannot wrap your brain around how heat transfer works. It is key to understand that 1LOT needs to be satisfied.
It is key for you to understand that you cannot determine if T is increasing, decreasing, or staying constant, without evaluation the balance of energy inputs and outputs to the Earths surface.
My answer to your questions is that yes, 1LoT applies and needs to be satisfied…but your error is to treat each part of the Earth system as its own thermodynamic system. Surface plus atmosphere is the system. Not surface alone, or atmosphere alone. So, you need to make sure that energy in equals energy out for the whole Earth’s system…this is where we get to the EEI discussion. If energy in is greater than energy out the temperature of the entire Earth will increase…and so on, and so forth…but your mistake is to treat each part of the system the same way, when each part of the system is not its own thermodynamic system.
Asking Google AI the question:
“can the Earth’s surface alone be treated as a thermodynamic system?”
Yields this response:
“No, the Earth’s surface alone cannot be treated as a thermodynamic system in isolation. The Earth is an open system, continuously exchanging energy and matter with the Sun, space, and other parts of the Earth system.
Here’s why:
Energy Exchange: The Earth is constantly bombarded with solar radiation and emits infrared radiation into space. This ongoing energy flow makes it an open system, not a closed one.
Not Isolated: The Earth’s atmosphere, oceans, and land surface are all interconnected and exchange energy and matter. The Earth’s surface is influenced by these interactions, making it part of a larger, open system.
Non-Equilibrium: The Earth’s surface, and indeed the entire Earth system, is not in thermodynamic equilibrium. The continuous energy input from the sun drives processes like weather, climate, and geological activity, keeping it in a state of disequilibrium.
Open System Characteristics: Open systems, like the Earth, can’t be treated as closed, isolated systems. They require external energy and matter inputs to maintain their state, according to MyNASAData.
In summary, while the Earth’s surface is a crucial component of the Earth system, it cannot be treated as a separate, closed thermodynamic system. Its energy exchange and interactions with other parts of the Earth system make it an open system, according to Physics Today – AIP Publishing.”
…and, anticipating that you are going to respond that you think the surface is its own thermodynamic system, then please clearly define the system boundary. I do not think you can.
“Non-Equilibrium: The Earth’s surface, and indeed the entire Earth system, is not in thermodynamic equilibrium. The continuous energy input from the sun drives processes like weather, climate, and geological activity, keeping it in a state of disequilibrium.”
Yep, that means heat flow from the Earth surface does not tend toward 0, as you erroneously claimed.
It has both inputs and outputs that together determine whether the surace is gaining or losing energy and thus whether it is warming or cooling.
“Open System Characteristics: Open systems, like the Earth, can’t be treated as closed, isolated systems. They require external energy and matter
inputs to maintain their state, according to MyNASAData.”
Yep, without inputs T cannot be maintained. 1LOT applies.
Nor have we been treating it as an isolated system. We have been clear the Earth surface has been exchanging energy with the sun and atmosphere.
NONE of this is saying 1LOT does not apply.
“First Law of Thermodynamics for Open Systems:
The first law of thermodynamics, which is the principle of energy conservation, applies to open systems as well. It states that the total energy of an open system remains constant, but energy can be transferred in various forms (heat, work, and through mass flow). ”
Oh well!
“your error is to treat each part of the Earth system as its own thermodynamic system. Surface plus atmosphere is the system. Not surface alone, or atmosphere alone.”
This is you redefining the system to suit your needs of the moment.
Earlier you claimed that the surface has a temperature and the atmosphere has a temperature and they exchange energy, so you were treating them as two systems.
But then you did not know how to determine whether T of the surface was warming cooling or because you refused to apply 1LOT to it, which makes no sense.
“So, you need to make sure that energy in equals energy out for the whole Earth’s system…this is where we get to the EEI discussion.”
Sure, but any part of this system can be a system also, if it has a measurable T, which must satisfy 1LOT.
“Key aspects of a thermodynamic system:
Boundary:
The boundary defines the system and separates it from its surroundings. It can be real (like the walls of a container) or imaginary (like a line drawn around a region of space). ”
Thus we make no error by defining the Earth’s surface or any part of it as a system.
Oh well. Again you are way outside your lane of expertise.
You have missed the point. Try responding to what I am actually saying.
Did just that.
“Surface plus atmosphere is the system. Not the surface alone, or atmosphere alone.”
So claims a Google-trained Thermodynamics expert!
If that were true, then none of the Thermodynamics experiments ever done, which were done on subsets of the Earth’s surface, would have been valid.
Define the boundary for what you believe is the thermodynamic system, “Earth’s surface”. Does it include the near-surface atmosphere? How much of it does it include, if so? How far deep into the ground or ocean is classed as “surface”?
The surface and nearby air are close in T. These are details that don’t affect the general principles being discussed here.
As I expected, you cannot define a boundary. Not a thermodynamic system then, is it?
Now, I have answered all your questions. You have four things to admit.
Off you go. Get admitting.
“Not a thermodynamic system then, is it?”
Still carrying on with the charade that you are now a Thermodynamics authority?
I showed you why your claims were absurd. They still are.
The argument is over.
The argument was over some time ago, Nate. You claim that both TH and TC can increase as the result of a radiative exchange, but you cannot provide the requested support. So, that’s that.
It “can’t be both”.
You say my claims are absurd, but I haven’t really made any. This discussion has by far been mostly about your claims, and your inability to support them.
“Yep, that means heat flow from the Earth surface does not tend toward 0, as you erroneously claimed.”
I claimed that heat flow between the surface and the atmosphere would tend towards zero, and that, of course, is correct. I never said it would reach zero…but, like any other example of heat flow, it does tend towards zero. Just like any objects out there under the Sun, hot objects tend to cool, warming up cooler objects. Temperatures of objects, surfaces and “things” tend to “try” to equilibrate. I don’t even see how this is remotely controversial.
“Earlier you claimed that the surface has a temperature and the atmosphere has a temperature and they exchange energy, so you were treating them as two systems.”
Well, the surface radiates upwards. There’s no doubt about that. So, I don’t have a problem putting “the surface” into the radiative heat transfer equation. It’s just when you start trying to claim it’s a thermodynamic system that I point out, quite rightly, that no two people can agree on what exactly constitutes “the surface”. This allows you to make all sorts of claims about 1LoT that I don’t think are justified. Radiation travels upwards from “the surface”, to be sure, but how much comes from the actual ground or ocean surface itself and how much comes from the near-surface atmosphere is a huge grey area.
Other than that, what claims have I made? Very few, I expect. I’m mostly just questioning your claims, and asking you to support them, as I said. That it “can’t be both” simply follows from your failure to back up your bull.
I found this in a physics textbook:
"Assuming that an object with a temperature T1 is surrounded by an environment with uniform temperature T2, the net rate of heat transfer by radiation is
Q̇_net / t = σ(T₁ − T₂)
where ε is the emissivity of the object alone… When T₂ > T₁, the quantity
Q̇_net / t
is positive; that is, the net heat transfer is from hot to cold."
https://phys.libretexts.org/Bookshelves/College_Physics/College_Physics_1e_(OpenStax)/14%3A_Heat_and_Heat_Transfer_Methods/14.07%3A_Radiation
This establishes that the NET radiation exchange determines the direction of heat flow.
For two large blackbody plates the equation can be simplified:
Q̇ = σ(T₁ − T₂)
Missing from this equation, because I don’t know how to format it, is the 4th power attached to each T (Stefan-Boltzmann equation). But it makes no difference to the result that the direction of heat flow is determined by the sign of Q.
There are plenty of textbooks defining the direction of heat transfer as being from the surface or body that radiates more to the other surface/body. That should end this debate. I’ll provide further references if needed.
I was unable to find in any online textbook an example of two bodies heated by an external power source. More usually 2-plate setups hold the temperatures of one or both of the plates fixed (as if maintained by an internal power source), so there is no analogue at all to furnish us with a solution to our scenario.
However, we can resolve the issue with the knowledge that we have.
1. The direction of transfer of ‘heat’ (per second Law definition) in a purely radiative environment is government by the NET exchange of radiation. There is no other definition that determines heat flow in a purely radiative environment.
2. If a blackbody plate in space is heated by the sun, a second blackbody plate placed beyond the first, that receives no solar radiation, is only heated by the first plate. Immediately, this second plate only gets half the radiation that the first plate does.
3. Both plates, being blackbodies, absorb all incident radiation, regardless of source.
4. With the introduction of the 2nd plate, both plates must heat up, as now the 1st plate is absorbing more energy, while the 2nd plate is also receiving an ever increasing amount of energy.
5. While both plates warm, as they must, the NET radiative exchange is ALWAYS plate 1 to plate 2. The flow of heat is ALWAYS from the 1st pate to the 2nd plate, according to the equation above, found in many textbooks, which determines heat flow in a radiative scenario. Heat flows from the hotter to the cooler object. That’s it. Finito.
6. No energy is created, it is only redirected, and the higher rate of energy transfer is purely and ONLY a result of the rate of energy loss being slowed in plate 1.
7. Both plates heat up until the 2-plate system achieves radiative balance with the solar input.
8. Plate 2 cannot rise to the same temperature as plate 1, because it receives less energy than plate 1 at all times.
9. Blackbodies do not reflect at all. They only absorb and emit radiation at all frequencies.
10. None of this violates any law of thermo. Blankets, sweaters and insulation operate on the same principle – slowing the rate of heat transfer of heated objects/systems.
“I was unable to find in any online textbook an example of two bodies heated by an external power source.”
Thank you for your honesty, barry. You have confirmed what my own research suggested.
So, basically, you have found in a physics textbook the radiative heat transfer equation, that me and Nate have been discussing throughout. You claim to have read through this discussion.
Let’s be clear, barry – you have confirmed that I am correct. There is nothing in the radiative heat transfer section of any physics textbook that suggests:
1) Both TH and TC can increase as the result of a radiative exchange, when there’s a heat source present.
2) That radiative exchange between two surfaces is treated differently with a heat source present, than without.
because there are no examples with two bodies heated by an external power source.
Nice try baiting me with the Green Plate Effect, barry. I will not be discussing that again, though.
Your mention of blankets, once again, is amusing also. I completely demolished the blanket analogy further upthread, and you both ran a mile from that demolition. Neither of you have had anything substantive to say in response. So, you have returned to the conversation a week later and brought up blankets again, as if nothing has been said! Not very honest of you, barry.
So, well done on your honesty with your research, but naughty naughty on the blankets thing.
In any case, you’ve confirmed I’m correct.
It “can’t be both”.
I read Nate and your discussion up to the point where I said I did, and not since then. So if you’ve demolished’ the blanket as insulator thing, then please link to it. Last time I asked you to comment on it you said you didn’t do analogies.
As the scenario under discussion is not addressed in any physics textbook that I can find, it neither confirms nor denies the scenario under discussion.
The heat transfer equation is almost always addressed by holding the temperature of 2 plates or 2 bodies (enclosure/object) fixed, in order to get students to work out the NET radiative transfer. Having read that in quite a few resources, I know that in the GPE the flow of heat is always from the hotter to colder object, and never in any other direction.
I asked you to address my question on heat flow with a blanket. If the skin is warmed when the blanket covers it, why is the heat flow not from the blanket to the skin. Please explain how this works in terms of heat flow.
You didn’t address the arguments in my posts, just claimed that because the specific scenario under discussion is not addressed in science texts, therefore your view on it is right. But that’s a non-sequitur, as science texts don’t answer that question either way.
However, plenty of science te3xts confirm the GHE, and explain the physics, so I’m not sure how you get to cherry-pick which science texts we should respect.
I see claims of winning the argument from you, but no substance to it, and lots of “I don’t talk about” this or that when it doesn’t suit you.
All assertion, no argument, plenty of avoidance, and nothing science text based to back you up. Instead your view is in opposition to science texts. It’s a wonder you invoked them.
Feel free to address my arguments. I’ll take avoidance as a concession. Feel free to link me to whatever you wrote about blankets. I’m not reading two days of posts to find it, thanks.
You are not being honest about blankets, barry. I responded with my point about blankets whilst you were still responding to me. You just ignored it at the time. This was before you disappeared for a week. So, it is up to you. Start being honest, or not.
Naughty of you, too, to bring up the Green Plate Effect and act like it’s something new…not something we have already discussed ad nauseam. It would have been more honest of you to have at least linked to the last month-long discussion we had on the subject, so readers could look through it and reach their own conclusions.
As I said, I will not be discussing it again. Life’s too short.
All I will say on the matter of the Green Plate Effect is as follows:
With the blue and green plate pushed together, all have previously agreed that both plates will be the same temperature, 244 K. When separated, and the heat transfer mechanism between the plates thus switches from conductive to radiative, GPE proponents claim that the blue plate warms to 262 K, and the green plate cools to 220 K.
This, then, is not an example of both TH and TC increasing as the result of a radiative exchange. TH is increasing, but TC is decreasing, in the GPE. The GPE is then an example of the more typical GHE claim – like a colder atmosphere warming/insulating a warmer surface. It does not prove that it “can be both”…it suggests quite the opposite, in fact, even if we were to take it as being “correct”.
“As the scenario under discussion is not addressed in any physics textbook that I can find, it neither confirms nor denies the scenario under discussion.”
Very funny, barry. Central to all the GHE claims about back-radiation warming/insulation is this idea that “in the presence of a heat source, x, y and z of course occurs”. It’s always been stressed, the importance of the presence of the heat source, and the difference this supposedly makes. Yet…from the radiative heat transfer section of any physics text, you have nothing to support it!
And, that doesn’t bother you in the least.
“but your mistake is to treat each part of the system the same way, when each part of the system is not its own thermodynamic system.”
This is a good example of you asserting nonsense because you think a brief Google/AI search makes you an authority on Thermodynamics. It does not.
Any part of the atmosphere or the Earth’s surface can be considered a Thermodynamic system, and must obey 1LOT, simply by making an imaginary boundary around any part of it (as my quote above showed).
Here is a rminder of that: “Key aspects of a thermodynamic system: Boundary: The boundary defines the system and separates it from its surroundings. It can be real (like the walls of a container) or imaginary (like a line drawn around a region of space).”
That is how we (including you) are able to consider the temperature of just a portion of the atmosphere or the surface.
This is how the lapse rate of the atmosphere is determined, a parcel of air rises from the surface to high in the atmosphere and 1LOT is applied to it, to determine how its T will change with its height. This is standard in Meteorology and Roy Spencer can elaborate on it. For
“like any other example of heat flow, it does tend towards zero. Just like any objects out there under the Sun, hot objects tend to cool, warming up cooler objects. Temperatures of objects, surfaces and “things” tend to “try” to equilibrate. I don’t even see how this is remotely controversial”
Again this is your key long-standing confusion, which prevents you from understanding heat transfer and the GHE.
Only a system in equilibrium with ite environment would have heat flowing from it tending toward 0.
For some reason you cannot wrap your brain around the simple concept of energy balance. If a rock is placed in the sun, then it heats up until it reaches a temperature where its heat input from the sun and heat output to the atmosphere are equal, balanced.
It reaches this steady state condition, which is NOT a state of equilibrium with its surroundings, and therefore NOT one in which heat flows tend toward zero. It is a state in which heat flow is continuous but balanced. Your own quote confirms this: “Non-Equilibrium: The Earth’s surface, and indeed the entire Earth system, is not in thermodynamic equilibrium. The continuous energy input from the sun drives processes like weather, climate, and geological activity, keeping it in a state of disequilibrium.” This is your repeated error. And the reason that your argument will never work.
Nate, I’ve never doubted that you can draw an imaginary line. My point is that no two people will define a boundary for “the surface of the entire Earth” the same way. And, whether you include the near-surface atmosphere as part of your “surface”, and how much of it you include, or how deep into the ground or ocean surface you go…it’s all kind of a big deal. There is so much going on at the ground/ocean surface to near-surface atmosphere interface…a lot more besides just radiative exchange!
But, you’re not interested in questioning anything. You’re just interested in belittling me, and trying to dismiss the arguments I’ve made, in any way that you can.
You focus only on those parts of the discussion where you feel you can score some imaginary point, and you completely ignore the main thrust of what I’m saying.
It gets very boring indeed.
“Again this is your key long-standing confusion, which prevents you from understanding heat transfer and the GHE.”
There is nothing at all preventing me from understanding your story, Nate. I understand it perfectly. Always have.
This is a discussion about whether the GHE “can be both” the surface warming the atmosphere via GHGs and the atmosphere warming/insulating the surface via GHGs. Want to claim that it “can be both”, in the presence of a heat source? Then find an example, from the radiative heat transfer section of a physics textbook, where both TH and TC increase as the result of a radiative exchange!
You can’t. I can’t. barry can’t. Because, in reality, it “can’t be both”.
“Nate, I’ve never doubted that you can draw an imaginary line. My point is that no two people will define a boundary for “the surface of the entire Earth” the same way”
Poppycock.
“As I expected, you cannot define a boundary. Not a thermodynamic system then, is it?”
Again if I can draw an imaginary line anywhere I want the you are wrong.
And you were emphatic that only Earth surface and atmosphere together count as a thermodynamic system that must satisfy 1LOT and energy balance.
This was your point and it is quite wrong.
“Again if I can draw an imaginary line anywhere I want the you are wrong.“
Yeah, but you won’t. You won’t commit to defining a boundary for what is supposedly “the surface of the entire Earth”. Nor will anyone else. Whereas, with the entire Earth system, the boundary is obvious. So, my point stands. With no boundary, it’s not a thermodynamic system.
Now, repeat yourself again, whilst never defining a boundary.
“There is nothing at all preventing me from understanding your story, Nate. I understand it perfectly. Always have.”
False. If you understood, you would not keep making the same erroneous statements over snd over like:
“like any other example of heat flow, it does tend towards zero. Just like any objects out there under the Sun, hot objects tend to cool, warming up cooler objects. Temperatures of objects, surfaces and “things” tend to “try” to equilibrate.”
which shows that you fundamentally fail to understand heat transfer.
And it is the key reason you fail to correctly analyze problems like the GHE, the GPE and the steel greenhouse effect (shell).
Funny you should mention the Green Plate Effect, Nate. As I explained to barry, the GPE should help you understand that it “can’t be both”.
But, you can never admit when you’re wrong, so we’ll be here for another month or so, probably.
“I responded with my point about blankets whilst you were still responding to me.”
Yet you won’t point it out so I can read it. You know where it is, I don’t. Let’s see if you take anything up…
“With the blue and green plate pushed together…”
Avoided all my points and instead bring up your old one.
“The GPE is then an example of the more typical GHE claim – like a colder atmosphere warming/insulating a warmer surface.”
Insulating yes, “warming” (in the classic thermo sense) – no.
Just like blankets and sweaters insulate the warmer object, slowing its heat loss so that its temperature rises.
But you don’t want to deal with that.
“Yet… from the radiative heat transfer section of any physics text, you have nothing to support it!”
The fact this this particular model doesn’t get treated in heat transfer texts doesn’t mean it’s wrong. It only means it doesn’t get treated – like a thousand other scenarios you could come up with. The basics furnish the tools to arrive at the solution, as I showed above, and which, as usual, you ignored.
As you are so busy protesting you’re not going to discuss this in in any number of ways that I lay out, I’ll assume you have no answer to these arguments. No point entertaining your replies when they are non-responsive.
“As I explained to barry, the GPE should help you understand that it ‘can’t be both’.”
Wrong. The GPE has 3 components. In Gadden’s description there were four components. The GPE doesn’t work as an analogy for what Gadden was saying, but it works fine for its original purpose.
I wonder if you can name all 4 components in Gadden’s description.
Poor barry…completely unable to find my point on blankets. It must be so hard for him!
May 17, 2025 at 6:33 AM, barry.
I see you are now deliberately cutting out all the parts from my response on the Green Plate Effect which demonstrate I’m correct that the GHE “can’t be both”.
I’ll just copy and paste it in here, in full, again:
“With the blue and green plate pushed together, all have previously agreed that both plates will be the same temperature, 244 K. When separated, and the heat transfer mechanism between the plates thus switches from conductive to radiative, GPE proponents claim that the blue plate warms to 262 K, and the green plate cools to 220 K.
This, then, is not an example of both TH and TC increasing as the result of a radiative exchange. TH is increasing, but TC is decreasing, in the GPE. The GPE is then an example of the more typical GHE claim – like a colder atmosphere warming/insulating a warmer surface. It does not prove that it “can be both”…it suggests quite the opposite, in fact, even if we were to take it as being “correct”.”
Your only genuine response should be to acknowledge that the GHE “can’t be both”, barry. If I hear back anything else from you, I’ll know that you’re not debating in good faith.
This has been a particularly enjoyable win. Thank you.
“The GPE doesn’t work as an analogy for what Gadden was saying”
Lol, barry…if that were true, then why did you bring it up?
It’s been clear throughout this entire discussion that if the GHE can genuinely “be both”, then TH and TC need to increase as the result of a radiative exchange (with a heat source present).
You cannot find any examples of that occurring from the radiative heat transfer section of a physics textbook, and they do not even treat radiative heat transfer any differently with or without a heat source – there’s simply no examples with a heat source mentioned! So, the GPE was then your “big example” of how this all supposedly works.
Yet even if, for the sake of argument, we take the GPE as being “correct”, then it still only demonstrates TH increasing, not TC as well. In fact, it has TC decreasing!
That’s devastating for your own position that it “can be both”, barry.
“May 17, 2025 at 6:33 AM”
No cogent point made, nor does it answer my question.
You are avoiding saying anything except your cupful of mantras.
You could actually be intellectually honest and engage,and say that blankets work by convection, not radiation (they work with both), instead of avoiding the obvious rejoinder with your less committed “blankets don’t work that way.”
It’s weasely behaviour. You’re not openly engaging, you’re tightening your grip because if you engaged in good faith you’d get caught out.
In all these cases the point is that the transfer of heat through a system receiving energy is slowed down, causing warming.
That’s what you won’t openly address.
* That’s why you won’t explain why a blanket gets warmer while skin does, and that doesn’t break the 2nd law, because then you’d get asked why it’s different with the atmosphere slowing heat loss from the surface and you would have no good answer.
You’re avoiding, ducking and weaving and dodging.
I’m asking you a question you’ve never answered, while you’re trying to draw me back to a point I’ve addressed at length.
You can’t answer my question because you’d hoist yourself on your own petard if you answered honestly.
There’s the point, asterisked. You’ll read it and side-step it again, because you don’t have the goods on this, just a cupful of mantras.
But surprise me. The question has been unanswered for many days. Have a crack, if you think you won’t lose the argument by doing so.
“You could actually be intellectually honest and engage,and say that blankets work by convection, not radiation (they work with both)”
No, barry, ordinary blankets do not “work with both”. Space blankets “work with both”, but we weren’t talking about space blankets, and in any case the radiative part of the space blanket insulation functions via the reflectivity of the material, not through the same mechanism supposedly involved in the GHE.
And you want to question my intellectual honesty!
My point on blankets, just in case anyone reading this hasn’t been following:
“4) This is all I have to say about your obsession with blankets. If the much-discussed GHE back-radiation warming/insulation mechanism actually worked, then “blanket insulation” would work the same way. Everybody would note that blankets insulate, radiatively, in exactly the same way as is proposed for the GHE. But, “blanket insulation” doesn’t work that way. Which kind of says it all, really.”
Note that barry went to the ends of the Earth to avoid responding to this, and even though he has finally responded…he still has offered no rebuttal to it!
There is none.
“* That’s why you won’t explain why a blanket gets warmer while skin does, and that doesn’t break the 2nd law, because then you’d get asked why it’s different with the atmosphere slowing heat loss from the surface and you would have no good answer.”
Sorry, barry, but radiative heat transfer is different. Of course it’s different, because absolutely everything emits radiation, based on its temperature and emissivity. If it were the case that everything in existence could insulate everything else based solely on its emitted radiation, then the Universe would be a very hot place indeed!
Now, try to stop throwing so many false accusations around, calm down, and come to terms with the fact that your own big example (the GPE) shows that the GHE “can’t be both”.
“Sorry, barry, but radiative heat transfer is different”
Yep, conduction convection and radiation are all different modes of transferring heat from a warmer to a cooler object. All have heat flow increasing with greater differences between TH and TC.
That property and 1LOT are all that is needed to explain how both TH and TC can increase in this situation.
DREMT cannot explain why the differences in modes of heat transfer matters in this situation.
Lacking that, this is just another classic assertion without evidence.
He keeps asserting ‘can’t be both’ whole never supporting his claim with evidence.
Then demands proof that he’s wrong.
We’ve provided plenty of that.
And he’s tried but failed to find actual flaws in our facts and logic.
It matters not a bit that he claims to be unconvinced. It only matters that he has no rational counter argument.
And that’s where we have to leave it.
We’ll leave it with the Green Plate Effect proving me right.
What a fitting, glorious way to win yet another argument.
Thank you for my success.
https://www.drroyspencer.com/2025/05/uah-v6-1-global-temperature-update-for-april-2025-0-61-deg-c/#comment-1705318
When they don’t have any answers, they just sort of very quietly drop it, and move on. Readers will notice, though.
“GPE proponents claim that the blue plate warms to 262 K, and the green plate cools to 220 K.”
Yep, baffling why DREMT utterly fails to understand why vacuum would be a better insulator than metal.
And this increased insulation, together with a heat source, again the sun!, and 1LOT being applicable to each plate (each a valid thermodynamic system!), the heated blue plate has no choice but to warm.
But DREMT is unable to grasp these basic facts, logic, and common sense, and so he adopts the wrong answer and will not ever learn.
Reading comprehension failure, Nate, or are you just stupid?
You need both TH and TC to increase as the result of a radiative exchange, to be able to claim that the GHE “can be both”.
The Green Plate Effect proves you wrong, even if you take it to be “correct”.
Which I don’t, but that is irrelevant to this discussion.
“The Green Plate Effect proves you wrong, even if you take it to be “correct”.”
Not at all!
Just you failing to understand that different problems have different solutions.
But the GPE solution is correct nonetheless.
A comparable problem to the atmosphere/Earth surface with added co2 is adding a 3rd plate behind the green one, then both gp and bp warm.
It is Multi-layer insulation at work.
By the way, my understanding if the blanket is that you have a cold room with a blanket in equilibrium with it, ie also cold.
Then you put the blanket on. It warms from your body heat, and then your skin warms as a result of no longer being exposed to the cold room.
A similar GPE situation would be the GP held far away from any heat source and in equilibrium with the space @ 3K.
THEN the GP is brought up close behind the BP.
In that case the GP warms. And the BP no longer exposed on one side to the cold of space warms.
Both warm, like the blanket situation.
Nate…trying to introduce another plate, or bringing in a green plate at 3 K is pure, shameless obfuscation, and you know it!
The equilibrium temperature for the blue plate, on its own, is 244 K. Thus, having both plates pushed together, each being at 244 K is the perfect, logical starting point to see what happens as the result of switching to radiative heat transfer. On separating the plates, the BP supposedly warms and the GP supposedly cools. If you were correct that the GHE “can be both”, then both BP and GP would increase in temperature as the result of the radiative exchange. They don’t.
So, you are wrong.
And, as usual, you can’t accept that you’re wrong.
Bringing in a green plate at 3 K is like your trick with looking at the atmosphere in the morning when the Sun rises, after it had all night to cool. You’re just shameless, Nate.
The Green Plate Effect proves you wrong.
DREMT: “On separating the plates, the BP supposedly warms and the GP supposedly cools.”
To their new thermodynamic internal equilibrium consistent with 2LOT since isolated system entropy increases. This occurs if the green plate (no given initial temperature) is originally brought in at the same initial temperature 244K as the blue plate.
“If you were correct that the GHE “can be both”, then both BP and GP would increase in temperature as the result of the radiative exchange. They don’t.”
When separated at equilibrium. The green plate though could be originally brought in at any nonequilibrium temperature (since green plate initial T was not specified nor does it need to be) that shows a GP increased T at equilibrium.
So it is DREMT that is wrong & Nate is shown correct because the green plate initial temperature was not specified.
If you need to cool the GP in some way beforehand in order for it to increase in temperature along with the supposed increase in the BP then it’s not representative of the GHE any more. It’s just some ridiculous, contrived situation. The GHE is supposed to increase temperatures beyond what could be found given the Earth’s distance from the Sun, etc. That is why 244 K…244 K is the correct logical starting point for the plates. And, that is why the supposedly resulting 262 K…220 K demonstrates that the GHE “can’t be both”.
“Thus, having both plates pushed together, each being at 244 K is the perfect, logical starting point to see what happens as the result of switching to radiative heat transfer.”
In your ill-logic, but not in reality.
“On separating the plates, the BP supposedly warms and the GP supposedly cools.”
Exactly what would happen if the blanket was glued to the person as a starting point, and then unglued and separated.
Or if the atmosphere was squished down into a thin layer in contact with the surface as a starting point, then spread out into its normal volume.
Again for the very slow learners, different heat transfer problems have different solutions.
Deal with it.
I explained in my 1:00 AM comment, which you have ignored, exactly why 244 K…244 K is the correct starting point for the plates.
The Green Plate Effect proves you wrong, Nate.
“I explained in my 1:00 AM comment, which you have ignored, exactly why 244 K…244 K is the correct starting point for the plates.”
I explained in my 4:42 AM comment, which you ignored, why squeezing plates together is not like either the blanket or GHE setup.
You just need to look at Roys data to see that the troposphere temperature 45 years ago was cooler than now, as was the Earth’s surface.
Not because they were squeezed together like the plates.
They have both warmed by increasing the GHE.
By the way, in the initial Eli post on the GPE, it starts with the BP in the sun. Then he says: “Now let’s add another plate. We’ll color this plate green for greenhouse. It is heated by the first at a rate of 200 W/m2. But after awhile, it too has to heat up and reach an equilibrium temperature..”
“The GHE is supposed to increase temperatures beyond what could be found given the Earth’s distance from the Sun, etc. That is why 244 K…244 K is the correct logical starting point for the plates.”
The correct logical starting point would be the Earth with no atmosphere. Equivalent to the BP with no GP.
“Squeezing the plates together” is irrelevant.
It’s only relevant what temperature we introduce the GP at.
The BP, on its own, will be 244 K.
You have no justification for bringing the GP in at 3 K. Any more than I’d be justified in bringing it in at 400 K!
The logical temperature to bring it in at is 244 K. That would be equivalent to the 255 K for the Earth. The argument has been made that the GHE “can be both” the surface warming the atmosphere via GHGs (making it more than it would otherwise be, i.e above the 255 K) and the atmosphere warming/insulating the surface via GHGs (making it more than it would otherwise be, i.e above the 255 K). So both TH and TC should increase beyond 244 K as a result of the radiative exchange, if the GHE “can be both”.
The Green Plate Effect proves you wrong.
“It’s only relevant what temperature we introduce the GP at.
The BP, on its own, will be 244 K.”
Yep and Eli brought it in from a colder environment, just as the blanket is brought in from a colder environment.
And in both cases the TC and TH both warm, which you claim, still without evidence or reasoning, cannot happen.
Obviously it can.
My previous comment, in its entirety, eliminates any possible confusion still remaining, and settles the issue once and for all.
The Green Plate Effect proves you wrong.
You have no answers.
Instead use the patented DREMT tactic which is to pretend no opponent rebutted your claim, then repeat the claim, and declare it proven.
Everyone can clearly see that you are full of sh*t.
The proven fact is that the GPE, as originally stated, is easy to solve, and shows that the bodies at TH and TC both warm. Just as is true for the blanket and person.
There is no rationale to support your claim of ‘can’t be both’, or that heat transfer by radiation changes the result.
Nate, you only quoted from the very beginning of my comment. You completely ignored the main thrust of what I was saying…as per usual.
Unsurprisingly, this discussion has not been about whether two objects, super-cooled to a ridiculous 3 K, will then warm in the presence of a heat source! That’s just your desperate sophistry.
Read my comment in full. Then acknowledge that you’re wrong.
Correct Nate, DREMT stopped commenting about the original 2017 GPE and invented the DREMTgpe which is different in that the green plate starts at a DREMT given 244K not an Eli given unspecified GP T.
Humorous DREMT 1:00am just laughably makes up stuff (e.g. “cool the GP”) to suit a need.
Sorry guys, in the GPE the “244 K” temperature corresponds to the well-known “255 K” temperature wrt Earth’s supposed GHE. Shame that neither of you were intelligent enough to work that out.
My 8:27 AM comment, in its entirety, eliminates any possible confusion still remaining, and settles the issue once and for all.
The Green Plate Effect proves you wrong.
DREMT
DREMT,
You consistently overrate the quality and significance of your posts. Simply, you too easily get high on your own supply.
You simply cannot deny that the original GPE has the GP initially cold and warming up, as does the BP.
And more importantly, this matches the blanket scenario.
The GPE clearly satisfies your only objection to the blanket scenario, that it didn’t involve radiant heat transfer.
I see nothing in your posts that deals honestly or effectively with this rebuttal to your claim.
The 255K thing is a moving of the goal posts.
Nate, TC at 220 K is less than 244 K. You need TC to be more than 244 K.
Oh well, better luck next time.
And, God knows why you are still talking about blankets, given that you never had a response to my complete demolition of that analogy.
You are in no position to talk about shifting the goalposts given what you are trying to pull with the GP. I am not shifting the goalposts at all, I am simply making sure it is understood how the GPE relates to the GHE with what we are discussing.
My 8:27 AM comment, in its entirety, eliminates any possible confusion still remaining, and settles the issue once and for all.
The Green Plate Effect proves you wrong.
“You simply cannot deny that the original GPE has the GP initially cold and warming up”
So it looks like you will shamelessly deny the plain truth.
So you’ve entered pure tro.ll mode.
Here again is Eli:
“Now let’s add another plate. We’ll color this plate green for greenhouse. It is heated by the first at a rate of 200 W/m2. But after awhile, it too has to heat up and reach an equilibrium temperature..”
https://rabett.blogspot.com/2017/10/an-evergreen-of-denial-is-that-colder.html
And here is another article discussing it, showing a calculation the warmup of both plates.
https://skepticalscience.com/graphics.php?g=473
Sure, Nate. Eli says what he says. But, Eli’s not exactly going to admit that his Green Plate Effect is problematic for the Green House Effect, now is he? So, of course he will state that the GP warms, implying it’s somehow been introduced at a lower temperature than 220 K in the first place. Forgetting that his problem is located at a distance from the Sun where such objects as the GP would in fact be 244 K on their own. Let’s say the two plates are side by side, in view of the Sun, rather than one behind the other. Both would be 244 K. So, how exactly is the GP going to be introduced at a lower temperature than 220 K? It has to either be cooled, somehow, or magically brought in from deep space! A contrived, silly scenario, either way.
My 8:27 AM comment, in its entirety, eliminates any possible confusion still remaining, and settles the issue once and for all.
The Green Plate Effect proves you wrong.
Reminder that your main issue with the blanket was that there are no blankets that insulate, radiatively:
“If the much-discussed GHE back-radiation warming/insulation mechanism actually worked, then “blanket insulation” would work the same way. Everybody would note that blankets insulate, radiatively, in exactly the same way as is proposed for the GHE. But, “blanket insulation” doesn’t work that way. Which kind of says it all, really.”
Again for the slowest learners in the class: the GPE as posed by Eli demonstrates a radiative blanket effect, with the identical result that both TH and TC (the blanket T) warm. Exactly what you claimed was missing.
But as we see, moving the goal posts has become necessary.
Sorry, Nate, but any honest and rational appraisal of the Green Plate Effect shows that it actually claims TH increases whilst TC decreases as a result of the radiative exchange.
“But, Eli’s not exactly going to admit that his Green Plate Effect is problematic for the Green House Effect, now is he? So, of course he will state that the GP warms, implying it’s somehow been introduced at a lower temperature than 220 K in the first place.”
Sure, he must of anticipated your argument back in 2017, so he preemptively undermined it…
If there was doubt before, there can be none now, that you are totally full of sh*t.
Hint: when claiming that X cannot happen, keep in mind that ANY example of X happening proves you wrong!
Nate, context is important. As I explained earlier:
““Squeezing the plates together” is irrelevant.
It’s only relevant what temperature we introduce the GP at.
The BP, on its own, will be 244 K.
You have no justification for bringing the GP in at 3 K. Any more than I’d be justified in bringing it in at 400 K!
The logical temperature to bring it in at is 244 K. That would be equivalent to the 255 K for the Earth. The argument has been made that the GHE “can be both” the surface warming the atmosphere via GHGs (making it more than it would otherwise be, i.e above the 255 K) and the atmosphere warming/insulating the surface via GHGs (making it more than it would otherwise be, i.e above the 255 K). So both TH and TC should increase beyond 244 K as a result of the radiative exchange, if the GHE “can be both”.
The Green Plate Effect proves you wrong.”
“Sure, Nate. Eli says what he says.”
Yep, he described the GP (TC) warming up. Glad you finally agree.
“any honest and rational appraisal of the Green Plate Effect shows that it actually claims TH increases whilst TC decreases”
Oh well, In DREMTs world there is no truth.
The truth is, I had no idea you would sink so low as to invoke objects artificially cooled below 220 K to try to score some point or other. Maybe I should not have overestimated you. All that aside, you have an awful lot to respond to. Perhaps it is time to just admit you are wrong.
“The truth is, I had no idea you would sink so low as to invoke objects artificially cooled below 220 K”
Nothing artificial about it. It is the GPE problem as it was posed.
It is an unheated passive object brought in to insulate the BP from the cold environment.
Just as the blanket is an unheated passive object brought in to insulate the person from the cold environment.
You just cannot let go of your notions when they turn out to be are wrong.
Nate, you’re completely ignoring every single argument I’ve made.
If that helps you to “self-soothe”, then great. But, don’t expect it to convince anyone reading.
“Nate, you’re completely ignoring every single argument I’ve made.”
Riight… that’s the only possible explanation for your arguments failing.
But then how has there been another nearly month long discussion?
Hmmm!, puzzling.
Most significantly, the arguments in this comment:
May 28, 2025 at 8:27 AM
and this comment:
May 29, 2025 at 6:03 AM
remain unaddressed. All you did in either case was quote from the beginning of the comment and completely ignore the main thrust of the argument. As per usual.
As it stands, the GP being at 220 K, below 244 K, demonstrates that the GHE “can’t be both”.
Responded to them here:
https://www.drroyspencer.com/2025/05/uah-v6-1-global-temperature-update-for-april-2025-0-61-deg-c/#comment-1705444
Which you never addressed
You offer an opinion as to what the natural T to bring in the GP should be. But it makes no sense to me.
You have the sun as its heat source initially, which of course makes it warmer. Then move into the shade, leaving only the BP as it’s heat source, so naturally it is cooler.
But the point of insulation is it is unheated passive material. When installed it is warmed by whatever body is being insulated.
So cold blanket warmed by human, cold GP warmed by BP, cold atmosphere warmed by Earth surface.
I think you understood it clearly here:
“Between the surface and the atmosphere. In the RHTE, TH is the surface, and TC the atmosphere. TC will increase as a result of this exchange”
You’ve got to be kidding if you think what you linked to, or what you’ve said there, is in any way a rebuttal to either comment.
You’ve become completely unresponsive.
This:
“It is an unheated passive object brought in to insulate the BP from the cold environment.”
Referring to the GP introduced at under 220 K, is absurd. At the distance from the Sun that the plates are, you would have to either artificially cool the GP somehow, or magically summon it from deep space, in order for it to be introduced at under 220 K. Neither scenario relates to the GHE.
My other, earlier, comment, you do not even touch on. Do I need to write it out in full for a third time!?
‘It is an unheated passive object brought in to insulate the BP from the cold environment.’
Yep just as a blanket is an unheated passive object, which you always fail to acknowledge, and gets heated by the person.
Just as the atmosphere gets heated by the Earth surface as you EXPLAINED.
“Referring to the GP introduced at under 220 K, is absurd. At the distance from the Sun that the plates are, you would have to either artificially cool the GP somehow, or magically summon it from deep space”
Not absurd at all. It is an F*ing thought experiment!
Eli set it up how he did to mimic the cooler atmosphere being warmed by the solar heated Earth.
Calm down and get a grip man.
in order for it to be introduced at under 220 K. Neither scenario relates to the GHE.
Nate, you can bring a blanket in from a cooler part of the room. You cannot magically teleport a plate in from deep space. You don’t seem to fully understand the ramifications of that. Or, maybe you do, but you’re just playing dumb. This has to actually relate to the GHE. You cannot introduce a somehow pre-cooled atmosphere to the Earth!
I’ll post this in again:
““Squeezing the plates together” is irrelevant.
It’s only relevant what temperature we introduce the GP at.
The BP, on its own, will be 244 K.
You have no justification for bringing the GP in at 3 K. Any more than I’d be justified in bringing it in at 400 K!
The logical temperature to bring it in at is 244 K. That would be equivalent to the 255 K for the Earth. The argument has been made that the GHE “can be both” the surface warming the atmosphere via GHGs (making it more than it would otherwise be, i.e above the 255 K) and the atmosphere warming/insulating the surface via GHGs (making it more than it would otherwise be, i.e above the 255 K). So both TH and TC should increase beyond 244 K as a result of the radiative exchange, if the GHE “can be both”.
The Green Plate Effect proves you wrong.”
“Nate, you can bring a blanket in from a cooler part of the room. You cannot magically teleport a plate in from deep space.”
You are hyperventilating. You suggest something that would be difficult is not allowed in a thought experiment!
Just stop. Breathe into a paper bag. And let go of all your troubles.
Nate’s projecting again.
“You are hyperventilating. You suggest something that would be difficult is not allowed in a thought experiment!”
No. You can do whatever you like in a thought experiment. The point you keep missing (deliberately?) is that this has to actually relate to the GHE. You cannot introduce a pre-cooled atmosphere to the Earth, so why have something pre-cooled in your analogy? All we can do is imagine an Earth with an atmosphere without GHGs (so the atmosphere is at 255 K, supposedly) and then add the GHGs. So that would be a starting point of Earth’s surface at 255 K, and the atmosphere above it at 255 K. Then add GHGs. The radiative exchange begins.
This compares with the GPE starting at 244 K…244 K.
So, what you needed to see from the GPE was both BP and GP increasing in temperature from 244 K as a result of the radiative exchange. But, you don’t get that. Even if you assume it’s correct.
So, the GHE “can’t be both”. Radiative heat transfer just doesn’t work that way.
“radiative heat transfer is different”
A different mechanism but the principle is the same (reduction of heat loss), and you won’t say why that principle doesn’t work with radiation because that will expose you.”It’s different” isn’t an explanation – it’s a dodge.
Of course the surface and atmosphere BOTH get warmer when you introduce GHGs to the atmosphere, just as the blanket and the skin surface BOTH get warmer when covering the body with a blanket.
In BOTH cases the rate of heat loss from the surface is reduced.
In BOTH cases both components warm up until a new equilibrium is reached.
But you can’t explain WHY this happens by conduction (and radiation) with a blanket, but NOT by pure radiation.
You are twisting in the wind trying NOT to mechanistically explain the difference. Because if you dared lay that out you would be contradicting what you’ve said upthread, and reveal the poor assumption you keep avoiding articulating.
The opportunity is still there for you to explain why its different for radiation. What are the nuts and bolts here?
Or will you dodge the question forever?
“Of course the surface and atmosphere BOTH get warmer when you introduce GHGs to the atmosphere…”
…not according to the Green Plate Effect. See my responses to Nate, recently (and if you are not going to read through the discussion, don’t bother to take part in it).
“…just as the blanket and the skin surface BOTH get warmer when covering the body with a blanket…”
…only because the blanket can be “pre-cooled”. The atmosphere cannot. See my responses to Nate, recently (and if you are not going to read through the discussion, don’t bother to take part in it). Basically, you can bring in a blanket from a colder part of the room (and anywhere not on your body is a colder part of the room), but you cannot bring in an atmosphere from a colder part of space. That is where your analogy fails. I mean, I literally just finished explaining it to Nate.
“only because the blanket can be ‘pre-cooled’. The atmosphere cannot…
…Basically, you can bring in a blanket from a colder part of the room (and anywhere not on your body is a colder part of the room), but you cannot bring in an atmosphere from a colder part of space. That is where your analogy fails.”
This is barely coherent. You seem to be saying that the only valid theories are those that can be directly experimented on.
You have yet again dodged the point, now calling foul with, “bad analogy.”
Rather than stacking these acorns in front of the burrow, why not just describe the nuts and bolts of why radiation can’t slow heat loss.
You’ve done it before. What ails you, DREMT?
“This is barely coherent. You seem to be saying that the only valid theories are those that can be directly experimented on.”
If you can’t understand, then maybe you should be reading through the discussion you’re commenting on, before commenting! I have trashed the blanket analogy in two different ways now, but apparently you’re obsessed with it, and it’s the only thing you will talk about!
I forget his name, but one of our regulars did the GPE experiment. And in it his BP was heated by a lamp. The GP was initially moved to the side as the BP warmed, then the GP was moved into place, and it warmed as did the BP.
Nothing artificial about this. The idea being that an unheated passive object, at ambient temperature, brought in can be an insulator of a heated object, raising its temperature. Raising both temperatures.
As is the case for the original GPE thought experiment.
As is the case for the blanket warming person.
And Barry is correct that DREMTs claims it doesn’t work for radiant heat transfer because it is ‘different’ lacks support. He offers no rationale or evidence.
Well, I’ve made my case that the Green Plate Effect demonstrates the GHE “can’t be both”. Nate won’t respond to it, barry won’t even read it. All fairly predictable. “That’s that”.
Again demonstrating that if one only ever looks at ones own arguments, they seem brilliant.
Snide remarks aren’t rebuttals. Readers will note that you have not addressed my arguments at all, let alone refuted them…and that’s all that matters.
With your comment on Swanson’s experiment you make similar mistakes. You seem unable to relate the various examples to the GHE. With his experiment, turning on a heat lamp is like adding a second Sun, or increasing the output from the existing Sun. Of course the GP/atmosphere is going to warm in that case!
As I refute each example you just introduce something else, whilst never addressing my comments. What will you try next?
“Rather than stacking these acorns in front of the burrow, why not just describe the nuts and bolts of why radiation can’t slow heat loss.
You’ve done it before. What ails you, DREMT?”
Radiation can’t slow heat loss? And you attribute this to me? A reduction in heat loss refers to insulation. I don’t dispute at all that radiative insulation exists. I already explained this earlier, but let’s just ask Google AI:
“Does radiative insulation function via reflectivity?
Yes, radiative insulation works primarily through reflection. Specifically, it utilizes highly reflective surfaces, often aluminum foil, to bounce radiant heat back towards the source, preventing it from entering or escaping a space. This is in contrast to traditional insulation which primarily functions by reducing heat transfer through conduction and convection. Here’s a more detailed explanation:
Radiant Heat Transfer:
Radiant heat, like the heat from a radiator or the sun, travels through the air in the form of infrared radiation.
Reflective Surfaces: Radiant barriers and reflective insulation materials have highly reflective surfaces that are designed to reflect a significant portion of this infrared radiation.
Reducing Heat Gain/Loss: By reflecting the heat, these barriers minimize heat gain in summer (keeping the inside cool) and heat loss in winter (keeping the inside warm).
Air Space: For the reflection to be effective, a reflective surface needs an air space on at least one side of it. This air space helps to reduce heat transfer through conduction and convection, further enhancing the insulation’s effectiveness.”
And, before you get all excited about the word, “primarily” – it mentions that air spaces are used to help reduce heat transfer through conduction and convection. So that’s why it’s “primarily” working via reflection and not “entirely” working via reflection.
Will you leave this distraction now, or will you pursue it some more, diverting attention away from the demonstration that the GHE “can’t be both”?
I addressed it, Barry addressed it, and Roy addressed it.
You get a notion, fall in love with it, then ignore any criticism of it.
You ignore the fact that insulation is passive, it takes up heat only from the heated object being insulated.
Hence the blanket, Elis GP, and Swanson experimental GP are all initially at ambient T. Then they are brought in to insulate the heated body, and warm as a result of heat loss from THAT body, until they reach a steady temperature, at which both bodies have warmed.
Any one of these cases falsifies your claim that ‘can’t be both’ that warm.
Finding a way to modify the original GPE to pre-heat it with the sun, cannot undo the other cases that falsified your claim.
Thus is equivalent to putting the blanket on a blanket warmer heating it to 40C and then putting it on the person and having it cool down a few degrees.
Nothing fundamental demonstrated by that!
It all is just missing the point that insulation is passive, and ultimately heated by the body it is insulating.
And finally the lower half of the troposphere does end up warmer than your 255 K, via the GHE, as Roy explained.
Are you suggesting that he got it wrong?
And indeed reflective surfaces are MORE effective as radiant insulation, yet as you’ve seen and ignored about a dozen times, multi-layer-insulatuon MLI also works with high emissivity layers.
https://en.m.wikipedia.org/wiki/Multi-layer_insulation
We know you don’t do math, but if you did you could see the equation for heat transfer shows reduced heat transfer even when emissivity, e = 1.
ThE GPE, demonstrates MLE works with e=1 and is proven mathematically and experimentally to work.
We know you don’t do common sense, but if you did, you could see that it works because a layer of vacuum transfers less heat than a layer of metal, as everyone with common sense gets.
Wrong, Nate. Nobody has addressed it! Again:
1) In the GPE, the “244 K” is equivalent to the “255 K” in the GHE.
2) Thus, if the GHE “can be both”, you would expect the final temperatures in the GPE to both be above 244 K.
3) The final temperatures in the GPE, even if we take it to be correct, are 262 K…220 K.
4) So, the GHE “can’t be both”.
It’s so simple. And you have nothing to refute it.
“Does multi layer insulation function via reflectivity?
Yes, multilayer insulation (MLI) functions primarily via reflectivity, specifically in reducing radiant heat transfer. MLI consists of multiple thin layers of reflective material, like metal foil, separated by low-conductivity spacers. The reflective surfaces minimize the amount of heat radiated, while the spacers prevent heat conduction between layers.
Here’s a more detailed explanation:
Reflective Surfaces: The primary mechanism is the reflection of radiant heat back into the system or away from the protected area. The reflective materials, like metal foil, have a low emissivity, meaning they reflect a high percentage of incoming radiation.
Reduced Radiation Transfer: Each layer reflects a portion of the heat, and with multiple layers, the cumulative effect significantly reduces the amount of heat reaching the final layer or the protected area.
Conduction Reduction: While MLI excels at reducing radiation, it also minimizes heat conduction through the spacers between the reflective layers. These spacers are typically made of low-conductivity materials, further limiting heat transfer.
Vacuum Environments: MLI is particularly effective in vacuum environments, like those in outer space, where radiation is the dominant mode of heat transfer. In such environments, the lack of air prevents convection, making MLI’s reflectivity and low conduction properties even more crucial.”
Stuck in pure denial mode.
“1) In the GPE, the “244 K” is equivalent to the “255 K” in the GHE.”
Pure assertion.
Yet the lower half of the troposphere warms above 255 K with GHE, as Roy demonstrates. Debunked.
“2) Thus, if the GHE “can be both”, you would expect the final temperatures in the GPE to both be above 244 K.”
Wrong. 244K is the plate warmed by a heat source above ambient temperature.
As explained ad nauseum. You don’t listen.
Debunked.
“3) The final temperatures in the GPE,
even if we take it to be correct, are 262 K…220 K.
Which represents warming of both in the original and experimental GPE.
“4) So, the GHE “can’t be both”.
As shown by Roy Spencer, the GHE IS both.
Only one counter example debunks this.. Several examples where it is both are shown.
You have no sound rationale to support this claim.
So you just deny reality.
Now repeat your false claims again.
Weird responses from Nate.
““1) In the GPE, the “244 K” is equivalent to the “255 K” in the GHE.”
Pure assertion. Yet the lower half of the troposphere warms above 255 K with GHE, as Roy demonstrates. Debunked.”
Huh? Pure assertion? The effective temperature of the Earth is 255 K. The effective temperature of the BP is 244 K. The equivalence of the figures is that it is the temperature of the objects due to their distance from the Sun, etc. So no, 1) is not debunked.
““2) Thus, if the GHE “can be both”, you would expect the final temperatures in the GPE to both be above 244 K.”
Wrong. 244K is the plate warmed by a heat source above ambient temperature. As explained ad nauseum. You don’t listen. Debunked.”
No, see response to 1). 244 K is the “effective temperature”. So yes, obviously the plates should both warm above this temperature if the GHE “can be both”.
““3) The final temperatures in the GPE, even if we take it to be correct, are 262 K…220 K.
Which represents warming of both in the original and experimental GPE.”
No, Nate. Obviously 220 K is lower than 244 K.
““4) So, the GHE “can’t be both”.
As shown by Roy Spencer, the GHE IS both. Only one counter example debunks this.. Several examples where it is both are shown. You have no sound rationale to support this claim. So you just deny reality. Now repeat your false claims again.”
4) just follows logically from the first 3. Silly Nate, unable to follow simple logic. Oh well.
“Yes, multilayer insulation (MLI) functions primarily via reflectivity, specifically in reducing radiant heat transfer.”
It works with emissivity =1 plates as the link and the equation, if you could do basic math, shows.
As Eli and many others proved, the GP insulates the BP radiatively. He proves this simply with the RHTE, and 1LOT, which you earlier agreed applies to any thermodynamic system, and clearly each plate qualifies as one, as you learned.
So naturally this contradictory information is shamelessly ignored again.
“Pure assertion. Yet the lower half of the troposphere warms above 255 K with GHE, as Roy demonstrates. Debunked.”
“Huh? Pure assertion? The effective temperature of the Earth is 255 K. The effective temperature of the BP is 244 K. The equivalence of the figures is that it is the temperature of the objects due to their distance from the Sun, etc. So no, 1) is not debunked.”
First we notice that you keep ignoring Roy’s work and the established fact that the lower troposphere is warmed above 255 K, by the GHE.
Address this.
Second Eli has the radiant insulation initially at the ambient background temperature. This matches the blanket situation.
You keep ignoring this.
Whereas you pre-HEAT the radiant insulation with the full sun. Then put it in the shade, only heated by the BP.
Naturally it is cooler.
This is equivalent to pre-heating ones blanket with a heater to body temperature, then when in use, it naturally cools below that.
Artificial.
“So naturally this contradictory information is shamelessly ignored again.”
Nate, literally all I did was quote Google AI. Sorry reality doesn’t agree with your beliefs.
“First we notice that you keep ignoring Roy’s work and the established fact that the lower troposphere is warmed above 255 K, by the GHE. Address this.”
Not my problem. It’s yours. I explained how the 244 K relates to the 255 K. Obviously, both plates should be warmer than 244 K if the GHE “can be both”.
“Second Eli has the radiant insulation initially at the ambient background temperature. This matches the blanket situation. You keep ignoring this.”
Silly Nate. For the GP to be introduced at temperatures below 220 K would require artificially cooling the plate, or teleporting it in from deep space. As I’ve explained ad nauseam. You have everything backwards, as usual. Your way is artificial, my way is natural.
“So naturally this contradictory information is shamelessly ignored again.”
“Nate, literally all I did was quote Google AI.”
Yep and literally ignoring any rebuttals with contradictory information. Leading to your inevitable claim that no one rebuttal your argument.
QED
“First we notice that you keep ignoring Roy’s work and the established fact that the lower troposphere is warmed above 255 K, by the GHE. Address this.
“Not my problem.”
Oh? Other than the fact that it debunks your claim that GHE cannot warm both surface and atmosphere.
“or teleporting it in from deep space. As I’ve explained ad nauseam.”
This is deemed a problem for the guy who invokes massless strings, and magnetic yoyos, etc.
It COULD easily be brought from far away, or from behind a mirror, or from the dark side of Moon, or simply turned 90 degrees to be parallel to the suns rays.
In a thought experiment this is literally not my problem.
For you it becomes a flimsy excuse to deny the obvious, that this one example falsifies your ‘can’t be both’ assertion.
Now perhaps whine a little more about it to self soothe.
Nate, I already explained that it’s not a problem to imagine whatever you want, in a thought experiment. The point is, it has to relate to the GHE. The atmosphere, without GHGs, and the surface itself, would begin at the same temperature (supposedly 255 K). This is equivalent, in the GPE, to starting at 244 K…244 K. Not 244 K and less than 220 K!
Then you add GHGs to the atmosphere, and then the radiative exchange begins.
The 262 K…220 K result, even if we take it to be correct, demonstrates that the GHE “can’t be both”.
“I already explained that it’s not a problem to imagine whatever you want, in a thought experiment.”
Good, the we can drop the pretense that it is a problem requiring ‘artificial’ cooling or ‘teleportation’ from deep space.
“The point is, it has to relate to the GHE.”
First off NO. Your ‘can’t be both’ statement was about any rad heat transfer problem with a heat source.
So that is a moving of the goal post.
Second, as pointed out and ignored as ‘not your problem’ the GHE involves both the surface and lower troposphere warming from 255 K, as Roy Spencer explained
“The atmosphere, without GHGs, and the surface itself, would begin at the same temperature (supposedly 255 K). This is equivalent, in the GPE, to starting at 244 K…244 K. Not 244 K and less than
220 K!”
Again, you forget that every heat transfer problem is different. It is a mistake to assume the GPE, with no atmosphere and no CO2 should be an exact match to the real GHE.
It is simply designed to illustrate how a passive material can radiatively insulate, and cause a heated body to warm.
It’s black body plates are not like the atmosphere with transparency at many wavelengths and its complex structure.
Google AI also doesn’t explain why non-reflective radiation can’t work to insulate the loss of heat. Now you’re describing a different set up while ignoring the question – yet again!
I asked ChatGPT about the issue. Here is the response:
“While reflective surfaces can be used to radiatively slow heat loss, blackbody shields can perform the same function in principle — reducing net radiative heat loss — but they do so less effectively and by a different mechanism.
Explanation:
A reflective surface (low-emissivity) slows heat loss by bouncing radiation back to the source with minimal absorption or emission. It reflects most of the outgoing thermal radiation.
A blackbody shield (high-emissivity) absorbs all radiation it receives and then re-emits it equally in both directions. When placed between a warm object (like a spacecraft) and cold space, it sends half of the radiation back to the spacecraft, effectively halving the radiative heat loss compared to having no shield at all.”
(emphasis as at source)
Which is exactly what I said last time you mentioned reflective thermal shielding.
And you still can’t explain mechanistically why radiation from non-reflective surfaces can’t act as insulators. AI is not helping you here.
No, I don’t have time to read days worth of comments while I’m working away from home. Either you can explain in physical terms why non-reflective surfaces can’t act as radiative insulators, or you can keep trying to deflect. But it’s very clear you know you will be exposed if you just answer the question. It’s why you keep pointing everywhere else instead of directly addressing the query.
“And Barry is correct that DREMTs claims it doesn’t work for radiant heat transfer because it is ‘different’ lacks support. He offers no rationale or evidence.”
I figured I’d come up empty-handed even if I had the time to read back.
You’re not describing the physics, DREMT. You’re still stuck, it seems, on the notion that a warmer body can’t absorb the radiation from a cooler body.
Or if that’s not the mechanics that prevents non-reflective surfaces being radiative insulators, you’re keeping the mechanics a mystery for very good reasons, no doubt!
Nate quotes me saying: “The point is, it has to relate to the GHE.”
and bizarrely responds:
“First off NO. Your ‘can’t be both’ statement was about any rad heat transfer problem with a heat source. So that is a moving of the goal post. Second, as pointed out and ignored as ‘not your problem’ the GHE involves both the surface and lower troposphere warming from 255 K, as Roy Spencer explained”
Lol. The entire discussion has been about the GHE, and whether it “can be both” the surface warming the atmosphere via GHGs and the atmosphere warming/insulating the surface via GHGs. I’ve not moved the goalposts, I’ve been trying to keep the examples relating to that, throughout!
Then Nate quotes me correctly saying:
“The atmosphere, without GHGs, and the surface itself, would begin at the same temperature (supposedly 255 K). This is equivalent, in the GPE, to starting at 244 K…244 K. Not 244 K and less than 220 K!”
and obfuscates:
“Again, you forget that every heat transfer problem is different. It is a mistake to assume the GPE, with no atmosphere and no CO2 should be an exact match to the real GHE. It is simply designed to illustrate how a passive material can radiatively insulate, and cause a heated body to warm. Its black body plates are not like the atmosphere with transparency at many wavelengths and its complex structure.”
I didn’t say anything about it being an “exact match”, Nate. But, generally speaking, if the “back-radiation warming/insulation” mechanism worked as advertised, and the GHE “can be both”, then you would expect both BP and GP to increase from 244 K. Just like the surface and atmosphere of the Earth are supposed to increase from 255 K.
The point is, you cannot get anything for free. The supposed warming of the BP comes at the expense of the GP. The supposed warming of the surface would have to come at the expense of the atmosphere.
barry, if you can’t be bothered to read through the discussion, don’t bother to comment on it. I’m tired of this game you keep playing.
You keep falsely accusing me of avoiding this, or not responding to that, when I’m at pains to respond to everything that has been brought up during this incredibly lengthy discussion. Your ridiculous fixation on this one issue is really bizarre, but look…Google AI makes perfectly clear that which you can find from your own research: radiative insulation works via the reflectivity of the material…and it’s the exact same thing with MLI.
But look…let’s suppose, for the sake of argument, that blackbody surfaces somehow can also radiatively insulate. Let’s suppose the Green Plate Effect is correct. Even then, the Green Plate Effect demonstrates that the GHE “can’t be both”.
So…what else is there to discuss? I don’t know what you want from me, barry. I even run through the scenario that you are correct, and still in the situation we’re discussing, I’m right overall.
“Let’s suppose the Green Plate Effect is correct. Even then, the Green Plate Effect demonstrates that the GHE “can’t be both”.”
The GPE demonstrates that both the BP and GP warm when the GP is introduced. The GP warms because it was at absolute zero when we introduced it, and the BP warms because its rate of heat loss is slowed (don’t forget the constant sun!).
We started withy Gadden’s description of the GHE, which posited an atmosphere with and without GHGs:
“Greenhouse gas molecules in the air absorb some of the outgoing infrared radiation and then deliver that energy to the air, making the air warmer than it OTHERWISE would have been.”
An atmosphere without GHGs is cooler than one with, and the surface is cooler under an atmosphere without GHGs than one with them.
Gadden didn’t mention the surface. But he is not wrong about the atmosphere being warmer with GHGs in it than without.
“You keep falsely accusing me of avoiding this, or not responding to that, when I’m at pains to respond to everything that has been brought up during this incredibly lengthy discussion. Your ridiculous fixation on this one issue is really bizarre, but look…Google AI makes perfectly clear that which you can find from your own research: radiative insulation works via the reflectivity of the material”
I’m looking for a mechanistic explanation of why you believe the surface cannot absorb radiation from the atmosphere, slowing its rate of heat loss – thereby becoming warmer.
If you have realised AGW is well corroborated, I missed you saying that.
GHGs cause both the atmosphere and surface to warm. If you don’t think so, you’ve yet to explain the physics. All I’ve seen is assertions about what can and cannot be and a brief summary on how reflector shields work. I haven’t seen you explain the mechanics of why “it can’t be both.”
OK, barry. What I am going to do for you is assume, for the sake of argument, that the Green Plate Effect is correct. Then I will explain, using the physics of the Green Plate Effect, why the GHE “can’t be both”.
So, in the GPE, the 244 K temperature is directly comparable to the 255 K temperature for the Earth. 255 K is the Earth’s effective temperature, i.e the temperature of the Earth given its albedo and distance from the Sun, etc. The 244 K is like the “effective temperature” of the BP.
We wish to analyse an Earth with an atmosphere without GHGs, add GHGs, then see what happens as a result of the radiative exchange between surface and atmosphere, in the presence of a heat source (the Sun). So, I assume you will accept that in absence of GHGs, it is postulated that both surface and the atmosphere above it will be at 255 K, the effective temperature.
This then correlates to starting the GPE with the plates at 244 K…244 K.
We then examine what happens as the radiative exchange begins between surface and atmosphere, or BP and GP, in the presence of the Sun.
The BP increases in temperature to 262 K, whilst the GP decreases in temperature to 220 K.
Oh dear. If the GHE “can be both”, then both surface and atmosphere should warm above the effective temperature as a result of the radiative exchange, in the presence of the Sun. But, according to the Green Plate Effect, that does not occur.
Instead, the BP, or surface, only increases in temperature at the expense of the GP, or atmosphere, which decreases in temperature.
Demonstrating that I am, in fact, correct. The GHE “can’t be both”.
“Lol. The entire discussion has been about the GHE, and whether it “can be both” the surface warming the atmosphere via GHGs and the atmosphere warming/insulating the surface via GHGs. I’ve not moved the goalposts,”
You don’t recall asking us to provide examples of rad heat transfer problem with a heat source where both TH and TC warm? No atmosphere required.
Convenient.
In any case the Eli version does that, and it is a radiative version of the blanket example.
Now, naturally, you move the goal posts.
Yes, Nate, I asked you repeatedly to support the idea that both TH and TC could increase as the result of a radiative exchange, with a heat source present. From the radiative heat transfer section of a physics text. On the unspoken understanding (or so I thought) that it would of course be relatable to the GHE, since that is what we were discussing in the first place. In other words, I was asking you to support your claim. You could not.
You, then, twist this into the idea that I’m making some counter-claim that two “things”, in radiative contact with each other, can never both increase in temperature under any circumstances…and set about trying to knock this straw man down via any means that you can.
And now, you falsely accuse me of trying to shift the goalposts simply because I’m pointing out whether or not the various examples actually relate to the GHE!
“On the unspoken understanding (or so I thought) that it would of course be relatable to the GHE”
Indeed unspoken. This is known as moving of the goal posts then claiming everyone understood where they were.
Standard playground move by the schoolyard bully when he loses.
Eli offered an example problem, that illustrates the undeniable principles at work with the GHE. Both plates warmed.
He solved with it with simple physics, which you still deny.
Then YOU changed it to a problem where
the GP is pre-heated!
Does your Mom pre-heat your blanket before you get in bed?
Nate whines, squawks and endlessly repeats the same mistakes whilst tossing out his usual barrage of false accusations. He’s apparently unfamiliar with the concept of “effective temperature”.
There is a lot to digest here. The question is not what “we” should do. but what can we do? China has more than half of all solar panels in use today — world-wide — but that is only about 7% of their electric production last time I looked at some data. The vast majority of the balance is from coal-fired plants, and that usage is still increasing. How many more solar panels and windmills does the world need?
The only reliable calculation of the greenhouse effect is to compare the current state of the earth versus a theoretical planet with no atmosphere. I claim it is not possible to separate greenhouse gases from clouds and other effects. It is further impossible to reliably separate the effect of CO2 from Water vapor, but it is clear that water vapor dominates the effect of other greenhouse gases. It is clever that people pushing an agenda leave out the effect of water and try to put everything on CO2.
The other game is methane which has a half-life somewhere around 10 to 12 years depending on who you believe. The current level of 2 ppmv is only twice the historic level, so the human impact is clearly not an important issue for honest people who are looking at the data.
China increased solar’s share of electrical generation from 6.2% in 2023 to 8.3% in 2024 – that’s a 2% annual share increase, or an increase of 1/3 over the previous year’s production total. That increase is also still non linear.
Obviously China can’t continue to increase its production by 1/3 every year, but a 7% share of the total is now history and ignores that China is increasing the rate of solar uptake continuously.
Remember, in 2010 solar made up 0% of the total. Should we reference that 2010 value today when arguing that solar won’t be significant in the future?
Since upper tropospheric humidity is not increasing as assumed in the IPCC climate models, there is no waterfall. I would re-assess the situation in 200 years after we hit 800 ppm.
You should show your observational evidence that, as you say, “ upper tropospheric humidity is not increasing,” since most recent peer-reviewed studies and satellite observations indicate that UTH is indeed increasing, broadly consistent with the expectations of climate models and the Clausius-Clapeyron relationship.
Opinions are not facts.
Only Arkady’s opinions are facts, apparently.
S. George Philander.
As the C02 effect on temperature is linear , where is the waterfall? much ado about nothing .
The radiative forcing from carbon dioxide is close to logarithmic; it’s definitely not linear.
This isn’t really in dispute. It also doesn’t mean on its own that any particular concentration is either good or bad.
Donald – that’s if you think we have cloud effects paramaterised properly.
Further, I doubt they have the impacts of a more humid world captured properly from a glacial perspective. There are a lot of high mountains in the tropics and large amounts of precipitation would change their albedo and the water cycle significantly, and very quickly and non-linearly. I can’t believe GCMs have the resolution or code to model that, but happy to be corrected.
as the C02 effect on temperature is linear and hydrocarbons are finite,where is the waterfall? Its nonsense unless a warmer more productive planet scares you.
The assertion that “the CO₂ effect on temperature is linear” is scientifically incorrect, misleading, and betrays a fundamental misunderstanding of radiative physics and atmospheric thermodynamics.
If you can’t address the scientific question, there is no hope of you answering the political question.
Ian Brown and stephen p anderson should discuss the finer points of how increases in CO2 concentration having either a linear effect as Ian posits, or absolutely no effect, as stephen suggests.
The Monckton Pause extends to 22 months starting in 2023/06. The average of this pause is 0.70 C. The previous Monckton Pause started in 2014/06 and lasted 107 months and had an average of 0.21 C. That makes this pause 0.49 C higher than the previous one.
My prediction for 2025 from the March update was 0.43 +/- 0.16 C.
My prediction for 2025 including the April update is now 0.47 +/- 0.14 C.
It hasn’t cooled down much because TSI is still very high in 2025.
https://i.postimg.cc/SKwgLJGr/CERES-TSI-Composite.jpg
Many people like to think they’ve falsified solar activity forcing.
This time I am going to continue where I left off in last month’s blog, as bdgwx thought I was wrong about TSI, and since I was too busy in April with ice storm clean-up and dealing with poor internet to spend time on it, I think today would be a good day to respond to those comments and give you another update.
The sun has emitted 27.1782 W/m2 more solar irradiance in solar cycle #25 than in cycle #24 by the 64th month (March), updated from 26.3W through February. This total was derived by subtracting the NASA CERES TSI Composite monthly TSI for solar cycle #24 from cycle #25, and then summing the differences, as can be seen below:
https://i.postimg.cc/0N7sq7BL/Tale-of-2-Cycles.jpg
Here’s what bdgwx said last month in response to my comment:
“That is patently false.
The average TSI over 63 months starting from the beginning of SC25 from 2019/12 to 2025/02 is 1362.24 W.m-2.
The average TSI over 63 months starting from the beginning of SC24 from 2008/01 to 2013/03 is 1361.73 W.m-2.
That is a difference of 1362.24 – 1361.73 = 0.51 W.m-2. That isn’t even remotely close to your claimed 26.3 W.m-2.”
I thank bdgwx for the opportunity to demonstrate how easy it was for him to misrepresent this and still yet feel victorious, wrongly.
There are so many mistakes here so it will take some time, I’m sorry.
1. bdgwx didn’t use the same data set I used. There were two instruments that measured TSI during SC#24 & #25, SORCE and TSIS, both available from the LASP server. SORCE covered SC#24, and TSIS has covered SC#25. Their data were offset during the overlap period. This offset is handled by LASP and NASA in the NASA CERES composite.
bdgwx used the individual TSI data sets instead of the TSI composite.
2. bdgwx did not use the correct starting month for SC#24, which was 2008/12, not 2008/01.
3. bdgwx didn’t multiply his 0.51 by the 63 months duration to get the gross total excess TSI of SC#25 over SC#24!!! His number results in 32.13, not 26.3, because his start time for SC#24 was wrong so his average was wrong and then he didn’t use the composite TSI like I did so the difference in cycles is wrong too.
That’s 3 strikes and you’re out!
Let’s see what else bdgwx said. “BW said: This result is then divided by the canonical 4 to get 1.25 W/m^2/yr in average solar climate forcing over each of the last 5.25 years.
Again, this is patently false.
The actual radiative force is 0.51 W.m-2 * (1 – 0.3) / 4 = 0.09 W.m-2. That isn’t even remotely close to your claimed 1.25 W.m-2.
1. I didn’t say ‘radiative forcing’. We want use the form I used since it can be directly compared to other proposed forcings such as from CO2, which is similarly expressed.
2. bdgwx used the wrong calculated value of 0.51 to begin with.
3. bdgwx used the 0.3 value for albedo. Why? I said in my original comment bdgwx responded to last month that the albedo was lower during that period as it typically is during the start of a solar cycle, lower albedo being a function of eastern tropical Pacific ocean La Nina cooling, which leverages the available rising TSI. Furthermore I had said TSI contributed about 36% of the ASR, after the albedo effect, not 100% as he apparently intended to imply.
That’s 3 more strikes and you’re out again bdgwx!
What did I say?
Many people like to think they’ve falsified solar activity forcing.
“bdgwx didn’t multiply his 0.51 by the 63 months duration to get the gross total excess TSI”.
Oh dear. If you multiply with the number of months, the unit is no longer W/m^2. It’s like saying that a car, driving at 50 mph for 63 months will accumulate a gross total speed of 3,150 mph.
Very good Gadden. People don’t understand radiative physics, especially “radiative flux”
Flux does not simply add, like energy does. People confuse the two. The more people, like you, that recognize the mistakes, the more others can learn.
Good job.
I see this all of the time; more so on the WUWT blog. It is rare for a contrarian commenter to fix their math mistake. In fact, in the majority of cases they go on to repeat the same mistake (even after being informed of it) over and over again. It is particularly bad on the WUWT blog in which some commenters will make yet more mistakes defending their previous mistakes. And some of these math mistakes are so trivial that even elementary students could spot them.
I standby what I said. You are wrong. That is unequivocal and indisputable. Your response here contains an egregious math mistake. 0.51 W.m-2 * 63 months does NOT equal 32.1 W.m-2. What it equals is 32.1 Wmonths.m-2. That is Wmonths.m-2; not W.m-2. Those are two completely different things. Fix your math and resubmit for review.
You’re right. BobW’s number ends up in joules/m2.
(0.51 W/m2)*(63 months) = 1.3 megajoules/m2
That’s energy delivery, not power delivery, over 5+ years. That’s not much. That’s about one 100 W light bulb running for 3 hours. 3 hours out of 5+ years.
Wonderful! [To see how the CERES-derived TSI looks so much better than the older datasets.] Have you ever checked how closely this TSI record traces the measures of cloudiness (albedo)? Wondering about that bc of all the excitement that the recent warming (as reflected especially well in the UAH-record) is associated with a ‘brightening skies’, in which case …. Also the older correlation of a lagged (~ 11-yr-avg or cumulative, as in your preferred measure) correlation between solar activity and sea-surface warming.
“Have you ever checked how closely this TSI record traces the measures of cloudiness (albedo)? “
If you are asking me, I think the question should be reversed, that is, how closely does albedo track TSI?
The last two solar minimums and before TSI>threshold were times of lower cloud fraction and albedo during La Nina conditions.
https://i.postimg.cc/7hvjBJz5/Solar-Cycles-and-Tropical-Step-Changes.png
https://i.postimg.cc/5Nr6ghYn/CERES-TOA-Cloud-Area-Fraction-by-Latitude.jpg
Lovely spring in the UK. A milder planet is a better planet.
We have more mystery. Is it really going down, or is it leveling off. Once again, next month will be interesting.
Compelling evidence that CO2 does not cause climate change is double. 1. Paleo and recent CO2 data show no correlation (without substantial proportionality change) between CO2 and T at CO2>300 ppmv. 2. Average global water vapor has been increasing about 1.4 % per decade which is more than twice as fast as possible from just planet warming. The measured increase in WV can account for all of the climate change attributable to humanity
Compelling evidence that CO2 does not cause climate change is double. 1. Paleo and resent CO2 data show no correlation (without substantial proportionality change) between CO2 and T at CO2>300 ppmv. 2. Average global water vapor has been increasing about 1.4 % per dekade which is more than twice as fast as possible from just planet warming. The measured increase in WV can account for all of the climate change attributable to humanity
I have a theory that the double posts (including mine) are a result of the site updating very slowly so it appears that the comment did not get posted. This is different than 403 Forbidden.
That has been happening for years. You will see every so often that I lead of with ‘duplicate’. That changes the post enough to allow it to post 2nd time around.
Damnit, maybe I have to start believing tipping points ARE possible?
gadden…”The point I was making was that it is important to see the ‘forest’ (climate change) rather than the the ‘trees’ (monthly temperature fluctuations)”.
***
What climate change? I have seen none in my part of the planet, Vancouver, Canada. You seem to be confusing a few natural weather events for climate change.
Climate is a 30 year average of weather and 30 years ago was 1995. I have seen no evidence of climate change since then.
In the 1930s, they had very unusual weather and he number of heat waves in the ’30s has never been exceeded in North America. Heatwaves happen and a few in recent times coupled with severe weather and so on is no evidence of climate change.
Besides climate cannot be specified in the same way as a global average, which in itself means nothing. The planet has a plethora of climates so which one are changing? There is no global climate.
https://www.env.gov.bc.ca/soe/indicators/climate-change/temp.html
Gordon Robertson, you asked me the following:
“How do you think the atmosphere traps IR to produce significant warming? How much surface radiation, percentage-wise, does the 0.04% CO2 trap. Better still, how much warming do you think a gas at 0.04% concentration and 0.06% mass can actually cause?”
My reply:
How it works:
1/ The Earth is warmed by sunlight.
2/ The earth seeks to reach global energy equilibrium, meaning the earth emits an amount of energy that is equal to the amount of absorbed sunlight. That emitted energy is infrared (IR) energy.
3/ The earth’s temperature dictates the amount of IR energy emitted. The earth’s surface temperature at which the global energy equilibrium can be reached is -18 °C or zero Fahrenheit.
4/ Greenhouse gases absorb and emit IR energy, which prevents the IR energy emitted at the earth’s surface from being directly lost to space, which disrupts that equilibrium.
5/ Due to those greenhouse gases interfering, IR is lost to space at an altitude where the air is colder than -18 °C. And so, the earth heats the atmosphere until that altitude where infrared is lost to space, warms to -18 °C. That warming allows the earth to reach that global energy equilibrium.
6/ But we live at the earth’s surface, far below that cold -18 °C altitude. At the earth’s surface, that warming results in an average temperature of about 14 °C (57 °F), allowing water to exist as a liquid.
7/ Finally, adding more greenhouse gases results in IR being lost at even colder temperatures due to it being at a higher altitude, resulting in the earth heating the atmosphere even more until that altitude where infrared is now lost warms to -18 °C, which means our average temperature at the earth’s surface has risen and will continue to rise as we add more greenhouse gases.
I’d say CO2 accounts for about 20%, H2O 50%, clouds 25%, and Ozone and other GHGs 5% of the clear-sky greenhouse effect.
Your turn.
I think I may be blocked from this site. Puzzled as to why. I don’t have an active website. I don’t have the scientific chops on this matter, but I have done a lot of reading, a decent an
Mount of it quasi-technical. My next project is going to be taking some individual
U.S. weather stations that have a long history in the same general la action. I will then look at the changes in the 30 yr normal over time. Since they are recalculated every 10 years. I understand all the problems with this from a research aspect. However, I think it provides very powerful information. A few tries at a couple regional stations have shown quite underwhelming increases.
Thomas Hagedorn
No one – except those who unbearably contradict or even insult the blog’s owner – will be banned from this site, not even those MAGAmaniac pigs who call others “Nazis.”
*
” My next project is going to be taking some individual
U.S. weather stations that have a long history in the same general la action. I will then look at the changes in the 30 yr normal over time. ”
Are you trying to reinvent the wheel? How many people, do you think, did the very same job?
Thomas Hagedorn
No one – except those who unbearably contradict or even insult the blog’s owner – will be banned from this site, not even those MAGAmaniac dumbies who call others “Nazi”.
*
” My next project is going to be taking some individual
U.S. weather stations that have a long history in the same general la action. I will then look at the changes in the 30 yr normal over time. ”
Are you trying to reinvent the wheel? How many people, do you think, did the very same job?
Thomas Hagedorn
No one – except those who unbearably contradict or even insult the blog’s owner – will be banned from this site, not even those MAGAmaniacs who call others “Na~zi”.
*
” My next project is going to be taking some individual
U.S. weather stations that have a long history in the same general la action. I will then look at the changes in the 30 yr normal over time. ”
Are you trying to reinvent the wheel? How many people, do you think, did the very same job?
Thomas Hagedorn
No one – except those who unbearably contradict or even insult the blog’s owner – will be banned from this site, not even those MAGA altar boys who dare to call others “Nazi”.
*
” My next project is going to be taking some individual
U.S. weather stations that have a long history in the same general la action. I will then look at the changes in the 30 yr normal over time. ”
Are you trying to reinvent the wheel? How many people, do you think, did the very same job?
Thomas Hagedorn
No one will be banned from this site, not even those MAGA altar boys who dare to call others “N~a~z~i”.
*
” My next project is going to be taking some individual
U.S. weather stations that have a long history in the same general la action. I will then look at the changes in the 30 yr normal over time. ”
Are you trying to reinvent the wheel? How many people, do you think, did the very same job?
Thomas Hagedorn
No one will be banned from this site, not even those altar boys who dare to call others “N~a~z~i”.
*
” My next project is going to be taking some individual
U.S. weather stations that have a long history in the same general la action. I will then look at the changes in the 30 yr normal over time. ”
Are you trying to reinvent the wheel? How many people, do you think, did the very same job?
Bindi is completely out of control, again.
I believe the official record is now 6 re-posts over a span of 5 minutes.
No he is not out of control. He just forgot that the blog’s behavior has changed: earlier, when you saw the top after having sent a comment, you knew it was silently rejected and you began to edit it until the comment was accepted. This now makes no longer sense.
But Clint R doesn’t understand such things, as he reduces everything to a ball-on-a-string.
Bindi was out of control and now denies he was out of control!
The evidence says otherwise….
Ok, my little experiment that seems to have upset bindi so much is meant to show to the 99.99% of Americans who don’t understand the science of climate change at a sophisticated level (that includes me, and because of education and research done 50+ years ago I do have a basic understanding of the issues) that increases have been tiny and imperceptible. One way to do that is to look at the increases over decades at a station near where you (or the person you are interacting with) lives. Then simply translate that difference into how far south you would have to move to experience the same “climate change.” For me, I would have to move from, say, Cincinnati Ohio to London KY. I am pretty sure that I could survive and even prosper there. In fact, I understand that some people even change their climate in a more drastic way, moving to South Carolina or Florida. I understand that they do survive that change. The climate normal data us easily accessible online at NWS and can be shown to people.
Ark, the “-18C” nonsense has no relevance to science. It is the calculated temperature of an imaginary sphere. That same temperature exists in Earth’s atmosphere, but so do all the other temperatures in the range. The “-18C” has NO relevance.
You keep regurgitating your cult beliefs, not realizing they violate the laws of physics.
Wow, incredible story. The planet has cooled for 4 billion years. Aren’t we so very luck for those Green House gases. If not for them we wouldn’t be here. And, just the exact right amount. All life on the planet exists by a razor thin margin.
stephen says: “The planet has cooled for 4 billion years.”
What are you talking about? Surface temperature? If so, you are completely wrong! The surface temperature has varied significantly over time. About 700 mill. years ago we had “snowball earth” with glacier at sea level even at equator.
What do you mean what do I mean? The planet was molten and has cooled. And, supposedly would have cooled to the point we wouldn’t be here but for the Green House Effect. The fragile Green House effect is keeping us alive. Is that difficult to understand?
stephen p Anderson’s anti-intellectual posturing masquerading as critique is like proudly denying gravity while falling off a roof.
Ark has no intelligent rebuttal to the premise that we’re all here hanging by a thread, since the dinosaurs, because of the Green House Effect. If not for the GHE the planet would be mostly ice-covered and well I guess about 1000 humans made it through the last Ice Age, that is the contention anyway. Thank God for the Holocene. Ironically, all the alarmists like Ark want us to control carbon so that we’re back hanging by a thread. Because see, the oceans are going to boil if we don’t. We’re damned if we do and damned if we don’t. We need to listen to these Masterminds like Ark.
stephen p anderson, you’re feral.
ark…answering your recent post in parts…
https://www.drroyspencer.com/2025/05/uah-v6-1-global-temperature-update-for-april-2025-0-61-deg-c/#comment-1703832
“2/ The earth seeks to reach global energy equilibrium, meaning the earth emits an amount of energy that is equal to the amount of absorbed sunlight. That emitted energy is infrared (IR) energy.
3/ The earth’s temperature dictates the amount of IR energy emitted. The earth’s surface temperature at which the global energy equilibrium can be reached is -18 °C or zero Fahrenheit.”
***
2/ is a statement thrown around here on Roy’s blog that is far more presumptuous than factual. For one, the use of a generic energy to explain electromagnetic energy in (in one frequency spectrum) versus electromagnetic energy out (in another frequency spectrum) is ingenuous. Ergo, it is necessary to state which energy is which, a fact lost on alarmists who use a summation of EM and heat to bypass the 2nd law. The energies have nothing in common and cannot be summed.
2/ is based on the Conservation of Energy Law, for the lack of a better scientific word (ie. law). Even more presumptuous is that the CoEL is covered by the 1st law of thermodynamics, which covers only the energies of thermal and mechanical energy.
The notion of conservation of energy was developed pre 1850, in an era when energies like heat were not understood clearly. It’s still not clearly understood nearly 2 centuries later. No one knew in that era that heat is related to atomic motion, both internally and externally, but Clausius showed an uncanny understanding of atomic theory when he inferred that internal energy is a summation of internal thermal and mechanical energy.
A basic principle of CoEL is that energy can neither be created nor destroyed, a bold statement given that even today we have no idea what energy is. All we can offer are observations of what energy does. For example, thermal energy causes atoms to move faster while gravitation and mechanical energy cause masses to move faster.
There is little doubt that energy balance must be conserved where one energy is converted to another energy. Energy does not simply disappear during such a conversion. However, energy can be created and it can disappear. It is a mistake, IMHO, to use two conversions of energy over an indefinite time period to claim a balance is required.
To understand that we must resist the temptation to lump all forms of energy into one generic energy and to examine each energy form in turn.
For example, solar energy emitted to space by the Sun will dissipate over distance in proportion to the distance squared. There must be a limiting distance over which our Sun’s energy can’t be detected from afar. In essence, at such a point, we can claim that solar energy has disappeared for all intents and purposes.
Same with gravitational energy. The gravitational field around Earth dissipates with the square of distance. There has to be a limiting point where Earth’s gravitation field has no influence on any mass, at which point we can claim the field strength has been reduced to either zero or to point where it essentially does not exist.
An important point here is instrument accuracy. Some scientists are claiming Einsteinian theory has replace Newtonian theory because Newtonian theory does not apply to atoms at the atomic level. I find such a concept to be ingenuous since the real problem is a lack of instruments to measure at the atomic level. I am sure, based on my experience in electronics and electrical theory, that once such instruments are developed, it will be found that Newtonian theory applies at the atomic level.
We already know it does. At the level of electrical charges it is known that the law governing the attraction/repulsion of point charges (Coulomb’s Law) is virtually identical to Newton’s Law of Gravitation. Additionally, the basis of quantum theory is electron mass and momentum, both Newtonian quantities. Even Schrodinger’s equation, the basis of quantum theory, used for atoms with more than one proton/electron, is based on the Newtonian based wave equation for masses.
In astrophysics it is hypothesized there are stars outside the range of our optical instruments. That means the energy has become so weak they can no longer detect it. How weak must energy become before we can no longer claim it as energy?
Heat is another form of energy that can disappear simply by reducing the KE (temperature) of atoms and molecules to near 0K. The heat is not converted to another form, it simply disappears.
None of this was known circa 1850 when this law was proposed.
I am hypothesizing that heat disappears in our atmosphere as atoms and molecules heated at the surface rise naturally into an ever-decreasing pressure in our atmosphere. That is important to your point 2/ since your point is based only on radiation while ignoring the effect of heated air rising into a reduced pressure/temperature environment.
My hypothesis makes it clear, if true, that an energy balance is not required between incoming solar and out-going IR. Our atmosphere is warmer because processes retain heat and dissipate it internally. That dissipated heat does not have to be emitted and resolves the issue of electromagnetic energy in versus electromagnetic energy out.
Obviously, a balance has developed between incoming solar and reduced exiting IR and that is why our planet is warmer than it should be. However, the balance is not on a one-to-one basis.
Gordon Robertson.
The assertion that “the Earth seeks to reach global energy equilibrium” is not a wild presumption, it’s a foundational principle of radiative balance in climate physics, supported by observational data, blackbody radiation laws, and first principles of thermodynamics. To dismiss it as “presumptuous” suggests either willful neglect of fundamental physics or a misunderstanding so profound it’s almost impressive.
Your indignation at the use of the word “energy” across spectral bands is amusing. Yes, incoming solar radiation peaks in the visible and near-UV, while Earth’s outgoing radiation is in the IR, but EM energy is EM energy regardless of its frequency. The Planck spectrum, Stefan-Boltzmann law, and Wien’s displacement law all treat it as such, because nature does too. There is no physical law requiring energy to match frequency-for-frequency to be comparable. Your insistence that the energies “have nothing in common and cannot be summed” is like arguing that a dollar in quarters is not the same as a dollar in bills because the shapes are different!
The accusation that “alarmists… bypass the 2nd law” by summing EM and heat highlights your lack of understanding. The second law prohibits net heat flow from cold to hot bodies, not the individual exchange of radiation. Both hot and cold bodies emit radiation; the warmer body emits more, resulting in a net energy flow from hot to cold. This is precisely what is observed and modeled in every empirically validated radiative transfer calculation. Spectral measurements from ground-based instruments, radiosondes, and satellites (e.g., SURFRAD, NASA’s AIRS and CERES missions) directly confirm the presence of infrared radiation emitted by the atmosphere and absorbed by the Earth’s surface. This is not a theoretical artifact, it is an empirical reality.
To reject these physical mechanisms is not a critique of alarmism, it is a rejection of over a century of thermodynamic and radiative physics.
The rest of your comment boils down to your belief that “heat disappears in our atmosphere…” and therefore “an energy balance is not required between incoming solar and out-going IR…” This is wrong because the energy balance is written for the Top of Atmosphere which is the system boundary. If you can’t see this, then you need to go back to high school physics and I don’t have the time to teach you.
Don’t have time for a full reply right now. However, you keep referring to non-existent disciplines like climate physics. Any physics claimed by alarmists as climate physics is pseudo-science.
Physics is physics and climate science is climate science and never the twain shall meet.
There is no global energy equilibrium for the simple reason that energy in is EM as is energy out. There is no reason why they should balance in real time and we know they don’t. The EM in from the Sun heats up the surface, atmosphere and oceans and a good portion of that heat is stored for an indeterminate period of time. The EM out is only a portion of the EM in since much of the heat dissipated from the surface is dissipated naturally as the heated air rises from the surface.
The notion of an energy budget was created by an uber-alarmist, Keven Trenberth, and his partner Kiehle. They admitted in their paper that none of their theory was based in measurement but calculated based on alarmist theory. In the calculation, they completely ignored the effect of conduction/convection directly to air molecules, giving it a value of a small fraction of dissipation via radiation. Shula proved them wrong with his Pirani gauge experiments.
I did not imply a law to match radiation frequencies. I implied only that incoming solar in a higher frequency band operates one way and the radiated IR in another way. There is a significant delay between the two and most IR by far exits to space directly without encountering a CO2 molecule.
I was also taking a shot at the alarmist propensity to consider only radiation as a means of heat dissipation at the surface. It is a minor player with conduction/convection playing the major role.
Once again, the 2nd law has nothing to do with a “NET” energy flow. Furthermore, There is no NET heat flow between bodies of different temperatures. Heat can be transferred only hot to cold BY ITS OWN MEANS. The idea that a two-way heat transfer exits between bodies of different temperatures in pseudo-science.
Heat does not flow through the 93 million miles of space between the Sun and Earth. Heat is produced locally when intense solar EM is absorbed by cooler surface on Earth and is converted to heat.
You can calculate the energy balance anywhere you want as long as you are calculating EM energy. When you start mixing that EM with heat and claim the 2nd law is not violated provided those different energies are in a mysterious positive energy balance, you are contradicting the 2nd law which can only be balanced using heat only.
It is wrong to claim that heat can be transferred from a colder atmosphere to a warmer surface. Dead wrong. The 2nd law says so. However, alarmists are getting around the requirements of the 2nd law by claiming a very strange positive balance of energies.
In other words, alarmists are not only moving the goal posts they are using pseudo-science to do it. They are also abusing the S-B law. As Clint has just pointed out, according to S-B, ice can radiate nearly 300 w/m^2, a nonsense figure.
The minus 18C you mention has nothing to do with altitude or a budget, it is strictly a theoretical difference between a calculated Earth with no oceans and atmosphere and the calculated +15 C for Earth’s average temperature. The actual difference is 33C which you get when you subtract -18C from +15C.
Gordon Robertson.
More of your usual ad hominem, strawman, and false dichotomy deflections. But I digress.
The same physics used in climate models is routinely used in weather forecasting. Numerical weather prediction models apply the same physical principles used in long-term climate simulations, and atmospheric general circulation models developed for weather forecasting are the foundation of climate models.
Here’s Mother Nature in all her glory teaching a Master Class in Atmospheric Radiative Physics for those who want to learn: https://ibb.co/BH753Xz0
No, energy cannot just “disappear.” This isn’t magic.
No, heat cannot be lost to space by convection or conduction, only radiation.
Loox like just about everybody in here believes this sudden big step in the data is real
Looks like just about everybody believes that sudden big step is real
SOLAR MINIMUM UPDATE
Donald’s EPA exempted seven of the biggest coal-burning power plants in Georgia from complying with hazardous air pollution standards.
Georgians have already paid for the pollution controls, they’re installed, and the plants already meet the standards.
WIN WIN WIN!
SOLAR MINIMUM UPDATE
The EPA exempted seven of the biggest coal-burning power plants in Georgia from complying with hazardous air pollution standards.
Georgians have already paid for the pollution controls, they’re installed, and the plants already meet the standards.
WIN WIN WIN!
Fact Check: President Trump Did Post an AI Image Of Himself Dressed As Pope.
While Catholics all over the world are in the 9-day period of mourning the death of Pope Francis, The White House posts this image. Has Trump lost his mind?
Yes.
Is the Pope Catholic?
That is the funniest thing I have seen all day. I think mocking the Pope is allowed. There are other religious figures that cannot be mocked or depicted in any way. I will leave it there.
A statistical quibble. Averaging hides variability.
However, without knowing the underlying variability, one cannot say if the average moves due to CO2 or chance. Thus while a trend may appear convincing, it may simply be an artifact of the eye to find patterns where none exist.
To mock the Pope as the leader of a religious community comprising approximately 1.5 billion people worldwide, you have to be pretty brain-dead.
The United States currently has no president at its helm, but merely a ruthless, disrespectful, and even cowardly Pinocchio.
” … but merely a ruthless, disrespectful, and even cowardly Pinocchio. ”
Oh dear… I forgot to add superficial, unpredictable, aggressive and vindictive.
He’s also a court-confirmed rapist.
(In New York, he was fiund to be liable for certain actions. Those actions are called rape according to NY, MA, MD, KS and OH law and probably in many more states, I didn’t check them all. And according to the FBI rape definition and in many other countries, including mine. In the NY case, he wasn’t legally found liable for rape, since the rape occured many years ago, when NY law had a more narrow rape definition.)
Spain had a power grid failure 28 April 2025. One of the suggested causes was “induced atmospheric vibration”. This explanation lacks any discussion of how such “induced atmospheric vibration” occurs although the underlying theme is ‘climate change’.
But perhaps there is a mechanism. Wind Turbines generate infrasonic noise (LFN). Many structures resonate when impacted by infrasonic noise. Perhaps the “induced atmospheric vibration” was caused by LFN from wind turbines.
Spain had a power grid failure 28 April 2025. One of the suggested causes was “induced atmospheric vibration”. This explanation lacks any discussion of how such “induced atmospheric vibration” occurs although the underlying theme is ‘climate change’.
But perhaps there is a mechanism. Wind Turbines generate infrasonic noise. Many structures resonate when impacted by infrasonic noise. Perhaps the “induced atmospheric vibration” was caused by infrasonic from wind turbines.
What a load of nonsense. 100% robertsoning, 0% reasoning.
*
On the Iberic Peninsula, the immediate origin was quite different from what happened in 2021 in Texas: instead of frozen gas pipelines, it was a breakdown of the frequency stability within the solar power supply, which led during five little but fatal seconds to a sudden loss of 15 GW which could not be compensated fast enough despite 25 GW gas, 7 GW nuke, 5 GW coal and… 17 GW wind.
*
But in fact, the same happened as 2021 in Texas, because finally it was due to a simlarly extreme isolation: like Texas lacking access to the great external grid around it, Spain and indirectly Portugal currently have only a small access to external supply through three high voltage lines from France.
*
In Germoney, the same sudden loss of 50 Hz stability would immediately be compensated due to the transnational grid giving access to hydro from Norway, nuke from France, coal from Poland, wind from… Spain, he he.
Germoney is since years net electricity exporter but can rely on external supply at any time.
*
A reminder…
” It’s no surprise that power outages occurred in Texas. According to energy economist Ed Hirs of the University of Houston, a lack of investment in the Texas power grid is a primary problem.
Unlike the other continental states of the USA, Texas has its own power grid and is not connected to the major eastern and western interconnecting grids, which can compensate for fluctuations in demand, even across state lines.
In Texas, electricity demand increased so sharply due to the cold that parts of the grid had to be repeatedly disconnected to prevent a complete power outage.
On Tuesday alone, according to ERCOT, 45,000 megawatts of power generation were lost. 30,000 of these were in gas, coal, and nuclear power plants. The Governor of Texas, Republican Greg Abbott, is calling for an investigation into the causes of the power outages.
Outages primarily occurred in gas-fired power plants. There alone, output fell by 27,000 megawatts. The bottom line is that this is an exceptional situation, one that other electricity markets are generally not designed for. “
What is your explanation for the “breakdown of the frequency stability within the solar power supply”?
Your explanation of what would have happened in Germany refers to ‘inertia’ due to revolving mass of turbines used at every generator except wind and solar.
Upthread, DREMT is pointing out the inconsistencies in the cult’s CO2 nonsense. That’s just one of the ways we know they are children. They can’t even come up with a consistent definition of their beliefs. Every time they try, they fall flat on their faces.
If they claim that CO2 can warm a 288K surface, that bogus science would mean you could boil water with ice cubes. If they claim the atmosphere is a “blanket”, that applies of nitrogen and oxygen, not CO2. CO2 radiates to space.
Arrhenius got it wrong with his bogus CO2 equation. You don’t create energy by adding mass to the atmosphere. His bogus equation breeds the “logarithmic” nonsense. The equation is based on “belief”, not physics. You could apply the same belief to ice cream production. You could claim that Baskin-Robbins was “heating the planet”. About 80 years ago, there was only 1 store. Now there are over 8000. You want proof that the increases in ice cream stores is warming the planet? Then let’s make up an equation:
F = 5.35 * ln(8000/1) = 48 W/m^2
(Adults will know that ice cream is not heating the planet. Children will not.)
As usual, when Clint doesn’t understand where an equation comes from, he declares it must be wrong.
It is argument by ignorance.
Problem is, Nate, the Arrhenius equation was never intended to calculate CO2 warming. If you read the Arrhenius paper on it he calculated about a 6C warming for a doubling of CO2. For our current level of about 400 ppmv, he calculated something like 2.7C warming.
https://protonsforbreakfast.wordpress.com/2024/09/06/arrhenius-1896-first-calculation-of-global-warming/
Seems he klimate klowns who program unvalidated models have adopted his work hook, line, and sinker.
Nate,
Clint understands that any meaningful equation describing nature needs to be simple and come from conservation of mass or energy and that it must be predictive like F=ma or E=IR. If it isn’t predictive then it is gobbledygook.
As you say, Stephen.
Here’s a derivation of the CO2 forcing equation from Clive Best, a well respected sceptical source.
https://clivebest.com/blog/?p=4697
https://clivebest.com/blog/?p=4697
That’s called a curve fit. Explain it to him Blinny.
“needs to be simple and come from conservation of mass or energy and that it must be predictive like F=ma”
Weird that F= ma doesnt come from either of those laws.
What about E=mc^2? Is that weird too?
Apparently, MAGAmaniacs are so dim-witted that they don’t even realize they use phrases like ‘curve fit’ exclusively in contexts that fit their pseudoscientific narrative.
No wonder people like that call me a Nazi: that’s the definitive indication of at best a pea brain under their skull.
If you act like a Nazi then you are a Nazi. It is the Principle of Equivalence.
OK, you’re such a genius. Where does the 6.6 come from?
Anderson, I explained years ago that if you claim that I am behaving like a Nazi, this would mean that you are comparing me to fascist murderers who are responsible for the deaths of
– 6 million Jews, plus at least 1 million communists, socialists, socialdemocrats, Christians, half a million Sinti, Roma, and hundred thousands of mentally or physically disabled people;
– 27 million Russians (soldiers, civilians) who left their life during the Nazi invasion.
*
You are an absolutely disgusting asshole, Anderson.
“If you read the Arrhenius paper on it he calculated about a 6C warming for a doubling of CO2”
And do you believe his was the last word on the subject? In 1900??
How bout not ignoring a century of discoveries in atmospheric physics, shall we?
That’s my point, Nate.
Blinny,
If the shoe fits, wear it.
“That’s my point, Nate.”
Then it is well hidden amongst nonsense.
“Upthread, DREMT is pointing out the inconsistencies in the cult’s CO2 nonsense…”
…and boy, was the reaction predictable…
I just read above:
” Looks like just about everybody believes that sudden big step is real ”
*
Looks like we are victims of a vast conspiracy of dark forces working in secret at UAH, NOAA, and RSS to collectively manipulate us:
https://i.postimg.cc/6ppxgtbt/LT-Globe-UAH-6-1-vs-RSS-4-0-vs-NOAA-STAR-2020-2025.png
*
Voilà qui est complètement paranoïaque, ma foi.
Sez the man who came here with a different name and talked about himself
Yes yes, dachshund… You just proeved once more your inability to admit having told absolute nonsense.
Rien de nouveau pour moi…
A conspiracy takes intelligence. Just mass delusion.
Like MAGA.
Apparently MAGAmaniacs are so dim-witted that they don’t even understand the slightest bit of irony.
https://www.npr.org/2025/05/05/g-s1-64393/states-wind-energy-lawsuit-trump-administration
‘Attorneys general from 17 states and Washington, D.C., are challenging an executive order Trump signed during his first day in office, pausing approvals, permits and loans for all wind energy projects both onshore and offshore. They say Trump doesn’t have the authority to unilaterally shut down the permitting process, and he’s jeopardizing development of a power source critical to the states’ economic vitality, energy mix, public health and climate goals.’
Trump is using the government to squash the a thriving industry.
Why?
Is that how the free enterprise system is supposed to work?
So Nate thinks that the courts should force the Trump Administration to continue Biden’s Green New Deal Plans. He also thinks the Trump Administration should be forced to maintain Biden’s immigration policies. Anything else, Nate? How many leftist judges do you have out there Nate?
Nate,
What percentage of our power generation should be wind power?
What percentage of the liquor market should be wine, Stephen?
Maybe your Dear Leader knows.
Didn’t think so, propagandist.
Why should a President decide which energy source is better?
Looks like you dont understand how a market economy works.
I’m pretty sure stephen said he was all for letting the market chart its own course -and pretty sure he was lambasting others for criticising capitalism.
So I guess all that pro-market claptrap melts away when dear leader decides to regulate industry by presidential fiat.
Wind power requires massive public subsidy. Its not free enterprize when taxpayers foot the bill.
Wind power is causing a lot of problems for wilderness critters and people living near them.
> Wind power requires massive public subsidy
No, they don’t, and in fact Texas is trying to regulate it to favor the fossil fuel industry:
https://www.volts.wtf/p/what-in-tarnation-is-going-on-in
Can’t beat zero cost inputs.
Warren Buffett says investing in wind power makes no sense without massive public subsidy.
https://capitalresearch.org/article/wind-power-doesnt-make-sense-without-the-tax-credits-part-1/
Who should I trust? Willard or Warren?
“said Buffett in 2014” when it might have been valid.
Not anymore.
Since Kennui hasn’t bothered to click on the link:
Besides:
https://www.rechargenews.com/wind/buffett-utility-reaffirms-faith-in-us-renewables-with-4-3gw-wind-and-solar-expansion-plan/2-1-1802554
Sorry if this has been commented on previously, but I see that the March anomaly has been reduced from 0.58C to 0.57C, according to the above table. Is this correct?
No, no one did report this difference until now.
The March anomaly for ‘USA48’ also went down by 0.01 C, as I can see when comparing the public March data to what I downloaded last month.
Curiously, the public file showing all zonal and regional data
https://vortex.nsstc.uah.edu/data/msu/v6.1/tlt/uahncdc_lt_6.1.txt
still contains the old values today:
2025 3 0.58 0.87 0.46 0.74 1.07 0.52 0.41 0.42 0.41 0.40 0.65 0.33 0.89 1.15 0.67 0.44 0.36 0.45 1.23 1.13 1.33 -0.24 -0.30 -0.21 1.25 1.28 1.20
But the changes will certainly be visible when the file is updated with the April data.
Such a posteriori corrections appear sometimes, e.g. when satellite-borne sounding data needs a reevaluation.
Using the “5 and over rule”, according to the above table the average of the two hemispheres in March (0.74 and 0.41) still rounds to 0.58, not 0.57. It must be very close.
The linear warming trend of +0.15C per decade from January 1979 is looking pretty vulnerable too. A May anomaly of +0.58C or above would push that up to +0.16C per decade, again using the “5 and over rule”.
In terms of periods of 30-years and over, I think that would be the fastest rate of warming in the UAH data.
Connecting plastic body parts to torsos, attaching nylon hair, painting eyeballs on Barbie dolls, and styling the hair of Bratz dolls. Is this what MAGA voted for?
Trump likes to keep his examples simple so children of the Left can understand. Using dolls makes it easy for you.
See, Donald cares about you….
I was watching Trump talking to Canadian PM Carney. Trump seemed completely befuddled with even the simple point Carney was making. One of them was that the US and Canada get along best when we work together.
Duh!!!
I expect Trump will go away with his enclave of sycophants and get it that such an intelligent statement belies his idiotic tariffs then come back with an insult against Carney.
The US and Canada have gotten along fine for a couple of hundred years then suddenly an ijit comes along and messes it up with a delusion that the US is supporting Canada and the rest of the world. A portion of the US citizenry jump up and applaud when Trump claims that while the majority cringe and put bags over their heads, holding their breath till the mid-terms when they can get rid of Republicans in Congress and the Senate once and for all.
Let’s hope the Dems learned their lesson about dabbling in an insane political correctness and right their ship.
Let’s face it, Trump got in because the Dems blew it with their politically-correct (progressive) ideology (in this case idiot-ology). They saw Trump as a good alternative based on his relatively harmless previous Presidency. Boy, did everyone get it wrong, including me. Yes, I am as much an ijit as anyone who supported him.
Trump did a good job of running off Trudeau and installing someone that has pledged to honor the commitments to NATO, while securing the border.
Amazing.
I had no time for Trudeau but when Trump bullied him and insulted him re becoming governor of the state of Canada, he set me and every other loyal Canadian into action against Trump. He woke up a sleeping dog and now he’ll get nothing from Canada since we are now determined to go our own way, something we should have done long ago.
He has also hurt many US citizens with his craziness and many of them are Republicans. His only way around that is to back off on the tariff insanity and deal with us and harmed US citizens in good faith.
Then again, we’ve never encountered such a jerk as Trump. We can thank him for waking us up, but that’s not exactly what he wanted from us. The only way for him now is to send in the army and if he tries that I predict an internal revolution in the US, even within the army. He will also get much of the rest of the planet against the US with such an action.
stephen…”What about E=mc^2? Is that weird too?”
***
Another one of Einstein’s blunders. When E. offered this relationship it was based on an incorrect assumption re the photoelectric effect and close to 10 years before Bohr’s discovery of the relationship between electrons and EM.
In E.s theory of the photoelectric effect, he presumed that electrons dislodged from a surface by EM was due to a momentum transfer from the EM to the electrons in the surface. That led to the idea that EM had mass hence momentum. Turns out it was not a momentum transfer but a transfer of energy related to electric and magnetic fields, which is more a charge transfer than a momentum transfer.
In E = mc^2, it suggests the relationship is true for all mass, hence the proportional relationship between E and m. Furthermore, the E is not specified although in his work with the photoelectric effect, it had to be EM. The relationship is certainly not true for other forms of energy.
Bohr discovered that the relationship between E and electron release had nothing to do with mass. Einstein knew the release of electrons had nothing to do with EM intensity and was related only to frequency. He should have clued in to that fact but he was into thought experiments hence not a true scientist like Newton. In essence, Newton observed and concluded whereas Einstein tried to visualize in his mind and reach conclusions based on his thoughts.
To illustrate that, Louis Essen, the inventor of the atomic clock, claimed that E.s theory of relativity is not even a theory but a collection of thought experiments. He added that E. did not understand measurement an obvious shot at Einstein’s misunderstanding about time. He seemed to think it is real and not what it is, an invention of the human mind that is fixed to the Earth’s rotational rate.
Re the release of electrons at a surface when bombarded by certain frequencies of EM. Bohr proved with hydrogen that the orbital level of the sole electron depended on the frequency of EM it absorbed. That frequency is very specific, right down to a fraction of a cycle power second. Anywhere outside that discrete frequency and the associated electron is not affected.
When E. made the claim about photon momentum and subsequent mass, he knew nothing about the actuality. He knew nothing about the relationship between electrons and EM, the electron having been discovered only a few years before he made the assumption. Subsequent conclusions about EM mass and momentum is based purely on consensus related to the mysteries of post Bohr quantum theory, which is highly imaginative.
Bohr was partly to blame for that since he seemed to go off the deep end after his brilliant discovery of 1913. He completely alienated Einstein as well as Schrodinger, who provided the wave equation which underlies modern quantum theory. Bohr began hypothesizing nonsense like electrons being able to communicate with each other at a distance.
Then de Broglie got in on the act, THEORIZING that electrons behaved like a wave as well as a particle. Schrodinger based his wave theory on de Broglie’s theory and it worked for atoms with electron/proton numbers beyond hydrogen, even though Linus Pauling had to modify it to make it work for molecules.
That does not mean electrons act like waves it only means that the orbital motion of electrons and any orbiting body with a regular period can be modeled as a wave motion.
The mass-energy-equivalence equation (E=mc^2) has NOTHING to do with the photoelectric effect.
clint…I did not claim e = mc^2 is related to the photo-electric effect, I claimed only that the relationship between e and m is due to a mistake by Einstein in presuming EM has momentum that is transferred to electrons in surfaces, causing the electrons to become free.
EM has no mass, hence no momentum. Modern scientists have given it a momentum using smoke and mirrors related to Planck’s constant, h. Since the units of h are joules/cycle = joules/Hz, h is obviously meant as a constant to relate energy to frequency in the electromagnetic spectrum. So, if you multiply a certain frequency of EM radiation by h it gives the energy in that frequency of EM.
There is no mass indicated in Planck’s equation, E = hf, so how did Einstein manage to relate EM to mass? He couldn’t, he simply made it up, no doubt through another thought experiment.
Einstein gave EM the property of mass through his idea of momentum and incorrectly presumed EM was transferring momentum to electrons on a surface, enabling them to be set free. He knew that it took a certain frequency of EM to activate an electron but insisted that it was the momentum in EM that caused the action.
Bohr discovered the real reason why the electrons are set free. They have an electric and magnetic field when they move which interacts with the EM radiation, and that is what gets transferred, not momentum. The transferred EM increases the KE of the electron, causing it to jump to a higher orbital energy level with a higher frequency.
Gordon is incorrect writing “EM has no mass, hence no momentum” since photons do possess momentum as shown by successful photon to solar sail momentum transfer in multiple tests. The rest of Gordon’s comment falls apart accordingly.
Gordon,
Go to your community college and take some remedial physics classes.
Each month you drift farther and farther away from reality.
nate…”[GR]“If you read the Arrhenius paper on it he calculated about a 6C warming for a doubling of CO2”
[nate}”And do you believe his was the last word on the subject? In 1900??
How bout not ignoring a century of discoveries in atmospheric physics, shall we?”
***
To climate alarmists, the words of Arrhenius are the last words on the subject. They are stuck in 19th century physics before the electron was discovered in 1898. The IPCC have been claiming the same 6C warming as Arrhenius.
There have been no discoveries in the ensuing century that support the anthropogenic theory. The entire theory is based in 19th century physics. Although Fourier is mentioned as a father of the AGW theory his contribution was so immature as to not warrant a mention. No one can blame Fourier, who was a brilliant mathematician whose legacy in math has endured, he simply lacked the physics to be correct.
The real breakthrough came with John Tyndall and his brilliant experiment circa 1850 that proved certain gaseous molecules could absorb infrared energy. CO2, being one of them, and making up a tiny fraction of the atmosphere, became the focus for anthropogenic warming. It should have been grasped immediately that such a tiny concentration of CO2 in the atmosphere could not warm it significantly. That could have been proved using the Ideal Gas Law, and why the IGL was not used is the mystery.
Arrhenius supplied no more than conjecture that was never proved. It was not till 1939 that Callandar got in on the act but his theories were mere extensions of those produced by Tyndall and Arrhenius.
Fast forward to the IPCC and what do the papers reviewed claim? Ta da…more Tyndall and Arrhenius.
Repeat…there have been no studies since Tyndall and Arrhenius that confirm the GHE or AGW theories.
“there have been no studies since Tyndall and Arrhenius that confirm the GHE or AGW theories.”
Nonsense, in the 1950s Gilbert Plass did the first detailed computations of line by line IR spectra to determine that the GHE was NOT saturated for CO2, and after including pressure broadening, atmospheric temperature variation and layer by layer atmospheric physics arrived an an estimate of about 3C for a doubling of CO2.
Manabe and Wetherald made the first 1D radiative convective model, corroborating earlier estimates and Revelle and Keeling confirmed that anthropogenic CO2 was causing total atmos CO2 was rising.
Since then there have been many papers corroborating the GHE and AGW through other lenses – such as satellite retrieval of radiance changes over time in the bands associated with CO2.
There is plenty of work on this.
Don’t mistake activity for progress.
https://www.newscientist.com/article/dn20413-warmer-oceans-release-co2-faster-than-thought/
Nor sure of your point, Ken. CO2 levels may rise faster in the future if this science is valid.
CO2 might not be as anthropogenic as postulated. AGW is bunkum.
Too, GHE wrt CO2 is mostly saturated. Again AGW is bunkum.
It’s not happening yet, Ken. Measurement of CO2 in the oceans has been carried out for decades, and ocean CO2 is increasing, not being outgassed to the atmosphere. Whereas, anthropogenic CO2 emissions account twice over the actual rise in atmos CO2.
“GHE wrt CO2 is mostly saturated”
No. Even if CO2 were saturated in the first 10 metres of atmosphere, that layer radiates IR upwards as well as downwards, and so the next layer gets half the radiation that the first layer did. How can the second layer be saturated? Repeat upward for every 100 metres of atmosphere.
Repeat…there have been no studies [aside from the thousands of peer-reviewed studies, satellite data, ice core analyses, and five IPCC assessment reports] since Tyndall and Arrhenius that confirm the GHE or AGW theories.
There, fixed it for you.
“It’s basic physics. See for example any atmospheric science textbook.
1. Earth receives sunlight such that it is not at absolute zero temperature.
2. Earth radiates infrared radiation (thanks to it’s nonzero temperature) towards space.
3. Greenhouse gas molecules in the air absorb some of the outgoing infrared radiation and then deliver that energy to the air, making the air warmer than it OTHERWISE would have been. (Without the greenhouse gases, the infrared radiation (and thus the energy contained therein) would go straight to space in a fraction of a second.)”
1. Is false. The Earth is a hot ball of magama,rock and gasses that has been cooling for billions of years despite solar input
2. True
3. True which drives convection increasing the rate of evaporation and the rate at which the surface cools and the rate of h20 radiating to space at the top of the troposphere
H20 is earths primary coolant
evaporation of water requires warming. Maintenance of higher water vapor in the atmosphere requires a warmer atmosphere.
But in your view this evident warming produces a net cooling??
Phil J simply hasn’t read up on emergence from earthen ice ages and recent measured TLT warming per the top post causing his erroneous claims 5:36 pm: “1. Is false. The Earth is a hot ball of magama,rock and gasses that has been cooling for billions of years despite solar input”.
Hello Nate,
Evaporation of water cools the surface
Increasing the rate of convection increases the rate of evaporation.
H20 is the primary means by which the atmosphere cools to space
Which of these are you disagreeing with?
“Increasing the rate of convection increases the rate of evaporation.”
No, evaporation depends on the state of the liquid not the air. Condensation depends on the state of the air.
Ball4,
You are mistaken. Wind certainly increases the rate of evaporation.
This is easily verified by experiment.
Take three of the same pans with equal amounts of water in each. Position fans with low and high setting blowing across 2 of them and no fan for the third. Observe the differences in rate if evaporation
PhilJ, run your carefully controlled experiment, learn from the data, and report back. You will learn evaporation rate from each of the containers is the same since evaporation depends on the state of the liquid which doesn’t change in your stated conditions.
Wow! So much controversy about the atmospheric greenhouse effect that was recognizes as early as 1856.
Those of you who view my climate-related videos might be interested in my latest YouTube video, which touches upon climate change research (or rather the attemps to shut it down.)
The title is “Destroying American Science” and the link is: https://youtu.be/7l14Twp1pWI
As always, your comments are welcome.
Dr. S.
GHE is recognized but its also not very well understood.
Arrhenius calculations led to the science community thought that adding CO2 would result in linear warming; more CO2 means more warming, while not understanding the effect of saturation.
Saturation has a logrithmic effect on GHE; doubling CO2 results in less warming than the previous doubling.
Saturation is at the point where doubling from 420 ppm to 840 ppm, a process that will take two centuries, will result in less than 1 degree further warming in our climate. Its wilfull blindness; no more grant money for AGW that won’t boil the earth.
AGW is bunkum.
“Saturation has a logrithmic effect on GHE; doubling CO2 results in less warming than the previous doubling.”
Logarithmic means the SAME increase for every doubling.
Just so many ‘deals’ being made by the President where we dont get stuff, but the President gets stuff. LIke a jumbo jet from terrorism-funder Qatar, like deals throughout the Mideast for the Trump organization as he visits, like selling Crypto based on the promise of a private dinner with the President.
Are people really ok with this level of grift from our President?
Performing a regression of the monthly lower troposphere globe column on de-seasonalised Mauna Loa CO2 from UAH inception (12/78) until 3/25, the start-to-end difference of the estimated anomaly series is 0.7437, and the equivalent CO2 difference is 90.8.
Doubled CO2 sensitivity based on these numbers is therefore 0.7437 * 280 / 90.8 = 2.293.
The adiabatic lapse rate amplification for mid-latitudes is roughly 1.15 (and tropics & polar very roughly offset each other), so the surface sensitivity 2.293 / 1.15 = 2.0, to 1dp.
Despite the step change in temps since NH summer 2023, we are still on course for a surface sensitivity toward the low end of the Charney 1.5-4.5 range.
Global
https://climatedatablog.wordpress.com/2025/05/21/uah-mean-and-median-global-for-apr-2025/
Tropics
https://climatedatablog.wordpress.com/2025/05/21/uah-mean-and-median-tropics-for-apr-2025/
Proposed major cuts to NASA would likely hit Huntsville heavily [ALABAMA POLITICAL REPORTER = alreporter.com]
“Under the Trump administration’s budget proposal for the 2026 fiscal year, funding for the National Aeronautics and Space Administration would be reduced by over 6 billion dollars, or almost 25 percent.
“The economy of Huntsville, home to the Marshall Space Flight Center as well as several federal contractors and research parks, depends heavily on government spending on space exploration and research.
“One recent report by NASA based on the organization’s budget for the 2021 fiscal year estimated they help create over 41,000 jobs in the state of Alabama…”
where is may data?
See comment above for one possible explanation. Federal cuts to science funding MAY affect science. Perhaps the grant that funds this analysis is withdrawn? The current Administration is somewhat hostile to climate research. I guess we’ll know soon enough.
While waiting for May update, I though4 I’d revisit an old post from early this month.
“List NATURAL mechanisms realistically capable of warming Earth’s global multidecadal average temperature by one degree C over a century or so. Go!”
Increased UV dosing of the oceans
Increased Geothermal output
To which I will add
3. Infalling mass
4. Human activity, waste heat from nuclear activity as an example
5. Waste heat from life