
 Home/Blog
…and for floods across the U.S. and the world, the “scientific consensus” agrees.
The catastrophic flooding of July 4, 2025 in the Texas hill country has left at least 130 dead. Many news outlets (predictably) have invoked climate change as a contributing cause, for example CNN, NPR, ABC News, The Texas Tribune, et al. As others have documented, there were more than adequate flash flood watches and warnings from the National Weather Service, and there was no shortage of either NWS staff or weather data.
It has long been known that this region is considered “Flash Flood Alley“, where the local topography and little soil covering the rock underneath leads to large amounts of runoff into the Guadeloupe and other nearby rivers in the event of heavy thunderstorms.
Clearly, one weather event is not evidence of climate change. We need to examine long-term weather statistics to evaluate claims that severe weather, of any type, is getting worse. This is especially true of heavy rainfall events, which are notoriously sporadic, with long-term statistics which are not well-behaved.
Flash floods require more than just heavy rainfall; they also require (1) rain to accumulate over a very short period of time, (2) the storms need to stay over the same area, and (3) the geography and hydrology features (little soil, sloping terrain) need to rapidly funnel most of the water into streams and rivers. The Flash Flood Alley region of Texas can deal with, say, 5 inches of rain if it falls steadily over 2 days. But if it falls in only 6 hours, flash flooding is much more likely. As is the case with tornadoes, a catastrophic flash flood requires specific ingredients that seldom occur all at the same time and location. There is a large element of randomness involved.
The Catastrophic Floods of 1978
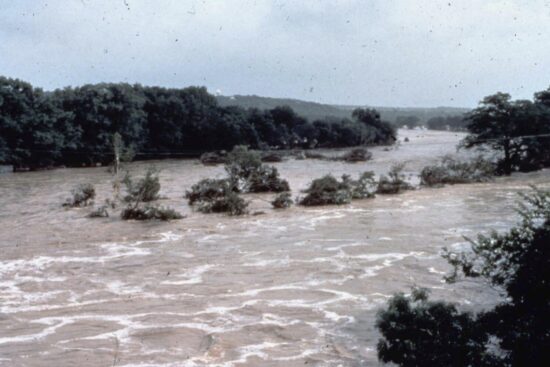
While the 1987 flood (pictured above) was also severe, it has been nearly 50 years since a flood of similar magnitude to the July 4th flood occurred, and that was in 1978. This San Antonio Express-News article is a fascinating read regarding that event. Like this year’s disaster, the cause was a dissipating tropical storm (Amelia in 1978, T.S. Barry this year). That flood killed 25 people in the Hill Country. What I find especially interesting is that the flood uprooted ancient cypress trees, up to 6 ft. in diameter, estimated to be several hundred years old.
133 Years of Heavy Rainfall Events in the Texas Hill Country
John Christy (UAH) provided me some heavy rainfall statistics for several stations in the Kerrville, TX area. For years John has been going through old daily weather summary forms that were never digitized, extending observational records back into the late 1800s. This is tedious and time-consuming work, but necessary if one has any hope of examining long-term trends in heavy rainfall events.
From those data, here are the last 133 years of the heaviest 2-day rainfall events in each year at Kerrville, TX (since 1893).
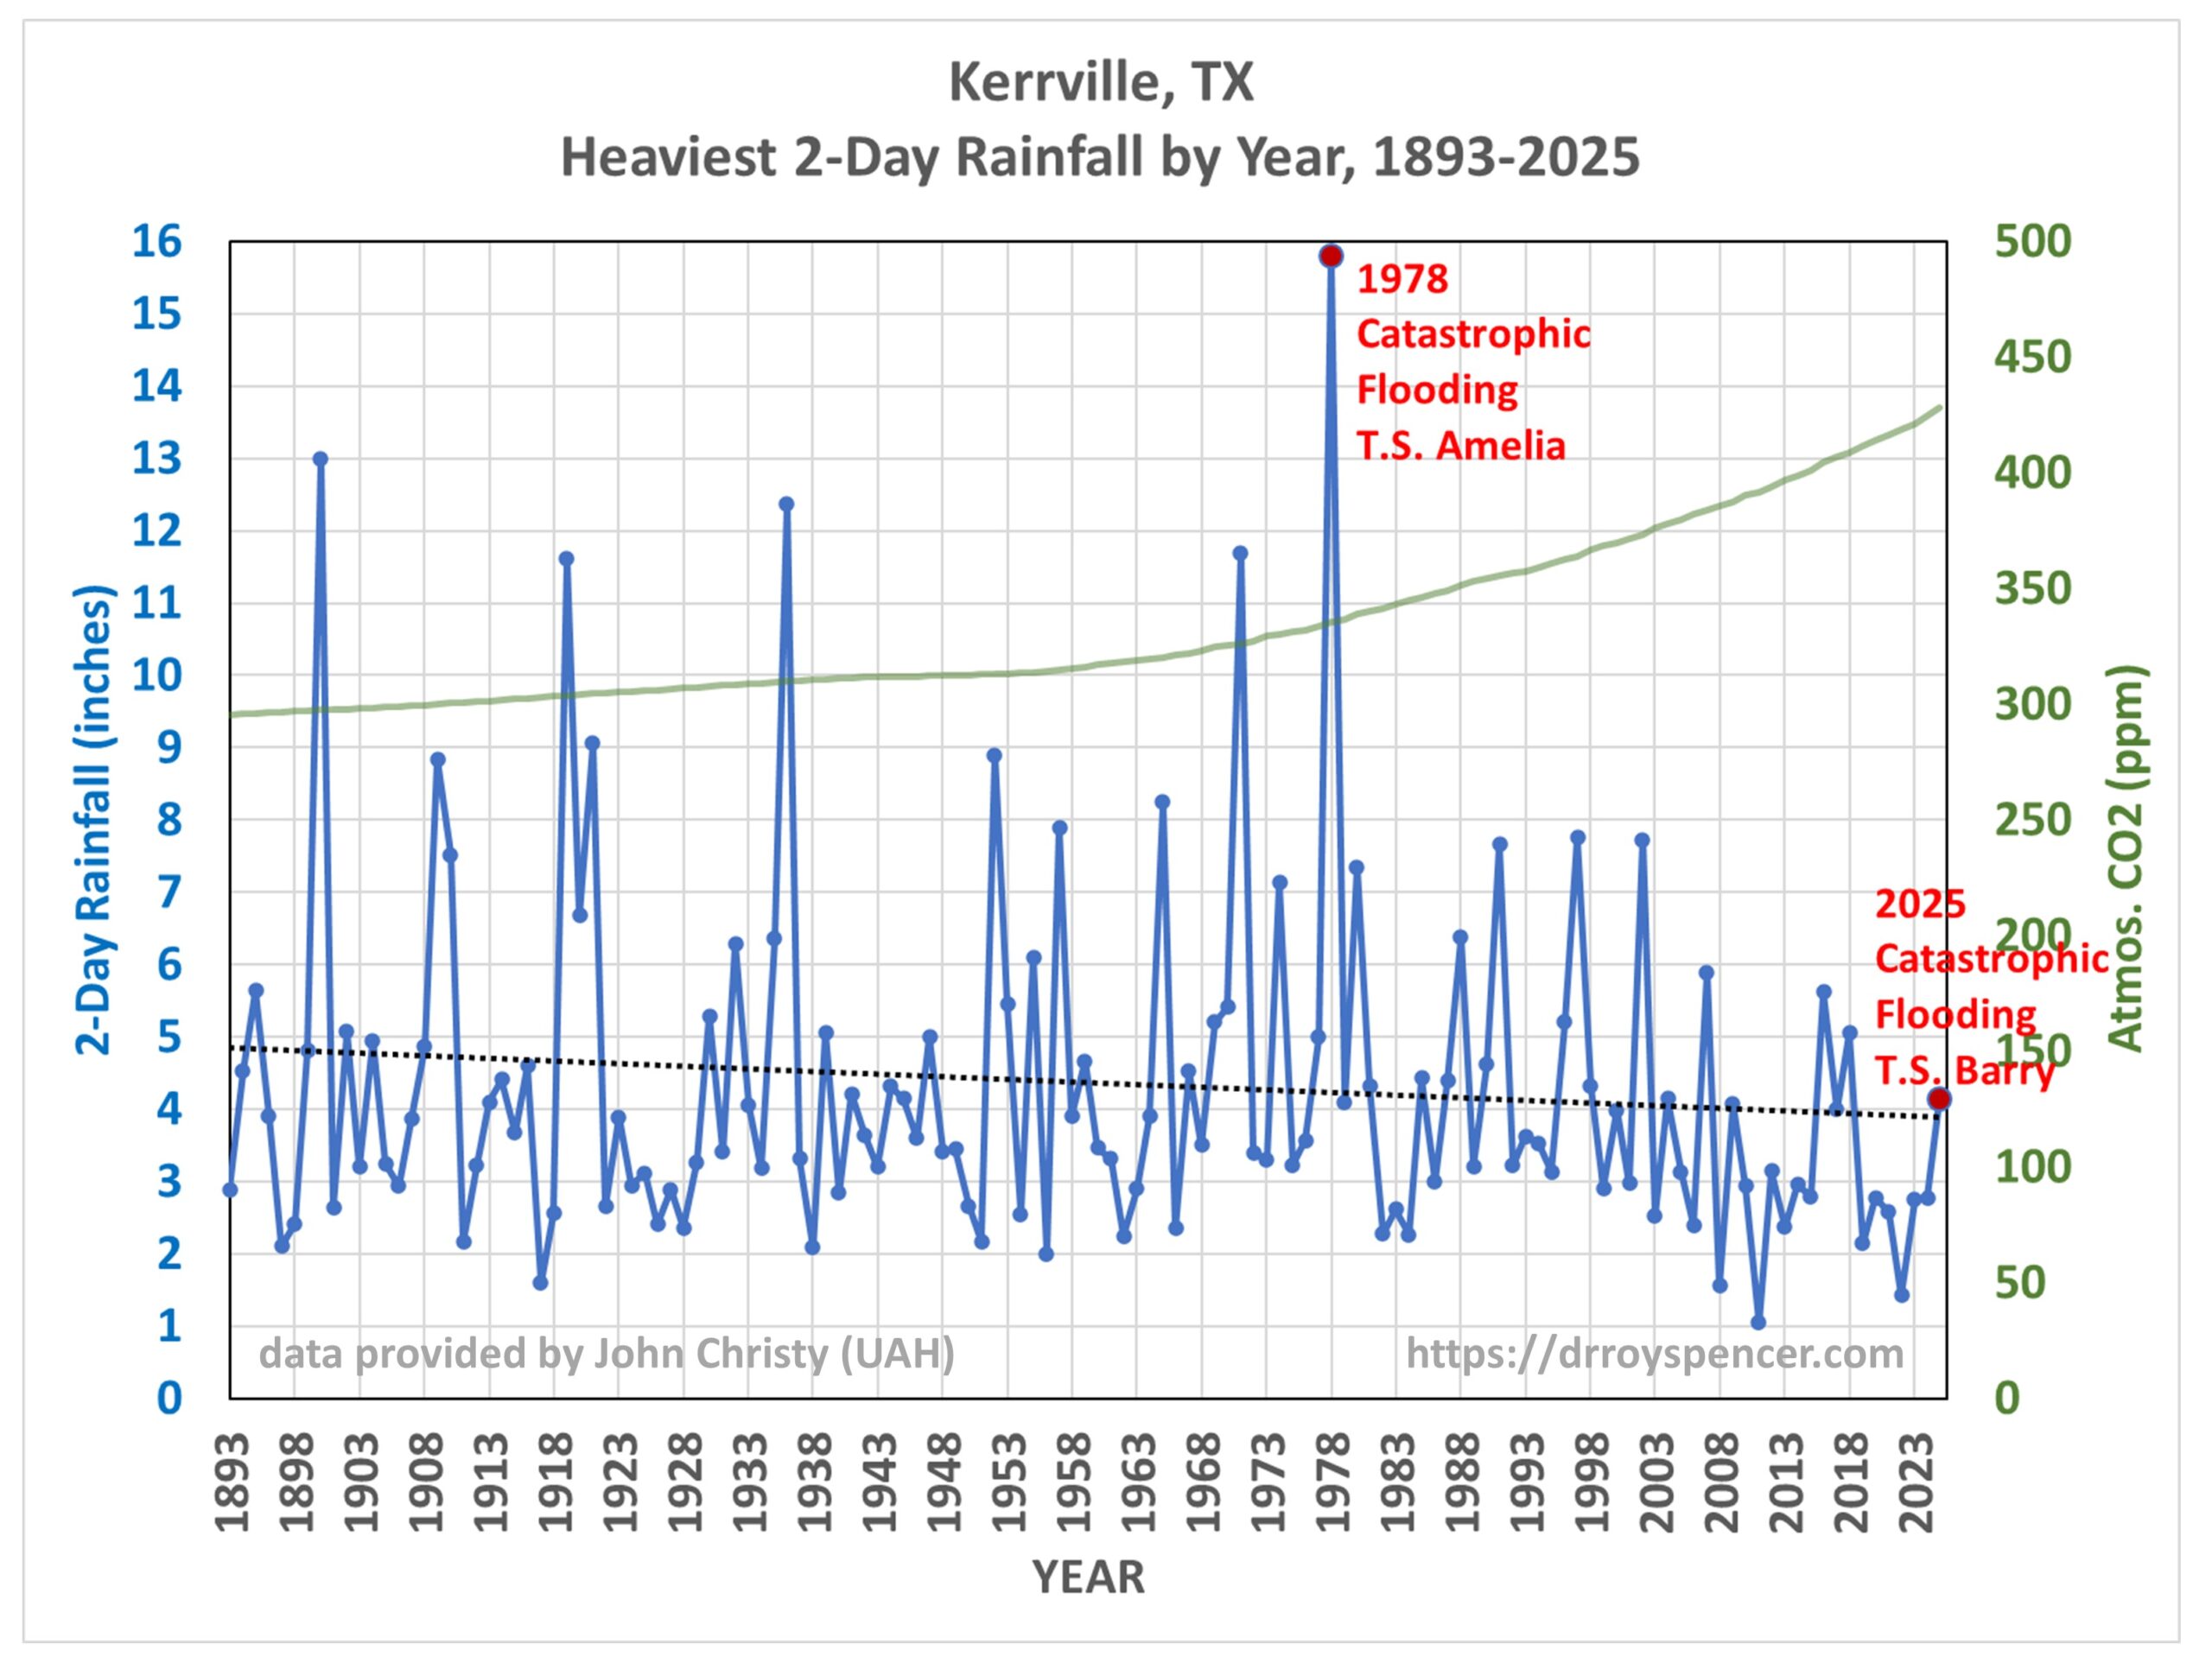
Clearly, there has been no long-term change in heavy rain events at Kerrville, Texas in spite of increasing atmospheric CO2 concentrations (also shown in the above plot). Even the EPA shows maps for the 50-year period 1965-2015 that indicate slight downward trends in river flooding magnitude and frequency over most of Texas, as well as the rest of the U.S.
From the Kerrville plot above you might wonder, why did the 2025 flood have so little rainfall at Kerrville? This is because most of the rain occurred upstream of Kerrville. Flash floods can occur at locations where no rain has fallen, as the water flows downstream from where the heavy rainfall occurred. Because of this effect, not all of the heavy rainfall peaks shown in the above plot produced serious flooding, and some of the documented flood events at Kerrville had only modest rainfall amounts.
Instead, the rainfall statistics at Kerrville should be viewed as evidence to address the question, are heavy rainfall events in Texas Hill Country getting worse? At Kerrville, at least, the answer is “no”.
But that’s just one station. John Christy also provided me data for 3 other nearby stations: Boerne, Fredericksburg, and Hondo Texas (not shown). For the same period (1893-2025) the trend lines for those stations are all essentially flat to slightly downward.
Climate Change, Heavy Rainfall, and Flooding: What Is The “Scientific Consensus”?
As we document in our Department of Energy report released yesterday entitled, A Critical Review of Impacts of Greenhouse Gas Emissions on the U.S. Climate, when one looks at rainfall statistics across the U.S. extending back to the mid- to late-1800s, there is little evidence for anything that might be considered related to human-caused climate change.
And don’t take just our word for it.
For flooding, the most recent IPCC report (AR6) said there is “low confidence for observed changes in the magnitude or frequency of floods at the global scale.”
For the U.S., the 4th National Climate Assessment stated that “trends in extreme high values of streamflow are mixed” with both increases and decreases, and there is no “robust evidence” that any trends are attributable to human influences.
So, for the usual suspects trashing our report to the media (Michael Mann, Andy Dessler, and Zeke Hausfather), maybe they should look at what we actually wrote, and the “consensus” sources we relied upon.
The public has been misled on climate science, and we are trying to set the record straight.


Do you think Lee had the time to read your report before announcing a his intent to reduce the number of waterways that would face regulation under the Clean Water Act in a move urged by the agriculture and petrochemical industries, Roy?
Same thing at Valencia Spain. I was looking for pictures from last fall’s event and found black and white images. The images were from a wikipedia article about 1957 Valencia flood …
Its not climate change when Valencia has had rather frequent flood events; some 75 events since 1321. The problem is of people building on the flood plain in spite of the known potential for floods.
https://en.wikipedia.org/wiki/1957_Valencia_flood
Dr Spencer.
Another way to look at the data is by plotting the hourly rainfall rate time series. That’s also the best way to illustrate your assertion that “The Flash Flood Alley region of Texas can deal with, say, 5 inches of rain if it falls steadily over 2 days. But if it falls in only 6 hours, flash flooding is much more likely.”
Rgrds.
Hourly data do not exist back to 1893 (just daily amounts), and as I said, we need precipitation time series for as long a period of record as we can get.
FYI…
https://www.nature.com/articles/ngeo262
“Clearly, there has been no long-term change in heavy rain events at Kerrville, Texas.”
Misleading.
If 100 y rain events in Kerville are now 50 y events, there would be too few in this chart to detect that statistical change.
For statistically robust analysis, need to look at a large region, like the whole Southern US, not just one town.
See Valencia Spain.
75 flood events since 1321.
https://en.wikipedia.org/wiki/1957_Valencia_flood
If the long term trend in Valencia is major flood every 70 years or so with no perceptible change why would there be a long term change in Kerville?
AGW is alleged to be global …
Nate, I mentioned 4 towns. And did you not even bother to look at the EPA’s U.S. plots (I provided the link) that show flooding events are down across most of the U.S.? Please, if you are only coming here to spout your pre-conceived notions and not even look at the data, you are wasting my electrons.
And yet, my statistical point is still valid.
You chose to show one town. Four in the same area not much better.
As you note, the nearby catastrphic 2025 event does not even appear on the plot..
I have a technical question. There have been some reports of very sudden and intense rainfall that the media like to assign to climate change. The mantra is that ” warmer planet can hold more water.” Is that true? Is there any data to confirm or refute that claim? Humidity data in dew point, which is a good measure of absolute humidity (percent RH is almost a joke), is available at most airports. Could that data be used to examine the claims.
There is another aspect of this that is more interesting and even more technical. Is there any evidence that increasing CO2 is causing the atmosphere to be more unstable, or possibly cause local areas of increased instability? Could this happen suddenly? On that same topic, is there any evidence that the tropopause has been affected in any way up or down? Is there a possible effect in the lower stratosphere that thunderstorms can build higher and faster?
“Is there any evidence that increasing CO2 is causing the atmosphere to be more unstable, or possibly cause local areas of increased instability?”
No.
All (mostly US data) metrics floods fires hurricanes tornadoes etc show only a very slight negative trend if there is any trend to be seen at all.
Try reading this: https://www.energy.gov/sites/default/files/2025-07/DOE_Critical_Review_of_Impacts_of_GHG_Emissions_on_the_US_Climate_July_2025.pdf
You do not understand the question. I stated that it is technical. All of the hints are there. It is not a statistical question and it is absolutely not in the report that I read on Tuesday. The effect helps to support the greenhouse gas theory, and the fact that water vapor is the predominate greenhouse gas. If you are in the science-denier camp, claiming that the lapse rate is entirely due to pressure, then I cannot help you. Try arguing with Nate for fun. If you would like to learn about it, try this:
https://en.wikipedia.org/wiki/Atmospheric_instability
https://en.wikipedia.org/wiki/Tropopause
https://en.wikipedia.org/wiki/Troposphere
https://en.wikipedia.org/wiki/Stratosphere
I would suggest the evidence shows that unstable weather occurs at boundary conditions determined by the jet stream.
If you get a wilder wavier jet stream you get wilder woolier weather.
Warmer planet means jet stream is more stable and linear than when its cooler.
The amount of moisture in the air on the basis of 2 degree warming since 1850 is probably non-sequiter. You wouldn’t be able to measure the difference in a lab setting even with the most accurate and precise instruments even across a much wider temperature differential.
” Warmer planet means jet stream is more stable and linear than when its cooler. ”
This couldn’t be more wrong.
I’m not a fan of the exponential increase of ‘artificial intelligence’, but simply typing this nonsensical sentence in Google gives you the following answer:
” The statement is incorrect. A warmer planet actually leads to a less stable and more meandering jet stream, not the other way around.
Here’s why:
1. Reduced Temperature Difference:
– The jet stream is driven by temperature differences between the equator and the poles.
– As the Arctic warms faster than the tropics due to climate change, this temperature difference weakens.
– A weaker temperature gradient results in a slower, less stable jet stream.
2. Increased Meandering:
– A slower jet stream tends to meander more, forming larger waves and dips.
– These waves can lead to more persistent and extreme weather events, like heat waves or cold spells.
3. “Blocking” Events:
– The meandering jet stream can cause high-pressure systems to become “blocked” by low-pressure systems, leading to prolonged periods of extreme weather in one location.
4. Not Necessarily Faster Winds:
– While some research indicates that “jet streaks” (localized areas of very fast winds within the jet stream) may get faster with warming, the overall jet stream is more likely to slow down and become less stable according to a study in Carbon Brief.
In summary, while some specific aspects of the jet stream might be affected differently, the overall effect of a warmer planet is to weaken and destabilize the jet stream, making it more prone to large meanders and blocking events. ”
*
This answer luckily contained no bloody hint on… CO2, nor does even the Carbon Brief guest post:
https://www.carbonbrief.org/guest-post-why-jet-streak-winds-will-get-faster-as-the-climate-warms/
“warmer planet can hold more water.” Is that true?”
Yes. Long ago Manabe and Weatherald 1967 showed that average hemispheric RH was nearly constant even as the seasonal cycle changed the temperature significantly.
There is more water vapor in the atmosphere in summer.
Constant RH with increased temperature requires increase water vapor.
Congratulations with this task and report that is written. I could only imaging how redeeming this will be after all yours year with work and development in your field. And I could not agree with you more. The situation is today very polarized. The truth is between, and today I am much more concerned about the manmade actions compared to the effects. It also looks like a perfect storm trying to change the humanity. This has been tried before, braking and reversing the development and silence the ones asking critical questions. That didn’t go well..
Good luck with the storm that’s coming in your way 🙂
Seems like cherry-picking to single out one hill region of one state in one country for one kind of event. The trend in natural disasters shows an unambiguous increase:
https://www.climate.gov/news-features/blogs/beyond-data/2023-historic-year-us-billion-dollar-weather-and-climate-disasters
This flooding tragedy really hits home – I’ve experienced flash floods in similar terrain, and it’s terrifying how quickly water levels can rise. The “Flash Flood Alley” designation exists for good reason; the rocky landscape just can’t absorb sudden downpours. While it’s natural to look for broader explanations, you’re absolutely right that we need long-term data analysis, not single events. Thanks to the admin for sharing this thoughtful perspective on such complex weather patterns.
Having lived through several Texas flash floods, I can attest that the Hill Country’s geography is indeed the main culprit. Those limestone rocks and steep terrain create deadly conditions within minutes, regardless of climate patterns. The tragedy highlights why local knowledge and immediate evacuation warnings are so crucial in this region.
The article discusses the July 4, 2025 flood in Texas, emphasizing that while climate change is often cited, long-term rainfall data shows no significant increase in heavy rainfall events. Historical context and specific geographical factors are crucial in understanding flash floods, challenging the narrative around climate change impacts.