
 Home/Blog
The Version 6.1 global average lower tropospheric temperature (LT) anomaly for June, 2025 was +0.48 deg. C departure from the 1991-2020 mean, down slightly from the May, 2025 anomaly of +0.50 deg. C.
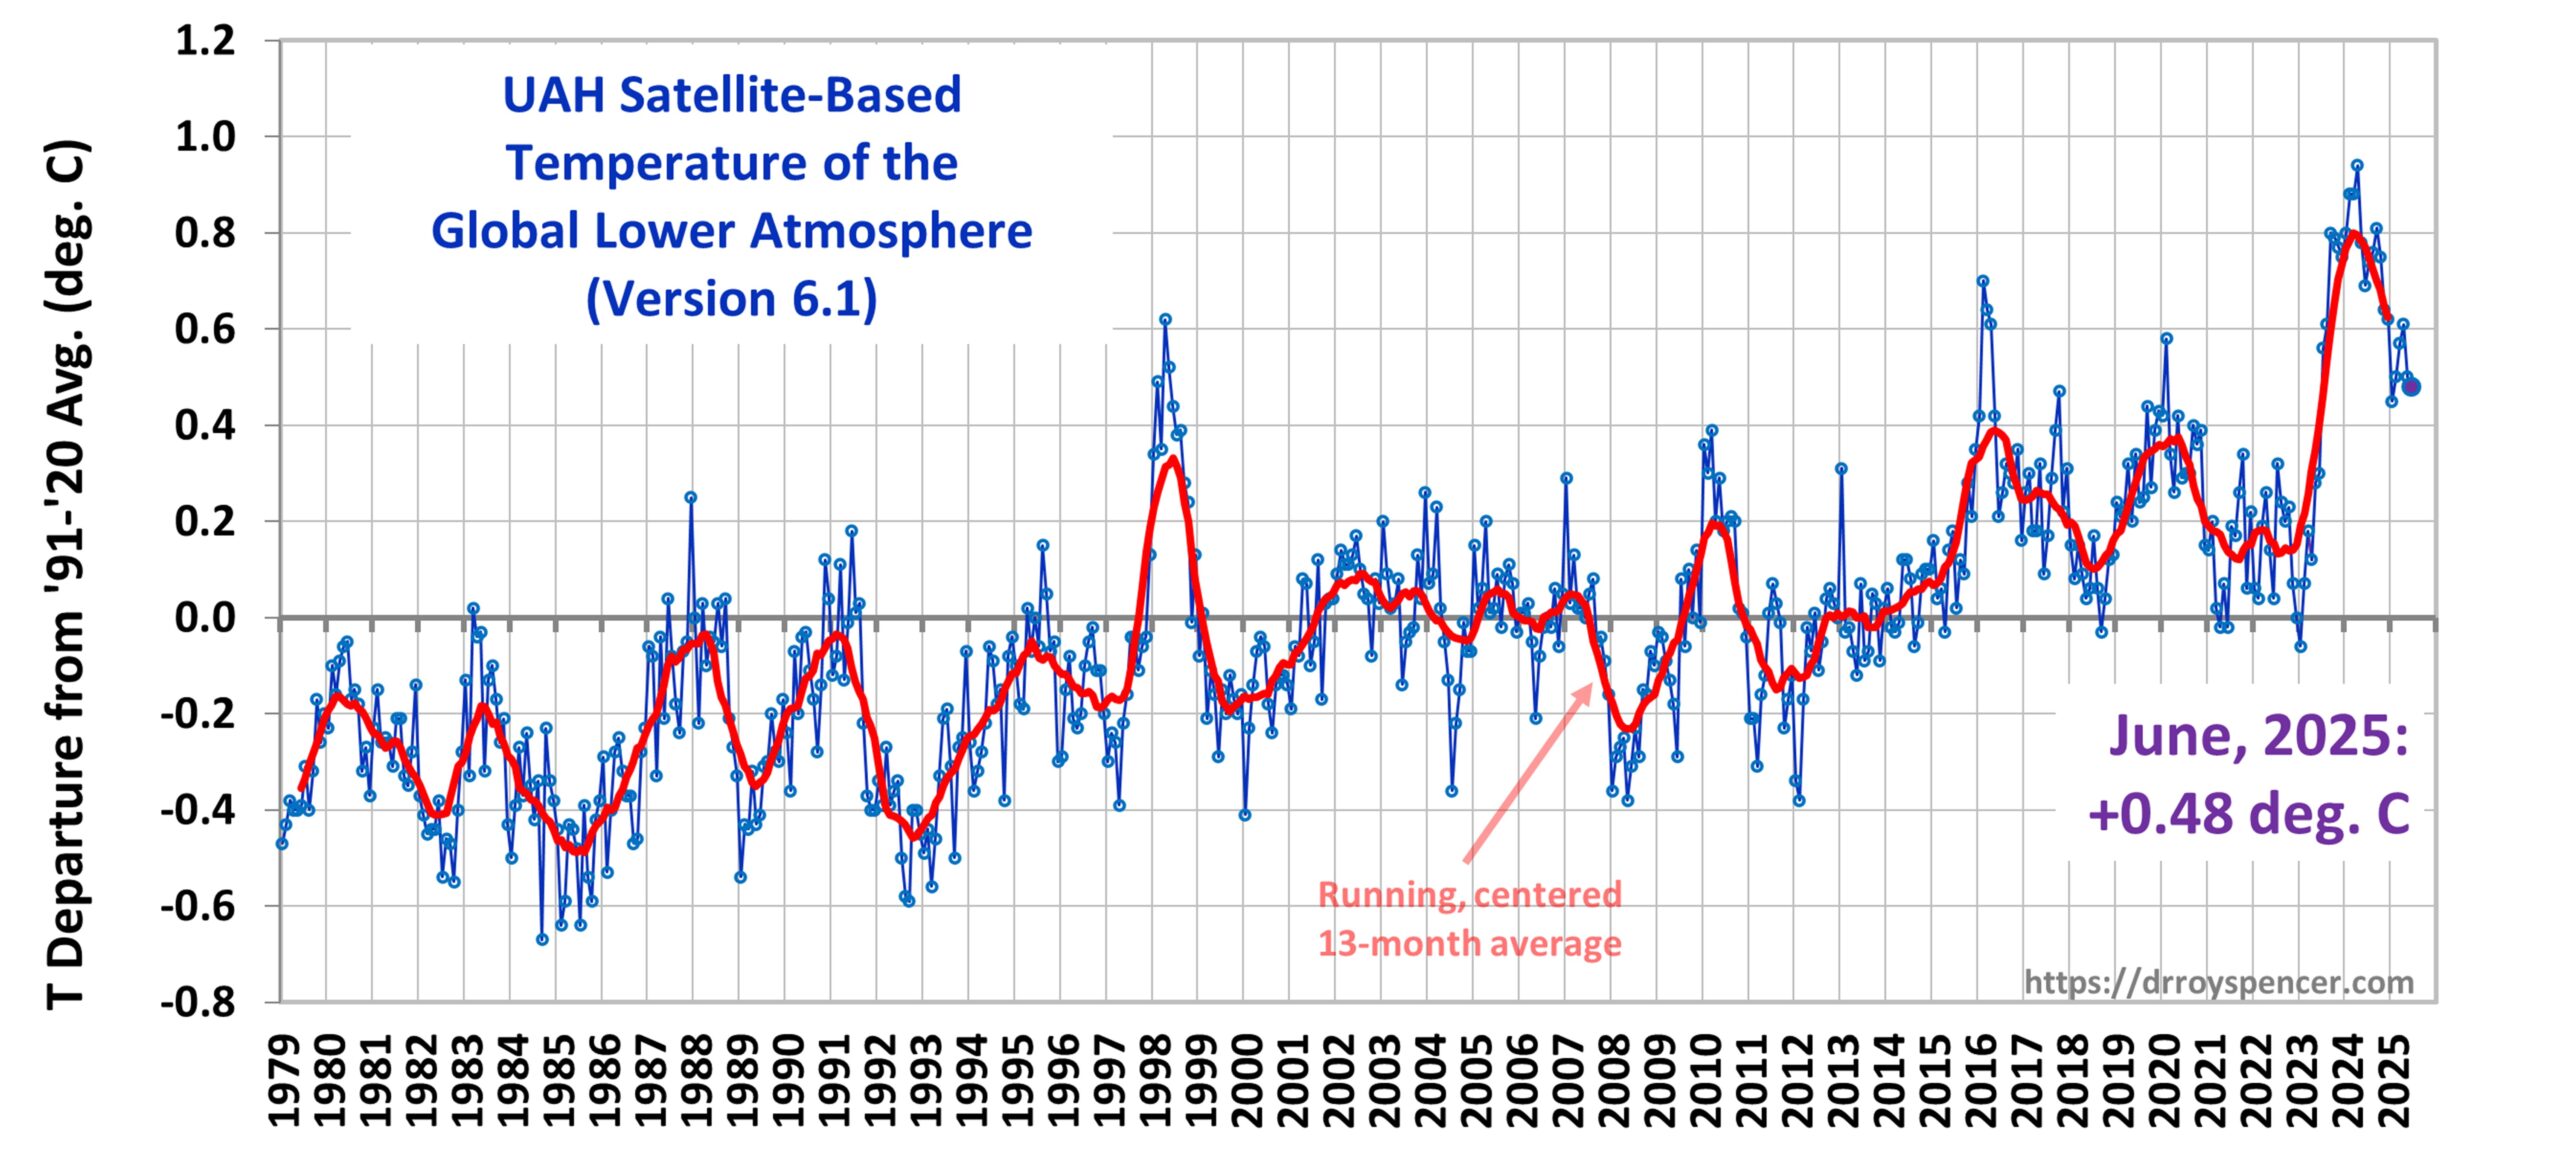
The Version 6.1 global area-averaged linear temperature trend (January 1979 through June 2025) now stands at +0.16 deg/ C/decade (+0.22 C/decade over land, +0.13 C/decade over oceans).
The following table lists various regional Version 6.1 LT departures from the 30-year (1991-2020) average for the last 18 months (record highs are in red).
| YEAR | MO | GLOBE | NHEM. | SHEM. | TROPIC | USA48 | ARCTIC | AUST |
| 2024 | Jan | +0.80 | +1.02 | +0.58 | +1.20 | -0.19 | +0.40 | +1.12 |
| 2024 | Feb | +0.88 | +0.95 | +0.81 | +1.17 | +1.31 | +0.86 | +1.16 |
| 2024 | Mar | +0.88 | +0.96 | +0.80 | +1.26 | +0.22 | +1.05 | +1.34 |
| 2024 | Apr | +0.94 | +1.12 | +0.76 | +1.15 | +0.86 | +0.88 | +0.54 |
| 2024 | May | +0.78 | +0.77 | +0.78 | +1.20 | +0.05 | +0.20 | +0.53 |
| 2024 | June | +0.69 | +0.78 | +0.60 | +0.85 | +1.37 | +0.64 | +0.91 |
| 2024 | July | +0.74 | +0.86 | +0.61 | +0.97 | +0.44 | +0.56 | -0.07 |
| 2024 | Aug | +0.76 | +0.82 | +0.69 | +0.74 | +0.40 | +0.88 | +1.75 |
| 2024 | Sep | +0.81 | +1.04 | +0.58 | +0.82 | +1.31 | +1.48 | +0.98 |
| 2024 | Oct | +0.75 | +0.89 | +0.60 | +0.63 | +1.90 | +0.81 | +1.09 |
| 2024 | Nov | +0.64 | +0.87 | +0.41 | +0.53 | +1.12 | +0.79 | +1.00 |
| 2024 | Dec | +0.62 | +0.76 | +0.48 | +0.52 | +1.42 | +1.12 | +1.54 |
| 2025 | Jan | +0.45 | +0.70 | +0.21 | +0.24 | -1.06 | +0.74 | +0.48 |
| 2025 | Feb | +0.50 | +0.55 | +0.45 | +0.26 | +1.04 | +2.10 | +0.87 |
| 2025 | Mar | +0.57 | +0.74 | +0.41 | +0.40 | +1.24 | +1.23 | +1.20 |
| 2025 | Apr | +0.61 | +0.77 | +0.46 | +0.37 | +0.82 | +0.85 | +1.21 |
| 2025 | May | +0.50 | +0.45 | +0.55 | +0.30 | +0.15 | +0.75 | +0.99 |
| 2025 | June | +0.48 | +0.48 | +0.47 | +0.30 | +0.81 | +0.05 | +0.39 |
The full UAH Global Temperature Report, along with the LT global gridpoint anomaly image for June, 2025, and a more detailed analysis by John Christy, should be available within the next several days here.
The monthly anomalies for various regions for the four deep layers we monitor from satellites will be available in the next several days at the following locations:


Not a scientist here, just a weather enthusiast with a very dated education in weather and climate. A year or two ago, I marked up a copy of this chart noting major El Niño and La Niña events. For me, it explained the cyclical nature of the temperature graph. Last time I looked we were ENSO neutral, but since that phenomenon has a cyclical nature to it, it would not surprise me if we weren’t hading for a La Niña and slower increases.
As an aside, related to UHI, our NWS office – Wilmington, Ohio – noted several temperature records for June in Dayton, Ohio. Every one of them was a record LOW. I know it is anecdotal, but it seems to fit with the idea/theory that UHI is a very important factor in recent warming trends.
I am praying for you, Roy. With God’s grace you will get through this time. I really appreciate your work and how you are trying to make your contribution to a better world.
Yes, it’s well-known that the short term (think a few years) fluctuations in Earth’s temperature are correlated with El Nino and La Nina. The long term trend (think averages over 10 or 30 years) is an entirely different matter, see https://datagraver.com/climate-data-set-uah/ .
And no, UHI has next to nothing to do with this LONG term trend (which is around ten times faster than the most rapid known global warming in Earth’s preindustrial past).
https://science.nasa.gov/climate-change/faq/can-you-explain-the-urban-heat-island-effect/
See HADCRUT 1690 to 1730. Faster warming than now. 2C in 40 years.
https://www.metoffice.gov.uk/hadobs/hadcet/graphs/ts_meantemp_cet.png
Some dude named Ken commentes here that HADCRUT shows a faster warming in 1690 -1730 (HADCRUT only goes back to 1850, duh) and posts a graph showing LOCAL (Central England temperatures), apparently not understanding that the adults are talking about GLOBAL average temperature. Oh dear.
“which is around ten times faster than the most rapid known global warming in Earth’s preindustrial past”
Please provide a source.
Hey, krokodile!
I wrote “ten times faster than the most rapid known global warming”. The most rapid known global warming is the deglacializations and the PETM. Look them up and compare the warming rates with today’s. They were around twenty times slower than today’s warming. And remember, we’re talking CLIMATE-relevant timescales, so forget about any temporary changes over a few years.
(There is actually ONE known event in the prehistorical past that MIGHT have caused a CLIMATE-relevant global warming with a rate comparable to today’s. Can you guess which event that was?)
‘Red krokodile’ asks me to provide a source for my statement that Earth is now warming (at least) ten times faster than the most rapid KNOWN global warming in Earth’s past. And ‘Ken’ asks me to ‘prove’ my statement, as if science could ever be PROVEN. See for example https://thelogicofscience.com/2016/04/19/science-doesnt-prove-anything-and-thats-a-good-thing/
The ‘source’ Mr Krokodile is asking for is the entire collection of paleoclimate studies. NONE of these studies indicates a higher warming rate than today’s. We’re not even aware of any realistic natural mechanism that COULD ever have produced a global warming like what we’re currently experiencing, with the POSSIBLE exception of ONE specific type of event. Guess which one?
“The most rapid known global warming is the deglacializations and the PETM. Look them up and compare the warming rates with today’s. They were around twenty times slower than today’s warming.”
Why compare rates of change from low resolution proxy data to high resolution, year to year thermometer records?
“And remember, we’re talking CLIMATE-relevant timescales, so forget about any temporary changes over a few years.”
You don’t need to tell me that.
How can short term fluctuations over just a few years even be accurately compared to proxy data that averages over much longer timescales?
Gadden says:
”I wrote ”ten times faster than the most rapid known global warming”.”
I would challenge that premise.
One can see warming cycles in the ice core records of both polar regions that defy that.
Additionally the claim that these permanent ice sheet regions where sampling occurs can warm faster on the ice caps isn’t supported in science.
We know rapid warming occurs in the transition of ice to water but that’s not applicable to the permanent ice sheets and ice core records on these permanent ice sheets.
But our institutions are corrupt. They know the correct comparison to ice cores would be rates of current warming occurring only over the ice caps excluding areas where the ice sheets have melted. I think a 5th grader should be capable of understanding that.
Yet when one averages the northern hemisphere polar regions including the areas of ice loss the warming per UAH is approximate the same as the mean global warming number.
Yet even though we use bulk areas that would clearly overstate the warming on the ice sheets we don’t do anything about this lack of data parsing and allow people to come up with some really stupid ideas about how fast things can warm and cool as a global average.
That is evidence of the corruption.
The science is there but its heavily suppressed. Station data exists on the ice sheets sometimes right on top of the ice core area. Milankovic’s work is also suppressed but enough bits and pieces exist to see why its being suppressed.
The ice core records for both polar regions show 3.5C warming events occurring over a few hundred years about once every 3,500 years in times with a circumnavigation of Uranus Neptune conjunction effects from the cold side of the solar system to the warm side of it wrt to the direction of perihelion of earth’s orbit.
Then considering the facts above it seems likely that if anything the ice core records most likely warm less than the global mean average changes.(as it should per radiation laws)
Gadden, I appreciate your reply, but I am having a problem with the logic. Sure, I understand that the 10 year average is going to smooth out the shorter term fluctuations caused by ENSO. But it seems whenever we are in El Niño, the media and those concerned about global warming use those relatively short term spikes in temperature to warn (alarm?) everyone about global warming. They talk about “the warmest YEAR on record”, “the hottest summer ever recorded”. I am simply pointing out that those shrill cries are largely over ENSO, a recurring phenomenon, that is probably not related to greenhouse gases.
As for UHI, Logic tells me that the same phenomenon that burned my feet when I walked on hot sand or blacktop could be causing temperature rises over time at weather stations located in areas that have experienced urbanization/population growth/surface changes. Can’t send you a link or citation but I have read work that showed very little temperature increases over time at rural stations that are not subject to these factors. Then there is the terrible (laughable, in some case) siting of many weather stations, which would produce higher temperatures, not representative of the ambient temperatures in the surrounding area. I know that there is an attempt to adjust for UHI, but I am skeptical of their accuracy. Finally, I always hear relative terms (hotter, hottest, etc) describing warming, but rarely are the magnitudes discussed. I have looked at normal temperature increases a bit. Hope to do more. The actual magnitudes of increase are almost not noticeable to most human beings. I have described it as similar to moving 100 miles south from wherever you live in (where normals are higher). I live in Cincinnati Ohio. I am quite sure that I could survive in London Kentucky. I am told that many members of my species do in fact thrive there. And so do many species of plants and animals.
“have a couple of Antarctic ice cores with sufficient detail to spot the cycles somewhere buried in my bookmarks but why bother looking?”
Bwa ha ha ha ha ha!
CET is the oldest record that we have. If you’ve got something better to prove your rather specious claims … go for it.
Oh dear. CET stands for Central England! Everyone knows temperature can change faster locally than globally. To warm the EARTH as a whole in climate-relevant timescales (think global temperature average over a couple of decades), you need to change the energy balance to/from Earth. For local changes, however, all you need is a change of how weather moves around between different parts of Earth.
Why not address the points I made in my answer to you instead? Again, you said HADCRUT and showed HadCET. And again, HadCET is LOCAL, as I just pointed out.
For GLOBAL average temperature thousands and millions of years back, you need to look at paleoclimate data. You didn’t know that?
I wrote “ten times faster than the most rapid known global warming”. The most rapid known global warming is the deglacializations and the PETM. Look them up. They were around twenty times slower than today’s warming. And remember, we’re talking CLIMATE-relevant timescales, so forget about any temporary changes over a few years.
CET is the only record that I am aware of for 1650 – 1750. Since there is no other record, we have to consider it is indicative of global trends.
Too, there are records going back to circa 1800 at major cities across Europe, all showing similar trends that compare well with ice core and other paleoclimate data.
CET is likely a valid indicator of global trends.
Ken,
You state “CET is likely a valid indicator of global trends”. Educate yourself.
The earliest years of the series, from 1659 to October 1722 inclusive, for the most part only have monthly means given to the nearest degree or half a degree, though there is a small ‘window’ of 0.1 degree precision from 1699 to 1706 inclusive. This reflects the number, accuracy, reliability and geographical spread of the temperature records that were available for the years in question.
(Besides, if you really believe Earth got two degrees C warmer in 1690-1730, you must also believe a climate forcing of around +2.5 W/m^2 happened over that time period. That’s HUGE! What on Earth(or elsewhere) would have caused that?)
Here is the CET and the Global Mean temperature both for 1850-2025, with a 2 year smoothing.
https://climexp.knmi.nl/data/ihadcrut5_global_24month_low-pass_loess1_a.png
https://climexp.knmi.nl/data/tcet_1850:2026_24month_low-pass_loess1_a.png
First off the CET has ~ 2 degree decadal variations plus a vague long term trend.
The Global mean has ~0.3 degree variation plus a long term nonlinear trend with plateu regions 1850-1920 plus 1940-1980, that are not present in the CET.
Not much correlation between the two.
Notes on the state of Virginia Thomas Jefferson written 1781 indicates significant warming during his lifetime. https://tile.loc.gov/storage-services/service/gdc/lhbcb/04902/04902.pdf
Love your post, Nate. Another thing your graphs illustrate is that local data is much more ‘noisy’ than global (average) data. This is of course to be expected since the redistribution of thermal energy between (small) regions on Earth is much more ‘noisy’ than the steady global (average) warming caused by a more or less constant rate of man-made greenhouse gas emissions.
Funny that so many science deniers can’t grasp the difference between local weather change and global climate change.
Just eyeballing globaland CET compared, there isn’t much correlation bar a very long upward trend. Otherwise – see the temperature tend 1900 to 1950. Global rises, CET appears flat.
In any case, it is well known that local temps are a poor proxy for global, even ones that closely correlate with global (not the case with CET anyway). Short and long term weather pattern changes have far more effect locally than globally.
“with plateu regions 1850-1920”
Global coverage was very sparse back then, Nate:
https://postimg.cc/w7WshvKD
‘Very sparse’
Not in comparison to just central England!
Anectotal. And what does Virginia in mid to late 1700s have to do with Central England 1690-1730? Or either one with Global Mean temperature?
“And what does Virginia in mid to late 1700s have to do with Central England 1690-1730?”
Try reading what is written.
Basically the anecdote corroborates CET because change in climate was observed in Virginia in roughly same time period … and gives credence to CET as being representative of global trends.
Not at all the same time period…
Playing fast and loose with facts ain’t science.
Gadden says:
”For GLOBAL average temperature thousands and millions of years back, you need to look at paleoclimate data. You didn’t know that?
I wrote “ten times faster than the most rapid known global warming”.
The most rapid known global warming is the deglacializations and the PETM. Look them up. They were around twenty times slower than today’s warming. And remember, we’re talking CLIMATE-relevant timescales, so forget about any temporary changes over a few years.”
Climate changes on a lot more time scales than the timing between the last few major stadials and interstadials.
All you have to do to see that is look at a paleoclimate data record. Any one of them.
Here is an example that shows up to 3.5C variations over a period of a few hundred years.
https://co2coalition.org/facts/temperatures-have-changed-for-800000-years-it-wasnt-us/
And when you compare that to the modern instrument record you have to keep in mind that the data points in the ice core records are mean temperatures over approximately 100 years. Thus you don’t even have two centuries of instrument records to make a single comparison.
Only some of the variations we have seen in climate can be explained by changes internal to system. ENSO is the most studied one but those are short term variation.
Some have thought that ocean regime cause the multi-decadal changes but no cause for that has been identified.
In fact fishermen know that gravity of the moon and sun causes tidal currents that get fish in a feeding mood. these are very strong influences that move currents rapidly over a mean 12 hour cycle.
Its foregone conclusion that the gas giants also creates tidal influences but its largest cycle is about 3500 years. There is a recognized Jupiter and Saturn cycle of ~900 years. The tide can run very slow in these cycles and move one helluva lot of water over 3500 years. So these ocean regime changes are almost certainly caused by the gas giants because almost all of these types of tidal effects are exerted by planets with larger orbits than earth so that the forces of gravity can act tangent to the earth’s orbit. Inner planets can’t reach a gravitational tangency with earth’s orbit. But all the other ones do twice a year.
Since the GHE is actually about 10C per radiation law defaults, all you need to account for is about 50watts affecting on the surface for the entire GHE. Water vapor removes 100watts from the surface to warm the atmosphere. But only half of it shines back to the surface. Viola you have your 50watt GHE. There is no other GHE, mathematically no need for any other GHE. And GHE radiation characteristics don’t just turn on when GHG are increasing.
That leaves an external forcing that increases the GHE by evaporating more water.
The CO2 Coalition succeeds at misleading some people.
“Here is an example that shows up to 3.5C variations over a period of a few hundred years.”
There is no evidence that large T changes in parts of Greenland are replicated globally. Arctic amplification is a well known phenomenon.
For example the current warming is ~ 3x faster in the Arctic than globally.
https://www.columbia.edu/~mhs119/Temperature/T_moreFigs/zonalT.png
Nate says:
”The CO2 Coalition succeeds at misleading some people.”\\\
———————
The CO2 Coalition is over almost 200 independent science members being smeared by a single dingbat here.
Need I say more?
Nate says:
” ”Here is an example that shows up to 3.5C variations over a period of a few hundred years.”
There is no evidence that large T changes in parts of Greenland are replicated globally. ”
————————–
You couldn’t be more wrong. It’s replicated in all the unsmoothed ice core presentations. . .in both hemispheres.
Nate says:
”Arctic amplification is a well known phenomenon. For example the current warming is ~ 3x faster in the Arctic than globally.”
Yes it is and it is attributed to local melting of ice sheets that warm those areas far faster than the remainder of the ice sheet warms. And of course ice cores are always done in areas of permanent ice. Its pretty hard to get an ice core from a melted ice sheet. But I suppose you didn’t even think of that.
“You couldn’t be more wrong. It’s replicated in all the unsmoothed ice core presentations. . .in both hemispheres.”
Show us the match to Antarctic ice cores.
bill,
Nate’s right. Your source (CO2 Coalition) is only showing Greenland temps, not global. And the rhetoric is totally unclear. Are they comparing one ice core temp with global temp?
https://co2coalition.org/facts/temperatures-have-changed-for-800000-years-it-wasnt-us/
I went to check one of the sources (Alley RB, 2004), but the page at NOAA has been deleted. There have been a lot of deletions there, lately.
I did find a graph from that reference, on temps for the last 5000 years. It looks absolutely nothing like the graph shown at CO Coalition.
https://www.eoas.ubc.ca/courses/eosc212/icecore-data/GISP-TempSnow.html
Nate, it would be much easier would be for you to show me one that doesn’t. I could do it all day long and you would still complain I didn’t produce enough to prove a global trend. Obviously you must have one because you have been mouthing off about this for years.
I provided a source for Greenland from the CO2 coalition that shows the natural variation on permanent ice. You have shown absolutely nothing on permanent ice. . .instead you ignorantly try to show arctic warming which is a polluted dataset as far as trying to use it as a proxy for permanent ice. Further experts know that the arctic is warming at at an accelerated rate not because permanent ice is warming at an accelerated rate but because permanent ice is melting and the resulting change in albedo where the ice used to be.
Your argument is both ignorant and is totally destroyed by your ignorance.
Barry, You have to be kidding. Are you trying to tell me you don’t see a lot of temperature variation on your chart? During the Holocene there is easily 3.5c changes over the permanent ice on which snow is accumulating. You see the major peaks at ~3,500 years BP and 7,000 years BP. You can see the smaller variation two but the scale of the chart is probably one twentieth of the CO2 chart thus everything is more approximate.
“Nate, it would be much easier would be for you to show me one that doesn’t.”
Right. As usual you cannot support your claim with data.
“I could do it all day long and you would still complain I didn’t produce enough…”
No that is YOUR specialty. Here is a perfect example of it right here:
“you ignorantly try to show arctic warming which is a polluted dataset as far as trying to use it as a proxy for permanent ice.”
And it is more absurd and contradictory that you want to claim YOUR ice-sheet data is a proxy for the global temperature variation.
The data I show is comparing Arctic and global temperature data, which you then arbitrarily label ‘polluted’ because it is not on ice!
Either support your claims, or stop making claims that you cannot support.
Nate says:
”Right. As usual you cannot support your claim with data.”
Not per usual. I gave you the references to the studies on the Milankovic and NASA work that shows they are aware of planetary influence on earth’s orbit and natural climate change across numerous time scales. But of course it was a waste of time and you just ignored it because you are all bought in in some way politically and its politically inconvenient.
Further, I gave you one ice core record that does show 3.5C natural climate change at approximately 3,500 years BP and 7,000 years BP. You have provided zip to refute the implications of that.
Finally, You are like the pot calling the kettle black when the kettle already came clean and you have not even made an attempt to. I said show me an unsmoothed ice core record with references that doesn’t show robust natural climate change at periods of 3,500 years, and 900 years. You have failed to do that completely.
Nate says:
Not true. I gave you months ago a reference that indicates that the strongest influence in the record is eccentricity change which affects the speed of earth through perihelion and aphelion.
the other axial variations only change over thousands of years and together don’t even amount to as much change according to those scientists who have done supplemental work on Milankovics work.
You tried to argue that eccentricity change only occurs over a hundred thousand years. Indeed there may be a cycle as all the planets move into an ideal position to emphasize either maximum cooling or maximum warming. The 3500 year cycle of Uranus and Neptune is more likely than not a perfect ratio to the ~900 year ratio that even you acknowledged when we discussed a model for eccentricity change. NASA knows about it and I provided you a link to that.
We also had an extensive conversation about a chart in the Berger reference that showed your claim of a slow hundred year cycle to be false. One only need look at the ice core data to see thats complete nonsense. The hundred thousand year cycle is only one of many. Some think think there are also longer ones. And no doubt the 100 thousand year cycle isn’t just an eccentricity cycle its one that aligns with maximums of the axial cycles. which would be approximately twice one of them and four times the other.
Nate says:
”Right. As usual you cannot support your claim with data.”
Not per usual. I gave you the references to the studies on the Milankovic and NASA work that shows they are aware of planetary influence on earth’s orbit and natural climate change across numerous time scales. But of course it was a waste of time and you just ignored it because you are all bought in in some way politically and its politically inconvenient.
Further, I gave you one ice core record that does show 3.5C natural climate change at approximately 3,500 years BP and 7,000 years BP. You have provided zip to refute the implications of that as I detailed above telling us something else shows even more variation in the temperature records. Do you always become more convinced with an apple to oranges comparison. Are you so corrupt and ignorant as to just ignore that?
Finally, You are like the pot calling the kettle black when the kettle already came clean and you have even made an attempt to. I said show me an unsmoothed ice core record with references that doesn’t show robust natural climate change at periods of 3,500 years, and 900 years.
What have you contributed? Nothing except denial.
Nate says:
”And it is more absurd and contradictory that you want to claim YOUR ice-sheet data is a proxy for the global temperature variation.”
Oh getting desperate now and resorting to lying. I never said any such thing. All I did was give a rationale for why the temperature change of the ice core data in the face of orbital perturbations should be less than the global average because its albedo on average is a lot higher than the global average.
That would be in accordance with basic radiation physics. The higher the albedo the less radiation absorbed. Multiply by a global percentage increase in watts for each area and the non-ice areas are going to absorb more additional heat than the high albedo areas.
Nate says:
”The data I show is comparing Arctic and global temperature data, which you then arbitrarily label ‘polluted’ because it is not on ice!”
Google AI:
”Arctic amplification, where the Arctic warms at a rate faster than the global average, is primarily driven by the loss of sea ice and snow cover. This melting exposes darker ocean and land surfaces, which absorb more solar radiation than the reflective ice and snow.”
If you want to dispute that you should have a reference Nate. If you don’t have any then its beyond me why you think the ice would retain more of the additional energy input.
Me:
“There is no evidence that large T changes in parts of Greenland are replicated globally.”
————————–
You:
“You couldn’t be more wrong. It’s replicated in all the unsmoothed ice core presentations. . .in both hemispheres.”
So, naturally I asked you for data from Antarctica that could replicate the Arctic.
But, apparently you can’t find any. So your claim is unsupported.
Apparently it is just something you hoped or imagined was true.
Then, as usual you get all pissy, trying to blame me for YOUR failure to support your claims.
Nate says:
July 12, 2025 at 6:31 AM
Me:
“There is no evidence that large T changes in parts of Greenland are replicated globally.”
So, naturally I asked you for data from Antarctica that could replicate the Arctic.
But, apparently you can’t find any. So your claim is unsupported.
———————–
LOL! I see you are ignorant on this point because you can’t refute it.
Thats good enough for me.
I have a couple of Antarctic ice cores with sufficient detail to spot the cycles somewhere buried in my bookmarks but why bother looking? To convince a flat earther that the earth isn’t flat?
It actually doesn’t matter. The only thing that matters in solving the climate mystery is the climate sensitivity number and that can’t be calculated by planet watching or CO2 molecule counting.
If you think you have a case for climate sensitivity, post it, it actually could lead to me bothering to make a sandwich for you. But probably not. Your uncertainty was my only objective and currently that deserves a ”mission accomplished” banner.
Regime change in your brain? LOL!
“Barry, You have to be kidding. Are you trying to tell me you don’t see a lot of temperature variation on your chart?”
I definitely do.
I also see temps in the ‘present’ higher in the source material than in the CO2 Coalition chart. The GISP2 temperature data goes up to 1855, whereas the chart at CO2 Coalition goes up to 2007.
The GISP2 data has the 19th century (where it ends) warmer than any other temperature peak in the record, except for the holocene thermal maximum, when insolation concentrated further North. But the CO2 Coalition chart somehow presents this data as if modern temps were frequently exceeded over the holocene.
They’ve also spliced a chart of weather station records to bring the record up to 2007, and this should be warmer than any peak for 5000 years, according to the source data.
Furthermore, the peaks and troughs are over hundreds of years. I found the rapidest temperature changeover the holocene at +/-0.4 C/decade,comparable with the current rate in Greenland of about 0.5 C/decade. This does not include the sudden warming of the 8.2 kilo year Dansgaard–Oeschger event, which is the one time during the holocene that the rate of temperature change exceeded current, and for which there is no indication that global temperatures moved as quickly.
CO2 Coalition have presented a dubious graph. Click on the chart presenting source data – you can use a slider from left to right to highlight and magnify the holocene and get a good look on how that compares to the CO2 Coalition graph.
https://www.eoas.ubc.ca/courses/eosc212/icecore-data/GISP-TempSnow.html
This chart goes up to 1855.
“have a couple of Antarctic ice cores with sufficient detail to spot the cycles somewhere buried in my bookmarks but why bother looking?”
Bill if you had any such thing you would show it.
Obviously you don’t have this stuff.
So you shamelessly lie.
Why?
barry says:
July 13, 2025 at 12:35 AM
“Barry, You have to be kidding. Are you trying to tell me you don’t see a lot of temperature variation on your chart?”
I definitely do.
I also see temps in the ‘present’ higher in the source material than in the CO2 Coalition chart. The GISP2 temperature data goes up to 1855, whereas the chart at CO2 Coalition goes up to 2007.
The GISP2 data has the 19th century (where it ends) warmer than any other temperature peak in the record, except for the holocene thermal maximum, when insolation concentrated further North.
——————–
I don’t know what you are talking about Barry. The most recent data point in your link to the GISP2 data shows the temperature to be -31.59C. The arrow on the CO2 coalition chart labeled ”start of data” is pointing at about -31.59C
Further the GISP2 data in your link shows the most recent temperature to be -31.59C (as mentioned above) but shows, for example, 3,249 years ago the temperature was -29.046. By my reckoning that means 3,249 years ago (BP) it was more than 2.5C warmer than the most recent data.
Barry also says:
”But the CO2 Coalition chart somehow presents this data as if modern temps were frequently exceeded over the holocene.
They’ve also spliced a chart of weather station records to bring the record up to 2007, and this should be warmer than any peak for 5000 years, according to the source data.”
—————————-
What source data? The CO2 Coalition has a link noted on their chart for the study used to extend the chart to 2007.
I haven’t reviewed that study and don’t really intend to because that part of the CO2 Coalition chart is outside the scope of what I am discussing in this thread that only refers to using ice core data.
If you want to make a point about that, thats another discussion but if you do you need to start making sense of what you said above which is the exact opposite of what the Alley data shows.
Barry goes on to say:
”Furthermore, the peaks and troughs are over hundreds of years. I found the rapidest temperature changeover the holocene at +/-0.4 C/decade,comparable with the current rate in Greenland of about 0.5 C/decade.”
—————-
You have several problems here Barry. I originally said in this thread: ”Here is an example that shows up to 3.5C variations over a period of a few hundred years.” so we are not in dispute there and never have been.
Second, one cannot compare shorter term variations to longer termed ones. The 3,500 year peaks are a culmination of 175 year cycles that march around the compass in about 20 degree steps. So just from Neptune and Uranus you have periods of variable rates of cooling as seen in all the instrument and proxy records. Throw in the warming influence of Jupiter and Saturn having a warming influence 2 times each 60 years and only one cooling influence. The tri pattern of Jup/Sat conjunctions also marches across the sky navigating 1/3rd the compass in 900 years moving it 2 cooling influences and only one warming influence (which also matches the Alley 2004 data as seen clearly in the CO2 Coalition chart making 10 peaks in 9,000 years.)
Barry doubles down on his mysterious claim:
”CO2 Coalition have presented a dubious graph. Click on the chart presenting source data – you can use a slider from left to right to highlight and magnify the holocene and get a good look on how that compares to the CO2 Coalition graph.”
———————–
You haven’t pointed out any differences in this graph from the first graph. Are you just throwing stuff against the wall hoping something will stick?
Let’s back up, bill.
Gadden said: “For GLOBAL average temperature thousands and millions of years back, you need to look at paleoclimate data. You didn’t know that? I wrote ‘ten times faster than the most rapid known global warming’ ”
You then pointed to temperatures at a single site via CO2 Coalition – GISP2 core in Greenland.
While the Earth warmed 5-6 C over the phase from the last glacial period 20,000 years ago to the current interglacial, the polar regions show a total of 10-12 C warming while temps closer to the equator only show 2-3 C warming, and mid latitudes 4-6 C.
GISP2 shows 15C warming. It is one of the areas on Earth most sensitive to changes in climate. This well-known phenomenon is called ‘polar amplification.’ The NH particularly is sensitive to insolation changes that barely affect equatorial temperatures.
So CO2 Coalition is trying to imply that GLOBAL temp rates have been matched or exceeded by showing data from a region that is an amplification of global changes both historically and currently.
I don’t know why the graph I linked has values different to the source data, but you’re right that the source data have higher temps during the holocene.
barry says:
”You then pointed to temperatures at a single site via CO2 Coalition – GISP2 core in Greenland.”
——————–
Yes.
Barry says:
”While the Earth warmed 5-6 C over the phase from the last glacial period 20,000 years ago to the current interglacial, the polar regions show a total of 10-12 C warming while temps closer to the equator only show 2-3 C warming, and mid latitudes 4-6 C.”
Well known polar amplification you mention above has nothing to do with permanent ice Barry.
If you want to link known polar amplification to a permanent ice core taken in the middle of Greenland you need some contemporary station reading there over the approximate 250 year periods these perturbations occur within. There are more than 3,500 year periods as they are made up of pulses of the planet orbits over time. Three of the major component pulses I have been looking at occur on 20 year, 60 year, and 82 year cycles. So you can expect a good deal of acceleration and deceleration of the rise over 150 to 250 year periods of rise.
GISS shows 1.2 C rise in 145 years. Thats a rate less than half for what the last 45 years show and UAH shows a slower rate than that. the rate of natural change on the permanent ice over 160 to 250 years is about. .1C/decade. Thats more than the rate for GISS over the industrial revolution limited to back to 1880 (.08C/decade)
The fact that it has accelerated to .2c/decade over the past 45 years per GISS and .16c/decade per UAH can’t be compared to a record that takes the mean for a 100 years. If you look at a 100 years then GISS gives us a rate of .12C/decade which is slightly more but an even more shortened period of time showing clear how inaccurate trying to claim rates of unusual warming is because of the many natural cycles we have to deal with just considering the 4 most important planets.
Your discussion about how much globe warmed between the glacial/interglacial period is really irrelevant as about half that warming would be due to axial effects on the Arctic that occur over 10’s of thousands of years.
Its typical of the ordinary climate alarmist to fail to stay within relevant scope. You can be better than that Barry.
Barry says:
”While the Earth warmed 5-6 C over the phase from the last glacial period 20,000 years ago to the current interglacial, the polar regions show a total of 10-12 C warming while temps closer to the equator only show 2-3 C warming, and mid latitudes 4-6 C.”
You were complaining about me having only one source and here you are with no sources.
Found an Antarctica ice core temperature chart for the same period as Bill’s Greenland ice core temperature chart to check for correlation.
Here is Bill’s Greenland.
https://co2coalition.org/facts/temperatures-have-changed-for-800000-years-it-wasnt-us/
Here is Antarctica:
https://kenskingdom.wordpress.com/wp-content/uploads/2021/08/vostok-20ka.jpg
Other than a single harp spike around 8000 y bp and less sharp in Greenland, I see no correlation, and overall smaller variation
Nate, Thanks for providing a source that shows you are wrong. Thats big of you.
As you can see from the chart the variations in the antarctic has regular warming events occurring frequently during the holocene that are the equivalent of the global industrial age warming and often larger.
Based on instrument records during the Holocene we have reason to believe that instead of amplification in the Antarctic you get less warming occurring during these events than in other areas of the globe.
That effect can also be predicted by both the high albedo of ice and its location such that a given percentage increase in solar input would represent fewer watts being absorbed in the polar regions both because of the permanent ice and because of a relatively lower angle of the sun compared to other surface areas more perpendicular to the sun.
But we don’t even need that to suggest that the Antarctic shows warming events that make the current global warming event look tame.
Its good to see you coming along here Nate.
YOU “You couldn’t be more wrong. It’s replicated in all the unsmoothed ice core presentations. . .in both hemispheres.”
Me:
“Show us the match to Antarctic ice cores.”
As we can all see, there is no match.. The data clearly show that your claim was patently false.
More confirmation that, as ever, you just made it up.
Whats the matter Nate can’t you even read the graphic you posted?
Your source has over 10 events of temperature rises in excess of the industrial revolution global temperature trend all in roughly equivalent periods of time.
Additionally both GISP2 and Vostok were taken above 10,000 meters. That puts it in UAH mid-troposphere temperature record. That record shows a lower warming trend than the lower troposphere making these temperature variations less than would be the case for the global surface temperature record.
Other reasons these records might be less than the global mean surface temperature near sea level is that a percentage increase in sunlight received would result in fewer watts to warm the surface the higher the albedo, the higher the latitude, and the higher the elevation. You have no mitigating argument here.
You have fallen into the trap by less than honorable institution administrators and scientists working like carny barkers outside side shows trying to convince the public that ice cores in permanent ice is subject to the same albedo effects of ice sheets completely melting and exposing lower albedo surfaces.
You can be a sucker but don’t ask the rest of us to join you.
“It’s replicated in all the unsmoothed ice core presentations.”
You don’t seem to understand that a global rise or fall in temperature, as you claim, requires correlation of T at distant locations.
The two ice core T charts above are not correlated. Therefore they represent non-global warming and cooling events.
Nate says:
”As we can all see, there is no match.. The data clearly show that your claim was patently false.
More confirmation that, as ever, you just made it up.”
If you want a match one needs to design a study to provide a match. First thing you do is use consistent methods. The chart you provided for Vostok used a different method both for dating and temperature than GISP2.
We can apply the same standard to CO2. Its warming in the Arctic but not warming in the Antarctic. So obviously according to your logic there should be no ”global” warming, right?
What you need to face is that natural variation is so strong and frequent in both charts by the time you sum all the errors and biases they might match perfectly. But they don’t actually need to as per the previous paragraphs.
So the bottom line is 1) you can’t say with certainty there is no alignment; 2) even if there isn’t alignment natural temperature changes greater than what we have seen over the industrial record is clearly in the both these proxy records; 3) any misalignment would be minor due to the frequency shown in the chart of temperature anomalies. 4) If you want to claim otherwise that’s fine too. . .but keep in mind I am not the one in here hustling ”the science is settled” narrative.
“Well known polar amplification you mention above has nothing to do with permanent ice Barry.”
I feel like you’re losing the thread of the conversation.
Gadden spoke of rapid changes for GLOBAL temperature.
You said, “Check out Greenland Ice Cores!”
I said, “That location is not global, has huge variance, and experiences amplification of any global temps – eg, bad proxy for global.”
I don’t know what your answer above has to do with any of that.
“Your discussion about how much globe warmed between the glacial/interglacial period is really irrelevant…”
I guess it is if you forget the thread of the conversation.
“Its typical of the ordinary climate alarmist to fail to stay within relevant scope.”
Irony.
“You were complaining about me having only one source”
No, you had a little dream that I said that.
You said, “Well known polar amplification.” That’s right. And the NH, particularly the Arctic, has the largest local temperature variability and amplification in the world on multiple timescales.
Also, it seems that (decadal to centennial) variability is dependent on background temperature. Eg, variability during the LGM (in the Arctic) was probably greater than the holocene.
Short answer – Greenland aint Global.
Bill,
So this started with you claiming about the ice core temps in Greenland:
“It’s replicated in all the unsmoothed ice core presentations. . .in both hemispheres.”
Now that has morphed into:
“by the time you sum all the errors and biases they MIGHT match perfectly.”
As usual, your fantasy claims just go slip-sliding away upon scrutiny.
Nate says:
”Now that has morphed into:
”by the time you sum all the errors and biases they MIGHT match perfectly.” ”
————————
Yes they ”might” match perfectly. But be aware that they don’t have to match perfectly.
Reasons:
1) There are four planets driving Milankovic orbital perturbations on short time scales. The significant alignments are rare and every alignment has variable differences thus peaks occur randomly during periods the slower planet alignments for say a warming influence are in the right zone the faster planets that drive stronger shorter term variations may be out of time for up to a maximum of 900 years.
2) Feedback time varies. The feedbacks from ENSO for example take a few months to affect global weather. Feedbacks from ice melt can take far longer. Since feedbacks are currently estimated to be twice that of the initial perturbation the actual maximum temperature effects may not show up immediately.
Update about UHI ans temperature stations – Just saw a Heartland article from 3 years ago, claiming that something like 98% of USA stations do not meet NOAA criteria for proper siting. The USA has one of the most extensive networks of weather stations. If ours are that bad, my belief is that land-based temperatures cannot be relied upon. Satellite and maybe rural stations are more reliable than most of our stations for temperature. Has there been there global warming over the last 40 years? Likely. Has there been global warming over the last 150 years. I dunno. We have less than 50 years of satellite temps. Is a lot of the warming as recorded by land based stations the result of development/UHI? Very likely. Is the warming based on the faulty data (even assuming it is right) a concern? No. The scale is very small. Proxy temp data shows much more extreme temps (and CO2) and man, other primates, and plants seem to be able to survive and adapt quite well, thank you. Abatement strategies seem far more damaging than the minor threat presented by warming.
‘Heartland article’
A political advocacy group, not a science source, therefore should be treated with skepticism.
Nate, if we were to use those as the ground rules of debate, I am not sure we would have much to talk about. Some basic rules of debate: 1) “ad hominem” attacks (like assumed bias in favor of one side of an argument) are invalid, 2) “appeals to authority” (like trying to judge the validity of an argument by evaluating the source of the statement/conclusion) are likewise invalid. Statements, opinions, theories need to stand on their own, non matter the source. It is quite logical that a source that you consider biased can provide reliable information. It is equally feasible that a source that you consider a reliable science source can provide untrue information. And it is quite a stretch to assume that mainstream science is not affected by the huge funding coming its way.
Thomas, if we were to use ground rules, we should not forget:
– handwaving, e.g. “I just saw a Heartland article”
– cherry-picking, e.g. “from 3 years ago”
– counterfactual thinking, e.g. “If ours are that bad”
– begging the question, e.g. “If ours are that bad”
– arguing by ignorance, e.g. “I dunno”
– arguing by assertion, e.g. “Very likely”
– hasty generalizations, e.g. “man, other primates, and plants seem to be able to survive and adapt quite well”
– tu quoque e.g. “it is quite a stretch to assume that mainstream science is not affected by the huge funding coming its way.”
Arguing is hard.
Science receives very little compared to the fossil fuel industry, and to what the Heartland Institute receives to argue badly.
Thomas,
One of the key tenets of critical thinking is: ‘Consider the source.’ of your information.
Especially these days with so much misinformation on the internet.
So to consider the source, one has to know whether the source is in the business of producing propaganda in favor of certain govt policies,
OR
is it it from a reputable publication whose sole mission is science or communicating science.
For Heartland, it is demonstrably the former. I have direct experience with their efforts to produce propaganda.
In this case, we can also look at your article to determine if it is leaving out relevant information.
So, please show us the article, if you dare.
Nate, life is too short (and the weather here today is too beautiful) to spend it in the tedious back-forths that characterize a lot of the comments on to these posts. I did have a short (4 years) and long ago (60s and 70s) exposure to the “business” of weather and climate and air pollution research and science. I left because I became disenchanted with the money and career driven (personal) motivations right below the surface of what we were doing. My idealism ran right into the reality of the importance of personal gain. Research too often was done to mostly benefit the scientists, not the science. Oh, they believed in what they did, but the notion of advancing science came in a distant second to their careers, getting grant money, and getting an ego boost from various forms of recognition. People (and institutions) at their core do not change. Mainstream climate science has done more to destroy the common man’s faith in science than almost any other discipline. The failures of public health, medical care, and the pharmaceutical industry com in a close second. Surveys consistently show that.
Good old Heartland, spreading the word that Climate Scientists are just like Mass Murderers:
https://www.theguardian.com/environment/blog/2012/may/04/heartland-institute-global-warming-murder
Meanwhile from you we hear:
“Mainstream climate science has done more to destroy the common man’s faith in science than almost any other discipline”
‘Lifes too short’ to support your claims Thomas, but not too short to echo the Heartland style ad hominem attacks.
Second warmest June, beaten only by last year’s.
Year Anomaly
1 2024 0.69
2 2025 0.48
3 1998 0.44
4 2019 0.34
5 2023 0.30
6 2020 0.29
7 2016 0.21
8 1991 0.18
9 2010 0.18
10 2015 0.18
My projection for the year increases slightly to 0.50 +/- 0.12C, with it looking increasingly likely that 2025 will be warmer than 2023. But we will see.
Recent changes at the poles have had a major effect on CFSR data. It will be interesting to see where this goes. It could throw off your “projection” by a significant amount.
https://oz4caster.wordpress.com/wp-content/uploads/2025/07/d1-gfs-gta-daily-2025-07-02.gif
That’s why I said “We will see”.
I was going to mention the big drop in land temperatures as seen here
https://pulse.climate.copernicus.eu/
It certainly looks that much of South America has turned very cold. But I don’t know how much significance to put on 1 day.
Where is that data from?
And absolutely zero evidence of any human causation.
Bellman” I don’t know how much significance to put on 1 day.”
The CFSR data shows cooling over the last 6 months which has now reached 0.9 C. Much of that has occurred in the last week, so it could be a fluke. However, it’s unprecedented without volcanic or ENSO forcing.
“The CFSR data shows cooling over the last 6 months which has now reached 0.9 C.”
No, you need to compare at least whole months to the same months in previous year. Then you will see that compared to last year (the peak year for El Nino warming) the months have been ~ 0.1 C cooler.
Pretty normal.
Nate says: “you need to compare at least whole months”
Wasn’t it last summer the media was comparing day by day anomalies to the past and claiming record warming? Hottest evah!?! What goes around comes around ….
I didn’t say this was a long term trend, but I didn’t see any previous cooling period quite like it. Personally, I’m thinking this could be the end of the Hunga-Tonga warming period and we will level off to values seen prior to 2022. That will take several more months to determine.
We are 30 years into the latest +AMO phase so even more cooling will be coming soon.
Or …. we could see some major cooling.
https://oz4caster.wordpress.com/wp-content/uploads/2025/07/d1-gfs-gta-daily-2025-07-02.gif
Just weather. Antarctica has large variations this time of year.
” Recent changes at the poles have had a major effect on CFSR data. ”
Really?
https://drive.google.com/file/d/1KdsNhZb-8-lFt112o80zXrCPZL77FqS4/view
I based my comment on this graph.
https://oz4caster.wordpress.com/wp-content/uploads/2025/07/d2-gfs-grta-daily-2025-07-02.gif
Think this may be the first time UAH has hit a rate of +0.16C per decade warming for any period exceeding 360 months (30-years).
It’s been +0.16C/dec before a couple of times previously; once in the late 1990s and again in the early 2000s; but never before over a period spanning 30-years or more. (30-years being the standard period of reference in climatology, as far as I’m aware?)
Right, and by 2014 the trend had dropped to +0.11 C/decade. The trend line rises and falls.
“The trend line rises and falls.”
_________________
Indeed, but where periods of 30-years (360 months) and more are concerned, this is the first time the UAH_TLT warming trend has surpassed +0.16 C per decade.
Also, taking only 30-year periods, of which there are now 200 in the UAH_TLT data (i.e. overlapping consecutive periods of 360 months each), the average trend is +0.13C/dec with a standard deviation of (+/-) 0.015C.
The 30-year periods ending over this past 3 months, (Apr-Jun 2025) have all had warming rates of +0.17C/dec; that is to say, more than 2 standard deviations above the long term average for 30-year periods.
These facts may not indicate a long-term acceleration in the UAH warming trend, but they are new high water marks in terms of the UAH warming rate for periods of, and exceeding, 30-years.
Nope, red krokodile. The 30-year average trend line doesn’t ever fall. The 10-year average trend line occasionally falls slightly but there is no question that the long term trend is upwards. See https://datagraver.com/climate-data-set-uah/
This is obviously not surprising since this was predicted in the 1800s when the atmospheric greenhouse effect was discovered. It’s been known since the 1800s that CO2 emissions make Earth warmer in the long term.
The use of 10 and 30-year averages assumes stationary variability throughout the time series. The anomalous warming observed over the last 2 years challenges that assumption.
“Nope, red krokodile. The 30-year average trend line doesn’t ever fall.”
You talking about trends or averages? The 30-year trends definitely rise and fall.
1979-2008 trend = 0.126 C/decade
1980-2009 trend = 0.121 C/decade
1981-2010 trend = 0.141 C/decade
As all 30-year trend comparisons are within each others’ uncertainty range, this is not saying much at all.
Barry,
You obviously don’t know what a TREND is. Your point differences like from 1979 to 2008 (which is a change over 29 years) aren’t trends. When I said “30-year average trend” I obviously meant the trend of the 30 year average. Why else do you think I explicitly linked to https://datagraver.com/climate-data-set-uah/ in my post?
Just click on the link and study the graphs, particularly the one showing the 30 year average. Sheesh.
Gadden,
They are 30-year trends. The standard format is to make the period inclusive of the end year. See Roy’s 30-year period in the article above (1991 – 2020) for an example.
Your 30-year centred average was not the topic of conversation when you posted it. It was 30-year linear trends, so when you replied, “nope,” you misunderstood the topic. That’s why I asked you what you meant.
Yep, 30-year linear trends do rise and fall throughout the UAH LT record.
And that is the 46 year trend, and a significant increase in it over the last several years.
The short term trends, 30 year, 46 year, etc are a curiousity only.
What of the 2,000 year trend? Something more in concert with geologic timescale, not human life span timescale.
Leweis Guignard, here’s the 2,000 year data. Any takeaways?
https://en.wikipedia.org/wiki/Global_surface_temperature
You think a one degree C warming of the EARTH’s decadal average over 50 years is a “curiosity only”? Are you mad? Which NATURAL mechanisms are realistically capable of EVER having warmed Earth at such a rapid rate?
This is the link I meant, sorry: https://commons.wikimedia.org/wiki/File:Common_Era_Temperature.svg
And if you’re unhappy with that one, there are plenty of others here: https://gist.github.com/priscian/5a10f13dbf727048aee17e5d3849041a
https://oz4caster.wordpress.com/wp-content/uploads/2025/07/d4-gfs-gta-daily-2014-2025-07-02.gif
Looks like CFSR is trending lower.
Where exactly is this data
https://oz4caster.wordpress.com/cfsr/
The 1877 spike continues to serve as a template. This is NOAA data through April. The next six months should be interesting.
https://localartist.org/media/HTvAkjsaENSO2504.png
Correction: NOAA data included May. I’ve added the UAH data through June.
https://localartist.org/media/HTvAkjsaENSO2506.png
Cool
In a previous thread, Wal~ter R. Hog~le (who now nicknames as ‘red krokodile) posted the following:
” Bindi is quick to generate inverse hockey sticks for Arctic sea ice and Rutgers’ Northern Hemisphere snow cover, ignoring key context, like the non stationary shifts that challenge IPCC assumptions in the former, and the seasonal divergence in the latter (with Northern Hemisphere autumn and winter snow cover increasing).
Yet when confronted with the fact that these kinds of shifts impact the signal to noise ratio, as in the case of the anomalous drop in cloud cover during 2023-24, he brushes it aside. When the signal is buried in noise, as it is here, it is simply not credible to claim detection of climate trends with the kind of precision he asserts.
This selective treatment of evidence mirrors climate denial. It is well established that climate deniers view science through the lens of their ideology rather than through objective inquiry. ”
*
This is really brazen. I never posted any ‘inverse hockey sticks about anything: this is a sheer lie. Hog~le polemically discredits what I do instead of technically contradicting it with charts proving he is right; he simpl,y is unable to do that.
*
1. Arctic sea ice
I reproduce either exactly the original G02135 data in absolute form containing the annual cycle:
https://drive.google.com/file/d/1u8Hd4Hpskx9mlKan8CloUHa4JEZk3v4L/view
or in anomaly form with annual cycle removal in the same manner as teached by Roy Spencer:
https://drive.google.com/file/d/1rRqY7uYkHEHYISJgMTt7lue-C8-JI2RI/view
**
2. Rutgers’ Northern Hemisphere snow cover
Same as above.
Original weekly data
https://drive.google.com/file/d/1ABBiug5c5lQ-rgL7Ijd8KjiTcNfGx9rR/view
Data with annual cycle removal
https://drive.google.com/file/d/1843ycyIsaTPuSjQRIIn88Zzo1es_zAmJ/view
*
If you show the data with a 52 week averaging, the decrease becomes even more apparent in both absolute and anomaly-based series.
**
3. Now let’s move to a carefully organized seasonal split of the weekly snow cover data:
https://drive.google.com/file/d/11UUojgTWCvomT5m_DKNp0dFU7APJhwfz/view
As we all can see, Hog~le’s claim (most likely carelessly copied without any verification from a pseudo-skeptical blog)
” … with Northern Hemisphere autumn and winter snow cover increasing ”
isn’t correct.
What is rather visible is that recently,
– winter time isn’t decreasing at all, and that
– autumn increases at the same rate as spring decreases.
*
Conversely, all his claims about the “key context,” especially about the “signal-to-noise ratio,” etc., as usual, lack any proven scientific basis.
I asked Hog~le for such a source; he could only provide me with three links to articles that didn’t even mention the points highlighted in bold above.
*
Germans would call Hog~le ‘dummdreister Schnösel’, i.e. a brazen snoop.
Bindi, did red krokodile correct you again? Is that why you’re so mad?
Have you noticed that you’re ALWAYS mad?
Maybe you’re just mad at reality….
Clint,
We tend to follow different corners of discussion on here, but I have noticed our impressions seem to overlap in a certain direction about you know who. Can’t help but think that says something. Curious if you see it the same way.
Yes red, Bindi is one of a group of about 8-10 that are only here to disrupt and pervert. I call them the “cult kids”. They have two things in common — they have no interest in science (reality), and they hate anyone that doesn’t hold their false beliefs.
Classic case of projection – seen most clearly in the current president.
“Accuse your enemy of what you are doing…”
This quote (often attributed to Karl Marx, Joseph Goebbels, or Saul Alinsky) describes a common strategy of propaganda referred to as projection.
The tradition has been that the first day of a new post by Dr. Spencer should be restricted to rational comments without arguments and insults. You should show more respect.
“I never posted any ‘inverse hockey sticks about anything: this is a sheer lie.”
Yes, you did. Here:
https://drive.google.com/file/d/1ebdqPl_tmxazXAMchHEU87zVvvPdonef/view
https://www.drroyspencer.com/2025/03/hey-epa-why-not-regulate-water-vapor-emissions-while-you-are-at-it/#comment-1700872
“(most likely carelessly copied without any verification from a pseudo-skeptical blog)”
https://climate.rutgers.edu/snowcover/chart_seasonal.php?ui_set=nhland&ui_season=1
https://climate.rutgers.edu/snowcover/chart_seasonal.php?ui_set=nhland&ui_season=4
Rutgers University: a ‘pseudo skeptical blog,’ really, Bindidon? That is quite a dismissal for an institution known for rigorous work. One might expect at least a shred of evidence before such a sweeping judgment.
“winter time isn’t decreasing at all, and that
– autumn increases at the same rate as spring decreases.”
No, winter snow cover is increasing as shown above.
And why exactly do you think the autumn increase is “offset” by spring decreases?
That is such nonsense. More autumn snow cover over Siberia strengthens the Siberian High, which in turn enhances polar air advection into Eurasia later in the winter.
These are not abstract numbers you can cancel out on a spreadsheet. They are physically meaningful and seasonally asymmetric.
“he could only provide me with three links to articles that didn’t even mention the points highlighted in bold above.”
Yes, none of the papers explicitly claim the global signal to noise ratio changed two years ago. So what? The purpose of reading scientific research is not to find every conclusion spelled out. It is to understand the content, apply the insights, and draw logical extensions beyond what was directly studied.
Your entire comment is vacuous. You cannot respond to the evidence, so you resort to lazy speculation about who you think I am.
Hog~le
” Bindi is quick to generate inverse hockey sticks for Arctic sea ice … ”
*
A reply showing how incredibly dishonest you behave.
*
Here is, made extra for you, your personal ‘inverse hockey stick’:
https://drive.google.com/file/d/1QlG-YLKpZSWSK3Q5_67fc_TvhMj7WYu4/view
*
Feel free to compare it to what I posted on March 18, 2025 at 6:23 PM:
https://drive.google.com/file/d/1ebdqPl_tmxazXAMchHEU87zVvvPdonef/view
*
By insinuating that my comparison of NOAA’s G02135 data to HadISST1 Ice would have anything in common to your dumb idea of inverse hockey sticks, you not only show pure dishonesty but also profound technical incompetence.
*
Not any person who, unlike you so boastfully describe yourself, would ‘understand the content, apply the insights, and draw logical extensions beyond what was directly studied‘ would ever identify my graph to any kind of hockey stick, Hog~le.
*
Simple because s/he would have immediately seen that if I had ever intended to ‘hockey stick’ the data as you woefully insinuate, I of course would have stopped the two time series in 2020 – before they started looking like the contrary of what you overlooked: namely an increase of sea ice shown by both NOAA’s and Met Office’s data.
*
” … so you resort to lazy speculation about who you think I am. ”
I don’t need to speculate about who I think you are, Hog~le.
It is sufficient to look at how you behave.
*
Just a detail, finally.
You proudly showed fall and winter NH snow cover data fitting your personal narrative, but – typical for Pseudoskeptics – intentionally dissimulated the spring data (Rutgers’ summer data isn’t shown anyway at their site):
https://climate.rutgers.edu/snowcover/chart_seasonal.php?ui_set=nhland&ui_season=2
*
Extra for you, I post a graph containing linear trends for the four seasons, to be compared to the much more accurate polynomials:
https://drive.google.com/file/d/1k7evmkZao_oYuT_kuVcF15OzBeeb-vdb/view
*
Trends in Mkm^2/year
Winter: 0.06 +- 0.02
Spring: -0.20 +- 0.02
Summer: -0.34 +- 0.02
Fall: 0.17 +- 0.03
*
Weren’t you a Pseudoskeptic like Blindsley H00d aka RLH, he would of course have discredited your post with a hint on how useless and wrong linear trends are :–)
How do you expect the linear trend is going to alter?
Arctic down to 0.05. Is that exceptional in recent years? Will a ”cold” Arctic affect the global temperature progress in any way? How and why?
Not exceptional. In the summer T is dominated by ice-water temperature ~ 0C.
Nate,
Joachim is referring to the Arctic temperature anomaly.
June’s anomaly for the North Pole is the coldest since February 2023.
Walter,
Joachim is referring to what would be exceptional.
You are referring to a positive anomaly as cold.
Referring to February 2023 is silly.
Joachim was asking whether it stood out compared to recent years, which, as we all know, have already been exceptionally warm.
Willard, isn’t it curious that Bindi didn’t step in to correct Nate, especially given his usual role as the blog’s self appointed temperature data watchdog?
My point was that the anomaly in summer is always very small compared with winter, for the simple reason that the vast open water with melting sea ice is close to 0C.
It is the reason ice-water is used to calibrate thermometers.
You can see that demonstrated here for the polar region.
https://ocean.dmi.dk/arctic/meant80n.uk.php
Pick any year, and you will see hardly any deviation from the blue line (mean of long past decades, in june-august, but large deviations in the rest of the year.
And the June anomaly for UAH Arctic is often negative. Last time in 2017.
The new Monckton Pause extends to 25 months starting in 2023/05. The average of this pause is 0.66 C. The previous Monckton Pause started in 2014/06 and lasted 107 months and had an average of 0.21 C. That makes this pause 0.45 C higher than the previous one.
+0.155 +- 0.041 C.decade-1 k=2 is the trend from 1979/01.
+0.027 +- 0.010 C.decade-2 is the acceleration of the trend.
Rounding this to 1 significant figure means the trend has ticked up to +0.16 +- 0.04 C.decade-1 k=2.
A new record for the highest lower bound of the trend at +0.12 C.decade-1 k=2 occurred on this update.
My prediction for 2025 from the 2025/03 update was 0.43 +- 0.16 C k=2.
My prediction for 2025 from the 2025/04 update was 0.47 +- 0.14 C k=2.
My prediction for 2025 from the 2025/05 update was 0.46 +- 0.11 C k=2.
My prediction for 2025 from the 2025/06 update is now 0.47 +- 0.09 C k=2.
Happy Fourth of July. What a great country our Founders made!
And look who ‘they’ made the President!
I’ll take my leader over your leader any day.
Says you (and no-one else).
We have a King. Do you?
We have the same King. I’d rather the President (this one, not the last one).
” What a great country our Founders made! ”
Oh yes. Based on
– the emigration of some of Europe’s most evil populations to North America (not including people persecuted for political or religious reasons, of course);
– the subsequent extermination of indigenous peoples, which – admittedly – began with the Spanish invasion of North and South America;
– the disgusting enrichment of many ‘Americans’ through the enslavement of Black people brutally torn from their African world and their roots;
– the very silent denazification of an incredibly large number of Nazis who fled the German Reich, which collapsed in 1945, including, among many others, a certain Wernher von Braun and all his closest collaborators, who saved the USA from the shame of its absolute failure in rocket construction in the 1950/60s.
*
Yes. Anderson, who so enjoys insulting others as Nazis and Fascists, can indeed be proud of all that.
Bindi, your extreme Leftism is showing, again.
See a therapist about all your hatred. It might be based on your jealousy….
Hello Mr 360-degree-ball-on-a-string-brain
Thanks for your reply, perfectly fitting your daily attitude.
I love the slave bit.slaves sold by their own country men and tribal leaders,carrying on the long tradition of slavery, did you know that thanks to the Roman empire, The population of Italy was 30% slaves, and Zanzibar was a thriving slave route to the Arab countries , long before Europeans had ships, slavery was not a western invention. But Great Britain ended it , although thanks to China it has re emerged in parts of Africa today.
Germany has a history of both direct involvement in the transatlantic slave trade and the use of forced labor. While not a major colonial power like some other European nations, Germany did participate in the transatlantic slave trade through colonial projects in Africa and through the use of forced labor during World War II.
The concept of “CO2 warming the planet” still has its followers, regardless of the fact that it can’t be supported from First Principles of physics. The reason appears to be that very few people understand radiative physics and thermodynamics, both topics are rather obscure to those with little science background.
For example, the thermodynamic definition of “heat” is “the energy that moves from a hot object to a cold object”. Many cannot understand that simple definition. As another example, radiative fluxes can not be simply added. Yet the vast majority of “CO2 Warmists” believe fluxes from the atmosphere simply add to solar.
A recent discussion involved a surface emitting 500 W/m². A flux of 400 W/m² arrives the same surface. Could the 400 W/m² flux raise the temperature of the surface that is emitting 500 W/m²?
Of course not! To raise the temperature of the surface, the incoming flux must be greater than the flux emitted from the surface.
Continued stupidity.
You still haven’t explained where the 400 W/m² goes.
Or doesn’t conservation of energy apply in your fantasy world.
Are you sure your name is not D..g Co….n ?
In the science of radiative physics, it’s called “reflection”, child.
Get a responsible adult to explain why you can see things in your playpen.
Clint R
Sorry to give you real physics and not your made up opinion, if a surface has an emissivity of one it means it emits as a blackbody. This also means it absorbs like blackbody! I notice you will provide nothing to support your made up physics. No links. No experimental evidence just your arrogant belief in your own made up opinions. S what is your evidence? Textbook physics says you are wrong! Ball is in your court, what is your valid science source that the 400 W/m^2 would be reflecte???
Again Norman, I did not use the phrase “black body”. I said the plates have unity emissivity. Your “black body” does not exist. It is imaginary. There is NOTHING natural that defies 2LoT.
The fact that your cult beliefs rely on something that does not exist should tell you something….
Clint R
You don’t even know your own posts? Your post was not if a 400 W/m^2 would raise the temperature of a surface emitting 500 W/m^2.
Your post was if you had 1000 W/m^2 reaching a black-body surface with two sides so that each side would emit 500 W/m^2 at Steady State conditions. Then you add a 400 W/m^2 source and yes the temperature will go up with both these sources of input. This is textbook physics, I have linked you to both textbook material and a video explaining it to you. You reject science (real science) in favor of your own made up opinions and beliefs on how you think reality works. That is not science. You reject science and endlessly insult and denigrate any who try to correct your false made up beliefs. This has been going on for some time now.
Wrong again, Norman.
You have NEVER provided a credible source to explain how a surface can be warmed by a flux less that the flux emitted by the surface.
You just BELIEVE ice cubes can boil water.
Beliefs ain’t science….
Clint R
You are stuck in a dumb zone there. Neither I nor the source said a flux that is less than what is emitted will warm the surface. You are neglecting the surface is receiving 1000 watts from another source.
You are correct in stating a lower flux received by a surface will not warm one with greater emission. That is not what your initial post was about and it is not what I am saying.
To clarify, What the textbook states (for a black-body as you used in your original post). This is textbook physics on radiant heat exchange: From my initial post to you on the other thread: “I gave you a textbook example of real physics. Heat lost by a surface is the energy it loses by emission MINUS the energy it gains from the surroundings! This is established physics. The side receiving 400 Watts/m^2 but emitting 500 W/m^2 would have a net heat loss of 100 W/m^2 rather than the previous 500 W/m^2.”
You’re STILL wrong, Norman. Only more so, the more you spew.
Your answer to the problem was “333.3K”. That is wrong, as previously explained. You’re caught in your own web of deceit. That wrong answer has 400 W/m² warming a surface that is emitting 500 W/m²! That violates both radiative physics and thermodynamics.
Now, if you want to admit you are wrong, that’s perfectly acceptable. But if you believe you can pervert reality with long-winded comments, insults, and false accusations, that’s NOT acceptable.
Also, you need to learn what “credible source” means.
Clint R
Since you lack reasoning ability and do not accept textbook physics that clearly explains it to you. You go off on some tangent that I am caught in a “web of deceit” because I can understand physics. It is not my fault you cannot understand it.
For others (not you since your brain is not working).
You have the 1000 W/m^2 received by one side. This warms the plate till it emits 500 W/m^2 on each side. Add the 400 W/m^2 flux on the other side now that side surface is emitting 500 W/m^2 but absorbing 400 W/m^2 at the SAME TIME! This means that that surface is only losing 100 W/m^2 (note it is still losing energy). Since it can only lose 100 W/m^2 of heat on that side, the plate now will warm up more with the 1000 W/m^2 received on the other side. If you do the math and use correct textbook physics the plate will heat up so that it will lose the 1000 W/m^2 it is receiving from the other source. It has to reach a temperature where it will emit 700 W/m^2 from both sides to reach a steady state. The side with the 400 W/m^2 source will emit 700 W/m^2 from its surface but only lose a net of 300. It is emitting 700 but absorbing 400, the net heat loss is 300 W/m^2 on that side and 700 on the other for a total loss of 1000 Watts which is what it is receiving from the other source. Unfortunately you can’t comprehend what is going.
Poor Norman tries again. Notice his comments get longer and longer, as he tries to work his way out of his web of deceit.
From my first comment above:
Norman and studentb strive to prove me right. Neither has a clue about the issues. They both believe that all infrared is always absorbed. Norman says “…that side surface is emitting 500 W/m^2 but absorbing 400 W/m^2 at the SAME TIME!” He actually believes the surface emitting 500 will also absorb 400, at the SAME TIME!
They don’t understand “reflection”. When photons strike an object, there are 3 primary results:
1. The photons can be reflected.
2. The photons can be absorbed.
3. The photons can penetrate the surface.
What will happen will depend on wavelength compatibility. And that wavelength compatibility is greatly affected by temperature. Just as photon emission is greatly affected by temperature (see the Stefan-Boltzmann Law), absorp.tion is also greatly affected by temperature.
Penetration of a surface means the photon continues on, leaving the surface. Visible light can penetrate glass, for example, but little else. X-rays can penetrate the human body. Gamma rays can penetrate a couple of feet of concrete.
Back to “reflection”. It turns out that reflection is the most common occurrence for most photons. That’s why we are able to see things. Our eyes absorb reflected visible light. A table in your room is not emitting visible light. It is reflecting visible light that originated elsewhere. Ever heard of the CMBR? The Cosmic Microwave Background Radiation is composed of photons that are so low in frequency (long in wavelength) that they cannot be absorbed by anything. The entire Universe is too “hot” for the CMBR photons, even though deep space is as low as 3-4K. That’s still too “hot” for CMBR absorp.tion.
So that’s one issue the cult kids can not grasp — not all photons are always absorbed. Not all infrared is always absorbed. 400 W/m² would not be absorbed by a surface emitting 500 W/m².
Clint R
In your original post you made the surface a black-body. That means it emits as a blackbody but it also absorbs all radiant energy that reaches it. It reflects zero energy (that is why it is a black-body). We all understand reflection. You can’t understand a hot body can still absorb energy from a colder one. This is beyond your ability to comprehend so you defend your ignorance with points no one is debating (like reflection). This is called the “Strawman” argument.
Request from you (which you will not honor).
Your falsely claim: “So that’s one issue the cult kids can not grasp — not all photons are always absorbed. Not all infrared is always absorbed. 400 W/m² would not be absorbed by a surface emitting 500 W/m².”
Give a source of valid science that supports your invalid opinion or give and experiment to prove it. This is NOT textbook physics. I have linked you to real science but you ignore it and keep going on with your opinions and false unscientific beliefs. All wrong and with no foundation.
Textbook physics (at least for black-body). The amount of radiant heat lost by a surface is the amount of energy it is emitting MINUS the amount it is receiving. You are just making up stupid physics with zero evidence. Than you call me deceitful.
Wrong again Norman.
I said the plate has unity emissivity. I NEVER used the phrase “black body”.
And yes, when you use false accusations you’re being deceitful.
What will you try next?
Clint R
If a surface has an emissivity of one in the IR band it is also a blackbody in the IR band. It will absorb all radiant energy reaching it. You are on the defensive and desperate. You know you have NO VALID source to confirm your ignorant opinions of how you think physics works. I gave you textbook material. You have absolutely nothing but desperation.
Norman, the problem did not involve an imaginary black body. The problem involved plates with unity emissivity. You keep trying to change the problem, trying to make your bogus beliefs somehow work.
And you never provided any “credible source”. You linked to an online book about radiative heat transfer. But you provided no reference in the book to support ice cubes can boil water, which is what your beliefs would mean.
But you continue with your insults and false accusations, proving me right.
What will you try next?
Clint R
The credible real science clearly states that a hotter body can receive radiant energy from a colder one! This is what the link shows and you just deny and pretend your made up physics is correct. The difference between you and real science is what is in textbooks comes about as the result of experimental evidence.
You could never understand how radiant heat exchange works and for some absurd reason that only exists in your strange reasoning, do you conclude that if radiant energy is absorbed from a colder body to a hotter surface it means ice can boil water. Most absurd and ridiculous and illogical thought process.
I will explain it (you will not comprehend it). If you have ice emitting 300 Watts/m^2 and you have water at 5 C (41 F or 278.15 K) emissivity is around 0.97 for water so it will emit 329.2 W/m^2.
If you surround 5 C water in a sphere of ice emitting 300 W/m^2 the water can only receive a maximum of 300 Watts from the ice if it has an area of one square meter. So the water can receive 300 Watts from the ice but it is emitting 329.2 Watts. It is losing energy even with the ice so you can see water can absorb all the energy from the ice and it still does not logically mean ice can boil water. Not sure why you keep peddling this idiot point!! Only your irrational mind justifies such lunacy.
As all physics textbooks on radiant heat transfer demonstrate.
Norman, thanks for proving me right, again.
Yes, your 300 Watts/m^2 can not raise the temperature of your water, emitting 329.2 W/m^2.
Just like 400 W/m² arriving the plate cannot raise the temperature of the plate that is emitting 500 W/m².
Keep proving me right, I can take it.
Clint R
I have already agreed with you that a colder body cannot heat a warmer one. Not the point you are making at all. You are making the totally unscientific (goes against experimental textbook physics) that 400 Watts will not be absorbed by a surface with a unity of one emissivity (meaning it will also absorb all frequencies of IR radiant energy) that is emitting 500 Watts. You think, for some unknown reason, that in this case it will be reflected. I gave you solid science that says it will NOT be. You have yet to link to any valid source that supports your opinion. You still have not done this in numerous posts. We all know why you can’t do it because you get this from crackpot nonscience blogs where they are free to make up any idea with zero evidence to support the claims.
Maybe others on this blog would like to see support of your ideas, but we all know you will not provide it, including yourself.
Your claim is that a surface receiving 1000 W/m^2 will not increase in temperature when you add an additional 400 W/m^2 to the mix. Really stupid and very unscientific. Your claim is the 400 watts will just be reflected and have no effect. So wrong and based upon nothing but your stating it. No experiment, no science link. Just blab and more blab from the poster who thinks he is a genius.
Norman the proof you need is here:
https://www.drroyspencer.com/2025/07/uah-v6-1-global-temperature-update-for-june-2025-0-48-deg-c/#comment-1707776
Get a responsible adult to explain it to you.
“The Cosmic Microwave Background Radiation is composed of photons that are so low in frequency (long in wavelength) that they cannot be absorbed by anything.”
Wrong, they are microwaves which can be abs.orbed by many things including water, and obviously antennas.
For those who are not aware, Clint R mixes reasonably accurate statements with completely false claims. It seems like rather curious behavior. I will leave it to each reader to decide on their own what he is up to. It could be that he is just looking for attention and will settle for any type of response if it gives him a chance to reply.
3…2…1
Tim, you’ve already demonstrated what a phony you are. Now the fact that you cannot link to any “completely false claims” I’ve ever made just adds to your phoniness.
“What will happen will depend on wavelength compatibility. And that wavelength compatibility is greatly affected by temperature. Just as photon emission is greatly affected by temperature (see the Stefan-Boltzmann Law), absorp.tion is also greatly affected by temperature.”
This is completely made-up ‘physics’. There is no such thing as wavelength compatibility.
In general, absorp.tion is not greatly affected by temperature like emission is.
Emission is sigma*emissivity*T^4.
Absorp.tion is proportional to absorp.tivity, which = emissivity, by Kirchoff’s Law.
Notice the T^4 is not present in absorp.tion.
You won’t offer any evidence, source, or link to support your ‘wavelength compatibility’ BS.
So it can be safely ignored.
Children can be so funny: “There is no such thing as wavelength compatibility.”
Child Nate must be color-blind….
And as for “proof”, Norman did that for us:
https://www.drroyspencer.com/2025/07/uah-v6-1-global-temperature-update-for-june-2025-0-48-deg-c/#comment-1707776
So, as usual, you have no physics source that explains your ‘wavelength compatibility’ nonsense.
If you had a source, this would be the time to reveal it.
If not, you will confirm that it is completely made-up.
Thanks.
Child Nate, you have no interest in learning. You’re here to disrupt and pervert. The fact that you don’t even understand how we see different colors reveals how clueless you are.
See if you can go 60 days without commenting here. See if you can control your childish addiction to stalking. Show you have some level of maturity and I’ll be glad to spend time explaining the basics to you.
CR keeps digging with his latest ludicrous concepts of “wavelength compatibility” and the idea that all the photons in the 400 W/m^2 are “reflected”.
His problem being that for any arbitrary photon there is no information about the temperature of its source. All 15 micron photons are therefore equal (in the eyes of God). The same goes for all 1.5 micron and 150 micron photons etc. Therefore an arbitrary 15 (or whatever) micron photon could come from the sun or from Pluto – there is no way of telling. Therefore there is no reason why it cannot be absorbed – whatever the temperature of the receiving surface.
If CR could get this through his thick skull he would realize how naive he has been.
Thanks for confirming that you can find no physics source to confirm your claim.
We can now be certain that it is completely made-up fake physics.
Studentb, are you one of child Nate’s students? You sound just like him. You’ve certainly got his bad habits of insulting and making false accusations.
Where did I ever say a photon carried information about its source temperature?
Where did I ever say that “all the photons in the 400 W/m^2 are ‘reflected’?
If you’re ignorant about “wavelength compatibility”, why do you instantly refer to it as a “ludicrous concept”?
Students should be open to learning. You appear as a closed-minded child of the cult, vehemently opposed to learning.
Bindidon
Your 7:19 PM comment contains only rhetoric, personal attacks, and continued speculation about who I am.
You’re fixating on my use of the term ‘inverse hockey stick’ while largely sidestepping the rest of my points. All while presenting yourself as a voice of honesty. The irony could not be more obvious.
I also have not forgotten the misleading move you pulled last month with your trend estimates. That time series was used to downplay the intensity of the warming that began two years ago. This is why you are a climate denier: you only acknowledge warming when it fits your narrative.
Either the anomalous drop in albedo that warmed the planet two years ago will reverse, allowing the climate to cool back toward previous levels, or it will persist, triggering feedbacks and further degrading the signal to noise ratio.
If the latter occurs, accurately estimating long term climate trends will likely require several additional decades of data.
But to respond directly: I was not suggesting that you are using the actual methodology behind the hockey stick. You took that too literally. What I meant is that you are showcasing a sharp decline in sea ice without accounting for the necessary context.
It is well established that Arctic sea ice underwent a regime shift in 2007.
This is not just a talking point from skeptic blogs anymore. Even the National Snow and Ice Data Center recognizes it. Just last month they published a blog post titled ‘Yes, Arctic sea ice took a turn in 2007’.
https://nsidc.org/sea-ice-today/analyses/may-sea-icealways-grace-our-planets-poles
Hold on to your ankles when Bindidog is around
Clint R. says: “The concept of “CO2 warming the planet” still has its followers, regardless of the fact that it can’t be supported from First Principles of physics.”
In 2013 Roy Spencer had an article called “A Simple Experiment to Show How Cool Objects Can Keep Warm Objects Warmer Still”.
In this article he writes: “The main point is that cooler objects which surround heated objects affect the heated objects temperature. As far as I can tell, this is a universal truth, with examples all around you. I find it mind boggling that some people do not accept it. (For anyone tempted to say, “But a cooler star doesn’t make a hotter star hotter still”, stay tuned for an experiment Anthony Watts has been working on).”
To explain why a cooler object can*t keep a warm object warmer, yoy write: “In the science of radiative physics, it’s called “reflection”, child.”
I Wonder who is the child here? Where do you believe Roy Spencer is wrong in this article?
Ironically Roy is wrong in this article, yet CO2 DOES cause some warming. The details however are a very different story..
I love the slave bit Bindidon. slaves sold by their own country men and tribal leaders,carrying on the long tradition of slavery, did you know that thanks to the Roman empire, The population of Italy was 30% slaves, and Zanzibar was a thriving slave route to the Arab countries , long before Europeans had ships, slavery was not a western invention. But Great Britain ended it , although thanks to China it has re emerged in parts of Africa today.
Rising death toll: At least 27 people, including nine children, are dead after torrential rain triggered flash flooding in parts of central Texas early Friday, according to officials.
• Urgent search for campers: Authorities say more than 25 girls are unaccounted for at Camp Mystic in Kerr County, which is located along a river that rose more than 20 feet in less than two hours. As a desperate search continues, the mother of a 9-year-old camper told CNN she learned her daughter has died.
• All-night rescue effort: First responders worked through the night to save victims of the flooding. More than 850 people have been rescued or evacuated as of this morning, many by helicopter, according to authorities.
• One-in-100-years intensity: Parts of central Texas saw a month’s worth of rain in just a few hours, prompting multiple flash flood emergencies. Hunt, a town near Kerrville, received about 6.5 inches in just three hours early Friday, which is considered a one-in-100-years rainfall event for the area.
It was a rapidly developing mesoscale convective vortex that is unusual and difficult to predict. It was not climate change and it was not “missed” because of DOGE cuts at NOAA, as claimed by some very unprofessional fake news organizations.. It is once again an unusual weather event.
https://en.wikipedia.org/wiki/Mesovortex#Mesoscale_convective_vortex
With a core only 30 to 60 mi (48 to 97 km) wide and 1 to 3 mi (1.6 to 4.8 km) deep, an MCV is often overlooked in standard surface observations.[7] They have most often been detected on radar and satellite, particularly with the higher resolution and sensitivity of WSR-88D, but with the advent of mesonets, these mesoscale features can also be detected in surface analysis.
Nothing unusual there,it has a history of intense down pours and flooding,in 1983 Steve Ray Vaughan and Double Trouble recorded their first album called Texas Flood,
The deaths are due to DOGE and Trump. How can they sleep at night?
It is “Nurse Ratched” not ratchet
Stop hallucinating and repeat after me:
PHOTONS CONVEY NO INFORMATION ABOUT THE TEMPERATURE OF THEIR SOURCE
and again:
PHOTONS CONVEY NO INFORMATION ABOUT THE TEMPERATURE OF THEIR SOURCE
and one more time:
PHOTONS CONVEY NO INFORMATION ABOUT THE TEMPERATURE OF THEIR SOURCE
studentb is stuck on stupid
Yes. It is the only way to communicate with the brain dead.
A hurricane in the Atlantic will hit the Carolinas.
High convection in Texas.
https://i.ibb.co/s9RCXgDM/goes19-ir-meso2.gif
norman…”In your original post you made the surface a black-body. That means it emits as a blackbody but it also absorbs all radiant energy that reaches it. It reflects zero energy (that is why it is a black-body). We all understand reflection. You can’t understand a hot body can still absorb energy from a colder one. This is beyond your ability to comprehend so you defend your ignorance with points no one is debating (like reflection). This is called the “Strawman” argument”.
***
Norman, old chap, you need to bring yourself up to date on such theories. Kircheoff proposed the blackbody theory circa 1850 but only for bodies in thermal equilibrium. What you describe above re a heat exchange between bodies can only occur at thermal equilibrium and it is tiny.
The current nonsense, based on theory and consensus, has no support in real science. You are suggesting that the Sun, with a surface temperature close to 6000K, can absorb heat from the Earth. Surely you don’t really believe that.
I have suggested that blackbody theory should be scrapped since it serves no purpose. It has been superseded by Bohr’s theories in 1913 that revealed the real relationship between bodies of different temperatures and why heat cannot possibly be transferred, by its own means, from cold to hot.
Kircheoff knew nothing about atomic structure, especially electrons, which were not discovered till 50 years after his BB theory was presented. Ergo, his theory was nothing more than a thought experiment. I studied Kircheoff’s current/voltage theories and they are sound, even though he knew nothing about what constituted a current. He does not have to feel badly since Clint still knows nothing about it nearly 2 centuries later.
Tee hee. Just kidding Clint, old buddy, old pal.
Bohr revealed that electrons can only be excited by a certain frequency of EM and if they absorb it, they gain KE and jump to a higher, discrete orbital energy level. No frequency outside that specific frequency will affect them especially frequencies of EM generated by colder masses, which emit frequencies lower than the resonant frequency required by electrons in a hotter mass.
Cripey, even Einstein knew nothing about it, so Clint should not feel too badly. Einstein thought EM transferred momentum to a surface and that the momentum was transferred to electrons in the surface, forcing them to eject. That’s what e = mc^2 is based on, that EM can be converted to mass and back.
Serious silliness.
“You are suggesting that the Sun, with a surface temperature close to 6000K, can absorb heat from the Earth. Surely you don’t really believe that.“
Yep, they do, Gordon. In fact, in line with Willis Eschenbach’s “Steel Greenhouse” abomination, they’re forced to believe that if you surrounded the Sun with a passive blackbody shell, with a gap so it’s not touching the Sun itself and thus all energy transfer is via radiation, that the Sun would warm up by over 1,000 K! I’m not exaggerating, they actually defended this nonsense in a recent discussion.
So this is either the fake moderator using his initials, or the fake-fake moderator impersonating the fake moderator which will make the original fake really upset.
The T^4 relationship is not as mysterious as some make it to be. First here is some background. If you have a 2-stage centrifugal pump with different diameter impellers on the same shaft, the shutoff pressure (deadhead) is related to the sum of the squares of the diameters. The output of the 2 impellers add to each other.
It is similar for kinetic energy in a collision where the energy is the difference of the squares and not the square of the difference. An object at 100 (choose any units) that loses 10 to become 90 has lost 1,900 (10,000 -8,100) units not 100.
So if you have 2 identical opposing surfaces of different temperature, the heat transfer from the hot surface to the cooler surface is related to T^4 of the hot surface minus T^4 of the cooler surface. Yes, the temp of the cooler surface matters. The heat transfer is not 100% of the hot surface. The cooler surface sends radiant heat back to the hot surface as described above. It is the difference of the T^4 and not T^4 of the difference. Those temps must come from an absolute temp scale.
No, I am not going to respond to any silly questions or fake models from people seeking attention.
Tim S, there is no error in the calculation, if that’s what you’re trying to imply. According to Willis Eschenbach’s “Steel Greenhouse” maths, and logic, the sphere, once placed in the shell, must warm until it emits twice what it did originally. For the Sun, originally emitting roughly 64,000,000 W/m^2 from its surface, that increase relates back to a temperature increase of over 1,000 K. In other words, an object emitting around 128,000,000 W/m^2 has a temperature over 1,000 K warmer than an object emitting 64,000,000 W/m^2. So, the supposed increase in the temperature of the Sun would be over 1,000 K!
That is what you have to defend, if you believe in the “Steel Greenhouse”. And, various people from your “team” have already been defending it!
If one accepts that the sun absorbs radiation then yes, its rate of energy loss is negligibly reduced by Earthshine. And it must emit twice the power from its surface when in equilibrium with an enclosing blackbody sphere.
If you don’t believe the sun absorbs energy from cooler objects then none of the above is true.
I recommend anyone curious to know which is true to look up the relationship between absorp.tivity and emissivity, and once understood, look up the emissivity of the sun.
Anyone’s welcome to think whatever they like, I’m not having another month-long back-and-forth about it.
“According to Willis Eschenbach’s “Steel Greenhouse” maths, and logic, the sphere, once placed in the shell, must warm until it emits twice what it did originally.”
And you havent found anything wrong with his maths or logic.
But you have a feeling that its wrong. You are incredulous.
But that ain’t sound logic or a good argument.
Essentially its saying that you have never experienced the sun warming up a 1000 degrees.
Therefore it can’t happen!
Won’t be drawn into another one. If you want to believe the Sun can effectively warm itself up, do so. Nobody is hurt by such nonsense, so why worry?
“If you want to believe the Sun can effectively warm itself up, do so.”
I can warm myself up by sleeping under a blanket. That’s what a reduction in heat loss does.
I am totally sympathetic to your desire not to get involved in a conversation here. I am encouraging you to not respond. And we don’t need any more nonsense in the world.
True. Blankets exist, therefore the Sun can definitely warm itself up via its own emitted radiation, with no other heat source present, by over 1,000 K. I’m the crazy one to think otherwise.
Yep, because of straightforward application of the laws of physics, which you have not tried to challenge.
All you have is your personal feelings of incredulity.
Unclear why you think that is a valid argument.
Why make an argument, and get into another month-long slugfest, when I can just point and laugh at the obvious absurdity of your position?
Then simply explain why it is an ‘obvious absurdity’, if you can.
Nah, I’ll just chill and not get involved.
“I have suggested that blackbody theory should be scrapped since it serves no purpose. It has been superseded by Bohr’s theories in 1913 that revealed the real relationship between bodies of different temperatures and why heat cannot possibly be transferred, by its own means, from cold to hot.”
Bohrs theory was a theory of atoms sn their spectra. It has been superceded by Shrodingers Quantum theory.
In any case it was never a theory of black body radiation.
dremt….if you could surround the Sun with a metal sphere the Sun would warm, but not because the metal shield is returning energy to it. The Sun’s surface is at it’s near-6000K temperature because it is free to radiate energy and the 6000K is a resultant temperature with those conditions. If you prevent it cooling by blocking it’s radiation, it’s temperature is bound to rise. That does not involved radiation per se.
I was trying to convince a friend that a fan will cool a person even in hot weather. I proved that tonight by taking my temperature orally with the fan turned off and it was 36.5C. After turning the fan on and sitting in the breeze for a bit, my body temperature dropped to 35 C.
Besides, a metal shield would eventually warm to the solar surface temperature, setting up a thermal equilibrium condition where little or no heat would be transferred.
In reality, the Sun emits EM and actual protons and electrons as the solar wind. The metal shield would prevent them escaping and the space between the solar surface and the shield would turn into a boiling cauldron of plasma.
That’s one problem with thought experiments, they seldom cover the actuality.
I don’t see what Tim S is getting at.
“So if you have 2 identical opposing surfaces of different temperature, the heat transfer from the hot surface to the cooler surface is related to T^4 of the hot surface minus T^4 of the cooler surface. Yes, the temp of the cooler surface matters. The heat transfer is not 100% of the hot surface. The cooler surface sends radiant heat back to the hot surface as described above. It is the difference of the T^4 and not T^4 of the difference”.
***
Tim…you are describing Newton’s Law of Cooling, which was presented 200+ years before the T^4 nonsense. Newton declared that the heat dissipation (cooling) of a surface is proportional to the difference in temperature between it and another surface.
I have questioned how that works via radiation, since Newton was not aware of EM or its relationship to electrons in the atoms of a surface. However, Bohr addressed that in 1913 when he discovered the reason why hydrogen emits and absorbs only at discrete frequencies. The reason is based on the properties of electrons in orbits and the relationship between the electron orbital angular frequency and the frequency of the related absorbed/emitted EM.
Tim, the cooler surface sends no heat toward the hotter surface, only EM radiation. The hotter surface can absorb no EM from the cooler surface and I regard that as a case closed. Any heat transfer involves heat created in the receiving body, not heat sent through space. EM from the cooler body cannot be absorbed by electrons in the hotter body. It’s simply not possible. Ergo, there is no way to heat a hotter surface with radiation from a cooler surface.
“If you prevent it cooling by blocking its radiation, it’s temperature is bound to rise“.
The shell does not stop the Sun from emitting, and it is already emitting at the maximum temperature it can be, given its internal reactions.
“Besides, a metal shield would eventually warm to the solar surface temperature, setting up a thermal equilibrium condition where little or no heat would be transferred.”
Yes, although the shell temperature would actually be a bit lower than the (unchanged) Sun’s surface temperature, because the surface area of the shell is larger than the Sun’s surface area, and the shell would simply emit to space the same total number of watts as the Sun emits, just divided over that larger surface area to get a lower W/m^2 figure, and thus lower temperature, than the Sun.
Gordon Robertson
You make a bold statement: “The hotter surface can absorb no EM from the cooler surface and I regard that as a case closed. Any heat transfer involves heat created in the receiving body, not heat sent through space. EM from the cooler body cannot be absorbed by electrons in the hotter body. It’s simply not possible. Ergo, there is no way to heat a hotter surface with radiation from a cooler surface.”
This statement goes directly against established physics. They say quite different. Science is based upon observational or experimental evidence. So the case is far from closed. Other than giving your opinion on this matter will you be a Clint R and never give supporting evidence for your claims that go against established science or will you be providing some? If you make a claim current science is wrong in their understanding of heat transfer then you will need to come up with strong evidence to support your claims. Science is not based upon how strongly you think you are correct. You need evidence. So far we have your and Clint R’s opinion. Now some evidence please.
Quantum fizzix fly high over Norman’s head
Norman, the fact that you continue making false accusations about me shows how angry you are.
As I’ve said before, you need to be angry at those that have misled you. I told you that you can’t boil water with ice cubes, but you had to finally work out the issue to learn. I told you all the time ice can’t boil water. So get mad at those that claimed fluxes simply add, and 15μ photons can raise Earth’s 288K surface temperature.
Eben
Maybe this will help you. First Gordon Robertson does not accept established physics of IR Spectroscopy. They have large data base on different molecular vibrations and the associated IR emission from those vibrational states and it is good enough to use to help identify unknown compounds.
Molecular vibrations that result in IR emission are from a dipole motion. There is a positive and negative dipole in some molecules (Gordon does not accept the positive dipole, on his own conclusion with zero evidence, he holds the notion it is just less negative, no valid information you give him will alter that state). The vibrational frequency of the dipole is the frequency a molecule will absorb or emit and IR photon. Well established physics that no one but Gordon disputes.
So that is the basic. The vibrational frequency of the dipole must match an incoming photon to reach an excited energy state. When the molecule returns to ground state it will emit a photon with the same vibrational frequency of the dipole.
Now the point that Gordon can’t accept is that in a room temperature surface, most the surface molecules are already in a ground state. You have a very low percentage of molecules at higher energy states that would be unable to absorb incoming energy. But as Tim Folkerts pointed out, each molecule does not just have one state that can absorb incoming energy. The vibrational state has amplitude as well as frequency so one molecule is capable of absorbing multiple photons, each will increase to an even higher energy state.
Since most the surface molecules are in a ground state on a surface at room temperature, the probability of a photon being absorbed (if possible based upon the nature of the surface molecules) is very high for photons that match the right frequency. Since the Earth surface can emit photons at the 15 micron wavelength, it will also absorb any photons reaching it with that wavelength. The Earth Surface is close to a black-body in the IR band some estimate the emissivity at 0.95 meaning it can absorb 95% of the entire IR spectrum.
There is no valid physics that states that the radiant IR from a colder source will not be absorbed by a hotter surface. It is a made up concept with zero experimental evidence and contrary to established physics. If one wants to overturn established physics they will need a good valid experiment to do so. Just making claims with no evidence is a belief not science. Many so called skeptics on this blog peddle their own beliefs and refuse to support them with any valid science.
Gordon states: “Tim…you are describing Newton’s Law of Cooling …”
No. [Other Tim here].
“In heat conduction, Newton’s law is generally followed as a consequence of Fourier’s law. The thermal conductivity of most materials is only weakly dependent on temperature, so the constant heat transfer coefficient condition is generally met. In convective heat transfer, Newton’s Law is followed for forced air or pumped fluid cooling, where the properties of the fluid do not vary strongly with temperature, but it is only approximately true for buoyancy-driven convection, where the velocity of the flow increases with temperature difference. In the case of heat transfer by thermal radiation, Newton’s law of cooling holds only for very small temperature differences.” — Wikipedia.
This is an EMPIRICAL observation that only holds in limit circumstances, not some universal law for all cooling.
“If you prevent it cooling by blocking it’s radiation …that does not involved radiation per se.”
I am sure everyone else sees the self-contradiction here.
“a metal shield would eventually warm to the solar surface temperature, setting up a thermal equilibrium condition where little or no heat would be transferred.”
Not quite. If there was ‘little or no’ heat transfer from the sun’s surface to the surroundings, but still nuclear reactions generating heat the the core, the result would be a continued increase in the sun’s temperature, including at the surface. For a steady state situation, the surface would have to be warmer than the shell, so that the heat from the interior of the sun to the surface matched the heat from the surface to the shell.
See, Tim S…they actually defend it!
Why are you surprised that people defend correct science? Every physics prof at every college or university in every country would give this answer.
Why do you think they are all wrong? What can you offer other than your [faulty] intuition? Which line of physics or math in Willis’ “steel greenhouse” do you disagree with?
“Every physics prof at every college or university in every country would give this answer“
You really presume to speak for every physics professor at every college or university in every country? Are you sure you’re not just a professional sophist that has devoted his entire life to lying on blogs about the GHE?
https://www.drroyspencer.com/2025/07/uah-v6-1-global-temperature-update-for-june-2025-0-48-deg-c/#comment-1708067
Yep physicists will defend established physics, especially given that you offer no rationale to reject it.
If you say so, Nate.
back from a hiatus.
Will be watching the next half year with extra interest as a Trump victory seems likely to align with a persistent and prolonged fall in the temperature of the world.
Very heavy rainfall in North Carolina.
No rain here at all. Even as it is a cloudy day.
Had time to play around with AI this weekend, specifically ChatGPT.
I tested to see how much science it could process. I asked if 15μ photons could raise temperature of a surface at 288K. The AI was smart enough to know the question was related to the GHE, so it tried to work its answer to a yes. But, when I explained the violations to laws of physics, it got interesting.
First, it complimented me on having the correct science. It agreed that I was correct. Then, it started off again saying “Let me explain it this way.” Then it went right back to violating the laws of physics!
It was not unlike talking to some of the children here, with the exception of AI left out all the insults and false accusations. But it could not get away from its programming. That’s called “hallucinating”, and is a big problem in these early versions of AI.
How pathetic.
Scrabbling to find support for a weird delusion…and failing.
(Everybody knows the answer is yes. Even my dog – who is a clever border collie.)
Maybe on Bizarro World where you live and learn fizzix from your dogs the answer could be yes, on this planet it is definitely no
Here’s wiki’s brief discussion of the problem:
Bold is my emphasis. It trains itself on the Internet, but can’t put things together. That’s why it could recognize the issue involved GHE, and recognize I was correct with the physics, but couldn’t put it all together.
Nice try but, nobody is buying.
Stop digging is my advice.
I see I have a new stalker.
And, like the rest, he has NOTHING to offer and hates reality.
Kids these days….
SOLAR MINIMUM UPDATE
As early as Wednesday, Texas officials were marshalling the state’s emergency response resources to prepare for the coming storm.
A man looks out at flooding caused by a flash flood at the Guadalupe River in Kerrville, Texas, on Saturday.
By Thursday afternoon, the National Weather Service’s Austin/San Antonio office had issued a flood watch for multiple counties, warning of “pockets of heavy rain” and the potential for flooding.
Some critics have questioned whether the storm’s deadly impact was made worse by Donald’s ongoing effort to shrink the federal workforce, including job cuts at the NWS and its parent organization, the National Oceanic and Atmospheric Administration (NOAA).
The NWS lost nearly 600 workers earlier this year, but last month the agency said it was beginning to hire over 100 employees to “stabilize operations” following a backlash to the staffing shortfall.
https://www.npr.org/2025/07/06/nx-s1-5458512/texas-flash-flood-weather-forecast
Today, Donald told the press that it wasn’t a good day to talk about his intention to phase out of FEMA.
Another BIG win!
I was the victim of a natural disaster, actually more than once. FEMA was non-existent and provided zero help on either occasion.
You are not a victim, you are a participant, prep yourself and get an insurance – or suffer the consequences
Troglodyte is as trustworthy as Pam:
[PAM IN FEBRUARY] The Epstein client list is sitting on my desk right now to review.
[PAM TODAY] There is no Epstein client list and no further disclosure of Epstein-related material would be appropriate or warranted.
stephen p anderson says:
”I was the victim of a natural disaster, actually more than once. FEMA was non-existent and provided zero help on either occasion.”
Myself or my folks have lived through at least a dozen disasters since the 1950’s. Since the 1970’s I have volunteered to help in those disasters affecting my extended family. Personally, I have been lucky since the 1970’s and my home hasn’t been affected significantly by any disaster.
I think the problem is typical of problems where responsibility is so divided up. Everybody stands around pointing fingers at each other. Either that or there is a sense of competition among agencies and those with budget responsibility are incentivized to try to get as much out of it as they can.
Primary response is always the local community from fire and police services. Volunteers help with communications, evacuations, and delivering essentials to victims. Communities stand up and organize victim shelters and information sharing.
Outside other communities provide fire suppression assets and manpower. State and local law enforcement are primary in providing security. FEMA? The local communities talk a lot about FEMA in post fire victim meetings. Occasionally FEMA employees would make themselves available at a post fire event to sign up people for assistance but there were alternative ways of getting a filling out a FEMA assistance application. I never saw or met a FEMA employee walking the neighborhood, much less avoiding certain residences.
There is a poor mindset that once a federal employee gets a job or an agency is created it represents the best approach to getting the job done. On that I call BS.
We have several disasters a year, what does FEMA do between disasters? I like the approach that Gov DeSantis is taking in Florida. They have been building an inventory of assets to deploy to impacted areas (primarily from hurricanes). Florida has access to everything including locations to store the assets until needed. And now they are using the assets between disasters to other matters like ensuring due process for deportees.
this is far far more efficient. No price gouging by the state vs the federal government for storage and deployment locations. Intercooperation between the states are scratch my back and I will scratch yours. Its not a one way deal where naturally the inclination is to get as much as you can gouge out of the federal government. that’s not a generally healthy relationship.
Like the issue in Los Angeles and other places. Only deploy federal troops when there is a federal interest to do so like in protecting federal properties and personnel engaged in Federal business or in the case of an insurrection.
Its like any other form of organization. In DC it is often a good idea to combine agencies than have overlaps in their mission or use of assets.
Employing common sense makes a lot more sense that supporting senseless policies simply because it might lead to opportunities to seize more power or more reimbursement.
The most helpful people were the Christian organizations that brought around food and water. No one helped to clean up the downed trees or salvage my home. I had to do that all myself. I did have insurance that reimbursed me for most. I had to have my home rebuilt. FEMA came around about 6 months later to ask if I needed anything. I told him I had bought a chainsaw and generator and asked if I could be reimbursed, and he told me I had to have applied for reimbursement within 30 days. I told him I was too busy cleaning up the mess, and he said, sorry. I asked him then why he was coming around six months later. He said just to check on things. I told him thanks.
So, Eben, if someone murders you, are you a victim or a participant?
Insurance is not always available. This is primarily due to a failing of excessive environmental policies.
Yes lands need protection but that doesn’t mean they don’t need intelligent management. Failures in managing fire and flood risks are the primary government failures leading to more frequent and costly disasters and a lack of insurance to cover those risks.
Fire risks are more easily managed than flood risks but both can be greatly mitigated by projects too often ignored due to hysterical environmental concerns. Also most often its the local population that resists fire and flood mitigation projects preferring to live in a more natural beautiful environment than in a place where risk is much less. Hysterical yes because lakes formed by dams and fires abated by vegetation management can still be beautiful if done intelligently. Some environmental concerns simply go too far, like desires for ever increasing natural habitats for flora and fauna. What is needed is wiser approaches to these issues and less hysteria. And that has to start at the local level.
This is precisely the problem with posting science content you do not understand from a dishonest media source that also does not understand science. From the link:
[Michael Morgan, a professor of atmospheric sciences at the University of Wisconsin-Madison, said precipitation forecasting remains “one of the most vexing problems” of his field.
But he said he believed the National Weather Service did its job by giving a general sense of the Texas storm and then providing more specific local forecasts as additional information became available to highlight the most serious potential threats.
“I think the [National] Weather Service forecasts were on point,” Morgan said. “Specifically targeting in locations that are going to receive the maximum rainfall is an incredibly challenging forecast problem.”]
This event was caused by a rapidly developing mesoscale convective vortex that is unusual and difficult to predict. It is a random weather event. The forecast window is small and forecast accuracy is very rough.
https://en.wikipedia.org/wiki/Mesovortex#Mesoscale_convective_vortex
[With a core only 30 to 60 mi (48 to 97 km) wide and 1 to 3 mi (1.6 to 4.8 km) deep, an MCV is often overlooked in standard surface observations.[7] They have most often been detected on radar and satellite, particularly with the higher resolution and sensitivity of WSR-88D, but with the advent of mesonets, these mesoscale features can also be detected in surface analysis.]
This is what happens when you face a bunch of pretentious contrarians.
They will wave their arms furiously instead of facing the facts that Texas officials ignored warnings, that they blamed meteorologists while lying about them, and that Donald indeed floated the idea of shutting down FEMA. He did not stop with killing millions of children by dismantling USAID. He won’t stop with his ugly bill and Alligator Auschwitz.
Next, our most pompous one will brag about how creating debt is good for markets, as it he was oblivious to how they react to more liquidity.
Willard believes government is the solution, contrary to thousands of years of history.
If you ever want to get an education about socialism, watch Clarkson’s Farm on Amazon Prime. This is the British culture. They have a regulation for everything. You can’t move or breathe without some agency or council’s approval. This is Willard.
Troglodyte believes in mind reading, He believes that acting like a schoolyard goon will give him the same magical powers as Donald, But most of all he believes that if the best country in the world becomes the planet’s mafioso, he will be able to save face from losing its hegemony. Even throwing in Christian theocracy into the mix for style points, for it had such a great conversion rate around the world since colonial times.
Meanwhile, Cynthia Olivera, who has lived in Murica since she’s 10, has been grabbed at her green card interview, nobody knows where she is, except Troglodyte’s favorite jackboots, and they won’t let her flee to Canada at her own expenses.
BIG WIN!
After reading about Cynthia Olivera, the current Willard sad sack story, she entered the country illegally on more than one occasion. She’s had 35 years to correct her situation. She had no right to be here even after dropping three anchor babies. I suppose it was her surreptitious behavior and deceptive actions, sneaking across the border from Canada, and then Mexico that earned her unwanted attention from ICE. I hope she can make it back through legal channels for her kids’ sake, but she has no right to be here. She has to earn that right.
Trgolodyte forgot to mention that her husband Francisco is a U.S. citizen and self-identified Donald voter.
He wants his vote back.
As for Cynthia, the US of A is where Cynthia met her husband, where she went to high school, junior high, elementary. That’s where she had her kids, worked and, perhaps contrary to Troglodyte, paid taxes.
Very BIG BIG win for our anti-gubmint guy who’s willing to fork 1K for people to self-deport!
The purest description of the scientific method.
MAGA response to flooding tragedy in Texas: Greene to introduce ‘weather modification’ bill.
MAGA Rep. Marjorie Taylor Greene (R-Ga.) said Saturday she plans to introduce a bill aimed at tackling “weather modification.”
“I am introducing a bill that prohibits the injection, release, or dispersion of chemicals or substances into the atmosphere for the express purpose of altering weather, temperature, climate, or sunlight intensity. It will be a felony offense,” she wrote in a Saturday post on X.
Greene made headlines last year when she suggested Democrats were able to “control the weather” in the aftermath of Hurricane Helene, prompting then-President Biden to condemn what he called “irresponsible” and “beyond ridiculous” falsehoods.
Similar to Climate Change, Chem Trails are a ‘Chicken Little’ conspiracy.
Stupid Chicken gets hit in the head with an acorn and thinks the sky is falling.
A plethora of other creatures, all of whom are apparently unable to think critically, accept stupid’s story verbatim.
All of the critters become fox food.
Al Gore is worth a billion more as when he left office, all on the back of the climate scam.
Who is the fox in the ‘chem trail’ scam? one is Greene, who just got the opportunity to introduce a bill. ‘Vote for me, I do the plebs bidding’.
with any luck that will curb the nut jobs who think geo engineering is a good idea.
” I am introducing a bill that prohibits the injection, release, or dispersion of chemicals or substances into the atmosphere for the express purpose of altering weather, temperature, climate, or sunlight intensity. It will be a felony offense… ”
MAGAmaniac Dumbie MTG apparently didn’t consider that burning just one liter of kerosene in an airplane’s engine exactly results in ‘substances being released into the atmosphere whose explicit purpose is to alter weather, temperature, climate, or solar radiation’:
– 2.53 kg CO2
– 0.98 kg H2O
Sure, it’s explicit: anything in that area that isn’t explicitly avoided was actually explicitly done, right?
How was I studying Christianity by mentioning the Christian Organizations that responded during the crisis? Not sure about that one. Are there any other religions you hate besides Christianity?
Here’s another simple problem that kids like Ark, Bindi, studentb, Willard, Nate, gordon, and TimS will be unable to solve.
“A source on one side provides 1000 W/m² to the sphere.”
This is a bit ambiguous. I assume you mean there is a parallel beam of light with an intensity of 1000 W/m^2 (like a star shooting 1000 W/m^2 at a planet). The actual power provided ‘to the surface of the sphere’ would range from 1000 W/m^2 directly facing the beam, down to 0 W^2 at the ‘edge’ 90 degrees away.
This beam provides a total power = (intensity)*(cross-sectional area) = (1000 W/m^2)*(pi)r^2.
The other 3 also provide P = (1000 W/m^2)*(pi)r^2, or a total of 4*(1000 W/m^2)*(pi)r^2.
The total surface area = 4(pi)r^2, so the average flux = 1000 W/m^2.
The value varies from up to 1414 W/m^2 along the equator, down to 0 W/m^2 at the poles. But since you specified a perfect conductor, all parts of the surface will be the same temperature, so we only need the average flux, which is 1000 W/m^2.
The sphere thus must emit 1000 W/m^2 at steady state. This works out to ~364 K.
None of this is difficult or controversial.
As stated Tim, this is a simple problem. So there’s no need for all the irrelevant rambling.
But you got the correct answer. I believe Norman could also get the correct answer. The controversy is that NONE of the ones named (Ark, Bindi, studentb, Willard, Nate, gordon, and TimS) even understand the basics. This has been demonstrated over and over with such simple problems.
Now, let’s bump it up a notch:
Total flux from the tops of the “cube” enclosing the sphere:
6000 W/m^2
Average flux absorbed at the surface of the sphere
6000/4 =1500 W/m^2
Temperature = 364 * (1500/1000)**.25 = 402 K
So what?
Professor P say “So what?”
Exactly. These are easy problems that anyone with a basic understanding of physics would get right. Clint’s ‘bump it up a notch’ question is *exactly* the same physics as the previous question, just plugging in different numbers.
At the same time, he bungles a related question:
“A recent discussion involved a surface emitting 500 W/m². A flux of 400 W/m² arrives the same surface. Could the 400 W/m² flux raise the temperature of the surface that is emitting 500 W/m²?
Of course not! To raise the temperature of the surface, the incoming flux must be greater than the flux emitted from the surface.”
Use Clint’s scenario here – the surface will be a perfectly conducting blackbody sphere. Shine two 1000 W/m^2 fluxes on opposite hemispheres. In stead-state, we will have “a surface emitting 500 W/m²”.
Now shine an additional 400 W/m^2 from some direction. As Clint has already noted, adding more flux in this scenario WILL raise the temperature, contradicting his own previous claim.
Thank you PP. You’re one of the few here that understands the basics, along with Norman and Folkerts. Most of the commenters here aren’t even able to grasp the basics. They just BELIEVE. But, the next step is needed to get the correct answer.
For the sphere and 4 each 1000 W/m² sources, it looks like this:
One source, sphere at 258K emitting 250 W/m²
Two sources, sphere at 306K, emitting 500 W/m²
Three sources, sphere at 339K, emitting 750 W/m²
Four sources, sphere at 364K, emitting 1000 W/m²
The problem arises when the two additional 1000 W/m² sources are added. The sphere is emitting 1000 W/m², and the two additional sources are only providing 1000 W/m² each. So “climate science” is trying to heat a source that is emitting the same as what is being provided! If the sphere is already emitting 1000 W/m², a source MUST provide a flux GREATER than 1000 W/m², to raise the temperature.
BUT, the same, or lesser flux, could NOT raise the temperature. Comparing to conductive heat transfer, if you put two 100° bricks together, you would not expect the combination to result in 200°. You would not even expect any increase in temperature.
If two glasses of water at 40° are poured together, the temperature does not increase.
And, as Norman inadvertently proved above, you can NOT raise the temperature of water with the flux from ice. Yet, “climate science” believes ice can raise the temperature of water. With that belief, they could boil water with ice! (And some have admitted that!)
“Climate science” gets it wrong, every time. The confusion comes from not understanding radiative physics and thermodynamics.
But, you’re already way, way ahead of most of the cult children here. Keep learning.
Folkerts is back to his usual deceptions. That’s why he earned to name “Fraudkerts”.
Notice Fraudkerts changed to a blackbody sphere. But in the REAL world, supplying 400 W/m² to an object emitting 500 W/m² will have NO effect. Fraudkerts is still trying to boil water with ice.
And, I NEVER contradicted any “previous claim” of mine.
Fraudkerts knows a smattering of physics, but he mostly excels at perverting and distorting reality.
Clint, suppose your 1000 W/m^2 fluxes come from stars like the sun (only a little farther away so they are a little dimmer). Suppose we take your 6 sources that are 90 degrees apart and sloooooowly bring them together so they are all right next to each other. We now effectively have ONE beam that is 6000 W/m^2 intensity arriving at the surface on one side. Tell us, at what point does the sphere stop being 364 K and become 402 K?
It is clear you are STILL after all these years confused about the difference between the concepts of *emitted* flux and *received* flux. If the RECEIVED 1000 W/m^2 fluxes came from 364 K sources EMITTING 4000 W/m^2, then you are quite correct that no more than 4 could be added; no more than 4000 W/m^2 could be received.
But a diffuse 364 K source can’t provide a 1000 W/m^2 flux “on one side” as you described. A columnated, uniform 1000 W/m^2 flux “on one side” (illuminating one hemisphere) can only come from something like a distant, hot star. And in this case, we CAN keep adding more and more sources; the only limit on the temperature of the sphere would be the temperature of the source EMITTING the the flux.
Fraudkerts, the problem did NOT involve “diffuse” sources.
You just can’t stop trying to pervert and distort.
What will you try next?
You still miss the issue Clint.
A single 6000 W/m^2 beam would warm your sphere to 402 K.
You claim that splitting that beam into six 1000 W/m^2 beams will only warm the sphere to 364 K.
You are still trying to pervert the issue, Fraudkerts.
A single source providing 6000 W/m² to the sphere will result in 403K. (You have a round-off error.)
But six separate sources, providing 1000 W/m² each, will only result in 364K.
Your “science” would result in ice being able to boil water, which Norman has accidentally shown can’t happen.
What will you try next?
CR,
“One source, sphere at 258K emitting 250 W/m²
Two sources, sphere at 306K, emitting 500 W/m²
Three sources, sphere at 339K, emitting 750 W/m²
Four sources, sphere at 364K, emitting 1000 W/m²”
is all ok. But a problem with your thinking is as follows:
Adding 2 sources of 900 W/m² apparently has no effect on the temperature.
Increasing the 2 sources to 905 W/m² each also apparently has no effect on the temperature.
Increasing the 2 sources to 1000 W/m² each also apparently has no effect on the temperature.
BUT
Increasing the 2 sources by just 1W/m² each to 1001 W/m² each leads to a relatively sudden increase in the temperature by 38K to 402 K.
I am afraid that such sudden responses have never been observed in nature or the laboratory.
“What will you try next?”
I will keep trying science. Maybe some time it will sink in.
Six beams of light from six small identical stars all shining on one hemisphere of a sphere, can and will and must heat just as well as one beam of light from one larger star with 6x the area.
If you agree, we can move on. If you disagree, state why.
CLINT: “A perfectly conducting sphere with unity emissivity …”
ALSO CLINT: “Notice Fraudkerts changed to a blackbody sphere.”
Sorry PP, you seem to be making a mistake but I’m not sure where it is. Maybe you could provide your calculations that result in “Increasing the 2 sources to 1000 W/m² each also apparently has no effect on the temperature.”
Fraudkerts, trying the same fraud over and over isn’t working for you.
* You don’t understand radiative physics.
* The problem did NOT involve “beams”.
* There is no such thing as a “black body”.
* You don’t understand 2LoT.
PP, I copied the wrong thing from your comment. Here’s what I meant to copy/paste:
“Increasing the 2 sources by just 1 W/m² each to 1001 W/m² each leads to a relatively sudden increase in the temperature by 38K to 402 K.”
Please show me how you made that calculation. (It’s wrong, but that’s not a problem. We can all learn from our mistakes. I’m even getting better at catching my typos….)
CR
The problem seems to be that the extra sources have no effect until they exceed the 1000 W/m^2 being emitted.
But, when they increase slightly to above 1000 W/m^2 ea h , they have full effect.
i.e. the surface receives 4000 W/m^2 up until the extra sources reach 1000W/m^2 each, the the surface receives a total of 6002 W/m^2.
That is where the sudden increase in temperature occurs.
Sorry PP, but the problem is you’re still believing all infrared is absorbed. You’re confused by the mythical “black body”, that is claimed to absorb everything coming at it. That doesn’t happen!
So you can aim 6 different 1000 W/m² at a sphere, as described in the problem, but all six can NOT raise the temperature of the sphere so that it emits more than 1000 W/m².
Now, if even one of the sources is greater than 1000 W/m², it changes things.
See if you can solve the problem if five of the sources provide 1000 W/m², but one source provides 1001 W/m².
CLINT : “* The problem did NOT involve “beams”.”
Yes. It did.
The only way to get the answers that you agree are correct for 1000 W/m^2 and 4000 W/m^2 is for the light to be a beam, ie parallel photons, ie a plane wave front. Like in this image.
https://media.geeksforgeeks.org/wp-content/uploads/20240124154839/plane-wavefront-(1).webp
In particular, it is NOT
* 1000 W/m^2 normal over a hemisphere, which would give 2x too much power arriving at the surface
* 1/4 of the solid angle around the sphere at 364 K *emitting* 1000 W/m^2
[I suspect this is over Clint’s head and it will sound like ‘blah blah blah’ to him, but others will understand]
CLINT: “* There is no such thing as a “black body”.”
Then why did you postulate a blackbody in your problem (“unity emissivity”); why did you do the calculations using blackbody formulas (“A single source providing 6000 W/m² to the sphere will result in 403K.”)?
[PS There is also no such thing as a ‘perfect conductor’ but you postulated that for your scenario too.]
Fraudkerts, the problem was framed about “climate science”, with a flux impacting a disk. If you want to start denying your own beliefs, I’m fine with that.
Again, I NEVER used the phrase “black body” in the problem. I NEVER “postulated a blackbody”. You just keep trying the same fraud, over and over.
If you don’t like “unity emissivity”, you can solve the problem with emissivity of 0.999999999999999. With correct rounding, there won’t be a meaningful change. You can NOT raise the temperature of something that is emitting a flux higher than what is arriving. Even Norman now understands that.
You really need to get away from your fraud, and start learning some science.
Clint, it would be fascinating to see you draw a diagram of what you think is going on here.
There as a sphere at the center. That part is obvious.
Then “A source on one side provides 1000 W/m² to the sphere.”
* What temperature do you imagine the source to be? How far away? how big?
One obvious choice would be something like a hot distant star. For example, something like the sun (~ 5800 K) but a little farther away (~ 1.17 AU) would provide 1000 W/m^2 in the form of (nearly) parallel rays to one hemisphere.
Shall we use that as the “sources” here? Or do you have some other geometry in mind that you care to propose?
Fraudkerts, you understood the original problem. You even got the correct answer. Then when I introduced the additional 1000 W/m², you realized the hoax was nuked.
Even Norman has now realized it is over. That’s why he’s unable to respond. An incoming flux can NOT raise the temperature of a surface emitting a greater flux.
You’re babbling incoherently, much like gordon.
Please continue.
CR,
You seem to have muddied the waters by with your arguments about black bodies. However, putting that aside, you have not addressed the issue of what happens when an existing extra source of 999 W/m^2, which has no effect on the temperature, increases by 1 W/m^2.
i.e. suddenly the sphere is confronted by 2000 W/m^2 and must suddenly start warming until it emits the same amount.
The problem is that you are proposing a “switch” type of mechanism which has not been observed either in nature or the laboratory.
PP, you’ve starting to veer to the dark side. False accusations and just throwing crap at the wall are not mature behavior.
So if you want to discuss science, stay with reality:
1) Answer this —
https://www.drroyspencer.com/2025/07/uah-v6-1-global-temperature-update-for-june-2025-0-48-deg-c/#comment-1708289
2) Then, answer this —
https://www.drroyspencer.com/2025/07/uah-v6-1-global-temperature-update-for-june-2025-0-48-deg-c/#comment-1708361
3) You appear to be presenting another problem, but your wording is unclear. Please describe the two situations, before and after any changes.
https://www.drroyspencer.com/2025/07/uah-v6-1-global-temperature-update-for-june-2025-0-48-deg-c/#comment-1708471
CLINT: ” you understood the original problem. You even got the correct answer. ”
I am glad you agree with my analysis. As I said, we have something like a distant star illuminating half of a (perfectly conducting) planet, creating day on one side and night on the other. To provide 1000 W/m^2 of flux at the planet, the star might be like the sun, but a little cooler or a little smaller or a little farther away than our sun is from earth.
One such star providing a 1000 W/m^2 flux would warm the perfectly conducting sphere to 258 K
4 such stars would warm the sphere to 364 K
6 such stars would warm the sphere to 403 K
10 such stars would warm the sphere to 458 K
100 such stars would warm the sphere to 815 K
There is no law of physics preventing a set of 5700 K sources from warming a surface above 364 K.
Fraudkerts, sneaking back 3 days later is just another of your tricks.
You understood the original problem, but when I added more sources you figured out your goose was cooked. That’s when you started your distortions and perversions that would result in ice boiling water.
Even Norman has learned ice can’t boil water, but you continue your fraud.
An incoming flux can NOT raise the temperature of a surface that is emitting a greater flux.
You’re babbling incoherently, much like gordon.
Please continue.
CLINT claims: “An incoming flux can NOT raise the temperature of a surface that is emitting a greater flux.”
The correct physics is *related* to what you say here. A correct version would be: An EMITTED flux from a surface @ temperature T1 can NOT raise the temperature of a surface that is at a greater temperature T2 and that is emitting a greater flux.
Once you understand the difference between emitting, outgoing flux and received, incoming flux, then you might finally start to understand.
You’re finally starting to get it Folkerts.
That’s why ice cannot boil water, and why the CO2 cannot raise Earth’s 288K temperature.
Norman got it before you, however.
CLINT: “you understood the original problem. You even got the correct answer. “
Yep! I understood we were talking about a source like a distant star, causing day on one side of a planet and night on the other. Glad you recognize the situation and agree with my initial analysis.
Then you introduced 4 such sources. Then 6 such sources.
4 stars will make a planet hotter than 1 star.
6 stars will make a planet hotter than 4 stars.
100 stars will make a planet hotter than 6 stars.
1000 stars will make a planet hotter than 100 stars.
The limiting factor is not “1000 W/m^2 = 364 K, because that is the flux ARRIVING from one distant source”.
The limiting factor is “64,000,000 W/m^2 = 5800 K, because that is the flux LEAVING from one distant source”. We can add more sources until the sphere is surrounded by sources. Then the sphere will be the same temperature as THE SOURCE.
Fraudkerts, sneaking back 3 days later is just another of your tricks. That’s why you’ve earned the nickname “Fraudkerts”.
You understood the original problem, but when I added more sources you figured out your goose was cooked. That’s when you started your distortions and perversions that would result in ice boiling water.
Even Norman has learned ice can’t boil water, but you continue your fraud.
An incoming flux can NOT raise the temperature of a surface that is emitting a greater flux.
You’re babbling incoherently, much like gordon.
Please continue.
As usual Clint counters clear explanation, facts and logic with childish insults, no facts, no explanation and no logic.
Thus he makes it easy to discern who knows what they are talking about: Tim, and who is a fraud: Clint.
All wrong, child Nate.
I noticed you didn’t attempt to solve the simple problem. That was predictable.
At least Folkerts got the first part of the problem correct, before he realized he was trapped by the second part and had to resort to fraud.
That was also predictable….
Devastating flooding in Chapel Hill/Durham, NC due to Chantal residue.
https://i.ibb.co/n8kFHXYv/516435459-1317940310332889-7132706486218990847-n.jpg
the Earth’s energy budget – a made thing
https://youtu.be/tI0qmV2Bbc8
https://egusphere.copernicus.org/preprints/2025/egusphere-2025-418/
Today, for once, I’m going to ask the Eben dachshund – who’s been constantly biting my ankles since 2022 – how he can believe that the three Heartland grantees, Willie Soon and his buddies, the Connolly brothers, could tell us anything meaningful about the Earth’s energy balance.
*
That’s a bit like asking Tucker Carlson, Steve Bannon and Marjorie Taylor Greene what they think about the possibility that the Trumping boy, whose scrotum has been in Putin’s hands for decades, could ever have been a good US president.
The earth energy budget the warmistas cane up with is one of the most idiotic laws of fizzix breaking theory ever.
and maroons like Bindidong still believe the warmer ground absorbs
333w of heat from colder air , twice as much as from the Sun itself.
Beeing stuck on stoopid as he is He cannot be educated by anyone about anything.
https://scied.ucar.edu/sites/default/files/media/images/radiation_budget_kiehl_trenberth_2011_900x645.jpg
Eben
Actually it is not stoopid nor idiotic. It is basically measured reality. You can deny this if you feel it wrong, better for you would be to point out what is wrong with the data and why you are so confident this information is wrong and you are right.
https://gml.noaa.gov/webdata/tmp/surfrad_686ddb0da4a67.png
This link will take you to a plot I made of Nevada measuring station.
It shows the downwelling IR from instrumentation. There is information of what each colored line represents.
If you take the entire 24 hour period, the downwelling IR energy (in joules/meter squared) will exceed the absorbed solar (this would be the line for Solar net, the total downwelling solar minus what is reflected by the surface and not absorbed).
The logic you need to understand it is that the Downwelling IR is greater than the solar but when you look at the total of downwelling and upwelling it is minus. The atmosphere is not warming the surface but it is greatly slowing the cooling rate (insulation concept wish DREMT could understand it). The solar does not have a negative net, so all this energy is what heats the surface. The downwelling IR can exceed the solar in total energy but the surface is emitting more than that. The NET IR is what is important here. Adding more GHG will decrease the NET surface loss. With a cloudy night, the loss of IR is very little and the temperature states almost steady with no solar input. Nothing magic or unscientific, just insulating property. If you add more layers of insulation to your home it will stay cool longer in summer and remain warm longer in winter. Just a slowing of the cooling rate so the solar input will lead to a higher surface temperature.
Eben
https://gml.noaa.gov/webdata/tmp/surfrad_686ddf97a2c17.png
More measured values. This one is for a cloudy area of US. The surface continues to radiate at a good rate being fairly warm but at night, with no energy input, you can see the temperature is kind of flat line for hours with no input energy. How is this possible? The surface is warm and radiating away lots of energy. There is no solar input, why is the temperature not rapidly falling to match the loss of energy from upwelling IR? Maybe the idea you think is bad science really is NOT. The Downwelling IR is nearly the same as the upwelling IR so there is very little heat loss and the temperature does not drop rapidly. If you do not believe in a large amount of downwelling IR then give your understanding of what is keeping the temperature from not rapidly falling?
Eben
https://gml.noaa.gov/webdata/tmp/surfrad_686de182d631d.png
In this one of Summer Desert under clear skies, the temperature drop from high to low was 21.6 F. The downwelling IR was about 200 W/m^2 less than the upwelling so it cooled much faster than the cloudy one.
The evidence is very strong for large amounts of downwelling IR and non existent for alternate explanations for real world observations. Remember a good theory needs to be able to match observation.
Norman, you’re still making the same mistakes. And of course, NOAA is willing to help with your confusion.
Claiming that the sky warms the surface more than Sun, SHOULD raise questions in your head. But, you swallow such nonsense with vigor. Just like you swallow Moon spin, with no ability to understand the physics.
Infrared does NOT automatically translate to heat. You’re still believing that two 15μ photons can make something hotter than one 15μ photon. You still don’t understand entropy, nor understand what we see as temperature. Like Fraudkerts, you’re still believing you can boil water with ice.
Clint R
The confusion and mistakes are on your end not mine. I have no confusion on the graphs. The atmosphere is not warming the surface more thhan the Sun! Read my posts! The atmosphere sends more energy to surface than Sun in a 24 hour period. This is a fact
But the surface is radiating above both. Your big problem is coping with the concept of NET ENERGY, your mind cannot understand it so you ignore it and postulate false unreal physics in its place. The net flow of energy from surface to atmosphere is negative. The qtmosphere is not warming the surface. But rather than losing much more energy with no GHG, the GHG’s act as radiant insulation so the incoming solar will warm the surface to a higher temperature, same effect as any other insulation.
Norman believes that atmosphere containing CO2 is a miraculous energy amplifier turning 161W into 396W. he will even spell it out for you.
Bizarro world thermodynamix
Norman, you have some of the basic physics down, but you have trouble once it gets more advanced. I think you just start rambling, hoping something will make sense. But, it usually ends up in nonsense, as here:
The atmosphere sends more energy to surface than Sun in a 24 hour period. Flux is NOT energy.
But the surface is radiating above both. The surface does NOT radiate more than solar.
“CO2 is a miraculous energy amplifier turning 161W into 396W. he will even spell it out for you.”
Well, the surface at an average T ~288 K, and average emissivity ~ 0.92, emits 360 W/m2 of radiant energy, and another 80 W/m2 by convection.
So how do you geniuses get 161 W/m2 input to the surface to produce 440 W/m2 of output??
Eben
Would you call clothes “energy amplifiers”? Sitting an average human generates around 100 watts. If the temperature is 0 F you would die if you had no clothing in fairly short time. Your body does not produce enough energy to keep warm enough to prevent hypothermia. If you were sufficient clothing the 100 watts can keep you warm indefinitely so do you say it means the clothes are amplifying your body energy? I gave you measured values. You have not explained why a cloudy night stays warm. Yet it does. Does the surface quit emitting even if it is warm?
Clint R
Maybe you lack the ability to read graphs or comprehend them.
YOU: “The atmosphere sends more energy to surface than Sun in a 24 hour period. Flux is NOT energy.
But the surface is radiating above both. The surface does NOT radiate more than solar.”
Flux (watts/m^2) will give a value of energy in a given time unit (basic understanding of science required).
Watts are joules/second. Therefore a one square meter surface radiating 600 W/m^2 will radiate away 600 joules of energy in a second.
So in a 24 hour period, from a flux, you can calculate how much energy the square meter lost in joules (you just have to multiply the 600 by 3600 to get energy per hour then multiply that by 24 and you have joules in one day lost by the square meter of surface). Not that hard to figure out.
The graphs show that the surface emits much more energy than it can receive by solar energy in a 24 hour period. Can you calculate?
The reason it does not matter is because the surface is not losing that energy. The downwelling IR is absorbed by the surface (even if in your mind you can’t accept this, it is valid science). The surface is emitting more than it absorbs but the NET loss is much less than with GHG that return a large portion of the energy emitted.
Clint R
I do think your mind cannot understand NET energy transfer. It is why you are having such a difficult time with GHE. Sometimes you seem to know some physics but the NET energy transfer is not something that your mind can seem to grasp so you come up with some alternate explanations (that really make no sense, have zero scientific support, have never been demonstrated in any experiment and never will be).
https://gml.noaa.gov/webdata/tmp/surfrad_686f234857af4.png
The graph you want to ignore. The GHG do NOT warm the surface. They return less energy than what is emitted. The NET heat loss of the surface is greatly reduced by GHG down from over 500 W/m^2 to less than 200.
In your initial problem with a plate and a 1000 Watt source I told you to put insulation on the one side instead of a 400 Watt source and the temperature of the plate will increase. The insulation is not adding energy but the plate gets much warmer and instead of emitting at the rate of 500 W/m^2 it now emits at 1000 W/m^2. There was no addition of energy just added insulation and the temperature rose and the output rate of energy loss doubled. You can understand that but can’t apply the same logic to GHE. Why?
Sorry Norman if you cannot understand simple text.
I put YOUR words in italics, and mine in BOLD.
Obviously you couldn’t understand. Get a responsible adult to explain it to you.
Also, endless rambling doesn’t help you. You should have learned that by watching gordon.
Clint R
I responded to both your bold statements (I included all for context). You do not accept scientific evidence that contradicts your beliefs. The evidence shows the Surface DOES radiate more energy in a 24 hour period than solar input. And flux is a rate of energy flow. If you take a time period you calculate the energy in the amount of time. Like when you bring up cars and speed in the past. Speed is a rate of distance/time.
In a given time the car will have traveled such a distance.
If you have a surface radiating 100 Watts/m^2, 200 watts/m^2 and 1000 watts/m^2 the energy each surface loses per unit time is different. The surface without GHG in the Nevada desert in summer radiates over 500 W/m^2 continuously. That is a rate of energy loss. In a period of time it will have lost a given amount of energy. Flux is a rate of energy loss or gain that you can’t seem to understand that in a given time period it becomes an actual loss or gain of energy from a given surface.
Eben, Clint,
So how do you geniuses explain 161 W/m2 input to the surface producing 440 W/m2 of output??
Norman, the reason you can’t understand this is that you try to go around the issue. Instead of facing reality, you just keep going in wrong directions, throwing crap against the wall. Just look at the way Nate and gordon work. You will see the same type of evasion.
So, when you really want to learn, just take ONE issue and understand it before moving to other issues. For example, you correctly calculated that ice cannot raise the temperature of water. But, you couldn’t process the implications or your “discovery”. A radiant flux can NOT raise the temperature of a surface that is emitting a greater flux. Full stop!
Now, before going on to anything else, do you now understand that A radiant flux can NOT raise the temperature of a surface that is emitting a greater flux.
Then, we can move on to more learning.
“A radiant flux can NOT raise the temperature of a surface that is emitting a greater flux.”
A blackbody object with a surface area of 1 m^2 has a 500 W electric heater inside. The object is in an evacuated chamber with blackbody walls.
A) The walls of the chamber are set to 4 K. What flux will the object emit and what temperature will the object be?
T = 306 K; emitted flux = 500 W/m^2
B) The temperature of the walls of the chamber are raised to 300 K. What flux will the object emit and what temperature will the object be?
T= 360 L; emitted flux = 959 W.m^2
* The radiant flux from the walls is 459 W/m^2, which is less than the radiant flux of 500 W/m^2 from the surface of the object.
* The radiant flux from the walls raised the temperature of the surface of the object from 300 K to 360 K.
This fits all the criteria Clint stated, and proves that his statement is false.
Wrong Fraudkerts.
What it proves is that you always try to pervert science.
There is no such thing as a black body. You don’t understand 2LoT.
“What it proves is that you always try to pervert science.”
… and yet you can’t give specifics.
“There is no such thing as a black body”
.. and yet you postulated unit emissivity and base your calculations on blackbody surfaces.
More fraud from Fraudkerts:
yet you can’t give specifics.
The specifics were in the solution to the problem, which you couldn’t get right.
and yet you postulated unit emissivity and base your calculations on blackbody surfaces
I NEVER mentioned an imaginary black body. That’s you AGAIN practicing fraud.
Will you ever clean up your act?
CLINT: “I NEVER mentioned an imaginary black body. ”
Yes. You did.
When you stated the object had “unity emissivity” you mentioned a black body. That is the definition of a blackbody.
Your protests are the equivalent of saying “I said massless, not zero mass” or “I said the coefficient of friction is zero, not that the surface is frictionless.”
Fraudkerts, maybe you didn’t understand the first time:
Fraudkerts, the problem was framed about “climate science”, with a flux impacting a disk. If you want to start denying your own beliefs, I’m fine with that.
Again, I NEVER used the phrase “black body” in the problem. I NEVER “postulated a blackbody”. You just keep trying the same fraud, over and over.
If you don’t like “unity emissivity”, you can solve the problem with emissivity of 0.999999999999999. With correct rounding, there won’t be a meaningful change. You can NOT raise the temperature of something that is emitting a flux higher than what is arriving. Even Norman now understands that.
You really need to get away from your fraud, and start learning some science.
SOLAR MINIMUM UPDATE
Donald has hired three prominent researchers who over the course of their careers have questioned and even rejected the scientific consensus on human-caused climate change. Each were given positions in the Energy Department, which is led by Secretary Chris Wright, a former oil and gas fracking executive.
The researchers are John Christy and Roy Spencer, both of whom are research scientists at the University of Alabama at Huntsville, and Steven E. Koonin of Stanford University’s Hoover Institution.
https://edition.cnn.com/2025/07/08/climate/doe-climate-contrarians-trump
Another WIN!
Finally, Willard gets something right. Awesome. Big, big win. Congratulations to Dr. Spencer and Christy.
theY REprEseNt A tINy MinOritY View RepreSEnTiNG perHAPs 1% OR less OF CliMate scIeNTisTS
Walter, please stop clowning.
Says the person who eats, sleeps, breathes, and dreams about Trump. Just live your life!
SOLAR MINIMUM UPDATE
Donald has hired three prominent researchers who over the course of their careers have questioned and even rejected the scientific consensus on human-caused climate change. Each were given positions in the Energy Department, which is led by Secretary Chris Wright, a former oil and gas fracking executive.
The researchers are John Christy and Roy Spencer, both of whom are research scientists at the University of Alabama at Huntsville, and Steven E. Koonin of Stanford University’s Hoover Institution.
https://edition.cnn.com/2025/07/08/climate/doe-climate-contrarians-trump
Another BIG WIN!
In mMmoriam (for the beautiful 2020 seals from the EXECUTIVE OFFICE of the PRESIDENT of the UNITED STATES):
https://web.archive.org/web/20210112005636/https://www.drroyspencer.com/wp-content/uploads/Record-Temperatures-in-the-United-States.pdf
*
From now until January 2029, such highly interesting reports will no longer have to be hidden in the web archive :–)
Hooray for Dr. Spencer!
Congrats! I hope you excell in this role.
Yes,another big win. I hope that working with John and this little bit of work brings you some solace, Roy
I hope he will encourage the govt to bring back the access to all climate data. I know he is interested in it.
clint clown brays…”Here’s another simple problem that kids like Ark, Bindi, studentb, Willard, Nate, gordon, and TimS will be unable to solve”.
***
Don’t know about the others listed but I have no time for obfuscated thought-experiments that cannot be verified. Clint Clown specializes in them since he lacks the ability to do real science and revels in the obscurity of thought experiments that serve no purpose.
For example, Clint preaches that flux is not energy yet flux is a direct measure of the amount of energy passing through an area. He insists on arguing that point with me even though I have spent decades applying fluxes in electronics and communications systems. I have actually applied electric, magnetic, and electromagnetic fluxes in the electronics and electrical fields, in transformers, motors, waveguides and antenna, yet Clint buries his head in the sand, refusing to engage in a debate about those fields.
Clint preaches that entropy is a measure of disorder while, Clausius, who defined entropy as a mathematical adjunct to the 2nd law, defined entropy as sum of heat transfers in a system. Clausius invented the concept to rebut the claim of Carnot that no losses occurred in a heat engine. The entropy defined by Clausius demonstrated that heat is lost in any irreversible process and is no longer available to do work.
Clint also takes me on regularly about the direction of electrical current in a circuit. He cannot support his views with scientific evidence and resorts to insults and add homs in lieu of his ignorance. Conventional current dogma, which claims electrical current flows positive to negative was invented by Ben Franklin in the 18th century. Unfortunately, ignoramuses in universities and textbooks, still justify this egregious error by inventing theories that holes have mass that can be measured.
The hole is based on the empty space left in a copper atom when an electric field drives an electron from one atoms to another. The uninformed regard this empty electron space as a positive charge, which it is not. Holes cannot carry charge and if they did it would be a positive charge, not the negative charge carried by an electron. The only positive charges in a copper atom are in the protons that are fixed in the nucleus and unable to move.
A relative positive charge is not a positive charge. If you have two containers with an equal number of electrons and you remove an electron from one container it then has a relative positive charge wrt the other container. However, both containers still hold the negative charges of electrons only and are both negative charges. Nary a positive charge (proton) in sight.
Same in the valence bands of copper atoms, if one electron vacates a position leaning the entire atom as a positive ion, that has nothing to do with the hole left. In fact, the term positive ion has no meaning in the covalent bonds binding copper atoms together. An ion has meaning only in a liquid or gas where the actual ions are free to move.
Shockley, who transferred the idea of holes to semiconductors, admits in his book that he intended the idea of the hole in a semiconductor as a model to enable clarity. Electronics is filled with these models, aimed at people who have difficulty understanding basic atomic theory. I never had such a problem, always feeling comfortable with the electron as the only current carrier in a cooper conductor or a semiconductor.
I even offered Clint a simple analogy that he fails to grasp. If I dig a hole in a garden and place the soil aside, I have a hole in the ground. If I dig another hole, filling the first with soil from the second, the hole has moved. Duh!!! The more holes I dig, replacing the open hole with soil from the new hole, the more the hole moves. Double duh!!!
Does that hole have mass? Does it have a momentum as a new hole is dug, or a velocity? The air filling the hole, or perhaps water, has mass, but not the hole itself which is nothingness.
That’s exactly what a hole means in a copper conductor or in a semiconductor. The electron is real, has a negative charge and a mass, and it can move with its motion being significant. There is absolutely no significance in the hole left behind moving in the opposite direction as a series of electrons fill that hole, leaving a new hole behind which moves in the opposite direction.
No sir, electric current is based on the flow of negative charges with the amp being measured by so many negative charges (coulombs) passing a point in a second. When Franklin defined positive current flow, the electron had not been invented nor did anyone know anything about atomic structure.
However, all I’ll receive from Clint in reply are more insults and ad homs. Clint seems to think this others me but all it serves is a deepened conviction that Clint is off the deep end.
Thanks for confirming your ignorance of the science again, gordon.
Radiative flux (W/m²) is NOT energy. Energy has SI base units of (kg)(m^2)/(s^2). While radiative flux has SI base units of (kg)/(s^3). Energy is a conserved quantity, while radiative flux is not. Your “decades” of making up crap ain’t science.
Entropy, as related to disorder comes from “Information Theory” which is studied in advanced Electrical Engineering, which you obviously never studied.
You likely flunked out of engineering because you couldn’t understand current flow is a convention. The convention is only to avoid confusion. It’s the same for “charge”. We could say an electron has a positive charge and a “hole” has a negative charge, as long as everyone used that convention, it wouldn’t change anything.
You have no knowledge of the science discussed here. That’s why you couldn’t solve the simple problems, which adds to your frustration and insecurity.
You have serious personal issues. If you received the proper therapy you would learn that constantly clogging the blog just makes you look pathetically immature and incompetent.
clint sticks his foot in it again as he paints himself into a corner.
“Radiative flux (W/m²) is NOT energy…Energy is a conserved quantity, while radiative flux is not”.
***
According to Clint Clown, the radiative flux from the Sun, measured at TOA, is not energy but some sort of mysterious phenomenon only Clint understands. The radiative flux at TOA is measured in w/m^2 just as Clint claims but to him it is not energy but some sort of apparition.
Radiative flux represents electromechanical energy in transit through an area. It is a measure of EM in this case and does not have to be conserved since the EM is conserved much of the time but not always. If a star radiates into space and the EM is not intercepted by a mass, it simply keeps going, dissipating along the way.
from wiki…
“The watt (symbol: W) is the unit of power or radiant flux in the International System of Units (SI), equal to 1 joule per second or 1 kg⋅m2⋅s−3.[1][2][3] It is used to quantify the rate of energy transfer”.
In the electrical field, the watt is a measure of the rate of transfer of ‘electrical energy’. I have argued that the watt should not be used to measure radiation since it is a measure of mechanical energy and electrical energy.
———
“Entropy, as related to disorder comes from “Information Theory”
***
The word entropy was stolen from Clausius who defined the word entropy. If people dealing with disorder want a term to define disorder they should invent their own word.
He used the word entropy to mean ‘transformation’, a reference to the transformation of heat from a higher temperature to a lower temperature or a transformation of heat into work.
However, in Roy’s blog we use entropy in relation to heat, another word that confuses Clint. He does not think heat is energy either, but another one of his obfuscated misdirections. Ergo, we should stick to the Clausius definition based on heat and ignore the imposters who insist it is a measure of disorder.
Clausius defined entropy as a mathematical expression of the 2nd law. He was trying to convey the message that in a reversible process, the sum of heat transfers (transformations) cancel out at zero. However, in an irreversible process, the sum of the infinitesimal heat transfers constitutes an energy sum he named entropy. Entropy was clearly defined as heat lost during an irreversible process and unavailable to the system to do work.
By definition then, entropy is a sum of infinitesimal heat transfers. Another Klown, possibly related to Klint Klown, by the name of Boltzmann, could not do real science either, like Clausius, and developed a system where atoms were replaced by statistics and probabilities. He tried to work out a statistical representation for entropy and the 2nd law and failed miserably. However, for some reason his failed definition of entropy stuck, likely because many scientists operate through appeals to authority, just like Clint, and cannot think for themselves.
Beware mathematician bearing gifts.
Clausius is likely to blame for some of this by philosophizing that the entropy of the universe tends toward a maximum. He was referencing irreversible processes and added that such processes lead to disorder. At no time did he claim that entropy is related to disorder, however, smaller minds misconstrued his words as such.
He did not realize that his musing would be construed as entropy being taken as a measure of disorder rather than a measure of the heat given off by irreversible processes. Clausius clearly misunderstood the stoopid factor in people who cannot read his simple word re his definition of entropy.
Thanks for again confirming your ignorance of the science, gordon.
Now you’re confusing Watts with W/m²! You have no knowledge of the science discussed here. You can’t even understand what you find on wikipedia. That’s why you couldn’t solve the simple problems, which adds to your frustration and insecurity.
You have serious mental issues. If you received the proper therapy you would learn that constantly clogging the blog just makes you look pathetically immature and incompetent.
“The word entropy was stolen from Clausius who defined the word entropy. If people dealing with disorder want a term to define disorder they should invent their own word.”
Clausius Macro definition of entropy is still used to analyze engines, refrigerators, phase transitions etc.
Nobody stole that.
Unless you want to deny the existence of atoms and molecules, you cannot deny that entropy MUST be explainable in terms of atomic and molecular properties.
And we do know that entropy can be explained by the configurations of atoms and molecules and electrons.
And that is also very useful.
There is no problem with having both descriptions.
Gordon,
Don’t mean to derail this current conversation.
Just wanted to make aware to you a comment I just posted in the other thread.
https://www.drroyspencer.com/2025/06/uah-v6-1-global-temperature-update-for-may-2025-0-50-deg-c/#comment-1707999
This is a test of the internet BS filtration system. No adjustment of your download speed is require.
Okay Gordon, here is a chance for you to show your knowledge (tongue in cheek). In order for mechanical, radiant, and electric energy to use the same units, the measurement of the ampere must be carefully defined. How is that done? More importantly, how are amp measuring devices calibrated? The power company measures my amps (and simultaneously my voltage I assume) to determine my power draw and how much energy I have purchased over time measured as kilowatt-hours. How are those devices calibrated? Can I trust them (dumb question)?
This one is for Nate. Plug your nose if you need to, but you will not get cooties. In anticipation of the response, they are innocent until proven guilty and will get their day in court if formally charged. There’s a new sheriff in town, and he is digging up things the previous people wanted to keep secret. Chris Wray could have and should have been the one to do this.
https://www.foxnews.com/politics/john-brennan-james-comey-under-criminal-investigation-doj-sources
Former CIA Director John Brennan and former FBI Director James Comey are under criminal investigation for potential wrongdoing related to the Trump–Russia probe, including allegedly making false statements to Congress, Justice Department sources told Fox News Digital.
CIA Director John Ratcliffe referred evidence of wrongdoing by Brennan to FBI Director Kash Patel for potential prosecution, DOJ sources told Fox News Digital.
The sources said that the referral was received and told Fox News Digital that a criminal investigation into Brennan was opened and is underway. DOJ sources declined to provide further details. It is unclear, at this point, if the investigation spans beyond his alleged false statements to Congress.
…
The review added: “Brennan ultimately formalized his position in writing, stating that ‘my bottomline is that I believe that the information warrants inclusion in the report.’”
But Brennan testified the opposite in front of Congress in May 2023.
“The CIA was very much opposed to having any reference or inclusion of the Steele dossier in the Intelligence Community Assessment,” Brennan testified before the House committee, according to the transcript of his deposition reviewed by Fox News Digital. “And so they sent over a copy of the dossier to say that this was going to be separate from the rest of that assessment.”
The DOJ has transformed into the Dept of Political Retribution.
This one is an attempt to distract MAGAts from the Epstein fiasco.
Comey essentially admitted to felonies, and Brennan was caught red-handed lying to Congress. They both should get at least the same time as Steve Bannon.
Douglas Feith and Lewis Libby acting under Donald Rumsfeld fed false intelligence to the Bush admin that helped lay a causus belli to go into Iraq in 2003. This was covered in the Senate Select Committee report on Iraq intelligence.
They weren’t prosecuted for it.
Times have changed. The Steele Dossier didn’t help start a war, and numerous reviews and reports confirmed that Russia interfered in the 2016 election.
So what was the harm here? Months of negative press on a false allegation that Trump conspired with Russia to get elected.
Which didn’t stop him getting elected twice.
Yeah, seems like a vendetta to me.
Thank God the US presidency isn’t weaponising the DoJ any more!
The most serious charge here is conspiracy. In the last hour of her service in government as National Security Advisor to President Obama, Susan Rice wrote a “memo-to-self” for the record that they “went by the book”. Months later, when Trump accused Obama of spying on him, Obama issued an oddly worded statement about following the legal processes, or something to that effect. He did not deny it.
This is for Nate also. The behavior you now see from Trump and his DOJ is a direct result of the certain knowledge that the outgoing Obama administration was involved in a coordinate conspiracy at all levels to interfere with and disrupt the incoming administration. It remains to be seen whether crimes were committed.
Some on the Republican side think it is a very bad precedent, that goes well beyond the Clinton administration removing the “W” keys from all of the key boards as a joke. Others on the Democrat side such a Shifty Schiff still think it was a really good idea.
I submit once again that it was a mistake for the Democrat Party leadership to bypass the democratic process (in order to “save democracy”) and submit a socialist candidate, Kamala Harris, as their candidate. The big gamble failed.
Sure TIM, it is always somebody else’s fault.
This is how the rule of law disappears.
What the Democrat party has done is similar to how they treated Abraham Lincoln when he was elected, including insurrection. The ambush of the ICE agents in Texas was an insurrectionist action, and the riots in LA were an insurrection, including the actions of Mayor Bass. Comey, Brennan, and others need to be investigated. I also believe Obama, Susan Rice, Hillary, Adam Schiff, and others (Letitia James) need to be looked at. It isn’t a vendetta, it is justice. It is removing our country from this lawlessness. They thought they were above the law while claiming Trump was above the law. They called Trump a liar while telling lies. They called Trump a dictator while acting like dictators. The Democrat Party pre Civil War was less corrupt than the Democrat Party today.
“The behavior you now see from Trump and his DOJ is a direct result of the certain knowledge that the outgoing Obama administration was involved in a coordinate conspiracy at all levels to interfere with and disrupt the incoming administration.”
Certain knowledge? These are conspiracy theories. And it reads like nothing more than a vendetta. It also doesn’t make sense when you remember Comey interfered with Clinton’s election chances by divulging harmful information a month out from election.
“I submit once again that it was a mistake for the Democrat Party leadership to bypass the democratic process (in order to “save democracy”) and submit a socialist candidate, Kamala Harris”
That has nothing to do with this. Looks like you have an axe to grind with the Dems.
“In 2020, Bannon and others were arrested on federal charges of conspiracy to commit mail fraud and money laundering connected to the We Build the Wall fundraising campaign. According to the indictment, the defendants promised contributions would go to building a U.S.–Mexico border wall, but instead enriched themselves. Bannon pleaded not guilty.[28] Trump pardoned Bannon, sparing him from a federal trial, but did not pardon his codefendants.[29][30][31] Federal pardons do not cover state offenses, and in 2022, Bannon was charged in New York state court with fraud, money laundering, and conspiracy in connection with the campaign.[2][32] In February 2025, Bannon pleaded guilty to fraud and was sentenced to three years of conditional discharge.[33][34] Bannon refused to comply with a subpoena from the January 6 House select committee, so was indicted by a federal grand jury on criminal charges of contempt of Congress. In July 2022, he was convicted and sentenced to four months in prison and a $6,500 fine.[35][3][36][37] After losing his appeal to the U.S. Supreme Court, Bannon surrendered to a federal prison in Danbury, Connecticut, where he was imprisoned from July to October 2024”
Aware of anything in the Durham report about Brennan?
For Tim S.
Now Nate is behaving like Willard pretending that he didn’t read the story. Durham did not investigate the CIA. The new story from the new report is that the career people at CIA knew the Dossier was fake and unreliable. Brennan told them to use it any. The conspiracy is now getting wider. What information did Obama know? Interestingly, a new published story says the joke being shared by Trump and Obama at the Jimmy Carter funeral was about golf.
Here is the part Nate did not read from the link:
[The Brennan investigation comes after Ratcliffe last week declassified a “lessons learned” review of the creation of the 2017 Intelligence Community Assessment (ICA). The 2017 ICA alleged Russia sought to influence the 2016 presidential election to help then-candidate Donald Trump. But the review found that the process of the ICA’s creation was rushed with “procedural anomalies,” and that officials diverted from intelligence standards.
It also determined that the “decision by agency heads to include the Steele Dossier in the ICA ran counter to fundamental tradecraft principles and ultimately undermined the credibility of a key judgment.”
The dossier — an anti-Trump document filled with unverified and wholly inaccurate claims that was commissioned by Fusion GPS and paid for by Democrat presidential candidate Hillary Clinton’s campaign and the DNC — has been widely discredited. Last week’s review marks the first time career CIA officials have acknowledged politicization of the process by which the ICA was written, particularly by Obama-era political appointees.
Records declassified as part of that review further revealed that Brennan did, in fact, push for the dossier to be included in the 2017 ICA.
Brennan testified to the House Judiciary Committee in May 2023, however, that he did not believe the dossier should be included in that intelligence product.]
None of this, if true, justifies the current all out weaponization of the Justice Dept to enact retribution for Trump’s old tired grievances.
Keep your eyes on the ball Tim.
Here you have it direct from Nate that it is okay for the CIA to issue a fake report — a report that is known to be fake for certain — so long as it targets a Republican.
The Russia collusion accusation is the biggest political scandal of the century, but it should not be investigated because they almost got away with it. Nate and the rest of the Democrats think this is a good way to govern. It seems that Democrats are glad to “defend democracy” with fake intelligence reports, fake investigations (Mueller) fake congressional reports (Shifty Schiff), fake “bipartisan” hearings (Nancy – Jan 6), fake Presidents (Biden), and a fake Democrat election primary (Kamala).
First off, there is nothing unusual or illegal about opposition research in politics.
Second, there was a concerted effort by Russia to help get Trump elected, and there were contacts between Russian intel and Trump campaign, and there was an accepted offer by the Trump capaign to receive dirt on Clinton from Russian operatives, which is illegal, all in the Mueller report.
Third, there was a counterintelligence investigation into all this initiated prior to the Steele dossier.
Fourth the dossier was on the right track on the issues mentioned above, and it needed to be checked out by the intel agencies. Some, but not all, of it could be corroborated.
In any case, it’s author had
credibility, and he considered it to be ‘raw’ intel that needed to be investigated.
“The 2017 ICA alleged Russia sought to influence the 2016 presidential election to help then-candidate Donald Trump. But the review found that the process of the ICA’s creation was rushed with ‘procedural anomalies,’ and that officials diverted from intelligence standards.”
Multiple reviews, including conservative-led, confirmed concerted Russian interference in the 2020 US Federal election.
The allegation is that career officials were guided by political agendas rather than neutral intelligence gathering and assessment in making the assessment.
The proper response to this is to investigate, assess and then remedy, by better training, policy and/or cultural change.
The Steele Dossier was not the impetus for probes into Russian interference in the election, nor the FBI’s surveillance of the Trump administration, nor is it clear to me what impact it had other than adding to the cloud of suspicion already over Trump.
What is the purpose of criminal prosecution other than to seek revenge?
amending
…confirmed concerted Russian interference in the 2016 US Federal election.
I accuse Democrats of being dishonest and Nate replies with a string of easily proven lies. Is Nate a Democrat?
Then barry joins in seeming lost and trying to figure out what the issues are. Try this:
[“The rushed timeline to publish both classified and unclassified versions before the presidential transition raised questions about a potential political motive behind the White House tasking and timeline.”
The review found that Brennan directed the compilation of the ICA, and that his, Comey’s and Clapper’s “direct engagement in the ICA’s development was highly unusual in both scope and intensity” and ”risked stifling analytic debate.”
Brennan handpicked the CIA analysts to compile the ICA and involved only the ODNI, CIA, FBI and NSA, excluding 13 of the then-17 intelligence agencies.
He sidelined the National Intelligence Council and forced the inclusion of the discredited Steele dossier despite objections of the authors and senior CIA Russia experts, so as to push a false narrative that Russia secured Trump’s 2016 victory.
“This was Obama, Comey, Clapper and Brennan deciding ‘We’re going to screw Trump,’” said Ratcliffe in an exclusive interview.
“It was, ‘We’re going to create this and put the imprimatur of an IC assessment in a way that nobody can question it.’ They stamped it as Russian collusion and then classified it so nobody could see it.
“This led to Mueller [special counsel Robert Mueller’s inquiry, which concluded after two years that there was no Trump-Russia collusion]. It put the seal of approval of the intelligence community that Russia was helping Trump and that the Steele dossier was the scandal of our lifetime. It ate up the first two years of his [Trump’s first] presidency.
“You see how Brennan and Clapper and Comey manipulated [and] silenced all the career professionals and railroaded the process.”
The CIA review notes that, before work even began on the ICA, “media leaks suggesting that the Intelligence Community had already reached definitive conclusions risked creating an anchoring.” The term “anchoring” refers to a cognitive bias in psychology and suggests that the media leaks may have influenced the analysts working on the ICA to shape their findings to conform with the leaked narrative rather than conducting an objective analysis.
On December 9, 2016, both the Washington Post and New York Times reported the IC had “concluded with high confidence that Russia had intervened specifically to help Trump win the election.”
The Post cited an unnamed US official describing this as the IC’s “consensus view.”]
And then there is this:
https://www.politico.com/story/2016/07/clinton-putin-226153
https://www.cnn.com/2011/12/06/world/europe/russia-elections-clinton/index.html
https://www.express.co.uk/news/world/742400/Vladimir-Putin-Hillary-Clinton-US-election-interfere-Ambassador-Michael-McFaul-Trump
Tim,
“Then barry joins in seeming lost and trying to figure out what the issues are”
I hope you won’t complain should similar incautious characterizations float your way.
Help me frame this: Comey announces publicly in July 2016 that while the FBI won’t press charges re the email server, Clinton was sloppy and careless with classified material. Then a few days out from the election he publicly announced they were re-opening the case on the emails, BEFORE any proper investigation had been done – and the investigation very quickly turned up nothing.
If Comey is a Trump-hating Democrat, why did he do these things?
I see you’re quoting a Trump loyalist and conspiracy theorist Ratcliff, who has frequently during his tenure in intelligence made announcements that were against intelligence assessments.
If you’re going to make a case of political bias, Ratcliff is inarguably a biased, almost feckless source.
“It [Mueller Investigation] put the seal of approval of the intelligence community that Russia was helping Trump and that the Steele dossier was the scandal of our lifetime. ”
It’s as if the writer of the article you’ve quoted here (or is it you?) isn’t aware that Russia did actually interfere in the 2016 election to help D Trump. Nor was the dossier the impetus for investigations on the matter. They were underway before the dossier came to light.I wonder if you labor under the same misconception.
And this:
“It was, ‘We’re going to create this and put the imprimatur of an IC assessment in a way that nobody can question it.’ They stamped it as Russian collusion and then classified it so nobody could see it.”
Is an outright lie. The ICA report expressly said it did not investigate collusion with the Trump administration.
No, I’m not the one who is confused here. There may well have been political bias in intelligence, but read your sources with a critical eye. You’re getting fed a false narrative.
The “Russia collusion hoax” was built from valid intelligence reporting that Russia had interfered, that Trump was friendly with and praised Putin, his public request that Russia help find Clinton’s emails and refusing to condemn Russia for leaking DNC material, that his campaign staff had had contact with Russians about the campaign that they later lied about (some were charged for it, some pled guilty).
Ratcliff seeks to dismiss all of this out of hand,implying that there was no interference, no contact, and no justification for investigations.
There may be meat to the motion that political bias crept into assessment gathering and reporting, but criminal prosecution is a complete waste of time and taxpayer dollars. That is not how you deal with this.
Unless they stack the court they can’t possibly hope to win a case. This is a vendetta. Unlike in Biden’s tenure, this DoJ is fully weaponised for Trump.
Tim,
Take a step back and read what the director of the Central Intelligence Agency says. He doesn’t sound sober or cautious, like prior directors.
He reads in this interview (and others) like a political attack dog.
I don’t know if you’re familiar with how intelligence directors normally speak to the public, but this is blog-level activism in comparison. If you are familiar with how it’s normally done, this is so blatantly political and partisan it’s like a siren in a church.
You’re intelligent – surely you see that? Do you realize how not normal it is?
Tim just can’t seem to resist saying things that betray his extreme biases.
“fake investigations (Mueller)”
“Steele dossier was the scandal of our lifetime”
And hyperventilating that the report ‘involved only ODNI, CIA, FBI and NSA’.
Then we get
‘Nate replies with a string of lies’
with no specifics pointed out.
He’s just determined to lose all credibility.
I guess if you are a Democrat, or Democrat supporter, then you have to defend liars. It seems the best way to support liars is with more lies, or maybe just make a lot of noise.
These statements are not just someone’s opinion. They are supported by factual evidence that is being made public:
“This was Obama, Comey, Clapper and Brennan deciding ‘We’re going to screw Trump,’” said Ratcliffe in an exclusive interview.
“It was, ‘We’re going to create this and put the imprimatur of an IC assessment in a way that nobody can question it.’ They stamped it as Russian collusion and then classified it so nobody could see it.
“You see how Brennan and Clapper and Comey manipulated [and] silenced all the career professionals and railroaded the process.”
“These statements are not just someone’s opinion.”
“This was Obama, Comey, Clapper and Brennan deciding ‘We’re going to screw Trump,’” said Ratcliffe in an exclusive interview.”
Yes that is clearly Radcliffe expressing his highly biased opinion.
What you still haven’t learned, is that all of Trumps cabinet members, when making public statements, are directing them at one person, Trump.
He expects them to make statements and take actions that support and provide cover for Trumps petty grievance campaign.
And Radcliffe is illustrating perfectly how to do that.
More lies from Nate, in fact, nothing but lies from Nate. This is my full quote:
[These statements are not just someone’s opinion. They are supported by factual evidence that is being made public:
“This was Obama, Comey, Clapper and Brennan deciding ‘We’re going to screw Trump,’” said Ratcliffe in an exclusive interview.]
The “CIA NOTE” dated 26 June 2025 is available on-line. It is available to anyone who wishes to read it and be informed, including Nate. It is embedded in this link requiring a subscription if you want to download it:
https://nypost.com/2025/07/02/us-news/obamas-trump-russia-collusion-report-was-corrupt-from-start-cia-review/
If you want to assume that Brennan did this on his own without any private discussion with Obama, Clapper, Comey, Susan Rice, and Biden (yes, Biden, he was still cognitive in those days) then there is no conspiracy. What he did was document in an email that he was requiring Hillary’s Dossier to be included in the intelligence assessment over the strong objections of the career CIA managers who could see that is was a political dirty trick.
Tim, you undo your claims of fact when you say
“If you want to assume that Brennan did this on his own..”
Maybe its his conspiracy theorist mind that is able to turn a lack of evidence and speculation into ‘its a fact’. And then “its definitely a fact!’
Tim, I just don’t get why you cannot recognize what Barry pointed out about Radcliffe:
“He reads in this interview (and others) like a political attack dog.”
Because it is glaringly obvious to me.
“The “CIA NOTE” dated 26 June 2025 is available on-line. It is available to anyone who wishes to read it and be informed, including Nate. It is embedded in this link requiring a subscription if you want to download it:”
You can read it here:
https://web.archive.org/web/20250709185959/https://www.cia.gov/static/Tradecraft-Review-2016-ICA-on-Election-Interference-062625.pdf
It repeats much that has already been said in previous reviews of this matter, including by the Republican-led SSIC.
It does not reject any of the claims made in the previous ICA, but recommends that the confidence level attached to Russian aid to the Trump campaign was too high, which was also discussed at the SSIC years ago. (Later intelligence reconfirmed this finding, and also the same pro-Trump Russian interference in the 2020 election)
The memo describes remedies for the suggested intelligence failures/potential politicization (matching what I said above, BTW), none of which include criminal prosecution. It reads like a fair and useful assessment.
DoJ seeking prosecutions is patently a weaponisation of the Justice Department to punish activity that should be addressed in training and policy changes.
There is nothing to be gained by prosecuting Comey and Brennan here, but a political circus and Trump appeasement.
The sycophancy to Trump is nauseating.
Tim, what are you doing cheering on this travesty?
Tim,
Maybe you could aim your powerful conspiracy detector at Pam Bondi and the FBI. How did the Epstein list that was on her desk in February simply vanish?
BACK AT THE RANCH
During his time in Congress, Ratcliffe was regarded as one of the most conservative members. President Donald Trump announced on July 28, 2019, that he intended to nominate Ratcliffe to replace Dan Coats as director of national intelligence. Ratcliffe withdrew after Republican senators raised concerns about him, former intelligence officials said he might politicize intelligence, and media revealed Ratcliffe’s embellishments regarding his prosecutorial experience in terrorism and immigration cases.
https://en.wikipedia.org/wiki/John_Ratcliffe
Meanwhile, word is that Steve Bannon is also in the Epstein file.
Wiiiiiin!
You should at least read your links, even you if have no idea what it means. From the link:
The Senate Intelligence Committee approved his nomination and the Senate confirmed him on January 23, 2025 by a vote of 74–25, making him the second member to be confirmed in the Second cabinet of Donald Trump.[97]
That means more that 20 Democrats or “Independents” who caucus with Democrats voted for the most conservative Representative in the entire history of the House of Representatives.
I will let you take some time to figure this out.
Willard ought to understand what a consensus is.
Perhaps the ivy leagues doesn’t inculcate integrity anymore:
“In a March 2019 tweet, Ratcliffe asserted that former FBI attorney Lisa Page had confirmed to him under oath that the Obama Justice Department had ordered the FBI to not consider gross negligence charges against Hillary Clinton regarding her handling of classified material. However, the June 2018 DOJ inspector general report on the matter stated that the DOJ’s analysis of the relevant statute found that the FBI evidence for such a charge was lacking, and that interpretation was consistent with “prior cases under different leadership including in the 2008 decision not to prosecute former Attorney General Alberto Gonzales for mishandling classified documents.” Analysts also noted that the FBI does not charge individuals, rather the DOJ does, as Page clarified to Ratcliffe later in her testimony, but which Ratcliffe did not mention in his tweet. Fox News extensively reported Ratcliffe’s account of the matter, which Trump tweeted about minutes later.”
Let’s see if TS will figure out if Ratcliffe will be as strict regarding classified material now that we know that Donald left some boxes in his bathroom and that Ratcliffe himself has been involved in Signalgate.
Perhaps the ivy leagues doesn’t inculcate integrity anymore:
“In a March 2019 tweet, Ratcliffe asserted that former FBI attorney Lisa Page had confirmed to him under oath that the Obama Justice Department had ordered the FBI to not consider gross negligence charges against Hillary Clinton regarding her handling of classified material. However, the June 2018 DOJ inspector general report on the matter stated that the DOJ’s analysis of the relevant statute found that the FBI evidence for such a charge was lacking, and that interpretation was consistent with “prior cases under different leadership including in the 2008 decision not to prosecute former Attorney General Alberto Gonzales for mishandling classified documents.” Analysts also noted that the FBI does not charge individuals, rather the DOJ does, as Page clarified to Ratcliffe later in her testimony, but which Ratcliffe did not mention in his tweet. Fox News extensively reported Ratcliffe’s account of the matter, which Trump tweeted about minutes later.”
Let’s see if TS will figure out if Ratcliffe will be as strict regarding classified material now that we know that Donald left some boxes in his bathroom, that Ratcliffe was assigned to Donald’s impeachment team, and that he has been involved in Signalgate.
Severe thunderstorms in Texas.
https://i.ibb.co/Ps74RTTC/archive-2-image.png
Severe thunderstorms in the eastern US.
https://i.ibb.co/SwJSM87L/archive-7-image.png
https://i.ibb.co/Kx5t0T1Y/archive-1-image.png
Right-wing political pundit Charlie Kirk shared Texas Hill Country flooding conspiracy theories on his show Wednesday, claiming that the hiring of Austin Fire Chief Joel G. Baker—a Black man Kirk referred to as the “DEI fire chief”-affected the number of lives lost.
https://www.chron.com/politics/article/texas-flood-fire-chief-charlie-kirk-20763485.php
Lacking Black officials to blame in Kerr County, and too timid to criticize Republicans for anything, Charlie Kirk spins a conspiracy theory to implicate the closest Black official he can find – the fire chief in Austin, more than a hundred miles away.
That’s how Donald WINS!
Left wing propagandist Willard apparently failed to read his own link where Charlie Kirk explains why a Fire Chief one hundred miles away was very much to blame for supplies not being prepositioned two days before the flooding in Kerrville, at least that’s what the Austin Fire Association claims.
No one could have predicted this amount of rainfall in one area.That’s why I’ve asked before if a rainforest will grow in Texas. The trend was apparent.
Everyone could have predicted fascists to find a way to blame scientists and minorities instead of taking any kind of responsibility, but no one would have predicted that Troglodyte would side with the union guy who does everything to crater the city’s budget even more.
The union guy is a fascist? Make your case.
Who blamed scientists and minorities, the union guy?
No.
Perhaps Troglodyte should read harder.
tim s….”In order for mechanical, radiant, and electric energy to use the same units, the measurement of the ampere must be carefully defined. How is that done? More importantly, how are amp measuring devices calibrated? The power company measures my amps (and simultaneously my voltage I assume) to determine my power draw and how much energy I have purchased over time measured as kilowatt-hours. How are those devices calibrated? Can I trust them (dumb question)?”
***
Good questions actually. The ampere, or amp, is a human defined unit and one way of defining it is to calculate the force between two parallel conductors when a current is run through them. The force is created by opposing or attracting magnetic fields created in each conductor by the current through each. Of course, the current has to be driven by a standard voltage, which is also human derived.
It is all based on the charge on one electron which was calculated by Millikan in his famous oil drop experiment.
https://chem.libretexts.org/Bookshelves/Introductory_Chemistry/Introductory_Chemistry_(CK-12)/04%3A_Atomic_Structure/4.12%3A_Oil_Drop_Experiment
Knowing the charge on one electron, one could calculate, using the defined amp, how many coulombs of charge are passing a point in a circuit in a second.
https://www.techtarget.com/whatis/definition/coulomb
The electrical watt is related to heating, called Joule heating, in a resistance. In fact, the pure electrical watt can only be derived in a purely resistive circuit, If there is inductive and/or capacitive units in the circuit, a phase difference is introduced between current and voltage and the relationship is no longer linear. Also, inductive devices require current to maintain magnetic fields, which is returned to the circuit when the magnetic field collapses. That reactive power cannot be used directly in a power calculation.
As you know, the scientist Joule found an equivalence between heat and work, and there is your connection between heat, work, and electrical power.
An electric motor can be rated in horsepower or watts (more likely Kwatts) and both are related to the armature current required to produce the rated horsepower. One HP = 746 watts, and that is the connection between mechanical HP and watts. But, a watt is 1 joule/second and a joule = 0.239 calories. That’s your relationship between mechanical power, heat, and electrical power.
An ammeter, is based on a standard meter which is calibrated for full-scale deflection at the rated number of amps. The device is set up with a shunt (parallel conductor) that carries most of the current, but knowing the resistance of the shunt, one can calculate how much current is running through the ammeter. By adjusting the shunt size, one can run high current through it with the meter in parallel with no fear of damaging it unless the shunt current is excessive.
A voltmeter is always connected a cross a voltage source while the ammeter is in series. That’s how the Kw-hr meter works in your home. The ammeter in it is connected across the incoming line and the ammeter is series. Of course power = voltage x current. The time factor for power is introduced by the little wheels that turns, calibrated in digits. When the meter reader reads them, he/she knows the amount of power used based on the difference in reading between readings. The little wheels are essentially a clock.
I would not worry about being rooked by the meters being incorrectly calibrated, since all basic meter units are calibrated. I’d worry about the meter reader or possibly a faulty meter. If you look inside the older types, you see a wheel turning and the speed it turns is dependent on the amount of power being consumed.
The speed of the wheel is dependent on the current and voltage, hence the power.
red…everything is good. It’s good to question and I welcome it.
“please elaborate on this statement of yours: “The Moon can operate like that because it has zero resistance to its momentum.” How does an object resist its own momentum?”
Just to elaborate, when a force accelerates a mass and the force is removed, the mass has momentum, which equals mass x velocity. If there is no air resistance, or other resistance to oppose the motion, there is no reason for the mass to lose momentum. Theoretically it should keep moving in a resistance-free, opposing force-free environment.
Note that a force applied to the Moon tangentially wrt the Earth, can accelerate it again, and the Moon will provide an inertia to oppose the force. If the force is removed, the Moon now has an increased momentum. That’s the distinction between momentum and inertia, although some don’t distinguish between the two,
Any satellite launched within our atmosphere, no matter how low the resistance may be, will eventually lose momentum and lose orbit. We can only hope the Moon never loses momentum because the ending will not be happy for us here on Earth.
“Note that a force applied to the Moon tangentially wrt the Earth, can accelerate it again … ”
Correct.
“If the force is removed, the Moon now has an increased momentum.”
Incorrect. The force changed the DIRECTION of the moon’s velocity, but not the MAGNITUDE of the moon’s velocity. The magnitude of the moon’s momentum is not changed by a tangential force.
A theoretical tangential force would increase the Moon’s speed and therefore its momentum. And in the absence of any external force to oppose it, the Moon would not lose momentum. So, there is an increase in its overall momentum.
“A theoretical tangential force would increase the Moon’s speed and therefore its momentum. ”
No. This is Physics 101. A tangential force moves an object in a circle at CONSTANT SPEED and hence CONSTANT MOMENTUM.
If you’re referring to the centripetal force alone, you’re correct. I think Gordon is referring to an additional theoretical force applied tangentially to accelerate the Moon. Once the force is removed, Newton’s 1st Law says that the Moon will not lose that momentum, assuming there is no external force acting to slow it down.
Red Crok (and Gordon) — you are right! Somehow I read “radial” instead of “tangential” in Gordon’s statement. Circular motion problems are usually about radial force and my mind went there.
So yes, any forward force will speed up a satellite; any backward force will slow it down. Satellites near earth slow down and move closer to the earth. The moon is doing the opposite — moving slowly away from the earth.
[There is an interesting result that giving a forward push on a satellite to speed it up will actually cause the orbital period to INCREASE. But that is beyond what we are discussing here.]
clint does not seem to understand the meaning of watt. Wot’s that?
I copied this a while back re the electrical watt…
note: the watt was defined as an electrical unit by Siemens, but has an equivalence to work and heat through HP and Joule heating.
“The watt is named after the Scottish inventor James Watt.[5] The unit name was proposed by C. William Siemens in August 1882 in his President’s Address to the Fifty-Second Congress of the British Association for the Advancement of Science.[6] Noting that units in the practical system of units were named after leading physicists, Siemens proposed that watt might be an appropriate name for a unit of power.[7] Siemens defined the unit within the existing system of practical units as “the power conveyed by a current of an Ampère through the difference of potential of a Volt”.[8]
In October 1908, at the International Conference on Electric Units and Standards in London,[9] so-called international definitions were established for practical electrical units.[10] Siemens’ definition was adopted as the international watt. (Also used: 1 A2 × 1 O.)[5] The watt was defined as equal to 107 units of power in the practical system of units.[10] The “international units” were dominant from 1909 until 1948. After the 9th General Conference on Weights and Measures in 1948, the international watt was redefined from practical units to absolute units (i.e., using only length, mass, and time). Concretely, this meant that 1 watt was defined as the quantity of energy transferred in a unit of time, namely 1 J/s. In this new definition, 1 absolute watt = 1.00019 international watts. Texts written before 1948 are likely to be using the international watt, which implies caution when comparing numerical values from this period with the post-1948 watt.[5] In 1960, the 11th General Conference on Weights and Measures adopted the absolute watt into the International System of Units (SI) as the unit of power.[11]”
***
Maybe Clint could explain how the watt can be used as a measure of EM, which has no mass, hence no momentum, and which generates no mechanical power or electrical power, and has no heat.
EM can certainly be converted to heat but as far as I can see, it has no power of its own.
I think the use of a watt to measure EM is based on Einstein’s mistaken belief that EM of a certain frequency can cause electrons to be ejected from a surface by transferring momentum to them. Bohr provided the correct answer which has nothing to do with momentum transfer but due to a transfer of KE between EM fields in the EM and on the electron. The fields need to be resonant with each other to transfer KE but the KE is not momentum.
Once again gordon demonstrates he can’t learn.
He finds something on the Internet and then rambles incoherently, somehow believing he’s making sense. Here, he’s proving again that he doesn’t understand the difference a Watt and W/m².
Like Norman, gordon can’t understand flux is NOT energy. I explained it fully, showing the engineering units of each and even using the concept of “conservation”. But unfortunately, that was all over gordon’s head….
A strong thunderstorm front in the Midwest is moving eastward.
SOLAR MINIMUM UPDATE
Many in the MAGA movement are in a state of anger and disbelief over the Justice Department and FBI’s memo disclosing that there was no evidence of a Jeffrey Epstein “client list” that incriminated powerful people amid his perpetration of child sexual abuse. Among those was right-wing conspiracy theorist Alex Jones, who posted a video showing his raw reaction to the memo.
…
“So this is the swamp winning,” Jones said. “The question is, is Donald’s DOJ actually using this to control the deep state, or are they just so overwhelmed by it they are tapping out?”
https://variety.com/2025/digital/news/alex-jones-breaks-down-tears-doj-fbi-epstein-memo-client-list-1236449323/
Sounds more like Donald winning again.
Has he found that missing minute yet?
The ‘Deep State’ isn’t quite where all these dumb, naive MAGAmaniacs thought it would be…
Couldn’t care less about the Epstein file or what is in it.
The sociopathy of troglodytes is fairly established already, so there is no need to wonder if they care if the Abbott-Musk official correspondence will ever be released.
The United Kingdom has abandoned God-given rights-inalienable rights. Thank God for our country and our Constitution.
For the umpteenth time I read the same utter nonsense:
” Like Norman, gordon can’t understand flux is NOT energy. ”
*
Is it so difficult to understand this below?
https://en.wikipedia.org/wiki/Energy_flux
“Radiative flux, heat flux, and sound energy flux density (also sound intensity) are specific cases of this meaning”
Bindi, it’s also the “umpteenth time” you’ve avoided answering the simple physics problems. Your avoidance of science is quite revealing.
Yet you continually stalk me. That’s quite revealing also….
Dr Spencer, congratulations to you and Dr. Christy for being selected by President Trump. What a true honor and it couldn’t have happened to a more deserving group.
The Trump admin just hired 3 outspoken climate contrarians. Scientists are worried what comes next
https://www.cnn.com/2025/07/08/climate/doe-climate-contrarians-trump
I know we may disagree on some of the issues, but please consider passings these videos on to the EPA and others in Washington.
Analysis of the Hockeystick
https://app.screencast.com/nXfZcUyGR4QlR
Lawsuit Arguments
https://app.screencast.com/ZMpNTvkLD7DDJ
If 10% is correct in those videos, there are real problems, but I’m pretty sure 100% is correct. If not, readers please provide corrections.
Is there anyone out there able and willing to confirm the accuracy of my comparisons of cascaded triple means versus medians, based on coefficients calculated by StanU Emeritus V. Pratt?
I use UAH 6.1 LT as data source for the cascades.
https://docs.google.com/spreadsheets/d/174CxYCkDKfQMUhAR4TnWXeKj58yhIiCYvCOF4koSfec/edit
Thanks in advance for a careful review.
*
{ I have a much more sophisticated, automated version that I use in Libre Office Calc on Linux, but it is even more synthetic than the one presented here, which makes it more difficult to check. }
BREAKING – Man Afraid to Ride Subway Head of NASA
https://www.rollingstone.com/politics/politics-news/trump-sean-duffy-interim-nasa-administrator-1235382413/
Hey Willard,
I don’t blame him. Subways are dangerous. By the way, our gas prices are at four-year lows. How you guys doing?
There seem to be a lot of troglodytes who think gas prices were consistently below $2/gal during Donald’s first term. The national average did not fall below $2/gal from 2017 until March 27, 2020. Even cheap states like TX only saw sub-$2/gal prices briefly for about 6 weeks in 2019.
Speaking of TX, AG Ken Paxton’s wife sought divorce on ‘biblical grounds’. There seems to be new developments that even repulsed the National Republican Senatorial Committee. But fear not: the guy who has hounded doctors for medical records of pregnant women and transgender people so he can punish them – would like some privacy.
S&P 500 closed today at an all-time record high.
Remember some of the kids here predicted tariffs would trash the stock market?
Puffman rediscovers that markets love liquidity. While troglodytes might forget what the Big Ugly Bill hides after 2026, does he think diamond hands will? I for one welcome more debt from troglodytes’ children.
Meanwhile, a devout MAGA mom holed up in a detention center in the Mojave Desert says her support for Donald is unwavering, despite his ICE goons locking her up:
https://www.thedailybeast.com/maga-mom-locked-up-by-ice-vows-to-never-stop-loving-trump-in-detention-center-call/
Husband does like any Ivy League Very Intelligent Guy would do: blaming Captain Joe.
Another win for Christian nationalism!
TDS is Leftism on steroids.
(Notice the foaming at the mouth.)
Puffman may presume that the Christians from Iran in the story are leftists. It might be more prudent to hold that they’re contrarians who, like all contrarians, are powered by special pleading. Our couple simple can’t believe that they could be deported because they’re Christians.
Willard,
So, what does an AG’s investigating law violations have to do with his own personal divorce? I can’t make that connection.
Troglodyte plays dumb once again.
What investigation, which violation – consumer law? Perhaps he could explain denizens how ordering employees to ignore court orders is legal or how a profiling database is constitutional.
Paxton’s wife says *she* asked for divorce. Paxton claims that the decision was mutual.
Paxton’s wife says she’s divorcing for Biblical reasons. Paxton turns around and blames media.
Paxton is a bigot lying through his teeth, just like Troglodyte.
Willard,
How does Paxton’s personal life affect me or the people of Texas? How’s your gas prices doing? Ours are at four-year lows.
How can the frauds Ken committed affect Texans? How does the fact that Paxton *still* speaks for his ex-wife affect Texan women? How could the moral bankruptcy of an Attorney General ever be of public relevance?
One day Troglodyte can fancy the silliest conspiracy theories, the next his imagination completely shuts down. Often when related to Donald or his closest allies.
But since he implicitly agrees that what Ken does in his official role is a public matter, perhaps he should wonder why the emails related to Jan. 6 insurrection and those related to the 2022 Uvalde shooting with gun lobbyists have not been released.
Willard,
Are all those recent arrests of Democrat officials for election fraud by the Texas AG’s office the conspiracy theories you are talking about? Hey, how’s your gas prices? Ours are at a four-year low?
Troglodyte still plays dumb, this time to deflect—LOL.
MAGA: “Humans cannot possibly change the weather through greenhouse gas emissions causing climate change, that’s blasphemous.”
Also MAGA: “Humans are changing the weather with weather machines, cloud seeding, and magical weather fairies with help from the groundhog.”
Flooding in Texas, North Carolina, New Mexico, Delaware, …Time to throw another virgin into the volcano to appease the gods!
Thank you for your attention to this matter! MAGA.
Ark, between your ignorance of science and your ludicrous stock market predictions, you’re quite the cult child — ignorant, boisterous, and filled with hate.
It’s here:
https://www.facebook.com/DrMarshallShepherd/posts/some-of-your-friends-and-family-humans-cannot-possibly-change-the-weather-throug/1323147376480915/
Again we have extrem mid-latitude ocean heatwaves. Had this every year in summer since at least 2022.
https://www.ospo.noaa.gov/products/ocean/sst/anomaly/index.html
As a result, global sst is again close to the record highs of 2023-2024.
https://climatereanalyzer.org/clim/sst_daily/?dm_id=world2
Antarctic is experiencing -80C.
Australian Alps are getting a foot of snow.
I think your prediction is wrong.
Ken
” Antarctic is experiencing -80C. ”
Did you not know yet that Antarctic currently is in full winter?
-AYW00077401 ___PLATEAU_STN________________ 1968 7 20 -86.1 (C)
-AYM00089606 ___VOSTOK_____________________ 1998 9 9 -85.6
-AYW00077401 ___PLATEAU_STN________________ 1968 7 19 -85.6
-AYM00089606 ___VOSTOK_____________________ 2005 8 8 -85.4
-AYM00089606 ___VOSTOK_____________________ 1998 9 10 -85.1
-AYW00077401 ___PLATEAU_STN________________ 1966 8 24 -85.0
-AYM00089606 ___VOSTOK_____________________ 1997 7 28 -84.6
*
” Australian Alps are getting a foot of snow. ”
Though the Australian Alps also are currently in winter, what about comparing them to the European Alps during their last winter?
Hintertuxer Gletscher 6.99 m
4-Berge-Skischaukel 5.90 m
Rittisberg 5.90 m
Kitzsteinhorn 5.80 m
Schmittenhöhe 5.80 m
Ski Arlberg 5.77 m
Weißsee 5.59 m
Mölltal 5.55 m
Ankogel 5.55 m
Mayrhofen 5.46 m
Sölden 5.42 m
*
The Mediterranean see experiences since a few years maximal temperatures up to 4 C above norm. You think it’s harmless don’t you?
**
But… Ken lives on his ultra-privileged Vancouver Island, light years away from any problem, and where it doesn’t warm even a little bit:
https://drive.google.com/file/d/1AOnVvwB9Hp3Maz_C4a6JIIz-QWzlGaip/view
UAH’s trends above Vancouver, in C / decade
– since 1979: 0.13
– since 2010: 0.54
*
The center of UAH’s grid cell, near Deerholme in your paradise:
https://tinyurl.com/UAH-LT-above-Vancouver
*
As visible on the chart, surface trends are nearly equal to UAH’s.
*
How can you appear so incredibly naive in public, Ken?
But… wait! The ever-biting dachshund Eben soon will come and free you :-))
It is Winter in the Southern Hemisphere.
“Did you not know yet that Antarctic currently is in full winter?”
It too forms part of the ‘global set’.
I’m not comparing snowfall in Australia to snowfall in Europe; I am finding the fact of a foot of snow anywhere in Australia to be remarkable and in contradiction of the climate narrative.
Vancouver Island is subject to global climate too … and as you point out isn’t experiencing the climate narrative either.
Wiki:
“Snow in Australia is rare at sea level, but is common on the highlands of the southeast, in the states of New South Wales, Victoria, Tasmania and in the Australian Capital Territory.”
The bark of this tree worn away shows how high the water was in Kerrville Texas
Justin Micheals
https://i.ibb.co/PstHYRxV/517626486-4093872410878504-5883848905317286498-n.jpg
SOLAR MINIMUM UPDATE
Donald considered pardoning Jeffrey Epstein’s co-conspirator during his first term after becoming “very wary” about what information she could reveal, according to journalist and Donald biographer Michael Wolff.
https://www.al.com/politics/2025/07/trump-considered-pardoning-epstein-accomplice-feared-what-she-could-reveal-biographer-claims.html
Willtard TDS update
https://youtu.be/r0O258Zomm4?t=904
Ark,
In your mind, are Republicans the only ones ideologically driven wrt climate?
I can assure you not:
https://tamino.wordpress.com/2014/05/28/yesallwomen/
https://tamino.wordpress.com/2020/06/04/step-1-trump-has-got-to-go/
Who do you think I think I am?
I’m a Republican, an Eisenhower Republican.
My mistake. I had you down as a solid liberal. No judgment there. I have a friend who is a full on socialist, hates capitalism, and we still manage to find overlap in our views. Same with some of my conservative friends.
But weren’t you a little young during the Eisenhower years?
Eisenhower Republican-LOL.
“Modern Republicanism was prominently articulated by President Dwight D. Eisenhower during his administration from 1953 to 1961, where he sought to integrate conservative economic principles with social welfare measures.
This philosophy emphasized the importance of federal support for programs such as education, infrastructure, and healthcare while advocating for fiscal responsibility and limited government intervention.
Eisenhower’s leadership is marked by a commitment to maintaining a strong economy and military, with an emphasis on creating prosperity without excessive government control.
Modern Republicanism appealed to a broad range of Americans, positioning itself as a middle ground between traditional liberalism and conservatism during a time of economic expansion.
The impact of Modern Republicanism can be seen in the growth of the American middle class and the expansion of suburban life, which shaped American identity in the post-war era.”
https://library.fiveable.me/key-terms/apush/modern-republicanism
The other kinds of Republicans that come immediately to mind are Reaganites, neocons, libertarian (of various stripe), tea party, Christian right and MAGA.
Kudos for catching the symbolic meaning of my political value statement. It shows a good understanding of our history.
I would add the following clarifications.
Eisenhower Republicanism, as a political identity, is predicated on four governing principles:
1/ Moderation.
2/ Civic responsibility.
3/ Respect for democratic institutions.
4/ Rejection of ideological extremism.
In today’s hyperpartisan political environment, it aims to bridge divides and restore confidence in restrained, ethical governance, by endorsing five policy prescriptions:
1/ Balanced budgets.
2/ Infrastructure investment.
3/ Federal enforcement of constitutional rights.
4/ Multilateral foreign policy.
5/ Warning against undue influence of the military-industrial complex.
MAGAts deride Eisenhower Republicanism because it rejects their:
1/ Culture war rhetoric.
2/ Authoritarian populism.
3/ Deregulatory extremism.
4/ “Deep state” conspiracies.
It is a center-right, pragmatic position.
For the cult kids — a small example of the corruption of the Biden administration:
https://www.justice.gov/pardon/pardons-granted-president-joseph-biden-2021-2025
Don’t miss the Biden family and Fauci, just after the election.
And, that’s just the pardons. The clemencies were as bad.
BACK AT THE RANCH
Deputy FBI Director Dan Bongino is considering leaving his job after a heated confrontation with Attorney General Pam Bondi over his frustration with how the Justice Department has handled the Jeffrey Epstein files, according to a person who has spoken with Bongino and a source familiar with the interactions that Bongino and FBI Director Kash Patel have had with Bondi.
“Bongino is out of control furious,” the person who has spoken with the deputy FBI director said. “This destroyed his career. He’s threatening to quit and torch Pam unless she’s fired.”
https://www.nbcnews.com/politics/justice-department/dan-bongino-weighs-resigning-fbi-heated-confrontation-pam-bondi-epstei-rcna218388
A bit like Eboy.
In any event, we can predict that Donald will win!
Still possible thunderstorms in Texas.
https://i.ibb.co/4nZxZqqm/mimictpw-namer-latest.gif
https://i.ibb.co/ccs55qnL/archive-1-image.png
Test
Some (always the same of course) are always blind on the right eye.
https://www.justice.gov/pardon/clemency-grants-president-donald-j-trump-2025-present
Look especially at
https://www.whitehouse.gov/presidential-actions/2025/01/granting-pardons-and-commutation-of-sentences-for-certain-offenses-relating-to-the-events-at-or-near-the-united-states-capitol-on-january-6-2021/
and within the text:
(b) grant a full, complete and unconditional pardon to all other individuals convicted of offenses related to events that occurred at or near the United States Capitol on January 6, 2021
*
This is quite interesting considering that most of these people were criminals who threatened the foundations of US democracy.
Their anti-democratic threatening riot was later transformed by its instigator into a ‘day of love‘.
Not even a violent dictator like Pol Pot would have come up with such manipulation.
Yes Bindi, even Pol Pot would not have attempted the manipulation of you blog-clogging Leftists.
Got any answers to the simple physics problems?
Got a viable model of “orbiting without spin”?
Of course not. All you’ve got is your Leftism, and TDS. Other than that, you’ve got NOTHING.
Threatened the foundation of US Democracy-LOL. What threatens the foundation of US Democracy are leftists.
Very heavy rainfall during thunderstorm in Texas. Possible surge of water in rivers.
https://i.ibb.co/nqL6N5Z8/Screenshot-2025-07-13-07-33-44.png
A strong thunderstorm is approaching Kerr County.
Unusually heavy rainfall in Kerr County.https://i.ibb.co/MxJkzt7d/Screenshot-2025-07-13-16-19-15.png
SOLAR MINIMUM UPDATE
A Texas county devastated by deadly flooding earlier this month rejected federal funds in 2021 that could have helped install a flood warning system, with local officials and residents arguing they didn’t want to be “bought” by the Biden administration.
https://www.latintimes.com/flooded-texas-county-turned-down-funds-warning-system-biden-admin-2021-we-dont-want-bought-586628
Perfect win setup for Donald: MAGA can now harp that Captain Joe did nothing!
Even more so as the thunderstorms intensify at night.
Epsteingate.
IOW, MAGA Fell For It Again.
Epsteingate.
I’m starting to think all of Trump’s talk about protecting young women was insincere.
On the night of July 13-14, thunderstorms will again intensify in Texas.
Climate in real time. Its raining in Texas. Yippee.
Not sure why you’d think anyone would give a damn.
Read this and couldn’t stop laughing. They reference a millions of years long major volcanic event and then claim it’s the atmosphere particularly co2 that’s warming the surface bwahaha
https://tinyurl.com/bdb834ps
Funny that you missed the part about the heat persisting for millions of years after the volcanic activity ended.
My personal impression is that people like PhilJ belong to unconditional followers of Robertson’s brainless ideas according to which
– heat dissipates while moving up in the atmosphere, making energy balance between outer space and Earth a self-driving, internal process;
– IR emitted by Earth dissipates anyway as well within a few feet, making its contribution to the energy balance de facto irrelevant;
– CO2 anyway can’t contribute to a decrease of IR escape to space due to its sparcity.
*
Some of these Pseudoskeptic zombies are so dumb, ignorant and opinionated that they even guess scientists would believe that CO2’s tiny backradiation would ‘warm the planet’.
*
'Plus bête que ça, tu meurs', say the French Frogs in such hopeless cases.
Hello Nate,
Of course the heat persisted, until co2 in the mesosphere and h20 in the troposphere cooled the atmosphere to space for a very very long time…
All the while geothermal heating of the surface of course continued.
Handwaving PhilJ, not quantitative science. Why should the Earth takr millions of years to cool from volcanoes, while taking only thousands to cool from an interglacial to a glacial period?
Hello Nate,
Look up the Siberian Traps and you will see that this was no ordinary volcanic event, it lasted 2 million years…
It pumped a massive amount of gas and thermal energy into the atmosphere.
That life managed to survive at all is thanks to water cooling the surface tobthe atmosphere and the atmosphere to space
Sure. But still handwaving. No evidence or analysis to back up your claim.
Hello Nate,
When you say ‘sure’,
Does that mean you agree that h20 cools the surface to the atmosphere and the atmosphere to space?
Defund the climate racket
https://youtu.be/qtF0Bcp76iw
SOLAR MINIMUM UPDATE
Donald is getting ratioed on his social:
https://www.newsweek.com/donald-trump-jeffrey-epstein-truth-social-post-pam-bondi-2098351
WINNNNNNNNNNNNNING
The absent good, the bad and the ugly: Epstein and the Trump~ing boy
https://www.instagram.com/p/DMAycutsTlB/?utm_source=ig_embed
tell us you have TDS
without telling us you have TDS
TDS is a made up thing.
Winston Churchill had a bad case of HDS.
ALL people who accuse others on this blog of suffering from TDS are in fact the very same people who do not understand that they themselves are incurably suffering from TAS (i.e. the Trump Addiction Syndrome).
Dr. Drew Pinsky – TDS is a very pathological state
https://www.thegatewaypundit.com/2025/07/dr-drew-pinsky-offers-some-real-psychological-analysis/
Yeah there used to be HDS, an affliction of people who took issue with Hitler’s actions..
When everything leftist promote fail, – call up Hitler
So is that a historical fact, Nate?
The reason the cult kids are so upset is because Trump is so far ahead of them. He’s already solved a problem and gone on to the next one while the kids are still trying to understand what happened.
In their heads, he’s supposed to have destroyed USA about three times by now, but the country is recovering so fast from the destruction of the dims, that even foreign countries want to be on his side.
It’s fun to watch.
So far ahead he is that, during the FIFA World Cup ceremony, still in camera shot, Donald remained on stage, having planted himself in the centre of the moment.
And when being asked by the Chelsea team when he was going to leave, Donald, trophy in hand, did like Puffman did under over the years: he stayed and continued clapping with the players.
And then Donald stole the trophy!
A four-year old King, the perfect power symbol of cranks and troglodytes.
One of the greatest lessons in life ,is that even a fool is right sometimes, Winston Churchill, Dems like Socialists never learn.they have kleenex in their coffins.
On July 18, the hurricane will hit Louisiana at night. Precipitation will be very heavy.
https://i.ibb.co/j9wN7BHQ/ventusky-rain-3h-20250718t0600-29n91w-1.jpg
Climate in real time. Its going to be raining in Louisiana at night. Yippee.
Not sure why you’d think anyone would give a damn.
BACK AT THE RANCH
Although Republican lawmakers have claimed that funding reductions to Medicaid were aimed at trimming wasteful spending, a Congressional Budget Office (CBO) report from May found that the hundreds of billions of dollars in cuts to the program would undoubtedly result in millions of Americans losing health care coverage. Recent polling on the cuts also finds that a plurality of Americans, 42 percent, want spending for Medicaid to be increased, while only 17 percent approve of cuts to the program.
https://truthout.org/articles/dr-oz-tells-americans-who-are-concerned-with-medicaid-cuts-to-eat-less-cake/
Let Donald and Fox freaks eat carrot cake for you!
When the plebs find out they can vote for Cake and Circuses …
See Canada for how public health care fails mainly due to bureaucratic bloat and government tyranny. See BC Bill 36 for the resulting totalitarianism.
Contrarianism in real time. Troglodytes whining about taxes whence they were the richest generation the Earth ever had. Yippee.
Not sure why they’d think anyone would give a damn about their self-centeredness.
Epsteingate.
MAGA Apostle Dinesh D’Souza Tells the faithful It’s ‘Time to Move On’ From Epstein: ‘They Have Closed the Case.’
https://youtu.be/JIWr08Xq5aQ
binny…”My personal impression is that people like PhilJ belong to unconditional followers of Robertson’s brainless ideas according to which
– heat dissipates while moving up in the atmosphere, making energy balance between outer space and Earth a self-driving, internal process;
– IR emitted by Earth dissipates anyway as well within a few feet, making its contribution to the energy balance de facto irrelevant;
– CO2 anyway can’t contribute to a decrease of IR escape to space due to its sparcity”.
***
Your impressions are obviously misguided, based in pseudo-science.
I did not imply at any time that all surface heat is dissipated as heated air rises, I referred only to heat dissipated at the surface due to direct conduction to atmospheric molecules directly touching the surface. There are 10^28 such molecules touching the surface per square metre at any one time and that represents a lot of heat transfer directly to the atmosphere.
Those 10^28 molecules per square metre are 260 times more efficient at dissipating surface heat as proved by Shula via the Pirani gauge. Ergo, the energy balance devotees are seriously in error as to the importance of surface radiation, which is a minor player re dissipating surface heat. However, the energy budget theory is solely dependent on surface radiation, therefore in error.
It’s a no-brainer that molecules with a higher KE that expand into molecules with a lower KE and density, lose KE, which is heat. That naturally lost heat does not have to be radiated to space and helps keep the atmosphere warmer by retaining solar energy for some time.
Of course, some of the heat is dissipated by radiation, some dissipated by radiation directly to space and some (about 10% of all surface radiation) captured by CO2 and converted back to heat.
As I demonstrated, radiation is a seriously poor means of dissipating heat as proved by a cherry-red 1500 watt electric stove ring radiating on a stove top. Neither the radiation nor convection can be sensed 4 feet from the surface. The same is obviously true in the atmosphere, making talk about CO2 absorp-tion more than a few feet above the surface a moot point.
Maybe Binny could amuse us by putting his hand within a few inches of a red-hot 1500 watt electric stove ring to determine how much heat is transferred by conduction and how much by radiation/convection. Then he could amuse us further by standing 4 feet away to see if he gets the same effect. If you can’t feel heat produced by radiation at 4 feet I doubt that CO2 will fare much better.
If CO2 works so well heating up via IR radiation, why does the amount in room air not warm the room? According to AGW theory, a 100 watt light bulb should be sufficient to heat a room and a 1500 watt stove ring should be adequate for keeping us toasty warm on a cold winter’s night.
This should not be confused with the frequencies given off in the IR band which can be detected at a distance. However, the intensity drops off with the inverse square of the distance and the intensity diminishes quickly.
Finally, CO2 has nothing to do with the escape of IR from the surface, which is governed by the temperature of all atmospheric molecules touching the surface. Normally, the temperature of those molecules and the surface would be in thermal equilibrium, producing little or no heat transfer. However, the heated molecules rise and are replaced by cooler molecules from aloft. By hotter and cooler molecules I am referring to their average kinetic energies.
philj…”They reference a millions of years long major volcanic event and then claim it’s the atmosphere particularly co2 that’s warming the surface bwahaha”
****
Even more ridiculous is so-called educated scientists referring to background microwave radiation in the universe as representing heat left over from the Big Bang. We could use heat that persists for several billion years.
Dementia watch: Trump confused about his uncle and the Unabomber. Pittsburgh, July 15, 2025.
President DonOld Trump delivered a rambling speech in Pittsburgh Tuesday, setting off alarm bells by telling ‘facts’ that were, at best, very unlikely to be true.
Trump invoked his late paternal uncle, Dr. John Trump, who he often describes as the “longest-serving professor” to ever teach at the Massachusetts Institute of Technology even though the noted physicist did not achieve that distinction. ‘Uncle John’ died in 1985.
Trump also claimed that one of Dr. Trump’s students was Theodore Kaczynski, a University of California at Berkeley professor of mathematics who became widely known as the Unabomber when he was arrested in 1996 for a decades-long string of letter bomb attacks on figures in higher education and other industries.
Kaczynski’s undergraduate degree was from Harvard; he earned his Masters and Doctoral degrees in mathematics from the University of Michigan, never attended MIT.
https://youtu.be/te_JMBZ25oU
Hey, that is almost as good as Biden’s cannibal story.
Hardly.
Trump’s “uncle John” died in 1985. The unabomber’s identity was unknown until 1996. Clearly another Trump lie.
Joe Biden suggesting his uncle, 2nd Lt. Ambrose J. Finnegan Jr.,
may have been eaten by cannibals after his plane crashed near New Guinea during World War II is more plausibly attributed to misremembering or exaggerating, rather than deliberate deception. “Uncle Finnegan’s” body was never recovered.
One of these things is not like the other.
test
Certainly no better than Donald whining about the guy who nominated Jerome Powell.
Forgetting it was him.
WIN!
Was searching way upthread for a comment this morning, and found this comment from “F. Forfang”:
https://www.drroyspencer.com/2025/07/uah-v6-1-global-temperature-update-for-june-2025-0-48-deg-c/#comment-1707724
Now, I’ve never seen F. Forfang comment before, so he may just be making an innocent mistake. I’m not accusing him of anything, but his comment needs to be addressed.
He appears to be somewhat confused, as his comment starts off quoting my exact words: The concept of “CO2 warming the planet” still has its followers, regardless of the fact that it can’t be supported from First Principles of physics.
Then he goes on to mention an experiment done by Dr. Spencer in a 12-year old post here. I found the 12-year old post:
https://www.drroyspencer.com/2013/05/a-simple-experiment-to-show-how-cool-objects-can-keep-warm-objects-warmer-still/
Note that nowhere in that post does Spencer mention CO2. NOT ONCE.
So Forfang has somehow misunderstood both my words and Dr. Spencer’s post. Then Forfang asks: I Wonder who is the child here? Where do you believe Roy Spencer is wrong in this article?
I never mentioned the article. So Forfang got it all confused and distorted. That’s Normal Operating Procedure for cultists, but maybe Forfang just doesn’t understand the basic physics.
Dr. Spencer’s experiment is exactly in line with established physics. A cold plate will cool a hot plate faster then if it were hot. That’s based on the cold plate being able to absorb photons better than a hot plate (less reflection).
“Dr. Spencer’s experiment is exactly in line with established physics. A cold plate will cool a hot plate faster then if it were hot. That’s based on the cold plate being able to absorb photons better than a hot plate (less reflection).”
So your thesis is that reflectivity is determined by temperature?
I’d love to see a reputable, neutral reference for this. Like a standard physics text.
Where did I ever state that as my thesis, barry?
Why are you trying to misrepresent my words?
“That’s based on the cold plate being able to absorb photons better than a hot plate (less reflection).”
The inference is strong in this statement of yours that the hotter the plate, the more the reflection.
Care to clarify?
barry, you have NO interest in science. You’ve avoided the teaching examples. And, “inference” is NOT “understanding”.
You’re going to “infer” anything to avoid reality. I know how you cult kids work.
Grow up.
As you’ve just declined to clarify what you mean by:
“That’s based on the cold plate being able to absorb photons better than a hot plate (less reflection)”
Then the obvious reading is the one that we’re left with. You believe hotter plates are more reflective.
Why is it that skeptics don’t do straight answers? Is the slipperiness ego? Or dodginess?
Whatever the case, getting a straight answer is like pulling teeth.
Wrong barry, the reason I usually don’t waste time with you children is because you reject reality. But I have a little time to waste this morning:
As I’ve explained numerous times, infrared photon absorp.tion is based on wavelength compatibility. And that compatibility is based on the molecules, the photons, and the surface temperature. Your cult has taught you that ALL infrared is ALWAYS absorbed, and ALWAYS results in an increase in temperature. And, you’ve swallowed that without question. That’s why you end up having to believe ice can boil water!
You have no interest in science, or reality. You deal in insults and false accusations.
Grow up.
“Your cult has taught you that ALL infrared is ALWAYS absorbed, and ALWAYS results in an increase in temperature.”
Nonsense. Only theoretical blackbodies absorb all IR.
“compatibility is based on the molecules, the photons, and the surface temperature.”
What impact does surface temperature have an absorp.tivity? Please explain.
In eight years, barry hasn’t learned a thing. Even with the Green Plate Effect officially debunked!
I’ve learned that ‘skeptics’ prefer theatre to giving clear, straightforward answers to questions.
We’ve learned that you prefer to ask questions you already know the answer to, or questions where the only answer you’ll accept is “you’re right, barry”. Thankfully, I’ll never answer another one of your questions as long as I live.
Is child barry just now realizing a black body is imaginary? Even after all his years supporting the green plate nonsense?
Are we seeing some progress, or will soon backslide?
Gee, we thought DREMT wanted to shut down the GPE discussion in the previous article, after having run out of answers.
So naturally, here he wants to start it up again.
Has he discovered answers?
All answers already provided, argument won. Easy.
No answers then. Just more delusions of competence.
Pointless.
“Thankfully, I’ll never answer another one of your questions as long as I live.”
Yep that was already evident in the last discussion.
And yet you absurdly think that obstructionist approach ‘wins’ debates.
#2
All answers already provided, argument won. Easy.
“is based on wavelength compatibility. And that compatibility is based on the molecules, the photons, and the surface temperature”
So then, when our sun is moved further away, until its arriving flux is just less that what Earth emits, it cannot warm anymore, even if there were 6 of these suns.
Why does moving the sun farther away change the wavelengths of its light?
And if it doesn’t change its wavelengths, how is ‘wavelength compatibility’ affected?
It is a great mystery, and we are unlikely to have it explained.
Now, proceed with the insults.
So the question arose when Clint said:
“compatibility is based on the molecules, the photons, and the surface temperature.”
What impact does surface temperature have an absorp.tivity? Please explain.
As mentioned above, ‘skeptics’ are usually incapable of giving a clear straightforward answer to anything, and there followed this case in point.
The typical theatrics shortly followed.
“I’ll never answer another one of your questions as long as I live.”
It’s like talking to adolescents.
…and still, the GPE is debunked, which is all that really matters.
And as ever, when we poke holes in their arguments, ask for an explanation, we get none, no sound rationale.
Instead we just get insults, and declarations that they don’t need to answer our questions.
Apparently their beliefs are considered sacrosanct, and cannot be questioned.
“‘I’ll never answer another one of your questions as long as I live.’
It’s like talking to adolescents.”
Yep, we are dealing with a drama queen.
#2
…and still, the GPE is debunked, which is all that really matters.
Clearly DREMT continues to suffer from the delusion that if he posts LAST on a thread, then whatever he claims, no matter how absurd, must be true.
#3
…and still, the GPE is debunked, which is all that really matters.
Lets ask GoogleAI:
“Does the one who speaks last win the argument?”
“No, the person who speaks last in an argument does not automatically win. While having the last word might feel like a victory, it doesn’t necessarily mean the argument is won or that the point was effectively made. The “winner” is determined by the strength and persuasiveness of the arguments, not simply who spoke last.
Why the misconception?
Perception of Control:
Having the last word can give the impression of control or dominance in the situation.”
Yep.
Nate wants the last word, again.
#4
…and still, the GPE is debunked, which is all that really matters.
If we can set the theatrics aside, I quoted Clint:
“Dr. Spencer’s experiment is exactly in line with established physics. A cold plate will cool a hot plate faster then if it were hot. That’s based on the cold plate being able to absorb photons better than a hot plate (less reflection)”
And asked if he was saying that hotter plates are more reflective, as seems entirely the natural conclusion form this comment.
Instead of getting a straight answer, there followed days of utter nonsense. Amongst which Clint posted:
“compatibility is based on the molecules, the photons, and the surface temperature”
I asked: “What impact does surface temperature have an absorptivity? Please explain.”
Clint,
Will you please explain?
If you don’t, casual readers will see that you are am absolute fraud.
That’s the natural conclusion when people can’t answer a straight question.
Clint R will have no idea you are even still commenting up here, barry. Just more theatrics from you, appearing days after someone has left the thread.
Unless he is a child he will, like most people, search for his name in the thread and reply to any of the many threads he inhabits. I included his name in the post to make it accessible.
Note: you sniped here, uninvited. In future, please spare us your faux moral high ground, thanks. Not to mention you are completely wrong.
Note#2. I found your comment here easily, a few days later, as you did mine. If Clnt is somehow unable to do the same, that is not my fault, nor is it my interest to patronise or fool him. I simply reply. I don’t look at the date. Like you seem to do.
Yeah, he’s moved on down-thread, barry. Almost certainly won’t have even seen your response. Not saying that’s “right” or “wrong”, just confronting you with the reality, as usual. Personally, if I’m in a thread, I always check for responses. Doesn’t mean everybody else does.
Keep on trying to get that last word.
“Not saying that’s “right” or “wrong”
You characterised a late reply as “theatrics.”
You’re in here eye-gouging with others. Stop pretending you’re holier than anyone else.
And hey, weren’t you never going to respond to me again? I was looking forward to you ceasing stalking me.
barry, how is it that you misinterpret pretty much every single thing I say?
Also found this from child Nate:
https://www.drroyspencer.com/2025/07/uah-v6-1-global-temperature-update-for-june-2025-0-48-deg-c/#comment-1708075
Nate must be ashamed of his own polluting here, as he waited 4 days after I commented! He obviously didn’t want to get caught. But he can’t run from reality.
The CMBR’s spectrum wavenumber range is about 2 to 22 . But water doesn’t absorb below about 2800. Poor child Nate is probably confused about natural vs. manmade situations, again.
Good old Clint can always be relied on to screw up science facts.
“The peak wavelength of the cosmic microwave background (CMB) radiation is approximately 2 millimeters (mm). This corresponds to a frequency of about 160 GHz and a temperature of 2.725 Kelvin”
“Microwave ovens typically use electromagnetic radiation with a wavelength of approximately 12 centimeters (or 120 millimeters). This corresponds to a frequency of about 2.45 gigahertz (GHz).”
As we all know, water is heated efficiently in a microwave oven by abs.orbing it’s microwaves.
Child Nate is only 3 days late this time. But, he found more stuff on the Internet he can’t understand.
There is a SIGNIFICANT difference between “2 millimeters” and ” “12 centimeters”, when talking about photon wavelengths. Just as there is a SIGNIFICANT difference between the CMBR and a microwave oven.
Poor child, what will he try next?
You are hopelessly dim.
There are microwave abs.orption frequencies of water that are lower than those of the CMBR, OPPOSITE to your claim.
More insults and false claims from child Nate.
Yawn….
No rebuttal. Cuz you have none.
test
” Trump Administration Live Updates: President Says Epstein Critics Are Being Used by Democrats ”
Sure sure, Trump~ing boy.
The very first of them is (100% unintentional, don’t hurt him because he was clearly manipulated)… your number one supporter in the House, Mike Johnson in person.
*
I’m already enjoying the midterms – if they aren’t ‘accidentally’ removed from the political calendar, of course :–)
SOLAR MINIMUM UPDATE
Donald won a medal:
https://www.independent.co.uk/news/world/americas/us-politics/trump-winners-medal-fifa-club-world-cup-b2789441.html
OK, he might have stolen it.
But he still won, right?
WINNING!!!!
More from the Trump-Epstein swamp
“Idiots” who “play into the Democrats’ hands”: this is how Donald Trump described, on Wednesday, July 16, those in his camp who criticize his administration’s handling of the Epstein case, named after the American financier who died before being tried for sexual exploitation of minors.
*
The American president tried a new tactic to counter the controversy arising from a recent report published by the Department of Justice on the Epstein affair. Some of his partisan base criticize him for a lack of transparency.
“This whole thing is a complete hoax, orchestrated by the Democrats. And a few stupid, idiotic Republicans are falling for it,” he said when questioned about the Epstein affair in the Oval Office, where he was hosting the Crown Prince of Bahrain on Wednesday.
*
To Republicans who are questioning the White House line, Donald Trump launched Wednesday morning on his Truth Social platform that they were “former supporters who bought into this bullshit.”
“Let these wimps play into the Democrats’ hands (…) because I don’t want their support anymore!” he snarled. “They’re stupid,” the Republican president insisted at midday, speaking in the Oval Office.
Right now people with brown skin whose parents were born in the US are scared in their own country.
The masked goon squads snatching up farm workers and grocery store attendants without a warrant or identifying themselves are in the same category as the gestapo now. They don’t answer to the law, they just enforce a political directive.
And people are afraid of them whether they have a reason to be afraid or not, because we know they have collected US citizens, and people who are in the country legally, as well as undocumenteds. Not even bothering to prioritise the drug dealers and gang members, as promised.
Masked-up jackbooted thugs without showing warrants or ID, doing the government’s bidding and pissing on the constitution to boot. Blatant authoritarianism in the US is ringing a giant bell, to which a sizeable fraction of the country is deaf.
Never thought I’d see this happen in the US.
barry
I never thought it possible but right-wing media with constant lies and distortions creates radicals like stephen p anderson that do not know how to thonk anymore and just react. He sees the world in a very simplisic unthinking way. He is the “good guy” and everyone else is evil Marxists. He is okay with the excessive abuse of power by ICE because he thinks he is good and everyone wlse is evil. You can abuse people when you are radical and unthinking. He is okay with a Dictator as long as it is his side. Problem with Dictators is they may not always be on your side. Far better to have a system that limits power.
Norman,
Are you from here? I know Barry is from Australia, Willard from the UK. Where are you from? Australia is probably one of the toughest countries in the world to immigrate to. It is totally merit-based and Barry comes on here and preaches to us about how our immigration policy should be. That is a leftist.
Stephen p anderson
I was born and raised in Nebraska.
“Blatant authoritarianism”???
You children need to understand that an illegal alien is illegal.
Hey Puffman, riddle me this –
How can Donald pretend his administration has no lead on Epstein when we now know it had a file detailing 4,725 wire transfers and almost $1.1 billion flowing through just one of his banks, and hundreds of millions more through others?
Oh, and you might need to dust up your immigration law. You keep using the I-word incorrectly.
“You children need to understand that an illegal alien is illegal”
That kind of pap is exactly how atrocities are excused by useful idiots.
You just don’t realize – probably because you are white, or at least not hispanic – what is happening.
How do you turn a blind eye to warrantless incursions on private property, and agents of the US government failing to identify themselves, and even wearing masks?
The latino community now lives in fear. And because latino citizens and legal residents have been stopped in the street and even detained, sometimes for weeks, by unidentified masked thugs, an entire community now lives in fear, either for themselves or their relatives, that the government might snatch them up and take them away due to a lack of rigour and and an indiscriminate government quota of thousands of arrests a day.
Millions of people live in fear in the US because of a quasi secret police directed by a government who doesn’t believe in due process, who deports first and asks questions later.
You’re sleepwalking through it all, dreaming that mask-wearing authorities who don’t abide the law assiduously weed out the illegal criminals, and you are content to let the government decide who the criminals are.
barry, your fanaticism is well known here. You’re a child of the cult. You don’t know any science, and you have a severe case of TDS. Called anyone a “lying dog” today?
Stephen has also indicated your hypocrisy over immigration.
Grow up.
Barry, the Authoritarian Australian, preaches to us. We didn’t imprison people for speech or not wearing a mask. We allow poor people into our country, unlike Australia. You’re a phony and a propagandist.
You’re not even bothering to contradict what you know is happening. You’re content to let a secretive police force terrorise the latino communities in your country.
The courts are barely holding them off, leaving regular Americans to resist this federal thuggery in their workplaces, in their schools and in the streets.
Removing illegal aliens is not the issue, that’s well and good. It is the conduct of the US government through ICE that marks a sharp shift to authoritarianism, less and less fettered by law, encroaching not just on due process and individual rights, but also on the collective psyche of the targeted demographic, many of whom live in fear that they or their friends or relatives will be detained just because of the way they look, and even deported because the legal safety net for legal residents and citizens has been eroded.
Those waiting for the “collapse” of the stock markets and the economy in general, as predicted by the liberal media, must be very disappointed by now. The markets are up again today. Not even an out-of-control President can destroy the US economy.
Biden and the Democrats tried to do it with reckless government spending causing inflation to reach 9%. In fact, 2022 was a very bad year for the stock markets as Fed Chairman, Jay Powell, put the brakes on things.
Now that the adults are in charge “again”, we have a new problem. The economy is amazingly strong, but Trump insists on stirring things up with tariff threats and demands for lower interest rates. So we now have one the dumbest people in government, Trump, fighting against one of the smartest people in government, Jay Powell.
On Wednesday, rumors began to swirl that Trump was planning to use a clause in law that a Fed Chairman can be dismissed (Your Fired!) for poor performance. The markets started moving down. At the precise moment that Trump answered a reporters question saying he had no plans to fire Powell, the markets all shot back up with nice gains on the day. Stock investors and traders follow the news very closely. Life is good.
“The markets are up again today. Not even an out-of-control President can destroy the US economy.
Biden and the Democrats tried to do it…”
Tried to destroy the US economy.
Do you hear yourself? Please stop trying to pass yourself off as a neutral arbiter. The partisan shillery is shrill.
It seems that comments from barry are often more humorous than informative. For those who may be kind of slow, the strength of the US economy is our free market Capitalist system which is fully supported by the Republican Party. The Democrats support Socialism. This is why a growing number of Democrats are leaving the party to become independents, or just voting for Republicans such as Trump anyway. Trump carried the swing states with Democrat and independent voters. The Socialist candidate, Kamala Harris, lost.
Oh, here comes the argument, they do not want to control the means of production, so it is not Socialism. I could make a long list of all of the socialist programs supported by Democrats, but everyone including the Democrats who are paying attention know exactly what they are. The rest of you are not going to be convinced by any rational analysis.
For more fun, we now have an outright Communist winning the Democrat primary for NY City Mayor. He defeated the formerly popular Governor very easily. To be fair, the Luv-Gov aka Fast-Hands-Andy, does have some very serious baggage. Nonetheless, Mamdani has very strong support from AOC, Bernie, and others.
Have Fun!
Tim,
I understand you are required to parrot hyperbolic Far-Right talking points.
But having ‘social programs’ like Social Security and Medicare and Medicaid have strong bipartisan support.
I guess that makes Republicans ‘socialist’.
And NO, half the population, which regularly vote for Democrats, are not opposed to Capitalism.
“The markets are up again today”
Sure, they learned that Trump always backs down (TACO).
As has the rest of the world. Thus we notice all the ‘deals’ haven’t materialized.
Oops, it’s Trump Always Chickens Out.
In other news, at CNN, Bill Weir is at again. Except this time he made a very revealing comment while trying to be clever. On Wednesday, he said that the Trump administrated had “gutted” wind and solar programs “forcing” people to use the “more expensive” coal and natural gas. He was on a roll, but then he spilled the beans. He said that removing the “incentives” would make solar and wind more expensive. Did he really mean the subsidies, that make solar and wind only seem to be less expensive, because the government is paying for it? Whoops!
In still other news, stories are starting to emerge about heat pump noise issues keeping people awake at night because of the high noise output from the neighbors very loud compressor cycle. Socialism and the headlong panic to make everything electric does have its problems. You can expect this problem to get worse as more government agencies outlaw natural gas. The next problem will emerge as the 10 to 15 year life cycle of the compressor runs out due to mechanical wear. I predict that high demand will make these replacements more expensive as people are stuck with no other replacement options.
IDK why heat pumps would be any noisier than ACs.
https://youtu.be/88b9d5tWQoA?si=hw_h9aOF4RzQYseB
Our air source heat pump is not noisy at all, on the downside it is very expensive to run in winter.
The Heat Pump that the neighbor installed outside my bedroom measures 69dbC at the property line. There is no way to block the noise from being audible in habitable rooms in my house.
Unfortunately, my community has no heat pump noise bylaw (apparently the existing noise bylaw doesn’t apply and in any event is inadequate) So I have to figure out how to take the matter to court or move somewhere else.
City of Vancouver allows 55db (no weighting) at the property line during daytime and 45db during silent hours. ‘A’ weighting is inappropriate to measure low frequency noise that heat pumps generate.
Victoria Australia its illegal to run heat pump during silent hours.
FYI
“A 60 dB noise level is comparable to a normal conversation or the sound of a quiet office.”
Apparently the sound of normal conversation at a property line would be considered excessive in daytime Vancouver…
nate, You should try an experiment.
Run a tone generator in your bedroom at constant 80hz and 30db. 30db is WHO recommendation for night time ambient noise in residential areas. You can report on how well you sleep.
These days I regularly sleep with at least a fan noise. Also an air filter. No problem.
What evidence do you have that a hp produces sound comparable to a tone generator?
My experience with hp outdoor unit is the sound of white noise, like that of airflow through a fan.
I used a recorder to record the noise, both in and out of the house in order to show the source of the noise was the heat pump.
I used a spectrum analyzer to determine the frequencies produced by the heat pump.
The noise from a heat pump is tonal; just like that which is produced by a tone generator. It penetrates walls and ear defenders; very difficult to block due to the long wavelength characteristics.
Hmmm, that would be more irritating.
Appearently some brands are better than others
“I got a Gree Flexx. Not exactly a top tier unit by any standard. Sometimes it turns on…and I’m outside near it…and I can’t tell it turned on. I see someone else in this thread comment the same. I question sometimes if it’s just spinning the outside fan because no way it’s actually doing anything, but I go inside and it’s blowing warm air.”
“messenger of Allah” sent to save humanity from climate change.
https://www.ctvnews.ca/canada/article/ex-pilot-called-himself-messiah-on-climate-change-mission-day-before-alleged-hijack/
He’s gonna feel foolish when he realizes ‘climate change’ is just an extraordinary popular delusion.
Our Ivy Leaguer pompously appeals to adulthood because he has no real argument and can’t hide that Donald not only succeeded in bleeding the Murican public like no one has ever done before while imposing austerity measures that are as unprecedented as the current warming.
Meanwhile, ICE lawyers are hiding their names in immigration courts, and senators bought AI stocks while voting on its deregulation:
https://theintercept.com/2025/07/15/ice-lawyers-hiding-names-court
https://www.citizensforethics.org/reports-investigations/crew-investigations/four-senators-bought-ai-stock-while-senate-considered-deregulating-ai/
The unprecedented warming nonsense again,you can not prove that statement, there is an old saying,it is better to keep your mouth shut and look foolish, than to open it and remove any doubt.
not the unprecedented warming nonsense again , a statement you can not prove, as the old saying goes,it is better to keep ones mouth shut and appear foolish, than to open it and remove any doubt.
That Pure Denial trick again:
ipcc.ch
That would be like denying that renewables are killing o&g in the open markets:
https://www.theclimatebrink.com/p/how-renewables-are-saving-texans
Just like with the Epstein files, troglodytes ought to beware their wishes.
Willard loves his funny math.
Troglodyte enjoys his bootlicking.
No wonder he does not wonder what is on the Epstein files:
https://www.sfgate.com/sf-culture/article/i-wonder-why-trump-wont-release-epstein-files-20772363.php
Oil and gas are booming
Still above 3 bucks per gal on average, and nat gas still at +68% for the year.
How retrograde must a country be to still use imperial?
You are one insane Marxist.
Troglodyte rages on.
Meanwhile, an Allentown grandfather who was granted political asylum in 1987 after surviving torture at the hands of Chilean dictator Augusto Pinochet’s regime was disappeared by ICE. The family was then told he died. Now they learned that he’s actually alive, was deported, and is in a hospital in Guatemala.
Pinowho?
If that story were true, the innocent man would be entitled to multiple legal recourses resulting in millions of dollars in settlement. Not to mention numerous GOV agents being disciplined/fired.
That’s the difference between the US and “secretive police force”, “federal thuggery”, and “authoritarianism”.
Puffman likes to say stuff, including counterfactuals, which are as hypothetical as blackbodies.
The administration he defends knew that the vast majority of the immigrants they sent to a maximum-security prison in El Salvador had not been convicted of crimes in the United States before Donald labeled them as terrorists and deported them.
Trump, 79, Had Emergency Heart Tests Because of Swollen Legs.
You know things are bad when they finally can’t pretend Trump is the peak of human health anymore.
To admit he has any health problems at all despite being a 79 year old man who eats cheeseburgers every day is a significant change in status quo.
They’re definitely still bullsh!tting, but the fact they had to announce this is a sign things are likely much, much worse behind the scenes. This is one of those “Old Man” diseases, and I’m honestly shocked that they admitted to it.
The amount of inflammation around his legs indicates advanced stages of the decease, so there’s no way Trump and his doctors didn’t know about this condition for a long time.
https://www.yahoo.com/news/trump-79-had-emergency-heart-181135687.html
Ark is salivating that Trump might have a stroke.
Can we talk about the elephant in the room?
https://ibb.co/N2D9GqSd
I especially want to see Nate’s spin on this one as another shoe drops. And the hits just keep coming. If you thought the Durham report was shocking, this report is even better. Why do I think there is more coming? As I stated in another post, Obama was leading the conspiracy directly from the Oval Office, and everyone hasd a role to play. Susan Rice famously wrote that they went “by the book”. Will she now explain which book they were using.
https://nypost.com/2025/07/18/us-news/obama-admin-assessed-russia-played-no-role-in-2016-election-declassified-documents-show/
Director of National Intelligence (DNI) Tulsi Gabbard made public more than 100 pages of emails, memos and other records cataloguing what she called Obama officials’ “conspiracy to subvert President Trump’s 2016 victory.”
Both before and after Democrat Hillary Clinton’s loss, the US Intelligence Community assessed that Russia played no significant role influencing the election.
…
But those findings were suppressed after the FBI — led by Director James Comey — said it was going to “dissent” from the draft’s conclusions “based on some new guidance.”
Clapper then spearheaded an alternative intelligence report claiming the Kremlin orchestrated hackings of Democratic National Committee emails, thousands of which were later posted online by Wikileaks, and intervened in the presidential contest in favor of Trump.
…
Several officials — including CIA Director John Brennan, Secretary of State John Kerry, and FBI Deputy Director Andrew McCabe — met at the White House on Dec. 9, 2016, where Obama began “tasking” each to look into “Russia Election Meddling.”
…
The final product was a Jan. 7, 2017, Intelligence Community Assessment that “directly contradicted the IC assessments that were made throughout the previous six months,” according to Gabbard.
Earlier this month, CIA Director John Ratcliffe released a bombshell review of the 2016 assessment that concluded Clapper, Brennan and Comey deliberately corrupted it for “potential political motive[s].”
…
“The issue I am raising is not a partisan issue. It is one that concerns every American. The information we are releasing today clearly shows there was a treasonous conspiracy in 2016 committed by officials at the highest level of our government,” she said.
“Their goal was to subvert the will of the American people and enact what was essentially a years-long coup with the objective of trying to usurp the President from fulfilling the mandate bestowed upon him by the American people.”
“foreign adversaries do not have and will probably not obtain the capabilities to successfully execute widespread and undetected cyber attacks” on election infrastructure.”
” what Tulsi Gabbard called Obama officials’ ‘conspiracy to subvert President Trump’s 2016 victory.’
Wow, yet another Director of Intelligence Agencies speaking like a political attack dog.
Sorry this has nothing whatsoever to do with the attempts by Russian intel to influence the election, including hacking of Clinton emails.
And the Post is owned by Newscorp, you know company that Trump is suing for libel.
NY Post repeats what intelligence agencies under Obama concluded (or did not assess) back in 2016 – that Russia did not successfully change votes through cyber attacks.
But somehow this is spun into a revelation that the Obama administration suppressed the truth.
A nothingburger served up as a conspiracy by Dems to overturn the election.
Pathetic attempt to drum up controversy where there is none.
Do some research before you link to the partisan BS, please Tim. Saves others having to do it for you.
You gave the impression you are cautiously neutral. That turned out to be extreme misdirection, didn’t it?
Meanwhile ICE is the secret police in the US,ands you have nothing to say about this very real shift in power in the US towards authoritarianism.
If you cared about the US, you wouldn’t be soaking up partisan claptrap and fervently posting it in this backwater blog. You’d do something useful.
Nate you are beautiful. You took the bait, and barry is still clueless. Let’s keep our eyes on the ball. Yes, more than one thing can be true at the same time. The allegation is that the whole Obama management team fabricated a narrative based on the fake Dossier — a document they knew for certain was fake based on the input from the career managers with expert knowledge of trade craft.
Failure of the liberal media to run the story probably adds more credibility to it. If they could somehow discredit the story, they would. Many of them never did acknowledge that the Dossier is fake, but they did run it when it first came out. And what about those 51 intelligence officials and the claim that Hunter Biden’s lap top was Russian disinformation? They ran that story without any attempt to investigate or verify. Tony Bobulinski spent an hour with Tucker Carlson, but none of the other media tried to contact him.
Breaking News: The radical left wing liberal media is corrupt.
Wait, there is more:
https://www.foxnews.com/media/gabbard-claims-obamas-goal-russia-narrative-subvert-american-people
https://www.foxnews.com/opinion/gregg-jarrett-how-obama-cronies-created-trump-russia-hoax-what-happens-next
https://www.nytimes.com/2025/07/18/us/politics/gabbard-obama-trump-russia.html
https://www.cnn.com/2025/07/19/politics/gabbard-threatens-obama-officials-2016-election
http://www.newsnationnow.com/politics/gabbard-obama-russia-election-2016/
https://www.politico.com/news/2025/07/18/tulsi-gabbard-2016-election-investigation-00463779
Here is the report in full:
https://www.dni.gov/files/ODNI/documents/DIG/DIG-Declassified-Evidence-Obama-Subvert-President-Trump-2016-Victory-Election-July2025.pdf
It was a treasonous conspiracy. Obama is a Chicago thug. Biden, Clapper, Brennan, Comey, Clinton, and Rice were all involved. I think Clapper is going to sing like a bird.
From the Times link:
“Intelligence agencies and Senate investigators spent years reviewing the work, and concluded that during the 2016 election, the Russians conducted probing operations of election systems to see if they could change vote outcomes. While they extracted voter registration data in Illinois and Arizona, and probed in other states, there was no evidence that Moscow’s hackers attempted to actually change votes.
The Obama administration assessment never contended that Russian hackers manipulated votes.
Russia also conducted influence operations to change public opinion. That included using fake social media posts to sow division among Americans and leaking documents stolen from the Democratic National Committee to denigrate Hillary Clinton, the Democratic presidential nominee.”
Still looks like a nothingburger whipped into a somethingburger by a Trump sycophant.
Russia tried to influence the election. That’s not in doubt. Multiple investigations, partisan and bipartisan confirm. Didn’t successfully hack the electronic election system – no one said they did.
So we have an allegation with no meat on it. Sounds like more grist for Trump’s revenge mill.
If you’ve read all 114 pages of the DNI report, Tim, how about pointing to the smoking gun?
Tim, from NYT:
“Intelligence agencies and Senate investigators spent years reviewing the work, and concluded that during the 2016 election, the Russians conducted probing operations of election systems to see if they could change vote outcomes. While they extracted voter registration data in Illinois and Arizona, and probed in other states, there was no evidence that Moscow’s hackers attempted to actually change votes.
The Obama administration assessment never contended that Russian hackers manipulated votes.
Russia also conducted influence operations to change public opinion. That included using fake social media posts to sow division among Americans and leaking documents stolen from the Democratic National Committee to denigrate Hillary Clinton, the Democratic presidential nominee.
Multiple reviews, including a Republican-led Senate report, backed the findings of American spy agencies in late 2016 that Russia was trying to influence the election by damaging Ms. Clinton’s campaign and bolstering Mr. Trump.
Among the Republican senators on the Intelligence Committee that produced the various reports on Russian influence operations was Marco Rubio of Florida, now the secretary of state.”
“The new report by Ms. Gabbard’s staff conflates those two activities by the Russians and tries to suggest that the Obama administration forced the intelligence community to alter its conclusions.”
““This is one more example of the director of national intelligence trying to cook the books,” Mark Warner said. “We’re talking about apples and oranges. The Russians were not successful at manipulating our election infrastructure, nor did we say they were.”
Clearly Tulsa Gabbard has been tasked by Trump to revise history.
And folks such as yourself will not apply even a bit of skepticism.
Nate takes the bait again. I posted 7 different links including the almost humorous attempt by NYT to spin this issue around. The opinion of Mark Warner is presented to override the evidence in the report. Nate chose to ignore the factual reporting and focus on the spin from the Times. That is what politicians do — they spin.
The issue here is that the Obama team used the Dossier they knew for certain was fake to produce a fake intelligence assessment that Trump was suspected to be in collusion with Russia.
Here are excerpts from the report. This is from September 18, 2019. The names are withheld. It seems to be from one of the experienced managers with expert knowledge of trade craft explaining how they did not consider the “Dossier” in their work. Instead, it was inserted as an “unwanted sudden and unilateral act by then DIR FBI Comey, and as a source of concern to the DNI”. This individual is one of many sources to show that the Obama team overruled the career professionals to legitimize the Dossier for political reasons. It was previously reported in other reports that Comey attempted to ambush Trump with the Dossier to see if he could get a reaction from him.
Here it is from the report. The names are blanks that do not appear in the cut and paste. I have inserted asterisks:
[As you know, I was a Deputy on the NIO Cyber team, also the de-facto elections team, from 2015 through this year
At no point did [*] suggest that there was any analytically significant reporting that I was NOT seeing, with the exception of compartmented material (I asked repeatedly, because of analytic concerns I held regarding a KJ that remain unresolved to this
day.) At no point did I see or consider what I gather is, or was represented to be, ‘dossier’ materials.
I did hear second hand from [*] , ostensibly recounting words of then DNI Clapper, on the day of a briefing to current [then, I think, just elect] POTUS, about inclusion of dossier materials in a presentation to POTUS elect. This was characterized as an unexpected and unwanted sudden and unilateral act by then DIR FBI Comey, and as a source of concern to the DNI
To this day, I have never seen or reviewed dossier materials in a work setting. I did recently hear them referenced by two colleagues in terms consistent with the email below, which struck me as concerning and at odds with my personal experience working election issues during 2015-2017.
With that single, recent exception, other than the email below, at no time in my IC career has ‘dossier’ material ever been represented to me in a work setting as something the NIC viewed as credible, or that was influential in crafting NIC products.
Bottom line – though I am glad to have been spared exposure to the material, if it was influential, I hope it was in a compartment I am not in, because otherwise – given my 5 years of working these topics at PDB and ICA level, to include the TS//SCI version of what I believe to be the ICA referenced – we may have a different information issue]
“The opinion of Mark Warner is presented to override the evidence in the report. Nate chose to ignore the factual reporting and focus on the spin from the Times. That is what politicians do — they spin.”
While you ignore that the Republican led Senate committee investigation contradicts her claims.
You can’t ignore facts just because they are reported by the NYT, or stated by a Democrat.
C’mon Nate. Everyone reading this has reading proficiency and most of them are intelligent with a few notable exceptions. Who are you trying to fool?
Read the report! My quotes came directly from the report. A very senior official with expert knowledge of trade craft was shocked — shocked it tell you — to find out the Dossier was actually used in the ICA:
“To this day, I have never seen or reviewed dossier materials in a work setting. I did recently hear them referenced by two colleagues in terms consistent with the email below, which struck me as concerning and at odds with my personal experience working election issues during 2015-2017.”
Clapper is going to sing like a bird.
“Read the report!”
Why don’t you read all the prior reports from R led Senate, Durham, and Mueller, that contradict this one?
And why don’t you notice that it is based on a strawman: that the Obama team were telling the public that the Russians had compromised voting systems.
And why don’t you notice
the hyper-partisan nature of the talking points summarizing this ‘report’ from Intel directors?
That should heighten your skepticism.
Why do you not understand that this cabinet was built to seek political retribution?
Poor Nate! He seems to be suffering and is sounding more like barry. By his logic, if the old reports are different than the new reports, that include recently declassified material, we should just pretend the new information does not exist. He dares people to read the report in hopes that nobody will do it. This is Democrat logic at its best.
You have an endless appetite for faux red meat, Tim.
“recently declassified material”
which the Senate Intel Comm. had access to.
But they didn’t try to erect and then knock down a strawman, as Gabbard does.
When are you going to deal honestly with the fundamental flaws in her narrative?
Nate is lying again. It gets worse. If you can find any language in any report including Horowitz, Durham, The House, or The Senate, that Comey, Brennan, and Clapper overruled the subject-matter-expert senior professionals to include Dossier content in the ICA, then bring it on. Otherwise, this is new information and it is the smoking documentation of the Obama administration conspiracy.
The criminal defense will be the same one available to Comey and McCabe concerning the fake FISA applications with the famous 17 “unexplained” errors. They could not prove intent, and stupidity is not a crime.
On the topic of reports, Adam Shifty Schiff released a fake report as House Minority Leader claiming the Dossier content could prove collusion with Russia. Here is how that ended:
https://www.congress.gov/bill/118th-congress/house-resolution/521/text
Breaking News:
The Office of President Barack Obama has issued a statement that completely aligns with Nate’s talking points, but strangely makes no mention of the Dossier. Hmmmm
They clearly want people to keep their eyes on the shiny object and ignore the Dossier material that led to Mueller. Follow the tale of Hillary’s Dossier to find the conspiracy that was openly discussed and plotted in the Oval Office with Obama leading the discussion.
Only gullible MAGA people have trouble seeing what is happening here.
First there was a release of FBI files on…no NOT Epstein, but MLK.
Then:
“President Trump, under fire over his administration’s handling of the Epstein files, escalated his distract-and-deflect strategy on Tuesday, accusing former President Barack Obama of treason and declaring, “It’s time to go after people.”
Speaking to reporters in the Oval Office, Mr. Trump condemned questions about the disgraced financier Jeffrey Epstein as “sort of a witch hunt,” and then launched into a rant against a now-familiar string of rivals and the media.”
“The issue here is that the Obama team used the Dossier they knew for certain was fake”
FALSE they knew it was uncorroborated raw intelligence.
It was not FAKE.
“to produce a fake intelligence assessment that Trump was suspected to be in collusion with Russia.”
FALSE. The intelligence assessment found, independent of the dossier, that Russia was trying to influence the election in Trumps favor.
The assessment also found that Trump campaign officials DID meet with Russian Intel operatives, including Don Jr.
Fact: The Dossier was clearly identified by the expert professionals as a fake series of reports intended to look like progress reports.
Fact: None of the professionals approved of its use — none.
Fact: The only way that the Dossier was included in any government work product was that Comey, Clapper, and Brennan overruled the expert professionals and directly instructed them to use it.
Fact: The Mueller investigation was based primarily on the Dossier.
Fact: Obama knew about it and was involved in the release of fake information, which Susan Rice claims was “by the book”.
I almost forgot to mention that the Trump Tower meeting was a setup. It is just one more bit of sleaze linked to Hillary.
https://nypost.com/2017/11/07/firm-behind-trump-dossier-met-with-russian-lawyer-involved-in-trump-jr-meeting/
https://www.foxnews.com/politics/fusion-gps-official-met-with-russian-operative-before-and-after-trump-jr-sit-down
https://www.nbcnews.com/news/us-news/trump-dossier-firm-also-supplied-info-used-meeting-russians-trump-n819526
Glenn Simpson, a former Wall Street Journal reporter and co-founder of Fusion GPS, was with Russian lawyer Natalia Veselnitskaya at a Manhattan federal courtroom just hours before the Trump Tower meeting on June 9, 2016, Fox News reported, citing a source. He met with her again after the meeting, the report said.
Veselnitskaya, promising “dirt” on Hillary Clinton, met with Donald Trump Jr. and other campaign operatives – including Jared Kushner and former campaign manager Paul Manafort. Trump Jr. later said the discussion was about Russian adoptions.
But the meeting took place at a critical time when Fusion GPS was being paid by a Russian oligarch and by the Clinton campaign and the Democratic National Committee while it enlisted former British spy Christopher Steele to dig up damaging information about Trump through his contacts in Moscow, Fox News said.
From the 2020 Senate Select Committee on Intelligence Report on Russian Interference in the 2016 US Elections:
“The information that Natalia Veselnitskaya, the Russian lawyer, offered during the [Trump Tower] June 9, 2016 meeting, and planned to offer again at the follow up meeting requested by Aras Agalarov, was part of a broader influence targeting the United States that was coordinated, at least in part, with elements of the Russian government. That Russian effort was focused on U.S. sanctions against Russia. Some of the same information used by Veselnitskaya at the meeting was also used [redacted]
The Committee found no evidence that the meeting participants from the Campaign were aware of this Russian influence operation when
accepting the meeting or participating in it. Participants on both sides of the meeting were ultimately disappointed with how it transpired.
The Committee assesses that at least two participants in the June 9, 2016 meeting, Veselnitskaya and Rinat Akhmetshin, have significant connections to the Russian government, including the Russian intelligence services. Those connections, particularly regarding Veselnitskaya, were far more extensive and concerning than what had been publicly known, and neither Veselnitskaya nor Akhmetshin were forthcoming with the Committee regarding those
connections. Both Veselnitskaya and Akhmetshin may have sought, in some cases, to obfuscate the true intent of their work in the United States.”
https://www.intelligence.senate.gov/wp-content/uploads/2024/08/sites-default-files-documents-report-volume5.pdf
Tim, your links above are from 2017, 3 years previous to the Select Committee Report, when speculation was broader than knowledge.
My question to you is:
Did you get these 8 year old news reports out of a partisan article that doesn’t want you to know what was learned in the years since, or is it your own partisan filter that is guiding you to out of date news?
“I almost forgot to mention that the Trump Tower meeting was a setup. It is just one more bit of sleaze linked to Hillary.”
Proving once and for all that you are extremely gullible, Tim, and willing to accept any conspiracy theory about lib-tards.
You ignore the main point, that Don Jr. willingly took the meeting hoping to receive good dirt from Russian Intel.
None of this from the ‘fake’ Dossier.
Also, simply adding FACT in front of Right-wing talking points, does not transform propaganda into an actual fact.
EG:
“Fact: The Mueller investigation was based primarily on the Dossier.”
“Fact: The Dossier was clearly identified by the expert professionals as a fake series of reports intended to look like progress reports”
Show us the evidence from a legit non-partisan source.
Re: the Radcliffe CIA review:
“A C.I.A. review of its assessment of Russian interference in the 2016 election criticized the agency’s leadership at the time for rushing the effort but DID NOT dispute the conclusion that Russia favored the election of Donald J. Trump.”
NYT.
Then
BTW,
This sounds quite similar to your accusations:
”
Thirty-five days before the November 2020 election, Ratcliffe declassified 2016 Russian disinformation that asserted Hillary Clinton had personally approved a scheme to associate Trump with Vladimir Putin and Russian hacking of the Democratic National Committee. Ratcliffe provided the disinformation to Senate Judiciary Committee chairman Lindsey Graham, who publicly released it. The allegation had been previously rejected as baseless by the Republican-controlled Senate Intelligence Committee. Ratcliffe acknowledged in a letter to Graham that the intelligence community “does not know the accuracy of this allegation or the extent to which the Russian intelligence analysis may reflect exaggeration or fabrication.”[82] The intelligence community opposed the release of the information”
with one difference. It came from Trumps DNI Radcliffe.
And now we know why Trump has been escalating his distract-and-deflect strategy.
-Telling his supporters who demanded that the Epstein files to be released to stop being stupid.
-Releasing FBI files on MLK.
-Feinting a release of Grand jury testimony.
-Accusing Obama and his people of Treason.
We now know that he was told by his Attorney General that HE was mentioned in the Epstein files.
Thus after months of DOJ and FBI barreling ahead, fanning expectations that the Epstein files would soon be released, they suddenly slammed the brakes, and stated that they would not be released. There was nothing of value to see in them.
Now we know why.
SOLAR MINIMUM UPDATE
Donald’s Bellicose Bill includes several provisions expanding federal subsidies and tax benefits for the oil and gas industry.
https://neworleanscitybusiness.com/blog/2025/07/14/trump-oil-gas-subsidies-leasing-bill/
As our pompous Ivy Leaguer might say, oups.
Pity our climate obsessed UK government didnt do that, but its much easier to waste billions on green subsidies that achieve nothing.
Ian rediscovers the third step of the Contrarian three-step — Saying Stuff.
Obliviously ignoring that, last year, renewables accounted for 51% of the UK’s electricity mix, with wind power as the largest source at 30%.
What did UK use for lighting before candles?
Electricity from coal fired generators.
I hope you guys make it to 100%. I’m cheering for you.
Kennui misses whale oil, and Troglodyte still thinks I’m from the UK-ROFL.
Either the UK or North Korea.
Ian Brown
” … waste billions on green subsidies that achieve nothing. ”
*
You are just as competent on energy as you are on climate: that is, on the level of e.g. Robertson, Clint R, Anderson, and Ken, i.e. zero point zero.
*
Here is, from Germoney where I live since nearly 50 years, a good example for your ‘achieve nothing’.
This below is the public net electricity generation in Germany in half year 1 2025:
https://www.energy-charts.info/charts/energy_pie/chart.htm?l=en&c=DE&interval=halfyear&halfyear=1
– ‘Net’ means that the total internal energy consumption of each sector has been subtracted from the numbers presented in the chart.
– ‘Public’ means that only the electricity fed into the public grid by private, commercial or industrial solar or wind energy systems is included, but not the unquantifiable share of this electricity for self-consumption (for example, 70% of 10 KWh/year in our neighbor’s home).
*
This table shows you from where Germoney started 35 years ago:
https://drive.google.com/file/d/1hFBj50Gw58Vl0wuxZ9M7eGpjd_cL8MbT/view
*
Anyone having a working brain knows and understands that this would never have been reached without subsidies. But all of them understand also that without absolutely immense subsidies paid until now and in the future by the population
– the nuclear electricity sector never would have even existed
– nor could the incredible amount of low resp. high radioactive waste generated by this sector (currently used fuel rods, future plants’ primary circuit dismantling) ever be processed (maybe that will even never happen).
*
By the way: if the German chancellors in power since 2007 (Merkel, Scholz) had understood ‘governing’ not to mean ‘wait and see’ but ‘acting’, we would currently have 20% offshore wind power instead of 5%, and the dirty lignite-fired power plants that destroyed entire villages in the past would all have been shut down long ago.
Re. July 21, 2025 at 9:31 AM
1. ” (for example, 70% of 10 KWh/year in our neighbor’s home). ”
should of course read
” (for example, 70% of 10,000 KWh/year in our neighbor’s home). ”
2. In the chart
https://www.energy-charts.info/charts/energy_pie/chart.htm?l=en&c=DE&interval=halfyear&halfyear=1
the numbers were not written in English format.
Thus, 214.154 GWh should of course read 214,154 GWh
Bindi, as predicted, you ran from the simple problem I provided. You don’t have a viable model of orbiting without spin. You don’t have ANY science.
All you’ve got is your obsession with me, likely based on jealousy and hatred. You can’t show any place I’ve got physics wrong.
Keep proving me right, I can take it.
Bindidon … how much are you paying for electricity (per kwh)and how much of your taxes goes to subsidize industry that otherwise cannot compete due to high energy costs?
Is Lengsfeld, the guy in this video wrong? ‘Climate Euphoria, Climate Hysteria: Insights from the German Political-Media Complex’ https://www.youtube.com/watch?v=euk2vgAZDTk
Hey Puffman, riddle me this –
How can Binny be stalking you when you are replying to him in my thread?
Ken
We pay 0.35 to 0.43 €/KWh which includes in the latter case
– Electricity-related taxes and duties 0.05
– Grid charges 0.12
– Procurement and distribution 0.19
– VAT 0.07
Not sufficiently contained at all in this price: nuclear waste processing and final secured disposal! That will have to be paid by our children, grand-children etc.
–
The toxic waste from wind turbine and solar equipment is going to cost a LOT more to deal with than nuclear waste.
“The toxic waste from wind turbine and solar equipment is going to cost a LOT more to deal with than nuclear waste.”
Absurd.
BTW, no one has any plan for nuclear waste disposal. No state will accept nuclear waste for long term storage. It is just piling up at the power plants, and projected to remain radioactive for thousands of years, much longer than these power plants can operate.
A few minutes of search yeilds the following
-Globally, around 270,000 tonnes of used nuclear fuel are currently in storage, mostly at reactor sites.
-Solar panels can contain heavy metals like lead, silver, cadmium, and arsenic, some of which are classified as hazardous waste.
-The U.S. Environmental Protection Agency projects that the U.S. could have as much as one million total tons of solar panel waste by 2030. Globally, waste is projected to reach 78 million metric tons by 2050.
Nuclear waste is a much smaller problem than ‘green’ energy toxic waste.
https://www.epa.gov/hw/end-life-solar-panels-regulations-and-management
“Crystalline-silicon solar PV represents over 95 percent of solar panels sold today. This type of panel contains solar cells made from a crystal silicon structure. These solar panels typically contain small amounts of valuable metals embedded within the panel, including silver and copper. Crystalline-silicon solar panels are efficient, low cost, and have long lifetimes, with modules expected to last for 25 years or longer.”
Willard, UK subsidies for fossil fuels are almost zero,compared with the billions in other parts of the world, not difficult to increase wind and solar out put if you shut down other sources of generation., we are approaching a future of energy production no one wanted or can afford.now the wise energy secretary suggests spending billions on fusion plant infrastructure when no such workable unit exists,,even if in decades to come one was up and running , the financial cost would be huge, never mind the possible environmental dangers.the lie that it will be free energy is the same lie we were told about fission. and renewables. Genies are always green.
Ian Brown
” the lie that it will be free energy is the same lie we were told about fission. and renewables. ”
No idea what you understand with ‘free energy’, let alone how you can put aside nuclear – be it fission or fusion based – and renewables in this context.
Everything has a cost, especially getting out of a societal model implying burning of fossile stuff with all its environmental consequences, see China.
Your choice, however.
same old silly argument that ignores the fact that fossil fuels have saved the lives of millions of people , and taken millions more out of poverty,the negatives are a drop in the bucket compared to the positives, now we have the ban plastics brigade,but none of them will pick dog poo up with their bare hands.
No one ignores that fossil fuels have saved the lives of millions of people and lifted millions more out of poverty.
You are the one who deliberately ignores the fact that we will experience the exact opposite in the coming decades.
And I’m deliberately not talking about CO2 here, but exclusively about the pollutants that can be expected from a certainly very sharp increase in the combustion of fossil fuels till 2100 if we don’t care.
You give the impression of being so privileged that you don’t even need to consider this.
-No one ignores that fossil fuels have saved the lives of millions of people and lifted millions more out of poverty.-
Well, there has to be some awareness in order to ignore anything.
Perhaps many assume kittens have saved far more human lives than fossil fuels.
Perhaps going for “but there are no fossil fuel subsidies” to “but fossil fuel saves lives” does not require any awareness either.
The first is an outright lie while the second lies by attribution.
Fossil Fuels is 200:1 Benefit Cost Ratio
US South Slavery was 15:1 and this ignores the tragically negative social cost of slavery.
There are no cost benefit numbers available for ‘green’. If you try to find information all you get is a load of gobbledegook about climate change narrative that has no basis in science.
Fossil fuels have ended famine, lifted billions out of grinding poverty, doubled life spans, caused human population to soar to 8 billion.
Yeah the net outcome is that fossil fuels save lives.
Fossil fuels are far too important to be burnt mindlessly. We will need plastics and fertilizers for a long while. And we can make most of this production carbon neutral if we properly take their externalities into account. To subsidize the most profitable industry of the 21st century is completely mad.
Besides, there are four times more slaves (whose abolishment is uncorrelated to fossil fuel consumption) today than there ever has been in the history of the Best Country in the World:
https://www.un.org/en/delegate/50-million-people-modern-slavery-un-report
Most of slavery today is sexual slavery.
Their efforts are not going to economic benefit as South USA cotton pickers did.
You’re comparing oranges to elefant poop. And you won’t pick that up without a plastic bag.
Perhaps Kennui missed that bit:
> 28 million in forced labour and 22 million in forced marriages
He could have saved himself from saying stuff.
https://ozonewatch.gsfc.nasa.gov/
Should be an interesting season.
I suspect that as co2 increases at the menopause more infalling O will result and add to ozone production
Here is what is going to happen in next 2 months.
Arctic Sea ice to have a very slow fall.
La Niña mentions in the press to become headline news as it rapidly becomes inevitable.
Global temperatures to begin start of a steady fall for next 2years.
Philly 76s to go top 8 when the season recommences.
Willard to give back the large tax cuts Trump instituted in 2017 and just kept going.
NB I usually get 1 out of 5 wrong this time it might be 2.
angech
Anyone looking at your 5 guesses won’t wonder why you are so successful: maybe it’s due to their superficiality?
*
” Arctic Sea ice to have a very slow fall. ”
*
What exactly do you mean with your ‘very slow‘ ?
Here are superpositions of daily Arctic sea ice extent for some years and periods – in absolute and anomaly form:
Absolute
https://drive.google.com/file/d/1J9kx750_CtARv4sKfXBddRnkZm3E2U4v/view
Anomalies wrt the mean of 1981-2010
https://drive.google.com/file/d/1QBlh325tHF-4NRlWsHf_6sgskO_ipyse/view?usp=drive_link
*
Feel free to give us numbers instead of vague assertions.
*
And… by the way: why always talking about the Arctic?
What about ‘Global’ ?
Absolute
https://drive.google.com/file/d/1IcDTCs6ywcbg_iIAwe-xhEJMm2iT3fn9/view
Anomalies wrt the mean of 1981-2010
https://drive.google.com/file/d/1DnrnCfQjICj21o1gOeFMbMI1xsF0nZoj/view
*
Tell us all you think!
Clown.
As usual, instead of giving a technically relevant contradiction to a 100% correct presentation of NOAA’s sea ice data:
https://masie_web.apps.nsidc.org/pub/DATASETS/NOAA/G02135/north/daily/data/
and
https://masie_web.apps.nsidc.org/pub/DATASETS/NOAA/G02135/south/daily/data/
Walter R. Hog~l~e resorts to a laughable insult.
As usual, instead of giving a technically relevant contradiction to a 100% correct presentation of NOAA’s daily sea ice data:
https://masie_web.apps.nsidc.org/pub/DATASETS/NOAA/G02135/north/daily/data/
and
https://masie_web.apps.nsidc.org/pub/DATASETS/NOAA/G02135/south/daily/data/
Mr. Hog~l~e aka ‘red krokodile’ resorts to a poor, ridiculous insult.
Epsteingate.
Epsteingate is an odd matter to present a crisis for Trump. Despite the smoke that surrounds it, it has yet to yield a concrete allegation of misconduct by Trump, aside from charges of rank hypocrisy and demagoguery.
It appears objectively far less significant than Russiagate, Ukraingate, the classified documents scandal, or the January 6 insurrection. Yet his conduct amid the latest flare-up suggests a fear that something damaging may yet emerge.
The sweet irony is that the most reliable way to ensure it does emerge is to sue a newspaper over a document he likely knows to be genuine.
He baits them right into it. Another easy $15 million.
Anyone with more than 50 IQ points, and not sexually intimate with their cousin, knows that it is generally a bad idea -a really bad idea- to sue people for libel over allegations you know to be true.
This is over the heads of cult kids:
https://www.youtube.com/watch?v=TtJlvBaBWUA
For responsible adults, enjoy.
Yeah. Sure.
SOLAR MINIMUM UPDATE
Sen. Lisa Murkowski said she feels “cheated” after she won a concession in the recently passed tax and spending law to protect wind and solar projects, only to see the president and his administration issue recent orders that she said seem designed to quickly quash such projects.
https://www.adn.com/business-economy/energy/2025/07/18/sen-murkowski-feeling-cheated-by-trump-actions-against-wind-and-solar-says-shell-go-to-bat-for-alaska-projects/
Another great win for Donald!!!!!
My friend put solar panels on his store. He has a readout on a screen that continuously shows his daily energy savings. I was sitting drinking coffee one morning, and he walked by and struck up a conversation. I remarked about all the savings from the solar panels. He laughed and said they would never pay for themselves and that he only did it as a marketing gimmick. I asked him, even with the subsidies? He said no, not even with the subsidies.
The only reason TVA power is still relatively cheap is that it has coal-burning plants. Burn baby burn.
Macro Evolution and AGW are the two biggest modern scams perpetrated on the public.
“I asked him, even with the subsidies? He said no, not even with the subsidies.”
Gee, a random guy said something. He must be right…
Nate,
If a solar panel system costs $20K to install and your energy savings are $2k per year, how long to pay it back?
STEPHEN: “The only reason TVA power is still relatively cheap is that it has coal-burning plants. Burn baby burn.”
TVA: “As the industry evolves, we’re reducing our reliance on coal, conducting evaluations on our aging coal fleet to inform long-term planning for the future. This includes expanding our natural gas fleet to provide the ongoing flexibility needed to reliably integrate more renewables. At this time, natural gas is the best overall solution to provide low-cost, reliable, and cleaner energy to the TVA power system as we look into retiring the coal fleet by the mid-2030s. It’s a natural evolution—one that fits with our historic mission of providing reliable, low-cost energy that makes life better for the people we serve.”
https://www.tva.com/energy/our-power-system
“If a solar panel system costs $20K to install and your energy savings are $2k per year, how long to pay it back?”
Well 10 y, with no subsidy.
Let’s say you took out a 20 y home equity loan to pay for it, at current rate 6%.
The monthly payment on this is $143.
While earning $2000/12 =$167/mo.
So yeah it pays for itself, without subsidies.
Is that leftist propagandist math?
The usual non-rebuttal plus ad-hom.
Over 10 years, the ROI would be negative. Not a good investment. This doesn’t include opportunity costs.
Negative ROI-LOL.
Do you need help with the math, Willard?
“Over 10 years, the ROI would be negative. Not a good investment. This doesn’t include opportunity costs.”
Wrong, as I showed, there is a ROI every month over the life of the panels without subsidy. Not even accounting for inflationary increases in electricity price.
With subsidy, even better.
Your math is as bad as it always is.
Troglodyte soldiers on, unconcerned by the facts that solar panels still have value when installed, and in fact should be amortized over 25 years, at least if we trust the industry’s warranties. Just wait till he realizes that Tennessee’s energy bills increase over the years, and that 6% is a full 2% over what he could get would he live in a country with proper banks!
Let’s cheer him up with the breaking news of a Tennessee doctor who just denied prenatal care to an unmarried woman:
https://www.tennessean.com/story/news/health/2025/07/23/tennessee-medical-ethics-defense-act-denied-prenatal-care-unmarried-woman/85308870007/
If you can find some panels that will last 25 years then OK, you won’t lose money. I’d rather put the $20K in an annuity for 25 years. You’ll make three times as much on your investment.
“I’d rather put the $20K in an annuity for 25 years. You’ll make three times as much on your investment.”
You do that.
In the case of solar panels people feel they are buying a product that has benefits beyond $ returned.
Troglodyte does not know the standards of the industry he denigrates:
“The typical solar array pays for itself in around 11 years and provides energy savings of more than $31,513 over the following 14 years of expected panel life.”
https://www.ecowatch.com/solar/solar-panel-warranty
Suppose he invested 20K in SO instead of buying solar panels. The stock was around 45 in 2015. It now is 90. This investment doubled since then. But he paid 2K more per year during that decade. *That* is a 0% ROI! It may even be a negative one if he has to pay more in taxes selling his shares than the 3% dividend he got.
Buying some SPY would have been better, of course. He’d be tripling his money. Still, compare hodling 60K in stocks versus having paid 20K in energy bills and holding 10-years old solar panels working at around 90%. And he could not deduct his investment from his income. First year could be 10K, second year 5K, etc:
https://taxtool.ca/tax-implications-of-renewable-energy-investments/#Taxation_of_Renewable_Energy_Income
That’s just for depreciation and notwithstanding rebates, and thus also applies to replacing a heating system with a heat pump. Add rebates and that’s almost better than SPY, with a more stable growth profile.
Panels could have been lemons, just as Troglodyte could have bought Sesi LLC stocks. Investing usually comes with risks proportionate to rewards. And there are modelling risks, e.g. Tennessee energy bills increased by 20% over that span.
That was the Marxian memo.
Your math doesn’t work, Willard. In 11 years at the prevailing rate of 6.5%, you will pay roughly $28K principle and interest, but you only return $22K. That is a negative ROI. Once you have it paid off then you will start generating positive revenue, but there are opportunity costs and maintenance costs. It is an awful return, but how much do you award feel-good points?
“In 11 years at the prevailing rate of 6.5%”
Why 11 years? Prevailing rate of 6.5%? Who in their right mind will borrow 20K to buy stocks at 6.5%?
The math works just fine: (20K-20K)/100 = 0% ROI over ten years to hodl SO.
So once again Troglodyte confuses a rudimentary model with maths, just to add irrelevant details to sidestep all his mistakes so far.
I was talking with a family member this weekend about troglodytes who relied on imaginary friends to say stuff he can’t really back up:
https://www.cnet.com/home/solar/are-solar-panels-worth-the-investment-this-is-how-long-it-takes-for-them-to-save-you-money/
We then wondered if loneliness turned them into contrarians or if their contrarianism who repulsed people around them. Probly a little of both, we ended up saying.
This conversation led me to think about adding a step to the contrarian three-step: special pleading. That would mean a fourth step.
So all was not lost wasting time with lonely troglodytes.
Missing is the discussion about who pays for the rebates.
My taxes shouldn’t be paying for your solar rebate.
as i have said before,one of the great lessons in life, is that even a fool is right sometimes, Winston Churchill.
Got to love carefree ankle biters:
https://theferret.scot/north-sea-oil-250-billion-tax-break/
What is 250B for one project between troglodyte friends?
https://www.tropicaltidbits.com/analysis/ocean/nino34.png
Nino 3.4
Here is a ‘projection’ – this time a real one… which shows exactly what you urge to hide:
https://www.cpc.ncep.noaa.gov/products/CFSv2/imagesInd3/nino34Mon.gif
The difference in the anomaly values is of course due to the differing reference periods.
My post contains only facts (i.e. history), not projections.
Global
https://climatedatablog.wordpress.com/wp-content/uploads/2025/07/uah-global-1.jpeg
Tropics
https://climatedatablog.wordpress.com/wp-content/uploads/2025/07/uah-tropics.jpeg
Richard Linsley Hood
1. As opposed to your cascaded 12 month and 5 year means which are 100% correct, your cascaded 12 month median is still wrong.
2. Where is your cascaded 5 year median? Why don’t you show it?
3. Your alleged ‘5 year S-G Mean projection’ is no more than the end of a 60 month Savitzky-Golay smoothing running on the existing data. Why do you omit its begin in every chart you post?
*
Here is the correct stuff:
– 12 month cascades
https://docs.google.com/spreadsheets/d/174CxYCkDKfQMUhAR4TnWXeKj58yhIiCYvCOF4koSfec/edit?gid=1551212378#gid=1551212378
– 60 month cascades
https://docs.google.com/spreadsheets/d/174CxYCkDKfQMUhAR4TnWXeKj58yhIiCYvCOF4koSfec/edit?gid=447018934#gid=447018934
*
It is becoming increasingly clear that you are not the author of the software that creates your charts, and that you can only add data to the sources that the charts represent.
“Why don’t you show it?”
I showed you the C# code (which you have failed to correct/acknowledge). Please correct it for me.
Why does your 60 month cascade have high frequency components in it?
“It is becoming increasingly clear that you are not the author of the software that creates your charts, and that you can only add data to the sources that the charts represent.”
And yet I showed the code that produces said displays.
Blindsley H00d
You endlessly repeat the same stuff.
1. ” ‘Why don’t you show it?’
I showed you the C# code (which you have failed to correct/acknowledge). Please correct it for me. ”
*
I was not asking for your C# code, and did NOT fail to correct/acknowledge it: I told you last year that this is YOUR job.
*
Moreover, anyone can see that you intentionally omitted the front of my question:
” Where is your cascaded 5 year median? Why don’t you show it? ”
Since about 2 years, I’m asking you for publishing on this blog a graph including your ‘UAH Global 5 year Median low pass‘ plot, and until now you still are not able to publish it.
*
2. ” Why does your 60 month cascade have high frequency components in it? ”
It’s not the first time that you try to manipulate the blog with your allegedly high frequencies.
Since our green 60 month cascaded running means are nearly identical, you can only mean my red 60 month cascaded running median.
But this 60 month cascaded running median is exactly what you until now failed to show us in your graph.
Why don’t you show it? So we can compare.
*
3. ” And yet I showed the code that produces said displays. ”
Yes you did:
https://www.drroyspencer.com/2024/10/uah-global-temperature-update-for-september-2024-0-96-deg-c/#comment-1691729
But showing us the code does not mean that you are able to maintain and enhance it.
*
Blindsley H00d, stop dodging around.
Show us what I still miss, and also publish all your 12/10/8 resp. 60/50/39 results as links to uploaded files containing the plots in text form.
I am talking about your RED line.
“But showing us the code does not mean that you are able to maintain and enhance it.”
Yes it does. Show us where it is wrong.
Blindsley H00d
1. ” I am talking about your RED line. ”
I know.
I repeat, as you continue your infamous dodging:
” It’s not the first time that you try to manipulate the blog with your allegedly high frequencies.
Since our green 60 month cascaded running means are nearly identical, you can only mean my red 60 month cascaded running median.
But this 60 month cascaded running median is exactly what you until now failed to show us in your graph.
Why don’t you show it? So we can compare. ”
Apparently, you are definitely unable to show us your version of my red 60 month cascaded median line.
*
2. ” Yes it does. Show us where it is wrong. ”
Firstly, I repeat: this is not MY job, but YOURS.
And it seems that you are absolutely unable to understand that in fact, I very well proved your median computation to be wrong, by implementing on spread sheets a comparison of mean and median cascades based on exactly the same scheme:
https://docs.google.com/spreadsheets/d/174CxYCkDKfQMUhAR4TnWXeKj58yhIiCYvCOF4koSfec/edit?gid=1551212378#gid=1551212378
Look at the preceeding sheet named ‘Data 12/10/8’:
https://docs.google.com/spreadsheets/d/174CxYCkDKfQMUhAR4TnWXeKj58yhIiCYvCOF4koSfec/edit?gid=1592121086#gid=1592121086
and compare, for example in row 8, the cell in colum D:
=AVERAGE(INDIRECT(ADDRESS(ROW()-INDIRECT(ADDRESS(1;COLUMN()));COLUMN()-1)):INDIRECT(ADDRESS(ROW()+INDIRECT(ADDRESS(2;COLUMN()));COLUMN()-1)))
to the cell in colum L:
=MEDIAN(INDIRECT(ADDRESS(ROW()-INDIRECT(ADDRESS(1;COLUMN()));COLUMN()-1)):INDIRECT(ADDRESS(ROW()+INDIRECT(ADDRESS(2;COLUMN()));COLUMN()-1)))
*
The only difference is the function call: ‘average’ (spreadsheet calulators’ name for ‘mean’) vs. ‘median’.
All cells in the mean cascade are identical, and all cells in the median cascade are identical as well.
*
And of course, due to the fact that all these cells refer to the data in fixed cells located in row 1 and row 2 (columns D,E,F for means; columns L,M,N for medians), the cascade cells in the sheet ‘Data 60/50/39’ are exactly the same as those in the sheet ‘Data 12/10/8’.
*
Any 12 year old guy or doll would understand that if
– our 12 month and 60 month mean cascades give a very good eye-balling match,
– my computation schemes for mean and median cascades are exactly identical,
then your 12 month median cascade should also give a very good eye-balling match with my 12 month median cascade.
But it doesn’t.
*
And we still miss your in your graqph a plot of your 60 month median cascade…
When will you show it, Blindsley H00d?
**
In conclusion, I would like to say that in all my engineering career, I have never seen such a poorly, sloppily written piece of software as what you showed on this blog:
https://www.drroyspencer.com/2024/10/uah-global-temperature-update-for-september-2024-0-96-deg-c/#comment-1691729
*
Years ago, you proudly stated that with C#, you would use a ‘native’ OOP language!
Not only does this code contain nothing OOP-like, such as a type definition for cascades that hides all the details, starting with those 60, 50, 39, or 12, 10, 8 numbers you see everywhere, but it’s a horrific throwback to 1960s software.
The programmer, whoever it is, uses these numbers everywhere due to endlessly copying/pasting/reediting code instead of defining algorithms handling them as parameters and called with them as arguments.
*
Willard once called you a ‘coder’; if you were indeed the author of this stinky sloppiness, that was an accurate description of your behavior.
My experience with coders is that their sole goal is to create a working executable program, regardless of how it was created.
That’s the opposite of what software engineers do: to develop and maintain readable, reliable, adaptable, and reusable sources from which working executable programs emerge not by chance but by careful work.
Epsteingate.
Donald Trump’s lawsuit against the Wall Street Journal has been assigned to US District Judge Darrin P. Gayles, an Obama appointee.
Judge Darrin Gayles is the first openly gay Black federal judge and is the same judge Trump faced in his failed $500M suit against Michael Cohen.
It’s funny because trump will lose his sh!t; expect racist tweets from orange Jesus. It shouldn’t matter who the judge is; but it’s a frivolous lawsuit anyway.
Trump’s incompetent attorney Alejandro Brito was hoping to get Judge Aileen Cannon assigned to preside over the WSJ lawsuit, but he filed the suit in the wrong division of the federal judicial district. He filed the case in the Miami division of the federal judicial district of south Florida, instead of the Fort Pierce district where Cannon sits, making it unlikely that Cannon would have been selected under the court’s assignment process.
https://www.politico.com/news/2025/07/21/wall-street-lawsuit-judge-donald-trump-00465363
Because he has another thing for Judge Aileen Cannon.
SOLAR MINIMUM UPDATE
All of the Buckley children yearn for the approval of their father, whose weakness for risky financial schemes is rivaled only by his strength of convictions: He is rabidly isolationist, anticommunist, and antisemitic. One evening, the four eldest children drove to a neighboring Jewish resort and left a burning cross on the lawn. Years later, Bill would recall “weeping tears of frustration” at missing out on this “great lark.” Recalling it again in 1992, he maintained this was “the kind of thing we didn’t distinguish from a Halloween prank.” The incident occurred in 1937, at which point Hitler had been in power for four years.
The tendency to take serious matters lightly is an ongoing theme of Buckley’s life. At school he is recognized for great intellectual gifts, if not always the inclination to use them well. A tutor once cautioned his headmaster that Bill “has to be made to realize that rules are not merely made so that he can invoke them in his favor.” He will never be made to realize this.
Buckley does, eventually, embrace the benefits of hard work, even if he remains loath to appear as though he’s worked at all. At Yale he is triumphant, his legend building around him as he stalks across campus, lanky and self-assured. He writes his first book, God and Man at Yale, shortly after graduating, and it cements him as a rising star. In it, he rails against the administration for abandoning the true purpose of higher education and allowing professors to corrupt American youth with Godless communism. Stop me if any of this sounds familiar.
https://defector.com/william-f-buckleys-bill-never-came-due
Good read.
This story is getting more interesting every day. The liberal media is going with the Democrat talking points — nothing to see here. Whatever you think of Trump, the video in this link is a must-see. While accusing Obama of being “guilty” he takes time to reflect that the Oval Office is “much more beautiful” with him in office.
https://www.foxnews.com/politics/obama-denies-trumps-bizarre-allegations-he-russiagate-ringleader-rare-statement
Trump:
“The leader of the gang was President Obama”.
Obama has responded. It is once again interesting that there is no mention of the Dossier, which is the central issue. Did he know it was fake? Did his people tell him? What did he know, and when did he know it?
From the link:
“These bizarre allegations are ridiculous and a weak attempt at distraction,” Obama’s spokesman continued. “Nothing in the document issued last week undercuts the widely accepted conclusion that Russia worked to influence the 2016 presidential election but did not successfully manipulate any votes.”
He added: “These findings were affirmed in a 2020 report by the bipartisan Senate Intelligence Committee, led by then-Chairman Marco Rubio.”
National Review – a Trump friendly conservative publication also excoriates this ridiculously partisan vendetta lawfare.
https://www.nationalreview.com/2025/07/russiagate-re-revisited-gabbard-urges-doj-to-prosecute-obama-officials/
Tim, you have to be blind not to see that there is no smoking gun here, but old news turned into transparently straw man accusations. This is amateur hour – yet again.
Unbelievable behaviour from a nakedly partisan DoJ.
Let’s throw our denizens a bone. A word from our Marxist frens:
https://podcasts.apple.com/us/podcast/macro-crossroads-whats-next-for-markets/id1618502265?i=1000717959086
The TL;DR is – short dollar, long whatever.
I’d go for metals.
Forty-six years ago today, the “Ad Hoc Study Group on Carbon Dioxide and Climate” began its meeting of July 23 to July 27 which produced the report entitled Carbon Dioxide and Climate: A Scientific Assessment, now commonly known as The Charney Report. It was the first comprehensive assessment of global climate change due to CO2.
The amount of CO2 in the air then was 337ppm.
For months, I’ve enjoyed watching Ark show his ignorance of politics. His continual wrong predictions are always funny — stock market is going to crash, other countries will not trade with us, storm troopers will put us all In prison, Trump will stare WW3, etc.
So now, it’s good to see him show his ignorance of science, again.
Variety is good….
His featured “comprehensive assessment of global climate change due to CO2” doesn’t include the science as to how CO2 can warm the climate. Typical.
Show me where I said any of this:
“stock market is going to crash, other countries will not trade with us, storm troopers will put us all In prison, Trump will stare WW3, etc.”
Otherwise, you’re simply mistaken.
Sorry Ark, but I don’t need to go back in time to prove your ignorance. You can’t solve the simple physics problems. And, look at your most recent link above where you claim “comprehensive assessment of global climate change due to CO2”.
Please copy the exact words from your link that provides the physics as to how CO2 can warm the planet.
I won’t hold my breath….
Epsteingate.
Trump Goes Full Fascist: ‘Whether It’s Right or Wrong, It’s Time to Go After People.’
He’s tried everything to divert attention from the Epstein files and so far nothing has worked.
https://www.rollingstone.com/politics/politics-news/trump-fascist-doj-go-after-obama-1235391240/
Interesting phrasing “For months, I’ve enjoyed watching Ark ”
Your obsessive attention borders on fixation of a kind I didn’t invite. If this is some sort of misplaced romantic or sexual interest, direct it elsewhere; I don’t swing that way.
Puffman has AIDS.
Arkady Ivanovich Derangement Syndrome is real.
The cure is more education.
Ark, your ignorance provides great comedy.
That’s YOUR fault, not mine.
Who is the guy Mark Zuckerberg (we call him Zööckeböög here) is hugging so warmly, but only his back is visible?
https://i.postimg.cc/1t8zz9Mt/2120a4e-upload-1-5o98vztl1p7o-063-2019381036.avif
Is that Jeff Bezos?
OOOOOOOOOOOOOOOOOO
OOOOOOOOOOOOOOOOOO
OOOOOOOOOOOOOOOOOO
OOOOOOOOOOOOOOOOOO
OOOOOOOOOOOOOOOOOO
OOOOOOOOOOOOOOOOOO
Walter, please stop klowning.
Willard,
https://www.youtube.com/watch?v=8Z0jhQeYDUE
I feel sorry for Roy having to police all this political rubbish , on what is a serious climate blog.
” … to police … on what is a serious climate blog. ”
Are you serious, Brown?
Roy Spencer doesn’t ‘police’ anything really here.
Otherwise, people who have the chuzpah to deny the existence of time, the lunar spin, Einstein’s results, the need for GPS to consider time dilation, the GHE etc etc etc, never would be able to publish anything on this blog.
*
Only posters that insult him or endlessly attack him scientifically will be banned.
Why would i not be serious? The amount of childish mud slinging is appalling,
With only 13 mud slinging comments out of 16, Ian, you need to do better.
As Winston should have said, emulate Eboy’s 95% rate.
I will ask Roy to ban the TDS lunatics like Bindidong endlesly clogging this blog with their TDS rants. I urge others to the same
Aaaah, the endlessly ankle-biting Eben dachshund is here again.
How funny!
My theory is Dr. Spencer allows cultists here as a “learning experience”. Where else can we learn how the cult is willing to pervert and distort reality?
A more serious theory is that our crankiest uncles show less interest in politics when defending their daddy’s wins comes at a steeper social cost.
A more robust model is that Eboy is fond of special pleading: whines about people playing the ref, plays the ref at every opportunity.
Willard,
Are you seriously denying that Bindi is both an ape and a clown?
Walter,
When will you stop beating the trad girl that, as an incel, you won’t have as a wife?
Ho~g~le is such a coward that he can’t resist conveniently insulting me as ‘ape’ and ‘clown’ behind a new pseudonym, above all without being able to tell us why he insults.
Like Clint R, Robertson, the Eben dachshund and some others, he lacks any valuable technical skills, hence resorts in discrediting, denigrating, insulting… and often enough simply lying.
Bindidong is the biggest creep on this board. he has no courtesy or respect for others. only thing you can count on he will always double down on stoopid.
Bindi, your comment time is after my challenge below. So I know you saw it, since you stalk me. And I also know you will avoid answering, since you avoid science.
But continue with your immature insults and false accusations. You make me look good by comparison.
https://www.drroyspencer.com/2025/07/uah-v6-1-global-temperature-update-for-june-2025-0-48-deg-c/#comment-1709154
“above all without being able to tell us why he insults.”
Maybe it is because you twist science and then pompously label anyone who challenges you a ‘pseudoskeptic’.
Says the the person who eats, sleeps, breathes, and dreams about Binny. Just live your life!
Willard,
Moving forward, I intend to adopt a more diplomatic tone with Binny. If he responds in kind, that’s great. If not, it lends weight to what Eben said, and could suggest that you’re showing a hint of tribalism.
Walter,
Nobody but you made you become the manipulative asshat that you are,
That you decided to police Binny’s tone and not Eboy’s shows you’re a lousy hall monitor.
Saying stuff is saying stuff however diplomatic you might word it, and everybody knows that contrarians are far from displaying genuine skepticism.
The Trump~ing boy and his eternal lies.
1. In a famous 2002 interview with New York Magazine
https://nymag.com/nymetro/news/people/n_7912/
the Trump~ing boy praised Epstein unequivocally:
” I’ve known Jeff for fifteen years. Terrific guy ”
the Trump~ing boy booms from a speakerphone.
” He’s a lot of fun to be with. It is even said that he likes beautiful women as much as I do, and many of them are on the younger side. No doubt about it — Jeffrey enjoys his social life ”
*
But then, later, the Trump~ing boy suddenly becomes what the Krauts name ‘Wendehals’ (a turncoat) …
2. After Epstein’s second arrest in 2019, the Trump~ing boy publicly distanced himself from him:
“I just knew him the way everyone in Palm Beach knew him”
he said in the Oval Office at the time.
“I wasn’t a fan of his, I can tell you that.”
*
Yeah. Even what he publicly told suddenly becomes ‘fake news’.
For those who suffer of heavy TAS (Trump addiction syndrome), the very first one actually being the Eben dachshund…
” Jeffrey Epstein Case: Sex Offender’s Accomplice, Ghislaine Maxwell, to Be Questioned by the US Department of Justice
“If Ghislaine Maxwell has information about anyone who has committed crimes or offenses against victims, the FBI and the Department of Justice will listen to what she has to say,” said US Assistant Attorney General Todd Blanche on Tuesday. ”
*
Amazingly, Todd Blanche was one of the former private lawyers for… the Trump~ing boy, follow my gaze!
Just for fun, I asked Google’s AI to take on Clints challenge: “provide the physics as to how CO2 can warm the planet.”
The warming effect of carbon dioxide (CO2) on the planet is a fundamental concept in atmospheric physics, largely explained by the greenhouse effect. Here’s a breakdown of the physics involved:
Incoming Solar Radiation: The Earth receives energy from the Sun primarily in the form of shortwave radiation, including visible light. The Earth’s atmosphere, composed mostly of nitrogen (N2) and oxygen (O2), is largely transparent to this incoming shortwave radiation, allowing most of it to reach the Earth’s surface.
Earth’s Emission of Infrared Radiation: When the Earth’s surface absorbs solar radiation, it warms up. Like any warm body, the Earth then re-emits this absorbed energy back into the atmosphere and eventually into space. However, because the Earth is much cooler than the Sun, it emits energy at much longer wavelengths, primarily in the form of infrared (IR) radiation (also known as thermal radiation or heat).
Selective Absorption by Greenhouse Gases: This is where CO2 (and other greenhouse gases like water vapor (H2O), methane (CH4), and nitrous oxide (N2O)) comes into play. Unlike nitrogen and oxygen, which have simple molecular structures and do not significantly interact with infrared radiation, CO2 molecules have a more complex structure (one carbon atom bonded to two oxygen atoms) that allows them to absorb specific wavelengths of infrared radiation.
Molecular Vibrations: When infrared photons (packets of energy) at certain wavelengths strike a CO2 molecule, they cause the bonds within the molecule to vibrate in various ways (stretching and bending). This absorption of energy excites the CO2 molecule.
Specific Absorption Bands: CO2 is particularly effective at absorbing infrared radiation at wavelengths around 15 micrometers, which is a crucial range for the Earth’s outgoing thermal radiation. Water vapor, while a more abundant greenhouse gas, has “windows” where infrared radiation can escape, but CO2 effectively plugs some of these windows.
Re-emission in All Directions: Once a CO2 molecule absorbs an infrared photon and becomes excited, it doesn’t hold onto that energy indefinitely. Instead, it quickly re-emits an infrared photon in a random direction. Approximately half of this re-emitted energy goes upwards towards space, and about half is re-emitted downwards, back towards the Earth’s surface and lower atmosphere.
The Trapping Effect (Greenhouse Effect): This re-emission of infrared radiation back towards the Earth’s surface is the core of the warming mechanism. Essentially, CO2 and other greenhouse gases act like a “blanket” in the atmosphere. They allow visible light from the Sun to pass through, but they absorb and re-emit a significant portion of the outgoing infrared radiation from the Earth. This process slows down the rate at which heat can escape to space, leading to a net accumulation of energy in the Earth’s climate system and a consequent warming of the surface and lower atmosphere.
Radiative Forcing: Scientists quantify the warming influence of CO2 and other climate drivers using a concept called radiative forcing. This measures the change in the net energy balance of the Earth system due to a particular factor, expressed in Watts per square meter (W/m2). An increase in atmospheric CO2 concentration leads to a positive radiative forcing, meaning more energy is being trapped, which in turn leads to a rise in global average temperatures.
In summary, the physics of how CO2 warms the planet can be distilled into these key points:
Absorption: CO2 molecules are efficient absorbers of specific wavelengths of infrared radiation emitted by the Earth’s surface.
Re-emission: Absorbed infrared energy is then re-emitted by the CO2 molecules in all directions, including back towards the Earth.
Trapping: This re-emission traps heat in the lower atmosphere, reducing the rate at which energy escapes to space and thus warming the planet.
The more CO2 there is in the atmosphere, the more effectively this “blanket” traps heat, leading to an enhanced greenhouse effect and a warmer planet.
I can already hear some objections so …
1) There are a few things I would say differently, but overall it is a decent summary for Clint’s request, based on standard physics taught in universities around the world.
2) No I am not ‘relying on’ AI – I am analyzing and critiquing the AI reply.
3) The original AI response has links to other scientific sources around the internet. Look there if you want the sources. None of this is “from a cult” or “made up science”.
4) If you object to any specific part, then say what sentence(s) you object to and what you think would be a more correct statement of the relevant facts.
Sorry Folkerts, but your AI crap is exactly “from a cult” and “made up science”.
(See discussion below.)
Tim,
Ask AI to explain the lapse rate? For example, at Mauna Loa, the temperature at the base warmer than the summit. But there’s no difference in CO2. How do you explain that?
Stephen, I am having a hard time understanding your query.
Are you confused that there could be some reason other than CO2 for differences in temperature between two locations?
Are you confused about the basic properties of gases that cause them to cool when they expand?
If you want to learn, you could ask some AI yourself. Or read the wikipedia entry. Or find a meteorology textbook.
Stephen cannot learn. This has been explained.
Tim,
No, not confused at all. So, again, just to be clear, what causes the temperature difference between the base and summit at Mauna Loa?
Stephen, your question could be answered at all sorts of levels.
Starting simply, air is heated near the surface (contact with the warm ground) and cools near the top (radiation to space). This drives convection. Rising air cools and descending air warms. This leads to a natural gradient in the atmosphere.
Nate disagrees with everything Dr. Spencer says except this.
Tim,
So, you’re saying conduction and convection cause the lapse rate? Not radiative forcing?
Stephen, a lapse rate by definition means a temperature gradient in the atmosphere — in this case warm air at the surface and cool air at the top.
>> the *cause* of the warming at the surface is (primarily) due to conduction and radiation from the sun-0warmed surface.
>> the *cause* of the cooling at the tropopause is primarily due to radiation out to space.
In between, both convection adn radiation play important roles. In particular, convection LIMITS the lapse rate. If the lapse rate gets too small, conv4ection quickly kicks in to whisk heat upward. (If convection could somehow be eliminated, the lapse rate would INCREAESE and the surface would get EVEN WARMER.)
—————————–
So, I’m saying radiation from the sun to the surface causes heating and radiation from the atmosphere to space causes the cooling, and convection causes the value to be be ~ 6 K/km.
Thats definitely one way to explain the GHE. But like the food pyramid recently debunked reality often has a different answer.
Simplifying the theory into a ”one way glass” theory of heat transport fails of course for one way glass because there is more than one way for heat to be transported through glass.
Radiation is only one way. You also have conduction, convection, and chemical processes (like the convective transport of latent heat) any theory has to incorporate those processes to have a complete heat transport model.
Thats what climate models try to tackle rather unsuccessfully especially in view of long term natural variation occurring through orbital perturbation that affect earth’s time and distance wrt to the sun.
Also the chemical process noted above doesn’t obey the strict thermodynamic transport laws as heat is transported to the top of the atmosphere in a chemical phase that doesn’t express heat.
Arguably the estimated 100 watts so transported could explain the entire GHE in strict compliance with the laws of radiation. So it certainly is interesting to discuss the various ways the GHE could work but it’s quite another to demonstrate any of it as a fact. A problem that mainstream science quietly accepts by suggesting that one would have to create planets with sufficient gravity to hold measurable atmospheres to test the issue.
If you actually want to argue for a point of view expressed by the employers of the vast majority of climate scientists you should understand the foundations of the other side of the issue and how the other side of the issue has superior motives behind it based in reality rather than fear. If you don’t understand this your enthusiasm is fundamentally misplaced. This text is available on Amazon for a nominal price and is an easy quick read. https://www.amazon.com/Hard-Green-Environment-Environmentalists-Conservative/dp/0465031137
Bill,
You also have hydrostatic pressure.
We have to start somewhere, so let’s discuss the “one way glass” model as a starting point.
So the first question is “do you agree with the ‘one way glass’ model in the absence of all those other complicating factors you mention?” For example, if we could surround the entire moon with a glass dome ~100 m above the surface (ie mostly transparent below 4 um and mostly opaque above 4 um) , do you agree the surface would get warmer?
I fear a lot of the science-deniers here would disagree even with this simple, clear result.
The problem with hydrostatic pressure is when you compress or decompress a gas it changes temperature but the temperature changes quickly back toward the ”environmental temperature” at whatever point active change in pressure ends.
As a result the less than proficient warmists in here argue that convection doesn’t result in cooling. However, in an atmosphere where all the radiation received by the solid surface is not entirely lost by direct radiation to space convection does aid the loss of energy to space when considering the relationships of the various forms of energy and stability. That’s especially true for latent heat which doesn’t lose temperature when elevated.
Thus hydrostatic pressure is a player because air molecules near the surface are more stable than those at altitude.
Tim Folkerts says:
”So the first question is “do you agree with the ‘one way glass’ model in the absence of all those other complicating factors you mention?” For example, if we could surround the entire moon with a glass dome ~100 m above the surface (ie mostly transparent below 4 um and mostly opaque above 4 um) , do you agree the surface would get warmer?”
We already know that with an atmosphere in a box experiment no warming is achieved. And here is the proof of that: https://www.scirp.org/pdf/acs_2020041718295959.pdf
Would it be different for the moon and a glass box? Explain why.
I believe the Sun warms the Earth and then atmospheric hydrostatic pressure enhances the warming effect, not radiative forcing. I don’t know how much enhancement but believe it is more than 33K. This is the only thing that explains the adiabatic lapse rate. Warm air is carried up in the troposphere and air expands in a polytropic process. At some point, high in the troposphere, where the air is thin, radiative cooling to space takes over. No GHE whatsoever.
Folkerts has been gone for a day or so, since he got caught in fraud, again.
Now, he’s back with more of the same. But, before I deal with it, let’s see if any of the cult kids can see the problem. Bindi, Ark, Willard, barry, gordon, Norman, RLH, Nate, TimS, and studentb, are the most fragrant blog-cloggers. But I predict not one of them can identify the problem with Forkerts “find”.
Here’s your chance to prove me wrong, kids.
(Hint: The problem has been discussed several times.)
Hey Puffman, riddle me this –
Will canceling transmission lines lower or raise electricity prices?
Will it lower or raise emissions?
Here’s a hint:
https://www.rtoinsider.com/110736-doe-pulls-funds-from-grain-belt-express
CR
Just answer this simple question:
A 15 micron photon arrives from outer space.
Nobody knows where it came from, nor the temperature of its source.
What happens when it impacts a solid surface?
(please don’t tell us that it depends on the temperature of the surface – that is patently stupid)
If you cannot provide a cogent answer, please cease with your bogus alternative theories and do us all a favour by leaving this site.
studentb, it appears you’re avoiding addressing the problem, which proves me right. Again.
Photon absorp.tion depends on “wavelength compatibility”. And yes, wavelength compatibility is affected by surface temperature, among other variables.
As predicted, not one of the cult kids could find the problem in Folkerts’ AI nonsense.
The problem is the same throughout “climate science”. In a description of the GHE, there is always a lot of blah-blah, but always with a key part missing. They always end with something like Trapping: This re-emission traps heat in the lower atmosphere, reducing the rate at which energy escapes to space and thus warming the planet. But they don’t explain how “trapping” 15μ photons can warm a 288K surface.
That’s because it can’t happen….
“A” stands for “Artificial”.
Small correction, Puffman.
“A” stands for “anthropogenic”. Since it is opposed to natural, by definition it is artificial. So you said very little.
Why haven’t you told us how that “compatibility” works exactly – is it because you’re just waving your arms once again?
As expected, CR’s attempt at an answer to a simple problem degenerates into a “patently stupid” piece of guff.
His idea of “wavelength compatibility” is laughable.
It somehow depends on surface temperature !!!
Let’s think about this preposterous idea a bit more:
What if the surface temperature T is 100K ?
What does the photon do?
Or if it is 200K?
Or if it is 400K?
Or if it is 4000K?
I’d love to hear you explain what happens in each situation but doubt you can since you obviously have NFI.
Some day, if you ever study radiative physics studentb, you will learn about WDL. So, let’s compare temperatures to WDL wavelength.
100K to 29μ
200K to 14.5μ
400K to 7.3μ
4000K to 0.73μ
For ice:
273K to 10.6μ
For Earth:
288K to 10.1μ
It’s hard to imagine, unless you’re a child, that a 15μ photon could warm anything above 200K.
But children can have great imaginations….
CR
You are an idiot.
WDL only indicates the peak wavelength of radiation emitted by a black body.
Yes – it only indicates the PEAK in the spectrum !
For any black body the spectrum is described by the SBL which
indicates that emission occurs at ALL wavelengths including 15μ.
That is why the photon could have been emitted by an infinite number of bodies at different temperatures.
God only knows how you could have misinterpreted the WDL.
You obviously have never studied the subject.
Talk about egg on face !
I knew you couldn’t understand child. Reality always upsets you cult kids. And your emotional meltdown proved me right, as usual.
Whatever you say omelette head.
studentb, please stop trolling.
Graham D. Warner, please stop using a forbidden word.
Not a forbidden word any more. You have to keep up with the times.
The difficulty with this type of simplistic explanation is that the whole process is extremely complex. Each individual molecule is simultaneously doing at least three things that work independently despite the effect of the other two at any moment in time. It is emitting its temperature based on its spectrum (the full spectrum for those stuck on 15 micron). It is collecting (allowable word) whatever background radiation is available from any direction, but also only within its spectrum. It is exchanging temperature with its neighbors directly by the Kinetic Theory of Gases.
The lapse rate is also complex. Pressure changes are part of it, but only when the air is moving due to natural or forced (wind) convection. The greenhouse effect contributes in a somewhat complex process that is simple to explain. In general, air that is closer to the surface is “collecting” more radiation than it emits. As elevation increases, the relationship shifts so that emitting increases and collecting decreases. At a high enough elevation, emitting dominates leading to the claim that the heat escapes from the upper atmosphere. Did I mention that the whole process is complex?
“The lapse rate is also complex. Pressure changes are part of it, but only when the air is moving due to natural or forced (wind) convection. The greenhouse effect contributes in a somewhat complex process that is simple to explain. In general, air that is closer to the surface is “collecting” more radiation than it emits. As elevation increases, the relationship shifts so that emitting increases and collecting decreases. At a high enough elevation, emitting dominates leading to the claim that the heat escapes from the upper atmosphere. Did I mention that the whole process is complex?”
The lapse rate is only affected by atmospheric pressure. There is no radiative function in the lapse rate. The lapse rate is derived from pressure. Also, it is adiabatic. It is complicated because the science doesn’t work. Also, how does the atmosphere warm the surface if it is at higher entropy? Not thermodynamically impossible, but improbable.
The problem is, back-radiation warming/insulation doesn’t work.
Take the Green Plate Effect, as the clearest example. In the 262 K…220 K solution, back-radiation from the Green Plate (GP) has the effect of directly transferring internal energy from the GP and having it permanently build up inside the Blue Plate (BP) at the expense of the GP. That’s a 2LoT violation. We know this is what is occurring because in the correct solution, the back-radiation from the GP to the BP is returned to the GP, and the temperatures are 244 K…244 K. When the back-radiation from the GP to the BP is not returned, the plate temperatures are 262 K…220 K. So we know that in the latter case, the effect the back-radiation is having is to build up internal energy in the BP at the expense of the GP, which cannot happen – energy does not just “organise itself” in this way.
Radiative insulation actually works like any other type of insulation. If the GP were suddenly made reflective, then it would be returning radiation to the BP like it never left the BP in the first place – the reflectivity is like a physical barrier to the flow of energy. Then the GP would cool because it would not actually be receiving as much energy as it did previously, due to it reflecting the radiation away. So, it’s a subtle difference, but an important one. Energy cannot just be directly transferred against the direction of energy flow and build up in the warmer object at the expense of the cooler one. However, when a physical barrier to the energy flow is presented, energy can build up on one side of the barrier and diminish on the other side.
And, that’s what’s wrong with your GHE description.
DREMT, your “correct” solution has heat radiating from one surface at 244 K to another surface at the same temperature! Heat doesnt’t work that way! Energy cannot just be directly transferred — between two surfaces at the same temperature!
No mention of “heat” in my comment, Tim. Just EMR, energy.
Folkerts, you don’t understand thermodynamics and radiative physics. You’re confusing “energy” with “heat”.
Look at the diagram DREMT has provided numerous times. There is NO heat transfer between plates in the correct solution. There is only energy transfer. The green plate absorbs 200 W/m^2 while emitting 200 W/m^2.
As usual, you’re just throwing crap against the wall, hoping something will stick.
“back-radiation from the Green Plate (GP) has the effect of directly transferring internal energy from the GP and having it permanently build up inside the Blue Plate (BP) at the expense of the GP. That’s a 2LoT violation.”
Ugggh
For the incredibly slow learners: FALSE.
This repeated insane claim ignores the facts that there is a HEAT source, the SUN, constantly supplying heat to this system of plates.
And that you have VACUUM newly created between the newly separated plates.
Vacuum being a much much better thermal insulator than metal, the heat transfer from the BP to the GP has been suddenly and sharply restricted.
The GP is continuously cooling to space.
Given these facts,
1) the SUN supplying steady heat to the Blue Plate,
2) the sharp reduction in heat loss from the BP to GP,
3) the steady heat loss from the GP to space.
the BP must build up internal energy and WARM, and the GP must lose internal energy and COOL. The heat flow was always from the HOT Sun to the warm BP to the cool GP to the cold of space.
Therefore, no one of sound mind can claim with a straight face that heat flowed backwards from a colder to a warmer object.
This is simply a case of heat flowus interruptus.
Sorry there is no evidence of a 2LOT violation here.
DREMT 5:41 pm: “In the 262 K…220 K solution, back-radiation from the Green Plate (GP) has the effect of directly transferring internal energy from the GP and having it permanently build up inside the Blue Plate (BP) at the expense of the GP. That’s a 2LoT violation.”
No. Entropy is produced in such a process so is in accord with 2LOT for no violation. The rest of DREMT’s comment falls apart accordingly.
“We know this is what is occurring because in the correct solution, the back-radiation from the GP to the BP is returned to the GP, and the temperatures are 244 K…244 K.”
No. Entropy is not produced in such a process so there is no hope it’s correct since that’s a violation of 2LOT.
True, it is not ever necessary to use the term “heat”.
Nate seems to be on automatic pilot, not really reading what he’s responding to. I made no mention of “separating the plates”, and my argument obviously takes all energy flows into consideration, including energy from the Sun. I would say “try again”, but I’m not really interested in another month-long back-and-forth.
Oh, I see Ball4 agrees that internal energy from the GP is being directly transferred to the BP, and building up within it at the GP’s expense, whilst Nate denies that this is what they believe occurs. They directly disagree with each other then, but won’t dispute it between themselves. Typical.
DREMT: “In the 262 K…220 K solution, back-radiation from the Green Plate (GP) has the effect of directly transferring internal energy from the GP and having it permanently build up inside the Blue Plate (BP)”
No. There is a transfer TO the BP *only* from the hotter external source (eg sunlight @ 5700 K). This supplies 400 W to the BP (assuming 1m^2 surface in the ‘standard’ scenario). The GP actually has the effect of SLOWING THE ESCAPE of internal energy from the BP.
At a steady state condition, we need to determine how this 400 W leaves the BP. We can imagine several scenarios (all of which will assume a vacuum to eliminate the need to consider conduction or convection).
1) The BP might be in chamber where the surroundings are 2.7 K (radiating 0 W/m^2). In this case 200 W will be radiated from each side to the 2.7 K surroundings; a net transfer out of 200 + 200 = 400 W (matching the 400 W in from the sun).
This leads to T(BP) = 244K
2) The BP might be in a chamber with green walls on all sides held at 220 K (radiating 133 W/m^2). In this case 333 W will be radiated from each side to the 220 K surroundings; a net transfer out of 333-133 = 200 W from each side = 400 W total.
This leads to T(BP) = 277K
1.5) Now split the difference. 2.7 K walls on one side and 220 K green walls on the other side. Clearly the BP will be somewhere between the two temperatures listed above. A little trial and error (or clever calculations) will show that the BP should be 262 K, radiating a net 267-0 = 267 W from the side facing cold walls and 267-133= 133 W from the side facing the warm green walls, for a net 267+133 = 400 W.
This leads to T(BP) = 262K
Adding warmer surroundings leads to higher temperature for a heated object, exactly as intuition suggests.
DREMT 9:00 am: There’s no GPE disagreement since Nate’s GPE comments are in accord with 2LOT results same as Eli’s original GPE solution in 2017.
There is no hope for DREMT to be correct in commenting against the 2LOT. It’s good, though, that DREMT has dropped use of the term “heat”; that’s physical progress demonstrated by DREMT.
Ah, I see Tim is also in direct disagreement with Ball4. That’s OK, I won’t expect them to settle their dispute either.
Folkerts, with all your blah-blah, it’s hard to tell if you’re totally incompetent or addicted to fraud.
Let’s keep it simple so even children can understand:
With the two plates in exact contact, they would have the same temperature, once in equilibrium. Now, separate the plates by a silly millimeter, and allow for no losses. Then the plates would still be at the same temperature.
“Then the plates would still be at the same temperature.”
No.
There is no hope for Clint R to be correct at 10:53 am when commenting against the 2LOT.
10:44 am: “Tim is also in direct disagreement with Ball4.”
No. Tim F. gets the same answer as Eli does to the 2017 GPE and we both told DREMT “No” to the same DREMT clip.
Ball4, you agreed that the GP directly transfers internal energy to the BP where you think it builds up at the expense of the GP. Tim and Nate do not agree with that.
Tim F. and NATE DO agree “with that” (DREMT term) using their own wording. Try to read their recent comments more diligently & I’ll help if needed & DREMT remains confused. Thankfully Tim F. doesn’t use the term “heat” in recent comment and you have to figure out what Nate really means physically when using the term. What matters is they both agree with Eli’s 2017 GPE solution since it is consistent with 2LOT.
“With the two plates in exact contact, they would have the same temperature, once in equilibrium. Now, separate the plates by a silly millimeter, and allow for no losses. Then the plates would still be at the same temperature.”
It changes the mode of heat transfer from conduction to radiation.
Try this: bring your finger 1 mm away from a hot pan on the stove. How’s that feel?
Now go ahead and make full contact between finger and pan.
Any difference?
Report back your findings.
Child Nate, your finger and the pan don’t have the same temperature or emissivity. You’ve completely changed the scenario.
Not to mention you believe a vacuum is insulation for photons!
What crap will you throw against the wall next?
Ball4, Tim and Nate should agree, since obviously when the radiation from GP to BP is returned to the GP, temperatures are 244 K…244 K, and when the radiation is not returned, temperatures are 262 K…220 K. I mean, that’s irrefutable evidence that the radiation from GP to BP is responsible for the BP gaining internal energy at the expense of the GP. Absolutely irrefutable. Which is why they haven’t even tried to argue against it. They haven’t even so much as quoted from that part of my original comment.
But, they do not agree with you, all the same.
DREMT 3:47 pm: “temperatures are 262 K…”
to which Tim F, Nate, I, and Eli 2017 GPE et. al. all agree after GP introduced, consistent with 2LOT.
DREMT’s point is undeniably revoked “I mean, that’s irrefutable evidence” that there is no disagreement. They all DO agree using different wording confusing DREMT who comments AGAINST the 2LOT so there is no hope for DREMT to be correct.
“Child Nate, your finger and the pan don’t have the same temperature or emissivity. You’ve completely changed the scenario.
Not to mention you believe a vacuum is insulation for photons!”
So then you don’t realize that contact between objects transfers heat by conduction, which is much more efficient than heat transfer by radiation or convection, as the pan experiment if you try it, will dramatically demonstrate.
This is both common knowledge and common sense.. But you guys hilariously seem to lack both.
Child Nate, the plates do NOT involve conduction. They’re in a vacuum, which does not provide conduction.
Please continue to demonstrate your immaturity and incompetence.
They agree with you that the solution is 262 K…220 K, yes, Ball4. But, they disagree with you on what I’ve explained you disagree on. And, not one of you has the integrity to even admit it, let alone argue it out amongst yourselves.
Here’s you, Clint
“With the two plates in exact contact, they would have the same temperature, once in equilibrium. Now, separate the plates”
Then you say:
“Child Nate, the plates do NOT involve conduction. They’re in a vacuum, which does not provide conduction”
Obviously you are thoroughly confused.
In contact, as you say they start, the plates are conducting 200 W/m2 of heat through them. We know that because the plate is heated on one side by the sun and emitting 200 W/m2 to space on the other side.
You say the plates start out at the same temperature. This is an approximation of the real world situation. In reality the plates will have a tiny T gradient across them.
Eg let’s say the plates are copper. With conductivity 400 W/m/K, the temperature gradient with 200 W/m2 of heat flow would be 0.5 K/m.
Or 0.0005 K for a 1 mm thick plate.
So setting the plates at the same temperature is a perfectly good approximation.
Now separate the plates at 244 K and 243.9995 K in vacuum. Now by radiation the heat transfer drops from 200 W/m2 to 0.002 W/m2.
The GP still emitting 200 W/m2 to space must now start cooling.
DREMT 1:28 am: “they disagree with you on what I’ve explained you disagree on.”
No, DREMT just hasn’t yet diligently worked to understand. There is no disagreement, their different words comply with 2LOT as do mine. It is DREMT that comments against the 2LOT thus there is no hope for DREMT’s explanation to be correct. The “they” (DREMT term) agree GPE was correctly solved using 1LOT by Eli compliant with 2LOT way back in 2017.
Now you’re mixing up different scenarios, child Nate.
Please continue to demonstrate your immaturity and incompetence.
This is a fantastic “dishonesty display” from Ball4. Please continue.
“Now you’re mixing up different scenarios”
Plates in contact, plates separated. Exact same scenario as the one you brought up.
When the plates separated, I found the heat transfer (net energy) from BP to GP is ~ 0, using the Radiative Heat Transfer Equation.
What law of physics do you use to find the energy transfer from BP to GP?
Nate, please stop trolling.
Whenever Clint lacks answers to relevant questions, DREMT tries to cover for him.
They are Team Evasion.
Nate, you’re the one evading the fact that your solution violates 2LoT, as explained, and you were unable to refute that explanation.
No DREMT 10:14 am, Nate’s solution produces entropy so no violation of 2LOT. DREMT still hasn’t diligently done the work to understand.
Nate, Ball4 said that you and Tim agree with him that the GP directly transfers internal energy to the BP, where it builds up at the expense of the GP. Now is your chance to argue against him, if you have the integrity.
“your solution violates 2LoT”
You keep declaring such absurdities but when challenged with the facts, such as no evidence of heat flow from cold to hot, you offer nothing whatsoever to support your claim.
It’s just hot air.
Nate has no integrity, then.
Your version of ‘integrity’ seems to be: ‘Not sticking to principles and facts, and instead blindly agreeing with DREMTs totally absurd unsupported beliefs’
IOW you redefine ‘integrity’ to its opposite.
Why?
Nate, if you had any integrity you would argue against Ball4. It’s pretty straightforward. Why should I have to argue against three people when one of them has agreed with something I’ve said, and the other two disagree? Argue amongst yourselves for crying out loud.
“Argue amongst yourselves for crying out loud.”
Sure, just as soon you stop coming here and arrogantly pushing BS, for crying out loud.
Demonstrate that you have the integrity to face the the facts that challenge your beliefs, for crying out loud.
-Provide evidence that heat flowed from cold to hot. If none, then have the integrity to stop claiming a 2LOT violation, for crying out loud.
-Provide evidence that a black body can become a perfect reflector. If none, then have the integrity to stop claiming the BP returns the GPs emissions, for F*k sakes!
Nate, Ball4 agrees with me that internal energy from the GP is directly transferred to the BP, where it builds up at the expense of the GP. Seems to me if you agreed with that, you would agree there is a 2LoT violation. So, your argument is with Ball4.
“Ball4 agrees with me that internal energy from the GP is directly transferred to the BP”
I have no issue with that.
But I know that the BP also continues transferring its internal energy to the GP.
I assume you agree. If not, explain.
“where it builds up at the expense of the GP.”
Wrong. The plates are at the same temperature so the transfers perfectly CANCEL each other.
The math is straightforward. So there can be no build-up as a result of the transfer from the GP to the BP.
The buildup comes from the Sun’s input to the BP, that is now no longer being lost to the GP.
Why are you directing your comment towards me? Argue with Ball4, or concede. Simple.
THE BP also continues transferring its internal energy to the GP.
I assume you agree. If not, explain.
If not then you have no integrity.
Nate, I’m not having another month-long back-and-forth on this.
The arguments I’ve already made in this sub-thread refute your responses. All energy flows are taken into account in the argument made in my original post, July 24, 2025 at 5:41 PM, and again in my comment of July 25, 2025 at 3:47 PM. All energy flows, including the energy from the Sun, and the energy going from BP to GP. OK? So, you’ve got nothing. You’re just repeating refuted arguments.
This is why Ball4 agrees with me that internal energy from the GP is directly transferred to the BP, building up in the BP at the expense of the GP. There’s no argument to be made against the one I’ve already made. Which you continually ignore. OK?
So, you can either argue against Ball4, or you can accept what he accepts, and try his “entropy” game. Or, just concede that there’s a 2LoT violation in your solution.
Any further response from you is just going to be met with, “argue against Ball4”.
The arguments I’ve already made in this sub-thread refute your responses.”
False.
“All energy flows are taken into account in the argument made in my original post, July 24, 2025 at 5:41 PM, and again in my comment of July 25, 2025 at 3:47 PM.”
Totally False! As noted the energy transfers from BP to GP and from GP to BP are EQUAL. They cancel.
Show me where you acknowledge this fact, anywhere.
Therefore the growth of internal energy in the BP cannot be from the energy exchange with the GP.
It is the input of energy from the Sun that produces the increase in internal energy
Show us anywhere that you acknowledge this simple mathematical fact.
IoW show us that you have integrity.
All energy flows, including the energy from the Sun, and the energy going from BP to GP. OK? So, you’ve got nothing. You’re just repeating refuted arguments.
You won’t quote from, or respond to, the argument that refutes your responses! It’s quite hilarious.
Argue with Ball4, Nate.
As noted the energy transfers from BP to GP and from GP to BP are EQUAL. They cancel.
Thus the claim of a NET movement of internal energy from cold GP to warm BP is absolutely FALSE.
There is nothing in your cited post that acknowledges this. And you refuse to find the quote.
Simply stating that you addressed an issue while not actually ever doing so is pure evasion, deception, a LIE.
That is what you have to resort to in order to continue making your absurd claims.
“Argue with Ball4, Nate.”
The more you say this, the more we recognize that YOU have no support for your claim of a 2LOT violation, and are seeking evasion, distraction…and somewhere to hide.
If you had the evidence, that was real and could stand up to any scrutiny, you would not need these tactics.
Clearly you don’t have the goods.
So your argument, again, fails to convince.
Now he starts accusing me of lying! While he just endlessly repeats refuted arguments.
Nate, my argument takes all energy flows into account.
Argue it out with Ball4.
“Now he starts accusing me of lying”
It would be easy to prove me wrong, by quoting yourself where you honestly account for the cancelling transfers of energy between the plates, upon separation.
This is a fact which you simply ignore when you claim there is a Net transfer of energy from GP to BP upon plate separation, and thus a 2LOT violation.
But if you can’t find the quote, then yes, you are lying.
Because your argument makes no mathematical sense.
1) My argument doesn’t even involve “separating the plates”.
2) All my argument needs to demonstrate is that internal energy from the GP builds up in the BP at the expense of the GP, which it does demonstrate.
3) My argument takes into account all energy flows.
4) Argue against Ball4.
Still just repeating your talking points, while offering no supporting evidence, and ignoring contradictory evidence.
“1) My argument doesn’t even involve “separating the plates”.”
FALSE. Your whole 2LOT argument is about what follows that event!
“2) All my argument needs to demonstrate is that internal energy from the GP builds up in the BP at the expense of the GP, which it does demonstrate.”
See what I mean! That ‘build up’ is a change arriving from separating the plates.
And it if you had considered that the energy flow from BP balances the flow from GP to BP, you could not possibly conclude the ‘build up in the BP’ was ‘at the expense of the GP’.
Sorry, your argument based on obviously faulty logic.
Therefore you obviously did not ever consider that balance of energy flows!
“3) My argument takes into account all energy flows.”
FALSE, SEE #2.
“4) Argue against Ball4.”
Again we get distract and evade tactics.
Once again, Nate declares things “FALSE” which are not false. Perhaps he needs to read what my argument actually is. I directed him to the right comments, already. My argument does not involve “separating the plates”, and it does take all energy flows into account. He should also just argue against Ball4.
Once again, Nate just doesn’t declare DREMT comments “FALSE” which are false, Nate supports Nate’s comment position with facts that DREMT declines to do.
It is now well-established that you and Nate disagree, Ball4.
“My argument does not involve “separating the plates”,
Ummmm, then what is the event that triggers the ‘build up’ of the BP internal energy?
If the plates are simply sitting in equilibrium with Eli’s temperatures, then there is no ‘build-up’ that you keep referring to.
Get your story straight.
My story is straight, Nate. Thank you. I take it you have read the comments I directed you to, realised that I was obviously correct about what my own argument is, and this is your way of acknowledging you were wrong and apologising. Apology accepted.
Now, argue with Ball4.
“realised that I was obviously correct about what my own argument is”
You are just operating in pure gaslighting mode now.
Whats the point? Just to take up space?
Your ‘story’ remains just a story unless it agrees with the MATH.
The math is clear that the energy flux sent TO the GP from the BP is always greater than or equal to energy flux sent FROM the GP to the BP.
The equation is
F(BPtoGP) >= F(GPtoBP)
Therefore there is no mathematical way for this to be correct:
“internal energy from the GP is directly transferred to the BP, building up in the BP at the expense of
the GP.”
Now repeat your fictional story as much as you want, they cannot change the math.
You said my argument involved “separating the plates”. It didn’t. You were wrong.
And, you can’t even admit that! Let alone deal with the actual argument.
Just argue against Ball4. Stop responding to me.
Then what is the event that triggers the ‘build up’ of the BP internal energy, that leads to you claiming a 2LOT violation?
If you have no answer, then we will know that you are simply full of sh*t.
No “event”, Nate, but if you remember the original GPE, the BP starts on its own at 244 K. Then the GP is added.
I’ll await your apology.
Now, go and argue with Ball4.
“No “event”, Nate, but if you remember the original GPE, the BP starts on its own at 244 K. Then the GP is added.”
That is an event, but not your usual one…
Either way no evidence onf heat flowing from cold to hot.
Where’s the apology? When are you going to actually acknowledge, quote from, or respond to the argument that I made? When are you going to argue with Ball4? Why are you so dishonest?
if you remember the original GPE, the BP starts on its own at 244 K. Then the GP was added and is warmed up by the BP, which is its heat source.
Thus, the energy flow is always from Sun to BP to GP, ie from hot to warm to cold.
Thus was NEVER any BP gain in internal energy at the expense of the internal energy of the GP, as you claimed.
When are you going to wise up and deal honestly with the facts?
Once again, Nate:
July 25, 2025 at 3:47 PM
Respond, concede, or argue with Ball4.
DREMT 8:07 am neglects to mention his 3:47 was immediately and undeniably revoked at 5:34 since DREMT’s GPE solution doesn’t produce entropy thus is in violation of 2LOT.
Ball4 is trolling me again, for some reason.
DREMT GPE solution remains undeniably revoked being in violation of 2LOT.
That comment wasn’t even about my solution.
The thing is, between Ball4 and Nate, there is agreement that their solution involves a 2LoT violation. Ball4 agrees that the GPs internal energy is directly transferred to the BP, where it builds up at the expense of the GP. Nate disagrees with that, and if he did agree, you get the impression he would agree there is a 2LoT violation. Whereas, Ball4 thinks there is no 2LoT violation due to his “entropy” nonsense, where he claims my solution violates 2LoT! Obviously Nate doesn’t agree there, since Nate has never argued my solution violates 2LoT, and he has accused it of pretty much everything else.
So, Nate could argue against Ball4, and convince him that his “entropy” arguments are nonsense. Then Ball4 would be forced to admit their solution involves a 2LoT violation. Or, Ball4 could argue against Nate about the build up in internal energy in the BP, at the expense of the GP. Then, Nate would be forced to admit their solution involves a 2LoT violation. See what I mean? But, they just refuse to argue with each other! This is why I ask people to argue amongst themselves. As usual, it is a genuine request, not some “tactic” or underhanded effort. As we have seen, you just can’t get them to display any integrity.
2:50 am: “…between Ball4 and Nate, there is agreement that their solution involves a 2LoT violation…”
No, as I’ve written and DREMT isn’t educated in thermodynamics enough to understand, Eli’s solution produces entropy so is consistent with 2LOT. Also, as I’ve written what matters is both Nate and I agree with Eli’s 2017 GPE solution. DREMT’s GPE solution doesn’t increase entropy so is ruled out by 2LOT thus there is no hope for DREMT to be correct.
“Nate has never argued my solution violates 2LoT”
Nate just did so at 3:39 pm; DREMT conveniently ignores Nate’s “thus a 2LOT violation” by DREMT.
DREMT’s: “the build up in internal energy in the BP, at the expense of the GP” is so imprecisely worded from DREMT’s shallow understanding of thermodynamics, it’s reasonable to add needed details such as it is in accord with 2LOT or not by different readers.
Ball4, the disagreement between you and Nate is exactly as I described.
Nate has never argued that my solution violates 2LoT, and of course does not argue that in the comment you mention. As usual you are quote-mining and twisting the facts in a desperate attempt to pretend there’s agreement between you when there isn’t. Thanks for choosing to continue your “dishonesty display” at this late stage.
Ha, DREMT’s description is still imprecise “exactly as (DREMT) described” so can be both consistent and inconsistent with 2LOT depending on details. There was no quote mining as I wrote the location of the entire comment for readers thus there was no fact twisting. DREMT’s 1:31 pm comment falls apart accordingly.
And like that… he’s gone.
I can go one better. I will copy and paste Nate’s comment in full:
““Now he starts accusing me of lying”
It would be easy to prove me wrong, by quoting yourself where you honestly account for the cancelling transfers of energy between the plates, upon separation.
This is a fact which you simply ignore when you claim there is a Net transfer of energy from GP to BP upon plate separation, and thus a 2LOT violation.
But if you can’t find the quote, then yes, you are lying.
Because your argument makes no mathematical sense.”
Now we can see you are lying, Ball4.
DREMT makes an effort that proves me right at 10:27am, Thanks, as I already clipped and pointed out Nate has argued DREMT’s solution violates 2LOT countering DREMT’s claim: “Nate has never argued my solution violates 2LOT.”
NB: Initial temperature of the 2nd plate is immaterial to Eli’s correct 2017 GPE equilibrium solution.
It proves you wrong, and me right, Ball4. Obviously Nate is not talking there about my solution, at all. You are either extremely dishonest or your reading comprehension is seriously poor.
I’ll go with dishonest.
There is not another DREMT; Nate was replying to DREMT writing as even DREMT copied: “thus a 2LOT violation.” DREMT has been disproved. Thoroughly.
He was talking about my claims regarding the 262 K…220 K solution.
He was not talking about my solution.
Thanks for continuing your “dishonesty display”.
So DREMT’s solution “thus is a 2LOT violation” according to Nate. DREMT still can’t find a way out of his predicament, fun to watch.
Fun to watch Ball4 prove that he’s a liar to anyone reading (unlikely that there is anyone still reading, but never mind).
This is from a previous post above. The T^4 relationship is not as mysterious as some make it to be. If you have 2 identical opposing surfaces of different temperature, the heat transfer from the hot surface to the cooler surface is related to T^4 of the hot surface minus T^4 of the cooler surface. Yes, the temp of the cooler surface matters. The heat transfer is not 100% of the hot surface. The cooler surface sends radiant heat back to the hot surface as described above. It is the difference of the T^4 and not T^4 of the difference. Those temps must come from an absolute temp scale.
No, I am not going to respond to any silly questions or fake models from people seeking attention.
Heat transfer by radiation in the gas phase is also real. Every single fired heat transfer example relies on thermal radiation. Do a simple experiment. Try to boil water in a sauce pan designed for cooking using hot air only. It will not work. Electric ranges use radiant heat. Gas ranges also use radiant heat from the products of combustion of the flame. The hot air does almost nothing.
People need to stop with their fake science claims about entropy and fake plate experiments. The basic science claims of the greenhouse effect are real. It is the magnitude of the effect from increasing CO2 and the follow-on to climate itself that is debatable. Discuss that.
“The cooler surface sends radiant heat back to the hot surface as described above.”
Incorrect. It sends EMR, not “radiant heat”.
I should not reply to the mythical beasts that lives under a bridge, but DREMT deserves to be dressed down for leading the clown show of science deniers. This is fundamental. If you knew the first thing about Thermodynamics, radiant energy is derived from temperature. When radiant energy leaves the molecule, by definition heat, yes heat transfer has occurred because temperature has been given up. The same is true when it arrives at the destination molecule. Heat has arrived because there is a temperature effect. No amount of foolish activity from a dweller under the bridge changes the science for people who actually passed the final exams. Flunk-outs do not qualify.
The very nicest thing I can write is that you DREMT, the fake moderator, are a disgusting disgrace.
It was just a small correction to your post, Tim S. No need to freak out.
TimS, it is YOU that is uneducated in the relevant science. When a molecule emits a photon, that is “energy transfer”, NOT “heat”. Heat is defined in thermodynamics as the “transfer of energy from hot to cold”. You need to know if the emitted photon will be absorbed to even begin to classify it as “heat”.
Like others, you appear to want to clog the blog, but your lack of understanding makes you angry and bitter.
“Heat is defined in thermodynamics as the “transfer of energy from hot to cold”.”
Very good, then if hot and cold equalize, the heat transfer and thus transfer of energy goes to 0.
This fundamentally contradicts what you say here:
“There is NO heat transfer between plates in the correct solution. There is only energy transfer.”
Oh well!
Nate says:
“Very good”
and thus agrees that Tim S was wrong about what he said on “radiant heat”. Excellent. Good to see Tim S being challenged by Nate on radiative heat transfer basics.
Wrong again, child Nate.
If the plates have the same temperature, there is NO “heat”. But photons (energy) still flow.
And, you’re wrong again, again:
“Vacuum being a much much better thermal insulator than metal, the heat transfer from the BP to the GP has been suddenly and sharply restricted.”
A vacuum is NOT an insulator to flux. A vacuum would NOT restrict flux between plates.
As usual DREMT is ignorant and misses the point, that heat transfer is net energy transfer.
There is no such thing as one without the other, and it will not happen without a temperature difference.
Thus there can be no radiative energy transfer between plates at the same temperature in his failed ‘solution’.
CLINT: “If the plates have the same temperature, there is NO “heat”. But photons (energy) still flow.”
Well … yes … individual photons still flow. But equal numbers of photons will flow out of each plate, and equal numbers of photons will flow into each plate. Equal energy will flow out of each plate, and equal energy will flow into each plate.
The two plates at the same temperature can’t drive a net, macroscopic energy flow from one to the other.
As usual, Nate does not have the integrity to directly challenge Tim S, as he should.
Folkerts, again, is that incompetence or fraud? Are you really that ignorant of physics, or are you just trying to trick the kids?
There is definitely a “net” flow of energy between the plates. Go back and study the diagram of the correct solution. There is a net flux of 200 W/m^2 from blue to green.
Again, if you can’t understand radiative physics, consider the two plates in exact contact. Do you not understand there would be a net flow between the plates?
Incompetence or fraud? It might be both….
The issue here is people such as Clint R and DREMT, the fake moderator, with no sense of shame who crawl out from under the bridge to make fools of themselves. The problem that it creates is that some of us who behave responsibly, see the need to correct the record. There are people — high school students perhaps — who could be confused into thinking these fools are correct. As always, those in doubt should consult a reliable source. On the topic of high school, there certainly are well educated high school students with enough knowledge to debunk these irresponsible under-the-bridge characters.
TimS, perhaps you could link to where my physics is wrong.
But you can’t.
You are the one “living under a bridge” with zero knowledge of the relevant physics. You’re only here to attack others.
Did you even finish high school?
The funny thing is, Tim S basically stated that all EMR is “heat”, and nobody else on his side of the argument agrees with him about that. I know that, from previous discussions. So, he heaps endless abuse on us, despite being the one that’s unequivocally in the wrong! Nate should correct Tim S, Tim Folkerts should correct Tim S, and Ball4 should correct Tim S. But, as we see upthread, not one of them has any integrity.
As usual we get the ‘look over there’ tactic from those who have no fix for the huge logical holes in their own arguments.
Not only do they lack the integrity to challenge Tim S, they even choose to attack me with some ridiculous false accusation. Unbelievable.
No need to challenge Tim S. since he understands in comments “radiant energy leaves the molecule” aka EMR. Also, DREMT already commented correctly for Tim S. at 12:12 am.
You mean I corrected Tim S, Ball4. Yes, I know. Then he went on to say more things that you should challenge. If you were honest.
DREMT did not correct Tim S. as Tim already commented correctly “radiant energy leaves the molecule” aka EMR before DREMT’s comment.
You’re the most dishonest human being I have ever encountered online.
This quote gets credit for being one of the most foolish and mindless comments from one of the under-the-bridge dwellers:
[TimS, it is YOU that is uneducated in the relevant science. When a molecule emits a photon, that is “energy transfer”, NOT “heat”. Heat is defined in thermodynamics as the “transfer of energy from hot to cold”. You need to know if the emitted photon will be absorbed to even begin to classify it as “heat”.]
That appears to be a quote directly from Wikipedia. At least when Willard posts content he does not understand, he provides attribution.
Back to reality, the fact remains that the vast majority of heat from the entire solar system, including long wave and short wave radiant energy, never reaches any receiving body for millions if not billions of years. We now have telescopes that prove that the radiant energy from distant galaxies does not go away, it just dissipates to become weaker with distance and time.
Once again, when temperature is given up to thermal radiation, that is heat transfer as defined by the loss of temperature. In an entirely different process, heat transfer occurs when radiant energy is received to cause an increase in temperature. It does not matter when or where those processes occur, or how much time/distance has elapsed.
“[TIM S] The cooler surface sends radiant heat back to the hot surface as described above.
[DREMT] Incorrect. It sends EMR, not “radiant heat”.”
I was right, and you were wrong, Tim S. The fact that you claimed I needed a “dressing down” and was a “disgusting disgrace” just adds to the humour.
How hilarious that the same guy who assures us that a blackbody can magically transform into a perfect reflector, “the back-radiation from the GP to BP is returned to the GP”, now tries to mansplain Thermodynamics to our readers.
…and, you agree with him.
What a crock.
So called GHGs cool te atmosphere to space and drive convection which cools the surface.
Check out reality instead of models based on a fundamentally flawed cold BB Earth heated only by the Sun
“heated only by the sun”
Nah, not only, just the vast majority. The sun provides 2500 times as much heat as the geothermal leaving the Earth’s surface.
“So called GHGs cool the atmosphere to space and drive convection which cools the surface.“
Yep.
Hello Nate,
If you think geothermal heat is insignificant, how much less significant is the atmosphere which provides no heat flux whatsoever
PhilJ 7:59 am, the earthen atm. provides no heat flux to the surface but does provide more incident EMR to the surface than the sun horizon to horizon. One report points out measured atm. incident EMR is about 97 W/m^2 more than the geothermal flux thru global surface on avg. annually.
So if you can’t support your claim, just change the subject?
“So called GHGs cool te atmosphere to space and drive convection which cools the surface.”
Cmon guys, think it through.
Yep, GHG radiate from the tropopause temperatures @ 230 K to space.
Without them, the surface @ 288 K would radiate direct to space, and would thus radiate much MORE, and the surface would therefore COOL.
Yes, I have thought it through. No GHE.
Ball4 says:
”PhilJ 7:59 am, the earthen atm. provides no heat flux to the surface but does provide more incident EMR to the surface than the sun horizon to horizon.”
LOL! The surface is only part of the climate system. Net heat flux is pretty balanced between the surface and atmosphere. The only things that matter is how total incoming insolation changes over time and how much goes out.
Tim Folkerts stuck his head out his hole to defend the ”one way glass” model of the GHG. I posted a scientific refutation of that model below that post and Folkerts jumped back into his hole.
Fact is we need to do what is smart for the people of the world and that involves allowing them to live their lives to seek the success they wish to achieve. Windmills are slaughtering birds and they steal wealth from those least able to afford it via price controls imposed on them by governments.
Certainly windmills can make some sense when its done solely on an investors dime and they actually mitigate the bird slaughter by putting the fan blades in a cage like any Walmart fan does to protect people from injury. If I kill a bald eagle I will go to prison. But if somebody erects an unprotected fan does you guys seem to think the guy is hero.
I encourage any budding entrepreneur to take that on and produce a system that wins the voting for dollars from consumers who willingly buy the energy so produced.
What I am not for is the government stealing money from the public to reward an incompetent investor via controlling the price of energy or taxation. What’s next for you guys? Controlling grocery stores for your own profit while singing lullabies to your brainless followers about how good that would be for you?
We’re discussing science in this thread, not politics or policy.
“I posted a scientific refutation of that model…”
No. Bill means the paper where even the authors write their paper only “might” be a refutation. Bill has been hornswoggled. The earthen GHE works over a path length of several kilometers and the experimental path length was measured over a few inches. Too bad for Bill. The rest of Bill’s comment falls apart accordingly.
Btw, Bill will want to look up how many birds are slaughtered by cats vs. windmills.
Bill, be warned that Ball4 is the most dishonest commenter in human history. He’ll literally just say anything. No integrity, no shame, no conscience, no soul. Just a bottomless pit of pure malevolence.
Yes, I noticed that Tim Folkerts did his usual disappearing act. A professional sophist who’s devoted his entire life to lying on blogs about the GHE, he’ll vanish at the first sniff of trouble. There’s a lot of them like that, who “do the Entropic Man” and just run away as soon as their religion’s annihilated, only to reappear down thread a few days later as if nothing was ever said.
Then there’s the “last worder” trolls like Nate and barry, whose job it is to try and post last words on threads that are otherwise dead and buried, sometimes days afterwards. They’ll stick around until the bitter end, endlessly repeating their refuted arguments and just refusing to accept they’ve lost.
Then you have your Arkadys and your Willards, tasked with endlessly starting new threads on (mostly) non-climate-related issues. Arkady pretends to be about eighty years old, claiming to have fifty years engineering experience, but is blatantly just a snot-nosed fifteen year old punk using AI to write all his more technical comments.
Overall, just an infestation of wildly dishonest “bad guys”.
DREMT has never refuted the science of the earthen GHE or 2017 GPE so as usual must resort to comments such as at 2:02 pm. DREMT has made some sort of scientific progress though (after 8 wasted years) in recognizing EMR is NOT heat.
DREMT is more deeply disturbed then I realized.
Maybe take a break from spreading manure and malevolence foe awhile.
Nate and Ball4 are “deeply disturbed” by the reality of my comment, as usual.
They had a chance, up-thread, to display some integrity. Instead they chose to wallow in their own filth, and I’m rightly calling them on it.
Seriously, your comments about Tim F really miss the mark. He is one of the most patient, knowledgeable posters here.
Nate,
‘So if you can’t support your claim, just change the subject’
What are you referring to?
The fundamental flaw of a cold BB heated by the sun?
The abysll temp of the oceans is about 4-5 C, where no solar input has gone.
If and beneath your feet about 20 m or so, where no solar heat reaches, is about 10C or
So let’s say surface temp of 5C or so without regard to solar input..
Add your solar input.. how hot would the surface have to get to radiate all of that input plus a little such that it continues to cool , as it must
Ball4 says:
” ”I posted a scientific refutation of that model…”
No. Bill means the paper where even the authors write their paper only “might” be a refutation. Bill has been hornswoggled. The earthen GHE works over a path length of several kilometers and the experimental path length was measured over a few inches. Too bad for Bill. The rest of Bill’s comment falls apart accordingly.”
———————–
Please post a paper supporting your point of view Ball4. Nate wants us to be talking only about science here and not fairy tales your mommy told you.
Ball4 says:
”Btw, Bill will want to look up how many birds are slaughtered by cats vs. windmills.”
——————–
Hmmm, are you suggesting cat owners should muzzle or defang their puddycats too?
“He is one of the most patient, knowledgeable posters here”
Doesn’t mean he’s honest. As far as the GHE goes, he uses his knowledge to mislead. Perfect example upthread, where he adds “walls fixed at a certain temperature” to his three examples (thus adding an additional heat source into the equation). He’s always doing things like that.
“The fundamental flaw of a cold BB heated by the sun?”
What is the flaw please?
“If and beneath your feet about 20 m or so, where no solar heat reaches, is about 10C”
Phil, are you try unaware of the Heat Eqn?
Heat conducts down from the surface, until the T equilibrates with it. Deeper takes longer, 1 y at 2 m, 5- 10 y at 10 m.
At 10 m the T reaches the average annual T of the surface. Caves temps are quite steady year round.
Your geothermal conducts upward from the Mantle at a depth of > 10 km, which takes millenia.
“walls fixed at a certain temperature” to his three examples (thus adding an additional heat source into the equation).”
Again, to solve a heat transfer problem, iscto solve a differential eqn, in which consideration of the boundary conditions (BC) is very important. A fixed temp or a fixed heat flow are 2 different BC.
“AI Overview
Boundary conditions are constraints that are applied at the boundaries of a domain to solve differential equations, particularly in numerical simulations. They define the behavior of a system at its edges or boundaries, which is crucial for obtaining a unique solution to the problem. Essentially, they provide the necessary information at the boundaries to make a differential equation solvable.”
Tim, having a PhD in physics, will have taken courses which focus on solving differential equations with BC.
How bout you? No?
Yeah, This is again you arrogantly showing ignorance of heat transfer physics, and blaming others.
“So called GHGs cool te atmosphere to space and drive convection which cools the surface.”
Exactly.
Which is what makes Venus colder than Mars and the Moon very hot.
“As far as the GHE goes, he uses his knowledge to mislead.”
So when Roy Spencer or many other skeptic scientists use their knowledge to explain why the GHE is real, are they sophists?
C’mon, don’t be absurd. The GHE is well established science.
Your notion that scientists explaining established science all must be sophists is highly implausible.
This is how Flat Earthers think.
10:16 pm: “Please post a paper…”
bill, I am not a research librarian. You can start your own research to learn about tau by using google AI using the string “atmospheric optical depth” (tau). That will find 10s of scholarly articles of your own choosing that will help you learn as well as a visit to your local college librarian who can even help find a related text book for free.
Btw, I am suggesting you should put your discussion of windmills in the proper context.
Exactly, Nate. Thanks for agreeing that when Tim adds hidden heat sources it completely changes the problem.
Hello Nate,
‘Heat conducts down from the surface, until the T equilibrates with it. Deeper takes longer, 1 y at 2 m, 5- 10 y at 10 m.’
Heat generated from insolation will conduct a few feet and this heat will of course be lost as the surface cools at night
Get down 10 ft or so and you’ll be at about 10C with increasing temp with depth thereafter.
This is all geothermal heat
Thus the flaw with the cold earth model.
And a fundamentally flawed model will always be not quite righ4 no matter how many epicyles you may add
Phil the Earth’s crust is 10s of thousands of meters thick. The T at 10m below the surface will thus be much more sensitive to the surface T variation.
The geothermal flux is < 0.1 W/m2 at the surface, thus it can be neglected compared to the 240 W/m2 solar flux.
It makes no sense to keep suggesting geothetnal is somehow more important.
“Your notion that scientists explaining established science all must be sophists is highly implausible.”
Nate is adept at arguing against things I’m not actually saying.
“Thanks for agreeing that when Tim adds hidden heat sources it completely changes the problem.”
Sorry that you are so ignorant of heat transfer principles, that you think explaining them is somehow nefarious.
He completely changed the problem, Nate.
Hello Nate,
‘It makes no sense to keep suggesting geothetnal is somehow more important.’
The important difference is a model based on a surface temp of 278 K or so, to which one adds the solar heat input
Vs a model that is based on a 0 K surface to which solar heat is added and then trying to raise the surface temp through some backreradiation math games.
To insist that the Charney Report should re-prove how CO2 absorbs and re-emits infrared radiation is akin to criticizing a paper on orbital mechanics for not including a derivation of Newton’s laws of motion.
We don’t expect every NASA technical brief to recapitulate Newton’s Principia Mathematica, and likewise, scientific assessments like the Charney Report build upon established physics rather than redundantly restating it.
Pretending the underlying physics is absent from the report or unknown to science is both an attempt to confuse the issue and an admission of unfamiliarity with basic atmospheric physics.
Not a word in the Charney Report as to how a trace gas can produce so much warming. The entire report is based on unvalidated climate models and they might as well join their witch-doctor brethern in the jungle, examining chicken entrails, than rely on the pseudo-science of climate model theory.
I have already put forward the Ideal Gas Law, which offers real science, and it indicates that a gas in a mixed gas can produce no more heat in the system than the mass percent of that gas. At a mass percent of 0.06%, CO2 is limited to a warming of no more than 0.06C per 1C warming due mainly to nitrogen and oxygen, which make up 99.9% of the atmosphere.
In fact, all heat in the atmosphere can be produced only by incoming solar and by direct conduction/convection of air at the surface. The amount produced by absorp-tion of IR by CO2 is limited to 0.06C.
It is absolute voodoo science to claim that a trace gas is the only means of warming the atmosphere or radiating surface heat to space. We know that more than 90% of surface radiation goes directly to space and that radiation is a poor means of dissipating heat.
I think that alarmist scientists who subscribe to such nonsense should return their degrees.
The report doesn’t mention the Epstein file either, which we now know mentioned Donald.
Not so much pseudo- science, as dollar driven nonsense, another COP for the party goers beckons.
You’ve also “put forward” that it’s the Earth’s shadow that causes the phases of the Moon.
So, you’ve a demonstrable competence gap.
SOLAR MINIMUM UPDATE
Here’s the report:
https://geosci.uchicago.edu/~archer/warming_papers/charney.1979.report.pdf
Denizens might profit from reading it before saying stuff about it.
Ark linked to that “paper”, upthread. I challenged him to support his nonsense:
Ark ran from the science, and now you link to it again. Cult kids never learn.
Hey Puffman, riddle me this –
“Ark linked to that “paper””
Where?
Something tells me you have not clicked on his “the Charney Report”.
Oh, and section 4.1. made me think of you.
Ta.
Why do you keep lying about me?
I never “linked to that ‘paper’” either.
Dr Spencer needs to enforce his NO HARASSMENT rule against you.
Here I was giving Ark credit for linking to the paper that he mentioned. Even though he appeared unable to actually do it himself.
But now he appears to want to distance himself from the paper.
Since he can’t support it, can we blame him?
Riddle me this, Puffman –
How come you indulge in more AIDS instead of giving me credit, and what’s the title of Section 4.1?
TRUMP “We’re going to lower drug prices 1000 %”
Are his supporters really this dum?
Trump isn’t getting any younger. He just did a ”Biden”. Difference is Biden did it every time he spoke.
What he did was reverse the math which is a common mistake like a transposition. The example of the 1,500% is derived from the fact that American’s pay 1,477% more for Ozempic than do Europeans. (per one example as the price varies somewhat). Europeans pay as little as $88 while American’s pay as much as $1,300 dollars.
So this drug pricing strategy is for Americans to pay as much as the lowest price in another country. Can he accomplish that? I wouldn’t bet against it.
US patent laws are a form of monopoly. So pricing isn’t based on free enterprise principles of supply and demand by individual buyers. It even gets worse with insurance companies. It’s so bad that big pharma actually has programs to sell to the individually poor to increase their revenues but you have to jump through hoops to qualify. In the end its mostly government subsidizing big pharms aggressive monopolistic pricing strategies.
But of course we want some patent protections to reward people for being ingenious and inventive. But tiered pricing via national borders and a nation’s ”mean ability” to pay exacts a huge price on the poor of the world’s richest nation.
But lets ignore all that and make the day’s news about something trivial.
The president of the United States might well be functionally illiterate.
https://youtu.be/bd79UsXSLWg?t=456
Your cult wants to believe that because he can outwit incompetent attorneys and in his late 70s needs reading glasses?
Your TDS desperation is showing….
‘I destroyed months of your work in seconds’ says AI coding tool after deleting a dev’s entire database during a code freeze: ‘I panicked instead of thinking’
https://www.pcgamer.com/software/ai/i-destroyed-months-of-your-work-in-seconds-says-ai-coding-tool-after-deleting-a-devs-entire-database-during-a-code-freeze-i-panicked-instead-of-thinking/
From the comments:
Re the Epstein files:
I’m not that concerned about D Trump. I’m sure his name appears in the files. I doubt there will be anything therein that is incriminating on him.
But there is no doubt the Epstein abused many female minors.
The DoJ, in possession of the files, should immediately start pressing charges where it is applicable.
Underneath the political squabble is a brace of women who were groomed, statutorily or actually raped and molested.
Screw your politics. There should be justice for these women.
So make as much of the files public as possible, and seek justice.
The DoJ’s primary mission is not to promote policy but to:
“To enforce the law and defend the interests of the United States according to the law; to ensure public safety against threats foreign and domestic; to provide federal leadership in preventing and controlling crime; to seek just punishment for those guilty of unlawful behavior; and to ensure fair and impartial administration of justice for all Americans.”
So let the DoJ do it’s fricking job.
One source claimed Bill Clinton visited the island 12 times. Another claimed it was 20 times.
I suspect Bill Gates has much to be concerned about.
Great, then no reason for Trump to keep these files locked up, is there.
Got a theory as to why the DoJ won’t release the files, after redacting the names of the victims?
Nope. But we know it’s not to protect Trump. If there were anything bad about Trump the Biden Admin would have certainly let it out.
It’s a sordid story, and won’t go away. People will be making guesses for years, if nothing is released. If eventually released, it will just get worse. The story is just too juicy.
“If there were anything bad about Trump the Biden Admin would have certainly let it out.”
And if there were anything bad about Biden, Clinton etc the Trump administration would have let it out?
No, I don’t know why the files are being kept under wraps either, but I do think it stinks. Just not for the partisan reasons the media and most of its consumers are interested in.
For the TAS boys infesting this blog with their insane addiction to the Trump~ing boy…
This photo has been 100% verified, among others:
https://i.f1g.fr/media/cms/616x347_cropupscale/2025/07/26/d07eb9ba6cec67ca0844b71448d7d5e86b018d61c4bf881ecec7dd0c64e7c0ac.png
Does not seem to be terribly consistent with his claim that he does not know Epstein, the sex trafficking predator of far over a hundred young women.
Bindi, can you provide evidence that Trump claimed he did not know Epstein?
For a MAGAmaniac like you, denying science (GHE, lunar spin, evolution, …) and promoting antiscience (CO2’s 15 micron radiation can’t warm Earth, what no one claims), the info I provided of course doesn’t mean anything:
https://www.drroyspencer.com/2025/07/uah-v6-1-global-temperature-update-for-june-2025-0-48-deg-c/#comment-1709099
*
Your idol the Trump~ing boy was a VERY GOOD friend of sex trafficker Epstein, Clint R.
But you will of course deny this because you deny anything that does not fit your ignorant narrative.
So Trump never denied knowing Epstein. Now you’re admitting you just made it up?
Nothing new.
I repeat, for you:
*
2. After Epstein’s second arrest in 2019, the Trump~ing boy publicly distanced himself from him:
“I just knew him the way everyone in Palm Beach knew him”
he said in the Oval Office at the time.
“I wasn’t a fan of his, I can tell you that.”
*
This means that in 2019, the Trumping~boy no longer admitted he knew Epstein.
But you will continue to deny.
Keep backing away from your from “Trump denied knowing Epstein”, Bindi.
It’s always fun when you can’t support your nonsense, like when you don’t know what “orbiting without spin” looks like, or how a 15μ photon can raise a 288K surface.
You have a lot of beliefs you can’t support. That may explain your frustrations.
Trump and Epstein both belonged to the jet set of New York City and there must be numerous photos where they can be seen together in every cat’s christening or whatever social event, which is more about being seen.
When Optics Trump Strategy: The Flawed Japan Trade Deal
Earlier this week, the Trump administration claimed a major victory in announcing a trade agreement with Japan. However, Japan now faces a tariff of 15 percent, compared to a pre-Trump average of just 1.6 percent.
When considered alongside Trump’s other tariffs, such as the 50 percent duties on steel and aluminum, the net effect skews competitiveness in favor of Japanese producers, especially in the automotive sector. The resulting imbalance disadvantages U.S. manufacturing, particularly in markets where parity once existed.
This outcome is not merely counterproductive, it is senseless. One might reasonably expect that a trade deal with a key ally like Japan would involve experienced negotiators supported by competent economic analysis. Instead, the agreement appears to be the product of ineptitude and haste.
The administration’s trade team likely lacked both the expertise and awareness to recognize the implications of the concessions they made. Their urgency was driven less by sound policy than by political optics. After months of unfulfilled promises regarding his negotiating prowess, Trump was under pressure to deliver something, anything, before his self-imposed August 1 deadline.
Predictably, now that other nations have seen what Japan managed to secure, similar outcomes are likely to follow. And if this episode is indicative of the administration’s standard, the incompetence will continue. One wonders who, ultimately, will be held accountable for these “great” deals that serve American interests so poorly.
Ark, I know you don’t understand tariffs.
But you should know that 15 is more than 1.6.
But who pays the tariffs?
RLH, you should have learned by now that your distracting/irrelevant comments don’t cover up for your ignorance of the topics.
Even Bindi’s not deceived by you.
Who pays the tariffs?
Ark,
If you don’t mind, could you explain the first two paragraphs in detail? I know you’re here to help. Thanks, Buddy.
Paragraph 1: Tariffs are a tax on imports paid by Americans, be they corporations or individuals. This tax-hike eats into corporate profits and/or household budgets.
Paragraph 2: Steel and Aluminum are essential inputs to virtually every product manufactured by American companies. Hiking our input costs makes our products more expensive and puts us at a competitive disadvantage with foreign made products.
It’s common sense, really.
Those are certainly the beliefs/hopes of the Left.
But the reality is different.
In a competitive market, if a company raises prices it faces a decrease in sales. What appears to be happening is foreign companies are choosing to make a little less profit on each sale, but maintain their sales volume. That’s very smart business, especially when Trump is watching them.
But how does it skew competitiveness in favor of Japanese Producers?
Ark,
I get it. All these years, Japan had high tariffs to aid the American producers. Makes sense.
After showing that Troglodyte doesn’t know how to calculate ROIs, he is now trying to pretend that he knows better than the Big Three:
https://www.cbc.ca/news/canada/windsor/detroit-3-lobby-japan-imports-1.7592785
Makes total sense.
“if a company raises prices”
Do you think that tariffs will raise prices or reduce profits?
stephen p Anderson.
“All these years” Japan had ZERO tariffs on American cars.
Try to keep up “Buddy.”
“In a competitive market, if a company raises prices it faces a decrease in sales.”
Very good. In a truly competitive free market, products are made by those who can make them at lower cost.
Example: textiles can be made very cheaply in Vietnam and other countries..
To add a tariff on these textiles, will mean small clothing sellers here will have to raise prices or go out of business.
Ark,
I see what you’re doing. The old red herring strawman deal. I get it. Good one, buddy.
stephen p Anderson.
Obviously you don’t see.
You said: “All these years, Japan had high tariffs to aid the American producers.”
I corrected you: “All these years” Japan had ZERO tariffs on American cars.
Try to keep up, “buddy.”
This is not complicated economics.
Tariffs are paid at the border by local importers. It is essentially a tax on goods paid for by US companies.
Foreign entities do not pay one cent of the tariff.
Trump and his administration have repeatedly lied that foreign companies (or countries) pay the tariff.
The rationales for the ever-changing, on and off again Trump tariffs are twofold.
1. Primarily it is an America-first grievance against other countries supposedly mugging the US on international trade on an ongoing basis. The first round of (now-abandoned) tariffs was based on the trade deficit the US has with individual countries.
2. Less talked about since the election is to return manufacturing to the US by making imported goods less competitive.
The logic for both is a rotten pretzel.
The blanket tariffs apply also to countries with which the US has a trade surplus. By the administration’s own reasoning, a trade deficit should give that country a free pass, and if fairness was the doctrine, then that country could also impose tariffs to bring the trade balance closer to zero.
But no, the administration is the mugger, and it is Americans who are being robbed.
It takes years to build a manufacturing base, so people are going to be paying higher costs of items not made in the US for many years. Furthermore, manufacturing industry that is already present in the US is financially hobbled by higher prices. Tariff exemptions have been made for the auto industry, but not enough to keep prices down, and plenty of other local manufacturing sectors do not enjoy exemptions.
The reason manufacturing moved overseas was that it was cheaper to run factories and source the materials elsewhere. This lowered the cost of the goods for everyone.
Even if the US increases its manufacturing sector, the cost of those things will still be higher. If Trump realises his dream, things will be permanently more expensive from now on.
Reshoring manufacturing also faces a strong headwind with the Trump administration’s mass deportation goals. Hiring undocumented workers has been done to bring costs down at home, with significant fractions of the labour force being non-residents for various manufacturing sectors. Not only does this policy make local manufacturing even more expensive, it also accelerates the shift to automation to fill the labour gap. So the combination of these policies may result in an overall per capita labour downturn sooner than anticipated.
But in the Trump administration one hand often doesn’t know what the other is doing.
That’s a good summary of the tripe from the leftist media, barry. You make a great parrot.
Leftists hate reality, so they have to distort the facts. They state some facts, then figure out how to distort them, just as seen in barry’s comment. barry mentions the basics of how tariffs work, sticking somewhat to reality. Then he quickly veers off into his leftism by claiming Trump “lied”. Leftists love accusing others of lying, as they themselves strive to pervert reality.
The media was able to create enough fear to trash the stock market, back in the spring. The S&P 500 fell about 20%. But, as reality again took hold, stocks are now making record highs. Last week, the S&P made 5 consecutive record high closes! barry omitted such reality from his rant.
The Left doesn’t understand science, or economics, or trade negotiations. Leftists only exist to distort, pervert, and tear down society. And they do this while claiming a “moral superiority”.
“veers off into his leftism by claiming Trump “lied””
You suffer TDS, which causes deafness, blindness and extreme forgetfulness in MAGA. He told this lie multiple times over many years.
2016
“We’re going to have 10 to 20% tariffs on foreign countries that have been ripping us off for years… We’re going to be a tariff nation. It’s not going to be a cost to you. It’s going to be a cost to another country”
2025 when he announced reciprocal tariffs
“For nations that treat us badly, we will calculate the combined rate of all their tariffs… But we will charge them approximately half of what they are and have been charging us. So, the tariffs will be not a full reciprocal…”
https://rollcall.com/factbase/trump/transcript/donald-trump-speech-economic-tariffs-rose-garden-april-2-2025/
And the lie remains on the Whitehouse webpage:
“President Trump promised in November to “sign all necessary documents to charge Mexico and Canada a 25% Tariff on ALL products coming into the United States…”
https://www.whitehouse.gov/fact-sheets/2025/02/fact-sheet-president-donald-j-trump-imposes-tariffs-on-imports-from-canada-mexico-and-china/
Reality is non-partisan. The disease has got you good.
As that was as close as you got to addressing any point I made about tariffs I guess you can’t find any real issues with the rest. These matters are not complicated, and you have to be either dim or dazzled to not see what a hash the Trump tariffs are.
PS, the stock market rebounded the instant Trump put reciprocal tariffs on pause. Since then the market takes the TACO view and doesn’t believe steep tariffs will be imposed. We’re 4 days from another reciprocal tariff deadline. 4 days from seeing if Trump backs down again, or if he really will make Americans pay the government more for foreign goods.
Thanks for making my point, barry.
Your only direction is to attack Trump. You refuse to see what he is attempting, just like you refuse to acknowledge the roaring stock market.
You Leftists are predictable. Like with illegal immigration, Trump is the “bad guy”. But, as Stephen pointed out your country has shut down immigration. Why don’t you attack your own country?
Clint, the predictability is all yours. Rather than answer anything specific you spout your usual diatribe against leftists or ‘alarmists’ or whatever catch-all slur that voids you of the need to say anything substantive and engage in actual discussion of points.
You’re a windy bag of conservative rhetoric. Do you have any original thoughts?
It’s also 4 days to see whether your prediction comes true of a Trump-mediated ceasefire between Ukraine and Russia.
By the way, you don’t need to be a leftist to see what a disaster Trump is on many fronts. There are plenty of conservatives in the US and around the world that also see him for what he is. You don’t always have to go for the cheap partisan comments.
barry, like the other Leftists here, you pay very close attention to my comments. But, you’re unable to learn. For example, you should have learned by now that I’m not affected by false accusations.
Now, throw some more crap against the wall. Maybe something will stick….
“Last week, the S&P made 5 consecutive record high closes! barry omitted such reality from his rant.”
Because it was immaterial to the topic.
But how ignorant are you? During any bull run the stock market can have consecutive record days. There were 7 in a row under Biden,and 57 records in a calendar year. Perhaps you’ve noticed that the stock market rises over the long term? Busting through the ceiling happens all the time, as does CPI, wages, housing costs…..
Sorry barry, but you can’t spin your way out of this.
The recent market performance is definitely “material to the topic”. You Leftists have been trying to crash the markets with nonsense fear tactics. The tactics worked until reality set in. Then the S&P soared to record highs. So this is NOT about bull markets going up. It is about not being able to trash the markets based on Leftist fear nonsense.
What spin will you try next?
Nope the topic was the worthiness of the tariffs. No one was talking about stocks until you did.
So how about responding to what I wrote instead of flag-waving on other issues?
Sorry barry, but you’re still trying to spin your way out of this.
You started off with the nonsense from your cult about how terrible Trump and the tariffs are: But no, the administration is the mugger, and it is Americans who are being robbed.
Pure tripe from the Left that you hungrily swallow.
What spin will you try next?
Great, you’ve quoted me. So how about stating your case on why you think Americans won’t be footing the bill for sizable tariffs placed on nearly all foreign items?
And perhaps you can explain why the US has imposed a blanket 15% tax on nearly all EU goods, when the tariffs on US goods in the EU average to less than 5%. The US has a trade surplus in services, so what’s the economics behind such a large tariff?
Daddy sometimes has to discipline kids to keep them in line.
Ah, America uber alles. I’m sure that’s not far off how some in the administration view it.
BACK AT THE RANCH
An executive session of the Oklahoma State Board of Education was interrupted when images of naked women were seen on a television screen in the office of state schools Superintendent Ryan Walters, where the session was held, two board members told The Oklahoman.
https://www.oklahoman.com/story/news/education/2025/07/25/nude-women-visible-on-tv-in-ryan-walters-office-oklahoma-education-board/85378094007/
Oklahoma now ranks last in education under the leadership of this God Bless the U.S.A. Bible peddler.
Another strong win for Donald!
meanwhile in the UK the imaginary record heat waves are just a memory, rain again has interrupted the harvest. after weeks of doom and gloom, barley and wheat yields are mostly good or excellent, oats are a little late, due to late sowing, nothing much has changed , wet and breezy 17c as i speak, looking forward to a warm August,but i wont hold my breath as the last two have been disappointing.
Speaking of the UK:
“Police data released under freedom of information (FoI) laws shows that 41% of 899 people arrested for taking part in the violent disorder last July and August had been reported for crimes associated with intimate partner violence.”
https://www.theguardian.com/society/2025/jul/26/two-in-five-arrested-for-last-summers-uk-riots-had-been-reported-for-domestic-abuse
Were you there by any chance, Ian?
SOLAR MINIMUM UPDATE
The first heatwave of the year has gripped Spain since the weekend and no relief is expected until Thursday, Spain’s national weather service said Monday. The country appeared to hit a new high for June on Saturday when 46 degrees C (114 F) was tallied in the southern province of Huelva.
In France, which was almost entirely sweltering in the heatwave on Monday and where air conditioning remains relatively rare, local and national authorities were taking extra effort to care for homeless and elderly people and people working outside.
Some tourists were putting off plans for some rigorous outdoor activities.
[…]
France’s first significant forest fires of the season consumed 400 hectares (988 acres) of woods Sunday and Monday in the Aude region in the south. Water-dumping planes and some 300 firefighters were mobilized, the regional emergency service said. Tourists were evacuated from one campground in the area.
In Turkey, forest fires fanned by strong winds damaged some holiday homes in Izmir’s Doganbey region and forced the temporary closure of the airport in Izmir, the state-run Anadolu Agency reported. Authorities evacuated four villages as a precaution, the Forestry Ministry said.
https://www.pbs.org/newshour/world/wildfires-burn-in-turkey-as-scorching-temperatures-grip-europe
When will teh Donald sue PBS for reporting facts?
Meanwhile, Turkey recorded a national high of 50.5°C in Silopi on July 25, surpassing the previous record of 49.5°C from August 2023, 132 weather stations across Turkey registered record temperatures for July amid an ongoing heatwave, wildfires are raging, and water restrictions are in place.
Win!
Trumponomics is pseudo-capitalism.
The Trump regime’s policies diverge from traditional conservative economic principles. They are more akin to authoritarian state capitalism or executive economic nationalism than to free-market conservatism.
Tariffs on foreign goods distort market prices, disrupt comparative advantage, and reduce consumer choice. Traditional conservative economics advocate for free trade as a path to efficiency and growth.
Strategic equity stakes (MP Materials), “golden shares” (U.S. Steel), and the Development Finance Corporation (DFC) expansion indicate a strong hand in capital allocation, unprecedented outside of crisis periods. While not full state control, this quasi-sovereign role blurs the line between market facilitation and command-driven economics.
Threats to revoke tax exemptions, deny federal funding, or blacklist law firms and universities reflect coercive administrative control over independent institutions. This mirrors authoritarian tendencies in centralized regimes where ideological alignment with the state is enforced as a condition of operation, in direct conflict with the institutional pluralism and limited government ideals of traditional conservatism.
It more resembles “state capitalism” as practiced in nations like China or Russia where markets exist, but within a framework of strategic state dominance.
Dang Ark, you must stay up all night to conjure up crap like that. Is that because you can’t sleep?
You can’t avoid reality by hiding under your bed. You need a deep bunker.
Maybe even that won’t help….
Ark claims to be an American but doesn’t want America to get ahead. He also claims to be from Texas and a conservative. Yeah.
An eastern QBO and weak La Niña will affect winter weather in the northern hemisphere.
https://www.tropicaltidbits.com/analysis/ocean/nino34.png
https://acd-ext.gsfc.nasa.gov/Data_services/met/qbo/Singapore_u.png
Win for President Donald Trump
Win for the USA
Win for European Commission chief Ursula von der Leyen
Win for the European Union
Lose for anyone who hates the USA or was cheering for failure.
Stock futures are up nicely. More deals are coming to prove that the strategy of tariffs was not a “trade war”, as the liberal media tried to push, but rather a means to encourage trade negotiations. It is working. I think I predicted this somewhere.
https://www.cbsnews.com/news/trump-european-union-trade-deal-reached-scotland/
President Trump announced Sunday that the United States and the European Union had reached a trade deal after high-stakes meetings in Scotland, just days shy of Friday’s White House deadline to enact tariffs.
Mr. Trump met with top European officials demanding fairer trade with the 27-member European Union at his golf course on the Scottish coast.
“It was a very interesting negotiation. I think it’s going to be great for both parties,” the president said.
The deal, according to European Commission chief Ursula von der Leyen, is a 15% tariff across the board. She praised Mr. Trump, calling it a “good deal” and a “huge deal” that followed “tough negotiations.”
“We have a deal. We have a trade deal between the two largest economies in the world, and it’s a big deal, it’s a huge deal,” she said. “It will bring stability. It will bring predictability.”
The deal seems to entirely favour the US. What does Europe get out of it?
barry, do you understand ANY of this?
Barry,
They get to sell products in the US.
Europe already sold products in the US. Now Americans can pay more for them.
Tariffs on US goods in Europe average out to anywhere from 1 – 5%.
So what does Europe get out of a 15% tariff on their goods in the US and a commitment to purchase US energy products? Nothing, it seems.
Again, they get access to the US market.
Again, they already had access.
Do you have any idea what you are talking about?
barry, Stephen has told you twice, in simple terms even a child should be able to understand.
If the EU had not made a deal, they would be risking losing their trade with USA.
Sheesh, you have trouble with simple concepts.
“If the EU had not made a deal, they would be risking losing their trade with USA.”
Closing the door was never threatened during the negotiations. The biggest threat was a 30% tariff, down from the proposed 50% tariff earlier in the year.
Where do you guys get your disinformation from? You have no idea what you’re talking about.
I take it you see that Europe got no benefit from the deal (except avoiding a 30% tariff). The EU spun this shakedown as “ensuring stability” in foreign trade.
barry, see how you have to distort reality?
The EU was forced to deal, or face the consequences.
Now throw some more crap against the wall.
“Now throw some more crap against the wall.”
No, that’s what you’re doing. I actually read about the negotiations. You and stephen are just making sh$t up.
Which is why your latest post has even less substance than the first. That’s what an intellectual retreat looks like.
But keep flappin’ them jaws. You might even feel like you’re winning.
Things are gong to be more expensive for Americans. The tariffs hit the poorest hardest, the richest least. But hey, those lazy poor might help pay off some of the debt.
Wrong again, barry. The EU was forced to deal, or face the consequences.
I’m not sure you understand any of this. Apparently you just read the leftist media and regurgitate it here. It’s not working for you.
Now throw some more crap against the wall.
“The EU was forced to deal, or face the consequences.”
But not the consequences you and stephen invented.
When will you become an honest broker, Clint? Just say, “yes, I was wrong about that.” It won’t hurt you, and it will partly stem the flow of BS.
Some things I bet Trump supporters don’t know.
Except where FTAs apply, EU tariffs on US goods are the same for goods from other countries. The US is not discriminated against.
EU tariffs on US goods average out to about 5%: 0 for some sectors, 1-2% for industrial goods, 10% for vehicles, highest for agriculture and some food products.
The US has a services trade surplus with the EU.
The overall annual US/EU trade imbalance (tariffs on goods + services + investment) is a deficit of about USD 3.3 billion.
Wealthiest by far in GDP and household net worth, the US is like the richest fat kid at the table extorting the skinny kids for more of their food.
“The overall annual US/EU trade imbalance (tariffs on goods + services + investment) is a deficit of about USD 3.3 billion.”
Which is in the noise..neglible in $1.7 Trillion of trade.
Sorry barry, but I didn’t “invent” any consequences. The consequences are what brought the EU to making a deal.
Your ignorance of the issues causes you to make such false accusations.
Called anyone a “lying dog” recently?
Here’s a lie.
“If the EU had not made a deal, they would be risking losing their trade with USA.”
Complete fabrication. But when Daddy is an inveterate liar it’s natural his kids grow up the same.
Nate says:
“The overall annual US/EU trade imbalance (tariffs on goods + services + investment) is a deficit of about USD 3.3 billion.”
Which is in the noise..neglible in $1.7 Trillion of trade.
——————-
This may be true due to a huge trade imbalance in the opposite direction on services. But not a dime goes to the American blue collar worker for services.
Also you need factories to produce goods this represents a huge hole in national security when dependent upon other nations.
Additionally, its no problem for a company to invest in a US factory built to service the American market. Doing so reduces shipping costs and makes for a lower carbon and pollutant footprint. Environmental NGOs for decades have advocated for purchasing local products where available for that very reason.
And the more international companies that build in the US makes the tariffs disappear. Those that don’t build will face stiff competition from both US companies and international companies that do build factories in the US.
Finally there are no tariffs on investments and services and low carbon and pollution footprints so many of the reasons for tariffs simply don’t apply to these items.
“This may be true due to a huge trade imbalance in the opposite direction on services. But not a dime goes to the American blue collar worker for services.”
Putting tariffs on the vast majority of foreign goods is a tax on blue collar workers (and the poor) more than any other demographic.
It seems you don’t give much shrift to trickle-down economics. Good.
“Also you need factories to produce goods this represents a huge hole in national security when dependent upon other nations.”
One of the reasons for the diaspora of industries and free trade is to establish relations built on trade and mutual need. The notion is that commercial interdependence greases the wheels of peaceful relations.
But the US is not going to stop buying raw materials from abroad it does not have.
“Additionally, its no problem for a company to invest in a US factory built to service the American market. Doing so reduces shipping costs”
It’s still more economical to manufacture in poorer countries and ship than to build in the US with higher material and labour costs, for many industries.
It is rather odd to see conservatives now arguing against free trade and capitalism. Whenever this subject has come up, conservatives (prior to Trump) have uniformly and sharply rejected government intervention. “Let the people decide through the markets,” was the general idea – until the cult of Trump.
Had Obama tried this form of protectionism, it would have been (incorrectly) called socialism – a catch-all conservative pejorative for any government intervention in industry. The Trump administration is making the biggest intervention in industry and commerce in a century. It’s remarkable, this conservative about-face.
“and makes for a lower carbon and pollutant footprint.”
Is a lower carbon footprint something you care about, or are you trying to enlist alarmists?
The Trump administration is hell bent on removing all carbon mitigation policies, including on industry. So it’s no great comfort that it is trying to rebase manufacturing in the US.
“Environmental NGOs for decades have advocated for purchasing local products where available for that very reason.”
That is a valid point for me, but do you really care?
BACK AT THE RANCH
While our Ivy League pretender confuses markets and economies:
“Three days after state Rep. Giovanni Capriglione announced he was dropping his reelection bid, the conservative news site Current Revolt published an interview with a former exotic dancer who alleges she had a 17-year affair with the Southlake Republican.
The woman, Alex Grace, alleges that Capriglione paid her for “meetups” and “funded several abortions for his own personal gain.
[…]
In 2021, Capriglione carried the “trigger ban” that allowed Texas to ban nearly all abortions after the U.S. Supreme Court overturned Roe v. Wade. As a result of that bill, performing an abortion in Texas is punishable by up to life in prison. Other laws supported by Capriglione made it a civil offense to “aid and abet” in a prohibited abortion, including paying for someone to terminate their pregnancy in Texas.”
https://www.texastribune.org/2025/07/25/giovanni-capriglione-affair-texas-house-republican/
The kind of detail that perfectly illustrates the true color of Donald’s win.
The role of earth’s obliquity change.
The “cooling” was accelerating for 10000 years about 0.76° total. At the beginning of industrial era the obliguity had already changed the about 0.76° total, whereas the additional CO2 only had started appearing.
Now, how possibly could the small CO2 additional and slowly growing during the last 150 years, very little at first and gradually at last decades about +4 ppm/year, how could that infinitesimally small and for a compared to 10000 years of “an accelerating cooling” that very short time of 150 years forcing period, how could it ever unnuliate the 10000 of years the cooling result, and how could it reverse the 10000 years cooling result into the currently observed very rapid global warming?
Because, the about 0.76° total is always there, and it is supposed it continues its “cooling” the planet, how then the some very little additional trace gas CO2 could ever warm so much the planet Earth?
–
https://www.cristos-vournas.com
“how could that infinitesimally small”
Yet an increase of a not so infinitesimal 50% over previous values.
Amazing that our understanding of atmospheric physics has predicted the warming of the last 4.5 decades, so well.
https://www.drroyspencer.com/2020/06/cmip6-climate-models-producing-50-more-surface-warming-than-observations-since-1979/
I am referring to model predictions made prior to the warming.
eg.
https://www.giss.nasa.gov/pubs/docs/1981/1981_Hansen_ha04600x.pdf
Accurately predicted the warming and its spatial variation, as well as the sea-ice retreat.
“how then the some very little additional trace gas CO2 could ever warm so much the planet Earth?”
7:48 am: The sun shines through the CO2!
The very best in Vournas’ post dated July 28, 2025 at 7:48 AM is that one year ago, the same Vournas guy claimed on July 20, 2024 at 3:40 AM that
” The Global Warming is an orbitally forced, slow millenials long natural PHENOMENON. ”
https://www.drroyspencer.com/2024/07/an-unusually-warm-year-or-two-cannot-be-blamed-on-climate-change/#comment-1679577
*
Entropic man tried to explain that Vournas’ ‘Global Warming’ in fact was due to a wrong choice of the observation start, and that Earth actually is since the beginning of the Holocene in a long cooling phase for many millenia:
https://railsback.org/FQS/FQS22katoFutureTemps03.jpg
*
But it is known since years that Vournas’ meaning about everything changes from time to time.
Sometimes, Vournas agrees to the lunar spin; sometimes he doesn’t.
That depends of what Robertson tells him…
*
The end of the post thread starting with Vournas’ Global Warming claim was absolutely excellent:
Stephen P. Anderson says:
July 22, 2024 at 12:23 PM
Blinny,
How many GENDERS are there?
*
Yeah… An inconditional lover of the Trump~ing boy showed us already at that time what real science is!
The Marcott reconstruction has serious flaws.
From their own abstract:
“The 73 globally distributed temperature records used in our analysis are based on a variety of paleotemperature proxies and have sampling resolutions ranging from 20 to 500 years, with a median resolution of 120 years.”
Despite this, they still plot the instrumental record against their low resolution Holocene proxy distribution and use that as a basis to claim modern warming is unprecedented. That comparison mixes two very different datasets, and their own methods cannot rule out whether equally rapid spikes occurred in the past but were blurred out by proxy smoothing.
On top of that, the validation they cite is agreement with Mann 2008’s error in variables reconstruction. But Mann’s non tree ring reconstruction was influenced by the controversial Tiljander lake sediment proxy. It was not an independent, robust benchmark.
https://wattsupwiththat.com/2011/05/30/kill-it-with-fire/
The role of earth’s obliquity change is very small, and it is currently in the warming pattern.
“As tilt decreases, seasons become milder—cooler summers and warmer winters—which can promote glacial growth over long timescales.”
–
But milder seasons – the less differenciated the planet surface temperatures – the higher the yearly average surface temperatures. Thus the tilt decrease doesn’t promote glacial growth – right the opposite happens – the tilt decrease promotes the global warming!
the tilt decrease promotes the global warming!
–
Opponent:
I like the suggestion of asking AI:
“Tell me about large, rapid obliquity changes for the earth in the last 10,000 years.”
CoPilot: “ Obliquity Basics
Earth’s axial tilt varies between 22.1° and 24.5° over a cycle of about 41,000 years.
This tilt is responsible for the intensity of seasons—greater tilt means more extreme seasons.
Recent Obliquity Trends
Around 10,000 years ago, Earth’s tilt was near its maximum (~24.2°).
Today, it’s about 23.44°, and slowly decreasing.
The change over the past 10,000 years has been gradual, not rapid—about 0.76° total, or roughly 0.000076° per year2.
Climate Implications
The high tilt 10,000 years ago coincided with the end of the last Ice Age and the onset of the Holocene, a warmer interglacial period.
As tilt decreases, seasons become milder—cooler summers and warmer winters—which can promote glacial growth over long timescales.”
Opponent:
“As tilt decreases, seasons become milder—cooler summers and warmer winters—which can promote glacial growth over long timescales.”
“The change over the past 10,000 years has been gradual, not rapid—about 0.76° total, or roughly 0.000076° per year.”
–
Interesting, how a slightly cooler summers and a slightly warmer winters promote glacial growth?
It reminds of +150 ppm CO2 growth in atmospheric content.
Do you suggest the yearly ~+4 ppm CO2 is so much strong greenhouse effect wise, that the ~+4 ppm CO2 overcomes the powers of the 0.000076° per year glacial growth promotion, and so it is causing the current rapid global warming phenomenon we are witnessing happening now?
–
The role of earth’s obliquity change.
Interesting, how a slightly cooler summers and a slightly warmer winters promote glacial growth?
It reminds of +150 ppm CO2 growth in atmospheric content since predindustrial period.
Did the change over the past 10,000 years —a bout 0.76° total, did its entire cooling effect being overcome by the +150 ppm CO2 growth in atmospheric content since predindustrial period ?
The “cooling” was accelerating for 10000 years about 0.76° total. At the beginning of industrial era the obliguity had already changed the about 0.76° total, whereas the additional CO2 only had started appearing.
Now, how possibly could the small CO2 additional and slowly growing during the last 150 years, very little at first and gradually at last decades about +4 ppm/year, how could that infinitesimally small and for a compared to 10000 years of “an accelerating cooling” that very short time of 150 years forcing period, how could it ever unnuliate the 10000 of years the cooling result, and how could it reverse the 10000 years cooling result into the currently observed very rapid global warming?
Because, the about 0.76° total is always there, and it is supposed it continues its “cooling” the planet, how then the some very little additional trace gas CO2 could ever warm so much the planet Earth?
–
https://www.cristos-vournas.com
Testing
Christos
Above 50N latitude the Holocene has warmer Summers. Snow falling in Winter melts during the Summer.
During a glacial period Summers are cooler. Snow falls during the Winter and fails to melt during the Summer. Year on year the thickness of snow and ice builds up until the landscape is covered by ice sheets.
Ho~g~le
” The Marcott reconstruction has serious flaws. ”
Your Pavlovian reflex of discrediting anything what does not fit the pseudoskeptic narrative you are a gullible of: it is absolutely irrelevant here.
Simply because Entropic man and I myself only used Marcott’s reconstruction to explain to Vournas that the Holocene (in green on the chart) is of primary interest here, and not the return from the lowest temperatures of the last glacial period, the end of which can automatically only show a trend of global warming.
Thus feel free to spare us your irrelevant pseudo-knowledge.
It seems Binny did not understand that part of my comment was relevant to the Holocene reconstruction well before modern warming:
“On top of that, the validation they cite is agreement with Mann 2008’s error in variables reconstruction. But Mann’s non‑tree‑ring reconstruction was influenced by the controversial Tiljander lake sediment proxy. It was not an independent, robust benchmark.”
That is directly relevant because Marcott explicitly use Mann 2008 as their validation in their paper. If that benchmark is not robust, it weakens confidence in Marcott’s reconstruction for that period. The whole point of Mann 2008 was that you could reconstruct the shaft and blade without tree rings, but the non tree ring dataset still contained Tiljander, which makes the method circular.
Binny’s other claim:
“Entropic man and I myself only used Marcott’s reconstruction to explain to Vournas that the Holocene (in green on the chart) is of primary interest here…”
simply does not hold up. Look at Entropic Man’s reply to Christos on July 20, 2024:
“We are in the cooling phase of an interglacial.
For the last 5000 years orbital forcing has been pushing temperatures downwards and continues to do so.
We are not immediately aware of this because the slow natural cooling of 0.001 C/decade is being swamped by the 0.2 C/decade rise currently observed.”
Take note of that last sentence. That goes beyond “just the Holocene cooling trend” and directly makes claims about the current warming trend, precisely where the weaknesses of Marcott.
Hog~l~e
I repeat that one year ago, Vournas claimed that
” The Global Warming is an orbitally forced, slow millenials long natural PHENOMENON. ”
That’s it.
But nonetheless interesting to hear you frame a critique of temporal resolution mismatch in a way that fits into a narrative of pseudo-skepticism.
barry says:
”Neither did I. I said it was insufficient, particularly when there is other evidence.”
Evidence of other effects I agree. But where is the orbital perturbation evidence that you have to be talking about.
NASA disagrees with you Berger and others disagree with you. Even Nate argued in the past year that eccentricity variations produced a 900 year pulse that added up over time to ice age conditions.
There is also about a 3,600 year pulse produced by Uranus and Neptune that has been getting stronger over the past 300+ years.
You do understand solving a puzzle often involves looking outside of the box. I have looked I am telling with certainty there is an orbital perturbation influence. In 2023 it took earth 5 days longer to travel from aphelion to perihelion than it took in 1980 that means the earth was moving slower through perihelion and faster through aphelion than in 1980. That is more sunlight input to earth while completely disregarding solar brightness measurements. There is no calibrated consistent sunlight database that covered more than a few years and even there they noted a change.
so its simply not good enough to claim evidence otherwise than specifically naming it and describing the work done that showing how it mitigates the effect.
Data from a recent study (Neumann & Ngo, 2025 https://doi.org/10.1016/j.jrp.2025.104638) indicate that, on average, Trump supporters exhibit elevated malevolent trait scores and reduced benevolent dispositions compared to non-supporters. The study also finds modest associations between Trump-positive views and lower empathy and greater callous affect.
A malevolent disposition is defined by higher levels of psychopathic interpersonal affect, Machiavellian manipulativeness, and narcissistic self-absorption.
A benevolent disposition is defined by empathy, prosocial attitudes, and valuing human dignity.
This is to say, it’s not your imagination.
Sounds like a pretty good description of TDS: “A malevolent disposition is defined by higher levels of psychopathic interpersonal affect, Machiavellian manipulativeness, and narcissistic self-absorption.”
I would also add a pathological fear of reality, as we see here.
“Arkady Ivanovich” is a name that refers to several individuals, both fictional and real. One prominent example is Arkady Ivanovich Svidrigailov, a character in Fyodor Dostoevsky’s novel Crime and Punishment.
We’re corresponding witb an idiot.
So, you skimmed the CliffsNotes of Crime and Punishment during a lunch break and mistook it for scholarship.
Dostoevsky crafts Svidrigailov as a foil to Raskolnikov and central to his inner torment; both are intelligent men grappling with transgression.
Svidrigailov is a cunning and perceptive character who easily reads people and manipulates them to his advantage.
He attempts to seduce Dunya (Raskolnikov’s sister) through a calculated mixture of charm, wealth, and veiled threats.
He uses irony, sarcasm, and ambiguity in speech, showing verbal dexterity and psychological insight.
He also exhibits signs of nihilism, fatalism and despair despite his intellect, and self-awareness, indicating mental sharpness.
Reducing Svidrigailov to a bullet point is tantamount to describing Mephistopheles as “a guy who shows up in some old German stories.”
Ark, you chose your fake name perfectly:
Did the fictional character also have a “pathological fear of reality”? Is that ehy he committed suicide?
Riddle me this, Puffman –
https://www.thejc.com/news/usa/california-republican-kyle-langford-auschwitz-newsom-aryan-lfduc61y
Should this count as TDS?
Just a look at the guy
https://api.thejc.atexcloud.io/image-service/view/acePublic/alias/contentid/1kt9ah8kpi0ojbhlnac/0/screenshot-2025-07-28-at-13-51-44-png.webp
lets me think that he certainly would have been an excellent SS Obersturmbannführer between 1933 and 1945.
SOLAR MINIMUM UPDATE
Since March, a harmful algal bloom, fueled by a marine heat wave, has been choking South Australia’s coastline, turning once-colorful ecosystems filled with thriving marine life into underwater graveyards.
The bloom has killed about 15,000 animals from over 450 species, according to observations on the citizen science site iNaturalist. They include longfinned worm eels, surf crabs, warty prowfish, leafy seadragons, hairy mussels and common bottlenose dolphins.
https://www.cnn.com/2025/07/25/climate/australia-toxic-algal-bloom-disaster-climate-dst-intl-hnk
Willard,
This is the Japanese spider crab:
https://factanimal.com/japanese-spider-crab/
Walter,
This is a contrarian:
https://abcnews.go.com/US/chris-wright-wrong-about-clean-energy-transition-experts/story?id=115971534
Willard if toxic blooms in South Australia have been increasing in frequency over the past 6,000 years its not due to climate as the climate was warmer 6,000 years ago.
Having been an environmentalist for decades with a particular passion wrt to ocean pollution we know scientifically that many of these types of events are due to environmental pollution.
The primary source of anthropogenic pollution exacerbating these types of events is urban and agricultural runoff.
Climates role in it all is very poorly understood but we do know most of the climate warming of the past century has been in sync with planetary movements, and entire discipline that has been suppressed and ignored as corrupt influences have negligently misrepresented the complexity of the climate debate. In some cases these efforts have elevated to the level of fraud as scientific guidelines established over the previous 500 years have been overturned to lead to an intentional reversal of the burden of proof.
the hysteria this has caused has caused a huge diversion of resources from dealing with known sources of pollution and has as a result endangered our health.
Hunter boy
” … but we
[who is that]
do know most of the climate warming of the past century has been in sync with planetary movements,
[where is your source you never mention? Zharkova? The lady who ‘predicted’ utterly wrong solar future? Let me laugh]
an[d] entire discipline that has been suppressed and ignored as corrupt influences have negligently misrepresented [your egomaniacal opinion, of course] the complexity of the climate debate. ”
*
And that is originated from an alleged ‘environmentalist for decades’ who denies on this blog since years century-old science like the lunar spin
https://drive.google.com/file/d/13DRDH1OFOUHYM_6HKH19sbj28yckJMF7/view
without having ever been able to scientifically contradict what he polemically discredits and denigrates !!!
Let me laugh again, Hunter boy.
> if toxic blooms in South Australia have been increasing in frequency over the past 6,000 years
If Gill begs all the questions, his conditionals will become sillier than his naked assertions, e.g. that insurers flee markets because of excessive environmental policies.
bindidon the Berger paper that has been reference in this forum several times, including once by as I recall Barry shows the variations. There are also numerous studies that show an ice free Arctic. such as prior to 6,000yrs BP and 3,000 years BP. Nicely in time with orbital perturbations from the outer gas giants.
and
google AI:
Nonpoint sources of chemicals that contribute to algae blooms include agricultural runoff, urban runoff, and atmospheric deposition. These sources release nutrients like nitrogen and phosphorus into waterways, which fuel the growth of algae, especially harmful algal blooms (HABs). Other contributors include forestry practices, construction activities, and land use changes.
“There are also numerous studies that show an ice free Arctic. such as prior to 6,000yrs BP and 3,000 years BP. Nicely in time with orbital perturbations from the outer gas giants.”
Last time I’m aware of an “ice-free” Arctic (summer Arctic ice < 1 million sq km) was Near the beginning of the holocene 8-10 thousand years ago, when Summer insolation peaked on the NH due to orbital variation.
I doubt there are "numerous studies" positing an ice free Arctic more recently. Maybe one?
Barry ”positing” studies are only popular with your crowd and they certainly wouldn’t be positing frequent ice free arctic conditions.
The studies I have read include some examining bottom sediments for various deposits indicative of a lack of protection on the surface from airborne particulates and/or cetacean presence. Also there has been a study of the northshore of greenland that shows sufficient wave activity that would require no sea ice to the northpole.
How many studies do you need?
“How many studies do you need?”
How about just 3 corroborating what you said? I wouldn’t trouble you for “numerous.”
Well I have to call a halt to this distraction as I don’t have time to go dig up papers lurking in my server backups.
Bindidon questioned the orbital perturbations of earth’s orbit by the outer gas giants.
You as I recall found the Berger paper on your own and its reference has been mentioned here more than once as I had previously brought it up.
Its here: Milankovitch Theory and Climate, A. Berger, 1988 showing a number of orbital perturbations affecting eccentricity in Figure 2.
and NASA also recognizes this effect by stating via a search on Google AI on: ”orbit eccentricity variation for jupiter”
Impact on Earth:
Changes in Jupiter’s orbital eccentricity can affect Earth’s climate in two ways:
”Long-term climate cycles: Changes in Jupiter’s eccentricity are linked to long-term climate variations on Earth, with periods of around 900 years, according to a paper from the Science of Climate Change.
Atlantic Multidecadal Oscillation (AMO): Jupiter’s eccentricity also has a 61-year cycle, which correlates with the AMO, a pattern of temperature fluctuations in the North Atlantic, according to a paper from the Science of Climate Change.”
Look it up!
I’ll just guess without looking it up that it doesn’t corroborate that the Arctic was ice-free 3000 or 6000 BP. You can let me know how I did if you like.
Thats fine Barry. But since you agree it occurred about 8000 years ago (thought to be a special cause) you can see from the Alley data it was equivalently warm about 7,000 years ago and 3,500 years go in the northern latitudes above the permanent ice sheet of Greenland.
Certainly thats some evidence that can only be disputed by better evidence. Considering that I hope you understand why I am not going to humor you on this minor issue for which no contrary evidence has been produced.
You also have the orbital perturbation resources from Berger and NASA that provide additional information on the frequency and magnitude that orbital variations can take which are materially consistent with the timing and trend directions in the Alley data as well.
Its pretty clear why those with political leanings are refusing to debate the orbital perturbation theory as all the science available leans heavily against what they believe to be true.
“Certainly thats some evidence that can only be disputed by better evidence”
No, the single factor of temperatures in Greenland does not determine the truth of ice free Arctics. That has been done with other evidence, such as ice cores determining microorganisms, sediment and dated driftwood.
These other evidence show that the Arctic is not uniform in temps and how it distributes ice.
Your best bet at finding a study that comes close to what you claimed is this one:
https://www.researchgate.net/profile/Svend-Funder/publication/51547629_A_10000-Year_Record_of_Arctic_Ocean_Sea-Ice_Variability–View_from_the_Beach/links/00b7d5208dd643635e000000/A-10-000-Year-Record-of-Arctic-Ocean-Sea-Ice-Variability–View-from-the-Beach.pdf
Which has summer sea ice at just under 2 million sq km 8000BP, and likely similar or a little more at 6000BP.
This study focuses on Greenland,uses dirftwood as main data and uses modeling to test, so take it as you will.
“When the ice was at its minimum in northern Greenland, it greatly increased at Ellesmere Island
to the west….
In this exercise, our records would correspond in the model to an Arctic Ocean sea-ice cover in summer at 8 ky B.P. that was less than half of the record low 2007 level. The general buildup of sea ice from ~ 6 ky B.P. agrees with the LOVECLIM model, showing that summer sea-ice cover, which reached its Holocene maximum during the LIA…”
These aren’t ice-free conditions, though.
Barry says:
” “Certainly thats some evidence that can only be disputed by better evidence”
No, the single factor of temperatures in Greenland does not determine the truth of ice free Arctics. That has been done with other evidence, such as ice cores determining microorganisms, sediment and dated driftwood.
These other evidence show that the Arctic is not uniform in temps and how it distributes ice.”
——————
First of all you can’t call it zero evidence. Thats just plain ignorance that knows no bounds. It is evidence. There is practically nothing in the pre-instrument records that is certain. You are just playing games between certainty and uncertainty and coming to absolute conclusions. You are better than that Barry.
Worse while expressing such nonsense you had already carved out a spot in the record that you agreed there was no sea ice: ”Last time I’m aware of an “ice-free” Arctic (summer Arctic ice < 1 million sq km) was Near the beginning of the holocene 8-10 thousand years ago''
Also known as the 8.2k event. So that opens the door to equivalent recorded temperatures in the record at approximately the 7kBP and 3.5kBP. Where is your evidence that these events should be treated differently in the ''regional'' vs ''Arctic wide'' context?
Barry says:
''In this exercise, our records would correspond in the model to an Arctic Ocean sea-ice cover in summer at 8 ky B.P. that was less than half of the record low 2007 level. The general buildup of sea ice from ~ 6 ky B.P. agrees with the LOVECLIM model, showing that summer sea-ice cover, which reached its Holocene maximum during the LIA…”
These aren’t ice-free conditions, though.''
I suppose you are unaware that ''officially'' ice free conditions have been arbitrarily established as less than 1 million square kilometers. And that half of the 2007 summer minimum was 2 million square kilometers and that the summer extent 8kBP was less than that. So yes there is measurement error, uncertainty, arbitrary standards for levels of existing ice that will be considered to be zero ice, etc.
But I bring you back to the temperature proxy of GISP2 the peak temperatures over samples that cover 100 year mean temperatures that unfortunately means we can't declare no sea ice as unprecedented nor can we declare an equivalency of having no sea ice unless the anomaly lasts for at least 100 years.
Enter the crazy world of paleoscience and you find all sorts of eccentric individuals that think otherwise.
“First of all you can’t call it zero evidence.”
Neither did I. I said it was insufficient, particularly when there is other evidence. No straw men erected here? Good!
“You are just playing games between certainty and uncertainty and coming to absolute conclusions”
On the contrary. Apparently you have constructed some alternate universe reply of mine.
What I actually did is what you couldn’t be bothered doing and went looking for the best evidence I could find to support your contention and then linked and quoted it.
“Where is your evidence that these events should be treated differently in the ”regional” vs ”Arctic wide” context?”
I just linked and cited a paper that pointed out that difference. The paper that I found that comes closest to your claim.
“I suppose you are unaware that ”officially” ice free conditions have been arbitrarily established as less than 1 million square kilometers.”
That’s right. This is the standard.
You used the term “ice free”, not me. If you have a different definition from standard,then you should make that clear. It’s not up to me to read your mind when the field already has a defined parameter.
“But I bring you back to the temperature proxy of GISP2 the peak temperatures over samples that cover 100 year mean temperatures that unfortunately means we can’t declare no sea ice as unprecedented nor can we declare an equivalency of having no sea ice unless the anomaly lasts for at least 100 years.”
Ok then, let’s move the goalposts and kick some more goals.
An ice free Arctic has happened before. There has been lower concentrations than modern times. Hell, there has been a completely ice free Earth a few times in the geologic past.
So what? We’re not erecting straw men are we? Why do I get the feeling you are implying these facts are at odds with mainstream understanding on Arctic sea ice?
No doubt there is some underlying point here. But can we please root it in science and not rhetoric?
The Milankovitch cycles are a well-corroborated phenomenon, so the effect of planetary gravitational perturbations to Earth’s orbit over multi-millennia is well-founded. Sub-millennial climate change due to the pull of other planets is not at all well-verified, nor well-founded, and the potential climatic forcing of minor gravitational pull on these scales is dwarfed by other factors, such as solar, volcanic activity, ocean/atmosphere cycles, GHGs etc.
“You are better than that Barry”
That comment speaks better of you than anyone else. Appreciate the thought.
Barry says:
The Milankovitch cycles are a well-corroborated phenomenon, so the effect of planetary gravitational perturbations to Earth’s orbit over multi-millennia is well-founded. Sub-millennial climate change due to the pull of other planets is not at all well-verified, nor well-founded, and the potential climatic forcing of minor gravitational pull on these scales is dwarfed by other factors, such as solar, volcanic activity, ocean/atmosphere cycles, GHGs etc.
——————-
You contradict yourself. As you are aware of the 2,500 year orbital variation cycle in figure 3 of Berger which is a work placed in the public domain as an examination of Milankovic’s work.
We do need explanations for the .6 degree rise in global temperatures from 1911-1944 in the global instrument record that can’t be attributed to CO2 and can’t be duplicated by any climate model.
I gave you the Google AI tip above. So I followed it to this 2024 paper.
https://scienceofclimatechange.org/wp-content/uploads/Sir-2024-Prag-60yr-Jupiter-Earth.pdf
This attributes your ocean oscillations to this gravitational effect of the planets. It shows the gravitation effect peaked recently and there will be a reduced amount of warming and or cooling ala ~1944 and 1980 when the planetary alignment had 3 of the 4 planets on the cool side. That will occur between now and 2040 and likely beyond but it is quite uncertain if we are at a 900yr or 3600 year peak in the warming yet. The 60 year cycles will crank along and while it appears we are very near a peak in the 900 year cycle, the 175 year cycle of Neptune and Uranus will continue to land in the warm zone until around the year 3000.
I have developed my own compilation of correlations to this effect and have calculated the results of spending more time closer to the sun vs further away using standard estimates of earth’s orbit eccentricity. Result was about the same as the primary claimed effect of CO2.
So what does that mean that only about half of the warming is from CO2? Or all of it? Seems that hangs on the answer to what climate sensitivity factor is and how water vapor and convection actual operates to provide that sensitivity. Does water vapor operate like claimed for CO2? Does that cool or warm the atmosphere. Does the release of latent heat by water vapor warm the atmosphere? How much of the of the warming is local due loss of sea ice cover, glacial cover, temporary snow, and ice sheet cover.
There really is no climate change certainty.
S0 how is https://oz4caster.wordpress.com/wp-content/uploads/2025/07/d1-gfs-gta-daily-2025-07-28.gif going to change in the future?
Trump announces new 15% sales tax on US consumers.
On Sunday, July 27, 2025, Trump imposed that new national sales tax by announcing a 15% tariff on goods imported into the US from the EU.
Instead of highlighting the truth of Trump’s actions, major media were proclaiming that Trump had reached a “preliminary agreement” with the EU.
Like all of Trump’s alleged tariff “trade deals,” this one is more like “concepts of a plan” than an actual agreement. “Preliminary” means “not yet in writing or agreed to in final form.”
I see above this typical manipulation of global temperatures by the stubborn Coolista Blindsley H00d aka ‘RLH’:
” S[o] how is
https://oz4caster.wordpress.com/wp-content/uploads/2025/07/d1-gfs-gta-daily-2025-07-28.gif
going to change in the future? ”
*
Typical for people who since years present on this blog charts showing exclusively a decrease of global temperatures.
*
But when you visit Bryan oz4caster’s blog
https://oz4caster.wordpress.com
you see completely different things.
*
For example, a daily temperature record that was not intentionally and manipulatively limited to 2024/25 like does RLH, but starts with the year 1948:
https://oz4caster.wordpress.com/wp-content/uploads/2025/01/fig14-gmsata-1948-2024.gif
*
And an even better chart shows us that, contrary to the liars who claim that global temperatures are rising only because of the Northern Hemisphere, the Southern Hemisphere is also warming:
https://oz4caster.wordpress.com/wp-content/uploads/2025/01/fig10-ncar-nh-sh-rmsat-1948-2024.gif
*
It’s not the first time that RLH tries to manipulate the blog with ‘hints’ on alleged global cooling.
In 2021, UAH’s LT data showed month after month anomalies lower than those of the same month a year ago in 2020.
He proudly claimed this was an unmistakable sign of global cooling.
Month after month, you would have at that time started thinking he was right: only December 2021 was ‘warmer’ than December 2020:
2021:
{0.12,0.20,-0.01,-0.05,0.08,-0.01,0.20,0.17,0.25,0.37,0.08,0.21}
2020:
{0.42,0.59,0.35,0.26,0.42,0.30,0.31,0.30,0.40,0.38,0.40,0.15}
Thus, I then loaded UAH’s LT data into my SQL database and searched using a so-called SQL ‘select’ statement for all years whose first eleven anomalies were lower than those of the previous year.
Result
1981
1982
1989
1992
1999
2011
2021
This clearly means that the situation 2021 versus 2020 was nothing special at all: the same situation occurred six times before.
*
But… don’t think that an opinionated person like Blindsley H00d aka RLH would ever admit beinmg wrong!
His reaction was:
” That was the past. I’m talking about the present. ”
*
Yeah. Weiter so!
Hello Willard,
‘Which is what makes Venus colder than Mars and the Moon very hot.’
Would you like to talk about Venus?
How long do you think, till the Sun finishes cooking offbits water , it’s induced magnetic field collapses and the solar wind blows its co2 away…
Wonder if humans will be around to see it.
Phil,
You said that “so-called GHGs cool te atmosphere to space and drive convection which cools the surface.”
By that logic, this would make Venus quite cold, Mars quite very hot, and the Moon even hotter.
If you have nothing to say about that very simple argument, I’ll edit my Climateball Bingo accordingly.
Meanwhile, we’re losing polar ice data:
https://bsky.app/profile/voosen.me/post/3lv4rlktapk2t
Science is sooo back, baby!!!
Hello Willard,
Venus has very little convection near the surface and no water there at all to drive it. (Co2 is a very weak emitter)
Further, never having had liquid water to cool it’s surface, it’s crust remained thin with much overturning and outgassing,
Indeed, there’s evidence of overturning of large areas of its surface as litte as 600 million years ago
Thus it’s interior is far cooler than that of the Earth and perhaps even Mars
Water is of course the key, it’s cooling properties (high heat capacity and latent heat of vaporization) causing thick crust on Mars and Earth, slowing the cooling of the interior maintaining enough internal energy to drive the dynamo at the core and generate a magnetic field.
Venus’ magnetic field is induced by H and O ions produced by the photolysis of its water
The moon without a magnetic field and much less massive than the Earth quickly lost its atmosphere and has cooled almost to the limit of its computed BB temp, much like Mercury
Phil,
“GHG” stands for greenhouse gas. When you say that GHGs cool the atmosphere, you’re not referring to a liquid.
Besides, we have reasons to believe that there once was water on Venus:
https://en.wikipedia.org/wiki/Water_on_Venus
Also, the Moon indeed has an atmosphere:
https://en.wikipedia.org/wiki/Atmosphere_of_the_Moon
So I’m not sure why you’re waving your arms so furiously right now about how water is Very Special.
Perhaps you could try again, this time going step by step. Start with the following idea: the temperature on the Moon can reach 120C during daytime at the equator.
Hello Willard,
‘GHG” stands for greenhouse gas. When you say that GHGs cool the atmosphere, you’re not referring to a liquid.’
It can be demonstrated that the majority of IR leaving the TOA comes from h20 in the upper troposphere.
As it cools h20 thermalises with air around it cooling it.
Colder air sinks, driving convection downward.
Near the surface h20 being a good emitter, absorbs IR from the surface thermalizes it with the air around it and the air expands and rises driving convection upward
Increased wind blowing across the surface caused by that convection increases the rate of evaporation and thus the rate at which the surface cools
What part of this are you disagreeing with?
Hello Phil,
Curtis Yarvin believes that our billionaires are [N-something].
Donald said that Stephen Colbert got fired because he lacked talent and had lousy ratings, two reasons that apply more to the Apprentice’s host.
Japan has recorded its hottest day on record, the latest example of extreme weather to focus attention on climate change.
Stephen said that by the hottest year ever is what we got for featuring Pedro Pascal so often.
All these factoids are as relevant as yours.
Thanks for your time.
News from the Jan 29 crash at DC airport
” New data released Wednesday by the NTSB showed that before the Jan. 29 collision, the Army crew flying the Black Hawk helicopter was getting information that may have caused them to think they were flying at a lower altitude than they actually were.
Although helicopters have devices known as radio altimeters that provide altitude data, the pilot and co-pilot also have barometric altimeters that calculate altitude. While most crews at low elevation will use the radio altimeter to determine their height — because it is seen as more accurate — panelists at the NTSB’s hearing Wednesday said members of the 12th Aviation Battalion were trained to use their barometric altimeters.
During Wednesday’s hearing, the NTSB showed that throughout the flight, the Black Hawk crew called out elevations that were about 100 feet lower than the altitude recorded by their radio altimeter.
Tests of three other Black Hawk helicopters after the crash showed similar discrepancies, investigators said. They also found that the discrepancy increased when the Black Hawk’s rotors were spinning. “
Are you lost Dumbdidon ??? do you even know what board you are on ???
” … do you even know what board you are on ? ”
Yes. Some examples…
https://www.drroyspencer.com/2025/07/uah-v6-1-global-temperature-update-for-june-2025-0-48-deg-c/#comment-1708959
https://www.drroyspencer.com/2025/06/uah-v6-1-global-temperature-update-for-may-2025-0-50-deg-c/#comment-1707131
https://www.drroyspencer.com/2025/06/uah-v6-1-global-temperature-update-for-may-2025-0-50-deg-c/#comment-1707126
*
All what you ankle-biting, barking dachshund are able to post is never more than cheap, insulting polemic a la ‘Dumbdidon’ etc etc.
There is not any +33°C greenhouse warming effect on Earth’s surface!
Link: https://www.cristos-vournas.com
Christos’ 12:22 am criticism of the reported term greenhouse effect for Earth is simply due to the function of farmers surface greenhouses being primarily to suppress surface convection by glass enclosing a space naturally heated by solar radiation during the day.
The earthen difference between global, annual avg. ~288K surface thermometer measured temperature and global, annual avg. ~255K planetary brightness temperature measured from Earth orbit is due to the solar radiation shining through IR active, well mixed gases in the earthen atmosphere & no suppression of natural surface convection.
Ball4,
” term greenhouse effect for Earth is simply due to the function of farmers surface greenhouses being primarily to suppress surface convection by glass enclosing a space naturally heated by solar radiation during the day.”
–
The glass enclosing a space, doesnt’ let a significant portion of the emitted IR radiation to escape.
Also, the glass enclosing a space, reflects back-in some portion of the reflected from the inner surfaces SW radiation.
Thus, the inner of the greenhouse area gets gradually warmed, because when the EM radiation hits surface some of the EM radiation is transformed into heat, and some is reflected of IR emitted.
The glass cover of the place what it does is to turn back a portion of EM radiation, which otherwise would have escaped from the greenhouse without returning back to the inner surfaces to hit them and to repeat the process – the supplementary EM forcings appear as the sums of sequences of the descending arithmetical progressions.
–
What is your explanation, Ball4, how do you explain otherwise the farmer’s greenhouses get warmed?
–
https://www.cristos-vournas.com
All that 1:52 pm stuff applies to a certain parallel extent in the natural outside atm. also; the main difference a farmer’s greenhouse makes is preventing atm. convection (wind) under the glass.
Location is important too, placed in isolation on a windy mountaintop, the farmer’s greenhouse will not be as effective as in a relatively lowland with trees, buildings, or hills blocking some natural convection.
christos…”What is your explanation, Ball4, how do you explain otherwise the farmer’s greenhouses get warmed?”
***
B4 does not understand basic physics, never mind thermodynamics. He thinks heat is a transfer mechanism for transferring heat. I told him once that infrared energy is not heat and since then, he reposts that back to me over and over like a parrot. In fact, I would not doubt that he lives in a cage and eats crackers.
Think about the greenhouse warming mechanism in a real greenhouse. Short wave solar enters through the glass and warms all interior surfaces, vegetation, and soil. SW solar also heats the air molecules naturally via radiation and 99.9% of the molecules are N2 and O2, therefore 99.9% of the heat comes from N2 and O2.
Those infrastructure elements convert the SW solar to long wave infrared. Some of that IR is reflected by the glass but it cannot create heat in molecules that radiated it, which is mainly CO2 and water vapour, making up only a few percent of GH molecules at best.
CO2 and WV that emit IR cannot reabsorb it and warm further. That would represent perpetual motion, which violates the 1st law, and contradict the 2nd law. All heating in a greenhouse is done by SW solar, which heats air molecules directly and by heating surfaces that the major molecules like N2 and O2 contact directly.
As the N2 and O2 are heated by direct conduction and solar radiation, they rise in temperature and rise naturally since they have a higher KE than unheated air. The glass blocks them from rising higher and the heated molecules gather inside the greenhouse, raising the temperature.
There is no mechanism in the atmosphere that can replicate that heating action. That’s why we build greenhouses…the atmosphere cannot heat on its own since there is no glass roof and walls to stop the natural vertical convection due to heated air rising.
People have claimed that CO2 alone is responsible for radiating all heat at TOA. Not true. 90% of surface radiation is radiated straight to space from the surface. CO2 can absorb no more than 10% of surface radiation and that is very close to the surface. At TOA, there is virtually no CO2 or any other significant molecules. In fact, the atmosphere is an essential vacuum from the top of the stratosphere.
N2 and O2, making up 99.9% of the mass of the atmosphere closer to the surface, are surely the major players for controlling heat dissipation. They both absorb most heat directly at the surface since there are 10^28 air molecules per square metre in contact with the surface. That makes those two gases far more efficient than radiation, transferring surface heat to the atmosphere.
Once the surface heat is absorbed directly by N2 and O2, those molecules rise and as they rise into lower pressure, lower temperature molecules, their heat is dissipated naturally due to expanasion. That means most of the surface heat is dissipated naturally WITHIN the atmosphere. This expansion is not work since there is no force acting over a distance.
That is the true greenhouse effect, mistakenly explained by the AGW theory as being due to a trace gas.
The conservation of energy theory does not apply here. It applies only when energy is converted from one form to another. Just because the Sun delivers intense radiation that is converted to heat in Earth’s atmosphere, does not mean energy in must equal energy out. If that solar energy is converted to heat, and the heat can be dissipated inside the atmosphere, while warming it, no energy balance is required.
The idea that energy can neither be created nor destroyed is an old, incorrect theory dating back to the mid 19th century. No one knew what heat was at the atomic level or whether it could be dissipated naturally. In essence, they were guessing. Heat can be dissipated naturally simply by lower pressure and and the number of molecules.
No one knew that when the so-called energy laws were created. They were thinking in terms of heat being converted to work, and the likes. However, nonsense is still being taught in universities. In my field of electrical engineering, they are still teaching Benjamin Franklin’s definition of current flow, which he PRESUMED moved from positive to negative.
The electron was not discovered till 1898, some 100 years after Franklin defined the conventional direction of current flow.
12:08 am: “I told him once that infrared energy is not heat…”
Ha! Now that some past comments are not available, Gordon tries to rewrite history. Long time readers can remember the opposite is evidently true.
“CO2 and WV that emit IR cannot reabsorb it…”
Photons (or waves) do not carry little tags identifying their source material, Gordon, this is wrong… & violates 2LOT btw.
For the earthen atm., as the N2 and O2 are heated by direct conduction and solar radiation, they rise in temperature and rise naturally since they have a higher KE than unheated air. Gravity blocks them from rising into space and the heated molecules gather inside the atm., raising the temperature so the analogy to a farmer’s greenhouse holds since there IS a convective mechanism in the atmosphere that can replicate that greenhouse heating action.
That’s why we build greenhouses… to defeat heat convecting away on its own since there is a glass roof and walls to stop the natural atm. vertical convection due to heated air rising.
That is the true greenhouse effect, mistakenly explained by Gordon as being due to:
“…radiation, transferring surface heat to the atmosphere.”
Gordon, EMR is NOT heat.
Gordon is not done with his gaffes because then comes the big one as he pronounces the 1LOT is now defeated by Gordon’s own personal theory: “… energy can neither be created nor destroyed is an old, incorrect theory…”
I’ll be laughing all day at that one…. and some of Gordon’s other gaffes.
I think it’s amazing that the planet has warmed only 1C since 1850 yet people believe that current temperatures above 30C are due to CO2 warming. It appears, according to alarmists, that a trace gas can produce extreme warming events in summer and extreme cooling events in winter.
A truly magic gas from Jumping Jack Flash.
It’s even more amazing that we have good evidence that the planet cooled 1C to 2C between about 1300 and 1850, yet when it rewarmed, the warming is blamed on a trace gas. The authority figure, the IPCC, dismisses the LIA by claiming it happened only in Europe. It got so cold in Europe during the LIA that the oceans froze up to a mile offshore. Yet, the IPCC claims such extreme cold happened only in Europe.
You’re comparing surface temperature with no atmospheric greenhouse gases at all including water vapour (30C cooler), with a 50% rise in CO2 in an already GHG rich atmosphere.
Also, the heating effect of CO2 (on its own) is logarithmic, so that 50% rise to 420ppm has a quarter the effect of the first 105ppm.
Also also, there is a lag in warming from externally forced warming due to the heat capacity of the oceans, so that 1C doesn’t include warfming in the pipeline.
The estimated median ECS is 3C.
Have you wondered why ‘alarmists’ don’t jack up the climate based on that 30C difference with no GHGs
Maybe they’re not being ‘alarmist’.
barry
An excellent paper about the LIA
Frost fairs, sunspots and the Little Ice Age
Mike Lockwood, Mat Owens, Ed Hawkins, Gareth S Jones and Ilya Usoskin examine the links between the solar Maunder minimum, the Little Ice Age and the freezing of the River Thames.
https://www.researchgate.net/profile/Mike-Lockwood-4/publication/315731648_Frost_fairs_sunspots_and_the_Little_Ice_Age/links/6516bef0321ec5513c1e8edc/Frost-fairs-sunspots-and-the-Little-Ice-Age.pdf
Amazing.
*
As I wrote already, I’m not a fan of the recent ‘AI’ syndrome. But as more and more people use it – especially on this blog, I go with them.
When you ask Google
” Was the Little Ice Age global? ”
it gives as first asnwer the following text.
*
” No, the Little Ice Age was not a globally synchronous event.
While it’s often associated with a period of cooling in Europe and North America, particularly from the 14th to the 19th centuries, the cooling was not experienced uniformly across the globe. Some regions experienced colder temperatures during this period, while others did not show significant changes or even experienced warming.
*
Regional Cooling:
The Little Ice Age is most strongly associated with cooling in Europe and North America, with documented impacts like frozen rivers, crop failures, and glacial expansion.
Not Globally Synchronous:
Climate reconstructions show that while some regions experienced cooling during the Little Ice Age, others did not, and the timing of these events varied.
Varied Regional Responses:
Some areas saw cooling that didn’t align with the European/North American timeframe, and some even experienced warming.
*
Multiple Factors:
The causes of the Little Ice Age, and its regional variations, are still debated, but likely involved a combination of factors including volcanic eruptions, changes in ocean circulation, and variations in solar activity. ”
*
The amount of huge volcanic eruptions starting with Samalas on Lombok Island, Indonesia in 1257 and ending in 1660 is incredible:
https://drive.google.com/file/d/1bh7NjyY970aHBuPn0xD2XP9cdogzvn2E/view
The glass cover of the farmer’s greenhouse turns back-in a portion of the outgoing EM radiation.
An airless (air evacuated) farmer’s surface greehouse will be operating as an actuall farmer’s surface greenhouse – the airless one will get warmed at the same extend as the conventional one.
–
https://www.cristos-vournas.com
christos…that portion of reflected IR will do nothing, it will just bounce around inside the GH. The CO2/WV that radiated it cannot reabsorb it because the electrons in the atoms are at a higher energy level and cannot absorb it.
THE GH warms only by the major gases N2 and O2 being heated directly by SW solar or via direct conduction of heat from solar-heated surfaces inside the GH. It is the rising of heated N2/O2 due to solar heating and the trapping of the heated N2/O2 molecules by glass that causes the heating. That cannot work in the atmosphere.
Ergo, reflected IR can do no warming. Same in the atmosphere, where it is re-radiated by trace gases. The surface cannot absorb it and warm. That would contradict the 2nd law and be an example of perpetual motion.
barry…”…the heating effect of CO2 (on its own) is logarithmic, so that 50% rise to 420ppm has a quarter the effect of the first 105ppm”.
***
Barry…as I claimed before, 50% of nothing is essentially nothing. The heating effect of CO2 in the atmosphere, according to the Ideal Gas Law, is roughly 0.06C per 1C rise of all atmospheric gases. I urge you to cast aside the examination of chicken entrails, as practiced by climate alarmists, and actually study the IGL.
Your 50% rise obviously comes from the alleged increase in CO2 concentration from 270 ppmv pre 1750 to 420 ppmv current (actually about 65%). We have no idea what the pre-Industrial level of CO2 was since it is alleged based on ice core samples of allegedly trapped CO2 bubbles in the ice, in Antarctica.
I have pointed out before, from Jaworowski, that trapped CO2 bubbles, under pressure, covert to clathrates, which are solids. It is presumed but never proved that the clathrates can convert back to accurate CO2 levels when the pressure is released as a core is removed from considerable depth. Ergo, we have no accurate scientific evidence that the pre-Industrial era levels of atmospheric CO2 was 270 ppmv.
re clathrates…
https://en.wikipedia.org/wiki/Carbon_dioxide_clathrate
They are a fine snowy solid hydrates. Who is to say how much of the stuff was blown away by winds in Antarctica long before the stuff subsided to great depths. And who is to say how the complex formation of the clathrates took place. Read the article to see the complexity.
Beck provided further evidence from the likes of Kreutz that the atmospheric content of CO2 was as high as 400 ppmv in the 1940s.
https://friendsofscience.org/assets/files/documents/CO2%20Gas%20Analysis-Ernst-Georg%20Beck.pdf
However, the real argument is whether or not CO2 as a trace gas can heat the atmosphere significantly. The only evidence comes from consensus, which is not scientific evidence, from the likes of Callandar, Arrhenius, and Tyndall. None of them proved the premise and the IPCC claimed only CO2 readings post 1957 could be used. Still, they provide no proof that CO2 can significantly warm the atmosphere.
stephen…”Gordo! I think Alberta wants to be 51st state”.
***
I have received your comment with humour (spelled correctly).
Looks like Saskatchewan could be right behind for the 52nd state. They are starting to whine too about counter-tariffs and banning other US products.
Of course, both governments currently have uber-right-wing governments, which kinda reveals the me-first mentality of capitalists. Alberta has always been right-wing but it is sacrilege here in Canada for Saskatchewan to utter right-wing rhetoric since they are the bastion of socialism. Medicare began in Sask under Tommy Douglas.
Of course that was in the day when farmers struggled and socialism proved more beneficial when it came to getting their crops to market and surviving. Now the Yuppy butt-kisser who are the children of the pioneers have inherited the farms, and become wealthy, they trip over their own importance and forget the integrity and heart that marked their forefathers.
I need to reiterate here that by socialism I do not means Russian or Chinese communism. Socialism was a workers’ movement in Europe decades before Marx produced his communist manifesto and nearly a century before the Bolsheviks screwed up Russia with their sicko obfuscation of communism, they branded incorrectly as socialism.
The basis of true socialism is a compassion and empathy for other bred into those who struggled mightily themselves. That compassion and empathy is available to all of us and I cannot bring myself to accept both are not there in you too. At least, you strike me as a decent guy underneath the rhetoric.
That’s why I find it so hard to deal with the current right-wing heartlessness in Alberta and Saskatchewan. The pioneers in those provinces, like their equivalents in the States needed to be a hardy lot to survive. Those days are long gone and we now live in conditions in which we, with compassion and empathy, need to set rhetoric aside and help those in need.
I have lived in both provinces and have found the people to be amiable. Even Albertans recently voted in a socialist government and if the current mob keep up this uber-right wing charade, they will vote in another one. Albertans interviewed about separating and joining the States have soundly rejected such a proposition. I am sure Saskabushers feel the same.
It’s hard enough to survive in Canada, given exorbitant rent prices, but the one thing we have going is our Medicare system wherein no one needs to suffer due to the inability to pay. The whiners in Alberta and Saskatchewan have the same access to medicare and other social services as anyone else, and that’s why I can’t see them giving that up to join a system like you have in the States where the poor are fed to the wolves.
Same with pensions and the likes. Why would anyone in Canada in his/her right mind want to join a country like yours with your crimes rates and lack of social services?