
 Home/Blog
The Version 6.1 global average lower tropospheric temperature (LT) anomaly for July, 2025 was +0.36 deg. C departure from the 1991-2020 mean, down from the June, 2025 anomaly of +0.48 deg. C.
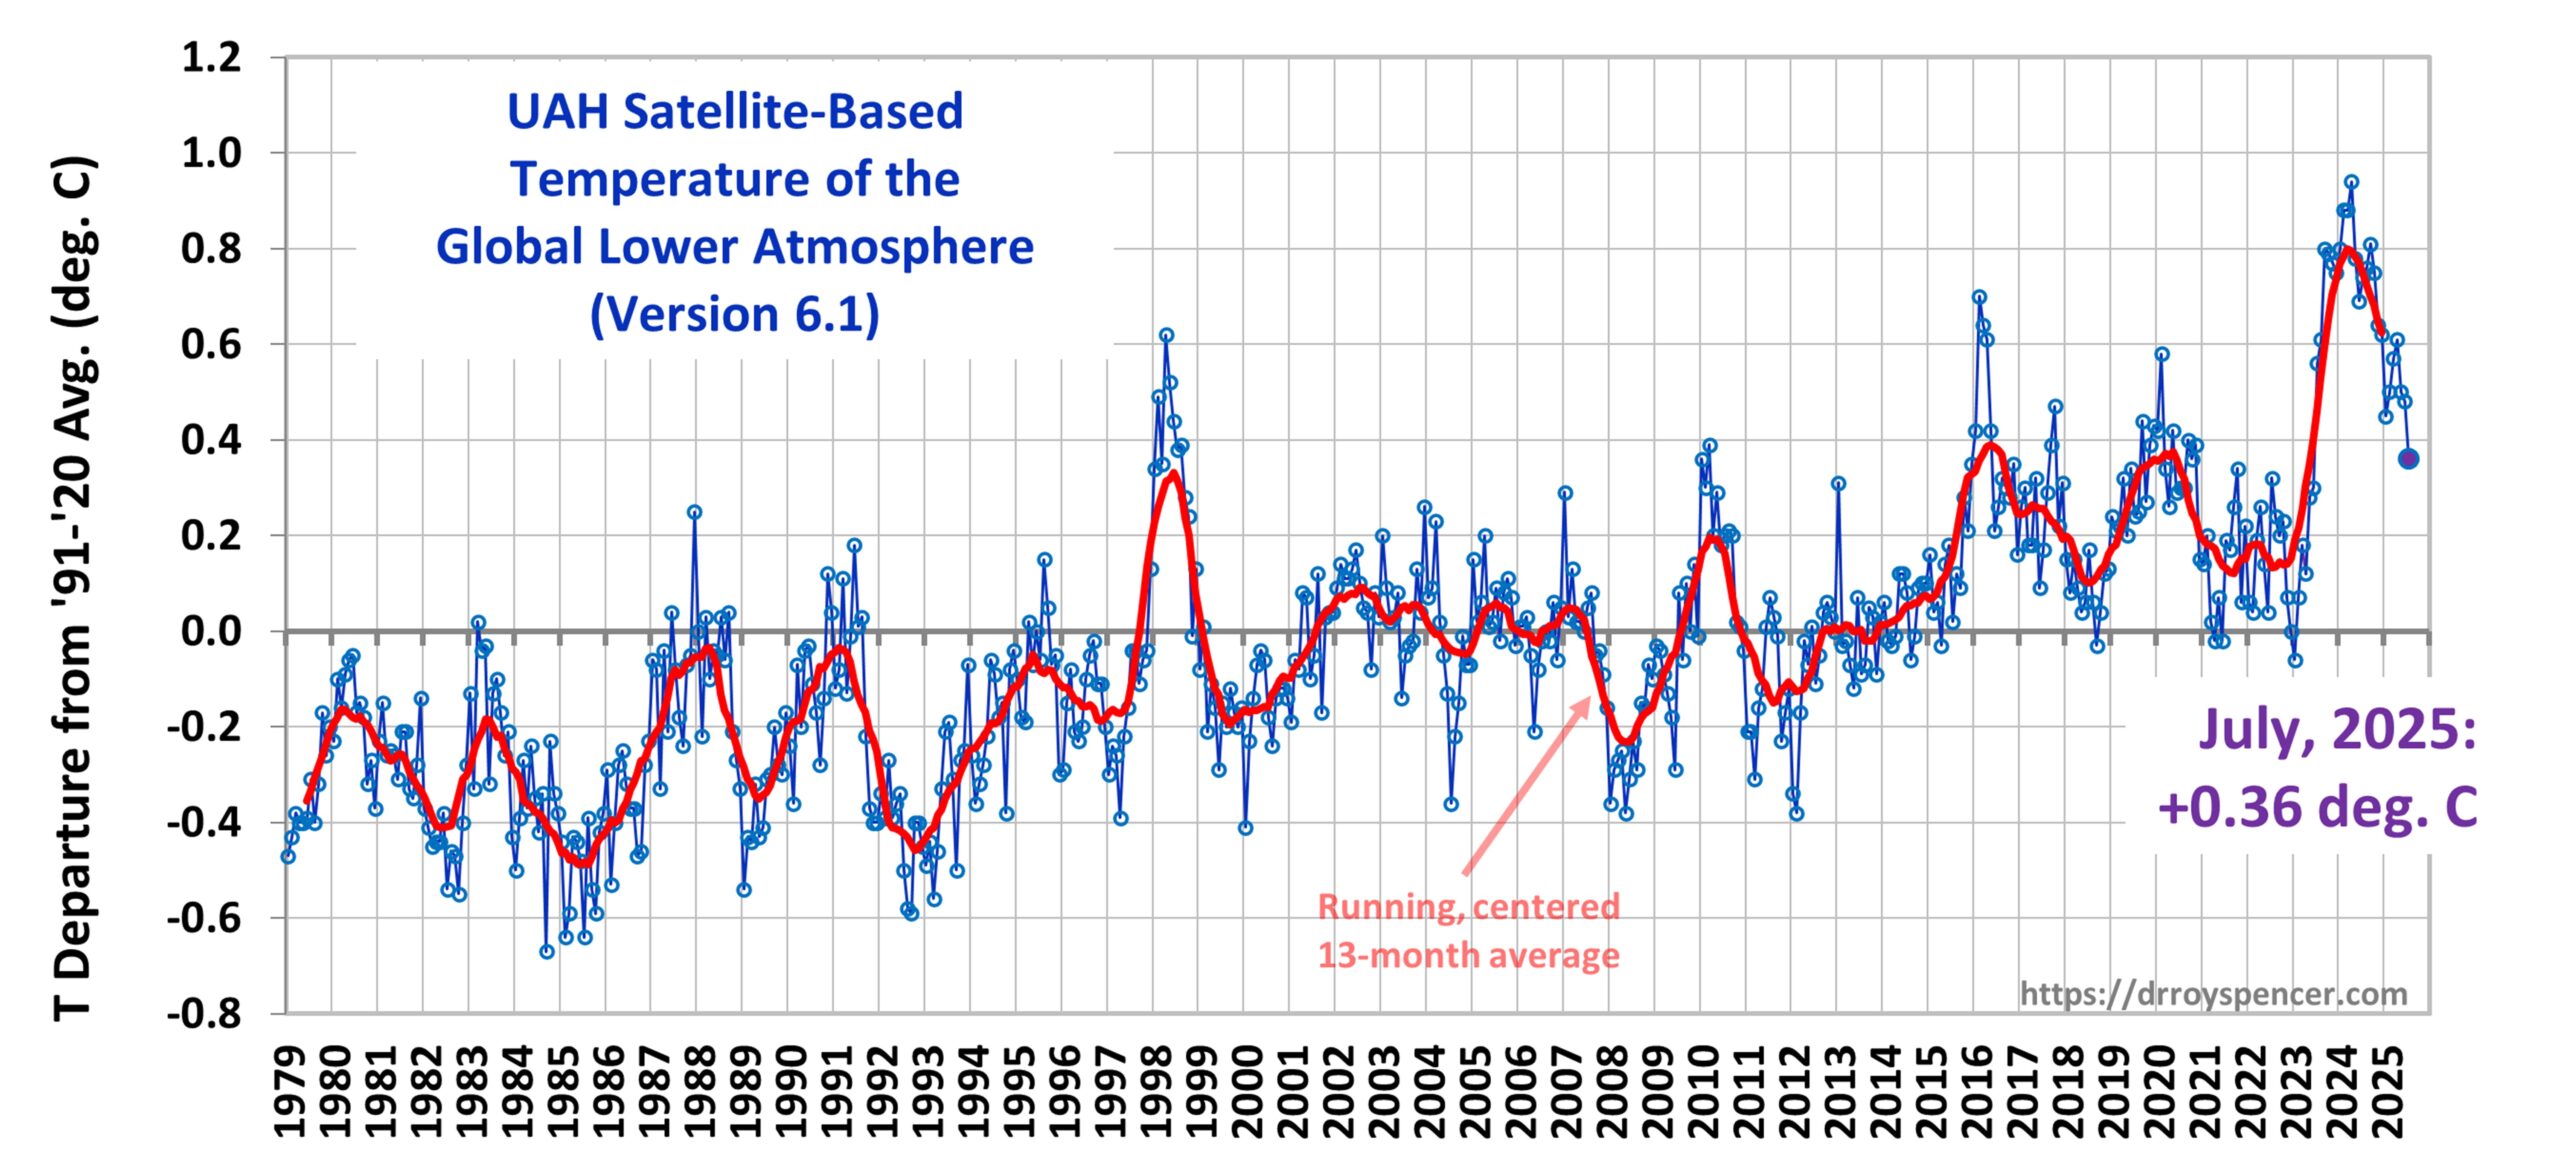
The Version 6.1 global area-averaged linear temperature trend (January 1979 through July 2025) remains at +0.16 deg/ C/decade (+0.22 C/decade over land, +0.13 C/decade over oceans).
The 0.12 deg. C drop in global average temperature anomaly since last month was dominated by the extra-tropical Southern Hemisphere, which fell from +0.55 deg. C in June to +0.10 deg. C in July.
The following table lists various regional Version 6.1 LT departures from the 30-year (1991-2020) average for the last 19 months (record highs are in red).
| YEAR | MO | GLOBE | NHEM. | SHEM. | TROPIC | USA48 | ARCTIC | AUST |
| 2024 | Jan | +0.80 | +1.02 | +0.58 | +1.20 | -0.19 | +0.40 | +1.12 |
| 2024 | Feb | +0.88 | +0.95 | +0.81 | +1.17 | +1.31 | +0.86 | +1.16 |
| 2024 | Mar | +0.88 | +0.96 | +0.80 | +1.26 | +0.22 | +1.05 | +1.34 |
| 2024 | Apr | +0.94 | +1.12 | +0.76 | +1.15 | +0.86 | +0.88 | +0.54 |
| 2024 | May | +0.78 | +0.77 | +0.78 | +1.20 | +0.05 | +0.20 | +0.53 |
| 2024 | June | +0.69 | +0.78 | +0.60 | +0.85 | +1.37 | +0.64 | +0.91 |
| 2024 | July | +0.74 | +0.86 | +0.61 | +0.97 | +0.44 | +0.56 | -0.07 |
| 2024 | Aug | +0.76 | +0.82 | +0.69 | +0.74 | +0.40 | +0.88 | +1.75 |
| 2024 | Sep | +0.81 | +1.04 | +0.58 | +0.82 | +1.31 | +1.48 | +0.98 |
| 2024 | Oct | +0.75 | +0.89 | +0.60 | +0.63 | +1.90 | +0.81 | +1.09 |
| 2024 | Nov | +0.64 | +0.87 | +0.41 | +0.53 | +1.12 | +0.79 | +1.00 |
| 2024 | Dec | +0.62 | +0.76 | +0.48 | +0.52 | +1.42 | +1.12 | +1.54 |
| 2025 | Jan | +0.45 | +0.70 | +0.21 | +0.24 | -1.06 | +0.74 | +0.48 |
| 2025 | Feb | +0.50 | +0.55 | +0.45 | +0.26 | +1.04 | +2.10 | +0.87 |
| 2025 | Mar | +0.57 | +0.74 | +0.41 | +0.40 | +1.24 | +1.23 | +1.20 |
| 2025 | Apr | +0.61 | +0.77 | +0.46 | +0.37 | +0.82 | +0.85 | +1.21 |
| 2025 | May | +0.50 | +0.45 | +0.55 | +0.30 | +0.15 | +0.75 | +0.99 |
| 2025 | June | +0.48 | +0.48 | +0.47 | +0.30 | +0.81 | +0.05 | +0.39 |
| 2025 | July | +0.36 | +0.49 | +0.23 | +0.45 | +0.32 | +0.40 | +0.53 |
The full UAH Global Temperature Report, along with the LT global gridpoint anomaly image for July, 2025, and a more detailed analysis by John Christy, should be available within the next several days here.
The monthly anomalies for various regions for the four deep layers we monitor from satellites will be available in the next several days at the following locations:


This month’s post is of great importance. It shows strong empirical evidence that the earth’s energy transport process, aka the climate system, is dynamically stable. This is saying that, after the 2023 – 2024 strong water vapour and temperature perturbation, the July point shows regression towards the expected trajectory. A similar regression was evident in response to the 1998 perturbation.
This means that the warmista Hansen–Schlesinger–IPCC fable of “amplification through positive feedback by the radiative effect of increased water vapour” does not occur in nature. The “amplifier” is shown to be fake. The true dynamics of the process has no amplification.
This shows that the feedback, properly defined (not as the warmistas bizarrely or perversely define it), is negative. The whole warmista doctrine is blown away by this empirical observation.
Congratulations, Dr Spencer, on your magnificent and decisive assembly of empirical data.
A single month’s anomaly says very little in terms of trends or amplification. Like any other month,this anomaly falls well within the normal variability, and is well within the envelope of the long term positive trend.
Thank you, barry, for your comment. Yes, a single month’s anomaly, considered by itself, says little. But we are looking at a time series. The trend on the relevant time scale for water vapour feedback, shows, as you observe, a return to the “normal”, and is well within the envelope of the longer term positive trend. That is the point. If there were positive feedback, it would have shown itself as a persisting growth of the perturbation. We don’t know the cause of the longer term positive trend, but we don’t need to for this analysis. What matters here is that it wasn’t disrupted by an explosive extension of the perturbation that started in 2022 or 2023. The proposed “amplification” is said to arise from “positive feedback”, which the new data rule out when the sign is defined according to the natural definition.
That response indicates that there has to be damping and significant negative feedback in play in response to a perturbation which IMO was most likely an increase in the upper tropospheric humidity.
Good point, Christopher.
It’s a correction after the perturbation. Earth can handle it.
I was curious if the fall would be as rapid as the rise.
If the La Niña returns we could even see the global anomaly get back to 0.0!
Good point, Clint. La Nina is now the highest probability ENSO condition for next winter.
The current downturn is sure looking like the dissipation of the Hunga-Tonga eruption effects which should continue through 2025. That would likely get us back to a pre-2022 climate state.
CFSR data is showing a similar downward trend in 2025.
https://oz4caster.wordpress.com/wp-content/uploads/2025/08/d1-gfs-gta-daily-2025-08-01.gif
This also means all the climate change hype over the past 3+ years was based on a false premise. There really is no other good explanation for the current cooling.
Finally, we are still hanging on to the AMO warm phase which has now reached 30 years. It is due for a phase change. This could lead to as much as 0.6 C of cooling in the not too distant future.
Reply to Richard Mustain: The GIF of your CFSR data is missing (404 — File not found). Do you have another link for it?
G N, try this:
https://oz4caster.wordpress.com/cfsr/
I hope my humble effort based on 17 years of study of first future energy options and then, realising that what was proposed was a fraudulent moneymaking scheme, concentrating on the climate change that is all attributed to one small effc and dimishing effect of increasing CO2, so all blamed on AGW/enrgy use justification – for the fraud that monetises a non-problem in fact. That nuclear could fix much better.
After detailed consideration of the sensitivity/response of each of the main and obvious natural feedbacks kindly quantified by NASA, that ensure the wafer thin skins of water and atmosphere held onto the huge rock that is Earth by gravity, absorb and then release an equal amount of energy, and how each of these feedbacks will change with temperature, I produced a simple, empirical, dynamic energy balance – such as you suggest.
THe energy balance is maintained by the variability of the 240W/m^2 of LWIR enrgy losses with temperature. This powerful negative feedback to changing temperatures overcomes the tiny radiative perturbations from AGW effects, even if the full Hansen nonsense of 2W per metre per degree Kelvin positive feedback by WV is included.
The net feedback to any radiative perturbation to the whole System is about 9W per m² per degree NEGATIVE feedback. Most of this is convected latent heat that is later lost as radiation from the troposphere, 84W/m^2 that varies by 7% per degree SST so 6W/m^2, the next largest is S-B effect of 1.4% per degree on 240W/m^2 from mostly Tropospheric atmosphere but also direct radiative losses from the surface/ocean. So another 3.4W/m^2 deg K.
For example, the IPCC’s 1.6 W per m² AGW effect since 1850 will have been rebalanced by a temperature rise of about 0.2°C – hence the remaining 1.3° is natural change.
In models the natural change component is simply denied to attribute all change to modeller’s chosen variable, of course. Which is why the models so over-predict the actual change we measure.
Yet the natural cyclical change range, rate and periodicity have been measured and reported many times by people who study natural change. Who knew?
So climate models are complete fraud on the measured facts of nature we know. And the strong natural feedbacks that are a very real, obvious and inherent part of the natural enrgy balance control system can easily hold the balance against the natural radiative perturbations of the Earth’s orbital variability, nearly up to 100W/m^2 over a year at max eccentricity and the Laskar cycles in general. The much smaller AGW is barely noticeabale to this dominant negative feedback control.
In haste….. I hope you find merit in this approach. It’s real, simple to explain, easy to follow. NO models required.
Catt, Brian, An Empirical Quantification of the Negative Feedbacks of Earth’s Energy Balance (January 01, 2025).
Available at SSRN:
http://dx.doi.org/10.2139/ssrn.5220078
Hello, Brian Catt. I note with comfort that your excellent work corroborates the conclusion, from Dr Spencer’s most valuable empirical data, that the earth’s energy transport process, aka the climate system, is dynamically stable. This blows away the “official” warmista doctrine of “amplification by positive feedback through the radiative effects of increased water vapour”.
The warmista doctrine is propped up by two tricks. One: a dodgy and perverse definition of “positive feedback”. Two: considering the virtual or potential radiative effects of extra water vapour without regard to the evaporative and convective feedback components that are their necessary physical precursors.
Brian,
“The change in cooling feedback in response to a given change in Earth’s radiative energy balance, from whatever cause, is estimated to be 8.7W per metre squared per degree Kelvin.”
I’m wondering how you account for the warming from our last glacial period, which was ~ 5 C globally?
This would produce a negative feedback of around 43 W/m2.
But the solar forcing, even at its maximum @65 deg N latitude, is only about 25 W/m2 from Earth’s orbital variation.
With so much negative feedback, how then does this warming take place?
I agree that the warming isn’t due to the multiple static shell theory expressed by the Greenplate effect promoted by Hansen–Schlesinger–IPCC. But there is a single shell effect.
And there may be an element of a multiple shell effect probably detected by Roy’s work on climate sensitivity that showed negative feedback.
Folks in here have widely recognized that if the atmosphere gets warmer the surface will get warmer. But the Hansen–Schlesinger–IPCC calls for atmosphere cooling via their multiple static shell theory. However, cooling of the upper troposphere would cause a destabilization of the atmosphere.
Also when looks at radiation physics a 241w/m2 mean input from the sun results in a mean stabilized temperature of 279K for .3 albedo making the GHE somewhere around 9K.
So what causes the 9K? Latent heat from evaporation of water into water vapor can easily account for that. A physical process that warms the atmosphere.
Total mean incoming solar radiation over appropriate periods of time will change both evaporation and albedo via Milankovic theories of orbital and axial perturbations.
The main short term perturbation is the one that led to the discovery of Neptune where the speed of Uranus in the sky confounded astronomers in that it wasn’t showing up where it was expected to show up on schedule.
In 2023 the earth has been arriving closer to the sun up to 5 days later than 1980 than was expected before this effect was detected in Uranus around 1821. It then took 28 years before they found the cause.
It would be nice to develop a model of earth’s orbital perturbations as that can easily be then used to see how much it effects total mean sunlight variations and predict their effects into the future. I have been grinding away on this with a lot less discipline and zeal that Milankovic had and my access to technology is severely limited. . .but not nearly as much as Milankovic was. I can say there is a strong correlation of the variations we know of in timing of planet positions and the bumps and valleys we see in our temperature and proxy data.
Why can we be sure that the customary Hansen−Schlesinger−IPCC “amplifier” is fake?
The “amplifier” of the customary Hansen–Schlesinger–IPCC circuit diagram has a unilateral “gain” circuit element, and it has a unilateral summing junction. Such are artificial engineered devices, and do not occur in the atmosphere. Natural processes are dissipative or reciprocal, practically the opposite of unilateral. Dissipative processes include friction, thermal conduction, and diffusion, involving self-feedback, with negative elements on the leading diagonal of the matrix of rate coefficients. In contrast, the customary “amplifier” circuit diagram excludes self-feedback by setting zero values for the elements on the leading diagonal of the matrix of rate coefficients. This makes the eigenvalues of the matrix either purely real, one negative, the other positive (necessarily dynamically unstable), or both purely imaginary and of opposite signs (necessitating undamped finite oscillatory responses to perturbations). Such dynamics are unnatural and unphysical. That shows that the “amplifier” is fake.
The hard logic to get past on is 1) The persistent argument around here that the surface warms because of a warm atmosphere that has some radiant capabilities; and 2) that these radiant capabilities actually cause a loss of heat such that the atmosphere doesn’t allegedly get hot enough to cool properly.
So to explain this a model is constructed with multiple static layers from a GPE model making it the only such model that works without trapping convection and preventing the mixing of gases in the atmosphere.
Seems to me that because of convection of gases unable to emit low frequency radiation the problem is that the atmosphere would be hotter than the surface without greenhouse gases to cool it. And it would be hotter because the variable input of solar light bringing the potential of a higher atmospheric temperature based upon the heat of the daytime getting trapped in the atmosphere by gases that either emit no IR or only parts of the IR spectrum (i.e. poor full IR spectrum emitters) preventing the atmosphere from cooling.
So there is a requirement for a single layer of radiating gases to bring the surface temperature up to the temperature of the atmosphere where the heat has been trapped by non-IR emitting gases and poorly emitting gases and you have lapse reversals in the stratosphere and thermosphere where you have UV absorbing oxygen species and CO2 can’t counteract that and do there what is claimed for it to do in the multiple static layer model. the problem is the multistatic layer model is in fact individual free floating molecules like a barbarian army or militia without a general staff that runs like the dickens at the first shot.
So what to do? Well you preach that there isn’t another factor that could be causing the warming while doing your best to ignore all other explanations explored by science up to that point.
So the answer on how to convince me otherwise is do your homework.
Christopher, “That shows that the “amplifier” is fake.”
This is a bunch of sciency words that are used to obfuscate rather than make a convincing argument.
Try again. Why is the positive feedback of eg melting Arctic sea ice, exposing lower albedo ocean, not a valid positive feedback?
Nate, please stop trolling.
DREMT, please stop last wording.
That’s what you were doing, Nate. Hence I asked you to stop trolling.
Nah. I asked a question relevant to the discussion, while again piss on a discussion when you have nothing intelligent to add.
You’re a boring last-worder troll and are utterly in love with the sound of your own voice.
This appraisal from the nutcase who just shat two dozen times on long dead discussions, hoping to leave a vacuous last-word unnoticed.
Its clearly a weird fetish for you, to piss on a discussion long after the participants have left.
Still after that last word, huh, Nate?
With you, every accusation is a confession.
Just keep proving me right.
The proper way to define dynamical stability in the present context is through dynamical systems theory (e.g. ‘Dynamical Systems’ by G.D. Birkhoff (1927), American Mathematical Society, Providence, RI). All the eigenvalues of the matrix of rate coefficients must be negative (or, exceptionally, if complex, must have negative real parts). A single positive eigenvalue will make the process dynamically unstable.
That is a rather theoretical definition, which we can’t directly verify, because we don’t well enough understand the details of the dynamics.
The appropriate empirical definition, according to dynamical systems theory, is that, for dynamical stability, a substantial perturbation should always be followed by a rapid return to the currently expected trajectory of the process. Such a return signifies negative feedback.
On the other hand, positive feedback as defined above would have resulted in a rapid extension of the perturbation. Instead, this month’s new data rule out positive feedback.
Christopher,
Climate science has always understood that the summed feedbacks are negative, largely because the IR emission (which reduces warming) increases proportional to T^4.
However the positive feedbacks, such as ice-albedo, and water vapor, reduce the total negative feedback, thus amplifying the temperature response to an external forcing.
Nate, please stop trolling.
DREMT please get help for your OCD.
#2
Nate, please stop trolling.
Looks like I was correct in saying that https://oz4caster.wordpress.com/wp-content/uploads/2025/08/d1-gfs-gta-daily-2025-08-01.gif would well predict the outcome of UAH global temperatures.
You were correct. I suspect if we had more data we would be seeing and increase in cloudiness as the main driver of the cooling. This follows Christopher’s point that we are seeing negative feedback.
The Earth’s climate is slowly returning to its pre Hunga-Tonga eruption state. The only response by the alarmist crew will be to push longer term trends which are still influenced by this temporary warming. They will have no explanation for the cooling.
What are you talking about? Variability is not contested by anyone. Why would anyone have difficulty explaining recent months being cooler than the latest peak in UAH temps?
Are you imagining that someone said the recent high temps are here to stay? What dream are you dreaming about this mythical ‘alarmist crew’?
Thank you, barry, for your comment. Indeed, as you suggest, no clear thinking person will say that “the recent high temps are here to stay”. But there are others who support the “official” warmista Hansen–Schlesinger–IPCC theoretical doctrine of “amplification by positive feedback through the radiative effects of increased water vapour”. Their theory predicts the persistence of the recent high temps. Dr Spencer’s data blow that theory away.
WV amplification is about tropospheric WV.
Hunga Tonga injected WV into the stratosphere, and I don’t know of anyone who suggested that this injection would not eventually fall out, nor of anyone who suggested that this had any relation to the WV amplification effect, which is a feedback to tropospheric background temperature.
IOW, I’m not sure what prompts you to conflate two separate issues.
IF the HT WV injection had a significant warming effect (consensus is that it didn’t), NASA and other bodies expected that effect to dissipate in several years, along with the elevated stratospheric WV concentration:
“The excess water vapor injected by the Tonga volcano, on the other hand, could remain in the stratosphere for several years…
The effect would dissipate when the extra water vapor cycles out of the stratosphere and would not be enough to noticeably exacerbate climate change effects.”
https://www.nasa.gov/earth/tonga-eruption-blasted-unprecedented-amount-of-water-into-stratosphere/
Thank you, barry, for your comment. To get from the sea to the stratosphere, the water had to pass through the troposphere, and to cycle back to the sea, the stratospheric water has to pass through the troposphere. You are right to observe that people haven’t been talking about tropospheric water vapour in this scenario. I think they know that water vapour in the troposphere is such an example of negative feedback that it is hardly in dispute. If there were genuine positive feedback, even the unreported amounts of water vapour that were put and are still being put into the troposphere would have interacted with the increased tropospheric temperature, and triggered the instability.
“If there were genuine positive feedback, even the unreported amounts of water vapour that were put and are still being put into the troposphere would have interacted with the increased tropospheric temperature, and triggered the instability.”
No. Tropospheric water vapour content is determined by temperature and pressure. Once it falls from the stratosphere it rains out in less than a week. That’s why WV is seen as a feedback, not a forcing, to changes in tropospheric temperature. And that’s why there are no measurements of changes in tropospheric WV concentration.
Also, the amount of WV in the stratosphere is far smaller than in the troposphere. While stratospheric WV increased by 10%, the same amount of WV (146 Tg) in the troposphere amounts to an increase of 0.002% (of a total 13,000,000 Tg). The HT WV injection had virtually no impact on total WV content in the troposphere, and would have contributed next to zero warming in that layer of the atmosphere, differently to the stratosphere.
I’m afraid you are alone in trying to conflate these two ideas of tropospheric WV feedback and HT water vapour injection into the stratosphere.
“I think they know that water vapour in the troposphere is such an example of negative feedback that it is hardly in dispute.”
My understanding is that water vapor added to the troposphere increases the GHE, which would be positive feedback.
barry, the HTE can be seen in the UAH graph above. Note the spike in anomalies.
It’s funny that your “consensus” can’t see it. The HTE was able to do what the bogus GHE can’t.
Obviously your “consensus” is jealous….
Poor Clint has no idea what’s being talked about.
barry, if you weren’t such a child I wouldn’t have to explain your own words to you:
“IF the HT WV injection had a significant warming effect (consensus is that it didn’t)…”
https://www.drroyspencer.com/2025/08/uah-v6-1-global-temperature-update-for-july-2025-0-36-deg-c/#comment-1709991
When you grow up, you’ll learn to NOT make false accusations.
You still don’t get it Clint. And there was only one word in italics in the original. If you read for comprehension instead of being triggered…
barry, please stop trolling.
In 1937, Soviet census officials were disappeared for reporting numbers Stalin didn’t like.
In 2025, Trump fired the head of the Bureau of Labor Statistics because the jobs numbers made him look bad.
Different century, same instinct: if the facts don’t flatter the regime, shoot the messenger and burn the ledger.
An alternative view on this is that successive US governments had removed the voices that didn’t fit the narrative and Trump reinstated them.
That alternative view collapses under even modest scrutiny.
The BLS operates with a long-standing reputation for methodological rigor and independence across administrations of both parties. Its unemployment figures are routinely corroborated by multiple independent sources, including ADP, Moody’s, and private-sector payroll and economic analytics firms.
If a president fires a statistical agency head not for malfeasance or inaccuracy, but for publishing data that conflicts with his preferred narrative, that is not restoring balance; that is undermining institutional integrity. Dismissing verified facts in favor of political convenience is not reform. It is propaganda.
He should keep Biden’s appointment because you think so?
“He should keep Biden’s appointment because you think so?”
Yes, historically these are apolitical appointments that serve 4 y terms. Biden kept his Trump appointee.
There is no good reason to turn the BLS into a political operation.
Indeed this reminds us of the tradition in the Soviet Union, which was to avoid reporting bad news to the leaders, else you could lose your job or be sent to Siberia.
This led ultimately to failures like Chernobyl, and finally the collapse of the Soviet Union.
She was fired for incompetence. Sorry to ruin your TDS fantasies.
https://www.whitehouse.gov/articles/2025/08/bls-has-lengthy-history-of-inaccuracies-incompetence/
You are missing the bigger picture. It wasn’t the latest numbers that led to the firing. It was the updates to the May numbers. Those numbers weren’t even close according to the revision. Trump fired the head of the department because they were reporting junk numbers.
Richard M.
The BLS estimates the employment rate for over 100 million people by sampling “just” ~200,000 people, of necessity, an inaccurate exercise.
The 90% confidence interval for the monthly change in total non-farm employment from the establishment survey is on the order of plus or minus 136,000.
So, the predicted rise of 73,000 jobs in July could turn out to be either a minus 70,000 or plus 200,000, in round numbers.
Let’s take Trump’s words at face value. He stated:
“In my opinion, today’s Jobs Numbers were RIGGED in order to make the Republicans, and ME, look bad — Just like when they had three great days around the 2024 Presidential Election, and then, those numbers were ‘taken away’ on November 15, 2024, right after the Election, when the Jobs Numbers were massively revised DOWNWARD, making a correction of over 818,000 Jobs — A TOTAL SCAM.”
So he fired her for this scam.
But the private ADP numbers showed that May and June were indeed very low in new jobs, in fact June was negative for private sector jobs.
https://mediacenter.adp.com/2025-07-30-ADP-National-Employment-Report-Private-Sector-Employment-Increased-by-104,000-Jobs-in-July-Annual-Pay-was-Up-4-4
The discrediting whitehouse.gov propaganda can’t change facts:
” Its unemployment figures are routinely corroborated by multiple independent sources, including ADP, Moody’s, and private-sector payroll and economic analytics firms. “
That really was not the issue for Trump. It was the revision of 1/4 million jobs in previous months, that possibly could have given him more ammo in his fight with the Fed on interest rates for this latest round.
BillyBob
” … the revision of 1/4 million jobs in previous months… ”
Where the heck do you have that from?
Why don’t you present a trustworthy source for your allegation?
Thats ironic Bindidon, the source is the BLS. The revisions for May and June lowered net employment over 250,000. The talk on CNBC today is that the probability of an interest rate cut in September has increased due the soft job market. But I guess we will see next month. My point is that if the numbers were more accurate in May/June, we may have had a different Fed statement this month.
Apos BilliyBob, you were of course right, no idea why I myself rejected what I had seen already :–(
But nevertheless, you shoud put this 250,000 into the correct context.
I tried to explain this to the MAGAmaniacs Clint R and his so dirty insulting acolyte Anderson:
https://www.drroyspencer.com/2025/08/uah-v6-1-global-temperature-update-for-july-2025-0-36-deg-c/#comment-1710208
I suppose one could also relate the Biden/clinton/obama persecutions of all things Trump, as well, to Stalin. But what any of this has to do eith the June anomoly is beyond me.
I think that makes this the 4th warmest July in the UAH record. Well down on the last two years, and slightly below 1998.
How do you see the rest of 2025 turning out?
https://oz4caster.wordpress.com/wp-content/uploads/2025/08/d4-gfs-gta-daily-2014-2025-08-01.gif
Top 10 warmest July’s
Year Anomaly
1 2024 0.74
2 2023 0.56
3 1998 0.38
4 2025 0.36
5 2022 0.32
6 2020 0.30
7 2016 0.26
8 2019 0.24
9 2010 0.20
10 2021 0.19
8 of the 10 warmest have happened in the last 10 years.
https://i.imgur.com/ICJwTTd.png
My estimate for 2025, based on a simple linear projection, drops slightly to 0.49 +/- 0.10C.
https://i.imgur.com/iJPsby8.png
But I think it’s more likely the projection will drop over the rest of the year.
This month’s anomaly is now just slightly above the long term trend.
https://i.imgur.com/PSW1auq.png
These non-systematic step changes have set up sinusoidal patterns after the step change. The crests of the sinusoids tend to be below the peaks. Curious to see where the trough sets.
Yes, stephen p anderson, indeed, as you observe, the subsequent crests are below the peak. The “official” warmista Hansen–Schlesinger–IPCC “amplifier” model says that such oscillations will be undamped; Dr Spencer’s empirical data refute that: they show that such possible oscillations are damped.
What is your prediction for this month?
“The ‘official’ warmista Hansen–Schlesinger–IPCC ‘amplifier’ model says that such oscillations will be undamped”
No. WV amplification has nothing to do with interannual variability.
Also “Hansen–Schlesinger–IPCC” sounds like the latest pejorative catchphrase empty of meaning but full of bilious rhetoric.
barry, please stop trolling.
Right now 2 of August 2025, according to Copernicus, from the peak of 18 of November 2023, in terms of surface temperatures, it has decreased 0,66dC globally. From average troposphere, from the peak of April 2024 (+0.94dC), it has decreased 0,58dC. It looks like after Hunga Tonga, temps are returning to the mean, and earth cooling a little bit. Hope it continues in the future.
The surface temperature of the ocean is exactly as it should be at this time of year. In the western Pacific, it reaches 30 C (more can’t because of the pressure near the surface and the increase in convection in these areas).
https://i.ibb.co/1tXPRBz7/cdas-sflux-sst-global-1.png
It’s only one month, but it is a relief to see those gobsmacking temperatures reverting to the long term trend.
Entropic Man, please stop trolling.
Here’s why BLS revises numbers:
https://www.bls.gov/opub/btn/volume-2/revisions-to-jobs-numbers.htm
The size of the revisions are almost always less than a percent of the total workforce.
https://www.bls.gov/web/empsit/cestn.htm#Benchmarks
Trump and the Repubs are creating a false scandal, presumably based on Trump’s political ego. BLS initial figures are based on 70% of the data, and their revisions climb to over 90% of the nationwide data.
An initial total jobs estimate from 70% of the data that is less than a percent off the final estimate with 90+% of the data is a very good error window.
But because revisions to monthly changes in the labour force are a much larger percentage, they can become a political football. But Trump has gone way beyond the usual politicking and actually attacked the bureau for what happens normally.
The President can have the person of his choosing.
And the rest of us can draw the conclusion of our choosing about his lack of character and competence.
It appears you’ve already drawn your conclusion.
There was no need to fire her. This was an overtly political act of retribution.
And no, the pres cannot simply install whoever they want. It is a senate-confirmed position, and because it is a non-partisan role the senate always confirms with significant majority.
Trump has thrown a tantrum and shown everyone who works in government that he might nix you if you tell a truth that he doesn’t like. Petty tyrant.
She works for Trump. He decides what is necessary.
His ego decided it was necessary to fire her just because he didn’t like the revised numbers. He said it plainly himself – the revisions were done to “make me look bad.” BLS revised as usual and he got upset about the optics.
Since 1884 when it was created, the BLS has made revisions, sometimes large, to the initial report after further data came in. This is the first time in 140 years that a president has fired the head of the BLS.
You keep justifying this unprecedented action by referring to the president’s authority, not by the quality of the decision. This is the very definition of an authoritarian mindset.
In the very same vein:
https://www.lemonde.fr/international/article/2025/08/03/jeanine-pirro-ex-star-de-fox-news-confirmee-procureure-de-washington-par-le-senat-americain-sur-demande-de-donald-trump_6626393_3210.html
” Former Fox News star Jeanine Pirro, confirmed as Washington’s U.S. Attorney by the U.S. Senate at Donald Trump’s request
This 74-year-old judge, who is taking on one of the most important positions in the country, has written several books in support of the U.S. president and shared conspiracy theories about the 2020 election, which Donald Trump lost to Joe Biden. “
Bindidon, please stop trolling.
christopher…”This month’s post is of great importance. It shows strong empirical evidence that the earth’s energy transport process….”
***
I agree with your post, I just wish you’d refrain from calling it energy and refer to it as heat. The word energy is proper but it is far too general. What type of energy is being transferred? Also, there is a move afoot to discredit heat as a form of energy and heat is the problem we are facing, not so much a generic energy.
Gravitational energy holds our atmosphere in place as the planet rotates, otherwise Earth could not support life since the atmosphere would drift off into space. There would be no climate without gravitational energy, which creates a force on mass, attracting mass,including atmospheric gases to the surface.
If we say a mass has gravitational energy, it means ‘something’ is attracting the smaller mass to the greater mass of the planet. We have no idea what that something is, which is true of any kind of energy. Thermal energy, aka heat, is a reference to energy associated with atoms, in fact, heat has been defined as the kinetic energy of atoms by Clausius. That can apply to the internal energy within an atom or the kinetic energy of an atom in motion, even to the vibration of atoms in a solid.
Clausius, who is credited with the definition of internal energy in the 1st law, originally defined internal energy as internal heat plus internal work. However, he made it clear that it was the internal heat that is responsible for the internal atomic vibrations that constitute internal work. He was talked into dropping the dual energy designation by Thompson, an egregious error IMHO. Today, we have people talking about internal energy as some mystical entity that is lumped under the generic description of plain energy.
I have argued here with those who insist that heat is a philosophical entity that indicates a transfer of generic energy. They refuse to specify which type of energy is being transferred due to a temperature difference and by definition it can only be heat that is being transferred. Ergo, the modern definition of heat is reduced to a transfer of heat, not thermal energy itself.
We live in confused scientific times.
Temperature is a human definition, based initially on the relative level of heat. The heat in water at the freezing point of water and the heat in water at the boiling point of water were adopted as set points. 0C was designated by Celsius as the freezing point of water and 100C was designated as the boiling point. Linear gradations in between designated temperatures between.
Maxwell, along with Boltzmann, muddied the waters by defining temperature as the average kinetic energy of molecules in a theoretical gas. However, Celsius (1742) and Fahrenheit (1724) had already defined temperature using the freezing and boiling points of water as set points. Clearly, temperature was a human definition and not a natural phenomenon like heat energy. Heat infers atomic motion whereas temperature has a vagueness about it.
Where has all the warming gone?
Long time cooling.
Where has all the warming gone?
Long time no see.
Where has all the warming gone?
To the ocean I hear them say,
When will they ever learn?
When will they ever learn?
My apologies to Pete Seeger.
The oceans remain at near record temperatures.
https://climatereanalyzer.org/clim/sst_daily/?dm_id=world2
And well above the pre 2023 levels.
Click the Anomaly map to see the massive heatwave in the Northern Pacific that we have had for 4 years.
Nate, please stop trolling.
DREMT please stop extending long dead threads.
#2
Nate, please stop trolling.
Ho~g~le
In the previous monthly report thread, you copied and pasted the WUWT stuff about Marcott and Mann concerning past reconstructions.
Typical pseudoskepticism mostly based on singular points grossly amplified to a global of course negative appreciation.
*
Feel free to continue this discrediting sequence with the next element in the chain:
Ranking of tree-ring based temperature reconstructions of the past
millennium
J. Esper & al. (2016)
https://www.climatology.uni-mainz.de/files/2016/03/Esper_2016_QSR.pdf
*
” Tree-ring chronologies are widely used to reconstruct high-to low-frequency variations in growing season temperatures over centuries to millennia.
The relevance of these timeseries in large-scale climate reconstructions is often determined by the strength of their correlation against instrumental temperature data.
However, this single criterion ignores several important quantitative and qualitative characteristics of tree-ring chronologies. Those characteristics are (i) data homogeneity, (ii) sample replication, (iii) growth coherence, (iv) chronology development, and (v) climate signal including the correlation with instrumental data.
Based on these 5 characteristics, a reconstruction-scoring scheme is proposed and applied to 39 published, millennial-length temperature reconstructions from Asia, Europe, North America, and the Southern Hemisphere. Results reveal no reconstruction scores highest in every category and each has their own strengths and weaknesses. ”
*
Addendum
Großräumige Temperaturrekonstruktionen
mit Baumringen
Jan Esper (2022)
https://www.climatology.uni-mainz.de/files/2022/11/Esper_2022_AWLM.pdf
Just so we’re clear, Binny, I know the Auditor’s stuff inside out. But if you are to bait Walter as you baited for years our bunch of cranks on two of their three main talking points, you are on your own.
Not my pig, not my farm.
As so often from you, Willard: a completely useless, counterproductive, egomaniacal post.
Will you ever be able to stop yourself from rambling when it makes absolutely no sense?
Lass mich verdammt nochmal in Ruhe!
Warnings can be useful, dearest Binny:
https://climateaudit.org/tag/esper/
But one needs not be tone deaf.
Besides, I was mostly making sure he got the memo about something he was querying earlier.
Carry on.
Willard boy
Who would care what your good old stupid friend Mc Intyre says?
Few really cares about tree rings, Binny, including you. So why handwave to something you do not want to discuss, from another thread that had died? It’s not only ignorant, it’s self-defeating.
You’re on your own, pseudo-luckwarmer. Best of luck.
Looks that Willard sees through Bin-liner too. Always knew it wasn’t just bias.
Ho~g~le
Let me add this comment confirming what I mean with
” Typical pseudoskepticism mostly based on singular points grossly amplified to a global of course negative appreciation. ”
**
Look at your post wrt my evaluation of the German Weather Service’s data:
https://www.drroyspencer.com/2025/03/uah-v6-1-global-temperature-update-for-february-2025-0-50-deg-c/#comment-1699827
*
You wrote – without having the slightest idea what the people you quote mean:
” A quality control level of 5 is classified as ‘historic, subjective procedures’. ”
*
Did you ever ask the DWD team what they mean with ‘subjective‘, and what it means in exact terms of uncertainty?
Of course you didn’t, Ho~g~le.
*
But the very best comes a bit later, when you dare to write:
” Given this, aligning pre-1980 data with post-1980 data would not be ideal. The document supports this:
“When using the ‘historical/’ and ‘recent/’ directories together, the temporal overlap must be taken into account and that the type of quality control differs.” ”
*
If you were an experienced engineer, you would have compared the two directories, as I did years ago before my first evaluation.
And you would have seen that ‘historical’ vs. ‘current’ has nothing to do with your supposed ‘pre-1980 data vs. post-1980 data’, but rather means ‘fixed, validated’ as opposed to ‘processed, but not yet validated’ data.
For example, on January 8, 2025, the ‘historical’ data for
00044 20070401 20250802 52.9336 8.2370 Großenkneten
ended on December 31, 2023, while the ‘recent’ data began on October 13, 2022.
*
The reason for your ignorance is obvious: you very probably would never bother to open compressed files.
*
For people like you, it would be best not to publish posts that ultimately only reflect your own lack of technical skills.
Bindidon, please stop trolling.
SOLAR MINIMUM UPDATE
Nashville is headed into its 27th straight day in the 90s on Monday, which puts this heat wave in rare territory. The National Weather Service says it is the longest streak since 2022 and among the ten longest 90-degree streaks on record for the city.
https://wpln.org/post/peak-heat-expected-in-nashville-continuing-streak-of-90-degree-days/
I wonder why contrarians don’t worry that climate models could have underunderestimNashville’s last two years.
where are you going with this one Willard? all you have said is it is neither unusual or unprecedented, when did the instrumental records begin in Nashville? If they are less than 200.years old, all you are talking about is the odd warm spell in a warmer climate regime.we have little wind forecast for the UK tomorrow,if it blows some ones hat off it will be all over the media.
The last three days it has been in the low 80’s. Not sure where Willard is getting his info. Maybe it is the same people who produced MODTRAN.
Which part of my last sentence you do not get, Ian, and do you realize scientists know Antarctica was a verdant paradise more often than not?
One very big disadvantage of being a selfish asshat is that your beliefs carry no currency.
Yep starting from July 2, all of the rest of July had highs in the 90s.
https://www.accuweather.com/en/us/nashville/37243/july-weather/351090
This Summer has not been bad at all. Several years ago, we had maybe a half dozen days above 100. This year I’ve not seen any days above 90.
binny…”In the previous monthly report thread, you copied and pasted the WUWT stuff about Marcott and Mann concerning past reconstructions”
***
In their critique of Mann’s data in the hockey stick, NAS disqualified their claims on two points…
1)Mann et al used only one tree ring sample for the 13th or 14th century. Subsequently, NAS raised their base claim to 1600 from 1000 AD, The IPCC were so embarrassed, they raised it to 1850.
2)NAS disqualified their usage of pine bristlecone upon which they proxied the entire 20th century. Ergo, the blade and lower portions of the stick handle were null and void as was most of the 20th century.
When the pine bristlecone began showing cooling in the 1960’s, MBH solved the problem with chicanery. They simply snipped off the cooling proxy data and replaced it with real surface data.
Don’t know how you can defend an egregious alarmist like Mann.
https://climateaudit.org/2006/06/22/nas-panel-report/
Robertson
You are not even able to properly read comments you ‘reply’ to.
Only people as dumb as you or even dumber (if that is possible) can appreciate your clueless posts.
Bindidon, please stop trolling.
nate…you posted a link to ESTIMATED ocean temperatures. Here are the real, measured temperatures…
https://www.nsstc.uah.edu/climate/
Doesn’t look so hot to me without the climate analyzers bright reds and oranges to fool people into thinking the oceans are boiling hot.
Robertson
” Here are the real, measured temperatures… ”
*
Here too you behave, as always, as the ignoramus de service, as always unable to accurately understand the meaning of ‘estimate’, let alone to inform yourself about what is ‘real’ and ‘measured’.
https://climatereanalyzer.org/clim/sst_daily/?dm_id=world2#info
Atmospheric temperature measurements through evaluation of O2 emissions in the 60 GHz range are based on swaths mostly much broader than the 0.25 x 0.25 degree, and are subject to uncertainty much greater than that for ground-based measurements:
” Satellite-based oxygen (O2) sensing in the lower troposphere is subject to significant uncertainties, primarily due to factors like cloud cover, aerosol scattering, and the inherent challenges of measuring a relatively uniform and abundant atmospheric component. While satellites excel at measuring total column O2, retrieving O2 concentrations specifically within the lower troposphere (the atmospheric layer closest to the Earth’s surface) is more difficult. ”
*
For you and the people follwing your nonsensical posts, anything coming from UAH is by definition ‘correct’.
Gordo! I think Alberta wants to be 51st state.
BACK AT THE RANCH
CMN: An auto parts maker in Detroit just had to layoff 100 workers and shut down a warehouse. The owner specifically blamed tariffs.
STEPHEN MIRAN: It’s always convenient to blame political changes when your business fails
Winning!!!
Willard, please stop trolling.
Friday, Trump fired the head of the Bureau of Labor Statistics because he didn’t like the numbers.
Sunday, he said “You know, we’ve cut drug prices by 1200, 1300, 1400, 1,500%. I don’t mean 50%. I mean 1400, 1,500%.”
Wait ’till he finds out that any “cut” over 100% would be a refund!
The thing about the economy that every dictator learns sooner rather than later is that you just can’t hide bad news forever.
But the wildest part about Trump’s innumeracy is he’s covering up the fact that his name is all over the Epstein files, and he’s about to pardon a convicted child sex trafficker to keep his coverup going.
No, he fired her because he believes she’s incompetent. Those are certainly grounds for dismissal.
Kamala was your choice….LOL.
” No, he fired her because he believes she’s incompetent. ”
Typical, utterly stupid lie of a stubborn MAGAmaniac.
*
The Trump~ing boy:
” In a message on his social network, Truth Social, on Monday, August 4, the President of the United States wrote: “I will choose an exceptional replacement,” after repeating that the data had been, in his opinion, “FAKED” for political purposes to “minimize the success” of his early term. ”
*
The whole world knows that the Trump-ing boy fired Erika McEntarfer just because she dared to release data he didn’t like, but Anderson (you know, the guy who calls me a “Nazi” or “fascist”) will endlessly protect his religiously beloved golden calf.
*
The Trump~ing boy again:
” The president accused Erika McEntarfer of rigging employment figures, without providing any evidence of any data manipulation. Since early 2024, she has headed the Department of Labor’s Statistics Service, which publishes the benchmark figures on employment, productivity, and price indices (CPI) in the United States. ”
*
BBC:
https://www.bbc.com/news/articles/cvg3xrrzdr0o
Trump fires lead official on economic data as tariffs cause market drop
US President Donald Trump has fired the boss of one of America’s most important economic institutions hours after weaker-than-expected jobs data stoked further alarm about his tariff policy.
On social media Trump claimed that Erika McEntarfer, commissioner of the Bureau of Labor Statistics (BLS), had “RIGGED” jobs figures “to make the Republicans, and ME, look bad”.
*
The US currently experience with the Trump~ing boy the worst president ever, even far worse than Double U or Nixon.
New jobs, as reported by BLS:
Month—–Estimate—–Revision
May—–144,000—–19,000
June—–147,000—–14,000
Incompetence or malfeasance, or both?
The point is — if they can’t do any better than that, we don’t need them.
Drain the swamp!
Of course, the cult kids LOVE incompetence and malfeasance, just look at their fervent support for the CO2 nonsense.
Blinny,
Nazi boy who doesn’t like being called a Nazi but continuously sounds like a Nazi. He can fire her because of the way she looks. That’s his prerogative. But he does believe she’s incompetent and that’s also his prerogative. Typical of a Nazi socialist wanting to keep his Deep State buddies in positions of influence. Why would a German Nazi even care? Because leftists are all one big happy dumb family.
The cult kids hate free-market capitalism. They are the masterminds. They should control the economy, and the atmosphere, and anything else that advances their utopian agenda. Blinny, where is your leftist utopia? Where has it ever been? The Third Reich? Marxist Russia? Cuba? Venezuela? Where?
If Clint R wasn’t a poor ball-on-a-string ignoramus and Anderson a dirty, malfeasant asshole permanently insulting me as a NAZI, they would have a different look at what a liar his idol, the Trump~ing boy, in reality is.
To understand what REALLY happens, they should stop KISS-ing, and consider sources showing a different view on non-farm payrolls, e.g.
https://think.ing.com/uploads/charts/_w800/Julypayrolls.png
Here we clearly can see it: the private sector losses in October and even July 2024 were higher than in both May and June 2025.
*
In the ING report, we read:
” September cut looks increasingly likely even with rising inflation
The mediocre headline figure for July is one thing, but the huge revisions suggest that the jobs market has lost momentum earlier than thought and the pressure from the President for Fed action is only going to intensify after this.
The statements from the two Fed Governors who voted for rate cuts this week – Chris Waller and Michelle Bowman – commented that they felt the Fed was being “overly cautious” with the risk that policy is “falling behind the curve”.
This sentiment is likely going to be felt more broadly within the Fed after today’s numbers, especially with tariffs set to eat into household spending power and corporate profits, thus creating a major headwind for growth. ”
https://think.ing.com/articles/weak-jobs-report-reignites-prospect-of-imminent-us-rate-cuts/
*
It’s astonishing how uneducated the Trump~ing boy, his staff, and his MAGA-obsessed populace are when it comes to economics. They all fail to grasp that the main consequence of rising US tariffs isn’t that America is getting bigger again.
It’s that costs for businesses and consumers in the US are rising, resulting in ever more job losses.
*
But wait: It won’t be long before the cowardly Trump~ing boy once again blames Biden for everything he himself is to blame for.
No Blinny, Trump understands our best hope for continued US prosperity is to bring jobs back to the US. After WWII we were the world leader in manufacturing. And yes, Japanese auto manufacturing forced US manufacturers to do better. They were trained by an American. But US policy after that was to allow foreign countries to export their cheap labor into the US and not allow US goods into their countries. Walmart switched from buy American to kill American jobs. That was crony capitalism, not free-market capitalism. Trump knows we need a fair playing field. Japanese won’t import US rice or beef cattle. The Brits won’t import US cars. Canada has restrictions on US imports. Europe extorts and fines large American companies like Apple and Google. China steals our intellectual property and sends students to spy. Enough is enough.
” The cult kids hate free-market capitalism. ”
*
No. The so-called ‘cult kids’ (1) do not ‘hate’ anything, and (2) understand very well the concept.
Rather do the MAGA-obsessed idiots not understand at all that the Trump~ing boy’s tariff idiocy is the exact opposite of free market capitalism, especially when tariffs on Brazilian products, for example, have nothing to do with economics, but only with the political will to help Jair Bolsonaro, the man who, like him, tried to overturn the democratic elections in his country and stage a coup.
*
What the Trump~ing boy is doing is slowly establishing a dictatorship, which he himself hinted at so unequivocally at a rally during his 2024 campaign:
“If I win this election, you won’t have to vote anymore.”
*
Due to his increasingly dictatorial behavior – something the overwhelming majority of US citizens absolutely abhor – the Republicans will never be able to win the midterm elections.
And for this exact reason, these will very probably not take place – unless he and all these Republicans hopelessly loyal to him are all stopped decisively.
*
The cult clearly is on the other side.
” No Blinny, Trump understands our best hope for continued US prosperity is to bring jobs back to the US. ”
*
This has now become the blatant hallmark of absolute ignorance.
You’re not only evil and filthy enough to constantly insult others in the worst possible way; you’re also stupid and ignorant enough to believe your MAGA idol’s megalomaniac and egomaniacal ‘politics’ could ever lead to jobs returning to the US.
Due to the current tariff hurdles, some somewhat spooked megacorporations will have a short-term economic interest in temporarily relocating some locations to the US.
However, the result will, at best, be the relocation of robots, not human jobs – except for the bloated bureaucracy of these branches.
*
How can you be so childishly stupid, Anderson?
I’m ending this conversation now: Your insulting behavior and the stupidity of your 6.9-liter pickup driver mentality are simply too much.
MAGA made Trump, not the other way around. He’s doing what we want.
Bindi, your TDS is showing, again.
TDS is a manifestation of their mental disturbance.
Trump didn’t bother to investigate what led to the large revision. He just said ‘Ur fired’ to the messenger.
That seems to be what his supporters like in a TV personality.
What they fail to realize is that he is a showman. He boasts that everything is the greatest ever.
So it can’t possibly be true that employment is down under his leadership!
Thus he needs to put the blame on someone. Or as so often, just claim that it is fraud.
This is just the way he behaves. And if anyone here hasn’t learned that about him yet, then they are very slow learners.
Employers added 104,000 jobs in July.
Ask our Ivy Leaguer about NFP.
“Trump understands our best hope for continued US prosperity is to bring jobs back to the US”
Highest tariffs since Great Depression.
He wants to make Depressions Great Again!
Nate says:
”Trump understands our best hope for continued US prosperity is to bring jobs back to the US”
Highest tariffs since Great Depression.
He wants to make Depressions Great Again!
————–
Trump did his homework. (A benefit of graduating from Wharton)
The Smoot Hartley tariff act in 1930 was enacted to protect government revenues after the stock market crash. The US had a trade surplus at that time. The guy with the surplus is the guy that loses the trade war.
So Trump latched on to a slightly modified version of the The Reciprocal Trade Agreements Act of 1934 which authorized the U.S. President, Franklin D. Roosevelt, to negotiate bilateral trade agreements with other countries, allowing for tariff reductions of up to 50% in exchange for reciprocal tariff reductions from those countries. This Act aimed to lower trade barriers and stimulate international trade during the Great Depression.
Here the only difference is Trump started with a huge negative trade balance brought on my economic dogma regarding tariffs being bad to an extent that the US had ceased retaliating against trade abuses by other nations vs the US.
One way trade restrictions against the US products resulted in a huge negative trade imbalance for the US due to a “lack” of retaliatory tariffs.
Trump did his homework on this and completed the theory of tariffs and established retaliatory tariffs while simultaneously inviting nations with trade surpluses with the US to negotiate bilateral trade agreements with the US and agree on a tariff structure that would balance trade.
So you can criticize FDR if you wish but 1934 is when the great depression turned around and trade relations became healthy again.
What both parties are really guilty of is decades of feeding huge profits into international corporations who used favorable foreign tax shelters to shelter income taxes and near zero US import tariffs to become very rich at the expense of the American worker.
And who in the US doesn’t like it? Mostly it’s those who now have to choose between favorable offshore income tax shelters while paying tariffs or building factories in the US.
And no doubt you can add a few who want to thrive by thinking inside the box.
So Nate you are certainly welcome to predict a great depression arising from policies that helped bring us out of the depression if you wish, but I wouldn’t advise it.
“This Act aimed to lower trade barriers and stimulate international trade during the Great Depression.”
yep, the opposite of what Trump has done, which is to raise trade barriers.
To lower trade barriers he cannot also raise gov revenue, which is a principle goal.
Of course Nate missed the part about why nation’s retaliate and what the determinant for success is with that retaliation. So he has married a half baked theory.
Its not that our nation’s leaders were dumb in dogmatically following a policy of free trade even in the presence of trade barriers put up by other nations. There are a multitude of reasons to curry favor overseas. Perhaps Nate can tell us what his reason is.
Willard says,one very big disadvantage being a selfish aashat is that your beliefs carry no currency,the truth will set you free,just as i said the BBC rolled out their climate editor on the 6pm news,no mention of past summer storms,Fastnet and others must have alluded him. Its a clown show.
SOLAR MINIMUM UPDATE
Donald has asked NASA employees to draw up plans to end at least two major satellite missions, according to current and former NASA staffers. If the plans are carried out, one of the missions would be permanently terminated, because the satellite would burn up in the atmosphere.
https://www.npr.org/2025/08/04/nx-s1-5453731/nasa-carbon-dioxide-satellite-mission-threatened
Win! Win! Win!
Willard, please stop trolling.
Looks like Graham D. Warner has returned to his old ways.
Willard, please stop trolling.
Republican Karen Notices Climate Change and Demands to Speak With The Manager.
https://youtu.be/HCIhkXh7HBw
Arkady, please stop trolling.
Found this quite interesting
https://tinyurl.com/mrx9su3c
D. M. McLean’s historically important study was published 47 years ago, on August 4, 1978. It offered a concise, qualitative narrative of terminal Mesozoic greenhouse conditions and highlighted the potential analogies to AGW.
The paper proposed that the late Cretaceous “terminal Mesozoic” climate was characterized by high atmospheric CO2, global warmth, and extensive greenhouse conditions; ideas that were forward-looking at the time.
https://www.science.org/doi/10.1126/science.201.4354.401
Overall, McLean’s work is recognized as a pioneering but now superseded conceptual model that helped stimulate decades of high-resolution paleoclimate research.
Did you find something you believe in, Ark? I bet that find doesn’t explain how CO2 can “heat the planet”, huh? Yea,
“CO2 heating” is all beliefs, not science.
If you understood the science, you could easily find something wrong with this:
https://postimg.cc/yJFTRZzW
But, you’d have to know something about radiative physics and thermodynamics….
BACK AT THE RANCH
Transportation Secretary Sean Duffy will announce expedited plans this week to build a nuclear reactor on the moon, the first major action by the former Fox News host as the interim NASA administrator.
WINNNNN
Willard, please stop trolling.
Test:
https://www.drroyspencer.com/2025/07/uah-v6-1-global-temperature-update-for-june-2025-0-48-deg-c/#comment-1709174
Oh, I can finally post links again:
https://www.drroyspencer.com/2025/03/hey-epa-why-not-regulate-water-vapor-emissions-while-you-are-at-it/#comment-1700051
And another one:
https://www.drroyspencer.com/2025/05/uah-v6-1-global-temperature-update-for-april-2025-0-61-deg-c/#comment-1703830
Sorry Chartmaster,
You must always set your reference frame first.
And use the same reference frame for the Moon on the right and the Moon on the left.
The reference frame choice is out of our hands, unfortunately. It is decided by whether “orbit without spin” is as per the MOTL, or the MOTR. Since it’s as per the MOTL, a rotating reference frame must be used to quantify the “spin” rate of orbiting bodies.
No physics, just spin.
“a rotating reference frame must be used to quantify the “spin” rate of orbiting bodies.”
Then you get a spin rate relative to a rotating reference frame, which is wrong.
Then use a different rotating reference frame, which gives a different spin rate.
Or a different wrong answer.
Nobody expects you to understand, bob.
Yes, it is hard to teach physics to a goldfish.
No need to be quite so hard on yourself, bob.
Water vapor has been on increasing trend of about 1.5 % per decade since before 1988. This is more than twice as fast as possible from just planet warming.
Basic physics suggests you are mistaken.
Relative humidity tends to stay the same, while absolute humidity, the maximum water content, increases by 7% per degree C.
Temperatures have been increasing by 0.2C/decade. You would therefore expect water content to increase by 0.2*7=1.4% per decade.
This pretty close to the 1.5% you quote. Good agreement between theory and observation and no need for you to go looking for extra mechanisms.
The 1.5 % is from NASA/RSS measurements.
The ‘more than twice’ results from basic physics and UAH temperature measurements.
Your math method for determining WV increase is incorrect. The ‘7 %’ is a rate which should be applied for each months temperature change from the previous month. Numerical integration using monthly increments is required. The correct method is shown in Sect 7 at the link.
Dan, your method produces strange results that are history dependent.
The vapor pressure is purely a function of temperature, not T history.
Therefore, we should simply multiply the T trend by the 0.067 * Pave to find the P trend .
When we do so with HadCrut, we get a good match to the observed P trend, ~ 0.41 Kg/m^2/decade
Nate, please stop trolling.
testing
SOLAR MINIMUM UPDATE
Warmest July on record for the People’s Republic Of China. In fact, their warmest month on record overall.
Willard, please stop trolling.
Basic physics suggests you are mistaken.
Relative humidity tends to stay the same, while absolute humidity, the maximum water content, increases by 7% per degree C.
Temperatures have been increasing by 0.2C/decade. You would therefore expect water content to increase by 0.2*7=1.4% per decade.
This pretty close to the 1.5% you quote. Good agreement between theory and observation and no need for you to go looking for extra mechanisms.
Entropic Man, please stop trolling.
News from the Turd Reich.
On Tuesday, August 5, 2025, the President of the United States unexpectedly appeared on the White House roof. He wandered aimlessly, engaged in a disjointed exchange with reporters, made cryptic remarks regarding nuclear weapons, gestured erratically, and then departed without offering any explanation.
https://youtu.be/_YIEfAm9JA0
These aren’t ordinary times!
Ark has now regressed to anal fixation. That’s where cultism and TDS takes a person.
BACK AT THE RANCH
Reducing our dependence on whales as an energy source will send us sliding down the slippery, spermaceti-lubricated slope to socialism. If we give up whaling, what will those lackwits come for next? Will I have to surrender my peg leg for a titanium prosthetic?
https://www.mcsweeneys.net/articles/im-captain-ahab-and-i-say-we-must-never-transition-away-from-a-whale-based-energy-industry
Now that the positive feedback/tipping point hypothesis can be rejected, one wonders what they will come up with next be to keep the AGW agenda running.
The left will never stop. They are the legion of the miserable.
SOLAR MINIMUM UPDATE
The high temperature at one of Finland’s northernmost weather stations, in the municipality of Sodankylä (Lapland region) within the Arctic Circle at latitude 67.3°N, reached at least 25°C for 26 days in a row.
Records date back to 1908.
https://bsky.app/profile/wxnb.bsky.social
Nothing unusual in subarctic Lapland. Temperature over 30°C would be unusual. Long lasting heat waves in the summer and cold waves in the winter come from nearby Russia.
Beating record over record has indeed become the new normal.
People like the poster ‘Max C’ I like to name ‘pseudoskeptic’.
Under that category I understand those who tend to downplay anything that doesn’t match their narrative.
*
I don’t have access to daily Finnish data, and my preferred GHCN daily dataset has no data for Sodankylä Tähtelä.
However, it is easy to find a Finnish web site publishing data for July/August 2025:
https://www.foreca.fi/meteorologilta/e5zt4hj1
*
” The record-breaking streak of temperatures above 30 degrees Celsius that began on July 12th is coming to an end. 30 degrees Celsius has been exceeded for 22 consecutive days, which is the longest period of sweltering heat in our digitized measurement history. ”
*
The site luckily says that this extreme period now comes to an end. However, it says also:
” And that's not all. The current heat wave has broken several records, especially in the northern part of the country. At the Meltosjärvi observation station in Ylitornio, a heat wave (over 25 degrees Celsius) has lasted continuously since July 11.
In addition, the first day of August was in some places the hottest August day in Lapland's measurement history, as some local August temperature records were broken. ”
*
Maybe Max C tries to inform himself before posting such boastful blah blah.
Here is a list of temperatures for the GHCN daily Finland station
FI000007501 67.3678 26.6328 179.0 SODANKYLA AWS
*
FI000007501 SODANKYLA_AWS 2025 7 11 26.0 (C)
FI000007501 SODANKYLA_AWS 2025 7 12 27.8
FI000007501 SODANKYLA_AWS 2025 7 13 30.6
FI000007501 SODANKYLA_AWS 2025 7 14 27.8
FI000007501 SODANKYLA_AWS 2025 7 15 26.5
FI000007501 SODANKYLA_AWS 2025 7 16 25.4
FI000007501 SODANKYLA_AWS 2025 7 17 25.2
FI000007501 SODANKYLA_AWS 2025 7 18 30.5
FI000007501 SODANKYLA_AWS 2025 7 19 25.1
FI000007501 SODANKYLA_AWS 2025 7 20 29.4
FI000007501 SODANKYLA_AWS 2025 7 21 29.6
FI000007501 SODANKYLA_AWS 2025 7 22 31.7
FI000007501 SODANKYLA_AWS 2025 7 23 26.5
FI000007501 SODANKYLA_AWS 2025 7 24 27.2
FI000007501 SODANKYLA_AWS 2025 7 25 29.1
FI000007501 SODANKYLA_AWS 2025 7 26 27.5
FI000007501 SODANKYLA_AWS 2025 7 27 25.4
FI000007501 SODANKYLA_AWS 2025 7 29 27.2
FI000007501 SODANKYLA_AWS 2025 7 30 28.0
FI000007501 SODANKYLA_AWS 2025 7 31 30.8
FI000007501 SODANKYLA_AWS 2025 8 1 30.0
FI000007501 SODANKYLA_AWS 2025 8 2 28.5
FI000007501 SODANKYLA_AWS 2025 8 3 26.9
FI000007501 SODANKYLA_AWS 2025 8 4 26.0
*
Nowhere in this station’s daily record since 1908 do you see such a list.
*
Of course: 6,000 years ago or so it was a little bit warmer :–)
MaxC will be happy you proved him right, Bindi. As he stated: “Temperature over 30°C would be unusual.”
Now, you can address some REAL science:
https://www.drroyspencer.com/2025/08/notice-of-availability-a-critical-review-of-impacts-of-greenhouse-gas-emissions-on-the-u-s-climate/#comment-1710285
Hey Puffman, riddle me this –
Federal prosecutors on Wednesday moved to dismiss criminal charges against a woman accused of fraud in Florida who was being represented in court by Brad Bondi, the brother of Attorney General Pam Bondi.
https://abcnews.go.com/US/woman-accused-fraud-hired-ags-brother-lawyer-months/story?id=124429973
Coincidence?
‘Specialist’ Max C wrote above:
” Nothing unusual in subarctic Lapland. ”
But apparently, Clint R’s vicious penchant for denial is increasing exponentially.
I thus repeat the info coming from the Finnish web site:
” The record-breaking streak of temperatures above 30 degrees Celsius that began on July 12th is coming to an end. 30 degrees Celsius has been exceeded for 22 consecutive days, which is the longest period of sweltering heat in our digitized measurement history. ”
Even the one station SODANKYLA AWS’ data, reported by the Finnish Met Office to NOAA for GHCN daily input purposes, contains 5 days over 30 C.
Clint R lies, lies and… lies.
Binbi, you Leftists hate reality, so when someone brings truth, in your head they are lying. So keep proving me right.
And speaking of avoiding reality, you again avoided addressing this:
https://www.drroyspencer.com/2025/08/notice-of-availability-a-critical-review-of-impacts-of-greenhouse-gas-emissions-on-the-u-s-climate/#comment-1710285
Keep proving me right. I can take it.
https://www.foreca.fi/meteorologilta/e5zt4hj1
These temperatures are for the whole Finland. If one day temperature is over 30°C in New York and next day over 30°C in Los Angeles, in Finland they would call it “heat pipe”.
I thought we were talking about 26 days in a row above 25C, Max.
How many series like these have you found since 1908?
Global
https://climatedatablog.wordpress.com/2025/08/08/uah-mean-and-median-global-for-jul-2025/
Tropics
https://climatedatablog.wordpress.com/2025/08/08/uah-mean-and-median-topics-for-jul-2025/
Like every month, Blindsley H00d aka RLH publishes a chart
https://climatedatablog.wordpress.com/2025/08/08/uah-mean-and-median-global-for-jul-2025/
– showing a wrong UAH Global 12 month Median low pass when compared to
https://docs.google.com/spreadsheets/d/174CxYCkDKfQMUhAR4TnWXeKj58yhIiCYvCOF4koSfec/edit?gid=1551212378#gid=1551212378
and
– lacking a UAH Global 5 year Median low pass when compared to
https://docs.google.com/spreadsheets/d/174CxYCkDKfQMUhAR4TnWXeKj58yhIiCYvCOF4koSfec/edit?gid=447018934#gid=447018934
but he will certainly continue to falsely claim that it is not his medians but mine that are wrong, even though the latter are calculated using Excel, software that has been validated for at least 40 years and is used by millions of people worldwide.
The same holds for his Tropics chart of course :–)
So critique the C# source code (which I have published and have failed to do – continuously).
https://climatedatablog.wordpress.com/2025/08/08/uah-mean-and-median-topics-for-jul-2025/ hides the source code. Why?
No, Blindsley H00d: for the umpteenth time I repeat that I won’t waste my time with a critique of your source code which – as I wrote recently – belongs to the worst program sources I’ve ever seen.
*
If you were a REAL software engineer, you would have asked yourself for years why your results differ by so much from an Excel-based solution.
And you would have yourself decided to start what in software engineering is named ‘cross validation’, i.e. implementing an alternative solution based on a way different to your current one.
Instead, you stubbornly stay on your stance.
*
Moreover, the fact that you still are unable to finally provide the blog with a chart showing zhe UAH Global 5 year Median low pass is utterly suspect, to say the least.
As I wrote earlier, it becomes more and more clear that you are not the author of this dumb piece of code, and are able to no more than adding each month new UAH values.
*
For the last time: Prove me wrong by adding this 5 year Median low pass to your C# code and showing us the result, Blindsey H00d.
“your results differ by so much from an Excel-based solution.”
Which you wont reveal.
“you are not the author of this dumb piece of code”
I am. And it is not dumb. I just replaced the call to mean with a call to routine that does median.
“you are not the author of this dumb piece of code”
I just replaced a call to mean with a call to a routine that does median.
” … Which you wont reveal. ”
Now that’s too much.
Are you that dumb that you don’t see THIS is the Excel solution?
https://docs.google.com/spreadsheets/d/174CxYCkDKfQMUhAR4TnWXeKj58yhIiCYvCOF4koSfec/edit?gid=1551212378#gid=1551212378
“If you were a REAL software engineer”
So my employment by Motorola was a fraud? You should tell them.
Fraud? Why? Since when is it fraud to employ incompetent people?
At best, it was a serious mistake my employer would never have made.
No one at our company would have passed the three-month probationary period when coding software as bad as what you published on this blog: s/he would have been fired after just two weeks.
I remember a colleague who had to code firmware in assembly because no cross-compiler was available: he did it with far more care than you did with your dirty C# garbage.
*
But… why are you trying to distract and evade again, Blindsley H00d?
For the last time: when will you finally show us your UAH Global 5 year Median low pass, allowing us all to compare it with my Excel-based result which I uploaded into a Google Docs spreadsheet file?
Source sheet
https://docs.google.com/spreadsheets/d/174CxYCkDKfQMUhAR4TnWXeKj58yhIiCYvCOF4koSfec/edit?gid=1700426125#gid=1700426125
Graph sheet
https://docs.google.com/spreadsheets/d/174CxYCkDKfQMUhAR4TnWXeKj58yhIiCYvCOF4koSfec/edit?gid=447018934#gid=447018934
*
Stop dodging, Blindsley H00d, and start working!
“At best, it was a serious mistake my employer would never have made.”
Motorola checked and verified my credentials (which in included my software credentials) just as yours would have done.
“Which you wont reveal.”
I have sent you a request to alter/view the file. Let’s see if you acknowledge that?
No idea what access problem you have, unless you use TOR.
The file is accessible by anybody on Firefox.
I have already explained to you in the past that sending requests to Google Drive must be avoided.
These people don’t care about privacy.
I obtain your address upon the request (I’ll keep it secret of course) and you would obtain mine with my confirmation – what I absolutely don’t want.
” Motorola checked and verified my credentials… ”
I highly doubt they would have done that if you had presented them your dirty, unreliable piece of C# you posted here, along with your other ‘credentials’.
And moreover, Blindsley H00d: why do you suddenly claim not to have access to data your had no problem to access last month
https://www.drroyspencer.com/2025/07/uah-v6-1-global-temperature-update-for-june-2025-0-48-deg-c/#comment-1708994
and dared to write on July 22, 2025 at 8:52 AM
” Why does your 60 month cascade have high frequency components in it? ”
though you YOURSELF never showed us your own version of a 60 month median cascade for UAH LT’s Globe?
“I remember a colleague who had to code firmware in assembly because no cross-compiler was available”
I remember being asked by CQHQ whether my assemblers were authenticated!
“The file is accessible by anybody on Firefox.”
I don’t use Firefox (and you didn’t say that was a requirement).
“unreliable piece of C#”
Tell that to Microsoft!
Hre is what you brazenly criticized a month ago – without having ever madde the very same job, but now suddenly claim not to access:
https://i.postimg.cc/CxmwkT0L/Screenshot-20250809-211115.png
” Tell that to Microsoft! ”
Since when is a company like Microsoft responsible for the unreliable crap people like you code when using one of the good programming languages it offers?
Again and again and again I ask Blindsley H00k aka RLH for a chart showing us his UAH Global 5 year Median low pass.
Still no chart…
The Mean in that one is larger than the Median though the data says otherwise (see the center).
See https://i.postimg.cc/CxmwkT0L/Screenshot-20250809-211115.png and 1998.
Again and again and again I ask Blindsley H00k aka RLH for a chart showing us his UAH Global 5 year Median low pass.
Still no chart…
” The Mean in that one is larger than the Median though the data says otherwise (see the center). ”
*
Does that mean that trough being yourself absolutely unable to present your own cascaded 60 month median chart, you dare to doubt the correctness of Google Docs’ graphic presentation of their spreadsheets?
You, the poor Perch Ltd failure, do really doubt that?
See
https://www.drroyspencer.com/2025/08/uah-v6-1-global-temperature-update-for-july-2025-0-36-deg-c/#comment-1710553
“you dare to doubt the correctness of Google Docs’ graphic presentation”
Your presentation, not Googles.
” Your presentation, not Googles. ”
Oh that’s now a bit too much, isnt’ it?
Not only are you, since your first graph containing a UAH Global 5 year Mean low pass, still unable to enhance it with a UAH Global 5 year Median low pass as I request since then: you also start brazenly lying.
*
No, Blindsley H00d liar: this is not my presentation but very well that automatically generated by Google Docs, just like this below was generated by the Libre Office Calc spreadsheet calculator installed on my Linux system:
https://drive.google.com/file/d/1NuDlpNz2ujFwbQ7Jf-7wRBVSklyb3Mgm/view
*
You are not only a technically and professionally incompetent person: you are not even capable of behaving decently and therefore resort to the stupidest lies, like little children caught by their mother licking jam.
“You are not only a technically and professionally incompetent person”
Tell that to Motorola and GCHQ.
Again and again and again I ask Blindsley H00d aka RLH for a chart showing us his UAH Global 5 year Median low pass.
*
He is unable to incorporate it into ‘his’ software and therefore resorts endlessly to diversionary and evasive maneuvers.
You are the person that claimed that Motorola and GCHQ were defective.
” You are the person that claimed that Motorola and GCHQ were defective. ”
You are a liar, Blindsley H00d. I never claimed that.
On the contrary, I claimed that if you were really tha author of this dirty C# garbage you posted here a while ago, then you are INDEED a technically and professionally incompetent person.
What Motorola and GCHQ thought about you in the past is of no interest here.
*
And as expected: false claims instead of this UAH Global 5 year Median low pass you still are unable to show.
“What Motorola and GCHQ thought about you in the past is of no interest here.”
Wrong.
“I claimed that if you were really th{e} author of this dirty C# garbage you posted here a while ago, then you are INDEED a technically and professionally incompetent person.”
I am indeed the author.
Do it for yourself
using System.Drawing;

using System.Drawing.Drawing2D;

using System.Drawing.Imaging;

using System.Globalization;

using System.Net;

using MathNet.Numerics.LinearAlgebra;

using MathNet.Numerics.Statistics;

using Microsoft.VisualBasic.FileIO;
namespace UAH_5_year_to_climate
{
public class UAHdata
{
//Year Mo Globe Land Ocean NH Land Ocean SH Land Ocean Trpcs Land Ocean NoExt Land Ocean SoExt Land Ocean NoPol Land Ocean SoPol Land Ocean USA48 USA49 AUST
public int Year { get; set; }
public int Month { get; set; }
public float Globe { get; set; }
public float GLand { get; set; }
public float GOcean { get; set; }
public float NH { get; set; }
public float NHLand { get; set; }
public float NHOcean { get; set; }
public float SH { get; set; }
public float SHLand { get; set; }
public float SHOcean { get; set; }
public float Trpcs { get; set; }
public float TrpcsLand { get; set; }
public float TrpcsOcean { get; set; }
public float NoExt { get; set; }
public float NoExtLand { get; set; }
public float NoExtOcean { get; set; }
public float SoExt { get; set; }
public float SoExtLand { get; set; }
public float SoExtOcean { get; set; }
public float NoPol { get; set; }
public float NoPolLand { get; set; }
public float NoPolOcean { get; set; }
public float SoPol { get; set; }
public float SoPolLand { get; set; }
public float SoPolOcean { get; set; }
public float USA48 { get; set; }
public float USA49 { get; set; }
public float AUST { get; set; }
}
class Program
{
static string uriString = "http://vortex.nsstc.uah.edu/data/msu/v6.1/tlt/uahncdc_lt_6.1.txt";
static string dataDirectory = @"C:\Users\richa\source\repos\UAH 5 year to climate\csv\";
static string dataFile = dataDirectory + "uahncdc_lt_6.1.txt";
static string imageDirectory = @"C:\Users\richa\source\repos\UAH 5 year to climate\Images\";
static void Main(string[] args)
{
Console.WriteLine("Getting UAH data from " + uriString);
List months = new List();
WebClient webClient = new WebClient();
webClient.DownloadFile(uriString, dataFile);
using (TextFieldParser parser = FileSystem.OpenTextFieldParser(dataFile))
{
// Set the field widths.
parser.TextFieldType = FieldType.FixedWidth;
parser.FieldWidths = new int[] { 5, 3, 6, 6, 6, 6, 6, 6, 6, 6, 6, 6, 6, 6, 6, 6, 6, 6, 6, 6, 6, 6, 6, 6, 6, 6, 6, 6, 6 };
//one line header
parser.ReadLine();
while (!parser.EndOfData)
{
string[] fields = parser.ReadFields();
if (fields[0].ToString() == "Year")
break;
UAHdata uah = new UAHdata();
uah.Year = Int32.Parse(fields[0]);
uah.Month = Int32.Parse(fields[1]);
uah.Globe = float.Parse(fields[2]);
uah.GLand = float.Parse(fields[3]);
uah.GOcean = float.Parse(fields[4]);
uah.NH = float.Parse(fields[5]);
uah.NHLand = float.Parse(fields[6]);
uah.NHOcean = float.Parse(fields[7]);
uah.SH = float.Parse(fields[8]);
uah.SHLand = float.Parse(fields[9]);
uah.SHOcean = float.Parse(fields[10]);
uah.Trpcs = float.Parse(fields[11]);
uah.TrpcsLand = float.Parse(fields[12]);
uah.TrpcsOcean = float.Parse(fields[13]);
uah.NoExt = float.Parse(fields[14]);
uah.NoExtLand = float.Parse(fields[15]);
uah.NoExtOcean = float.Parse(fields[16]);
uah.SoExt = float.Parse(fields[17]);
uah.SoExtLand = float.Parse(fields[18]);
uah.SoExtOcean = float.Parse(fields[19]);
uah.NoPol = float.Parse(fields[20]);
uah.NoPolLand = float.Parse(fields[21]);
uah.NoPolOcean = float.Parse(fields[22]);
uah.SoPol = float.Parse(fields[23]);
uah.SoPolLand = float.Parse(fields[24]);
uah.SoPolOcean = float.Parse(fields[25]);
uah.USA48 = float.Parse(fields[26]);
uah.USA49 = float.Parse(fields[27]);
uah.AUST = float.Parse(fields[28]);
months.Add(uah);
}
DrawJpegImageFromUAH("UAH Global.jpeg", "Global", months);
DrawJpegImageFromUAH("UAH NH.jpeg", "NH", months);
DrawJpegImageFromUAH("UAH SH.jpeg", "SH", months);
DrawJpegImageFromUAH("UAH Tropics.jpeg", "Trpcs", months);
//DrawJpegImageFromUAH("UAH Tropics.jpeg", "Trpcs (20N-20S)", months);
DrawJpegImageFromUAH("UAH NoExt.jpeg", "NoExt", months);
DrawJpegImageFromUAH("UAH SoExt.jpeg", "SoExt", months);
DrawJpegImageFromUAH("UAH NoPol.jpeg", "NoPol", months);
DrawJpegImageFromUAH("UAH SoPol.jpeg", "SoPol", months);
}
}
const int imageWidth = 1200;
const int imageHeight = 600;
private static void DrawJpegImageFromUAH(string imageFile, string selection, List l)
{
float[] temperatures = new float[l.Count];
switch (selection)
{
case "Global":
for (int x = 0; x < l.Count; x++)
temperatures[x] = l[x].Globe;
break;
case "NH":
for (int x = 0; x < l.Count; x++)
temperatures[x] = l[x].NH;
break;
case "SH":
for (int x = 0; x < l.Count; x++)
temperatures[x] = l[x].SH;
break;
case "Trpcs":
//case "Trpcs (20N-20S)":
for (int x = 0; x < l.Count; x++)
temperatures[x] = l[x].Trpcs;
break;
case "NoExt":
for (int x = 0; x < l.Count; x++)
temperatures[x] = l[x].NoExt;
break;
case "SoExt":
for (int x = 0; x < l.Count; x++)
temperatures[x] = l[x].SoExt;
break;
case "NoPol":
for (int x = 0; x < l.Count; x++)
temperatures[x] = l[x].NoPol;
break;
case "SoPol":
for (int x = 0; x 5.0f)
vscaleStep = 0.5f;
if (max - min > 3.0f)
vscaleStep = 0.2f;
float gmin = 0.0f;
float gmax = 0.0f;
while (gmax min)
gmin -= vscaleStep;
gmin -= vscaleStep;
float vscaleMax = gmax - vscaleStep;
float vscaleMin = gmin + vscaleStep;
int hscaleStep = 1;
int hscaleMin = first + hscaleStep;
int hscaleMax = last - hscaleStep;
Console.WriteLine("Graph horz {0} to {1}", first, last);
Console.WriteLine("Graph vert {0} to {1}\n", gmin, gmax);
Console.WriteLine("Graph vert scale {0} to {1}", vscaleMin, vscaleMax);
Console.WriteLine("Graph vert scale step {0}", vscaleStep);
Console.WriteLine("Graph horz scale {0} to {1}", hscaleMin, hscaleMax);
Console.WriteLine("Graph horz scale step {0}", hscaleStep);
// Create bitmap
using (Bitmap newImage = new Bitmap(imageWidth, imageHeight))
{
using (Graphics graphic = Graphics.FromImage(newImage))
{
graphic.Clear(Color.White);
int vgraphTop = 20;
int vgraphBottom = imageHeight - 60;
int hgraphLeft = 70;
int hgraphRight = imageWidth - 20;
// Create pens.
Pen wideDarkGrayPen = new Pen(Color.DarkGray, 3);
Pen narrowDarkGrayPen = new Pen(Color.DarkGray, 1);
Pen lightbluePen = new Pen(Color.FromArgb(95, 125, 175), 1);
Pen brightGreenPen = new Pen(Color.FromArgb(0, 255, 0), 3);
Pen bluePen = new Pen(Color.Blue, 3);
Pen dashedBluePen = new Pen(Color.Red, 3);
Pen thinGreenPen = new Pen(Color.FromArgb(0, 255, 0), 1);
Pen thinBluePen = new Pen(Color.Blue, 1);
Pen blackPen = new Pen(Color.Black, 3);
Pen redPen = new Pen(Color.Red, 3);
Pen thinRedPen = new Pen(Color.Red, 1);
SolidBrush whiteBrush = new SolidBrush(Color.White);
wideDarkGrayPen.Alignment = PenAlignment.Center;
brightGreenPen.Alignment = PenAlignment.Center;
bluePen.Alignment = PenAlignment.Center;
dashedBluePen.Alignment = PenAlignment.Center;
thinGreenPen.Alignment = PenAlignment.Center;
blackPen.Alignment = PenAlignment.Center;
redPen.Alignment = PenAlignment.Center;
dashedBluePen.DashStyle = DashStyle.Dash;
Font textFont = new Font("Arial", 12, FontStyle.Bold);
Font smallTextFont = new Font("Arial", 10, FontStyle.Bold);
int vgraphRange = vgraphBottom - vgraphTop;
float vscaleRange = gmax - gmin;
float vscaleRatio = vscaleRange / vgraphRange;
for (float t = vscaleMin; t < vscaleMax + 0.1f; t += vscaleStep)
{
int v = (int)(vgraphBottom - (t - gmin) / vscaleRatio);
if (t -0.05f)
{
graphic.DrawLine(wideDarkGrayPen, new Point(hgraphLeft - 5, v), new Point(hgraphRight, v));
graphic.DrawString(string.Format("{0,2:0}", 0),
textFont,
Brushes.Black,
new Point(45, v - 8));
}
else
{
graphic.DrawLine(narrowDarkGrayPen, new Point(hgraphLeft - 5, (int)(vgraphBottom - (t - gmin) / vscaleRatio)), new Point(hgraphRight, (int)(vgraphBottom - (t - gmin) / vscaleRatio)));
graphic.DrawString(string.Format("{0: #0.0;-#0.0}", t),
textFont,
Brushes.Black,
new Point(30, v - 8));
}
}
graphic.DrawLine(narrowDarkGrayPen, new Point(hgraphLeft, vgraphTop), new Point(hgraphRight, vgraphTop));
graphic.DrawLine(narrowDarkGrayPen, new Point(hgraphLeft, vgraphBottom), new Point(hgraphRight, vgraphBottom));
graphic.DrawLine(narrowDarkGrayPen, new Point(hgraphLeft, vgraphTop), new Point(hgraphLeft, vgraphBottom));
graphic.DrawLine(narrowDarkGrayPen, new Point(hgraphRight, vgraphTop), new Point(hgraphRight, vgraphBottom));
int hgraphRange = hgraphRight - hgraphLeft;
int hscaleRange = last - first;
float hscaleRatio = (float)hscaleRange / (float)hgraphRange;
StringFormat format = new StringFormat();
format.Alignment = StringAlignment.Center;
SizeF txt = new SizeF();
SizeF sz = graphic.VisibleClipBounds.Size;
string text = "";
for (int y = hscaleMin; y <= hscaleMax; y += hscaleStep)
{
text = string.Format("{0:0000}", y);
txt = graphic.MeasureString(text, smallTextFont);
int h = hgraphLeft + (int)((y - first) / hscaleRatio);
graphic.TranslateTransform(0, sz.Height);
graphic.RotateTransform(270);
graphic.DrawString(text, smallTextFont, Brushes.Black, new RectangleF(-(vgraphBottom / 2 - 6), h - 6, sz.Height, sz.Width), format);
graphic.ResetTransform();
graphic.DrawLine(narrowDarkGrayPen, new Point(h, vgraphTop), new Point(h, vgraphBottom + 5));
}
GregorianCalendar gc = new GregorianCalendar();
for (int i = 0; i < l.Count; i++)
{
var item = l[i];
int v = (int)(vgraphBottom - (temperatures[i] - gmin) / vscaleRatio);
DateTime date = new DateTime(item.Year, item.Month, 1);
date = date.AddMonths(1);
date = date.AddDays(-1);
int h = hgraphLeft + (int)(((float)(date.Year - first) + (float)(date.DayOfYear) / (float)(gc.GetDaysInYear(date.Year))) / hscaleRatio);
if (i == l.Count - 1)
graphic.DrawEllipse(redPen, h - 1, v - 1, 3, 3);
else
graphic.DrawRectangle(lightbluePen, h - 1, v - 1, 3, 3);
}
// reference period
int vv = (int)(vgraphBottom - (0 - gmin) / vscaleRatio);
int firstref = hgraphLeft + (int)((float)(1990 - first) / hscaleRatio);
int lastref = hgraphLeft + (int)((float)(2020 - first) / hscaleRatio);
graphic.DrawLine(blackPen, new Point(firstref, vv), new Point(lastref, vv));
graphic.DrawLine(blackPen, new Point(firstref, vv - 5), new Point(firstref, vv + 5));
graphic.DrawLine(blackPen, new Point(lastref, vv - 5), new Point(lastref, vv + 5));
format = new StringFormat();
format.Alignment = StringAlignment.Center;
text = "Anomaly Degrees C";
txt = graphic.MeasureString(text, textFont);
sz = graphic.VisibleClipBounds.Size;
graphic.TranslateTransform(0, sz.Height);
graphic.RotateTransform(270);
graphic.DrawString(text, textFont, Brushes.Black, new RectangleF(10, 5, sz.Height, sz.Width), format);
graphic.ResetTransform();
DateTime dt = new DateTime(l[^1].Year, l[^1].Month, 1);
dt = dt.AddMonths(1);
dt = dt.AddDays(-1);
graphic.DrawString("Latest data: " + dt.Date.ToString("MMM") + " " + dt.Date.Year,
smallTextFont,
Brushes.Black,
new Point(hgraphLeft, vgraphTop - 18));
graphic.DrawString("Data Source: " + uriString,
smallTextFont,
Brushes.Black,
new Point(hgraphLeft, imageHeight - 20));
graphic.DrawString("RLH",
smallTextFont,
Brushes.Black,
new Point(imageWidth - 40, imageHeight - 20));
float[] firstPass60 = RunningMean(temperatures, 60);
float[] secondPass60 = RunningMean(firstPass60, 50);
float[] thirdPass60 = RunningMean(secondPass60, 39);
for (int i = 0; i < thirdPass60.Length - 1; i++)
{
UAHdata item1 = l[i + ((60 + 50 + 39) / 2)];
UAHdata item2 = l[i + 1 + ((60 + 50 + 39) / 2)];
DateTime dt1 = new DateTime(item1.Year, item1.Month, 1);
DateTime dt2 = new DateTime(item2.Year, item2.Month, 1);
dt1 = dt1.AddMonths(1);
dt2 = dt2.AddMonths(1);
dt1 = dt1.AddDays(-1);
dt2 = dt2.AddDays(-1);
int v1 = (int)(vgraphBottom - (thirdPass60[i] - gmin) / vscaleRatio);
int v2 = (int)(vgraphBottom - (thirdPass60[i + 1] - gmin) / vscaleRatio);
int h1 = hgraphLeft + (int)(((float)(item1.Year - first) + (float)(dt1.DayOfYear) / (float)(gc.GetDaysInYear(dt1.Year))) / hscaleRatio);
int h2 = hgraphLeft + (int)(((float)(item2.Year - first) + (float)(dt2.DayOfYear) / (float)(gc.GetDaysInYear(dt2.Year))) / hscaleRatio);
graphic.DrawLine(bluePen, h1, v1, h2, v2);
}
using (StreamWriter sw = new StreamWriter(dataDirectory + $"UAH 5 year {selection} CTRM.csv"))
{
for (int i = 0; i < thirdPass60.Length; i++)
{
DateTime date = new DateTime(l[i + ((60 + 50 + 32) / 2)].Year, l[i + ((60 + 50 + 32) / 2)].Month, 1);
date = date.AddMonths(1);
date = date.AddDays(-1);
sw.Write(date.ToShortDateString());
sw.Write(",");
sw.WriteLine(thirdPass60[i]);
}
}
float[] firstPassMedian60 = RunningMedian(temperatures, 12);
float[] secondPassMedian60 = RunningMedian(firstPassMedian60, 10);
float[] thirdPassMedian60 = RunningMedian(secondPassMedian60, 8);
for (int i = 0; i < thirdPassMedian60.Length - 1; i++)
{
UAHdata item1 = l[i + ((12 + 10 + 8) / 2)];
UAHdata item2 = l[i + 1 + ((12 + 10 + 8) / 2)];
DateTime dt1 = new DateTime(item1.Year, item1.Month, 1);
DateTime dt2 = new DateTime(item2.Year, item2.Month, 1);
dt1 = dt1.AddMonths(1);
dt2 = dt2.AddMonths(1);
dt1 = dt1.AddDays(-1);
dt2 = dt2.AddDays(-1);
int v1 = (int)(vgraphBottom - (thirdPassMedian60[i] - gmin) / vscaleRatio);
int v2 = (int)(vgraphBottom - (thirdPassMedian60[i + 1] - gmin) / vscaleRatio);
int h1 = hgraphLeft + (int)(((float)(item1.Year - first) + (float)(dt1.DayOfYear) / (float)(gc.GetDaysInYear(dt1.Year))) / hscaleRatio);
int h2 = hgraphLeft + (int)(((float)(item2.Year - first) + (float)(dt2.DayOfYear) / (float)(gc.GetDaysInYear(dt2.Year))) / hscaleRatio);
graphic.DrawLine(redPen, h1, v1, h2, v2);
}
using (StreamWriter sw = new StreamWriter(dataDirectory + $"UAH 12 month {selection} Median CTRM.csv"))
{
for (int i = 0; i < thirdPassMedian60.Length; i++)
{
DateTime date = new DateTime(l[i + ((12 + 10 + 8) / 2)].Year, l[i + ((12 + 10 + 8) / 2)].Month, 1);
date = date.AddMonths(1);
date = date.AddDays(-1);
sw.Write(date.ToShortDateString());
sw.Write(",");
sw.WriteLine(thirdPassMedian60[i]);
}
}
float[] firstPass12 = RunningMean(temperatures, 12);
float[] secondPass12 = RunningMean(firstPass12, 10);
float[] thirdPass12 = RunningMean(secondPass12, 8);
for (int i = 0; i < thirdPass12.Length - 1; i++)
{
var item1 = l[i + ((12 + 10 + 8) / 2)];
var item2 = l[i + 1 + ((12 + 10 + 8) / 2)];
DateTime dt1 = new DateTime(item1.Year, item1.Month, 1);
DateTime dt2 = new DateTime(item2.Year, item2.Month, 1);
dt1 = dt1.AddMonths(1);
dt2 = dt2.AddMonths(1);
dt1 = dt1.AddDays(-1);
dt2 = dt2.AddDays(-1);
int v1 = (int)(vgraphBottom - (thirdPass12[i] - gmin) / vscaleRatio);
int v2 = (int)(vgraphBottom - (thirdPass12[i + 1] - gmin) / vscaleRatio);
int h1 = hgraphLeft + (int)(((float)(item1.Year - first) + (float)(dt1.DayOfYear) / (float)(gc.GetDaysInYear(dt1.Year))) / hscaleRatio);
int h2 = hgraphLeft + (int)(((float)(item2.Year - first) + (float)(dt2.DayOfYear) / (float)(gc.GetDaysInYear(dt2.Year))) / hscaleRatio);
graphic.DrawLine(brightGreenPen, h1, v1, h2, v2);
}
using (StreamWriter sw = new StreamWriter(dataDirectory + $"UAH 12 month {selection} CTRM.csv"))
{
for (int i = 0; i < thirdPass12.Length; i++)
{
DateTime date = new DateTime(l[i + ((12 + 10 + 8) / 2)].Year, l[i + ((12 + 10 + 8) / 2)].Month, 1);
date = date.AddMonths(1);
date = date.AddDays(-1);
sw.Write(date.ToShortDateString());
sw.Write(",");
sw.WriteLine(thirdPass12[i]);
}
}
double[] noisyLongTermSignal = new double[l.Count];
for (int q = 0; q < l.Count; q++)
{
noisyLongTermSignal[q] = (double)(temperatures[q]);
}
double[] filteredLongTermSignal = new Filtering.SavitzkyGolayFilter(5 * 12, 2).Process(noisyLongTermSignal);
filteredLongTermSignal = new Filtering.SavitzkyGolayFilter(5 * 12, 2).Process(filteredLongTermSignal);
filteredLongTermSignal = new Filtering.SavitzkyGolayFilter(5 * 12, 2).Process(filteredLongTermSignal);
filteredLongTermSignal = new Filtering.SavitzkyGolayFilter(5 * 12, 2).Process(filteredLongTermSignal);
filteredLongTermSignal = new Filtering.SavitzkyGolayFilter(5 * 12, 2).Process(filteredLongTermSignal);
for (int r = 0; r l.Count - 80)
graphic.DrawLine(thinBluePen, h1, v1, h2, v2);
}
string GrapicText = "UAH " + selection + " 12 month Mean low pass";
string GrapicText2 = "UAH " + selection + " 5 year Mean low pass";
string GrapicText3 = "UAH " + selection + " 5 year S-G Mean projection";
string GrapicText4 = "UAH " + selection + " 12 month Median low pass";
Font GraphicFont = new Font("Arial", 12, FontStyle.Bold);
SolidBrush CaptionBrush = new SolidBrush(Color.Black);
int CaptionWidth = (int)graphic.MeasureString(GrapicText, GraphicFont).Width + 30;
int TextHeight = (int)graphic.MeasureString(GrapicText, GraphicFont).Height;
//int CaptionHeight = TextHeight * 3;
int CaptionHeight = TextHeight * 4;
int CaptionLeft = hgraphLeft + 2;
int CaptionTop = vgraphTop + 2;
graphic.FillRectangle(whiteBrush, CaptionLeft, CaptionTop, CaptionWidth, CaptionHeight + 6);
graphic.DrawLine(brightGreenPen, new Point(CaptionLeft + 10, CaptionTop + 12), new Point(CaptionLeft + 25, CaptionTop + 12));
graphic.DrawString(GrapicText, GraphicFont, CaptionBrush, new Point(CaptionLeft + 30, CaptionTop + 2));
graphic.DrawLine(bluePen, new Point(CaptionLeft + 10, CaptionTop + 12 + TextHeight), new Point(CaptionLeft + 25, CaptionTop + 12 + TextHeight));
graphic.DrawString(GrapicText2, GraphicFont, CaptionBrush, new Point(CaptionLeft + 30, CaptionTop + 2 + TextHeight));
graphic.DrawLine(thinBluePen, new Point(CaptionLeft + 10, CaptionTop + 12 + TextHeight * 2), new Point(CaptionLeft + 25, CaptionTop + 12 + TextHeight * 2));
graphic.DrawString(GrapicText3, GraphicFont, CaptionBrush, new Point(CaptionLeft + 30, CaptionTop + 2 + TextHeight * 2));
graphic.DrawLine(redPen, new Point(CaptionLeft + 10, CaptionTop + 12 + TextHeight * 3), new Point(CaptionLeft + 25, CaptionTop + 12 + TextHeight * 3));
graphic.DrawString(GrapicText4, GraphicFont, CaptionBrush, new Point(CaptionLeft + 30, CaptionTop + 2 + TextHeight * 3));
}
newImage.Save(imageDirectory + imageFile, ImageFormat.Jpeg);
}
}
static float[] RunningMean(float[] f, int count)
{
float[] result = new float[f.Length - count];
for (int i = 0; i < f.Length - count; i++)
{
result[i] = Mean(f, i, count);
}
return result;
}
static float[] RunningMedian(float[] f, int count)
{
float[] result = new float[f.Length - count];
for (int i = 0; i < f.Length - count; i++)
{
result[i] = Median(f, i, count);
}
return result;
}
static float Mean(float[] f, int pos, int count)
{
float result = 0.0f;
for (int i = 0; i < count; i++)
result += f[pos + i];
result /= count;
return result;
}
static float Median(float[] f, int pos, int count)
{
List temp = new List();
float result = 0.0f;
for (int i = 0; i < count; i++)
temp.Add(f[pos + i]);
temp.Sort();
// Calculate the median for an even List of numbers
if (count % 2 == 0)
{
result = (temp[count / 2] + temp[count / 2 + 1]) / 2;
}
else // Calculate the median for an odd List of numbers
{
result = temp[count / 2];
}
return result;
}
}
}
namespace Filtering
{
///
/// Implements a Savitzky-Golay smoothing filter, as found in [1].
/// [1] Sophocles J.Orfanidis. 1995. Introduction to Signal Processing. Prentice-Hall, Inc., Upper Saddle River, NJ, USA.
///
public sealed class SavitzkyGolayFilter
{
private readonly int sidePoints = 0;
private Matrix coefficients;
public SavitzkyGolayFilter(int sidePoints, int polynomialOrder)
{
this.sidePoints = sidePoints;
Design(polynomialOrder);
}
///
/// Smoothes the input samples.
///
///
///
public double[] Process(double[] samples)
{
int length = samples.Length;
double[] output = new double[length];
int frameSize = (sidePoints << 1) + 1;
double[] frame = new double[frameSize];
Array.Copy(samples, frame, frameSize);
for (int i = 0; i < sidePoints; ++i)
{
output[i] = coefficients.Column(i).DotProduct(Vector.Build.DenseOfArray(frame));
}
for (int n = sidePoints; n < length - sidePoints; ++n)
{
Array.ConstrainedCopy(samples, n - sidePoints, frame, 0, frameSize);
output[n] = coefficients.Column(sidePoints).DotProduct(Vector.Build.DenseOfArray(frame));
}
Array.ConstrainedCopy(samples, length - frameSize, frame, 0, frameSize);
for (int i = 0; i < sidePoints; ++i)
{
output[length - sidePoints + i] = coefficients.Column(sidePoints + 1 + i).DotProduct(Vector.Build.Dense(frame));
}
return output;
}
private void Design(int polynomialOrder)
{
double[,] a = new double[(sidePoints << 1) + 1, polynomialOrder + 1];
for (int m = -sidePoints; m <= sidePoints; ++m)
{
for (int i = 0; i <= polynomialOrder; ++i)
{
a[m + sidePoints, i] = Math.Pow(m, i);
}
}
Matrix s = Matrix.Build.DenseOfArray(a);
coefficients = s.Multiply(s.TransposeThisAndMultiply(s).Inverse()).Multiply(s.Transpose());
}
}
}
” Do it for yourself ”
Me, looking in the deep at such a dirty code, let alone changing even one line of it?
Gracias no!
You are really opinionated, aren’t you?
*
My last comment.
If you are really the author, you certainly will
– have tried to copy & paste your Mean 5 year low pass and edit it to a Median 5 year low pass
– have seen that it is even worse than the Median 12 month low pass
– and hence decided not to publish the chart containing it.
My Excel based implementation is for sure correct, as the 12/10/8 and the 60/50/39 cascades are all identical because the cascade window sizes are factorized at spreadsheet begin.
The only difference is the function called (average or median).
@RLH have you heard of python? It does a pretty good job visualizing data without having to rebuild statistacal functions and drawing lines from scatch.
Yes I have heard of python. https://www.online-python.com/ https://en.wikipedia.org/wiki/Guido_van_Rossum
Blinny doesn’t read C#.
David
Your Python hint is of no value here: simply because Blindsley H00d (RLH 4u) never used this language, and would never succeed in using it.
Quite probably, he also never used C# until obtaining some (very well written) source from somewhere, and added incredibly bad increments to it to obtain a software showing cascaded running means for UAH 6.x LT.
To see the differences between the good obtained kernel and the bad increments you just need to look for example at the number of explicit occurrences of “12, 10, 8” or “60 50, 39” (sometimes strangely “60,50, 32”).
The very best is that when extending his code crap with a 12 month median cascade, he copied and pasted the mean cascade software’s 60 month stuff.
You then understand why he never will be able/willing to provide us with a chart containing a UAH Global 5 year Median low pass, as I have shown a while ago in this Excel chart uploaded into Google Docs:
– source
https://docs.google.com/spreadsheets/d/174CxYCkDKfQMUhAR4TnWXeKj58yhIiCYvCOF4koSfec/edit?gid=1700426125#gid=1700426125
– chart
https://docs.google.com/spreadsheets/d/174CxYCkDKfQMUhAR4TnWXeKj58yhIiCYvCOF4koSfec/edit?gid=447018934#gid=447018934
*
RLH has been avoiding publishing his chart for months, instead constantly evading the issue, most recently with irrelevant blabber like:
“Blinny doesn’t know C#.”
Of course, I understand C#; so well that I understand how he messes up good C# sources when trying to extend them.
Conversely, he’s clearly unable (or worse, unwilling) to understand why my Excel-based templates have to be 100% accurate.
“he also never used C# until obtaining some (very well written) source from somewhere”
I authored every line above in C#.
If you were really the author
– you’d have written the entire stuff in the same dirty manner as is the corner containing all these stupidly repeated 12,10,8 and 60,50,39 number sequences
and
– you’d have posted since months a chart containing the UAH Global 5 year Median low pass that you are until today still unable to present.
Instead, you constantly keep evading the issue.
*
No one who has decades of software engineering experience will ever believe you, Blindsley H00d.
“No one who has decades of software engineering experience will ever believe you”
Show us your “decades of software engineering experience”. Not just say it.
Stop talking and dodging, Blindsley H00d, and show us finally this UAH Global 5 year Median low pass that you are until today still unable to present and constantly keep evading the issue.
I did:
https://docs.google.com/spreadsheets/d/174CxYCkDKfQMUhAR4TnWXeKj58yhIiCYvCOF4koSfec/edit?gid=1551212378#gid=1551212378
https://docs.google.com/spreadsheets/d/174CxYCkDKfQMUhAR4TnWXeKj58yhIiCYvCOF4koSfec/edit?gid=447018934#gid=447018934
*
And you were a while ago cowardly enough to claim the links would not show anything visible to you!!!
But I just obtained confirmation that they are perfectly visble on another computer running under Windows 11, with the same result as on my Linux system.
@RLH, I don’t doubt that you have written that piece of code. I didn’t read all of it, but I read enough to see that you are complicating very simple statistical calculations. It signals that you have very little experience from working with data in a professional manner. I recommend that you look into other tools like python or R if you want to analyze data at scale.
Stop talking and dodging, Blindsley H00d, and show us finally this UAH Global 5 year Median low pass that you are until today still unable to present and constantly keep evading the issue.
@RLH
This is lovely hardcoded stuff:
int firstref = hgraphLeft + (int)((float)(1990 – first) / hscaleRatio);
int lastref = hgraphLeft + (int)((float)(2020 – first) / hscaleRatio);
And then drawing charts from scratch with lines and circles..
This reminds me of the first programs I wrote in Pascal when I was 10 years old to calculate and draw the average slope of a hill using knowledge of height and length.
“Do it yourself”
I’m not heavily invested in this, but the posted code has errors and fails to compile. This might be a quirk of the message board suppressing certain character sequences in the pasted, but lines 163, 172, 325, and 472 are flagged by the compiler and are clearly not right.
e.g. 163 “for (int x = 0; x 5.0f)” is missing a comparison operator and the increment or some such.
I’m not a c# guy, but as David notes, this is a frightening amount of code to do something that would a whole lot more compact and comprehensible in some other environments.
“It signals that you have very little experience from working with data in a professional manner.”
Tell that to Motorola (who differ).
“R if you want to analyze data at scale.”
You want it in R?
Binny: I given you the source code in C#. Do it for yourself.
” Do it for yourself ”
I have already answered:
https://www.drroyspencer.com/2025/08/uah-v6-1-global-temperature-update-for-july-2025-0-36-deg-c/#comment-1710797
*
It is now 100% clear to us all that Blindsley H00d aka ‘RLH’ is unable to add the expected increment to the dirty piece of software he posted.
Thus next month he will post his chart unchanged
– Global Median 12 month low pass still wrong;
– Global Median 5 year low pass still missing.
End of story.
David, Mark B
Nice to take some time on reviewing RLH’s dirty piece of code. I woudn’t have done that.
*
I don’t share, however, your idea that having used e.g. Python or R instead of C# would have here resulted in a cleaner source.
My experience in working with persons unable or unwilling to adopt state-of-the-art discipline in developing and maintaining software sources has been that their behavior was orthogonal to the programming / software development languages they used.
When you don’t understand the need for basics like e.g.
– to avoid using the same constant numbers instead of abstract names describing what they mean, or
– to design small algorithms with clear signature instead of duplicating and adapting inline code,
– to identify objects combining data and methods operating on them instead of using discriminating switches,
you behave the same everywhere – from assembly up to most modern languages.
*
This means for me that persons like RLH would extend a clean R, Python, C++ or even ANSI-C source in exactly the same way as when using C#.
I just copied the posted code into an online editor/compiler to make it easier to look at details. The compiler identified the errors so I didn’t spend much additional effort, but, as David noted there’s a lot of code to do plotting that I’d expect to be encapsulated in libraries in anything written in the last few decades.
any warm spell in Finland has to balanced by cool spells, as last winter my Friend who lives there, recorded snow from late September through to early May, she recorded it as one of the longest snowiest winters for many years.its weather,nothing more.
Ian Brown
Firstly, though Willard was plain correct in showing a long lasting warm period, it’s indeed a very local record, just as is that of snow reported by your friend.
Long record over bigger areas always show the better picture.
*
Secondly, snow is not primariyly a sign of cold but of wet. The more dry, the less snow.
*
I don’t have any snow record for an area as small as Finland.
Thus let’s look at the average temperatures for Tmin resp. Tmax in Arctic Finland.
1. Absolute temps
https://drive.google.com/file/d/1IscYekVl5xEH-PYjq3cg67PY_eHgR4x_/view
2. Anomalies (departures with annual cycle removal)
https://drive.google.com/file/d/1-PrIV11NLzYQ1chagk0_Mks7Du-iwKMX/view
*
Regardless whether absolute or relative, the linear estimates in C / decade are similar.
– since 1908:
Tmin: 0.25
Tmax: 0.12
– since 1979:
Tmin: 0.52
Tmax: 0.51
– since 2010:
Tmin: 0.39
Tmax: 0.72 (!)
*
Finally, let’s go back to your Finnish friend, with a plot over the yearly absolute temperature averages for the period October till April, beginning in 1976. 50 years…
https://drive.google.com/file/d/1xF5Zt0Gx3QfSLoiiWtqAPKQTFgpIKuKc/view
As you can see, the 2024/25 average from Oct till Apr was nearly 3 C higher than the previous one.
And above all: how long does she live at the place she is now?
*
” its weather,nothing more. ”
*
Really, Mr Brown?
*
Source
https://www.ncei.noaa.gov/pub/data/ghcn/daily/
I note the estimates you posted, yet Arctic sea ice extent shows no decline since 2007, i find it strange you think that you can have snow without cold,as for my friend she has lived there since birth. if the estimated 3c anomaly is not repeated for 2025/26 will that be just weather or an inconvenience?
Ian Brown
” I note the estimates you posted, yet Arctic sea ice extent shows no decline since 2007… ”
*
No idea from where you got that misinformation from – probably WUWT.
Linear trend for Arctic sea ice, Mkm^2/decade
Absolute values
– Jan 1979 – Jul 2025
— extent: -0.51 +- 0.10
— area: -0.24 +- 0.10
– Jan 2007 – Jul 2025
— extent: -0.28 +- 0.43
— area: -0.23 +- 0.44
The shorter the period including the annual cycle, the higher the resulting standard deviation, which is here higher than the value itself.
That’s the reason why everybody (beginning with this blog’s owner) uses anomalies with annual cycle removal.
Anomaly values
– Jan 1979 – Jul 2025
— extent: -0.51 +- 0.01
— area: -0.24 +- 0.12
– Jan 2007 – Jul 2025
— extent: -0.26 +- 0.07
— area: -0.26 +- 0.07
*
No declne since 2007? Are you joking?
*
” … i find it strange you think that you can have snow without cold,as for my friend she has lived there since birth. ”
What about reading what I wrote instead of misrepresenting it?
” Wet snow is associated with warmer temperatures near or slightly above freezing, while dry snow is associated with colder temperatures well below freezing. Wet snow is characterized by its stickiness, making it ideal for activities like building snowmen and snowball fights. Dry snow, on the other hand, is powdery and less likely to clump together, making it suitable for activities like skiing and snowboarding. ”
Why, do you think, is there so often more snow in Austria than in Eastern Siberia?
Ian Brown
FYI, the Arctic sea ice charts including July 2025
– Absolute
https://drive.google.com/file/d/1xgKii1CJvDD22fA1RXJry0eMjBKhgwt5/view
– Anomalies
https://drive.google.com/file/d/17RBeTrCw6bTcvnUOI3Sxvr_-jXx81VvS/view
*
Oooooh! Arctic sea ice rebounds, say the polynomials. So what…
BACK AT THE RANCH
Junior Donald posted a meme of Donald on the White House roof throwing a green dildo at WNBA players.
Women are finally earning the respect they deserve.
SO MUCH WINNING!!!!!!!!!
” Donald Trump accuses the Bureau of Labor Statistics of “intentionally” skewing figures and presenting different statistics
According to Stephen Moore, Donald Trump’s loyal economist, “during the last two years of the Joe Biden administration, the Bureau overestimated job creation by 1.5 million units.” A downward revision to employment data in early August infuriated Mr. Trump, who immediately fired the Bureau’s head.
Before reporters, hastily summoned to the Oval Office for an announcement described as “major” by a senior official, the Republican president displayed several charts alongside Stephen Moore. This economist, who works with the conservative Heritage Foundation think tank, stated that
” … during the last two years of the Joe Biden administration, the Bureau of Labor Statistics (BLS) overestimated job creation by 1.5 million units.” ”
*
Yeah. 100% expectable MAGAnism.
Bindi, we already know you’re confused about politics. But, here’s your chance to prove you actually know something about science.
Find at least ONE thing wrong with this graphic:
https://postimg.cc/yJFTRZzW
It should be easy, as there are several things wrong.
“Find at least ONE thing wrong with this graphic:
https://postimg.cc/yJFTRZzW
It should be easy, as there are several things wrong.”
–
–
The simplest one is the assertion that the
Average emitted by Earth’s surface EM energy is:
398,2 W/m2
It cannot be so, because it assumes Earth’s surface emits at its average surface temperature 288K.
The average surface temperature is not a temperature per ce! It is a number for comparison.
Example: our Moon and planet Mars for equal Albedo (the Marsian
a= 0,250) would have the same average surface temperature 210K.
Moon and Mars do not emit the same amount of EM energy, because Mars is at 1,53 AU from sun, when Moon is at 1 AU from sun!
The solar flux on Moon is So = 1362 W/m2
The solar flux on Mars is S = 586,4 W/m2
yet the average surface temperature for the same
Albedo (a = 0,250) is 210K !!!
–
https://www.cristos-vournas.com
Very good, CV. You found ONE. Please don’t give away any more answers. There are several.
My point is none of the cult kids can do the same. (Bindi, Nate, barry, gordon, Willard, Ark, Ent, studentb, RLH, and Folkerts, just to name the most ignorant.) Not one of them could find any errors in the graphic. It comes from NASA, so to the cult kids, it’s “Holy”.
But to REAL scientists, it’s just full of holes….
SOLAR MINIMUM UPDATE
The third-hottest July worldwide ended a string of record-breaking temperatures, but many regions were devastated by extreme weather amplified by global warming, the European climate monitoring service said Thursday.
https://phys.org/news/2025-08-hottest-july-wreaks-climate-havoc.html
Nova Scotia has made it illegal to walk in the forest due to dry weather conditions. No actual science was consulted; walking in the woods does not increase the risk of wildfire.
This order is a crime against humanity. We have a common law Right to Roam. The people who made this order are tyrannical idiots that must be removed from our government immediately.
That an idiotic order can be made anywhere in Canada shows that Canada is fiscally, morally, and intellectually bankrupt.
The order smacks of a balloon to see if they can get away with calling climate change emergencies as an excuse to lock us down again.
National Academies Will Review Endangerment Finding Science
With the Trump administration raising doubts on climate science, the country’s premier science advisory group will fast-track a consensus document.
The nation’s premier group of scientific advisers announced Thursday that it will conduct an independent, fast-track review of the latest climate science. It will do so with an eye to weighing in on the Trump administration’s planned repeal of the government’s 2009 determination that greenhouse gas emissions harm human health and the environment.
The move by the National Academies of Sciences, Engineering, and Medicine to self-fund the study is a departure from their typical practice of responding to requests by government agencies or Congress for advice. The Academies intend to publicly release it in September, in time to inform the Environmental Protection Agency’s decision on the so-called “endangerment finding,” they said in a prepared statement.
“It is critical that federal policymaking is informed by the best available scientific evidence,” said Marcia McNutt, president of the National Academy of Sciences. “Decades of climate research and data have yielded expanded understanding of how greenhouse gases affect the climate. We are undertaking this fresh examination of the latest climate science in order to provide the most up-to-date assessment to policymakers and the public.”
The Academies are private, nonprofit institutions that operate under an 1863 congressional charter, signed by President Abraham Lincoln, directing them to provide independent, objective analysis and advice to inform public policy decisions.
…
Andrew Dessler, director of the Texas Center for Extreme Weather at Texas A&M University, said…
“The National Academies [were] established exactly to do things like this- -to answer questions of scientific importance for the government,” …. “This is what the DOE should have done all along, rather than hire five people who represent a tiny minority of the scientific community and have views that virtually nobody else agrees with.”
A “consensus document”? What a joke!
Trump really has them scared.
Guess what the “consensus” will conclude — Earth is 33K hotter than it should be because CO2 “traps heat”!
Just the same old nonsense. And the cults kids will slurp it up without questioning.
” … Earth is 33K hotter than it should be because CO2 “traps heat” ”
*
Only ignorant people who falsely and insidiously want to discredit science, will claim such completely unscientific nonsense.
No one in the world has ever claimed that – except ignorant morons like Clint R.
*
The 33 K difference between today’s Earth and a snowball Earth formed by all water vapor snowing down from the troposphere never had to do with CO2.
And water vapor doesn’t ‘trap heat’; it merely prevents a part of the infrared radiation it absorbs from escaping into space.
CO2 does this too, albeit to a very small – but slowly increasing – extent.
**
Clint R however will continue to misrepresent such facts, exactly as he endlessly misrepresents century-old lunar spin theory
https://drive.google.com/file/d/13DRDH1OFOUHYM_6HKH19sbj28yckJMF7/view
by insulting all scientists in this domain as ‘astrologers’.
*
But like his friends-in-denial posting similar nonsense on this blog, Clint R never and never would be able to scientifically contradict what he polemically discredits and denigrates.
Bindi, you don’t even know your own cult’s nonsense, which is the point I’m making with the bogus energy graphic. The “33K” nonsense comes from the imaginary sphere. You haven’t been paying attention.
And you’ve again linked to those sources that have NO proof Moon spins.
So, keep proving me right.
” And you’ve again linked to those sources that have NO proof Moon spins. ”
Of course they have, Clint R!
YOU are the one who is NOT able to scientifically disprove them.
*
But like your good old brother-in-denial ge~r~an, you will, like everywhere else on this blog, repeat the same nonsense over and over again.
Why don’t you finally see a psychiatrist?
Bindi, identify which one proves Moon spin.
Consensus has no meaning in science. Science can only be falsified. Academies are political entities. They are mostly a political arm of the left or the political elite. Status quo has no place in science.
Poor effort:
climateball.net/but-science#consensus
climateball.net/but-science#falsification
climateball.net/but-politics#academia
climateball.net/but-politics#leftists
That last one needs some work: what the hell does “but status quo” mean?
Stephen,
How do we, the public, know that the laws of physics are valid, other than by the scientific consensus?
How do doctors know whether medical treatments work, other than by the scientific consensus?
Nate, science must be based on reality. Consensus is too often based on beliefs.
For example, the CO2 nonsense is all beliefs. There isn’t even a “consensus” as to how CO2 warms the planet. One group claims CO2’s infrared is the cause, while another group claims CO2 is insulation. Both groups are wrong, as we know from physics.
Yet, the hoax continues because people want to believe in it. It’s the same with the Moon spin hoax.
Even after the skeptics report for Trump agrees that there is a GHE and it does cause warming, you still don’t get it. And you have nothing to offer in the way of actual physics sources to support your claims.
So you are irrelevant.
Child Nate, no one expected you to understand my comment.
” Bindi, identify which one proves Moon spin. ”
That is now the very best again. All of them do.
*
For years I have been presenting work proving the rotation of the Moon, but Clint R. (and with him his friends-in-denial Robertson, DREMT, Hunter, and some others) are all equally incapable of refuting these theories technically or even scientifically and therefore always resort to polemical discrediting and denigration.
*
What then please is the sense of choosing any of the list I present since years?
*
Even if I refer to the very first source – Newton’s Principia Scientifica (Book III, Prop. XVII, Th. XV), Clint R brazenly claims I would misrepresent Newton’s words – though I do nothing else than showing the original Latin text and one out of a dozen of its translations, e.g. Ian Bruce’s (2012, page 23, text within [square brackets] is explanation):
http://www.17centurymaths.com/contents/newton/book3s1.pdf
*
” PROPOSITION XVII. THEOREM XV.
The daily motions of the planets is uniform, and the libration of the moon arises from its daily motion.
It is apparent by the first law of motion and Corol. 22. Prop. LXVI. Book I that Jupiter certainly is revolving with respect to the fixed stars in 9 hours and 56 minutes, Mars in 24 hours and 39 minutes, Venus in around 23 hours, the earth in 23 hours 56 minutes, the sun in 25 1/2 and the moon in 27 days 7 hours 43 minutes.
It is evident that these are found from the phenomena [i.e. experimental data in modern jargon].
Spots in 27 1/2 days, with respect to the earth; and thus with respect to the fixed stars the sun is rotating in around 25 1/2.
Truly because there is the monthly revolution of the moon about its axis : the same face of this will always look at the more distant focus of its orbit, as nearly as possible, and therefore according to the situation of that focus will hence deviate thence from the earth.
This is the libration of the moon in longitude: For the libration in latitude has arisen from the latitude of the moon and the inclination of its axis to the plane of the ecliptic.
N. Mercator has explained this theory of the libration of the moon more fully in letters from me, published in his Astronomy at the start of the year 1676. ”
*
Clint R always discredits this translation, though others (e.g. 1749 in French, and 1872 in German) show the same.
*
Until now, for example, none of the lunar spin deniers has understood that Newton used the expression ‘with respect to the fixed stars’ only for the motion period of celestial bodies, and not for their motion as such.
*
I tried for years already to explain how the German physicist, mathematician and astronomer Tobias Mayer calculated in 1750, out of own observations, both the lunar spin period and the inclination of the lunar spin axis wrt the Ecliptic:
https://www.e-rara.ch/download/pdf/913790
While I read the 130 pages long treatise and translated relevant parts of it, this work was polemically rejected all the time by people all unable to scientifically disprove it.
*
All the time, these deniers come back to the same trivial, childish idea that if the Moon shows us the same face all the time, it can’t rotate about an internal axis.
*
So what!
Bindi, you’re avoiding another chance to learn. I wanted you to identify which one of your sources proved Moon spins. You can’t do that. You can’t even understand what you find on the Internet. Endless blah-blah ain’t science.
And you can’t find anything wrong with the bogus energy-balance graphic.
Why are you so opposed to learning.
News from the Turd Reich.
On Thursday, August 7, sH!tler called for Intel’s CEO to ‘resign immediately.’
https://finance.yahoo.com/news/trump-calls-for-intel-ceo-to-resign-immediately-122344189.html
What do they call it when the government runs all the business and manages the markets? China calls it State Capitalism.
Republicans used to be about free enterprise. Until they went full fascist.
Ark, you really need to do something about your anal fixation. Norman had the same problem a year of so ago, but got it fixed. You might ask him where he got his therapy.
You need to do something about it. Combined with your TDS, you look like an incompetent 6-year-old.
Glad to be of help….
BACK AT THE RANCH
A neo-Nazi group buoyed by Donald’s rhetoric is expanding its reach and changing the face of white extremism in America.
https://www.reuters.com/investigations/american-nazis-aryan-freedom-network-is-riding-high-trump-era-2025-08-08/
WIIIIIIIIIIIIIIIIIIIIIIIINNNNNNN
The Alarmist assumption that water vapor increase is just feedback from temperature increase is FALSIFIED by measured (by NASA/RSS using satellite instrumentation) average global water vapor (from TPW anomalies) being more than twice the maximum possible from just planet warming. The method and example are in Sect. 7 of the engineering/science analysis made available at https://watervaporandwarming.blogspot.com and shown in Fig 7.2 there.
Why use the ad hominem label “alarmist” and undermine your scientific credibility? This kind of rhetoric signals a non-neutral framing.
Invoking a self-referential blog post as the authoritative source, rather than peer-reviewed literature, further diminishes your credibility.
The claim that “alarmists” assume only temperature matters is a strawman.
The 2021 “Global Water Cycle Budget” review will clue you in to the fact that climate and hydrology researchers do not attribute water vapor increases exclusively to temperature.
The scientific approach incorporates multiple components of the hydrological cycle. Large-scale circulation changes, regional moistening and drying patterns, and anthropogenic moisture sources such as irrigation and reservoirs are all acknowledged in the literature.
Further, there is no fixed “maximum possible” water vapor increase derived from global mean surface warming alone. Clausius-Clapeyron gives an approximate 7% per degree C increase in saturation vapor pressure but, as you know, actual global TPW changes due to vertical and horizontal temperature gradients, tropospheric temperature changes (not just surface), as well as atmospheric circulation and moisture transport.
I normally don’t engage with ad hominem comments on this blog, but your statement mischaracterizes the mainstream scientific and methodological understanding of an important technical issue.
Dan, I tried your numerical integration method on a simulated constant T with random white noise added.
It always produces a WV negative trend proportional to the magnitude of noise. Try it yourself.
I think there is flaw in the method.
Thanks to your comments I made an improvement in the algorithm. The bias was using just the (n-1) temperature. Down steps were all based on a higher temperature and up steps on a lower resulting in the negative trend that you discovered. An improvement is to use the average of (n-1) and (n-2). The excess measured WV decreases from the previously asserted ‘more than twice’ to ‘about 1.85 times’. I would appreciate it if you would check the improved algorithm. The algorithm is still not perfect but should be useful and still falsifies the assumption that water vapor increase is just feedback from temperature increase.
Ok. I’ll try it.
But the vapor pressure should be purely a function of temperature, not T history.
Therefore, we should simply multiply the T trend by the 0.067 * Pave to find the P trend .
When we do so with HadCrut, we get a good match to the observed P trend, ~ 0.41 Kg/m^2/decade.
Dan, your new method is trying to remove noise by averaging. The more averaging of noise you do, the greater the slope.
We can remove all the noise by replacing the temp data with its LS fit.
Then use your method with the T fit line for Hadcrut. It produces a WV trend of 0.041.
This is quite a good match to the observed trend.
OLS regression underestimates the regression slope in the presence of noisy data ONLY for noise in the dependent variable, so for trend lines of time series (x is time, y is temperature) since time is known perfectly, data averaging does not produce a more accurate trend, and OLS regression produces an unbiased slope (although noisy data will produce larger error bars on that trend estimate). It just doesn’t bias the trend estimate.
The average, (WV(n-1) +WV(n-2))/2, is used to minimize bias in calculating the effect of temperature change as described above. It’s influence on reducing ‘noise’ and/or the reported T fluctuations is negligible. The algorithm calculates, using the 0.067 1/1/C° rate, the WV change resulting from T change each month and sums the monthly WV changes to get the total WV change over the total time period (37 years, 36 for HadCRUT). This result is substantially less then just using the end-point temperatures.
The WV-change/year slopes (kg/m^2/yr or mm/yr) using UAH temperatures thru 2024 are: measured = 0.0447, end-to-end = 0.6099 * 0.067 = 0.04086, path = 0.0241. I suspect that the acceptance of the end-to-end value was influenced by confirmation bias.
Dan,
“It’s influence on reducing ‘noise’ and/or the reported T fluctuations is negligible”
Yes, but as I showed with a completely flat T trend, when noise is added to it, your method of obtaining the WV trend produces a negative trend. Which is non-existent.
So the noise is the problem.
Why can’t we use the surface T trend and scale by 0.067*mean(WV)?
The fact that this matches well to the WV trend is not an accident.
Nate,
The latest (8/12/25) algorithm should give negligible slope, try it.
Dan, it still gives a WV trend of 0.0345, whereas I calculate 0.041. So your algorithm is still adding a negative trend to the data.
The lapse rate falsifies the GHE theory. GHE theory is as big a fraud as Darwinism. Two of the biggest scientific frauds ever perpetrated.
*** the tropospheric lapse rate exists only as the result of convective overturning, and that convective destabilization would not exist without the GHE. Look at the stratosphere: almost no temperature change over a factor of 100x change in air pressure. Pressure does not determine temperature… temperature stabilizes when the rates of energy gain and loss are equal. The adiabatic lapse rate involves, by definition, no gain or loss of energy (the “a” in adiabatic). Again, pressure does not determine temperature. -Roy
Roy, for those of us that don’t have your background in meteorology, could you explain what “convection overturning” means? I tried to look it up, but wikipedia only had this, which I don’t think applies:
https://en.wikipedia.org/wiki/Convective_overturn
Are you referring to the fact that a packet of warm air rises while a packet of cold air falls? If so, how does the GHE cause that?
“those of us that don’t have your background in meteorology,”
Nice to see you acknowledge that you are not an expert, and can learn from those who are.
He has explained this several times. Without the GHE, and its removal of convected heat to space by radiation in the upper troposphere, the convection cannot continue. There would be no weather.
Responding 2 days late is better than 5 days late, Nate. You’re improving.
But, I see you’re also confused. Now you believe the GHE cools Earth! I don’t think your cult would agree with that, unless they’ve learned some physics….
That’s why I was hoping Roy would clarify his comment.
Now try hard to understand this time. The GHE cools the upper troposphere. Yet it insulates and warms the Earths surface.
If you still don’t get it consider a layer of foam insulation laying on a heated surface. The top surface of the insulation is emitting heat to the surroundings.
Thus the top layer of the insulation is cooling the insulation!
And yet the insulation still insulates the heated surface, making it warmer.
Is this beyond your ability to comprehend?
Child Nate offers yet another definition/description of the illusive GHE — Now it heats, insulates, and cools!
Kids these days….
So no specific rebuttal, as usual, just insults.
Do you feel insulted by reality, Nate?
Maybe if you would stop spouting nonsense and try to learn. You’ll never know til you try….
After a brief wet couple of years, Lake Meade is continuing to dry. Water levels are down again near to the record lows of 2022, continuing the post 2000 drought.
The levels are again more than 150 feet below full pool.
http://graphs.water-data.com/lakemead/
Click All Time Lake Levels to see the full history.
20,000,000 people can use a lot of water. Hoover Dam, which forms Lake Meade, was built about a century ago.
When this CO2 nonsense goes away, much funding will be available for more dams, like this one:
https://www.youtube.com/watch?v=SfOS-ibaYnc
Nate needs to read The Grapes of Wrath or watch some of the old news reels about the Dust Bowl.
The Dust Bowl was largely human-caused and in the Great Plains, not the West.
Relevant facts
https://www.ncei.noaa.gov/access/monitoring/climate-at-a-glance/regional/time-series/107/tavg/36/7/1895-2025
https://droughtmonitor.unl.edu/
It was partially human caused, an extended drought and high temperatures dried out the grasses, not an unusual occurrence,but the clearing of the dead material opened up the bare earth to the mercy of the wind, if the grass had been left untill the rains returned then earth would have remained stable, the climate conditions were not unusual, early wagoners traveling west found a virtual desert instead of the fertile land they expected,a change of climate in the Sahel region of Africa from a moist regime to a drier regime resulted in a famine and thousands of deaths in Ethiopia, made worse by good intentions,money flowed into the area as farming increased during the moist years,bore holes tapped into the ground water for irrigation of crops,then the climate changed and the ground water was exhausted, the rest is history,climate changes always has.
More relevant facts:
La Niña’s Role:
La Niña events, characterized by cooler-than-average sea surface temperatures in the tropical Pacific, are often associated with reduced precipitation in the Southwest.
Yes, La Nina at the equator is associated with cool water off California. Its believed the LIA brought about a mega-drought in the Southwest US that completely changed the indigenous cultures in the area. That began sometime in the 14th century.
there are many signs that this climate anomaly is primarily natural as there is no mechanism for gradually increasing CO2 to create the variations of temperature and rainfall that exists in the modern climate record. That would apply equally variations in temperature and rainfall seen in the climate record over the past 1000 years when CO2 was allegedly not changing.
https://www.science.org/doi/10.1126/sciadv.adn9389
“Historically, meteorological drought in the western United States (WUS) has been driven primarily by precipitation deficits. However, our observational analysis shows that, since around 2000, rising surface temperature and the resulting high evaporative demand have contributed more to drought severity (62%) and coverage (66%) over the WUS than precipitation deficit. This increase in evaporative demand during droughts, mostly attributable to anthropogenic warming according to analyses of both observations and climate model simulations, is the main cause of the increased drought severity and coverage. The unprecedented 2020-2022 WUS drought exemplifies this shift in drought drivers, with high evaporative demand accounting for 61% of its severity, compared to 39% from precipitation deficit. Climate model simulations corroborate this shift and project that, under the fossil-fueled development scenario (SSP5-8.5), droughts like the 2020-2022 event will transition from a one-in-more-than-a-thousand-year event in the pre-2022 period to a 1-in-60-year event by the mid-21st century and to a 1-in-6-year event by the late-21st century.”
Nate we have been over that approach before.
Its not very informative of the history of droughts.
And the 2020-2022 drought being an unprecedented since the year 2000 isn’t exactly a remarkable finding.
And of course using that to predict what is going to happen over the rest of the 21st century implies they have a reliable way of predicting anything like that. If you find one please provide me a link to it.
No doubt the only thing that fixated your attention was the word ”unprecedented”.
What I noted was most significant about this paper was it was written by an obedient Chinese government scientist that was hired by my alma mater. Nothing remarkable about that, I studied there during the era of Angela Davis when being a communist professor was just getting real popular.
So you doubt that the warming that has occurred should have produced additional drying during a drought period.
Got it.
“The unprecedented 2020-2022 WUS drought”
Where does it qualify ‘unprecedented’ with ‘since 2000’?
Nate says:
”So you doubt that the warming that has occurred should have produced additional drying during a drought period.
Got it.”
————————
That depends upon how much water vapor is in the air column Nate.
Nate says:
” ”The unprecedented 2020-2022 WUS drought”
Where does it qualify ‘unprecedented’ with ‘since 2000’?”
—————————–
Again it depends upon if you believe station data or you believe climate models. I believe station data more so than climate models. But your author doesn’t preferring the climate models as opposed to actual measured humidity at the weather stations.
They state that ”this dataset (CRU) has an unrealistic wetting trend in the southwestern US (32) (Supplementary Text and figs. S2 and S3) that contradicts more recent research findings (33).”
OK so where does ’33’ take us. That takes us to a paper whose title is: ”Observed humidity trends in dry regions contradict climate models”
And the conclusion of that reference says: ”This discrepancy is most clear in locations that are arid/semi-arid year round, but it is also apparent in more humid regions during the most arid months of the year. It indicates a major gap in our understanding and modeling capabilities which could have severe implications for hydroclimate projections, including fire hazard, moving forward.”
In other words it suggests we need to fix the climate models. LMAO!!!
Like I said Communist misinformation. . .they even had the guts to suggest it was research that allegedly supported the climate models. . .and as such the leadings author’s position at UCLA is dependent upon the pleasure of the Governor of California and so he is obediently echoing Kenneth Trenberth’s declaration when finding out observations were not supporting climate model warming that the observations must be wrong.
and nobody looked at the reference and Nate got conned again.
“Like I said Communist misinformation.”
Your now standard dismissal of valid scientific evidence that doesnt support your claims.
Whatever, you had no credibility anyway.
How much is that due to population growth, add on irrigation, agriculture and industry, in the UK we have the problem of reservoirs build decades or in some cases over a century ago,the population has grown, but the reservoirs are the same,our problem is more water is wasted than is necessary,the average annual rainfall in South East England is approx 23 inches , but only 6 inches is required, the South East is in drought again but 2024 was wet with many floods ,and all that water ran back into the sea.the last reservoir of any size to be opened in the UK was Kielder Water in 1982.
SOLAR MINIMUM UPDATE
Europe is the fastest-warming continent, and the impacts of climate change here are clear. 2024 was the warmest year on record for Europe, with record temperatures in central, eastern and southeastern regions.
https://wmo.int/news/media-centre/european-state-of-climate-extreme-events-warmest-year-record
The crisis is over; Europe is cooler this year than last.
How long till Europe is covered with ice once again?
Willard says:
”Europe is the fastest-warming continent”
Should have been predicted 20 years ago. But we ignore the actual natural warming operators for an ignorant exclusive look at CO2.
1) We remain well within the solar maximum effect with feedbacks likely still growing from what appears might be the October 2024 solar maximum.
2) We remain well within the warming effect of the unprecedented slow transit through perihelion due to the combined pulls of Jupiter, Saturn, Uranus, and Neptune and event that only occurs once about every 172-175 years and requires about 3,600 to transit the celestial compass as it varies over those millennia from a cooling influence to a warming influence. We are well within the warming influence of that but likely have not yet hit its peak.
3) The very slow tidal effects this planetary movement makes for ocean current tidal flows that produce the AMO and likely also the PDO. Europe is the closest down wind continent to the AMO and thus the regional warming seen in Europe would be the expected enhancement of the AMO by the tidal effects Jupiter, Saturn, Uranus, and Neptune. Well mixed CO2 has no known mechanism to account anything to that.
So buckle up we are almost without a question at or very near the 900 year cycle peak for the warming influence Jupiter and Saturn in their unique 60 year cycle of transiting the heavens. Nate even produced a chart of this cyclic effect as the cause of the ice ages in combination with axial tilt and precession factors to explain eccentricity pulse variations in the recent past.
NASA even continues to recognize this effect. The IPCC avoids the topic like a plague. Milankovic’s book while having a library card in the Library of Congress is unavailable. What we are entering into since the 2023/4 planet transits is a lowering of temperature trends over the next 40 years. Will cooling result? Well it did the last time from ~1940 to ~1980 and the transition this time will have stronger planetary cooling influence than then.
STEP 3 – Saying Stuff
Meanwhile:
An initial ‘back of the envelope’ calculation suggests that the recent heatwaves across Southern and Central Europe, the US and China could carry significant economic costs. Estimated GDP losses range from -0.1pp for Germany to as much as -1.4pp for Spain, with
total losses of -0.5pp for Europe, -0.6pp for the US and -1.0pp for China. To put this into perspective, one day of extreme heat (above 32°C) is equivalent to half a day of strikes.
https://www.allianz.com/content/dam/onemarketing/azcom/Allianz_com/economic-research/publications/specials/en/2025/july/20250701_Heatwaves_EconImplications.pdf
Willard says:
”STEP 3 – Saying Stuff”
https://scienceofclimatechange.org/wp-content/uploads/Sir-2024-Prag-60yr-Jupiter-Earth.pdf
“NASA even continues to recognize this effect.”
A 60-year planetary gravitational influence on Earth’s global climate?
I doubt it. NASA endorses the Milankovitch theory, not sub-millennial orbital mechanics influence on global climate.
https://cafeastrology.com/interpretingsolarreturns.html
barry says:
”A 60-year planetary gravitational influence on Earth’s global climate?
I doubt it. NASA endorses the Milankovitch theory, not sub-millennial orbital mechanics influence on global climate.”
NASA attributes the gravitational pull of Jupiter and Saturn for the changes in earth’s ellipticity. Changes in eccentricity is estimated by science as being more than half the influence of the Milankovic cycles and the mean amount of solar received from the sun
https://science.nasa.gov/science-research/earth-science/milankovitch-orbital-cycles-and-their-role-in-earths-climate/
Last link from that page:
Further Reading: Why Milankovitch Cycles Can’t Explain Earth’s Current Warming
https://science.nasa.gov/science-research/earth-science/why-milankovitch-orbital-cycles-cant-explain-earths-current-warming/
LOL
bill,
Your link to NASA corroborates exactly what I said. They endorse Milankovitch cycles with periodicities of tens of thousands to a hundred thousand years.
I do not remember NASA ever touting the notion of orbital dynamics influencing global climate on sub-millennial (ie, 60-year) scales.
I said I doubt you could find a NASA reference to support your view, and you just provided one that supports my contention.
“NASA even continues to recognize this effect.”
That remains undemonstrated. I think it is just the ‘skeptic’ conference that gave that thesis its imprimatur.
Guys I am perfectly aware of how corrupt institutions don’t out and out lie but instead they selectively perceive what they want to see and ignore what they don’t want to see.
It is acknowledged that it is the pull of gravity that produces 60% of the effects of natural climate change whether they be a result tidal effects or changes in net solar radiation received by earth and they can’t even bring themselves to say that but instead you have to calculate it in order to preserve the ”unnatural nature of CO2” which is an unstated lie.
Once bought into that its nearly criminal to not recognize that the laws of gravity say that the primary determinants are mass and distance. The mass doesn’t vary except as you selectively add or subtract planets. So what do our corrupt institutions do, they just recognize 2 of 8 planets.
And of course distance varies as planets move from the same side of the sun to the opposite side from earth. They orbit via their known orbit perturbations that produce the eccentricity of their orbits.
When you have 8 variables (planets) that all effect each other at different magnitudes you are going to see maximal extremes occur very rarely with literally an unlimited number of lesser effects depending upon where in the orbit these planets are.
And of course there is the so-called seminal Hays etal paper whose conclusion support that changes in distance of these planets from earth represents about 60% of the total Milankovic effect.
Hays, et al also states of the 3 Milankovic variables the eccentricity variable is the only one that isn’t likely linear, which conforms with the laws of gravity mentioned above.
they go on to mention that this would be relatively easy to model in this day and age compared to the challenges of modeling atmospheric effects of CO2. And what do our so-call faithful institutions do with this information? They effectively ignore it and deny it.
https://www.researchgate.net/publication/6049421_Variations_in_the_Earth's_Orbit_Pacemaker_of_the_Ice_Ages
Bill, you have to make your case with hard data and analysis, or reference to real scientific papers that have done it.
In that realm your case has not been made.
You cannot explain away the lack of evidence with conspiracy theories else you are just joining the Flat Earther mindset.
To be clear, bill, everyone accepts the Milankovitch theory is on solid ground, explaining climate change on the scale of tens of thousands of years.
This theory does not bolster claims of orbital influence on climate on far shorter time-scales.
You said NASA endorsed the notion of 60-year climate phases due to orbital variation. Asked to provide evidence NASA supports this view you linked to NASA’s support for Milankovitch.
Now you seem to be arguing – tacitly admitting NASA DOESN’T support the 60-year theory – that because of Milankovitch then these shorter time periods must also hold.
There are no dots connected here. It would be like trying to argue there are several summers instead of just one, because of the ups and downs in temperature through the year. The Earth’s rotation changes speed along with its angle to and distance from the sun throughout the year, and therefore because it is known Earth’s orbital dynamics cause seasons, this fact coupled with the observed temp variability throughout the 12 months corroborates the conclusion that there are 16 rather than 4 seasons.
What is lacking, of course, is a well verified mechanism tying these orbital variations to the variability. Curve-fitting is not sufficient evidence – or we could find a 60-year phase pulsar and connect global climate to that.
bill,
I went looking for a peer-reviewed paper connecting orbital dynamics to a 60-year climate cycle. This is the best I could find.
“The possible relationship between the 60-year variation in global temperature with an amplitude of 0.35°C and the corresponding cycle at the location of Jupiter and Saturn is considered. It was shown that the gravitational perturbation of the Earth’s orbit by Jupiter and Saturn can only account for a global temperature variation of only 0.012°C. It is shown that the modulation of the flux of cosmic dust entering the Earth’s atmosphere by the gravitational field of Jupiter and Saturn is a more promising mechanism for the transmission of the influence of giant planets on the Earth’s climate. In order for the global temperature to experience variation with an amplitude of 0.3°C, Jupiter and Saturn must provide a variation in the flux of extraterrestrial matter in the Earth’s atmosphere with an amplitude of 16%. The question of whether these two planets are capable of providing such a variation is of considerable interest for climatology.”
https://www.academia.edu/download/113344664/S001679322003013520240415-1-z1ma8y.pdf
Only problem with the latter contention is that there is no observed 60-year cycle in cosmic dust, and even if there were a linking mechanism to terrestrial climate cycles is not established.
First off thanks for the reasoned replies, so refreshing to not have to deal with those who choose insults over discussion.
barry says:
”To be clear, bill, everyone accepts the Milankovitch theory is on solid ground, explaining climate change on the scale of tens of thousands of years.”
————-
And that it is due to variation of gravitational influences on earth. That’s important as we have one basic mechanism widely recognized, 8 planets without which Harvard teaches us: ”If the Earth were the only planet orbiting our Sun, the eccentricity of its orbit would not vary over time.”
xxxxxxxxxxxxxxxxxxxxx
barry says:
”This theory does not bolster claims of orbital influence on climate on far shorter time-scales.”
—————-
Yes it does as the longer time scale effects are a build up of feedbacks (ice and perhaps ocean temperature) from regular shorter term effects. (both recognized by the IPCC)
Nate even confirmed that with his model of pulses of incoming solar that adds up to an ice age.
xxxxxxxxxxxxxxxxxxxxxxxxxxxxxxx
Barry says:
What is lacking, of course, is a well verified mechanism tying these orbital variations to the variability.
—————
Huh? I am not aware of any mechanism other than gravity being employed by the other planets Barry. I am discounting this comment.
xxxxxxxxxxxxxxxxxxxxxxxxxx
barry says:
”I went looking for a peer-reviewed paper connecting orbital dynamics to a 60-year climate cycle. This is the best I could find.”
Actually Barry this paper is attempting to discredit the idea without a model or even all the mechanisms brought about by gravity.
And of course the .35C variation the author recognizes can’t be accounted for by any of the work done by the author or the IPCC.
So at your most generous interpretation this paper leaves a huge gap of ignorance about natural climate change.
Your side argues that to override the CO2 theory skeptics need to explain the warming, and when they do it becomes a game a cat and mouse denying that gravity affects climate change in any meaningful way pulling the legs off the Milankovic chair. If that doesn’t pique your scientific curiosity nothing will.
It also gives no underlying explanation for the ice ages and no explanation for the cause of that observed 60 year cyclic climate change pattern as to do that you must account for the warming pulses that add up to the eccentricity variation that is being recognized here.
Keep in mind that Hays has eccentricity variation apparently as 60% of the Milankovic effects.
the argument for a 100,000 year linear eccentricity variation is wholly unsupported. And the Hays paper says its likely non-linear which it has to be to be in compliance with what Harvard is teaching.
As a final note the 60 year cycle noted in the modern temperature record is not only in time with the Saturn/Jupiter 60 year cycle, the positions of the planets align correctly on the correct side of the planet to slow travel through perihelion to warm the climate.
The 60 year JS cycle over the past 60 years is made up of three JS conjunctions. One in 1980 on the cold side, 2000 hot side, 2020 hot side, then JS mingled with Neptune and Uranus on the warm side during the next 3 years. In July Jupiter passed earth’s perihelion to the cold side and the next JS conjunction in 2040 will be near maximum cold tangency. It takes 450 years for this march of J&S to switch from 2 on the warm side and 1 on the cold side to 2 on the cold side and one on the warm side making for the 900 year cycle that NASA recognizes and is seen in the Gisp 2 icecore and others.
It seems likely what is important about the 60 year cycle it allows for feedbacks to fully come into play and that the 20 year standard for climate is way too short. But to see that one needs to know how Milankovic came up with the short term orbital variations.
The 2020 js conjunction had all 4 of the gas giants on the warm side and the 1940 effect was missing Neptune which was in opposition subtracting its influence rather than adding to it.
barry said: “What is lacking, of course, is a well verified mechanism tying these orbital variations to the variability.”
—————
bill said: “Huh? I am not aware of any mechanism other than gravity being employed by the other planets Barry.”
No, I’m saying ‘climate variability’. The 60-year orbital variation brings about minute changes in the LOD – on the order of a 4 millisecond difference from trough to peak over the cycle. This is entirely negligible. And this LOD change is symmetrical WRT solar incidence and darkness: if day is longer, so is night.
So the insolation change isn’t a cause.
What is there beyond the correlation of periodicity? What’s the physical mechanism linking this tiny change in orbital patterns with changes in global climate? It can’t be solar incidence, so what is proposed? From the paper you linked all I saw was curve-fitting, but no linking mechanism.
US corporate bonds boom and bust over 60-year cycles, but I’d need to show a plausible mechanism for this pattern causing global climate to change.
Certain fishery stocks wax and wane over 60 year cycles, so I might have a better chance of finding a physical link to the alleged 60-year cycle in global temperature.
Even better for a link to climate is a 60-year cycle in monsoon patterns. You can curve fit that pretty well, if you select the right records, but again, I’d need to establish a connecting mechanism.
barry says:
”No, I’m saying ‘climate variability’. The 60-year orbital variation brings about minute changes in the LOD”
—————
Barry I am not talking about length of day.
I am talking about changes in earth’s speed through space. Earth’s orbital velocity is given as an average of earth’s linear speed through the entire orbit. But that speed changes due to the gravitational attraction of other planets and the speed change is the greatest at points of tangency to the orbit and this changes due to the planets moving through space themselves.
So this effect is reflected in the Naval observatory data with changes in that speed resulting in an approximate 5 day change from 1980 to 2023 from one half of the orbit compared to the other half.
We know this effect exists and in the mid 19th century solving why Uranus suddenly wasn’t where it was supposed to be wrt to the celestial data based upon the calculations at the time led to the discovery of Neptune.
xxxxxxxxxxxxxxxxxxxxxxx
Barry says:
”From the paper you linked all I saw was curve-fitting, but no linking mechanism.”
—————-
Using gravity and position affecting earth’s speed through space
isn’t curve fitting Barry.
A model is needed to correctly determine the climate effect.
that fact was noted in Hays etal 1976 in his Milankovic paper
xxxxxxxxxxxxxxxxxxxxxx
Barry said:
”Even better for a link to climate is a 60-year cycle in monsoon patterns.”
————-
Well you have to admit it fits the 60 year natural climate change variation very well also.
The 60 year warming cycle peaks correlate by date to locations of major perturbing planets that would encourage warming by decreasing earth’s speed through perihelion and their minimums correlate with to locations that would increase speed through perihelion this 60 year pattern shift over a 900 year cycle to one that stacks warm events to one that stacks cold events.
So its not curve fitting its two curves that match by date. Curve fitting is when you have 2 curves and you manipulate their fit with zero correlation.
“But that speed changes due to the gravitational attraction of other planets and the speed change is the greatest at points of tangency to the orbit and this changes due to the planets moving through space themselves.
So this effect is reflected in the Naval observatory data with changes in that speed resulting in an approximate 5 day change from 1980 to 2023 from one half of the orbit compared to the other half.”
Bill, maybe you forgot. We discussed this at length. And the Naval Obs web site explained it also. This effect was explained as an artifact of the Moon’s orbit, not Jupiter’s pull.
You still miss the point bill.
You can point to all manner of orbital perturbations, but correlation is not causation.
The Milankovitch cycles have orbital variation that is not just correlated, but brings significant enough changes to Earth’s relationship to the sun that climatic effects can be meaningfully assigned. One example is the change in insolation poleward, melting the polar ice.
The smaller-scale cycles, such as the 60-year cycle, are such tiny perturbations that they have next to no effect on Earth’s climate.
The paper you linked described no linking mechanism between the orbital variation and the climatic changes, it only points out some correlation.
You keep replying that the orbital variation is well-evidenced. That’s not what I’m disputing. I am disputing that there is a well-evidenced link between these minor perturbations and sub-millennial scale global climate change.
You said NASA supports that the 60-year climate signal is linked to 60-year orbital variation (which is about length of day in the paper you linked).
NASA does not support this notion. NASA does endorse Milankovitch theory, which has well-defined mechanisms linking orbital variation with Earth’s climate. The paper you linked has no such defined linking mechanisms. It connects volcanic eruptions with orbital variation. But how? How does orbital variation initiate volcanic eruptions? There is nothing about that in the paper. For just one example.
Regarding the 60-year cycle and changes in Earth’s distance to the sun from orbital perturbation:
“Thus, the combined gravitational effect of two giant planets can change the Earth–Sun distance only by 3300 km. This variation, in turn, causes a change in the flow of electromagnetic energy reaching the Earth by an amount expressed in W m–2…
The corresponding radiation forcing (perturbation introduced by this factor into the radiation balance of the atmosphere) is 0.01 W m–2. If we take the maximum climate sensitivity λc = 1.20°C W–1 m2 adopted by IPCC (2013) (increase in temperature by 4.5°C with a doubling of the concentration of CO2 in the Earth’s atmosphere), we find that the variation of the Earth’s orbit caused by Jupiter and Saturn is capable of causing a global temperature variation of up to 0.012°C. As for Venus, the perturbation it produces is even smaller.”
https://www.academia.edu/download/113344664/S001679322003013520240415-1-z1ma8y.pdf
So even looking myself for a causal mechanism linking these small perturbations and global climate, there is little to support an orbital mechanics/climate change link on shorter time scales than Milankovitch theory.
Nate says:
”Bill, maybe you forgot. We discussed this at length. And the Naval Obs web site explained it also. This effect was explained as an artifact of the Moon’s orbit, not Jupiter’s pull.”
Nate yes we discussed it and you never produced any paper or model that supported that idea. Some unattributed page on a website with no scientific references nor even a claim of some lunar orbit mechanism that would be in time with that variation.
Until then the issue begs for a model of all the significant perturbations on earth’s orbit. So effectively all the discussion resulted in is agreement with me for what we need to do and if its already been done then we need to get access to the model.
barry says:
”You can point to all manner of orbital perturbations, but correlation is not causation.”
So are you advocating that we discard all science built on correlations Barry?
the situation here with orbital perturbations is better known than CO2 being implicated by correlation as the cause of climate change. The primary approach of the IPCC was to build models of all the known science on potential causes of climate change and eliminate them. They did so for every theory except this Milankovic effect and they chose instead to claim that the eccentricity variable was linear over a 100,000 year cycle when we are pretty certain its not. . .not if you believe what Universities are teaching about the causes of earth’s eccentricity.
“So are you advocating that we discard all science built on correlations Barry?”
Not at all. Correlation is one step, not the final arbiter. If the perturbation is too weak to cause significant change in global temperature then the correlation is coincidental.
We can curve fit any number of correlations. But unless physics supports the statistics then there’s no thesis. I’ve just looked for physical mechanisms that could verify 60 year orbital variations having a significant impact on global climate. Any science I’ve looked at rejects the proposition on physical grounds, whether it’s the real perturbation in LOD (several milliseconds only), or the distance of Earth to the sun (extremely minor perturbation with minimal effect on global temperature). I could find no physics, either, linking the 60 year orbital variation/s to volcanism, as posited in that paper you linked.
It is ALL curve-fitting, but no connecting physical mechanism. Differently to Milankovitch cycles, which see much larger orbital perturbations on long time scales, which bring about measurable physical changes that can account for global climate change.
Barry says:
”I could find no physics, either, linking the 60 year orbital variation/s to volcanism, as posited in that paper you linked.”
Sure Barry I don’t disagree. I am not making a connection to volcanism so that’s not a claim I am supporting nor denying.
Barry says:
”It is ALL curve-fitting, but no connecting physical mechanism.”
I already told you that’s incorrect, the physical mechanism is regular directional pull of gravity in time with the rotation and location on the celestial compass primarily from the 4 gas giant planets that has been increasing in its combined strength since the LIA that slows earth’s speed in its orbit through perihelion, stacking feedbacks over that period of time.
If you want to claim otherwise that’s fine. . .but you will be wrong.
what I am pointing out here is there is a need for a model of this as noted by Hays etal 1976. The science community who allegedly is so dedicated to us all haven’t taken Hays advice.
Barry says:
”Differently to Milankovitch cycles, which see much larger orbital perturbations on long time scales, which bring about measurable physical changes that can account for global climate change.”
You make a claim here of difference but you provide no support for its difference and Harvard is not teaching it as different but of the same physical mechanism, namely the orbital rotation of the other planets which are short term events that correlate with the instrument temperature record.
The stacking of these shortterm events with their sinusoidal patterns gets the longer time scale that is consistent with ice core data and is consistent with Nate’s view, Harvard’s view, NASA’s view on how orbit eccentricity perturbations build into the major events.
Further you have Berger sporting a figure where Milankovic discovered shorter term orbital variations and classified them as the same. One needs to find a reason to claim otherwise.
But its obvious if they do the work then there will be no differentiation between this forcing and CO2 and we will be left to try to figure out the effects of cosmic dust, tides, albedo feedbacks.
So for obvious and corrupt reasons they don’t want to do it.
That of course will bring us full circle to the wisdom of Dr. Syun Akasofu who stated that to understand anthropogenic climate change one must first understand natural climate change.
Don’t you think it’s odd that you have so many people like Nate claiming that this issue has been resolved but can’t show how it was resolved yet supports a legolike construction of an ice age on planet perturbations? He even alleges its the moon but can’t name any moon sinusoidal pattern to stack and would it even matter if it were the moon instead of the other planets? NO!!! For a trained auditor you may as well be flying the largest red flag ever.
How do you believe the ice ages get stacked up? Have you thought about it even or just bit into the idea without a thought such that you think you can declare it ”different”?
So while you want to deny these other patterns. They are recognized to exist. All you need is a model of them showing a correlation to temperature records and temperature proxies.
As to the sinusoidal patterns, there are plenty of sources for the 60 year, 900 year, and its really easy with the near 2:1 resonance of Uranus and Neptune to build their 175 year and 3600 year sinusoidal patterns that correspond to the more complicated triangle of conjunctions that Jupiter and Saturn produce.
https://www.nasa.gov/solar-system/the-great-conjunction-of-jupiter-and-saturn/
https://tinyurl.com/3s6v6bud (this one mentions the 60 year cycle discovered by Kepler where Jupiter and Saturn return to nearly the same spot after 60 years “forming a near perfect triangle” in the sky.)
there are also numerous references to the 900 year cycle of Jupiter and Saturn variously stated by 877 and 924 years by La Place and others. The 900 year and 3,600 year sinusoidal patterns mentioned above can be matched to temperature peaks in the icecore data and their 4:1 resonance.
That stuff is right out there naked in the wild which goes to show how deep the denial goes.
“Nate yes we discussed it and you never produced any paper or model that supported that idea.”
Wrong. The Naval Obs official website explained why it happens. I did a straightforward calculation to confirm what they were saying is correct. You cannot rebut.
If you don’t understand the explanation or calculation that is your issue.
“Some unattributed page on a website with no scientific references nor even a claim of some lunar orbit mechanism that would be in time with that variation.”
This exactly my issue with your claims. You offer no scientific references or show calculations or any relevant evidence
bill,
“I already told you that’s incorrect, the physical mechanism is regular directional pull of gravity in time with the rotation and location on the celestial compass primarily from the 4 gas giant planets that has been increasing in its combined strength since the LIA that slows earth’s speed in its orbit through perihelion, stacking feedbacks over that period of time.”
I don’t know how to make it any clearer that I am not disputing the orbital variation that you keep defending. That is already accepted. Please stop replying as if I am disputing orbital variation. This entirely misses my point.
What I dispute is that these very minor perturbations on sub-millennial scale have a noticeable impact on global climate. I am saying there is no connecting physical mechanism.
In Milankovitch cycles, by contrast, there is a significant physical mechanism associated with the multi-millennial orbital variation. This is the relocation of solar insolation intensity further towards the poles, which melts the ice. Here is the linking mechanism that connects orbital variation to global climate changes.
“You make a claim here of difference but you provide no support for its difference”
I’ve provided a paper measuring the changes in distance from the sun and calculating the resulting change in solar radiation. Looking for physical mechanism that links the 60-year orbital variation to global climate change I found a paper that calculates this perturbation and finds an insignificant effect.
Similarly, I read some of the source papers to the one you linked and discovered that the LOD change is mere milliseconds, and that this is a symmetrical effect, so LOD changes associated with the 80-year orbital variation has no noticeable effect on global climate. I covered this with you.
ou said earlier:
“Barry I am not talking about length of day.”
So why did you link to a paper about LOD being the 60-year orbital (rotational) variation and climate? This is the same paper that connects volcanism with orbital variation. I thought you linked to this because you agreed with it?
“I am talking about changes in earth’s speed through space.”
So I’ve covered off LOD and distance. I know of no science that suggests there is 60-year cycle in Earth’s velocity. You may be conflating ideas.
To round off – I am not disputing that there is a ~60-year orbital variation for Earth caused by gravity interaction with major planets, only that it is so small it can’t account for global climate change at this scale. I’ve provided a study and information about the two possible modes of orbital variation (distance and rotation speed) over 60 year periods, to demonstrate that the orbital changes are too small to have a noticeable impact.
If you know of well-founded science that there is a 60-year cycle in Earth’s velocity, please refer to it, and then we can look at whether this difference (if any) could possibly affect global climate to any significant degree.
Finally – yes, I’ve been using the term ‘curve fitting’ less strictly than it is generally – it is sometimes used to talk about matching wiggles in two different data sets. So I’ll just say that correlating time series is not enough. The physical mechanism linking them has to be solid, too. I don’t see it.
And I feel that I need to say for a 3rd time in one post – because I keep saying it and you keep not understanding – I agree that these orbital variations are well-founded. What I disagree with is that the 60-year orbital variations have any measurable impact on terrestrial climate. And I’ve provided research to corroborate my opinion.
Nate says:
”This exactly my issue with your claims. You offer no scientific references or show calculations or any relevant evidence”
well at least I am honest and I am calling for the science community to model this. You? I don’t see any reference or calculations attached to your post so what is this? A game of the pot calling the kettle black?
1538 1541 it was so hot in Europe forests began to die, many major rivers were almost dry, three years of crop failures and famine, the Black Forest suffered badly with leaf loss by July. Rumania was still warm in November with people swimming in lakes to keep cool, everywhere is warming faster than anywhere else has been the call for decades,nonsense of course, but it keeps the mirage going,
Three successive fine / warm summers from 1538-1540: the weather in 1540 was so fine that picking of cherries commenced before the end of May and grapes were ripe in July.
“1538 1541 it was so hot”
What I read about was drought, ie from little rain.
That is distinct from and longer lasting than a typical heatwave we experience now.
BACK AT THE RANCH
In my view, the only intellectually honest conclusion was that Donald didn’t hijack the Party, he revealed it. People don’t abandon deeply held beliefs in a matter of months. When you go from the “Character Counts” party to fervent support for a guy who talks in public about dating his daughter, it doesn’t mean that you have changed a deeply held principle. It proves that you never had deeply held beliefs. What the party called “bedrock principles” turned out to be nothing more than marketing slogans.
Something happened in the Republican Party. We evolved a system that rewarded lack of character and elevated weak men and women. I’m not sure how this happened, but it probably has something to do with the homogeneity of the Republican Party. In a country that is 57% white, Donald’s coalition in 2020 was 85% white. In 2024, he improved among non-white voters so that his winning coalition was … 84% white.
https://www.lincolnsquare.media/p/an-inside-look-how-the-law-and-order
There is a lot of talk recently on local TV, especially from the weather people, that we are experiencing a heat wave. It’s called summer folks, one long heat wave from about June 21st till September 22. Naturally, heat waves increase in late July and early August. It has been that way since I was a kid, sometime last century.
I am used to grass burning in summer due to a lack of rain and now that water restrictions are in place, a whole lot of lawns are turning brown. Not to worry, come Autumn it will become green again.
They are also talking about droughts in the Vancouver, Canada area and further into the province. There is talk of water shortages. No one seems to be aware that our population has nearly tripled in the past few decades. Many more people are using water for showers, baths, washing cars and even power washing entire houses. Burnaby, a suburb of Vancouver where I grew up, has gone from a population of 90,000 to 250,000 in the past few decades.
Still, we have plenty of water available, just not in our reservoirs. We leave it up to a panel to predict how much water we will need each year, and without fail, they under-predict the amount of water we will need. Therefore, our reservoirs are allowed to fill only to a human-predicted level. The size of reservoirs has not increase while the population has tripled.
The Interior of BC, a region about 250 miles inland from Vancouver has always had drought conditions. How dry? It’s so dry that cactus plants grow in the area and sage brush is the major shrub, just like in the deserts of the Old West films. In fact, Hollywood used to come North and shoot westerns there.
By the way, the Interior is dry because it’s on the wrong side of the coastal mountains. When clouds approach from the Pacific Ocean, they drop all their water on the wet side, leaving hardly any for the dry side. Ergo, the cause of the drought conditions is well known and it’s about weather.
That does not stop the alarmist weenies from claiming that drought is due to global warming/climate change.
Nobody knows what Trump is talking about anymore.
During his nationally televised announcement that he’s deploying the National Guard to Washington, DC, to battle a crime wave that doesn’t exist, Trump once again demonstrated that his brain has turned to oatmeal.
Twice, he told reporters he’d soon be meeting Russian President Vladimir Putin “in Russia.” The meeting, however, will take place in Alaska, which, unless Trump has recently gifted a U.S. state to Moscow, remains firmly outside Russian territory.
It’s the kind of thing you hear right before the family sits down to have “that” conversation about Grandpa. But coming from a sitting president launching a domestic military campaign against an imaginary crime emergency? That’s not just troubling, it’s downright surreal.
Ark, are you scared because you believe Trump made a gaff? Do you realize all people make gaffs? I listened to his speech, and couldn’t believe how capable and positive he was. He’s solving problems that have existed for years and no other president has been able to solve. You can’t expect him to be perfect. You just have to accept he is helping, a lot.
You’re having issues, but psychology has improved so much in the last 50 years that your problems are easily fixable. You don’t have to live in fear. Talk to a therapist. Your health insurance may even pay for it. You have nothing to lose.
You don’t have to live under your bed.
Trump and stats.
https://youtu.be/wRAjbgvj9Pc
Trump doesn’t do facts.
A propos
https://scienceofclimatechange.org/wp-content/uploads/Sir-2024-Prag-60yr-Jupiter-Earth.pdf
” The Climate Intelligence Foundation (CLINTEL for short) is a Dutch foundation that engages in climate science denial. The organization, which fights against climate protection, is considered the continental European counterpart to the British Global Warming Policy Foundation. According to its own statements, it was founded by science journalist Marcel Crok and geoscientist Guus Berkhout, who began his career at the oil company Royal Dutch Shell.
Clintel maintains close ties to other climate denial organizations such as the US-based Heartland Institute, the oil-industry-funded Friends of Science, the European Climate Realist Network, and many well-known climate skeptics.
The Climate Intelligence Foundation became known for its spearheaded declaration “There is no Climate Emergency,” in which, according to Clintel, several hundred scientists and experts deny the existence of the climate crisis.
The signatories include academics, politicians, lobbyists, and high-ranking figures from the oil and gas industry known as climate change deniers, as well as others associated with various climate change denial organizations such as the Cato Institute, the Heartland Institute, and the Global Warming Policy Foundation.
According to a bibliographical analysis, the signatories have virtually no scientific activity in the field of climate change. Furthermore, the authors of this analysis classify the declaration as a disinformation campaign intended to confuse the public about the scientific consensus on climate change.
At the same time, they place the declaration in the tradition of earlier, similar climate change denial initiatives such as the Leipzig Declaration and the Oregon Petition, some of whose statements were also adopted. ”
*
https://euracoal.eu/info/country-profiles/czech-republic-8/
*
Yeah. Long live the naive believers!
Bindi, have you found any errors in the bogus energy-balance graphic:
https://postimg.cc/yJFTRZzW
I asked all cultists to respond. The time is running out. I plan to start exposing the fraud in the graphic this weekend. If your cult can’t find any errors before, then they will be exposed, again.
SOLAR MINIMUM UPDATE
NASA is planning to decommission premier satellite missions that gather information on planet-warming pollution and other climate vital signs beginning as soon as October, sources inside and outside of the agency told CNN.
The destruction of the satellites – which will be abandoned and allowed to eventually burn up in a fiery descent into Earth’s atmosphere – marks the latest step by Donald to scale back federal climate science.
…
The greenhouse gas monitoring missions, known collectively as the Orbiting Carbon Observatory, are some of the many Earth science casualties in the proposal.
Other satellites and instruments on the chopping block include the long-lived Aqua satellite, which carries a high-resolution Earth imaging instrument called MODIS, that among other uses, helps detect wildfires worldwide. Also at risk are the Terra and Aura missions, each of which have climate science applications, and planned satellites that would precisely measure solar radiation, heavy precipitation and clouds.
https://www.cnn.com/2025/08/13/climate/nasa-satellites-trump-budget-cuts-weather
WINNIWINNING
What does an orbiting carbon observatory do that is not already being accomplished (probably at much lower cost) by the Mauna Loa observatory?
Step 2 – Sammich Request
Meanwhile:
India achieves 50% clean power capacity five years ahead of target
https://www.pv-magazine.com/2025/07/16/india-achieves-50-clean-power-capacity-five-years-ahead-of-target/
No, its not a sammich request. We all know you have no valid answers.
Ken V
” What does an orbiting carbon observatory do… ”
*
Newcomer here, huh?
Why do you ask instead of first learning?
https://en.wikipedia.org/wiki/Orbiting_Carbon_Observatory_2
https://www.npr.org/2025/08/04/nx-s1-5453731/nasa-carbon-dioxide-satellite-mission-threatened
Indeed.
When it comes to weather and climate, our current govt is continuing its ‘We don’t want to know’ policy.
https://www.usatoday.com/story/news/politics/2025/06/30/pentagon-satellite-weather-data-hurricane-season/84415765007/
https://green.org/2025/08/10/trumps-decision-to-decommission-climate-satellites-implications-and-reactions/
In the second case, the plan is to destroy perfectly functioning, already paid for satellites. I can’t imagine Roy is pleased with these policies.
As time allows, I like to find humor in the nonsense child Nate presents. Here, the winner is:
“In defense of his decision, Trump argued that decommissioning these satellites would save taxpayers millions of dollars (ignoring the billions and indeed trillions in damages we can expect from climate change).
Only responsible adults will catch the humor….
Trillions wasted world wide trying to fix something that was never broken in the first place, with no result. Burning witches may have better results.
Having a Dear Leader who tells you what to believe seems to crush independent thought!
Bindidon says:
August 8, 2025 at 3:14 PM
“Secondly, snow is not primarily a sign of cold but of wet. The more dry, the less snow.”
–
Comments like these are pure gold and well worth storing and repeating over time with full acknowledgment of the author.
–
To the normal person snow is primarily associated with cold.
It occurs in the colder half of the year, winter.
It can cause frostbite (cold damage) to hands if handled for a long period without gloves.
Water exists in 3 standard states.
Solid as cold, ice or snow.
Liquid as water which is wet and warmer than snow but colder than steam.
Gas as steam, very hot.
Water is only wet in its liquid state.
Snow is never wet, it is a solid.
–
Amazing how many knots one can tie one’s brain in when trying to justify a point of view that plain clashes with reality.
–
” Wet snow is associated with warmer temperatures near or slightly above freezing, while dry snow is associated with colder temperatures well below freezing.
Wet snow is characterized by its stickiness, making it ideal for activities like building snowmen and snowball fights. Dry snow, on the other hand, is powdery and less likely to clump together, making it suitable for activities like skiing and snowboarding. ”
*
In Eastern Siberia, it is way colder than e.g. in Germany or Austria; but there is often less snow in Verkhoyansk than in Garmisch-Partenkirchen or Innsbruck.
Thanks angech for posting incompetent nonsense.
News from the Turd Reich.
Goldman Sachs is being targeted by Trump for publishing unbiased economic forecasts, the kind their clients pay for. If clients suspected the analysis was just pro-Trump propaganda, Goldman wouldn’t keep them for long.
https://www.cnbc.com/2025/08/13/goldman-stands-by-call-that-consumers-will-bear-the-brunt-of-tariffs-after-trump-blasts-banks-economist.html
[Goldman Sachs] …analysis finds that through June foreign exporters absorbed just 14% of the cost of U.S. tariffs while American companies paid 64% and American consumers paid 22%. Goldman predicts that consumer share will rise to 67%.
[Trump] …David Solomon and Goldman Sachs refuse to give credit where credit is due…. I think that David should go out and get himself a new Economist or, maybe, he ought to just focus on being a DJ, and not bother running a major Financial Institution.
Ark, you’re not making much progress curing your anal fixation. That’s likely linked to your immaturity….
When you searched for ways to attack Trump at CNBC, you overlooked this:
Dow rallies 400 points for a second day, S&P 500 closes at another record high.
https://www.cnbc.com
BACK AT THE RANCH
Donald sent 3 U.S. citizen children, including boy with cancer, to Honduras with their deported moms
https://www.nbcnews.com/news/us-news/ice-deport-us-citizen-kids-stage-4-cancer-honduras-rcna224501
W
I
N
N
I
N
G
So many people try to come here to be terribly abused.
Why would anyone want to illegally enter such a country?
Maybe they just like all the authoritarianism, racism, poverty, and pollution, huh?
(Only responsible adults will understand the sarcasm.)
Hey Puffman, riddle me this –
https://www.thedailybeast.com/white-house-may-give-big-balls-edward-coristine-presidential-medal-of-freedom-the-same-medal-as-rosa-parks/
Does Big Balls deserve a tug or the same medal as Rosa Parks?
Not only are people trying to get into this country, but no one is prevented from leaving. With a REAL authoritarian dictatorship, no one is allowed to leave.
This is stuff cult kids can’t understand.
There’s something about “American citizen” that seems to escape you, Puffman. Another quick question. Donald said that –
“Since 1978 the Kennedy Center honors have been amongst the most prestigious awards. I wanted one, never able to get one. I would have taken it. I waited and waited and waited and I said to hell with it, I’ll become chairman. I will give myself an honor. Next year we’ll honor Donald, okay?”
Doesn’t that start to look like a banana republic dictator who gets himself fake medals?
The UK has the same problem, unlike immigrants of the past the modern day immigrant expects to be looked after hand and foot,free accommodation, free health care,a living allowance,and food vouchers, some complain the hotel rooms are not large enough, nothing wrong with immigration,Britain was built by it, we appear to have lost our way over the years,today it seems the more you give,the more they expect.
binny…”The Climate Intelligence Foundation became known for its spearheaded declaration “There is no Climate Emergency,” in which, according to Clintel, several hundred scientists and experts deny the existence of the climate crisis”.
***
The only people who think there is a climate crisis are climate alarmists. They offer no scientific proof, just consensus based largely on unvalidated climate models.
Scientifically-speaking, how can a 1C rise in the global average since 1850 (175 years) possibly cause climates to change anywhere? And how can a trace gas possibly cause significant warming, never mind a catastrophic climate change? These are valid scientific questions that alarmists cannot answer and spend a lot of time dodging.
Those speaking of climate catastrophe are hysterical. They are in the same category as religious zealots like scientologists. They also dodge the questions of how much of the warming since 1850 is due to a re-warming from the Little Ice Age.
The alarmists’ authority figure, the IPCC, have conveniently dismissed the LIA as a local cooling influencing Europe only. Anyone that stoopid should be an authority figure to no one other than charlatans.
1538 1541 it was so hot in Europe forests began to die, many major rivers were almost dry, three years of crop failures and famine, the Black Forest suffered badly with leaf loss by July. Rumania was still warm in November with people swimming in lakes to keep cool, everywhere is warming faster than anywhere else has been the call for decades,nonsense of course, but it keeps the mirage going,
Yes droughts have occured throughout history.
Point?
Point is,nothing unusual is happening, we have never been more capable of adapting to changes than we are today,and we will only get better, thanks to discoveries, inventions and technology , we live in a world of 8 billion people ,before the industrial revolution it was approx 1 billion,the warming must have played some part in the advancement, as the increase of C02 has increased greening and crop production, i have seen very little negative impacts compared to the advantages of a warmer regime, even if the warming is all caused be human activities it is not finite, because fossil fuel use will decline as sources are exhausted,
According to Ian, unusual means it never happened.
“We’ll adapt” is another point, about another issue.
“Point is,nothing unusual is happening”
Well, that is just denial of the available facts.
“we have never been more capable of adapting to changes than we are today,and we will only get better, thanks to discoveries, inventions and technology”
Yes and No. Paleolithic people simply moved around as ice sheets and sea level rose and fell rather gradually.
Today have built massive infrastructure that cannot easily be moved.
We can mitigate the problems with technology, like surrounding coastal cities with sea barriers, but at geeat cost.
Or we can adapt by adopting renewable enery at modest cost.
Nate, please stop trolling.
Your post is simply an admission that you have nothing of value to contribute to the discussion, but feel a need to piss on it anyway.
DREMT, pleasing stop pissing on discussions when you have nothing intelligent to add.
Nate, please calm down, and stop trolling.
News from the Turd Reich.
U.S. national debt just hit an unprecedented $37 trillion.
Powell, despite Trump’s barrage of threats and insults, was absolutely right to hold the line on rates.
So where is Trump’s actual plan to bring down inflation and rein in price hikes?
It’s not often that Marge and I agree on something… https://www.foxnews.com/politics/rep-marjorie-taylor-greene-explains-why-shes-extremely-frustrated-dc-lawmakers
Arkady, please stop trolling.
Trump and Putin are meeting again. This is likely the beginning of the end.
Look for the TDS kids to get even crazier….
Bin Wigly has a good take on TDS in today’s cast
https://youtu.be/RU8bBYGNivo?t=1554
Ark,
Calling people Alarmists who believe that burning fossil fuels is catastrophic to humanity is not ‘ad hominem’, it’s not even pejorative. I suggest that you look up the meaning of ad hominem.
The analysis, with all relevant references, is made available for anyone with enough engineering/science skill to understand it. I welcome competent comments. I am aware that papers that disagree with the common dogma are rejected before they even get to peer review (ask Dr. Spencer). Only about 10 % get published. Biased peer review is de facto censorship. My work is ‘peer reviewed’ by Mother Nature.
What hydrologists acknowledge and what Climate Scientists use are not the same. I have seen no evidence that measured water vapor increase is incorporated into the GCMs. Instead, they imply, if not outright claim, that the WV increase results from temperature increase which has resulted nearly all from CO2 increase. Examples:
NASA at https://science.nasa.gov/climate-change/causes/ “Water vapor is the most abundant greenhouse gas, but because the warming ocean increases the amount of it in our atmosphere, it is not a direct cause of climate change.”
EPA at https://www.epa.gov/climatechange-science/causes-climate-change “Since the Industrial Revolution, human activities have released large amounts of carbon dioxide and other greenhouse gases into the atmosphere, which has changed the earth’s climate.”
That ‘about 7 %” number is a rough approximation. As you should know, the correct value depends on temperature and is the slope of the saturation vapor pressure curve (curve is explained by the Clausius-Clapeyron relation) at a temperature divided by the pressure at that temperature. It’s graphed at Fig 4 of the analysis at https://watervaporandwarming.blogspot.com . Most of the average global WV is evaporated from warm tropical waters where WV change %/degree is closer to 6 %/degree. I use 6.7 %/degree which is conservative. Average global vertical temperature gradients haven’t changed significantly and, because average global TPA is used, lateral variation is not relevant.
The “…mainstream scientific and methodological understanding of an important technical issue” has been falsified.
“Calling people Alarmists who believe that burning fossil fuels is catastrophic to humanity is not ‘ad hominem’”
Sure, but who here is using ‘catastrophic’ to describe the effects of GW.
Strawman.
SOLAR MINIMUM UPDATE
Data and analytics firm Wood Mackenzie published a report in recent weeks that suggested 20 proposed or effective specialized rates for data centers in 16 states it studied aren’t nearly enough to cover the cost of a new natural gas power plant.
In other words, unless utilities negotiate higher specialized rates, other ratepayer classes — residential, commercial and industrial — are likely paying for data center power needs.
Meanwhile, Monitoring Analytics, the independent market watchdog for the mid-Atlantic grid, produced research in June showing that 70% — or $9.3 billion — of last year’s increased electricity cost was the result of data center demand.
https://apnews.com/article/electricity-prices-data-centers-artificial-intelligence-fbf213a915fb574a4f3e5baaa7041c3a
Shallow State?
Willard, please stop trolling.
Bindidon,
“The 33 K difference between today’s Earth and a snowball Earth formed by all water vapor snowing down from the troposphere never had to do with CO2.”
–
What is this now? What snowball Earth? How it is possible – it is unimaginable!
–
https://www.cristos-vournas.com
” What snowball Earth? How it is possible – it is unimaginable! ”
Unimaginable? Of course only for people like you, who originally fully supported the theory of the moon’s rotation but started denying it a few years ago just because you deny the greenhouse effect, and many people denying the greenhouse effect also deny the moon’s rotation.
This the ‘Flat Earth syndrome’.
*
The Snowball Earth is nothing other than an Earth whose troposphere – e.g., through a combination of Milankovitch cycles – became so cold that all the water vapor in it precipitated down to the surface into snow.
*
Τόσο δύσκολο σου είναι να το καταλάβεις;
Bindidon, what it is you are at again saying?
Of course our Moon rotates, why do you question it, why do you need Newton’s principia to understand Moon rotates. Don’t you see it yourself that Moon rotates?
Moon rotates before your eyes, and you searching for what Newton says about it!
You don’t understand, Bindidon, what you are seeing. If Moon were not rotating ones per its orbit, then an observer on Earth would have seen all sides of the Moon.
But we see only one side of the Moon!
Isn’t it a prove enough for Bindidon, that our Moon rotates?
Why Bindidon needs to bring it over and over again as an important discussion topic?
*************
Now, Bindidon:
“The Snowball Earth is nothing other than an Earth whose troposphere – e.g., through a combination of Milankovitch cycles – became so cold that all the water vapor in it precipitated down to the surface into snow.”
Interesting, Milankovitch cycles, so cold there is no water vapor left in the troposphere of the water planet Earth!
And, Bindidon, I never denied the greenhouse effect. I said it is very weak from trace gases in thin earth’s atmosphere.
On the other hand you have denied the farmers greenhouses’ greenhouse effect – you claim farmers greenhouses get warmed not from the outgoing radiation captured, but by the air being enclosed.
Because you, Bindidon, still support the utterly mistaken assertion, which claims air is capable emitting downwellng radiation of 340 W/m² – which is a pure fantasy!!!
–
–
https://www.cristos-vournas.com
Vournas
1. ” Bindidon, what it is you are at again saying?
1.1 Of course our Moon rotates, why do you question it, why do you need Newton’s principia to understand Moon rotates. Don’t you see it yourself that Moon rotates? ”
Look back for your posts in this blog’s past (2020-2022 or so) and you will find a lot of your posts claiming that Moon does not rotate about its axis.
You first admitted this lunar spin evidence again in July 2024.
*
1.2 You don’t need to tell ME taht but rather to Clint R, Robertson, the fake moderator DREMT, the Hunter bgoy and a few other ignoramuses.
**
2. ” On the other hand you have denied the farmers greenhouses’ greenhouse effect – you claim farmers greenhouses get warmed not from the outgoing radiation captured, but by the air being enclosed. ”
I never wrote such claims.
**
3. ” Because you, Bindidon, still support the utterly mistaken assertion, which claims air is capable emitting downwellng radiation of 340 W/m² – which is a pure fantasy!!! ”
I don’t ‘support’ it nor do I discredit it like you do.
Simply because I lack both scientific knowledge and technical skill to prove or disprove it.
If you think it’s ‘pure fantasy’ then give us a scientific proof for what you think, instead of simply claiming it.
Bindi, the easiest way to understand the Moon issue is with the simple ball-on-a-string. If you swing the ball in an orbit, the same side of the ball always faces the inside of its orbit.
Pretty much like Moon….
From Vournas to the eternally incompetent and cowardly Clint R, who lacks the guts to tell him his nonsense:
” Of course our Moon rotates, why do you question it, why do you need Newton’s principia to understand Moon rotates. Don’t you see it yourself that Moon rotates?
Moon rotates before your eyes, and you searching for what Newton says about it!
You don’t understand, Bindidon, what you are seeing. If Moon were not rotating ones per its orbit, then an observer on Earth would have seen all sides of the Moon.
But we see only one side of the Moon!
Isn’t it a prove enough for Bindidon, that our Moon rotates? ”
*
What about getting some balls, Clint R?
My comment was also available for Vournas, Bindi.
But since you mentioned him, did you notice he found something wrong with the bogus “energy budget” nonsense? Yet you have been unable to do the same. Does Vournas know more about science than you? Or are you just afraid to learn?
” My comment was also available for Vournas, Bindi. ”
No it was not; otherwise you wuld have included his name in your previous reply. You didn’t. You are not even able to admit that.
*
” Does Vournas know more about science than you? ”
Vournas knows about the terrestrial energy budget exactly as much as we all do on this blog (me included of course): zero point zero.
*
” Or are you just afraid to learn? ”
The one who is afraid to learn, that’s you with your ball-on-a-string syndrome, which is all what you are able to ‘contribute’ on this blog: misrepresenting, discrediting, denigrating.
Which by the way perfectly correlates with your (and the dachshund’s) Trump addiction syndrome.
Thank you, Bindidon, but you should say it openly that Moon rotates.
Because we have not your own, Bindidon’s official assertion yet, that our Moon rotates.
–
https://www.cristos-vournas.com
OMG Christos…
Why the heck do you think I have created for years this list of proofs of the lunar spin
https://drive.google.com/file/d/13DRDH1OFOUHYM_6HKH19sbj28yckJMF7/view
and updated it regularly?
*
Why the heck do you think that lunar spin deniers a la Clint R always deny that all links in the list point to a document proving the lunar spin about its polar axis?
*
For example, he he:
https://articles.adsabs.harvard.edu/cgi-bin/nph-iarticle_query?db_key=AST&bibcode=1970Moon….1..347M&letter=0&classic=YES&defaultprint=YES&whole_paper=YES&page=347&epage=347&send=Send+PDF&filetype=.pdf
or
https://articles.adsabs.harvard.edu/cgi-bin/nph-iarticle_query?db_key=AST&bibcode=1972Moon….5..302M&letter=0&classic=YES&defaultprint=YES&whole_paper=YES&page=302&epage=302&send=Send+PDF&filetype=.pdf
*
Of course: none of the pseudoskeptic gullibles denying the linar spin were ever able to understand the difference between the optical and physical libration phenomena.
Do YOU understand this difference?
Poor Bindi. He keeps throwing the same slop against the wall, hoping something will stick.
Most of his links don’t even work, and the ones that do don’t have any relation to “proof of lunar spin”. Bindi appears to be confused about libration, also.
Poor Bindi.
Bindidon, those are big mistakes, because the Stefan-Boltzmann emission law doesn’t apply at celestrial temperatures (the lower temperatures).
Because neither the surface emits ~398 W/m², and nor the atmosphere returns ~340 W/m².
Those both are terrible mistakes!
Please have the surface covered with standard 400 W radiative heaters per square meter (m²).
And please cover the skies with 340 W radiative heaters per square meter (m²).
They would produce a high temperatures furnice!
Unbelievable! Who started that nonsence in the first place?
*********
And, also, a planet doesn’t emit at its average surface temperature, because the average surface temperature is not a temperature per ce.
***********
https://www.cristos-vournas.com
Art of The Deal.
Donald Trump passed on buying the Dallas Cowboys in 1984 for $50M> saying “I feel sorry for the poor guy who is going to buy the Dallas Cowboys. It’s a no-win situation for him, because if he wins, well, so what, they’ve won through the years, and if he loses, which seems likely because they’re having troubles, he’ll be known to the world as a loser.’
Today, the Cowboys are worth $12.8 BILLION, meaning if Trump bought the team then, it would have returned 14% a year for 41 1/2 years!
Arkady, please stop trolling.
Barry says:
”What I disagree with is that the 60-year orbital variations have any measurable impact on terrestrial climate. And I’ve provided research to corroborate my opinion.”
Barry thats fine but the research you provided did not address the physical gravity mechanism I described. In orbital systems there are two factors that determine distance from the sun. mass/distance of the perturbation applied to the speed of earth in the orbit. As you should know an external gravity forcing speeds up the earth for 6 months then slows it for 6 months.
And you did not address the alternative calculation of the solar input effect of spending 5 more days on the perihelion half of the orbit vs the aphelion half of the orbit.
Even Nate recognizes this. He believes it is caused by the moon. Not a big deal. If the moon’s rotation around the earth causes the earth to spend the independently measured 5 more days closer to the sun than further away. . .LOL! . . .you still get the same amount of additional sunlight as if it were Jupiter and Saturn doing it. It makes for zero difference being the moon doing the job.
But that may not even do the trick Barry. You may need a tidal model to model the effect of gravity on long term ocean tides.
The AMO and PDO are two phenomena in climate science lacking a physical mechanism. But you bet your bottom dollar that ultimately its a tidal effect.
Any tidal effect from Jupiter and Saturn or the moon is going to create the observed temperature variations that co2 climate models can’t reproduce.
Does that mean CO2 amounts to zero? No. What it means is you can’t use the increase in temperature since 1980 to confirm a CO2 model. Dr. Akasofu plotted these cycles in his paper and noted an underlying linear warming of about a 1/2 degree per century. . .but he said that could be the gradual melting of ice sheets and glaciers and any other climate effects that come from feedbacks from that. So no help here on the linear trend either.
The starting point is to actually do an orbit perturbation model for the planets in the solar system and run it as recommended by Hays etal 1976. Ground truth it using observatory data to ensure the planets end up where they were observed to be over time. Then you would have the basis for building an insolation model on top of the output. Science estimates you can plot up to 2,000,000 years of planet position data this way before chaotic effects render it inaccurate.
Then you will be well ahead of CO2 models in having an actual verified model of the primary radiant effects.
Obviously the powers that be are aware of this and have chosen instead to suppress the information. If they had done this in 1976 as recommended science could have been nearly 50 years further down the road today than it is. But we continue to twiddle our thumbs.
“Barry thats fine but the research you provided did not address the physical gravity mechanism I described. In orbital systems there are two factors that determine distance from the sun. mass/distance of the perturbation applied to the speed of earth in the orbit. As you should know an external gravity forcing speeds up the earth for 6 months then slows it for 6 months.
And you did not address the alternative calculation of the solar input effect of spending 5 more days on the perihelion half of the orbit vs the aphelion half of the orbit.”
You are positing a 60-year climate cycle determined by orbital variation, presumably matching that cycle.
Which orbital variation do you think that has a 60-year cycle explains the potential 60-year climate cycles?
At the moment i’m unclear which orbital variation/s you think accounts for the supposed 60-year climate cycle.
References would be appreciated.
Sure Barry. The link I originally gave you shows the 60year cycle of Jupiter Saturn conjunctions as a pattern of Jupiter orbit eccentricity (with a smaller assist from Neptune and Uranus) matching to the temperature record.
Kepler discovered the Jupiter/Saturn 60 years cycle and described it as 3 consecutive conjunctions forming a near perfect equilateral triangle in the sky. Except that it triangle itself rotates slowly forming an 900 year cycle as seen in the GISP2 records.
In fact the explanation for the longer Milankovic cycles was a solar input chart offered by Nate that shows a slow progression with a lot of bumps over about 25,000 years that contributes to the ice ages with each bump either leading to cooling and then warming over longer scale times in combination with axial motions. I am sure Nate will share that with you.
So you have 4 sources now itemized (provided Nate is willing to share his) one of which you added to my inventory by finding it yourself and the 2 I have given you which you only commented on one of them. You didn’t comment on the last one I have you here.
https://tinyurl.com/3s6v6bud in this post: https://www.drroyspencer.com/2025/08/uah-v6-1-global-temperature-update-for-july-2025-0-36-deg-c/#comment-1710991
I have myself estimated the ”5day” solar effect and its significant. I think its about 1/2 of what we need with a ”central” estimate of feedback. But that doesn’t consider any of the other possible effects such as irregular ENSO cycles, AMO cycles, solar cycles, ozone takedowns, solar grand maximums and what they all leave behind as albedo feedbacks. Obviously all those are problems we have with the CO2 theory as well as well evidenced by the irregular shape of instrument temperature records and temperature proxies.
“The link I originally gave you shows the 60year cycle of Jupiter Saturn conjunctions as a pattern of Jupiter orbit eccentricity (with a smaller assist from Neptune and Uranus) matching to the temperature record.”
The link you provided that I referred to earlier was about Jupiter’s 60-year orbital influence on Earth’s LOD, which you ruled out above.
Please provide the link to the paper specifically on the thesis of the Jupiter/saturn orbital effect on Earth’s 60-year cycle of its distance to the sun. I can’t see it. The links you’ve just now provided do not refer to 60-year cycles.
You’ve rejected the 60-year orbital variations I know of regarding Earth’s LOD and speed (?), so I want to get the specific 60-year orbital variation you are speaking about that affects Earth.You are saying it is about Earth’s distance to the sun, right? A 60-year cycle that correlates with the potential 60-year climate cycle, yes?
Reference to a research paper would be greatly appreciated.
barry says:
”The link you provided that I referred to earlier was about Jupiter’s 60-year orbital influence on Earth’s LOD, which you ruled out above.”
I didn’t rule out the correlation Barry. the Author offered more possibilities than LOD. As I said this needs investigation. What I said is the paper you are referring to is showing a correlation between Jupiter orbit eccentricity variations and earth’s temperature variations. . .suggesting that Jupiter’s orbit perturbations are the same perturbing factor that earth experiences that climate models are failing to describe.
You said: ”In Milankovitch cycles, by contrast, there is a significant physical mechanism associated with the multi-millennial orbital variation. This is the relocation of solar insolation intensity further towards the poles, which melts the ice.”
In saying that you left out half the effect per Hays et al 1976 which is orbit perturbations not axial perturbations including his statement that these perturbations are not likely linear.
So yes orbit perturbations alone don’t create the major interglacials in our current iceage. But the eccentricity orbit perturbations of Jupiter correlate with earth’s temperature records and this correlation has corruptly been suppressed.
Barry says:
”You’ve rejected the 60-year orbital variations I know of regarding Earth’s LOD and speed (?), so I want to get the specific 60-year orbital variation you are speaking about that affects Earth.You are saying it is about Earth’s distance to the sun, right? A 60-year cycle that correlates with the potential 60-year climate cycle, yes?”
So now you are arguing that the suppression of Milankovics actual work is proof that part of his work is has no support yet Hays gives it support. And how does your idea of how it works while you ignore half of Milankovic’s work that you say is well founded?
Reference to a research paper would be greatly appreciated.
bill,
I have been consistently asking you about a 60-year celestial mechanics variation, which you have alluded to multiple times, that accounts for the supposed 60-year climate cycle in the instrumental record.
When I mentioned that the 60-year LOD cycle only changes by several milliseconds, and that this is symmetrical to day and night, and so couldn’t possibly have a noticeable influence on global climate, you replied:
“Barry I am not talking about length of day.”
In the next sentence you said:
“I am talking about changes in earth’s speed through space.”
So I checked that out, and there is no research suggesting a 60-year cycle in the Earth’s velocity.
In the post that started this thread you appeared to be saying that it is about Earth’s distance to the sun.
‘In orbital systems there are two factors that determine distance from the sun. mass/distance of the perturbation applied to the speed of earth in the orbit… If the moon’s rotation around the earth causes the earth to spend the independently measured 5 more days closer to the sun than further away. . .LOL! . . .you still get the same amount of additional sunlight as if it were Jupiter and Saturn doing it.”
But it seems that this variation is not part of a 60-year cycle that can be matched to the 60-year global temperature oscillation. Or at least, you’ve provided no reference saying so.
So the only reference you’ve provided for a 60-year perturbation of Earth’s celestial mechanics is about LOD.
LOD cannot possibly cause such large temperature swings, when the amplitude of the 60-year LOD cycle is measured in milliseconds, and applies equally to daytime and nighttime.
I know you are saying “more work needs to be done,” but I’m not seeing a careful consideration and sorting of different cycles and the actual physical effects that could have, but rather a series of hopeful correlations that seem to avoid discovery of any physics linking the celestial variation to global climate. Meanwhile, papers I find that actually do this work conclude no significant effect from short-term variation.
To be super clear, I am focussing on this 60-year celestial/climate cycle connection, and I’m not seeing anything yet that looks solid.
“In saying that you left out half the effect per Hays et al 1976”
I’m just mentioning the most well-known, dominant effect, not discounting the others, which I alluded to way above. The various Milankovitch cycles are all multi-millennial, and the linking mechanisms between those cycles and global climate are well-supported (Hays 1976 begins by querying the linking mechanisms between orbital variation and global climate). Once again, it is the shorter cycles you are speaking about – and particularly the 60-year cycle – that does not seem to have a significant mechanism linking the celestial variation with global climate. LOD is simply too insignificant a change to contribute to 60-year global climate variation.
Barry says:
”Once again, it is the shorter cycles you are speaking about – and particularly the 60-year cycle – that does not seem to have a significant mechanism linking the celestial variation with global climate. LOD is simply too insignificant a change to contribute to 60-year global climate variation.”
—————————
Thats simply because you don’t understand what the LOD is indicative of.
So far you haven’t yet explained the changes in speed of earth through perihelion and you reject NASA that clearly states the climate variation is due to Saturn and Jupiter.
Hays et al 1976 asserts that eccentricity variation is 50% of the total effect (actually 60% of the Milankovic effects as Hays et al took the liberty of allocating 15% of the total effect to CO2 feedbacks.
Your claim that the ice ages are merely axial variations is falsified by numerous sources.
And finally you have provided no explanation of how climate variation over the millennia can add up ”primarily” from the motions of Jupiter and Saturn when their orbit periods are about 12 and and 30 years respectively as NASA claims.
The only thing I have added in are the other two gas giants with orbit periods of 84 and 165 years with less than the ”primary” effects such that the actual mean progress of longterm climate change is coming in chunks of time a bit different than precisely 60 years.
But you the barebones fact is simply you do not have major peaks and valleys in the earth’s climate time history without Jupiter and Saturn contributing to it.
the claim that CO2 is modifying that rhythm has yet to be established.
And the best way of establishing that would be as Hays et al 1976 recommends by creating an orbit perturbation model. So since Hays et al 1976 is considered by mainstream science to be a seminal work of science the big question is why hasn’t that been done.
I can state via my professional experience the correlations are strong, what I posted above and the papers I have quoted being wrong is very remote and that won’t be refuted by some guy on a blog with zero science papers rebutting it and only self prepared estimates borne out of a basic misunderstanding of the science that ignores the key elements.
Calculate for yourself what 5 more days at earth’s unperturbed ”kepler” orbit distances through perihelion as opposed to aphelion means in terms of additional watts of sunlight received by earth. It’s not hard to do that using approximations. Then realize that without feedbacks that amounts to about half of the primary 1 degree per doubling of CO2 without feedbacks.
Then realize that is only a fraction of the orbital effect as slowing the earth’s speed through perihelion will cause earth’s actual orbit to move closer to the sun increasing the additional wattage received by tarrying longer in the perihelion half of the orbit.
When the march of these planetary orbit rotation ratio effects move in the opposite direction of the axial effects; they override the axial effects per Hays et al 1976 by being 150% more powerful on average than the combined axial effects.
So try to put in an honest reply here. You have shown the ability to be reasonable without skipping around looking for gotchas.
News from the Turd Reich.
After six months of failure to end the war in Ukraine (a task he once said was “so easy” that it would be done before he even returned to office in January) Trump has now staged an embarrassing self-own in Anchorage.
In the end, what appeared to be a high-stakes diplomatic opportunity instead turned into a fundraising ploy targeting his most gullible supporters. As Trump was greeting Putin on the tarmac (clapping as he did) his fundraising team circulated the following e-mail:
TRUMP LITERALLY HAD US SOLDIERS GET ON THEIR KNEES TO ROLL OUT A RED CARPET FOR PUTIN (August 15, 2025)
Ark is still suffering from TDS, making his anal fixation even worse.
Ark had ample opportunity to learn how Trump works, from the Iranian event. Trump first played “good cop”, trying his hardest to negotiate. When that failed, Trump went to “bad cop”, destroying the Iranian nuclear facilities.
It’s going to be the same with Putin. Trump will get tired of playing “good cop”.
Government papers found in an Alaskan hotel reveal new details of Trump-Putin summit
There’s nothing like the feeling that your life is in the hands of a competent administration. And this is nothing like feeling like your life is in the hands of a competent administration.
Arkady, please stop trolling.
BACK AT THE RANCH
Papers with U.S. State Department markings, found Friday morning in the business center of an Alaskan hotel, revealed previously undisclosed and potentially sensitive details about the Aug. 15 meetings between Donald and Russian President Vladimir V. Putin in Anchorage.
Eight pages, that appear to have been produced by U.S. staff and left behind accidentally, shared precise locations and meeting times of the summit and phone numbers of U.S. government employees.
https://www.npr.org/2025/08/16/nx-s1-5504196/trump-putin-summit-documents-left-behind
Masterful.
Dan Pangburn.
Regarding your comment of 8/14/25 at 6:51 PM.
1/ Ad hominem refers to attacking the person rather than addressing the substance of their argument. Labeling someone an alarmist is a framing tactic that attempts to shift focus from the evidence to a characterization of their supposed mindset or motives. Your use of the term here is a textbook example.
2/ Saying that you “have seen no evidence that measured water vapor increase is incorporated into the GCMs” means nothing since you admittedly shun the peer-reviewed literature.
All modern GCMs explicitly simulate the hydrological cycle (evaporation, condensation, precipitation, and atmospheric water vapor transport) by solving thermodynamic and fluid dynamic equations. The NASA and EPA public statements you quoted are simplifications of causality for a lay audience, not model documentation as you seem to think. I suggest that you look up the extensive peer-reviewed literature and open-source model code documentation demonstrating that water vapor physics is central to GCMs.
Atmospheric water vapor content is not prescribed; it is an emergent property of the coupled climate system simulated in GCMs. The Earth system water cycle itself is a dynamic outcome of these simulations, not a user-inserted dataset.
Why the “Earth’s Energy Budget” graphic is nonsense.
https://postimg.cc/yJFTRZzW
#1 Flux does NOT balance.
Radiative flux is not a conserved quantity. That means it does not need to “balance”. It’s very possible to have more flux coming in than going out. For example, a hypothetical sphere receiving 960 W/m² would be emitting 240 W/m². “960” does not equal “240”. The cult tries to treat flux as energy. Energy is a conserved quantity, flux is not conserved.
#2 Flux does NOT average.
Because of the non-linear nature of radiative flux, it can not be averaged.
#3 The incoming solar is NOT 340.4 W/m²
The cult has divided the solar constant, about 1370 W/m², by 4. Radiative flux can not be simply divided!
#4 The absorbed solar is NOT 163.3 W/m²
After dividing solar constant by 4, they then adjust for albedo. Then, they adjust again for more albedo. Reducing solar to a measly 163 W/m² which would correspond to a temperature of about 232K (-43°F, -42°C). Solar panels would not work. That flux couldn’t even melt ice!
#5 The cult can’t even get the arithmetic right.
Solar does not add correctly 340.4 – 77 – 22.9 – 77.1 = 163.4, NOT 163.3. (I know it’s a petty point, but it’s in the graphic. The cult kids couldn’t even catch an arithmetic error!)
#6 The 239.9 W/m² is bogus.
No one knows what Earth’s emitted “average” flux is. A hypothetical sphere at 288K would be emitting 390 W/m². At some point in space, that same flux would be reduced to 239.9 W/m², but it would also be reduced to 139.9 W/m², or 39.9 W/m², or any value between 390 and 0 W/m², at distance, due to the Inverse Square Law. Claiming Earth emits 239.9 W/m² is just more fraud.
#7 Back-radiation of 340.3 W/m² cannot warm a 288K surface.
An expensive IR thermometer measures overhead clear sky at about -50 °F. But 340.3 W/m² corresponds to 41 °F! Compare the bogus 340.3 back radiation with the bogus “absorbed solar” of 163.3 W/m². In cult “science”, the sky is warming Earth more than Sun!!! That ain’t science, it’s fraud.
#8 Back-radiation is not all CO2
There are several radiative gases in the atmosphere. CO2 is one of the least effective, as it has a very limited line spectrum from Earth’s surface emission, specifically the 15μ photon, which carries less energy than the WDL photon from an ice cube.
#9 Assigning some values of flux to thermals and latent heat is another prime example of the fraud.
How did they conjure up values of W/m² for thermals and latent heat? That ain’t science!
#10 Earth’s outgoing energy seldom matches the incoming energy.
In fact, the outgoing energy is typically LESS than the incoming due to “losses” like molecular collisions, weather, and photosynthesis. The solar energy gets converted to other forms of energy than thermal, so never leaves the system.
#11 The clouds only emit!
In the cult’s bogus energy “budget”, clouds are only emitting. It’s as if the clouds have some internal energy source.
Well if anyone is interested in reality, that should be enough to completely debunk the “Earth Energy Budget”. But, there’s one more important point. They end up with a “net absorbed” of 0.6 W/m². The implication is that Earth is accumulating energy. But notice they NEVER provide any error margins. All their values are meant to be taken as absolute. That is, they get to make up whatever they want.
Photosynthesis by itself is estimated to be about 2% of solar. After albedo, that amounts to about 19.2 W/m². If you use their “divide-by-4” fallacy, it still means 4.8 W/m² is devoted to photosynthesis. That’s 8 times the bogus 0.6 W/m²! And I suspect their other errors are even larger.
It’s all bogus, and would make great comedy if so much money, and negative impacts on society, weren’t involved.
But, there was one thing they got correct. Notice in the distribution of solar (yellow arrows to left) — the 77 W/m² And the 22.9 W/m². Notice the descriptions, “reflected by clouds and atmosphere” and “reflected by surface”. They are admitting flux can be reflected. Maybe the cult kids will now accept that flux can be reflected….
Hey Mr Omelette head,
Learn about the WDL and the SBL before attempting to do science.
I recommend “Radiative Flux Transfer for Dummies” as a good first read.
No one found anything wrong with the science, and I didn’t even make any typos! I reread it before submitting, so was glad I eliminated my usual supply.
“…divided the solar constant, about 1370 W/m², by 4. Radiative flux can not be simply divided!”
Of course flux can be divided. By definition it’s watts per square metre – power divided by area. That’s exactly why we can average it over different areas.
The approx 1370 W/m2 solar constant is determined with respect to a perpendicular flat surface.
The Earth is not flat.
Because irradiation diminishes with increasing angle from the perpendicular, the average flux across the sunlit hemisphere is about 685 W/m2.
If you do not (effectively) divide the solar constant by two, you overstate the insolation striking a spherical Earth in any calculation.
Mathematically, what function would you use to compute the flux on a sphere from a plane-parallel beam?
The solar flux is averaged over the entire surface for ease of computation, so that incoming and outgoing radiation can be compared on a matching, per-square-metre basis.
“non-linear nature of radiative flux, it can not be averaged”
Of course it can. Flux is energy per area per time. Just like rainfall in mm/day, it can be averaged over space and/or time with no problem.
Flux itself is not conserved, but in equilibrium the total incoming and outgoing energy fluxes must balance.
Quite nicely put barry.
Our problem with CR is that we are “casting pearls before swine”.
Clint R belongs to these ignoramuses who think scientists would manipulate the ‘Ein = Eout’ equation, by unduly replacing the 2 π R^2 sunlit hemisphere with a simple π R^2 disk.
Such people who endlessly urge in a pathlogical 360 degree discrediting of science will never grasp that there is more incoming solar flux at the equator than at the poles: the size of cells of equal arc length decreases both latitudinally and longitudinally.
Integrating ∫cos^2(a)da from a = 0 till a = pi/2 gives… exactly 0.5.
What else could we expect from people discrediting astronomers as astrologers and reducing the complex motion of the Moon to that of a… ball-on-a-string.
Frogs say in such hopeless cases: ” Plus bête tu meurs. “
I also recommend that CR reads:
“Mathematics for Dummies”.
Sorry barry, but you’re confusing “climate science” physics with REAL physics. Two 500 W/m² fluxes don’t have the same effect on a surface as one 1000 W/m² flux. Fluxes can’t be divided.
The rest of your blah-blah is just as bad.
But you managed to get one thing correct — “The Earth is not flat.” Very good.
Keep learning. Some, like studentb and Bindi, can’t….
Bindi, no matter how many times it is explained to you, you still don’t get it.
The simple ball-on-a-string is a model of “orbiting without spin”. It is NOT trying to model Moon’s actual orbit.
And you STILL don’t have a viable model of “orbiting without spin”.
You just can’t learn.
Clint, flux is defined as energy per area per time. The units already have division built into them. Same with averaging. At any given picosecond the total amount of energy passing through a plane is slightly different.
The amount of energy per second averages the energy over a unit of time.
The amount of energy per square metre divides the total flux by area.
On a sphere, sunlight hits at an angle, so you have to weight by cosine. The same beam spreads over more area, so the flux is divided. The solar constant must be divided on a sphere, otherwise you’re shining flat-Earth sunlight on a round planet.
Really, Clint, some of your ideas are as wacky as flat-Earthers.
barry, not only are you ignorant of the science but now you’re clearly trying to pervert the issue. You avoid reality:
Two 500 W/m² fluxes don’t have the same effect on a surface as one 1000 W/m² flux. Fluxes can’t be divided.
The rest of your blah-blah is just as bad.
A man went for a walk on the coastline
To enjoy the bountiful sunshine
He took off his shirt
Got immediately sunburnt
Then lamented: “It was all because of the cosine”
But now I’m curious, Clint, to see if you can answer the question I posed above.
A sphere is 4 times the area of a disc of the same circumference.
The sunlit hemisphere of the Earth is twice the area of a disc with the same radius.
So how would you, Clint, calculate the solar flux irradiating a sphere, when it’s flux is 1370 W/m2 on a flat plane at the same distance?
Or more simply, how do you convert the solar constant as it strikes a flat plane, to the actual flux as it falls across a hemisphere?
You’re STILL trying to pervert the issue, barry.
You can’t face the reality: >b>Two 500 W/m² fluxes don’t have the same effect on a surface as one 1000 W/m² flux. Fluxes can’t be divided.
The rest of your blah-blah is just as bad.rr
Now, what will you try next?
Chanting mantras is not answering questions, Clint.
How do you calculate the actual flux across the sunlit hemisphere of a sphere at 1 AU from the sun? We’ll take the solar constant you already mentioned, 1370 W/m2: how do you work out the flux received by the sunlit hemisphere?
If you can do this without any operation that equates to dividing or averaging, I will be mightily impressed, and I will happily concede that I am wrong.
The reason you have retreated to a mantra is that if you answered the question you’d be forced to show you are dividing and averaging flux to get a solution.
We can all see you ducking the question each time you repeat the chant, signalling yet again that this is way above your head.
Prove me wrong. Answer the question.
Clint R
Other than offering your opinion: “Two 500 W/m² fluxes don’t have the same effect on a surface as one 1000 W/m² flux. Fluxes can’t be divided.”
Do you have any supporting evidence of this such as an experiment?
Have you taken two 500 W heat lamps situated above an absorbing surface, measured the temperature at steady state and then tried it with a 1000 W heat lamp to see if your statement is correct?
barry — Bindi already did the calculation for you. After albedo, that would result in 479.5 W/m², much more realistic than your cult’s 163.3 W/m². But still invalid for any “energy balance” for Earth.
What will you try next?
Norman — Surely you haven’t forgotten what I taught you last time? An arriving flux can NOT warm a surface emitting the same, or greater, flux. So, Two 500 W/m² fluxes don’t have the same effect on a surface as one 1000 W/m² flux. Fluxes can’t be divided.
“Bindi already did the calculation for you”
Nope, he did not calculate flux over a hemisphere from the solar constant. This is a lame deflection, and another indication you have no idea what you’re talking about.
Clearly you are in way over your head. Obviously you are not able to calculate flux on a hemisphere based on the solar constant. If you were, you would know that averaging and dividing the fluxes is necessary.
Clint R
I did not request your opinion on the matter. I am asking if you have any experimental evidence to support your claim. Textbook physics clearly states that the cold surface will send IR to the hotter one reducing the rate it loses energy. You need to support your claims if you want them to believed. At this point they are your opinions on how you think radiative heat transfer should work. They are not established with any experiment on your part. It does not matter how many times you repeat it. It needs experimental validation to be science.
barry, Bindi showed the result of integration over a hemisphere: “…exactly 0.5”
So applying to solar constant, 1370 W/m², we get 685 W/m². Then, reducing for albedo, we get 479.5 W/m², much more realistic than your cult’s 163.3 W/m². But still invalid for any “energy balance” for Earth. That’s because flux is NOT energy, and you can’t average flux.
What will you try next?
Norman, you are confusing yourself, again. Stick with only one issue, until you fully understand it. You’re behaving like barry, just throwing crap at the wall hoping something will stick.
The first issue you mentioned was my statement “Two 500 W/m² fluxes don’t have the same effect on a surface as one 1000 W/m² flux. Fluxes can’t be divided.”
Consider a high emissivity thin surface perfectly insulated on the back and edges. If that surface receives 500 W/m², it will reach a temperature of 306K. Then if you add a second flux of 500 W/m², the temperature will not increase because the surface is already emitting 500 W/m². As I taught you earlier, a surface will not absorb a lesser flux than it is emitting. So the surface will NOT increase in temperature with two 500 W/m² fluxes, but will increase in temperature with one 1000 W/m² flux.
Now, before proceeding, do you fully understand this basic concept?
Clint R
Yes that is your belief that adding an additional 500 watt source will have no effect. I am not confused in the least. I am asking you to support your belief with experimental evidence. Do your experiment. Heat one side with a heat lamp. Let it reach a steady state temperature. Remove the insulation and turn on a similar heat lamp on the opposite side and share your data. What you peddle are your opinions, what I request is valid science with experimental validation.
You’re changing the scenario, Norman. Taking off the insulation changes the physics. That’s just another example of you throwing crap against the wall.
Why don’t you want to face reality?
“Two 500 W/m² fluxes don’t have the same effect on a surface as one 1000 W/m² flux. Fluxes can’t be divided.”
Lets put Clint at the focus point of all the mirrors of a solar thermal power plant.
https://en.wikipedia.org/wiki/Concentrated_solar_power
According to his bizarre thinking the sunlight fluxes he recieves from each of the thousands of mirrors will not add.
So he should not heat up any more than if he stood out in the sun.
He could be a contender for a Darwin Award!
Child Nate likes to reveal his ignorance of the issues.
Like many in his cult, he finds something on the Internet that he believes supports his false science, and can’t control himself.
Here, he’s apparently discovered how a magnifying glass works. It can focus solar to a much higher flux. But that has NOTHING to do with my point, which children can’t understand.
He’s just throwing crap at the wall, as usual….
Nope. Its a whole bunch of separate sources whose fluxes should not sum or heat according to you.
So you should be fine standing at the focus.
Wrong child, it’s only one source. The mirrors are simply restoring the solar flux that was lessened by distance. If all of the flux could be captured the emitting temperature of Sun could be reached.
Again, you don’t understand any of this. As I said, you just throw crap at the wall, hoping something will stick.
Keep proving me right.
Clint,
“Bindi showed the result of integration over a hemisphere: …exactly 0.5
So applying to solar constant, 1370 W/m2, we get 685 W/m2.”
Yep, Bindi integrated for area and YOU, Clint, have just divided the flux by two (same as multiplying by 0.5) to account for the spread over the hemisphere.
So you’ve proved you can divide flux.
Furthermore, the flux is greatest at the equator and least at the poles – so the result you’ve just given us is an average.
You have averaged and divided flux.
And you thought you couldn’t. Congratulations on this achievement!
barry must have missed:
“…much more realistic than your cult’s 163.3 W/m². But still invalid for any “energy balance” for Earth.”
Not only did barry miss my clarification, but he apparently believes that arithmetic is science. He must believe if you can do a division, then it is okay.
So, let’s saw barry in half (divide-by-2). It can’t hurt because one divided by 2 is one-half. The arithmetic is correct, so barry should be fine.
It’s really quite astonishing how far they are prepared to go to misunderstand. So here, barry has been attacking the quite ludicrous strawman that Clint is saying you literally can’t divide one number by another number and call it an average, for flux!
Mathematically, you can produce an “average flux”, of course. But, is it actually, physically meaningful? Does it in any way accord with real values that are actually, physically experienced? Clint is saying, “no”.
It’s not that difficult to understand.
“it’s only one source. The mirrors are simply restoring the solar flux that was lessened by distance.”
Yep, ‘restoring’ by summing.
You have a thousand separate streams of photons being summed. And producing the expected result 1000 x the flux of one stream, and thus very high temperatures.
Can you point out the physical difference between those thousand streams from one sun, and a thousand streams coming from a thousand different but identical suns?
Of course not. Photons are photons.
Your theory fails to agree with experiment.
Child Nate, we both know that when I answer your latest effort to pervert reality, you will just find more crap to throw against the wall.
So, how about this: You stop commenting here for 30 days, then I will answer your question. Deal?
DREMT,
“The cult has divided the solar constant, about 1370 W/m2, by 4. Radiative flux can not be simply divided!”
Is what Clint said.
Clint divided the solar flux by 2 to give us the result for the lit hemisphere.
I call this progress. Sadly, Clint seems to be denying his achievement.
Every solar flux value for a curved surface is an average, and has been since he began yapping about these matters years ago.
He apparently didn’t know it.
If you want to sign up to denying the arithmetic for flux on a curved surface, that’s entirely up to you, but it is one of the more decrepit lines of science denialism I’ve seen, and that’s saying something.
barry, you’re such an incompetent clown. You only have value as an entertainer.
You actually believe arithmetic can be used to pervert reality.
A healthy human can easily walk at a speed of 4 mph. So in your perverted world a human can walk at 4000 mph, since 4 X 1000 = 4000.
Keep entertaining us.
Predictably, barry doubles down on his ridiculous misrepresentation. Of course Clint is not suggesting you literally can’t divide one number by another number. Of course Clint was aware that “every solar flux value for a curved surface is an average“. He’s saying if you divide flux, and average it, don’t expect the result to be physically meaningful.
DREMT,
You are contradicting Clint while trying, for some unknown reason, to defend his pap.
Here is his post with his comments as he wrote them:
https://www.drroyspencer.com/2025/08/uah-v6-1-global-temperature-update-for-july-2025-0-36-deg-c/#comment-1711069
The nuance you are trying to attribute is not there. Nice try bailing Clint out of his nonsense. But your interpretation is just as vacuous, not to mention self-contradictory.
Flux is already divided and averaged as soon as you give a result for the solar constant on a curved surface.
That’s a fact. Calling it ‘physically meaningless’ is the same as saying that any average is meaningless. Pure anti-science.
But please, keep talking. It is instructive for anyone bothering to read.
barry, I have followed this discussion from the beginning. You are not capable of honest debate. You always misrepresent. I let it happen for a little while but eventually it became too irritating for me and I felt the need to intervene.
You’re right, DREMT. barry is just another cult kid. He’s like Nate, Bindi, Norman, Ark, Willard, studentb, and the rest. He has no science background, so resorts to various debate tricks.
He’s fruitlessly trying to defend his cult science, debunked here:
https://www.drroyspencer.com/2025/08/uah-v6-1-global-temperature-update-for-july-2025-0-36-deg-c/#comment-1711069
The points in the debunk are numbered. If barry were legitimate, he would identify which point and clearly state his concern with it. Otherwise, he’s just throwing crap at the wall hoping something will stick.
“Can you point out the physical difference between those thousand streams from one sun, and a thousand streams coming from a thousand different but identical suns?”
As expected, we get crickets from Clint. And that is correct, there is NO difference.
Now go and stand in front of 1000 500 W/m^2 spotlights shining on you, and you should be no warmer than with one spotlight.
Or, win the Darwin Award in a blaze of glory!
We will remember your brilliance (of your glow).
Your answer, Nate:
https://www.drroyspencer.com/2025/08/uah-v6-1-global-temperature-update-for-july-2025-0-36-deg-c/#comment-1711393
As noted “crickets”.
No attempt to answer the question.
You have none, that is obvoius.
Because your ‘theory’ is thoroughly stoopid.
If you stop commenting here for 30 days Nate, then I will answer your question. Deal?
That’s a small price to pay to learn more than all the other cult kids.
barry, when you come up with any single value for the insolation on Earth’s curved surface you are indeed averaging flux and I saw absolutely no indication that Clint R was unaware of that. His point is valid, because averaging flux can lead to significant errors especially when converting your average flux back to a temperature value. See, for example:
https://springerplus.springeropen.com/articles/10.1186/2193-1801-3-723
Clint, If you wont defend your ideas against challenges, then they can be safely ignored.
Now go away.
DREMT,
The nonsense is as tiresome as it is spurious. I’ll quote Clint.
“#2 Flux does NOT average.
Because of the non-linear nature of radiative flux, it can not be averaged.”
This is absolutely false. Flux is Clint may be mistaking the nonlinear relationship of flux to temperature. If so, how can you be defending this completely wrong comment?
Likely it is from this fundamental misunderstanding that Clint screws up the rest of his analysis.
Yes, you know very well that flux can be averaged and divided. This is NORMAL SCIENCE – not just climate science, but ALL radiative physics. But then you jump off the cliff with Cint in trying to rationalize HIS hopelessly ill-conceived issues with normal science.
If you want to defend Clint, explain to everyone here why flux is a non-linear quantity.
Nate, you haven’t presented any “challenge”. All you’ve done is throw incompetent nonsense at the wall.
Take 30 days off, and I’ll teach you some physics.
Clint R’s statement:
“Because of the non-linear nature of radiative flux, it can not be averaged.”
From my link:
“Inequality (4b) implies that the area-weighted average temperature of a spherical surface (on the left) is always lower than the temperature calculated from the area-weighted average long-wave radiation emitted by the surface in proportion to T(μ)4 (on the right). Due to a non-linear relationship between temperature and the emitted radiative bolometric flux, and a strong latitudinal variation of the absorbed shortwave radiation across the surface of a sphere, the actual mean global temperature of a directionally illuminated planet is not estimable in principle from a planetary averaged radiative flux (Eq. 2) using the SB law (Eq. 1). This is because a spherical geometry violates the fundamental assumption in the SB relationship for spatial homogeneity of radiation absorption and emission.”
Let me know what you need help in understanding, barry. As far as I’m concerned, Clint is correct.
I’m not sure barry was sober when making his last comment. He appeared very incoherent.
But, since he did mention one of the specific points, “#2 Flux does NOT average”, I will respond.
A surface at 205K is emitting 100 W/m². An identical surface is at 355K is emitting 900 W/m². The average flux is 500 W/m², but that calculated average has no meaning because fluxes can not be averaged.
The average temperature of the two surfaces is 280K, resulting in an emission of 265 W/m².
Watch how barry tries to pervert this simple example of why flux cannot be averaged.
That is exactly what I thought you meant by your #2, Clint. Thanks for clarifying. Time to watch barry wriggle.
9:50 am: “The average temperature…”
Clint R: as has been pointed out many times here, temperature is an intensive property thus cannot be properly simply averaged. Demonstrating Clint R chooses not to learn from proper relevant texts.
In Clint’s example, properly accounting for area in m^2 is not evident. Properly, the 900 + 100 are incident on 2m^2 constant area surface thus 500 (or 1000/2) is ok as a meaningful answer for the correct incident area. Clint R is well known for improperly accounting for surface area.
Clint misses that energy flow rate is an extensive property thus can be properly averaged over a constant area when that area is properly accounted.
Btw, Clint’s points #1-11 11:13 am have all been disproven by proper experiment. Clint is well known in preferring incorrect assertions over proper experimental evidence.
Oh look, Ball4 has showed up. This is how the cult kids work. When one runs out of ways to pervert reality, another one shows up to take a turn.
And, as usual, Ball4 knows nothing about the issues. The surfaces mentioned were identical. That means, since temperature is an intensive property, it can be averaged.
The rest of his comment is just as incompetent/irrelevant.
Kids these days….
Clint 11:19 am, your averaging temperature remains humorously wrong. Pouring an 8oz. glass of 355K water into a frozen ocean at 205K does not make the average temperature 280K. Remembering that energy flow rate is an extensive property thus can be properly averaged will hold down the laughter at Clint’s antics.
Ball4 humorously doesn’t understand the word “identical”.
Maybe when/if he grows up?
“Energy flow rate” is power (W) and of course that can be averaged. What we’re actually talking about is whether flux (W/m^2) can be averaged. Ball4 is not even in the right ball-park, as usual. And, it’s deliberate.
Ball4 is one of the most dishonest “human beings” I have ever encountered online. Let’s just say if there was a dying baby and for some reason the only thing that could save it was Ball4 telling the truth…the kid would be done for. He’s simply a savage monster of hateful sophistry that would literally say anything to defend his pathetic religion, no matter what the cost. An abomination of human filth that is one of the only people on here that I would ever say actually deserves to be banned…and I hate the entire concept of censorship. It’s hard for me to think lower of another person than I do Ball4. A worthless, repellent c*nt.
Wriggle? You guys caught up to me.
Clint said: “Because of the non-linear nature of radiative flux, it can not be averaged.”
I said: “This is absolutely false. Flux is [linear] Clint may be mistaking the nonlinear relationship of flux to temperature.”
So what did you guys immediately respond with? The non-linear relationship of flux to temperature. Well, duh!
You quote the paper, DREMT:
“Due to a non-linear relationship between temperature and the emitted radiative bolometric flux…”
Yup. Agreed. I already said it.
The anonymous authors appear to have committed the mistake they say they are correcting for. The conventional method to get the ET of a sphere is to integrate the (yes, it’s linear) flux BEFORE introducing any non-linearity by converting to temperature. But in this paper the integrating steps each converts flux to temperature and averages temperature. Perhaps this indicates why the method hasn’t been taken up.
I note that the paper argues the GHE may provide more surface warming than 33K. I wonder how you took this, DREMT.
DREMT 4:47 pm: “What we’re actually talking about is whether flux (W/m^2) can be averaged.”
Clint 9:50 am: “The average temperature…”
So, no DREMT, Clint was discussing avg. temperature. Please do try to keep up. I’ve already pointed out when Clint R can’t ever use the correct area in m^2, then Clint’s averaging of flux is also wrong. However, many writers do use the correct area in m^2 with results agreeing with experiment unlike Clint R.
barry wriggles by pretending #2 hasn’t always involved the non-linear relationship between flux and temperature. What on Earth did you think Clint meant by “because of the non-linear nature of radiative flux, it can not be averaged”?
The paper I linked to is confusing you, barry. It actually just makes exactly the same point Clint made in his 9:50 AM comment. It’s just Clint made the point a lot more straightforwardly and concisely.
The 500 W/m^2 average of the two fluxes Clint mentions is mathematically correct, but physically meaningless. It’s physically meaningless because it no longer relates correctly to temperature via the SB Law, a law of physics. The temperature you would calculate from that average is too high, as he showed.
It is that simple principle which the authors of the paper I linked to are explaining means, “the actual mean global temperature of a directionally illuminated planet is not estimable in principle from a planetary averaged radiative flux (Eq. 2) using the SB law (Eq. 1).“
The authors conclude the “atmospheric thermal enhancement” is three times higher than previously thought. Most rational people would realise that this is a challenge to the GHE. But some, I guess, just assume “oh well, the GHE must be three times greater than we previously thought” rather than “there’s no way the GHE can account for such a large difference”. It takes all sorts, I suppose.
DREMT says,
“What on Earth did you think Clint meant by “because of the non-linear nature of radiative flux, it can not be averaged”?”
Exactly what the words say – that radiative flux is non-linear. Which is categorically false. Flux is energy per time per area, and is absolutely a linear quantity.
If Clint had said, “because of the non-linear relationship between flux and temperature, you cannot get an effective temperature average by combining temperature with flux in the calculation”, then we’d have had no issue. But no worries, I pointed that relationship out in my reply. Which I would not have done had Clint covered it in his statement.
Dividing the solar constant by 4 spreads incoming flux over the sphere, which is perfectly reasonable to do when creating an ENERGY BUDGET, as the sphere radiates over all its surface.
As long as you don’t introduce the non-linearity of the flux/temperature relationship into the energy budget before you conclude it, there’s nothing wrong with dividing and averaging flux to get an effective temperature.
Now, two separate fluxes of 500 W/m2 arriving at the same square metre of surface will give you 1000 W/m2. Flux is linear and can be summed, divided and averaged.
What would be incorrect would be to take a flux of 500 w/m2 and a flux of 1000 W/m2 hitting different halves of a surface, calculating the temperature of each half and then averaging the temperature. This would give you an effective temperature below the actual effective (average) temperature, because of the non-linear relationship of flux to temperature.
The average flux for this example is 750 W/m2, which converts to the effective (average) temp of 339 K.
This isn’t the actual temperature all over the surface, it is simply the temperature as an expression of the energy budget – the surface must radiate an average of 750 W/m2 to balance incoming.
Now convert each patch to temperature and average:
500 W/m2 = 306
400 W/m2 = 364
Tav = 335
This runs afoul of the actual energy budget, because it makes the mistake we all agree should not be made. The flux/temperature relationship is non-linear, so you can’t integrate fux by integrating temperature.
But you can absolutely sum, divide and average flux to get a sound energy budget.
“Exactly what the words say – that radiative flux is non-linear. Which is categorically false. Flux is energy per time per area, and is absolutely a linear quantity.”
So you misinterpreted Clint as saying something silly. I knew what he was getting at, from the beginning. Both because he’s argued “flux cannot be averaged” before and previously brought up the example that he did at 9:50 AM and because I don’t generally interpret people as saying silly things. I go for the more reasonable interpretation.
“As long as you don’t introduce the non-linearity of the flux/temperature relationship into the energy budget before you conclude it, there’s nothing wrong with dividing and averaging flux to get an effective temperature.”
The error in dividing and averaging flux to get an effective temperature is made clear in the paper I linked to, as has already been explained. Plus, what are you not understanding about Clint’s 9:50 AM comment?
Clint’s right, you’re wrong. End of story.
You can always tell when barry knows he’s wrong — he just starts clogging the blog with nonsense. He is so immature he can NOT understand simple statements like: “Because of the non-linear nature of radiative flux, it can not be averaged.”
It’s like Ball4 not being able to understand “identical”.
There’s no way to have an adult conversation with children this retarded.
Humorously, Clint introduced the word “identical” roughly 3 days AFTER introducing his surface problem. Fun to watch Clint have to backtrack when called out with physics errors.
Energy flow rates are extensive thus if the incident area is used properly (as they are in Clint’s originally linked diagram) then energy fluxes can be properly averaged. Clint doesn’t add the illuminated areas properly so arrives at improper conclusions.
All so typical of Clint R antics and fun to read his physics gaffes.
Wrong again, Ball4.
Here’s where I first presented the example:
“A surface at 205K is emitting 100 W/m². An identical surface is at 355K is emitting 900 W/m².”
https://www.drroyspencer.com/2025/08/uah-v6-1-global-temperature-update-for-july-2025-0-36-deg-c/#comment-1711561
You are despicably dishonest, Ball4. You’re even worse than barry, and Nate, and that is bad!
So, you’re now banned.
So, Clint said:
“A surface at 205K is emitting 100 W/m². An identical surface is at 355K is emitting 900 W/m². The average flux is 500 W/m², but that calculated average has no meaning because fluxes can not be averaged.
The average temperature of the two surfaces is 280K, resulting in an emission of 265 W/m².
Watch how barry tries to pervert this simple example of why flux cannot be averaged.”
We then did see barry try to pervert the simple example in his most recent comment. Although it’s difficult to tell because barry’s comment is so convoluted and garbled, with his counter-example he seems to be suggesting the 500 W/m^2 average flux in Clint’s example would be “correct”, and the 265 W/m^2 would be wrong! In other words, he seems to have it all exactly backwards. He doesn’t seem to understand the point of Clint’s example at all.
Again, humorously wrong, Clint R 1:58 pm. Your “consider a high emissivity thin surface” example was introduced on August 19, 7:02 am. No mention of an “identical” surface which came roughly 3 days later after Clint’s initial physics error was pointed out and Clint was forced to backtrack. Do try to keep up.
Once more, all so typical of Clint R antics and fun to read his physics gaffes.
Ball4’s “dishonesty display” continues. Clint’s August 19, 7:02 am example was illustrating a different point altogether. Thus, there was no “back-tracking”. Ball4 continues to prove me right on what I said about him.
DREMT,
“So you misinterpreted Clint as saying something silly.”
No, I took his words at face value. I don’t like to mischaracterise what others say.
“I knew what he was getting at, from the beginning”
Oh, so he didn’t say what he meant, you had to know what he was getting at.
Clint is fortunate to have an ally that knows he means something other than what he actually says.
DREMT said Clint said,
“A surface at 205K is emitting 100 W/m2. An identical surface is at 355K is emitting 900 W/m2. The average flux is 500 W/m2, but that calculated average has no meaning because fluxes can not be averaged.
The average temperature of the two surfaces is 280K, resulting in an emission of 265 W/m2.”
280K is not 265 W/m2.
It’s 348.5 W/m2
Averaging temperature may give you the average kinetic energy, but averaging temperature to establish flux commits the exact error in the quote you provided, DREMT. The flux/temperature relationship-is non-linear. You pervert the results if your calculation process mixes the two.
For an energy budget, you average fluxes, because they are linear. You can then determine an effective radiating temperature. Averaging temperatures for this purpose will give you spurious results.
Clint not only got the flux wrong for 280K, he has the concepts backwards.
Endorsing Clint’s work makes you subject to the same criticisms.
Yes, barry 6:26 am, DREMT is subject to many of the same physics errors as Clint R since DREMT 2:25 am can’t even understand Clint was 3 days later forced into backtracking from Clint’s August 19, 7:02 am “identical” point errors when they were pointed out.
Yeah, I’ve done that before. I use a spreadsheet for quick calculations. I simply entered temperature in the flux box. I try to always check my work, but often I’m laughing at the pathetic cult kids and I sometimes forget.
Spreadsheet errors are closely related to typos, which are caused by CO2. So, if you don’t like my spreadsheet errors, stop breathing….
As I said, barry…you have it backwards. Not me.
In Clint’s example, it’s the 500 W/m^2 average that is wrong. You cannot correctly convert that to a temperature value. But, that is exactly what you are claiming you can do!
“I don’t like to mischaracterise what others say.“
Then why do you do it, constantly? Certainly you do it all the time to anyone who questions the GHE.
Correcting the errors caused by CO2, here:
https://www.drroyspencer.com/2025/08/uah-v6-1-global-temperature-update-for-july-2025-0-36-deg-c/#comment-1711845
“In Clint’s example, it’s the 500 W/m^2 average that is wrong. You cannot correctly convert that to a temperature value.”
Tommyrot.
Because flux is temperature to the fourth power, the mapping of temperature to flux is non-linear. That’s why averaging temperature to derive a flux balance is the wrong thing to do.
Flux is linear – Clint is flat wrong about that. Embarrassingly wrong.
Averaging flux across a surface will give you the correct radiative flux balance across the surface. Solving then for temperature will give you the effective radiating temperature.
If you want to work out the mean molecular kinetic energy, average the temperatures.
If you want to work out a radiative energy budget, or derive an ERT, average the fluxes.
FFS, the 500 W/m^2 average in Clint R’s example is wrong, barry. It’s physically meaningless. I repeat from earlier:
“The 500 W/m^2 average of the two fluxes Clint mentions is mathematically correct, but physically meaningless. It’s physically meaningless because it no longer relates correctly to temperature via the SB Law, a law of physics. The temperature you would calculate from that average is too high, as he showed.
It is that simple principle which the authors of the paper I linked to are explaining means, “the actual mean global temperature of a directionally illuminated planet is not estimable in principle from a planetary averaged radiative flux (Eq. 2) using the SB law (Eq. 1).“”
From the paper I linked to:
“Consider two points, P1 and P2, on the surface of an ASCO located at the exact same latitude (e.g. 45°N) but at opposite longitudes so that, when P1 is fully illuminated, P2 is completely shaded and vice versa (Figure 1). If such an ASCO orbited the Sun at Earth’s distance, had a regolith of zero thermal conductivity, and were only heated by solar radiation, then the equilibrium temperature of the illuminated point would be T1 = [S o (1 – α o )cosθ/εσ]0.25 = 349.6 K assuming α o = 0.12 (a typical value for rocky surfaces), a solar incident angle θ = 45°, and ε = 1.0. The temperature of the shaded point would be T2 = 0, because it receives no radiation since cos θ < 0 and there is no heat release from the regolith at night due to zero heat storage. The mean physical temperature between the two points is simply then Tm = (T1 = T2)/2 = 174.8 K. However, if one employs the average solar flux absorbed between the two points, i.e. Sm = {[S o (1 − α o )cos θ] + 0}/2 = 423.4 W m−2 to calculate a ‘mean’ effective emission temperature, one obtains Te = [Sm/εσ]0.25 = 294.0 K. Clearly Te ≫ Tm, a result of Hölder’s inequality.“
“Because flux is temperature to the fourth power, the mapping of temperature to flux is non-linear. That’s why averaging temperature to derive a flux balance is the wrong thing to do.”
And nobody here is arguing with that.
You tell him, Nate.
Barry is telling you. But you are not listening. And keep missing the point.
Clint has been making indefensible arguments, such as
“#2 Flux does NOT average.
Because of the non-linear nature of radiative flux, it can not be averaged.”
There is nothing in that FALSE statement about temperature or the SB Law.
Flux outputs from the Earth are measured over many points by satellite, and AVERAGED.
The solar input flux and reflected flux can be measured and AVERAGED over the Earth.
To compare these averages is to obtain Earths energy balance, an important quantity.
Thus such averages are useful, not meaningless.
I have successfully made my arguments. It is done.
DREMT,
You don’t know what you are measuring.
What does temperature measure?
“Temperature is a physical property that measures the hotness or coldness of an object, representing the average kinetic energy of its constituent molecules or atoms.”
Is that radiative flux?
Nope. So when you average temperature you are measuring a different property to flux.
The authors of the paper prefer, for reasons unexplained except to assert that the average of flux and the average of temperature gives different results, to use the average of temperature to determine flux.
And they fall into exactly the non-linear trap they warn against.
Which is why this is a maverick paper with almost no support from the science community. And perhaps also why the authors’ names are fictional.
I’ll say it again, and you’ll probably ignore it again.
“If you want to work out the mean molecular kinetic energy, average the temperatures.
If you want to work out a radiative energy budget, or derive an ERT, average the fluxes.”
Now have a little think about the difference between kinetic energy and radiative energy. Perhaps you will see the light. They are different properties on different scales – and both scales are linear.
“The authors of the paper prefer, for reasons unexplained except to assert that the average of flux and the average of temperature gives different results, to use the average of temperature to determine flux.
And they fall into exactly the non-linear trap they warn against.”
Wrong, barry. They are not determining flux from the average of temperature. The paper isn’t a “quest for flux” at all. The paper is a quest for a better estimate of the Earth’s temperature in the absence of an atmosphere. They are simply pointing out, correctly, that if you average fluxes, and then try to convert that average flux value to a temperature, you get the wrong temperature value.
What do you not understand about Clint’s example? Down-thread, he made it even clearer. The 500 W/m^2 average corresponds to a temperature of 306 K. The actual average temperature is 280 K. So, the 500 W/m^2 value is physically meaningless, because it does not convert correctly to temperature any more.
“They are simply pointing out, correctly, that if you average fluxes, and then try to convert that average flux value to a temperature, you get the wrong temperature value.”
Which is what Barry stated, nothing new, not in dispute, and not the point of their paper.
DREMT,
Nothing you have brought up supports this:
“Consider a high emissivity thin surface perfectly insulated on the back and edges. If that surface receives 500 W/m², it will reach a temperature of 306K. Then if you add a second flux of 500 W/m², the temperature will not increase because the surface is already emitting 500 W/m². As I taught you earlier, a surface will not absorb a lesser flux than it is emitting. So the surface will NOT increase in temperature with two 500 W/m² fluxes, but will increase in temperature with one 1000 W/m² flux.”
This IMO is indefensible nonsense. But please go ahead and try to explain it.
Wrong, Nate.
It was not what barry stated, he did dispute it, it was something new (to barry) and I never said it was the main point of their paper.
Then explain it. Or point out a comment where you explain it.
If you cant then you cant. No excuses.
Barry said:”Because flux is temperature to the fourth power, the mapping of temperature to flux is non-linear. That’s why averaging temperature to derive a flux balance is the wrong thing to do.”
“Nothing you have brought up supports this…”
Nor did I say it did. As far as I’m concerned that’s a separate point altogether. Stop changing the subject.
“Barry said:”Because flux is temperature to the fourth power, the mapping of temperature to flux is non-linear. That’s why averaging temperature to derive a flux balance is the wrong thing to do.””
Exactly. Yet this is what you claimed he had stated:
“They are simply pointing out, correctly, that if you average fluxes, and then try to convert that average flux value to a temperature, you get the wrong temperature value.”
Can’t you tell the difference?
“Nothing you have brought up supports this…”
“Nor did I say it did. As far as I’m concerned that’s a separate point altogether. Stop changing the subject.”
Well that was the MAIN point Clint was trying to make. Which, you now say, you cannot defend. Even though when I stated it was indefensible, you said ‘Wrong Nate’.
The only other point you made was one not in dispute by anyone here:
That the relationship between flux and temperature is nonlinear, and therefore averages may not obey that relationship.
The other point you tried to make about the average flux not being’physically meaningful’ was debunked.
Eg.
https://www.drroyspencer.com/2025/08/uah-v6-1-global-temperature-update-for-july-2025-0-36-deg-c/#comment-1712137
For science it is meaningful, just as many other averages are.
https://www.drroyspencer.com/2025/08/uah-v6-1-global-temperature-update-for-july-2025-0-36-deg-c/#comment-1712723
“And no, you haven’t “debunked” a thing. You just think you have. There is really no point talking to you on any subject”
Translation: your claim was debunked and you have absolutely no rebuttal to it.
We understand how you operate.
It is laughable that you try to mansplain to scientists that a quantity that they regularly use and find meaningful, is somehow ‘meaningless’.
Stop being so dum.
Nate, in your supposed “debunking” you:
1) Switched from discussing the energy budget diagram, the focus of Clint’s critique, to discussing EEI – is this a tacit admission that the energy budget diagram is indeed worthless?
2) Claimed that with the EEI the incoming and outgoing fluxes can be directly measured to determine it, a claim that no other scientist makes. It’s in fact estimated using a wide range of different techniques and data sources.
“Oh well”.
Do you really not understand that EEI is about the energy budget at the TOA?
Clearly the information provided by averaging flux is ‘meaningless’ to you, but not to science.
“Claimed that with the EEI the incoming and outgoing fluxes can be directly measured to determine it, a claim that no other scientist makes. It’s in fact estimated using a wide range of different techniques and data sources.
Measurements of averge flux are done in different ways, and with differing uncertainty. None are worthless.
Still responding? Weird.
Still no point?
When you average fluxes, and convert that average figure to a temperature value, you get the “wrong temperature value”. Yet, flux is related to temperature by a law of physics, the SB Law. That means that the average flux value is “physically meaningless”.
The point is not hard to understand. You just resist it with every fibre of your being. You argue that since these average flux values are used by scientists, they must not be meaningless. But, what it actually means is that scientists are using physically meaningless values.
“Oh well”.
12:13 pm: “…scientists are using physically meaningless values.”
No. They are properly averaging an extensive property (in Clint’s link elsewhere): energy flow rate – which is physically meaningful.
Humorously, DREMT chooses to remain wrong about these physics.
“When you average fluxes, and convert that average figure to a temperature value, you get the “wrong temperature value”. Yet, flux is related to temperature by a law of physics, the SB Law.”
Yep as noted several times, that is well known, not in dispute.
And yet average flux hitting the Earth and emitted by the Earth are extremely useful to climate science. For one thing, it is easily converted to total energy input and output from the Earth. Use of one is just as good as the other, but units are easier to use with flux, eg an imbalance of 0.8 W/m2 is easier to grasp and compare to theory.
“That means that the average flux value
is “physically meaningless”.”
Obviously not. Now stop mansplaing.
“Yep as noted several times, that is well known, not in dispute.“
Actually, Nate, it was in dispute, by barry, e.g. here:
https://www.drroyspencer.com/2025/08/uah-v6-1-global-temperature-update-for-july-2025-0-36-deg-c/#comment-1711894
“Obviously not”
That’s not an argument, Nate.
“…energy flow rate – which is physically meaningful.”
“Energy flow rate” is power (W). Not irradiance or radiant exitance (W/m^2), or “flux”, which is what we’re actually talking about.
Not the first time I’ve corrected you on that, Ball4. You can’t learn, but you keep trying to “teach”.
You’re just another obsessive stalker, like Nate. Apparently, I live rent free in both of your heads. A comfortable place, lots of empty space.
Well, DREMT 4:07 pm finally gets something physically & meaningfully right! Good for DREMT, yes energy flow rate is physically meaningful extensive property power which through a constant measured area (in m^2) becomes physically meaningful energy flux as shown in Clint’s linked graphic.
Nice going DREMT. I see DREMT CAN sometimes get the physics right. Do try to keep it that way. Now if only Clint R will agree with DREMT about power being an extensive property, then victory would be at hand!
No, Ball4. It’s not the idea of dividing power by area to create a flux value that’s being challenged. It’s the idea of summing different flux values and averaging them.
“Try to keep up”.
“, Nate, it was in dispute, by barry, e.g. here:”
Nope. He has it all correct. You are perhaps confused by his terminology, ie ‘effective radiating temperature’. Look it up.
No, Nate. No confusion, and barry disputed it in the comment I linked to, among other places. Of course you would pretend otherwise.
“It’s not the idea of dividing power by area to create a flux value that’s being challenged. It’s the idea of summing different flux values and averaging them.”
Not an actual problem here:
“Measuring the average flux hitting the Earth and emitted by the Earth are extremely useful to climate science. For one thing, it is easily converted to total energy input and output from the Earth. Use of one is just as good as the other”
Because the fixed total area of the Earth is used in this analysis.
[DREMT] In Clint’s example, it’s the 500 W/m^2 average that is wrong. You cannot correctly convert that to a temperature value.
[BARRY] Tommyrot.
Certainly seems like barry was disputing it, Nate.
DREMT,
These are the kind of silly Clint statements that started the pushback from Barry and others like me.
“If that surface receives 500 W/m², it will reach a temperature of 306K. Then if you add a second flux of 500 W/m², the temperature will not increase because the surface is already emitting 500 W/m². As I taught you earlier, a surface will not absorb a lesser flux than it is emitting”
This has nothing whatsoever to do with Holder’s inequality, which Barry never disputed.
So it is a puzzle why you even needed to jump to his defense.
I explained in a comment already exactly why I got involved. See if you can find it.
This is Clints attempt to rebut Barry.
“Sorry barry, but you’re confusing “climate science” physics with REAL physics. Two 500 W/m² fluxes don’t have the same effect on a surface as one 1000 W/m² flux. Fluxes can’t be divided.
The rest of your blah-blah is just as bad.
But you managed to get one thing correct — “The Earth is not flat.” Very good”
So this clealy illustrates his erroneous thinking. Yet you still jump in to try to rationalize his irrational thinking.
Nate continues to try and bait me into discussing something else.
Nothing to say then about his main points, which are his indefensible Bailey. You retreat to and dedend his Motte, Holders inequality, which nobody here disputes.
Its a tactic which weve seen you employ so many times.
Nobody buys it.
The false accusations continue. Clint’s comments there were about his point #4. Not what I was discussing. barry and I were discussing #2. I don’t have to defend every statement Clint makes. There are plenty of things I don’t agree with him on. But, barry was misrepresenting him on #2 whilst also condescending (and I’m pretty sure barry had no idea about Holder’s inequality until I linked to that paper). It was a combination of things I found irritating so I stepped in. As I have every right to. If you don’t want me involved in future, then you guys need to stop misrepresenting people.
#3 not #4.
barry, try not to use technical words such as “cosine” “trigonometry” or “integration” when dealing with CR. These concepts are well beyond him.
studentb, please stop trolling.
Obviously not.
Obviously not, what? You’re obviously not capable of posting your comments in the right place. That much is true.
The arguments I’ve already made refute your responses, Nate. But, once again, you believe that if you repeat refuted arguments again and again until you get the last word, you “win”!
Obviously you have not. A successful argument would convince someone.
But rather than being convinced by your argument, people have pointed out the obvious flaws in it, and, as usual, you just declare your argument successful regardless.
It is quite pathetic.
Lol. So Nate believes that unless barry admits that he’s wrong, and thus accepts that he’s been “convinced” by my argument, that means barry is right! Amazing. No, Nate, barry never concedes that he’s wrong, but that does not mean that he’s right.
No, you think that when you have convinced no one but yourself of the correctness of your argument, then your argument was successful.
Thats is quite pathetic.
Wrong, Nate.
You obviously use a different criteria for judging success of your argument than anyone else involved in a debate.
How do you decide if it was successful then?
When I wrote, “wrong, Nate” your 9:53 AM comment wasn’t even visible on my screen at the time. But, nothing ever stops you from finding a way to misrepresent me.
Sorry, but barry and I have been discussing Clint’s point #2 from his list. If you can’t follow the discussion, please butt out of it.
And no, you haven’t “debunked” a thing. You just think you have. There is really no point talking to you on any subject. You don’t listen, aren’t even really interested in understanding differing views, constantly misrepresent and falsely accuse, never think outside your bubble, and just silently drop things without ever conceding the issue. And, barry is just as bad.
5:29 pm: … which is no problem when done properly. The problem is that Clint R isn’t routinely able to sum different extensive energy flow rate flux values and properly average them physically meaningfully as is done in the graphic that Clint linked.
Keep up the good work though since even DREMT can occasionally get the physics meaningfully correct such as when properly identifying extensive energy flow rate as power.
Ball4’s “dishonesty display” continues, as he dazzles everyone with the filth he’s prepared to wallow in.
Left out the uncomfortable parts where Barry is making it abundantly clear he understands Holders inequality
“Because flux is temperature to the fourth power, the mapping of temperature to flux is non-linear. That’s why averaging temperature to derive a flux balance is the wrong thing to do.”
While pointing out exactly what he thinks is wrong with Clint’s crap.
“Flux is linear – Clint is flat wrong about that. Embarrassingly wrong.”
Look this is all besides the point.
Make whatever point you want about the science and stop tro.lling people.
Do both of you actually believe Clint thinks flux is not linear!?
Jesus wept. Give the guy some credit.
SOLAR MINIMUM UPDATE
Tom Alexandrovich, top Israeli cyber warfare official under Netanyahu, arrested in FBI child predator sting operation for luring minor on internet for sex acts, allowed to board plane & flee U.S. despite no diplomatic immunity.
https://www.kold.com/2025/08/15/8-arrested-las-vegas-area-child-sex-sting/
The Epstein Party wins again!
Israel announces mass relocation of Palestinians to Southern Gaza ahead of new offensive
https://www.foxnews.com/world/israel-announces-mass-relocation-palestinians-southern-gaza-ahead-new-offensive
Sham the Arab states all refused to take them decades ago,they refused then and refuse today, even though some of them were part of the area known as Palestine, why does Jordan refuse, after all it took a large part of Palestine.
It is hard to blame neighboring Arab countries for refusing to absorb another influx due to their potential to destabilize their countries.
That is the elephant in the room with Netanyahu’s plan: he says Israel will seize temporarily to dismantle Hamas and then hand Gaza to some Arab authority.
But what if no Arab state steps up? A power vacuum risks something worse than Hamas taking over, while Israel either stays trapped in permanent occupation or tries to force Gazans out as in 1948 (Nakba).
I would like to congratulate Donald Trump for relenting on his ambition for an unconditional ceasefire in Ukraine, instead deferring to Putin’s conditions after obviously fruitful talks in Anchorage.
His critics paint Trump as an egotistical tyrant. They should see now that he listens and yields when it is necessary.
I agree. Words cannot convey my admiration.
He deserves not one, but 2 Nobel Peace Prizes for ending the wars in Gaza and Ukraine (possibly, at some point in the future).
And one for Economics for his amazingly clever tariff policies.
And one for Literature – since although he does not read books his posts on social media read like poetry.
Maybe one for Physics – he knows so much about climate change, whales and wind farms, and for pointing out how bleach cures Covid.
one of the great lessons of life, is that even a fool is right sometimes, Winston Churchill .
Frogs usually refer to comments like Barry’s above as ‘au deuxième degré’.
Apparently, studentb perfectly understood the situation :–)
People who ignore history…
President Macron paid Putin a visit at the Kremlin in the very beginning. Putin just laughed. Then Biden and NATO sat back waiting for Kiev to fall in a few days. That was followed by a series of soft moves where people debated and delayed whether we could send tanks, missiles, or airplanes because they were afraid Putin might get angry. Progress has been slow and largely ineffective.
Trump decided to do the only intelligent thing possible. He decided to talk directly to Putin. Trump knows the guy is pure evil, dishonest to the core, and intent on taking Ukraine no matter how long it takes. He does get a daily intelligence briefing.
Now the media is hysterical trying to find something — anything — to criticize the only advancement toward peace that anyone has achieved. There is talk of a meeting between Zelenskyy (sic) and Putin one-on-one with a followup three-way with Trump.
More important, the Europeans have finally figured out that throwing insults at Putin wasn’t getting anywhere. Eventually the liberal media, their partners in the Democrat Party, and the rest of you fools will get the picture. No, the EU countries are not “shielding Zelenskyy from Trump”. They are supporting Trump, and they have coached Zelenskyy how to behave himself in front of the only person who has any chance of ending the war any time soon. There is a unified coalition behind the leadership of Donald Trump that is finally being effective. There is talk of “Article 5 type” security guarantees As much as this pains me to state and many of you to accept, that is the reality.
https://www.cbsnews.com/live-updates/trump-zelenskyy-meeting-white-house-ukraine/
Putin flatters Trump and Trump gets nothing from Russia. Trump has been played ever since he took on the mission. He has been the Kremlin’s patsy since before he castigated Zelenski in the White House. He has won zero concessions from Russia, and wound up rolling out the red carpet and failing to get what he wanted. Putin got the photos and the credibility he desired.
The fantasies the right has about Trump are pure invention, fashioned in an empty space where no actual substance lies. Trump’s ‘genius’ is something hidden from view, a brilliantly clandestine game of chess that will be revealed in due course.
And as for not bad-mouthing Putin – Trump did that the last time he interacted with the dictator of Russia, early July, when he realized Putin was full of it. How quickly people forget.
Yep. While in many other areas Trump is a tough negotiator. In this instance many have noted how not tough he has been with Putin.
Giving away the chief leverage points, NATO, Ukraine territory, before the start of negotiations…and yet no resolution.
From the Internet Time Machine:
Why not this one?
https://www.bloomberg.com/news/newsletters/2024-04-16/fda-deletes-viral-ivermectin-not-a-horse-tweet-opens-door-for-misinformation
It’s a new week.
How will Trump embarrass America today?
Newsmax reaches $67M settlement with Dominion Voting Systems in defamation case.
Conservative-leaning cable news channel Newsmax agreed to pay Dominion Voting Systems $67 million to settle a defamation lawsuit over false election claims that the 2020 election was rigged.
Earlier this year, Fox News reached a $787 million settlement with Dominion over similar claims. Newsmax previously settled with Smartmatic, another voting machine company, over defamation claims in 2024.
Barry says:
” ”I am talking about changes in earth’s speed through space.”
So I checked that out, and there is no research suggesting a 60-year cycle in the Earth’s velocity.”
——————–
So how do you explain significant perturbations that result in eccentricity changes Barry? The study you are discussing above has that illustrated. Are you in denial of this basic concept expressed by Milankovic, Berger, Hays, NASA etc?
Please explain how ellipticity varies and what the mechanism of it. I provided you with references that show the gravitational pull of the planets, primarily Jupiter and Saturn change the earth’s eccentricity.
https://www.academia.edu/117506080/Possible_Contribution_of_the_Gravitational_Influence_of_Jupiter_and_Saturn_to_the_60_Year_Variation_in_Global_Temperature
Do you recall that study? You are the one who found it. What does an object do when exposed to gravity? You really show read 1) the story of how Neptune was discovered. It was noticed that Uranus was not showing up in the correct location in accordance to schedules initially computed. They calculated the gravitational forces necessary to make for the perturbation and used those calculations to plot likely sources in the sky that would cause a change in speed of Uranus. This was in the middle of the 19th century and even then it was well understood and now you are playing dumb?
Barry wrongly claims:
”But it seems that this variation is not part of a 60-year cycle that can be matched to the 60-year global temperature oscillation. Or at least, you’ve provided no reference saying so.”
Well you did! see above.
And I did too: https://skyandtelescope.org/astronomy-news/the-400-year-rhythm-of-great-conjunctions/#google_vignette
and here: https://scienceofclimatechange.org/wp-content/uploads/Sir-2024-Prag-60yr-Jupiter-Earth.pdf
Barry wrongly claims:
”So the only reference you’ve provided for a 60-year perturbation of Earth’s celestial mechanics is about LOD.”
thats a lie. LOD is the second thing mentioned in the study
The first was eccentricity variation by gravity of the other planets.
LOD doesn’t even make it to the conclusion but is used as evidence of the change in orbital speed via transfer of angular momentum. So all you are demonstrating here is an inability to understand these papers.
Thus there is no sense in going through the rest of your post as you keep improperly harping on the relationship of LOD changes to changes in orbital angular momentum.
“I provided you with references that show the gravitational pull of the planets, primarily Jupiter and Saturn change the earth’s eccentricity.”
Yep, over 10’s to 100’s of thousands of years.
To suggest that therefore it happens over 60 years, is not supported by any facts.
Fact is Nate we can see the effects in the modern temperature record and in the proxy records.
You are just in denial of those effects and you have no explanation for them.
Hays et al tells us you are wrong about the linear nature of this. It runs in good size bumps of many sizes depending upon infinite alignments of the planets on a regular schedule probably spanning a half million years or more.
The linear axial cycles that span 10’s of thousands of years only makes up about 40% of the effect per Hays et al.
What source do you have that provides a mechanism for this that is linear in nature for a single 100,000 year cycle that is caused by the gravity of the 8 planets? We know that co2 models can’t explain the climate variations between 1900 and 1980 and I predict that within the next 35 years there will also be a lack of explanation for the subsequent 80 years. How much longer do you want to be responsible for slowing down the progress of science Nate?
Bill,
barry: “So I checked that out, and there is no research suggesting a 60-year cycle in the Earth’s velocity.”
bill: “So how do you explain significant perturbations that result in eccentricity changes Barry? The study you are discussing above has that illustrated. Are you in denial of this basic concept expressed by Milankovic, Berger, Hays, NASA etc?”
None of those are of a 60-year cycle.
I have been querying the 60-year orbital/rotational cycle in terms of climate. I already said many times that the multi-millennial orbital dynamics and climate are well founded.
barry: “So the only reference you’ve provided for a 60-year perturbation of Earth’s celestial mechanics is about LOD.”
bill: “thats a lie. LOD is the second thing mentioned in the study”
LOD is the only 60-year cycle mentioned in the study. The study mentions other perturbations, but not on the 60-year cycle.
It is also the one and only perturbation that this study connects to the 60-year climate oscillation.
I am talking about the celestial mechanics supposedly linked to the 60-year climate cycle. I am talking about the connection to the 60-year climate cycle. I have always been speaking about the celestial mechanics connection to the 60-year climate cycle.
Is this yet clear to you?
You complained that this connection is buried by mainstream climate science., So I checked it out. I found research on it.
I found research on this supposed connection to the 60-year climate cycle, and concluded that it was not ‘buried’, but that the connection isn’t there. LOD doesn’t work.
If you can point specifically to another 60-year cycle in Earth’s celestial mechanics that I can investigate in relation to climate, or some other 60-year cycle generated by other planets that could explain 60-year climate cycles, please do so. LOD is the only 60-year cycle from the links you gave.
I am well aware you have provided information on different cycle lengths, but the 60-year correlation is the one I have focussed on.
60-year cycle. Shall we investigate this just now, sort it out, and then look at other cycles?
Let’s unbury this particular correlation, shall we?
barry says:
”barry: “So I checked that out, and there is no research suggesting a 60-year cycle in the Earth’s velocity.”
bill: “expressed by Milankovic, Berger, Hays, NASA etc?”
None of those are of a 60-year cycle.”
——————
they are all about orbit perturbations by the other planets, Jupiter and Saturn is by far the most powerful combination and Kepler long ago described the slowly rotating 60 year cycle of these two planets that takes 900 years to full rotate through the sky.
What more do you need? For today’s corrupt institutions to take off their horse blinders?
xxxxxxxxxxxxxxxxxxxxxxxxx
barry says:
I have been querying the 60-year orbital/rotational cycle in terms of climate. I already said many times that the multi-millennial orbital dynamics and climate are well founded.
————–
Yes likely well founded but practically entirely undescribed. So what you left out of your ”well founded” claim is exactly what is it built on top of? You should know that via Berger and Hayes. But you choose to ignore it and you haven’t given a reason why nor acknowledged exactly what the building blocks are that created you belief in the foundation. Like who cares if their is any rebar in the foundation huh? We will be just fine as long as we don’t get hit by a comet, asteroid, or god forbid another moon or planet.
xxxxxxxxxxxxxxxxxxxxxxx
Barry says:
”LOD is the only 60-year cycle mentioned in the study. The study mentions other perturbations, but not on the 60-year cycle.”
BS the graphic that creates the correlation isn’t LOD its Jupiter’s orbit perturbations estimated
———————
No its not. You are completely ignoring the conclusion of the paper.
”5. Conclusions
We present a causal chain that links a 60-year period of Jupiter’s orbital eccentricity to a 60-year period of climate change:
1) 60-year cyclic changes in the eccentricity of Jupiter’s orbit are the main cause of changes in the Earth’s orbital rate.
2) Changes in the Earth’s orbital rate cause climate changes with a period of about 60 years.”
Its says zero about LOD itself creating more sunlight for earth.
Barry claims:
”I found research on this supposed connection to the 60-year climate cycle, and concluded that it was not ‘buried’, but that the connection isn’t there. LOD doesn’t work.”
Sure the methodology you used isn’t anything proposed or calculated by the paper either. So why are you trying to do that?
Barry says:
”If you can point specifically to another 60-year cycle in Earth’s celestial mechanics.”
There is only one and you can’t just calculate sunlight input change straight up from LOD like you are trying to do. All the author has done is show a correlation to Jupiter’s orbital perturbations and earth’s LOD that has a pattern over a short period of time to ocean oscillations which also correlate to climate change. Doing that you can tease out that the major cycle is 60 years even with influences from cycles of other lengths forced on the earth by primarily the other gas giants.
barry: “If you can point specifically to another 60-year cycle in Earth’s celestial mechanics.”
“There is only one…”
Well, I’m glad we are agreed on that.
“… and you can’t just calculate sunlight input change straight up from LOD like you are trying to do.”
I didn’t calculate it. I simply reported from the references in this paper that the amplitude of change is several milliseconds. I also learned that the change is diurnally symmetrical -nights and days both equally are lengthened/shortened by several milliseconds over the cycle.
“All the author has done is show a correlation to Jupiter’s orbital perturbations and earth’s LOD that has a pattern over a short period of time to ocean oscillations which also correlate to climate change. Doing that you can tease out that the major cycle is 60 years even with influences from cycles of other lengths forced on the earth by primarily the other gas giants.”
Yes, all the author has done is show a correlation.
You have said that the climate possibilities of such perturbations have been buried.
So I dug into the ground to unearth some facts on this, based on the paper you linked, with the graph of the 60-year climate cycle oscillation. My question going in was – “what is the physical mechanism linking this planetary perturbation with global climate. The answer was LOD.
So I checked out what the 60-year LOD changes actually are, and whether this could have a noticeable effect.
They don’t.
So, we agree that the only 60-year cycle celestial change to Earth’s mechanics is the rotation speed changes. I think it’s pretty clear that LOD changes of a few milliseconds can’t account for the global temperature changes they correlate with.
Far as I’m concerned this concludes the investigation into the 60-year orbital perturbations on Earth’s climate, with a negative result.
If you want to posit other sub-millennial celestial cycles cycles (ie, aside from Milankovitch) that have an influence on Earth’s climate, go right ahead. We can check correlation and causation.
You think this stuff is buried? Well, spades out, let’s exhume these matters.
barry says:
”Yes, all the author has done is show a correlation.”
We agree! Correlations as important as this, being a better correlation than CO2 should definitely be modeled and investigated.
Barry says:
I think it’s pretty clear that LOD changes of a few milliseconds can’t account for the global temperature changes they correlate with.
They don’t.
———————
You need to read with better comprehension Barry. The author does not make the claim you claim he does.
LOD is just another result of the pull of gravity by the major outer planets. Climate change is just another result of orbit perturbations forced by gravity.
The LOD effect is interesting because it demonstrates a significant effect on tides. Namely enough of an effect to measurably change the rotation rate of earth.
global temperature changes just happen to occur simultaneously in time with the LOD changes. the Author here merely points out that the AMO has long been thought to have an effect on the multi-decadal climate cycles seen in time with the AMO and PDO.
So regardless of how much warming might be caused by ocean oscillations or by a longer time lingering in the southern summer; the fact is the current warming from 1980 is in time with planetary motions and as the author says also is in time with ocean oscillations and the instrument temperature record.
LOD changes are also occurring because of the tidal effects of the outer planets, lifting oceans and continents slightly to affect the earth’s rotational angular momentum.
barry says:
So, we agree that the only 60-year cycle celestial change to Earth’s mechanics is the rotation speed changes. I think it’s pretty clear that LOD changes of a few milliseconds can’t account for the global temperature changes they correlate with.
———————
No we only agree that the outer planets via lifting the oceans and the continents will change the earth’s rotational angular momentum.
However it may have effects on the distribution of heat in the earth system which itself could provide an explanation for the warming cycle fully in the 20th century and be part of the next cycle.
What we apparently disagree on is that gravity can also at the same time cause the earth to accelerate or decelerate in discreet zones of its orbit (i.e. not perpendicular to the pull of gravity of the large planets.) Why you are in such adamant disagreement with Newton’s Laws of Gravity is beyond me.
“You need to read with better comprehension Barry. The author does not make the claim you claim he does.”
From the abstract:
“The 60-year cycle of eccentricity of Jupiter’s orbit is shown to be closely related to the 60-year cycle of Earth’s climate. Changes in Jupiter’s orbit affect the Earth’s rotation rate. The following phenomena have been shown to be related to these changes: the 1992 El Chicon eruption, the 1991 Pinatubo eruption, the occurrence of strong earthquakes in the period 1900–2022, the AMO index, low flows in the period 1920–2020 on the Punkva River in the Moravian Karst, precipitation extremes in the Czech Republic after 1995, the catastrophic floods of 2002 in Central Europe, and the unusually long drought of 2014–2019 in Central Europe.”
https://scienceofclimatechange.org/wp-content/uploads/Sir-2024-Prag-60yr-Jupiter-Earth.pdf
Wherever a 60-year period is mentioned with respect to Earth’s celestial mechanics in that paper, it is only WRT its spin rate.
Which I thought you understood when you replied to me:
barry: “If you can point specifically to another 60-year cycle in Earth’s celestial mechanics.”
bill: “There is only one…”
You wrote: “What we apparently disagree on is that gravity can also at the same time cause the earth to accelerate or decelerate in discreet zones of its orbit”
No, we don’t.
You mistake my sharp focus on the 60-year cycle as a rejection for perturbations on different scales. If we are to examine claims, I prefer to address them one by one. It appears you prefer to address things severally, without lasering in on each claim.
I am willing to methodically go through each thing you think is “buried” by mainstream climate science on celestial mechanics influencing Earth’s climate. To do that properly I need to see a celestial cycle linked to Earth’s climate, and then to understand the linking mechanism to move the study from pure correlation to a physical basis. I’ve done that with the 60-year cycle from that paper. What next?
Barry you keep trying to argue that changes to LOD doesn’t explain the 60 year patterns seen in the temperature record.
We agree on that yet you keep trying to argue it and claim that one of the studies I provided for you makes that argument.
You then provided a quote from the article and that quote doesn’t support what you are claiming that the study claims.
So that being done we can talk about the fact that the earth does warm and cool naturally and that that natural climate change is connected/correlated to the location of planets in the sky at given times and their orbit rotation rates.
And whether you agree that these motions should be modeled to estimate how much or less solar exposure is affected and what kinds of tidal flows they create on the surface of that planet (which which apparently is adequately sufficient to change LOD meaning that you indeed have tidal flows that creates some degree of climate change just from the flow change. Enough apparently to be an explanation for changes to the AMO, you know the one that you guys told us is a sufficient flow that could cause New York to freeze solid into a block of ice should it change via warming from CO2)
“And whether you agree that these motions should be modeled to estimate how much or less solar exposure is affected and what kinds of tidal flows they create on the surface of that planet (which which apparently is adequately sufficient to change LOD meaning that you indeed have tidal flows that creates some degree of climate change just from the flow change. Enough apparently to be an explanation for changes to the AMO”
“Tidal” activity in that paper refers to the tides of gravity.
You are again suggesting that the correlation is enough to explain changes to the AMO. Correlation is not causation is not just a saying, it is a caution against the peril of pattern matching without establishing a causal chain.
Between these two comment in your post:
“Barry you keep trying to argue that changes to LOD doesn’t explain the 60 year patterns seen in the temperature record.
We agree on that”
And:
“which apparently is adequately sufficient to change LOD meaning that you indeed have tidal flows that creates some degree of climate change just from the flow change
You seem to have contradictory opinions on whether the 60-year LOD cycle is sufficient to cause climate change of the same periodicity.
I am satisfied that a change of a few milliseconds of sunlight/not sunlight, equally for day and night is insufficient to cause a noticeable climate change.
So if you have some other linking mechanism from gravitational effects that correlates with global climate change, I’d be happy to investigate it. But so far nothing as concrete as the LOD correlation has come up. Looks to me like that won’t happen. I can’t investigate generalisations. I need a specific thesis – like the LOD thesis from that paper. Which has not been buried but has indeed been investigated, cf the research paper I provided above.
barry says:
” ”Tidal” activity in that paper refers to the tides of gravity.
————-
Is there any other? boxes of laundry detergent maybe?
barry says:
”You are again suggesting that the correlation is enough to explain changes to the AMO. Correlation is not causation is not just a saying, it is a caution against the peril of pattern matching without establishing a causal chain.”
Huh? Tides move huge amounts of water!! The only person who would question that has to be a landlubber.
barry says:
Between these two comment in your post:
”Barry you keep trying to argue that changes to LOD doesn’t explain the 60 year patterns seen in the temperature record.
We agree on that”
And:
”which apparently is adequately sufficient to change LOD meaning that you indeed have tidal flows that creates some degree of climate change just from the flow change.”
You seem to have contradictory opinions on whether the 60-year LOD cycle is sufficient to cause climate change of the same periodicity.”
Nothing contradictory at all because I didn’t say LOD caused climate change. I said in other parts of my post that gravity causes tides and the tides causes measurable change to LOD. The tides are also implicated in multi-decadal climate change. Do I have to go find references for you on that too? The key chart compares the perturbations of Jupiter’s orbit (which indicates that the other 3 gas giants alter it enough such that it correlates to the AMO.
You are very noticeably trying to play horseblinder science by ignoring your own references you have provided and by ignoring Hays et al and are obfuscating about one paper that shows a correlation of planet motions to climate change. That same thing, the 4 gas giants, also causes changes to LOD.
I am not claiming the reverse of that and none of the papers you have claims that LOD causes climate change either. So its beyond bizarre why you are stuck on this non-point and making ridiculous claims about it.
Barry says:
”So if you have some other linking mechanism from gravitational effects that correlates with global climate change, I’d be happy to investigate it.”
Good your beyond believing one of the papers I gave you claims LOD changes is the cause of the natural climate change we see in the instrument record and ice core proxies.
Investigate the fact that the motion of the 4 gas giants changes the speed of earth within portions of the orbit and the US Naval Observatory data that indicates the earth spent 5 more days in the half of the orbit that would be warmer than the other half. Or heck I could care less if you determine that its the moon’s gravity doing that. . .either way its natural climate change.
“I am not claiming the reverse of that and none of the papers you have claims that LOD causes climate change either. So its beyond bizarre why you are stuck on this non-point and making ridiculous claims about it.”
Because it is the only concrete claim I can test. Everything else is vague. Give me a cycle that has an actual effect on Earth we can observe and measure, then a correlation to climate, and the linking mechanism. Then I have a thesis I can test.
You can tell me that Uranus has a 60-year cycle, and it correlates with the Earth’s 60-year climate pattern. But I can’t rest the theory until I have the third component – how does Urnaus’ 60-year cycle affect Earth dynamics that would impinge on global temperature, and where is the observational data for that?
“Investigate the fact that the motion of the 4 gas giants changes the speed of earth within portions of the orbit and the US Naval Observatory data that indicates the earth spent 5 more days in the half of the orbit that would be warmer than the other half.”
Give me a link to this. I can’t test that information. What period? This isn’t the 60-year cycle, it is some other. So what evidence is there of correlation to global climate?
Bill says: ”Investigate the fact that the motion of the 4 gas giants changes the speed of earth within portions of the orbit and the US Naval Observatory data that indicates the earth spent 5 more days in the half of the orbit that would be warmer than the other half.”
Barry says: ”Give me a link to this. I can’t test that information. What period? This isn’t the 60-year cycle, it is some other. So what evidence is there of correlation to global climate?”
Well you were able to easily calculate LOD effects. Can you do the same for orbit effects?
Here is a link to work with. As to correlating it to a cycle like AMO or the instrument temperature record you need to pick dates on those cycles to correlate with.
I picked, among others, the instrument temperature record nadir and zenith dates of 1980 and 2023, respectively, to measure the 5 day differential for sunlight exposure at current stated differences in length for aphelion and perihelion.
I found a significant difference in sunlight reaching the earth system. . .unlike LOD. Logically the effect would seem to potentially be greater by the gravity of the planets actually changing the length of aphelion and perihelion from the mean estimated value passed around.
I haven’t checked for the cycle but it seemed adequate to confirm a mechanism for temperature change over that period of time recognizing that these planets are only occasionally in optimum locations in the sky to affect our orbit with the rest of the time passed with lesser anomalies.
Things like that last item suggests a strong need to fully model the solar system with a consistent measure of distances and orbit perturbations to lock it all in. . .as suggested by Hays et al 1976.
https://aa.usno.navy.mil/data/Earth_Seasons
[Trump from the Oval Office] “When you go to a voting booth, and you do it the right way, and you go to a state that runs it properly, you go in — they even asked me, they asked me for my license plate. I said, ‘I don’t know if I have it.’ They said, ‘Sir, you have to have it.’ I was very impressed actually.”
Fact Check:
1/ They don’t ask for a license plate.
2/ Convicted felons can’t vote.
3/ Days without Trump nationally and internationally embarrassing our country: Zero.
This claim was made in multiple social media posts identical to the one here from August 18, 2025: https://archive.ph/vVpVm
Fact check:
No, that’s not true: Earth’s distance from the Sun changes daily and at aphelion, the Earth’s distance from the Sun is only about 3% more than the average distance. Other factors have a greater impact on temperature, including the atmosphere’s ability to slow fluctuations in heat and the 24-degree tilt in Earth’s axis, which determines the duration and intensity of sunlight striking the planet.
You think that thermal inertia is irrelevant to ice sheet melt.
From the document Ark cited:
https://library.edf.org/AssetLink/0kdlw6oq5v8hsvj152eqx01b0qn74uuq.pdf
“Dr. Christy is well known for his questioning of established, peer-reviewed climate science and raising doubts about the extent to which human activity has caused global warming.11 He has been linked in the past to the Heartland Institute, an advocacy group that frequently questions the scientific consensus on climate change.”
The word ‘linked to’ is vague. Its meaning can cover everything from a single speaking appearance to long term organizational work. In any case, it only functions rhetorically as a credibility attack rather than a substantive critique of Christy’s contributions in the DOE report.
Any Climateball player worth their salt knows that JC wrote very little of the report. Just as they know that his tie with Heartland is as strong as Roy’s if not stronger:
https://heartland.org/?s=john+christy
The steps of the contrarian tango (Pure Denial, Sammich Request, Saying Stuff, and Special Pleading) form a compact system for not carrying one’s weight on the Climateball field.
I repeat what I wrote a week ago.
A propos
https://scienceofclimatechange.org/wp-content/uploads/Sir-2024-Prag-60yr-Jupiter-Earth.pdf
” The Climate Intelligence Foundation (CLINTEL for short) is a Dutch foundation that engages in climate science denial. The organization, which fights against climate protection, is considered the continental European counterpart to the British Global Warming Policy Foundation. According to its own statements, it was founded by science journalist Marcel Crok and geoscientist Guus Berkhout, who began his career at the oil company Royal Dutch Shell.
Clintel maintains close ties to other climate denial organizations such as the US-based Heartland Institute, the oil-industry-funded Friends of Science, the European Climate Realist Network, and many well-known climate skeptics.
The Climate Intelligence Foundation became known for its spearheaded declaration “There is no Climate Emergency,” in which, according to Clintel, several hundred scientists and experts deny the existence of the climate crisis.
The signatories include academics, politicians, lobbyists, and high-ranking figures from the oil and gas industry known as climate change deniers, as well as others associated with various climate change denial organizations such as the Cato Institute, the Heartland Institute, and the Global Warming Policy Foundation.
According to a bibliographical analysis, the signatories have virtually no scientific activity in the field of climate change. Furthermore, the authors of this analysis classify the declaration as a disinformation campaign intended to confuse the public about the scientific consensus on climate change.
At the same time, they place the declaration in the tradition of earlier, similar climate change denial initiatives such as the Leipzig Declaration and the Oregon Petition, some of whose statements were also adopted. ”
*
https://euracoal.eu/info/country-profiles/czech-republic-8/
*
Yeah. Long live the naive believers!
Bindi is one of the blog-cloggers here who understands none of the science. Like several of the other cult kids, he’s just lonely….
So let’s make use of his interruption.
One of the ongoing errors in the CO2 nonsense involves “flux”. Solar Insolation arriving Earth is called “flux”, and has units of W/m². But that’s where the problem starts. “Flux” is NOT “energy”. And “flux” is NOT “heat”.
Flux has units of Power/Area, or in the MKS system of units, Watts/meter$#xB2;. Since Power is Energy/Time, Flux is also Energy/Time/Area. Flux has base units of M/T^3 (mass/time^3).
Because “energy” is involved, people unfamiliar with physics assume flux is energy. We see that constantly in the CO2 nonsense, especially in the “Earth’s Energy Budget” debunked here:
https://www.drroyspencer.com/2025/08/uah-v6-1-global-temperature-update-for-july-2025-0-36-deg-c/#comment-1711069
Flux is not Energy, just as Power is not Energy, just as Speed is not Distance. But children cannot understand physics. Flux contains units of Energy but that does not mean they are equal. Just as Speed contains units of Length, 60 miles/hour is not the same as 60 miles!
Just to make it clear, let’s again compare units:
Category —– MKS Units —– Base Units
Energy —– Joules —– Mass X Length²/Time²
Power —– Watts —– Mass X Length²/Time^3
Flux —– W/m² —– Mass/Time^3
Responsible adults will recognize that Flux cannot be haphazardly treated as Energy.
So whenever you see flux confused with energy, you will know that ain’t science.
Clint R is an incredibly incompetent person, like all those who doubt the centuries-old science of the lunar spin.
He has been corrected so many times about flux vs. energy…
https://en.wikipedia.org/wiki/Energy_flux
This is the ‘ball-on-a-string’ syndrome, also named KISS (Keep It Simple, Stupid).
Bindi, you can’t correct me. I haven’t stated anything wrong.
I think you’re just obsessed with the simple ball-on-a-string. You probably have nightmares about it. That simple analogy destroys all of your false beliefs.
Sorry.
Clint R
YOU: “If that surface receives 500 W/m², it will reach a temperature of 306K. Then if you add a second flux of 500 W/m², the temperature will not increase because the surface is already emitting 500 W/m². As I taught you earlier, a surface will not absorb a lesser flux than it is emitting. So the surface will NOT increase in temperature with two 500 W/m² fluxes, but will increase in temperature with one 1000 W/m² flux.”
Once again I will ask you for your experimental evidence to support this opinion of yours. Do take two heat sources that can reach one surface. Turn one on first. Let it reach steady state then turn on the other one which produces the same flux as the first and demonstrate the temperture of the surface does not increase when you turn on the second energy source. Other than that you are just blabbing clogging the blog as you claim Gordon Robertson does. Support is what is requested. I think all regulars on this blog know your endless beliefs and opinions. Now it it time to science up and provide experimental evidence and prove the textbooks wrong!!
Norman, you have no background in the relevant science. You would have to have a course in radiative physics and a course in thermodynamics. I try to make things simple, but you still can’t understand.
I’ve explained this before, and you were forced to concede because you realized ice could not warm things warmer than ice. But you’re STILL having trouble with that concept.
There is nothing as simple as the ball-on-a-string, but like Bindi, you have not been able to understand it.
I can only do so much….
Clint R
I will try again, then probably have to give it up. Post results of a test you do. Two heat lamps rated at same wattage. A plate that absorbs IR well. A thermometer. Not a hard science experiment to perform. According to your opinion (which is not science) a 2nd light will have no impact on the temperature of the plate. Do the test and post the results.
Norman don’t make me repeat myself. You have no interest in reality, or science, or learning. You won’t accept anything I offer.
So how about YOU provide a credible source that shows two 300 W/m² fluxes arriving a surface will result in that surface being able to emit 600 W/m².
I won’t hold my breath….
Clint R
So now it is the reversal tactic along with numerous insults about my intelligence
I am not making claims one way or another, therefore there is no burben of proving anything. You however have make bold statements that I have requested you provide evidence for. I described a simple experiment for you to do and yet you will not support your opinions
Why is that? Both Roy Spencer and E Swanson have provided experimental evidence that a cold object will raise the temperature of a heated object. You have provided zero evidence their experiments were flawed.
Norman, it’s not my fault you’re insulted by reality. I would recommend trying to learn.
And appealing to others is an act of desperation. Do you actually believe putting on a coat in cold weather invalidates 2LoT? Do you believe that means “cold” can warm “hot”?
You have no interest in reality, or science, or learning. You won’t accept anything I offer. So again, how about YOU provide a credible source that shows how two 300 W/m² fluxes arriving a surface will result in that surface being able to emit 600 W/m².
I won’t hold my breath….
Clint R
Your ability to divert is endless. You still have not done an experiment to validate your claim about two 500 watt sources reaching some surface. So the one who makes the claims expects the one asking for your evidence and science is now requested to perform the test you will not? Strange diversion. Also a slew of mindless insults that really are just diversions. So basically you are saying you will not do science but claim your opinions are science and anyone who does not accept your beliefs is and ignorant idiot? Hmm.. Diversion tactics is very strong in this one. Must be a Trump supporter, learns well from the Master. Epstein files? Oh no crime in DC! Look, look over here nothing to see in Epstein files (except maybe the mention of my name in numerous places in those files).
See here, Norman, after you finish with your TDS:
https://www.drroyspencer.com/2025/08/uah-v6-1-global-temperature-update-for-july-2025-0-36-deg-c/#comment-1711299
BACK AT THE RANCH
A speechwriter at the Department of Homeland Security has been linked to hateful posts on social media, reportedly claiming that American conservatives are ostracized like the Jews were in Nazi Germany.
https://www.independent.co.uk/news/world/americas/us-politics/dhs-speechwriter-social-media-conservatives-nazi-germany-b2809794.html
GEWINN!
Complaint for Declaratory, Injunctive, and Mandamus Relief filed on August 12, 2025 in the U.S. District Court for the District of Massachusetts (Case No. 1:25-cv-12249) by Environmental Defense Fund (EDF) and Union of Concerned Scientists (UCS) against the U.S. DOE Secretary Christopher Wright, EPA Administrator Lee Zeldin (in their official capacities), DOE, EPA, and a secretive “Climate Working Group” (CWG) formed by DOE.
Alleged are violations of the Federal Advisory Committee Act (FACA), which include failure to: consult GSA before forming the group, publish formation notices or maintain a charter, balance membership or avoid undue influence, open meetings to the public, and preserve or disclose records and minutes.
The existence of the CWG was undisclosed until July 29, 2025, coinciding with EPA’s announcement to rescind the Endangerment Finding. No meetings, records, or deliberations were made public, violating FACA’s transparency mandates.
The report, titled “A Critical Review of Impacts of Greenhouse Gas Emissions on the U.S. Climate,” contains no evidence of peer review, and DOE publicly presented its findings with a foreword by Secretary Wright acknowledging the report was intended to counter the mainstream narrative.
From the complaint: https://library.edf.org/AssetLink/0kdlw6oq5v8hsvj152eqx01b0qn74uuq.pdf
Thank you.
I’m impatiently awaiting the MAGAmaniacal responses in ball-on-a-string style from the usual suspects.
https://www.theguardian.com/environment/2025/aug/20/slowdown-in-melting-of-arctic-sea-ice-surprises-scientists
Dramatic slowdown in melting of Arctic sea ice surprises scientists
The melting of sea ice in the Arctic has slowed dramatically in the past 20 years, scientists have reported, with no statistically significant decline in its extent since 2005.
First impression of the paper: The framing seems protective. Instead of simply defining a “pause” as “an extended period with little or no decline in sea ice cover” and leaving it at that, the authors embed it directly within AGW framework:
“We would like to underscore that pause or slowdown are used interchangeably to refer to an extended period with little or no decline in sea ice cover, due to the observed realization of multi-decadal climate variability on top of the response to anthropogenic forcing, temporarily interrupting the ongoing long-term reduction in Arctic sea ice.”
By doing so, they assume from the outset that a pause cannot exist on its own – it MUST BE explained as an interruption caused by variability overlaying anthropogenic forcing. If the results were truly robust, wouldn’t the data and analysis stand strongly on their own, without the need for hedging or interpretive guardrails?
https://agupubs.onlinelibrary.wiley.com/doi/10.1029/2025GL116175
The long period with no “statistically significant” loss of ice is examined in the context of a world warming from greenhouse gases.
Why do you think that context should be immaterial?
“they assume from the outset that a pause cannot exist on its own”
If the world were not changing temperature, there would be nothing interesting about a lack of change in Arctic sea ice.
I argue the framing is all that makes this ‘pause’ interesting.
Let’s frame it differently. “The global temperature hasn’t changed for 100 years. We want to draw attention to the fact that Arctic sea ice cover hasn’t changed in a hundred years, also.”
No, I’m not seeing why this thesis is more interesting than the one you’ve linked. Could you clarify your criticism?
Well, the authors report that the multi model mean shows about a 20% chance of simulating a pause like the observed one.
But that statistic can be interpreted in two very different ways.
The paper chooses to treat it as a frequency statistic (i.e., there is a roughly one in five climatological chance of a melting pause under AGW, similar to how we might say there is a certain probability of an El Ni-no occurring in any given year.)
If instead you treat the same number as a measure of model skill, the conclusion is very different: there is an 80% failure rate, which suggests the models may be sending too strong of a warming signal and underestimating natural variability.
Under that framing, the observed pause looks much less consistent with AGW.
That is why the framing matters. The choice of framing determines whether we call that a success or a failure.
Choosing the frequency interpretation makes the pause look expected and unproblematic.
Choosing the skill interpretation highlights model weakness. It would be like trying to convince the FDA to approve a drug with only a 20% efficacy rate.
Barry,
Another issue is in the robustness of the metric being tested.
In this study, a pause is defined only as a 2005–2024 trend that is equal to or slower than the observed.
This definition strips away critical context. In reality, the pause was preceded by a sharp melting period from 1996–2005.
The sequence of events (rapid decline → pause) is itself meaningful, because from a Lorenzian, chaos-theory perspective, the dynamics of the earlier decline may have conditioned the later slowdown.
By focusing solely on the pause window, the study sidesteps the deeper question of whether models can capture the transition in timing and dynamics: features tied to real world physics with direct implications for predictability.
The authors themselves acknowledged that the duration of a pause affects the risk of a sharper subsequent decline in the models, which implicitly concedes that timing structure matters.
“If instead you treat the same number as a measure of model skill, the conclusion is very different: there is an 80% failure rate, which suggests the models may be sending too strong of a warming signal and underestimating natural variability.”
There is a 100% failure rate at predicting interannual variability. There is a lesser failure rate with predicting long-term ‘pauses’ arising from statistical variability.
The Arctic has warmed by at least 0.5C in the period (most conservative estimate), up to 1C in some data. I couldn’t tell from the paper whether the models had overestimated this warming, or what other factors bearing on sea ice had been accounted in the modeling (like other emissions, natural and anthropogenic).
There is nothing in the text to suggest that the models overestimated the warming signal. How should we treat this speculation?
“There is a 100% failure rate at predicting interannual variability. There is a lesser failure rate with predicting long-term ‘pauses’ arising from statistical variability.”
Interannual noise is one thing, but a 20 year pause is a multidecadal trend – exactly the kind of signal models claim to capture. By your logic, any deviation with a failure rate below 100% can be dismissed as variability, and then there would be no falsification test.
“There is nothing in the text to suggest that the models overestimated the warming signal. How should we treat this speculation?”
The absence of that conclusion in the text does not make it speculation. Instead, it reflects the authors’ choice to frame the 20% probability figure as a frequency statistic rather than a skill metric. That framing sidesteps the question of whether the models are systematically misrepresenting reality.
“Interannual noise is one thing, but a 20 year pause is a multidecadal trend – exactly the kind of signal models claim to capture.”
A 20-year pause is not a trend. In fact, the trend was negative. The authors pointed out that the trend was not statistically significant.
If you understand statistics, this result doesn’t mean that there is not an underlying trend, nor that there is a definite pause.
We know the Arctic has warmed in the period, and a simple expectation is that sea ice would accordingly recede. This is what models show. (This is also intuitive)
So the authors wondered is a 20-year ‘pause’ – or a trend that fails statistical significance – a feature within the various model runs that ultimately show reduced ice cover in the longer term, as you would expect happens with a warming Arctic – and which is actually observed for this period.
The paper assesses, but not too deeply, I think, the possibility that a reduction in ice cover is somehow linked to anthropogenic forcing, coming up with a negative. Then, compared to an array of model runs, 20% of the time they find 20+ year ‘pauses’ that are a result of ordinary random chance, an artefact of the variability. We’ve seen this behaviour a few times in the temperature record.
Asking whether there is a problem with the models is a fair question, but I’m not sure how they fit that into the scope of this paper. That’s a separate study with very different metrics. And there is already plenty of other research critiquing models.
“A 20-year pause is not a trend. In fact, the trend was negative. The authors pointed out that the trend was not statistically significant.
If you understand statistics, this result doesn’t mean that there is not an underlying trend, nor that there is a definite pause.”
You are right that a non significant trend ALONE does not prove a pause.
But if you look at Figures 1c and 1d, after 2012 (the peak 20 year sea ice loss trend), the subsequent trends steadily slow. The most recent 20-year period ending in 2024 is actually the 2nd slowest in the record. That is not trivial.
“Then, compared to an array of model runs, 20% of the time they find 20+ year ‘pauses’ that are a result of ordinary random chance, an artefact of the variability. We’ve seen this behaviour a few times in the temperature record.”
Variability is not always random, high frequency noise.
It can be dynamically structured and regime like, as we see in many modes of low frequency variability (AMO, PDO, etc.).
The Arctic sea ice pause seems to reflect such dynamics, so it has physics behind it that matter for predictability, and models need to capture that.
“Asking whether there is a problem with the models is a fair question, but I’m not sure how they fit that into the scope of this paper. That’s a separate study with very different metrics. And there is already plenty of other research critiquing models.”
The reason it is not in scope is because the authors chose to frame it that way.
By treating the 20% as a climatological occurrence statistic rather than a skill test, they kept the result consistent with AGW.
That choice ties directly back to the strong hedging in the introduction, where they defined the pause in advance as only a temporary interruption on top of AGW.
For the last 20, 40, 50 years the Arctic has been the fastest warming region on the planet. Isn’t this a firm physical foundation on which to predicate the notion of a “pause” in sea ice decline, particularly when the period has seen the fastest rate of warming for the region?
I’m not clear if you think models might be faulty WRT warming in the region, or if they fail to model the potential response of sea ice to increased temps over the last 20 years.
Yes, it is a good foundation. But that is why the pause is so strange: it suggests there are important dynamics being missed by the models.
The fact that this pause occurred ruing the period of fast Arctic warming makes it peculiar and significant.
It has further implications for the future trajectories of both Arctic temperatures and sea ice.
“I’m not clear if you think models might be faulty WRT warming in the region, or if they fail to model the potential response of sea ice to increased temps over the last 20 years.”
The most likely explanation is the latter: models impose an overly rigid coupling between warming and sea ice loss, which prevents them from reproducing the real world divergence you note.
A sea ice – temperature relationship does exist, but it is less rigid and more complex than the models allow.
This suggests that if models fail 80% of the time to reproduce observed sea ice trends, they are also misrepresenting the behavior of Arctic temperatures.
Someone might argue that the models “get Arctic temperatures right” based on statistical extrapolations, but that is not the same as accurate simulation.
EDIT (for better flow and clarity):
The most likely explanation is that models impose an overly rigid coupling between warming and sea ice loss, which prevents them from reproducing the observed divergence.
In reality, the sea ice – temperature relationship is still there, but it is more flexible and complex than the models allow. They can’t accommodate the real world dynamics that temporarily stabilized sea ice despite continued warming.
And this has consequences for temperatures too. A model might match Arctic temperature statistics through extrapolation, but that is not the same as accurately simulating the physical development of Arctic climate.
The finding in the paper seems quite reasonable. The warming is there. Long-term sea ice decline in a warming environment seems to be a fair null. Some models exhibit long ‘pauses’ that are an artefact of the variability- all noisy data exhibits ‘pauses’. So they checked how unusual it is – 20% of the time random noise produces this result.
No one expects models to be able to predict the exact trajectory over a particular period, and if a 2-decade ‘pause’ is unexpected, then seeing it appear in 20% of models doesn’t suggest there is a flaw in the models, unless the ‘null’ for that is a fidelity to observation greater than is expected.
This is really the crux of the dilemma, Barry. The meaning of that 20% hinges entirely on how you classify the pause.
If you treat the pause as random noise, then in that framing it’s just chance that you get a flattening in noisy data.
But if you treat the pause as lo -frequency variability, the interpretation flips. Models are supposed to capture low frequency dynamics and multi decadal trends. In that framing, a 20% success rate looks poor.
And from reading the paper, I am not convinced the pause belongs in the “noise” category, and I don’t think the authors believe that either. They wrote in Section 3.1:
“While sea ice loss in September is of particular interest because that month is the annual minimum, the current pause in Arctic sea ice loss is seen in every single month throughout the year, as shown in Figures 1e and 1f. This suggests that the underlying mechanism(s) must explain not just the summer trends (R. Zhang, 2015; Francis & Wu, 2020) or winter trends (Yeager et al., 2015), but sea ice trends throughout the entire year. We speculate that a negative sea ice thickness feedback and changes in ocean heat transport convergence near the sea ice edge could play important roles (Bitz et al., 2005; Oldenburg et al., 2024; Polyakov et al., 2023; Sumata et al., 2023).”
The final paragraph of the paper leaves the door open on the robustness of sea ice modeling.
“Going forward, how can we use what we have learned about the recent pause in Arctic sea ice loss? First, if internal variability has played an important role then the present slowdown could provide a source of future predictability of Arctic climate change in the same manner as Yeager et al. (2015) (see our Figure S5 in Supporting Information S1). Some studies (Stern, 2025; Sumata et al., 2023) have characterized this period as a regime shift in Arctic sea ice cover, which may also help to narrow sea ice trend projections. Second, the pause period could be used as an out of sample test in future climate model evaluation—like the early and middle periods of the 20th century (Bianco et al., 2024; Chen & Dai, 2024; Flynn et al., 2023). Nonetheless, the results of our study is a reminder that one needs to be cautious about multi-decadal predictions of the climate system, especially in highly variable regions such as the Arctic. Standing in 2007 or 2012 after having experienced yet another year of record loss and listening to assessments that climate models are flawed in their ability to reproduce the rapid loss of Arctic sea ice (Stroeve et al., 2007), it would take a rather brave person to have predicted that a sustained slowdown in ice loss was around the corner, although, as we have shown, and several studies have documented (Kay et al., 2011; Swart et al., 2015; R. Zhang, 2015), the current pause is entirely consistent with the state-of-the-art model simulations.”
I get that this nod to model deficiencies is not enough for you, but as indicated elsewhere in the paper, and as is the case, critical analyses of sea ice modeling is an ongoing area of research. I’m just not sure why you think this particular paper needed to delve into it.
Some papers assessing sea ice modeling:
https://agupubs.onlinelibrary.wiley.com/doi/epdf/10.1029/2019GL086749
https://journals.ametsoc.org/view/journals/clim/34/4/JCLI-D-20-0522.1.xml
https://link.springer.com/article/10.1007/s00382-025-07646-3
https://journals.ametsoc.org/view/journals/clim/37/23/JCLI-D-23-0647.1.xml
https://tc.copernicus.org/articles/18/2739/2024/
https://ui.adsabs.harvard.edu/abs/2024EGUGA..2612969D/abstract
The Turd Reich’s seven-month scorecard:
Of the 46,113 individuals currently detained by Immigration and Customs Enforcement (ICE), 71% have no criminal record.
This directly contradicts Reich Chancellor’s claim that “murderers, human traffickers, gang members, and other criminals” are the primary targets of his mass-deportation policies.
The gap between the regime’s rhetoric and the reality of enforcement underscores yet another failure to deliver on a central campaign promise.
Apparently, murderers, human traffickers, and gang members are not lining up at Home Depot for day-labor jobs or picking vegetables in the fields.
Cost of electricity is way up
Cost of utilities is up
Cost of groceries way WAY up -especially meat, dairy, fruit, fresh veggies, eggs, coffee, chocolate
Cost of dining out way up
Cost of medications significantly up
Cost of construction and homes up
Cost of a new car up
Cost of heating is up
Cost of travel is up
Cost of furniture is up
Cost of home renovation is up
Cost of travel is significantly up
Cost of raw materials is way up
MAGA hats are still cheap though.
On the Ukraine war which Trump promised to end “in 24 hours” upon taking office: yesterday, in a massive air attack, one of the Russian cruise missiles hit a major American electronics factory in Western Ukraine. No military logic or necessity, just terror against people, businesses, and normal life in the country.
Hoping there will be a response to this attack on us. If Iran bombed an American facility in the Middle East, there would be a response from Trump.
This could be the chance for Trump to transition from his “good cop” role. But, he has to be careful as the TDS Leftists can’t wait to call him a “war monger”.
” On the Ukraine war which Trump promised to end ‘in 24 hours’ upon taking office… ”
*
From the German stock exchange website ‘boerse.de’, not exactly one that could not be accused of spreading unverified pro-Ukrainian information:
https://www.boerse.de/nachrichten/UN-Zahl-ziviler-Opfer-in-der-Ukraine-im-Juli-gestiegen/37766492
*
” UN: Number of civilian casualties in Ukraine rose in July
Wednesday, August 13, 2025, 4:21 p.m.
KYIV (dpa-AFX) – The United Nations recorded a record number of civilians killed and injured in Russia-attacked Ukraine in July.
According to the report published by the Office of the High Commissioner for Human Rights, 286 people were killed and 1,388 injured.
This is the highest figure since May 2022.
Compared to the same month last year, the number of casualties increased by 22.5 percent.
According to the report, almost 40 percent of the casualties were attributable to Russian airstrikes using drones and missiles on targets in the Ukrainian hinterland, including major cities such as Kyiv, Dnipro, and Kharkiv.
Compared to June, this was a decrease of 20 percent. 24 percent of the casualties were caused by drone strikes near the front lines. According to UN observers, heavy Russian bombing along the front line resulted in 67 civilian deaths and 209 injuries.
Ukraine has been resisting a Russian invasion for more than three years. According to the UN, more than 13,800 civilians have been killed and more than 35,500 injured since the war began. ”
*
The reason why the Trump~ing boy never does anything higher than blathering against Putin you find here:
https://www.ukrinform.fr/rubric-society/3974743-regis-gente-journaliste-francais-auteur-du-livre-sur-les-liens-de-trump-avec-la-russie.html
” This directly contradicts Reich Chancellor’s claim that
” … murderers, human traffickers, gang members, and other criminals… ”
are the primary targets of his mass-deportation policies. ”
*
This discourse is in complete agreement with what Hitler’s propaganda minister, Joseph Goebbels, had been repeating in Germany ever since 1933.
The Germans experienced the climax of this constant perversion on September 1, 1939, when Poland was invaded by the Wehrmacht and the SS, but citizens heard on the radio:
” We’ve been firing back since 5:45 a.m.! “
Tell me what did Joe Biden achieve on the world stage? apart from handing Afghanistan back to the Taliban and sitting on his backside when Russia invaded Ukraine, i must give him credit for the sanctions he helped place on Russia,sanctions so tough the Russian economy grew 8%. thanks to BRICS, back to climate,bumper harvest in the North East of England this year,the last few acres of spring Barley are being cut as i post this, this years harvest is one month earlier than last year.thanks to an improving climate and C02 fertilization,
“what did Joe Biden achieve on the world stage?”
https://www.economist.com/special-report/2024-10-19
We had the fastest horse in the race–by far–and Trump decided to take it out back and shoot it.
“Tell me what did Joe Biden achieve on the world stage? apart from handing Afghanistan back to the Taliban..”
Donald Trump arranged that deal.
“On February 2, 2020, the Trump Administration signed a preliminary peace agreement with the Taliban that sets the stage to end America’s longest war.
Under the agreement, the U.S. will withdraw nearly 5,000 troops from the country in 135 days in exchange for a Taliban agreement to not allow Afghanistan to be used for transnational terrorism.”
https://web.archive.org/web/20210615230810/https://gop.com/president-trump-is-bringing-peace-to-the-middle-east-rsr/
” Dramatic slowdown in melting of Arctic sea ice surprises scientists ”
Here we see again that newspapers like the Guardian, usually discredited as ‘alarmists’, are suddenly welcome when they report on something that fits the narrative of the pseudo-skeptics.
*
At best, I’m myself surprised that the authors were surprised this year (!) by something that has been known for years and years.
One only needs to look at the most recent monthly ASIE time series
https://drive.google.com/file/d/17RBeTrCw6bTcvnUOI3Sxvr_-jXx81VvS/view
to see from the polynomial that the downward trend is weakening.
*
Looking at the linear trend only provides an illusion.
{ The same applies by the way even more to Antarctica, but… in a 100% opposite direction:
https://drive.google.com/file/d/16WB0LUn6XujkDG9FgKYU1IhPZMyfznUH/view
This is the reason why since 2016, this time series has no longer been interesting to the pseudo-skeptics, as it no longer fits their earlier discourse about the ‘Antarctic rock-solid growing sea ice’, he he.
*
Back to the Arctic: Anyone who splits the monthly time series into individual month series will wonder what the real meaning of this fixation on September values is:
https://drive.google.com/file/d/1cL57UakZj8Hqw7QAv2c6XSqto6iHH5Sv/view
When you compare the twelve, you realize that
– it makes no sense at all
and that
– October is about to ‘become the new September’.
This becomes all even more visible when comparing the monthly linear trends for 1979-2024 to those 2005-2024:
https://drive.google.com/file/d/1412Nfr7MZuybZ84YkIiN69zcMzRawReI/view
– the yearly average sea ice loss trend for 2005-2024 isn’t even half that for the entrire period;
– October surprisingly keeps also in the 2005-2024 period the month with the least sea ice loss trend of all twelve. This is especially visible when comparing daily data for several years.
**
The pseudo-skeptics’ hopes for a long-term slowdown of arctic sea ice loss might be dampened if one moves from surface-based observation to one based more on ice thickness:
https://agupubs.onlinelibrary.wiley.com/doi/full/10.1029/2023JC020848
But… my many years of experience with them shows that they will surely soon find a little something that will help them discredit this article!
Tell me you haven’t read the paper without telling me you haven’t read the paper.
https://agupubs.onlinelibrary.wiley.com/doi/10.1029/2025GL116175
https://www.carbonbrief.org/arctic-sea-ice-decline-erratic-as-expected/#:~:text=Gravity%20will%20ensure%20that%20the,behaviour%20of%20Arctic%20sea%2Dice
As usual: Ho~g~le’s egomaniacal nonsense instead of a technical reply.
I of course have read that paper.
What if…Earth is really supposed to be at 290K, rather than 288K?
Suppose the rebound from LIA has been delayed by the particulates from burning coal. Now, with the clean up of the atmosphere, we are continuing the rebound.
But, can we get back to 290K?
It may take a while….
https://postimg.cc/75FGzgRZ
BACK AT THE RANCH
Crystal Clanton, the attorney whose texts declaring “I HATE BLACK PEOPLE” sparked an investigation into two judges’ hiring practices, will begin working next term as a law clerk for Supreme Court Justice Clarence Thomas, who is Black.
https://lawandcrime.com/supreme-court/clarence-thomas-hires-i-hate-black-people-lawyer-who-was-investigated-over-racist-texts/
This is grossly illegal, unethical, and immoral. That said, I will not shed a tear for anyone who willingly and enthusiastically paved the way for fascism when they get their comeuppance at its cold, brutal hands.
John Bolton deserves this. He could have testified at Trump’s impeachment trial, but instead he chose a book tour. F*ck him.
FBI raids ex-national security adviser John Bolton’s home in classified documents probe: ‘NO ONE is above the law’
https://nypost.com/2025/08/22/us-news/patels-fbi-raids-john-boltons-home-in-high-profile-national-security-probe/
Arkady, would it be possible for you to stop endlessly smearing your political faeces all over the blog? Thank you.
Imagine you were for example a giraffe and asked which of the following two pictures makes you think more of a human:
https://i.postimg.cc/vHVrs6DN/Untitled-design-2025-08-18-T104833-012.jpg
https://i.postimg.cc/htndRykX/Bjutiful-pig.png
*
Which of the two pictures would you rather choose?
Oh apologies!
I chose the wrong picture, even though it actually fit well.
This one is definitely better:
https://media.istockphoto.com/id/1715746861/de/foto/br%C3%BCllaffe.jpg?s=1024×1024&w=is&k=20&c=UzIFrM50BGC68oJfUaxAE7-JS2DkMnFI8i1PjFNlhAY=
Kilmar Abrego García set free after illegal deportation, smuggling charges
The man whose case has become a flashpoint in the Trump administration’s deportation campaign has been released while awaiting trial. ICE could try to quickly deport him.
*
Justice Department sends House committee first batch of Epstein files
The panel’s Oversight Committee issued a subpoena this month for information from the investigation into the sex offender.
*
Sometimes things move millimeter by millimeter.
Ce n’est qu’une question de patience.
Et comme nous écrivit si bien ce génial Jean de La Fontaine dans sa fable ‘Le lion et le rat’:
” Patience et longueur de temps font plus que force ni que rage. “
“The United States of America now owns 10% of Intel, one of our great American technology companies.” Howard Lutnick, August 22, 2025.
Ronald Reagan must be rolling in his grave!
Sounds like a “deal”.
You can bet it will do a lot better than Obama’s Solyndra.
These findings (https://www.nature.com/articles/s41477-025-01957-3) imply that under hotter and drier conditions, when nighttime water replenishment becomes more difficult, trees may increasingly restrict photosynthesis. This would diminish their capacity to act as carbon sinks, reducing the amount of atmospheric CO2 they absorb.
In a warming world, the stability of terrestrial carbon sinks may be more tightly constrained by water availability than by carbon supply, making forests more vulnerable to climate change than previously assumed.
Trees typically open their stomata during the day, allowing them to absorb CO2 from the atmosphere and use light energy for photosynthesis. However, stomatal opening also leads to water loss through transpiration, creating a trade-off between carbon uptake and water conservation.
Traditionally, it was thought that photosynthesis took priority in this balance. If trees cannot fully replenish the water lost through daytime transpiration, they reduce or delay stomatal opening the following morning, limiting photosynthesis to prioritize water recovery. Growth processes depend strongly on this nighttime refilling of cells, which restores turgor pressure needed for cell expansion, even when sufficient sugars are available from previous photosynthesis.
Solyndra vs. Intel or: Clint R’s massive, unsurpassable stupidity
Solyndra was a failed solar panel manufacturer focused on a niche, tubular design that ultimately proved too costly and unscalable, leading to its bankruptcy and a political scandal over a government loan.
Intel is a massive, long-established semiconductor company that has faced challenges, including workforce and revenue declines and failed acquisitions, but remains a dominant force in its industry and a focus of government support through initiatives like the CHIPS Act.
Key Differences
• Scale:
Solyndra was a startup with limited employees and a single, high-cost product line.
Intel is a global giant with tens of thousands of employees and a broad portfolio of products and services.
• Innovation vs. Scalability:
Solyndra’s focus on a niche, high-cost technology failed to achieve the cost reductions necessary for market success.
Intel, while innovative, prioritizes large-scale manufacturing and cost efficiency to compete in the global market.
• Market Position:
Solyndra was a competitive newcomer that failed to establish a viable market position.
Intel has been a dominant force in the semiconductor industry for decades.
The comparison highlights the vast differences in scale, industry, and business models between a failed startup and a major tech corporation.
*
Once again, it becomes clear that the gullible Trumpista Clint R cannot escape his trivial, biased ‘Keep It Simple, Stupid’ discourse.
No wonder he discredits and denigrates any science he doesn’t understand.
*
Let’s not forget, by the way, that despite their regular, tiny skirmishes and squabbles over details, Robertson and Clint R keep 100% interchangeable pseudo-skeptics.
Yeah Bindi, Solyndra was a scam. And Obama fell for it.
I often point out that you cult kids have NOTHING buy insults and false accusations. So thanks for proving me right, again.
The real issue that the Trump a$$-lampreys ignore is that this is Chinese-style State Capitalism.
Republicans used to be about free enterprise. Until they went authoritarian and proto-fascist.
BACK AT THE RANCH
Ten of the eleven U.S. recessions between 1953 and 2020 began under Republican presidents. Of these, the most statistically significant differences are in real GDP growth, unemployment rate change, stock market annual return, and job creation rate.
https://en.wikipedia.org/wiki/U.S._economic_performance_by_presidential_party
Upthread, barry was confused, again. So this is an effort to help him.
barry was trying to understand “#2 Flux does NOT average”. I offered a simple example, but sadly CO2 caused an error. I will now attempt to correct it.
A surface at 205K is emitting 100 W/m². An identical surface is at 355K emitting 900 W/m². The average flux is 500 W/m², but that calculated average has no meaning because fluxes can not be averaged.
The average temperature of the two surfaces is 280K, resulting in an emission of 349 W/m².
And that is what is meant by “Flux does NOT average”.
9:32 am: “The average temperature…”
Clint yet again makes the mistake of averaging temperatures which cannot be directly averaged since temperature is an intensive property. Clint R continues with incorrect physics. The average energy flux has physical meaning though since energy flow rate is an extensive property as shown in Clint’s original link where the emitting area is properly handled.
Ball4, Clint already told you…you’re banned! So, why are you still trolling him?
12:52 pm: No trolling; just being of service to readers in pointing out Clint R’s errors in physics.
Oh look…
The fake pseudo-moderator DREMT, who surprisingly has stopped giving himself the pretentious nickname “Dr Ro~y’s Emer~gency Moder~ation Te~am”, now begins again with his utterly lying troll tirades against honest people who correct Clint R, this blog’s biggest troll and 360-degree science denier.
Ball4 at 10:23 AM, you could also simply say:
You’ve got to be kidding, Bindidon. Please tell me you’re joking.
Bindi uses insults and false accusations to prove he doesn’t understand the science.
He does such a good job….
3:06 pm: Sure, when reasonably assuming uniform planetary near unit natural emissivity.
That would normally be planetary Te defined: the single theoretical brightness temperature of a blackbody that would radiate the same total amount of energy as measured on avg. annually for an entire planet.
Ball4 at 7:21 PM, you could also just say:
The key is that you work with the fourth power of temperature, not the temperature.
” … Already thoroughly explained, up-thread. ”
You, fake pseudomod, Clint R, Robertson and all other science deniers never explained anything on this blog, about Moon’s motion the least.
Let alone would any of you be able to scientifically contradict centuries of astronomical science.
Bindidon, unsurprisingly I was referring to the subject of this thread, not the moon. Good to see you are not obsessed, huh?
There are too many numbers for the cult kids, so to make it easier to understand:
Temperature —– Emitted Flux
205K —– 100 W/m²
355K —– 900 W/m²
Average (280K) —– 349 W/m²
But Average Flux (500 W/m²) corresponds to 306K. Much hotter than 280K!
That’s why averaging flux is bogus science.
No Clint 5:39 pm, your averaging of temperature once again is bogus science causing much laughter among more astute readers.
I cannot believe how stupid CR is. I think his level of maths prevents him from understanding the processing of raising a number to the fourth power. Real school boy level misunderstanding.
As usual, Clint is relentlessly attacked for being correct.
Correct about what, DREMT? Be specific.
” … for being correct ” ?
Like when claiming that the Moon does not spin about its polar axis, for example?
Despite the fact that the lunar spin period computed in 1750, based on observations made using a small telescope and a self-made micrometer, is the same as that computed nowadays, based on observations made using Moon-based retroreflectors and laser ranging…
The trolls here are… Clint R with his eternal ‘Got a viable model for orbiting without spin?’ nonsense, and DREMT with his eternal MOTL/MOTR nonsense, for sure.
Already thoroughly explained, up-thread.
Bindi, the fact that you have no “viable model for orbiting without spin” means you have NOTHING. We’ve got such a model, you don’t!
You haven’t learned anything in years now. You just keep clinging to the same nonsense.
“A surface at 205K is emitting 100 W/m². An identical surface is at 355K emitting 900 W/m². The average flux is 500 W/m², but that calculated average has no meaning because fluxes can not be averaged.
The average temperature of the two surfaces is 280K, resulting in an emission of 349 W/m².
And that is what is meant by “Flux does NOT average”.”
A clear, simple example, Clint, which obviously barry has no response to. This issue is settled, then.
No need for anyone but barry to respond to this post.
… except for those readers that know to point out Clint R is wrong to average intensive property temperatures so Clint’s conclusion is wrong.
Energy flow rates are extensive properties so energy flux CAN be averaged when the relevant area is properly handled.
No need for anyone but barry to respond to this post.
Average of temperature is the mean of kinetic energy of molecules in a volume.
Average of flux is the mean radiative energy loss/gain at a surface.
Both are linear properties. At different scales.
So if you convert one to the other DURING a calculation for mean energy you run into non-linearity.
For a radiation budget and ERT, use average flux. If you convert from or to temperature during the averaging, you will commit exactly the error the fictional authors of your study warn against.
And they themselves commit the error.
As the authors discovered, when they average temperature to determine flux they end up with a lower surface temperature. That will always be the case due to flux being T to the 4th power.
So with their method, as they point out, you end up with an even larger GHE.
However, all this is barely relevant to Clint’s asinine theiss that just because the average of fluxes and the average of temperatures bring different results, you CAN’T AVERAGE FLUXES.
You most certainly can, and you do so depending on the property you want to ascertain – which in this case is a measure of Earth’s energy loss as if it were a blackbody with albedo of 0.3.
barry cannot help but misrepresent everyone.
https://www.drroyspencer.com/2025/08/uah-v6-1-global-temperature-update-for-july-2025-0-36-deg-c/#comment-1712422
What the authors actually do:
“The conclusion from the above discussion is that a proper calculation of the mean physical temperature of an airless celestial body (Tna) requires an explicit integration of the SB law over the planet surface. This means first taking the 4th root of the absorbed shortwave flux at every point on the planet and then averaging the resulting temperature field across the entire surface rather than calculating a single temperature from the globally averaged absorbed solar flux as done in Eq. (3).”
The paper 2:51 am: …a proper calculation…
In DREMT’s cited paper for Earth, the result should equal what various satellites have naturally measured since Nimbus experiment reported annualized planetary brightness about Te=255K in early 1970s vs. proper surface annualized thermometer data about 288K depending on time period observed.
I’ll let DREMT perform the calculations in the paper as applied to Earth (not airless) to report how close the paper’s analysis is to the naturally measured planetary Te and thermometer data.
No thanks, I’m good.
“What the authors actually do”
Is to introduce non-linearity into their estimate by converting flux to temperature piecemeal all over the sphere, and then average the resulting temperature.
They get neither the actual average temperature as a kinetic mean, nor the effective radiating temperature, because they commit the error they warn against when converting flux to temperature over tiny fractions of the surface.
I’ll give you one thing, the authors didn’t derive a flux from their averaged temperature. My mistake. It was Clint did that upthread.
So you’ve pointed out that there is a difference between the average ‘surface’ temperature as mean kinetic energy, and as mean effective radiating temperature.
But I don’t know what the complaint is. Using the average of temperatures makes the GHE larger, as the authors note. Averaging flux to get the ERT gives a more conservative value for the GHE.
Are you really signing up to the author’s opinion? That the strength of the GHE has been underestimated?
DREMT,
A little thought experiment for you, based on Clint’s upthread, where he gave the flux from averaged temperatures.
A 2 square metre blackbody rectangle is irradiated by 1000 W/m2 on one half, and 0 W/m2 on the other half. It’s a perfect conductor and insulated on the back. Average the flux and you get 500 W/m2 emitted from the surface. 306K.
If you average the temperature from each half you get 182K = 62.5 W/m2.
What do you make of the average incoming energy of 500 W/m2 converting to an output of 62.5 W/m2. Is the 1st law intact? How do you justify the discrepancy?
barry, the authors do not commit the error they warn against. I don’t know why you keep saying they do. Obviously there is something about this you are simply not understanding. And, I don’t have the patience to deal with you about it.
I already told you, they calculate an “atmospheric thermal enhancement” three times greater than previously thought. Not necessarily a GHE. That’s you putting words in their mouths. If you knew the authors, you’d know that they think there is no GHE. But, that’s all besides the point. Which has been simply, and successfully, made. The argument is over.
“Which has been simply, and successfully, made.”
But no one can say what point was made.
No matter, it was ‘successful’ by fiat.
Lol. Pretending not to know what the point is, is one of their dirtiest little tricks. They really are desperate. Good to see bad people reduced to this.
DREMT,
I checked the authors out,which is why I know the names they used on the paper are fictional.
The reason their methodology falls into the trap they warned against is that they converting flux to temperature all over the sphere, embedding non-linearity into their average at each iteration. Let’s look again at their warning.
“The non-linearity of the SB radiation law coupled with a strong latitudinal variation of the absorbed solar flux across the surface of a sphere creates a mathematical condition that precludes in principle a correct calculation of the true global surface temperature from a spatially integrated radiative flux.”
With integrated flux you get a single conversion, and this represents temperature as radiative loss from the sphere, which is indeed different from what a spatially averaged temperature would yield. The authors correctly point out, the averaged temperature will always be lower than the temperature derived from average flux.
But they do not average temperature, they iteratively convert flux to temperature in patches all over the globe. This will give yet another, abstract result, different from the Effective Radiating Temperature and the averaged surface temperature. Holdinger’s inequality is embedded in every iteration of conversion, non-linearity occurs multitudinously instead of just once.
And they do indeed suggest the GHE would be greater.
“Employing the new temperature formula we show that Earth’s total ATE is ~90 K, not 33 K, and that ATE = GE + TE, where GE is the thermal effect of greenhouse gases, while TE > 15 K is a thermodynamic enhancement independent of the atmospheric infrared back radiation. It is concluded that the contribution of greenhouse gases to Earth’s ATE defined as GE = ATE – TE might be greater than 33 K, but will remain uncertain until the strength of the hereto identified TE is fully quantified by future research.”
Noting that the GHE is an expression of a radiative balance, and that the clearest way to compute that as an energy budget is with flux alone, I am mystified as to what the issue is.
You’ve said that averaging flux is not the issue. Fine, so what’s the problem? That the averaged flux doesn’t give you the same global average temperature as an actual average of temperature? And that this undermines claims of a 33K GHE? Ok, then if you average the temperatures you get a larger GHE. It’s as simple as that. You don’t prefer the more conservative estimate?
As I wonder why you or Clint would rather we averaged the surface temperatures to derive a stronger GHE, it occurs to me that Clint was ACTUALLY saying you can’t divide or average flux period. Not some shade of meaning that well, you actually can legitimately do that, but not to get the actual surface temperature.
Because surely he’s not arguing for a stronger GHE.
He’s just arguing that energy budgets are bogus. That’s his starting and end point.
You most certainly can divide and average flux.
And you must to work out energy balances that conserve energy.
If you use the fictional authors’ iterative flux/temperature conversion method for a temperature average, you can get HUGELY spurious results as I pointed out in this simple example which you ignored.
https://www.drroyspencer.com/2025/08/uah-v6-1-global-temperature-update-for-july-2025-0-36-deg-c/#comment-1712846
Averaging the temperatures after converting different fluxes in this way produces an actually meaningless result. It doesn’t describe the temperature field, and it is useless for an energy balance, having broken the 1st Law.
barry, you’re just repeating yourself.
The authors:
1) Do not commit the error they warn against making.
2) Do not even think there’s a GHE.
I only linked to the paper because it supports Clint’s argument that when you average fluxes, and convert that value to temperature, you get the “wrong temperature value”. Since temperature is related to flux by a law of physics, the SB Law, and this no longer applies correctly to the averaged flux, that makes the averaged flux “physically meaningless”. So, as Clint said:
“The average flux is 500 W/m², but that calculated average has no meaning because fluxes can not be averaged…and that is what is meant by “Flux does NOT average”.”
And, the only reason I have stepped in is because you kept, and keep, misrepresenting Clint (and now me, and the authors of the paper, etc etc).
Please stop misrepresenting everyone, barry.
P.S: in your thought experiment, you made the rectangle a perfect conductor, hence the temperature will not be 364 K in one half, and 0 K in the other half. It will be a uniform 306 K in both halves. Tna will equal Te. As is pointed out in the paper:
“From the standpoint of Hölder’s inequality, one would expect Tna to approach Te only if the absorbed solar radiation were uniformly distributed throughout the entire planet surface. However, this requires a regolith of infinite lateral thermal conductivity, which is physically impossible.”
“Employing the new temperature formula we show that Earth’s total ATE is ~90 K, not 33 K, and that ATE = GE + TE, where GE is the thermal effect of greenhouse gases, while TE > 15 K is a thermodynamic enhancement independent of the atmospheric infrared back radiation. It is concluded that the contribution of greenhouse gases to Earth’s ATE defined as GE = ATE – TE might be greater than 33 K, but will remain uncertain until the strength of the hereto identified TE is fully quantified by future research.”
They believe the strength of TE is approx. 90 K, leaving 0 K to be due to the GHE. This was made clear in a subsequent paper.
They believe there is no GHE.
OK?
And finally…
…converting a bunch of different flux values to temperature values and then averaging the temperature values does give you a “correct temperature value” at the end of it. That’s why they did it that way! You are misunderstanding the effects of Holder’s inequality.
Try to understand, that it would make no sense for the authors to make the same mistake they warned against, and then for a paper with such an obvious, glaring mistake to pass peer review and be published in a reputable journal. That’s just a basic “sanity check” against what you’re proposing…
“it would make no sense for the authors to make the same mistake”
Perhaps then you will stop accusing climate scientists of all making the same simple mistakes, like averaging global flux.
That makes no sense!
Good to see bad people reduced to this.
“The average flux is 500 W/m2, but that calculated average has no meaning because fluxes can not be averaged… and that is what is meant by “Flux does NOT average’.”
Clint points out that the flux average is different to the average of temperature.
He THEN announces that the averaged flux is “meaningless.” His proof? Because the averaged temperature is different to it.
So,he asserts that because there is a difference, that the averaged flux is wrong. There is no argument, just an assumption about the superiority of averaging temperatures.
And with that assumption he concludes, “fluxes cannot be averaged.”
Which is absolute horsepucky.
If you want to do an energy balance over convex surfaces you cannot average temperatures. As your own paper points out, you will get a result lower than the averaged flux temperature That means you will break the 1st law in the energy balance when you convert the temperature average back to flux – as Clint did upthread.
What neither of you have considered is that there are different purposes for which you average temperature and average flux.
Clint says flux is non-linear. He is wrong. And you disagree with him, though you hedge on this. You know that flux is linear.
And you absolutely have to average and divide flux to get an energy budget. Which is what Clint is arguing about (see the OP on this -it’s all about the energy budget), not about the average volumetric temperature of the Earth -that’s all your own stuff.
“in your thought experiment, you made the rectangle a perfect conductor, hence the temperature will not be 364 K in one half, and 0 K in the other half. It will be a uniform 306 K in both halves. Tna will equal Te. As is pointed out in the paper”
Nope, the method employed by the authors is to convert incident solar flux to temperature and then average. They do NOT measure the actual temperature of the skin and average.
So use their method and voila – conservation of energy is violated.
Because they are not even trying to do an energy budget.
You can even do this with our canonical plate in space.
Sun sends 400 W/m2 to a plate in space. You and I both agree that the plate sheds 200 W/m2 on each side, at a temperature of 244K.
Now let’s use the method in the paper. We already know before we begin we’re going to get a lower temperature.
(290K – 0K) / 2 = 145K
= 25 W/m2
Oops.
The conductivity is immaterial to the primary method for calculating average temperature from integrating solar flux and converting each iteration to temperature. I just included it to help see the flaw more clearly.
You will ALWAYS end upbreaking the 1st Law if you use this method on a curved surface and most other configurations where the object has varying surface angles to insolation.
That’s because their method is not designed to determine an energy budget. They are trying to calculate the actual mean, kinetic, volumetric surface temperature of a planet with no GHE.
Naturally, they end up with a much colder surface than the ERT.
But the point remains that you can and must average fluxes for an energy budget. If we applied your authors’ methods to such, conservation of energy would be violated.
barry, first of all:
1) Do you accept that you were wrong to say the authors commit the mistake they warn against in the paper?
2) Do you accept that you were wrong to say the authors argument means the GHE must be more than previously thought (especially given that they think there is no GHE)?
When you are able to accept that you were wrong on those two points, I will move on to the massive slew of errors, false accusations, and misrepresentations you have introduced in your latest two essays.
1:11 am: “They believe the strength of (A)TE is approx. 90 K…”
Their ATE of ~90K simply adds in the lower albedo of the moon due to optical processes other than that of Earth’s “atmospheric infrared back radiation.” The earthen atm. GHE ~33K depending on period measured only includes Earth’s albedo, not the difference in lunar albedo.
Good to see DREMT recently now come to an understanding the avg. brightness temperature of the Moon can be meaningfully calculated from radiometer measured W/m^2 leading to their ATE ~90K in DREMT’s supporting use of Holder’s inequality. DREMT could argue that out with Clint R and improve Clint’s physics.
Ball4 is full of shit, as usual.
“They do NOT measure the actual temperature of the skin and average.”
I never said or in any way implied that they did, barry.
“So use their method and voila – conservation of energy is violated.”
Not at all. Suppose that your rectangle is not perfectly conducting, and instead has some negligible thermal conductivity meaning that one half of the rectangle will actually remain at 0 K while the other half remains at 364 K. The reality is that the average temperature of the rectangle would be 182 K, as their method would calculate, and half of it would be emitting 0 W/m^2 whilst the other half emits 1000 W/m^2. You don’t say that the rectangle is emitting 62.5 W/m^2 because their method does not involve converting the overall temperature average to a flux value!
“it would make no sense for the authors to make the same mistake”
“Perhaps then you will stop accusing climate scientists of all making the same simple mistakes, like averaging global flux.”
Nate beat me to this point. You give credence to their methods because it passed peer-review. The corollary Nate made argues itself.
“You give credence to their methods because it passed peer-review…”
Not in the least, barry. As I said, it was just a basic “sanity check”, for you, against your ridiculous claim that I know is wrong, anyway. The authors do not make the mistake that they warn against in their paper.
Will you admit that you were wrong on those two points I listed before? Any integrity, barry?
Then I can continue to trash your other two posts which are equally full of nonsense.
Ah, what the hell. I’ll continue trashing your two comments, anyway. Nobody expects you to display any integrity and admit you were wrong.
“Clint points out that the flux average is different to the average of temperature. He THEN announces that the averaged flux is “meaningless.” His proof? Because the averaged temperature is different to it. So,he asserts that because there is a difference, that the averaged flux is wrong. There is no argument, just an assumption about the superiority of averaging temperatures. And with that assumption he concludes, “fluxes cannot be averaged.” Which is absolute horsepucky.”
Your straw man version of his argument sure is horsepucky, barry. For the actual argument, see for example:
https://www.drroyspencer.com/2025/08/uah-v6-1-global-temperature-update-for-july-2025-0-36-deg-c/#comment-1713060
“I only linked to the paper because it supports Clint’s argument that when you average fluxes, and convert that value to temperature, you get the “wrong temperature value”. Since temperature is related to flux by a law of physics, the SB Law, and this no longer applies correctly to the averaged flux, that makes the averaged flux “physically meaningless”.”
barry chirrups:
“Clint says flux is non-linear”
We’ve already been over this. What Clint meant was that the relationship between temperature and flux is non-linear, and in one of his responses to you he clarified that through his example (which he then started this second thread with)! So why are you still misrepresenting him?
“And you absolutely have to average and divide flux to get an energy budget. Which is what Clint is arguing about (see the OP on this -it’s all about the energy budget), not about the average volumetric temperature of the Earth -that’s all your own stuff.”
OMG, I know what the argument is about, barry. I know what the paper I linked to is about. I explained to you why I linked to the paper. You could just be honest and admit that before I linked to the paper you had no knowledge of Holder’s inequality and thus no understanding of what Clint was trying to explain to you with his #2.
“1) Do not commit the error they warn against making.”
I spent a couple of hours learning about Jensen’s and Holdinger’s inequality. I agree I was wrong about this.
“2) Do not even think there’s a GHE.”
I looked up a later paper and confirm that they have made this claim. Unsurprisingly.
If you derive the volumetric temperature of a sphere using the method in the paper and use that in an energy budget you will break the 1st Law. As I demonstrated.
IF YOU WANT TO DETERMINE AN ENERGY BUDGET for a planet, you MUST divide and average flux, NOT divide and average temperatures.
Clint is entirely wrong in his criticism #2. If he wants to make a different claim about actual surface temperature, he is welcome to try again.
“If you derive the volumetric temperature of a sphere using the method in the paper and use that in an energy budget you will break the 1st Law. As I demonstrated.”
barry…what do you think Clint is arguing? Do you think he is suggesting to “derive the volumetric temperature of a sphere using the method in the paper” and then convert that temperature value to a flux value to use in an energy budget? Or, is this yet another straw man?
Clint is just criticising the Earth’s energy budget attempt: full stop, period, end of story. Nobody is suggesting doing what you mention.
In his #2 he is only saying, it’s a mistake to average flux, because in doing so you end up with a meaningless value (meaningless in that it no longer correctly relates to temperature). Is it so hard to understand that? This was just one criticism out of eleven, yet we’ve had an extraordinary amount of back-and-forth already and you’re still misrepresenting him! How hard is it to just correctly sum up your opponents argument and then actually respond to it?
I appreciate that you’ve admitted you were wrong. That takes integrity, so I apologise for suggesting you had none. But, just try to think about your comments on this issue, how you behaved towards Clint, when clearly all along he understood something you didn’t. Read back through the original thread in light of that. Maybe you’ll get why I felt the need to intervene.
“In his #2 he is only saying, it’s a mistake to average flux, because in doing so you end up with a meaningless value (meaningless in that it no longer correctly relates to temperature).”
I saw nothing in what he said that this is what he meant. Maybe I missed a subsequent post?
But you have defended his claim that you cannot average
(integrate) flux based on the notion that it is a different value to the volumetric or kinetic temperature of the surface.
So I’ve got to argue with what you say he is arguing. He doesn’t lay this out himself as far as I’ve seen.
If, when establishing an energy budget you compute the volumetric temperature of the Earth’s surface, you will end up with a violation of the 1st Law.
The Effective Radiating Temperature is not meaningless. The claim that it is is simply an assertion, based on the notion – as YOU ARGUE – that it is different from the kinetic skin temperature of the Earth.
This would be like saying that because a sun-illuminated sphere has varying temperatures any average at all is a construct, and therefore invalid. It does not represent reality.
That is not true of course. The average has value depending on the purpose.
The purpose of your authors is to find out the actual average temperature of the surface to find out how much the atmosphere warms it.
This is different from the purpose of calculating an energy budget. These are two different metrics on different scales.
barry has constructed an elaborate fantasy of what his opponents are arguing, and is clearly not going to allow them to correct him with clear statements of what is actually being said. Oh well. All rationality has left the debate, again.
Ball4 at 8:57 PM
Yes,
1/ Fluxes can and must be averaged (area or time-weighted).
Favg=½(σ205^4+σ355^4)=½(100+500) =500Wm²
2/ Temperatures cannot be averaged before applying σT^4, because the Stefan-Boltzmann relationship is nonlinear.
Teff=(½(205^4+355^4))^1/4≈303K
Favg=σ303^4=500 Wm²
Just a couple of mistakes there, Ark:
*1/2(100+500) should be 1/2(100+900). (Did you know that typos are caused by CO2?)
*Temperatures can certainly be averaged, if the surfaces are identical. But radiative fluxes, even from identical surfaces (but different temperatures) cannot be averaged. That’s just ONE of the many things wrong with your cult’s “Earth’s Energy Budget”.
“Temperatures can certainly be averaged, if the surfaces are identical.”
No Clint, temperature is intensive property, so you are still wrong. However, energy flow rate is extensive so the Earth’s energy budget really is meaningful as measured in your original cited chart.
Why are you still responding to Clint when he already told you, you’re “banned” – meaning you know you will not be getting a response?
https://springerplus.springeropen.com/articles/10.1186/2193-1801-3-723
“Inequality (4b) implies that the area-weighted average temperature of a spherical surface (on the left) is always lower than the temperature calculated from the area-weighted average long-wave radiation emitted by the surface in proportion to T(μ)4 (on the right). Due to a non-linear relationship between temperature and the emitted radiative bolometric flux, and a strong latitudinal variation of the absorbed shortwave radiation across the surface of a sphere, the actual mean global temperature of a directionally illuminated planet is not estimable in principle from a planetary averaged radiative flux (Eq. 2) using the SB law (Eq. 1). This is because a spherical geometry violates the fundamental assumption in the SB relationship for spatial homogeneity of radiation absorption and emission.“
Ball4 11:09 AM.
1/ Jensen’s inequality (〈T〉≤〈T^4〉^¼) does not invalidate using the planetary effective radiating temperature Teff. It simply tells you that Teff≥〈T〉 for heterogeneous surfaces.
Teff is defined from the area-mean emitted flux, which is what satellites measure; it is not intended to equal the arithmetic mean surface temperature 〈T〉.
Nothing in Jensen prevents inferring Teff from the global mean flux; in fact, that is exactly the physically meaningful definition.
2/ “Spherical geometry violates the fundamental assumption in the SB relationship.” Is laughable.
For a spherical, non-isothermal body one integrates the local flux σT(x)^4 over the area to get the total emission Fout = 〈σT^4〉. No “violation;” you just do the area integral properly.
3/ No reputable source concludes that mean temperatures are “not estimable in principle” from global fluxes, only Den Volokin (aka Ned Nikolov) and Lark ReLlez (aka Karl Zeller).
They refer to Holder’s inequality.
I’ve no need to defend the paper or its conclusions. The point of linking to it is to show that it’s known (as you agree) that when you sum fluxes and average them, then convert that average to a temperature value, you get the “wrong temperature”.
As Clint’s example showed.
No, DREMT 12:33am. Earth’s energy budget summing process is over the actual measured natural physical area of the Earth. DREMT wrote good with that with no need to calculate the area of the Earth using the methods in the paper linked.
Clint R’s example improperly averaged an intensive property so his method remains wrong. In fact, all of Clint’s earlier points #1 through #11 have been proven wrong by experiment.
I don’t think anybody here really understands why you think saying “temperature cannot be averaged” is a good rebuttal to Clint’s “flux cannot be averaged”.
Most would probably wonder why you are making things worse for climate science.
Carry on.
Obviously, I refer to an intensive property temperature cannot be averaged because Clint averages that intensive property as the basis of Clint’s failed attempt to prove energy flux cannot be averaged.
Carry on digging your hole deeper.
No hole here. With the argument won some time ago, I’m just laughing at all the desperate squawking from the “cult kids”.
Ball4 11:09 AM.
1/ Every reputable source is familiar with the Hölder/Jensen inequality and knows how to deuce one from the other.
2/ Another failure of the Den Volokin/Lark ReLlez paper is that it calls Te “non-physical” and “a disk temperature.”
Every reputable source knows that Te has a clear observational meaning: it is the blackbody temperature that would emit the same outgoing longwave radiation (OLR) that satellites observe at the top of the atmosphere.
Note that this portion of the paragraph was fraudulently left out of the quote given above. I also remind you that Den Volokin (aka Ned Nikolov) and Lark ReLlez (aka Karl Zeller) published the paper under silly pseudonyms.
3/ The most incompetent passage in the paper is the “two-point day/night” example on page 3. It’s an unphysical straw man even for airless bodies; even the Moon’s night-side is far above 0 K.
I suppose it was contrived because such extremes only maximize the Jensen gap; they do not demonstrate any flaw in using Te for global energy balance. When realistic rotation, finite thermal inertia, and conduction are included, local T heterogeneity shrinks, and the arithmetic mean approaches the fourth-root mean.
Regardless, that has no bearing on the legitimacy of Te as a flux-derived diagnostic.
4/ Another failed attempt at justifying the unjustifiable.
Is Ball4 writing some comments I don’t know about?
SOLAR MINIMUM UPDATE
Disinformation around a “weather weapon” and cloud seeding is being widely promoted by everyone from anti-government extremists to GOP influencers–leading to real-world consequences.
https://www.wired.com/story/texas-floods-conspiracy-theories-geoengineering-weather-weapon/
Let’s Make Fake Wins Great Again!
I mean, what does this guy think his job is?
Interviewer: “…don’t you need to uphold the Constitution of the United States as president?”
Trump: “I don’t know.”
https://www.nbcnews.com/politics/trump-administration/read-full-transcript-president-donald-trump-interviewed-meet-press-mod-rcna203514
It’s literally his job description, and the main part of the oath he took. Twice. Take all the context you need from the link.
His full answer was :
“I don’t know. I have to respond by saying, again, I have brilliant lawyers that work for me, and they are going to obviously follow what the Supreme Court said. What you said is not what I heard the Supreme Court said. They have a different interpretation.”
You could have provided the entire answer, barry. But, that would be reality. Instead, you try to pervert reality.
Yup, I gave you a link and I said, “Take all the context you need from the link.”
Which you certainly did. But the answer to the question on whether he needs to uphold the constitution as president is still, “I don’t know.”
Nor does he care. The constitution is an inconvenience to him, not the bedrock of his sworn duty.
In the tradition is being fooled by snake-oil salesmen, it is fascinating to observe nearly half the US being stupefied by the blustering razzle dazzle of the world’s most successful grifter.
barry, you like to pretend to be a lawyer. So let’s see if you can find all the reasons your statement would not have any bearing in a fair court: “Nor does he care. The constitution is an inconvenience to him, not the bedrock of his sworn duty.
I won’t hold my breath….
Also barry, I’m glad to see you criticize the “nearly half the US” that voted for Kamala.
How could be “stupefied” by her incessant word salad?
Possibly they also suffered from TDS….
barry says:
Interviewer: “…don’t you need to uphold the Constitution of the United States as president?”
Trump: “I don’t know.”
It’s literally his job description, and the main part of the oath he took. Twice. Take all the context you need from the link.
——————-
Apparently you are the only one here that doesn’t understand the context Barry.
Obviously his the discussion is about whether the undocumented are getting the due process for which they are entitled. It is long established precedence that the undocumented get a lot less due process than a citizen in a contesting a deportation action.
Aren’t you aware that the Democrats are trying to lengthen that process and suing at the drop of a hat and losing? Fact is in these deportation facilities all the potential deportees are getting due process. Trump is merely saying he doesn’t know the fine details of the legal process that is required and he has delegated that to the AG and the DHS attorneys.
And on the topic of ignorance, are you going to calculate the 5 days of additional sunlight we were getting in 2023 vs 1980? You offered to do that after choosing to calculate something nobody is arguing. Are you always so confused about what folks are talking about?
The president doubts that he is supposed to uphold the constitution.
And this is not a controversial observation. He’s many times said similarly, including about repealing parts of the constitution he doesn’t like.
What is stunning is that conservatives are perfectly ok with this. Talk about Trump derangement syndrome. This is a cult of people patriotic only to Trump.
What part of the constitution Barry?
The facts don’t care about your feelings Barry.
Just ask Trump:
Donald Trump Truth Social Post
“So, with the revelation of MASSIVE & WIDESPREAD FRAUD & DECEPTION in working closely with Big Tech Companies, the DNC, & the Democrat Party, do you throw the Presidential election Results of 2020 OUT and declare the RIGHTFUL WINNER, or do you have a NEW ELECTION? A Massive Fraud of this type and magnitude allows for the termination of all rules, regulations, and articles, even those found in the Constitution. Our great “Founders” did not want, and would not condone, False & Fraudulent Elections!”
On repealing the 14th Amendment on birthright citizenship:
“It’s in the process. It’ll happen … with an executive order.”
https://www.axios.com/2018/10/30/trump-birthright-citizenship-executive-order
And again in the 2023 campaign:
“As part of my plan to secure the border, on Day One of my new term in office, I will sign an executive order making clear to federal agencies that under the correct interpretation of the law, going forward, the future children of illegal aliens will not receive automatic U.S. citizenship.”
Not by an amendment,not by an act of congress, but by presidential fiat.
His job description is to preserve and protect the constitution, not rewrite it or ignore it.
I don’t know how it is conservatives are so blind to how unfit for the office this guy is.
barry says:
”Our great “Founders” did not want, and would not condone, False & Fraudulent Elections!”
———
So does that mean you condone false and fraudulent elections?
xxxxxxxxxx
Barry says:
On repealing the 14th Amendment on birthright citizenship:
“It’s in the process. It’ll happen … with an executive order.”
————
You must get your information from the fake news. The issue isn’t birthright citizenship. The issue is that birthright citizenship in the 14th amendment has requirements for birthright citizenship other than simply being born on US soil. Thats an issue that will be decided in the end by the Supreme Court in accordance with the Constitution. Fact is that limitation has a precedence of use that has disallowed citizenship on an unrestricted birthplace basis.
xxxxxxxxxxx
Barry says:
”Not by an amendment,not by an act of congress, but by presidential fiat.”
————
Nope thats incorrect. Either an executive order or an act of Congress is required to take the issue to the courts. Without that folks will just go along with no action.
xxxxxxxxxx
Barry says:
”His job description is to preserve and protect the constitution, not rewrite it or ignore it.”
———–
He isn’t rewriting it or ignoring it. . .he is interpreting it. If his interpretation is wrong the courts will say so.
xxxxxxxxxxx
Barry says:
”I don’t know how it is conservatives are so blind to how unfit for the office this guy is.”
———–
I don’t know how liberals are so full of themselves when they don’t even understand how the separation of powers works.
Are liberals so timid that they fear asking what clauses like the 14th amendment’s condition ”and subject to the jurisdiction thereof” meant to the ratifiers of the Amendment?
Does that include invaders of our nation who broke our laws intentionally and actively avoided letting the government know they were even here, never reporting in to the appropriate authorities?
How are you coming on those sunlight calculations?
“So does that mean you condone false and fraudulent elections?”
Ah, you believe that a “false and fraudulent election” gives a pre4sident the right to “terminate” the constitution.
Good to know! And good to know you swallow Trump’s horsehit without chewing.
Trump has already issued an executive order attempting to repeal the provision of the 14th Amendment that people born in the US are US citizens.
Courts have universally rejected this, calling it unconstitutional. His order is blocked by the courts.
So yeah, bill, he has already tried to rewrite the constitution by executive fiat, effectively adding his ‘interpretation’ to the 14th amendment.
“Are liberals so timid that they fear asking what clauses like the 14th amendment’s condition “and subject to the jurisdiction thereof” meant to the ratifiers of the Amendment?”
This phrase has already been tested in court, with decades of precedent. Is Trump so dim that he didn’t check? No, he doesn’t care. He just overrode 150 years of precedent.
bill, he doesn’t care about the constitution. It’s as plain as day. The constitution is an impediment to him, not a sacred document. Why even bother trying to pretend it matters to him?
And yes, thank God for separation of powers, though Congress is rubber-stamping Trump’s designs. He’s losing the vast majority of court battles with his unconstitutional actions, and he’s losing to Dem and Repub judges alike. Because he continually usurps the limitations of the presidency.
barry says:
”Ah, you believe that a “false and fraudulent election” gives a pre4sident the right to “terminate” the constitution.
Good to know! And good to know you swallow Trump’s horsehit without chewing.”
———————–
Terminate the Constitution? You are sounding rather neurotic here. There is zero evidence of that fact. The Constitution provides for 3 branches of government and its the Executive branches role to bring cases to the Judiciary branch and provide recommendations and suggestions to Legislative branch since it is the Executive Branch’s duty to work with the other branches.
If the President has reason to believe an election was fraudulent he would not be doing his duty if he didn’t say anything about it. And him saying something about very oddly gets your panties all twisted up. Now thats really bizarre.
barry says:
”Trump has already issued an executive order attempting to repeal the provision of the 14th Amendment that people born in the US are US citizens.
Courts have universally rejected this, calling it unconstitutional. His order is blocked by the courts.”
————————–
so far in the last 6 months its been the action’s of lower courts that have been most often found unconstitutional in the end Barry. Haven’t you been paying any attention to what’s actually going on?
I hadn’t thought about this before. But suggesting the wording of the 14th amendment was to turn American citizenship into a huge game of capture the flag seems to be an extremely bizarre interpretation of what people were thinking in 1868. Indeed if you go through legal channels and get a green card for permanent residence in the US then yeah an avenue for citizenship and your future offspring makes a lot of sense. But should it apply to bandits crossing the border, hiding out in the hills and ghettos or in the quarters belonging to somebody violating labor laws? I wouldn’t think that was in the minds of people pushing for the 14th Amendment. But hey I am not a lawyer, much less a Constitutional lawyer. As I see it this issue will be decided by the Supreme Court and gee Barry the Constitution will then have been followed to every letter of the law. . .and here you are with a big knot in your undershorts.
Barry said:
”This phrase has already been tested in court, with decades of precedent. Is Trump so dim that he didn’t check? No, he doesn’t care. He just overrode 150 years of precedent.”
Gee barry I don’t see you quoting any precedence at all. Is that just something your daddy told you?
Gee I would expect you to do the research before concluding what the answer is. Of course you could do what I do, namely give an opinion on why you think citizenship should be a game of Capture the Flag and why you think that was the intent of the 14th Amendment.
Barry said:
”And yes, thank God for separation of powers, though Congress is rubber-stamping Trump’s designs. He’s losing the vast majority of court battles with his unconstitutional actions, and he’s losing to Dem and Repub judges alike. Because he continually usurps the limitations of the presidency.”
Yes thank God for separation of powers Barry. The rest though sounds like what your daddy told you as I am seeing just the opposite with Republican voters winning the registration race. I have been seeing a lot more finalized judgement going along with Trump than against. But at least I will acknowledge that I don’t know what the actual count is. Do you?
bill,
“Terminate the Constitution? You are sounding rather neurotic here.”
Oh bill, I’m quoting Trump’s words.
“A Massive Fraud of this type and magnitude allows for the termination of all rules, regulations, and articles, even those found in the Constitution.”
Should I amend it to “terminate certain parts of the constitution”? Fine by me. Good to know you agree with Trump that parts of the constitution can be ignored.
“If the President has reason to believe an election was fraudulent he would not be doing his duty if he didn’t say anything about it. And him saying something about very oddly gets your panties all twisted up.”
He didn’t say “something,” you inveterate hand-waver, he said he could terminate “all rules and regulations… even those in the constitution,” based on his unproven allegations.
Why does your brain get weak when I provide the examples you asked for? Suddenly you reckon Trump vaguely said something, hand-wave hand-wave.
“so far in the last 6 months its been the action’s of lower courts…” blah blah blah.
Federal courts have universally blocked Trump’s rewriting of the 14th amendment by presidential fiat. Haven’t you been paying any attention to what’s actually going on? Why change the subject – which is how Trump regards his duty to the constitution, or lack of interest thereof.
“Gee I would expect you to do the research before concluding what the answer is.”
Yeah, that’s what I did. Then provided you links to Trump doing what I said he does – treating the constitution as subordinate to his will. Of the two of us, I provide links, but you only provide…
“Of course you could do what I do, namely give an opinion on why you think citizenship should be a game”
Opinion. You have no idea of what I’m talking about, possibly because you live in a news echo-chamber which is uncritical of Trump?
Firstly, there is 150+ years of precedent conferring citizenship on children of foreign citizens born in the US.
The courts first considered the jurisdiction qualifier in the Slaughterhouse Case of 1873. Subsequent courts have many times over the years considered the clause, and come to the same conclusion that except for children of diplomats and foreign combatants warring on on US soil (and for a brief time, native Indians), children born here are automatically US citizens.
Trump pretended 150 years of legal precedent didn’t exist and rewrote the meaning of the 14th amendment by presidential fiat.
I don’t know why you are bothering to normalise his behaviour. More than any other president Trump has ignored congress and done everything by presidential orders. The co-equal branches of government are an impediment to him, as is the constitution. He does not build coalitions to legislate his interests, he dictates to his agencies to carry out his orders. He does not go to court to pursue an agenda, he goes to court to defend his presidential overreach.
He is a wannabe dictator pressing harder than any president before him against the limits of the presidency. He has ignored the courts more than once, and he is content to ignore the constitution if he can get away with it.
And courts with both Republican and Democrat appointed judges have ruled many times that he has overstepped the limits, acting as a bulwark against his naturally autocratic style. He treats the US as a business, not an ideal, and he is the CEO.
This is not contentious. It’s very plain to see.
What Trump could have done, like any normal president, is to work with congress to amend the 14th amendment, or to write a law that qualifies citizenship that doesn’t transgress the constitution, or he could have taken the matter to the courts.
But he doesn’t do this. He issues orders. He uses the presidency as a dictatorship, not as a platform to shape and build consensus around his agenda.
And this is what his supporters want him to do. Drain the swamp. Remake the US government. Be the CEO. I don’t know why you bother trying to cast him as a defender of the constitution or the balance of powers. He isn’t that, and that’s not what his people voted for.
barry says:
”He didn’t say “something,” you inveterate hand-waver, he said he could terminate “all rules and regulations… even those in the constitution,” based on his unproven allegations.”
He can Barry. It’s called martial law. Its been done more than 60 times in US history. Abraham Lincoln for example suspended the writ of Habeas Corpus in Kentucky due to an uprising in that state. Congress has even more powers of limiting Constitutional protections than the President. And the States even have more powers than the Federal Government. However all of it is subject to judicial review of the necessity.
But all this is moot Barry. He hasn’t done that. So why do you have such a big knot in your panties.
Barry says:
”Federal courts have universally blocked Trump’s rewriting of the 14th amendment by presidential fiat. Haven’t you been paying any attention to what’s actually going on?”
And if he hadn’t done that the issue would not be reviewed by the courts Barry. He is enjoined from exporting children born as a result of the game of Capture the Flag until the courts decide on the matter. This was written by expert lawyers to ripen the case for judicial review as no such children got forcibly removed.
In fact Trump was willing to make a deal on the Dreamers and the democrats refused to build his wall and stop the illegal crossings as a condition for that. Now we have a wall and no deal for the dreamers. Pretty sad if you actually care about that.
Barry says:
”Why change the subject – which is how Trump regards his duty to the constitution, or lack of interest thereof.”
No change in subject. A declaration of martial law doesn’t suspend the courts Barry.
In the case of honest Abe the Supreme Court agreed that the suspension of constitutional rights was justified because of military needs.
One should be able to surmise that the job of the President is to enforce the law and there is no requirement or restriction automatically put on doing what needs to be done to enforce law and order by Article I or II powers by the Constitution as far as I am aware of other than the separation of powers doctrines. . .which have to be fully adjudicated, including appeals, with only temporary injunctions to restrict the activity while the judicial process goes forward. Are you completely unaware of this or are your efforts here to deceive others by suggesting the President is doing something illegal?
Finally FDR interned American citizens of Japanese descent by Executive Order without declaring martial law. No court decided to challenge that. Was FDR a dictator? He actually did it.
Barry says:
”Yeah, that’s what I did. Then provided you links to Trump doing what I said he does – treating the constitution as subordinate to his will. Of the two of us, I provide links, but you only provide…”
Your statement there is only your opinion.
The President understands fully that anything he does has to be justified. the courts do not take up hypothetical issues. the worst thing you could do to protect American citizens and their job opportunities would be to do nothing to correct the flaunting of the law by the Biden administration and sanctuary city and state laws.
Why are you being so duplicitous? Do you really believe liberals should be held to a more lenient standard?
Barry says:
”Firstly, there is 150+ years of precedent conferring citizenship on children of foreign citizens born in the US.”
And if nobody challenged that it still doesn’t add up to legal precedence unless a court decides it does Barry. Why don’t you understand that?
Barry says:
The courts first considered the jurisdiction qualifier in the Slaughterhouse Case of 1873. Subsequent courts have many times over the years considered the clause
—————-
The Slaughterhouse Cases combined three suits challenging a Louisiana law that granted a single company the exclusive right to butcher animals in New Orleans.
Gee Barry it appears your only quote is inapplicable. Do you have one that applicable to birthright citizenship?
Barry says:
”He is a wannabe dictator pressing harder than any president before him against the limits of the presidency. He has ignored the courts more than once, and he is content to ignore the constitution if he can get away with it.”
Again you have no quotes to support that claim Barry. All you are doing is parroting fake news and hoping that’s enough for it to stick and selectively attacking the conservative viewpoint on this matter while ignoring the real abuses of law by your side.
Barry says:
”And courts with both Republican and Democrat appointed judges have ruled many times that he has overstepped the limits, acting as a bulwark against his naturally autocratic style. He treats the US as a business, not an ideal, and he is the CEO.”
Cripes you think the US is only an ideal and not operated on the basis of improving the lives of US citizens? Fact is Barry – check your Constitution Article II. He is the CEO and it about time somebody started paying attention to business as opposed to believing money grows on trees.
Administrations get judgments against them all the time. Like Biden trying to give away money to college attendees using money from those who never had the opportunity to go to college. the courts overruled that. The courts overruled roe v wade. The courts outlawed a 1965 act that either required or was interpreted as it being OK to use race to draw district lines. the courts overturned provisions in the Obamacare act that required the purchase of medical insurance. Happens all the time. Did you get your panties twisted up over those as well?
Its amazing the degree that you think your dung doesn’t stink. Its one thing to have a difference of opinion and quite another to think yours doesn’t stink and everybody who disagrees with you has stinky dung. I try to be as patient as possible with those who have been deceived and thus ignorant and am not patient at all with those who are hypocrites and deceivers.
“He can Barry. It’s called martial law.”
There is no provision in the constitution for martial law suspending the constitution. SCOTUS faulted Lincoln for suspending habeus corpus.
But there is no war. Trump has not declared martial law because there is no cause. He is issuing unconstitutional orders because he doesn’t care about the constitution, not because the US is at war.
So your argument here is baseless.
It is also baseless because the rights that were curtailed under declaration of war were habeus corpus, assembly, free speech. Nothing to do with birthright citizenship. You are inventing a rationale for Trump’s EO rewriting the 14th Amendment that even he didn’t make.
But credit to you for finding any excuse to give your dictator all the power he needs. You should sign up to be another administration yes-man. They are all eager to please the leader.
“And if he hadn’t done that the issue would not be reviewed by the courts Barry.”
The courts have reviewed the matter for the last 150 years. Are you American? Why do you need an Australian to provide you with a civics lesson?
“Do you really believe liberals should be held to a more lenient standard?”
Liberals are irrelevant to this discussion, but good on you for making it about partisanship.
“Gee Barry it appears your only quote is inapplicable.”
I didn’t provide a quote, a cited a case that first considered the meaning of “jurisdiction” in the 14th Amendment.
“The first observation we have to make on this clause is that it puts at rest … that persons may be citizens of the United States without regard to their citizenship of a particular State… the distinction between citizenship of the United States and citizenship of a State is clearly recognized and established.”
In the years closely following even more interpretation was given, at first side-lining native Indians (since revoked), and the children of diplomats and foreign combatants warring against the US. Otherwise federal courts and SCOTUS have upheld birthright citizenship when interpreting “jurisdiction.”
Trump ignored all this precedent – many cases over the last 150 years – when he “reinterpreted” the 14th Amendment by presidential fiat.
Why I call him a wannabe dictator or petty tyrant is precisely because the courts have ruled against his overstepping the limits of his presidency. But he has even ignored the courts from time to time.
“Again you have no quotes to support that claim Barry. All you are doing is parroting fake news”
It is well reported that after he was blocked from sending people to the el Salvador prison he sent them anyway, for example. I’ll let you look that up, as otherwise you will pontificate from the middle of your media bubble. Time to get out from the echo-chamber, bill.
“check your Constitution Article II. He is the CEO”
Yes, I know you are a Trump boot-licker. What you are not is a constitutional patriot. MAGA put Trump above the constitution. He was perfectly correct when he said he could shoot someone in Times Square and his followers wouldn’t care.
I probably need to fetch you that quote, too, as you are so lost in pro-Trump world that you forget his infamous comment.
Trump has issued more executive orders than anyone other than Roosevelt, who was given sweeping powers by congress in a financial emergency. Trump has completely eclipsed any modern president for ruling by presidential fiat – and he has lost far more cases against his EOs than any other president. Not because there is a conspiracy against him, but because his directives overreach his authority. The courts are keeping a dictator in check. The court rejections indicate his predilection for abusing the authority of the presidency.
If you doubt what I’m saying, look it up. Exercise some real skepticism.
Tell you what, I’m sure it won’t be long before Trump declares there is a war on the US to suspend some provisions of the constitution. And of course, you will march in lockstep with such an overt authoritarian move.
Because you think he just needs to declare an emergency and poof! the president can do whatever he sees fit.
barry says:
”There is no provision in the constitution for martial law suspending the constitution. SCOTUS faulted Lincoln for suspending habeus corpus.”
——————
Now you are lying. SCOTUS never did that.
Barry said:
”But there is no war. Trump has not declared martial law because there is no cause.”
——————
Barry the Civil war wasn’t a war either. Lincoln deemed it a rebellion. No war was declared. A rebellion apparently means today that there is a massive disregard for law and order. Like attacking federal law enforcement officers in the performance of their duties.
Lincoln acted on the fact that the public was harassing legal government actions of moving troops through Kentucky. . .such as throwing stuff at them. Like recently in California.
Barry says:
”He is issuing unconstitutional orders because he doesn’t care about the constitution, not because the US is at war. . .You are inventing a rationale for Trump’s EO rewriting the 14th Amendment that even he didn’t make.”
Now Barry pretends to be a mind reader. ROTFLMAO! Whats next Barry? Are you going to start interpreting the law with a ouija board?
Barry says:
”But credit to you for finding any excuse to give your dictator all the power he needs. You should sign up to be another administration yes-man. They are all eager to please the leader.”
Here Barry recognizes he has no legal argument and continues with his mind reading.
Barry says:
”The courts have reviewed the matter for the last 150 years. Are you American? Why do you need an Australian to provide you with a civics lesson?”
Still no reference. I suggest Barry you wait until all these issues go completely through the legal system before getting your panties all twisted up.
Barry says:
“Do you really believe liberals should be held to a more lenient standard?”
Liberals are irrelevant to this discussion, but good on you for making it about partisanship.
FDR wasn’t a liberal? Was he a wannabee dictator?
Barry says:
I didn’t provide a quote, a cited a case that first considered the meaning of “jurisdiction” in the 14th Amendment.
“The first observation we have to make on this clause is that it puts at rest … that persons may be citizens of the United States without regard to their citizenship of a particular State”
—————–
?????
What has gone wrong is a lack of consistent morality in this country and thats what got Trump elected.
He has won minority votes because of the economic opportunities he has given them and for signing prison reforms he supported and signed into law as requested by minority clergymen and celebrities.
I am far from making Trump out to be a Saint, its just I can see with clear eyes what he is accomplishing.
Here is a clear-eyed view of most of the issues you have your panties in a twist over. https://youtu.be/zOXu59wgQmU?si=qaRKz5Gxw3ELckkq
Barry says:
”Trump has issued more executive orders than anyone other than Roosevelt. . . Trump has completely eclipsed any modern president for ruling by presidential fiat – and he has lost far more cases against his EOs than any other president”
——–
So now you are claiming there is a legal limit on executive orders? LOL!
Fact is Barry EO’s is about transparency of issuing his decisions on how the executive branch should enforce the law. He has a large team of lawyers and elected Congressmen all supporting him and thats not to speak of the majority of the public.
You are the outlier here.
Barry says:
”Tell you what, I’m sure it won’t be long before Trump declares there is a war on the US to suspend some provisions of the constitution. And of course, you will march in lockstep with such an overt authoritarian move.”
——————-
Wow are you seeing that on your ouija board?
Barry says:
”Because you think he just needs to declare an emergency and poof! the president can do whatever he sees fit.”
————–
How many scofflaws, violent protestors and officials sitting on their hands to protect American citizens should there before the President takes action?
Seems to me the public as already spoken on that matter.
In democracies elections have consequences.
If you really think the country is going in the wrong direction just keep doing what you have been doing.
How are your sunlight calculations coming around or is it the case all you are now interested in is politics?
“Now you are lying. SCOTUS never did that.”
Merryman (1861) – Chief Justice faulted the president for suspending habeus corpus on civilians.
Ex parte Milligan (1866) SCOTUS affirmed civilians had to be tried in civilian courts even in times of war, giving the opinion:
“The Constitution of the United States is a law for rulers and people, equally in war and in peace”
“Still no reference”
Yes, the quote you later quoted in your comment. Why are you so obtuse? And your response to it? Three question marks. This is someone who has their fingers in their ears.
And why don’t you do a bit of your own work? I’ll name some cases to help you.
United States v. Wong Kim Ark (1898, SCOTUS)
Plyler v. Doe (1982, SCOTUS)
INS v. Rios-Pineda (1985, SCOTUS)
The first confirmed birthright citizenship after considering the jurisdiction caveat, the others confirmed it. These are by no means the only cases that affirmed birthright citizenship having considered jurisdiction.
Trump summarily overrode all these court decisions with his EO. And the courts slapped his overreach down.
As they have done more than with any other president, not because of conspiracy (many Republican judges have also knocked his EOs back), but because he continually oversteps his authority.
“So now you are claiming there is a legal limit on executive orders?”
No, but keep burning those straw men down.
I am proving Trump’s dictatorial bent. Roosevelt made the most because of the deep financial emergency of the time, and because congress authorised him to take unitary action. No such conditions apply to Trump.
“Fact is Barry EOs is about transparency of issuing his decisions on how the executive branch should enforce the law.”
Trump has done plenty of clandestine stuff that has not come to light without whistleblowers and investigative journalism. One of the first actions of the Trump admin was to create DOGE, which sought and won exemption from the Freedom of Information act, and has not published anything on its structure, accountability or who manages it and its various arms. US citizens still don’t know its legal foundation, budget, leadership, staffing, oversight mechanisms, reporting requirements, and judicial checks.
I could spend a day listing the opacity created by Trump’s administration, all the way to the masked, often unidentified federal agents snatching people off US streets under banner of immigration reform.
“He has a large team of lawyers and elected Congressmen all supporting him” – Republican congresscritters definitely lick his boots. The profound ass-kissing of his cabinet meetings is public record. The odious fawning was truly something to behold as each member genuflected their admiration for dear leader.
But congress has authorised none of his actions. Trump doesn’t seek congressional approval. This president believes in the unitary power of the presidency.
“Seems to me the public as already spoken on that matter.”
Have you seen the polls, lately? People voted for him to remove non-citizen criminals, not snatch workers off farms or to militarise police forces.
But now you are defending his ‘right’ to dictate, not defending his defense of the constitution or the balance of powers. So it seems you know he is more like Putin than Regan.
“How are your sunlight calculations coming around”
Until you offer a clear case of correlation between planetary variations and climate and the mechanism that causes it there’s nothing to check. Vague invocations aren’t sufficient.
barry says:
”Merryman (1861) –
Ex parte Milligan (1866) SCOTUS
The Merryman decision was not a Supreme Court decision.
Anyway Lincoln ignored it and went on issuing more suspensions of writs of habeas corpus, including arresting about 1/3rd of the Maryland state legislature and other persons who spoke against the war he was starting.
In Exparte Milligan. Only one dissenting justice argued that martial law should be illegal.
barry says wrt birthrights:
United States v. Wong Kim Ark (1898, SCOTUS)
Question here was a child who was born in the United States to Chinese-citizen parents who are ”lawful permanent residents of the United States” a U.S. citizen. Swing and miss. Nobody is questioning this decision as these foreign nationals were accepted as residents in the US by the federal government.
Plyler v. Doe (1982, SCOTUS)
this case ruled that the state cannot withhold funds to school districts who educate ”people” regardless of citizenship or migrant status unless the State can show a compelling interest. Seems to me the Constitution doesn’t automatically grant an interest in US borders to the states.
another swing and miss.
INS v. Rios-Pineda (1985, SCOTUS)
This merely upholds the discretion of the Attorney General to decide if they want to consider allowing an illegal immigrant to stay in the US and avoid deportation. Isn’t that exactly what your complaint is around that the AG isn’t using her discretion as you see fit?
barry says:
”I am proving Trump’s dictatorial bent.”
Words you don’t like doesn’t rise to the level of deeds Barry. So far the only thing you have proven is Trump is quite not a dictator relative to other Presidents.
You are desperately grasping at straws here.
wrt to your offer: ”So if you have some other linking mechanism from gravitational effects that correlates with global climate change, I’d be happy to investigate it.”
I gave you the link that measures changes of earth’s speed within an annual orbit that gives 5 extra days of enhanced sunlight between 1980 and 2023 while the climate was warming Barry.
Are you claiming that the radiation from additional sunlight has to be proven to have a climate effect first?
If so then why would I care if you calculated it for yourself? Its quite apparent you prefer to remain blind to any facts that might threaten the dogmas you believe in.
“In Exparte Milligan. Only one dissenting justice argued that martial law should be illegal”
Another straw man. We’re not arguing over whether martial law should be illegal
Ex parte Milligan confirmed the earlier Chief Justice’s opinion that Lincoln was wrong to suspend habeus corpus for civilians, even in time of war saying;
“The Constitution of the United States is a law for rulers and people, equally in war and in peace”
We’re arguing whether a president can unilaterally suspend provisions of the constitution.
Congress retroactively authorised Lincoln’s suspension of habeus corpus to avoid a constitutional crisis and threats to the president’s powers in the middle of a war. This would not have been necessary had Lincoln’s actions not gone against the constitution.
“Anyway Lincoln ignored it and went on issuing more suspensions of writs of habeas corpus, including arresting about 1/3rd of the Maryland state legislature and other persons who spoke against the war he was starting.”
Which is exactly the kind of action Milligan said was unconstitutional.
So your defence of Trump’s unilateral suspension of provisions of the constitution rests on the actions of a president during a civil war that SCOTUS deemed unconstitutional.
No civil war at hand today, bub. I trust you haven’t completely had your hair set on fire by the inflammatory rhetoric from the Trump administration.
“Question here was a child who was born in the United States to Chinese-citizen parents who are ‘lawful permanent residents of the United States’ a U.S. citizen. Swing and miss.”
Ok, so you read your law selectively. Let’s quote Wong Kim Ark (1898).
“The real object of the Fourteenth Amendment… in qualifying the words ‘All persons born in the United States’ by the addition ‘and subject to the jurisdiction thereof,’ would appear to have been to exclude… the two classes of cases – children born of alien enemies in hostile occupation and children of diplomatic representatives of a foreign State… The amendment… includes the children born within the territory of the United States of all other persons, of whatever race or color, domiciled within the United States…
To hold that the Fourteenth Amendment of the Constitution excludes from citizenship the children born in the United States of citizens or subjects of other countries, would be to deny citizenship to thousands of persons of English, Scotch, Irish, German, or other European parentage, who have always been considered and treated as citizens of the United States.”
Phyler v Doe ruled that all persons physically present in the United States are “within its jurisdiction”, regardless of immigration status, including undocumented children. This confirms the Ark ruling that “within its jurisdiction” applies to the children of undocumenteds.
And Rios-Pineda: “…deportation proceedings were instituted against respondents, who by that time had a child, who, being born in the United States, was a United States citizen.”
As I said above, these cases affirmed Wong Kim Ark (1898). These are only some of the cases over the decades that uphold birthright citizenship. Something you erroneously claimed had never been tested in court. Did Trump tell you that?
Looks like you’re not very good at reading comprehension. Maybe that’s why an Australian needs to help you with your civics lesson.
And maybe this is the root cause of those conservatives (by no means all of them) who cannot see what is patently obvious – a president who doesn’t care about the constitution, and who sees himself as a deal-making CEO with the US as a business.
“You are desperately grasping at straws here.”
No, I’m citing material which your blinders can’t deal with.
Plenty of conservative commentators and politicians have also concluded that the administration is overreaching its powers,and plenty of judges appointed by both red and blue presidents have ruled against Trump’s overreach. His first administration lost the vast majority of its cases, when the win rate for previous administrations was around 70%.
https://lawshun.com/article/when-trump-lost-law-case
This is not a conspiracy against Trump. Use Occam’s razor and what you know of his style. He keeps losing because he and his legal acolytes are pursuing a unitary executive policy, not law. The DoJ is his bulldog, that actively seeks retribution on his perceived enemies, and prejudices any future jury by politically targeting anyone they want to indict. it’s so obvious you’d have to be blind, deaf and moronic not to see it. Pam Bondi, Kristi Noehm, on air on the regular character assassinating people targets who have not yet faced trial, breaking the rules of jurisprudence in every law book and the DoJ’s own policies.
This administration sees checks and balances as an impediment and the law and the bully pulpit as weapons. And you and Trump supporters like that. He is “your retribution,” as he infamously said. Stop pretending Trump cares about the constitution, and keep arguing about how the US needs a CEO-president that can suspend the constitution. You sound a lot more authentic doing that.
“I gave you the link that measures changes of earth’s speed within an annual orbit that gives 5 extra days of enhanced sunlight between 1980 and 2023”
I saw no link to a paper discussing that.
And what do you mean “5 extra days of enhanced sunlight?” This is vague as hell. Is it a growing increase, or a sudden transition? Is it matched at the other end of the orbit with 5 days of disenhanced sunlight? Does this occur in one of the seasons, or is it year-round? Is it a cycle, like a wave of growing and declining enhanced sunlight over the period?
No link, not enough information. Can’t work with that.
barry says:
”Another straw man. We’re not arguing over whether martial law should be illegal”
First, the Trump administration has been following the law as they interpret it and as the courts have decided and said they will follow it.
In the case in question the court said that the writ of Habeus Corpus can be suspended. It merely added some conditions that Abraham Lincoln may have violated; though since it was 5 years after the fact, the war was over, that was never tried in court. Thus despite your claim otherwise Lincoln was not criticized by the court on that.
Then, as further evidence, I pointed out FDR incarcerated American citizens of Japanese descent because he perceived that as a necessity to fulfill his Constitutional duties. Many lawsuits were filed and they all failed with the Supreme Court upholding the government’s actions based on the concept of “military necessity”. That could happen today. . .but it hasn’t. So Trump is right and you are wrong.
barry says:
”Ok, so you read your law selectively. Let’s quote Wong Kim Ark (1898).”
Plenty of questions to raise Barry there always is. The court doesn’t make law either Barry and so it only decides cases actually put in front of it. Ark may be an indication of how the court would rule in the instance regarding undocumented immigrants that have not subjected themselves to US law; but Ark as I pointed out is not such a case. The reason the court’s reasoning in Ark would not apply to undocumented immigrants is precisely because the government wasn’t offered an opportunity to argue that point. Now even if they do determine there was sufficient submission to US law by undocumented immigrants the landscape has changed since Ark. Now we have illegal rebelling states and cities actually shielding undocumented immigrants from being subjected to US law in the form of ”sanctuary jurisdictions”.
Certainly I want Trump to explore the limits of his ability to protect American Citzens from invasion and exploitation. I can’t imagine why you are opposed to that. That seems senseless and represents an extremely weak executive branch fearful of actually enforcing the law because of even a remote possibility of being found not in compliance. I sincerely doubt you would want your views to be so flaccidly pursued.
barry says:
”I saw no link to a paper discussing that.”
Its not a paper Barry. It’s a dataset that gives the annual half orbit time periods affected by other celestial objects.
You can take that data and calculate the change in total annual sunlight received by earth using the elliptical shape of the orbit.
Barry says:
”And what do you mean “5 extra days of enhanced sunlight?” This is vague as hell. Is it a growing increase, or a sudden transition?”
Its all in the dataset I linked you to Barry. The job you volunteered for is not impossible nor even that challenging for step one in understanding natural climate change.
Barry says:
”Is it matched at the other end of the orbit with 5 days of disenhanced sunlight?”
———-
I said the dataset shows that between 1980 and 2023 earth got 5 more days in the half orbit closer to the sun than from the half of the orbit further from the sun. It didn’t materially affect the length of the year.
Barry:
”Does this occur in one of the seasons, or is it year-round?”
the answer is above, it shows the disruption in the earth’s orbital rotation by other celestial objects and if you want to research it further you will find that the earth in the instrument record and proxy records shows the earth gets warmer when the earth spends more time closer to the sun than further from the sun in any given year and colder when the opposite is the case.
For example, It explains the 1850-1910 and 1910-1980 major climate variations that occurred during those times. CO2 based climate models fail to explain those variations, full stop.
And that is also consistent with warming seen from 1980 to 2024 possibly 2025 with that combination of cycles ending by 1930 if not before. Its important to note that each of the mentioned climate variations are combinations of planet alignments working together in the same half orbit but with different alignments within that half orbit causing some variations in the length of climate deviations.
And this effect is also consistent as an explanation for climate variation from 1980 to the present as well.
You offered and I suggested you figure out how much more sunlight comes orbit timing variations. A relatively not too difficult of a problem to figure out.
From there you can confirm or dispute the numbers I came up with. . .which I figured using standard IPCC climate sensitivity could explain all the warming we have seen.
I wouldn’t want to at this point suggest the IPCC sensitivity could be wrong other than note there are a lot of scientists who think that. But other factors may be in play such as the changes in solar brightness we have witnessed over the instrument record got from a Grand Minimum LIA to a Grand Maximum with record level solar cycles over a period of 60 years recently. Or there could be a different sensitivity number that would admit other natural perturbations or even CO2.
I am just on a mission to figure out the perturbation of earth’s orbit and those effects on earth’s climate since very little is said about it by our brave and altruistic institutions of higher learning. We also lack longterm calibrated measurements of solar brightness but I don’t have a dataset I would feel confident in measuring the effect of that.
“First, the Trump administration has been following the law as they interpret it and as the courts have decided and said they will follow it.”
The courts have ruled against the Trump administration far more often than in favour. 90% against in his first term, which is entirely unusual. Most administrations have a 70% win rate. This pattern is being repeated in his second term.
And he is losing because he is transgressing the law. The constitution as well as legislation. That is what the rulings say.
Furthermore, the Trump administration has publicly argues that the president should not have to follow rulings it deems wrong. Judges have been pilloried by the administration, an unprecedented attack on the separation of powers. Trump claims that “saving the country breaks no laws.” Abrego Garcia was deported in defiance of a court order, and the administration then defied a 2025 order to bring him back, saying they were unable to (later shown to be a lie when they eventually did bring him back). The administration was ordered to stop planes deporting people to el Salvador – they did not comply. Spokesperson for Trump said, “A single judge in a single city cannot direct the movements of an aircraft carrier full of foreign alien terrorists who were physically expelled from U.S. soil.”
This is a naked admission from the administration that it reserves the right to ignore judges on the matter of security.
In the 1st Trump administration court orders to release the congressionally appointed funding for sanctuary cities was ignored for months. Court orders to reunite children separated from illegal border crossers was ignored until courts eventually had to appoint a steering committee to ensure his administration complied.
The Trump administration does not respect the law. It begrudges it, and, unbelievably, wages political assassination campaigns against judges who rule against it.
The danger is that this last could be normalised in the US by the Trump administration. That a coequal branch of government – the judiciary – becomes a political target. This is exactly how the Trump administration treats the balance of powers; something to be fought, tooth and nail.
“The reason the court’s reasoning in Ark would not apply to undocumented immigrants is precisely because the government wasn’t offered an opportunity to argue that point.”
False, Ark clearly said, as I quoted, that aside from the children of combatants and diplomats, children born in the US are citizens, even considering the phrase, as they did, “and subject to the jurisdiction thereof.”
I’ll quote again:
“The real object of the Fourteenth Amendment… in qualifying the words ‘All persons born in the United States’ by the addition ‘and subject to the jurisdiction thereof,’ would appear to have been to exclude… the two classes of cases – children born of alien enemies in hostile occupation and children of diplomatic representatives of a foreign State… The amendment… includes the children born within the territory of the United States of all other persons, of whatever race or color, domiciled within the United States…
To hold that the Fourteenth Amendment of the Constitution excludes from citizenship the children born in the United States of citizens or subjects of other countries, would be to deny citizenship to thousands of persons of English, Scotch, Irish, German, or other European parentage, who have always been considered and treated as citizens of the United States.”
The later rulings, of which I provided only a few of many examples, confirmed that this ruling applied to children born in the US despite their parents’ immigration status.
“Certainly I want Trump to explore the limits of his ability to protect American Citzens from invasion and exploitation. I can’t imagine why you are opposed to that.”
Would you be ok with Trump ordering ICE shooting illegals dead, so that he might test how far his limits go?
Too much? How about holding them without trial in a gulag with the drinking water coming out of the cisterns of uncubicled toilets, with no sanitary conditions and contaminated food? As has already been done? (Check out alligator Alcatraz)
When a government does not respect the rule of law you get crap like this. Banana republic, third world crap like this. Gulags and masked armed forces rounding people up.
“That seems senseless and represents an extremely weak executive branch fearful of actually enforcing the law because of even a remote possibility of being found not in compliance.”
You really love these straw men don’t you?
How about Trump uses his majority in congress to inspire legislation? How about actually writing law, instead of stretching it? How about using legal instruments properly?
Trump has had a fine opportunity to use a sycophantic Republican party in congress to pass any number of laws to authorise his actions.
But he hasn’t even tried. Because he is not interested in legislation or the balance of powers. As you already admitted, he is a CEO president. One who wants to dictate, and try to overcome or ignore the courts and legislation.
This is what dictators do. They want to rule, not govern.
“Its all in the dataset I linked you to Barry. The job you volunteered for”
What a fantastic imagination you have. I did not volunteer to come up with a theory on your behalf. I asked you to lay one out so I could test it.
I’ll quote myself:
“You’ve rejected the 60-year orbital variations I know of regarding Earth’s LOD and speed…(?), so I want to get the specific 60-year orbital variation you are speaking about that affects Earth. You are saying it is about Earth’s distance to the sun, right? A 60-year cycle that correlates with the potential 60-year climate cycle, yes?
Reference to a research paper would be greatly appreciated.”
You provided a paper on LOD earlier, the only paper you’ve referenced which links a 60-year orbital/rotational variation to terrestrial climate.
If you have something well-developed, let me know. If you’ve got vague ideas, you’re on your own.
I asked a couple of posts ago if Trump set your hair on fire with his inflammatory rhetoric.
“Certainly I want Trump to explore the limits of his ability to protect American Citzens from invasion and exploitation.
The answer, clearly, is YES.
• barry says:
‘’The courts have ruled against the Trump administration far more often than in favour. 90% against in his first term, which is entirely unusual. And he is losing because he is transgressing the law. The constitution as well as legislation. That is what the rulings say. ‘’
Well you just believe whatever your daddy tells you. You need to produce a source that lists all lawsuits against his administration and all the rulings including appeals courts and the Supreme Court that sustains or denies every judgment and then compare that to every other President.
Statements by political advocacy groups isn’t sufficient as it was announced by leaders of the democrat party after they lost public support across the board that their strategy against Trump was going to be legal. Many lawsuits have been filed for example against Trump for using racial profiling illegally and injunctions against that behavior, which I suspect your daddy calls a win. Trump doesn’t even need to respond as he isn’t illegally doing what was alleged. Racial profiling is permissible as long as it is not the only reason for making a stop. Thus Trump’s DOJ only needs to run an investigation and develop other evidence before conducting a raid. Which obviously they are doing.
• barry says:
‘’Trump claims that “saving the country breaks no laws.” Abrego Garcia was deported in defiance of a court order, and the administration then defied a 2025 order to bring him back, saying they were unable to (later shown to be a lie when they eventually did bring him back).’’ LOL! Garcia was sent to El Salvador, the nation he is a citizen of. It was the President of El Salvador who sent him back not the DOJ.’’ So we are seeing how bogus your mathematical arguments with the first example.
• barry says:
‘’The administration was ordered to stop planes deporting people to el Salvador – they did not comply. Spokesperson for Trump said, “A single judge in a single city cannot direct the movements of an aircraft carrier full of foreign alien terrorists who were physically expelled from U.S. soil.”
Your second example probably notches up multiple wins on this in that several injunctions were offered up, 2 named and one for provision class. In addition it was allowed by some appeals courts. The Supreme Court vacated all the judgments of this nature with one decision, saying. In re Bonner, 151 U. S. 242, 254, 259 (1894). For “core habeas petitions,” “jurisdiction lies in only one district: the district of confinement.”
Ultimate core courts zero, Trump one.
You then go on to blabber about decisions that weren’t about anybody who snuck into the country and dropped a baby out of their womb and complain generically about Trump having the balls to stand up to tyrannical judges bent of stripping the President of his constitutional powers being the hallmark of a dictator while ignoring precedence set by many Presidents and not calling them dictators as well.
As time goes on your argument here is getting weaker and weaker and more bogus than ever.
• barry says:
‘’What a fantastic imagination you have. I did not volunteer to come up with a theory on your behalf. I asked you to lay one out so I could test it.’’
I didn’t ask you to calculate a theory Barry. I asked you to calculate the additional sunlight that the earth receives from the 5 day disruption within Earth’s annual orbit between 1980 and 2023 out of the rotational data found at the US Naval Observatory.
Now you are making bogus excuses to not do that because you know I am right that this is significant amount of additional sunlight.
But whats new. . .I just showed above how bogus your arguments are that Trump is a wannabee dictator.
Feel free to leave the conversation if you wish since its going nowhere with you resorting to obviously bogus arguments and excuses. If you want a nose ring for your party to lead you with I can help you with that also as that appears all I can help you with.
Now that the US Coast Guard has kinetically stopped a go fast boat with known terrorists and illegal drugs on board in international waters who ignored orders to voluntarily stop, your daddies are now standing up for terrorists and the illegal import of drugs that have killed hundreds of thousands of American citizens. Good luck with that.
Here you go:
“Former US President Donald Trump has lost 93% of cases brought against his administration in court, according to the Institute for Policy Integrity at the New York University School of Law. The Institute found that the Trump administration lost 79 out of 85 cases involving federal agencies on deregulatory or policy issues. This is a historically low 7.1% win rate, with most administrations achieving a 70% win rate.”
https://lawshun.com/article/when-trump-lost-law-case
This comes from a Law school, not a political advocacy group.
If you want to check out all of Trump’s first administration lawsuits, including those not mentioned in the list – most of which were NOT challenges to the Trump administration’s policy and regulatory actions, you can see them here.
https://policyintegrity.org/trump-court-roundup
Even including cases that were pro forma and routine, like government enforcement of EPA regulations on polluters, social security claims, or prosecuting employers for bad labour practises, the Trump administration STILL lost 78% of all cases.
“LOL! Garcia was sent to El Salvador, the nation he is a citizen of.”
He was illegally sent there in defiance of a court order forbidding him being sent to that exact country. Because he was at risk there. SCOTUS concurred that this action was illegal (see below).
“It was the President of El Salvador who sent him back not the DOJ”
The DoJ presented the el Salvadoran government with an arrest warrant for Abrego Garcia, after ignoring the court’s instruction for weeks, and only after the court applied more and more pressure. Pam Bondi made sure to publicly thank the self-styled dictator of el Salvador.
The Trump administration could always have got him back, they just didn’t want to respect the court’s order.
“In re Bonner, 151 U. S. 242, 254, 259 (1894). For “core habeas petitions,” “jurisdiction lies in only one district: the district of confinement.”
You’ve cited the wrong case. You mean Rumsfeld v Padilla, which actually weighs against Trump admin – see the SCOTUS ruling below. The court requiring the administration return Abrego Garcia is in DC. Abrego’s confinement location was irrelevant because it wasn’t a core habeus petition, it was a statutory/constitutional challenge against the government.
Which Trump lost, and then defied the court order.
SCOTUS weighed in on this and agreed Abrego Garcia had been illegally sent to el Salvador and had to be returned.
“The United States acknowledges that Abrego Garcia was subject to a withholding order forbidding his removal to El Salvador, and that the removal to El Salvador was therefore illegal…
The [District Court] order properly requires the Government to ‘facilitate’ Abrego Garcia’s release from custody in El Salvador and to ensure that his case is handled as it would have been had he not been improperly sent to El Salvador.”
Three of the justices commented in respecting the decision:
“To this day, the Government has cited no basis in law for Abrego Garcia’s warrantless arrest, his removal to El Salvador, or his confinement in a Salvadoran prison. Nor could it. The Government remains bound by an Immigration Judge’s 2019 order expressly prohibiting Abrego Garcia’s removal to El Salvador…
The Government now requests an order from this Court permitting it to leave Abrego Garcia, a husband and father without a criminal record, in a Salvadoran prison for no reason recognized by the law. The only argument the Government offers in support of its request, that United States courts cannot grant relief once a deportee crosses the border, is plainly wrong. See Rumsfeld v. Padilla, 542 U. S. 426, 447, n. 16 (2004); cf. Boumediene v. Bush, 553 U. S. 723, 732 (2008). The Government’s argument, moreover, implies that it could deport and incarcerate any person, including U. S. citizens, without legal consequence, so long as it does so before a court can intervene… That view refutes itself.”
bill hunter wrote: “Ultimate core courts zero, Trump one.”
You have muddled this up spectacularly. Where are you getting your information?
“Trump having the balls to stand up to tyrannical judges bent of stripping the President of his constitutional powers being the hallmark of a dictator while ignoring precedence set by many Presidents and not calling them dictators as well.”
Tyrannical judges? Have you become a mouthpiece for the administration now?
Republican and Democrat judges alike have ruled against Trump’s authoritarian moves. It’s not partisan and it’s not a conspiracy. Try not to be wilfully blind to what’s going on. Maybe you’ll learn to get the name of the court case you are quoting correct, or even get the century in which it was written right.
Trump has just now renamed the DoD the Department of War and threatened to unleash it on Chicago. Yes, some of it is theatrics, but it is also perfectly in line with the strong-arm branding of an authoritarian regime. The intent to send National Guard to Chicago without consulting with the state is quite serious.
Conservatives would have screamed blue murder if Obama did anything like this. The fed overriding states is tantamount to treason – in any but the Trump era. Now we know that many conservatives secretly longed for a dictator to take control.
You can check out Trump’s current court success rate at this link:
https://www.nytimes.com/interactive/2025/us/trump-administration-lawsuits.html
The only way I can access this, not being a subscriber, is to go through the wayback machine.
https://web.archive.org/web/20250830041457/https://www.nytimes.com/interactive/2025/us/trump-administration-lawsuits.html
“I didn’t ask you to calculate a theory Barry. I asked you to calculate the additional sunlight that the earth receives from the 5 day disruption within Earth’s annual orbit between 1980 and 2023 out of the rotational data found at the US Naval Observatory.”
Learning how to use the portal to do the groundwork for YOUR claim is way too onerous. Come at me with something better than “figure it out yourself.” I’m certainly not jumping through multiple hoops on your whim. I’ve asked for a cogent theory, not to do your homework for you.
“Now that the US Coast Guard has kinetically stopped a go fast boat with known terrorists and illegal drugs on board in international waters”
“Kinetically stopped”
Orwell would be proud of you. The administration just murdered some probable drug-smugglers in foreign waters that were heading to a nearby island.
If the administration was just it would lay out its case for the legality of the strike, and the evidence for why it was essential that military action be taken.
Trump-lovers will be satisfied with what daddy tells them and tell the bad people criticising daddy how dumb they are.
Wikipedia also have a page on the 2nd Trump administration court cases, if you’re interested.
https://en.wikipedia.org/wiki/Legal_affairs_of_the_second_Trump_presidency
barry says:
”Learning how to use the portal to do the groundwork for YOUR claim is way too onerous.”
Barry it was a suggestion that you do it for yourself. You complain about the 5 days additional sunlight and how many additional watts that comes to.
I simply gave you some information for you to figure it out if you actually want to dispute what I have been saying.
The website I gave you it gives the dates and times of day the earth passes through aphelion and perihelion. So you can easily calculate the duration of a half orbit and see how much it varies over time.
From that using the geometry of half orbits of an ellipse and the fact the difference in sunlight from aphelion to perihelion is 7% you can figure out how much change in sunlight occurs from one year to another.
You could start by just acknowledging that there is a significant variation of sunlight received annually rather than simply denying it without any evidence.
And that amount of change doesn’t even consider how distance to the sun varies. If it moves slower near the sun it will get nearer to the sun. If it moves faster further from the sun it will get further from the sun increasing the effect. Then on top of that you have to consider changes in the solar spectra due to solar cycles and groups of solar cycles. Unfortunately we don’t have calibrated measures of that over long terms but we do know its yet another factor.
Either you have the interest in this as you have expressed you are in addition to your willingness to calculate correlations. I said there is a correlation from 1980 to 2023 that correlates to recent warming and a 5 day difference in sunlight between the two extremes of the orbit from perturbations of other celestial bodies.
xxxxxxxxxxxxxxxxxxxxxxx
xxxxxxxxxxxxxxxxxxxxxxx
xxxxxxxxxxxxxxxxxxxxxxx
xxxxxxxxxxxxxxxxxxxxxxx
xxxxxxxxxxxxxxxxxxxxxxx
xxxxxxxxxxxxxxxxxxxxxxx
Barry says:
” ”Kinetically stopped”
Orwell would be proud of you. The administration just murdered some probable drug-smugglers in foreign waters that were heading to a nearby island.”
Illegal and dangerous drugs are intercepted and attempts to deal with that occurs where ever they are found.
A great old movie laid out the frustration of dealing with drug trade. The 1971 movie ”French Connection”. Here the enforcement of drug laws are show to be violent and futile and enforcement actions questioned by those in authority (darned good movie). . .which apparently to you means we have been living in an Orwellian world for a long time.
An authorization of dealing with this effectively has been granted to the President by Congress. This activity is authorized under the the Antiterrorism and Effective Death Penalty Act of 1996. Among that Act and others Congress has instructed the President to:
(4) the President should use all necessary means, including
covert action and military force, to disrupt, dismantle, and
destroy international infrastructure used by international
terrorists, including overseas terrorist training facilities and
safe havens
The President is merely following Congress’ direction in an Act signed by President Clinton and which was followed by the Patriot Act that allowed for identifying terrorist harboring states and organizations. Presidents 42 through 47 have been actively using this authorization to do as Congress instructed.
Barry says:
”If the administration was just it would lay out its case for the legality of the strike, and the evidence for why it was essential that military action be taken.”
I think I just did it for you as it has been public knowledge now for almost 29 years.
10s if not 100s of thousands of American’s are dying from dangerous drugs being illegally imported into our nation, mostly by named terrorist organizations. And also into other nations as well. That should satisfy the standard of ”essential” that you are searching for.
The bottom line is these go fast boats go faster than our destroyers and coast guard cutters. With the employment of the Reaper drone by all the Air Force, Navy, Army, Marine Corp, and Coast Guard we don’t have to let these guys pass any longer and hope that we will get another chance to catch them.
And to not do that will result in more US civilians being murdered by these terrorists.
Do you disagree? If so why?
“You could start by just acknowledging that there is a significant variation of sunlight received annually rather than simply denying it”
Why did you just lie about me denying it?
AEDPA doesn’t give the president authority to conduct military strikes. It gives the Sec of State powers to designate terrorists groups.
“Section 324. Findings and Purpose
Congress makes the following findings:
International terrorism is a grave and deadly problem that threatens the vital interests of the United States.
The United States has an inherent right of self-defense against international terrorists.
International terrorists often operate through networks and safe havens located in foreign countries.
4. The President should use all necessary means, including covert action and military force, to disrupt, dismantle, and destroy international infrastructure used by international terrorists, including overseas terrorist training facilities and safe havens.”
This is policy guidance, not authorization – precatory language.
The administration has not formally cited any legal basis for a military strike on non-combatants in international waters. The action breaks international law.
You can keep looking for a legal basis and try to make the administration’s case for it, but the point I’m making is that the administration claims supreme executive power. They are not interested in legality, only the unitary power of the president.
“Presidents 42 through 47 have been actively using this authorization to do as Congress instructed.”
No president has ever used the AEDPA as a basis to bomb drug-smugglers. Nor has the Trump administration claimed such a thing. This action is entirely without precedent.
This was an extra-judicial execution of alleged criminals in international, not a defensive attack on combatants.
Would you be ok with Trump ordering ICE to execute people on US soil they say are foreign drug smugglers? I think you would justify nearly any extra-judicial killing done by the Trump admin, because you are attracted to shows of force and summary execution as a deterrent. Did you get that vibe from the movies?
“10s if not 100s of thousands of American’s are dying from dangerous drugs being illegally imported into our nation”
The Trump administration says the Venezuelan leader is in cahoots with the gang they just fired on. Would you support an invasion of Venezuela to oust this Trump-alleged criminal that supports these narco-terrorists? Or would you need to see some evidence of this collaboration?
I reckon not.
“With the employment of the Reaper drone by all the Air Force, Navy, Army, Marine Corp, and Coast Guard we don’t have to let these guys pass any longer”
They were 500 miles from the US heading to a nearby island, according to Marco Rubio. Rubio also said they elected not to interdict.
The Navy interdicts fast boats with ease. They can also disable them from a distance. The administration chose to execute the people on board.
Why the fuss? Just more evidence of Trump’s contempt for law and precedent, now with lethal results. every move he makes is in line with authoritarian governments. You might as well start arguing that authoritarianism is a good way to govern. You’re most of the way there already.
“And to not do that will result in more US civilians being murdered by these terrorists.”
Murdered? What is this doublespeak? Drug smugglers do not force Americans to take drugs.
You’re getting further from reality as you try to rationalise an extra-judicial execution of non-combatants by a regime unconcerned with domestic or international law. Trump is now a vigilante.
Speaking of balance of powers, are you aware, bill, that Trump has issued several executive orders against law firms where people once worked who investigated him or represented people who did?
Judges have ruled that these were unconstitutional orders, breaking the 1st and 5th amendments and violating the independence of the legal profession.
But the orders themselves tell you all you need to know about Trump’s respect for law. No other president has used their powers to attack law firms. This is Trump-era madness. You address judicial differences through legal processes, or by writing legislation, not by autocratic fiat. Only Trump does this level of overreach.
Barry says:
”No president has ever used the AEDPA as a basis to bomb drug-smugglers.”
Its the job of the President to establish precedence in foreign affairs Barry and he did so under the guidance provided by Congress.
These drug smuggling gangs are terrorists and have been legally declared to be so for about 6 months.
They have murdered more American citizens than all other terrorist groups combined.
Bottom line is your recommendations have been followed now for decades with negative success. Don’t be asking that Trump continue to pursue impotent methods of dealing with this public endangerment that has risen to the level of terrorist armies invading our shores from foreign nations while the leaders of these cartels live in palatial estates and government officials are either involved or to fearful to move aggressively to eliminate this threat.
Try to be thankful that Trump is taking a more aggressive stance to eliminate these cartels. You don’t get a Kings X pass because you are in international waters. We have shown that when dealing with the Somali pirates as well. . .which mostly affects corporations and large shipping companies. The drug crisis mostly affects less fortunate citizens.
Meanwhile you piss and moan about Trump’s aggressive actions and court cases against his executive orders. Current score on fully decided cases stands at plantiff wins zero and Trump administration wins 7.
Even if he ends up losing the action against certain law firms that’s not going to come close to turning that score around.
Barry says:
”The Trump administration says the Venezuelan leader is in cahoots with the gang they just fired on. Would you support an invasion of Venezuela to oust this Trump-alleged criminal that supports these narco-terrorists? Or would you need to see some evidence of this collaboration?”
Of course not. Trump’s administration reportedly has a cartel leader giving evidence of such collusion currently incarcerated turning state’s evidence to which the administration and military have upped the surveillance and prevention efforts on particularly coming from Venezuela. I will be disappointed if Trump doesn’t produce evidence for such an action noting that he probably won’t unless fired upon. After all he wants the Nobel Peace Prize and all his actions so far with regard to wars has been the right actions. He will probably continue to handle the Maduro regime as he has been and he may take actions specifically against cartels within Venezuela’s borders as well as other nations allowing this to continue. These actions will likely be pinpoint targeted with the Reaper drones as was the cartel smuggling vessel. And of course Presidents 42 through 47 have all done this against named terrorist organizations.
Barry says:
”Why did you just lie about me denying it?”
Because its not a lie. Sticking ones head in a pile of sand is a form of denial.
It appears you are aware of the fact that there are solar input differences while climate change scientists surreptitiously evade the topic saying there is no significant change in sunlight reaching earth and then proceed to show short term surveys of solar brightness as there only evidence. That’s effectively a lie because quite simply the topic is being suppressed as opposed to being thoroughly investigated as it should be.
“Its the job of the President to establish precedence in foreign affairs”
No it isn’t. That is not written in the constitution or anywhere else. It’s a fabricated bit of rhetoric to try to buttress an extrajudicial act of war.
“and he did so under the guidance provided by Congress”
Congress did not authorise this action. The AEDPA does not give authority for action, only designation. No other act of congress authorises the president to use the military against alleged drug smugglers. Designating drug smugglers as terrorists does not sanction military action.
After publicly admitting it hadn’t sorted out a legal basis for the action after the event, the administration came up with a pretext under Article 2 of the constitution. However, this still requires congressional authority.
So while conservative commentators try to run cover for the administration, the administration’s own attempts to provide a legal basis for murdering 11 people in international waters have fallen short. Evidently they did not consider the legal basis until after the fact. No surprises there.
And no surprises that you are trying to defend this acton by singing from the administration hymnbook on drug smugglers being the same as armed combatants shooting at US interests.
“Current score on fully decided cases stands at plantiff wins zero and Trump administration wins 7.”
Yep, the admin has won 7 unappealable cases and been blocked on a plethora more. In their favour is a Supreme Court with 3 Trump appointees and a conservative majority that seems to favour the unitary power of the presidency, so we’ll see if they keep backing authoritarianism.
“he may take actions specifically against cartels within Venezuela’s borders”
I have no doubt. The Bush administration argued hard before breaking international law and invading Iraq. Trump won’t bother with a legal justification.
“And of course Presidents 42 through 47 have all done this against named terrorist organizations.”
They did this with al Qaeda and affiliated groups. Targeting al Qaeda had congressional authority. There is no such authorisation here. If you think AEDPA gives the pres authority, why did congress need to give approval to target al Qaeda? Answer, AEDPA doesn’t give authority. Neither does the Act giving George W authority to target al Qaeda give permission to attack other terrorist groups.
“Because its not a lie. Sticking ones head in a pile of sand is a form of denial.”
Yeah, you lied, and now you’re telling some other story.
barry says:
‘’No it isn’t. That is not written in the constitution or anywhere else. It’s a fabricated bit of rhetoric to try to buttress an extrajudicial act of war.’’
So you must also consider the actions of Clinton and Obama when they used missiles against terrorist targets they designated. Hopefully you are intelligent enough to be consistent.
x
x
barry says:
‘’ ‘’and he did so under the guidance provided by Congress’’
Congress did not authorise this action. The AEDPA does not give authority for action, only designation.’’
So exactly how do you define the clause in the act that says: ‘’The President should use all necessary means, including covert action and military force, to disrupt, dismantle, and destroy international infrastructure used by international terrorists, including overseas terrorist training facilities and safe havens.’’
Clinton ordered ‘’Operation Infinite Reach on August 20, 1998, two years after AEDPA, in retaliation for al-Qaeda’s bombings of U.S. embassies in Kenya and Tanzania. The operation involved simultaneous Tomahawk cruise missile strikes on targets in Afghanistan and Sudan.’’
So you are operating on a double standard here Barry. You are listening to your daddy’s legal experts not reading the law. The law did not designate Al-Qaeda as an FTO. Madeline Albright did and Clinton attacked before the designation as the designation was not made until 1999. Then Obama didn’t use AEDPA either nor seek Congressional approval for the Syria intervention.
x
x
Barry says:
‘’You are trying to defend this acton by singing from the administration hymnbook on drug smugglers being the same as armed combatants shooting at US interests.’’
They are worse Barry and they do more damage. And where exactly do you get the condition it has to involve shooting? They used bombs in the example above.
x
x
Barry says:
‘’In their favour is a Supreme Court with 3 Trump appointees and a conservative majority that seems to favour the unitary power of the presidency, so we’ll see if they keep backing authoritarianism.’’
That’s ridiculous Barry. Conservatives stand for lesser government but defend the itemized powers and rights outlined in the Constitution. You invoke politics when it was tyrannical judges ignoring the Constitution who caused these stupid lawsuits to go to the Supreme Court obedient to their masters in the DNC and their strategy to use the judiciary to strip Trump of his powers.
x
x
Barry says:
‘’ ‘’he may take actions specifically against cartels within Venezuela’s borders”
I have no doubt. The Bush administration argued hard before breaking international law and invading Iraq. Trump won’t bother with a legal justification.’’
The action against Iraq did not involve a designation of Iraq as an FTO. So Congressional approval was needed.
x
x
Barry says:
‘’They did this with al Qaeda and affiliated groups. Targeting al Qaeda had congressional authority. There is no such authorisation here. ‘’
AEDPA of 1996 was a Congressional delegation of authority. Congress can act to pull back that authority and/or remove organizations or categories of FTOs from the list. So far Congress has not elected to do this.
Bush used executive order 13224 to expand FTOs to entities and individuals. Trump issued an executive order to expand the categories to include international drug cartels and other violent transnational criminal gangs.
x
x
Barry says:
‘’Yeah, you lied, and now you’re telling some other story.’’
Lied about what?
BACK AT THE RANCH
A Republican candidate who ran unsuccessfully for Congress in Nevada in 2020, and was endorsed by Donald, was charged with killing a man at a Las Vegas Strip resort last year.
https://www.nytimes.com/2024/03/08/us/politics/ex-gop-candidate-dan-rodimer-murder.html
Donald recognizes true winners!
Measured water vapor increase is about 40 % more than significantly possible from just planet warming. The upper limit to water-vapor-increase from warming is bounded by the Clausius-Clapeyron relation. This FALSIFIES the assumption that water vapor increase is just feedback from temperature increase caused by CO2 increase. Verification is at recent update to https://watervaporandwarming.blogspot.com
Buy American only! Right now!
Le Monde, 2025 Aug 26
Tariffs: 25 Countries Suspend Packages to the United States
” The Trump administration has decided, effective August 29, to eliminate the customs duty exemption that previously applied to packages worth $800 or less. ”
*
Of course, this won’t be worth it for the MAGAmaniacs: They won’t buy anything outside the US, let alone know anyone outside the US who would want to send them a gift.
*
And the one guy in the US who cares least about such a truly social, yet in his eyes, infinitesimal detail is the Trump~ing boy, the dumbest, most arrogant, and most incompetent US president of all time.
Compared to him, even Nixon, Reagan, and Dubble U were, by and large, pretty intelligent people.
If you want to send packages f.ex. from Europe to USA, you need to know how to pay the tariffs. There is no system for that yet and no information available. That is why many European countries had to suspend sending packages to the United States. Previously importers payed the tariffs, now it’s other way round.
No, Max, this applies to a small subset of (personal, not commercial) packages where the sender decides they will pay the tariff themselves. If the sender does not pay the tariff, the recipient pays it at the other end, like every American business does, before passing the cost on to consumers, unless they elect to absorb the loss.
Bindidon says:
”Tariffs: 25 Countries Suspend Packages to the United States”
a big nothing burger. First ”countries” generally don’t send packages. Shipping companies do.
US carriers with global service Fedex, DHL, and UPS are all operational. some third rate services may have suspended operations but its not likely any reliable foreign vendor can’t find a shipping company still in business and able and ready to handle tariffs especially considering how many countries charge tariffs.
But I suppose Bindidon doesn’t use a single shipper and depends upon some national socialized mail system that also does packages. That’s generally not a good idea in overseas shipping as a lot of people get burned or massively delayed on lost or damaged packages over disputes or uncertainty over which service was at fault because all those packages get moved between shipping companies. So those methods can get both complicated and/or expensive in a hurry.
Bindidon says:
”Of course, this won’t be worth it for the MAGAmaniacs: They won’t buy anything outside the US, let alone know anyone outside the US who would want to send them a gift.”
Bindidon who fancies himself as a member of the jet setting elite is likely to go cross eyed looking down his nose at everybody else.
My prayers go out to the family of Charlie Kirk and Iryna Zarutska. Its hard to imagine the evil that went after these two kind and gentle persons. Nobody deserves that and thats especially true for these two.
“Its hard to imagine”
Ask Melissa Hortman’s family, for whom not one single troglodyte said a thing.
Willard I have no idea what you a babbling/complaining about.
Seems to me you are the only guy in here complaining about posts asking for folks to pray for the families of innocent victims of evil.
Chris Cuomo probably said it best that Kirk will likely be most remembered by his millions of young admirers as the guy who ”made debate and disagreement, without being disagreeable, cool again.
That certainly won’t apply to you.
Import tariff money goes the same place as tax money. So, an import tariff is much like a tax. The difference is that it is a voluntary tax. If you don’t want to pay it, don’t buy the product.
There are specialist steels used in American nuclear submarines, only available from a supplier in England.
Perhaps the US should stop making nuclear submarines.
Since England gets their nuclear submarines from us, maybe it all works out in the end.
That sounds like something that you just made up. There is nothing magical about steel.
SOLAR MINIMUM UPDATE
MERTARVIK, Alaska (AP) — Growing up along the banks of the Ninglick River in western Alaska, Ashley Tom would look out of her window after strong storms from the Bering Sea hit her village and notice something unsettling: the riverbank was creeping ever closer.
[…]
Today, erosion and melting permafrost have just about destroyed Newtok, eating about 70 feet (21.34 meters) of land every year. All that’s left are some dilapidated and largely abandoned gray homes scraped bare of paint by salt darting in on the winds of storms.
https://apnews.com/article/climate-change-permafrost-melting-alaska-newtok-relocation-moving-292694f057b75f75a9438c794853ee25
Drill, baby, drill!
I wonder if the cult kids understand the mountain ranges are also “washing away”.
Of course not….
Hey, Puffman, riddle me this –
Suppose your President took a homeowner tax exemption on his Donald Tower suite while living in the White House: is falsely claiming a residence for financial benefit cause for dismissal?
Do mountains erode, silly child?
Got any mail from Japan, Germany, Austria, Denmark, Italy, France, or Sweden recently, Puffman?
That’s my point, child. You have no clue about the things you find on the Internet. You’re just throwing crap against the wall, hoping somehow to pervert reality.
Grow up.
I thought you were only “asking” a question, Puffman.
A dark money group paid $80,000 to Noem’s personal company when she was governor of South Dakota. She did not include this income on her federal disclosure forms.
That’s fine with you?
That has NOTHING to do with “erosion and melting permafrost” in Alaska, child.
See how you deviate and pervert? You often don’t know anything about the subject. You just hope something works for you.
You’ll be here all day, trying the same failed tricks.
Your dogwhistling about erosion has no RELEVANCE whatsoever, Puffman.
But thank you for allowing me to remind denizens that Donald’s White House is awashed with xanax and speed:
https://www.rollingstone.com/politics/politics-features/trump-white-house-drugs-speed-xanax-1234979503/
Have you thought of not rooting for fascist drug addicts?
Now you’re denying your own link, silly child.
Keep proving me right.
You’re the one trying to deny that snow and ice ain’t water, Puffman.
Riddle me this:
Do you like that the rich buy their under-achieving children’s way into elite universities with massive, tax-deductible donations?
No only are you denying your own link, but now you’re stooping lower with false accusations.
Keep proving me right, silly child.
I can take it.
Keep acting like Mike, Puffman, I can take it.
Reply to this comment.
perma frost, in an area which was once in the middle of a huge forest, before the cold killed the trees and fire destroyed them, in a few more centuries the forests may return to the Arctic.
Thawing releases CO2 rapidly in the atmosphere, and you ought to know what happens then:
https://www.cbc.ca/news/canada/edmonton/the-world-s-permafrost-is-rapidly-thawing-and-that-s-a-big-climate-change-problem-1.6674976
FEMA employees who warned Congress that FEMA, with its staff cuts, and new red tape, is now unprepared for hurricane season, have been punished and put on leave.
They also pointed out that the Law passed after Hurricane Katrina requires a head be appointed who is experienced in emergency management, which the current interim head is not.
More echoes of the Soviet Union in decline, where exposing bad news was punished, which led to failures like Chernobyl.
FEMA has been only effective at wasting money. They are useless during emergencies. Just ask the victims.
A complete rebuild of the Agency is necessary.
You know NOTHING about wasting money, Puffman.
Here’s wasting money:
“In his 17-month stint as UF president, Ben Sasse more than tripled his office’s spending, directing millions in university funds into secretive consulting contracts and high-paying positions for his GOP allies.”
https://www.alligator.org/article/2024/08/sasse-s-spending-spree-former-uf-president-channeled-millions-to-gop-allies-secretive-contracts
You sure repeating your silly talking points will work?
UF is NOT FEMA, silly.
You really are desperate.
What childishness will you try next?
FEMA isn’t effective about wasting money, Puffman:
The UFC plans to host a fight card on the White House grounds, a spokesperson for the promotion confirmed to NBC News on Friday. Further details were not available, but Donald said he would like it as part of a celebration honoring America’s 250th birthday on July 4, 2026.
https://www.nbcnews.com/sports/mixed-martial-arts/ufc-trump-white-house-fight-card-2026-rcna216982
THIS is an effective waste of money.
Well, you’ve proved me right yet again, silly child.
Now do it again by getting in the last word.
Here’s real waste, Puffman:
Florida’s immigration jail known as “Alligator Alcatraz” will probably be empty of detainees within days, a state official has said, indicating compliance with a judge’s order last week that the facility must close.
You got NOTHING, not even good riddles.
We’ve reached the Benito Mussolini stage of fascism.
Someone should remind Trump how that ended.
Just doesn’t seem Reich. Makes me Führious.
sehr gut !
Did you know that one of Hitler’s slogans was “Make Germany Great Again” …… MAGA !! True.
America lost hundreds of thousands of good men defeating fascism in WWII. That legacy demands we recognize the warning signs when leaders embrace authoritarian rhetoric, attack democratic institutions, and place loyalty to themselves above loyalty to the Constitution.
Now PP, is that really true?
Did hitler ever say “make Germany great again”?
Hey Puffman, riddle me this:
Why is it that Robert E. Lee’s never achieved a rank higher than Colonel, unless you count a bogus organization that has never been recognized internationally?
Speaking of ChatGPT
Hey ChatGPT, is the following correct?
A surface at 205K is emitting 100 W/m2. An identical surface is at 355K emitting 900 W/m2. The average flux is 500 W/m2, but that calculated average has no meaning because fluxes can not be averaged.
The average temperature of the two surfaces is 280K, resulting in an emission of 349 W/m2. And that is what is meant by “Flux does NOT average”.
This has already been discussed. The LLM AIs hallucinate. It’s a well known problem, and this is just one more example.
LLMs “learn” from the Internet. But, they do not understand logic. I even gave an example of what I was referring to, but the AI was unable to respond properly. It just went off on its own hallucination.
It’s not really unlike the way cult kids behave….
[Me] based on the basic error committed in the original comment, would you surmise that the person who made the original comment is dishonest or just poorly educated?
[ChatGPT] Without knowing the author’s background, the safest assessment is that the remark reflects a lack of education in radiative physics. The Stefan-Boltzmann law is standard undergraduate-level material, and the distinction between averaging flux versus averaging temperature is central to planetary energy balance.
[Me] Virtual high five ChatGPT.
“What does not average linearly is temperature, because the Stefan-Boltzmann relation is nonlinear. Confusing the nonlinearity of the flux-temperature relation with the idea that fluxes cannot be averaged is a category error. Climate scientists explicitly account for this when defining the planet’s effective radiating temperature: they average fluxes and then apply the Stefan-Boltzmann relation.”
I’m reliably informed that nobody here disputes that when you average fluxes, you get the “wrong temperature” when you take the overall average flux value and convert that figure to a temperature value using the SB Law. That means nobody here disputes that ChatGPT is wrong, at least about the paragraph quoted above. See here:
https://www.drroyspencer.com/2025/08/uah-v6-1-global-temperature-update-for-july-2025-0-36-deg-c/#comment-1713007
A real time definition of Confirmation Bias: dismissing an LLM’s response as mere “hallucination” when it conflicts with your pre-existing beliefs, yet accepting without hesitation those answers that align with your expectations.
Yes Ark, your confirmation bias combines with your ignorance of science and TDS to completely shut down your ability to think rationally.
I’ve spent enough time with ChatGPT to see how it hallucinates. For example:
My question: “What are the vectors acting on Moon”
ChatGPT responds:
I ignored some of the minor mistakes, but asked: “Did you leave out Moon’s velocity?”
ChatGPT responds:
So the AI completely omitted the velocity vector, got caught, made excuses, then started trying to teach me about vectors!
That’s just like the cult kids do! That’s why it’s called “ARTIFICIAL intelligence”.
I can’t help but notice the condescending tone ChatGPT adopts towards you! As if dealing with a toddler, no? But I digress.
I fed all your dog’s breakfast of a comment to ChatGPT and here is what it said:
Dang Ark, you’re getting as bad your cult brother (sister?), silly willy.
The AI completely omitted the velocity vector, got caught, made excuses, then started trying to teach me about vectors!
That’s just like the cult kids do! That’s why it’s called “ARTIFICIAL intelligence”.
What will you try next?
Riddle me this, Puffman:
“The solar constant is the average solar irradiance at the top of Earth’s atmosphere, about 1361 W/m².” – ChatGPT
Is the solar constant impossible?
I wrote above that the LLM addresses Clint R as if he were a toddler.
So, I asked ChatGPT to critique the tone adopted by the LLM in Clint R’s post above.
Here’s what it said:
Even ChatGPT thinks Clint R is an eejit.
Ark, I deal in reality. So, insults and false accusations don’t affect me. That’s the difference between responsible adults and cult kids.
The AI completely omitted the velocity vector, got caught, made excuses, then started trying to teach me about vectors!
That’s just like you cult kids do! That’s why it’s called “ARTIFICIAL intelligence”.
What will you try next?
I need to explain some more on the solar energy/ planet surface interaction process – as I see it happening – to make it clear as much as I can.
When solar EM energy hits surface’s matter the following three things occur:
1). Reflection (SW), which is both – diffuse reflection and specular reflection (with specular reflection directional constituent).
2). Immediate (IR) emission, which is from the skin-surface-layer by interaction induced proces, which is observable by the skin-surface-layer’s elevated temperature.
3). A small fraction of the incident solar energy gets absorbed in inner layers in form of HEAT!.
*****************
*****************
When a planet or moon has a higher the (N*cp) product, the immediate (IR) emission lessens, and the small absorbed fraction gets larger.
Notice:
There is always some the immediate (IR) emission, because it is the result of solar EM energy interaction proces with surface’s matter.
When the (N*cp) product is lower, more (IR) EM energy goes out by the immediate (IR) emission, and less is retained as heat, so the average surface temperature is lower.
And,when the (N*cp) product is higher, less (IR) EM energy goes out by the immediate (IR) emission, and more is retained as heat, so the average surface temperature is higher.
Thus, the not reflected (SW) EM energy never gets absorbed in inner layers as heat in its entiety.
****************
****************
The planets and moons retain only a small fraction of the incident solar (SW) EM energy as heat.
Planets and moons surfaces emit – when they are not solar irradiated – very little (IR) EM energy.
They do not emit what the Stefan-Boltzmann emission Law requires for their respective surface temperatures.
–
https://www.cristos-vournas.com
What we see instead, what the established science of Earth’s Climate is doing?
They take the impossible number of 390 W/m2.
Then they take another impossible number of 240 W/m2.
And then, they calculate the difference of those two:
390 W/m2 – 240 W/m2 = 150 W/m2
The impossible 150 W/m2 !!!
–
https://www.cristos-vournas.com
Great, let’s break this down carefully. The statement tries to describe how solar radiation interacts with a planet’s or moon’s surface, but it contains **several misconceptions and flawed reasoning**—both conceptual and scientific. I’ll analyze it step by step.
—
### Main Flaws
#### 1. **Confusion Between Reflection, Absorption, and Emission**
* The statement splits the fate of solar energy into three outcomes (reflection, immediate IR emission, and absorption) but **misrepresents the physics**:
* Reflection is correct: some solar radiation is reflected (specular/diffuse).
* However, the idea of “immediate IR emission” being separate from absorption is **wrong**.
* Photons that are not reflected are **absorbed first**, increasing the internal energy of the material, which leads to heating.
* The emission of IR radiation is a **consequence** of absorption and thermal excitation, not a separate competing process.
* The description implies that sunlight somehow converts **directly into IR emission without being absorbed**, which is physically incorrect under standard radiative transfer principles.
—
#### 2. **Misuse of (N × cp) Product**
* The statement references a mysterious $(N \cdot c_p)$ product:
* Presumably, $N$ = density or number of particles, and $c_p$ = heat capacity.
* The text claims that a larger $(N \cdot c_p)$ means more energy retention and less immediate IR emission.
* This is **not how thermal emission works**. Thermal radiation is governed by **temperature and emissivity** (Planck’s Law, Stefan–Boltzmann Law), not directly by heat capacity.
* A higher heat capacity affects **how quickly** the surface temperature changes when absorbing energy, but it **doesn’t suppress IR emission** at equilibrium.
—
#### 3. **Misunderstanding of Stefan–Boltzmann Law**
* The text states:
> “Planets and moons surfaces emit… very little (IR) EM energy. They do not emit what the Stefan-Boltzmann emission Law requires for their respective surface temperatures.”
* This is **false**:
* Any object at a given temperature $T$ radiates energy per unit area as $\sigma \epsilon T^4$, where $\epsilon$ is emissivity.
* If a surface is at temperature $T$, it **must** radiate accordingly; emissivity may reduce the flux, but you cannot “violate” Stefan–Boltzmann.
* In steady-state, incoming absorbed energy balances outgoing IR radiation (ignoring minor conduction/convection losses for airless bodies).
—
#### 4. **Misrepresentation of Energy Flows on Airless Bodies**
* The statement implies that most solar energy is **not retained as heat**, and emission is “very little.” This is misleading:
* On airless bodies (e.g., the Moon), surface temperature rises until IR emission balances absorbed sunlight—this is basic radiative equilibrium.
* Heat is **not permanently retained**; it cycles daily. Without an atmosphere, nightside temperatures plummet because of rapid radiative cooling.
—
#### 5. **Overcomplication and Incorrect Use of Terms**
* Phrases like “interaction induced process” and “skin-surface-layer” are vague and non-standard. The process is straightforward:
* Photons are either **reflected** or **absorbed**.
* Absorbed photons **increase temperature**, leading to IR **reemission** per Planck’s law.
* No special category of “immediate IR emission” is needed.
—
#### 6. **Contradictory Reasoning**
* The statement says:
* “Immediate IR emission lessens when heat capacity is higher,” but then admits there is “always some IR emission because of interaction.”
* This contradicts itself: emission is dictated by **surface temperature and emissivity**, not capacity.
* Heat capacity only affects **how fast** temperature changes, not the equilibrium level of emission.
—
### Correct Physics Summary
1. Incoming **shortwave (SW)** radiation is either reflected (albedo) or absorbed.
2. Absorbed energy increases surface internal energy → raises temperature.
3. At thermal equilibrium, outgoing **longwave (IR)** emission equals absorbed solar energy (minus conduction/convection if relevant).
4. Stefan–Boltzmann law governs emission: $E = \epsilon \sigma T^4$.
5. Heat capacity affects **thermal inertia** (the speed of temperature changes), not emission at equilibrium.
—
### Key Takeaways for Improvement
* Clarify that **absorption always precedes emission**.
* Remove the idea that Stefan–Boltzmann doesn’t apply; it always does.
* Replace vague terms with precise radiative physics concepts (albedo, emissivity, thermal inertia).
* Emphasize **radiative equilibrium** rather than “small fractions retained as heat.”
* Avoid implying that heat capacity directly reduces emission—it only delays temperature rise.
—
Republican Sen. Joni Ernst won’t seek re-election in Iowa in 2026
I suspect that she’s trying to get a head start on other MAGAts before all the planes to non-extradition South American countries fill up.
The Grift is Strong
Yesterday’s Appeals Court’s decision striking down Trump’s tariffs as unconstitutional should have been a moment to restore trust in the integrity of U.S. trade policy.
Instead, it just highlighted Commerce Secretary Howard Lutnick’s glaring conflict of interest.
It is no secret that Lutnick had already positioned his former firm to benefit immensely from a policy reversal by buying tariff refund rights for 20-30 cents on the dollar.
The grift here is not even subtle. Banana Republic stuff!
America Held Hostage by the Dunning-Kruger Effect
https://www.huffpost.com/entry/trump-ignorant-moron_n_68af882fe4b0d635adb3ace1
Yes ignorance does start most wildfires ,but not climate change, as in the UK , a little bit of forest management would not come amiss. You reap what you sow.
There must have been a lot of arsons in Britain this summer, for this is the warmest summer on records.
Let’s blame immigration!
Ian Brown.
I don’t know of anyone who’s ever said that climate change is responsible for “starting” fires with a match. Do you have a source for that?
Nobody disputes the fact that the immediate ignition source of most wildfires is human activity whether negligence, arson, or accidents.
The scientific point is that climate change creates the conditions that make wildfires far more frequent, intense, and destructive due to longer droughts, record-breaking heat, and drier vegetation.
Forest management alone cannot offset systemic shifts in temperature and precipitation driven by rising greenhouse gases.
Sorry Ark, but summertime is NOT climate change. It’s seasonal change.
Summers occur every year, often coinciding with “fire seasons”.
Riddle me this, Puffman –
https://www.drroyspencer.com/2025/08/uah-v6-1-global-temperature-update-for-july-2025-0-36-deg-c/#comment-1713345
Judge Breyer finds that the Trump administration violated the Posse Comitatus Act with military deployments to Los Angeles.
https://storage.courtlistener.com/recap/gov.uscourts.cand.450934/gov.uscourts.cand.450934.176.0_1.pdf
I was told there would be winning.
Arkady says, climate change creates the conditions that make wildfires more frequent,intense and destructive, my point was, if you leave dead material to build up over time your asking for trouble, we had a couple of wildfires in the UK this year after only one dry season. on moors that were once burnt every year by land owners which acted as fire breaks. 1976 recorded the lowest ever soil moisture content yet any fires were easily contained because of centuries of management, now thanks to ignorance that has gone.the last two Summers have been like 1911 and 1912 in reverse, climate like weather changes.
Your point about fuel management is valid. However, this does not contradict the evidence that climate change is lengthening fire seasons, lowering soil moisture, and increasing ignition potential in the UK and across Europe.
Your comment reminded me of the Broken Windows Theory which says that neglect of small-scale management such as controlled burning and vegetation clearance, can create conditions where underlying systemic stressors turn manageable risks into destructive outcomes. In both contexts ignoring maintenance amplifies vulnerability to external shocks.
ark…I keep asking for the evidence and no one supplies it.
How can a 1C warming since 1850 possibly cause climate change, especially to the level of catastrophic predictions and claims? This is obviously a variability in weather. Temperatures are soaring by 10C in areas yet no one can explain how a trace gas does that, especially when it has been unable to do it the past 170 years.
I think we should be researching the relationship of global oscillations like ENSO, the AMO and PDO as suggested by Tsonis et al.
The forest fires are another matter. There is evidence that humans are causing significant fires, possibly related to arson. It won’t be the first time that alarmists have caused such problems. They throw paint on paintings in art galleries and damage SUVs for no good reason.
Here in Canada, lightning has always been a major cause of fires but why are the fires all of a sudden burning around towns? We have never seen so many evacuations from rural towns as as recently.
Recently, a public official claimed we are facing drought in the Vancouver, Canada area due to climate change. She totally ignored the fact that our local population has tripled and that people are using water recklessly and unnecessarily. They are using water to power spray their entire homes and every year. Many families are taking several showers a day whereas in the past that did not happen.
Worse still we have a body that predicts how much water we’ll need in our reservoirs and they continually underestimate the amount we will need each year.
The point was, it is the drive for a net zero future that is the maine cause of wildfire danger,as i said the lowest ever soil moisture recorded in the UK was way back in 1976 at Kew . much has been made of the warm UK summer, yet last summer and autumn was the wettest since 1912, the media made most of the 4 heat waves , yet in Northumberland the temperature only exceeded 30c on 2 days,one in july and one in august.hot summers in the south of the UK are common.the climate is the least of our problems.
Net zero policies don’t cause wildfires; climate and land management do.
Pointing to 1976 at Kew is cherry-picking a single record.
The broader trend is that UK and European fire seasons are getting longer and more severe. A wet summer or a couple of 30 C days in Northumberland doesn’t change that.
Local variability exists, but the baseline shift from warming makes drought years riskier than before.
Trump has finally done it, he has isolated the US from the rest of the planet. Russia, India, China and others, representing half the world’s population, have gotten together to combat him and Canada is seeking markets in Europe and Asia.
Trump’s tariffs will be a joke when no one wants to sell to or buy from the US. Also, Trump’s wish is to have products manufactured in the US. He presumes he can get Yanks to work for peanuts with no benefits. Dream on. US products will be far too expensive to sell internationally.
The reason we are doing so well here is that Asians are paid peanuts with no benefits to create the cheap products we line up to buy for a pittance. China can get away with that as dictators and I think Trump envisions the same thing for US workers.
Totally out of touch.
The UK climate clowns rely on cheep Chinese products to build the renewable industry,while turning a blind eye to the fact that those products are all manufactured, by burning huge amounts of coal, so much coal they have to import stocks from Australia. as the Chinese diplomat said,we are served by useful western idiots.only a matter of time before western economies collapse under the strain.
Step 3 – Saying Stuff.
Meanwhile:
“The UK’s first investor-funded ground source heat pump network has begun installation in South Wales, marking the start of a new £100 billion asset class in clean energy infrastructure.”
https://airqualitynews.com/fuels/the-uks-first-investor-backed-heat-pump-network-takes-shape/
The UK climate clowns rely on cheep Chinese products to build the renewable industry,while turning a blind eye to the fact that those products are all manufactured, by burning huge amounts of coal, so much coal they have to import stocks from Australia. as the Chinese diplomat said,we are served by useful western idiots.only a matter of time before western economies collapse under the strain.
Just wanted to let Barry know that I will be replying to his comment dated August 24, 2025 at 6:09 PM soon.
Apologies for the delay. I’ve been extremely busy lately.
Thanks red, and no hurry or worries. We comment here under our own schedules and interest.