
 Home/Blog
The Version 6.1 global average lower tropospheric temperature (LT) anomaly for August, 2025 was +0.39 deg. C departure from the 1991-2020 mean, up a little from the July, 2025 anomaly of +0.36 deg. C.
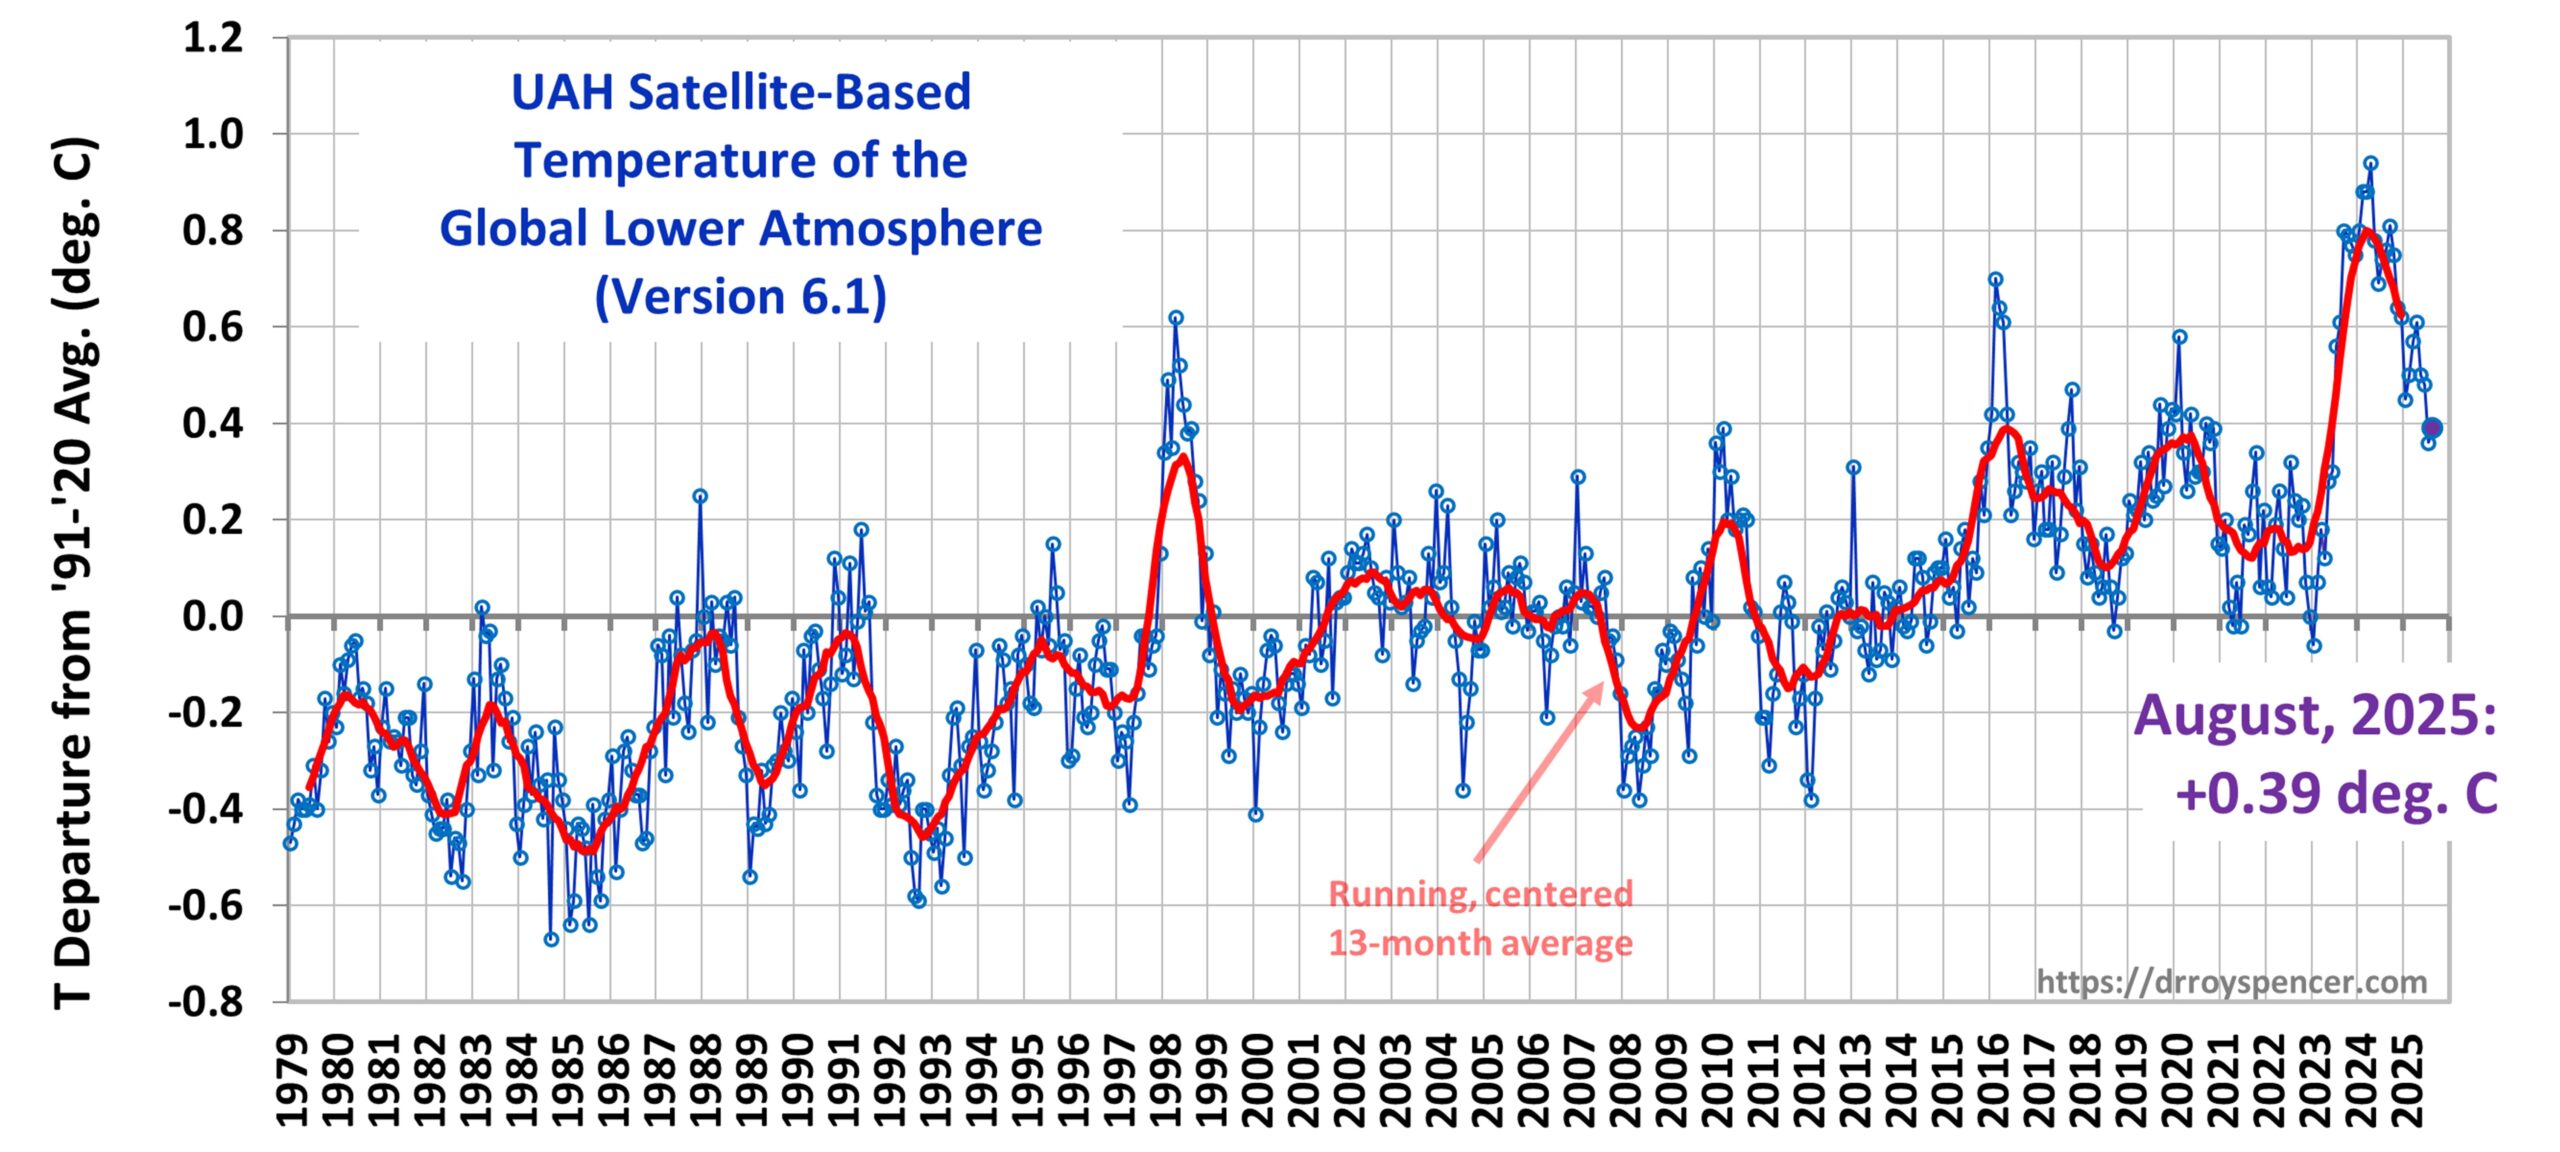
The Version 6.1 global area-averaged linear temperature trend (January 1979 through August 2025) remains at +0.16 deg/ C/decade (+0.22 C/decade over land, +0.13 C/decade over oceans).
The following table lists various regional Version 6.1 LT departures from the 30-year (1991-2020) average for the last 20 months (record highs are in red).
| YEAR | MO | GLOBE | NHEM. | SHEM. | TROPIC | USA48 | ARCTIC | AUST |
| 2024 | Jan | +0.80 | +1.02 | +0.58 | +1.20 | -0.19 | +0.40 | +1.12 |
| 2024 | Feb | +0.88 | +0.95 | +0.81 | +1.17 | +1.31 | +0.86 | +1.16 |
| 2024 | Mar | +0.88 | +0.96 | +0.80 | +1.26 | +0.22 | +1.05 | +1.34 |
| 2024 | Apr | +0.94 | +1.12 | +0.76 | +1.15 | +0.86 | +0.88 | +0.54 |
| 2024 | May | +0.78 | +0.77 | +0.78 | +1.20 | +0.05 | +0.20 | +0.53 |
| 2024 | June | +0.69 | +0.78 | +0.60 | +0.85 | +1.37 | +0.64 | +0.91 |
| 2024 | July | +0.74 | +0.86 | +0.61 | +0.97 | +0.44 | +0.56 | -0.07 |
| 2024 | Aug | +0.76 | +0.82 | +0.69 | +0.74 | +0.40 | +0.88 | +1.75 |
| 2024 | Sep | +0.81 | +1.04 | +0.58 | +0.82 | +1.31 | +1.48 | +0.98 |
| 2024 | Oct | +0.75 | +0.89 | +0.60 | +0.63 | +1.90 | +0.81 | +1.09 |
| 2024 | Nov | +0.64 | +0.87 | +0.41 | +0.53 | +1.12 | +0.79 | +1.00 |
| 2024 | Dec | +0.62 | +0.76 | +0.48 | +0.52 | +1.42 | +1.12 | +1.54 |
| 2025 | Jan | +0.45 | +0.70 | +0.21 | +0.24 | -1.06 | +0.74 | +0.48 |
| 2025 | Feb | +0.50 | +0.55 | +0.45 | +0.26 | +1.04 | +2.10 | +0.87 |
| 2025 | Mar | +0.57 | +0.74 | +0.41 | +0.40 | +1.24 | +1.23 | +1.20 |
| 2025 | Apr | +0.61 | +0.77 | +0.46 | +0.37 | +0.82 | +0.85 | +1.21 |
| 2025 | May | +0.50 | +0.45 | +0.55 | +0.30 | +0.15 | +0.75 | +0.99 |
| 2025 | June | +0.48 | +0.48 | +0.47 | +0.30 | +0.81 | +0.05 | +0.39 |
| 2025 | July | +0.36 | +0.49 | +0.23 | +0.45 | +0.32 | +0.40 | +0.53 |
| 2025 | Aug | +0.39 | +0.39 | +0.39 | +0.16 | -0.06 | +0.69 | +0.11 |
The full UAH Global Temperature Report, along with the LT global gridpoint anomaly image for August, 2025, and a more detailed analysis by John Christy, should be available within the next several days here.
The anomaly in the tropics (20N – 20S) has dropped considerably, to +0.16 deg. C. The U.S. was below the 30-year average in August.
The monthly anomalies for various regions for the four deep layers we monitor from satellites will be available in the next several days at the following locations:


Thank you Dr Spencer!
Let’s do this no TDS month
You might like:
A Republican Minnesota state senator who was caught in a sting operation resigned under fire Thursday after he was charged with soliciting a minor for prostitution, stepping down before the Senate could vote on whether to expel him.
According to Eichorn’s profile, which has now been removed from the Senate website, he is married with four children. He listed his profession as entrepreneur and was first elected in 2016. He got some national attention earlier this month as one sponsor of a not-very-serious bill that would have designated “Donald derangement syndrome” as a mental illness.
https://apnews.com/article/senator-justin-eichorn-resigns-b79bc500b740f61d1e5f280e3822fb9b
Huh? Is there some relevance to this blog? This seems so out of context that I struggle to understand- so very curious what is the context.
Thank you for your diffident question, Aaron. My comment was in response to Eboy’s hall monitoring. Are you struggling to understand the relevance of Eboy’s hall monitoring?
Further, you might already have forgotten:
https://www.drroyspencer.com/2025/07/the-doe-scientific-report-underpinning-the-epas-decision-to-reconsider-the-2009-endangerment-finding-on-co2/
Chris Wright is that kind of guy to say that if we wrapped the Earth in solar panels it would produce 20% of the energy we need:
https://finance.yahoo.com/news/energy-secretary-says-wrapping-earth-233101352.html
It might be true of Pluto, but wrapping the Sahara desert might be enough to produce four times the energy we actually need:
https://theconversation.com/solar-panels-in-sahara-could-boost-renewable-energy-but-damage-the-global-climate-heres-why-153992
Wright also uses the “report” to order Zeldin to deregulate the truck and car industry:
https://indianapublicradio.org/news/2025/07/epa-plans-to-get-rid-of-clean-car-standards-says-greenhouse-gases-dont-harm-people/
Deregulation is one of the main theme of Project 2025, a project from the Heartland Institute:
https://heartland.org/about-us/who-we-are/roy-spencer/
Hope this helps.
In return, I got to ask – why so diffident?
Wright may have been making fun of the cult beliefs. That’s the “science” that claims Sun only provides 163 W/m² to Earth’s surface. A solar panel wouldn’t even work with so little flux!
Hey Puffman, riddle me this –
https://www.drroyspencer.com/2025/08/uah-v6-1-global-temperature-update-for-july-2025-0-36-deg-c/#comment-1713380
Wright simply confused a few Climateball lines.
Here’s something even funnier:
“Pakistan is in the midst of a solar boom that has rapidly turned the country into one of the world’s largest new adopters of this renewable energy source, according to data from the global energy think tank Ember. This solar transition is driven by demand from frustrated Pakistani citizens who have seen electricity prices skyrocket in recent years.”
https://www.npr.org/sections/goats-and-soda/2025/08/21/g-s1-82369/solar-power-panels-boom-pakistan
What’s funny is that there’s nothing troglodytes can do about it except to join the bandwagon!
Following the links, Willard asks:
“Is the solar constant impossible?”
No. The solar constant is not impossible. The solar constant is calculated by dividing the Sun’s total power (solar luminosity) by the surface area of a sphere with a radius equal to the Earth’s average distance from the Sun. Thus, the calculation does not involve taking different flux values and averaging them, which is the problem.
Silly willy would be unable to identify the errors in the links he finds:
https://postimg.cc/vDVvWJ7D
Kids these days….
Our two gentlemen just did what they deem impossible. Splendid.
In return, solar panel imports from China to Africa jumped 60% in the past year, nearly tripling outside South Africa, with 20 African countries hitting record highs:
https://www.aa.com.tr/en/africa/here-comes-the-sun-africa-bets-big-on-solar-energy/3678606
“Wright may have been making fun of the cult beliefs. That’s the “science” that claims Sun only provides 163 W/m² to Earth’s surface. A solar panel wouldn’t even work with so little flux!”
In fact the dont work at night or at the poles…which is why the average flux is that low..
Willard couldn’t understand what I explained, then. The problem discussed previously involved Hölder’s inequality. It applies, for example, when different flux values are summed and averaged, and then you convert that average value to a temperature value. You get the “wrong temperature”. The problem doesn’t apply to the solar constant, as explained.
Anyone can get the “wrong temperature” only if calculating Earth surface area with integrals & not when using the actual measured value as is properly done in the usual EEI graphic as already explained.
Fun to read Clint R improperly average flux then try to claim the EEI graphics Clint linked are wrong.
Ball4 lies, as usual. If you took the measured flux values, summed them, averaged them and then converted the average value to a temperature value, it would still be the “wrong temperature”.
Graham D. Warner conflates explanation and obfuscation:
The solar constant (GSC) measures the amount of energy received by a given area one astronomical unit away from the Sun. More specifically, it is a flux density measuring mean solar electromagnetic radiation (total solar irradiance) per unit area. It is measured on a surface perpendicular to the rays, one astronomical unit (au) from the Sun (roughly the distance from the Sun to the Earth).
https://en.wikipedia.org/wiki/Solar_constant
Flat Sun?
What I said is correct, and not at all contradicted by your quote. You said you would refer to me as DREMT if I changed my handle to DREMT, but I guess you have no integrity.
What Graham said is incorrect, and as long as he keeps PSTering people, he’ll always be the Graham we know and love.
Perhaps he could tell us how to get the mean of solar electromagnetic radiation the Earth receives without averaging flux values?
What I said is correct:
“The solar constant is calculated by dividing the Sun’s total power (solar luminosity) by the surface area of a sphere with a radius equal to the Earth’s average distance from the Sun.”
Look in the “calculation” section of your own link.
There is still a lot of confusion about the Solar Constant. It is legitimate to take solar flux measurements at satellite altitude, and average those readings. The reason it’s legitimate is because all the flux comes from one source, and the readings are essentially at the same distance. The errors introduced are thus small, less than 1%. That’s why we see different values for the Solar Constant, but they’re all well within 1% of 1365 W/m². That value being the average of readings on both near and far points of Earth’s orbit.
Maybe I will have time to provide more clarity this weekend.
From Google AI:
“The solar constant isn’t calculated using a direct formula but is determined by measuring the Sun’s total radiant power (luminosity) and dividing it by the surface area of a sphere at Earth’s orbital radius (the inverse-square law). This measurement is done using advanced instruments, like absolute radiometers, from outside Earth’s atmosphere to avoid atmospheric interference and account for variations in solar output and Earth’s orbital eccentricity.
1. Determine the Sun’s total power (Luminosity): This value, often denoted as L, represents the total amount of energy the Sun radiates per unit time. It is determined by sophisticated measurements using instruments like absolute radiometers, which are designed to measure radiation very precisely.
2. Use the Inverse-Square Law: Imagine a sphere with the Sun at its center and the Earth on its surface. The total solar power (Luminosity) spreads out over the entire surface area of this sphere. The formula for the surface area of a sphere is 4πr², where r is the average distance from the Earth to the Sun (the astronomical unit).
3. Apply the Formula: The solar constant (σ) is then found by dividing the Sun’s total power by the surface area of the imaginary sphere: σ = L / (4πr²)”
For those still oddly insisting an average flux is ‘meaningless’, here we see another application of average flux.
To evaluate a solar panel installation at your location, calculate energy generation per day. To do so need average solar flux per day at your location.
Oh well!
Averaging solar flux over a day certainly makes more sense than averaging over a day and night. But, either way, the resulting average value, if converted to a temperature value, would give you the “wrong temperature”.
[PUFFMAN] It is legitimate to take solar flux measurements at satellite altitude
[ALSO PUFFMAN] Flux does NOT average.
“if converted to a temperature value, would give you the “wrong temperature””
Yet another red herring, nothing to do with the application.
You can attempt to use these “average flux” values in all sorts of ways…but, since they no longer relate correctly to temperature, when all flux values should relate to temperature via the SB Law, a law of physics…then they’re “physically meaningless”. I don’t get what you don’t understand about that. You accept all the premises but reject the conclusion, for some reason.
Perhaps you just like to argue for the sake of it.
Here’s another problem with averaging flux:
https://climateofsophistry.com/2025/08/02/the-history-of-climate-sophistry/
“In physics we want to understand how matter reacts to energy, and the response of matter to energy is entirely dependent on the intensity of that energy when it interacts with matter, and energy’s intensity is given by its flux. The example of a 9 Watt laser is pertinent: 9 Watts is barely any energy at all, only 9 Joules per second, however, coming in the form of a laser beam only 0.1 millimeters in radius this energy has a flux in the hundreds of millions of Watts per square meter, and this makes the laser beam intense enough to burn through a thin piece of metal, or a thick piece of wood, etc. Nine Watts isn’t even a rating for traditional lightbulbs it would be so weak and feeble, but when concentrated to a dot 0.1 millimeters in radius, it becomes another thing entirely. Intensity – it’s a thing!…
…Consider a sphere of wood with a surface area of one square meter. This sphere can rotate underneath the laser beam in such a way as to evenly cast the laser beam over the entire surface over twenty four hours. If we time average the 9 Watt laser over a sphere with a surface area of one square meter, then the flux of the laser upon the sphere is 9 W/m2. In fact, it doesn’t matter how much time has elapsed, as the sphere could rotate in 12 hours, 5 minutes, or one year, depending on the rate of rotation of the sphere, and still the result would always come out to 9 W/m2 for one revolution of the sphere. Time averaging therefore has no effect on the flux since it always works out to the same value. Since the result is a uniform flux over the entire sphere, we could simply draw it as a flat line and depict an input of 9 W/m2 falling over the flat surface, on average. An average flux of this value is almost negligible, a simple faint glow, and would have no effect on the sphere. Would this flat wooden sphere approximation be meaningful?
The reality of the situation is that the 9 W laser had a real-time flux in the hundreds of millions of Watts per square meter due to its beam having a tiny surface area in cross section, and this real-time flux was driving such an action that the beam would have been burning holes right through the wooden sphere. Thus, “time averaging” the energy of the laser over the entire sphere as a flat plane does not result in a value which can explain what the sphere actually experienced. The sphere would have had holes burned into it and its surface would have been thermally evaporating in the heat due to ~100,000,000 W/m2 laser flux, and so the flat Earth method excused as “time averaging” with a result of a feeble 9 W/m2 which is too weak to do anything but cast a dim glow does not characterize the laser beam and its reality in interacting with the sphere.”
[PUFFMAN] Flux does NOT average.
[DREMT] You can attempt to use these “average flux” values in all sorts of ways…but
Who is right?
I’m not contradicting Clint. Nobody is saying that mathematically, averaging flux simply cannot be done. What is being said is that the averaged flux value is, essentially, meaningless. Like here:
https://www.drroyspencer.com/2025/08/uah-v6-1-global-temperature-update-for-july-2025-0-36-deg-c/#comment-1711845
“[CLINT] The average flux is 500 W/m², but that calculated average has no meaning…”
“What is being said is that the averaged flux value is, essentially, meaningless.”
The averaged flux will give you an energy balance that doesn’t violate the 1st Law.
That isn’t meaningless. Unless you consider the 1st Law meaningless.
If you have a better idea for an energy budget, let’s hear it. And then we’ll see if it violates the 1st Law.
Unable to counter the argument presented here:
https://www.drroyspencer.com/2025/09/uah-v6-1-global-temperature-update-for-august-2025-0-39-deg-c/#comment-1713787
barry arrives to attack some strawman about 1LoT and make demands.
“What is being said is that the averaged flux value is, essentially, meaningless.”
Given that several examples have been shown of how averaging flux on Earth is quite meaningful, this claim is meaningless.
In ordinary debate, that is..
Nate also has no rebuttal to the argument made. In ordinary debate that means he loses.
You don’t dispute the premises, as I said. You just reject the conclusion, apparently based on the idea that fluxes are being averaged and those averages are being used, therefore they must be meaningful!?
How meaningful is it to pretend the laser can’t burn holes in the wooden sphere? How meaningful is it to pretend the Earth receives 240 W/m^2, rather than 480 W/m^2, or 960 W/m^2?
barry throws his usual crap against the wall:
“The averaged flux will give you an energy balance that doesn’t violate the 1st Law.”
Fluxes don’t typically average. Fluxes are NOT energy, so aren’t required to obey 1LoT.
“If you have a better idea for an energy budget, let’s hear it.”
A better idea for an energy budget would be to use “energy”.
Step 4 – special pleading.
Puffman is silently backtracking the second dragon crank thesis he promulgated for more than a decade.
Lame and lamer this nonsense gets.
Non-scientist, non engineers desperately seeking something, anything to bitch about that climate scientists do, grasping at super red herrings about lasers burning holes..
“How meaningful is it to pretend the laser can’t burn holes in the wooden sphere?”
No pretending necessary. Lasers and their ability to burn things has no relevance to the sun’s effect on the Earth’s temperature and energy balance.
To suggest that is sophistry for gullible people.
“How meaningful is it to pretend the Earth receives 240 W/m^2, rather than 480 W/m^2, or 960 W/m^2?”
240 and 480 are averages over a curved surface, and 960 on a flat.
So which is better?
If interested Earth’s energy balance then 240 W/m2 is better since it is a global average directly comparable to the average emitted flux.
“Fluxes don’t typically average. Fluxes are NOT energy, so aren’t required to obey 1LoT.”
Not sure about Clint, but scientists can do simple math. Thus they can take flux, which is power per unit area, and multiply it by area to get power. Then multiply by time to get energy.
Thus by measuring the average flux hitting the Earth, 240 W/m2 they can easily determine energy recieved by the Earth per day.
Then compare to energy emitted by Earth per day, to check for an imbalance.
Since both involve the same area and same time period, they can simply directly compare the average fluxes.
This is just not difficult. I dont know why some here have so much trouble with it.
Just look at how Nate is willing to be an uneducated child to defend his cult beliefs.
I say that flux is NOT energy. So what does child Nate do?
“Not sure about Clint, but scientists can do simple math. Thus they can take flux, which is power per unit area, and multiply it by area to get power. Then multiply by time to get energy.”
Just as I said, flux is NOT energy. Child Nate proves me right again!
10:40 am: That Clint R and DREMT have such trouble with something as simple as averaging energy flux properly while using S-B shows their low level of ability and comprehension in the science on topic for this website.
The point being made with the laser and the wooden sphere was perfectly clear to any honest, rational person. No need to engage with Nate when he has sunk to these levels.
Just as I said, flux is NOT energy”
With no consequence for this problem, because scientists can do simple math!
DREMT 11:56 am, no, you have not made any point to help Clint R with laser and wooden sphere since there is no improper averaging of intensive property temperature in your example.
Ball4 is back to thinking that claiming temperatures cannot be averaged actually helps his cause, somehow. What an odd fellow.
Here’s where Puffman says that radiative flux is not a conserved quantity, is non-linear, and thus can’t be averaged or divided:
https://www.drroyspencer.com/2025/08/uah-v6-1-global-temperature-update-for-july-2025-0-36-deg-c/#comment-1711069
The same applies to the solar constant.
Flux is not a conserved quantity, it’s linear (Clint was referring to the relationship between temperature and flux as being non-linear), and I’ve already explained about the solar constant (but you don’t listen, don’t understand, and can’t learn).
DREMT 2:05 pm: Check your 1:16 am link where Clint averages temperature and then was told his physics is thus incorrect which makes Clint’s statement “Flux does not average” immediately wrong.
Clint and DREMT are STILL showing their low level of ability and comprehension in the science on topic for this website. Following Clint’s errant physics about averaging temperatures is meaningless.
“The point being made with the laser and the wooden sphere was perfectly clear”
Not at all. Concentrating light burns things. That is the only clear point.
But irrelevant to the Earth.
Nate missed the point? No surprises there.
I followed the link, Ball4, there we can immediately find you arguing that temperature cannot be averaged. It’s funny, you get absolutely no pushback from anyone for saying over and over again that temperature cannot be averaged, yet if Clint says “flux cannot be averaged” it’s an endless frenzy of OTT responses.
It should be obvious that arguing either temperature or flux cannot be averaged presents huge problems for climate science, but apparently only Clint gets challenged!
At equilibrium net energy fluxes must sum to zero, otherwise the 1st Law is violated.
So when calculating the energy balance of a sphere irradiated by a sun, the incoming and outgoing energy must be exactly equal.
DREMT will readily confirm that the average of temperature over a sphere will produce a lower flux result than the average of incoming flux.
Clint dodged the request to come up with a better formula for calculating the energy budget over a sphere illuminated by a sun. One that doesn’t violate the 1st Law.
Graham has continued to PSTer people on the other thread.
From ChatGPT –
“Irradiance = energy flux density — no separation there…treating irradiance as independent from energy is a root cause of confusion and bad teaching.”
Puffman is a lousy teacher. Too bad Graham is playing red shirt for him.
DREMT 5:06 pm, no, of the two (specifically the EEI graphic Clint R originally linked), Clint R only deserves the challenge because Clint simply averages intensive property temperature improperly then immediately draws the erroneous conclusion that an extensive property (energy flow rate) over a known, measured area cannot be averaged.
Clint R remains wrong in simply averaging an intensive property to draw a conclusion. If DREMT is correct in arguing someone else is as wrong as Clint, then just be specific so DREMT’s precise argument can be understood & reliably checked.
“At equilibrium net energy fluxes must sum to zero, otherwise the 1st Law is violated.”
That’s wrong, barry. A plate could receive 400 W/m^2 on one side and emit 200 W/m^2 from both sides and 1LoT is not violated, but 400 does not equal 200.
Flux (W/m^2) not being energy (J) is accepted by Nate on September 6, 2025 at 12:24 PM but challenged by Willard on September 6, 2025 at 9:17 PM. That Nate and Willard will not argue with each other is certain.
Ball4 continues to assert that temperature cannot be averaged, with no pushback from any of the commenters here. Great, let’s assume it’s universally accepted that temperature cannot be averaged, presenting huge problems for climate science. Another win.
“That’s wrong, barry. A plate could receive 400 W/m^2 on one side and emit 200 W/m^2 from both sides and 1LoT is not violated, but 400 does not equal 200.”
That doesn’t have anything to do with what I said. Just stop with the nonsense already.
I said, “At equilibrium net energy fluxes must sum to zero, otherwise the 1st Law is violated.”
We have used this premise a gazillion times arguing a green plate scenario. You sum both faces against the incoming. 200 + 200 – 400 = 0. You have argued countless times on this premise.
You have to account for the fact that incoming is received on one face, while outgoing flux occurs over twice the surface area.
You know this already, so stop dicking around.
Point is that in equilibrium net energy fluxes across a sphere must sum to zero or the 1st Law is violated.
The plate receives 400 W/m^2 and emits 200 W/m^2. Flux is not a conserved quantity. 400 does not equal 200. Energy (J) is a conserved quantity. Energy balances with the plate because the surface area receiving is half that of the emitting area. If you agree, that is fine, no need to attack me whilst ignoring Ball4.
DREMT 1:31 am erroneously writes (by simple assertion): “… presenting huge problems for climate science.”
Because DREMT has not yet pointed specifically to even one “problem”. Clint’s original EEI graphic link remains unsuccessfully challenged by DREMT.
—–
DREMT 7:56 am: Really the plate receives 400 W/m^2 and emits 2 x 200 W/m^2 in long term equilibrium. DREMT again doesn’t comprehend energy flow rate is an extensive property.
DREMT and Clint R often miss the factor of two. Clint and DREMT are STILL showing their low level of ability and comprehension in the science on topic for this website.
“400 does not equal 200.”
Graham hides behind an incomplete claim.
400 equals 200 times 2.
An amount of Watt per meter square on a surface equals twice that amount on a surface twice the size that first one.
Dragon cranks commit a similar mistake when the Earth receives light where it doesn’t shine. It doesn’t. It just so happens that the area of a sphere, the surface that emits, is four times its shadow, the surface that receives light.
Ball4 and Willard apparently missed:
“A plate could receive 400 W/m^2 on one side and emit 200 W/m^2 from both sides and 1LoT is not violated, but 400 does not equal 200.”
and
“Energy balances with the plate because the surface area receiving is half that of the emitting area”
It’s great when they start their “dishonesty display”.
10:37 am: Correctly a plate could receive 400 W/m^2 on one side and emit 200 W/m^2 from both sides and 1LoT is not violated, since 400 DOES equal 200 + 200. DREMT again misses a plate has two emitting sides and has again unsuccessfully challenged Clint’s original linked EEI.
My point stands: DREMT and Clint R often miss the factor of two. Clint and DREMT are STILL showing their low level of ability and comprehension in the science on topic for this website.
Here is one of the places where Ball4 argues that you cannot average temperatures:
https://www.drroyspencer.com/2025/08/uah-v6-1-global-temperature-update-for-july-2025-0-36-deg-c/#comment-1711862
Funny, it’s an argument I’ve often seen made from those who are strongly opposed to climate science. Weird that still, nobody is challenging Ball4.
As to whether it poses a problem for climate science, can Ball4 really not think of any examples where climate scientists average temperatures!? None at all!?
DREMT 12:21 pm still has not yet pointed specifically to even a single “problem” example. Clint’s original EEI graphic link remains unsuccessfully challenged by DREMT.
“Correctly a plate could receive 400 W/m^2 on one side and emit 200 W/m^2 from both sides and 1LoT is not violated, since 400 DOES equal 200 + 200…”
…but the plate is not emitting 400 W/m^2. As I said, perfectly correctly, the plate receives 400 W/m^2 and emits 200 W/m^2. Flux is not a conserved quantity.
“Nate missed the point? No surprises there.”
DREMT again evaded the chance to explain the relevance of his link to the current discussion.
Because he is impressed by sophistry designed to impress gullible people, who then cannot explain the point.
Graham D. Warner, who started to PSTer people in this thread, apparently missed that there’s no “perhaps” there:
“An amount of Watt per meter square on a surface equals twice that amount on a surface twice the size that first one.”
If we disregard the surfaces under consideration, there’s no basis to compare anything.
It’s like saying that eating for two hours is more than eating for one hour, without saying what is being eaten, at what pace, etc.
Nate, if you can’t understand the point, there’s no need to feel bad. Plenty of readers will get it.
Here’s a challenge for you, Nate: translate Willard’s most recent comment into a coherent form. Bet you can’t.
Exactly, Nate.
Try to understand why dragon cranks somehow believe they can sell that energy balance models deny arithmetic.
“Here’s a challenge for you, Nate: translate Willard’s”
Sure. Just as soon as you translate your link and explain why the fact that lasers or little kids with magnifying glasses can burn stuff, has any relevance whatsover to this discussion.
If you can’t, then we will know you are just quoting without understanding, as usual.
DREMT obfuscates 1:10 pm: “As I said, perfectly correctly, the plate receives 400 W/m^2 and emits 200 W/m^2.”
At that point in time, correctly, the plate is not at long term equilibrium. Energy is the conserved quantity & must be in accord with 2LOT during the natural process: universe entropy increases.
See? Nate has no clue what Willard’s incomprehensible comment means, either. Meanwhile, the perfectly clearly written comment about the wooden sphere and the laser, and its obvious message that averaging the flux will distance the situation from the true physical reality, will be understood by plenty of readers.
At the same time, Ball4 thinks the plate, receiving 400 W/m^2, and emitting 200 W/m^2, is not at equilibrium! barry holds his tongue, probably in sheer disbelief at the antics of his comrades. Will he have the integrity to speak out against them?
“The plate receives 400 W/m^2 and emits 200 W/m^2.”
So you’re doubling down on the nonsense?
The plate does not emit 200 w/m2. It emits in total 2 X 200 w/m2.
As it must, to balance the incoming.
You yourself have argued using blackbody cubes. You well know that if one face receives 400 w/m2, each face must emit (400 / 6) W/m2. The sum of emitted flux is the sum of fluxes emitted by each face.
The 1st Law requires that energy in = energy out. Flux is not conserved, but at equilibrium the sum of fluxes must be zero for the energy to balance and satisfy the 1st Law.
And you know this. You have yourself summed fluxes on the premise of the 1st Law being satisfied. You are just dicking around.
200 W/m2 is not the sum of fluxes being emitted by the plate. It is the flux being emitted from only one side. Don’t be obtuse, DREMT.
“The plate does not emit 200 w/m2. It emits in total 2 X 200 w/m2.“
Which does not mean it emits 400 W/m^2. The plate emits 200 W/m^2. It has nothing to do with “summing fluxes”, barry. The convention is to simply state what the object emits, e.g. in the case of the plate, 200 W/m^2, and that it emits from its entire surface area (i.e. both sides) is assumed! There is no need to say it emits “200 W/m^2 x 2” or even “200 W/m^2” from both sides”. That would be assumed. All you need to say is, “the plate emits 200 W/m^2”. That the plate receives 400 W/m^2 and emits 200 W/m^2 is not a problem, because as you agree, flux is not conserved. In does not have to equal out.
But, you don’t have to believe me. Ask Google AI:
Question: Do you need to specify that an object emits from its entire surface area, or is it assumed?
Answer: “You generally do not need to specify that an object emits from its entire surface area, as this is a fundamental assumption in thermal radiation and physics, where total emitted power is directly proportional to surface area. Instead, you specify the radiant exitance (power per unit area) and then multiply it by the total surface area to get the total power radiated from the object”
“In does not have to equal out.”
Dear oh dear. You have failed physics 101. You don’t know what an energy balance is.
Back to dueling AI is it? Hilarious.
“If a thin blackbody plate receives 400 W/m2 square and emits from both sides, what is emitted in total from the plate?”
ChatGPT says after calculating:
“400 W/m2 total, split equally from both sides… total emission equals the incident flux, because the plate radiates from both sides”
Being obtuse means asking the wrong question.
You’re hilarious. You are now contradicting all your argument we had a few months ago, by insisting that the total outgoing from a blackbody object doesn’t have to equal incoming flux when in equilibrium.
Your plates, your cubes, all you prior argumentation is now completely undermined. Well done, DREMT!
Let’s do math!
Blackbody plate receives 400 W/m2, it emits 200 W/m2 from both faces.
Normally Ein = E1 + E2 (En depending on the number of surfaces)
Now with DREMT’s ‘logic’,
400 w/m2 = 200 w/m2 + nothing else
And he thinks this represents an energy balance.
No wonder he gets everything wrong!
If I decide that a blackbody cube receives 600 W/m2 but only emits 100 W/m2 from one side, I have most definitely broken the 1st Law. But DREMT thinks that flux can’t be summed, so he should believe no laws were harmed here.
barry starts wildly attacking the strawman that I’m saying the plate only emits from one side. He’s forgetting that I already established:
“A plate could receive 400 W/m^2 on one side and emit 200 W/m^2 from both sides…”
Dear, oh dear.
As I already clearly stated:
“The plate receives 400 W/m^2 and emits 200 W/m^2. Flux is not a conserved quantity. 400 does not equal 200. Energy (J) is a conserved quantity. Energy balances with the plate because the surface area receiving is half that of the emitting area.”
Flux in does not have to equal flux out. Energy in does have to equal energy out (when there are no losses).
barry seems to be getting confused between flux (W/m^2) and energy (J).
The plate is not emitting 400 W/m^2. It is emitting 200 W/m^2. However, if one side of the plate has a surface area of 1m^2, it will be emitting 400 J in one second.
DREMT 4:05 am is forced to backtrack, now writes 400 in and 400 out in LT equilibrium for the plate. Nice concession, DREMT. Try harder without prodding to keep your physics comments correct in the future on a science blog.
How can I “backtrack” by repeating part of my first comment on the matter?
The plate emits 200 W/m^2, at equilibrium. Not 400 W/m^2.
You guys are making the most ridiculously simple, fundamental mistake. Fun to watch bad people making fools of themselves.
“The plate is not emitting 400 W/m^2. It is emitting 200 W/m^2. However, if one side of the plate has a surface area of 1m^2, it [the entire plate] will be emitting 400 J in one second.”
Whereas, if the plate were emitting 400 W/m^2, as barry and Ball4 contend, the entire plate would be emitting 800 J in one second. Yet, the plate would only be receiving 400 J in one second. So barry and Ball4 have the plate generating an additional 400 J, every second, out of nowhere!
Fun times.
Pretending not to know what the point is, is one of their silliest little tricks. They really are desperate. Good to see Sky Dragon cranks reduced to this.
ROFL.
Yes Willard 8:52am, I’m laughing at DREMT too. DREMT just makes up stuff when cornered in claiming barry and I wrote 400 in and 800 out.
My earlier point DREMT and Clint R often miss the factor of 2 still stands.
Sorry, Willard, but this:
“An amount of Watt per meter square on a surface equals twice that amount on a surface twice the size that first one.”
Is too vague and ambiguous to be interpreted. It could be right, it could be wrong! I would need further clarification on what exactly you mean, to tell either way.
The rest of your 2:21 PM comment seems to be an attempt to say the surface area irradiated and the emitting surface area need to be known. Fine, but since I said from the beginning that the emitting surface area is double the irradiated area, you don’t have a point. And, from earlier:
“400 equals 200 times 2”
Looks like Willard was making the same simple, fundamental mistake as barry and Ball4. Three of them caught out at once! Delightful.
And so our sky dragon crank still fails algebra:
An amount of Watt => A
per meter square on a surface => S
equals => =
twice that amount => 2A
on a surface twice the size that first one => 2S
in short => A/S = 2A/2S
Perhaps he should have stayed in school.
Sure, OK. You clarified. You were referring to the power (W). Fine. Yes, that’s not disputed.
Not sure why you thought it was.
And, you still made the same mistake as barry and Ball4.
“You were referring to the power”
Our sky dragon crank keeps dodging.
S is a surface.
Is power expressed in terms of surface?
Yes, S is a surface. And A is power (W).
You clarified what you meant, and it was something I was never disputing.
Until you clarified, your sentence was a garbled, poorly written mess.
And so dragon crank has returned to gaslighting.
The relationship between energy and surface isn’t power.
What is it?
You clarified what you meant, and it was something I was never disputing.
Until you clarified, your sentence was a garbled, poorly written mess.
Even after he’s being told multiple times that watts per meter squared isn’t power, our gaslighter will continue gaslighting.
Dragon cranks are not good persons.
Of course W/m^2 isn’t power (W). Why do you think every time I write power (W), I include the W for Watts? It’s so nobody gets confused with what I’m saying. Yet, somehow you manage it.
Let’s see:
DREMT reads “A/S” and he things of power. When corrected, he still sees power. And now he pretends he gets that I wasn’t talking about power.
Perhaps he knows that his insistence on power is pure deflection?
Quite possible, now that he admitted being a sophist.
“DREMT reads “A/S” and he things of power“
No, I read “A” and thought of power (W). That then clarified your otherwise garbled, nonsensical sentence for me.
Rewriting your wretchedly abysmal effort more sensibly, you could say:
“If you double the surface area (m^2), but the flux (W/m^2) remains the same, you must have double the power (W)”
Clearer, no?
At least DREMT is honest about his sophistry.
He knows what he’s doing!
As Willard is reduced to nothing but insults, I guess he’s conceded he had no point, all along.
DREMT is reduced to begrudgingly concede that flux can remain the same, and is indeed preserved in an energy balance model.
The first hint being “energy”, and the second “balance”.
Of course flux “can” remain the same, Willard, but it is not a conserved quantity and in the plate example discussed does not remain the same. Flux in does not equal flux out, yet energy balances, in that example.
Clint R wrote “Wright may have been making fun of the cult beliefs. That’s the “science” that claims Sun only provides 163 W/m² to Earth’s surface. A solar panel wouldn’t even work with so little flux!”.
Oh dear. ♂️
The 163 W/m^2 is averaged over the entire Earth over an entire year. If we only average over the sunlit hemisphere (which obviously ‘moves’ as Earth rotates), the average is twice as large, 326 W/m^2. And if we exclude the polar regions early, mornings and late afternoons, the aveeage is significantly higher.
This Clint R individual seems to question that the “Sun only provides 163 W/m² to Earth’s surface”. He seems unaware of basic geometry, Earth’s average albedo and Earrh’s radiation budget.
Graham D. Warner, who PSTered twice yesterday on this thread, does not seem to get that energy balance models balance its energy whatever the surface, but it a plate or a planet. As long as the *relationship* between the input and the output surfaces remain the same, so will be the relationship between in and out fluxes.
That one “can” misapply an arithmetic rule does not invalidate that rule, so Puffman’s illustration is fallacious.
Every word said here is correct:
“Of course flux “can” remain the same, Willard, but it is not a conserved quantity and in the plate example discussed does not remain the same. Flux in does not equal flux out, yet energy balances, in that example.”
Words are not the things that are “correct” in that sense. Claims are. And usually claims need to be relevant to be correct.
Besides, only DREMT “segues” with plates of different sizes. Sometimes even infinite plates!
The short of it is that energy, flux, and surfaces are interconnected. Once they are fixed in the model, an equilibrium obtains. Which means that our Sky Dragon cranks’ “segue” is of no relevance whatsoever.
DREMT 8:45 am remains wrong since at equilibrium flux in does equal flux out (400 in and 400 out); DREMT just calculates a non-equilibrium situation. Eventually that situation will equilibrate depending at least on the unknown specific heat of the material to 400 in and 400 out.
As long as you understand that what I said in that comment is correct, you can tell yourself whatever you want to hear.
400 = 2 x 200
Silly.
What I said is obviously correct.
Why can it not just end there?
Must this continue for another month?
The Blue Plate, on its own, does not emit 400 W/m^2.
Just ask Eli.
That’s way too vague.
Perhaps DREMT should read what Barry says a little better.
barry is wrong, so no need to reread him.
DREMT also lied about me, on September 7, 2025 at 1:31 AM.
Another false accusation.
Silly.
Indeed you are.
DREMT is not a good person.
If you say so, Willard.
“Meanwhile, the perfectly clearly written comment about the wooden sphere and the laser, and its obvious message that averaging the flux will distance the situation from the true physical reality, will be understood by plenty of readers.”
What physical reality? It appears to be one we all agree on, that concentrated light can burn things.
Again, this point is not controversial, and not relevant to the sun’s ability to warm the Earth…and the use of average flux to determine whether its warming effect is increasing due to CO2.
The physical reality here is that the Earth spins and makes a diurnal cycle.
And yet when considering the cause of long term warming trends, the average
energy balance persisting over months or years is of interest, not the diurnal cycle.
And this requires measurement of average flux recieved and emitted globally per day, or month, or year, etc.
So although there are various ‘physical realities’, no one is pretending they do not exist.
Nate really is a master at playing dumb.
No rebuttal, no answers, just insults.
Aspiring to be just like Clint..a pure tr.oll?
No need to make a rebuttal when you missed the point. And, you know you did. You’re doing it deliberately. When you address the point made, I will make a rebuttal. OK?
False. This you evading challenges to your claims.
What are you afraid of?
“What physical reality? It appears to be one we all agree on, that concentrated light can burn things.“
That’s you missing the point, Nate.
I told you that there was another problem with averaging flux. I then linked to the article and quoted the relevant parts from it. It makes abundantly clear that averaging the flux from the laser over the entire sphere gives you a pathetically small value of only 9 W/m^2. That average value in no way represents the physical reality that the wooden sphere is actually a burning wreck due to the intensity of the laser.
Just saying, “oh, but everyone’s aware that lasers can burn things” in no way rebuts the argument made. The average fails to reflect the physical reality. End of story.
“It makes abundantly clear that averaging the flux from the laser over the entire sphere gives you a pathetically small value of only 9 W/m^2. That average value in no way represents the physical reality that the wooden sphere is actually a burning wreck due to the intensity of the laser.
Just saying, “oh, but everyone’s aware that lasers can burn things” in no way rebuts the argument made. The average fails to reflect the physical reality. End of story.”
I agreed that concentrated light burns things, which is a ‘physical reality’ that is not obtained by an averaged flux.
My point is so what? This is not relevant to the Earth heated by the sun.
As I explained, the ‘physical reality’ that is lost by globaly averaging flux is the diurnal cycle. Yes?
Or is there something else?
Then I argued that is ok if interested in long term warming, to average over the diurnal cycle.
What is wrong with that?
I think the parallels to the Sun and the Earth are obvious (though it is of course exaggerated), but…
That aside, you just seem to be looking for a fight.
Averaging flux hides the physical reality. The laser and wooden sphere example makes that clear. No need to even talk about the Sun and the Earth. I wanted to point out another problem with averaging flux, and did so. Why can it not just end there? Must this continue for another month?
“Why can it not just end there? Must this continue for another month?”
Why cant you jusy acknowledge when your opponent makes a valid point, and move on?
The diurnal cycle is not of interest, so averaging is a perfectly fine thing to do here.
Decide whether you can live with that. Or just keep doubling down.
Yes, Nate, why can’t you just accept that I made a valid point, and move on? Why are you changing the subject to “diurnal cycle”!?
As I explained, the ‘physical reality’ that is lost by globaly averaging flux is the diurnal cycle. Yes?
Or is there some other ‘physical reality’ that you had in mind?
As I explained, I’m not in the mood for another month-long discussion about it. Maybe some other time?
Well then it is abundantly clear that there is no meaningful ‘physical reality’ that is being missed or neglected by the use of average global flux.
There is no actual consequence for climate science.
Then we can leave it there.
The baiting continues.
…from DREMT.
What Nate neglects to mention is that he and I have discussed the issue of averaging flux and the effect on the diurnal cycle at length, previously (by “at length” think about a month of constant back-and-forth). Here, he acts as if this never occurred. I choose not to repeat a month-long conversation. Nate exploits that to his own advantage. Perhaps “baiting” is not the right word for what he’s doing…but, whatever you want to call it, it ain’t honest.
“the effect on the diurnal cycle at length”
As noted, nobody is ignoring the diurnal cycle. But of interest here is long term climate change.
You’ve been saying here it is not about the diurnal cycle, it is about some other vague, unamed ‘physical reality’.
Thus far this appears to be a fake controversy that, as usual, you cannot support, but cannot let go of.
See? For one thing, he could just read the linked article…
Just skimmed through this entire conversation. It’s pretty clear that Clint R and DREMT are entirely clueless about, well, all of this, while barry, Ball4, Nate and Willard actually know what they’re talking about.
You are welcome to find, link and quote anything I have said that is wrong. Otherwise, kindly retract your false accusation.
DREMT wants me to show where he is wrong. OK.
He writes “You can attempt to use these “average flux” values in all sorts of ways…but, since they no longer relate correctly to temperature, when all flux values should relate to temperature via the SB Law, a law of physics…then they’re “physically meaningless”.”
“all flux values should relate to temperature via the SB Law”, really? Obviously, an average flux (averaged and varying over time and/or surface) does not relate to temperature since SB is a nonlinear relation.
DREMT is right that the average flux cannot be directly translated into a corresponding meaningful temperature, but claiming that the average flux is therefore physically meaningless is bonkers. As dumb as saying that an average temperature is meaningless just because it doesn’t relate correctly to flux. How come science deniers NEVER understand averaging, an elementary school topic?
That DREMT didn’t understand the laser-and-wooden-sphere thought experiment provided by Nate is also telling.
Gadden, a bunch of insults does not make a valid rebuttal. Plus, I introduced the laser and wooden sphere example, not Nate. That you did not even realise that, is telling.
DREMT, yes I didn’t check the origin of the laser discussion carefully. You brought it up, Nate commented. Fine. My point was that Nate’s comments about it went over your head. Obviously, if you want to know the temperature at, say Mt Rushmore on 25 July 2024 at 3:15 pm, the solar flux averaged over Earth’s surface and over, say, the 2010-2020 decade is pretty useless information, sure. So what? The average solar flux (averaged over surface and some time period like a year) still has a meaning. It can be used in Trenberth diagrams (google it!) to show or study Earth’s flux balance, you can multiply it by Earth’s surface area and a time period to get the total solar ENERGY delivered to Earth in that time period, etc. Saying that an average flux has no physical meaning is nutty. An average of a physical quantity is never meaningless. You just have to understand what it is (and what it’s not).
That’s OK, I don’t need to Google things I already know more than you about.
Obviously the point being made with the wooden sphere and laser example went over your head completely. You would realise that if you understood more about the website it comes from. The criticism of averaging flux being made there is that time averaging completely obscures the physical reality that the laser is burning holes in the wooden sphere. A 9 W/m^2 average is completely divorced from that reality.
Keep on learning.
“time averaging”
DREMT fabricates, once again.
Willard fabricates, once again.
In energy balance models, the equality holds at every instant.
Another lie by DREMT.
DREMT, you’re totally missing the point.
An average OBVIOUSLY doesn’t show how a quantity is distributed over a region (and/or over time period). For example, the average income in a country ‘hides’ that some people in that country have much higher income than others. This doesn’t mean that the average income in itself is a meaningless quantity. You just have to understand what an average value is and what it isn’t. THAT is the point so I suggest you take your strawman argument and put it where the sun doesn’t shine.
How come you science deniers NEVER understand averages? Are there no schools in your country?
The point you keep missing, Gadden, is that time-averaging the flux from the laser over the entire sphere completely hides the reality that the wooden sphere is now a burnt, charred wreck. Just like your pathetic religion.
DREMT: “The point you keep missing, Gadden, is that time-averaging the flux from the laser over the entire sphere completely hides the reality that the wooden sphere is now a burnt, charred wreck”.
Oh dear. No, I’m not missing that. I just explained what an average is and what it can be used for. That you incorrectly believe an average is meaningless (just because it doesn’t say how the physical quantity in question is spatially and temporally distributed) is the problem here.
Your argumentation is akin to “If the average of three numbers is 6, that doesn’t tell me what the highest of those three values is so therefore the average is meaningless”. The premise is of course correct (the average obviously doesn’t say what the individual values are) but the conclusion is flawed (averages are meaningless).
Let’s just conclude that you’re entirely clueless about the purpose of averaging. Begone now.
Yes, it’s funny that with you guys, you first assume that somehow I would not understand what an average is, then presume to try and explain it to me, and think that this somehow counters the point being made! Then you have the audacity to preach about a straw man, as if I am the one attacking a straw man, and not you!
I’m not going anywhere – why don’t you skulk back into the corner you crawled out from?
DREMT should grow up.
Gadden made a valid point rather well. All you is insult him and dismiss it without any rebuttal.
Clearly your argument cannot be properly defended.
“The point you keep missing, Gadden, is that time-averaging the flux from the laser over the entire sphere completely hides the reality that the wooden sphere is now a burnt, charred wreck. Just like your pathetic religion.”
Which for the umpteenth time, is a ‘physical reality’ irreleavant to the Earth. There is no burning of the Earth by the sun’s heat.
And for the umpteenth time, you cannot say what ‘physical reality’ other than the reality that there is a diurnal cycle, is hidden by averaging flux.
The point that you keep ignoring is that the average flux is proven to be useful in many climate science papers.
Your hand-waving dismissal of it is basically saying that you know better than the authors of all those papers, but clearly you do not.
So that is pure arrogance lacking credibility.
Gadden attacked the straw man that I was suggesting all averages are meaningless. So no, he did not make a good argument.
The wooden sphere and laser thought experiment does not even suggest that an average flux is meaningless. It suggests that the average flux is completely misleading, failing to reflect anything about the physical reality of the laser’s intensity.
And, you can read more about it in the linked article further upthread.
What Gadden said was perfectly reasonable.
It’s pretty clear our Sky Dragon cranks appear clueless.
With time, another hypothesis could replace it.
“The wooden sphere and laser thought experiment does not even suggest that an average flux is meaningless. It suggests that the average flux is completely misleading, failing to reflect anything about the physical reality of the laser’s intensity.”
As pointed out many times, this is an extreme case, which cannot be applied to the Earth. They are different problems and we get different results.
This is again a motte bailey error. You cannot defend your case for the Earth, so you keep retreating to the extreme case of the laser burning wood.
What the laser burning shows is that its effect on matter, is quite damaging if its intensity exceeds a high threshold. Yet for the Earth the sun intensity always remains well below that threshold.
This is a slippery slope error. You are saying, well look where this varying flux could lead…to burning.
Nope.
“Which for the umpteenth time, is a ‘physical reality’ irreleavant to the Earth. There is no burning of the Earth by the sun’s heat.”
Nate gets dangerously close to understanding, but chooses to reject the idea that the Sun can heat the Earth to any significant degree. Odd.
The baiting continues.
…from Willard.
“but chooses to reject the idea that the Sun can heat the Earth to any signficant degree. Odd.”
As ever you resort to shamelessly lying about my views.
See Nate’s comment of September 12, 2025 at 2:32 PM to see someone actually shamelessly lying about my views.
DREMT: “Gadden attacked the straw man that I was suggesting all averages are meaningless. So no, he did not make a good argument.”
Also DREMT (earlier): “You can attempt to use these “average flux” values in all sorts of ways…but, since they no longer relate correctly to temperature, when all flux values should relate to temperature via the SB Law, a law of physics…then they’re “physically meaningless”
So DREMT’s ‘logics’ is that since an average flux does not relate to a physical temperature, an average flux is physically meaningless. The mistake he is making is of course that he incorrectly assumes the Stefan Boltzmann applies to averages (“all flux values should relate to temperature via the SB Law”). It doesn’t.
Here’s an analogy:
Assume the voltage across a 1 ohm resistor is 0 V for one hour and then 2 V for one hour. The average voltage across the resistor over these two hours is obviously 1 V. The electrical power dissipated in the resistor will be 0 W the first hour and 4 W the second hour, so the average power is 2 W.
If we now apply the Power=Voltage^2//Resistance law (“a physical law” to quote DREMT) to the AVERAGES, we get 2 = 1. In DREMT’s deranged world, this means either the average voltage or the average power is “physically meaningless”. In reality, all it means is that the voltage-to-power equation doesn’t apply to averages. In short, DREMT doesn’t understand nonlinear relationships.
First, the false accusation was, “you don’t understand averages.” Now, it’s “you don’t understand non-linear relationships”.
Perhaps the problem you have is the phrase “physically meaningless”. Perhaps you would prefer, “arbitrary construct”?
DREMT still doesn’t get it. Amazing.
He said an average flux is “physically meaningless”. After being schooled good about this, he changed his tune to claiming an average flux is an “arbitrary construct”. Hilarious.
Apparently he didn’t get the electrical circuit analogy either.
If you say so, Gadden.
Same temperature as August 1998, which makes this the equal third warmest August in the UAH data set.
Year Anomaly
1 2024 0.76
2 2023 0.61
3 1998 0.39
4 2025 0.39
5 2016 0.32
6 2020 0.30
7 2017 0.29
8 2019 0.25
9 2022 0.24
10 2010 0.21
https://oz4caster.wordpress.com/wp-content/uploads/2025/09/d4-gfs-gta-daily-2014-2025-09-01.gif says the same.
Great info, Bellman!
#3-1998 and #5-2016 featured strong El Nino’s, which always belch extra heat out into the atmosphere. Take those out and the top 3 are the last 3 years!
1. 2024
2. 2023
3. 2025
Both these 2 years prior to that featured sustained weak La Nina’s which caused temporary, slight cooling.
9. 2022
??. 2021
The important number is the Tropics. Looks like a new La Nina is getting started which will spread its effects towards the poles over the next 6 months.
I would also expect more cooling from the Hunga-Tonga warming effect dissipating. We might even reach negative anomalies again.
The biggest question is still the AMO. When the AMO phase change takes place we should see an increase in clouds along with further cooling. We are at the same place in the cycle as the early 1960s. We all know what happened then.
https://www.youtube.com/watch?v=RQRqr9_jw5I
You can ‘expect’ all you want, but there wasn’t a H-T warming effect to begin with so there will be no cooling from it either.
The HTE can be seen in the UAH chart above. It correlates well with the early Polar Vortex disruption followed by the Stratospheric water vapor, as shown here:
https://postimg.cc/DWDB8Tww
Now you might say that “correlation is not causation”, which is true. But the causation is backed by solid physics, unlike with the CO2 nonsense.
“But the causation is backed by solid physics”
which you are never able to show us…so this is another post that can be safely ignored.
Child Nate, you know you can’t ignore me.
You don’t have the necessary maturity.
Many folks, including myself, predicted the 2025 cooling we have experienced based solely on the dissipation of the HTe warming effect. There’s not any other good mechanism which fits both the warming in 2023-24 and the cooling we are now seeing.
https://climatlas.com/temperature/jra55/jra55_globe_t2m_2009_2023.png
What other mechanisms did you consider then refute.
The obvious one is ENSO. Every El Nino as large as the one in 2023, produces a strong spike in global warming through the year following it, ie 2023-2024.
Then a cooling in the year following that, ie 2025.
In addition there has been for several years an ongoing annual summer-Fall heat wave in N. Mid latitude oceans. This oscillates somewhat year to year, and is still high, but slightly reduced this year relative to the 2023 peak.
http://www.columbia.edu/~mhs119/Temperature/T_moreFigs/ElNino.vs.aerosols.pdf
Ocean temps still near record of 2023.
https://climatereanalyzer.org/clim/sst_daily/?dm_id=world2
“Many folks, including myself, predicted the 2025 cooling we have experienced based solely on the dissipation of the HTe warming effect. There’s not any other good mechanism which fits both the warming in 2023-24 and the cooling we are now seeing.”
No one has first shown how HT was responsible for the ocean warming.
My comments are not ad hoc speculations like your HT explanation.
I predicted in my May 2022 NASA-LASP Sun-Climate Symposium poster the 1.5°C ‘limit’ would likely be breached during this solar cycle from solar activity. It happened as I predicted. My system is based on decadal ocean warming after sunspots > 95 SN, and was confirmed using CERES EBAF data.
https://i.postimg.cc/Hx0fWkf1/Decadal-Warming-Steps-since-2000.jpg
Subsequent cooling is just the fade off the El Nino peak.
The basis for my prediction was expected solar minimum related relative tropical cloudlessness leading to lower albedo, enhancing the strong TSI rise.
https://i.postimg.cc/7hvjBJz5/Solar-Cycles-and-Tropical-Step-Changes.png
https://i.postimg.cc/5Nr6ghYn/CERES-TOA-Cloud-Area-Fraction-by-Latitude.jpg
It’s highly likely several different perturbations worked together to produce the recent spike — Solar, ENSO, HTE, and possibly others.
That shouldn’t be a surprise to anyone.
The only thing absolutely certain is that CO2 did not do it.
Sorry Nate, ENSO doesn’t fit. The 2023-24 El Nino was over in May 2024. It was replaced by La Nina conditions by the fall of 2024. There was some cooling from the end of the El Nino but that was over prior to the end of 2024.
In 2025 we moved from La Nino conditions to neutral conditions. That would have a slight warming effect. Solar cycle 25 remains at its peak.
There’s nothing to have driven the strong 2025 cooling other than the dissipation of HTe warming. Of course, that also means most of the warming in 2023 was due to the HTe. The El Nino was quite weak. It just looked strong from the added effect of HTe.
There’s still a little more of the HTe warming to lose as well. Probably take another year. When all is said and done we will likely be back to pre-2022 temperatures. And coming soon, the AMO phase change brings even more cooling.
“The El Nino was quite weak. It just looked strong from the added effect of HTe.”
False. It was a strong El Nino by the usual measures.
“There’s nothing to have driven the strong 2025 cooling other than the dissipation of HTe warming.”
Ummm, of course there is.
The eak la Nina spiked in Jan-March of this year. There is always 4-5 months delay in its effect on global UAH.
Nate just can’t accept the obvious. If the El Nino had been strong there would have been significant cooling in mid 2024 after it disappeared. Nope, just some minor cooling.
“There is always 4-5 months delay in its effect on global UAH.”
I said nothing about UAH data, don’t know why you brought it up.
It’s pretty obvious you have nothing to offer that explains the 2023 warming and matching 2025 cooling. HTe explains it quite well. Natural events do affect the climate.
Not UAH? Why not? What data do you prefer?
Even Clint acknowledges that correlation is not indicative of causation, particularly when there are several other confounding variables.
Child Nate, whenever you mention me you need to also include what I have discovered about you. You are an uneducated cult child stalking people here almost 24/7. You obviously have no job. You may even be unemployable….
As usual with the ever tr.olling Clint, posts that are insults lacking any information.
Clint R says:
It’s highly likely several different perturbations worked together to produce the recent spike — Solar, ENSO, HTE, and possibly others.
That shouldn’t be a surprise to anyone.
The only thing absolutely certain is that CO2 did not do it.
So why do these spikes keep getting warmer over the decades?
Nate, Bannedvid, please stop trolling.
Unsurprisingly, Clint R isn’t up-to-date on the actual effects of the Hunga Tonga eruption. See https://newsroom.ucla.edu/releases/hunga-volcano-eruption-cooled-southern-hemisphere
Clint R, the Hunga Tonga eruption actually cooled the planet.
See https://agupubs.onlinelibrary.wiley.com/doi/10.1029/2024JD041296
Gadden, please stop trolling.
The important number is the trend. When will that drop to zero? Not in our lifetime.
The LINEAR trend?
As always, LINEAR trends are, according to the opinionated Brit boy, only useful and valid when they are negative, e.g. that for UAH LT between 2016 and 2021.
Robert, trends on cyclic data need to be at least double the length of the longest cycle. Do you have thermometer data that goes back at least a couple thousand years? No?
That means trends are suspect unless you can mathematically remove the effect of cycles. Do you have that capability? No?
Trends will likely be misleading. They will simply show your position within the cycles which isn’t very useful for predicting future changes.
We have been in the warm phase of the millennial cycle for 400+ years. Hence, warming is expected. The AMO has moved from its cool phase into its warm phase over the past 60 years. Hence, additional warming is expected.
Unless one can remove these effects from historic data they cannot make any claims about other causes of climate change. That is the big failure of climate pseudoscience.
> trends on cyclic data
Where’s your stationarity test, Richard?
LINEAR trends are just the ultimate smoothing of the data.
Cycle nuttery isn’t less ultimate, Richard.
Willard, please stop trolling.
I thought the important number was DC, specifically summer days.
Please advise.
LOL!
LOL!
” The biggest question is still the AMO. When the AMO phase change takes place we should see an increase in clouds along with further cooling. We are at the same place in the cycle as the early 1960s. We all know what happened then. ”
*
Since half an eternity, poster Richard M manipulates us with his AMO stuff by using the detrended AMO variant which is useful only to show that AMO has a cyclic kernel.
But when you want to talk about AMO versus temperatures, you obviously have to use the undetrended variant:
https://drive.google.com/file/d/1_sgA1QI-f6ZELCxGE3TUp3IgsAvJsSfr/view
And then you see that we are far far away from his nice polar bear picture because AMO increases at a rate similar to the rest of the Globe.
Of course the “AMO increases”, it is sitting on top of the millennial cycle which has been rising for several centuries. Your problem is, when the AMO cycle flips back, all of the warming seen this century will vanish. This cooling will rip apart all the claims coming from alarmists even if it’s slightly warmer than the 1960s/1970s.
The small warming from the millennial cycle will not be enough to keep the climate hoax alive. It won’t take long once the AMO flips. Keep an eye on Arctic sea ice. It will be the first hint the AMO transition has begun.
” Of course the ‘AMO increases’… ”
If you think a guy like Richard M would agree being wrong, you are even more wrong.
*
Instead of agreeing he is wrong on misinterpreting the detrended AMO, he invents a new escape
” … it is sitting on top of the millennial cycle which has been rising for several centuries. ”
The millenial cycle isn’t rising at all – apart from ‘the end of the LIA’ as some say.
*
And then the very best:
” It won’t take long once the AMO flips. Keep an eye on Arctic sea ice. It will be the first hint the AMO transition has begun. ”
Aha.
My answer is that keeping fixated on Arctic sea ice is a pseudoskeptic nonsense: AMO is strongly interconnected with AMOC and hence of global nature.
It would therefore be honest to ‘keep an eye’ on Global sea ice instead:
https://drive.google.com/file/d/1MEUnU8tQ0IJANp840_o6FQA-sXCdIJuL/view
*
Maybe the genius Richard M will download the same HadISST1 ICE data, process it, and inform us when the blue polynomial dares to go beyond the red linear trend, it could take long, however :–)
Bindidon says: “My answer is that keeping fixated on Arctic sea ice is a pseudoskeptic nonsense: AMO is strongly interconnected with AMOC and hence of global nature.”
We will see. If I am right the AMO index and Arctic sea ice will track together. As Arctic sea ice increases, the AMO index will decrease. With this view, the AMO index is simply showing the cooling effect of more sea ice in the Arctic. It has nothing to do with the AMOC.
Global ocean currents, of which the AMOC is a small portion, are more likely tied to the millennial cycle.
The change to the AMO cool phase is due soon. The warm phase transition started in 1995 and phases run 30-35 years. We could see this change at any time. The cooling from this change could lead to a 0.6 C drop in global temperatures. Coming on top of the recent HTe cooling will drop global temperature anomalies way down.
The only warming left will be from the millennial cycle. AGW will be relegated to the book of bad science.
https://drive.google.com/file/d/1MEUnU8tQ0IJANp840_o6FQA-sXCdIJuL/view
In this chart of the global sea ice extent there is a trend curve of the 4th polynomial degree. How to interpret its shape?
David
In contrast to linear estimates which draw a simple line over all the data, higher order polynomials tend to much better follow the local behavior of that data.
The choice of 4th order was simply due to the fact that for the observed data, 2nd and 3rd order polys kept too near to the linear estimate.
Richard M
” The warm phase transition started in 1995 and phases run 30-35 years. ”
Wrong, look at the data.
*
All your predictions in the last 10 years – be it here or at WUWT – were simply wrong, but you’ll never admit it.
Keep stubborn, Sah! We’ll enjoy.
Bindidon says “Wrong, look at the data.”
I have looked at the data. The last 3 AMO transitions occurred in 1932, 1962, 1996. All fit in the 30-35 year window. Before then the data is not good enough to make any claims. However, 1900 looks like it would be a reasonable date for the previous change.
“All your predictions in the last 10 years – be it here or at WUWT – were simply wrong”
Name one. My predictions come with conditions. I tie them to actual events. I have stated many times that when the AMO cycle flips we will see cooling. Since that hasn’t happened yet, my prediction has not been wrong.
I’ve also stated that cooling would occur when the HTe warming effects dissipated. Oh look, I was right.
We are not discussing the same thing.
You claim since years that the since the last AMO transition was in 1995, the next one will be 30-35 years later, hence the next flip would be due soon, and the ‘cooling from this change could lead to a 0.6 C drop in global temperatures‘.
This is what I disagree with since years.
I have shown years ago that AMO and global temperatures do not necessary follow the same path, the correlation is much too weak to allow any conclusion in either direction:
https://drive.google.com/file/d/1alycZI-rbKOXsiBKiRDpwI3L1T2LIoPb/view
*
It’s a pity that the AMO data based on Kaplan SST was given up because the AMO now based on ERSST V5 automatically will lead to polemic I would prefer to avoid.
1. Detrended
https://drive.google.com/file/d/1bd46RkCTf8CNmXpH7GJPobvar62IRuKD/view
2. Undetrended
https://drive.google.com/file/d/11PVAuOzEUYiYSRh3PDKIQgFmAJ9N4DEk/view
*
Now if you really believe that the North Atlantic SST increased by such an amount only because of the HTE: feel free to do so.
Let me finally add that when you write
” I’ve also stated that cooling would occur when the HTe warming effects dissipated. Oh look, I was right. ”
you fail to present a clear proof of this HTE effect (which even Roy Spencer doubted).
For ball-on-a-string simpletons a la Clint R, to show the amount of stratospheric water vapor over time is proof enough; but for me it isn’t.
*
Here is a look at a comparison of all four atmospheric layers watched at UAH for the period 2018-2025, 100% encompassing HT since its eruption:
https://drive.google.com/file/d/1WJrazk_mY8xeiSaTznnDOEkVrR2hYrLw/view
Since the HTE, there has been no cooling anywhere in the lower stratosphere that (1) resulted from the cooling of higher layers and (2) corresponded to, and could therefore have caused, a simultaneous and uniform warming of all three underlying layers.
Bindidon, please stop trolling.
A second order polynomial fit to the LT global temperature data indicates that the temperature rise is accelerating.
The old link to data https://www.nsstc.uah.edu/data/msu/v6.0/tlt/
seems dead. The new link http://nsstc.uah.edu/climate/ leads to a global report page. It has a link to data through 2024. Does the change to version 6.1 eliminate the monthly summary files?
Try https://www.nsstc.uah.edu/data/msu/v6.1/tlt/ instead.
Thank you
When I look at
https://www.nsstc.uah.edu/climate/
I see the pictures referring to July 2025, e.g.
https://www.nsstc.uah.edu/climate/2025/July2025/202507_Map.png
Until Roy (or others) get around o changing it, it will be JULY 2025 :: MAPS AND GRAPHS.
A relief to see the recent excursion in monthly temperatures reverting to the long term trend.
https://www.woodfortrees.org/plot/uah6/from:1979/to:2027/every/plot/uah6/from:1979/to:2027/every/trend
That WFT graph is not up to date. Current anomalies are much closer to the long term trend.
https://i.imgur.com/VtbiWYw.png
Thank you for the graph.
It illustrates that the 2024 peak is another like 1998 rather than an invite acceleration.
And this?
https://oz4caster.wordpress.com/wp-content/uploads/2025/09/d4-gfs-gta-daily-2014-2025-09-04.gif
Testing
The Climate Reference Network also shows a near zero temperature departure from climatology for August 2025:
https://a.atmos.washington.edu/marka/crn/usa48/202508.usa48.txt
From comments on Roy Spencer coauthored report for DOE.
“More than 85 American and international scientists have condemned a Trump administration report that calls the threat of climate change overblown, saying the analysis is riddled with errors, misrepresentations and cherry-picked data to fit the president’s political agenda.
The scientists submitted their critique as part of a public comment period on the report, which was to close Tuesday night.”
“In a chapter-by-chapter rebuttal that essentially serves as a peer review, the scientists took apart some of the government’s most eye-popping claims.”
“By Tuesday morning, more than 2,300 comments had been filed regarding the report. Among them was a submission from the American Meteorological Society, a premier climate science organization, which outlined what it called “foundational flaws” in the report and called on the government to correct the findings.”
“Among them was a submission from the American Meteorological Society, a premier climate science organization…”
Meteorologists are not climatologists aka climate scientists. Meteorologists are experts in the field of climate, but laymen in the field of climate change.
I notice you left out the link to whatever left wing source you are using. Try this:
“This comes weeks after the Union of Concerned Scientists and the Environmental Defense Fund filed a lawsuit against the Trump administration”
How many think those are reliable sources? Their liberal bias and publicly stated agenda is obvious.
Let’s not leave out the ring leader:
“Andrew Dessler, professor of atmospheric sciences at Texas A&M University, coordinated the response from dozens of climate experts. He says unlike the DOE report, climate reports from groups such as the United Nations’ Intergovernmental Panel on Climate Change feature the work of hundreds of global scientists and require multiple rounds of peer review.”
The fact remains that the endangerment finding was based on bogus speculation and the raw opinion of activist scientists. It was not based on a sound scientific analysis using factual information. It was pure speculation. Now that the adults in the room are taking a fresh look, the alarmists are very upset.
From the Federal Register:
In this action, the U.S. Environmental Protection Agency (EPA) is proposing to repeal all greenhouse gas (GHG) emission standards for light-duty, medium-duty, and heavy-duty vehicles and engines to effectuate the best reading of Clean Air Act (CAA) section 202(a). We propose that CAA section 202(a) does not authorize the EPA to prescribe emission standards to address global climate change concerns and, on that basis, propose to rescind the Administrator’s prior findings in 2009 that GHG emissions from new motor vehicles and engines contribute to air pollution which may endanger public health or welfare.
Here is a guy who did not read or understand the Union of Concerned Scientists’ comments to Secretary Chris Wright but is now twisting himself into knots with some left wing/right wing bullsh!t. This is followed by some incompetent statement about the EPA Endangerment Finding.
Are you disputing these facts which have been widely reported?
Or are you just calling them left-wing facts?
““More than 85 American and international scientists have condemned a Trump administration report that calls the threat of climate change overblown, saying the analysis is riddled with errors, misrepresentations and cherry-picked data to fit the president’s political agenda.”
“The scientists submitted their critique as part of a public comment period”
“By Tuesday morning, more than 2,300 comments had been filed regarding the report. Among them was a submission from the American Meteorological Society, a premier climate science organization, which outlined what it called “foundational flaws” in the report and called on the government to correct the findings.”
”“More than 85 American and international scientists have condemned a Trump administration report that calls the threat of climate change overblown, saying the analysis is riddled with errors, misrepresentations and cherry-picked data to fit the president’s political agenda.””
I truly shocked!
”Among them was a submission from the American Meteorological Society, a premier climate science organization, which outlined what it called “foundational flaws” ”
The WMO defined climate as 30 years average weather. An ridiculous and meaningless figure.
*Fact* the ‘GAT’ in 1997 was the same as the GAT in 1958.
*Fact* Aside from the latest anomaly (unrelated to CO2), the ‘GAT’ today in 0.1 degrees warmer than it was in 1958.
*Fact* That is insignificant.
*Fact* Nate has basically got noth’n.
None of the “85 American and international scientists” who have “condemned” the DOE report are being objective in any way. The authors of the DOE report did not “condemn” anyone. They have offered their view of the currently available science, as well as their interpretation of the data and analysis contained in the various papers they have referenced — even if that differs from the view of the authors. They are being honest and responsible. Rational and objective people understand that.
Objective scientists do not condemn each other for having a diffident interpretation of the data. That type of personal attack is a certain sign of a political activist. This offensive activism and hype is the foundation of Climate Science. Sadly, the vast majority of people who call themselves climate scientists have already made up their minds to push the climate agenda regardless of the data.
“Objective scientists do not condemn each other for having a diffident interpretation of the data.”
They actually do.
“None of the “85 American and international scientists” who have “condemned” the DOE report are being objective in any way.”
In your non-expert opinion, ie worthless.
“The authors of the DOE report did not “condemn” anyone. They have offered their view of the currently available science, as well as their interpretation of the data and analysis contained in the various papers they have referenced — even if that differs from the view of the authors. They are being honest and responsible. Rational and objective people understand that.”
Look, read the comments of the 85 before judging them. First off many are authors of works referenced in the report. They know what they are talking about.
In normal government reports such as this, there is peer review. There was none here. The 85 authors are providing that peer review.
And it is essential to have here, since the authors of the report were specifically selected from the extreme skeptic wing of the spectrum, a poor representation of climate science views.
Nate, you know better. You know there are no objective opinions or objective peer review coming form the Climate Change folks. The sole purpose of anyone employed as a “Climate Scientist” is to scare people into believing that “climate change is real and already happening” so they can remain employed. The authors of DOE report are being honest about their views.
“Nate, you know better. You know there are no objective opinions or objective peer review”
You know better that the 5 authors were selected for their extreme views of climate change, not to provide the objective truth, but to advance a political objective.
An they were selected bycEnergy Sec Wright who seems unable to understand the most basic energy science.
“Energy Secretary Says Wrapping Earth With Solar Panels Would Produce 20% Of Global Energy, X Users Swiftly Community Note Official”
https://finance.yahoo.com/news/energy-secretary-says-wrapping-earth-233101352.html
There is no threat to anyone , truth is, the climate is most agreeable, as it was during all past warmings, billions have been and are still being wasted worldwide for no good reason,1850 is an obsession , a period in time no sensible person would want to return too,
“all past warmings’ which all were very slow compared to the current human-cause warming.
There were also many past mass extinctions, which I’d prefer not to experience again .
Nate, please stop trolling.
The new Monckton Pause extends to 29 months starting in 2023/04. The average of this pause is 0.62 C. The previous Monckton Pause started in 2014/06 and lasted 107 months and had an average of 0.21 C. That makes this pause 0.41 C higher than the previous one.
+0.155 +- 0.040 C.decade-1 k=2 is the trend from 1979/01 to 2025/07.
+0.027 +- 0.010 C.decade-2 k=2 is the acceleration of the trend.
My prediction for 2025 from the 2025/03 update was 0.43 +- 0.16 C k=2.
My prediction for 2025 from the 2025/04 update was 0.47 +- 0.14 C k=2.
My prediction for 2025 from the 2025/05 update was 0.46 +- 0.11 C k=2.
My prediction for 2025 from the 2025/06 update was 0.47 +- 0.10 C k=2.
My prediction for 2025 from the 2025/07 update was 0.46 +- 0.08 C k=2.
My prediction for 2025 from the 2025/08 update is 0.46 +- 0.06 C k=2.
American Meteorological Society Responds to DOE Climate Synthesis Report
https://www.ametsoc.org/ams/about-ams/ams-statements/statements-of-the-ams-in-force/the-practice-and-assessment-of-science-five-foundational-flaws-in-the-department-of-energys-2025-climate-report/
Blah-blah-blah!
Remember Ark, your “independent subject matter experts” STILL can’t explain how CO2’s 15μ photons can warm a 288K surface.
Beliefs ain’t science.
How the “independent subject matter experts” keep the hoax alive.
This same kind of garbage can be found all over the Internet, and even at some older GOV (NASA) sites. But these selected quotes come from:
https://news.climate.columbia.edu/2021/02/25/carbon-dioxide-cause-global-warming/
Example 1:
In this first example, full sunlight is heating a “dark rock”. They use that to imply that all infrared can do the same. They don’t understand radiative physics and thermodynamics. A black iron skillet heated in full sun can cook an egg. Full-sun photons contain much more organized energy than far infrared photons. Not all infrared is the same, because not all photons are the same. Ice emits infrared. They should try to cook an egg with the energy radiated from ice!
If the egg doesn’t cook, just use more ice….
Hey Puffman, riddle me this –
“UNDP and the Global Fund to Fight AIDS, Tuberculosis and Malaria launched the Smart Health Facilities initiative in 2023, a $2.21 million programme to secure reliable energy for medical services and expand healthcare access. The project, due for completion in 2025, includes installing solar systems at 14 facilities—11 of them district hospitals—representing about 20 percent of the country’s district-level health capacity.
Together, the 14 sites will deliver a combined capacity of 640 kWp of solar energy and 1,545 kWh of battery storage, resulting in an annual reduction of approximately 548,3 tonnes of CO₂ annually.”
https://www.undp.org/smart-facilities/stories/solar-energy-brings-stability-burundis-health-facilities
Is this energy only made out of your “special” photons?
How the “independent subject matter experts” keep the hoax alive.
(Quote from same source as above.)
Example 2:
They demonstrate again they have no knowledge of thermodynamics. They don’t understand the definition of “heat”. They believe infrared is “heat” — “About half of that energy goes out into space, and about half of it returns to Earth as heat, contributing to the ‘greenhouse effect.’
Nope. “Heat” is the transfer of thermal energy from “hot” to “cold”. They believe all infrared is heat…but beliefs ain’t science.
Steo 3 – Saying Stuff
Riddle me this, Puffman –
“A massive data center for ZuckMs AI will likely lead to rate hikes for Louisiana customers, but Meta wants to keep the details under wraps.”
https://www.404media.co/a-black-hole-of-energy-use-metas-massive-ai-data-center-is-stressing-out-a-louisiana-community/
Do you think that banning renewables will increase or decrease energy bills, and is this energy powered by your “special photons”?
How the “independent subject matter experts” keep the hoax alive.
(Quote from same source as above.)
Example 3:
Notice that in their attempts to describe the CO2 nonsense, they always have all the details at the start. They discuss in detail how the solar photons can penetrate the atmosphere, but Earth’s infrared photons can not. But when they get to the end, to where they need to explain how 15μ photons can warm the surface, all they offer is beliefs.
That’s because CO2’s 15μ photons can NOT warm a 288K surface.
Hey Puffman, riddle me this –
“In the government-subsidized zone that provides tax breaks, solar manufacturer ReNew’s sprawling factory makes enough modules to produce 4 gigawatts of power each year — equivalent to the energy needed for approximately 2.5 million Indian homes. The 2-year-old facility that employs nearly 1,000 people serves as a symbol of the solar industry’s momentum. India’s capacity to build key solar components more than doubled in the fiscal year ending in March.”
Source: https://abcnews.go.com/Business/wireStory/indias-solar-industry-aiming-compete-china-finds-strength-125279419
Do you think cranky uncles can do anything about this, and is your “they always have all the details at the start” why you never provide any useful detail?
Willard, please stop trolling.
Clint R
When a 15micrometres photon hits a 288C surface the electromagnetic energy of the photon is absorbed by an electron and becomes kinetic energy of the atom of which the electron is a part.
Since heat is the kinetic energy of atoms the heat content of the surface is increased by each absorbed photon.
All wrong Ent.
“When a 15micrometres photon hits a 288C surface the electromagnetic energy of the photon is absorbed by an electron and becomes kinetic energy of the atom of which the electron is a part.”
* 288 °C is way over the boiling point of water. You may have meant 288K, with is believed to be Earth’s average temperature.
* Electrons do not absorb such low energy photons. Low energy photons, if absorbed at all, require compatible molecules. So if a 15μ photons hits a molecule on Earth, it gets reflected if the wavelength is incompatible.
“Since heat is the kinetic energy of atoms the heat content of the surface is increased by each absorbed photon.”
All wrong Ent.
* “Heat” is NOT kinetic energy of atoms. “Heat” is the thermal energy transferred from “hot” to “cold”. You may be confusing “heat” with “temperature”, which is a common mistake by women and children. Temperature is a measure of the average kinetic energy.
Also, passenger jets do NOT fly backwards.
Now, will you learn or just keep throwing crap against the wall?
“low energy photons, if absorbed at all, require compatible molecules”
Step 4 – Special Pleading
Perhaps I should call it Cheap Bargaining.
Right enough, that should be 288K.
You make no sense. Physicists talk about the heat content of a material. They also measure specific heat, the amount of heat necessary to change the heat content of a standard quantity of a material by a standard temperature.
You are full of it.
Miami has a basketball team named “Heat”. There was a movie called “Heat”. Some track and field events have “heats”.
But the thermodynamic definition of “heat” involves the transfer of energy from hot to cold.
It’s so confusing for women and children….
I’ve learned the best repellent for cult kids is to present a simple physics problem. So, for Nate, barry, ball4, and willard, solve this:
A very thin perfectly conducting plate, with emissivity of 1.0, is in deep space. 1000 W/m² impacts front face, while 400 W/m² impacts the back face.
What is the maximum temperature the plate will reach?
Clint R
I have also learned from MAGA Clint R that he will not do any real science experiment but will insult and denigrate any and all who dare question his made up physics. Just like a true Trumper. Divert and insult and believe yourself to be a genius when you can’t even read a physics textbook (I have already linked you to one).
So have you taken two equal heat lamps and taken the temperature of a surface with one on and then turned on the other to record a temperature? According to you made up physics the second heat lamp would have no effect since the surface has reached the temperature one lamp will provide and the second lamp is emitting the same flux and fluxes can’t add so no effect. Evidence Trump boy or just quit posting and wasting intelligent people’s time with your endless nonsense. The Moon rotates once per orbit. You still don’t accept this well established physics and rely on a elementary explanation of orbiting to create your make believe reality.
Norman, are you mad because I didn’t specifically mention you?
Well, don’t feel left out. You’re invited to solve the simple problem, with or without your childish insults and false accusations.
Clint R
No science from you. No surprise! You woll not do science but you pretend to understand it, even when you are not able to read and comprehend textbook physics on heat transfer. Your made up physics will not change real physics.
Norman, the science you avoid is here:
https://www.drroyspencer.com/2025/09/uah-v6-1-global-temperature-update-for-august-2025-0-39-deg-c/#comment-1713868
Clint R
Your link to your own post is NOT a science experiment! It is a question you pose that I answered correctly that you did not accept.
You run away from science as quickly as your savior Trump runs from the Epstein files. You love him because your own mind works like his. You make up stuff and attack any who inform you that you are incorrect. Tim Folkerts tries to explain real science to him and all you do is attack him. So we all know it is not possible to reason with you or point out your errors. It is not in you to consider the possibility that you are wrong.
Norman, the reason you’re clogging the blog with childish insults and false accusations is because you’re angry that you’ve fallen for the nonsense. You’ve swallowed crap, and now you’re angry and lashing out.
You can’t boil water with ice cubes, but your cult teaches that you can. “Orbiting without spin” is correctly modeled by a ball-on-a-string. But you don’t want to face that reality, yet you have no such model. You don’t want to learn.
Take responsibility for your childish mistakes. You’re behaving like gordon!
333K
(1000 W/m2 + 400 W/m2) / 2 = 700 W/m2
S/B conversion = 333K
Now let’s do this by converting the flux striking each side and averaging the temperature.
1000 W/m2 = 364K
400 W/m2 = 290K
/ 2 = 327K
Problem with this is two-fold.
1. With a thin, perfectly conducting plate there is no temperature gradient, so both sides must be the same temperature. One cannot be 364K and the other 290K, at any time.
2. The resulting flux from 327K is 648 W/m2, which is out of balance with the incoming, so now the plate has to heat up or violate the 1st Law.
barry is the only one that attempted a solution. It’s amazing to me that most of the cult kids don’t even understand their cult’s “science”. At least barry knows what his cult preaches.
Unfortunately, the nonsense barry has been taught is WRONG.
barry adds both fluxes, believing they are both absorbed. This is exactly what his cult teaches — all fluxes are always absorbed. That allows the CO2 nonsense to work, but it also means you could boil water using ice cubes!
Bad science.
barry went on to show that fluxes do not average. So, he got something right. Fluxes don’t average, and they don’t add. (Before the kids start finding specific examples trying to “prove” that wrong, let me state that special cases don’t count.)
So, what is the correct solution?
306K, emitting 500 W/m².
Once the plate is emitting more that 400 W/m², the incoming 400 W/m² will not be absorbed. Incoming fluxes less than the flux being emitted by an object will not be absorbed. That’s why you can’t boil water with ice cubes. It’s also why CO2’s 15μ photons can not warm a 288K surface.
(The cult responses to this are predictable. Watch them resort to “insulation”, which has NOTHING to do with this problem. Or watch for them to claim not absorbing flux is somehow a violation of 1LoT.)
Hey Puffman, riddle me this –
“a hypothetical sphere receiving 960 W/m² would be emitting 240 W/m²”
How many mistake can you spot in that silly dragon crank hypothetical?
7:29 am: “Once the plate is emitting more that 400 W/m², the incoming 400 W/m² will not be absorbed.”
… violates 2LOT since Clint’s described process doesn’t increase universe entropy so there is no hope for Clint R to be correct. It is back to study better thermodynamics course material for Clint.
Clint,
“A very thin perfectly conducting plate, with emissivity of 1.0…”
That’s a blackbody surface. Here’s a definition for you.
“The body that emits the maximum amount of energy uniformly in all directions and at each wavelength interval is called a blackbody. An ideal blackbody absorbs all radiation incident on it.”
https://www.thermopedia.com/content/66/
“Once the plate is emitting more that 400 W/m2, the incoming 400 W/m2 will not be absorbed. Incoming fluxes less than the flux being emitted by an object will not be absorbed.”
Horsepucky. That’s voodoo, not science. Not one single solitary physics textbook will corroborate what you’re saying.
And that is why you never have and never will provide a reference from a physics textbook.
But they will all corroborate what I am saying, as I have shown you.
“incident flux (irradiance) on surface k can be found. It is the sum of the radiation leaving each other surface j in the enclosure that is incident on surface k”
https://www.thermopedia.com/content/70/
M.I.T. says of two surfaces at different temperatures…
“We can add up all the energy E1 absorbed in 1 and all the energy E2 absorbed in 2… The net heat flux from 1 to 2 is…”
https://web.mit.edu/16.unified/www/FALL/thermodynamics/notes/node136.html
M.I.T. knows that warmer bodies absorb the radiation from colder bodies, as well as colder bodies from warm.
Don’t believe M.I.T.?
“All bodies above absolute zero temperature radiate some heat. The sun and earth both radiate heat toward each other. This seems to violate the Second Law of Thermodynamics, which states that heat cannot flow from a cold body to a hot body. The paradox is resolved by the fact that each body must be in direct line of sight of the other to receive radiation from it. Therefore, whenever the cool body is radiating heat to the hot body, the hot body must also be radiating heat to the cool body. Since the hot body radiates more heat (due to its higher temperature) than the cold body, the net flow of heat is from hot to cold, and the second law is still satisfied.”
https://www.engineersedge.com/heat_transfer/black_body_radiation.htm
But hey, what would engineers know?
barry provides us with another example of “Artificial Intelligence”. Like the computer versions, barry is very good at searching on the Internet. And also like the computer versions, he is unable to understand the things he finds. He can find the knowledge, but is unable to organize it. To make proper use of knowledge requires REAL intelligence.
For example, he found the definition of a “blackbody surface”, but he was unable to recognize that “blackbody surfaces” do not exist. They are imaginary. So to base your cult beliefs on imaginary objects is the opposite of intelligence.
Then barry found a MIT link that he doesn’t understand. And because he can’t understand it, he doesn’t realize the link proves him WRONG. The example described in the link has photons being reflected! In barry’s false science, all photons must always be absorbed. Once again, barry proves me right.
In his last “find”, barry provides a link to something with the word “engineer”. So barry believes it without question. Because he found something on the Internet that has the word “engineer”, it MUST be true. Once again, barry demonstrates his lack of intelligence. The link confuses “heat” with “energy” — “All bodies above absolute zero temperature radiate some heat.”
barry recently correctly quoted the definition of “heat”. But lacking intelligence, he can’t apply the definition to reality. There is no such thing as “net heat”, as “heat” only has ONE direction — Hot to Cold.
What will barry try next?
This is one of the best threads I have read in this commentary section. Actual proof. You cannot boil water with ice cubes, so simple but yet so complex.
David 6:01 am, it is possible to boil water with the added absorbed radiation from ice. Dr. Spencer performed easily replicable experiments showing how to do so a few years ago.
Sock puppets recognize sock puppets.
“MIT link… he doesn’t realize the link proves him WRONG. The example described in the link has photons being reflected!”
Did you not read the quote, Clint?
“We can add up all the energy E1 absorbed in 1 and all the energy E2 absorbed in 2… The net heat flux from 1 to 2 is..”
That’s for two surfaces at different temperatures, and the net flow of radiation is the difference, which gives the flow of heat. The equations are for grey surfaces, which allows for both reflectance and absorp.tance, an emissivity > 0 and < 1.
Follow the equations and you see that the same is true when both surfaces are of equal emissivity. Temperature of the surface does not prevent absorp.tion.
https://web.mit.edu/16.unified/www/FALL/thermodynamics/notes/node136.html
Now, where is your reputable physics text corroborating the voodoo you have claimed – that radiation from cooler bodies cannot be absorbed by warmer bodies?
We both know than no physics text confirms this. Which is why you will blather but fail to cite a reputable source. As you have failed to do for years now.
Blackbodies are theoretical but conform to physical laws. Your physics is pure fantasy.
Ball4 I am on the other side of the Atlantic, so the time appears a bit odd..
Please show me the link to dr. Spencers boiling with ice experiment if you have it!
barry, you didn’t refute my comment. You just continued to swallow the MIT nonsense. IOW, you continued with your hallucination:
*The MIT nonsense starts with a single photon, but then changes to flux.
*A “vacuum” is not specified, which must exist to eliminate conduction and convection.
*Temperature of plates is not specified, which must be, to find a solution.
*If a single photon is absorbed, then it is COMPLETELY absorbed.
*If a single photon is reflected (which violates your “all photons are always absorbed” nonsense, then it is COMPLETELY reflected.
The MIT nonsense gets the math correct, as demonstrated by the correct simplification of a mathematical series. But there is only an “Artificial Intelligence” level of understanding about the physics involved.
But, then you go on to misrepresent and falsely accuse me. I NEVER claimed “that radiation from cooler bodies cannot be absorbed by warmer bodies”. What I have stated is that if a photon is somehow absorbed (due to Kirchhoff’s Law), but contributes energy unable to increase the surfaces average kinetic energy, the there will be no temperature increase. That’s similar to putting an ice cube in a cup of hot coffee.) So your false accusation that I “blather but fail to cite a reputable source” is nothing more than a ‘when did I stop beating my wife” question.
If you really believed “Blackbodies are theoretical but conform to physical laws”, then you would know that they reflect photons if their temperature is too high.
What will you try next?
“If you really believed ‘Blackbodies are theoretical but conform to physical laws’, then you would know that they reflect photons if their temperature is too high.”
Pure and utter fantasy. Just a complete fabrication with no basis in any physics text.
Whereas all physics texts that describe the absorp.tive properties of blackbodies say that they absorb ALL radiation incident on them.
I can quote physics texts for days on this, as I have upthread.
But you can’t cite one single solitary physics text that corroborates your voodoo.
“What will you try next?”
Nothing. The facts are corroborated and your voodoo is not.
You’ll keep espousing voodoo,and never cite a text.
If you reply, you will cite no physics text to corroborate your view.
Because it is a fantasy in your mind.
barry claims all physics textbooks mention black bodies.
I explain to barry that black bodies are imaginary.
barry agrees, but claims black bodies obey the laws of physics.
I explain that black bodies are imaginary and violate the laws of physics, so his false beliefs are built on imaginary concepts.
barry claims all physics textbooks mention black bodies.
barry makes a full circle, learning NOTHING. This is what “Artificial Intelligence” looks like.
[BARRY] all physics texts that describe the absorp.tive properties of blackbodies say that they absorb ALL radiation incident on them.
[PUFFMAN] barry claims all physics textbooks mention black bodies.
barry also thinks that the Blue Plate, on its own, is emitting 400 W/m^2, because ChatGPT told him you added up the flux emitted from each side! And, he probably won’t ever acknowledge he was wrong.
barry shows us what “ARTIFICIAL intelligence” looks like.
Child willard shows us what “NO intelligence” looks like.
Weird that still, no dragon crank is challenging Puffman’s misreading of Barry’s claim.
This is where you admit you were wrong, barry.
This is where DREMT dodges again.
Grow up, Willard.
[BARRY] all physics texts that describe the absorp.tive properties of blackbodies say that they absorb ALL radiation incident on them.
[Clint] barry claims all physics textbooks mention black bodies.
Yet another dishonest distortion of my words from Clint. This crap is why we never get anywhere.
And still Clint has not provided one single, solitary physics reference for his voodoo science that warmer bodies cannot absorb radiation from cooler bodies. Not for YEARS. Not after scores of requests to do so.
DREMT, why aren’t you noticing THIS and saying something about it? It’s a blatant, gaping hole in Clint’s thesis that renders his view no more than his own fantasising.
Why do you say nothing about this? Because you are not interested in a fact-finding mission, DREMT. Tribalism is where you’re at.
barry was having a massive go at me up-thread, even though I was correct about the plate, and he was incorrect. Now here he is, not admitting he was wrong, and having a go at me about something else whilst expecting me to fight his battles for him!
It beggars belief.
barry, you continue to misrepresent and falsely accuse me. I NEVER claimed “that radiation from cooler bodies cannot be absorbed by warmer bodies”. What I have stated is that if a photon is somehow absorbed (due to Kirchhoff’s Law), but contributes energy unable to increase the surfaces average kinetic energy, then there will be no temperature increase. That’s similar to putting an ice cube in a cup of hot coffee. So your false accusation that I “blather but fail to cite a reputable source” is nothing more than a “when did I stop beating my wife” question.
If you really believed “Blackbodies are theoretical but conform to physical laws”, then you would know that they reflect photons if their temperature is too high.
What will you try next?
More misrepresentations by our two sky dragon cranks.
” What I have stated is that if a photon is somehow absorbed (due to Kirchhoff’s Law), but contributes energy unable to increase the surfaces average kinetic energy”
Abs.orption MEANS the energy is deposited in the material.
According to 1LOT, it has increased the internal energy of that material.
So your statement violates 1LOT, IOW it is rubbish.
Wrong again, Nate.
Absorbing energy is NOT a violation of 1LoT.
It’s amazing that you kids can’t even understand the basics. And then there is willard, who’s nothing more than a babbling drooler — “riddle me this”, “sammish”, “puffman”, etc.
barry and Willard accuse Clint of misrepresentation because he left out “blackbodies absorb all incident radiation”. Meanwhile, barry keeps misrepresenting Clint, as Clint points out. But, moving on from the first sentence of Clint’s post where he didn’t mention “blackbodies absorb all incident radiation” you will find he is making rather an interesting point. And, it’s not a point that is materially affected by inclusion of that sentence. Clint could have included the sentence, and his overall point would be unaffected. So, it seems like a fuss about nothing. Clint points out that barry goes full circle and doesn’t learn. Indeed, that has been my experience with him. He insists that blackbodies must absorb, and when it’s pointed out that they are not real, it just…falls on deaf ears. Well, I think Clint said it best:
“barry claims all physics textbooks mention black bodies [and that they absorb all incident radiation].
I explain to barry that black bodies are imaginary.
barry agrees, but claims black bodies obey the laws of physics.
I explain that black bodies are imaginary and violate the laws of physics, so his false beliefs are built on imaginary concepts.
barry claims all physics textbooks mention black bodies [and that they absorb all incident radiation]
barry makes a full circle, learning NOTHING. This is what “Artificial Intelligence” looks like.“
See? Doesn’t really change anything about his overall point.
Hey Puffman, here’s your chance to prove you’re not just another brain-dead sock puppet:
https://web.archive.org/web/20160215062717/http://www.drroyspencer.com/2015/12/uah-v6-global-temperature-update-for-november-2015-0-33-deg-c/#comment-203416
Why do you still use coffee and ice cubes?
“Wrong again, Nate.
Absorbing energy is NOT a violation of 1LoT.”
Not at all what I stated.
Lets be very very clear: abs.orbing energy while not increasing the system internal energy violates 1LOT.
“Clint points out that barry goes full circle and doesn’t learn. Indeed, that has been my experience with him. He insists that blackbodies must absorb, and when it’s pointed out that they are not real, it just…falls on deaf ears. Well, I think Clint said it best”
Weak excuse.
The physics of black bodies is correct, and it applies very well to near black bodies eg charcoal, that do exist. His ideas fail for charcoal and many other real, nearly black bodies.
Blackbodies can be used as an excuse to violate the laws of physics, Nate.
https://www.quantamagazine.org/how-to-design-a-perpetual-energy-machine-20200401/
Care to answer their questions?
Child Nate, you just keep going in circles.
Where did I ever say that absorbing energy does not increase the system internal energy?
You cult kids are just clogging the blog and wasting my time.
“because he left out “blackbodies absorb all incident radiation””
Wrong. Again.
What petty quibble does Willard have in mind this time? You can substitute in barry’s complete sentence verbatim if you like, it still doesn’t materially change Clint’s overall point. Let’s try it:
“barry claims [all physics texts that describe the absorp.tive properties of blackbodies say that they absorb ALL radiation incident on them].
I explain to barry that black bodies are imaginary.
barry agrees, but claims black bodies obey the laws of physics.
I explain that black bodies are imaginary and violate the laws of physics, so his false beliefs are built on imaginary concepts.
barry claims [all physics texts that describe the absorp.tive properties of blackbodies say that they absorb ALL radiation incident on them].
barry makes a full circle, learning NOTHING. This is what “Artificial Intelligence” looks like.”
There you go. Now, stop whining and grow up.
All physics texts that describe the absorp.tive properties of blackbodies != all physics textbooks. Gee whizz.
OK, Willard. His point remains unaffected, as shown.
Two days ago:
[BARRY] all physics texts that describe the absorp.tive properties of blackbodies say that they absorb ALL radiation incident on them.
[PUFFMAN] barry claims all physics textbooks mention black bodies.
[ME] *Quotes Barry and Puffman.*
[DREMT] Barry also thinks that the Blue Plate, on its own [etc]
[PUFFMAN] barry shows us what “ARTIFICIAL intelligence” looks like.
[ME] Weird that still, no dragon crank is challenging Puffman’s misreading of Barry’s claim.
[DREMT] This is where you admit you were wrong, barry.
[ME] This is where DREMT dodges again.
[DREMT] Grow up, Willard.
[BARRY, QUOTING THE FIRST TWO MOMENTS OF THE EXCHANGE] DREMT, why aren’t you noticing THIS and saying something about it? It’s a blatant, gaping hole in Clint’s thesis that renders his view no more than his own fantasising.
[DREMT, AFTER SPENDING A DAY RIPPING OFF HIS SHIRT] OK, Willard. But but but but but but but but but.
barry was asking me to intervene on something different to the entirely irrelevant, pedantic point you’re fixated on, Willard.
And, he was wrong about the plate example discussed upthread, and should acknowledge that.
Barry asked DREMT to opine on an obvious lie Puffman made:
[PUFFMAN, LYING AGAIN] barry claims all physics textbooks mention black bodies. I explain to barry that black bodies are imaginary.
An obvious lie that he used to “segue” away from what Barry was saying.
But of course DREMT has to jump on Barry instead of acknowledging this fairly basic fact.
Perhaps he would care to tell us: if numbers were pure constructions, should mathematicians stop using them?
Wrong, Willard. barry asked me to opine on this:
“And still Clint has not provided one single, solitary physics reference for his voodoo science that warmer bodies cannot absorb radiation from cooler bodies.“
Which is a different, but related, topic. And, barry was misrepresenting Clint here, as Clint explained, and you don’t care.
Barry asked DREMT to opine on Puffman’s distorsion *and* Puffman’s lack of a single, solitary physics reference for his voodoo science.
DREMT’s response:
– jumping on Barry
– repeating his irrelevant claim about blackbodies
– ripping off his shirt
Is he alright?
Wrong again, Willard. I opined on the first issue through my own choice, barry only asked me to opine on the second issue. Your reading comprehension fails you again.
False on both counts, and still no Sky Dragon cranks physics textbooks.
As usual, Willard is incapable of admitting an error. At least barry (usually) can admit when he gets something wrong.
And, he still expects Clint to provide textbook support for a claim he never made in the first place. Yes, barry misrepresented Clint, remember?
As usual, DREMT misreads Barry to dodge a very reasonable question.
Willard can’t even admit that barry misrepresented Clint.
Graham D. Warner won’t admit that Puffman has yet to support silly statements such as:
– “incoming fluxes less than the flux being emitted by an object will not be absorbed” to dodge Barry’s criticism
– “fluxes don’t average, and they don’t add”
– “306K, emitting 500 W/m²”
But best is when Puffman speaks of a surface “with emissivity of 1.0” while at the same time rejecting blackbodies, and Graham follows Puffman on this!
I don’t need to support anything Clint says. That’s Clint’s job.
On the one hand, DREMT finds weird that nobody is challenging B4.
On the other, DREMT doesn’t need to support anything Puffman says.
On the third hand, DREMT will soon argue that the commitment to challenge or support are not the same!
Willard obviously has no rebuttal to any of my own words on this sub-thread.
Barry says:
”Blackbodies are theoretical but conform to physical laws. Your physics is pure fantasy.”
LMAO!
Clint is right you don’t know what you are talking about.
Right from the get go you screw up big time in that statement above. If a blackbody is theoretical that means its NOT physical and by not being physical it can’t conform to physical laws.
Thats because the Stefan-Boltzmann law has a somewhat loosely described emissivity factor in it that allows to say in essence that a theoretical body that is a blackbody will theoretically emit radiation strictly in terms of its temperature conditioned upon its not instead reflecting or allowing the radiation to pass through the body which encompasses the emissivity variable in the law. So in effect the law says nothing about anything except that a body that absorbs all radiation that falls on it would have to by the laws of physics emit the same amount of radiation that it absorbed.
But you confound a plebeian understanding of theory with the physical world and then just start making stuff up.
Clint is doing nothing but suggesting that an object reflects radiation that is too weak to warm a given object which is at a higher temperature than the radiation received from a cooler object.
But Clint’s viewpoint has not even been addressed by you. You skirt around it via your plebeian understanding of it.
If you want to skirt Clint’s understanding you need to demonstrate why he is wrong without skirting the rather poorly defined emissivity factor.
You have simply decided to not include all possible ways that could happen because you learned this stuff by rote and not by understanding and instead run down bunny trails making meaningless arguments.
We have come to wide agreement that the greenhouse effect is created by a light absorbing sky being warmer than outer space. The corollary to that is for the sky to warm the surface more the sky will first have to get warmer.
Yet you run around with diagrams and explanations showing it warms the surface without warming the sky first. Nonsense!
For that to happen in any significant way from CO2 increasing in the lapse rate would have to change and nobody has demonstrated that.
” If a blackbody is theoretical that means its NOT physical and by not being physical it can’t conform to physical laws.”
LMAAAAAAAAAOOOOOOOOOOOOOOOOOOOOOOOOOOOOOOOOOOO
Next Gill will argue that an object with an emissivity of 1 is possible, but a blackbody is not!
barry, if you could just admit that you were wrong to sum the fluxes emitted from the sides of an object, an elementary mistake that shows you don’t know what you’re talking about, it might go some way to restoring your credibility.
If DREMT could finally admit that it’s perfectly fine to add SI units (perhaps he should ask his best artificial buddy on this), that’d be great.
It’s fun to watch Willard and Ball4 go down with barry on this.
The plate receives 400 W/m^2 over one side and emits 200 W/m^2 from both sides.
If an object, like the plate, is emitting 200 W/m^2, and has two sides, then it is still emitting 200 W/m^2. It is not emitting 400 W/m^2 because you do not sum the fluxes emitted from the sides of an object!
If you did sum the fluxes, and each side of the plate was 1 m^2 in area, then:
400 W/m^2 in over 1 m^2 equals 400 J received by the plate in one second.
400 W/m^2 out over 2 m^2 equals 800 J emitted by the plate in one second.
With 400 W/m^2 in and 400 W/m^2 out, the plate is somehow emitting twice as much energy (J) as it receives!
Now watch Willard fail to understand…
It’s sad to see DREMT struggling with something his best buddy resolves quite easily:
“In the scenario you described, where the object receives 400 W/m² on one side and emits 200 W/m² from both sides, you can analyze the energy balance as follows:
Incoming Energy: The object receives 400 W/m² from one side.
Outgoing Energy: The object emits 200 W/m² from both sides, totaling 400 W/m² (200 W/m² from one side and 200 W/m² from the other side).
In this case, the energy balance would be:
Incoming Energy = 400 W/m²
Outgoing Energy = 400 W/m²”
It really requires a devious brain like DREMT’s to be able to misunderstand that!
Actually its a bit more complicated than that Willard.
The non-insulating plate in space that is perpendicular to the source of radiation will perform at half the wattage of the level of radiation point source in the sky.
DREMT is right. When the incoming radiation at the surface of the plate is 400w/m2 the plate will radiate 200w/m2 out of both sides of the plate which to Willard’s surprise occurs because the surface of both sides of the plate has twice the square meters as the side of the plate receiving 400w/m2.
come on guys this is 8th grade geometry when I went to the 8th grade movin toward 70 years ago, not complicated at all.
Now all this changes when you change the point source to a surface that covers the entire field of view of the objects (like a pile of bricks in the middle of a heated room). In that case there will be no cooling of the plate and it will warm to the mean temperature of the field of view.
And of course despite the field of view emitting 400w/m2 having much more surface area than the plate, the plate will warm to emit 400w/m2 from both sides. It won’t warm the plate more than that despite the area of the sky being much larger than the plate as iot doesn’t do so in the room with a pile of bricks in the middle.
I would think the only explanation for that is that Clint is right that 400m/2 doesn’t have the frequency required to excite the molecules to a higher temperature.
So DREMT is right about the lack of adding of fluxes. Which of course you test by putting a pile of bricks in the middle of a heated room.
That of course doesn’t stop troglodytes from extrapolating a different outcome.
there is a lot more to ponder here but I definitely don’t want to go further until there is a grasp of the basics which seems in itself an impossible task as the troglodytes far prefer what their daddy told despite lacking a demonstration that they are right.
But it is interesting to point out that for the plate and a ”uniform” 400w/m2 sky/field of view the sky would be emitting no more than 400w/m2 from the backside of its surface. But worry not the sky isn’t such a sky and the sun does emit virtually the same wattage out its backside as its frontside (with some allowable variation due to upwelling currents of gases in the sun not being uniform).
Willard doesn’t disappoint. He can’t even follow the simple maths, relying on AI (which also gets this sort of thing wrong).
It may have taken two thousand words for Gill to admit that 200 + 200 = 400, but at least it brought him good memories!
One day he’ll tell us how DREMT discharged one of that 200.
If you Google:
“if a plate in space receives 400 W/m^2 on one side, what will it emit from both sides given that the surface area emitting is double the surface area receiving?”
You get the correct answer: 200 W/m^2.
Whereas if you just Google:
“ if a plate in space receives 400 W/m^2 on one side, what will it emit?”
You get the wrong answer: 400 W/m^2.
Google AI can get it right, you just need to be careful what you ask it.
Willard says:
”One day he’ll tell us how DREMT discharged one of that 200.”
LOL! Not a math wiz huh?
Obviously Willard you only got half way through the lesson. You have to look at all the examples I gave not just one of them and work it out mathematically.
Obviously Gill has never been a really good accountant if he can go from 400 = 200 + 200 to 400 = 200.
ROFL
Willard your model is flawed. When an object is receiving 400w/m2 from one direction it will warm to emit 200w/2 in 2 directions.
This is where you trip over your own pants leg. When 200w/m2 is emitted back to the 400w/m2 emitting object the net wattage being absorbed by the 200w/m2 emitting object is 200w/m2. And what does it do with that now total 200w/m2? It continues to emit it out in the other direction.
You need to study the model of the bricks in the middle of a room with 400w/m2 emitting walls, floor, and ceiling. Here radiation is received in all directions and the bricks will warm to emit 400w/m2.
You need to more carefully read for understanding Kirchhoff’s Law of Thermal Radiation as it applies to equilibrium temperatures in the bricks in the room thought experiment.
Gill arrives to defend the indefensible, and bait about an argument he lost.
“What comes in must come out” is not supposed to work?
ROFLCOPTER!!!!!!!!!!!!
What does Willard think that “flux is not a conserved quantity” means, exactly? He seems to think it means that “flux in” must equal “flux out” in every circumstance!
Is DREMT so disgraceful as to try to gaslight me about what happens when the equality between input and output disappears?
He might be a machine of perpetual denial, but reality isn’t!
(Next Gill will blame that it’s because of its liberal bias.)
Sheesh! I give Willard ”You need to more carefully read for understanding Kirchhoff’s Law of Thermal Radiation” and the bricks in the middle of a 400w/m2 emitting room that demostrates the law and Willard just ignores it and resorts to ad hominems.
Obviously ad hominems do not amount to a hill of beans in a science argument so apparently Willard has given up. As the teacher that was apparently unsuccessful in instilling in you Willard, if you replay again show your work.
And so Gill continues to pretend he, an accountant, is gonna teach physicists about the laws of physics.
Mercury must be retrograde.
LMAO!
Does he know at least that DREMT can balance everything in the model perfectly well when he’s on his best behavior?
Too bad that after the motte always comes the bailey.
Willard is a troll.
Obviously ad hominems do not amount to a hill of beans in a science argument so apparently Graham D. Warner has given up.
Perhaps he’ll soon return to his music career?
Having settled the scientific argument through two simple demonstrations, here:
https://www.drroyspencer.com/2025/09/uah-v6-1-global-temperature-update-for-august-2025-0-39-deg-c/#comment-1714905
and here:
https://www.drroyspencer.com/2025/09/uah-v6-1-global-temperature-update-for-august-2025-0-39-deg-c/#comment-1715262
there was nothing left to do but state the obvious fact that you are a troll.
DREMT only settled that Gill and Puffman are full of it, by returning to his motte in where he agrees with everybody else.
Oh, and he also settled that he can’t write.
He did not need to settle that he can’t read. That’s already established.
“…where he agrees with everybody else…”
…except you, Ball4, barry, and now Gordon. All of you have argued, wrongly, that flux is a conserved quantity, in other words that “flux in” should equal “flux out”. And, now you’re trying to pretend you never said that…but, the permanent internet record shows you did. Sorry, you made an embarrassingly simple mistake.
I guess Willard can’t get through the math.
No DREMT 10:09 pm, I doubt I’ve ever written flux is conserved quantity but energy flux is conserved per second and per m^2 as appropriately used in Earth’s energy budget.
“except you”
False.
And disgraceful.
You argued that “flux in” should equal “flux out” for the plate, wriggly worm.
DREMT’s wording is quite revealing, and disgraceful, as I clearly recall saying that flux never stands alone!
Perhaps he should take it up with his “buddies”.
Worms will wriggle.
DREMT doesn’t disappoint. He can’t even follow Barry’s simple maths, relying on AI (which also gets this sort of thing wrong).
Still wriggling.
“argued”
Why didn’t DREMT say “said”?
Wriggle, wriggle.
I don’t think DREMT ever admits mistakes, so I put it to the test.
No falsification to date.
Obviously, Willard is the one in the wrong, and cannot admit it. In fact, he’s been wrong on this subject for about three years, and simply can’t learn. Either that, or he’s trolling.
Proven liar and disgraceful crank Graham D. Warner does his thing.
Unlike Ball4 and Willard, I’m honest.
Even if DREMT was always completely sincere, his general blindness to pragmatic cues would mix very badly with his lust for Machiavellian gotchas.
There could be a lacuna in his theory of mind: it’s as if he thought he alone knew that AI was unreliable and could spit whatever it deciphers you want it to say.
It’s not “Google AI”, btw. That’s the corporate division. It’s Gemini.
“It’s not “Google AI”, btw. That’s the corporate division. It’s Gemini.“
I stand corrected.
A very simple riddle for our sky dragon cranks:
(Hot) The coolest summer nights have warmed by 5 deg. F in DC.
Why is this not the title of the next post?
clint belches out his misunderstanding of the new cult of science…
“…the thermodynamic definition of “heat” involves the transfer of energy from hot to cold”.
***
I have asked Clint several times to explain what form of energy is allegedly transferred by his unfortunate definition of heat. Energy comes in different forms, each describing the phenomena related to its different forms. All of it is related to mass, even EM which requires mass to emit it. Therefore all energy is defined by the different forms of mass and how energy is related to them.
So, is the energy transferred electrical energy? Nope. Is it chemical, mechanical, electromagnetic or nuclear?. Nope. Is it gravitational. Nope. There is only one form of energy it can be…heat, or thermal energy. What other form of energy can explain it?
Ergo, according to Clint, heat is the transfer of heat. Yet he preaches, correctly, that heat cannot e transferred from a colder atmosphere to a warmer surface that emitted EM energy in the first place that was converted from heat at the surface.
Confused laddie.
When I say EM comes from mass, there is a peculiar phenomenon involved. An electron, which has mass, also carries a negative charge. We still have no idea what charge is, let alone energy. It is the charge on an electron that produces EM. However, the mass is required to orbit the nucleus at a high enough velocity to emit EM of various frequencies.
In a circuit, however, mass can apparently move independently of the electron so electricity can move at the speed of light while the electrons in a conductor ambles along at centimetres per second.
It would be glorious to understand all of this at the atomic level. Quantum theory is hopeless at revealing it, in fact it seriously obfuscates reality. However, since obfuscation helps incompetent scientists hide away in obscurity, it serves them better. They can prattle on with inanities, something in which alarmist climate scientists excel, while offering an impression they know what they are talking about. Clint appears to have adopted their methodology, a fine act indeed, provided you like such pseudo-science.
I have asked Clint several times to describe which form of energy is being transferred and each time he has not replied. It’s obvious to anyone with half a brain that the energy being transferred is heat, or thermal energy. Thermal energy is the energy associated with atomic motion, either internally, related to electron orbitals, or externally, related to atomic vibration.
In fact, Clausius, credited with the definition of internal energy for the 1st law, defined internal energy as internal heat plus the internal mechanical energy (work) associated with atomic vibration. That makes sense since in the equation governing the 1st law, the external heat and work must be balanced internally to internal heat and work. Otherwise, work would simply disappear.
Clausius was an expert on heat and he defined it as the ‘ponderable’ motion of atoms. He used that word due to the fact that atomic structure in his day was largely unknown, so he was saying it appeared obvious. Now that we know the basic structure of atoms, there can be no doubt that heat is the average kinetic energy of atoms, either internally or externally.
If a mass heats up, it’s because it has absorbed heat directly from a hotter source or it has absorbed EM from a hotter source. According to Clint, a hotter mass simply has a higher energy level, which is fine, but it fails to explain what form the energy has taken. To be precise, one must state the form of energy being transferred.
Saying the mass has absorbed a generic energy is a cop out since we know a mass heats only when heat is applied to it or it absorbs EM from a hotter body like the Sun. Energy from the Sun is mainly electromagnetic energy which can only convert to heat in a mass.
The reason solar EM converts to heat is that electrons in the atoms absorb the EM and jump to higher orbital energy levels. That means their KE increases and guess what, that higher KE means more heat in the surface of the mass when all the electrons respond to EM. Of course, that heat soon spreads to the rest of the mass, warming it.
Many people have confused temperature with the average KE of atoms. That’s because ijits like Botlzmann led the scientific community astray with his dumb definition. He redefined entropy which he had no right to do since Clausius invented entropy and defined it in terms of heat. Clint, being a cult type himself is devoted to the Cult of Boltzmann and other wannabee Druids.
Temperature was defined long before Clausius or Boltzmann as a relative measure of heat. Therefore, when anyone speaks of the kinetic energy of atoms, they are referring to heat, which is measured by the human invention of temperature. Celsius and Fahrenheit developed measures of relative heat levels in their temperature scales, both of which are based on the heat level in ice and the heat level in boiling water as set points.
Claiming that temperature is a relative measure of kinetic energy is a cop out. The fact that Maxwell and Boltzmann came up with such innuendo speaks volumes of their understanding of physics. Maxwell was primarily a mathematician and Boltzmann a theoretician. Neither had a clue about the internal workings of mass at the atomic level.
Both of them are given credit for the kinetic theory of gases but it was Clausius who started the theory. He lost interest in it because it was taking away from the time he needed to study the relationship between heat and work. That raises another point, we know that heat and work are equivalents so why is work still recognized as energy while heat is redefined only as a transfer of some unknown energy.
Back to the same argument. Kinetic here simply means energy in motion and does not define a form of energy. Therefore kinetic energy tells us nothing about the type of energy. Temperature measures heat and no other form of energy, hence, temperature, like kinetic energy, tells us only the relative level of a form of energy we know as heat.
There are serious ijits today who are trying to redefine basic physics, chemistry and thermodynamics. They are trying to redefine gravity as not a force but a sci-fi claim about the intangibles time and space, both defined by human measures for this purpose. They have renounced the incredible work done by Newton and anointed a dreamer cum thought experimenter like Einstein as the new physics god. There appears to be no limit on the stupidity of humans.
Heck, anyone with no experience in science can tell you that heat exists as a form of energy. Everyone, that is, except Clint and his fellow Flat Earthers.
gordon, your therapy is not working.
This is not my field, but maybe you need to increase the medication?
Gordon writes erroneously: “Kinetic here simply means energy in motion…”
No Gordon 8:54 pm, kinetic here simply means constituent mass in motion.
Clausius’ heat is the total kinetic energy of that constituent mass in motion in anything that has mass. Kinetic temperature is the average of that mass kinetic energy measured at the site of the thermometer placed in the thing with mass.
Gordon just can’t ever reliably write about these simple Clausius’ teachings.
Gordon: “clint belches out his misunderstanding of the new cult of science”
Clint: the thermodynamic definition of “heat” involves the transfer of energy from hot to cold
I am pleased to agree with Clint on this. The classic thermodynamic definition of heat is indeed the spontaneous transfer of energy from hot to cold.
With advances in modern science the only caveat to add is that this is the NET transfer of energy, as at the microscopic level energy travels in all directions for all 3 forms of heat transfer.
ark..the AMS report on the DOE findings is nothing more than sour grapes from sourpusses. The authors of the DOE article are more than capable of offering objective opinions on global warming/climate change and the attack of the AMS is completely unobjective and unprofessional.
The DOE article written by John Christy, Roy Spencer, Judith Curry, Ross McKittrick and Steven Koonin represents a group with easily sufficient expertise to offer an objective opinion. The AMS and other alarmists are liars for claiming otherwise.
https://www.energy.gov/sites/default/files/2025-07/DOE_Critical_Review_of_Impacts_of_GHG_Emissions_on_the_US_Climate_July_2025.pdf
The AMS offer the following lies…
“…Decades of intensive research on climate change demonstrate that:
-Climate is changing, and the rate and magnitude of change are unusual in human experience.
-People are the primary cause of modern climate change, mostly through burning fossil fuels.
-Climate change is harmful to humanity, and the threats to people and all life are increasing.
-A wide range of response options is available that can reduce the dangers of climate change.
-Those who study the scientific evidence overwhelmingly agree”.
***
Not a shred of objective scientific evidence to support any of it. No scientific evidence that climate is changing and no evidence that humans are causing the alleged changes. It’s all consensus-based tommyrot.
The last statement confirms the consensus factor, alarmists all agree but none of them can prove what it is they are agreeing to.
There’s abundant hard evidence that the climate is warming. Radiative forcing from greenhouse gases has been quantified since Arrhenius (1896) and refined by modern spectroscopy and satellite observations. Decades of attribution studies show the fingerprints of human greenhouse gases. The “consensus” among scientists is not itself the evidence, but rather a reflection of converging independent evidence.
“Skeptics” misunderstand the meaning of scientific consensus. It is not a vote or groupthink; it is the broad agreement that emerges after multiple independent lines of evidence converge on the same conclusion. Consensus reflects the strength of the science, it does not replace it.
Ark, here you go again….
Everyone knows Earth is in a warming trend. That’s not the issue. The issue is what is causing the warming trend. Your cult believes that CO2 is causing it. But, beliefs ain’t science.
You can’t show how CO2’s 15μ photons can raise the temperature of a 288K surface. Worse, we know from physics that that’s impossible. So your “onsensus” is based on an impossibility. That’s why your cult must attempt to censor, malign, and discredit REAL science.
That’s also why you see people here, like Norman, gordon, and bindi, so full of hatred. They hate people that bring reality to them.
Everyone knows Earth is in a warming trend.
Much better —
https://www.drroyspencer.com/wp-content/uploads/UAH_LT_1979_thru_August_2025_v6.1_20x9-scaled.jpg
Much, much, very much better:
https://www.bbc.com/news/live/c5yk8n869g1t
Willard, please stop trolling.
Upthread there was some confusion about flux, Solar Constant, averaging/dividing/adding flux, and Conservation Law.
A radiative flux is not a conserved quantity. IOW, flux-in is not required to equal flux-out. “Conserved” means to be accountable. In simple terms, things that are tangible are
“conserved” — apples, coins, shoes, etc. For example, if there are 5 apples in a basket and 5 more apples are added, there must be 10 apples in the basket. If a person has $1000 dollars in his bank account, and nothing is put in or taken out, next month he must have $1000 in the account.
“Conserved” is easy to understand with tangible items, but it’s also true with energy. All energy must always be accountable. Energy is a distinct quantity. Common units are BTU, Joules, and kWh. Energy, like tangible items, can be added/subtracted/averaged. If there are 10 apples in each of 10 baskets, there are 100 apples total. If there are 10,000 Joules of energy in each of 2 batteries, then there are 20,000 Joules of energy total.
“Distance” is a conserved quantity. Walk one mile, then walk another mile, and you’ve walked two miles. Speed is distance/time. Speed is not always conserved. For example, two cars going at 40mph are both averaging 40 mph. But that does not mean one is going 80 mph while the other is stopped! The math is correct, but it’s wrong. The math has to fit the actuality.
It gets even more complicated with flux, since flux is a rate per area. Flux is NOT conserved. Simple math does not work with flux, in general. For example, two 1000 W/m² fluxes arriving a surface is not the same as one 2000 W/m² fluxes, even though the math is correct. Flux-in is not required to equal flux-out. The imaginary sphere receiving 960 W/m² will be emitting 240 W/m², but there is no violation of 1LoT.
In general, radiative flux cannot be averaged. The Solar Constant is a special case where averaging can be done because the source is the same, and the changes in distance don’t unreasonably affect the accuracy. Accepting the average Solar Constant as 1365 +/- 5W/m² is reasonable.
But, it is NOT reasonable to treat solar flux as energy. That’s one of the big mistakes made in the CO2 nonsense.
Finally 1LoT does not mean energy-in always has to equal energy-out. 1Lot means all energy must be accounted for. Energy-in seldom equals energy-out, due to losses. That’s true for Earth also. Trying to waste time with “Earth’s Energy Budget” is incompetence. Trying to use flux to do that is fraud.
…and, to make things even worse for climate science, Ball4 has argued here, for example:
https://www.drroyspencer.com/2025/08/uah-v6-1-global-temperature-update-for-july-2025-0-36-deg-c/#comment-1711862
that you cannot average temperatures!
clint…”…flux is a rate per area. Flux is NOT conserved”.
***
The rate of what per area? If there’s nothing varying, you can’t have a flux since Newton defined it as a rate of change of ‘something’ through an area. Flux is actually a rate of change of energy over an area. Some talk about heat as a flux per unit area flowing through an area in a solid.
Only certain energies can be referenced as flux. makes no sense to take about mechanical energy in terms of flux. Flux is normally used in reference to magnetic or electromagnetic energy. I am dubious as to the use of flux to describe heat flow through a solid but I can live with it.
——-
“Accepting the average Solar Constant as 1365 +/- 5W/m² is reasonable.
But, it is NOT reasonable to treat solar flux as energy”.
***
Why not? solar flux is a reference to electromagnetic energy. It is a conversion of that energy to heat that keeps us alive here on Earth.
Gordon
“I am dubious as to the use of flux to describe heat flow through a solid but I can live with it. ”
There are examples.
In Cornwall there is a hot spot in which heat rising from below heats water pumped down boreholes and the steam generates electricity.
Without heat flow the rock rapidly cools and the power station stops working.
IIRC a geological power station only works if the geological heat flow exceeds 0.1W/m^2.
Not only are you stupid, you are obstinately stupid.
You have repeatedly failed questions about the WDL and the SBL, you are completely wrong about averaging, and you keep prattling on about 15μ photons as if they know where they are going!
You, sir, are obviously the product of a failed education system. It is sad. More so as the notoriously low level of education of so many is why the country is heading towards fascism, civil war and the dark ages.
Have a nice day!
So, “distance is a conserved quantity.” Galileo and Newton must be kicking themselves for not thinking of that!
Also, your banking analogy is groundbreaking. Einstein should have skipped tensors and just used your shoe-and-basket accounting system.
But my favorite part is your bold stand against the Earth’s Energy Budget. Those silly satellites, radiometers, and climate physicists, wasting their time measuring flux in and flux out when they could have just asked you “Does it feel fraudy today?”
In all seriousness though, can you hear the words coming out of your mouth or does it just sound like a loud buzzing in your head?
I provided clarification on some issues the cult kids are confused about, and they go “postal”!
I purposely made the examples very simple, so even children can understand. And, they do! That’s why they’re so upset. Now that their hoax is being exposed, they can’t stand that reality.
I’ve said numerous times they have no understanding of basic radiative physics and thermodynamics. And they are now out in full force proving me right!
…and, not a single one of them is bothered when Ball4 says temperatures cannot be averaged, a direct challenge to climate science.
Yet DREMT still has not specified any such direct challenge to science because there is none.
In climate science, averaging temperatures is the norm. According to you, it cannot be done. There, not so difficult to understand, was it?
“The long-term average of the TSI is called the solar constant S.”
https://www.pvlighthouse.com.au/cms/lectures/altermatt/solar_spectrum/measurement-of-the-solar-constant
TSI stands for Total Solar Irradiance.
What are the units for the TSI, again?
DREMT 3:15 pm, if averaging temperatures improperly is the norm in the field, then DREMT ought to immediately be able to find an example where temperatures are improperly averaged in the field. However, DREMT still has not provided even a single specific example.
This means DREMT is definitely wrong until DREMT can do so other than Clint’s humorously improperly averaged temperature example.
Ball4 tries to imply that there is a “proper” way that temperatures can be averaged, and an “improper” way. Yet his post was quite clear: he stated that temperature was an intensive property and thus couldn’t be averaged. Full stop.
DREMT 9:40 am, that’s true; now go inform Clint R.
It’s true that you’re contradicting yourself? OK, then.
No contradiction, just DREMT 12:14 pm demonstrated limited ability to understand physics. DREMT hasn’t found any specific improper temperature averaging in science yet. Other than Clint R because Clint R doesn’t do science.
Suggesting that there is a “proper” way to average temperatures directly contradicts your assertion that temperatures cannot be averaged. You are arguing with yourself, whilst insulting me.
DREMT still can’t find and post up a specific improper way to average temperatures in field of science, yet Clint R found an improper way.
DREMT remains wrong until avoiding simple assertion and shows a specific example.
No need to find an example if your “temperatures cannot be averaged” is true, since in that case every instance of averaging temperatures would be wrong, regardless. It’s only if the other Ball4 is correct, the one who is suggesting that temperatures can be “properly” averaged, that an example of “improper averaging” would be required. So, first of all, you need to decide whether you think temperatures can be averaged, or not.
DREMT still needs to find a specific instance where temperature is improperly averaged in the field whereas Clint R has already posted up a his specific improperly averaged temperature example thus drawing an incorrect conclusion.
Until DREMT can do so, the science is proper. I’m sure DREMT lacks the ability to do so and follow up his false accusations with such a specific example.
NB: a hint for DREMT is this blog reports measurements from averaging energy flow rate which is an extensive property.
https://www.drroyspencer.com/2025/09/uah-v6-1-global-temperature-update-for-august-2025-0-39-deg-c/#comment-1714518
P.S:
“DREMT still needs to find a specific instance where temperature is improperly averaged in the field…”
No, I don’t. Since neither Clint nor I have suggested that temperature is improperly averaged in the field. The entire point was about whether it was right and “proper” to average flux. Not temperature.
You, on the other hand, have stated that temperatures cannot be averaged. Full stop.
The entire point was about whether it was right and “proper” to average flux which is proper since energy flow rate component of flux is an extensive property.
Since DREMT argues that the field is improperly averaging temperature as does Clint R (who then draws an incorrect physical conclusion) when DREMT can’t as yet provide a specific example, then DREMT’s argument has been falsified many times over.
Ball4 goes for the option of simply lying about what has been said.
For what it’s worth, Puffman indeed has suggested that temperature is improperly averaged by climate scientists. Many times over the year. And here when he said that
“In general, radiative flux cannot be averaged,” that “it is NOT reasonable to treat solar flux as energy”, and that this was “one of the big mistakes made in the CO2 nonsense”.
Just another lie from DREMT.
No lie from me. Is Willard now confusing flux with temperature? Who knows. It just gets sillier and sillier.
For some reason DREMT believes that converting different flux values into temperature is wrong, but also that nobody in climate science does that…
It’s fine to convert a bunch of different flux values to temperature values, individually, and then average the temperature values in the usual way.
It’s not fine to average a bunch of different flux values, and then convert the averaged flux value to a temperature value. That gives you the “wrong temperature”.
[DREMT] Neither Puffman nor I have suggested that temperature is improperly averaged in the field.
[ALSO DREMT] If you took the measured flux values, summed them, averaged them and then converted the average value to a temperature value, it would still be the “wrong temperature”.
Does it mean he believes that the only climate model he ever whined about is not used by climate scientists?
Averaging flux values and converting the resulting value to a temperature value is not averaging temperatures. Gee whizz.
Let’s see. When Puffman says:
[PUFFMAN, CERTAINLY NOT AVERAGING TEMPERATURES] The average temperature of the two surfaces is 280K, resulting in an emission of 265 W/m².
he’s not averaging temperatures. At least in his mind. That makes sense, since when he says:
[PUFFMAN, CERTAINLY NOT DIVIDING] Two 500 W/m² fluxes don’t have the same effect on a surface as one 1000 W/m² flux. Fluxes can’t be divided.
he confuses division with addition.
It all makes so much sense.
Yes, he averaged those temperatures. What are you confused about now?
Would DREMT care to tell us how temperatures can “result” in emissions?
That’d be a novel way to conceptualize how the Earth receives energy from the Sun: it would “result” from its temperature!
No, I’m good.
I suppose it’s too hard for DREMT to admit that it’s the other way around: the Earth has the temperature it has because it receives energy from the Sun. And so we won’t ask him if he believes the Earth can emit more than it received.
But how about Puffman’s claim that 500 + 500 != 1000: would he care to say if that represents a division?
Bash whatever strawmen you wish. I will just patiently wait until you have stopped making your incessant noise.
Poor DREMT.
Can’t even concede that “500 + 500 = 1000” doesn’t contain a division.
What are the odds that he finally admits that Puffman’s derivation of a temperature out of flux, without consideration of the surface to which it applied, is sheer stupidity?
More noise. It’s quite soothing, actually. Like a sort of background “white noise”. It might send me to sleep.
Too bad DREMT won’t justify why he believes “in does not have to equal out” in an energy balance model, when the only point of an energy balance model is to make sure in equals out!
zzzzzzzzzzz
The flow of Z’s that DREMT emits presumably can’t be added up.
At least if we believe sky dragon cranks!
Someday Willard will learn:
1) The point of an Energy Balance Model (EBM) should be to balance energy, which is measured in joules, and not irradiance/radiant exitance (flux), measured in W/m^2.
2) That energy (J) is conserved, and not flux (W/m^2).
3) Which means “flux in” does not have to equal “flux out”, unless the surface area receiving the energy is the same as the surface area it leaves from.
4) For the Earth, the surface area receiving the energy is not the same as the surface area it leaves from, unless you “time average” the energy received/leaving over at least 24 hours.
DREMT is so cute when he’s angry. Let’s soothe him with the sound of his best buddy’s voice:
Energy flux over an area refers to the amount of energy that passes through a specific surface area in a given time period. It is typically expressed in units of watts per square meter (W/m²). This concept is commonly used in various fields, including physics, engineering, and environmental science, to analyze energy transfer processes.
The formula for energy flux (Φ) can be expressed as:
[ \Phi = \frac{E}{A \cdot t} ]
Where:
( \Phi ) is the energy flux,
( E ) is the total energy passing through the area,
( A ) is the area through which the energy is passing,
( t ) is the time period.
Energy flux can be applied in contexts such as solar energy, where it represents the solar power received per unit area, or in heat transfer, where it can describe the rate of heat flow through a surface.
***
With my emphasis.
Does he really think that, just because he’s using the word “flux”, energy disappears?
Is there any other source of energy in the zero-dimension model DREMT still struggles with?
Flux never stands alone!
But, obviously not today. Back to sleep.
zzzzzzzzz
One day Graham D. Warner will understand that when he says flux, everybody knows that he’s talking about energy.
Which is why our two dragon cranks have to twist themselves into pretzels when comes the time to talk about the Solar constant. It even pushed Puffman to proclaim: “it is NOT reasonable to treat solar flux as energy”. He might as well argue that the Earth receives NOTHING.
It’s better for everyone if Graham keeps sleeping through it all.
He’s still going…
The gaslighting continues.
When flux represents energy, it needs to balance out.
The only way DREMT fails to do so is by cheating.
Just endless nonsense from Willard.
The usual way DREMT cheats is by saying silly things like “400 is not 200”, hiding away that:
(a) these are different areas
(b) the relationship between these areas is well known
(c) the only source of energy is from the Sun
DREMT has to break both algebra and geometry to sustain Sky Dragon lore. And that’s notwithstanding when he ignores Puffman’s suggestions that a surface with an emissivity of 1 isn’t a blackbody or that temperatures determine emissivity!
In an energy balance model, 200 + 200 indeed equals 400. If it doesn’t, there’s something wrong.
And Barry’s challenge has yet to be met, viz a Sky Dragon Crank energy balance model that would be non additive and non multiplicative.
The nonsense from Willard continues.
DREMT obviously has no rebuttal to anything I said on this sub-thread.
400 W/m^2 in does not equal 200 W/m^2 out. Yet 400 J in, per second, equals 400 J out, per second.
Irradiance/radiant exitance (“flux”) is measured in W/m^2.
Energy is measured in joules (J).
Mind your units.
I think that covers everything!
“400 W/m^2 in does not equal 200 W/m^2 out.”
DREMT keeps using the same silly trick over and over again.
400 W/m^2 on does equal 200 W/m^2 out when there is twice the m^2’s that emits out and there are that receive.
Why does he always “forget” that flux doesn’t stand alone?
Mind your units, Willard:
https://www.drroyspencer.com/2025/09/uah-v6-1-global-temperature-update-for-august-2025-0-39-deg-c/#comment-1714905
DREMT once again forgets to mind the surfaces.
He might as well argue that 400J does no equal 200J!
I did mind the surfaces. Fun to watch them embarrass themselves, as a matter of permanent internet record.
Of course DREMT didn’t mind his surfaces when he said “400 W/m^2 in does not equal 200 W/m^2 out”. Minding his surfaces would have got him 400 W/m^2 in equals 400 W/m^2 out”!
Sometimes he does. Then he’s at the motte part of his usual motte-and-bailey. That’s when he switches to “do numbers really exist” kind of crap.
The plate does not emit 400 W/m^2. Silly Willard.
Poor DREMT. Still unable to grasp that a system that when a system takes in more than it takes out, it’d warm indefinitely. As if he really did not realize that a Watt was a Joule per second.
As if…
It really does emit 200 W/m^2, though. Not 400 W/m^2.
I guess physics isn’t for everyone…
DREMT just can’t complete his thoughts. Any two-sided object (there are many different plates, with many configurations, some even impossibly infinite) that receives energy orthogonally on one side would emit the same amount of energy on both sides.
Since the output *of each side* is half what it receives, then the input can be divided. Then our equation satisfies multiplicativity. So it means it’s additive. Therefore whatever units we use, they must be additive too.
Imagine if DREMT could *not* increase the luminosity of his home by adding more light sources. That would mean his home can only be as luminous as his computer screen.
In a just world, DREMT would be granted this wish, and would never be able to see more light than this.
Willard, I did not say “fluxes don’t add”, full stop.
I said, you do not sum the fluxes emitted from the sides of an object…and, I’m obviously correct. I showed you the maths!
This isn’t up for debate. If the plate were emitting 400 W/m^2, as you claim, its temperature would have to be 290 K. The plate, emitting 200 W/m^2, is actually at 244 K. If you look through the history of the Green Plate Effect debate on this blog, you will find that everybody, on both sides of the debate, accepts that the Blue Plate, on its own, is 244 K. Not 290 K. Even when the Green Plate is added, the proponents of the effect only think its temperature rises to 262 K. Not 290 K.
You’re wrong, Willard.
[DREMT] I did not say “fluxes don’t add”, full stop.
[PUFFMAN] Two 500 W/m² fluxes don’t have the same effect on a surface as one 1000 W/m² flux. Fluxes can’t be divided.
For some reason DREMT does not correct Puffman on this. It’s obvious nonsense.
***
The maths DREMT should show is a bit different than what he did. At least if he minded his units half as well as he pretends. He’d need is to discharge the squared meters properly. Then he’d get watts, which he could then transform into joules.
Something nobody by sky dragon cranks can do, presumably.
This isn’t up for debate. Correctly, if the plate were emitting 400 W/m^2 LW total off both sides, as you claim, then its temperature is easily computed. The plate, emitting 200 W/m^2 LW from each side of 2, is also easily computed as the same given 400 W/m^2 SW absorbed on one side (of two sides) as Eli originally showed.
Humorous but not surprising how DREMT many times manages to miss the easily computed factor of 2 since the defined plate has only 2 sides.
[DREMT] I did not say “fluxes don’t add”, full stop.
[PUFFMAN] Two 500 W/m² fluxes don’t have the same effect on a surface as one 1000 W/m² flux. Fluxes can’t be divided.
For some reason DREMT does not correct Puffman on this. It’s obvious nonsense.
***
The maths DREMT should show is a bit different than what he did. At least if he minded his units half as well as he pretends. He’d need to discharge the squared meters properly. Then he’d get watts, which he could then transform into joules.
Something nobody by sky dragon cranks can do, presumably.
Tell Eli his Blue Plate emits 400 W/m^2 when on its own. Let me know how you get on.
No need to do so 1:13 pm since unlike DREMT’s laughable mistakes, Eli back in 2017 handled the factor of 2 for the 2-sided blue plate T1 appropriately: 400 W/m^2 = 3/2 sigma T1^4
Yes, there is no need to do so, since it’s already well-known that Eli’s Blue Plate emits 200 W/m^2, on its own, at a temperature of 244 K. It does not emit 400 W/m^2, at a temperature of 290 K. That is known and accepted by every single person on this blog who has ever discussed the Green Plate Effect.
How DREMT goes from plates to Eli’s specific thought experiment is quite beautiful.
At the same time, it’s also disgraceful.
I’m quite confident that Eli believes that 200 + 200 = 400. I’ll even go so far as to suggest that he’d point out that DREMT is forgetting that his famous setup involves more than two plates!
My original example was of a plate receiving 400 W/m^2 on one face and emitting 200 W/m^2 from both faces. I specifically chose that example because it would be familiar to people as the setup from the Green Plate Effect before the Green Plate itself is added.
Everyone on this blog who has ever discussed the Green Plate Effect thus knows that I’m right, and you’re wrong, Willard. The plate emits 200 W/m^2, not 400 W/m^2.
Keep on embarrassing yourselves, though.
Correcting DREMT 5:46 pm: since it’s already well-known that Eli’s Blue Plate emits LW 200 W/m^2 per side at equilibrium before a colder GP is introduced …
—-
Not everyone on the blog, not even most, are embarrassed since DREMT 12:14 am is embarrassingly wrong; DREMT’s plate has two sides so emits LW (200 side 1 + 200 side 2) W/m^2, absorbs SW 400 W/m^2 on side 1 at equilibrium which is fine since energy flow rate is an extensive property.
Saying “the plate emits 200 W/m^2” means that it emits 200 W/m^2 from the entire surface area of the plate, Ball4. That means both sides. Keep on embarrassing yourself.
DREMT blames B4 for not understanding his garbled, poorly written mess.
That the plate emits LW in two different directions (absorbing SW from one direction) is beyond DREMT’s limited blog relevant science ability to figure out given many poorly written comments.
If this posts, I may then be at my comment limit. C ya’.
Willard trolls.
Graham D. Warner is stuck with having to ignore Puffman’s nonsense, such as “The average temperature of the two surfaces is 280K, resulting in an emission of 265 W/m²”.
Ball4 lies.
zzzzzzzzzzz
Willard quotes Clint where he made a mistake that he later admitted to, but leaves that part out. What a guy Willard is.
Hey Puffman, riddle me this –
You write twenty posts, Gordo writes two. That makes eleven cranky posts between you two on average.
Where have your twenty cranky posts gone, and what does kWh stand for, again?
So, the moral of the story is…if you’re on their “team”, you can say what you like. You will never be challenged, even if you say something as contentious as “temperatures cannot be averaged”. But, if you’re not on their “team”, and say something similar, there will be an absolute shitstorm of relentless, hatred-filled pushback that goes way beyond the boundaries of any sort of reasonable response.
Wrong DREMT 12:39 am, that temperatures cannot be averaged is not contentious at all to readers with more physics ability than DREMT exhibits.
Ball4 misunderstands. I’m not going to argue with him if he wants to say temperatures cannot be averaged. What’s bad for climate science is good for humanity, after all.
So the moral of the story is that our sky dragon cranks are sophists.
If by “sky dragon cranks” you mean “you guys”, then sure.
More gaslighting. Perfect.
If you say so, Willard.
So the moral of the story is that “averaged flux value is, essentially, meaningless” is sky dragon crank crap.
So, you have no problem with the claim that temperatures cannot be averaged. Great!
So our sky dragon crank has no problem contradicting himself once again. Great!
Temperatures cannot be averaged = climate science goes “boom”. Willard doesn’t bat an eyelid. Perfect. We can all pack up and go home, there’s nothing left to discuss.
No DREMT, you are still wrong not being able to post up even one instance of the field improperly improperly averaging temperatures. Only Clint R posted up his improper temperature averaging so far.
Ridiculous. If temperatures can be “properly” averaged then your assertion that temperatures cannot be averaged is obviously wrong.
You keep on arguing with yourself.
So the moral of the story is that our gaslighter can’t recall what was being said.
Let his only friend help him out:
“Averaging intensive properties involves calculating the average values of properties that do not depend on the amount of material present. Intensive properties include characteristics such as temperature, pressure, density, and concentration.
To average these properties, you typically use a weighted average based on the relevant parameters of the system. For example, if you have two different substances at different temperatures, you can calculate the average temperature using the formula:
[ T_{avg} = \frac{(T_1 \cdot m_1) + (T_2 \cdot m_2)}{m_1 + m_2} ]
Where ( T_1 ) and ( T_2 ) are the temperatures of the two substances, and ( m_1 ) and ( m_2 ) are their respective masses.”
Willard fights back against Ball4, with a quote suggesting temperatures can be averaged. How will Ball4 respond to his challenge?
Why does Graham keep gaslighting B4?
Ball4 said:
“…that temperatures cannot be averaged is not contentious at all to readers with more physics ability than DREMT exhibits…”
Willard finds something challenging his statement. I point that out. Willard decides to falsely accuse me of gaslighting, as usual.
Pathetic.
More gaslighting.
Should be easy to show that B4 “continues” to say that temperatures can’t be averaged simpliciter when he clearly says that there are good ways and bad ways to do so.
Great “dishonesty display”.
That Ball4 is contradicting himself is not my fault.
DREMT misreading B4 is on DREMT alone.
No misreading, Willard.
Graham D. Warner, who has resumed PSTering, indeed misread B4:
The claim was that Puffman made the mistake of averaging temperatures which cannot be directly averaged.
Hence why his best buddy showed how we can still average them.
Not just the Puffman way.
A straight arithmetic average of the two temperatures was fine for the point Clint was making, and he had specified that the surfaces were identical.
Regardless, Ball4 has said numerous times that temperatures cannot be averaged, full stop. Nobody bats an eyelid.
Puffman’s point is invalid, and one does not simply derive a temperature directly from flux.
Except in the world of Sky Dragon cranks, it makes little sense to speak of the temperature of squared meters!
If you can show that using a weighted average gives a different value than Clint’s straight arithmetic average, considering that the mass will be the same for both objects since he stated they are identical, I will concede the point. Give it a shot!
It is more than enough to prove that “averaged flux value is, essentially, meaningless” is sky dragon crap.
Presumably easier to “segue” than to defend Puffman’s “distance is a conserved quantity.”
Dodge no. 1.
Step 2 – Sammich Request #12345
Dodge no. 2.
Three strikes and you’re out!
So the moral of the story is that “averaged flux value is, essentially, meaningless” is sky dragon crank crap.
https://www.drroyspencer.com/2025/09/uah-v6-1-global-temperature-update-for-august-2025-0-39-deg-c/#comment-1714229
Let our dragon crank set his toll bridge elsewhere.
Dodge no. 3.
You’re out! Obviously Clint was correct in that:
1) a straight arithmetic average was fine for his purposes since he made clear the objects were identical, so the result of a weighted average would be no different in any case. That eliminates Ball4’s only objection to his argument.
2) as Clint’s example showed, summing the fluxes, averaging them, then converting that average to temperature gave the “wrong temperature” value (different to his calculated average from 1), above).
Clint wins that one.
Here’s the comment that started this sub-thread:
https://www.drroyspencer.com/2025/09/uah-v6-1-global-temperature-update-for-august-2025-0-39-deg-c/#comment-1714229
Let readers decide who’s dodging it.
Your empty, insult-filled assertions, such as the one commencing this sub-thread, can be safely ignored.
So the moral of the story is that “averaged flux value is, essentially, meaningless” is sky dragon crank crap, and sky dragon cranks have no honor.
They’re not good people.
Wow.
For many years dragon cranks have peddled crap about energy balance models are expressed.
Scientists don’t treat “flux as energy”, whatever they may mean by that. There’s no “special case” in science. The Solar constant is not a constant. Just like there’s no “special” electrons.
Cranks simply forget about the Earth, and trivial facts about algebra and geometry.
In any event, contrarians basically lost:
UPINGTON, South Africa — Deep in South Africa’s Northern Cape province, south of the Kalahari Desert, a beaming light towers above dozens of solar mirror panels.
The mirrors tilt to varying degrees throughout the day, tracking the sunrays and projecting them onto a tower. The tower houses a receiver that absorbs intense heat, boils water and produces high-pressure steam. This is then converted into 50 megawatts of electricity — enough to power over 40,000 households for 24 hours.
https://abcnews.go.com/International/wireStory/africas-solar-energy-potential-makes-bright-future-renewable-125334077
Upthread Clint R provides a textbook example of what Feynman called Cargo Cult Science.
Cargo Cult Science is the superficial mimicry of scientific language and reasoning without the underlying rigor or self-correction that defines real science.
Clint R adopts scientific-sounding terms like “flux,” “conserved,” “1LoT,” and strings them together with everyday analogies about apples, bank accounts, and shoes, but misapplies the concepts showing his lack of technical education or understanding.
He treats “conserved” as synonymous with “can be added up.” His bizarre statement that “distance is a conserved quantity” is ridiculous.
Distance is just a geometric measure of length between two points or along a path. It can increase, decrease, or even stay the same depending on relative motion, and because motion itself is relative, there is no universal invariance that would “lock in” distance as a conserved quantity. It has no conservation law in physics, unlike energy, momentum, or charge.
Yes Ark, I try to make complex issues simple so even children can understand them.
The cult kids here didn’t have a clue about what “conserved” meant until I gave a few simple examples. “Conserved” just means something has to be completely accounted for. It can’t just appear/disappear. So, not only is “distance” a conserved quantity, but so is “area”.
Reality is cool, huh?
Hey Puffman, riddle me this –
Do you condone domestic abuse like your hero does?
Here’s a deal for you:
For every ONE citation to a Physics textbook that says “not only is “distance” a conserved quantity, but so is “area” ” I’ll cite FIVE that say different.
I could cite many more than FIVE but you know, Brandolini’s Law.
Ark, here’s a hint to help you: Willard isn’t helping your cause. He’s just setting a perfect example of an uneducated cult kid.
Now, I’ve got a better idea: Provide the methodology, from First Principles, as to how CO2’s 15μ photons can warm a 288K surface.
I won’t hold my breath….
Hey Puffman, here’s a better idea –
Solve this:
https://www.drroyspencer.com/2025/09/uah-v6-1-global-temperature-update-for-august-2025-0-39-deg-c/#comment-1714097
Alternatively, you could explain how Donald could find another guy with a history of sexual assault, this time as a “Deputy Assistant Secretary” at DHS:
https://www.buzzfeednews.com/article/addybaird/madison-cawthorn-sexual-misconduct-allegations-patrick
Sorry for your loss.
There’s not ONE SINGLE Physics textbook that says “not only is “distance” a conserved quantity, but so is “area”. ”
You have no credibility.
Also Ark, since you mentioned angular momentum, here’s another example of nonsense found on the Internet:
https://www.freeastroscience.com/2025/05/whats-causing-our-moon-to-drift-away.html
When you finish providing the methodology as to how CO2’s 15μ photons can warm a 288K surface, you can then show how angular momentum travels through a vacuum.
I’m betting you won’t be finished in the next 1000 years. But, keep working on it. You don’t want to let your cult down….
“since you mentioned angular momentum”
Hey Puffman, riddle me this –
Here is where “angular momentum” was first mentioned:
https://www.drroyspencer.com/2025/09/uah-v6-1-global-temperature-update-for-august-2025-0-39-deg-c/#comment-1714143
Who wrote that comment, and why would Mark Cernovitch, who is from Illinois and went to Pepperdine, would wish to larp as a Dixie?
Fool!
Tell us which surfaces you think 15μ photons can warm?
Don’t try and tell us that 15μ photons know anything about temperatures. Geez, you’ve been told umpteen times that photons carry no such information!
Arkady mentioned momentum here:
“It has no conservation law in physics, unlike energy, momentum, or charge.”
Just to correct Willard, again.
DREMT reads “momentum” and he thinks “angular momentum”.
No wonder he has no difficulty playing dumb.
Don’t tell Willard, but “angular momentum” is a type of “momentum”, and is a conserved quantity, so Clint’s segue was perfectly reasonable.
Let’s pull the full quote, then:
“Distance is just a geometric measure of length between two points or along a path. It can increase, decrease, or even stay the same depending on relative motion, and because motion itself is relative, there is no universal invariance that would “lock in” distance as a conserved quantity. It has no conservation law in physics, unlike energy, momentum, or charge.”
The “it” is actually distance.
In a reasonable world, that would have been the end of it a long while ago. But dragon cranks need to goad and bait.
The segue was perfectly reasonable.
(POZZO) Since you mentioned angular momentum
(ESTR) You’re the first one who does, Pozzo.
(VLAD) Here’s where Lucky mentioned angular momentum. Just to correct Estragon, again.
(ESTR) Well, actually, Lucky only mentioned momentum.
(VLAD) But momentum includes angular momentum!
(ESTR) Here’s Lucky’s quote: “Distance has no conservation law in physics, unlike energy, momentum, or charge.”
(VLAD) The segue was perfectly reasonable.
Yes, the segue was perfectly reasonable.
Dragon cranks are not reasonable people.
Your segues are definitely not reasonable. You simply swerve completely off-topic for no reason at all. Usually onto politics.
DREMT is reduced to nothing but NO Us, I guess he’s conceded he had no point, all along.
My point is that the segue was reasonable. Yours are not.
Our dragon crank’s point was that my claim was incorrect.
He was wrong.
Instead of conceding, he’s dodging and weaving.
As usual.
You were incorrect, since obviously Arkady mentioned momentum in his original post, so Clint wasn’t wrong to say, “since you mentioned angular momentum” and segue into that discussion. Of course, your point was pathetically petty in any case, as is this whole back and forth right now, but you don’t have a whole lot to offer…so you desperately cling to whatever tiny complaint you can dream up.
I am correct, since obviously Puffman was the first to mention angular momentum, contrary to what he claimed.
Misreads a simple equation. Lies about B4’s simple observation. Misrepresents Nate’s simple point.
Perhaps DREMT should take a break until next month.
No break, I’ll just enjoy watching you lie, spin and squirm. None of what you just said is true.
This much is true:
1. Puffman was the first to mention angular momentum in this thread:
https://www.drroyspencer.com/2025/09/uah-v6-1-global-temperature-update-for-august-2025-0-39-deg-c/#comment-1714077
2. DREMT has tried to dodge that fact by claiming that Puffman made a “segue”.
Astute readers might wonder: why would Puffman have needed to segue were “angular momentum” already mentioned?
Momentum was mentioned, which includes angular momentum and linear momentum.
Wow.
Everything I said is correct.
If you say so, Willard.
ark…”So, “distance is a conserved quantity.” Galileo and Newton must be kicking themselves for not thinking of that!”
***
With tongue firmly implanted in cheek I must challenge your statement. Newton and Galileo were right but Einstein, the accepted authority in physics by many, claimed that distance, or length, can vary with speed relative to the speed of light.
That came about when Einstein redefined time as a variable quantity, based on the theory of Lorentz. In Newtonian physics, distance = velocity x time. The same must apply in relative motion in which the problem is not Newtonian physics but a human mind that gets screwed up with its observations in that realm. Einstein claimed that velocity is a fixed quantity relative to time but that time can dilate, or change. Therefore, distance must be variable as well.
I have no idea what drug Einstein was smoking but it must have been a good one. He was obviously not on this planet when he reached such a conclusion. You see, on our planet, and in the universe in general, distance/length is fixed at STP and cannot vary as Einstein seemed to think. STP is important here because length varies with temperature and pressure, not time.
Furthermore, there is no phenomenon called time in that universe, it was created by the human mind strictly for the convenience of the human mind. If we look at the equation above, written in short form at STP as s = vt, the only way ‘s’ can vary is if time can vary. However, we defined time as a constant based on the relatively constant period of the Earth’s rotation.
The second is defined as 1/86,400th of one rotation of the Earth, where 86,400 is derived from 24 hours/day x 60 minutes/hour x 60 seconds per minute. Then there is the issue between sidereal and solar time.
Ask yourself this: if time is an independent phenomenon, what are the chances that one second of that phenomenon exactly matches 1/86,400th of one Earth rotation. And what are the chances that said second can vary with any velocity relative to the speed of light?
Einstein admitted that his relativity theory is based on Newtonian relativity. However, in the latter, time cannot vary. If you stand on your head and spit coins, you might be able to re-arrange s = vt with time as a variable quantity. That is, the second must change duration but only because of too much blood rushing to one’s head. We know, at least some of us know, that the second is a constant tied to the rotational period of the Earth. Therefore, it appears Einstein got himself turned around while engaging in a thought experiment, upon which much of his theories are based.
I think he was smoking illicit drugs, which does not bode well for those who worship him without question. But, hey, they are all likely on something as well.
sb…”Tell us which surfaces you think 15μ photons can warm?
Don’t try and tell us that 15μ photons know anything about temperatures. Geez, you’ve been told umpteen times that photons carry no such information!”
***
They carry temperature information in their frequency. A 15u photon can only come from a surface in a certain temperature range, found in the infrared region. As long as the 15u EM come from a hotter surface like the solar surface, it can warm any surface like the Earth’s surface.
You might ask how the Sun can emit 15u radiation, and it can’t. The IR it emits is of a higher frequency/shorter wavelength, but it is still in the IR band.
If you are looking for an explanation, look to the hydrogen atom. If an electron is excited several orbital energy levels, say 7 levels, as it drops back to lower energy levels, it can emit IR if it only drops 1 to three levels. I don’t think the IR it emits drops to the 15u level, but there may be some in that range. If it drops all the way back to ground level, it emits UV. Obviously, the colour range it emits means the electrons are dropping back to intermediate levels.
Look up the Balmer, Lyman, Paschen series, etc. for hydrogen. Bohr used that info as an inspiration for his theory of 1913 that explained the workings of electrons in atoms and their relationship to EM generation and absor.p.tion.
The intensity of solar EM varies with the frequency/wavelength. Shorter wavelength/higher frequency EM as found in the UV band is so intense it can burn and alter skin composition, producing skin cancer. That radiation originated 93 million miles away.
All surfaces radiate EM, right down to a few degrees K. The intensity of that radiation varies with temperature and if you measure the frequency you can tell the temperature of the source. That’s how IR thermometers work, they don’t measure temperature but they can convert the frequency of IR radiation to an equivalent temperature.
gordon proves his ignorance, again — “As long as the 15u EM come from a hotter surface like the solar surface, it can warm any surface like the Earth’s surface.”
A 15μ photon from Sun can NOT warm Earth’s 288K surface. Earth WDL photon is about 10.1μ, so it would require photons with more energy (shorter wavelength).
Source ——- Wavelength ——- WDL Temp
CO2 ——- 15μ ——— 193K
Ice ——- 10.6μ ——- 273K
Earth surface ——- 10.1μ ——- 288K
Sun (Visible blue) ——- 0.46μ ——- 6300K
Sun (UVA) ——- 0.35μ ——- 8280K
Only WDL photons significantly above 300K can warm Earth.
As expected.
GR and CR – Thick as two bricks!
GR: “You might ask how the Sun can emit 15u radiation, and it can’t.”
Yes it can you moron. Matter emits radiation at all frequencies. Planck’s law describes the electromagnetic radiation emitted by a black body at a given temperature. There is always a value for emission at 15u. Look up the formula and you can estimate the intensity at 15u for a body at 6000 K.
CR completely and shamelessly misinterprets the WDL (again).
Gordon 12:35 am, a 15 micron photon can have come from the sun or Earth’s atmosphere, no way to tell its source temperature.
Clint R 7:19 am is wrong also since if a 15 micron photon is absorbed by by Earth’s surface and there is no warming, then entropy is not produced violating 2LOT meaning there is no hope for Clint to be correct.
Wrong again, Ball4.
If a 288K surface absorbed a 15μ photon, that would definitely increase entropy. It would be similar to dropping an ice cube in a cup of hot coffee.
(Cult children won’t understand this. It’s just for adults.)
Success! Clint R 12:24 now agrees a 15 micron photon absorbed increases a 288k surface entropy which means the surface was warmed. DREMT 9:49 am also can now inform Clint that DREMT agreed that temperatures are intensive property and can’t be improperly averaged as does Clint.
“Surface” is not the “system”, batty4.
Quit distorting reality. That’s why you always get banned.
I never agreed or disagreed with your bizarre claims, Ball4. I simply point out that you keep arguing with yourself about them. When you finally make up your mind if temperatures can be averaged, or not, please let me know.
Fun to watch both Clint R and DREMT try to change their earlier erroneous comments. There are specific examples posted where Clint improperly averages temperatures but DREMT cannot find one specific improper temperature averaging in the relevant field that DREMT claims exist to post up.
Very humorous.
It’s your claim, Ball4, not mine. You said that temperatures cannot be averaged because temperature is an intensive property. Full stop. That would be a problem for climate science, to be sure, and no examples are required because it’s a blanket statement – all averaging is wrong according to that statement. Then, when challenged on that, you switch to, “improper” vs. “proper” temperature averaging. If temperatures can be “properly” averaged then obviously your claim that they cannot be averaged is false. So, like I said…you’re arguing with yourself.
There’s something about “there is no improper averaging of intensive property temperature in your example” that escapes our sky dragon crank.
But if he can’t get a simple 1/1 = 2/2 statement, that’s understandable
Willard can’t follow the discussion, as usual.
Our dragon crank has returned to gaslighting, as usual.
If you say so, Willard.
SOLAR MINIMUM UPDATE
I was recently scrolling in the r/LeopardsAteMyFace subreddit — where people often share screenshots of regretful Trump voters — when I came across several posts about Arkansas farmers.
On Tuesday, hundreds of farmers from across the state gathered before representatives to voice their concerns and ask for help amid terrible markets, higher input costs, and tariffs. Many emphasized the direness of the situation, with one farmer saying, “I have never been as worried as I am now about whether or not my kids and grandkids will be able to carry on.”
https://www.yahoo.com/news/articles/welfare-queens-people-lot-arkansas-224649174.html
Donald is once again winning winningly!
Come to the UK Willard, our ignorant Labour government have destroyed the future of many farmers offspring, and they have done it deliberately,
The problem with this claptrap is that when a Brit says “farmer” he’s referring to rentiers, Ian:
https://tlio.org.uk/the-uks-50-biggest-landowners-revealed-lovemoney-com/
The Al Maktoum family thanks you for your rent-free services.
If we keep demonizing coal and oil, there will not be any farmers left to worry about,and precious little food either.
Your crack about the Al Maktoum family, proves you dont have a clue what you are talking about when it comes to farming or farm ownership in the UK.
About 2,500 very large farms own or manage 5.5M acres, so more than 25 per cent of all the farmland in England, Ian.
You must be new here.
Willard, please stop trolling.
Here’s another example of Clint R’s fundamental lack of comprehension of what conservation laws actually mean, and his childlike misapprehension of physics.
“angular momentum travels through a vacuum”
Angular momentum is not a substance that flows through space; it is a conserved quantity of a dynamical system.
The mechanism of lunar recession is well established theoretically by direct application of Newtonian mechanics and has been measured with high precision.
NO PHYSICIST CLAIMS that angular momentum is moving through the vacuum.
Ark, you messed up again. Your TDS has destroyed your reading comprehension.
I never supported angular momentum moving through a vacuum. In fact, I was comparing such nonsense to CO2’s 15μ photons being able to warm a 288K surface. I suggested you provide evidence of both impossibilities, which you can’t.
Also, you should understand that your cult fully embraces the false concept of angular momentum transferring through a vacuum. Just one example: “It’s a cosmic exchange of angular momentum. Earth loses some of its rotational energy, which is transferred to the Moon, pushing it outward.”
https://www.sciencenewstoday.org/is-the-moon-really-moving-away-from-earth
You should not be commenting here until your condition improves. Just like you should avoid driving motorized equipment and handling weapons.
Another win for me; your ad hominem attacks are the clearest confirmation. Sorry for your loss, again!
This must be what Trump meant when he said “We’re going to win so much, you’re going to be so sick and tired of winning…,” no?
Sorry Ark, but you claiming victory when you have NOTHING ain’t gonna work. That’s what gordon and ball4 do. The reason you can’t win is because you oppose reality. That’s a loser position.
For example, can you admit that Ball4 is WRONG when he claims Dr. Spencer has shown you can boil water with ice?
The answer is either “yes” or “no”. Can you face reality?
https://www.drroyspencer.com/2025/09/uah-v6-1-global-temperature-update-for-august-2025-0-39-deg-c/#comment-1714242
You won’t answer truthfully. Prove me wrong.
Hey Puffman, riddle me this –
Investing just 0.7 per cent of GDP in the net zero transition could unlock huge financial savings – and avert a rolling climate crisis:
https://www.businessgreen.com/news-analysis/4518554/reaching-net-zero-cut-global-fuel-costs-usd1tr
Do you think it’s better to give 1T to Elon instead?
Willard, please stop trolling.
If DREMT asked one question per comment plus another question per comment, how many questions per comment would he ask?
#2
Willard, please stop trolling.
Apparently Jo Biden never had a month of job losses.
OF COURSE, NOW THAT TRUMP HAS FIRED THE STATISTICS CHIEF, THIS “FACT” MAY BE SUBJECTED TO REVISION.
NATO member Poland shoots down Russian drones that invaded its air space.
Israel bombs our security ally Qatar.
Meanwhile alky Secretary of War (SOW) Hegseth is goading Venezuela into a war.
Does this lock in the Nobel Peace Prize for Trump?
Ark, don’t miss this opportunity to prove you’re not just another brain-dead cult child:
https://www.drroyspencer.com/2025/09/uah-v6-1-global-temperature-update-for-august-2025-0-39-deg-c/#comment-1714308
Whenever you’re ready, Puffman:
https://www.drroyspencer.com/2025/09/uah-v6-1-global-temperature-update-for-august-2025-0-39-deg-c/#comment-1714149
Alternatively, you could tell us what you think of the ZZs flying over Poland under Donald’s watch?
Sorry Clint R, you should have learned the first law of holes, and maybe you wouldn’t be getting your butt kicked all over this board.
For somebody claiming to have fifty years engineering experience, so someone who would be seventy at the very least, Arkady sure comes across like some teenage punk using AI to help write his more technical comments.
Considering that he has to deal with dragon crank crap such as “distance is a conserved quantity”, Arkady’s stance is more than reasonable.
DREMT forgot to support Puffman on that claim, btw.
Willard apparently believes that just because I backed up Clint on a couple of issues we can be compared to the way their little group behaves – working together and thinking in absolute lockstep on every single issue, be it scientific or political, demonstrating no independent thought whatsoever. In fact Clint and I disagree on quite a lot. So what?
When was the last time DREMT threw Puffman under the bus?
He can’t even admit that he’s the one who mentioned “angular momentum. Heck, he can’t even admit that Puffman misread Barry!
What are the odds that he will *ever* accept an inference that involves flux, energy, and temperature?
When was the last time Willard contributed anything of any value whatsoever to this blog?
Pathetic response from the most pathetic individual that ever touched the Climateball field.
You seem upset. Everything OK?
The baiting continues.
Everything OK?
DREMT’s gaslighting has returned.
LOL
Seriously, everything OK?
Would DREMT care to answer if distance is a conserved quantity?
Not as far as I know. But, I could be wrong.
Would DREMT care to tell us who *mentioned* “angular momentum” in this thread?
Hint: it’s Puffman.
Clint mentioned the specific phrase “angular momentum” first, sure. But, Arkady mentioned “momentum” in his original post, so both angular and linear momentum were on the table to be discussed. Also, by “segue” I meant the transition from discussing Arkady’s original topic to Clint bringing up tidal locking. I did not mean any “transition” from mentioning “momentum” generally to discussing “angular momentum” specifically. As far as I’m concerned there is no transition involved there, since angular momentum is a type of momentum.
Any other pathetically pedantic points you wish to over-analyse?
And so, after two days of dodging and weaving, DREMT finally concedes that Puffman “mentioned the specific phrase “angular momentum” first”.
So Puffman was wrong to say “since you mentioned angular momentum”.
So Puffman himself introduce that bait.
Oh, sorry, not “bait” – “segue”.
DREMT can now proceed with his “but but but but but but but but but”.
I’m happy with what I’ve said on the matter already.
His segue into tidal locking was 1,000 times more reasonable than your utterly random lurches into politics that you pull on just about every sub-thread.
Puffman’s “segue”, like most of DREMT’s contributions, was pure bait. The only thing these two dragon cranks contributed to this website. For DREMT, that’s more than five years. For Puffman, that’s more than a decade, under various sock puppets.
It beggars belief.
Willard really hates people who have a different opinion than him about the GHE, for some reason. I wonder what he is so afraid of?
DREMT really likes to emphasize words while seething.
Is he alright?
Seething? I’m cool as a cucumber.
So DREMT says.
What do you say, Willard? Are you OK?
Do you ever answer questions?
If DREMT says so.
Do you ever answer questions?
Did Graham D. Warner already forget that he jumped on me first in this month’s thread in a subthread where I was answering a question?
Probably not.
Again, do you ever answer questions?
So DREMT plays dumb once more:
https://www.drroyspencer.com/2025/09/uah-v6-1-global-temperature-update-for-august-2025-0-39-deg-c/#comment-1713649
It suits him so well!
Yes or no? Do you ever answer questions?
DREMT really is a master at playing dumb.
We know you can troll, but can you answer questions?
https://www.drroyspencer.com/2025/09/uah-v6-1-global-temperature-update-for-august-2025-0-39-deg-c/#comment-1714875
Another mistake from Willard. Can’t answer questions, can’t post in the right place. Sheesh.
DREMT’s gaslighting continues:
https://www.drroyspencer.com/2025/09/uah-v6-1-global-temperature-update-for-august-2025-0-39-deg-c/#comment-1714821
Willard…do you ever answer questions?
See? For one thing, DREMT could just read the linked comment…
Giving straight answers is just not in his genetic makeup, as we see from the link.
Willard, do you ever answer questions?
DREMT apparently read “Did Graham D. Warner already forget that he jumped on me first in this month’s thread in a subthread where I was answering a question?” and wondered how many days he could play dumb. His solution? To pretend that as long as every single of his questions are no answered to his satisfaction by me, I never answer.
Not a good look on DREMT. Not a good look at all.
But, do you ever answer questions?
(ESTR) Did Vladimir already forget that he jumped on me first in this month’s thread in a subthread where I was answering a question?
(VLAD) But, do you ever answer questions?
You can just say “yes”, you know. Give a simple, straight answer for the first time in your life. You don’t have to be a Willard.
Do you ever answer questions?
DREMT could simply read harder.
Or he could drop the rhetorical questions.
Or stop playing you-and-him-fight games.
Or behave like a reasonable person instead of just pretending.
Or simply acknowledge that his three talking points are just silly.
That they rest on silly gotchas cut no ice.
Yet here we are.
It’s a nice demonstration, though. Just the simplest thing, giving a straight answer to a simple question, and you can’t do it. Instead, you have to try and turn it into another personal attack against your opponent. Same as you do with every thread.
Willard, do you ever answer questions?
A really nice demonstration of why DREMT keeps last-wording every thread with silly baiting indeed.
Still, the question remains:
Do you ever answer questions?
Looks like Graham D. Warner is disgracing himself by using the T-word again.
For the twelfth time of asking, do you ever answer questions?
At which point DREMT stops disgracing himself by repeating a question that has been answered many times already?
If Willard could just answer “yes”, or “no”, to the following, then he’d show that he has the ability to give straight, simple answers to questions:
Do you ever answer questions?
When will DREMT finally admit that he was asking a silly rhetorical question?
He just will not cooperate.
Again, when will DREMT admit that he was asking a rhetorical question?
It required an answer. Still does.
DREMT asked a rhetorical question.
Rhetorical questions don’t require an answer.
They contain it.
It was a wrong answer, but nobody cares.
When will DREMT own that he asked a rhetorical question that was obviously false?
It wasn’t a rhetorical question, because it requires an answer. That’s what I’m saying to you.
Astute readers know that “Do you ever answer questions?” means “You never answer questions”.
Perhaps DREMT should try it on his wife during an argument, and report.
All this because he missed the response to it. Sad, in a way.
I don’t think you give straight, simple answers to questions, so I put that to the test. You didn’t pass.
Why would DREMT ask a rhetorical question, pretend it’s not a rhetorical question, act as if he has not been answered (an abject form of gaslighting), and now use special pleading to try to pretend I did not respond, if not to disgrace himself?
Definitely a fail, for Willard.
More than one pragmatic failure by DREMT. His latest:
[RHETORICAL QUESTION] Do you ever answer questions?
[SWITCHEROO] I don’t think you give straight, simple answers to questions
Quite disgraceful!
The real question is:
Does Willard ever answer questions?
The real question is rather – has DREMT any social competence?
Yeah, yeah, but does Willard ever answer questions? Enquiring minds would like to know.
That doesn’t tell us if DREMT has any social skills, does it?
Perhaps it tells us what we already know.
No, I have no social skills.
Does Willard ever answer questions?
Does DREMT ever admit his mistakes?
He made a few this month, still awaiting for his admission.
(He’s making as a new one as we speak, but don’t tell him. It’s a surprise.)
If you say so, Willard.
Clint R continues to critique subjects he does not even understand at the entry level.
To understand the mechanism of lunar recession he’ll have to master freshman physics on conservation laws, university-level classical mechanics of two-body systems, basic astronomy of tides, and the fundamentals of experimental measurement.
And then there is his garrulity about heat transfer. Oh boy!
Does he even hear the words coming out of his mouth or does it just sound like a loud buzzing in his head?
Ark, why do you have such a hard time facing reality? Why do you just make up crap? Why do you fear truth?
Why can’t you admit ball4 does the same?
https://www.drroyspencer.com/2025/09/uah-v6-1-global-temperature-update-for-august-2025-0-39-deg-c/#comment-1714308
Man up little buddy.
That’s what I’m asking, Ark — Can you man up and admit the truth?
Why do you have such a hard time facing reality? Why do you just make up crap? Why do you fear truth?
Why can’t you admit ball4 does the same?
Hey Puffman, riddle me this –
Is Rubio doing a little globalism when he vows a US response following conviction of Brazil’s Bolsonaro, and have you thought of becoming a light designer?
This is Ball4’s comment:
“David 6:01 am, it is possible to boil water with the added absorbed radiation from ice. Dr. Spencer performed easily replicable experiments showing how to do so a few years ago.”
Why do they all protect Ball4?
Here’s what Puffman said:
“I never supported angular momentum moving through a vacuum. In fact, I was comparing such nonsense to CO2’s 15μ photons being able to warm a 288K surface.”
Why is Graham D. Warner protecting Puffman?
I don’t, as I’ve already demonstrated.
DREMT does defend Puffman.
As if his “Not as far as I know. But, I could be wrong.” was enough to wash away all the times he defended him!
DREMT is also Puffman’s attack dog. To take one example, there are 14 “barry says”, whereas there are 103 “barry”.
103!!!
When will DREMT reject Puffman’s special theory of special photons?
Ball4 is the topic. Try to stick to that.
The comment that kicked off that thread:
https://www.drroyspencer.com/2025/09/uah-v6-1-global-temperature-update-for-august-2025-0-39-deg-c/#comment-1714424
does not mention B4.
DREMT really has problems distinguishing the crap he peddles from “the topic”.
I hit reply under a comment about Ball4.
DREMT indeed tried to exploit Puffman’s deflection.
Sometimes, responding to DREMT and taking him by the hand to show him is not enough.
Gaslighting was to be expected.
Willard is also hitting reply under a comment about Ball4, but is not talking about Ball4. Perhaps he needs to learn how blogs work.
Puffman responds to a comment that does not involve B4 or anything B4 said that interests DREMT for his current vendetta by mentionning B4.
DREMT is on the scent. He piles on.
In DREMT’s world, whatever makes him salivate must be “the topic”.
In my world, if you are interested in replying to Arkady’s original post, you hit reply under that post. If you are interested in replying to Clint’s response about Ball4, you hit reply under that post. I hit reply under Clint’s response to talk about Ball4. You have also hit that reply button, repeatedly, but are not talking about Ball4. Instead, you are talking about me. So, you are off-topic, again.
In DREMT’s world, once Puffman deflected to a topic, it becomes “the topic”.
How illuminating, as illuminating as a world in which two lamps can’t provide more light than one.
Back on topic, I have no idea why they would all protect someone as obviously dishonest as Ball4. But, it’s not a good look.
And so “the topic” is the one Puffman injected, which happens to be one of the two DREMT amplified these two past weeks, oblivious that he’s asking of others what he won’t do for Puffman.
At least he did it in less than a month.
Puffman, by contrast, mentioned ice cubes more than three times, which shows regress compared to 2023, for instance:
https://www.drroyspencer.com/2025/09/uah-v6-1-global-temperature-update-for-august-2025-0-39-deg-c
Willard still does not understand how blogs work.
DREMT still fails to grasp topicality, relevance, commitment, and overall reasonableness.
There’s about a dozen of you, all working together, not an independent thought between you, and not one of you can speak out against Ball4.
Remarkable.
There’s no need to support anything B4 says. That’s B4’s job.
Well, you couldn’t support this:
“David 6:01 am, it is possible to boil water with the added absorbed radiation from ice. Dr. Spencer performed easily replicable experiments showing how to do so a few years ago.”
even if you wanted to, could you? It’s absolutely insanely false nonsense.
Well, DREMT couldn’t support this:
“A 15μ photon from Sun can NOT warm Earth’s 288K surface.”
or this:
“Low energy photons, if absorbed at all, require compatible molecules.”
He did try to support this:
“A better idea for an energy budget would be to use “energy””
but he failed, and he won’t remind Puffman that when he speaks of flux he’s actually speaking of energy flux.
… since DREMT demonstrates not understanding the basic atm. physics at 12:19 am. DREMT has no experiment or theory showing where Dr. Spencer’s experimental work involved anything wrong.
Ball4 lies about what Dr Spencer’s experiment showed, then acts like I’m the one challenging Dr Spencer.
A real hero.
DREMT says stuff about B4 and Roy’s experiment without showing any argument.
Another way to dodge that flux is actually energy flux and that Puffman holds an absurdist theory of special molecules!
Willard arrives to defend the indefensible, and bait about an argument he lost.
DREMT 12:19 am challenges Dr. Spencer’s experimental work “as absolutely insanely false nonsense.”
Then DREMT 1:32 pm backtracks and humorously acts like NOT ever writing challenges to Dr Spencer’s easily replicable experimental work! That is a great display of DREMT’s very limited ability in understanding the blog’s science.
“DREMT 12:19 am challenges Dr. Spencer’s experimental work “as absolutely insanely false nonsense.”
You have to laugh at his antics. I said this:
“David 6:01 am, it is possible to boil water with the added absorbed radiation from ice. Dr. Spencer performed easily replicable experiments showing how to do so a few years ago.“
Was absolutely insanely false nonsense. Meaning that it’s absolutely insanely false nonsense to suggest Dr Spencer performed easily replicable experiments showing how to boil water with the added absorbed radiation from ice. He did no such thing.
Ball4 knew exactly what I meant, as well. He’s just trolling, as usual.
5:35 pm: “He (Dr. Spencer) did no such thing.” which is easy to falsify using the blog search engine.
So Dr. Spencer did! The internet remembers if not the uninformed DREMT. Dr. Spencer did so in experiments with the actual atm. and in lab experiments. DREMT just hopelessly lacks accomplishment in the experimental science of this blog & prefers to comment only by mostly false assertion.
So, Ball4 asserts that Dr Spencer performed experiments showing how to boil water with the added absorbed radiation from ice…only, he’s not going to link to them.
Right…
DREMT said that Roy’s experiments did not refute Puffman, and he won’t link to them.
Of course…
Willard puts some more words in my mouth.
DREMT already forgot that he wrote: “it’s absolutely insanely false nonsense to suggest Dr Spencer performed easily replicable experiments showing how to boil water with the added absorbed radiation from ice. He did no such thing.”
He writes so much to say so little.
This has nothing to do with Clint. Or me. It is simply about a stupid claim Ball4 made. Which he cannot support.
DREMT is disgracing himself once again:
Puffman’s “ice cube can’t boil water” nonsense is indeed related to Roy’s experiments.
Experiments that DREMT still fails to cite!
Absolute gracelessness.
The “claim” that ice cubes cannot boil water via their emitted radiation does not need support. Obviously, it is correct, proven correct by the sum of all human experience throughout history. The claim from Ball4 that Dr Spencer somehow conducted an experiment showing how ice cubes could boil water via their emitted radiation is extraordinary. Extraordinary claims require extraordinary evidence. Instead, he’s provided nothing.
DREMT does a bit like Kash:
REPUBLICAN REP. MASSIE: “Have you reviewed the docs where the victims name the people?”
PATEL: “No.”
MASSIE: “So how can you tell the senate there are no names?”
SWALWELL: “If Donald isn’t implicated why not release everything that involves him?”
PATEL: *loses it*
Puffman repeated his nonsense about ice cubes, B4 said Roy refuted that nonsense. Either DREMT follows through and links to Roy, or he folds.
It’s really simple.
Willard desperately tries to reverse the burden of proof.
Clint has basically stated there are no unicorns.
Ball4 is claiming Dr Spencer has evidence they exist.
Willard is expecting me to link to every single experiment Dr Spencer has ever done, to show that none of them have evidence of unicorns.
What Ball4 does is an affront to the intelligence of everyone on this blog and an insult to Dr Spencer. What you do, in defending him (really just another excuse to attack and attempt to irritate me) is absolutely pathetic.
Correcting 1:58 pm comment: The “claim” that ice cubes cannot boil water via their added emitted radiation invalidating both 1LOT and 2LOT does need extraordinary experimental support. Obviously, the “claim” is incorrect, proven incorrect by the sum of all human experience supporting both 1LOT and 2LOT. The claim that Dr. Spencer somehow conducted an experiment showing how ice cubes could boil water at 1 atm. via their emitted radiation is not extraordinary, it is just every day ordinary thermodynamics correctly using 1LOT and 2LOT by an expert in the subject matter.
DREMT has been provided the information necessary to find Dr. Spencer’s years ago experiments but then DREMT chooses to ignore or dispute simple, replicable experimental evidence showing the “claim” to be false.
“desperately tries to reverse the burden of proof”
False.
DREMT made claims.
They’re his claims.
He should honor the same commitments he requires of others.
Where are Roy’s experiments?
“LMAO” at both responses. Now that’s gaslighting. Especially Ball4’s response. They do amuse the blog with their failure to understand simple physics, and their ridiculous, obviously false claims. Tweedle Dumb and Tweedle Dee.
Here is one claim DREMT would need to support:
[DREMT’S UNSUPPORTED CLAIM] Ball4 lies about what Dr Spencer’s experiment showed,
One good step would be to cite Roy’s experiment. At the very least, we would then ascertain if DREMT and B4 are talking about the same thing.
No need to read back all of Roy’s to find Roy’s experiment. That’s just a common misconception about the burden of proof. Almost required for contrarians who like Step 1 – Pure Denial.
Here is one experiment:
https://www.drroyspencer.com/2016/08/experiment-results-show-a-cool-object-can-make-a-warm-object-warmer-still/
Nowhere is water boiling as a result of the emitted radiation from ice cubes.
Oh well. Time for Willard and Ball4 to move the goalposts.
See, DREMT 12:25 am was feigning knowledge of the experimental evidence proving DREMT wrong.
Goalposts are NOT moved since the added “cool object” (ice cubes) made the “warm object” (water) warmer still. Showing that running the experiment with the initial water a smidge below boiling would cause the water to come to a boil per 1LOT and 2LOT with the added absorbed incident radiation from ice cubes. Clint R has been wrong all along.
Dr. Spencer also ran the experiment outdoors using the actual night time atm. in Alabama and found the same results.
Quite a self-goal there.
The experiment perfectly demonstrates how a (nearly) blackbody can act as radiative insulation.
Something that DREMT has always denied.
And, the goalposts are immediately shifted.
The claim was made that the experiment showed water boiling as a result of the emitted radiation from ice cubes. It does not show that. Thus, my claim that Ball4 was lying about the experiment is shown to be correct.
In a sane world, that would be the end of it.
“The claim was made that the experiment showed water boiling”
DREMT puts words in B4’s mouth.
At least it’s not words from his best buddies this time.
Still wrong DREMT 8:13 am, Dr. Spencer’s experiments always apply since they demonstrate using 1LOT and 2LOT proves you and Clint R are wrong that added ice cannot be used to boil water since the added “cool object” radiation (ice cubes) made the “warm object” (water) warmer still.
Silly.
Matters not what you were discussing.
The experiment perfectly demonstrates how a (nearly) blackbody can act as radiative insulation.
You have consistently denied that a blackbody can act as a radiative insulator.
That denial is now, thankfully, proven wrong by this experiment.
Thankfully, no longer will you be able to pull that out of the dustbin in arguments about the GPE, or the GHE.
Nate tries to bait me into another month-long back-and-forth. He will not get his wish.
Ball4’s claim:
“David 6:01 am, it is possible to boil water with the added absorbed radiation from ice. Dr. Spencer performed easily replicable experiments showing how to do so a few years ago.”
is proven false by simple inspection of the link I provided. My claim that he lied is proven correct. Ball4 is a proven liar.
Instead of criticising Ball4, Nate tries to change the subject. Willard still tries to defend Ball4. All three are acting abysmally.
If Nate wishes to start a new thread about Dr Spencer’s experiment, which has been known about for years, he can do so if he wishes. If so inclined, I will join him there. This sub-thread is about Ball4 and his absurd claim. Nothing else will be discussed.
No lie at all, DREMT 1:41 pm, just DREMT’s limited knowledge acquired in this field on display.
Thx for posting one of the experiments where years ago DREMT and Clint were proven forever wrong about physics by Dr. Spencer’s ice cube and water experiment showing David 6:01 am, it is possible to boil water with the added absorbed radiation from ice as required per 1LOT and 2LOT. Dr. Spencer did perform easily replicable experiments showing how to do so a few years ago.
“…it is possible to boil water with the added absorbed radiation from ice…“
…and not a single one of them will speak out against Ball4. The guy is just laughing at how much he can get away with.
The ultimate irony is that some of them actually made arguments (involving view factors) for why the radiation from ice could never boil water. But, here’s the thing: they directed their arguments towards Clint! As if they were “correcting” him…
Not “getting away” (DREMT term) with anything given Dr. Spencer’s experiments showing DREMT and Clint R to be wrong about basic physics. I am laughing at DREMT’s ultimately futile efforts to overturn Dr. Spencer’s experimental results.
Proven liar and notorious climate troll Ball4 does his thing.
There’s a hearing scheduled for today at 2 p.m. Eastern on the lawsuit in the U.S. District Court for the District of Massachusetts. You can sign up to listen to the hearing here: https://forms.mad.uscourts.gov/seating-signup.html?id=1%3A25-cv-12249-WGYWGYYoung09%2F11%2F20252%3A00%20PM
Timeline cleanser:
“Rapid changes in the climate system, primarily driven by anthropogenic GHG emissions associated with industrial activity and land-use change, represent significant risks to ecosystems, economies, and human well-being.”
What hubris, to think that we control the weather lol. Keep following your sorcerers as they lead you into poverty
PhilJ.
You left out the most important part of my post:
I’ll be more than happy to discuss what I have learned of the objective science supporting my comment if you’re willing; but I suspect that you have nothing.
Been remembering 9/11 today.
Yes barry, me too.
However, I also remembered 1973 9/11, a dark day dor democracy.
With the full support of the United States, which would not tolerate a socialist government in its backyard, General Pinochet began his military coup by having the Chilean army bomb the Palacio de la Moneda, Chile’s White House, and ushering in a bloodthirsty dictatorship that claimed ‘in fine’ far more lives than the massive, cowardly attack on the Twin Towers in New York.
A few years later, a similar, albeit even worse, situation occurred in nearby Argentina: over 30,000 people died there, about 3,000 of them during the infamous ‘vuelos de la muerte’ (they were thrown alive from Argentine Air Force planes a few thousand meters over the Atlantic).
The team that wrote the DOE report has been dissolved.
https://edition.cnn.com/2025/09/10/climate/trump-dissolves-contrarian-group
But their work has already changed the environment and industrial policy of the United States and destroyed the credibility of all consensus scientists.
I note too that the US plans to stop measuring and recording greenhouse gas emissions.
https://www.epa.gov/newsreleases/epa-releases-proposal-end-burdensome-costly-greenhouse-gas-reporting-program-saving-24
One less thing to worry about.trillions down the drain because of climate hysteria, all the while the poor scratch a living with their bare hands.
The poor are getting their act together.
Africa is now buying cheap wind turbines and solar panels from China instead of expensive fossil fuel technology from America.
The cost saving is twofold.
1) Economies of scale make the capital cost of renewables from China lower than their fossil fuel equivalents.
2) Renewables do not need fuel. No need to keep on paying America for gas or oil.
Entropic man says:
”Africa is now buying cheap wind turbines and solar panels from China instead of expensive fossil fuel technology from America.”
Good for them EM. that means fossil fuels will be cheaper for Americans.
And I wouldn’t call African energy producers, poor by the way.
SOLAR MINIMUM UPDATE
American soybean farmers are heading into harvest season without a single order from China, historically their largest customer, raising alarm bells about the agricultural sector’s stability and broader implications for the U.S. economy.
https://fortune.com/2025/09/09/soybean-harvest-china-agricultural-crisis-trump-tariffs-caleb-ragland/
GNINIW!
dremt…”Clint mentioned the specific phrase “angular momentum” first, sure. But, Arkady mentioned “momentum” in his original post, so both angular and linear momentum were on the table to be discussed. … As far as I’m concerned there is no transition involved there, since angular momentum is a type of momentum”.
***
Dremt…how’s it going?
There is a problem with the definition of angular momentum, which is applied incorrectly by many scientists. I think Clint mentioned that the Moon cannot have an angular momentum, with which I agree, since at any one instant it can only have a linear momentum. Excuse me for name-dropping, but Newton appears to agree as well. I channeled Newton recently and he claims it obviously has no angular momentum.
Angular momentum can only apply when a rotating lever arm, with mass, is attached to a mass that is claimed to have angular momentum. The outer rim of a flywheel has angular momentum since the entire mass, including spokes, is a rotating mass. Obviously, under normal conditions, the rim could not rotate without the spokes.
If you consider a radial line through one spoke to the rim, it is rotating wrt the x-y coordinate system hence has a changing angle measurable in degrees or radians. Since it and the rim are a rotating mass, you can have angular momentum.
The Moon has no such radial arm other than a massless vector created by humans hence has no angular momentum. As Newton stated, the Moon moves with a linear motion that is converted to an angular motion (curvilinear) by Earth’s gravitational field.
If the Moon had not brought its own momentum with it, a linear momentum, it could not have gone into orbit. At that, it needed a very specific liner momentum to be captured by Earth’s gravitational field.
Another common mistake stated by some scientists is that a mass moving in a circular orbit is accelerating. They base that incorrectly on the notion that a changing vector angle constitutes a change in angular velocity hence acceleration.
How can a mass moving in a circular orbit at a constant velocity also be accelerating? It can’t. The error is clear, a change in angle of rotating vector is not acceleration as long as it is constant.
Gordon
You are contradicting yourself.
The Moon does indeed have linear momentum and would be expected to move in a straight line along a vector.
Instead its vector changes over time through 360 degrees per orbit.
To change the vector requires acceleration. If the Moon is continuously changing vector it must be under continuous acceleration.
Entropic man
Of course the Moon rotates about its polar axis!
*
As do all greater celestial bodies in the solar system, i.e. including Jupiter’s four so-called Galilean satellites whose spinning was measured for centuries, our Moon spins because it was born out of an accretion disk created during our Sun’s birth.
*
Imstead of trying to learn, Robertson merely kept for years on his ignorant stance, e.g. in April 2024:
” Mayer had no business declaring an axis of rotation based on telescope observations. He was merely projecting onto the lunar motion his belief system.
All Mayer ever saw was one side of the Moon. He saw no rotation. Had he not been so obtuse, and more Scottish, he would surly have gotten it that the Moon always keeps the same face pointed at Earth. He had no right to presume it was rotating on an axis.
We can excuse his obtuseness based on the fact he could not jump on a ship and get to the other side of the planet easily to make further observations. ”
*
What a stupid, arrogant post!
*
Somewhat later he wrote
” I am still awaiting your proof, based om Mayers work, that the Moon rotates on a local axis. ”
Inevitable reply:
You are as always an incompetent, ignorant, lying boaster.
*
1. I have shown you many times during the last years that Mayer’s treatise contains a valuable proof of the lunar spin, based on a long observation and an outstanding evaluation of the observed data; a proof you are stupid enough to doubt, discredit and denigrate, though you are absolutely unable to scientifically contradict it.
*
2. I have explained often enough that Mayer’s lunar tables were the most accurate even 50 years after his death because, unlike all other scientists before him (including Flamsteed, Halley, Hadley, etc.), whose lunar tables were biased by the libration in longitude, Mayer was able, in a long, arduous work based on spherical trigonometry, to separate the orbital and rotational motion of the Moon and thus to calculate 100% selenographic, libration-indifferent coordinates of the lunar craters.
*
3. You are apparently too dumb to understand what it means that Mayer computed for the lunar spin period the same value (27.32166 days, down to the fifth digit after the decimal point) as is done today by using lunar laser ranging of the retroreflectors on the Moon – despite using no more than a simple telescope, a self-made micrometer with 1 arc minute precision and a primitive metronome.
*
Finally, Robertson and his denial acolytes (Clint R, the fake moderator DREMT and the Hunter boy) tried many times to turn Newton’s view on the lunar spin such that it could fit their own, egomaniacal view – despite Newton’s unequivocal text, as is shown by the most recent translation by Ian Bruce (2012) directly from the Latin source:
PROPOSITION XVII. THEOREM XV.
” The daily motions of the planets is uniform, and the libration of the moon arises from its daily motion.
It is apparent by the first law of motion and Corol. 22. Prop. LXVI. Book I that Jupiter certainly is revolving with respect to the fixed stars in 9 hours and 56 minutes, Mars in 24 hours and 39 minutes, Venus in around 23 hours, the earth in 23 hours 56 minutes, the sun in 25 1/2 and the moon in 27 days 7 hours 43 minutes.
It is evident that these are found from the phenomena.
Spots in the body of the sun return at the same place on the solar disc in around 27 1/2, with respect to the earth; and thus with respect to the fixed stars the sun is rotating in around 25 1/2 days.
Truly because there is the monthly revolution of the moon about its axis : the same face of this will always look at the more distant focus of its orbit, as nearly as possible, and therefore according to the situation of that focus will hence deviate thence from the earth.
This is the libration of the moon in longitude: For the libration in latitude has arisen from the latitude of the moon and the inclination of its axis to the plane of the ecliptic.
N. Mercator has explained this theory of the libration of the moon more fully in letters from me, published in his Astronomy at the start of the year 1676. ”
*
None of them understood until now that Newton did not use the expression ‘with respect to the fixed stars’ to describe motions of bodies, but rather these motions’ period, what is perfectly visible in the paragraph about the sun.
Entropic man
The best part is that Robertson, for example, would never visit
https://rasc-vancouver.com/observatories/trottier-observatory/
because he would quickly have to admit how completely wrong his egomaniacal distortions of astronomical reality actually are.
Hi Gordon, it’s going OK, thanks. Just busy dealing with the team of trolls that have infested this blog.
The team of trolls in fact consists of Robertson, Clint R, the fake moderator DREMT, the Hunter boy, Anderson, Tim S and a few newcomers like MaxC sharing their nonsensical, antiscientific views.
False.
ark…”Climate science applies the principles of physics to the Earth system at scales directly relevant to human experience”.
***
Coulda fooled me. All I have seen as scientific evidence from climate alarmists is hearsay evidence from John Tyndall, circa 1850, and Arrhenius, circa 1895, that CO2 in the atmosphere ‘could’ warm the atmosphere. It can, of course, but the amount is trivial, like its mass percent, and largely irrelevant.
The rest of their theory is strictly pseudo-science with little or no resemblance to physics. In fact, much of it is based on unvalidated climate models programmed with the pseudo-science.
An example of the pseudo-science is the warming effect attributed to CO2 in the atmosphere…ranging from 9% to 25% depending on the amount of water vapour. That is a ridiculous claim since the Ideal Gas Law limits a trace gas in the atmosphere to its mass percent, roughly 0.06%.
Another example is a phantom positive feedback effect that allegedly has a cooler atmosphere transfer significant amounts of heat to the surface, contradicting the 2nd law of thermodynamics. There can be no positive feedback in the atmosphere since there is no amplifier, especially a heat amplifier to support the feedback.
Many alarmists claim the 2nd law represents a ‘net’ transfer of heat, which is even more absurd. Clausius, who invented the 2nd law was clear that the 2nd law referenced a one-way transfer of heat from a hotter body to a cooler body. Alarmists have tried to mix infrared energy with thermal energy to arrive at a quasi-net quantity. The only way heat can be summed to form a net heat is if two or more sources of heat are involved. One cannot mix radiation and heat since the energies have nothing in common.
The anthropogenic warming effect depends on that contradiction of the 2nd law. It claims that CO2 absorbs surface radiation then transfers it back to the surface to increase surface temperature. That not only contradicts the 2nd law, it represents perpetual motion. You cannot dissipate heat at a surface via radiation and return a small portion of the same radiation to the surface to increase the surface temperature. Even if it was possible, there are losses involved which cannot be made up by transferring a tiny amount of the original surface radiation back to it.
A corollary of that pseudo-science is that atmospheric CO2 slows the rate of heat dissipation at the surface. That is not possible since the heat dissipated at the surface by the original radiation is already lost. It makes no sense that intercepting a tiny amount of that radiation with CO2 can somehow affect the rate of the heat dissipation.
Alternately, Newton’s Law of Cooling applies here. The rate of heat dissipation is directly proportional to the difference in temperature between the atmosphere and the surface, therefore it is the entire atmosphere, which is 99% nitrogen and oxygen, that controls the rate of surface heat dissipation.
That seems contradictory since the atmosphere and surface should be in thermal equilibrium. However, air at the surface is warmed by it and rises, allowing cooler air from above to contact the surface. Hence the repetition of air being heated, rising, and being replaced by cooler air, allows direct conduction and subsequent convection to remove heat from the surface.
A close examination of the wannabee science of climate alarmists reveals they have no idea what they are talking about.
Well said Gordon, a quick wander through the climate history of the UK since Caesars first failed invasion shows no alarming or unusual changes to the climate, you need go no further back than 1911 and 1912 to see contrasts in weather patterns, 1911 was very dry and hot with many days over 32c 1912 was cool and wet.and low and behold history repeats itself in 2024 and,2025. albeit the other way round,2024 was cool and wet,2025 is warm and dry, in the South especially,now the weather has changed as the European monsoon kicks in.
Gordon writes 4:34 pm: “An example of the pseudo-science is the (atmosphere) warming effect attributed to CO2…”.
This is Gordon physically contradicting himself after writing: “(CO2) can, of course…warm the atmosphere.”
Another basic physics mistake continually written by Gordon that EMR is heat: “one-way transfer of heat from a hotter body to a cooler body.” Gordon, EMR is NOT heat.
For practice, I’ll let Ian Brown 8:17 am dig out the rest of Gordon’s undeniable physics mistakes instead of writing Gordon being “Well said…”.
Ball4 lies about what Gordon’s saying. Obviously, Gordon does not think EMR is heat:
“One cannot mix radiation and heat since the energies have nothing in common“.
Ball4 disgraces himself again; and his fellow team mates say nothing, like always.
Every once in a while, DREMT 2:26 pm does get something right credit that a more astute commenter will not mix EMR and heat. Then DREMT shows very limited ability in the blog’s relevant science by not knowing EMR energy & heat energy amounts are both measured in joules thus do have something in common.
I was quoting Gordon, Ball4. As indicated by the quotation marks.
He disgraces himself further.
Yes 5:57 pm, Gordon has disgraced himself further given DREMT’s quotes.
Ball4 disgraces himself even further.
Ha ha ha.
Old man raging at the clouds.
In no way is the future climate predictable
https://youtu.be/p37Htuk85qU?t=674
Ozone holes pretty big again this year, don’t expect any significant cooling until it recovers
https://tinyurl.com/559uc2jh
SOLAR MINIMUM UPDATE
On Monday, Mayor Patrick Collins of Cheyenne, Wyoming, announced plans for an AI data center that would consume more electricity than all homes in the state combined, according to The Associated Press. The facility, a joint venture between energy infrastructure company Tallgrass and AI data center developer Crusoe, would start at 1.8 gigawatts and scale up to 10 gigawatts of power use.
https://arstechnica.com/information-technology/2025/07/ai-in-wyoming-may-soon-use-more-electricity-than-states-human-residents/
Big win for uranium traders, even bigger win for Donald!
Except, AI is now regarded as a giant scam. It has provided no net benefits to those companies who invested heavily in it.
I am sure Trump will make money either way – he is a cunning devil.
pp…most people, I venture, have no idea what AI is. It is simply a computer program programmed by humans.
Computers cannot think for themselves per se, no matter what some people think. They are simply made up of silicon-based devices (semiconductors) and other assorted electronics, mainly resistors, set up with the ability to make logical decisions, do math, and following written instructions from humans.
When you ask a question of an AI system, it first has to parse the words and get meaning from them using basic logic circuits. I admit that AI systems have gotten pretty good with that and the speed impresses me. I recently submitted a question to Chatgpt asking if I could translate a chm file from one language to another. It not only confirmed I could, it explained in detail how to do it, and it returned that answer almost instantly.
When I asked a follow up question to clarify what the AI had claimed, it replied “Good question”. However, in the end, it suggested exactly the same method I had employed and found tedious and cumbersome.
A chm file is a compilation of different hypertext programs (.htm or .html) compiled into one document complete with pictures (jpegs) and gifs (automated jpegs) as well as a table of contents, TOC, which allows a person to search an index and jump to the subject selected. No matter how sophisticated, it does not confuse me since I am well-versed in how computers work, both in the hardware and soptware domain. Also, I am well-versed in reverse engineer executable files.
Computer hardware does not understand hypertext language, or the C++ language, Python, Unix, or even the Assembly language, the lowest level language available to most programmers. A computer understands only arrangements of 1s and 0s, represented by a voltage or a lack of a voltage. The voltages are fed to the computer processor as voltages in combinations called an ASCII code.
No one knows how the human brain works but we know the workings of a computer in and out, since we designed them.
Fr example, a capital A in ASCII is hexadecimal 0x41 which translated to binary 01000001. That code is sent down a computer data buss or address buss as +3 volts on the 2nd and 8th line with the other lines being 0 volts. The number 0 is represented by hex 0x30 which is binary 00110000. With 8 such bits of data 2^8 = 256 different combination can instruct the computer what the programmer is telling it in English.
An instruction in html can be phrased as &.#.9.7.8.6.; which represents the ☺, with the dots removed. If this does not translate, I inserted an & followed immediate by a # then immediately by 9786; The entire phrase is a unicode string where unicode is an extension of the ASCII table.
Therefore any AI produced by a computer depends entirely on the intelligence of the programmer who designed the algorithms by which the computer makes decisions. It is claimed that a computer can learn to make decisions on its own but I regard that as smoke and mirrors. Sure, you can apply input to a computer and it appears to be thinking, but in reality, it is simply regurgitating what it was told to do y its program in a very logical manner.
Logic is not intelligence, it is a human creation. Logic has meaning only to the human brain whereas intelligence is a fundamental phenomenon in the universe quite independent of the human mind.
It comes down to one’s definition of intelligence, a phenomenon no one understands, especially how the human brain deals with it. When I studied digital logic as part of my electronics training, we learned that the human brain has limitations when it comes to deciphering large scale logic systems. Therefore, order was brought to it using Karnaugh maps and other devices required to synthesis large digital logic systems and reduce them to more manageable forms.
Neural logic theory is now employed.
http://pc-petersen.eu/Neural_Network_Theory.pdf
In the end, it all comes down to humans theorizing about human neural networks based on the neuron, a basic electrical function of the brain. It is impressive how far they have come, however, no one really understands the meaning of intelligence or how the human brain engages it.
People seem to fear AI due to sci-fi notions of robots becoming monsters and taking over. I cannot begin to imagine computers reaching a stage where they can ultimately out-think humans. The computer has an advantage of making very fast decisions but the human has an advantage parallel thinking which is much slower but it can ultimately be far more profound.
“It is simply a computer program programmed by humans.”
C’mon, Gordo.
Lots of computer programs are not AI!
Heck, not every AI is an LLM!
BACK AT THE RANCH
The Department of Justice has removed a study showing that white supremacist and far-right violence “continues to outpace all other types of terrorism and domestic violent extremism” in the United States.
https://www.404media.co/doj-deletes-study-showing-domestic-terrorists-are-most-often-right-wing/
Winners win!
ball 4…”This is Gordon physically contradicting himself after writing: “(CO2) can, of course…warm the atmosphere.”
***
B4 is famous for cherry-picking what I say and misrepresenting it. An immature side to his somewhat thin personality.
I said…”…and Arrhenius, circa 1895, that CO2 in the atmosphere ‘could’ warm the atmosphere. It can, of course, but the amount is trivial, like its mass percent, and largely irrelevant”.
I have explained the trivial degree to which CO2 can warm the atmosphere and that is based on the Ideal Gas Law, which equates the amount of warming to the mass percent of CO2 in the atmosphere, 0.06% or 6/100ths of 1 percent. Since pressure is proportional to mass and temperature (at constant volume), it means the warming produced by CO2 cannot exceed 0.06C for every 1C warming of the entire atmosphere.
Of course, since nitrogen and oxygen have a combined mass percent of nearly 99%, they contribute 99% of the warming, most of it scavenged from the surface by direct conduction then convected throughout the atmosphere.
————
[B4]Another basic physics mistake continually written by Gordon that EMR is heat: “one-way transfer of heat from a hotter body to a cooler body.” Gordon, EMR is NOT heat.
***
B4 has his own unique method of trohling me by cherry-picking my words and misrepresenting them. As Dremt accurately reveals, I do not relate EM to heat since they are two different forms of energy. Heat can be converted to EM by means of the electromagnetic nature of electrons in atoms, and vice versa, however, neither form of energy have anything in common.
——-
“For practice, I’ll let Ian Brown 8:17 am dig out the rest of Gordon’s undeniable physics mistakes instead of writing Gordon being “Well said…””.
***
Ian Brown is a student of science who recognizes when something is well-said. I think Ian is Scottish, as am I, and great mind tend to think alike, while fools like B4 and his fellow alarmists seldom differ. A loose translation is…’intelligent individuals often come to the same conclusion, while foolish people tend to have similar misguided ideas’.
Gordon 5:29 pm, there is zero cherry picking in my comment as I just pointed to your exact words, and referenced, your entire comment.
The gas law does not account for the much higher emissivity of CO2 gas than N2,O2 gas through the optical depth of Earth’s sunlit atm. so Gordon is wrong to write “the warming produced by CO2 cannot exceed 0.06C for every 1C warming of the entire atmosphere.” Although nitrogen and oxygen are the numerically dominant atmospheric gases, N2,O2 are not radiatively dominant.
Gordon now agrees EMR is not heat once that is pointed out yet again.
It was cherry picking since you omitted the vital part in which I clarified CO2’s warming effect is insignificant. The emissivity of CO2 is thus irrelevant.
The reason is simple. CO2 absorbs a trivial amount of surface radiation, less than 10% of the total radiation, which, more than 90%, radiates directly to space.
Climate models use primarily radiation since they rely on the Navier-Stokes which describe fluid flow like radiation. Thus, climate models are seriously limited in scope, themselves making trivial projections. They pretty well ignore conduction/convection which account for most heat dissipation at the surface.
Climate modelers and alarmist theoreticians are desperate to prove their anachronistic, albeit incorrect theories, and have placed far too much emphasis on surface radiation, a minor player in heat dissipation at the surface. The conduction of heat directly to air molecules, which have 10^27 molecules per square metre to absorb heat directly, are 260 times more efficient at dissipating surface heat than radiation.
Couple that fact with the trivial amount of surface radiation absorbed by CO2 and one can easily see that CO2 plays virtually no role in warming the atmosphere. Besides that, it back-radiates only a fraction of what it receives from the surface and that radiation, being from a cooler source, cannot be absorbed by the surface as claimed by alarmists. There goes the GHE and AGW theories.
B4 has never, in my more than 10 years commenting on Roy’s site, supplied a scientific means explaining how a trace gas can warm the atmosphere trivially let alone catastrophically.
I have no idea why B4 continues to rave about EM not being heat, especially since I pointed that out to him years ago. I have B4 pegged as an angry old man who can offer no more than belly rumblings.
When Gordon 9:05 pm stops writing EMR is heat like this “one-way transfer of heat from a hotter body to a cooler body” then I can stop reminding Gordon EMR is NOT heat.
I pointed out Gordon contradicting Gordon claiming “CO2’s warming effect is insignificant” and that warming is also “An example of the pseudo-science is the warming effect attributed to CO2 in the atmosphere….” Gordon can’t keep his stories straight.
Also, as I already wrote, & Gordon can’t comprehend using only the gas law, “a scientific means explaining how a trace gas can warm” the near surface atm. in the presence of natural SW and LW light is: though nitrogen and oxygen are the numerically dominant atmospheric gases, N2,O2 are not radiatively dominant.
“When Gordon 9:05 pm stops writing EMR is heat like this “one-way transfer of heat from a hotter body to a cooler body” then I can stop reminding Gordon EMR is NOT heat.”
“Energy” is sent both ways between a hotter body and a cooler body, “heat” is only transferred one way. So, Gordon was not saying EMR is heat.
10:40 pm: “”heat” is only transferred one way.”
Now inexplicably we have DREMT writing EMR is heat!
DREMT, EMR is NOT heat!
Inexplicably, if you write, “heat is only transferred one way” (i.e from hot to cold), Ball4 falsely claims you are writing “EMR is heat”.
You could have been talking about conduction or convection, but still Ball4 somehow misinterprets your comment as involving EMR, ElectroMagnetic Radiation. Very odd.
Sure, could have been talking about conduction, and/or convection; the only misinterpretation is by DREMT due to DREMT’s very limited accomplishment in this field.
Proven liar and notorious climate troll Ball4 does his thing.
nearly right Gordon, born of a Scottish father, now i live only 30 miles south of the Scottish border.my climate interests began in the mid fifties, when i was given a book by the Prof Gordon Manley ,at school we learned how to build our own weather stations, my headmaster was an avid amateur meteorologist, so Edward Sabine replaced Dan Dare as reading matter.i was taught observation was everything,and no matter how constructive or compelling the theory may be, if it does not match the observations or the reality, then the theory is wrong.i find it strange that people can wander through life and never notice anything,i met a chap when out walking on the only day temperature made 32c this year,look at the grass on the road side he said its all scorched, its climate change,i have never seen that before,look at the fields i said ,they are all green and ready for another cut of hay, oh he said,i didnt notice,and he wandered off shaking his head.
clint…” That’s what gordon and ball4 do”.
***
It’s not nice to slam your buddy B4. He and I have nothing in common re our responses to you. He’s actually on your side.
I ask you scientific question as follows. When you claim heat is not energy but a mere transfer of energy, I ask you this simple question. What kind of energy is heat alleged to be transferring? There is only one energy that can e referenced and that is thermal energy, which we call heat. Therefore, according to you, heat is a transfer of heat.
Then you claim flux is not energy. According to Clint, flux is just something you talk about and it has no real meaning in physics. Clint claims flux cannot be conserved which is akin to claiming energy cannot be conserved since flux is a human representation of energy flow through an area.
Newton defined flux (fluxion) as the rate of change of something (a fluent), the time derivative, a rate of change of something. That something could be the rate of change of the position of a mass, but it would be hard to apply a flux field to such a linear motion of a mass.
However, if the flux field was a gravitational field, where a field of forces could act on any mass in its vicinity, that force field would fall under Newton’s definition of flux. Same applies to magnetic fields and electromagnetic fields. Thus, a flux field is most definitely related to energy.
Then there’s the Clintism that entropy is a measure of disorder, even though, as defined by Clausius, the units of entropy are joules/degree Kelvin. Here, the work equivalent of heat, the joule, is employed but heat is actually measured in calories. Therefore the units of entropy should be calories/degree Kelvin, as specified by Clausius in relation to heat.
Entropy is actually a measure of the transfer of heat, as defined by Clausius, who defined it as the infinitesimal transfer of heat at temperature, K. Overall, entropy is the heat lost in an irreversible transfer of heat which can no longer be used to do work. Since heat can only be transferred, by its own means, from hot to cold, entropy is always positive. It is zero for a reversible processes in which heat is not lost.
Clint cannot reply to any of this because he does not understand it. However, Clint is not alone here, there are many scientists who fail to grasp the meaning of entropy, a problem that could easily be solved by reading the works of Clausius.
It goes on and on. Clint tries to correct me on the direction of electrical current which must be negative to positive. However, Clint is a textbook junkie and he reads in those books that ‘conventional’ current flows positive to negative. That anachronism dates back to the 1700s when Benjamin Franklin defined it, some 200 years before the electron was discovered and the true direction of current flow was determined.
If you tune back in a few days from now, Clint will have responded with ad homs and insults, unable to explain his objections.
On the flux issue…
…by “flux” we’re actually referring to “irradiance” and “radiant exitance” measured in W/m^2, whereas “energy” is measured in Joules (J). The reason flux is not conserved can be illustrated through a simple example of a plate, in space, receiving 400 W/m^2 from the Sun on only one of its sides, whilst emitting from both of its sides.
With 400 W/m^2 in over one side, and 200 W/m^2 out from both sides, “flux in” and “flux out” (W/m^2) does not balance, but energy (J) balances. If the plate has a surface area of 1 m^2 for one face, then its total surface area is 2 m^2. With that in mind:
Input: 400 W/m^2 x 1 m^2 = 400 J received in one second.
Output: 200 W/m^2 x 2m^2 = 400 J emitted in one second.
With 400 W/m^2 in over one side, and 400 W/m^2 out from both sides, “flux in” and “flux out” (W/m^2) balances, but energy (J) does not balance:
Input: 400 W/m^2 x 1 m^2 = 400 J received in one second.
Output: 400 W/m^2 x 2 m^2 = 800 J emitted in one second.
Gordon 7:51 pm: “Entropy is actually a measure of the transfer of heat…”
No. Gordon is still confused since: EMR is NOT heat.
“With 400 W/m^2 in over one side, and 200 W/m^2 out from both sides, “flux in” and “flux out” (W/m^2) does not balance, but energy (J) balances.”
Nor has anyone claimed that it should balance.
To be explicit, what has been claimed about the Earth to be in equilibrium, is that the AVERAGE flux in, and AVERAGE flux out, balance.
As it does for the plate.
“Nor has anyone claimed that it should balance…”
…apart from Willard, Ball4, barry, and now Gordon.
Nate provides another example that he is unable to learn.
This has been discussed here for years, yet child Nate STILL doesn’t get it. Earth’s theoretical “flux-in” is 960 W/² but “flux-out” is 240 W/². Flux-in does NOT equal Flux-out.
That’s what a cult does to a person’s mind. It’s the same for all of them. Bindi keeps linking to measurements of Moon’s orbital period as “proof” that it is spinning!
They don’t understand science (or politics), and they can’t learn.
Is Clint stalking me? Weird.
“Earth’s theoretical “flux-in” is 960 W/² but “flux-out” is 240 W/². Flux-in does NOT equal Flux-out.”
As I noted, but Clint naturally missed, only the AVERAGE flux balances.
960 W/m^2 aint the average flux.
Wrong again, child Nate. Flux cannot be averaged like that. You could average energy, but not flux.
But, it gets worse for you. Earth’s energy-out does not equal energy-in. You’ve been misled. So even if you try to have an “energy budget”, you still lose!
If you know a responsible adult, get them to explain this to you:
https://www.drroyspencer.com/2025/08/uah-v6-1-global-temperature-update-for-july-2025-0-36-deg-c/#comment-1711069
And so, after much progress, Graham D. Warner is lying again.
Willard arguing “flux in” should balance “flux out” for the plate:
https://www.drroyspencer.com/2025/09/uah-v6-1-global-temperature-update-for-august-2025-0-39-deg-c/#comment-1714911
Ball4 doing the same:
https://www.drroyspencer.com/2025/09/uah-v6-1-global-temperature-update-for-august-2025-0-39-deg-c/#comment-1715274
and barry:
https://www.drroyspencer.com/2025/09/uah-v6-1-global-temperature-update-for-august-2025-0-39-deg-c/#comment-1714049
The internet never forgets!
DREMT disgraces himself even further.
“Flux cannot be averaged like that. You could average energy, but not flux.”
You are such an oddball. You can talk clearly and accurately about what Gordon gets wrong about physics, then you spew fake physics, like this, to the rest of us.
Why?
Of course you can average flux, and it is meaningful to do so.
In DREMTs example we have 400 W/m2 input on one side, 0 W/m2 on the other, for an average of 200 W/m2.
Which matches the output average flux.
“But, it gets worse for you. Earth’s energy-out does not equal energy-in. You’ve been misled. So even if you try to have an “energy budget”, you still lose!”
Nonsense. I’ll ask again for evidence, and again you will respond with no evidence, just insults.
Nate says:
”To be explicit, what has been claimed about the Earth to be in equilibrium, is that the AVERAGE flux in, and AVERAGE flux out, balance.”
Wrong! Nate desperately doesn’t want to lecture his own side and in the process simply muddies the water.
Flux and average flux emitted from an energy source is 400w/m2
Flux and average flux emitted from the uninsulated plate heated by the 400w/m2 flux is 200w/m2
Nate though wants to incorrectly modify the flux by the total square meters of surface area for plate bathing in the flux but in doing so he converted flux to energy when the plate is a blackbody.
Now flux can be averaged but only under certain circumstances, check Google AI, such as flux that varies in intensity like how solar flux varies due to convective and/or tidal currents on the surface of the sun.
Energy is conserved not flux.
I’ve explained this several times, child Nate.
I can explain it, but you can’t understand it. You children have no ability grasp any of this. Just look at your cult brother below trying to warm something with 0W/m².
Maybe when you grow up….
“check Google AI”
qltm
Naturally Bill tries to twist my post into utter nonsense.
“Flux and average flux emitted from an energy source is 400w/m2
Flux and average flux emitted from the uninsulated plate heated by the 400w/m2 flux is 200w/m2”
I said nothing about the energy source!
Quote what I actually said, then point out your issue with it. Otherwise buzz off.
Clint, as expected, hides in his turtle shell, while tossing insults, when challenged.
He offers no evidence to back his bizarre claims that the energy input does not balance energy output for the Earth.
Nate,
Google AI:
Search: in radiation what is an average flux
Answer: In radiation, an average flux refers to the average rate of energy transfer across a unit area, most commonly expressed in watts per square meter (W/m²). It quantifies how much power from radiation is flowing through that specific area per unit of time, providing a measure of radiation’s intensity and its capacity to heat or otherwise affect a surface.
Google AI:
Search: Average flux.
“Average flux” refers to the averaged value of a flux, which is a measurement of the rate of flow of a quantity (such as particles, heat, or energy) across a given area over a period of time.
Nate, it’s sweet that you want to defend your buddies, but you can’t save them with “average flux”. Without even going into the debate over whether or not you can average irradiance over surface area that is not receiving said irradiance (the “dark side” of the plate never receives anything from the Sun since the plate does not rotate, yet you want to average the irradiance over this side anyway), you are arguing for an average of 200 W/m^2 input matching 200 W/m^2 output. Yet, if you click on the links from my 10:29 PM comment, you will see all three of them arguing for 400 W/m^2 input and 400 W/m^2 output!
All three of them were definitely, and absolutely WRONG, Nate. You sat back and watched the entire thing, as they trolled along, knowing better but saying nothing, and now you want to come in and try to bail them out with “average flux”!
You realise that makes you worse than them, right?
It’s cute that Gill is appealing to one of DREMT’s “buddies”.
What a nice couple they do. Who’s Dumb and who’s Dumber?
My name got mentioned.
At equilibrium, an object’s average outgoing flux equals its incoming flux.
In the case of the plate, the object has one face receiving and two faces emitting ER, so when calculating the balance of flux you must account for area – you average over surface area.
400 W/m2 = 200 W/m2 X 2
Or, 400 W/m2 / 2 = 200 W/m2
In the second case we average the incoming ER over the entire surface, just as we do with a sphere for a global energy budget.
400 W/m2 X pi R squared = 100 W/m2 4pi R squared
Surface area is 4 times cross-sectional area. Math.
We do this because it is the simplest way to compare incoming with outgoing. Averaging is perfectly acceptable. If the averaged incoming and outgoing don’t match then there must be a temperature change.
Furthermore, we’ve all been averaging and dividing fluxes for years with the GPE and associated conversations – every single one of us – and we’ve never had a problem with it until someone decided it’s suddenly verboten.
So, Clint, DREMT, everything you ever said in the GPE arguments that relied on dividing and averaging flux you are now suddenly self-rejecting.
All because of a dumb brain-fart you’ve latched onto.
Hilariously, barry is not going to admit he made a mistake.
No matter, the linked comment shows he did.
He summed the emitted fluxes from the sides of an object, concluding that the plate emits 400 W/m^2!
So, a cube receiving 1200 W/m^2 on only one side, he apparently would believe emits 1200 W/m^2, and not 200 W/m^2!
So if one side of the cube was 1 m^2 in area, the cube would receive 1200 W, but emit 7,200 W!
barry’s credibility has gone bye-bye.
Does DREMT really read the comments to which he responds?
“Furthermore, we’ve all been averaging and dividing fluxes for years with the GPE and associated conversations…”
…wrong again, barry. There is no averaging of fluxes in the GPE. If you inexplicably chose to average the incoming flux to the Blue Plate over both sides of it, even though one side of the plate never receives any energy, then the averaged input flux to the Blue Plate would be 200 W/m^2. As you know full well, in all GPE discussions the input flux to the Blue Plate has always been 400 W/m^2. So, the flux is not averaged.
What will you get wrong next?
400/2 = 200
barry says:
At equilibrium, an object’s average outgoing flux equals its incoming flux.
In the case of the plate, the object has one face receiving and two faces emitting ER, so when calculating the balance of flux you must account for area – you average over surface area.
400 W/m2 = 200 W/m2 X 2
Or, 400 W/m2 / 2 = 200 W/m2
—————
DREMT already did this for you here: https://www.drroyspencer.com/2025/09/uah-v6-1-global-temperature-update-for-august-2025-0-39-deg-c/#comment-1715262
But this is an energy flow calculation not a flux calculation.
And energy flow is the total rate of energy transfer. Energy flux is the energy flow per ”unit area”.
if you modify the incoming flux by using a total area
you are no longer talking about energy flux. . .you are then talking total energy flow transfer.
A challenge for DREMT: translate Gill’s most recent comment into a coherent form. Bet he can’t. Unless he asks one of his “buddies” to help him out?
uwu
” whether or not you can average irradiance over surface area that is not receiving said irradiance (the “dark side” of the plate never receives anything from the Sun since the plate does not rotate, yet you want to average the irradiance over this side anyway)”
Yep. Pretty simple. To explain why average flux in and average flux out balance, as it does for the Earth (where flux =0 in some places and times).
Sheesh.
No comment from Nate on the failure of his three comrades.
Still no translation from DREMT.
“To explain why average flux in and average flux out balance, as it does for the Earth (where flux =0 in some places and times).”
Yes, your “explanation” involves doing something that makes no sense for the plate (averaging irradiance over surface area never receiving that irradiance), since the plate doesn’t rotate. For the Earth, it necessarily means that you are “time averaging” the irradiance as well as spatially averaging it. All of which leads to such a low figure for incoming flux that you get the false impression the Sun cannot possibly account for the temperatures we experience, on its own. Thus we supposedly need a “GHE”. Yet the example of the wooden sphere and the laser:
https://www.drroyspencer.com/2025/09/uah-v6-1-global-temperature-update-for-august-2025-0-39-deg-c/#comment-1713791
shows the fallacy of that thinking.
You sat back and watched the entire thing, as they trolled along, knowing better but saying nothing, and now you want to come in and try to bail them out with “average flux”
No, you are not able to see through my silence what Ive been doing. Weird that you think I waste time following all your endless discussions..
“Yes, your “explanation” involves doing something that makes no sense for the plate (averaging irradiance over surface area never receiving that irradiance), since the plate doesn’t rotate. ”
Endless made up absurd rules from you.
We look at fluxes for all surfaces and count input and output fluxes and average them. It makes perfect sense to do it the same for all bodies
Of course Nate would never speak out against people on his own “team”. He never has before, so why would he start now? He claims not to follow my discussions, but naturally just happens to pop up out of nowhere whenever something is mentioned that tickles his fancy.
Since irradiance is basically defined as the power of radiation per unit area on the surface it hits, obviously it makes no sense to average it over surface it isn’t hitting!
There’s no point trying to reason with them, though.
These two sentences are one after the other in this sub-thread:
[BARRY] All because of a dumb brain-fart you’ve latched onto.
[DREMT] Hilariously, barry is not going to admit he made a mistake.
Our silly sky dragon crank is not very good at this.
There’s no point trying to reason with them, though.
“Since irradiance is basically defined as the power of radiation per unit area on the surface it hits, obviously it makes no sense to average it over surface it isn’t hitting!”
Again, DREMT mansplains to scientists what he thinks they are doing wrong.
Which is anything they do that makes no sense to him.
Most science qualifies for that.
Oh well.
Nate condescends to someone who has demonstrated understanding in the subject under discussion as an excuse to dismiss the overall point being made without having to bother to come up with any actual rebuttal, whilst giving a free pass to his buddies who have all demonstrated they have little to no understanding.
Oh well.
DREMT spent more than five years ignoring that 400 plus 0 equals 200 plus 200. All the while he used all kinds of tricks to stick around.
One of them being that when a physicist takes him by the hand and leads him to water, he plays victim.
Pure gaslighting, most probably to entertain a fantasy in which he alone understands everything.
…and Nate, if you want to slyly appeal to your own authority as a “scientist”, then post under your full name. As it is, you frequently make these appeals whilst still hiding anonymously, trying to get the best of both worlds.
DREMT soldiers on, lying again about what Nate said.
I thought I made it perfectly clear already why the global average input flux = the global average flux out to keep the Earth in equlibrium.
And this is why Climate Scientists use this approach. It works. Because it works in general for any object in equilibrium.
Like the plate.
Yet somehow you keep absurdly doubling down on trying to ‘splain to scientists why they are wrong to use this, but FAILING EVERY TIME.
Nate just skips the “argument” phase altogether and simply declares himself the victor.
False.
Learn to let go of bad ideas like everybody else has to do.
Is it really “false”, Nate? Where’s your actual counter-argument?
Letting go of bad ideas…do you think the three amigos have finally let go of their idea that you can sum the emitted fluxes from the sides of an object? Or are they going to continue to be WRONG with absolutely no pushback from you whatsoever?
DREMT’s definition excludes the right part of the equation, which should then be called exitance:
https://en.wikipedia.org/wiki/Irradiance#/media/File:Photometry_radiometry_units.svg
As if by magic, it has the same units as irradiance.
To balance the exitance of an object with its irradiance, we need to equate in-and out-puts that object as a whole. It’d make little sense to omit one half of an object in the calculation, unless one is named Joe and is running a con based on that omission. That’d be taking the concept of “dark side” too far.
How one gets the identity between irradiance and exitance does not matter much: addition, subtraction, division, multiplication, etc. As long as we have the same object on both side of the equation, all should be well.
Every time a sky dragon crank tells you “there is 400 in, and 200 out”, they already averaged. They certainly did not measure it!
“Every time a sky dragon crank tells you “there is 400 in, and 200 out”, they already averaged…”
For the plate, irradiance of 200 W/m^2 and radiant exitance of 200 W/m^2 are the averaged values, and 400 W/m^2 irradiance and 200 W/m^2 radiant exitance are the “not averaged” values. So, you have everything backwards, as usual.
Let’s decompose what DREMT just said about radiant exitance:
(1) radiant exitance of 200 W/m^2 is an averaged value
but
(2) 200 W/m^2 radiant exitance is the “not averaged” value
That may not make total sense, but on average that should score for 50%. Still, less creative than Gill’s “flow is not flux”.
Astute readers will still recall the two facts that matter here:
(F1) the only energy in the system is the total solar irradiance, which is an average; and
(F2) the whole point of creating an energy balance of a system is to model that system, not half of it.
At least two of our cranks already accepted F1, which requires that we normalize the two surface on the two sides of the equation, be it by addition, multiplication or their inverses.
When will they accept F2, and how many times will DREMT say “W/m^2” while opiniating on when not to average?
Perhaps it will make more sense to you if Nate says it:
“In DREMTs example we have 400 W/m2 input on one side, 0 W/m2 on the other, for an average of 200 W/m2. Which matches the output average flux.”
See? The 200 W/m^2 irradiance and 200 W/m^2 radiant exitance are the averaged values. The key point being the averaged irradiance is different to the “not averaged” value of 400 W/m^2.
“Is it really “false”, Nate? Where’s your actual counter-argument?”
WTF are you talking about? How bout reading and responding to my post.
Which post in particular, Nate?
“obviously it makes no sense to average it over surface it isn’t hitting!”
It seems I have to explain exactly how math and physics is done.
You are implicitly using an equation that includes fluxes into and out of ALL surfaces.
If part of the surface has 0 flux in or out, than that is entered as a 0 in the equation.
That is how science does it for the Earth or any object.
Why is this difficult to understand?
Nate, irradiance is defined as the power of radiation per unit area on the surface it hits.
For the plate, you believe you can change that definition and include surface area “not hit”. You would be wrong about that.
For the Earth, the entire surface area has only been “hit” after it completes a full rotation, which means your averaging of the irradiance is, necessarily, “time averaging” as well as spatial averaging. Now, read this comment again:
https://www.drroyspencer.com/2025/09/uah-v6-1-global-temperature-update-for-august-2025-0-39-deg-c/#comment-1715629
DREMT’s sophistry is endless. Gets caught saying A and non-A. Acts as if nothing happened.
If he wants to play definition games, the energy balance of a system is a model of that system as a whole, not half of it. (Tho Joe *really* tried to sell a hemispherical model!)
The solution to his very deep enigma is quite simple: irradiance on the dark side of his beloved plate is 0 W/m². Thus we indeed get that, for the two sides S1 and S2 of his plate, 400W/m² on S1 and 0W/m² on S2 equals 200W/m² on both S1 and S2. In equals out. Everybody should be happy forever after. {^1}
In any event, the only time we can cancel the amount of meter squared, and abstract away the size of our object, is when we have the same sized object on each side.
So just as we said, DREMT forgot the dark side. Again. To consistently do so after five years is not forgetfulness anymore. Sometimes DREMT does “remember”. But then he gets an unbalance of Joules! {^2}
If his plate loses 400 Joules every second, it’d be interesting to know what its deficit amounts to since the time he introduced it in the thread. {^3}
{^1} Another reading of the thought experiment could lead to 400W/m² on both sides: just assume that, when a sky dragon crank tells you that an object receives 400W/m², it indeed receives 400W/m². That’s how we can nudge a chat bot, wink wink nudge nudge.
{^2} One could write “J/s” instead of “W”, which means he’s stuck with averaging the time dimension too!
{^3} Of course DREMT does not say his system loses energy every second. He’d rather throw his toys out of the pram instead, and refuse to put the input and the output in the same equation!
“Gets caught saying A and non-A. Acts as if nothing happened.”
Perhaps you are right to chastise Nate for his suggestion that the emitted 200 W/m^2 is “output average flux“. I shouldn’t have gone along with it. The emitted flux of 200 W/m^2 is not averaged, it’s just “what the plate emits”. I’m letting the sophists confuse the issue!
So, let’s clarify: only the irradiance of 200 W/m^2 is averaged.
And, it’s wrong to average the irradiance over both sides of the plate, since the plate does not rotate. One side of the plate is therefore never irradiated. The 200 W/m^2 figure, for irradiance, is wrong.
The plate receives 400 W/m^2, and emits 200 W/m^2. As explained here:
https://www.drroyspencer.com/2025/09/uah-v6-1-global-temperature-update-for-august-2025-0-39-deg-c/#comment-1715262
“power of radiation per unit area on the surface it hits.”
Yep, thus I put a 0 in for the irradiance when it is 0.
As you do.
So what exactly is your problem?
I’ve made my argument as clear as I possibly can, Nate.
As you still haven’t even attempted any substantive rebuttal, I guess that’s that.
So you cant really articulate what your problem is. Other than you cant be wrong.
“the averaged irradiance is different to the “not averaged” value of 400 W/m^2″
Why does DREMT still omit the 0 W/m² from the other side of his imaginary object? One does not simply balance the energy of a system by only accounting for half of it!
Besides, does he really think that the Earth receives exactly the same amount of Watts at all time on every single meter squared of its daylight hemisphere? That is, on every possible squared meter, however we decide to divide it!
Sure, Jan.
It’s as if our dragon cranks had no interest whatsoever in the topics on which they spent years of their lives:
http://ww2010.atmos.uiuc.edu/(Gh)/guides/mtr/opt/air/sun.rxml
So yeah, the “half” is an approximation.
But wait! There’s more:
https://www.timeanddate.com/astronomy/different-types-twilight.html
There are at least three different types of twilight!
And all this prevarication when the thread started by an admission that the Solar Constant was itself an average value!
DREMT’s “not averaged” is just preposterous.
Maybe you really don’t understand, maybe you’re just pretending…either way, I really don’t care. People reading along, if there are any, will get it I’m sure. That’s all that matters.
Perhaps DREMT has nothing else than gaslighting once sky dragon cranks talking points are being DESTROYED:
– “fluxes don’t add”
– “fluxes don’t divide”
– “fluxes don’t average”
– “fluxes may average, but but but”
– “only non-average fluxes”
All the other ones.
No wonder he relies on sophistry so much.
Poor Willard. He’s spent the last three years of his life confused about something as simple as the maths presented here:
https://www.drroyspencer.com/2025/09/uah-v6-1-global-temperature-update-for-august-2025-0-39-deg-c/#comment-1715262
So confused was he about the plate example that he kept arguing for the first half of the comments under this article that it received 400 W/m^2 and emitted 400 W/m^2!
https://www.drroyspencer.com/2025/09/uah-v6-1-global-temperature-update-for-august-2025-0-39-deg-c/#comment-1714911
Now he’s equally as adamant that it receives 200 W/m^2 and emits 200 W/m^2!
As for him moving past the plate example and trying to understand what’s happening with the Earth!? Forget about it. He doesn’t stand a chance.
So, he’ll keep bashing his straw men. After a while his incessant noise just sort of fades into the background.
DREMT linked to a (Very Scientific) comment in which he has 400 Joule/sec as input and 800 Joule/sec as output. Perhaps he missed why I asked earlier:
https://www.drroyspencer.com/2025/09/uah-v6-1-global-temperature-update-for-august-2025-0-39-deg-c/#comment-1715823
Our poor sod is still stuck with half an object on the left side, so of course he can’t balance things out!
Soon enough he’ll also forget that flux is short for energy flux, say that by saying that flux is *NOT* energy.
The dark side of the Dark Triad.
“…in which he has 400 Joule/sec as input and 800 Joule/sec as output…”
…in order to show that when flux balances for the plate, energy does not balance. You really didn’t get that? Lol.
Nate says:
”He offers no evidence to back his bizarre claims that the energy input does not balance energy output for the Earth.”
Seems to me what has been pointed out is that flux isn’t conserved.
Energy balance? Thank you for recognizing I was right and you are now using the correct language and not twisting up what flux is. If you personally weren’t doing that then thanks any way for helping straighten everybody who have it wrong out.
On the balance issue. Yes over time energy in has to equal energy out. But how many millennia might we be talking about? The comings and goings of ice sheets and the warming and cooling of the oceans both take very long periods of time. The instrument temperature record and the satellites that measure outgoing is a mere drop of water in a bucket full of water.
DREMT still doesn’t get that his reductios are based on a strawman, and Gill still insists that energy flux doesn’t contain energy.
As Puffman would say, hilarious.
Have they two amigos ever wondered what’s the unit of the solar constant, the only source of energy in the model they consistently try to misrepresent?
Let’s ask their best buddy:
“The unit of the solar constant is watts per square meter (W/m2).”
Astute readers know they should validate that information. They should also expect DREMT to return to his overinterpretation of “delivered to a surface” in 3, 2, 1,…
Bill, do you have time to babysit Willard? I’m starting to get bored of it.
If Gill could remind DREMT that he once again “forgot” half the plate with his “when flux balances for the plate”, that’d be great!
Sorry Willard, you can’t just change the definition of “irradiance” to suit your argument. Not even Nate the Physicist is allowed to do that.
Half the plate is not irradiated and is never irradiated because the plate does not rotate (on its own axis, I might add!). It’s not “forgotten about”, but the definition of “irradiance” does not permit it to be included in the calculations for irradiance!
That’s just how it works.
The reason flux is not conserved is because irradiance and radiant exitance can and usually do occur over differing amounts of surface area. Obviously if irradiance were defined such that you could include surface area not irradiated, then you could claim that the surface area irradiated was always the same as the surface area the radiant exitance leaves from (in any situation), and then flux would be a conserved quantity!
Enough people on your “team” have agreed that flux is not a conserved quantity and so you really have no choice but to accept that means irradiance is defined the way I’ve said. That means irradiance for the plate is 400 W/m^2 and can only be 400 W/m^2. If it could be 200 W/m^2 then why not just go the whole hog and say “flux is conserved”!?
You people keep trying to claim that you accept flux is not conserved and then do absolutely everything in your power to act like it is conserved!
[W, on September 22, 2025 at 8:30 AM] Astute readers…should also expect DREMT to return to his overinterpretation of “delivered to a surface” in 3, 2, 1,…
[DREMT, on September 22, 2025 at 5:16 PM] you can’t just change the definition of “irradiance” to suit your argument.
Astute readers may observe that no definition of irradiance has been changed. Reminding that there’s a 0 W/m² that is being elided is enough. By contrast, they could ask themselves how DREMT redefines the notion of system by modelling half a plate.
He also pushes the concept of object beyond reasonableness, but has DREMT ever been reasonable?
By definition, the irradiance for the plate can only be 400 W/m^2.
That concludes the rational debate. Endless nonsense from Willard will continue, but the rational debate is done and settled in my favour.
“That means irradiance for the plate is 400 W/m^2 and can only be 400 W/m^2. If it could be 200 W/m^2 then why not just go the whole hog and say “flux is conserved”!?”
Again, saying the irradiance for the plate is 400 W/m2 is insufficient information to find out the temperature of the plate.
We need to specify the irradiance on all surfaces of the plate.
It is 400 W/m2 on one side and 0 W/m2 on the other side averaging to 200 W/m2.
Therefore in equilibrium it must emit 200 W/m2 from all sides.
Now go ahead and assert that this is wrong somehow.
By definition, the irradiance for the plate is 400 W/m^2.
DREMT conflates stipulation with definition.
(Definition) Irradiance is the flux of radiant energy per unit area.
(Stipulation) Let a plate receive 400 w/m² on one side.
(Stupid trick) That stipulation does NOT contain an average!
(Another stupid trick) Plates only have ONE side!
As I said, endless nonsense from Willard will continue.
DREMT, who has been forgetting half of his pet plate for a week and who tried to hide behind a guest without understanding what that guest has been saying, opined on nonsense.
The law to which he just appealed expresses the relationship between an object’s temperature and the energy it radiates.
Not what it receives.
What it radiates.
It’s the exitance that matters.
That is what Puffman keeps “forgetting”.
Willard sure is slow to catch up to the rest of the class.
“(Definition) Irradiance is the flux of radiant [power] per unit area…”
…on the surface it hits. Not on the surface it doesn’t hit!
So, like I said: by definition, the irradiance for the plate is 400 W/m^2.
DREMT somehow “forgot” to say how he can “specify the radiant exitance (power per unit area) and then multiply it by the total surface area to get the total power radiated from the object”, as his best buddy said, without averaging…
And he also “forgot” to say that it’s Puffman who drags everyone down on this. He won’t say that, because he’s on the team of sky dragon cranks. And since there are only a few members, he can’t afford to lose more members. Even had to suck up to Bordo!
The online life of a dragon crank is one of frustration and solitude. In return, he gets to believe he’s superior to almost everyone in the world. So at least there’s great upside.
“DREMT somehow “forgot” to say how he can “specify the radiant exitance (power per unit area) and then multiply it by the total surface area to get the total power radiated from the object”, as his best buddy said, without averaging…“
Why would I need the total power (W) radiated from the object? It’s radiant exitance (W/m^2) that relates to temperature via the SB Law. And, why do you think multiplying radiant exitance (W/m^2) by the total surface area (m^2) to get the total power (W) radiated is averaging!?
Like I said – endless nonsense.
“DREMT conflates stipulation with definition.”
Yep.
“DREMT conflates stipulation with definition.”
Yep.
He is quite special.
False, Nate:
https://www.drroyspencer.com/2025/09/uah-v6-1-global-temperature-update-for-august-2025-0-39-deg-c/#comment-1716061
“on the surface it hits. Not on the surface it doesn’t hit!
So, like I said: by definition, the irradiance for the plate is 400 W/m^2.”
Insufficient. Not a ‘definition’.
What if the the other side was hit by 100 W/m2?
Then what, by definition, is ‘the irradiance for the plate’ ?
Nate, if both sides of the plate are irradiated then you’d be justified in coming up with some averaged irradiance for the plate. However, both sides of the plate are not irradiated.
Think of your “lamp pointed at the floor” example. Say a circle 5 m^2 in area was illuminated. You don’t include the surface area of the floor outside of that circle when working out the irradiance, do you!? Yet that’s precisely what you’re suggesting for the plate. It’s so ridiculous.
Endless silly made-up rules, fake definitions, to rationalize your absurd claims.
Science is quantitative, it is not just saying stuff.
The real problem here is that you get a completely wrong answer for the temperatures of the plates in the GPE.
If DREMT can’t concede that “let a plate receive 400 W/m²” is not a definition, astute readers might already worry that he’ll soon distort the concept of averaging too.
Perhaps DREMT could reassure them by reminding how he determine the temperature of an object of an indeterminate size…without averaging anything?
“both sides of the plate are not irradiated.”
No, DREMT 7:36 am is incorrect since in the GPE example both sides of the plate are irradiated, one side by solar, the other side by deep space (by 0 energy flow rate for simplicity) hence Eli 2017 correctly averages applying the factor of 2.
DREMT then gives a silly example different from the given 2017 GPE example. DREMT has simply been duped by Clint R.
Sorry guys, but by definition, the irradiance for the plate is 400 W/m^2.
One has to feel sorry about Sky Dragon cranks, for if it truly was a definition, the plate truly would receive 400 W on each squared meter of its surface, and so would emit a little more than 200 W/m².
… for the sun facing side, and 0 for simplicity on the space facing side.
We’ll add “irradiance” to the list of things Willard doesn’t understand.
By definition, an object that receives 400 W/m² receives 400 Watts on each of its squared meter.
At least on average.
Now, perhaps DREMT is confusing “object” and “side”…
Obviously Willard is well aware that when I say “by definition, the irradiance for the plate is 400 W/m^2”, the “definition” I am referring to is the definition of “irradiance” itself. I mean, I clarified that for him here:
https://www.drroyspencer.com/2025/09/uah-v6-1-global-temperature-update-for-august-2025-0-39-deg-c/#comment-1716061
He’s just trolling again.
Obviously DREMT is well aware that either radiant exitance is an averaged value or it’s not:
https://www.drroyspencer.com/2025/09/uah-v6-1-global-temperature-update-for-august-2025-0-39-deg-c/#comment-1715772
Why does he always try to get his cake and eat it too?
Nate was trying to sell the idea that “average flux in” = “average flux out”:
https://www.drroyspencer.com/2025/09/uah-v6-1-global-temperature-update-for-august-2025-0-39-deg-c/#comment-1715318
You said:
“Every time a sky dragon crank tells you “there is 400 in, and 200 out”, they already averaged. They certainly did not measure it!”
https://www.drroyspencer.com/2025/09/uah-v6-1-global-temperature-update-for-august-2025-0-39-deg-c/#comment-1715763
Which was funny, because the averaged value was 200 W/m^2 input, not 400 W/m^2 input…so you had it all backwards, as usual. In correcting you, I made a mistake myself, of listening too much to Nate, and ended up saying:
https://www.drroyspencer.com/2025/09/uah-v6-1-global-temperature-update-for-august-2025-0-39-deg-c/#comment-1715767
Which you then called me out on. But, you were right to criticise me, and thus also Nate – the radiant exitance for the perfectly conducting plate is not averaged. It’s just the calculated value for “what the plate emits”. It is not what Clint’s “averaging flux” complaint is about. For what the “averaging flux” complaint is about, see:
https://www.drroyspencer.com/2025/09/uah-v6-1-global-temperature-update-for-august-2025-0-39-deg-c/#comment-1716090
So, there you go. We all make mistakes, I’m certainly not immune to them.
“the radiant exitance for the perfectly conducting plate is not averaged. It’s just the calculated value for “what the plate emits”.”
Ugggh.
You just keep using special cases, over-generalizing them, to derive your made-up ‘rules’.
In general the radiant exitance varies over the object, and must be averaged to find the total energy output.
Nate, when it’s time to talk about cases where the radiant exitance “varies over the object”, then that will be discussed. In the case of the perfectly conducting plate, it won’t vary.
And, averaging away variations in radiant exitance of course takes you further from reality, not closer to it.
It’s even worse than that, Nate: not only is Graham D. Warner inventing rules, but he blames Eli for it!
Eli hasn’t said “there’s 0 W/m² on the dark side”, so he just cannot use his head and add it. He alone plays by what he calls “definitions”. He alone understands irradiance.
No wonder he still puts his pet buddy’s words in my mouth.
No matter how much you all gaslight me, the irradiance for the plate, by definition, is 400 W/m^2. Why can you people not just accept that flux is not conserved!? You say you accept it, you pay lip service to the idea, then you try to do everything in your power to subtly imply and insinuate the opposite, wherever you can!
The gaslighting continues:
[DREMT] The irradiance for the plate, by definition, is 400 W/m^2.
[ALSO DREMT] Averaging the two fluxes = 400 + 0 / 2 = 200 W/m^2.
And that’s notwithstanding when he derives a temperature directly from flux!
Willard dishonestly arranges quotes divorced from their full context to create the impression there is ambiguity on my stance on irradiance for the perfectly conducting plate. There is no ambiguity. The irradiance for the plate is 400 W/m^2, by definition.
The irradiance for the GPE blue plate is 400 W/m^2, by definition, and the BP has two sides as defined by Eli, so Eli averages as he shows in eqn. form. Such a simple example blown way out of proportion by DREMT.
“The irradiance for the GPE blue plate is 400 W/m^2, by definition“
You got that bit right. However, Eli does not average the irradiance.
“Nate, when it’s time to talk about cases where the radiant exitance “varies over the object”, then that will be discussed. In the case of the perfectly conducting plate, it won’t vary.”
Thanks for confirming that your way of talking about these quantities is not generally applicable or useful.
It is your usual Motte-Bailey fallacy, to talk out of one side of your mouth as if you are stating some general truth, but when called out on it, will only try to defend your claim for a special case.
Just as you did with defining orbits and spins. Your definitions only ever work for the special case of circular orbits with synchronous rotations.
When challenged to make these apply to orbits in general you always said ‘that will be discussed later’.
Of course, later never comes.
Because your child-like notions come from, and only ever apply to, the special cases.
Sorry, Nate, but your false accusations, insults and distractions aren’t going to make the irradiance for the plate any different to 400 W/m^2, by definition.
“aren’t going to make the irradiance for the plate any different to 400 W/m^2, by definition.”
Considering all surfaces, as we should, the averge irradiance for the plate is 200 W/m2.
And that tells the average emitted flux is 200 W/m2, if the surroundings are at 0 deg K.
But with GP in place behind it, the average irradiance for the plate is now greater 200 W/m2.
And therefore the plate must warm in order to emit the same average flux that it receives.
Oh well.
No, Nate. Obviously only the surface area that is irradiated is included in “irradiance”.
Asking Google:
“Does irradiance only apply to the surface area irradiated?“
Returns:
“Yes, irradiance is specifically defined as radiant power per unit area and therefore only applies to the surface area receiving the radiation.“
I mean…obviously. Why is this even being disputed?
Like I said: by definition, the irradiance for the plate is 400 W/m^2.
For the Earth, you can average the irradiance over the entire surface area only because it is rotating, and therefore you can argue that over time (at least 24 hours) the entire surface is irradiated. That means that the average irradiance of approx. 240 W/m^2 for the Earth is necessarily a spatial and temporal average.
It’s like pulling teeth.
Asking Google search line: Can a surface have zero irradiance?
AI Overview
“Yes, a surface can have zero irradiance if there is no incident electromagnetic radiation on it”
A limited ability in this field DREMT 4:12 pm fails yet again: the 2017 GPE blue plate side facing space has no incident EMR so zero irradiance (a simplification from that of space) and Eli did correctly use the factor of 2 (e.g. (400+0)/2) for averaging the 2-sided BP energy flux at equilibrium to compute energy flux in = energy flux out, conserved.
What will DREMT try next?
Exactly, Ball4. If a surface is not irradiated, it has zero irradiance. I have no idea why you think that contradicts what I’ve said. It confirms what I’ve said.
And no, Eli did not average irradiance over the whole Blue Plate in the GPE. If he had, the big red arrow from the Sun would be labelled “200 W/m^2” instead of “400 W/m^2”, and he would have had to include a note saying “the irradiance is averaged over both sides of the plate”. Then, every physicist who saw it would be forever scratching their head over why irradiance was averaged over a surface that never received that irradiance!
Sure, limited in physics ability, DREMT 6:38 pm has to admit to having “no idea”. I’ve already informed DREMT that Eli’s big red arrow is correct at 400 solar irradiance and 0 irradiance from space shown (for simplicity) in an eqn. to average the BP irradiance for energy flux in = energy flux out, conserved.
Ball4 twists and distorts everything, as usual. Your Google reference compliments mine, it doesn’t contradict it. There is no arrow shown labelled “0 W/m^2”. The big red arrow from the Sun is simply labelled “400 W/m^2”, not “200 W/m^2”, and there is no additional note to say the irradiance is averaged over both sides of the plate, puzzling physicists as to why irradiance would be averaged over surface area not receiving it. So no, Eli does not average irradiance over both sides of the plate.
DREMT’s skills in this field 12:01 am are simply not developed enough to realize I’ve already informed DREMT that Eli is averaging irradiance (400+0) over both sides of the blue plate with the 2 in his equation “factor of 2 for a two sided plate per m^2”
As explained, and not refuted, Eli does not average the irradiance over both sides of the Blue Plate.
Endlessly talking about a body as if it has only half of its actual surface will advance your argument nowhere.
Meanwhile, no actual rebuttal of the relevant issues is forthcoming.
https://www.drroyspencer.com/2025/09/uah-v6-1-global-temperature-update-for-august-2025-0-39-deg-c/#comment-1716478
Nate pretends his attempts to distract are “relevant issues”. The irradiance for the plate is 400 W/m^2, by definition.
“attempts to distract”
So the argument, in your view, is about how to properly say that one side of the BP has an input of 400 W/m^2, and the other side has 0 W/m^2?
Is that it?
Nate…the funny thing is, there are parts of the argument that are more “controversial” than others. You might liken these parts to the “bailey”. One such example was brought up on this very thread, here:
https://www.drroyspencer.com/2025/09/uah-v6-1-global-temperature-update-for-august-2025-0-39-deg-c/#comment-1715629
but, you basically ignored it, completely. Instead, you guys spend all of your time pushing back on the parts of the argument which are not at all controversial. The “motte”. You keep arguing against the idea that the irradiance for the plate is 400 W/m^2, by definition, for example. Yet, that should not even be in dispute. It’s not controversial at all that I’m correct on that. So…there’s no “motte and bailey” fallacy at all happening here. What there actually is, is you lot endlessly attacking me on “motte” points so that everyone forgets the “bailey” even exists. And, I think you all do it deliberately. It’s just endless distraction from the actual meat of the matter. You want to tie me up in disputing these trivial points indefinitely, or you want to divert the conversation onto things that have been discussed to death already.
And, it just never stops…
Still unclear how your preferred description of a plate with 400 W/m^2 hitting one side and 0 W/m^2 hitting the other side, advances your argument?
And as I recall the argument with me was about whether another of your claims,
“your “explanation” involves doing something that makes no sense for the plate (averaging irradiance over surface area never receiving that irradiance), since the plate doesn’t rotate.”
has any logic or evidence to back it up.
So nothing provided. And thus, this is simply another of your completely made-up non-existent rules.
Nate just keeps pushing back on those “motte” points, proving me right yet again.
IDK what you are linking me to? If it was the laser on wood, it was debunked as an irrelevant Motte.
You seem to have lost your way in your meandering argument to nowhere.
If you say so, Nate.
DREMT just can’t resist playing dumb:
What was Barry’s problem, again?
You don’t average irradiance over surface area not receiving the irradiance.
https://www.drroyspencer.com/2025/09/uah-v6-1-global-temperature-update-for-august-2025-0-39-deg-c/#comment-1715940
Read that comment and try to understand it, this time.
“You don’t average irradiance over surface area not receiving the irradiance.”
Again, you repeat your completely made-up (non) rule. Why?
This is FALSIFIED by the fact that scientists DO average irradiance over the whole surface of objects, to determine energy balance and required out-going average emission for the object, whether it is the Earth, a plate or whatever.
And you are implicitly doing so when you tell us that the emitted flux from the plate is 200 W/m^2.
Nate, the Earth does receive energy over all of its surface area, in time, because it rotates. The plate does not rotate. Nobody averages irradiance over surface area not receiving that irradiance. Think of the lamp example, again. Try to be reasonable, for a change.
DREMT still doesn’t realize Eli’s BP is irradiated on 2 of 2 sides.
If you say so, Ball4.
I seldom have time to read, much less answer, poor gordon. But, this time is just too tempting!
gordon used to claim he was an electrical engineer, but no one was buying that nonsense. He has no concept of the basics. He’s never studied thermodynamics and doesn’t even understand current flow!
Now he seems to believe radiative flux is energy and is conserved. He STILL doesn’t understand the thermodynamic definition of “heat”. When I explained it to him that “Heat” was the transfer of energy from “hot” to “cold”, he asked what “energy” was being transferred! Obviously not a question an EE would have to ask.
When I explained to him it was “thermal energy”, he just kept saying I never told him what kind of erergy was involved, yet he started using the phrase “thermal energy” in his rants.
An EE learns very soon that current direction is a chosen convention. Conventional current flows from + to – by “convention”. It is not a hard concept to understand, but poor gordon can’t get it. Outside a battery,the current flows + to -, but inside the battery the same current would appear to be flowing – to +. This would be WAY over gordon’t ability to understand.
Never having studied thermodynamics, gordon is also confused by “entropy”. When he first heard the word, he went to wikipedia and read about Boltzmann. He didn’t understand the concepts of “statistical thermodynamics”, so he assumed that Boltzmann was wrong because wikipedia mentioned that Boltzmann committed suicide. Boltzmann’s work is well established and used extensively in advanced communications such as satellites and cell phones. The concepts were further developed by Claude Shannon, who is associated with “Information Entropy”. Clausius was correct about entropy, coming from 2LoT, but his early work has been greatly expanded on.
Don’t expect gordon to learn any of this. He will just continue with clogging the blog with his perversions of science.
Nothing new….
Hey Puffman, riddle me this –
What’s the temperature of an object that receives 0 W/m2 on one side?
“wrong again, barry. There is no averaging of fluxes in the GPE”
Of course there is, DREMT.
Every single one of us agrees that for a two-sided blue plate to be in radiative balance with an incoming 400 w/m2, it must emit 200 W/m2 from, both sides.
If the blue plate emitted from each side what it received one one side (400 W/m2) it would not be in radiative balance, it would be out of equilibrium with incoming energy and would have to cool down.
Each and every one of us understood back then that 400 w/m2 was distributed over 2 X the area. To get the output we simply divided (averaged) the input over the emitting area.
bill,
“But this is an energy flow calculation not a flux calculation”
This discussion sprang from complaints about the energy budget of the Earth.
The ridiculous claim is that you “cannot average flux.” Of course you can, as long as you mind your units. We’ve been doing that here for years.
Have a metre squared cross-sectional pipe split into 2 metre squared pipes downstream. The 400 L/s incoming fluid is split into 200 L/s. A 4-split pipe changes the flow rate for each pipe into 100 L/s. You can keep changing the manifold, and to work out the flux for each pipe; all you have to do is sum the number of pipes and divide. That’s averaging from the incoming flux (400 L/s/m2). Why is this so difficult to grasp?
barry, there is no averaging in the GPE. As I explained, and you ignored, if the input flux was averaged over both sides of the Blue Plate, it would be 200 W/m^2.
You really don’t get what is meant by “averaged”. Now, keep on doubling down on your mistakes.
“To get the output we simply divided (averaged) the input over the emitting area.”
The input power (W) was divided over the emitting area, to get the emitted flux (W/m^2).
That ain’t “averaging flux”.
“Averaging flux” is taking different flux values (typically for an input), summing them, and then averaging them to get an averaged flux value (for the input, typically).
That’s what the complaint is with, in any case.
DREMT 12:49 am: “there is no averaging in the GPE.”
Ha, no, that is physically incorrect. There is energy flux averaging in Eli’s original GPE & properly handled in math by Eli. It is DREMT, being limited in science ability, that just really doesn’t get what is meant by “averaged” in terms of energy flux.
“Averaging flux” (DREMT term) is taking different energy flux values (typically for an input), summing them, and then averaging them to get an averaged energy flux value (for the input, typically) as Eli does in the 2-sided BP math which is ok physically because energy flow rate is an extensive property.
There really is no complaint with Eli’s physics and math, in any case.
Ball4 turns up to lie, distort, and encourage barry’s misunderstanding. Nothing new.
“The ridiculous claim is that you “cannot average flux.””
That’s not really my claim, personally. My interpretation of Clint’s point #2 from his eleven-point criticism of the Earth’s energy budget is that you can average flux, mathematically (of course), but the result is “physically meaningless”. And, by that, it’s meant that average fluxes, as Gadden so helpfully pointed out up-thread, whilst thinking he was rebutting my argument (!), do not abide by the Stefan-Boltzmann Law. Since the average fluxes don’t abide by a physical law, they’re “physically meaningless”.
I think a lot of the reason for the pushback is the terminology, so I suggested that you could say they’re an “arbitrary construct”, instead, if you found that less triggering.
Either way, you can apply the same argument to temperatures. Average temperatures also do not abide by the SB Law, and can certainly be considered to be an “arbitrary construct”, especially since temperature is an intensive property.
But, of course, average temperatures can be very useful, for tracking changes to the Earth’s climate, for example. Being “physically meaningless” and an “arbitrary construct” doesn’t make them “useless”. It all depends on your point of view.
DREMT,
A blackbody cube receives 600 W/m2 to one face.
In order to calculate what the cube radiates you sum the number of faces and divide the incoming flux by that number. That is the very definition of averaging. The cube radiates 100 W/m2 from each side. That is the area averaged flux.
All our examples tend to be geometrically symmetrical, perfectly conducting blackbodies, making the averaging simple. But the principle applies to any geometry. Transforming the area averaged flux over a sphere lit to one side is a matter of dividing by 4. That’s the geometric math.
If we irradiate a b/b plate with 2 suns, each yielding a different flux to the surface, we add both fluxes and then divide by 2 (sides) to get the emitted flux *. The outgoing flux will not in any way mimic the two different incoming fluxes, it will output the area averaged total of them both.
* Clint believes that a blackbody surface will absorb no radiation from the cooler of two arriving fluxes, as we’re aware. This is errant poppycock wth no basis anywhere.
“A blackbody cube receives 600 W/m2 to one face.
In order to calculate what the cube radiates you sum the number of faces and divide the incoming flux by that number. That is the very definition of averaging. The cube radiates 100 W/m2 from each side. That is the area averaged flux.”
barry’s sophistry is endless. Dividing 600 W/m^2 by the number of sides gives you the right number, sure, but it’s just a shortcut. What you’re really doing is, if one side of the cube is 1 m^2 in area, you are calculating that it receives 600 W/m^2 x 1 m^2 = 600 W. Then, assuming the cube will warm to emit that exact amount of power from its entire 6 m^2 surface area, you divide 600 W by 6 m^2 to get 100 W/m^2. Again, you are dividing power by area, not averaging flux.
DREMT,
“What you’re really doing is, if one side of the cube is 1 m^2 in area, you are calculating that it receives 600 W/m^2 x 1 m^2 = 600 W. Then, assuming the cube will warm to emit that exact amount of power from its entire 6 m^2 surface area, you divide 600 W by 6 m^2 to get 100 W/m^2. Again, you are dividing power by area, not averaging flux.”
A cube of any surface area will get the same result. In this symmetrical case you are dividing the flux value by 6, not the power value.
It is the same for a sphere of any size. You can convert the flux value without worrying about power. Just divide by 4 to get the area averaged flux. This will give you your outgoing area-averaged flux for a blackbody sphere. Regardless of size.
It gets more complicated with non-symmetrical structures but the principle is the same. And yes, it is an area-weighted average, but you can average fluxes as a way to compute the results. As I said, mind your units (like area) and no problem.
It is no one’s fault but Clint’s that he claimed you can’t average, sum or divide flux. Of course you can. Stop trying to defend a bald claim with useless nitpicks. There are all sorts of ways you can calculate flux and averaging is not forbidden, though it may not always be the right tool for the task.
“Again, you are dividing power by area, not averaging flux”
We are always dividing power by area (W/m2). The result is the averaged flux over the area.
You can do it for multiple incoming sources, too. The resulting output is a combination of the sum of those inputs divided over the emitting area. If the emitting area is symmetrical you don’t have to worry about power, just factor the number of sides, or curve.
Back to topic – a global energy budget. You can divide the incoming solar flux as it would strike a plane at the surface of a blackbody sphere, and divide by 4 to get the outgoing flux. You don’t need to calculate power.
And yes, the two values are different. Well done! But as we have said all along, when you account for area, the sum of the fluxes must equal zero if the system is at equilibrium. Flux is not conserved, but it must be balanced if there is no temperature change occurring, in order to satisfy the first law. IOW, total energy in must = total energy out. OF COURSE you need to mind your units and account for area, the connection between flux and power. No one is perplexed about that.
“A cube of any surface area will get the same result. In this symmetrical case you are dividing the flux value by 6, not the power value.”
Obviously, barry…but it’s still not averaging flux. Dividing the input flux value by 6, for the cube, to get the output flux value is just a shortcut. You don’t listen, do you?
““Averaging flux” is taking different flux values (typically for an input), summing them, and then averaging them to get an averaged flux value (for the input, typically).
That’s what the complaint is with, in any case.”
“It is the same for a sphere of any size. You can convert the flux value without worrying about power. Just divide by 4 to get the area averaged flux. This will give you your outgoing area-averaged flux for a blackbody sphere. Regardless of size.”
Again, that’s not averaging flux, but yes…I understand the principle, barry. So does Clint. That’s why he said:
“a hypothetical sphere receiving 960 W/m² would be emitting 240 W/m²”
It’s good to know that you agree with him.
Now, you won’t understand this, but if you took the incoming flux of 960 W/m^2, divided it by 4, and then declared that the incoming flux was 240 W/m^2…
…that would be averaging flux.
There should be no controversy here at all. We all, with the possible exception of Clint, agree that the energy in and energy out should balance for a body in equilibrium.
For the Earth, departure from that balance should result in warming or cooling.
It is convenient, to express that energy imbalance on a per square meter basis, which us a flux unit. Because that is how the energy inputs and outputs are measured.
Thus the so-called climate forcings, whether produced by the sun, the GHE, or albedo changes, are measured in W/m2, which are the whole Earth averages.
Everbody in this field understands that to find total energy flows we multiply these average fluxes by the total Earth surface area. This is simply arithmetic.
There is nothing wrong with this.
Anybody claiming there is a problem with needs to explain what their problem actually is.
This particular sub-thread is about, “is flux averaged in the GPE”?
Perhaps Nate would like to opine on whether or not flux is averaged in the Green Plate Effect?
A clue for Nate would be that in the Green Plate Effect, the Blue Plate has always been treated as receiving irradiance of 400 W/m^2. From his contributions up-thread, Nate should be well aware that if irradiance were averaged over the entire Blue Plate, Eli would have stipulated that his Blue Plate receives 200 W/m^2. Instead he stipulated that it receives 400 W/m^2.
Thus there is a very simple and clear answer to the question at the root of this sub-thread. The answer is “no”. That makes me correct, and barry incorrect.
Will Nate have the integrity to agree with this assessment?
DREMT really really really wants to know if what Nate says of energy balance models in general applies to the blue plate.
Hint: search for the word “body”.
Perhaps it’s just cognitive limitation.
DREMT continues to argue about nothing of consequence.
Find a real issue.
The incessant drone appears.
“This particular sub-thread is about, “is flux averaged in the GPE”?”
Weird that there is no mention of it in prior 2 posts, one being from you.
Well, if Nate thought barry was right, he would definitely have said so.
Thus his refusal to answer can be taken as an acknowledgement that I’m correct.
“is flux averaged in the GPE”?
Yes. As I’ve already informed DREMT.
DREMT 7:16 am just doesn’t understand Eli did average the BP input 400 over two sides writing in 2017 “factor of 2 for a two sided plate per m2” or per Eli:
(400W/m^2 + 0 W/m^2) /2 = sigma * Teq^4. Run the numbers Teq=244 K.
DREMT is just too unaccomplished in this field to ever understand what Eli actually tried to teach.
Sorry, Ball4, in the GPE diagrams there is a big red arrow from the Sun labelled “400 W/m^2”.
If the irradiance were averaged over both sides of the plate, the arrow would be labelled “200 W/m^2”.
“Dividing the input flux value by 6, for the cube, to get the output flux value is just a shortcut.”
Yes, it’s summing the area (6 equal sides) and using that as the divisor for the flux. This gives you the area-weighted flux for the whole area.
Let’s put this in the context we started – Clint claimed that you can’t average the incoming flux over the entire sphere – you can’t do an area weighted average.
But of course you can. And doing so will give you the correct answer for the emitted flux that establishes the equilibrium incoming/outgoing energy.
For simple and symmetrical geometries like our examples you don’t need to calculate power separately, you can integrate incoming flux over the entire area, lit and unlit. You can average the flux over a larger area.
“Dividing the input flux value by 6, for the cube, to get the output flux value is just a shortcut.”
Clint says you can’t divide flux, so maybe you can help him out with this?
Shortcut. Ok!
“Thus his refusal to answer can be taken as an acknowledgement that I’m correct.”
False. Obviously I think your endless complaints about average flux are not correct, as Ive pointed out.
If you thought I agree with you, you havent been paying attention.
DREMT *never* cites his pet thought experiment.
Here is the simplest form:
https://rabett.blogspot.com/2018/08/the-simplest-green-plate-effect.html
When they look at 2b, cranks whine that fluxes don’t add.
When they look at a/2, they whine that fluxes shouldn’t be averaged.
The most basic double bind.
So what’s DREMT temporary solution? To forget that plates have two sides!
Pure genius.
Those in the back might remember this month’s object lesson: flux never stands alone. It is energy flux. It needs to be applied to the system being modelled, not one-sided objects.
“Obviously I think your endless complaints about average flux are not correct, as Ive pointed out.”
Indeed, you have endlessly wrongly criticised my obviously correct argument about averaging flux, summarised here:
https://www.drroyspencer.com/2025/09/uah-v6-1-global-temperature-update-for-august-2025-0-39-deg-c/#comment-1715760
but that is not what I meant, was it, Nate? As you know, I was simply asking you if flux was averaged in the GPE. And, as you know, it isn’t. If it were, the irradiance to the Blue Plate would be 200 W/m^2, not 400 W/m^2. So, you agree I’m correct about that, is what I meant.
barry, you simply ignored what I said about the sphere. You just dodged it completely. This isn’t up for debate, I’m simply instructing you that what you think is “averaging flux” is not what the complaint is about. Telling me you accept the idea that dividing the incoming flux to the sphere by 4 gives you the output flux means you accept a sphere receiving 960 W/m^2 emits 240 W/m^2, which obviously is exactly what Clint has said many times before. So, clearly that is not what Clint means by either “flux cannot be averaged” or “flux cannot be divided”.
Whereas, if you took the incoming flux of 960 W/m^2, divided it by 4, and declared that the incoming flux was 240 W/m^2, then you would be averaging flux. Just like if you took the incoming flux to the Blue Plate of 400 W/m^2, divided it by 2, and declared that the incoming flux was 200 W/m^2, then you would be averaging flux.
You are making up silly conventions where none exist.
In this special case the irradiance is 400 W/m2 on one side and 0 on the other side.
It is not sufficient to simply say the irradiance on the object is 400 W/m2.
In the case of the Earth, the irradiance varies across the lit surface reaching a maximum of 960 W/m2.
It is not correct to say the irradiance on the Earth is 960 W/m2.
Is flux averaged in the GPE? Yes or no?
“If the irradiance were averaged over both sides of the plate, the arrow would be labelled “200 W/m^2″.”
No 6:55 am, the illumination is 400 on one side. And yes, the energy flux is averaged in the GPE given the blue plate is illuminated only on 1 of 2 sides as shown.
Listen and learn from Eli, DREMT 3:06 pm. There is no radiant energy over any frequency interval illuminating unit area in unit time on the BP side facing space in the given diagram. Eli has the BP illumination arrow drawn correctly & Eli correctly shows the 2-sided BP input energy flux averaging process as I already noted a couple times.
[DREMT] That’s not really my claim, personally.
[ALSO DREMT] You can attempt to use these “average flux” values in all sorts of ways…but, since they no longer relate correctly to temperature, when all flux values should relate to temperature via the SB Law, a law of physics…then they’re “physically meaningless”.
[AND ALSO DREMT] If you took the measured flux values, summed them, averaged them and then converted the average value to a temperature value, it would still be the “wrong temperature”.
From this we can infer three things:
First, DREMT’s denial is silly, as usual.
Second, the implicit argument is that only a “non-averaged” flux would “relate” to temperature, which is also silly.
Third, the only energy source in the systems under consideration so far is itself expressed as an average flux.
Nate, is flux averaged in the GPE? Yes or no?
When has DREMT “de-averaged” the energy flux his pet model received from the outside world?
How does DREMT get a better temperature estimate from his “de-averaged” energy flux?
Has DREMT missed Eli’s assumption of a “really large blue plate” because “if the plate is big enough the heat transfer from the edges can be neglected”?
So many questions, so little time.
Willard, you are only embarrassing yourself.
Nate, is flux averaged in the GPE? Yes or no?
DREMT is only trolling.
He never had any argument.
“Second, the implicit argument is that only a “non-averaged” flux would “relate” to temperature, which is also silly.”
That’s correct, not silly, and is confirmed by Gadden, up-thread – ironically, the guy who said you knew what you were talking about! Gadden confirmed that averaged flux values do not abide by the Stefan-Boltzmann Law, so do not relate correctly to temperature. Only the raw, “non-averaged” data do.
Further, I’m arguing that fluxes are not averaged in the GPE, and therefore the complaint about averaging fluxes does not affect the GPE. Rendering your questions absurd.
So yeah…you’re only embarrassing yourself.
Nate, is flux averaged in the GPE? Yes or no?
“That’s correct, not silly, and is confirmed by Gadden, up-thread”
That “that” mispresents what Gadden said:
[GADDEN] Obviously, if you want to know the temperature at, say Mt Rushmore on 25 July 2024 at 3:15 pm, the solar flux averaged over Earth’s surface and over, say, the 2010-2020 decade is pretty useless information, sure. So what?
That doesn’t imply that DREMT will be able to *estimate* the temperature at a specific point at a specific time (here Mt Rushmore on 25 July 2024 at 3:15 pm) without averaging. It just means you’ll need a more fine-grained estimator. An estimator which, to repeat, involves the Solar Constant, thus a yearly average.
It’s as if DREMT has never done any estimation in his life. (In fact, one might suspect that he has never measured anything, say to build something concrete.) Speaking of which, he completely forgets that the output depends on the input, and thus if there’s some uncertainty in the estimator, it comes from the input, averaged or not. I say “averaged or not” if it’s possible not to use averages to measure the input, something DREMT has yet to prove.
Gadden said:
“The mistake he is making is of course that he incorrectly assumes the Stefan Boltzmann [Law] applies to averages (“all flux values should relate to temperature via the SB Law”). It doesn’t.”
He thought he was “correcting” me, but he actually made my point for me. Thanks, Gadden.
Nate, is flux averaged in the GPE? Yes or no?
From DREMT’s buddy, again:
“The Stefan-Boltzmann law is a fundamental principle in physics that describes the relationship between an object’s temperature and the energy it radiates as thermal radiation. Essentially, it states that the total power radiated from a black body per unit surface area is directly proportional to the fourth power of its absolute temperature.
j∗=σT4
Where:
j∗ (or P/A) is the radiant exitance, which is the total energy radiated per unit surface area per unit time. This is also called radiant power.
σ (sigma) is the Stefan-Boltzmann constant. Its value is approximately 5.67×10⁻⁸ W⋅m−2⋅K−4.
T is the absolute temperature of the black body in kelvins (K).”
Perhaps he could estimate the temperature of a plate that receives 400 W/m² on one side and 0 W/m² on the other? After all, this figure is not averaged, and things that are not averaged etc.
244 K.
Nate, is flux averaged in the GPE? Yes or no?
Perhaps DREMT could tell us how an object that received 0W/m² on one of its side can haz 244 K?
Bonus points if he could detail his method without showing any averaging.
https://www.drroyspencer.com/2025/09/uah-v6-1-global-temperature-update-for-august-2025-0-39-deg-c/#comment-1715262
No averaging of fluxes there. The plate emits 200 W/m^2, which relates to a temperature of 244 K via the SB Law.
Nate, is flux averaged in the GPE? Yes or no?
DREMT gestures toward a previous demonstration that doesn’t tell us how an object that received 0W/m² on one of its side can haz 244 K.
To do that, he’d have to convert irradiance directly, without consideration for the area of the object. Which is what Puffman consistently does, and what Gadden was mocking.
The area of the object, not just half of it!
The reason it matters is quite simple: to discharge the m² in W/m², he has to have the same amount of m² on both sides of his equation. An equation that DREMT always falls short of writing, btw.
Easier to hide his trick that way.
When DREMT does as everybody does, his w² cancel out. When he does as sky dragon cranks do, they don’t, and then he complains.
Perhaps DREMT prefers to complain than to do as everybody does.
Willard…just so you’re aware…everybody, on both sides of this debate, agrees that a blackbody object emitting 200 W/m^2 would be at a temperature of 244 K.
But, by all means, keep making a fool of yourself.
Everybody is aware that DREMT returns to his motte when comes the time to defend his bailey.
Willard, Ball4 and barry getting caught going “full bailey”:
https://www.drroyspencer.com/2025/09/uah-v6-1-global-temperature-update-for-august-2025-0-39-deg-c/#comment-1715379
DREMT, caught asking for a “definition” that defeats his silly gotcha:
https://www.drroyspencer.com/2025/09/uah-v6-1-global-temperature-update-for-august-2025-0-39-deg-c/#comment-1716140
You are confused about that, too. Shame.
DREMT gaslights.
Poor Willard, always the victim.
That’s what you’d say to me, right?
DREMT is incorrect again.
It’s me, him, and his best buddy:
(W) A sphere receives 400 w/m^2, how much does it emit
(G) The information that a sphere receives 400 W/m2 does not directly determine how much it emits…Without knowing the sphere’s temperature (T) or its emissivity (ϵ), you cannot calculate the emitted power.
(W) The first part is correct, the second is not. Since we use emissions to determine temperature, what you’re saying is circular.
(G) The correct physical approach is to assume the sphere is in thermal equilibrium, which allows us to determine the equilibrium temperature and, therefore, the emission.
(W) The problem is indetermined because we do not know if what is meant is 400 W per m² of the sphere or the disk.
(G) You are correct to identify the ambiguity in how the irradiance (400 W/m2) is defined. This ambiguity is precisely what causes the two possible, and drastically different, answers.
(W) So someone could use this ambiguity to argue that a plate that receives 400/m² does not balance.
(G) You are absolutely right. The ambiguity in the initial problem statement is the perfect logical tool to demonstrate why the simple statement “fluxes don’t balance” appears to be true under one interpretation, but not the other.
(W) Thus if a model balances energy, the amount of Watt per meter squared must somehow balance, at least if the object doesn’t change in the process.
(G) Yes, that’s the fundamental principle. But you don’t understand anything. Only I understand everything. I am better than everyone here. Physicists are dumb asses, and Eli has never mentioned the Dark Side! Bow to my Sky Dragon superiority. Muahahahahahahah.
***
That last G may be Gemini. But not only.
Gemini has yet to solve Theaetetus’s problem.
Try to come to terms with the fact that flux is not conserved, Willard.
Perhaps I should add that DREMT always confuses the general and specific when it suits him:
In general, flux isn’t conserved. The Sun moves around the Earth, and it doesn’t shine over the Earth in a stricly unique fashion. Some approximation needs to be done. Which are symbolized by the constant harping about averages.
In the case of energy balance models (EBM), they must, for EBMs have one job, and it’s to balance the energy it has, which is expressed in terms of flux. In needs to equal out, and what’s in is the solar constant, which is a flux.
Nothing mystical or extraordinary hard to get there.
The zero-dimensional EBM over which DREMT pisses all over models the Earth as a single dot. Why would anyone believe it gives us anything we’d deem realistic? It’s just a one-line sanity check.
Five years over a one-liner. How many years will it take to discuss 1-D, 2-D models, up to general circulation models (GCM)?
For a guy who pretends being here for the science, he has absolutely nothing to show for it. You’re just insulted because nobody believes you know better.
At some point you need to let go of your wounded ego, Graham.
Willard tries to make it personal, as usual.
The science is clear:
https://www.drroyspencer.com/2025/09/uah-v6-1-global-temperature-update-for-august-2025-0-39-deg-c/#comment-1714790
The science is clear, energy flux is conserved when handled properly (unlike Clint R’s handling). However, the flux of bugs hitting your car’s windshield is not conserved. The mass of bug juice, however, would be conserved when handled properly.
The trolling is clear, from Ball4.
Wow.
The evidence is clear:
https://www.drroyspencer.com/2025/09/uah-v6-1-global-temperature-update-for-august-2025-0-39-deg-c/#comment-1716259
DREMT is projecting.
And now, from Willard.
And, as you know, it isn’t. If it were, the irradiance to the Blue Plate would be 200 W/m^2, not 400 W/m^2.”
You are an expert at taking a special case and making a hasty generalization of it, to suit your argument..
So I have lamp shining on the floor. The spot is brightest on the middle and weaker around the edges, with peak intensity of 100 W/m2.
What is its irradiance? Is it 100 W/m2?
Is flux averaged in the GPE? Yes or no?
Yes.
What is the irradiance on the floor? 100 W/m2?
This is another of your pointless semantic zombie arguments.
Meawhile you still get the wrong answer for the temperatures of the plates in this very simple problem.
Nate, is flux averaged in the GPE? Yes or no?
It’s clear that Nate knows the answer is “no”. He would have said “yes” by now, no problem, if that’s what he thought. So, barry and Ball4 are both WRONG, again.
The Blue Plate is a “perfect conductor”. Let’s assume for a moment that it was not, that it instead possessed some negligible value for thermal conductivity.
That would mean the side facing the Sun would warm to 290 K, thanks to the 400 W/m^2 irradiance, and would emit 400 W/m^2. The other side would be near enough 0 K (forget about CMBR, for simplicity), emitting 0 W/m^2.
Averaging the two fluxes = 400 + 0 / 2 = 200 W/m^2.
Averaging the two temperatures = 290 + 0 / 2 = 145 K.
There you have it. The average flux, 200 W/m^2, converted to temperature using the SB Law, is 244 K. Totally different to the actual average temperature for the plate, of 145 K. That is because the SB Law does not apply to such averages.
That is what Clint meant by “averaging flux”, and the problem with it. Note that the problem doesn’t apply to “perfectly conducting” objects. The Earth is most certainly not a “perfectly conducting” object.
“The average flux, 200 W/m^2, converted to temperature using the SB Law,”
DREMT here means the average exitance.
He still hasn’t said how he can convert irradiance directly into temperature!
Can anyone babysit Willard for me, please?
Because DREMT humorously errs again: “Averaging the two temperatures = (290 + 0 )/ 2 = 145 K”.
No. Can’t physically obtain the answer as shown. Both Clint R and here DREMT fail in physics since, yet again, temperature is an intensive property. Nothing physically wrong with averaging energy flow rate as Eli does since that is an extensive property.
“The other side would be near enough 0 K (forget about CMBR, for simplicity), emitting 0 W/m^2.”
No, that would mean the nighttime temperature for Earth is 0 K and it is not measured 0K. DREMT makes yet another physics mistake.
The problem lies with Clint’s abuse of physics not with averaging energy flow rate through a m^2 area.
“Can’t physically obtain the answer as shown”
Provide a different answer with a weighted average or withdraw your complaint.
“No, that would mean the nighttime temperature for Earth is 0 K”
No, Ball4, because the Earth rotates and has an atmosphere.
DREMT 10:30 am finally admits Earth’s atmosphere affects its nighttime temperatures. Nice progress. Still, the plate will not be near enough 0K on the side facing space.
No different answer with a weighted average was provided, so Ball4’s complaint is considered withdrawn.
“…finally admits Earth’s atmosphere affects its nighttime temperatures…”
Not in the way you’re probably thinking.
“Still, the plate will not be near enough 0K on the side facing space.“
It’s just a simplified example to make the point, Ball4. Try not to nitpick it to death.
“Try not to nitpick it to death.”
Says the guy who has nitpicked every word of every commenter for half a decade, and whose current campaign is to nitpick Eli’s wording, which he tries to pass as a “definition”, no less!
Just because he won’t concede that the SB law by definition involves exitance, and with it averaging.
And instead of admitting that his talking point leads to the silly idea that measuring temperature using the SB law is…bad, or whatever epithet he fancies: impossible, meaningless, inaccurate.
The only reason this went on for so long is that DREMT believes he’s better than everybody else here.
Oh dear, Willard is getting emotional.
Can anyone else babysit DREMT for me?
Willard, this “went on for so long” because you guys:
1) Won’t stop responding.
2) Won’t concede that you’re wrong.
3) Won’t stop misrepresenting and falsely accusing.
4) Won’t ever argue amongst yourselves.
5) Can’t keep on-topic.
6) Sometimes outright lie (Ball4, I’m looking at you).
7) Won’t answer questions.
8) Don’t understand what the argument even is, but are still adamant it’s wrong.
9) Can’t follow complex discussions.
10) Aren’t even interested in understanding.
It was just one small point out of eleven from Clint’s original post. It’s not even the biggest criticism in the list. It’s not even the biggest criticism of averaging flux, IMO! That would be this:
https://www.drroyspencer.com/2025/09/uah-v6-1-global-temperature-update-for-august-2025-0-39-deg-c/#comment-1713791
which is a separate argument, though related.
Anyway…surely we’ve exhausted this point by now. Right?
Anyone?
I’m sure he’ll quiet down after his nap.
Looks like it’s just you and me, Willard.
https://www.drroyspencer.com/2025/09/uah-v6-1-global-temperature-update-for-august-2025-0-39-deg-c/#comment-1716250
More “AI slop” from Willard, that I’m told he doesn’t rely on.
Proven liar lies again.
Wow.
If DREMT says so.
You said:
“Nobody here but DREMT and Gill prefers AI slop.“
DREMT confuses slop and art.
There are people specialized in teaching the social skills he sorely lacks.
Art? You don’t half talk some rubbish, Willard.
Turning crank abuse into art is not easy.
By chance DREMT is there to help.
Calling me a “crank” is indeed abuse, Willard. Is that what you’re talking about?
What is a ‘crank’ on the internet anyway, Google/AI?
“An internet crank is a person who promotes eccentric, unfounded, or bizarre ideas and beliefs online, often with strong conviction and persistence. The term combines the meaning of “crank”—an odd, overzealous person who holds unusual views or supports bizarre causes—with the internet as their platform. These individuals frequently present their ideas as suppressed revolutionary insights, similar to historical figures like Galileo, and may attribute opposition to conspiracy theories involving powerful groups. ”
Seems appropriate.
A couple of days later, hoping he won’t be noticed, Nate drops in for a drive-by insult.
Another DREMT classic:
(First bind) Never stops responding
(Second bind) A couple of days later, hoping he won’t be noticed,
Never really happy.
Now the other troll returns…
BACK AT THE RANCH
Here’s Eric saying “they” at least 10 times in under 30 seconds
https://bsky.app/profile/atrupar.com/post/3lyym3dw4wk26
Make pronouns great again!
An interesting statistics…
https://cdn.bsky.app/img/feed_thumbnail/plain/did:plc:hwq2pjtxty5ceus4qmn22rw6/bafkreicmfb6teeldcswm5bnrxfr6jo7ucamgfonwumcg75knh5o75czgpu@jpeg
The National Academies for Science, Engineering and Mathematics (NASEM) review report has been published.
From the summary:
The complete report is located here: https://nap.nationalacademies.org/read/29239/chapter/1
They keep blowing smoke and you keep sucking it up, Ark.
They see increasing CO2 and they see a warming trend so they believe CO2 is causing the warming trend.
WRONG! Beliefs ain’t science.
They MUST show how CO2 can warm Earth’s surface. And they can’t do that. CO2’s 15μ photons can NOT warm a 288K surface.
If we are increasing the greenhouse effect, and i mean if, then for once we must be doing something right, with the optimum C02 level for flora at just over 1000ppm the planet came dangerously close to an extinction event,some need to learn, not to look a gift horse in the mouth.
Hey Puffman, riddle me this –
Just in case you don’t recall, that was asked of you in 2016:
https://web.archive.org/web/20160807095837/http://www.drroyspencer.com/2016/07/the-warm-earth-greenhouse-effect-or-atmospheric-pressure/#comment-218090
For some reason you failed to provide a complete answer.
CO2’s added 15μ photons can NOT warm a 288K surface is wrong by 1LOT, 2LOT, and easily replicable experiment. There is no hope for Clint R 7:56 am to be correct
I didn’t start commenting here until about 2021. But, I can answer the questions.
“Net flux” has no meaning unless you’re considering the arithmetic difference. So, in a perfect situation, the arithmetic difference would be:
1) one at 300 K and the other at 300 K?
0 W/m²
2) one at 300 K, the other at 290 K?
2.3 W/m²
3) one at 300 K, the other at 200 K?
26 W/m²
I really only answered here because the history was interesting. Ball4 and Folkerts were just as ridiculous as they are today! And one of the commenters seemed confused by “internal energy” vs. “kinetic energy”. I’ve addressed that before also. You can increase the “internal energy” of a system without increasing the temperature. But if you increase the “kinetic energy” of a system, the temperature will increase.
“You can increase the “internal energy” of a system without increasing the temperature. But if you increase the “kinetic energy” of a system, the temperature will increase.”
No Clint 12:30 pm. I just ran that experiment with my IR thermometer reading 32F brightness T on an ordinary glass of ice water. I dropped in another ice cube same as the ones already in there. Both total KE of the constituents and internal energy obviously went up but the brightness temperature still read 32F.
And Clint R was commenting under another name prior 2021 before that name got kicked off the blog for being silly all the time.
Sorry batty4, but temperature is based on AVERAGE kinetic energy. To increase temperature you must raise the AVERAGE kinetic energy.
The fact that I have to explain the basics to you indicates you don’t have a clue. And the fact that I have to repeatedly explain the basics indicates you can’t learn.
That’s why I usually ignore your childish antics.
“I didn’t start commenting here until about 2021.”
I believe you mean “at least since 2015”, Puffman.
Riddle me this – was it February?
“Ice cubes” started to appear a bit after that, ut supra.
4:40 pm: “To increase temperature you must raise the AVERAGE kinetic energy.”
Clint R quickly backtracks when called out; very humorous.
Not understanding “temperature” is one of the many problems in “climate science”.
Start here:
Hey Puffman, why not start here instead:
https://web.archive.org/web/20160417084358/http://www.drroyspencer.com/2015/12/paris-pow-wow-heap-good/#comment-204677
Riddle me this – who do you think you’re kidding when you say you started to comment here in 2021?
7:27 am: “If ice is added to the water, its temperature drops.”
Not always, as I already pointed out, when ice is already in the glass of water the mercury thermometer kinetic temperature remains 32F so no kinetic temperature drop, same as the brightness temperature remains the same in my experiment when similar ice was added described in the comment to which Clint R responded.
The average kinetic energy of the added ice molecules could be less than the average kinetic energy of the water molecules initially, so the average kinetic energy of the mixture could initially decrease and the mercury thermometer read lower temperatures. As equilibrium returns, the brightness temperature again increases to read 32F steady state as in my experiment.
As applied to climate science, the exact frequency of absorbed photons is immaterial (since matter radiates at all frequencies) so any absorbed photons in water add thermodynamic internal energy without adding mass thus would raise the average kinetic energy of the water molecules meaning CO2’s added 15μ photons (and all other frequencies, the exact frequency being immaterial) can warm a 288K surface as proven by increased temperature consistent with 1LOT and 2LOT shown by a kinetic thermometer in Dr. Spencer’s experiments with ice cubes and 1 atm. water in Alabama. Those experiments show the added “cool object” radiation (from ice cubes including 15μ photons) made the “warm object” (water) warmer still. Thus, added radiation from ice cubes can boil water as proven by experiment.
It’s simple then, Clint R has written yet again some experimentally proven wrong statements. Just basic physics.
The cult kids are out in pairs proving me right today.
Willard thinks I’m 3-4 different people!
And batty4 is still claiming ice cubes can boil water.
I never get tired of being right.
Puffman imagines that hiding under various sock puppets doesn’t make his inimitable style shines through:
https://web.archive.org/web/20150507012707/http://www.drroyspencer.com/2015/05/uah-v6-0-global-temperature-update-for-april-2015-0-07-deg-c
Riddle me this – how long are you gonna deny this?
Willard, are you still stalking me? You’re making me feel like a celebrity.
Yeah, there are other people that understand the basic physics.
You should try it….
Hey Puffman, riddle me this –
https://web.archive.org/web/20150529083441/http://www.drroyspencer.com/2015/05/trmm-satellite-coming-home-next-month/#comment-192233
isn’t it funny that after all these years are stuck with the same silly talking points?
Okay Willard, let’s teach you some physics:
A perfectly conducting sphere is in deep space. The sphere has an emissivity of 1. Four radiative sources are equally spaced around the sphere’s equator, so that each “side” of the sphere receives 500 W/m² at its “disk”.
Part 1a: What is the steady-state temperature of the sphere?
Part 1b: Two more sources are added, above and below the sphere, so that the poles also receive 500 W/m² at their “disks”. What is the steady-state temperature of the sphere with all 6 sources?
Funny that you mention a “sphere has an emissivity of 1”, Puffman:
<blockquote
But already I'm shaking my head. A blackbody by definition absorbs all radiation incident upon it, and yet you claim most of it would be reflected in some cases. Can you source that claim? I can’t find it in any of my texts.
https://web.archive.org/web/20150529083441/http://www.drroyspencer.com/2015/05/trmm-satellite-coming-home-next-month/#comment-192335
Emphasis not mine.
Did you think we did not know that Barry wasn’t the first to ask you for that citation?
Don’t miss an opportunity to learn, Willard.
https://www.drroyspencer.com/2025/09/uah-v6-1-global-temperature-update-for-august-2025-0-39-deg-c/#comment-1715717
To don’t have to be uneducated forever.
You know I love to learn, Puffman:
https://web.archive.org/web/20150529083441/http://www.drroyspencer.com/2015/05/trmm-satellite-coming-home-next-month/#comment-192279
Do you?
Willard, don’t run from education. Give it a try:
https://www.drroyspencer.com/2025/09/uah-v6-1-global-temperature-update-for-august-2025-0-39-deg-c/#comment-1715717
Only losers fear reality.
The sad reality is that you were here in 2015, Puffman, commenting with a sock that got banned. There’s even a thread just for you. Wanna see it?
And since you confuse riddling with teaching once again:
https://web.archive.org/web/20150529083441/http://www.drroyspencer.com/2015/05/trmm-satellite-coming-home-next-month/#comment-192206
Your sidekick might take note, for his imaginary point.
Willard, you seem to be avoiding the problem.
https://www.drroyspencer.com/2025/09/uah-v6-1-global-temperature-update-for-august-2025-0-39-deg-c/#comment-1715717
Don’t you want to learn?
Your avoidance is not your sole problem, Puffman –
https://web.archive.org/web/20150529083441/http://www.drroyspencer.com/2015/05/trmm-satellite-coming-home-next-month/#comment-192259
Ten years over the word “net” is rather poetic, don’t you think?
Well, I think I’ve mede the point — Willard has no interest in learning.
He refused to answer the simple problem:
https://www.drroyspencer.com/2025/09/uah-v6-1-global-temperature-update-for-august-2025-0-39-deg-c/#comment-1715717
In typical cult-child fashion, he just keeps throwing nonsense against the wall.
it’s no wonder he’s so uneducated.
I think I have clearly established that Puffman has been pushing the same sky dragon crap for a decade under various sock puppets.
The same voice. The same tropes. The same antisocial traits.
Just take a look:
https://web.archive.org/web/20151214101227/http://www.drroyspencer.com/2015/12/uah-v6-global-temperature-update-for-november-2015-0-33-deg-c/#comment-203416
It takes quite a crank to presume that the greenhouse effect implies the ocean will reach a boiling point!
Willard keeps finding people that get the physics right, but he can’t understand any of it. No surprise there.
So, for responsible adults, here are the solutions to the problems:
Solution to Part 1a: 306K
Discussion: Consider each source can be switched on/off. With only one source on, the sphere would be emitting 125 W/m². With two sources, 250 W/m². With three sources, 375 W/m² With all four sources, the sphere would be emitting 500 W/m² And that flux corresponds to a surface temperature of 306K (S/B Law).
Solution to Part 1b: 306K
Discussion: Any other 500 W/m² arriving would be met by 500 W/m² being emitted. The additional 500 W/m² would have no effect, as a GREATER flux is needed to reduce entropy. That’s why you can’t boil water with ice cubes.
Puffman keeps talking of himself as if he was “other people”. Curt and Dave get their physics right. Puffman and his silly ice cubes? Not so much.
Willard has no knowledge of the relevant science, so he resorts to false accusations. The cult kids are soooo predictable.
The funny thing is Willard doesn’t understand the ramifications of the solutions above. The solution to Part 1b completely debunks the CO2 nonsense.
What will the child try next?
Puffman isn’t even man enough to admit that he has returned to Roy’s under a variety of socks.
And DREMT cautions that kind of behavior.
Funny, I might have known I’d somehow be dragged into the discussion.
Willard, you can’t contribute anything scientifically, so you just present endless ad hominem (and disturbing amounts of stalking).
Please stop trolling (and stalking).
Is there something that prevents Graham D. Warner from recognizing that Puffman has been around for a longer time than he asserts?
One more for the road:
https://web.archive.org/web/20170105023619/http://www.drroyspencer.com/2016/08/suggested-backyard-experiment-to-measure-the-greenhouse-effect-of-more-carbon-dioxide/#comment-220288
Hilarious indeed.
Willard, please stop trolling (and stalking).
Yeah DREMT, I usually ignore kids like Willard and batty4, but I thought this would be a good chance to show them up, again.
Willard dodged the simple physics problem, repeatedly. And batty4 is still claiming ice can boil water!
Their cult “science” is collapsing on their heads, hence their desperation.
Graham D. Warner is letting Puffman off the hook while returning to his old ways.
Such a reasonable chap.
OK, Willard.
Humorously, Clint R 7:45 am still doesn’t understand experimental results show a cool object can make a warmer object warmer still as guaranteed by 2LOT. Ice cubes can boil water.
11:54 am: 306K is wrong per 2LOT since no entropy is produced in the calculated process, so no hope for Clint R to be correct; Clint missed the mark yet again for part 1a entered verbatim into google search:
AI Overview
“The steady-state temperature of the perfectly conducting sphere is approximately 337 K (or 64°C). This is calculated by balancing the incoming solar radiation with the emitted thermal radiation, using the sphere’s large surface area and its emissivity of 1 to determine the temperature needed for radiative equilibrium.”
What silliness will Clint R try next?
“Ice cubes can boil water…”
…and still his comrades say nothing.
“This is calculated by balancing the incoming solar radiation with the emitted thermal radiation”
Astute readers may notice that DREMT “forgot” to comment on that bit.
No need to, it is already well understood by all commenters.
Most commenters understand that “balancing” involves an operation that DREMT pretends he can bypass.
Speaking of balancing…
https://www.drroyspencer.com/2025/09/uah-v6-1-global-temperature-update-for-august-2025-0-39-deg-c/#comment-1715379
Being a good Sky Dragon crank teammate is a balancing act:
https://www.drroyspencer.com/2025/09/uah-v6-1-global-temperature-update-for-august-2025-0-39-deg-c/#comment-1715855
If you say so, Willard.
BACK AT THE RANCH
Senate Republicans are growing increasingly exasperated over Donald’s refusal to give them permission to move tough bipartisan sanctions legislation against Russia and countries that buy its oil.
https://thehill.com/homenews/senate/5504778-trump-russia-sanctions-gop-frustration/
What a bunch of non-winners!
When is Trump going to strong-arm US companies in Russia that subsidise the regime with their taxes? For the majority non-essential items and services supplied in Russia by these companies, isn’t it hypocritical to allow them to do business with Russia while demanding other, foreign companies stop buying Russian energy?
Sheesh Barry shooting oneself in the foot doesn’t accomplish anything wrt Russia.
Don’t you understand that buying Russian EXPORTS gives Russia money to continue this war. . .but a US company like Pepsico doesn’t contribute to their war economy.
Pulling out and abandoning assets doesn’t stop the Russian consumer from enjoying a drink with a Pepsico label as the Russian government could auction all the assets off to a Russian oligarch to run the operations and still use the Pepsico trademarks.
If US companies are asked to leave Russia the effect on the Russian government is likely nil or positive. The assets, marketshare, and the value of key Russian employees would be lost forever to the US company.
Russia is already banning the export of profits to unfriendly nations which includes us. The next step up by Russia could be to seize all the assets of these companies.
That might happen if the Russian government elects to burn more bridges.
From Gill’s best buddy:
“American companies contribute to Russia’s war on Ukraine primarily by continuing to operate within the country and, as a result, paying taxes to the Russian government.”
What would an accountant know about paying taxes anyway?
It’s nearly a billion dollars worth of taxes annually paid to the Russian government by US companies in Russia, bill. And this is for non-essential, non-humanitarian items, like tobacco and cola.
So when is Trump going to pull those US companies out of Russia that are helping fund Russia’s war effort with their taxes? Surely failing to do so while demanding foreign companies to stop buying Russian energy is hypocritical?
barry says:
”It’s nearly a billion dollars worth of taxes annually paid to the Russian government by US companies in Russia, bill. And this is for non-essential, non-humanitarian items, like tobacco and cola.”
Barry stop being a bone head. Do you actually believe that if American companies pull out the Russian citizenry will stop drinking marketed canned and bottled drinks and quit smoking?
Obviously the tax money will continue to flow. And even if it didn’t Putin could raise taxes anyway. That money is under their control and comes from the pockets of Russian citizens. Sheesh!
Gill doesn’t believe that ZZs can’t produce cigarettes or sodas.
Let’s ask his best buddy:
Traditional Russian sodas often feature unique flavors and are sometimes based on fermented ingredients. Here are some notable brands and types:
Kvass (Квас): This is a traditional fermented beverage made from rye bread. It has a slightly sour and sweet taste and a very low alcohol content (usually less than 1.5%). Brands like Ochakovsky are well-known.
Chernogolovka (Черноголовка): This is a prominent brand that produces a variety of sodas. Their most famous flavors include:
Baikal (Байкал): A dark-colored, herbal soda developed as a Soviet alternative to Coca-Cola. It contains natural extracts like black tea, Siberian ginseng, and eucalyptus oil.
Duchess (Дюшес): A sparkling drink with a distinct pear flavor.
Tarragon (Тархун): A bright green soda with a licorice-like taste from the tarragon herb.
Buratino (Буратино): A classic, sweet lemonade with a caramel flavor.
Mors (Морс): A traditional non-carbonated drink made from diluted berry juice, typically cranberries or lingonberries.
Russian Brands of Cigarettes
The Russian cigarette market has a mix of historical, local brands and international brands that are manufactured or sold within the country.
Yava (Ява): One of the oldest and most well-known Russian cigarette brands, dating back to 1912. It was one of the first domestic brands to produce filter cigarettes to international standards.
Belomorkanal (Беломорканал): A famous brand of papirosa (a type of cigarette with a cardboard mouthpiece). It is known for its strong, unfiltered taste and historical significance.
Prima (Прима): Another popular and historic Russian cigarette brand.
Kazbek (Казбек): A Soviet-era brand of cigarettes.
Willard, so you mean Russians get that huge list of your alternatives free so no profits are made when they are sold?
Gill should leave playing dumb to the crank dedicated to it.
Willard says:
”Gill should leave playing dumb to the crank dedicated to it.”
No worries Willard. I was just imitating you while hooking my thumbs into my armpits and flapping my elbows.
(Barry) When is Donald going to strong-arm US companies in Russia that subsidise the regime with their taxes?
(Gill, an old accountant) Don’t you understand that buying Russian EXPORTS gives Russia money to continue this war. . .but a US company like Pepsico doesn’t contribute to their war economy.
(Me, a peasant, citing Gill’s best buddy) “American companies contribute to Russia’s war on Ukraine primarily by continuing to operate within the country and, as a result, paying taxes to the Russian government.”
(Gill) Do you actually believe that if American companies pull out the Russian citizenry will stop drinking marketed canned and bottled drinks and quit smoking?
(Me, a peasant, citing Gill’s best buddy again) Gill doesn’t believe that ZZs can’t produce cigarettes or sodas. Let’s ask his best buddy: […]
A work of art and a thing of beauty.
(Gill) So you mean Russians get that huge list of your alternatives free so no profits are made when they are sold?
“Do you actually believe that if American companies pull out the Russian citizenry will stop drinking marketed canned and bottled drinks and quit smoking?”
Way to miss the point, bill.
Trump hinges Ukraine policy on a demand that foreign companies stop adding to Russia’s coffers, yet American companies are still pouring money into Russia’s coffers.
Willard and Barry:
You two don’t understand economics, or climate change for that matter.
Consumer goods are commodities that are paid out of disposable income. If a company pulls out another moves into their building and continues productions.
And even if the customers stopped drinking Pepsi and smoking cigarettes, its disposable income and they will spend it on something else.
An example of what happens is Coca Cola pulled out. Now the best-selling cola in Russia is Dobry Cola, a product of the Coca-Cola HBC subsidiary Multon Partners after the parent company suspended operations in Russia in 2022 due to the geopolitical crisis. Multon Partners is a Dutch operation.
This is basic economics guys you should try to take an entry level course that covers commodities, disposable income, and the law of supply and demand. And you should find yourself some reliable sources to read before posting so as to avoid uneducated layperson errors.
From Gill’s best buddy:
“from a business and economic perspective, consumer goods and commodities are distinct categories with key differences.
Commodities are raw materials or primary agricultural products. They are:
Standardized and interchangeable: One unit of a commodity is essentially the same as another, regardless of who produced it. For example, a bushel of wheat from one farm is the same as a bushel from another. This is known as being “fungible.”
Minimally processed: They are traded in their basic, raw form.
Traded on exchanges: Their prices are determined by global supply and demand on commodity exchanges (e.g., the price of crude oil, gold, or corn).”
Looks like Gill’s best buddy knows a thing about economics that Gill doesn’t know?
Willard looking up the internet dictionary definition of a commodity and repeating it verbatim hardly amounts to an economic understanding of a commodity and what consumer goods will perform like a commodity and in which cases.
I gave you the real world example of Coca Cola pouring out, I am sure not because they wanted to deprive Russia of tax dollars as if it did to any extent it be a very small percentage.
Coke most likely pulled out because they couldn’t get their money out so they didn’t want to continue to contribute money in managing the business without any return.
Pepsi probably stayed in because it looked like an opportunity to win new marketshare that was Coke’s. But what appears to have happened primarily is the Coke label that was the only thing Coke took with them didn’t stop the replacement cola with a new name taking the vast majority of Coke’s sales.
The economics lesson is in the fact that there is not much at all that isn’t completely replaceable in soda drinks with the manufacturing plant, operations, and distribution network left behind when Coke left. What wasn’t soaked up by continuing operations (i.e. the loss of the Coke label)_ hasn’t stopped the new brandname for the same product to continue to dominate the market and pay taxes that Coke is no longer paying.
If those taxes were slightly less then maybe Pepsi did win a bit of marketshare and they are paying the taxes.
And if Pepsi left they to will be leaving behind the bottling plant, operations, and distribution network, and the vast majority of employees to pay taxes.
Further, soda pops, and tobacco products themselve have as materials almost 100% commodities. So materials are covered as well as employees.
Thats the lesson and you missed it entirely and bit down on your daddy’s made up silly reason for these types of operations should cease.
Gill is now hurting is best buddy.
Perhaps he can get what Barry’s saying if we let his best buddy formulate it:
“The argument that this situation is hypocritical is based on the principle of consistency. Proponents of this view argue that it is contradictory for the United States to:
Demand that other nations make major economic sacrifices by cutting off their energy trade with Russia, which often has a significant negative impact on their economies.
Allow its own companies to continue paying taxes and providing services within Russia, thereby providing a separate, steady stream of revenue to the Russian government.
This perspective views the continued presence of American companies in Russia as undermining the very sanctions and economic pressure the U.S. has encouraged others to implement.”
Will he be able to get it now that it’s is best buddy that words it?
LOL!
Willard says:
Gill is now hurting is best buddy.
Perhaps he can get what Barry’s saying if we let his best buddy formulate it:
“This perspective views the continued presence of American companies in Russia as undermining the very sanctions and economic pressure the U.S. has encouraged others to implement.”
I have no idea who you are talking about Willard. And I don’t, like you, formulate my arguments to conform with anybody’s else’s opinions.
This is not anything like boycotting Russian products.
It doesn’t matter who agrees or disagrees. Facts don’t care about your feelings.
Gill has no idea for sure.
His point only imports matter has nothing to do with Barry’s.
By his logic, the nonsense he spouts to support our other cranks is morally sound because if he didn’t, another crank would fill his void.
Bill, by your “best buddy” Willard is referring to Google AI/Gemini. He likes to slam anyone not on his own “team” for using it, whilst giving a free pass to “team-mates”, and himself, to use it (of course).
Global
https://climatedatablog.wordpress.com/wp-content/uploads/2025/09/uah-global.jpeg
Tropics
https://climatedatablog.wordpress.com/2025/09/18/uah-mean-and-median-global-for-aug-2025-2/
As expected:
https://www.drroyspencer.com/2025/08/uah-v6-1-global-temperature-update-for-july-2025-0-36-deg-c/#comment-1711316
dremt…”On the flux issue…
…by “flux” we’re actually referring to “irradiance” and “radiant exitance” measured in W/m^2, whereas “energy” is measured in Joules (J).”
***
Dremt…don’t take this is a shot at your comment, I am simply trying to clarify what is meant by flux and what is meant by energy. I am trying to clarify as much for myself as anyone else.
Energy is a phenomenon that has no explanation because no one knows what it is. It is described loosely as the capacity to do work, which tells us nothing. Hence, we have devised different terminology to define what we mean by ‘the capacity to do work’.
If the work involves only atoms and their motion, either externally or internally, via electron transitions, we call that thermal energy. If a mass is driven by a force, we call that mechanical energy. If a process involves the disruption of the order in atoms, or the decay of one atom into another, we call that nuclear energy. If the processes involved are related to the internal chemistry of a substance, we call that chemical energy. If the work is done via a force and mass acting in a gravitational field, we call that gravitational energy, and so on.
Oh, I forgot, electrical energy, which flows negative to positive. That’s because electrical current is defined as the number of negative charges passing a point in a second (coulombs). However, negative charges are attached to masses called electrons and we have no idea how they operate. All we know is that electrons must move negative to positive and every EE textbook admits that even though they stubbornly stick to conventional current flow, defined by Franklin in the 1700s, about 200 years before the electron was discovered.
Flux has nothing to do with any of that, it was simply introduced by Newton to keep tract of change. Flux is a measure of rate of change and is now called the derivative of a function. in calculus If the measure is related to energy change, especially over an area, we call the flux a measure of energy change and the word flux has been myopically reserved for fields with area rather the instantaneous rate of change of a function as intended by Newton.
There is really no such thing as flux in and flux out unless we are talking about ‘something’ changing and in this case we are talking about energy changing its rate over an area. Therefore, the term needs to be energy in versus energy out. However, that lacks clarity, therefore we should state what kind of energy is entering and which kind is leaving.
We are obviously talking about electromagnetic energy entering and leaving and we are measuring the intensity using flux, which is stated as w/m^2, as you claim. However, the watt was defined in terms of mechanical horsepower as an electrical equivalent of mechanical energy. In the same manner, heat has been defined as the equivalent of mechanical energy, in joules. Today, electric motors can be specified in both watts and horsepower. I have asked several times how we can apply the watt to EM which has no mass and no forces acting on it.
You claimed that energy is measured in joules and I have nothing to say about that, however, you failed to mention the dimension. If a force is acting on a mass along the x-axis in one dimension, we could definitely measure the energy in joules, but what happens when we go to 2D or 3D?. Also, you failed to mention the type of energy.
A force can act on a mass at a point, propelling it along the x-axis. That cannot be said for an energy like EM, which cannot act on a point but must act over an area. Double integrals are used for a 2D area and triple integrals for a 3D area. For a line motion only the single integral is used.
I am merely trying to point out, on the basis of precision, that we must specify what is meant by flux and what is meant by energy. Clint has it all bundled up in a quaint, albeit incorrect vision and becomes angry when challenged rather than rebutting with a concise scientific argument.
In the event that I come across otherwise, I never presume that I know what I am talking about. I have learned painfully over the years that ideas (knowledge) I held dear in electronics could fall completely apart. I may sound like a know-it-all, but that’s just an act. It’s more a device to challenge.
It would be nice if Clint joined in, but one must not hold one’s breath for fear of turning blue and expiring. In fact, it would be nice if we could all try discussing things scientifically rather than taking cheap shots. Then again, we don’t want to become too boring and predictable. One must maintain a sense of humour.
Don’t worry, Gordon, I haven’t taken your comment the wrong way. I think it’s a shame you and Clint have fallen out. Clearly you’re a deep thinker, which is generally a good thing, however in this case I think you may have over-thought the problem! Flux is not conserved simply because it can be received and emitted over differing amounts of surface area.
SOLAR MINIMUM UPDATE
Sources tell me that Morocco is quite hot.
Thats a surprise.
It actually is!
Here’s what my source says:
“Unprecedented heat for this time of the year and next days can be even hotter.
Record heat also in MOROCCO
MINIMUM 30.6 Semara”
It also says:
“Extraordinary hot day in #Spain
40.7 El Granado,dozens of stations >35C allover the country including the highlands.”
https://bsky.app/profile/extremetemps.bsky.social/post/3lz2g73vqd22k
Thank you for your incredulity, Ian!
The place shown by bsky.app with the highest temperature (~ 40 C) is Badajoz in the Spanish Extremadura, known ‘since evah’ to show high temperatures in late summers.
I have no access in GHCN daily for Spanish station temperatures more recent than August 2025.
Nevertheless, a descending sort of September days for the station
SP000004452 38.8831 -6.8292 185.0 BADAJOZ/TALAVERA LA REAL
shows this
SP000004452 ___BADAJOZ/TALAVERA_LA_REAL___ 2016 9 6 43.7 (C)
SP000004452 ___BADAJOZ/TALAVERA_LA_REAL___ 1988 9 7 43.0
SP000004452 ___BADAJOZ/TALAVERA_LA_REAL___ 2016 9 5 42.4
SP000004452 ___BADAJOZ/TALAVERA_LA_REAL___ 1988 9 8 42.0
SP000004452 ___BADAJOZ/TALAVERA_LA_REAL___ 1988 9 6 42.0
SP000004452 ___BADAJOZ/TALAVERA_LA_REAL___ 2006 9 4 40.9
SP000004452 ___BADAJOZ/TALAVERA_LA_REAL___ 1988 9 9 40.8
SP000004452 ___BADAJOZ/TALAVERA_LA_REAL___ 2018 9 1 40.4
SP000004452 ___BADAJOZ/TALAVERA_LA_REAL___ 2006 9 3 40.2
SP000004452 ___BADAJOZ/TALAVERA_LA_REAL___ 1966 9 9 40.2
Thus… 40 C there are quite hot indeed but not quite unusual.
The reality of weather,
As US reliability falters, Saudi Arabia turns to a nuclear-armed ally
Trump statecraft asleep at the wheel. THIS IS MORE IMPORTANT THAN JIMMY KIMMEL.
On Wednesday, Saudi Arabia and Pakistan signed a “comprehensive defensive agreement” which includes defense industry collaboration, technology transfer, military co-production, and training.
The timing of this deal comes conspicuously close to the unprecedented Israeli attack on our security ally Qatar, which Trump failed to prevent.
It was only four months ago that “Qatar received Trump’s assurance that the U.S. would protect it if it ever came under attack.”
Since when did The USA have a self given right to decide what other countries do or do not do.nothing lasts forever, the USA had already began to withdraw back into it self ,long before Trump became a political figure, the British learned a long time ago that there is no point staying where you are not wanted, maybe its time our stupid western governments learned that sanctions do not work,never have, India and Russia two huge failures, a new world order has arisen along with Indonesia, the Philippines and Taiwan all on the verge of joining BRICS,
Another non sequitur reply duly noted.
clint ruminates…”A bucket of water has a temperature. Humans invented a way to measure that temperature. A simple mercury thermometer is placed in the water. The molecules in the water have kinetic energy — they are moving. As the molecules strike the glass tube of the thermometer, their kinetic energy gets transferred to the glass and then to the mercury. If the water is hot, the water molecules cause the mercury molecules to become more active, causing the mercury to expand, causing its level in the tube to rise”.
***
No Clint, water has heat (energy) and humans invented temperature to measure relative levels of heat. Before Celsius (1742) and Fahrenheit (1724) came along, there was no way to quantify the heat level in water other than to stick a finger in it and decide whether one lot of water was hotter, or colder, than another.
Note that temperature had already been defined some 100 years before Maxwell and Boltzmann tried to obfuscate temperature as the average kinetic energy of atoms/molecules. They did not use real atoms/molecules but fabrications of the human mind applied statistically to imaginary atoms. That had a lot to do with the fact that no one understood atomic structure at the time.
Kinetic energy has no meaning other than to describe atoms/molecules in motion. Therefore, defining temperature as average kinetic energy is a stab in the dark that means nothing. Clausius had already defined internal energy as the internal heat plus the internal work related to vibrating atoms. His definition was the basis of internal energy in the 1st law but he was talked into using the word energy rather than the sum of internal heat and work.
As far as your energy transfer example is concerned, it is closer to reality but like most modern weenies you have a fetish that is anti-heat. For one, heat has already been defined as internal kinetic energy. For another, you do what you can to dismiss heat as a valid form of energy and the reasoning appears to be based on a warped persnicketyness rather than logic and science. It is clear that you trip all over yourself to avoid admitting that heat is energy.
I repeat, kinetic energy means nothing in that it does not specify the energy involved, only that it is in motion. KE applies to any energy, so ask Clint again, what kind of KE is warming the fluid in the thermometer? What energy is in motion, is it mechanical, gravitational, electrical, chemical…or is it thermal energy, aka heat?
According to you, when the Sun warms you on a hot summer day, it is kinetic energy you feel but not the heat produced by your body as it converts
gordon is one sick puppy.
My guess is he once suffered a serious head injury….
Gordon 8:40 pm asks: “What energy is in motion…”
Mass in motion has KE. Atoms possess mass and atoms are in motion so possess KE. Gordon should know total thermodynamic internal (i.e. thermal) energy is Clausius’ U and average thermodynamic internal energy at the measurement is temperature but Gordon has yet to learn such.
Evidently Gordon has also yet to learn light possesses momentum (both linear and angular) but evidently not mass (as has been measured so far). Momentum is a property all to itself.
Ball4, is there something that prevents you from pushing the correct reply button?
BACK AT THE RANCH
GOP Senator Cynthia Lummis: “Under normal times, in normal circumstances, I tend to think that the First Amendment should always be sort of the ultimate right… I don’t feel that way anymore.”
https://www.semafor.com/article/09/18/2025/kimmels-suspension-prompts-free-speech-republicans-to-reconsider-their-boundaries
This might explain why thugs tear-gassed someone running for Congress, tried to run over her with a van, shot her with pepper balls, and dragged her on the ground.
Every troglodyte who applauds this has absolutely no pearl to clutch when the F-word is being thrown in their direction.
Bunch of thugs:
https://bsky.app/profile/jennbudd.bsky.social/post/3lzbvekcakk24
For posterity.
One day they’ll get their comeuppance.
ball 4…”Gordon 8:40 pm asks: “What energy is in motion…”
Mass in motion has KE. Atoms possess mass and atoms are in motion so possess KE. Gordon should know total thermodynamic internal (i.e. thermal) energy is Clausius’ U and average thermodynamic internal energy at the measurement is temperature but Gordon has yet to learn such”.
***
Gordon was asking ‘what energy is in motion’ wrt the type of KE specified. When KE is specified, one must know the type of energy to which KE refers. In the case described above, in a solid, KE is a reference to the internal atomic vibrations of the atoms. The question is, what causes the vibration?
When Boltzmann and Maxwell referred to KE in reference to atoms in motion in a gas, they were talking about thermal energy, aka heat, which is the energy related to such atomic motions/vibrations. In a gas, the KE references the actual velocity of each atoms as a tiny mass. The overall effect of the atomic velocities is a rise in temperature, however, temperature is a human invention to measure the heat content of the atoms.
There is no such reality/phenomenon as temperature, it is an idea/ measuring device created by humans. Heat is the reality, the energy, and temperature was invented to measure relative levels of heat, aka thermal energy.
They got the idea from Clausius, who started the investigation into internal energy and the KE of atoms. However, they (Max and Boltz) were dealing in a mental world where atoms in gases were visualized as statistical points, not real atoms, and they apparently became rather confused as to the reality, omitting heat altogether, and replacing it with a generic internal energy.
Clausius is credited with defining internal energy in the 1st law. He defined internal energy as internal heat plus the internal work of vibrating atoms. But what controls the level of vibration in atoms? According to Clausius, it is internal heat that controls the vibration. If you add heat, making the mass hotter, the atoms making up the mass vibrate harder.
It should be clear that the 1st law addresses a balance between heat and work, both externally and internally. Therefore the equation should balance both externally and internally. When we claim that U = Q + W, U refers to internal Q + internal W, as per the Clausius definition of U.
What other kind of energy could cause that? Increasing pressure on a mass can do it, but with a solid, there is only so much pressure that can be added to deform a mass and cause the internal atoms to compress. Serious atomic vibrations are produced by the addition of heat, aka thermal energy. It is called thermal for a reason and ‘therme’ is the Greek word for heat according to Christos, who speaks Greek.
Modern definitions of heat and internal energy fail to account for internal heat, appearing to claim that internal vibration increases by magic as temperature rises. They fail to grasp that the energy added is thermal energy, aka heat.
Behind Castle Walls, the Rich and Powerful Celebrate Trump
Downing Street seems to have pulled off a remarkable operation in persuading President Trump that having his second “state visit” held at Windsor Castle behind virtual locked doors rather than the traditional triumphal procession down the Mall to Buckingham Palace was a great compliment.
Windsor was, Trump told the media repeatedly, by far the superior venue and he alone in history had been so favored.
No one in his entourage, apparently, thought it odd that the legendary carriages which transported him in circles around the castle grounds were going from nowhere to nowhere.
But whoever in Westminster conceived and orchestrated this extraordinary grovel knew exactly what they were doing. The most powerful man in the world was given not just the greatest day out ever, but the personal affection and approval which he requires in apparently limitless amounts.
You might like:
https://www.ft.com/content/b1199ed4-d6c5-41df-9a9f-e7f7e5fd346a
A majestuous day.
Ark no longer tries to support his failed “science”. He’s now completely consumed by his TDS.
I feel sorry for him, as I laugh at him.
Laughter is good for the soul:
https://web.archive.org/web/20170105023619/http://www.drroyspencer.com/2016/08/suggested-backyard-experiment-to-measure-the-greenhouse-effect-of-more-carbon-dioxide/#comment-220289
Riddle me this – what was your sock after the G-string?
There’s nothing wrong with laughing at Leftists. They’ve chosen that road.
Clint R’s Law of Conservation of Square Footage:: “not only is “distance” a conserved quantity, but so is “area”.”
Amusingly clownish.
Thank you Ark.
It’s always good to quote me even if you don’t understand. It shows you’re trying to learn.
Perhaps you should focus on your pupil, Puffman. He seems to doubt that distance is a conserved quantity:
https://www.drroyspencer.com/2025/09/uah-v6-1-global-temperature-update-for-august-2025-0-39-deg-c/#comment-1714728
You’re nine days late for your lesson. Is it prepared?
Ark, to help with your education:
Note that “area” falls under “mass”.
See, learning doesn’t have to be painful.
Clint R’s Law of Conservation of Nonsense: “ Note that “area” falls under “mass”.”
Stretch a balloon and its area changes, the mass doesn’t, end of story.
What will the child try next?
Yes Ark, if you add more area, the total increases. Just like If you turn up the temperature in an oven, the energy inside increases.
You seem to be learning. Are you ready to learn that radiative flux does not simply add?
Were you able to understand the simple problem Willard ran from?
I will call this one Clint R’s Law of Conservation of Bullshit: “if you add more area, the total increases. Just like If you turn up the temperature in an oven, the energy inside increases.”
He confuses redistributing the same material by stretching a balloon with heating an oven by adding energy to the system.
What will this child try next?
Ark, when a balloon is blown up, the stretching reduces the skin thickness. It will eventually burst.
But 1 square inch on the surface is always 1 square inch.
I shouldn’t have to explain such basics to you. So, you’re not trying to understand. You’re just trying to be cute. And, you’re avoiding the climate science:
https://www.drroyspencer.com/2025/09/uah-v6-1-global-temperature-update-for-august-2025-0-39-deg-c/#comment-1715717
Who’s the real child?
…his dragon crank comrade says nothing.
Ball4 simply lies, and none of you call him on it. He makes your “team” look bad…so, hey, let him continue to do so if you want!
Clint R said something that Arkady considers funny, but there’s no suggestion Clint’s lying. And, he seems to be defending himself just fine.
Was there something else you wanted me to say?
…DREMT…says…nothing.
Was there something else you wanted me to say?
Clint R, are you denying reality, lying, or simply bullshitting? Seems you can’t tell which it is anymore.
“when a balloon is blown up… 1 square inch on the surface is always 1 square inch.”
The surface area of a spherical balloon is 4πr².
If it’s “blown up” from 6 inches to 8 inches, 1 square inch becomes 1.78 square inches.
What will you try next!
Ark, you appear more interested in attacking me than in learning.
You don’t even seem able to understand the stuff you find. If you increase the diameter of a sphere, the surface area increases accordingly. Area is conserved. That’s what it’s all about. If you have two apples and you add two more apples, you have 4 apples. “Apples” are “conserved”. Area is conserved. Energy is conserved.
However, some things are NOT conserved. Radiative flux is NOT conserved. If a certain sphere is irradiated long enough with 1000 W/m² it will be emitting 250 W/m². 1000 does NOT equal 250. “Flux-in” does NOT equal “flux-out”. Radiative flux is NOT conserved.
Will you get it, or will you just continue with the childishness?
I’m not “attacking” you. I’m trying to tell you that you’re trying to run before you can walk, little buddy.
Area is a geometrical property. Geometry is not a conservation law in physics.
Counting apples is a basic mathematical operation. Counting is not a conservation law in physics.
You will not begin to understand physics until you understand the conservation laws, their definition, and how to apply them.
What childishness will you try next!
[PUFFMAN] Ark no longer tries to support his failed “science”. He’s now completely consumed by his TDS.
[ALSO PUFFMAN] Ark you appear more interested in attacking me than in learning.
And DREMT…says..nothing once more.
Clint R 7:11 am: “If a certain sphere is irradiated long enough with 1000 W/m^2…”
Returns for BB sphere:
“AI Overview
Final Answer
The sphere will be emitting 1000 W/m^2 at equilibrium.”
Long enough “Flux-in” does equal “flux-out” when physically handled properly. Poor Clint R, incorrectly flailing around in the age of AI. But at least Clint managed to dupe DREMT.
Ark, now you’re just throwing irrelevant crap against the wall:
“Geometry is not a conservation law in physics.”
I never said it was.
“Counting is not a conservation law in physics.”
I never said it was.
You’re not impressing me. You seem to be acting like Willard, just clogging the blog with nonsense. If you want to impress me, solve the simple physics problem that you and Willard have been avoiding:
https://www.drroyspencer.com/2025/09/uah-v6-1-global-temperature-update-for-august-2025-0-39-deg-c/#comment-1715717
So, now you’re denying your denials.
On geometry:
[Clint R] In physics, a conservation law states that… Note that “area” falls under “mass”.
On counting:
[Clint R] things that are tangible are “conserved” –apples, coins, shoes, etc.
What will child Clint R try next!
OK, Willard, I’ll say something:
https://www.drroyspencer.com/2025/09/uah-v6-1-global-temperature-update-for-august-2025-0-39-deg-c/#comment-1715379
I see Ball4 just added another example.
Now you are striving to make a false accusation. But, it’s incoherent and lackadaisical, just meaningless word salad.
And, you continue to avoid the simple physics problem, where you could learn something.
See what TDS has done to your brain?
Hey Puffman, riddle me this –
https://www.drroyspencer.com/2025/09/uah-v6-1-global-temperature-update-for-august-2025-0-39-deg-c/#comment-1715772
Is it possible for radiant exitance to be both an averaged value and not a “not averaged” value at the same time?
We’ll let barry correct Ball4:
https://www.drroyspencer.com/2025/09/uah-v6-1-global-temperature-update-for-august-2025-0-39-deg-c/#comment-1715863
“It is the same for a sphere of any size. You can convert the flux value without worrying about power. Just divide by 4 to get the area averaged flux. This will give you your outgoing area-averaged flux for a blackbody sphere. Regardless of size.”
So, take the incoming flux: 1,000 W/m^2.
“Just divide by 4”: 250 W/m^2.
That, is according to barry, “the outgoing area averaged flux for a blackbody sphere”.
So, barry agrees with Clint. Progress!
The incessant drone appears.
Does area fall under mass, yes or no?
Google AI, or Gemini if you prefer, has this to offer:
“Where area is relevant in conservation principles:
Fluid Dynamics and the Continuity Equation: In incompressible fluid flow, the product of area (A) and velocity (u), known as the mass flow rate (in conjunction with density), is constant. This arises from the principle of mass conservation: if the area through which the fluid flows decreases, its velocity must increase to maintain the constant mass flow rate through the system.”
So, there is at least one example where area is involved in mass conservation. Does that mean “area falls under mass” in the way Clint means it? Maybe, you would have to ask him to clarify further.
Certainly, Clint did not say that geometry or counting were a conservation law in physics. That’s just the usual misrepresentation.
Nobody here but DREMT and Gill prefers AI slop.
How does modifying the shape of a system (say an object) add material to it?
My answer is: I don’t care. I’m not having another week-long back-and-forth over something that’s not even my claim to defend.
Are barry and Clint right, or is Ball4 right?
You don’t have to answer, Willard. In fact, I’d love to see barry and Ball4 discuss it. But, we all know the likelihood of that happening is zero.
Proven liar and notorious climate gaslighter DREMT does his thing:
Plays dumb about an identity (1/1 = 2/2). Gets caught saying A and non-A. Acts as if nothing happened. Gets caught saying I was incorrect about Puffman introducing angular momentum. Gets caught saying that Puffman’s deflection is the actual topic of discussion. Gets caught repeatedly saying I did not answer a question while I answered it many times. Then switched to a True Scotsman. Then pretended his rhetorical question was a real question.
Responds to Barry’s comments without reading them. Lies about B4. Doesn’t respond to Nate’s direct questions, doesn’t recognize Nate’s direct answers, often lies about Nate. Refuses to translate Gill’s gibberish. Enables Puffman’s fabrication about having commented here for at least a decade.
Not only fails to grasp topicality, relevance but also commitment and overall reasonableness. Claims that claims he made for a month aren’t his. Refuses to abide the rules he decrees for others. Knows that AI slop is slop, but pretends I believe bots are infallible. No – squarely puts bots’ words into my mouth.
Refuses to meet minds. Asserts that the irradiance of Eli’s plate isn’t an average, because “definition”. Willingly confuses one side of an object with the object as a whole. Presents stipulation as definition.
Keeps acting as if he was some kind of Nikola Tesla, but without the pigeons. Pretends he’s making scientific contributions whence he makes none. Ends up with pure gaslighting and, when frustrated, with PSTering.
BUT, he finally conceded that his best buddy was Gemini, not Google AI, and he almost confronted Puffman on his homemade physics, so despite all his abuses, it was progress. At least relatively to his usual performances.
The actual discussions are there for anyone to read, Willard. No need for you to unleash a barrage of false accusations and misrepresentations in your frustration.
Yeah DREMT, Willard can be mostly ignored.
He’s only here to attack science, spread TDS, and clog the blog.
Like the rest of his cult, he thrives on false accusations.
“his best buddy was Gemini, not Google AI”
Science proves that LLMs make users more retarded than they were before. Thoughts?
https://arxiv.org/abs/2506.08872
It certainly hasn’t helped Ball4, Arkady.
“Now you are striving to make a false accusation. But, it’s incoherent and lackadaisical, just meaningless word salad.”
Both, eh? I’m quite the gifted villain, apparently.
I chewed Copenhagen for 20 years and never had any trouble with worms or long relationships.
Dishonesty or incompetence? I think both, but mainly the former.
In incompressible fluid flow, the product of cross-sectional area (A) and velocity (u), is the volume flow rate (Q). If you’d rather work with the mass flow rate, then simply multiply Q by the fluid density.
Volume (or mass) flow rate is constant throughout a system.
As the area of a pipe changes, the fluid velocity must also change to maintain the same constant flow rate. This is the principle of conservation of mass. There is no principle of conservation of area.
“There is no principle of conservation of area.”
I wasn’t asked if there was. I was asked:
“Does area fall under mass, yes or no?”
Not knowing what Clint meant by “area falls under mass”, I tentatively suggested a way in which area was involved in the principle of mass conservation. And so, my overall answer to the question asked was “maybe”.
But, don’t let the facts stop your false accusations from flying.
Hey Puffman, riddle me this –
https://www.drroyspencer.com/2025/09/uah-v6-1-global-temperature-update-for-august-2025-0-39-deg-c/#comment-1716255
When are you going to engage with your pupil so what you will interest him?
He’s the only one you got!
“When are you going to engage with your pupil so what you will interest him?“
Willard needs a lesson from an English teacher.
DREMT wants to make it personal.
Again.
I know you like to do the thing where you repeat back to me something I’ve said elsewhere, but you really need to work on when you apply it.
There are social groups that could help DREMT learn about various language games that still escape him. He might be a tad old for most of them. (The groups, not the games.)
I’m sure he could find one.
And, there are English teachers.
Many other countries provide such courses.
…but, it’s probably best if Willard learns English from a native speaker.
“We’ll let barry correct Ball4”
No need since DREMT’s competence in the field is at such a low level that DREMT doesn’t realize Barry and Clint R are discussing different examples with different answers.
I’ll volunteer to help DREMT sort that out if asked but it’s a likely hopeless endeavor.
barry and Clint’s answer is the same. 1,000 W/m^2 in, 250 W/m^2 out.
Your answer is different.
Your answer could only be “correct” for a rotating sphere receiving 4,000 W/m^2 (not averaged), and emitting 1,000 W/m^2. The reported figure of 1,000 W/m^2 for irradiance would then have to be both a spatial and temporal average.
Google search answer is different because the verbatim problem statement entered is different as DREMT has already been informed.
I’ve correctly stated the only possible way “flux in” could equal “flux out” for your “BB sphere”, Ball4. Please continue with your deception for the blog’s amusement, however, you worthless, pathetic disgrace.
Hey B4,
If you ever got the time, ask DREMT what happens if instead of having a plate that gets 400 W/m² from only one side it received 200 W/m² from each side.
Watch him wriggle.
The proven liar returns.
“Knows that AI slop is slop, but pretends I believe bots are infallible. No – squarely puts bots’ words into my mouth.”
Let’s look at the reality:
https://www.drroyspencer.com/2025/09/uah-v6-1-global-temperature-update-for-august-2025-0-39-deg-c/#comment-1714911
“It’s sad to see DREMT struggling with something his best buddy resolves quite easily:
[Quotes the bot making a silly, fundamental mistake]
It really requires a devious brain like DREMT’s to be able to misunderstand that!”
Obviously Willard put the bot’s words in his own mouth. The only rational way to read the comment I just linked to is that he’s saying he thinks the bot is correct. So, not only does Willard not understand basic physics, he’s being condescending whilst doing so, doesn’t admit he’s wrong when called on it, then later lies and tries to spin it as if I’m the one that wronged him. All of the points in his long list are in a similar vein.
Worms wriggle.
…as you’ve demonstrated.
Unless you’re going to clarify what your point was at 10:49 PM, I guess that’s that.
DREMT lies.
And he is still wriggling.
Yeah Willard 10:49 pm, DREMT has for decades been expert at trying to wriggle out of DREMT’s physics errors in this field. Now DREMT tries to change Clint R’s 7:11 am: “If a certain sphere is irradiated long enough with 1000 W/m^2…” with no mention of sphere rotation into a certain: “rotating sphere receiving 4,000 W/m^2” trusting that a more astute reader will not notice.
This is what humorously happens as DREMT, having such low competence in this field, was so easily duped by Clint R. I’ll watch for, and knowingly grin, when yet another DREMT melt down rant occurs.
Sorry, Ball4:
https://www.drroyspencer.com/2025/09/uah-v6-1-global-temperature-update-for-august-2025-0-39-deg-c/#comment-1716312
Willard: if you have no point, I have no problem with that.
As long as it’s understood that there’s only one heat source irradiating the sphere, Ball4, then there’s no way for you to wriggle out of this.
“DREMT has for decades”
Half of one, B4.
Only half of one.
That’s more than enough wriggling, don’t you think?
Ball4 disappears, realising that I’m right, of course.
barry and Clint’s answer is the same. 1,000 W/m^2 in, 250 W/m^2 out.
Ball4’s answer is different.
Ball4’s answer could only be “correct” for a rotating sphere receiving 4,000 W/m^2 (not averaged), and emitting 1,000 W/m^2. The reported figure of 1,000 W/m^2 for irradiance would then have to be both a spatial and temporal average.
Willard 10:47 pm, DREMT is only the current screen name.
—-
In a failed attempt to wriggle out of a mistake, DREMT 12:43 am now adds rotation & completely made-up different illumination than Clint R’s original 7:11 am comment.
No mistake, Ball4. Further,
Continuing to assume that there’s only one heat source irradiating the sphere, then:
Any “BB sphere” emitting 1,000 W/m^2, whether rotating or not rotating, must be receiving 4,000 W/m^2 (not averaged) irradiance, in order to emit 1,000 W/m^2. If the sphere is not rotating, then an averaged irradiance of 1,000 W/m^2 is not possible. If the sphere is not rotating, then only an averaged irradiance of 2,000 W/m^2 would be possible, which would be a spatial average across the receiving lit hemisphere.
Notice how DREMT’s “(not averaged)” silently concedes the point, B4.
I know that he has haplessly commented under various names, but Eli’s thought experiment is from 2017…
Wait – that’s more than five years, innit?
I guess Ball4 silently concedes the point.
DREMT 7:26 am makes the mistake again of inserting wording into Clint R’s 7:11 am example that isn’t there to try and save DREMT, but it isn’t going to work.
Astute, i.e. more able than DREMT, readers can easily check there is no such wording to put into google search line for an AI answer to Clint’s 7:11 am example: “If a certain sphere is irradiated long enough with 1000 W/m²…”
I don’t need anything to “save” me, as I’ve been correct from the start.
You’re the one that’s wriggling.
What’s entered into Google is what’s entered into Google. I’m not disputing that and I’m certainly not trying to hide anything. What I’m saying is that the answer you get, 1,000 W/m^2 emitted, can only possibly be correct under the conditions I’ve outlined.
It’s really not hard to understand.
Now you will just reply with the exact same thing, again.
6:55 pm: “What I’m saying is that the answer you get, 1,000 W/m^2 emitted, can only possibly be correct under the conditions I’ve outlined.”
No. And it was google search’s answer. There is no rotation in Clint R’s 7:11 am example. I’ve already posted the google search answer to Clint’s verbatim example affirming my “no”. Anyone can replicate the search answer; even including the less than competent DREMT in order to realize DREMT is wrong & has made a mistake from which DREMT is evidently & repeatedly trying to run away.
Ball4, you keep wriggling.
You insist the sphere is not rotating, despite rotation or lack of it not being specified. If the sphere is not rotating, then Google simply gives the wrong answer. Even if the 1,000 W/m^2 irradiance were an averaged value, it could not eventually lead to an emitted flux from a non-rotating sphere of 1,000 W/m^2.
That is because you cannot average irradiance over surface area not receiving the irradiance, and only half of the sphere’s total surface area is irradiated if it does not rotate. So, at best, if the irradiance were an averaged value of 1,000 W/m^2 (spatially averaged over the lit hemisphere from an initial “not averaged” value of 2,000 W/m^2), then the emitted flux at equilibrium would be 500 W/m^2.
DREMT 12:31 am finally loses blind faith in Google AI: “Google simply gives the wrong answer”.
DREMT should go point that out to the google authorities (laughter will ensue) or at least stop using their search line for AI.
Humorously DREMT 12:31 am goes on to post a non-equilibrium answer for Clint R’s example at a stated equilibrium demonstrating DREMT’s lack of skill in this field! More laughs from the skilled readers.
Ball4 cannot refute the argument made, nor does he even address it.
Warner wriggles.
No need to wriggle with the argument settled in my favour.
Since DREMT posits he’s better than anyone else here including Puffman, no wonder he’s jury and judge of his own apology!
Sadly, he refuses to read my artful refutation of his silly appeal to AI, just like he can’t read what B4 says.
Willard, I’ve never posited that I’m better than anyone else here. Maybe it’s you that thinks I’m better than everyone else here? It certainly isn’t me that thinks it, but you seem to get the idea from somewhere…
…but rather than just endlessly discuss your opinions of me as a person, why not actually make an attempt to rebut the argument I’ve made on this thread?
We never said that DREMT said he was better than everybody else.
Another disgraceful mischaracterization.
Willard can’t read again… and, he obviously has no rebuttal to my argument, either.
DREMT still doesn’t get that words may have various meanings, and his “maybe it’s you that thinks I’m better than everyone else here” is pure gaslighting.
Willard has no rebuttal to my argument, so tries to distract attention.
There is nothing to rebut.
DREMT still replies.
There’s the entire argument for you to rebut.
Seeing nothing to rebut, DREMT is just being pedantic once more.
Willard has stopped even trying to make sense.
This particular sub-thread is about DREMT’s total lack of social skills, which won’t elide his failure to say what happens if instead of having a plate that gets 400 W/m² from only one side it received 200 W/m² from each side.
(The reason being that it DESTROYS his silly “by definition” argument.)
Of course it doesn’t.
Once again DREMT forgot his “yes” before his “but but but but”.
A basic skill to acquire, even in England!
Willard fails to place his comment correctly, again.
DREMT once again has no rebuttal.
He still replies.
Nothing to rebut, just you being pedantic again.
Has DREMT’s stance ever made any sense?
This particular sub-thread is a continuation from the very serious discussion about your failings with the English language. My stance on that has always made sense. You’re a terrible writer.
Of course, it isn’t.
It is; this sub-thread follows on from here:
https://www.drroyspencer.com/2025/09/uah-v6-1-global-temperature-update-for-august-2025-0-39-deg-c/#comment-1716550
SOLAR MINIMUM UPDATE
As commerce secretary, Howard Lutnick oversees the U.S. government’s vast efforts to monitor and predict the weather.
The billionaire also ran a financial firm, which he recently left in the control of his adult sons, that stands to benefit if Donald follows through on a decade-long Republican effort to privatize government weather forecasting.
https://apnews.com/article/trump-lutnick-weather-service-privatization-conflicts-9892de853c283468e6fb970cfd898d96
BIG WIN in the war over conflicts of interests!
dremt…”Don’t worry, Gordon, I haven’t taken your comment the wrong way. I think it’s a shame you and Clint have fallen out. Clearly you’re a deep thinker, which is generally a good thing, however in this case I think you may have over-thought the problem! Flux is not conserved simply because it can be received and emitted over differing amounts of surface area”.
***
Dremt…appreciate your open-mindedness.
Re Clint…I have no problem with him, it is Clint who seems to have a problem with me. Both you and I had helped him extensively with the Moon rotation debate then suddenly he started taking shots at me. There were things he had said with which I disagreed before that but I kept it to myself.
If he disagreed with anything I said after the Moon debate, all he had to do was say so in a civil manner. However, he took the low road and started treating me as the enemy, for whatever reason. It’s up to Clint if he wants to communicate civilly again, I have no problem being civil.
With regard to flux, I get your point and I am not trying to be picky. However, I have been a student of awareness for decades and how it relates to the human mind and the beliefs people tend to form based on their mental conditioning. I simply cannot identify with mental conditioning anymore and I tend to look for what is actually going on. Sometimes it takes a lot of words to describe that.
The debate was about whether or not flux can be conserved. I am asking how something that is an abstraction of the human mind can be of interest re conservation.
Planck recognized this enigma circa 1900. In his book on heat he points out quite correctly that humans have invented certain models based on natural phenomena. In other words, things like time, density, length and temperature are inventions of the human mind designed to interface the human mind to the real world. They don’t exist other than in the human mind and for the benefits of that mind.
Time is based on the period of the Earth’s rotation and note that a period has no units till we humans define them. Density is based on the molecular structure of water, which is arbitrarily given a density of 1. All other densities are relative to the mass per unit volume of water. Length is based on various factors like the length of a king’s foot or as with the metre, it was defined initially as a fraction of the length from the Equator to the North Pole.
Temperature was defined initially as the degree to which heat could expand mercury in a vial. Both the Fahrenheit and Celsius scales are based on the freezing and boiling points of water. I don’t care how Maxwell and Boltzmann redefined temperature, we still require thermometers to measure it as the relative levels of heat.
Flux is another invention of the human mind, initially by Newton. His intention was to determine an instantaneous rate of change between two variables in a function. For example, if two variables, x and y, are changing with a parabolic relationship, we equate them as y = x^2. Newton discovered that an instantaneous rate of change for that function is dy/dx = 2x. That means at any point on the curve y = x^2, the instantaneous rate of change of the function is 2x, where y = 2x defines a tangent line to the curve at any one point.
That is the basic meaning of flux, as in Newton’s fluxion. However, today, we tend to apply it to surfaces or areas where an electromagnetic field or a magnetic field is passing through it. If we have a single frequency of EM passing through an area, the equation for the EM is y = A.sin(theta) in its most basic form.
I think we tend to visualize flux, in the case of a magnetic field, as a bunch of lines squeezing into an area. the more lines per unit area the more dense the flux. That’s OK with me but it lacks precision. Maybe with a magnetic field there are some sort of collections of lines of something but when we group different frequencies of EM into an area, what is it we are measuring?
We tend to visualize a single photon as an entity but that’s far from the case. It begins life as a burst (packet of EM with a definite frequency) of EM from an electron that is very rapidly orbiting an atom. Thus, the packet of EM has a single frequency. How those single packets merge into a light spectrum of waves is not known. However, as I have tried to convey to Clint, the flux field is a depiction of energy, electromagnetic energy.
Ergo, we have no idea what a photon is although we tend to throw the word around as if it is fact.
Other than that, we use flux to help solder flow more easily and I can assure you it is not conserved there either. ☺ ☺ It melts and changes to a hard, brittle compound.
gordon’s obsession with me is likely caused by a combination of his Leftism and jealousy.
A BLAST FROM THE PAST
Bagram Air Base was built by the Soviet Union in the 1950s.
Don’t let any crank tell you otherwise!
clint…”However, some things are NOT conserved. Radiative flux is NOT conserved. If a certain sphere is irradiated long enough with 1000 W/m² it will be emitting 250 W/m². 1000 does NOT equal 250. “Flux-in” does NOT equal “flux-out”. Radiative flux is NOT conserved.
***
I will endeavor to help out my old buddy Clint here but he will no doubt receive it as a shot at him. C’est la vie.
Radiative flux is another way to say electromagnetic energy just as magnetic flux is associated with magnetic energy and gravitational flux might be associated with a gravitational field. Flux in a ammagentic field is measured in lines of force per unit area although it is not explained what is meant as a line of force. In motor and transformer theory, flux is general referenced only as a coupling mechanism or a field.
However, in engineering problem sets we replaced the entire field with a vector acting at the COM of an object. On other occasions, we used surface integrals to calculate the flux per unit area emanating from or entering a sphere. For example, the right hand and left hand rules for motors and generators depict a flux field as a vector quantity as if it acts at a point. The vector normally points N to S as per the poles of a magnet.
There is no reason why EM should be conserved and I have already given an example of that. In Clint’s example it is not conserved because it is converted to heat. One might say that EM’s loss is heat’s gain and vice-versa wrt to heat dissipation at a surface. However, the entire amount of energy with EM plus heat, at any instant, must be conserved.
The law of conservation of energy addresses a generic energy which can be made up of transformations of several types of energy. For example, when EM is converted to heat, the entire bundle of energy is conserved, not individual forms of the energy.
The law tells us that if EM is converted to heat, and lost completely, the entire energy bundle must remain the same energy-wise over the conversion. Of course, that does not allow for losses therefore the law is finicky and general in nature. That is, we’d have a very difficult proving it in many cases.
It should be noted that when the law of conservation of energy was declared, nothing was known about EM and its relationship with heat and electrons in a mass.
I used the example of EM emitted by the Sun and flowing freely into space. Any EM that is not absorbed must eventually thin out in intensity to a point where we must declare it disappeared. That is backed by error analysis in math where something like an exponential function decaying toward infinity must, at some point, be declared as a value, or limit, since infinity is not defined. When we declare the value of disappearance we must include an error estimate of what remains and that is an entire field in mathematics.
So, if we state that a zero value for solar radiation is 1 billionth of its initial value as it left the Sun, we can declare the energy completely dissipated at so many light years from the Sun due to the inverse square law. In that case, the conservation law is a moot point.
It makes little sense then to talk about radiation (EM) being conserved. However, if the same EM strikes the Earth, is absorbed and converted to heat in the surface, then the conservation law applies. Here, we are talking about total energy, not a specific energy like EM or heat. It tells us that if a certain amount of EM strikes a surface and is converted to heat, the entire energy amount must e conserved.
If we are going to talk about intangibles like conserving energy we also need to address the reality. We defined flux, at least Newton did, as a measure of a varying radiation field wrt time in general with regard to EM. Newton meant it more as an infinitesimal change of one parameter in a function wrt to another. However, where areas or volumes are involved, we can measure in units of change per m^2, hence the units of w/m^2 at TOA. It is a measure of EM intensity at TOA.
Flux then is a mathematical relationship of a varying field while the phenomenon it is measuring in our case is energy, specifically EM.
gordon’s obsession with me is linked to his Leftism and jealousy. He doesn’t really hate me. He hates reality. So because I bring reality, he is offended, defensive and hateful.
SOLAR MINIMUM UPDATE
Dyson spheres are a joke:
https://www.youtube.com/watch?v=fLzEX1TPBFM
Not in the Sky Dragon cranks sense. A real joke.
MAGA: Make Argentina Great Again
https://youtu.be/Yh2lV_rU_bU
[Trump says he’ll use tariff revenue to bailout farmers] In the Oval Office today, President Trump acknowledged his tariff/trade policies have been hurting U.S. farmers, and said the government is planning to send them relief money.
So basically, if you’re a small business owner now paying ridiculous import tariffs, you’re handing out money to the farmers who voted for this regime.
Biden’s and Trump’s payments to farmers have been virtually identical. ALL taxpayers pay billions of dollars in farm support, like direct payments, crop insurance, loan financing and subsidies.
For some reason you didn’t talk about net farm income, Max.
Why is that?
Trump’s large ad hoc payments to farmers are tied to trade wars and intended to offset losses from retaliatory tariffs. A self-inflicted wound no?
https://www.reuters.com/world/us/usda-considering-economic-aid-farmers-this-fall-says-secretary-2025-09-15/
https://farmpolicynews.illinois.edu/2025/09/tariffs-could-fund-farm-economic-aid-ag-sec-rollins-says/
Arkady: The U.S. government collected $165 billion in customs duties in first 9 months of this year and more than doubled it from $70 billion. It’s only fair to compensate possible losses to farmers. Biden payed $78 billion because of Covid.
(DONALD) *Hits farmer consumers on the head with a baseball bat*.
(MaxC) It’s only fair that Donald gives farmers Tylenol.
Meanwhile, in the real world:
https://www.youtube.com/watch?v=AfVGUiet39E
“Hidden taxes” are the most beautiful words.
MaxC
Tariffs are import taxes paid by US companies and/or consumers.
Farmers have lost export markets, primarily in China, because of Trump’s trade war.
Covid was global pandemic.
MaxC.
“The U.S. government collected $165 billion in customs duties in first 9 months of this year and more than doubled it from $70 billion.”
The government raising our taxes is not something to brag about.
https://en.wikipedia.org/wiki/Grievances_of_the_United_States_Declaration_of_Independence#Grievance_17
And neither is cutting off our trade with the world.
https://en.wikipedia.org/wiki/Grievances_of_the_United_States_Declaration_of_Independence#Grievance_16
‘Climate change is a huge scam by stupid people’
That includes you.
BACK AT THE RANCH
The violent weather that battered Europe this summer caused short-term economic losses of at least €43bn, according to an EU-wide estimate, with costs expected to rise to €126bn by 2029.
The immediate hit to the economy from a single brutal summer of heat, drought and flooding amounted to 0.26% of the EU’s economic output in 2024, according to the rapid analysis, which has not been submitted for peer review but is based on relationships between weather and economic data that were published in an academic study this month.
https://www.theguardian.com/world/2025/sep/15/europes-summer-of-extreme-weather-caused-43bn-of-short-term-losses-analysis-finds
Troglodytes are getting played. As long as Donald wins, they don’t care.
You make it sound like something unusual happened this summer,do you actually know any climate history of Europe,or do you just look stuf up ? Since my firsts venture into mainland Europe in 1968 i have encountered many such summers, what has changed is the fact governments and people have become pretty useless at coping with weather,when i was young we prepared for bad weather months in advance,the preparations for the coming Autumn and winter began every spring, in the cooler months we cleared brushwood and burned dead grasses and any other combustible materials, every one in the country side knew you rarely got two years with the same conditions,as for cost, the cost of every thing has increased,what happened to a stitch in time saves nine
You make it sound like you’re trying to use all the steps from the contrarian tango at the same time, Ian.
You can go for Step 1 – Pure Denial. Or you can go for Step 2 – Sammich Request. Or Step 3 – Saying Stuff. Even Step 4 – Cheap Bargaining.
Only the last one is missing. When are you going to provide any evidence? Any kind will do. Since it’d be a first, baby steps.
Here’s what it could look like:
https://www.metoffice.gov.uk/about-us/news-and-media/media-centre/weather-and-climate-news/2025/summer-2025-is-the-warmest-on-record-for-the-uk
Best of luck!
Willard: Temperatures 2 meters above Earth’s surface are useful information f.ex. for aviation and agriculture. But when meteorologists start to predict future climate, they are laymen like you and me. Simply ignore their climate predictions.
Reinsurers may demur, Max.
Have you thought about starting your own insurance gig?
MaxC
After a first post on September 3, 2025 at 10:42 AM
” Meteorologists are not climatologists aka climate scientists. Meteorologists are experts in the field of climate, but laymen in the field of climate change. ”
you now unsuprisingly repeat above
” But when meteorologists start to predict future climate, they are laymen like you and me. Simply ignore their climate predictions. ”
Wow wow wow.
*
And with that, you confirm your arrogant, condescending tone, discrediting meteorologists by denying them the opportunity to conduct valuable research on climate change. And you finally even insult meteorologist Roy Spencer, who actually owns the blog you post on (say after me: Thank you, 1st amendment).
Aall of this, of course, without providing a shred of substantive evidence for your incredibly shallow claim.
*
You hereby perfectly reproduce, in an abstract sense, the blatant, unscientific nonsense that a foursome of lunar spin deniers (I mean what the so-called ‘non-spinners’ Robertson, Clint R, the fake moderator DREMT, and the Hunter boy endlessly spread on this blog, along with their tacit support in the background) .
*
For years, these four geniuses have had the chutzpah to deny astronomers and mathematicians the ability to evaluate the lunar spin – by using spherical trigonometry like Cassini and Mayer, or systems of [x,y,z] differential equations like Lagrange, Laplace, and all their followers in science over centuries.
In the foursome’s view, all these scientists have failed to understand the alleged physical evidence shown by our Moon always presenting us the same side.
This evidence was disseminated by history deniers like Tesla in an obscure inventor’s pamphlet in 1919, and by some Tesla-worshipping Serbs working at a mechanics institute in Belgrade.
*
One of the foursome, the Hunter boy, was even bold enough to denigrate all these observations and results as ‘academic exercise’ for years, writing to me a few days ago in a subsequent thread:
” And don’t talk about your moon’s rotation any more. If you still don’t understand the actual position of non-spinners, there is no hope for you. You have been completely indoctrinated into a cult.”
A ‘cult’. Aha. Hundreds of engineers and scientists apparently were, like me, ‘completely indoctrinated into a cult’, including those who nowadays have to compute the exact delay between lunar descent and subsequent ascent procedures. Well done!
*
Even to Newton, the four denied the ability to scientifically evaluate and understand Cassini’s (unfortunately unpublished) lunar spin results, and to explain them to the German astronomer Mercator (alias Nikolas Kaufman) in 1675, which the latter published in his own treatise a year later.
**
But wait a minute…
Who knows! Perhaps MaxC is also one of these tacit supporters of this technical and scientific nonsense!
*
Therefore, it would be very interesting to hear from MaxC unequivocally about his technical and/or scientific training and his decades of experience!
Bindidon: There are many branches of meteorology, just like in engineering. E.g. computer engineers know nothing about nuclear engineering. Most meteorologists forecast weather and their work is invaluable for all of us. Some meteorologists focus on the atmosphere (climate) and its physical and dynamic properties. But only handful of meteorologists are specialized in climate change, and Dr.Spencer is one of them. Average meteorologists believe in consensus science and repeat IPCC’s claims like parrots.
MaxC
What a ridiculous, redundant answer, typical for you.
But at least it proves two things:
– you don’t have the least clue of what are meteorology, climate science and climate change;
– you are too much a coward to tell us what kind of education you obtained, let alone the level of experience you gained.
*
Thus: you are just an egomaniacal boaster, like Robertson, Clint R, the Hunter boy, Tim S and many many others.
Anyone actively watching this blog knows that I am a retired engineer who later specialised in software engineering.
Weekend is approaching, so I get to catch up on all the nonsense.
Ball4, Ark, Nate, and Willard have lost it. They are devastated by two developments — The realization that “Earth’s Energy Budget” is nonsense, and the simple physics problem.
They seem to have focused on #2 of the dozen debunks of the “Budget” — #2 Flux does NOT average.. Then, they took off to get confused about “conservation”. It’s fun to let them wallow in their confusion, as they’ve obviously never studied the subjects.
So I’ll focus on the simple physics problem.
Once again, here’s the problem:
The solutions were given above:
Only 3 of the cult tried to solve it, Norman, barry, and Ball4. But they all got the wrong answer. However, Norman seemed to understand the solution. That’s why he hasn’t commented here since!
This simple problem destroys the CO2 nonsense.
So, here’s a second problem for the cult kids (Ball4, barry, Ark, Nate, and Willard):
The weekend is approaching and still no one knows what Clint meant by “area falls under mass.”
He is devastated by two developments -that Area is a geometrical property, and counting apples is a basic mathematical operation- that prove he doesn’t understand how conservation laws work in physics.
Ark, you’ve already proved you don’t understand any of this. There’s no need to keep proving the obvious.
If you knew anything about the science, you would correctly answer the problem. But, you “know nothing”.
Prove me wrong.
Why are you ignoring your “team-mate’s” suggestion to clarify further what you meant by “area falls under mass.”
He seems to disagree with your latest blunder that not only is “distance” a conserved quantity, but so is “area”.
Ark, you’re making false accusations instead of solving the problem.
If you can’t solve it, just say so. Quit weaseling.
Here’s where DREMT made the mistake of trying to humiliate Barry:
[DREMT] Hilariously, barry is not going to admit he made a mistake.
That was immediately after this sentence:
[BARRY] All because of a dumb brain-fart you’ve latched onto.
All this is rather silly, for we all know that Barry would win the Lady Bing trophy if there was one in Climateball.
And since DREMT has been caught gloating after failing to have read Barry, he won’t let go. More so that it allows him to comment without addressing the discrepancies between his story and Puffman’s.
But the most beautiful thing is that he’s been told that multiple times already, and he’s still acting as if he hasn’t heard. Not unlike when he pretended I wasn’t answering him when I did, multiple times.
Sky Dragon cranks are weird.
barry wasn’t referring to his own mistake as a “dumb brain fart”, Willard. barry never admitted his own mistake.
barry was referring to Clint’s point about “averaging flux”.
Another one from Willard’s list of imagined DREMT “wrongdoings” bites the dust.
Anyone who read Barry’s comment can understand what he said:
So yeah – DREMT once again proves that he just can’t read.
Happy with my reading of his comment, unless barry tells me different.
All readers need to know is which mistake Graham D. Warner is talking about when he said “Hilariously, barry is not going to admit he made a mistake”.
They can also compare:
400 W/m2 = 200 W/m2 X 2
Or, 400 W/m2 / 2 = 200 W/m2
and contrast with what I already cited two times:
https://rabett.blogspot.com/2018/08/the-simplest-green-plate-effect.html
“…which mistake…”
…yes, barry has made many mistakes, but doesn’t admit to them. Thankfully, for barry, he has Willard working around the clock desperately trying to confuse the issue in order to try and protect him. barry is lucky to be part of such a large team of desperate defenders/obfuscators who would all go to the ends of the Earth for each other. What a team!
DREMT may never get tired of NIGYSOB.
Imagine if his opponents acted the same.
They pretend that they accept that radiative flux is not conserved, they pay lip service to that idea; then they do absolutely everything in their power to imply and insinuate that radiative flux is conserved.
Strange bunch.
Whoever you are talking about it is’t me, and I doubt it is anyone else.
A blackbody surface receiving a constant X W/m2 must emit a constant X W/m2 equivalent to balance incoming. If the surface is a plate with 2 sides the geometry of emittance changes but the incoming energy must match outgoing per 1st Law. So you account for surface area to determine the balance.
For simple, symmetrical constructs like the ones we deal with, balancing flux over area works perfectly as a proxy for total energy. This is not the case for more complicated structures.
To the point, working out the average radiative emissive flux for a sphere illuminated by a sun is a matter of dividing the incoming solar flux, as if striking a plane, by 4. It really is as simple as that.
Nothing Clint has said has demonstrated otherwise. He has only asserted things that aren’t true. Made claims. Not demonstrated them, while others have successfully debunked his odd ideas.
barry immediately proves me right.
And, besides that, he hasn’t listened to a thing, hasn’t learned a thing, and will never admit to the simple, fundamental mistake he made.
A waste of space.
barry, you’re STILL making the same mistakes.
“A blackbody surface receiving a constant X W/m2 must emit a constant X W/m2 equivalent to balance incoming.”
That’s incorrect. You are confusing radiative flux with energy. (Radiative flux, as used In climate science, is the flux emitted from a surface due to the S/B Law. Less often referred to as “radiosity” or “radiant exitance”, it has units of W/m². It is NOT “energy”.) Radiative flux is NOT conserved, energy is conserved. Radiative flux has SI base units of “kg/s^3”, while energy has SI base units of “kg.m^2/s^2. Two different “animals”.
So your statement should read “A surface receiving a constant X Joules must emit a constant X Joules equivalent to balance incoming, assuming no losses.”
Learn some basics before you start making false accusations about others. IOW, grow up.
Two questions, Puffman:
[PUFFMAN] Radiative flux, as used In climate science, is the flux emitted from a surface due to the S/B Law.
What’s your source for that, and why did you define flux as flux?
We’ll leave the third question (why do you contradict your sole pupil) for later.
Grow up Willard.
The definition of energy flux is the rate of transfer of energy through a surface, Puffman. Climate science has no special definition for it.
So not flux. ENERGY flux. The flow of energy in or out of a body.
(Not half of that body either.)
That means you’re also confusing flux with exitance. That also means you’re reversing your pupil’s trick, which was to reserve “flux” for irradiance.
After having spent more than ten years on this, you need to know your playbook.
You’re also confused about the S/B law, but that’ll need to wait for with cranky uncles, it’s one thing at a time.
Willard weasel must believe I’m about 10 different people.
Kids have such imaginations.
It’s actually the other way around, Puffman: I believe you used many socks. So many socks were the same person.
You’re not the author of the 300/100 puzzle, tho. That was Nate. So riddle me this:
Don’t you feel a little shame in using Nate’s argument as if your puzzle was original?
I said: “A blackbody surface receiving a constant X W/m2 must emit a constant X W/m2 equivalent to balance incoming.”
Clint said: “That’s incorrect.”
Then proceeded to talk about joules.
But what I said is correct for the geometry I nominated. If the only energy leaving the b/b is from the same surface receiving it, then the flux values will be equal.
Flux is not conserved but energy is. With our simple geometries all you have to do is account for area and the relationship between flux and energy is sorted in the math.
DREMT seems to think that when I say the flux values must sum to zero that I me
DREMT seems to think that when I say the flux values must sum to zero (at equilibrium) that I mean the incoming/outgoing flux values must be equal. Dunno how many times I have to repeat that area must be accounted for. 250 =/= 1000, but 250 X 4 = 1000. That’s what is meant by summing the fluxes.
I read upthread DREMT saying that his issue is specifically with averaging the incoming flux over a sphere. What is the problem? No one argues that the incoming flux is actually physically spread evenly over the whole sphere. Everyone seems to agree that area-averaging the incoming flux determines the outgoing flux value that provides the energy balance. I’m not even sure what the disagreement is anymore.
barry…before you disgrace yourself further and finish that sentence you started:
https://www.drroyspencer.com/2025/09/uah-v6-1-global-temperature-update-for-august-2025-0-39-deg-c/#comment-1714049
You clearly supported ChatGPT’s error here. ChatGPT was wrong, which means you were also wrong. It’s because you can’t admit that, that I’ve lost all respect for you.
September 19, 2025 at 5:46 PM:
https://www.drroyspencer.com/2025/09/uah-v6-1-global-temperature-update-for-august-2025-0-39-deg-c/#comment-1715647
DREMT is not a good person.
Actually, barry, it is not only the fact that you made a mistake you have still not admitted to…it’s:
1) You made the mistake whilst trying to humiliate me, even though I was correct.
2) You tried to pretend it had an impact on our previous discussions about the GPE, etc. It doesn’t.
3) You then appeared a handful of times further throughout the discussion this month, never admitting you were wrong, and trying to shovel layers of confusion over Clint’s issue with “averaging flux”.
4) You now show up, claiming not to know what the argument was even about!
The argument is about Clint’s point #2 from his eleven-point critique of the Earth’s energy budget, barry. I have made two arguments relating to “averaging flux”, one explained here:
https://www.drroyspencer.com/2025/09/uah-v6-1-global-temperature-update-for-august-2025-0-39-deg-c/#comment-1716090
which is in line with Clint’s original complaint. And one other argument, introduced here:
https://www.drroyspencer.com/2025/09/uah-v6-1-global-temperature-update-for-august-2025-0-39-deg-c/#comment-1713791
OK?
Both of those 2 DREMT 6:20 am arguments are physically wrong as more skilled commenters have already pointed out. Commenting on any physics could be even more humorously wrong now for DREMT not being able to use google search after DREMT comments: “Google simply gives the wrong answer”.
Proven liar and notorious climate troll Ball4 does his thing.
Oh dear, Graham D. Warner is getting emotional.
I was just calmly stating a fact. You need to work on when to apply these things, as I said to you before, Willard.
https://www.drroyspencer.com/2025/09/uah-v6-1-global-temperature-update-for-august-2025-0-39-deg-c/#comment-1716721
DREMT,
The problem with your arbitrary preference for averaging temperatures is that you won’t get a balanced energy budget. The average temperature will always be colder than the average flux value. Your planet will always be in the process of warming up – until outgoing energy = incoming.
An average temperature is equally “meaningless” to an area-averaged flux. In fact, both have their uses. Your preference is based purely on argumentativeness, causing an assertion without merit.
For you: av temp =/= av flux THEREFORE av flux is invalid.
A non sequitur, not an argument.
barry continues to demonstrate his total misunderstanding of the issues.
DREMT,
You linked to what you believe is your point just above:
“Averaging the two fluxes = 400 + 0 / 2 = 200 W/m^2.
Averaging the two temperatures = 290 + 0 / 2 = 145 K.
There you have it. The average flux, 200 W/m^2, converted to temperature using the SB Law, is 244 K. Totally different to the actual average temperature for the plate, of 145 K. That is because the SB Law does not apply to such averages.
That is what Clint meant by “averaging flux”, and the problem with it. Note that the problem doesn’t apply to “perfectly conducting” objects. The Earth is most certainly not a “perfectly conducting” object.”
My point is precisely germane to this, you just don’t have a response.
Your argument is, as I said: av temp =/= av flux THEREFORE av flux is invalid.
Which is a non sequitir.
You will never close the energy budget by averaging temperature. Try to do so with your example I’ve just quoted. Averaging the temperature and converting that to a flux value will leave you short of balancing the incoming energy every time. Temperature is the wrong metric to establish a radiative energy budget, because temperature has a non-linear relationship to radiative energy.
barry continues to demonstrate his total misunderstanding of the issues, and pathological inability to correctly represent my argument.
“You will never close the energy budget by averaging temperature…”
I’ve never suggested doing this. Not once. barry cannot help himself. He’s a machine of misrepresentation. And, refusal to admit mistakes. Maybe this will help him, but he didn’t listen the first time I wrote it, so it’s unlikely he’ll listen now:
https://www.drroyspencer.com/2025/09/uah-v6-1-global-temperature-update-for-august-2025-0-39-deg-c/#comment-1715760
That’s at least the third denial of DREMT in this thread.
The two first are his denial that he never claimed that one cannot average flux, and his denial of Puffman’s interpretation of the conservation laws.
How many days before the rooster crows, and will he also deny Puffman’s response to Nate’s 300/100 puzzle?
The reason I had to clarify, Willard, is because somebody was acting like “you cannot average flux” literally meant that the claim was “the mathematical operation of averaging numbers simply cannot be performed in the case of flux!” when obviously that was not the claim. So there is no “denial” there, just clarification.
There is a more plausible reason behind Graham’s actual stonewalling. Compare Puffman’s ridiculous assertion:
https://www.drroyspencer.com/2025/09/uah-v6-1-global-temperature-update-for-august-2025-0-39-deg-c/#comment-1716564
with what I already cited three times:
https://rabett.blogspot.com/2018/08/the-simplest-green-plate-effect.html
and which DREMT doesn’t really dispute (at least when comes the time to hide his bailey). Generalizing to cases where the two sides don’t receive the same amount of energy:
a + b = c + C
a = 2c – b
b needs to be 0 when a is 400 and c is 200.
Puffman’s solution is complete bonkers, so DREMT is just running the clock.
This is the last day of the month. He’s almost there. Will he succeed?
Stay tuned for Graham Stonewalls in Another Thread!
I’m not defending another of Clint’s claims.
Two months continuous, abusive pushback despite being correct on this one is enough for me!
DREMT faces a tough choice.
He could accept pretty basic algebra.
Or he could “not defend” Puffman.
What did he choose?
The Stonewall Defense strikes again!
Remarkably enough, the first of DREMT’s 413 comments this month is this one:
https://www.drroyspencer.com/2025/09/uah-v6-1-global-temperature-update-for-august-2025-0-39-deg-c/#comment-1713706
Astute readers may notice that he jumped on me to come to Puffman’s defense.
Let’s hope his victim bullying makes him happy.
Whatever thread he jumps in on, Willard always wants to change the topic from whatever it was to “DREMT’s behaviour”.
DREMT,
So now you’re citing yourself in yet another post to say “What I was REALLY talking about was.”
Let’s quote this one as well, then.
“That’s not really my claim, personally [can’t average fluxes]. My interpretation of Clint’s point #2 from his eleven-point criticism of the Earth’s energy budget is that you can average flux, mathematically (of course), but the result is “physically meaningless”.”
In what way?
“And, by that, it’s meant that average fluxes, as Gadden so helpfully pointed out up-thread, whilst thinking he was rebutting my argument (!), do not abide by the Stefan-Boltzmann Law. Since the average fluxes don’t abide by a physical law, they’re “physically meaningless”.”
So your point is really that “average fluxes don’t abide by physical laws.” Is it?
Well, they do for energy budgets with simple symmetrical objects. LIKE SPHERES. Dividing the solar flux by 4, gives you the area-averaged result for the output of a spherical b/b to be at thermal equilibrium with the incoming energy. That’s not physically meaningless, it is a calculation of radiative equilibrium and it is accurate. That doesn’t disobey S/B – the result is correct.
Can you always average flux like this? No. For more complicated geometries you need to calculate power rather than flux.
But for spheres (and plates and cubes and hemispheres), area-averaging incoming flux is fine, despite the nonsense that Clint spouts. Yes, it’s a shortcut. Yes, it’s ultimately relating flux to power, which IS conserved.
The physical law that must be obeyed here is the first law – the conservation of energy – and averaging fluxes as we have been doing satisfies that law, while averaging temperatures does not. The S/B non-linear relationship between temperature and flux doesn’t automate a preference for temperature, nor does area-averaging flux in simple geometries somehow contravene S/B. We’ve been doing that in every experiment we ever talked about, with plates, spheres and cubes, hemispheres etc.
So I’ve dealt with what you really meant – that averaging fluxes disobeys physical laws because of the S/B law.
Now, if you continue to say I’m missing the point, don’t link to yet another post saying something else. State clearly and for the record what point it is you mean. Alternatively, agree that I’ve just discussed what you really meant and perhaps reply to my comments.
barry tries, dishonestly, to pretend we’ve not been clear with him, from the very beginning, about what the point is, and what it isn’t. Yes, barry, as Clint pointed out from the moment you asked him to clarify, when he first gave you the example with the two surfaces, the problem is that when you sum and average different flux values, in the way that I also showed you in my first link, the resulting averaged flux value no longer relates correctly to a temperature value by the SB law. Averaged flux values do not abide by the SB law.
The shortcut of dividing the incoming flux to a sphere by 4, to get the outgoing flux, is not what the problem is. I don’t know how many times I have to tell you that…
DREMT,
“Yes, barry, as Clint pointed out from the moment you asked him to clarify, when he first gave you the example with the two surfaces, the problem is that when you sum and average different flux values, in the way that I also showed you in my first link, the resulting averaged flux value no longer relates correctly to a temperature value by the SB law.”
This was already covered in my previous post that you pretended missed the point. I quoted you:
“Averaging the two fluxes = 400 + 0 / 2 = 200 W/m^2.
Averaging the two temperatures = 290 + 0 / 2 = 145 K.
There you have it. The average flux, 200 W/m^2, converted to temperature using the SB Law, is 244 K. Totally different to the actual average temperature for the plate, of 145 K. That is because the SB Law does not apply to such averages.”
So you’ve just repeated yourself after falsely claiming I missed the point. This game is tiresome, DREMT. So I’ll just repeat what I said (for the umpteenth time).
“Your argument is, as I said: av temp =/= av flux THEREFORE av flux is invalid.
Which is a non sequitir.
You will never close the energy budget by averaging temperature. Try to do so with your example I’ve just quoted. Averaging the temperature and converting that to a flux value will leave you short of balancing the incoming energy every time. Temperature is the wrong metric to establish a radiative energy budget, because temperature has a non-linear relationship to radiative energy.”
You didn’t take up the challenge, I see.
“Averaged flux values do not abide by the SB law.”
Yes, they do for the objects we’ve been talking about. You are completely misstating the issue you are pointing to, which is the fact that the relationship between temps and fluxes are non-linear. This is the point you are using to try and substantiate the erroneous view that averaging fluxes is invalid.
If you DON’T convert flux to temperature, you can sum, multiply, divide and average and come up with valid results, especially for simple geometries.
To obtain the outgoing flux of a sphere you use the area as a divisor for the incoming flux. IOW, spread the incoming flux over 4 times the area – the area-averaged result will CORRECTLY give you the outgoing flux from a b/b sphere.
But hey – you go right ahead with your method of converting incoming flux to temperature, and averaging temperature. Then reconvert back to flux.
Let’s make it easy – go to your two-sided plate example. Average the temperature, convert to flux, and then explain how this results in a valid energy balance at equilibrium.
Go on. Show us how it SHOULD be done with this very simple geometry. Your insights will be fascinating.
Unless you choose to ignore the point for the umpteenth time…
I’m not the one playing games, barry.
“You will never close the energy budget by averaging temperature.“
It is not my argument, and never has been, that you can “close the energy budget by averaging temperature”. So, I do not need to take up your challenge. It’s a straw man.
Also, you should note, barry, that dividing the incoming flux for the Earth, by four, to get the outgoing flux, would give you 960 W/m^2 in and 240 W/m^2 out. Is that what you mean by “closing the energy budget”?
Of course DREMT is playing games, but it was worth it: at long last, he conceived a case in which there’s exactly 1 m² that is irradiated. He thus learned to *normalize*, incidentally a statistical operation. Presumably the source isn’t the Sun, for the solar constant is itself an average.
Let’s grant him the possibility not to average. Does it imply necessity? Not at all. He would still need to account for all the surface to balance things out. The rest of that object still receives nothing, i.e. 0W/m². That quantity represents irradiance too: he could have tried to make the same point he somehow still believes only him understand, using a totally dark object, one that receives *exactly* 0W/m² everywhere at all times. He could also have considered four beams on approximately 400 W on the fourth of each m² of the object. This may have tamed his righteousness a little.
However DREMT wishes to slice it, at best he made a pedantic point. The same kind of point as arguing that, in geometry, objects have only one surface. Astute readers would then observe that DREMT’s motte amounts to almost nothing. Alas, he can’t even succeed in getting that, for to receive 400W on one meter still equals receiving 100W on 4 meters. Watts add up. Meters add up. Every SI units add up. At least when done properly.
The only question that remains, after eight years on this, is – how will he keep his quibble alive? Perhaps I should ask an English teacher about this. Speaking of whom, if we say that an object has only one surface, then no wonder his best buddy tells him that irradiance is limited by it!
Willard, please try to post in the correct sub-thread:
https://www.drroyspencer.com/2025/09/uah-v6-1-global-temperature-update-for-august-2025-0-39-deg-c/#comment-1716879
[DREMT] I believe Willard’s incoherent nonsense was meant to be posted here.
[ALSO DREMT] please try to post in the correct sub-thread
Astute readers will notice that DREMT’s belief isn’t a belief anymore, about a comment he attests not being able to understand to boot. Perhaps he’s just playing dumb. Whatever.
He’s wrong anyway – that comment is placed where I wanted it. He might reply “but but but but but but aren’t you talking about the Very Intelligent thought experiment I just thought of?” The rejoinder would be: it’s important that DREMT learns to stop segregating what he says at one place and at the other.
Just like he did with his actual fake politeness, incidentally.
Besides, I want him out of my exchange with B4. He might reply “but but but but but but what about my Very Intelligent thought experiment?” The rejoinder would be: nobody cares about his gotchas, and we all know that DREMT tends to conflate what *he* wants to talk about with the topic of a sub-thread.
I’m trying to talk to barry, Willard.
[DREMT] I’m trying to talk to Barry
[FIRST COMMENT IN RESPONSE TO BARRY] barry immediately proves me right.
[NEXT COMMENT, INTERPOSING HIMSELF BETWEEN PUFFMAN AND BARRY] barry…before you disgrace yourself further and finish that sentence you started:
[THE COMMENT AFTER, AS A WAY TO IGNORE WHAT I SAID] Actually, barry, it is not only the fact that you made a mistake you have still not admitted to…it’s:
[AND THEN, DREMT AGAIN] barry continues to demonstrate his total misunderstanding of the issues.
DREMT is trying to talk with Barry really hard.
Perhaps it is Barry that is trying to talk with DREMT, and DREMT only trying to exploit that openness, like a Machiavellian would.
Yes, Willard, the blog understands that you dislike me. No need for you to go on about it in every single sub-thread.
“It is not my argument, and never has been, that you can “close the energy budget by averaging temperature”. So, I do not need to take up your challenge. It’s a straw man.”
So your defence of point 2 in Clint’s criticism of the validity of the Earth energy budget is disinterested in the validity of the energy budget.
No straw man from me – I’ve stuck to the topic. Whatever you’re on about is apparently a red herring.
My interpretation of Clint’s point #2 is what I said it is in the two comments I linked to, barry. My interpretation is not what you’re telling me it is. It does not involve “closing the energy budget” by averaging temperatures, taking that averaged value and then converting it to a flux value, because that involves the exact same problem as we encounter with “averaging flux”. As I acknowledge in the second of the linked comments:
“Either way, you can apply the same argument to temperatures. Average temperatures also do not abide by the SB Law, and can certainly be considered to be an “arbitrary construct”, especially since temperature is an intensive property.
But, of course, average temperatures can be very useful, for tracking changes to the Earth’s climate, for example. Being “physically meaningless” and an “arbitrary construct” doesn’t make them “useless”. It all depends on your point of view.”
So yes, you’re definitely attacking a straw man.
And no, it’s not a red herring, since averaged flux values are used in the Earth’s energy budget.
You seem to think taking the incoming flux, and using the shortcut of dividing by four to get the outgoing flux from a sphere is what is meant by “averaging flux”. I keep telling you that it isn’t what we’re criticising, but you won’t listen. There’s no point us arguing again about whether or not that shortcut really does involve averaging flux in any way, because you didn’t listen there, either, the first time. But, whether it does involve averaging flux or whether it doesn’t, that’s not what the complaint is about.
And, taking the incoming flux, and dividing by four to get the outgoing flux for a sphere is not the same thing as taking the incoming flux, and dividing by four to get an average of the incoming flux.
They pretend that they accept that two things are equivalent; then they waste eight years to imply that they are not the same.
Strange bunch.
Still interrupting, Willard?
DREMT,
The premise of the entire argument is Clint’s criticism of the Earth energy budget.
If you area average the incoming flux, dividing it by 4, you will get the correct outgoing flux for a blackbody sphere to balance the energy budget. The math is clear and correct.
Just as area averaging the incoming flux over a two-sided plate means dividing it by two, or a cube by 6, gets the correct result for outgoing flux.
This in no way fails to “abide by the S/B law,” an assertion entirely without merit. The only issue with the S/B law is if you convert flux to temp/temp to flux while averaging – which does not occur in assessing Earth’s energy budget
If, as I said ages ago and many times, you sum the fluxes, accounting for area, you will end up with 0: satisfying the 1st law. The maths is sound for these symmetrical geometries, as it relates flux to power. Call it a ‘shortcut’ or whatever you want, but you can sum, divide, average and multiply flux to get correct results, when working with these simple geometries.
Clint’s claims otherwise were about the spherical Earth. The only argument I’ve seen that has any substance is about the non-linear relationship between temperature and flux. But as there is no such conversion to temp when working out the energy budget, this inequality does not occur.
Averaging flux respects energy conservation. Averaging temperature does not. It’s as simple as that. Clint is wrong.
If this doesn’t address whatever it is you are arguing, you need to be clearer than you have been.
“The premise of the entire argument is Clint’s criticism of the Earth energy budget.”
Yes, barry. Indeed.
“If you [take] the incoming flux, dividing it by 4, you will get the correct outgoing flux for a blackbody sphere to balance the energy budget. The math is clear and correct.”
And, agreed with by Clint. Many, many times he has asserted a sphere receiving 960 W/m^2 emits 240 W/m^2. So, quick sense check – can this be what Clint means by “averaging flux”? No, obviously not, barry. As I have told you now, at least four or five times, dividing the incoming flux to a sphere by 4 in order to get the outgoing flux is not what the complaint is about. And, is a sphere receiving 960 W/m^2 and emitting 240 W/m^2 really what is represented in the Earth’s energy budget, barry? No. A rotating sphere receiving 240 W/m^2 and emitting 240 W/m^2 is what ends up represented in the Earth’s energy budget. Could it be that they’re dividing the incoming flux by 4 to get the averaged value for the incoming flux? Why yes, it could. 240 W/m^2 is a spatially and temporally averaged figure for irradiance for the Earth. Actually averaged, not just what you think of as averaging.
“Just as [taking] the incoming flux over a two-sided plate [and] dividing it by two, or a cube by 6, gets the correct result for outgoing flux.”
Sure thing. The shortcuts work. Not what the complaint is about.
“This in no way fails to “abide by the S/B law,” an assertion entirely without merit.”
Yet it has complete merit for what is being discussed – an averaged flux value, unlike the values you are talking about, does fail to abide by the S/B Law. Thanks to Hölder’s inequality.
“The only issue with the S/B law is if you convert flux to temp/temp to flux while averaging – which does not occur in assessing Earth’s energy budget”
The issue here is whether the value is an averaged flux value. As far as I’m aware, most (all?) of the values in the Earth’s energy budget are averages.
“If, as I said ages ago and many times, you sum the fluxes, accounting for area, you will end up with 0: satisfying the 1st law.”
There is “summing” and then there is summing. You can tell yourself – again, as a shortcut – that “summing” the output from the two sides of the plate equals the input to the plate, as a quick sense check. However, if you actually sum the output from the two sides of the plate, and declare the plate is emitting 400 W/m^2, in total, or however else you want to put it…you’d be wrong. The plate emits 200 W/m^2. Not 400 W/m^2. Please tell me you have at least learned that, by now.
“The maths is sound for these symmetrical geometries, as it relates flux to power. Call it a ‘shortcut’ or whatever you want, but you can sum, divide…and multiply flux to get correct results, when working with these simple geometries.”
In a way, you can. But, in the way Clint means? Maybe not. I’m not getting into anything else other than “averaging flux”, though. You can talk to Clint about what he really means with his “dividing flux” criticism. I doubt it is what you think it is.
“Clint’s claims otherwise were about the spherical Earth. The only argument I’ve seen that has any substance is about the non-linear relationship between temperature and flux. But as there is no such conversion to temp when working out the energy budget, this inequality does not occur.”
It’s not about converting the values. It’s about the fact that averaged flux values do not abide by the S/B law – in other words, if you were to convert them to temperature, it would be the “wrong temperature”. You don’t have to actually convert them to temperature in order for the problem to exist, barry.
“Averaging flux respects energy conservation. Averaging temperature does not. It’s as simple as that. Clint is wrong.”
Clint isn’t wrong, as I’ve hopefully now explained once and for all.
“If this doesn’t address whatever it is you are arguing, you need to be clearer than you have been.”
I look forward to seeing how you will misinterpret what I’ve said, this time.
I’ll explain a little further, as there could still be confusion remaining.
With all the examples we’ve discussed in the past, barry, in talking about the Green Plate Effect, an important simplifying assumption has been that the various objects – plates, cubes, spheres, shells etc – are all “perfectly conducting”. The reason this is important is that the emitted flux won’t then vary at all across the surface area. So, the entire surface area of a perfectly conducting blackbody sphere receiving 960 W/m^2 emits 240 W/m^2 uniformly over its entire surface area. This means that whether you consider that 240 W/m^2 to be an average, or not, makes no difference in terms of Hölder’s inequality and the issue of averaging flux. Since, if you took, for example, five samples of the emitted flux from any points on the sphere, they would all be 240 W/m^2. So, the average of the five samples will also be 240 W/m^2. Averaging makes no difference, here. So, Clint’s issue simply doesn’t apply.
Hopefully you will now fully understand why Clint’s point #2 from his critique of the Earth’s energy budget does not affect any of our previous discussions about the GPE, at all.
“It’s not about converting the values. It’s about the fact that averaged flux values do not abide by the S/B law – in other words, if you were to convert them to temperature, it would be the “wrong temperature”. You don’t have to actually convert them to temperature in order for the problem to exist, barry.”
Yeah, I understood you all along.
Av temp =/= av flux THEREFORE energy budgets are invalid
I said that the non linear relation between flux and temperature is the crux of your issue and it is. You’ve just spelled it out, as much as you’d like to pretend it’s something else.
It may have escaped your attention that I’ve acknowledged the non-linear relationship from the very beginning, and will point out again that in an ENERGY BUDGET the inequality doesn’t occur, and the object of the exercise is NOT to find the surface temperature of the planet.
The effective radiating temperature isn’t even on the surface, it’s at the TOA.
Earth energy budgets are done to find the energy imbalance, not calculate local or global surface temperature.
This fixation with Jensen’s inequality is a red herring. Balancing energy budgets without the completely unnecessary step of converting and averaging temperature satisfies the laws of physics.
“Yeah, I understood you all along.”
Erm…no you didn’t, barry.
“Av temp =/= av flux THEREFORE energy budgets are invalid”
Well, that’s still not quite what’s being said, barry. What’s being said is that averaged flux values don’t abide by the SB Law, hence are “physically meaningless” or are “arbitrary constructs”. I never personally said that meant they were “useless” or single-handedly made energy budgets “invalid”. Clint’s point #2 is just one criticism out of 11, you know.
“I said that the non linear relation between flux and temperature is the crux of your issue and it is. You’ve just spelled it out, as much as you’d like to pretend it’s something else.”
Of course it’s the crux of the issue, as was explained to you repeatedly, from the very beginning, when Clint clarified by giving you the example with the two surfaces. Why would I be pretending it’s something else!?
“It may have escaped your attention that I’ve acknowledged the non-linear relationship from the very beginning, and will point out again that in an ENERGY BUDGET the inequality doesn’t occur, and the object of the exercise is NOT to find the surface temperature of the planet. The effective radiating temperature isn’t even on the surface, it’s at the TOA.”
barry, once again…the problem exists whether you actually convert the average flux values to temperature or not. The inequality does exist without converting to temperature and so does occur in the energy budget. I’m not suggesting that the object of the exercise is to find the planet’s surface temperature!
“This fixation with Jensen’s inequality is a red herring. Balancing energy budgets without the completely unnecessary step of converting and averaging temperature satisfies the laws of physics.”
Again with the straw man that anyone is suggesting “converting and averaging temperature”! barry…why do you never listen?
“Well, that’s still not quite what’s being said, barry. What’s being said is that averaged flux values don’t abide by the SB Law”
Yes they do, and that’s exactly what you’ve been saying. The S/B law has no effect on averaging, dividing or summing fluxes.
The only time there is an issue is if you convert to temp and then average the temps. Now you have an inequality.
“the problem exists whether you actually convert the average flux values to temperature or not.”
Nope. Completely and utterly false.
“The inequality does exist without converting to temperature and so does occur in the energy budget”
No, the inequality does not OCCUR if you do not convert to temps. You can satisfy the energy budget if you stick with flux. You CANNOT satisfy the energy budget is you contravene Jensen’s inequality by converting to temp and averaging.
Your view is definitely: av flux =/= av temp THEREFORE energy budgets are invalid.
That’s your view, bub. Stop denying it. You don’t have a view unless you posit the non-linear relationship between flux and temperature. It’s the crux of your ridiculous ‘argument’.
And it is effectless when you don’t actually convert to temperature.
barry, you have no idea what you’re talking about, yet you’re certain you’re correct!
Averaged flux values do not abide by the SB Law. Obviously, you need to take different (varying) flux values, sum them, average them, and then you will end up with a number. That number no longer abides by the SB Law in that if you converted it to temperature in the usual way, it would be the “wrong temperature” value compared to the actual average temperature. Yet, clearly you don’t actually need to convert them to temperature for that to be true. It’s true, regardless.
I explained here:
https://www.drroyspencer.com/2025/09/uah-v6-1-global-temperature-update-for-august-2025-0-39-deg-c/#comment-1717028
that the flux values need to vary over the surface you are averaging them on. Obviously if the surface is of completely uniform temperature and thus emission then averaging the fluxes makes no difference. But, the Earth’s surface is anything but uniform in temperature and thus emission. If, like in my linked comment, you took five samples of emitted fluxes from five random locations but on the Earth’s surface, instead, you are now going to have five different flux values and your average of those values will no longer abide by the SB Law.
“Averaged flux values do not abide by the SB Law. Obviously, you need to take different (varying) flux values, sum them, average them, and then you will end up with a number. That number no longer abides by the SB Law in that if you converted it to temperature in the usual way, it would be the ‘wrong temperature’ value compared to the actual average temperature”
av flux =/= av temp THEREFORE av flux is invalid
That remains your argument, even when you try to complain it is not.
There is no inequality without the conversion. If you do not deal in temps there is no problem.
Did you know that if I divide a number by 0 then it has a problematic answer?
According to your twisted logic, that means that other dividing operations are invalid because of this.
BECAUSE EVEN IF YOU DON’T DIVIDE BY ZERO, THE ISSUE IS THAT IT IS POSSIBLE TO DO SO AND GET THE ‘WRONG’ ANSWER.
And that is really as silly as you have become.
The red herring is the non-linearity of flux to temp through S/B. As this conversion does not happen in energy budgets, the inequality doesn’t apply.
Any more than dividing is illegal because if you do it by zero you get “wrong” results.
As long as you don’t do the action, you don’t have the problem.
That will remain true no matter how many times you weirdly try to claim that the inequality exists even without the conversion, because it still COULD happen if you DID perform the conversion.
That is a spectacularly specious argument.
“I explained here:
https://www.drroyspencer.com/2025/09/uah-v6-1-global-temperature-update-for-august-2025-0-39-deg-c/#comment-1717028
that the flux values need to vary over the surface you are averaging them on. Obviously if the surface is of completely uniform temperature and thus emission then averaging the fluxes makes no difference. But, the Earth’s surface is anything but uniform in temperature and thus emission.”
For the energy budget, energy in must equal energy out in equilibrium. This must happen whether or not the surface is a uniform temperature.
Convert to temperatures and average them and you will not balance the budget.
Average flux over area and you will get a balanced energy budget.
Let’s make our plate grey on the side away from the sun. It has an emissivity of 0.5.
Our plate now emits 133.33 W/m2 from the grey side, and 266.66 W/m2 from the sun-side.
This balances incoming energy, and all I did was average the incoming over the entire surface, and then ensure one side emits twice the flux of the other.
133.33 + 266.66 = 400
There is no problem here. There is no problem integrating flux over area with a sphere. No laws are broken, not SB, not nothing. In fact, the 1st law is satisfied.
You’re all wrong, DREMT.
barry, do you have any other straw men to bash today? This has nothing to do with 1LoT. Nothing. And, for the 25th time, nobody is suggesting converting flux values to temperature values, averaging the temperature values, and then converting the resulting average temperature back to a flux value. Nobody. OK?
An averaged flux value does not abide by the SB Law. Thus, it is “physically meaningless”.
That’s it. There’s nothing more to it than that.
“And, for the 25th time, nobody is suggesting converting flux values to temperature values, averaging the temperature values, and then converting the resulting average temperature back to a flux value. Nobody. OK?”
Nobody?
barry: “I said that the non linear relation between flux and temperature is the crux of your issue and it is”
DREMT: “Of course it’s the crux of the issue”
Well dear, you find out about this inequality by “converting flux values to temperature values, averaging the temperature values,” and seeing the difference when they are converted to the same units – or by “converting the resulting temperature back to a flux value.”
You’re going around and around in circles, saying the same thing over and over while also saying you’ve been misunderstood. You’ve been understood the whole time, you’re just trying to land a punch with marshmallow hands.
“Our plate now emits 133.33 W/m2 from the grey side, and 266.66 W/m2 from the sun-side…”
…with an averaged emission for the plate overall of 200 W/m^2, which converts to the “wrong temperature” for the plate, of 244 K. With both sides of the plate at 262 K, the actual average temperature for that plate would be 262 K. The averaged flux value, 200 W/m^2, does not abide by the SB Law.
“An averaged flux value does not abide by the SB Law. Thus, it is ‘physically meaningless’.”
Sure it does.
I’ll remind you that “nobody is suggesting converting flux values to temperature values, averaging the temperature values, and then converting the resulting average temperature back to a flux value.”
Great! No one is suggesting we do the action that creates the inequality. That is no longer in the picture!
Now – explain to me how averaging fluxes fails to abide the S/B law without converting to temperature.
You just said no one is suggesting we do this. So let’s see you explain how averaging fluxes breaks S/B law-without referring to the non-linearity of temp and flux.
“with an averaged emission for the plate overall of 200 W/m^2, which converts to the “wrong temperature” for the plate, of 244 K. With both sides of the plate at 262 K, the actual average temperature for that plate would be 262 K. The averaged flux value, 200 W/m^2, does not abide by the SB Law.”
As I said way upthread, you have given deference to av temps over av flux with no justification.
Why doesn’t the averaged temp break the S/B law and the averaged flux doesn’t?
There’s no answer to that but more rhetoric, more bald, unexplained assertions.
As I also said way upthread, neither is more correct or valid, you use either for a different purpose.
Your bias is bias.
“with an averaged emission for the plate overall of 200 W/m^2, which converts to the ‘wrong temperature’ for the plate, of 244 K. With both sides of the plate at 262 K, the actual average temperature for that plate would be 262 K. The averaged flux value, 200 W/m^2, does not abide by the SB Law.”
Both the av temp and the ov flux “do not abide by the S/B law,” as both are at odds with the other due purely to the non-linear inequality.
But you favour, without explanation, av temp over av flux. I maintain:
av temp =/= av flux THEREFORE av flux is invalid
Is your entire argument.
I’m going to guess you will make some argument from incredulity to try to pad your bias for av temp over av flaux. Right now you just have assertion.
But the averaged flux abides by the 1st Law. Therefore…
The average temperature does not abide by the S/B Law.
There is no good reason why your statement about flux is any more valid than the one above.
You lack proper argumentation. You are slipping and sliding.
barry asks “Nobody?”
That’s correct, barry. Nobody is suggesting “closing the energy budget” by converting flux values to temperature values, averaging the temperature values, and then converting the resulting temperature to a flux value. Please, for the 26th time, finally hear this.
barry quizzes, in a poorly-written and confused way:
“Why doesn’t the averaged temp break the S/B law and the averaged flux doesn’t?”
Well, barry, an averaged temperature value also doesn’t abide by the S/B Law, for the same reason an averaged flux value doesn’t abide by the SB Law. As you will note, I said way back here:
https://www.drroyspencer.com/2025/09/uah-v6-1-global-temperature-update-for-august-2025-0-39-deg-c/#comment-1715760
“Either way, you can apply the same argument to temperatures. Average temperatures also do not abide by the SB Law, and can certainly be considered to be an “arbitrary construct”, especially since temperature is an intensive property.
But, of course, average temperatures can be very useful, for tracking changes to the Earth’s climate, for example. Being “physically meaningless” and an “arbitrary construct” doesn’t make them “useless”. It all depends on your point of view.”
“But, of course, average temperatures can be very useful, for tracking changes to the Earth’s climate, for example. Being ‘physically meaningless’ and an ‘arbitrary construct’ doesn’t make them ‘useless’. It all depends on your point of view.”
So av temps break the S/B law but can be useful?
No, av temps don’t break the S/B law, any more than av flux does. Only the conversion causes problems in certain contexts.
But, of course, average flux can be very useful, for determining the Earth’s energy budget, for example. Being ‘physically meaningless’ and an ‘arbitrary construct’ doesn’t make them ‘useless’. It all depends on what you are trying to achieve.
(Of course, ‘arbitrary construct’ is incorrect. They are ‘useful’. Not arbitrary)
1) An averaged flux value does not abide by the SB Law. Only the “raw” data does.
2) An averaged temperature value does not abide by the SB Law. Only the “raw” data does.
3) I never said either averaged flux values or averaged temperature values are “useless”.
Those are the facts, barry.
Clint’s point #2 was only a minor point. 1 point out of 11. Blown out of all proportion by trolls who insist that “Clint must be wrong”.
It’s taken you, what, two months to even get close to understanding his point!
P.S: if you want to keep pushing back against 1) and 2) from my previous comment, barry, then argue with Gadden:
https://www.drroyspencer.com/2025/09/uah-v6-1-global-temperature-update-for-august-2025-0-39-deg-c/#comment-1714945
I’ve understood his point and yours all along and pointed out the problem with it ages ago. You’ve tried to keep his criticism alive but ultimately nothing new has been said. Averaging flux for an energy budget is fine as long as you don’t use averaged temperatures during the analysis.
“An averaged flux value does not abide by the SB Law. Thus, it is “physically meaningless”…”
“With both sides of the plate at 262 K, the actual average temperature for that plate would be 262 K. The averaged flux value, 200 W/m^2, does not abide by the SB Law….”
“Well, barry, an averaged temperature value also doesn’t abide by the S/B Law, for the same reason an averaged flux value doesn’t abide by the SB Law… But, of course, average temperatures can be very useful, for tracking changes to the Earth’s climate, for example. Being “physically meaningless” and an “arbitrary construct” doesn’t make them “useless”.”
And using av flux for energy budgets is just fine, too. You can call it “physically meaningless,” an “arbitrary construct,” or even a “shortcut,” but that doesn’t make them useless.
You have nowhere left to go, because you can’t explain why av flux is not fit for the purpose of assessing an energy budget without referring to the non-linearity issue – which you’ve just admitted doesn’t affect av temperatures for the purpose of tracking changes. As long as you don’t convert all the temps to flux and then average them and convert back to temperature, you won’t run into the inequality issue.
And you won’t if you only use flux for energy budgets.
Clint’s criticism is dead.
“I’ve understood his point and yours all along“
False, barry. In fact, that’s quite an outrageous lie. You still don’t even understand it now, since you say:
“As long as you don’t convert all the temps to flux and then average them and convert back to temperature, you won’t run into the inequality issue.“
The three facts are as I listed previously. If you dispute the first two, argue it out with Gadden. If you dispute the third fact, link to where you believe I’ve stated that average fluxes are “useless”.
The facts are the facts. Of course, you are going to spin it that there’s no problem with the energy budget. Naturally, Clint will spin it that there is a problem.
Me? I’m here to make sure you stop with the misrepresentations and false accusations, and I’m here to point out another, different argument against averaging flux:
https://www.drroyspencer.com/2025/09/uah-v6-1-global-temperature-update-for-august-2025-0-39-deg-c/#comment-1713791
which nobody has any real answer to. That’s why all the attention has been diverted to pushing back on things that shouldn’t even be disputed.
Gadden’s conclusion:
“all it means is that the voltage-to-power equation doesn’t apply to averages.”
That’s right – if you convert during the analysis you may end up with diverging results.
So don’t convert. Problem is gone.
Gadden also said:
“In short, DREMT doesn’t understand nonlinear relationships.”
You don’t understand that the non-linear relationship doesn’t apply in an energy budget, because the S/B law isn’t applied. The S/B law is only applied when converting to temperature.
Your other point has been dealt with by others, and you dropped it. No follow up, because who the F is going to take an argument about a laser burning holes in a wooden sphere seriously. Postma may think that destroying the sphere is a salient point, but it’s just a silly extemporization on his argument from incredulity. Which for some reason you find more credible than standard physics texts.
Postma doesn’t seem to realize that the atmosphere is like an infinite plane over the surface, tangent to the atmosphere at every location. But at least he realises: “You can only make flux and energy equivalent for energy conservation if the input and output surface area is identical…”
Or if you make it mathematically identical, which is the mental shortcut we’ve all taken whenever we understood that the output from a two-sided b/b plate must sum to the input from one side.
“all the attention has been diverted to pushing back on things that shouldn’t even be disputed”
:eyeroll:
Funny how everyone seems to miss your point the same way.
barry, Gadden made it clear that the SB Law doesn’t apply to averages, which is exactly the same thing as saying that averages do not abide by the SB Law. Why do you keep wriggling so much on this? An averaged radiative flux value does not generally abide by the SB Law…the only exception being when the object’s surface is exactly the same temperature at every location. Which is what I explained to you here:
https://www.drroyspencer.com/2025/09/uah-v6-1-global-temperature-update-for-august-2025-0-39-deg-c/#comment-1717028
and, that’s why Clint’s criticism doesn’t affect any of our previous discussions on the GPE. You’ve yet to acknowledge that you were wrong to say it did.
And, you’ve yet to acknowledge your mistake here:
https://www.drroyspencer.com/2025/09/uah-v6-1-global-temperature-update-for-august-2025-0-39-deg-c/#comment-1714049
in supporting ChatGPT in its error. The plate does not emit 400 W/m^2 “in total” or indeed from any way of looking at it. The plate emits 200 W/m^2.
Everyone has been pushing back on things that shouldn’t even be disputed, barry. For example, I’ve argued that flux is not conserved, and I’ve received no end of pushback for it, despite being correct.
And no, nobody has provided any substantive rebuttal of Postma’s arguments. It’s been glossed over completely, lost in the back and forth over things that shouldn’t even be getting disputed! I certainly haven’t dropped it, having linked to the comment many times throughout this month’s comments.
I bet barry still thinks, “if you don’t convert, there’s no problem”.
He falsely accuses me of not understanding non-linear relationships, whilst he proves that it’s actually him that doesn’t understand them!
He’s had two months to get to grips with this criticism and he still doesn’t get it.
Unbelievable.
Our Sky Dragon cranks are melting down.
This simple problem destroys their nonsense:
https://www.drroyspencer.com/2025/09/uah-v6-1-global-temperature-update-for-august-2025-0-39-deg-c/#comment-1716333
Watch Puffman wriggle.
Willard, the temperature of the plate remains the same, emitting 200 W/m².
Now, keep weaseling out of answering:
The flat plate is receiving 300 W/m² from one side and 100 W/m² from the other side. What is its final temperature?
Prove you’re a good teacher, Puffman –
[PUFFMAN’S PUPIL] As long as it’s understood that there’s only one heat source irradiating the sphere, then there’s no way for you to wriggle out of this.
If you find the mistake in that statement, I’ll tell you the three mistakes you made in yours.
Deal?
Keep weaseling, Willard.
That’s all you can do.
Here’s a hint, Puffman: temperatures don’t emit.
Keep weaseling, Willard.
Perhaps I need to dumb it down, Puffman.
Does your answer depend on the number of energy sources?
Keep weaseling, Willard. You’re proving me right, again.
I love being right….
Your self-fulfilling fantasies appear futile, Puffman.
Riddle me this:
https://web.archive.org/web/20160807095837/http://www.drroyspencer.com/2016/07/the-warm-earth-greenhouse-effect-or-atmospheric-pressure/#comment-218079
Pray tell more about “heat energy”, but without using your usual silly analogies.
Willard, I answered your simple question, clearly and successfully. Now, you need to answer mine, instead of weaseling out of it:
The flat plate is receiving 300 W/m² from one side and 100 W/m&3xB2; from the other side. What is its final temperature?
Hey Puffman, riddle me this –
https://web.archive.org/web/20170917023334/http://www.drroyspencer.com/2017/09/uah-global-temperature-update-for-august-2017-0-41-deg-c/#comment-262801
Which schools gave you full points for answers void of calculations, and where’s the textbook in which you found material that has an emissivity of 1 but isn’t a blackbody?
Last chance Willard. Answer the simple question or admit you don’t know how.
The flat plate is receiving 300 W/m² from one side and 100 W/m² from the other side. What is its final temperature?
Last chance, or maybe you just want to be a weasel.
Hey Puffman, riddle me this –
https://web.archive.org/web/20171015075240/http://www.drroyspencer.com/2017/10/uah-global-temperature-update-for-september-2017-0-54-deg-c/#comment-268518
Where has SkepticGoneWild gone, and why are you trying to hide by defining flux as flux: would it be energy, by any chance?
Another point from Willard’s list:
“Gets caught repeatedly saying I did not answer a question while I answered it many times. Then switched to a True Scotsman. Then pretended his rhetorical question was a real question.”
bites the dust. Clearly I’m correct – Willard really does not ever answer questions. That’s been my experience with him, generally. He just does the kind of crap you see on this thread.
Willard passes on attempting the simple problem. Like an immature brat, he wants to ask questions but doesn’t want to answer any. So when asked, he has to weasel out of answering.
Kids these days….
But this problem is interesting enough to spend some time on.
If the plate in space receives 400 W/m² on one side only, the result will be the plate emitting 200 W/m² from each side, at a temperature of 244K. If the plate receives 200 W/m² from each side, the result will be the same.
But, if the plate receives 300 W/m² from one side and 100 W/m² from the other side, the result will be different. The plate will reach a temperature of 227K, emitting 150 W/m² from both sides.
Note that in each situation, the energy received is the same — 400A, where “A” is the area of the plate. But the final temperatures are different due to the different levels of incoming flux.
This concept is not understood in “climate science”. In “climate science”, the false belief is that all flux is treated as energy. But, in reality, the level of flux makes a difference. That’s why you can’t boil water with ice cubes.
Hey Puffman, riddle me this –
https://www.drroyspencer.com/2025/09/uah-v6-1-global-temperature-update-for-august-2025-0-39-deg-c/#comment-1716101
Do you think DREMT will continue to lie, insult and misrepresent by “forgetting” to cite the specific comment to which he’s supposed to refer?
Willard is weaseling again.
He can’t help himself. He’s a weasel.
Sure, this is what I was referring to:
https://www.drroyspencer.com/2025/09/uah-v6-1-global-temperature-update-for-august-2025-0-39-deg-c/#comment-1714791
People can read through from there. And, they can see from this thread that I’m correct. You do anything in your power to avoid answering questions.
If DREMT can’t can’t understand the point, there’s no need to feel bad. Plenty of readers can read for themselves will get it, and realize that he is lying again.
As for Puffman, he looks at 400/0 plate, and gives the same answer as for a 200/200 plate. But but but:
https://www.drroyspencer.com/2025/09/uah-v6-1-global-temperature-update-for-august-2025-0-39-deg-c/#comment-1716398
So beautiful. But not as beautiful as DREMT enabling this!
The only people proven to lie around here are you and Ball4, Willard. No need to keep falsely accusing me of lying.
DREMT constantly lied during the month, and he is ripping off his shirt instead of confronting Puffman on their diverging solutions to the various setups: 400/0, 300/100, 200/200, one or many sources, etc.
He insists they should be called definition, but that’s more ignorance than lie.
No, Willard. I do not “insist they should be called definition”. That was another misrepresentation from you from further upthread. I even corrected you on that at the time. The various stipulations are not definitions.
September 22, 2025 at 11:59 PM:
“By definition, the irradiance for the plate can only be 400 W/m^2.”
September 23, 2025 at 9:57 AM
“By definition, the irradiance for the plate is 400 W/m^2.”
September 23, 2025 at 10:33 PM:
“So, like I said: by definition, the irradiance for the plate is 400 W/m^2.”
September 24, 2025 at 10:32 AM:
“by definition, the irradiance for the plate is 400 W/m^2.”
September 24, 2025 at 2:32 PM:
when I say “by definition, the irradiance for the plate is 400 W/m^2”,
September 25, 2025 at 8:25 AM
“the irradiance for the plate, by definition, is 400 W/m^2”
September 25, 2025 at 9:57 AM:
“The irradiance for the plate is 400 W/m^2, by definition.”
September 26, 2025 at 12:39 PM:
“by definition.”
September 27, 2025 at 4:12 PM:
Asking Google: […] Like I said: by definition, the irradiance for the plate is 400 W/m^2.
September 28, 2025 at 10:17 AM:
“by definition.”
September 28, 2025 at 3:54 PM:
“by definition”
September 29, 2025 at 12:11 AM:
“I do not “insist they should be called definition”.
***
Perhaps DREMT should ask Google after how many “by definition” he will start insisting.
Meanwhile, he’s stuck with trying to dodge his confrontation wih Puffman on their diverging solutions to the various setups: 400/0, 300/100, 200/200, one or many sources, etc.
https://www.drroyspencer.com/2025/09/uah-v6-1-global-temperature-update-for-august-2025-0-39-deg-c/#comment-1716163
“September 24, 2025 at 2:32 PM
Obviously Willard is well aware that when I say “by definition, the irradiance for the plate is 400 W/m^2”, the “definition” I am referring to is the definition of “irradiance” itself. I mean, I clarified that for him here:
https://www.drroyspencer.com/2025/09/uah-v6-1-global-temperature-update-for-august-2025-0-39-deg-c/#comment-1716061
He’s just trolling again.”
Graham D. Warner gets caught lying about not having insisted on passing a setup stipulation as a definition.
He also gets caught once again appealing to his best buddy, which he still misnames.
And he still ignores that he needs to reconcile his calculations with Puffman’s on various plate setups.
And then Graham D. Warner whines about feeling disrespected.
An utter disgrace.
I did not “insist on passing a setup stipulation as a definition”, Willard. The definition I was always referring to was the definition of “irradiance”, not a setup stipulation. A setup stipulation is not a “definition”.
And so DREMT is verging on gaslighting once again.
What he presents as a definition is not a definition.
And he indeed insisted to call it a definition.
DREMT is not a good person.
Well, that’s one way for you to concede you were wrong, Willard.
Proven gaslighting and notorious climate crank DREMT does his thing.
Meanwhile, he still acts as if his best buddy confirms his contention that an object can have only one side, and he is weaseling away out of confronting Puffman on their diverging solutions to the various setups: 400/0, 300/100, 200/200, one or many sources, etc.
Clint answered your question correctly here:
https://www.drroyspencer.com/2025/09/uah-v6-1-global-temperature-update-for-august-2025-0-39-deg-c/#comment-1716398
So, where is the promised “destroys their nonsense”?
You weren’t just trolling again, were you?
DREMT is gaslighting once again.
Here’s the relevant bit from the relevant comment:
https://www.drroyspencer.com/2025/09/uah-v6-1-global-temperature-update-for-august-2025-0-39-deg-c/#comment-1716564
While Puffman presented this setup as an original riddle, it actually comes from Nate:
https://www.drroyspencer.com/2025/09/uah-v6-1-global-temperature-update-for-august-2025-0-39-deg-c/#comment-1716101
Readers will see for themselves, DREMT tried to stonewall Nate by appealing to his best buddy. As if his best buddy understood that DREMT was suckering it by omitting the Dark Side of the object.
DREMT won’t support Puffman’s “solution”. He prefers to stonewall instead.
Why is that?
Willard: why can you not just accept that the plate receives 400 W/m^2 and emits 200 W/m^2? Flux in (W/m^2) does not equal flux out (W/m^2), but energy (J) balances, because the surface area receiving the flux is half that of the surface area it leaves from.
Why do you go to the ends of the Earth to try to pretend there is something wrong with that?
You do not average irradiance over surface area not receiving the irradiance. So, the irradiance for the plate is not 200 W/m^2 averaged over both sides of the plate. It’s 400 W/m^2 on the side of the plate that’s actually irradiated!
If the plate were rotating, then you would have some justification for averaging the irradiance over the entire surface area of the plate, because over time all of the plate’s surface area would be irradiated…but it’s not rotating. So the dark side is never irradiated.
12:39 am: “So the dark side is never irradiated.”
No. The BP dark side is irradiated by space which for convenience is set to 0 so (400+0)/2 as shown in Eli’s 2017 equation.
Why can’t DREMT accept that flux is energy flux?
Why can’t he accept that by “surface” we are referring to the surface of the object we are modelling, not half of it?
Why can’t he accept that his best buddy doesn’t support the rule he made up?
Why can’t he accept that Puffman arrived at:
by breaking the rule he just made up?
Why can’t he accept that everybody understand what he’s saying, and that he’s just stonewalling?
So many questions, so little time.
https://rabett.blogspot.com/2017/10/an-evergreen-of-denial-is-that-colder.html?m=1
“We start with a simple case, imagine the Earth is just a plate in space with sunlight shining on it. Maybe 400 W/m^2”
End of story.
DREMT finally gets it, sunlight one side space shining on the other! Yes, end of story (400+0)/2
Perhaps “plate” means plate, not “only-one-side-of-a-one-sided object”.
And DREMT is still stuck dodging Puffman’s inequalities:
400+0 = 200+200
400+0 != 300+100
200+200 != 300+100
Ball4 doesn’t seem to understand that Eli would have had to specify if for some illogical reason he had chosen to average irradiance over the whole plate. He would have had to have noted that the irradiance, though 400 W/m^2 (not averaged), was averaged over the whole plate to become 200 W/m^2 (averaged). Then the big red arrow would be labelled “200 W/m^2”…
…but none of that happened, because Eli did not average the irradiance over the whole plate.
Since people keep claiming I’m “making up rules”, let’s put it to the test.
Let’s say the plate is 2 m^2 in area each side, for a total surface area of 4 m^2. On the source-facing side, a narrow beam of energy irradiates exactly 1 m^2 of that side of the plate, only, with 400 W.
What is the irradiance, in W/m^2?
No DREMT 8:06 am, you had it right the first time, Eli did average the irradiance over the whole plate in DREMT’s quote: “We start with a simple case, imagine the Earth is just a plate in space with sunlight shining on it. Maybe 400 W/m^2”
End of story; in Eli’s eqn. the BP (for Earth) has two sides of irradiation: (400 from sunlight + 0 from space (for convenience))/2 in Eli’s eqn.
That’s where Eli’s 2 comes from but very… VERY slow to learn DREMT has missed that for over 8 years now; 8 years of study down the drain.
Ball4 still gets it wrong. Perhaps he can be the first to try answering my question?
People are telling me I don’t English very well.
Can a native speaker help me here:
Does “plate” mean plate, or does it mean no, only half of the plate, because there’s a rule I never made up – look at this new puzzle?
DREMT’s question is incomplete. Study harder on Eli’s example for completeness. DREMT is going for 9 years of study down the drain.
A hint for our two proven liars.
Typing this question into Google search:
Can irradiance be averaged over surface area not receiving it?
Returns:
“No, irradiance is a measure of power per unit area on the surface receiving it, so it cannot be averaged over a surface that is not receiving the radiation.“
So they might want to bear that in mind when preparing their answers.
Each time you ask, you get a slightly differently-worded answer, but always in the negative and following the same line of logic. Thought I should include this one, for posterity:
“No, irradiance cannot be meaningfully averaged over a surface area that is not receiving it. Irradiance is a measure of radiant power per unit area, specifically the power of electromagnetic radiation received by a surface. By definition, an area receiving zero radiation has an irradiance of zero. Including that zero-irradiance area in an average would mathematically lower the overall value, but the result would be physically meaningless.”
Perfect!
However, DREMT 12:31 am: “Google simply gives the wrong answer”.
Now DREMT (being of limited ability in this field) reverses course at 1:26 pm, 2:06 pm & resorts to using Google search!
DREMT could enlighten the blog & Google search by posting up a physically meaningful example to use in DREMT’s question for any possible surface area “receiving zero radiation”.
Remember, Eli’s 2017 example had a plate surface irradiated by solar on one side and other side specifically irradiated by space.
That DREMT has outsourced his judgment can only be beneficial to him.
Here’s a result of an NSS search on this page:
Another:
One last:
Looks like the last example of NSS is naturally stuck on stupid.
Ball4 – all AI bots currently seem to be poor at calculating emitted fluxes in problems unless you are very careful with your wording in what you ask. That’s something we’ve all learned over the past few months. That doesn’t mean that you’re going to get the wrong answer with something simple and logical like the query about irradiance.
Keep pondering the question I asked, you two. I’ll be expecting your answers by tomorrow at the latest!
There is no proper answer to DREMT’s 9:25 am amateur question as stated since it is indeterminate. DREMT’s question has more unknowns than eqn.s. DREMT could follow Eli’s lead (e.g. two linearly independent eqn.s, two unknowns) & restate the question to be properly defined.
Ball4’s such.a good sophist. But no, the question I’ve posed can most definitely be answered. Still waiting…
Perhaps I should correct something I said, B4.
I said that DREMT has been around for half a decade.
Looking back, it’s more like eight years:
https://web.archive.org/web/20181009003314/http://www.drroyspencer.com/2017/10/uah-global-temperature-update-for-september-2017-0-54-deg-c/#comment-269629
Ah, the good old days where he didn’t have his best buddy to help him…
And even longer, screen names aren’t the only clue.
Hey B4, did you know that Barry is supposed to have forgotten that 240 x 4 = 960? Perhaps it’s DREMT who forgot his division by four.
Speaking of that old thread where DREMT appeared under various names, it looks like you had a dog fight over your pet interpretation of heat. Somehow, nobody intervened. Why do you think DREMT is still surprised when nobody intervenes in a dog fight?
Even I often skip them.
I believe Willard’s incoherent nonsense:
https://www.drroyspencer.com/2025/09/uah-v6-1-global-temperature-update-for-august-2025-0-39-deg-c/#comment-1716875
was meant to be posted here.
DREMT’s incorrect belief and egregious gaslighting are duly noted.
Reading back the thread in which DREMT did not seem so sure which nick to pick, we see an exchange between Barry and him. It ended rather well, with mutual apologies and DREMT overcorrecting himself. One highlight was this comment from Barry:
https://web.archive.org/web/20181009003314/http://www.drroyspencer.com/2017/10/uah-global-temperature-update-for-september-2017-0-54-deg-c/#comment-269419
The TL;DR is that flux never stand alone. Hence why DREMT’s “960 W/m^2 in and 240 W/m^2 out” exploits incomplete information.
How Barry can still keep his cool after so many years of abuse will always remain one of the greatest feats in Climateball history.
OK, so all irrelevant distractions and deliberate attempts from Willard to muddy the waters aside, the answer to my question is that the irradiance is 400 W/m^2.
Not 100 W/m^2, because you do not average irradiance over surface area which is not receiving it. Yes, 3 m^2 of the surface receives zero irradiance, but don’t forget:
“No, irradiance cannot be meaningfully averaged over a surface area that is not receiving it. Irradiance is a measure of radiant power per unit area, specifically the power of electromagnetic radiation received by a surface. By definition, an area receiving zero radiation has an irradiance of zero. Including that zero-irradiance area in an average would mathematically lower the overall value, but the result would be physically meaningless.”
FIN
Once again, DREMT confuses distractions with what *he* doesn’t want to talk about. That subthread was kick off by this comment:
https://www.drroyspencer.com/2025/09/uah-v6-1-global-temperature-update-for-august-2025-0-39-deg-c/#comment-1716425
It was addressed to Puffman. This subthread belongs to this comment:
https://www.drroyspencer.com/2025/09/uah-v6-1-global-temperature-update-for-august-2025-0-39-deg-c/#comment-1716390
A riddle DREMT still fails to respond.
Here he is, in *my* subthread from *my* thread, telling *me* that his distractions are what we should be talking about. Because, you know, he’s so proud of having thought of normalizing squared meters!
It only took him eight years.
Why can’t he wait for B4 to return and see to what he’ll respond? Nah. It’s just too important that he makes sure everyone gets the memo:
https://www.drroyspencer.com/2022/11/uah-global-temperature-update-for-october-2022-0-32-deg-c/#comment-1395800
But wait – didn’t he just deny having ever said anything like this?
“A riddle DREMT still fails to respond.”
I did respond, Willard. I said Clint had given you the correct answer.
DREMT is confused about many things in science and physics, Willard 1:17 pm. My “pet interpretation of heat”?
Hey, not much more than a century ago heat was looked upon existing as a substance – a massless, colorless, odorless fluid that existed within objects that could be poured out of them in transfer. It’s perhaps a bit true that this past theory of heat had its successes and hence deserves a bit of respect, but pls no more.
Slide rules were once the only means for fairly rapid multiplication and division. Now that we have pocket calculators and desktop computers, we don’t use slide rules. Neither should commenters here cling to a 2 century ago theory of heat which causes more birthing of sky dragon crank anti-experiment commenters like those that write “ice cannot boil water” contrary to 1LOT, 2LOT, and experimental evidence.
—–
DREMT’s 12:22 pm answer to DREMT’s own question “that the irradiance is 400 W/m^2.” also shows confusion since that answer is wrong.
The answer to DREMT’s question is indeterminate. All the area is illuminated, DREMT just didn’t specify the amount of light that is shining on rest of the area – a floodlight, earthshine, star shine, or whatever. There is no surface in this universe that can hide from light. DREMT’s underspecified, amateurish question was ill posed as I already informed DREMT.
Throwing numbers around has little to do with giving the “correct answer”. A real answer would contain more than numbers, but a solution in which we would see how exitance and irradiance are related in an energy balance model, and reveal why 200 W/m² on each side is equivalent to 400 W/m² and 0 W/m².
To speak of energy flux without specifying the object under consideration is as silly as saying that flux ain’t energy whence flux is actually energy flux.
But let’s close his silly loop, from his best buddy itself:
“The crux of your argument, that I am being “played by the notion of surface,” points to the essential difference between an **idealized, infinitesimally small surface element** and the **extended, heterogeneous boundaries** used in real-world models.”
FIN
There was nothing wrong with the question, and the answer was 400 W/m^2, Ball4.
Don’t worry, it’s not as embarrassing for you as your failure to notice that Eli hadn’t averaged the irradiance over the whole plate in the GPE. Eight years of study down the drain for Ball4.
Yes, B4. *Your* interpretation of heat. Of course you’re not alone to hold it. After all, you’re a deep thinker.
There’s no need to jump in every time someone does not use the word “heat” like you yourself would. Which includes Feynman, if you recall that blog thread in which DREMT undersigned his comments using his own name. It’s just a blog, not peer review. And peer review sucks most of the times.
Think of it like that. In the scale of puerile pedantry, there’s Graham, and right under there’s you. Only his lousy social skills makes him more obnoxious. At some point one must get away from the horse’s carcass.
I know that you won’t change your play style one bit. And I’ll have to stay away from wherever you decide to intervene. I’m not really talking to you. I’m making a point that Graham has already forgotten, which I already made when I told you that taking multiple nicks on various sites wasn’t cool.
In any case, we both agree that DREMT should not be gaslighting as much as he does. It does not bring him peace. And his naked lies disgrace him.
Be well.
Again, Willard, the only people caught actually lying in the comments here this month are you and Ball4. You, on this:
https://www.drroyspencer.com/2025/09/uah-v6-1-global-temperature-update-for-august-2025-0-39-deg-c/#comment-1716334
and, Ball4 on his big lie about Dr Spencer’s experiments.
The actual liar here authored this comment, completely uninvited:
https://www.drroyspencer.com/2025/09/uah-v6-1-global-temperature-update-for-august-2025-0-39-deg-c/#comment-1716560
His best buddy sent this post scriptum:
“My initial statement was correct only under the strict radiometric definition where one is interested in the intensity at a point of reception.”
FIN?
You can’t just admit you were wrong, even to the point you’re prepared to lie about it, Willard.
DREMT can’t admit misinterpreting all the time. Like he did with Barry, Puffman, B4, and now his best buddy, who tells me that “in the context of **energy balance and system modeling**, the quantity of interest shifts from **local intensity** to **system-wide power density**, for which the area-averaged flux (over both receiving and non-receiving regions) is the **fundamental and most meaningful variable**.”
You can either accept that flux is not conserved, or refuse to accept that. Up to you.
https://www.drroyspencer.com/2025/09/uah-v6-1-global-temperature-update-for-august-2025-0-39-deg-c/#comment-1715940
DREMT can either accept that equivalent quantities are equivalent, or he can waste another 8 years ranting about how they are not the same:
https://www.drroyspencer.com/2025/09/uah-v6-1-global-temperature-update-for-august-2025-0-39-deg-c/#comment-1716967
Considering his past, chances are he’ll continue trolling haplessly.
Imagine a “perfectly-conducting” blackbody cube, in space, receiving 1200 W/m^2 on one face. At equilibrium, it emits 200 W/m^2. Now, if you want to average the irradiance over the five sides receiving nothing (as well as the receiving side), and have an artificially low figure for irradiance of 200 W/m^2, that is “physically meaningless”, then be my guest. But, you may as well just go the whole hog and say “flux is conserved”, since that’s obviously what you’re really trying to say.
Now, you may think, “well, what difference does it make if you average irradiance, or not? The cube still emits 200 W/m^2, either way”.
That’s where we try to bring the example a little closer to reality. So, now let’s give the cube some negligible value for thermal conductivity, instead. In which case, the side of the cube facing the heat source is going to equilibrate at some temperature nearer 381.5 K, emitting 1200 W/m^2, and the other five sides are going to be…very cold indeed. I won’t hazard a guess at a temperature because whatever I say, Ball4 will tell me I’m wrong, and it will all just be a distraction from the general point being made.
So, if you were to average your irradiance over the whole cube, thus assuming the cube receives only 200 W/m^2, and at equilibrium emits 200 W/m^2, at a uniform temperature of 244 K, you’re going to be very shocked when you visit the cube and find that the reality is the cube is above boiling point on one side and well below freezing on the other five sides!
Averaging fluxes distances you from the physical reality.
DREMT 1:34 pm abandons all attempts over ~8 years at ever admitting understanding the point of Eli’s 2017 BP and GP and follow-up experiment proves Clint R wrong & moves on to a thick cube with thermal conductivity illuminated in space where Clint R is left in the dust of history.
The ISS would be more known from measurement, but let’s humor DREMT & honor using his cube example thus removing his shock that estimated avg. surface temperatures from averaging illuminating energy flux (i.e. using avg. energy flux in W/m^2) is legit with cube surface emissivity ~1 and employing a passive Borg cube non-rotating wrt to the sun orbiting at 1 AU. Just get out your handy smart phone and take less than a minute to find from google search & then convert these temperatures to avg. energy flux for the rotating wrt the sun Borg cube or a face:
“The temperature of a passive Borg cube’s side facing the sun in solar orbit at 1 AU would be approximately 394.3 K
On the side facing away from the sun, the estimated temperature would be around -150C, (-238F), or 123K.”
With a huge and unnecessary amount of confused braying, Ball4 uses Google to prove me right. His only mistake was having the cube at 1 AU, thus receiving approx. 1,361 W/m^2, rather than the 1200 W/m^2 I specified. Other than that, my point is confirmed (I’m guessing the point I was making went over Ball4’s head).
Thx, Ball4.
Yeah, happy DREMT agreed proving Clint R wrong is so easy.
Astute readers will have long ago seen through all of Ball4’s Tricks.
Speaking of tricks:
https://web.archive.org/web/20181009003314/http://www.drroyspencer.com/2017/10/uah-global-temperature-update-for-september-2017-0-54-deg-c/#comment-268349
Perhaps more attention ought to be paid to whom DREMT was describing as a paid sophist at the time.
Willard is back to playing his game where he links to random comments, hoping readers will be duped into thinking he has made a point.
Borg cube avg. temperature 168.2K not same as Earth. Borg cube avg. W/m2 239.3 same as Earth as measured from space so no trick: DREMT’S cube example shows Clint R is wrong as did Eli’s 2017 plate example show Clint R is wrong.
You completely missed the point of the cube example, Ball4. Completely. Just think whatever you like, you’re a total waste of my time.
(and, if the “Borg cube” average temperature is 168.2 K, and the average emitted flux is 239.3 W/m^2, that proves Clint’s point. 239.3 W/m^2 converts to a blackbody temperature of approx. 255 K, whereas the actual temperature of the “Borg cube” is 168.2 K. So, the average emitted flux value for the “Borg cube” is “physically meaningless” in that it doesn’t abide by the SB Law – it converts to the “wrong temperature”. This is why Ball4 can’t be trusted – see how he tried to spin this 180 degrees from the reality, trying to pretend it proved Clint wrong!)
Ha, DREMT swings back to his real point 4:10 pm but, no DREMT, the avg. temperature of Earth 239.3 W/m2 is measured at 255K same as the fictional Borg cube would be at 239.3 & not your bogus avg. temperature of 168.2K since temperatures cannot be directly averaged.
I didn’t “swing back to my real point”, Ball4. My point with the cube was the point I made on October 2, 2025 at 1:34 PM. I was just “pointing out” that the numbers for the “Borg cube” proved Clint’s point.
DREMT is at the point where he just refuses to understand what people are telling him.
This is not random.
Ball4 is talking nonsense, Willard, and you lap it up. He is referring to a 255 K temperature for the Earth that is measured, not calculated. That would be a reference to its “brightness temperature”:
“Brightness temperature is a measure of an object’s emitted electromagnetic energy, defined as the temperature a black body would need to have to produce the same intensity of radiation at a specific frequency. It is not the object’s actual physical temperature but rather a proxy for its radiative properties, used extensively in fields like radio astronomy and satellite meteorology to determine characteristics of distant or inaccessible objects.”
I assume you will now see the problem with his “argument”.
So now DREMT 9:36 am quotes an unnamed source writing the brightness temperature of my ordinary glass of ice water measured by IR thermometer at 32F “is not the object’s actual physical temperature” measured at 32F by mercury thermometer! DREMT is easily and obviously misled; DREMT is proven wrong by simple experiment (as did Dr. Spencer multiple times).
There really is no problem as imagined by DREMT; Clint R remains wrong as shown by Eli’s 2017 plate example and DREMT’s own cube in space example just having more sides than Eli’s.
Ball4 loses another argument in his usual way – going down in a frenzy of false accusations, misrepresentations and outright lies.
Clint’s point #2 is correct, following simply from Hölder’s inequality and the non-linear relationship between temperature and radiative flux. A minor point blown out of all proportion by a collection of trolls absolutely obsessed with the idea that “Clint must be wrong”.
Once again feeling misunderstood, misunderstanding everything once more, DREMT waves his arms, and soldiers on.
I’m not the one misunderstanding everything, Willard.
His bait not working, DREMT goes for the “No U”.
Puffman’s criticism is dead.
It has always been, but it now is.
If you say so, Willard.
MAGA takes over the Ryder Cup: Not only is the crowd’s (and some players’) behavior uncouth, rude and offensive, but team USA is down 4.5 to 11.5!
Just a wee glimpse into what the World Cup will be like. Everything Trump touches turns to sh!t.
max c…”Meteorologists are not climatologists aka climate scientists. Meteorologists are experts in the field of climate, but laymen in the field of climate change”.
and…
“Most meteorologists forecast weather and their work is invaluable for all of us. Some meteorologists focus on the atmosphere (climate) and its physical and dynamic properties. But only handful of meteorologists are specialized in climate change, and Dr.Spencer is one of them. Average meteorologists believe in consensus science and repeat IPCC’s claims like parrots”.
***
There is really no such things as a discipline devoted to climate change and no such thing as a degree in climate science. Climatology is a very loose description that provides an umbrella for those claiming to have expertise in climate change. It includes economists, anthropologists, librarians, climate modelers and other theoreticians trying to give the impression they are experts on climate.
Roy has a degree in meteorology and John Christy, who also doubles as the state climatologist for Alabama, has a degree in atmospheric science. Both Roy and John are about as close as you’ll get to experts on climate. Not only that, their work is based on state of the art satellite technology that can gather global temperatures from 95% of the planet whereas surface stations can account for no more than 30%.
Both the surface stations and Argo buoys used to cover the oceans can supply no more accuracy on average than 1 thermometer for every 100,000 square Kms of the surface.
clint…” You are confusing radiative flux with energy. (Radiative flux, as used In climate science, is the flux emitted from a surface due to the S/B Law. Less often referred to as “radiosity” or “radiant exitance”, it has units of W/m². It is NOT “energy””
***
What is flux if it is not a representation of energy? It cannot exist as an independent phenomenon without proof as to what it is.
I am claiming that flux is a human invention that qunaantizes the flow of an energy like magnetic energy or electromagnetic energy and helps us visualize it. Some use the word flux to quantize heat flowing through a solid. I can live with that, even though the flow is via electrons surrounding atoms in the material and not via a flux field.
You mentioned the S-B equation. Prior to Boltzmann being included in the equation, Stefan worked it out for himself and he was clearly describing the intensity of electromagnetic energy being emitted from a surface of temperature, T, where T, another human invention, described the relative level of heat in the surface.
Stefan used the results of an experiment by Tyndall in which Tyndall electrically heated a platinum filament till it glowed a reddish colour. As he increased the electrical current, the filament got hotter and began emitting colours representative of our modern colour temperature. That means a heated body gradually gives of colours in the order red, orange, yellow, green, blue, etc, as the heat content of the body increases hence the temperature.
These colours are not real wrt light but represent the effect the EM radiation, aka flux, has on receptors in the human eye. That is colour is the way the eye sees EM but has no relationship to the EM itself, which has no colour.
Another scientist converted the resultant colours to equivalent electromagnetic energy, hence the formula… EM intensity = sigma x T^4.
That is, Tyndall did the experiment and Stefan figured out the relationship between the surface temperature and the EM intensity it gives off.
It must e noted that the results apply only in the range of about 500C to 1200C. Attempts to use the T4 curve to extrapolate the results to lower temperatures prove to be ridiculous. That’s why ice is given an EM radiation intensity of something like 380 w/m^2.
That’s my story and I’m sticking to it.
10:02 pm: “It must (b)e noted that the results apply only in the range of about 500C to 1200C.”
No Gordon, in my room temperature kitchen my IR thermometer reads EMR brightness temperature of 32F just fine on an ordinary glass full of ice water.
SOLAR MINIMUM UPDATE
A year after Helene, what exactly Donald’s GoFundMe campaign paid for remains unclear. Grist reached out to the recipient organizations asking how much they received, and how it was spent. Several responded to an initial email and offered vague explanations, but none except Mtn2Sea Ministries responded to follow-ups for a more specific breakdown of related expenditures.
https://grist.org/accountability/trump-raised-8-million-for-helene-survivors-where-did-it-all-go/
It takes special troglodytes to make Donald win like that!
You have a bad TDS? Trump raised money for charity organizations. They got the money as promised and Trump got a lot of good will. I can’t see any problem with that. As you said, Trump was a winner once again.
By the way, did Biden raise any money for Hurricane Helene survivors? He probably just turned his side inside the blankets without even waking up.
Which part of “A year after Helene, what exactly Donald’s GoFundMe campaign paid for remains unclear” do you not understand, Max?
You might also like:
https://www.cnn.com/2025/06/11/politics/fema-hurricane-season-phase-out-trump
Did Joe say anything like this?
Willard: FEMA is a good example of ineffective bureaucracy. Trump’s plan is to dismantle FEMA and let the states take care of major disasters, like severe storms and flooding. Future role of federal government is to give funding when necessary. FEMA was founded by president Jimmy Carter in 1979. May Jimmy and FEMA rest in peace.
Willard:
“A year after Helene, what exactly Trump’s GoFundMe campaign paid for remains unclear. Grist reached out to the recipient organizations asking how much they received, and how it was spent. Several responded to an initial email and offered vague explanations, but none except Mtn2Sea Ministries responded to follow-ups for a more specific breakdown of related expenditures.”
Do you understand what “paid for” means. It means that the charity organizations got their money in full, but it’s not clear how the money was spent because the reporter failed to get that information.
However, if you read the whole article, it becomes clear that the money was well spent. Hundreds on homes were repaired, water purification packets were delivered, missing vehicles were replaced, hundreds of driveways, culverts and bridges were fixed, gift cards were given to survivors for groceries and other necessities, food supplies were distributed to listed recipients, etc. etc.
Max: you’re just saying stuff once again, and there’s something about “none except Mtn2Sea Ministries responded to follow-ups for a more specific breakdown of related expenditures” that still seems to escape you. Donald’s reputation as a guy who doesn’t deliver on his promises is quite robust:
https://failedpromises.net/
And you shouldn’t trust his claims about FEMA either:
https://www.factcheck.org/2024/10/trumps-false-claim-of-stolen-disaster-relief-funds/
Donald is doing exactly like our cranks are doing here.
Don’t be a crank
“Willard: FEMA is a good example of ineffective bureaucracy.”
As usual it is just asserted by Trump that this is the case, and it is expendable. But is it?
What is replacing it?
These are nickels and dimes of savings.
The actual problem with govt spending is the entitlements, SS, medicare, medicaid, which he is not attempting to fix
Trump’s Truth Social account shares seemingly AI video amplifying ‘medbed’ conspiracy theory.
The video looks like it’s from Fox News’ “My View with Lara Trump” where she announces breaking news that the president has announced a new “healthcare system” with the launch of America’s first “MedBed hospitals.” In the video, the president is seen announcing the technology from the Oval Office.
In the seemingly fake video, the president says that a limited number of “MedBed cards will be released,” and registration details will be announced soon. But a search for “MedBed Cards” found a website selling you the cards. The card shown in the video and the card on medbedcard.com look similar.
Truth Social has since taken the video down and even Fox News issued a statement that the “interview” never appeared on their network.
My honest guess is this is just Trump, high on whatever concoction they gave him that day, posting random sh!t he saw on QAnon. Medbeds are obviously horsesh!t.
The depressing reality is that the most likely explanation is that Trump thought it was real, meaning he:
1/ Gets all his news from Fox News even though he has intel briefings.
2/ Doesn’t know what’s going on in his own administration outside of his immediate sphere.
3/ Literally just goes along with whatever vaguely real thing he sees without bothering to check anything.
Get it together man!
He’s going to tax your movies now. MAGAs rejoice!
More facts for the TDS kids to ignore:
https://www.youtube.com/shorts/WdZDnnM6kEk
BACK AT THE RANCH
Donald just gathered the highest ranking officers in the military to tell them that he may order them to kill American citizens – and that they better follow his orders. All in response to a series of crises that have no basis in reality.
But but but – he’s gonna PAY you to buy drugs:
“You’re talking about 1,400%, 1,500%, 1,600% reductions in some cases.”
https://bsky.app/profile/atrupar.com/post/3m22z4pmu242n
Another WIIIIIIIIIIIIIIIIIINNNNNNNNNNNNNNNNNNNNNN
https://youtu.be/rOXbRu43ok8?t=2714
Here’s the best part of Hegseth’s speech: after he says “God Speed,” that moment where he waits for what he thinks is going to be thunderous applause, a beat, then you can literally see the realization of reality as he looks down and then walks away like a MAGA who just found out Krispy Kreme is all out of donuts.
Priceless!
Ark, obviously you didn’t understand the command when he finished.
Women in the military would even know more than you effeminate weasels.
Please allow Pete to finish his pull-up, Puffman:
https://bsky.app/profile/chrisinlondon.bsky.social/post/3m22nk5xv7s2f
An effeminate weasel trying to cover for another effeminate weasel doesn’t work.
But, it’s funny….
Are you trying to mock Mike Johnson, Puffman?
Pete’s just a Fox News pantomime:
https://bsky.app/profile/patriottakes.bsky.social/post/3lzy5msbdis2t
At least his new schedule prevents him from abusing his wife:
https://bsky.app/profile/djjakej.bsky.social/post/3lycdvpv6zc2p
Are you trying to mock Mike Johnson, Puffman?
You know what he has to do before tomorrow.
As for Pete, we both know he’s just a Fox News pantomime:
https://bsky.app/profile/patriottakes.bsky.social/post/3lzy5msbdis2t
ADP (a private company) today released its September 2025 National Employment Report, revealing that private sector employment declined by 32,000 jobs, well below expectations of a 50,000 increase.
This is the first decline in ADP data since March 2023.
Another MAGA win because, looking around at a government shutdown this morning, it’s starting to look like one of Trump’s failed businesses: University, Steaks, Vodka, Casinos, etc.
I see poor Willard is still confused by the simple examples:
https://www.drroyspencer.com/2025/09/uah-v6-1-global-temperature-update-for-august-2025-0-39-deg-c/#comment-1716790
Happy to correct him.
The plate receiving 400 W/m² from one side, and 0 W/m² from the other side would result in the plate reaching a temperature of 244K, emitting 200 W/m² from both sides.
IOW, 400 + 0 = 200 + 200
The plate receiving 200 W/m² from one side, and 200 W/m² from the other side would also result in the plate reaching a temperature of 244K, emitting 200 W/m².
IOW, 200 + 200 = 200 + 200
But if the plate receives 300 W/m² from one side and 100 W/m² from the other side, it only reaches a temperature of 227K, emitting 150 W/m² from both sides.
IOW, 300 + 100 = 150 + 150
The cult kids will claim that doesn’t “add up”, as 400 does not equal 300. But, they are confusing flux with energy. They are forgetting the 100 W/m² reflected. So, the energy budget looks like:
300 + 100 = 150 + 150 + 100
Flux is NOT energy and is NOT conserved.
[This involves science, so only responsible adults will understand.]
There’s NOTHING very confusing there, Puffman. You’re simply guestimating temperatures right out of irradiance rates. A performance that reminds me of Gob:
https://www.youtube.com/watch?v=5Nvxv2R01po
The only difference is that Gob is funny.
Flux is ENERGY flux, so your assertion is silly.
[Get DREMT to rubberstamp your “300 + 100 = 150 + 150”, then we’ll ask for receipts.]