
 Home/Blog
The Version 6.1 global average lower tropospheric temperature (LT) anomaly for September, 2025 was +0.53 deg. C departure from the 1991-2020 mean, up from the August, 2025 anomaly of +0.39 deg. C.
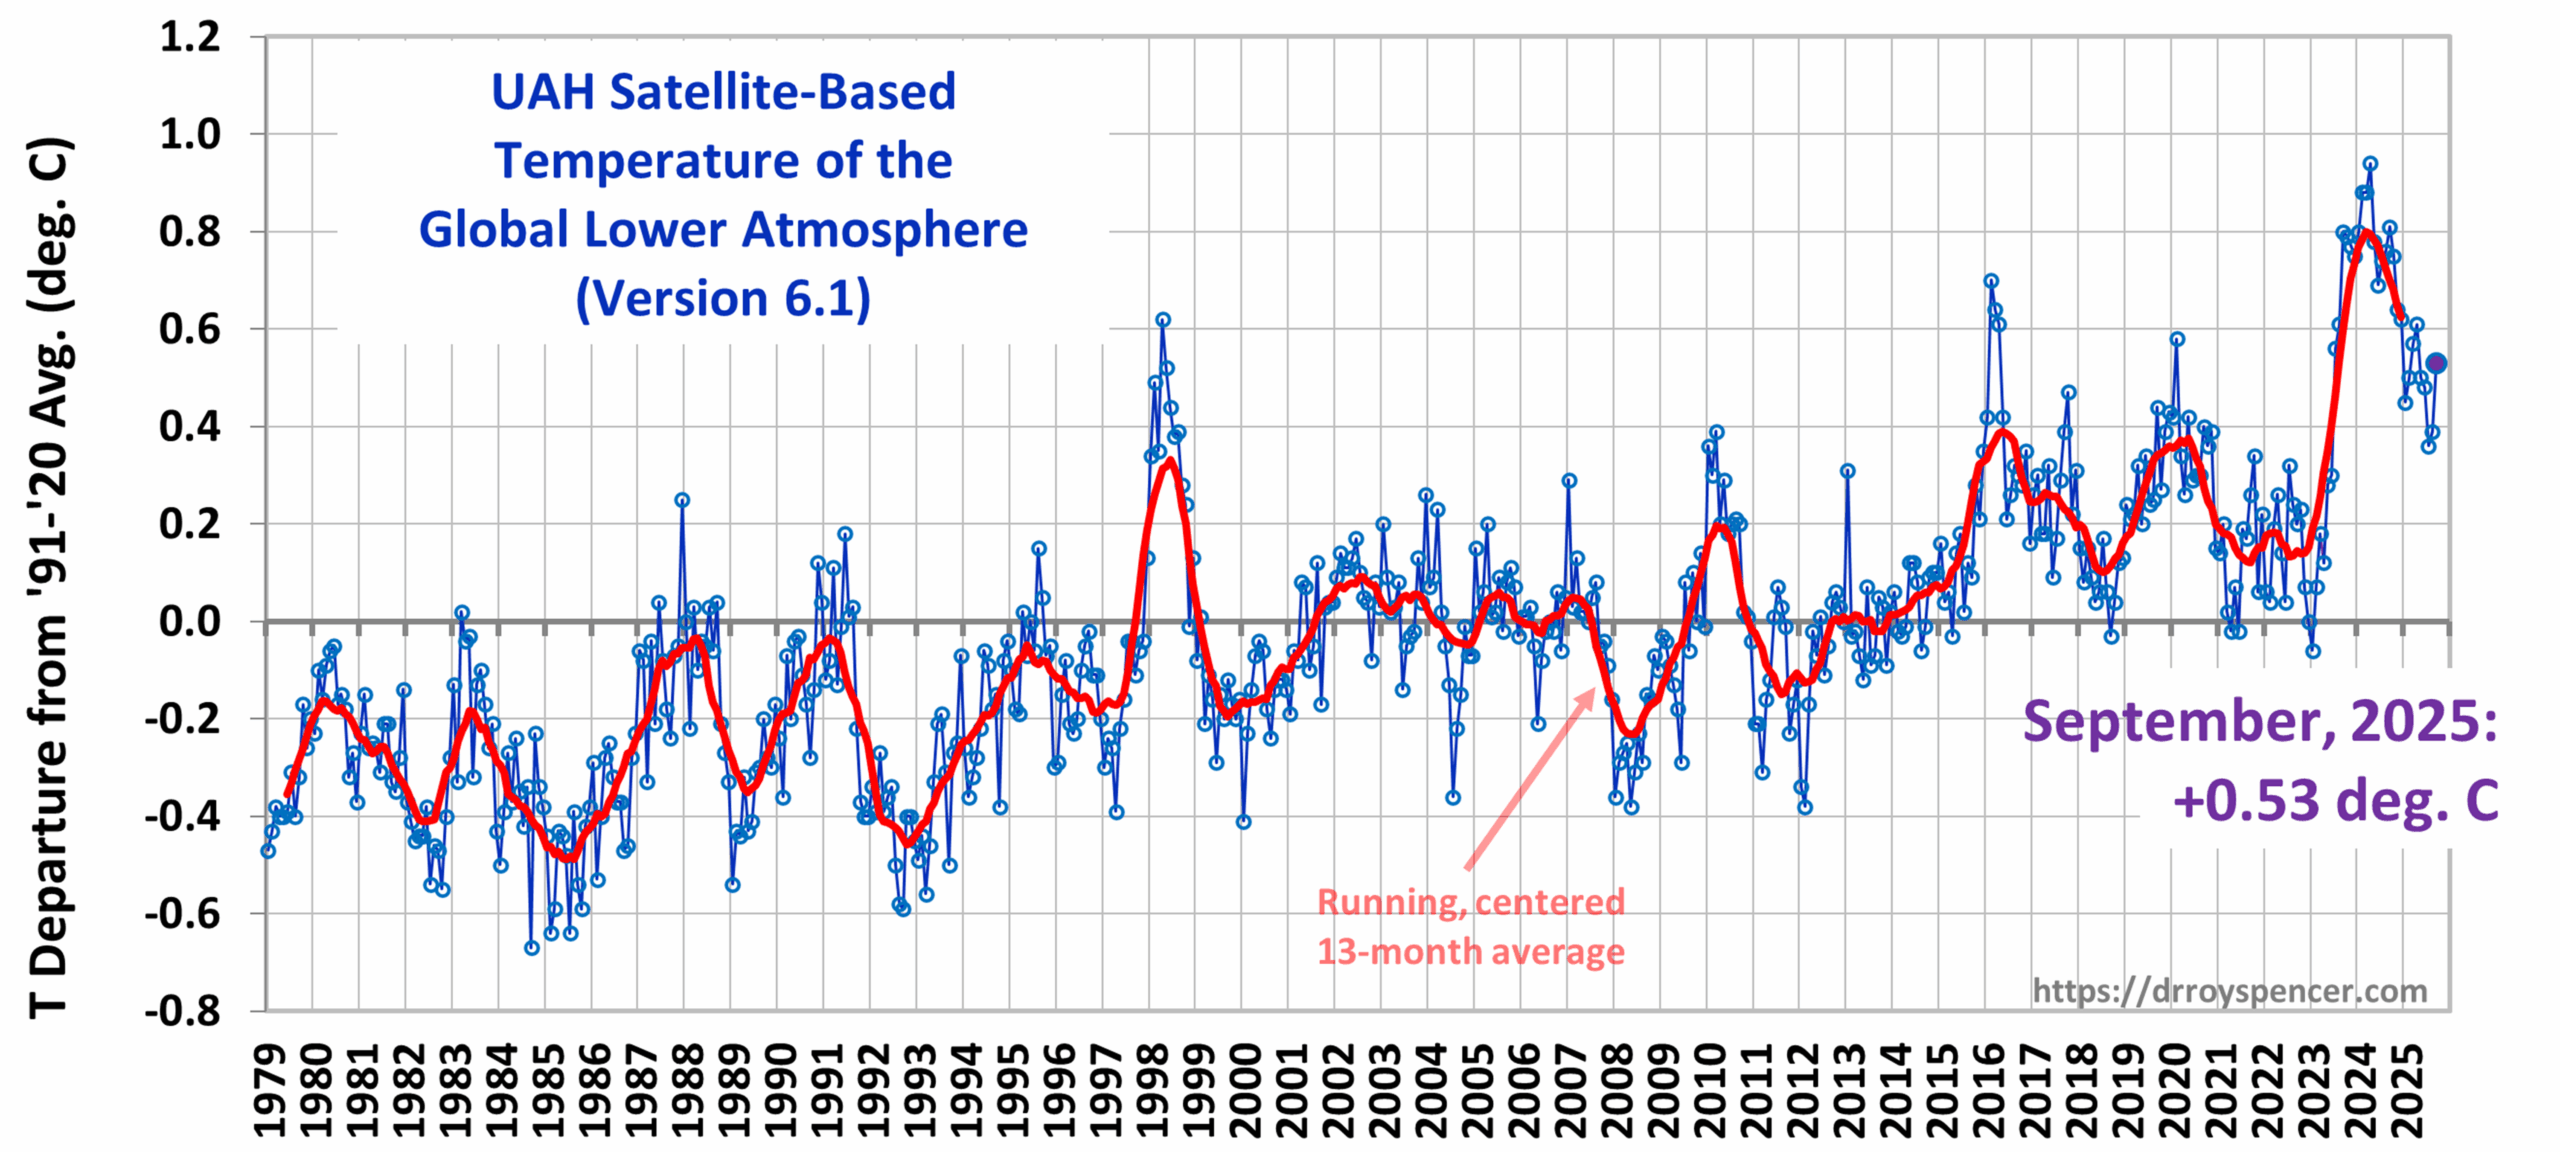
The Version 6.1 global area-averaged linear temperature trend (January 1979 through September 2025) remains at +0.16 deg/ C/decade (+0.22 C/decade over land, +0.13 C/decade over oceans).
The following table lists various regional Version 6.1 LT departures from the 30-year (1991-2020) average for the last 21 months (record highs are in red).
| YEAR | MO | GLOBE | NHEM. | SHEM. | TROPIC | USA48 | ARCTIC | AUST |
| 2024 | Jan | +0.80 | +1.02 | +0.58 | +1.20 | -0.19 | +0.40 | +1.12 |
| 2024 | Feb | +0.88 | +0.95 | +0.81 | +1.17 | +1.31 | +0.86 | +1.16 |
| 2024 | Mar | +0.88 | +0.96 | +0.80 | +1.26 | +0.22 | +1.05 | +1.34 |
| 2024 | Apr | +0.94 | +1.12 | +0.76 | +1.15 | +0.86 | +0.88 | +0.54 |
| 2024 | May | +0.78 | +0.77 | +0.78 | +1.20 | +0.05 | +0.20 | +0.53 |
| 2024 | June | +0.69 | +0.78 | +0.60 | +0.85 | +1.37 | +0.64 | +0.91 |
| 2024 | July | +0.74 | +0.86 | +0.61 | +0.97 | +0.44 | +0.56 | -0.07 |
| 2024 | Aug | +0.76 | +0.82 | +0.69 | +0.74 | +0.40 | +0.88 | +1.75 |
| 2024 | Sep | +0.81 | +1.04 | +0.58 | +0.82 | +1.31 | +1.48 | +0.98 |
| 2024 | Oct | +0.75 | +0.89 | +0.60 | +0.63 | +1.90 | +0.81 | +1.09 |
| 2024 | Nov | +0.64 | +0.87 | +0.41 | +0.53 | +1.12 | +0.79 | +1.00 |
| 2024 | Dec | +0.62 | +0.76 | +0.48 | +0.52 | +1.42 | +1.12 | +1.54 |
| 2025 | Jan | +0.45 | +0.70 | +0.21 | +0.24 | -1.06 | +0.74 | +0.48 |
| 2025 | Feb | +0.50 | +0.55 | +0.45 | +0.26 | +1.04 | +2.10 | +0.87 |
| 2025 | Mar | +0.57 | +0.74 | +0.41 | +0.40 | +1.24 | +1.23 | +1.20 |
| 2025 | Apr | +0.61 | +0.77 | +0.46 | +0.37 | +0.82 | +0.85 | +1.21 |
| 2025 | May | +0.50 | +0.45 | +0.55 | +0.30 | +0.15 | +0.75 | +0.99 |
| 2025 | June | +0.48 | +0.48 | +0.47 | +0.30 | +0.81 | +0.05 | +0.39 |
| 2025 | July | +0.36 | +0.49 | +0.23 | +0.45 | +0.32 | +0.40 | +0.53 |
| 2025 | Aug | +0.39 | +0.39 | +0.39 | +0.16 | -0.06 | +0.69 | +0.11 |
| 2025 | Sep | +0.53 | +0.56 | +0.49 | +0.35 | +0.38 | +0.77 | +0.32 |
The full UAH Global Temperature Report, along with the LT global gridpoint anomaly image for September, 2025, and a more detailed analysis by John Christy, should be available within the next several days here.
The monthly anomalies for various regions for the four deep layers we monitor from satellites will be available in the next several days at the following locations:


Warming goes on,
and Denying and Ignoring will goe on.
Same procedure as every month.
No one is denying warming. Only that it’s caused by CO2 and thus guaranteed and persistent. The data is clear the earth has cooled past 18 months after a massive spike the couple years before. No one seems to explain why- I suspect Hunga Tonga but is there no way to measure the water vapor situation?
I’m not sure what data you’re looking at but, even in the UAH series, there was no massive spike in the two years before March 2024 (18 months ago). I do note that there have been many periods where one could say the earth has cooled over 18 months but the long term trend is still up and we continue to see records, even in the UAH series.
This reminds me of the escalator charts where some claim it hasn’t warmed for x years, then we see an uptick. The trend is guaranteed and persistent, especially in data sets which record temperature at the surface, where people, animals and vegetation live.
January of 2023 to April of 2024 was an upward spike- just look at the graph above. Then 17 months trending down. Yes, there’s a larger upward arc, just as there have been longer downward arcs… but CO2 goes up every year. Something is more powerful in these 18 month segments than CO2.
Dirk McCoy seems to be completely unaware of the El Nino and La Nina phenemena. If you look at the UAH graph you’ll find that it’s basically the combination of a steady upwards trend of around 0.16 degrees per decade and fluctuations up and down around this trend. The trend is driven by man-made emissions (CO2, CH4, etc.) and the fluctuations are associated with El Ninos and La Ninas (compare with https://ggweather.com/enso/oni.htm).
Dirk McCoy ‘suspects’ Hunga Tonga (!) which is a surprisingly specific remark for someone who appears to be totally ignorant about the atmospheric greenhouse effect, the ONI and the fact that the HT effect was very small, very short-lived and probably also a COOLING (https://newsroom.ucla.edu/releases/hunga-volcano-eruption-cooled-southern-hemisphere).
Dirk McCoy says “Something is more powerful in these 18 month segments than CO2.”
Oh dear. Scientists have known for a VERY long time that short term changes, ranging from days to a few years, are typically much faster than CLIMATE changes. The latter refers to changes of long time averages, like over several decades. The short term ups-and-downs are quite irrelevant to CLIMATE since they cancel out each other in the long run.
I suggest Dirk McCoy atudes the 10 and 30 year averages of the UAH graph over at https://datagraver.com/climate-data-set-uah/ . The graph showing the 30 year average is particularly informative. What you see there is the underlying trend. THAT’s what matters from a CLIMATE perspective.
Hey Gadden, if only 4% of yearly emissions are from humans then how can all of the increase in CO2 since 1750 be due to humans when during that time most fossil fuel emissions were much much less than 4%?
Stephen p anderson asks “if only 4% of yearly emissions are from humans then how can all of the increase in CO2 since 1750 be due to humans when during that time most fossil fuel emissions were much much less than 4%?”
In recent decades, the average annual contributions from nature and from humans (excluding respiration which is part of the natural carbon cycle to atmospheric CO2 are approximately as follows:
Nature emits 780 and absorbs 800 billion tons.
Humans emit 40 billion tons and absorb no CO2.
It’s us.
See also https://www.climate.gov/news-features/climate-qa/how-do-we-know-build-carbon-dioxide-atmosphere-caused-humans
So, nature ab.sorbs 39 billion of the human emissions and 761 billion of the natural emissions. So, most of the atmospheric carbon is due to nature.
Of course most of the atmospheric carbon is due to nature, stephen p anderson, and you’d be hard pressed to find statements by climate scientists that say otherwise. This will not be true in the future if we don’t eliminate human caused emissions. However, the increase in atmospheric carbon is all human caused – it’s on top of the natural cycle.
Mike Roberts,
If only 4% of yearly emissions are due to humans, then how can all the increase be due to humans? Physically impossible.
Stephen p anderson, I’ll dumb it down for you with an analogy.
Peter has $400. Every day Paul gives Peter $100. Peter then immediately
gives Paul $100 back. This goes on day after day, year after year. In the long run, Peter’s capital will neither grow nor shrink, right?
Now, let’s say Mary suddenly starts showing up when this transaction occurs. As Paul hands Peter the daily $100, Mary also gives Peter some money, $4 as it happens. Paul now sees the $104 in Peter’s hand and can’t resist taking back a little more than the usual $100 so he asks for $102, and Peter gives that to him. Mary is happy giving away the $4 and does not get any money from Peter. From this day on, Mary coontinues showing up every day, giving away $4 and not expecting anything in return. So every day, Peter now receives $104 and pays $102. This means his capital will grow by $2 every day. Are you with me so far?
Who would you say is financing Peter’s capital growth? Is it Paul or Mary?
Let me know when the penny drops. If it doesn’t, ask a person of at least average intelligence to explain it for you.
Gadden,
You flunk Physics 101 with your incorrect model. Do you understand that atmopsheric CO2 obeys the continuity equation which is a first order linear differential equation?
dCO2/dt = Inflow – Outflow
Inflow=Lb/Te (Lb=Balance Level)
Outflow= L/Te
L=430ppm
If we use dC/dt=2ppm/yr (4.24PgC/yr) and a Te of 4 years.
Outflow=430ppm/4yr=107.5 ppm/yr
Inflow= 107.5ppm/yr+ 2ppm/yr =109.5ppm/yr
Balance Level = 109.5ppm/yr(4yr)=438ppm
Te (eTime) is the time it takes for Level to reach 0.693 the distance from the level to the balance level. So, in 4 years from now, the level should be 435.54ppm.
If inflow is 5ppm human and 104.5ppm natural, then in 4 years when the level is 435.5ppm, human CO2 can be no more than 20ppm of the total. Outflow, which is 107.5ppm/yr, is 4.945ppm/yr human and 102.555ppm/yr natural. So, of the 2ppm/yr increase, 0.055ppm is human and 1.945ppm is natural. Natural emissions are greater than natural sinks. This is conservation of mass and in compliance with the equivalence principle.
Also, I don’t think your 820 billion metric tons is correct. If so, that would indicate a much shorter Te of about 2.9 years. But it could be.
“Inflow=Lb/Te (Lb=Balance Level)
Outflow= L/Te”
These equations are not applicable to our atmosphere, Stephen.
For example, the atmosphere emits to the ocean and land. If the ocean has a level Lo = Latm, then there is no emission.
Zero.
Outflow = (Latm-Lo)/Te
Currently Latm and Lo are very nearly equal.
OTOH, when the ocean warms and cools with the seasons, it will emit and then absorb CO2.
Same with soil. And plants.
These are all driven, dynamic, processes, that do not follow your simplistic equations.
Nate,
So, is that true for natural and human carbon?
Nate,
Do you realize you’re telling Gadden his little dollar piggy bank model is wrong?
Gadden,
So Nate swooped in to try to save you while destroying your argument but did it with an argument that is equally as weak as yours. You’d think he’d do it with a sound mathematical argument. If he answers me, which he probably won’t because I’ll twist his poor argument into a pretzel, I’ll show you where he is wrong too.
“So, nature ab.sorbs 39 billion of the human emissions and 761 billion of the natural emissions”
Nature doesn’t distinguish. We add 40 billion tons of CO2 in the air, and the biosphere, year after year, never absorbs enough to reduce the total CO2 concentration. It keeps going up by about half what we emit, year after year.
It’s very, very simple math. If we add year by year twice as much as is accumulating year by year, and not taking any out, then it’s us.
Stephen.
A good model of carbon in surface and atmosphere is two big barrels of water connected by a thin tube. The barrels contain 400 liters.
Raising and lowering the T of the surface seasonally, can be modeled by raising and lowering the height of one barrel each hour.
When raised, water (carbon) flows out of the barrel (surface) thru the hose to the fixed barrel (atmosphere).
Because it has to flow thru the thin hose, it takes time (Te) to equilibrate, but 100 liters of water (carbon) is exchanged each time the bucket is raised.
Then when the barrel (surface) is lowered 100 liters flows back to the other barrel (atmosphere)
Now at the same time a human is adding 4 liters to the fixed bucket per hour. During each hour about 2 liters flows to the other bucket.
It should be obvious that a barrel (atm) increase water
(carbon) by 2 liters (ppm) per hour (year).
It should be obvious that this was entirely due to the human adding the water (carbon).
Why isnt it obvioys, Stephen?
Barry,
I showed you what happens based on the solution of the continuity equation. It is obvious that most of the yearly increase is due to nature. Your model violates the Equivalence Principle and is not based on any math.
Nate, you are almost there. You almost understand. The atmosphere will have a linear differential equation governed by dCO2(atm)/dt = Input – Output and Surface Ocean will have a separate equation dCO2(o)/dt= Input – Output. Also, land will have dCO2(land)/dt= Input – Output. Each solution will have its own independent Te’s for each system. Also, the deep ocean will have its own independent Te. By the way these solutions fit perfectly to the IPCC’s natural carbon cycle model. All you have to do is read Berry’s third paper. Your model (Latm-Lo)/Te doesn’t work because the atmosphere and ocean have two different Te and your solution would not work for the First order differential equation.
Nate,
You flunk physics 101. The 2ppm per year is dCO2/dt. It is the total change of CO2 in the atmosphere. It is governed by all inputs and all outputs. The balance level is set by all inputs and Te.
“It is obvious that most of the yearly increase is due to nature.”
It’s obvious that it is due to us.
Humans emit 40 Gt CO2 per year, the air gains 20 Gt, so nature must be taking up the other 20 Gt — meaning nature is a net sink, not a source. Therefore, the rise must come from human CO2.
It’s basic math.
To argue otherwise you would have to show that the biosphere somehow selectively removes anthro CO2 (zero evidence for this), and identify a source responsible for the 20 GT per year.
It can’t be the oceans because they are accumulating. Can’t be biota because the planet has gfrenened slightly.
But the first hurdle is the killer. We have a source, it is responsible for twice the actual increase. Nature is a net sink, humans a net contribution – twice as much as needed to account for the growth.
“You flunk physics 101.”
Why?
“The 2ppm per year is dCO2/dt. It is the total change of CO2 in the atmosphere. It is governed by all inputs and all outputs. The balance level is set by all inputs and Te.”
Sure. So point out the problem with the two barrels model. One of the barrels represents the atmosphere.
It has inputs and outputs that conserve mass.
“Your model (Latm-Lo)/Te doesn’t work because the atmosphere and ocean have two different Te and your solution would not work for the First order differential equation.”
Sure it does. The Te describes the time to exchange mass from the atm to the ocean mixed layer.
Barry,
It is basic math, but you ignore basic math and insert Barry math. Barry math is incorrect math. The math can’t be what you want it to be. It has to follow the laws of nature. Humans don’t get to invent any math they want. The Creator gave us math that governs the laws of nature. We don’t get to make up our own math if nature’s math doesn’t fit our narrative.
Nate,
You flunk physics 101 again. The outflow from the surface ocean is the solution to dCO2ocean/dt = Input – Output. That solution has a different Te. If your equation was true, dCO2atm/dt= Input – Output would be much larger that 2-3ppm. It would be a very large number, one or two orders of magnitude larger. So, we know its not true because dCO2/dt is only changing about 2-3ppm per year.
Nate,
Let’s take this a step further. Above, I used outflow=L/Te and I plugged in some numbers: 430ppm/4yr= 107.5 ppm per year. Let’s use your equation now: (430ppm – ?)/? = ?. Please fill in the numbers.
stephen,
“It is basic math, but you ignore basic math and insert Barry math. Barry math is incorrect math.”
But you were unable to show why, because the simple math is irrefutable.
Nature is a net sink. The largest sink is the oceans and they are accumulating CO2. The next largest sink is land vegetation, which is also a net sink, not a source.
It’s not just the straightforward math, the physical evidence corroborates.
And as you know there is much more physical evidence, including the increase in fossil fuel CO2 in the atmosphere and oceans, evident in the change in isotopic ratios of CO2 that come exclusively from fossil fuels.
The anthropogenic origin of CO2 increase is extremely well corroborated. There are many areas of uncertainty regarding AGW and global warming, but this is not one of them.
Stephen, the problem is with your interpretation of your equations.
When properly combined, they give for the flow of carbon from atmosphere to ocean:
dC/dt = (Lb-L)/Te where
Lb is the equilibrium concentration in the liquid is determined by the final atmospheric pressure.
This is standard kinetics of gas absorbing into liquid.
The problem is that in the real ocean, the concentration L in the ocean is NEVER near 0.
So there is NEVER going to be a flow of
dC/dt = (Lb-0)/Te = 107 ppm/yr
Nate,
Also, if that were true the outflow would only be about 60%. So,
dCO2/dt would be 109.5ppm/yr – 0.6(107.5ppm/yr) = 45ppm/yr.
Is it your contention that CO2 is rising 45ppm/yr?
Nate,
IPCC (2013) disagrees with you. Their Te for outflow to ocean is 9.7 years and outflow to land at 5.5 years. This gives an overall Te of 3.5 years. According to you Te for outflow to ocean is some very large number.
“If that were true”
Its your equations…so?
Dont know where u got 60% math.
“According to you Te for outflow to ocean is some very large number.”
The very large Te is from the mixed layer ML to deep ocean.
So added CO2 has nowhere to dissappear. It just keeps accumulating in atm, land and ML.
“The very large Te is from the mixed layer ML to deep ocean”
No, it is a very large Te from Deep Ocean to mixed layer. The Te is set by the mixed layer, not the deep ocean. The Te from mixed layer to deep ocean is about 9 years. The deep ocean sets the flow from the deep ocean to the mixed layer, 37100/102=363 years.
“Dont know where u got 60% math.”
From you. You’re the one who said the flow from atmosphere to ocean was virtually nil. So, the only flow is from atmosphere to land, according to you. So, if you eliminate all the flow from atmosphere to deep ocean then outflow drops and dCO2/dt goes to about 45ppm per year.
“The Te from mixed layer to deep ocean is about 9 years.”
Evidence?
I think you are speculating.
Sorry, meant to say from atmosphere to surface ocean eliminated. You’d have from my numbers above, 109.5 – 64.5 = 45ppm/yr= dCO2/dt.
Also, I completely agree with you, the Lb of the surface ocean or mixed layer is set by the inflows from the atmosphere and deep ocean.
Nate,
One other thing, it is not set by the atmospheric pressure but the partial pressure of CO2 in the atmosphere according to Henry’s Law and the Ideal Gas Law.
When you going to deal with this problem?
“The problem is that in the real ocean, the concentration L in the ocean is NEVER near 0.
So there is NEVER going to be a flow of
dC/dt = (Lb-0)/Te = 107 ppm/yr”
Evidence?
I think you are speculating……
IPCC (2013) data.
“When you going to deal with this problem?
“The problem is that in the real ocean, the concentration L in the ocean is NEVER near 0.”
No, it is never near zero. For natural carbon IPCC (2013) has a value of 900PgC. L in the ocean doesn’t set the outflow from the atmosphere. L in the ocean sets the flow from surface ocean to atmosphere and from surface ocean to deep ocean. L in the atmosphere sets the flow from the atmosphere to the ocean according to Henry’s Law and the Ideal Gas Law.
“So there is NEVER going to be a flow of
dC/dt = (Lb-0)/Te = 107 ppm/yr”
But there is. It is right there in the IPCC (2013) report. However, the 107.5ppm/yr is total flow to land and to ocean of all carbon. The math just isn’t on your side.
The evidence isn’t on your side either.
“So there is NEVER going to be a flow of
dC/dt = (Lb-0)/Te = 107 ppm/yr”
Well this is your equation. Given that L is close to Lb, the dC/dt is never 107 ppm/yr.
“But there is. It is right there in the IPCC (2013) report”
Exactly, so that tells us your theory and understanding of the natural flows is incorrect.
“L in the ocean doesnt set the outflow from the atmosphere.”
Very wrong, Stephen. The L in the ocean produces a back pressure on the atmosphere, which reduces the flow of gas from the atmosphere.
The atm partial pressure of CO2 sets the balance concentration of CO2 in the ocean, Lb by Henry’s Law.
Once the L reaches Lb, there is no more flow from the atmosphere, because the ocean is then producing a back pressure = the co2 partial pressurecin the atm. They are in equilibrium.
“Very wrong, Stephen. The L in the ocean produces a back pressure on the atmosphere, which reduces the flow of gas from the atmosphere.”
Not according to Henry’s Law. (The amount of gas that dissolves in a liquid is directly proportional to the partial pressure of the gas above the liquid.) The L in the Surface Ocean sets the outflow from the ocean to the atmosphere and the deep ocean.
“Once the L reaches Lb, there is no more flow from the atmosphere, because the ocean is then producing a back pressure = the co2 partial pressurecin the atm. They are in equilibrium.”
You are getting your L’s and Lb’s mixed up and you don’t understand the continuity equation. When the Lb(atm) = L(atm), dCO2/dt=0, but there are still inflow and outflow. The same for surface ocean. The same for deep ocean. The same for land. Gross conceptual error.
Nate’s new hypothesis. If L of all the reservoirs are equal, then all CO2 flow stops. That’s a novel hypothesis Nate. You should submit it to IPCC or better yet the Nobel Committee.
“When the Lb(atm) = L(atm), dCO2/dt=0, but there are still inflow and outflow”
There is exchange (swapping) of molecules at the boundary. That is not a net FLOW of gas, which is dC/dt.
In your bottle of soda you’re thinking that there is flow of CO2 between the liquid and the gas?
No. There is only swapping of individual molecules. Not flow.
Now open the bottle and allow the pressure to drop in the bottle. Then when closed again, because of the pressure drop there will be a flow of CO2 from the liquid to the gas phase. We can observe that by the bubbling that continues for a few minutes.
This results in a net removal of CO2 from the bottle, and both liquid and gas.
Just as adding CO2 pressure to the bottle results in adding CO2 mass to both gas and liquid reservoirs. Just as anthro carbon added to the atmosphere increases co2 mass in both atm and ocean.
Stephen, here is the Google AI description of the natural carbon flows in the carbon cycle.
“Carbon cycle flows are the movements of carbon between Earth’s reservoirs, including the atmosphere, oceans, land, and living organisms, driven by processes like photosynthesis, respiration, decomposition, and combustion.”
These are all driven non-equilibrium processes that produce macroscopic movement of carbon between reservoirs
These are not simply exchanges of molecules between reservoirs in equilibrium.
For example respiration of plants and animala. When we breath out we are producing a NET flow of CO2 from our lungs to the atmosphere. It is because of high concentration of CO2 in the blood in our veins. Nonequilibrium.
Nate asked google the wrong question. the correct question returns a response wide enough to see how wrong nate is in his argument thru this entire thread.
”The flow of CO2 between the ocean and atmosphere is driven by air-sea gas exchange, a process that becomes disequilibrium when one reservoir’s chemical or physical conditions change, creating a flux. For example, the uptake of atmospheric CO2 by photosynthetic organisms in the ocean lowers the partial pressure of CO2 in surface waters, enhancing the downward flux from the atmosphere. Similarly, if the ocean warms, it releases dissolved into the atmosphere.”
Nate,
None of your last two posts change anything. All they do is solidify your gross conceptual error. But I do have a question. If there is no flow of CO2 from the atmosphere to the ocean, how are the plants surviving? (Algae, phytoplankton, seaweed, kelp, etc.) Where are they getting their CO2 from?
P.S.- You’ve done nothing but expose your gross conceptual error the last couple of days and we’re just going in circles. I see why Berry tired of you quickly. Believe what you want to believe. You’re going to anyway.
“None of your last two posts change anything”
Thats not how honest debate works Stephen. You have to deal with facts that contradict your claims.
Here you are simply ignoring them.
“If there is no flow of CO2 from the atmosphere to the ocean, how are the plants surviving? (Algae, phytoplankton, seaweed, kelp, etc.) Where are they getting their CO2 from?”
Nowhere have I said there is no flow from atm to ocean. Ive stated many times that the surface ocean, where light gathering plants and organisms live, is increasing its Co2 concentration, keeping up with the increase from the atmosphere.
Nate,
You went from trying to make a mathematical argument and failing miserably but at least trying to essentially pointlessness.
“Oh, but its the molecules and, and, when we breath out there’s flow…and, and…”
Nate,
You’ve lost the debate and I think you know it but even if you don’t your nature is to keep going on way past relevancy and I’m not interested.
Nate,
You lie so much you can’t keep track of your lies…..
“For example, the atmosphere emits to the ocean and land. If the ocean has a level Lo = Latm, then there is no emission.
Zero.
Outflow = (Latm-Lo)/Te
Currently Latm and Lo are very nearly equal.”
stephen p anderson, it’s not physically impossible for that 4% of emissions to accumulate in the atmosphere, due to sinks not increasing by 4%. It’s the increase which results in warming.
“You lie so much you can’t keep track of your lies…..
“For example, the atmosphere emits to the ocean and land. If the ocean has a level Lo = Latm, then there is no emission.
Zero.
Outflow = (Latm-Lo)/Te
Currently Latm and Lo are very nearly equal.”
Yep, as I noted, that is YOUR equation, and what it finds for the FLOW of carbon in equilibrium between reservoirs does not agree with the observed natural flows of ~ 110 ppm/yr
As the evidence shows. The actual flows in the carbon cycle are NOT happening in equilibrium.
They are caused by DRIVEN nonequilibrium pocesses like pumping action of photosynthesis, plant an animal respiration, decomposition, ocean T disequilibrium, etc.
These are all cyclic driven processes that simply move carbon around without removing it.
While anthro carbon is being added to this cycle.
You and Berry suggest that flow is Lb/Te = 110 ppm/yr to somewhere where it disappears. Therefore the added anthro of 5 ppm/yr must also must flow out to the somewhere and dissappear.
This is a wrong interpretation. The flows are not removing carbon, just moving it around.
Nate,
It isn’t an interpretation. It’s math. It is the only math that fits the data. I know you’ll have some dumb response like, “according to you.” But your problem Nate is that it is tough to argue against math. I know you propagandists try, knowing that most of the population like Mike Roberts, can’t understand the math but unfortunately for you, I do.
Nate claims that dCO2/dt = Inputs – Outputs is my equation. That’s novel, Nate. Your barrel example above was dL/dt = Inputs – Outputs. The number of people (NP) in a building per unit time is dNP/dt = Inputs – Outputs. The number of anything in anything is d()/dt = Inputs – Outputs. It isn’t my equation Nate it is Nature’s equation. Also mass flow rate x time = total mass. That isn’t my equation Nate, that’s the Creator’s equation. You can call it Nature or Physics or whatever, but it isn’t my equation.
“It isn’t an interpretation. It’s math.”
Sorry, math alone is not science.
It is a valid equation. It says that when two reservoirs are in equilibtium there is no transfer of carbon MASS between them.
On Earth, there ARE cyclic transfers of carbon mass between reservoirs..because there are nonequilibrium driven dynamics.
In the Northern Hemisphere in the warm months there is a huge flow of carbon into the forests as a result of photosynthesis. It is like a forest carbon pump has been turned on.
It is not explained by your Lb/Te input flux.
Then in winter, the pump turns off.
The N-S asymmetry produces an oscillation in atm CO2.
https://gml.noaa.gov/aftp/products/movies/pumphandle_latest.mp4
Every natural law is based on math.
Different phenomena require different physics and math.
The Shrodinger Equation doesnt apply to planetary orbits.
“It is not explained by your Lb/Te input flux.”
Sure, it is. But we have the yearly data. The continuity equation works for any unit of time. Also, thanks for reminding us that CO2 follows temperature.
When the slope is increasing, dCO2/dt is positive. Inflow is greater than outflow. When dCO2/dt is negative, Inflow is less than outflow. Inflow= Lb/Te and Outflow = L/Te still work. Most of the seasonal sinusoidal behavior is regulated by inflow.
“Different phenomena require different physics and math.
The Shrodinger Equation doesnt apply to planetary orbits.”
Wow, that’s very profound Nate. Doesn’t support your argument but it’s very profound.
Nate,
I looked it up. There is a Hamiltonian Operator for planetary motion.
C’mon Stephen,
It aint sufficient for any scientist to say, I wrote down some math, therefore it explains this phenomenon.
Your equation for input = Lb/Te does NOT explain the uptake of carbon by forests through photosynthesis. It is just not applicable to that.
Your theory does not explain why CO2 was flat at around 280 ppm for the last 10,000 years and then shot up to 440 ppm, mostly in the last 60 years.
It has nothing to offer to explain that. That is a failure of your theory.
However the theory of how anthropogenic emissions provide a quantitative causal mechanism accounts extremely well for the rise.
Since accurate measurements of both atm concentration and cumulative emissions have been made, (1959) this what plotting one against the other looks like,
https://climexp.knmi.nl/data/icum_global_co2_emissions_1959:2025corr997594.png
It is a nearly perfect linear relationship, as predicted.
Nate,
I don’t know what the CO2 level has been the last 10,000 years and neither do you. I do know that the math doesn’t support Gadden’s assertion that the CO2 rise is man-made.
Just continuing to have no answers. No response to the inconvenient facts shown to you.
Here’s another to address your claim that ‘we dont know’ about past CO2. Of course we do know from air bubbles trapped in Anyarctic ice.
https://www.antarcticglaciers.org/glaciers-and-climate/ice-cores/ice-core-basics/
Nate,
What are you rambling on about? I’m supposed to respond to your speculation and propaganda and go off on one of your red herrings about proxy data. The math doesn’t support the assertion that the CO2 rise is man made. That is the cold hard fact. Anything else you’ve brought up is speculation and not pertinent.
Inconvenient facts- Al Gore
C’mon Man- Joe Biden
Greta next?
You’re a propagandist, Nate. Nothing more.
Stephen,
If you are at the point where actual data needs to be dismussed as speculation then your argument is a loser.
if your theory cannot account for the observations, then what is the point of it?
Nate,
You are a terrible propagandist. That is not how science works. You don’t get to play whataboutism in science. What about this? Well, what about this? In science, it only takes one thing to falsify a theory. Your theory that the CO2 rise is man-made is falsified.
[October 16, 2025 at 5:18 PM] You don’t get to play whataboutism in science.
[October 7, 2025 at 7:31 AM] Hey Gadden, if only 4% of yearly emissions are from humans then how can all of the increase in CO2 since 1750 be due to humans when during that time most fossil fuel emissions were much much less than 4%?
Ad hom attacks to avoid giving answers that you dont have.
This is all about what has been causing the sharp rapid rise in atm CO2.
Your theory cannot explain it.
Science’s theory (humans added it) explains the data, quantitativly.
You keep howling in the wind, ‘but the math!’, without recognizing that all the theories use math, not just yours.
Not all theories that use math can be right. They have to be tested against observations.
Your fails that test.
Sorry.
“In science, it only takes one thing to falsify a theory. Your theory that the CO2 rise is man-made is falsified.”
Yes Feynman made it absolutely clear that the ‘one thing’ is an observation or experiment.
Not theory or the math in it.
Which observation or measurement falsifies the theory that humans are causing the rise?
And no, don’t bother to simply repeat your theory.
And you still don’t comprehend. The evidence has to fit the math. The continuity equation is the evidence. It fits all the data.
Nate,
It is like the lapse rate. The lapse rate is an equation. It falsifies the GHE. The Equivalence Principle is a Scientific Principle. It falsifies the IPCC’s Carbon Cycle Model and the Bern Model. You can’t have a Model that is mathematically incorrect.
“The continuity equation is the evidence. It fits all the data”
You are just saying stuff that pops into your head, that has no basis in reality.
There is no such evidence.
Im sorry that your theory fails to agree with the observations rendering it useless.
But keep the dream alive.
“It is like the lapse rate. The lapse rate is an equation. It falsifies the GHE.”
This makes absolutely no sense Stephen.
It doesn’t make any sense if you have no mathematical comprehension.
It doesn’t make sense to a fish either.
This is Nate’s goal, to turn it from a mathematical debate, which he loses badly to a whataboutism debate. Obfuscation and chaos are the propagandist’s goal.
Here it is again Nate. It explains it perfectly.
dCO2/dt = Inflow – Outflow
Inflow=Lb/Te (Lb=Balance Level)
Outflow= L/Te
L=430ppm
If we use dC/dt=2ppm/yr (4.24PgC/yr) and a Te of 4 years.
Outflow=430ppm/4yr=107.5 ppm/yr
Inflow= 107.5ppm/yr+ 2ppm/yr =109.5ppm/yr
Balance Level = 109.5ppm/yr(4yr)=438ppm
Te (eTime) is the time it takes for Level to reach 0.693 the distance from the level to the balance level. So, in 4 years from now, the level should be 435.54ppm.
If inflow is 5ppm human and 104.5ppm natural, then in 4 years when the level is 435.5ppm, human CO2 can be no more than 20ppm of the total. Outflow, which is 107.5ppm/yr, is 4.945ppm/yr human and 102.555ppm/yr natural. So, of the 2ppm/yr increase, 0.055ppm is human and 1.945ppm is natural. Natural emissions are greater than natural sinks. This is conservation of mass and in compliance with the equivalence principle.
Yes, this is a restatement of your theory.
What observations does it explain?
Does it account for the 120 ppm rise in the last 65 years?
Does it explain the curreny 2 ppm rise per year?
Science’s theory DOES explain those things.
And the data I gave you shows a linear relationship between cumulative human emissions and atm concentration over the last 65 y of observations, in agreement with theory.
Can your theory explain that?
If not, then that is a failure of your theory.
During the Little Ice Age, temperatures cooled by 0.25 to 0.5 C, but atm CO2 changed by 7 ppm.
So clearly temperature change is not the cause of the 150 ppm rise in the last century.
So we have sciences theory which fully accounts for the rise.
And your theory which offers no sound explanation.
That is a failure of your theory. Feynman says then it must be wrong.
es, this is a restatement of your theory.
“What observations does it explain?” Most of the CO2 rise is natural.
“Does it account for the 120 ppm rise in the last 65 years?” Yes
“Does it explain the curreny 2 ppm rise per year?” Yes
Science’s theory DOES explain those things.
And the data I gave you shows a linear relationship between cumulative human emissions and atm concentration over the last 65 y of observations, in agreement with theory.
“Can your theory explain that?” Yes, it shows mathematically that most of the rise is natural.
If not, then that is a failure of your theory.
“During the Little Ice Age, temperatures cooled by 0.25 to 0.5 C, but atm CO2 changed by 7 ppm.
So clearly temperature change is not the cause of the 150 ppm rise in the last century.” Speculation
“So we have sciences theory which fully accounts for the rise.” Mathematically it doesn’t.
“And your theory which offers no sound explanation.” It does, natural emissions.
“That is a failure of your theory. Feynman says then it must be wrong.” Your theory is based on speculation. Mine isn’t.
“What observations does it explain?” Most of the CO2 rise is natural.”
Theory not observation.
Do you not understand the difference?
“Does it account for the 120 ppm rise in the last 65 years?” Yes”
No mechanism offered, no credit.
““Does it explain the curreny 2 ppm rise per year?” Yes”
No mechinism, no credit.
“Theory not observation.” Theory based on observation.
“Do you not understand the difference?” Yes, do you?
“No mechanism offered, no credit.” Natural emission data is from IPCC.
“No mechinism, no credit.” See continuity equation above.
Pure BS Stephen.
You have not connected the dots between your equations and the rapid rise of CO2 in the last century.
Given that CO2 is rising in air, ocean, land, and biosphere, your theory lacks a source for this added carbon.
“Pure BS Stephen.
You have not connected the dots between your equations and the rapid rise of CO2 in the last century.
Given that CO2 is rising in air, ocean, land, and biosphere, your theory lacks a source for this added carbon.”
This is your opinion. I’m not attempting to connect dots. The continuity equation falsifies that the atmospheric CO2 rise is due to fossil fuels. Fossil fuels can only account for about 4% of the rise. Also, the lapse rate falsifies the GHE. It’s math.
Shamelessly ignoring inconvenient facts that are inconsistent with your theory.
Theories live or die on their agreement with observations.
Nate,
This is from IPCC 2007:
“Turnover time “T” is the ratio of the mass “M” of a reservoir and the total rate of removal “S.” So, T=M/S. For each removal process separate turnover times can be identified.”
It says the turnover time for Natural CO2 is about 4 years. It assumes natural CO2 has remained at 280ppm and all the rise is due to humans.
Can you explain how nature differentiates between natural and human CO2?
Nate,
Ballantyne et. al. (2012) found there is no empirical evidence that the ability of the land and oceans to absorb atmospheric CO2 has started to diminish on a global scale. This means human CO2 has not changed the turnover time.
“Ballantyne et. al. (2012) found there is no empirical evidence that the ability of the land and oceans to absorb atmospheric CO2 has started to diminish on a global scale”
Of no relevance to this discussion Stephen. You are missing the point of the paper.
It is saying that the current ability is not diminishing.
It is NOT saying that the current rate is sufficient to prevent emissions from accumulating in the atmosphere.
Did you miss this sentence in Ballantyne 2012?
“Since 1959, approx. 350 billion tonnes of carbon have been emitted humans to the atmosphere, of which about 55% has moved into land and oceans”
Thus 45% remains.
Simply not consistent with your theory.
“It says the turnover time for Natural CO2 is about 4 years. It assumes natural CO2 has remained at 280ppm and all the rise is due to humans.
Can you explain how nature differentiates between natural and human CO2?”
No need. The carbon added to the atmosphere may take 4 y to equilibrate with the land and ocean. But it returns. Most of it is not elimnated to the deep ocean. It just keeps circlating, atm -land-atm-ocean-atm.
Anything added is still present in this circulation.Thus only 45 % of added carbon remains in the atmosphere.
Even your math says nothing about this fraction.
The flow from the surface ocean to the deep ocean is the same as the flow from the surface ocean to the atmosphere. I agree with you. Some of the carbon that flows from the surface ocean to the atmosphere was human carbon, but the total percent is never more than about 4-5%. Berry ran all the numbers on that in his third paper. He says it can be as high as 25% of the increase in his third paper but he is being conservative. 25% of the increase would put it at about 30-35ppm of the total.
So, from Berry’s third paper, based on the Law of Superposition, eTimes for natural carbon and human carbon are the same. So human carbon flows into the atmosphere and then is distributed proportionately (and cycles like you claim) as natural carbon. Therefore, using IPCC 2013 data to determine flows and eTimes, the human carbon in 2020 was distributed as:
Land-92.5 ppmv, atmosphere-33.1ppmv, surface ocean-17.9 ppmv, and deep ocean-69.5ppmv for a total of 213ppmv since 1750.
So, for human carbon in the atmosphere, it is only 33.1/430=8% of atmospheric carbon. The rise has been about 130ppm therefore most of the rise is due to natural carbon.
“Did you miss this sentence in Ballantyne 2012?
“Since 1959, approx. 350 billion tonnes of carbon have been emitted humans to the atmosphere, of which about 55% has moved into land and oceans”
Thus 45% remains.
Simply not consistent with your theory.”
Ballantyne did not understand the continuity equation or that natural and human CO2 have the same eTimes. So, it flows from reservoir to reservoir just like natural carbon.
“The flow from the surface ocean to the deep ocean is the same as the flow from the surface ocean to the atmosphere. I agree with you.”
I never said that. It makes bo sense, and there is no evidence for it.
“Ballantyne did not understand the continuity equation or that natural and human CO2 have the same eTimes. So, it flows from reservoir to reservoir just like natural carbon”
Pure ad hom attack, as opppsed to criticizing the science content of the paper that you cited.
Your assumption that carbon cycle experts dont understand conservation of mass etc is implausible.
Weak.
“Berry ran all the numbers on that in his third paper. He says”
Clearly your argument is ‘Berry is right, because he is a genius and I believe him’ and the hundreds of other carbon cycle experts are wrong because they must be stoopid and have not yet grasped Berry’s genius.
Very unconvincing.
“The flow from the surface ocean to the deep ocean is the same as the flow from the surface ocean to the atmosphere. I agree with you.
I never said that. It makes no sense, and there is no evidence for it.”
I thought you said it. If you understood you would have said it. It makes no sense to fish either. So, let’s take this one step at a time. Two questions: How does natural carbon flow to the deep ocean, but human carbon does not? Why does the IPCC have human carbon in their deep ocean inventory in their carbon cycle model if the?
“The flow from the surface ocean to the deep ocean is the same as the flow from the surface ocean to the atmosphere. I agree with you.
I never said that. It makes no sense, and there is no evidence for it.”
I thought you said it. If you understood you would have said it. It makes no sense to fish either. So, let’s take this one step at a time. Two questions: How does natural carbon flow to the deep ocean, but human carbon does not? Why does the IPCC have human carbon in their deep ocean inventory in their carbon cycle model if there is no evidence for it? (155PgC)
Nate,
Is that 155PgC one of those inconvenient facts you were talking about? Berry’s 69.5ppmv= 147PgC is pretty close to that IPCC number. Berry must be on to something. Berry did his own independent analysis using data from Keeling and others I believe. However, the difference is Berry is a true scientist and not trying to advance an agenda.
“However, the difference is Berry is a true scientist and not trying to advance an agenda.”
I see, so going back 65 y to, the 1950s, Revelle, etc have had a agenda to advance what? Climate change that nobody heard about yet?
C’mon, Stephen,
How do you tell Berry is a ‘true scientist’ and all the others are not?
Maybe you have an agenda?
“However, the difference is Berry is a true scientist and not trying to advance an agenda.”
I see, so going back 65 y to, the 1950s, Revelle, etc have had a agenda to advance what? Climate change that nobody heard about yet?
C’mon, Stephen,
How do you tell Berry is a ‘true scientist’ and all the others are not?
Maybe you have an agenda?”
You’re just a bundle of disinformation, aren’t you? Are you Soros’ Chief Climate Crazy? If he wants to pay me too, I’ll stop providing all these inconvenient facts. Revelle was the Father of climate change lunacy. He started it all. Berkley should have invalidated his diploma for fraudulent science.
Getting back to our debate, why didn’t you answer my questions? (I already know why) I’ve got more inconvenient questions once you answer those. I’ve got more questions even if you don’t answer which I suspect you will not.
“How do you tell Berry is a ‘true scientist’ and all the others are not?”
Since you cant tell me, I will tell you.
You ‘know’ based on his anti-climate-change politics aligning with yours.
You both have the same own-the-libs political agenda, thus you ‘know’ he is a real man and real scientist.
You dont need to understand the science much, since you can substitute your political judgement in for science knowledge.
Of course that results in horrible science, like Trump and RFK Jr deciding that vaccines or Tylenol causes Autism.
Thus you have ignored all the inconvenient actual scientific facts Ive shown you here, Stephen.
Which, for any neutral observer are strong evidence for humans causing the rise of atm CO2.
Given your mode of thinking, no amount of evidence can affect it.
There is no point in continuing.
“Your assumption that carbon cycle experts don’t understand conservation of mass etc. is implausible.”
I don’t think most do or they wouldn’t use the wrong equation for dCO2/dt in the atmosphere (and you) like Ballantyne. So, Ballantyne uses this equation:
dCO2/dt= Ef-En
Where Ef= Sum of one-way flows into the atmosphere
En= Sum of the net exchanges between the atmosphere and land and ocean.
He got this non-physics-based equation which is an assumption by the way from Revelle. The assumption is human CO2 remains in the atmosphere. He labels human flow as a one-way flow but then in the same work says that only half remains in the atmosphere. This is someone like Revelle who doesn’t understand the math (or maybe they do and don’t care) and are trying to make a name for themselves with an agenda. Not Berry or me. We follow the math.
So, is the above equation correct or is dCO2/dt = Inflow – Outflow, correct? And do you think that believing they don’t or didn’t understand conservation of mass and Berry does implausible in light of this?
None of that is an accurate representation of what was being done.
“None of that is an accurate representation of what was being done.”
Really?
https://www.drroyspencer.com/2025/10/uah-v6-1-global-temperature-update-for-september-2025-0-53-deg-c/#comment-1718828
Key questions for you left unanswered.
Stephen,
“He got this non-physics-based equation”
This equation is simply a straightforward expression of conservation of mass.
No one needed to give that to him. It is self evident.
It is absurd to claim that is somehow inconsistent with physics.
“Stephen,
“He got this non-physics-based equation”
This equation is simply a straightforward expression of conservation of mass.
No one needed to give that to him. It is self evident.
It is absurd to claim that is somehow inconsistent with physics.”
Nate,
How is assuming some flows into the atmosphere are one-way a conservation of mass? Why would it not be inputs – outputs? Also, will you explain the mechanism for how nature differentiates a human CO2 molecule and a natural CO2 molecule? I don’t expect you to answer because you don’t answer questions. You expose your absurdities if you answer questions.
It seems Stephen that unless it is a Berry paper you cant understand it.
“How is assuming some flows into the atmosphere are one-way a conservation of mass?”
Think about the digging up and burning of the fossil fuel carbon reservoir that ends up flowing into the atmosphere. It never flows back into the coal mine nor the oil well.
That is safely modelled as a one way flow.
No physics violations, Stephen.
“Think about the digging up and burning of the fossil fuel carbon reservoir that ends up flowing into the atmosphere. It never flows back into the coal mine nor the oil well.”
Yes, you’re taking carbon from the slow carbon cycle and introducing it to the fast carbon cycle. However, once it is in the atmosphere it can’t be differentiated from any other carbon. So, the question is once it goes to the fast carbon cycle, how long does it stay in the atmosphere. It distributes to land, surface ocean, and deep ocean, just like natural carbon. It has the same turnover times as natural carbon. Now, mathematically, it can’t be more than about 8% of the total carbon in the atmosphere. That is a mathematical fact.
So, then there is no physics problem with there equation. Good.
There are several problems with it. First, the system isn’t the fast cycle. So, it isn’t inflows and outflows from the fast cycle. The system is the atmosphere. Second, in nature, there is no such thing as one-way flows, even with the slow cycle. Third, he isn’t assuming the human CO2 is staying in the fast cycle, he is assuming it stays in the atmosphere. From ICPP 2013 even they don’t assume it does.
“First, the system isn’t the fast cycle. So, it isn’t inflows and outflows from the fast cycle. The system is the atmosphere. Second, in nature, there is no such thing as one-way flows, even with the slow cycle.”
Above you agreed that there was effectively a one-way flow from FF reservoirs to the fast cycle. Not sure what you are now complaining about.
“Third, he isn’t assuming the human CO2 is staying in the fast cycle, he is assuming it stays in the atmosphere.”
Not at all.
They clearly state that:
“Since 1959, approximately 350 billion tonnes of carbon have been emitted by humans to the atmosphere, of which about 55 per cent has moved into the land and oceans.”
And
“it can be argued that only FF should be
included in these calculations because it represents the addition of truly extrinsic C to the modern C cycle, which will be redistributed between the atmosphere, oceans and land.”
“They clearly state that:
“Since 1959, approximately 350 billion tonnes of carbon have been emitted by humans to the atmosphere, of which about 55 per cent has moved into the land and oceans.”
Well, at least you agree it isn’t a one-way flow. Their 55 percent is wrong. Berry showed mathematically using the continuity equation that FF CO2 can only be 8% of the atmosphere, max. That would be about 30-35ppm.
“And,
“It can be argued that only FF should be
included in these calculations because it represents the addition of truly extrinsic C to the modern C cycle, which will be redistributed between the atmosphere, oceans and land.”
Berry did apply FF to his calculations as part of inflow into the atmosphere at it should be. However, he didn’t assign it a different turnover time like Revelle did which would be a violation of the Equivalence Principle. If so you’ll need to explain how nature does that.
Doesn’t matter. Global population will peak by 2055 at just over 9 billion
and then fall 80% over the next century. Population has already peaked in the developed world and would be collapsing were it not for immigration. Deaths exceeded births in Germany in 1972! Dramatic drops underway in Japan, China, Korea, Taiwan, Thailand, Russia and much of Europe. Latin America not far behind. Parts of Africa moving in the same direction.
That’s a mixed blessing. Emissions are concentrated among the wealthiest nations with the lowest rates of population replacement. One China or India reaching Western levels of consumption would wipe out all the global gains from population reduction for decades after the peak.
Nate,
Not according to IPCC(2013). Te from atmosphere to ocean is 9.7 years and atmosphere to land is 5.5 years. And being the good mathematician that you are, you compute the overall Te to be 3.5 years. I used 4 years in my calculation above to be conservative.
Richard M (last month):
“The change to the AMO cool phase is due soon.”
Oops. The latest value is the warmest in 5 months.
As far as I can tell, the AMO cool phase is overdue by about 40 years.
AMO cooling is due, but I wouldn’t even say its overdue.
https://localartist.org/media/JupiterSaturnConnectionAMO.png
I’ve updated my spike comparison plot with the latest UAH data. Do compare with the plot above.
https://localartist.org/media/HTvAkjsaENSO2509.png
What’s coming soon is the arrival of La Niña. It’s dragging its feet for now, but it’s just around the corner. Then temperatures will drop.
My claim was based on a very simple calculation. The last 3 phase changes (1932 1962 1996) average out to about 31.3 years. While I have predicted 2027 is the highest probability year based on this history, why would anyone think a new phase change is not imminent (less than 5 years)?
Richard,
Just dont see much predictability here:
https://climexp.knmi.nl/getindices.cgi?WMO=UKMOData/amo_hadsst&STATION=AMO_hadsst&TYPE=i&id=someone@somewhere
Third warmest September, though still a lot cooler than the previous two years.
Year Anomaly
1 2024 0.81
2 2023 0.80
3 2025 0.53
4 2019 0.44
5 2020 0.40
6 2017 0.39
7 2016 0.30
8 1998 0.28
9 2021 0.26
10= 2010 0.20
11= 2022 0.20
My projection for 2025 is now 0.475 +/- 0.068C, with a 90% chance that 2025 will be the 2nd warmest year on record.
Your projection for the year is spot on, Bellman, using the UAH satellite data. It’s more of a nip-and-tuck race between 2023 and 2025 for the second hottest year in the surface temperature data sets. 2023 has the edge in the NOAA-NCEI data set, while 2025 has a small edge in the NASA-GISS data. No matter how it’s measured, the last three years will be the three hottest years in the instrumented record, by quite a good margin.
As Roy noted the trend since the start is 0.16 deg/decade.
But the trend over the last 20 y is nearly double that, at 0.31 deg/decade.
The warming has accelerated.
True, but each and every deviation from a mean that takes place within a period of 30 years or less is part of the domain called ‘weather’. Nothing to do with climate right.
Technically correct but the trend refers to the underlying increase in the 30-year mean(s).
Yes, the trend is accelerating. The instantaneous rate of warming from a second order polynomial fit to the data is 0.27 deg/decade.
Really? So the peak event of the last 3 years is part of the long term trend? Interesting!
So you think that a .16 C warming trend since 1979, isn’t a trend?
No more or less than the trough of the prior 3 years of La Nina.
And yet overall, the trend has accelerated.
Called it 10 days ago (or so).
See https://oz4caster.wordpress.com/cfsr/.
It’s not controversial that the warming has accelerated since the ~1970s. It also decelerated (slightly) mid 20th century.
If there’s “settled” climate science, it’s the climate (temperature…) record of the last ~150 years. The global (AMO-like) pattern is supported by solid evidence.
Did Hunga Tonga erupt again?
Must have, lol!
No need for Tonga Shmonga eruptions, you quietly recalibrate the sensors and viola – beautiful step up in temperature
Eben, “No need for Tonga Shmonga eruptions, you quietly recalibrate the sensors and viola – beautiful step up in temperature”
You do know that Spencer and Christy at UAH are ‘contrarians’, right? (And please tell me that “viola” is either a typo or a joke.)
Lol
September’s uptick could be best explained from good global albedo data, is such existed.
There was also an uptick in sunspots.
The new Monckton Pause extends to 30 months starting in 2023/04. The average of this pause is 0.62 C. The previous Monckton Pause started in 2014/06 and lasted 107 months and had an average of 0.21 C. That makes this pause 0.41 C higher than the previous one.
+0.156 +- 0.040 C.decade-1 k=2 is the trend from 1979/01 to 2025/09.
+0.027 +- 0.010 C.decade-2 k=2 is the acceleration of the trend.
My prediction for 2025 from the 2025/03 update was 0.43 +- 0.16 C k=2.
My prediction for 2025 from the 2025/04 update was 0.47 +- 0.14 C k=2.
My prediction for 2025 from the 2025/05 update was 0.46 +- 0.11 C k=2.
My prediction for 2025 from the 2025/06 update was 0.47 +- 0.10 C k=2.
My prediction for 2025 from the 2025/07 update was 0.46 +- 0.08 C k=2.
My prediction for 2025 from the 2025/08 update was 0.46 +- 0.06 C k=2.
My prediction for 2025 from the 2025/09 update is 0.48 +- 0.05 C k=2.
Time to sell your investment in LNG before the fashionable burtsts.
https://powering-the-planet.ghost.io/as-solar-dominates-the-sun-sets-on-the-lng-boom/?ref=powering-the-planet-newsletter
I have a comment on monthly variability. It is not “noise”. It represents natural dynamics in the atmosphere including weather events. Monthly data cannot signal a trend of any type, but that does not mean it is noise. It has value. A tight group from month to month should demonstrate stability of some type. In the same way, a progressive movement in one direction or another provides a clue. Beyond movement of the 13-month average, a new grouping such as we have over the last several months should have some significance.
Therefore, I think the atmosphere has cooled significantly this year. It is not noise any more than the surge that started in the beginning of 2023 is noise. Something real and significant has happened over the last 3 years. It demonstrates clearly that assigning cause and effect, or making claims about long term trends is very difficult. The only thing we can ever know for certain is the present state of the temperature of the atmosphere, not where it is going or what is causing it.
TS, if what you say is true, then the chances of next year being warmer/cooler than the last should be 50%/50%.
If betting on the outcome, the odds are the same as tossing a coin. You could offer me those same odds if you like and I will gladly stump up $1.
However, to sweeten the deal let me make this counter offer:
If it is cooler, you win $1.50
If it is warmer, I win only $1.00
Would you be interested?
Since your comment has nothing to do with anything in my comment, I will decline the offer of a stawman. I really am not interested in a random argument about nonsense.
Let’s make it simple for you.
Most forecasts these days are couched in probabilities.
All you have to do is nominate your estimate of the probabilities of it being warmer or cooler next year.
It’s not hard.
“Therefore, I think the atmosphere has cooled significantly this year.”
As it does every year after a strong El Nino peak occurs in the previous year.
The El Nino ended in May 2024 and was even replaced by La Nina conditions over the last 4 months of the year. Any El Nino effect was long gone by 2025.
The 2025 cooling is better explained by the Hunga-Tonga warming effect dissipating. It’s a slow effect and hard to see with the noise from ENSO and sunspots. It is likely to continue for at least another year.
Richard. It is well known that the effect of El Ninos or La Ninas on global T are delayed in UAH by 4-5 months. Because ocean warmth increases convection, whose heat is then transported around the world.
Look at the data.
Even in surface data, there is a delay of 3-4 months.
https://www.columbia.edu/~mhs119/ElNino-LaNina/
See 3rd and 4th figures.
“making claims about long term trends is very difficult”
Non sequitur. The long term trend short term variation are separable.
Think of it the Earth and its chaotic weather this way.
It is analogous to a pot of water placed on a burner with a thermometer. It is predictable that the thermometer will indicate a warming trend. Yet it will predictably show random variation due to the chaotic dynamics of heated water.
In the case of the Earth, the burner is the measurable increase in the GHE (forcing), that predictably must cause warming.
Wrong again, Nate. A stove burner is able to heat water because it is much hotter than the water. But CO2 is NOT hotter than Earth’s surface, so it can NOT raise surface temperature.
Like most of “climate science”, you don’t understand radiative physics or thermodynamics.
When you grow up you might learn that beliefs ain’t science.
Apparently the translation of ‘growing up’ from Clintspeak is ‘become more ignorant’.
No thanks.
Denying reality is only part of your immaturity, Nate. But, it’s required by your cult.
So, keep proving me right.
Until you actually attempt to support your claims with real physics, real facts and sound logic, your posts can be safely ignored.
More insults please.
Clint R
You know that Nate is correct about you. You make multiple statements but will never support even one with some established physics. You do not understand insulation at all. It does not add energy to a heated object, it slows down the loss of energy so a heated object gets hotter with insulation then without. CO2 and other GHG slow down the radiant energy loss of the surface and allow the solar input to achieve a higher surface temperture.
Maybe read up on insulation and come back later when you have something to say. Other than that you just insult, and belittle any and all who question you or tell you to support your claims.
As it stands for years you have not supported your claims with valid physics. Your posts ain’t science, just your made up version of how you think things work.
Child Nate, you started off trying to compare the atmosphere to a stove burner. It’s YOU that has NO understanding of the basic science.
You just make crap up vainly trying to support your cult beliefs.
And, if you’re insulted by reality, that’s no fault of mine.
What will you try next?
Norman, you’re getting as bad as gordon with all the false accusations.
Where did I ever say “insulation added energy to a heated object”?
You need to quote me precisely, instead of trying to pervert reality.
Clint R
It is somewhat sad that you do not even know how to logically follow your own points! You basically do say that “insulation added energy to a heated object”?
Your twisted and incorrect view of GHE is that CO2 is adding energy to the surface and warming it. If this was the actual GHE your twisted view would be correct that it violates the 2nd Law of Thermodynamics. But this view is wrong. The GHG in atmosphere act like an radiant insulator. The reduce the rate of radiant heat loss from the surface to space and allow the solar input energy to reach a higher surface temperature.
I have demonstrated this very clearly to you with the SURFRAD plots. You are not capable of grasping what the plots clearly show.
But I will attempt again to show you.
https://gml.noaa.gov/webdata/tmp/surfrad_68e16706d26c8.png
This clearly shows how GHG insulates and reduces the rate IR energy leaves the surface so that solar input will allow surface to reach a higher temperature.
You are far worse than Gordon Robertson as a alleged science poster. At least Gordon gives some sources for his points (even though mostly from crackpots). At least he does try to support his points. You don’t even make attempts at it. You just insult and put posters down, but you never offer support for any of your arrogant beliefs.
Norman, it appears you have been drinking again.
When you sober up, just link to one thing I actually said. That way I can maybe explain it so you can understand.
I’m willing to help, but you must be sober, and address ONE topic at a time. Endless rambling is what cult children do.
Nate says:
”In the case of the Earth, the burner is the measurable increase in the GHE (forcing), that predictably must cause warming.”
Yes if there is such a thing as GHE forcing. Unfortunately all the efforts at demonstrating a forcing fails. . .as you well know, since you have been provided with many many experiments that have failed, yet you still toot your horn as if you don’t see them.
And the fact is one cannot point to actual warming of the climate because the variables have not been adequately examined. In fact you sit here spouting through the top of your skull completely ignoring the many posts that Roy has posted over the past few years on UHI. Roy is a scientist, you are not.
“Yes if there is such a thing as GHE forcing. Unfortunately all the efforts at demonstrating a forcing fails.”
False. Direct observations from the surface and from space confirm it.
https://acp.copernicus.org/articles/24/6375/2024/
“Direct observational evidence from space of the effect of CO2 increase on longwave spectral radiances: the unique role of high-spectral-resolution measurements”
https://newscenter.lbl.gov/2015/02/25/co2-greenhouse-effect-increase/
”
“First Direct Observation of Carbon Dioxide,s Increasing Greenhouse Effect at the Earth’s Surface”
Nate, you can find crap like that all over the Internet. Neither of those two “papers” has ANY science.
The first one is claiming CO2 increases IR to space. Think about that. That would mean CO2 would increase cooling. They put out so much rambling blah-blah that they end up proving Skepitcs right!
“The first one is claiming CO2 increases IR to space.”
Who knows WTF you think you read, but Fig 1 and 2 clearly show a decrease due to added CO2.
But, if you still think it is claiming CO2 increases IR to space, quote it, and indicate page and paragraph.
Nate, find an adult to explain the title to you: Direct observational evidence from space of the effect of CO2 increase on longwave spectral radiances
As usual we have Nate WHO IS NOT A SCIENTIST posting up science papers he doesn’t even understand. Nowhere can he point out in the science papers the work that was done to establish that the near surface atmosphere would be a mean 255k without CO2 nor that it is as warm as it is due to CO2. There is nothing at all in his references that point out any such work.
Sheesh!
Clint demonstrates he is an ignoramus who can’t read.
The papers demontstrate a GHG climate forcing is observable.
As usual, Bill you are quite confused about what a climate forcing is.
Come back when you learn what it is.
sure Nate. I will be happy to right after you try to explain it. . .which of course you can’t.
Step 4 – Cheap Bargaining.
Bill, not taking the bait. Come back when you have something real.
we have been waiting for years for you to come up with ANYTHING scientific in nature that suggests the atmosphere is anything but a passive heat sink from heat leaving the surface and thus is incapable of dynamically forcing surface temperature.
Your entire schtick suggests that the atmosphere without CO2 would be colder than it is with and you have produced zero evidence of that.
Convection is more than capable of moving heat into the atmosphere all by itself and if there were no GHGs in the atmosphere the upper atmosphere would not cool as it does with GHGs.
Convection can’t eliminate the lapse rate because of the conversion of kinetic energy into work due to adiabatic expansion of the gases without any loss of energy.
You guys just want to ASS-U-ME the process is inefficient and can’t actually demonstrate that it is. Obviously the atmosphere is in a constant state of imbalance because of constant variation in rates of cooling and warming. . .so you just demonstrate the bottomless depth of your ignorance by constantly harping on the existence of an imbalance. Its such an obvious fact due to there being many heat sinks on this planet, the largest being the oceans.
A first year detective can see right through the lies and deception. There is so much nonsense being thrown about when you simply have to prove one thing. If you could do that the game would be over and nothing else would need to be said.
But its like how scientists deny the creation of the universe. They denied it for centuries claiming it was always here and endless in dimension. Then along came the discovery of redshift and now the universe was created . . . by a big bang. Now they are considering there may be other universes, probably just now recognizing that stars so far away may not have been in the big bang. . .at least when they think it happened. So does that mean multiple big bangs? Some different type of creation?
Science is science, scientists are people. The people don’t all agree. But you can bet that an honest poll would reveal people believe what they want to believe. . . and that’s a good thing because if it were any different we really would be doomed. The last guy to recognize they were wrong is the guy most invested in his having been right. Some scientists keep that in mind, others don’t.
Nate is on a tear of leftist ideology. Nate, explain the forcing component of the lapse rate, i.e.- where is it?
Standard meterology works very well and incrporates a GHE and a lapse rate.
Nothing leftist about it.
This is gobbldegook.
Roy Spencer explained this to you. You never comprehended what he was saying.
Nate,
I respect Dr. Spencer a lot. His only agenda is the advancement of the truth. But, he isn’t right about everything. Some of his explanations about different topics I have problems with. One of them is this. He is way off on this. There is no radiative component in the lapse rate. The reason for the temperature difference at the base and summit of Mauna Loa is hydrostatic pressure. There is no radiative component causing the difference. GHE is a fraud. There might be some teeny tiny amount of radiative forcing in the atmosphere, and at very short distances, but it ain’t 33C.
“He is way off on this. There is no radiative component in the lapse rate. The reason for the temperature difference at the base and summit of Mauna Loa is hydrostatic pressure. There is no radiative component causing the difference. GHE is a fraud.”
I dont know where you get the idea that you know better about this central topic in meteorology, than Roy Spencer, a PhD meteorologist?
Particularly given that meteotology has a proven track record of success in predicting the weather.
How bout you?
Once again Nate is intent on proving that his only purpose here is to make argument for the sake of argument, In so doing, he demonstrates a complete lack of honesty and a failure to understand complex concepts.
I wrote a detailed comment contain several different ideas, with one conclusion as follows:
The only thing we can ever know for certain is the present state of the temperature of the atmosphere, not where it is going or what is causing it.
Nate plays his usual game of taking one sentence, or a partial sentence out of context to change the meaning for his propose to make a snide remark.
In January 2023 when there was a very low reading following 2 previous months of cooling, I do not remember seeing any comments that a very rapid rise would follow over the next few months.
In a similar way, in April 2024, I do not remember seeing any comments that this might be the peak, and a sustained period of cooling would follow over the next year.
Once again, nobody can predict where this is going. Some say warming will continue with increasing CO2 accumulation. Others say that the cool phase of AMO is coming in the next few years. I do not know, and I do not really care, except that I will be paying attention and interested in the outcome.
“The only thing we can ever know for certain is the present state of the temperature of the atmosphere, not where it is going or what is causing it.”
Nonsense, not supported by the available evidence.
Climate models do not predict short term variations, so it is a strawman to suggest that they need to.
The reality is that climate science has understood quite a lot about global warming, why it happens, and CAN predict that it will continue its long-term upward trend, as they have succeeded in doing reasonably accurately so far.
Nate still hasn’t figured out that his speculation isn’t science. My speculation is that CO2 follows temperature. So what?
That’s not a speculation. It’s well-known physics (Henry’s law). For example, towards the end of the last glacialization, atmospheric CO2 rose by around 10 ppm for every degree of global (average warming).
HOWEVER, what’s happening now is entirely different from the past. Humans now inject around 40 billion tons of CO2 into the atmosphere per year. You have to be remarkably unintelligent if you think these emissions don’t play a role in the 20 ton average annual increase in atmospheric CO2. This CO2 increase corresponds to around 2.6 ppm increase per year.
Note also that the average annual warming of the Earth is around 0.02 degrees, which would drive only 0.2 ppm of atmospheric CO2 increase if the deglacializations are anything to go by.
If Stephen P still doesn’t get it, he should check out the following link which shows beyond any doubt, based on carbon isotope analysis, how we know what is causing the current CO2 growth in the atmosphere: https://www.climate.gov/news-features/climate-qa/how-do-we-know-build-carbon-dioxide-atmosphere-caused-humans
Nate says:
”Climate models do not predict short term variations, so it is a strawman to suggest that they need to.”
They may not need to but the only reason they don’t is because they don’t understand what causes the climate to change. Otherwise it would be useful for them to include it. . .which at the very least would establish that they do know something about how climate changes.
An observation in itself strongly suggests that yes they do need to include it.
I’ve taken a keen interest since our overlords told us we’d all perish from the energy that provides us with great luxuries and freedom.
They’ve been proven demonstrably wrong.
We’re looking at tiny changes over a very small period of time and there’s obviously nothing to worry about.
That’s just a flex. Three sentences all factually wrong. Face it, temperatures are going up and we’re the cause.
If that is true, why is the data not enough? Why do people make wild and false claims? Why do people such as Dr Michael Mann claim that odd weather events are evidence of climate change, or that COVID-19 was caused by climate change. He is all over the news with those claims. Can you blame clueless news anchors for believing him?
If ur no skeptical ur no Scottish.
Gee Aye, David H’s sentences are factually correct. They may not agree with your beliefs, but beliefs ain’t science.
Do you have any science you want to discuss?
Temperatures are going up,and we are the cause, says Gee Aye, bet you can not prove we are the only cause, how is this warming different to past warmings? as Hubert Lamb stated decades ago, climate changes,and sometimes well withing a persons lifetime, if todays climate was my only worry,i would be a happy man.
“Why do people such as Dr Michael Mann claim that odd weather events are evidence of climate change”
Got a quote?
He doesnt need any odd weather event to show evidence of climate change.
“how is this warming different to past warmings?”
It is much faster, and human caused.
“how is this warming different to past warmings?”
“It is much faster, and human caused.”
You should see CET 1690 to 1740. Two degrees in 50 years Twice as fast as now.
Ken,
Are you suggesting that global temperature is accurately represented by central England’s temperature?
“Are you suggesting that global temperature is accurately represented by central England’s temperature?”
Yes. CET has at least as much validity as being representative of global trends as your specious claim that this warming period is faster than any other warming period.
Easy to check if CET can well represent global average Temp over the last 50 y.
CET and then Global temperature last 50 y.
https://climexp.knmi.nl/data/tcet_36month_low-pass_loess1_1970:2025_a.png
https://climexp.knmi.nl/data/ihadcrut5_global_36month_low-pass_loess1_1970:2025_a.png
Does CET look like a good represention of global T, Ken?
Of course not.
Here you go Nate. I have not even looked at any of these links, but I am confident that Michael Mann is blaming the LA fires on climate change when the absolute fact is that these Santa Ana Wind fire conditions are common, and this event was not exceptional in any way.
https://climatechangedispatch.com/firestorm-of-lies-the-real-reasons-behind-californias-outbreak-of-fires/
https://co2coalition.org/2025/01/13/assigning-responsibility-for-the-tragic-los-angeles-fires/
https://www.newsbusters.org/blogs/nb/michael-wnek/2025/01/10/msnbc-host-michael-mann-blame-addiction-fossil-fuels-la-fire
https://www.hollywoodreporter.com/news/general-news/los-angeles-wind-storm-fires-pacific-palisades-celebrities-1236103557/
https://www.youtube.com/watch?v=piVs00ckypo
Why are all these from denialist blogs or trashy sources.
What he is claiming is that Climate change, which we have independent evidence for, is influencing regional weather in the Western US.
There is a good case for that.
So there it is. Nate is not a spokesperson for anything at all, but Michael Mann is. On the other hand, Nate has no place to go, except to admit that Mann is claiming weather variability as evidence of climate change. It works for high school students who can honestly say they have never seen anything like it.
If Mann was claiming the need to monitor continuing changes to see if a new or different pattern might be developing over decades or centuries, he would have a scientific standing for that. Instead he is going with the media inspired nonsense that climate change is real and already happening.
There is an excellent case for human influence on the current warming. There is very weak evidence to show the full extent of what that contribution might be. The reliable history of the last 100 years and more does not support the notion that CO2 is the “thermostat” that controls temperature or sea level rise for that matter. The notion that human influence beyond natural effects is causing actual change in the long-term climate anywhere on earth is a major stretch of science. It does work very well with high school students, and that shows the strategy they are working.
“So there it is. Nate is not a spokesperson for anything at all, but Michael Mann is. On the other hand, Nate has no place to go, except to admit that Mann is claiming weather variability as evidence of climate change”
Tim works hard to confuse cause and effect.
Your initial claim:
“Dr Michael Mann claim that odd weather events are evidence of climate change”
Your later claim:
“Michael Mann is blaming the LA fires on climate change”
Then you return to previous:
“Mann is claiming weather variability as evidence of climate change.”
The reality:
What he is claiming is that Climate change, which we have independent evidence for, is influencing regional weather in the Western US.
There is a good case for that.
“with the media inspired nonsense that climate change is real and already happening.”
This is where you stop making any sense to me. The scientific data is clear: places where most people live have significantly warmed in the last 50 y, in agreement with science predictions from 50 y ago.
https://www.ncei.noaa.gov/access/monitoring/climate-at-a-glance/global/time-series/nhem/land/tavg/36/8/1950-2025?trend=true&trend_base=10&begtrendyear=1970&endtrendyear=2025
The disgustingly dishonest Nate is doing it again, and I am sick of calling it out every time. He knows full well that he is misrepresenting my comment. It seems to be all he does. Here is the full context of my complete statement in the concluding paragraph, edited honestly for time and space with the appropriate triple dots:
“There is an excellent case for human influence on the current warming…The notion that human influence beyond natural effects is causing actual change in the long-term climate anywhere on earth is a major stretch of science.”
Nate will not address that statement because it is true. To be clear, a major stretch of science implies that peoples opinions are good enough. There needs to be reliable data. No hockey sticks allowed.
The disgustingly dishonest Nate is doing it again, and I am sick of calling it out every time. He knows full well that he is misrepresenting my comment. It seems to be all he does. Here is the full context of my complete statement in the concluding paragraph, edited honestly for time and space with the appropriate triple dots:
“There is an excellent case for human influence on the current warming…The notion that human influence beyond natural effects is causing actual change in the long-term climate anywhere on earth is a major stretch of science.”
Nate will not address that statement because it is true. To be clear, a major stretch of science implies that peoples opinion’s are NOT good enough. There needs to be reliable data. No hockey sticks allowed.
I went too fast and made a mistake. The second post is correct. Opinion’s are NOT good enough.
So you keep adding ad-homs. And still fail to address the content of my posts.
This is the point that you keep failing to address
“The reality:
What he is claiming is that Climate change, which we have independent evidence for, is influencing regional weather in the Western US.”
He is NOT, as you keep erroneously claiming, using fires as his evidence for climate change.
He, as well as the vast majority of climate scientists, already find the existing evidence for climat change convincing.
I understand that science never knows things for certain. Yet they know many things well enough. And climate change is one of those.
Basic flaw in the climate alarmism logical approach: It is fixed on the DIRECTION of the recent warming and ignores the significance of the MAGNITUDE.
Alarmists also focus on words, instead of data, especially the popular press and politicians. “Warmest” being my favorite. “Warmest” BY HOW MUCH? “The sea is rising” BY HOW MUCH?
Alarmists also focus on short term changes – monthly, annual, even decadal (is that a word?) – when even my English lit teacher next door knows that weather is variable. “If you don’t like the weather in ……(fill in the blank), just wait, it’ll change.”
Alarmists also focus on one factor – CO2 – and attribute short and long term warming to it, when we know that there are many other known (ENSO and others) and likely unknown causes of temperature change (pre-industrial times) OTHER THAN CO2.
I have looked at the changes in 30 year normals over the last two periods (1991-2020 and 1981-2010) for many airport stations in the U.S. and am quite underwhelmed by the MAGNITUDE of the warming. Despite NWS failure to locate earlier normals for me, I found a publication that has most of the data, Injustice have to get my hands on a copy (I don’t think it has been digitized. It will be interesting to compare the normal periods that included the 30s with the current normals.
The magnitude of the average warming where most people live, in NH lands, is > 3 degrees F.
This is noticeable. Where I live, in New England, there is very much less snow accumulation than 2 decades ago.
Then there is the effect on global weather circulation..such as the northward expansion of the Hadley cell, that expands the desert regions such as in SW US.
https://www.sciencedirect.com/science/article/pii/S2095927318301919
Can you provide some data to support your statements? How about the change in the 30 year average normal for your commercial airport? Name the airport and I’ll do the work first you. BTW, it is SIMPLE to do. NWS has great website/tool. Or would you rather keep using only words to support your claims? Data, please.
Here’s the closest airport to me. 0.6 F/decade since 1952 or more than 4 degrees F over that period. It’s very noticeable.
https://www.ncei.noaa.gov/access/monitoring/climate-at-a-glance/city/time-series/USW00004725/tavg/12/8/1951-2025?base_prd=true&begbaseyear=1991&endbaseyear=2020&trend=true&trend_base=10&begtrendyear=1951&endtrendyear=2025&filter=true&filterType=loess
This tool will work for many of the moderately large cities in the US.
Moreover, it’s really the global average affect that is central to “global warming” theory. Data for specific locations will be noiser, but in my region, if you haven’t observed it, you’re simply not paying attention.
Nate,
Boston Logan’s 30 year normal annual average went from 51.5F to 51.9F over 10 years.
Hartford’s International airport’s went from 50.6F to 51.0F over 10 years.
Both are up 0.4F over 10 years. ( I plan to go back to earlier normal periods, which include the 1930s to look at results for a lot of US stations over almost 100 years.)
So, at that rate it (0.4F) it would take 75 years to warm by 3 degrees. I am not sure why I should be alarmed about that. You have some very nice ski resorts in New England. I live in the Midwest and I know several people who regularly ski there. Snowfall can’t be too bad longterm.
Warming is skewed toward nights, which generally is a good thing. It also has lengthened growing seasons. There are factors for sure, but greatly increased CO2 and added warmth has contributed to incredible increases in plant growth over the last 40 to 50 years. It has literally saved lives and pulled some out of poverty in the third world.
Meanwhile, the magnitude of the increase from warming is far less than the normal temperature variation by day, than with differences brought about by different weather systems, than with latitude, and than with altitude. Plants, animals, and people seem to be able to adapt and even thrive in many extremely diverse climatic conditions.
“Noticeable”, yes. “Observable”, of course. Concerning, no.
Thomas, If I do a temperature trend for Boston using the NOAA tool linked above since 1970 (see below for justification), I get 0.8 F/decade, so there is a large unreconciled difference between your result and mine.
Whether or not this is “concerning” depends upon what one might be “concerned” about. It is a large and rapid climatic change by any reasonable standard.
It’s interesting that you mention skiing with regard to New England. As a long-time (40+ years) skier I’d say that snowfall is actually less important a parameter than accumulated snow cover which is strongly dependent upon temperature. Again referring to the Binghamton NY result from above, our wintertime average temperature has risen about 1 F/decade for 40 years and the ski season is noticeably shorter than it was “back in the day”, something on the order of a month. This in spite of significant investment and advances in technology of artificial snow making at regional ski hills. You can see similar changes in other locations in the Northeast US.
Finally, I’d offer the following plot of GISS LOTI global temperature which includes a piecewise linear fit using change point analysis to determine regime changes in the temperature trend as justification that linear analysis of recent temperature trends should start circa 1970. The physical justification is that it was around this time when concerns about air quality lead to regulation of pollutants that tended to have a cooling effect that largely negated the GHG warming.
https://southstcafe.neocities.org/climate/GISS_LOTI_piecewise_linear.png
And Thomas, here is winter months temp in NE region of US.
https://www.ncei.noaa.gov/access/monitoring/climate-at-a-glance/regional/time-series/101/tavg/3/2/1975-2025?trend=true&trend_base=10&begtrendyear=1970&endtrendyear=2025
It shows 5 deg F warming in last 50 y. That is most certainly enough to prevent snow accumulation.
“Boston Logan’s 30 year normal annual average went from 51.5F to 51.9F over 10 years.”
The Boston Logan observation station was relocated around April 1996 at the same time the instrumentation was switched to ASOS technology, so it’s non-trivial at best to compare data since that time with data prior to 1996.
The Boston Logan average temperature since 1996 has risen at a rate of 0.82 F/decade.
Station data from here:
https://www.ncei.noaa.gov/access/homr/#ncdcstnid=20009288&tab=MSHR
Similarly for Hartford Bradley, ASOS went online at a new location in 1996 and the average temperature trend since 1996 is 1.0 F/decade.
Station data from here:
https://www.ncei.noaa.gov/access/homr/#ncdcstnid=20004130&tab=LOCATIONS
https://www.ncei.noaa.gov/access/monitoring/climate-at-a-glance/global/time-series/nhem/land/tavg/36/8/1950-2025?trend=true&trend_base=10&begtrendyear=1970&endtrendyear=2025
It shows average T of NH land has warmed 2deg C since 1970, which is 3.6 deg F.
I read above, without being suprised the least:
” Beyond movement of the 13-month average, a new grouping such as we have over the last several months should have some significance.
Therefore, I think the atmosphere has cooled significantly this year. ”
*
Why doesn’t that surprise me?
Quite simply because such statements, based on a review of recent months, have appeared many times on this blog in previous years.
Many passages didn’t require a response: they were simply polemics.
*
The last time I felt the need to react was in 2021, when the good old Brit nicknamed ‘RLH’ suddenly claimed that 2021 was the (possibly unprecedented) harbinger of a global cooling, as all the first anomalies would be lower than those of the corresponding months a year earlier in 2020.
*
I was quite surprised and immediately doubted this claim. It didn’t take long for me to confirm my doubts by examining the entire UAH-LT time series in my SQL database: A simple “select” statement searching the series for all years whose first six anomalies were lower than those of the previous year sufficed.
Later, we discovered that even all of the first eleven months of 2021 showed the same thing, with the exception of December. I then expanded the search to include those months.
And this is the result:
1981
1982
1989
1992
1999
2011
2021
*
And even if you look at all 12 months, you still find four years with all 12 anomalies lower than in the previous year:
1982
1992
1999
2011
*
For experienced commentators familiar with the influence of extreme events on the lower troposphere, it is easy to identify the causes of these four years:
– 1982: Severe cooling due to the eruptions of St. Helens and El Chichón.
– 1992: idem for Pinatubo.
– 1999: The harshest transition in the satellite era from a strong El Niño to a strong La Niña.
– 2011: The trough of the next strong La Niña.
*
So no: The cooling currently observed in the lower troposphere is not significant at all: it is nothing more than a reaction to the sudden vanishing of what had caused the strong warming for two years.
What is significant, however, is the speed with which transitions from extreme deviations from the 30-year average (such as we experienced in 1997/98, 2025/16, and 2023/24) to a more normal level can occur.
This, in my opinion, is the best weapon against alarmism in both directions.
*
You can be a highly successful graduate of one of the world’s most prestigious universities and still believe that a 13-month average
https://www.drroyspencer.com/wp-content/uploads/UAH_LT_1979_thru_September_2025_v6.1_20x9-scaled.png
can lead to a useful prediction.
This is, of course, wrong, as the two averages in the next graph perfectlydemonstrate:
https://drive.google.com/file/d/1yQHlFXQrnTvVVAvOW8Zzu-DRP5pY-ozp/view
{ Caution: I had to switch from Roy Spencer’s centred mean to front-window based ones. }
***
But… apparently, such a prestigious education will not protect you from outbursts of subcutaneous aggression when responding to a simple request to switch from Fahrenheit to Celsius, as anyone can see below:
September 5, 2025 at 3:50 PM
” You and Willard are two of the best examples of Dr Spencer’s commitment to free speech. Both of you would be prime candidates for a permanent ban on most moderated comment blogs, on the basis of being annoying and irrelevant. This comment about the use of the Fahrenheit temperature scale is not a new low for you, it is a typical low level snobbish and rude comment. You prove once again that arrogance is a very poor substitute for intelligence or knowledge. ”
*
I can’t recall having ever experienced such immature, stupid reaction.
*
Luckily, Roy Spencer’s blog is, on my Firefox, under control of Elliott Bignell’s excellent Tarderase add-on feature, so from now on I’ll mute this arrogant Tim S genius, as I did for Clint R and a few others.
When Bindi mentions me, it’s a reminder of how many times he’s proven me right.
And, I enjoy being right….
Do agree that https://oz4caster.wordpress.com/wp-content/uploads/2025/10/d4-gfs-gta-daily-2014-2025-10-02.gif shows that this month is the same (or similar) to the last few years?
Excepting the last two!
And yet, all those ancient coastal cities are above water.
If you want to be relevant, you could try posting intelligent commentary. You could organize your thoughts into coherent sentences and paragraphs. As with Nate, I attempt to provide constructive criticism, but it is up to you to decide how you want to be considered. There is a chance that you could have something useful to contribute.
Bwa ha ha!
Tim thinks his ad-hominem attacks when he has no sound rebuttal, are ‘constructive criticism’.
Nate “.. demonstrates a complete lack of honesty and a failure to understand complex concepts”
Nate, I am sorry if you or anyone else is offended. That is not my purpose. I think you know that I have a very strong bias toward intelligent and well-written comments. When I see this kind of disorganized stream-of-thought rant, that is poorly written and directed at me, I sometimes feel a sense of responsibility to respond, but not always. I think the people who argue back and forth with petty insults and pet names detract from what could be a useful discussion. Why do you want to be included in that group?
“Nate, I am sorry if you or anyone else is offended.”
No you are not.
“That is not my purpose. ”
Yes it is. You quite often offer no rebuttal to the content of my posts, and think insulting my intelligence is a good substitute.
It isnt.
“I think you know that I have a very strong bias toward intelligent and well-written comments.”
I think you define ‘intelligent’ as ‘accepting of your unsupported often hyperbolic opinions’
“I think the people who argue back and forth with petty insults and pet names detract from what could be a useful discussion. Why do you want to be included in that group?”
Dude, you seem to lack any self-awareness.
Good example here:
“Because Nate is a disgusting liar, I need to point out that he dishonestly trimmed the quote as he always does to try to change the meaning.”
Followed by no response or rebuttal to any of the content of my posts.
Nate says ,how is the warming different from past warmings? Its much faster and human caused,really? since when was about 1.5c in 200 years fast? or problematic ?
Since we built a civilization on coastal plains which are now under threat from rising sea levels.
Numbers, not words please, scary as they are. I will wait to build my rescue boat until you give me a reason. A few specifics. Rate of rise, USING THE AVERAGE SCENARIO (since you folks seem to love “consensus”), applied to some big U.S. ports, NYC, Miami, Boston, SF. BTW, some of those have tide gauges that go way back. Make your case.
https://www.ipcc.ch/
Do we have any evidence that Thomas ever audited anything, let alone climate data?
None at threat in the UK. Not one.
Ent,
Do you mean like the city of Ur? It was built on the coast 10 thousand years ago. Isn’t it still above water?
Stephen
Around the Mediterranean coast are a number of cities which have been around for millennia. Some are still dry, some are now underwater.
This has little to with sea level. The Eastern Mediterranean is an active tectonic zone and cities change elevation every time there is an earthquake.
Perhaps you might like to use the submerged cities of Heracleon and Thonis as evidence that sea levels do not change.
Ent,
Aren’t Heracleion and Thonis the same city? So, it sunk because it is on an active tectonic plate and Ur rose? Sea level rise doesn’t seem to fit that narrative. It seems our coastal areas are safe for now for the next several thousand years.
Global average sea level rise by satellite:
https://sealevel.colorado.edu/
and together with tide-gauge global average sea-level:
https://research.csiro.au/slrwavescoast/sea-level/
Both indicate significant acceleration.
And, yet all those ancient coastal cities are still above water. Sidon and Ur, still above water. Ur was settled about 8000 years ago, still above water. It is actually about 20 miles from the coast, now.
Thats called a cherry pick, Stephen.
Nate, that’s how science works. Science can’t be proven only falsified.
Sure Stephen, just pick and choose data that works for you, and ignore the data that doesnt.
That aint how science works.
And BTW
“And, yet all those ancient coastal cities are still above water. Sidon and Ur, still above water. Ur was settled about 8000 years ago, still above water. It is actually about 20 miles from the coast, now.”
Tide-gauge sea-level rise has been measured to average 2 mm/year over the last century.
The narrative from your side is that sea level is rising, but not accelerating.
In 8000 years that should have produced a rise of 16 m or 50 feet.
By your team’s reckoning, those coastal cities should be submerged.
Why arent they?
Because it isn’t rising?
The area around Ur is subject to huge deposits of alluvial sediment from the Tigris/Euphrates river system. Over time this has raised the land and the delta has encroached on the sea, which is partly why Ur is further inland. Ur didn’t move much, the coast did. So did the courses of the rivers.
“Because it isn’t rising?”
No. It is rising, but that started only in the last century.
Not long enough to have flooded your cities.
Barry,
So, that’s your hypothesis? For over 8000 years the river sediment has found its way under Ur and elevated the site and kept it above sea level? That’s it?
“So, that’s your hypothesis?”
Hell no. You think I went to Ur and did geodetic surveys or something? I read up on expert research of the area.
You should try doing that some time. Blogs are a very unreliable source of information.
One of the most recent paleo sea level reconstructions suggests it’s more likely than not that pre-industrial Holocene sea level peaked about 3500 years before present and was slowly declining prior to industrialization.
https://www.nature.com/articles/s41467-024-54535-0
In any case the argument that sea level rise has not accelerated over the past few decades, requires one to ignore the data that clearly indicates the rate of sea level rise is accelerating, namely that satellite altimetry and satellite mass balance measurements, which would be a weird position for people wedded to satellite temperature because of near global coverage if one expected consistency from such people.
Good evidence and argument.
SOLAR MINIMUM UPDATE
Hyperscalers desperately need to free up capacity and reduce peaks so that they can connect to the grid faster; the quickest place to find spare capacity is in households; therefore, hyperscalers should pay to free up household capacity. They could get a third of the capacity they need by paying to replace electric resistance heating with heat pumps, and the rest by paying for battery storage and solar on suitable homes.
https://www.volts.wtf/p/could-we-get-hyperscalers-to-buy
A post from Ball4 that I missed on another thread but which is on-topic on this monthly thread about global temperatures. There seems to be an impression in the minds of people like B4 that the AMSU units in sats use S-B to measure irradiance, or that hand-held IR meters as depicted by B4 use S-B to calculate room temperature objects.
“[GR]10:02 pm: “It must (b)e noted that the results apply only in the range of about 500C to 1200C.”
[B4]No Gordon, in my room temperature kitchen my IR thermometer reads EMR brightness temperature of 32F just fine on an ordinary glass full of ice water”.
***
B4…remember, heat is not IR and IR detectors measure IR frequency, not heat, which has no frequency.
Your IR thermometer does not use S-B to calculate temperatures. The units measure IR alright but they are measuring frequency, not temperature. The units are calibrated in a lab where the frequency of IR is known for a given temperature. Ergo, the output voltages of the semiconductor units used in the meter are internally compared to lab voltages from IR emissions in a lab, and stored locally in the IR meter’s EEPROM for reference.
In fact, there is no known IR thermometer that calculates temps based on S-B. If the temperatures being measured were in the 500C to 1200C range, they may be able to use an educated guess to derive each temperature in the range using colour. Stefan did not specify a T^4 relationship for IR or lower frequencies. In fact, there is no mention of frequency in S-B since it is based on the colour perceived by the eye.
My argument is that the T^4 relationship between EM emission and temperature is not linear down to the room temperature range. That’s why S-B gives such nonsense readings in W/m^2 for ice.
“In fact, there is no mention of frequency in S-B since it is based on the colour perceived by the eye.”
I must take issue with the above statement.
The SBL can be derived by integrating Planck’s Law over all frequencies (and solid angle). The human eye has nothing to do with it.
professor, you are assuming GR understands integration.
He hasn’t the first clue about calculus.
SOLAR MINIMUM UPDATE
Many parameters have trends that have been detected and attributed to human activities (Chapter 11) but have not yet changed so much that they have emerged (Chapter 12).
The entire argument in Section 8.5 rests on this single, critical misunderstanding of these distinct concepts. This leads the authors to arrive at a demonstrably incorrect conclusion: “it is not currently possible to attribute changes in most extreme weather types to human influences.”
In fact, the extensive attribution findings detailed in Chapter 11 of the IPCC report make it clear that humans are indeed influencing extreme weather.
https://www.theclimatebrink.com/p/is-this-the-most-embarrassing-error
“it clear that humans are indeed influencing extreme weather”
in YOUR mind.
and the IPCC.
That’s a lot of minds out of a sudden, Richard, isn’t it?
You have one?
Willard: Thank you for those chapters and verses of the IPCC Bible.
Hard to pontificate on the real Bible without having read it, Max.
Why would you think you can do without RTFR?
The technical foundation for today’s climate action is being seriously questioned: Balloon-based atmospheric data shows no increase in upper tropospheric humidity, undermining key positive feedback assumptions behind CO₂-driven warming. Leading scientists Dr. William Happer & Dr. Wijngaarden highlight that without observed humidity or cloud cover changes tied to CO₂, the very rationale for carbon reduction policies lacks solid evidence
Happer has no formal training as a climate scientist. Their joint paper has been rejected by several major journals. Enough said. Don’t waste your time on them.
“Tolerance will reach such a level that intelligent people will be banned from thinking so as not to offend the imbeciles.”
~Fyodor Dostoevsky
Student Bee,
Is it your claim that because Happer has no formal training in Climate Science, that he, who has a PhD in physics with research in quantum mechanics, optics and spectroscopy, therefore can’t write papers or do research in Atmospheric Physics? What would formal training in climate science be that would support atmospheric physics research?
Happer is 80 years old !
Older than Trump !
Has never published anything on climate science his entire life.
Just another old, conservative sceptic.
Dr Happer does more atmospheric physics in his sleep than you will do your entire life.
“Dr Happer does more atmospheric physics in his sleep than you will do your entire life.”
You hit the nail on the head. His atmospheric physics are purely dreams. I prefer to call them incoherent delusions.
Remember, your brain cells start to die off by the time you reach 20 and continue to die through your lifespan. I estimate both Happer and you are old enough to have lost at least 20%.
StudentB, I can understand your frustration but ageist diatribes are not suitable for a site such as this.
“Balloon-based atmospheric data shows no increase in upper tropospheric humidity, ”
Absolute or relative? The difference is important.
Because of the clausius-clapyron relation absolute humidity increases by 7% per degree C above 0C while relative humidity remains relatively constant independent of temperature.
https://en.wikipedia.org/wiki/Clausius%E2%80%93Clapeyron_relation
Normal physics predicts that global warming would produce an increase in absolute humidity and a constant relative humidity above 0C and very low absolute and relative humidity below 0C.
What are the balloons showing?
Upper tropospheric humidity (UTH) stands for absolute or specific humidity. If I wanted to say relative humidity, I would have said relative humidity (RH). BTW, Contrary to Clausius Clapeyron, RH is decreasing in the upper troposphere. Climate alarmists need to understand the basis for Clausius Clapeyron before you assume that it shall remain constant everywhere. It has to do with an equilibrium condition of air over water. The atmosphere is not in equilibrium. Due to a multitude of dynamics, the humidity in the upper troposphere is decreasing between the 60s – Bates.
Sam, can you point us to the data showing that?
So first it was no formal training in Climate Science. Now it is because of his age. Which is it?
prof p…”“[GR]In fact, there is no mention of frequency in S-B since it is based on the colour perceived by the eye.”
I must take issue with the above statement.
The SBL can be derived by integrating Planck’s Law over all frequencies (and solid angle). The human eye has nothing to do with it”.
***
I am talking about how Stefan originally arrived at the T^4 relationship. He based it on an experiment by Tyndall, who had electrically heated a platinum filament wire and observed the EM given off as colours. As he heated the filament from about 500C, the wire glowed red, then orange, then yellow, etc. Another scientist converted the colours to wavelengths/frequencies and Stefan used the wavelength given off at 500C, comparing it to the wavelength given off at about 1500C. From the ratio, he developed his T^4 relationship between surface temperature and the colour/wavelength given off between temperatures.
The law he derived is I = EM intensity = sigma.T^4. Since his law was derived circa 1879 and Planck’s Law circa 1900, claiming that Planck can be derived from Stefan makes no sense. Besides, they involved two entirely different derivation. I can see similarities in the derivation but Stefan’s was based on actual experiment while Planck’s was based on a thought-experiment and imaginative math.
If anyone is going to claim a derivation it has to be an overly simplistic derivation in which Stefan’s Law is limited to a narrow subset of the EM spectrum.
Planck’s formula for blackbody radiation, is U(f,T) = (8.pi.hv^3/c^3).(1/[e^hf/kT – 1]). Nothing in common with Stefan’s formula.
Since Stupidb is such a smartass re his claim that I can’t do integrals, let’s see him derive Stefan from Planck.
The key to Planck is the exponential term e^hf/kt and it helps to understand what he was trying to accomplish. At the time, the EM spectrum was defined loosely as e = hf, where e is EM intensity. It tells us that as frequency(f) of EM increases, the intensity increased. Therefore UV frequencies will be more intense than IR frequencies. Unfortunately, as f-> infinity, so did the intensity, an undesirable condition called the ultraviolet catastrophe which differed from actuality.
Planck’s solution is an exercise in sheer fudging. He reasoned that that UV intensities were far less rare than frequencies in the mid-light spectrum and got around the issue by using an exponential function to suppress the likelihood of EM intensities on the UV side of the EM spectrum.
Look at the exponent with e, which is hf/kT…
h = Planck’s constant
f = frequency
b – Boltzmann’s constant
T = absolute temperature.
That’s the same hf from e = hf above. To prevent it running away as f -> infinity, Planck divided it by kT. Let’s look at the exponential, e.
Essentially, e^hf/kT is a probability function that reduces the intensity of radiation as it rises to higher temperatures. This has nothing to do with Stefan’s Law which is based on an experiment where temperature was varied and the colour produced from a filament was observed.
The problem here is Boltzmann, a man for whom I have little respect. He tried to reproduce the work of Clausius and screwed it so badly we are left today with idiotic claims based on a totally theoretical and statistical guessing game about atomic theory.
I am all for abandoning blackbody theory as useless and untenable. I won’t hold my breath since in my field of electrical engineering they are still teaching conventional current flow theory, which dates back to the 1700s when Ben Franklin proposed it. Ben can be forgiven since the electron was not discovered till another 100+ years after his definition but the clowns in universities who maintain that silly theory based on a sheer paradigm cannot be excused.
“The problem here is Boltzmann, a man for whom I have little respect.”
He has the respect of nearly all physicists and engineers.
He doesnt need yours.
Here you are dumbass:
https://en.wikipedia.org/wiki/Stefan%E2%80%93Boltzmann_law#Derivation_from_Planck's_law
but I don’t think your weak engineer’s brain is capable of following it.
SOLAR MINIMUM UPDATE
https://www.bbc.co.uk/news/resources/idt-d6338d9f-8789-4bc2-b6d7-3691c0e7d138
Sometimes, Pure Denial acts like an implicit Sammich Request.
Why waste time searching for “effects of climate change in the UK” when one can rant about the gubmint instead on a blog every day?
That sounds much like a UK historical weather record Willard, many such winters with mild weather and heavy rains, even Caesar had problems with the British climate, historic floods drowned thousands, after a wet Autumn and Late Summer, last winter was predominately dry, ca sera sera.
That sounds like denial to me, Ian.
I’ll indulge once more, but after that you’ll need to carry your own weight:
https://noc.ac.uk/news/uk-sea-level-rising-faster-global-average
Alternatively, can jump right to Step 3 – Saying Stuff.
Shame about the drought and shortage of rainfall in the UK last winter and spring of 2025. how does that fit in with your increasing winter rainfall theory? maybe its just weather,
The ozone hole over Antarctica.
https://i.ibb.co/nMqXkkcZ/omps-v8-sh-latest-N20.png
https://i.ibb.co/3L7hqr0/ozone-hole-plot-N20.png
The Hagedorn guy wrote above:
” Rate of rise, USING THE AVERAGE SCENARIO (since you folks seem to love “consensus”), applied to some big U.S. ports, NYC, Miami, Boston, SF. BTW, some of those have tide gauges that go way back. Make your case. ”
*
Ah well ah well!
Willard is right: newcomer Hagedorn recommended himself on this blog (September 29, 2025 at 10:10 AM) as an auditor, with the usual mixture of modesty and fervor!
Oh look:
” I am auditing Elements of Climatology at a respected university in the U.S. ”
*
We now have a renowned auditing specialist – by the way as it seems, particularly in sea level issues, n’est-ce pas? – whom we can commission to review the following sea level data for the US East coast, which we obtained from the PSMSL site and processed using our own software package:
https://drive.google.com/file/d/1mTv3cqd3f14xcgFxF7-TalMzGRSrZF-5/view
This chart is originated from the computation of sea level anomalies for the following PSMSL tide gauges – without considering Vertical Land Movement:
https://drive.google.com/file/d/1rE7554ribDDMBkh6wv6SKm1nFNiYt8Yg/view
At the end of each line you see:
– life: linear trend for the gauge’s entire activity since start;
– 93-22: linear trend for the gauge’s activity since start of the satellite-borne observations in 1993;
– their difference;
– the diff/life percentage (by which the gauge info is sorted upwards).
*
The incredible thing here was to discover that the ‘AVERAGE SCENARIO’ for these 50 East coast tide gauges, politically and polemically discredited by the Auditor-in-chief’, looked very similar to the data of the single PSMSL gauge
12; 40.700000; -74.013333; NEW YORK (THE BATTERY)
to such an extent that I had to display the polynomial for the 50 gauge average in dash mode – otherwise, you wouldn’t have seen that for the New York Battery gauge below it, he he.
*
A few words re: ‘Vertical Land Movement’
Despite intensive preprocessing of all gauge data to achieve global level homogeneity between gauges, PSMSL still provides very coarse data because it publishes gauge data independently of land movements around the gauges (upward for isostatic rebound, downward for land subsidence).
While it’s essential to consider this when calculating actual sea level rise or fall, this correction is pointless when considering the local situation.
If you lived where the sea level was rising by a staggering 100 mm annually due to subsidence, you wouldn’t care if this resulted in a global rise of a mere 5 mm/year!
*
Source
PSMSL
https://www.psmsl.org/data/obtaining/rlr.monthly.data/rlr_monthly.zip
GPS
https://www.sonel.org/-Vertical-land-movements-.html
**
Maybe the newcomer Hagedorn should either technically contradict the sea level data presented above, or refrain from useless ‘consensus’ polemics.
Well, Bindi, I have to say I am just devastated by your personal attacks. Devastated. Wiping away a tear right now. And, if winning a debate boosts your ego, then I declare you the victor! Feel better? Good. Now, if your long, technical response puts additional wind in your sails. Terrific!! I decided I will not waste any more time with Willard, who seems to be a team mate of yours, and deals in a lot of ad hominem. My purpose here is not as much to debate, as to learn. To debate is to win an argument, parrying opposing viewpoints without really considering their validity. I can be convinced! Hint: insult is not a good way to start. But that’s ok. I’ll give you another chance if you are interested in responding. Considering the length of your post, you are quite interested and seemingly knowledgeable in the subject (sea level rise).
Richard Feynman said “If you can’t explain something to a first year student, then you haven’t really understood.” I always liked better the version that used bartender in place of student. So, I am that bartender. Can you put your ego aside for a moment and answer my question succinctly? Without links to reams of data, off point, just in the text of your response. In inches, how much has the sea level risen at some of our major U.S. ports that have gauges over a long period of time and, given the recent rate of rise, how much will they rise over the next 50-100 years? By SCENARIO, I meant the most likely scenario of temperature increase, not the highest temperature increase scenario, which the press and politicians seem to consistently use.
I will pour a few more beers as I wait for your hopefully brief response. After all, I have thirsty customers to serve.
(BTW, you guys seem to be triggered by “auditors.” That is why after 8 years I transitioned over to financial management. Nobody is happy when the auditor shows up.)
Very mature comment, Thomas.
And you are right to not be upset by the cult kids here. There are about a dozen of them. They are ignorant of science, and behave like “rooftop shooters”, except they use “false accusations” instead of bullets.
When I provide some much needed science, I sometimes get as many as 4 vicious attacks. It indicates to me how effective I am. They have closed minds and hate reality.
Adults know that learning never ends.
Clint R
What science have you ever provided? I have asked you many times to support your opinions, as of date you have provided zero!! You have zero support from textbook physics, you have zero experimental evidence, you have zero measured values. You are NOT attacked by providing valid science. Posters dislike your endless insults and your lack of evidece to support even one of your claims!
Norman, you keep making those false accusations. But, I have provided numerous examples of textbook physics. It’s just that you can’t understand physics because you’ve never studied anything meaningful. Your total exposure is from “climate science” and things from wikipedia that confuse you.
Just take one simple example: You can’t understand that the ball-on-a-string is a viable model of “orbiting without spin”. You have no background in orbital motion, or vectors.
Also, you seem to forget I taught you why ice cannot boil water. It’s the same reason the sky cannot warm Earth’s surface. Incoming flux cannot raise the temperature of a surface that is emitting a greater flux.
You don’t understand, and you can’t learn. And your childish insults far exceed anything I’ve ever said. Remember your “anal fetish”?
Now, pound out a novel on your keyboard falsely accusing me. That’s all you can do.
Clint R
Just a bunch of insults and agai. Zero science! Why is this with you? What textbook physics have you given to support your opinions of how you believe heat transfer works??
The
Norman proves me right, again.
Clint R
What are you right about. What textbook physics have you linked to. All textbook physics clearly points out your misguided view on heat exchange is quite wrong! A colder object adds energy to a hotter one. This is established physics and not disputed. It will not raise the temperature of a NON-HEATED surface (even though adding energy) because two processes are taking place. A surface both will absorb and emit radiation. The hot surface will emit more energy than it gains from the colder surface so it will cool. If it is heated by an external heat source, the temperature of the colder surface will have a direct effect on the steady state temperature reached by the hotter surface. The warmer the cold surface the higher the heated hot surface will get. It is well established physics. Prove it wrong! You are not able to do this but you are able to insult me and falsely accuse me of not understanding valid physics. When you are caught in deception, you resort to insults and diversion. Now it is time to show, textbook material, that demonstrates what I just wrote to be wrong. You will not be able to do this so I suspect if you respond it will be some ignorant insult and empty diversion.
Norman,
People who keep spewing this nonsense are full of nonsense. Yes, it doesn’t violate any law of thermodynamics. But the probability that heat flows from higher entropy to lower entropy is virtually nil. Heat flows from the Sun to the Earth and from the Earth to the atmosphere. Heat flows from low entropy to high entropy.
Wrong again, Norman. If you had any REAL science you wouldn’t need to clog the blog with your rambling blah-blah. Want a couple examples of how to do it?
*** The ball-on-a-string is a viable model of “orbiting without spin”.
*** Incoming flux cannot raise the temperature of a surface that is emitting a greater flux.
See? Clear, concise, and accurate.
Maybe someday when you learn enough, you can do the same.
Norman,
It also doesn’t violate any laws for a boulder to roll up hill, or to roll up a speed bump.
Dr Roy posted a blog article about sea level rise a few years back:
https://www.drroyspencer.com/2018/05/
Sounds like it is a devilish topic to try to unpack. 1 foot rise per century does not sound like something we can’t handle with present technology. And it looks like 1/2 the rise could not have been from CO2 increases/warming. I’ll keep my waders in storage!
Stephen P Anderson
I already know that Clint R has no background in valid physics. I thought you stated you had a Chemistry degree. How is it that you do not grasp basic science and think it to be nonsense?? Where did you learn your Chemistry from?
I find it a waste of time to link textbook material to Clint R as he just ignores whatever does not fit in with his opinions. I know you are a radical right-wing political mind but I did think you might have a little science inside that brain of yours.
Heat is a concept of the amount of energy transferred from a hot body to a cold body so, no, heat does not flow from cold to hot. Energy always flows both ways. The temperature of a cold body will change the temperature of a hotter surface. Roy Spencer has clearly shown this as all textbooks on the subject also support this. Why you choose this ignorant position with a science background makes little sense.
https://www.drroyspencer.com/2016/08/experiment-results-show-a-cool-object-can-make-a-warm-object-warmer-still/
https://ahtt.mit.edu/
Download a heat transfer textbook at the above link.
stephen p anderson. I challenge you to find any textbook on heat transfer that would show my view is an incorrect one. Until you do this you might want to hold back on what you call nonsense!
The recent DOE report, co-authored by Dr Roy, has a section on sea level rise, starting at pg 75. A NOAA report included there pretty much answered my question.
Norman, you started the day off by proving me right. I never get tired of being right. Thanks.
You can hardly make a comment without insults, false accusations, and links to things you can’t understand. You can’t find anything wrong with the science I present, so you just have to invent crap.
Prove me right some more. I can take it.
Norman,
Without greenhouse gases what would the temperature of Earth’s surface be? What would be the temperature at the top of the atmosphere?
Clint R
You have zero science! You post unsupported opinions and reject all evidence againt your unsupported opinions! I have requested you do an experiment with two heat lamps but you do not do science at all. You never have and never will buy you will insult. It is the only thing you know how to do.
“The recent DOE report, co-authored by Dr Roy, has a section on sea level rise, starting at pg 75. A NOAA report included there pretty much answered my question.”
The flaws of that report are many, as have been pointed out by numerous climate scientists.
Its main flaw, as Roy admits, is that it is not intended to be a balanced assessment of the facts, but to promore the minority ‘climate skeptic’ point of view.
In addition, DOE broke the law by forming a climate advisory committee in secret, with members selected for their biases.
Keep proving me right, Norman. The more you prove me right, the more you prove yourself wrong.
That’s win-win, for me.
Clint R
Since you are not understanding, let me ask you a question. Do you know the difference between opinion and science?
Good question, Norman.
“Science” is what I offer in my comments. “Opinions” are what you offer.
For example, I have stated The ball-on-a-string is a viable model of “orbiting without spin”. But, you reject that based only on your opinion. You have no viable model, only your opinion.
See the difference?
Norman,
Yes, it only took me about a minute to find a thermodynamics textbook that doesn’t spew that garbage.
https://www.physics.ox.ac.uk/system/files/file_attachments/basic_thermo.pdf
We’ll see whether or not the auditor is able to detect the small mistake I made… errare humanum est.
Norman, does energy flow from the Earth to the Sun?
Stephen p anderson
Yes energy flows from Eatrh to Sun.
Stephen, does the Earth emit IR radiation to space?
What does it do in the direction of the sun? Do you imagine it bounces back off the sun’s rays, or what?
Yes, it does. From the top of the atmosphere. Nate without GHG what is the temperature of the surface and the top of the atmosphere?
That is a question that neither you nor Norman will answer. You only ask questions, right Nate?
stoopidb…”Here you are dumbass:
https://en.wikipedia.org/wiki/Stefan%E2%80%93Boltzmann_law#Derivation_from_Planck's_law
but I don’t think your weak engineer’s brain is capable of following it”.
***
I had been leaving stoopidb, aka student_b, alone because I was feeling sorry for him. That’s because he is the type who posts links involving calculus without having the ability to explain the integral used.
Having explained over and over that the T^4 factor in Stefan’s original equation is derived from an experiment by Tyndall where the integration must take place between 500C and 1200C, not 0 and infinity.
Stoopidb refers me to an integral, supposedly representing the S-B equation, which is laid out as follows…
P/A = integral [0->infinity].I(f,T) df
I have used f rather than nu for frequency. T is obviously temperature and as used her indicates T as a constant. Therefore this is a one-dimensional n integration of instantaneous frequencies, df, with temperature held constant. Makes no sense.
I have omitted the second integral that accounts for the angle of radiation using a cosine factor. It’s not important here, basically because the entire integral is wrong, however, it too must be a double integral.
You cannot calculate an area using a line integral!!!! Duh!!! The person who entered this article obviously has no idea how to do 2nd year math as applied to integrals. What are the chances he/she has any idea about the S-B law or it’s so-called relationship with Planck.
The equation above is trying to calculate P/A, meaning power per unit area of emitted EM. Temperature is a measure of heat. Where is the reference to heat in the EM energy? There is no heat in EM and using units of power related to mechanical energy id plain stoopid.
Even Ball4 knows that.
Be that as it may, let’s carry on. They infer that P/A is equal to the sum of all infinitesimal changes in temperature per infinitesimal change in frequency. That requires a double integral where one integral is calculated from f1 to f2 and the other from T1 to T2. This rocket scientist has used one integral to cover both. Not only that, they have tried to cover the view factor using a single integral to cover an area (the cosine factor).
I could go on tearing this pathetic equation apart but it would be wasted on the likes of stoopidb since he obviously lacks the background to recognize it himself. So, let’s look at the contribution of Boltzmann that converted the simple Stefan equation, based on a valid experiment, to the Boltzmann contribution based on a thought experiment.
According to Google AI, “The Boltzmann constant (k), also known as k_B, is a fundamental physical constant that relates the average kinetic energy of particles in a substance to the temperature of that substance. With a defined exact value of 1.380649 × 10⁻²³ joules per kelvin (J K⁻¹), it is a key proportionality constant in statistical mechanics”.
The first point is that B. did not do experiments, all of his work, and Maxwell’s, being worked out as a thought experiment via statistics. B. did not calculate KE’s directly, he hypothesed them statistically.
Note that Boltzmann “relates the average KE of ***PARTICLES*** in a substance to the temperature of the substance”. It has nothing to do with radiation (EM) and part of the reason is this. In the time of Boltzmann, no one knew what electromagnetic radiation was, or its relationship with atoms, especially electrons, which were not discovered till some 15 years after Boltzmann did his work.
Getting back to Planck, his work was a thought experiment in which he fudged the math to create a probability that certain frequencies of EM were less likely to exist than others. Again, Planck conceded years afterward that had he known the relationship of electrons and EM it would have made his work infinitely easier.
I claim the derivation of S-B from Planck is bogus. The reason is simple, the derivation requires an integration of frequency from 0->infinity in a line integral that appears to hold the temperature, T, constant. That is an example of blackbody theory where T is always constant. In other words, blackbody theory normally applies under thermal equilibrium.
Blackbody theory should be abandoned as the nonsense it is.
In the Stefan version of S-B, both the temperature and frequency vary over a temperature range from about 500C to 1200C. The meaning is clear, both the temperature and frequency must be integrated over that range and that has not been done. Furthermore, after using such limits of integration it is not appropriate, without proof, to use mathematics to extrapolate S-B outside that range.
What a mish mash of garbage.
Let’s make it simple:
“Every physical body spontaneously and continuously emits electromagnetic radiation and the spectral radiance of a body, Bν(ν, T), describes the spectral emissive power per unit area, per unit solid angle and per unit frequency for particular radiation frequencies.
The quantity Bν(ν, T) is the spectral radiance as a function of temperature and frequency. It has units of W·m−2·sr−1·Hz−1 in the SI system.”
To obtain Wm-2 you must integrate Bν(ν, T) over all solid angles and frequencies.
Voila, you obtain the SBL!
This works for both planetary and solar temperatures.
What is a “line integral”?
It looks GR doesn’t understand double integration.
Arguing with crazy fanatics who think “not only is ‘distance’ a conserved quantity, but so is ‘area'”, “In REAL physics, flux is NOT energy”, “flux cannot be averaged”, “Earth’s shadow causes the phases of the Moon”, just to name few, isn’t debate, it’s an exercise in futility and only serves to legitimize the illegitimate.
Not all opinions are worthy of patient consideration.
If someone points at a chicken and declares that it’s an elephant, you can’t waste your time debating the issue. There is no issue to debate, whether it’s conducted civilly or otherwise.
Trying to reason with those who have taken leave of logic and reason is like giving medicine to the dead.
Ark provides us with yet another example of his juvenile cultism, and inability to accept reality.
“not only is ‘distance’ a conserved quantity, but so is ‘area'”
That’s a clear example of how some things are “accounted for”. It explains the word “conserved”, as used in science. For example, energy is conserved, but flux is NOT conserved.
“In REAL physics, flux is NOT energy”
That simple fact alone debunks the cult’s “Earth Energy Budget”.
“flux cannot be averaged”
More evidence the EEB and EEI are BS.
“Earth’s shadow causes the phases of the Moon”.
That was just one of gordon’s many flubs. After repeated criticisms, I believe he has begrudgingly recanted.
Let’s see if Ark can accept this reality.
I already know the answer….
“For example, energy is conserved, but flux is NOT conserved.”
I argued for hundreds of comments against the “cult kids” last month on just that point alone. They kept pretending to accept that “flux is NOT conserved” whilst doing everything in their power to insist that in every simple situation you could come up with, “flux in” always equalled “flux out”! Even if they had to redefine “irradiance” to do it…
…I won’t be bothering, this month.
Yes DREMT, they have no interest in reality.
Energy conservation requires that the total incoming and outgoing powers balance. When expressed in terms of flux, this means the area-integrated incoming and outgoing fluxes are equal at steady state — though the flux densities themselves need not be equal.
IOW, as long as you account for area, flux in equals flux out.
400 W/m2 X 1A = 200 W/m2 X 2A = 400 W for a metre squared, 2-sided plate.
Multiply flux by area and you get power. Simple.
Integrate over area for incoming and outgoing, and the area-averaged incoming and outgoing fluxes are equal. Simple.
Flux in does not have to equal flux out.
Even simpler.
…and, in fact, in most simple cases where an object is irradiated by only one energy source, and does not rotate, flux in (W/m^2) will not equal flux out (W/m^2) since the surface area receiving flux will be less than the surface area emitting flux.
It’s only when the surface area receiving flux is the same as the surface area emitting flux that flux in will equal flux out. One example could be a rotating sphere irradiated by only one energy source…but, in that case, you would have to both spatially and temporally average the irradiance for flux in to equal flux out.
“It’s only when the surface area receiving flux is the same as the surface area emitting flux that flux in will equal flux out.”
Exactly!
What do you think is happens when the solar flux on a plane is divided by 4?
This makes the receiving surface area of a globe the same size as the emitting area of a globe.
You are so close to understanding, but your bias permanently blinds you.
The math is clear but your denialism will not permit you to see it.
Shall we talk again of how average temperatures are different to average flux? You seemed happy in this red herring.
“What do you think is happens when the solar flux on a plane is divided by 4?“
I already said, barry:
“One example could be a rotating sphere irradiated by only one energy source…but, in that case, you would have to both spatially and temporally average the irradiance for flux in to equal flux out.”
So, for the Earth, a value of approx. 240 W/m^2 (960 W/m^2 divided by 4) for the irradiance would be a spatial and temporal average.
Great, seems the argument is over. Small caveat that you don’t need to time-average: power (and thus flux) already represents energy per unit time, and that metric is consistent (joules per second). For equilibrium, you just need to integrate over area, which is variable.
“Shall we talk again of how average temperatures are different to average flux? You seemed happy in this red herring.”
You’ve had a pretty rough couple of months, barry. Mistake after mistake. Clint’s point #2 from his 11-point critique of the Earth’s energy budget is pretty straightforward. The values for radiant exitance in the budget all suffer from the same problem – they’re averages, thus they don’t abide by the SB Law, thus they’re “physically meaningless”. Not “useless”, but “physically meaningless”, all the same. You experienced no end of confusion over that.
To start with, you thought Clint meant that radiative flux itself was non-linear, when obviously he was referring to the relationship between temperature and flux. Then, I showed you the link to Nikolov & Zeller’s first paper, so you could learn about Hölder’s inequality. You got their paper all wrong, which you eventually admitted to. But, even after Clint had clarified with his example of the two surfaces, you still kept on with your confused misrepresentations.
You didn’t get why his criticism had nothing to do with our previous discussions on the Green Plate Effect. Maybe you still don’t!? You won’t say. You messed up by backing ChatGPT in its silly mistake on the plate receiving 400 W/m^2 and emitting 200 W/m^2. It said the plate emitted 400 W/m^2 “in total”, and you backed it! You accused Clint of misrepresenting you in your discussion about blackbodies, but that misrepresentation made no difference to his point, overall. You left the scene without saying a word, again.
Then, finally, you still didn’t get that his point #2 does not require a conversion of the averaged value from flux to temperature to be valid. Quite a lot of mistakes, there, overall! No wonder you haven’t been posting much.
In any case, Clint’s point #2 is indeed a red herring as far as the current point of contention goes – we’re actually currently talking about the problem with “time-averaging” irradiance. That problem was exemplified by the wooden sphere and the laser, here:
https://www.drroyspencer.com/2025/09/uah-v6-1-global-temperature-update-for-august-2025-0-39-deg-c/#comment-1713791
a different argument altogether. You’ve got to be more careful with following these more complex discussions, barry!
OK, so now barry’s made a new mistake:
“Small caveat that you don’t need to time-average…”
barry doesn’t seem to understand that the approx. 240 W/m^2 average for irradiance for the Earth is of course “time-averaged”, since the Earth does not receive energy over its entire surface area at any one moment. It’s only after it has completed at least one full rotation on its own internal axis that the Earth will have received energy over its entire surface area, thus any figure for irradiance that involves the full surface area of the Earth must be temporally averaged over at least 24 hours.
“The values for radiant exitance in the budget all suffer from the same problem – they’re averages, thus they don’t abide by the SB Law, thus they’re “physically meaningless” ”
That comment is meaningless. “Abide by the S/B law” is meaningless. You are using this meaningless shorthand to indicate that averaging flux and averaging temperature produces different results on conversion due to the non-linearity of the S/B law.
However, if you don’t make the conversion, there is no issue. And your super silly comment that the problem exists even if you don’t convert is just an empty word salad.
Averaged temperatures are “physically meaningless” you said, and also “useful.”
Same with area-averaged fluxes. No one claims that the area-averaged flux represents the actuality of flux on the surface, which varies over a curve, for example. What any sane person understands is that area-averaging is a useful shorthand to compare flux in with flux out.
It’s a wonder you continue to run around in circles trying to find a problem that doesn’t exist. Why not let Clint defend his absurdities by himself?
And you’re wrong about time-averaging the irradiance on a sphere. It could be non-rotating and you still only need to spatially average at equilibrium and get the right answer. You do not need to factor for rotation at all when calculating a global energy budget. All you have to do is divide the incoming radiation by four to get the global output.
Which you already did! There was no time-averaging in your own solution.
Do stop trying to make controversies where there are none.
All wrong, barry. I’ve never known someone to get so much wrong whilst being so certain they’re correct. I can’t be bothered to keep correcting you about Clint’s point #2. Just think whatever you want – life’s too short.
But the “time-averaging” thing…where to begin?
The only way you can say the irradiance for the Earth is approx. 240 W/m^2 is if you average the input over at least 24 hours. That’s just a fact, barry. Nobody else on your side of the debate would even dispute it. Once again I’m getting pushback for being correct!
Premise 1) We wish to find a figure for the irradiance of the Earth involving the entire Earth’s surface.
Premise 2) The entire Earth’s surface is only irradiated once it has completed one full rotation.
Therefore:
Conclusion: A figure for the irradiance of the Earth involving the entire Earth’s surface is necessarily “time-averaged” over at least 24 hours.
QED.
I may as well post this, lest anyone get confused by barry’s nonsense:
Asking Google, “if you take flux values from a non-isothermal surface and average them, will that average abide by the Stefan-Boltzmann law?”
Returns:
“No, an averaged flux value from a non-isothermal surface will not directly abide by the Stefan-Boltzmann law (\(F=\sigma T^{4}\)). This is because the law requires a single, uniform temperature, and averaging the flux would be incorrect; you must average the temperatures first, or use the integral of the flux over the surface to find the correct average temperature, before applying the law.
Why averaging flux doesn’t work
The law is non-linear: The Stefan-Boltzmann law is proportional to the fourth power of the temperature (\(T^{4}\)). This means areas with higher temperatures contribute disproportionately more to the total radiation than cooler areas.
Flux is not uniform: On a non-isothermal surface, the flux is not the same everywhere because the temperature varies.
Incorrect calculation: Averaging the flux values directly (\(\frac{\sum \sigma T_{i}^{4}}{N}\)) is mathematically and physically incorrect. It does not represent the total radiation from the surface.
The correct way to find the average flux
Average the temperature: The correct approach is to find the average temperature (\(T_{avg}\)) of the surface first. This is done by integrating the temperature over the surface area and dividing by the total area.
Apply the law: Once you have the average temperature, you can use the Stefan-Boltzmann law to find the average flux: \(F_{avg}=\sigma T_{avg}^{4}\).”
“if you take flux values from a non-isothermal surface and average them, will that average abide by the Stefan-Boltzmann law?”
An energy budget does not need to “abide” by the S/B law, as no conversion to or from temperature is required.
You sent your AI friend on a wild goose chase by inferring flux as a function of temperature. Your herrings remain scarlet. Every time you mention S/B you are inserting an operation that is irrelevant for energy budgets.
Your refusal to understand no longer concerns me, barry.
I’ve come to realise that you are not a genuine commenter. It’s a shame you wasted so much of my time, and I will never forgive you for that.
In future (if I do ever bother to comment again) you will be treated the same way Clint treats you. The way someone like you deserves to be spoken to.
I used to have some respect for you, but you’ve burned all your bridges with me these past few months. You were given chances to concede points, to admit you were wrong about certain things, but you refused.
You’re not to be taken seriously.
Perhaps Graham D. Warner should calm down.
I’m perfectly calm, not that it’s any of your business.
Rather than explain why I’m wrong that S/B is irrelevant for an energy budget you pout and chastise.
Ad hom is all you have left. You are welcome to your soap opera – enjoy it by yourself.
You are also welcome at any time to make a substantive rebuttal – if you can.
Earth’s energy budget is derived from measured fluxes – not from measured temperatures. SB is irrelevant to this purpose. SB only comes into play if flux is represented as a function of temperature (or vise versa).
Same with the b/b sphere in space (or greybody with a certain amount of insolation reflected). We work only in fluxes to determine an energy budget.
Same with plates in space. For the longest time we all agreed that BP emits 200 W/m2 from each side, being the area averaged result of the 400 W/m2 input.
Now you are selling herring and pretending we didn’t agree on these terms for years.
So, barry wants to waste even more of my time.
Yes, barry, the BP receives 400 W/m^2 and emits 200 W/m^2. Flux is not conserved. Well done. You seem to think something has changed here. It hasn’t.
No conversion is needed. The values for the average output in the energy budget fail to abide by the S/B Law, and are thus not “physically meaningful”.
I already explained to you, several times, why this criticism doesn’t apply to the output from the BP. You just refuse to take it on board. That’s not my fault, and it’s no longer my problem.
6:06 am: “Flux is not conserved.”
… but energy flux is conserved. DREMT always hides the pea by dropping the word “energy” in front of flux.
If not, and DREMT can experimentally prove energy flux is not conserved, I’d appreciate DREMT show where I can find some energy flux from nothing to power my furnace in winter, this computer, and my SUV.
Ball4 makes a fool of himself, again.
“No conversion is needed. The values for the average output in the energy budget fail to abide by the S/B Law, and are thus not ‘physically meaningful’.”
Even as you wave away the S/B conversion you keep trying to shoehorn it in.
You can’t ‘violate’ a law you’re not using. The S/B law doesn’t constrain energy fluxes.
Flux-based energy budgets are used throughout physics and engineering — not just climate science. The Stefan–Boltzmann law is only needed when modeling radiation from temperature, not when summing measured energy flows.
A flux-based energy budget fully “abides” the 1st Law. Averaging temps and converting to flux does not.
As I’ve shown you before, your argument introduces an energy imbalance (the inequality in the S/B does that). This is something else you have yet to address.
I’m not advocating “averaging temps and converting to flux”, barry. I’ve told you that about ten times, already.
I’m sorry you don’t understand the criticism. What am I supposed to do for you? Keep explaining the same things over and over again?
No need – you’ve already said that it’s the fact of non-linearity in the conversion that is the problem, whether or not you do the conversion.
Which is utter nonsense.
We agree flux isn’t conserved, so that’s nothing to quibble about. You don’t seem to realise that power equals flux times area. When the incoming and outgoing fluxes are applied over matching areas, energy conservation holds – in equilibrium, the fluxes must balance. Dividing insolation by 4 will give you the exactly correct flux balance for the whole globe.
If you multiply 240 W/m2 by the area of the sphere, you will get the total emitted power of the sphere. If you multiply 960 W/m2 by the total area, you will not get the total received power over the whole sphere. You must first area-average the 960 W/m2. And you don’t need to time-average for this energy budget: you’ll only get the same result if you do that.
“I’m not advocating ‘averaging temps and converting to flux’, barry. I’ve told you that about ten times, already.”
Really? And yet you quoted your AI friend doing just that.
“Once you have the average temperature, you can use the Stefan-Boltzmann law to find the average flux”
https://www.drroyspencer.com/2025/10/uah-v6-1-global-temperature-update-for-september-2025-0-53-deg-c/#comment-1718237
And why does it advocate averaging the temps and converting to flux? Because you trained it to do so by invoking the S/B law. You embedded the conversion in your question.
It’s called leading the witness, your honour.
barry, you can multiply 960 W/m^2 by the surface area of the “Earth’s shadow” disk to get the “total power” received. You don’t actually need to average flux at all to get “total power”. But, that’s a completely separate argument.
I only quoted Google to prove to you that averaged fluxes from a non-isothermal surface don’t abide by the S/B Law. I’m not advocating “averaging temps and converting to flux”. I knew I should have left that bit out, as it would only confuse you. Oh well.
“I’m not advocating ‘averaging temps and converting to flux'”
But the AI you quoted thought that’s what you wanted.
Why? Because you invoked the S/B law. The conversion is automatic when you invoke S/B. Do you need a definition?
Flux = σT⁴
The law IS a conversion.
Are you dense or obtuse?
Every time you invoke S/B YOU, not me, introduces an unneeded and unnecessary inequality into an energy budget. It’s pure argumentativeness. And sorry, but it is incredibly pig-headed and stupid. Enough.
“barry, you can multiply 960 W/m^2 by the surface area of the “Earth’s shadow” disk to get the “total power” received.”
Facepalm.
You will NOT get the total power received by a whole sphere, only the sunlit side, and you will break the 1st Law for an energy balance.
This is execrably wrong and now utterly tedious. The argumentativeness has made you moronic. I’m done.
barry, an averaged flux value from a non-isothermal surface does not abide by the S/B Law, and thus is not “physically meaningful”. I’m sorry that upsets you so much.
960 W/m^2 x the surface area for the “Earth’s shadow” disk gives you the “total power” received for the entire sphere.
480 W/m^2 x the surface area of the lit hemisphere gives you the “total power” received for the entire sphere.
240 W/m^2 x the surface area of the entire sphere gives you the “total power” received for the entire sphere.
Learn some maths, and physics, then come back and apologise.
Tsk, I put that badly.
Yes the total power is the same whether received by disc, sphere, cube or the head of a ram.
960 W/m2 X piR2 = total power
That same total divided by 4πR² = 240 W/m2 (average over sphere)
960 W/m² X 4piR2 would be wrong — it double-counts geometry
“960 W/m² X 4piR2 would be wrong — it double-counts geometry…”
…and, it’s not what I suggested doing.
Once again, what I said was correct. You do not even need to average flux to get “total power”.
Are you going to apologise?
“960 W/m^2 x the surface area for the “Earth’s shadow” disk gives you the “total power” received for the entire sphere.
480 W/m^2 x the surface area of the lit hemisphere gives you the “total power” received for the entire sphere.
240 W/m^2 x the surface area of the entire sphere gives you the “total power” received for the entire sphere.”
Right. Good.
Now do you see that endlessly pounding on the table declaring that one of these is the wrong thing to do and should not be done, makes no sense?
Nate, the fact that you don’t even need to average flux at all to get the “total power” received does not support your narrative.
I’m waiting for an apology from barry, though, and certainly have no interest in talking to you on this sub-thread. When barry stumbles, you appear as if by magic. Begone, troll.
It is your narrative that claims one of these mathematically correct statements, the one most useful for climate science is somehow ‘wrong’, that is unsupported.
Begone, troll.
Gemini:
“Psychological Projection is a defense mechanism where an individual unconsciously attributes their own unacceptable or unwanted thoughts, feelings, or impulses to another person. It’s a way for the ego to protect itself from anxiety or discomfort caused by acknowledging these undesirable traits within oneself.”
barry said:
“This is execrably wrong and now utterly tedious. The argumentativeness has made you moronic. I’m done.”
Yet, as it turned out, barry was wrong, and I was right. Once again.
Now, a bunch of trolls appear out of nowhere, to distract from that! They quite obviously work together.
“Now, a bunch of trolls appear out of nowhere, to distract from that! They quite obviously work together.”
Not at all. Barry admitted his error. Not sure why you are all in a lather about this.
It must be a rare treat.
And I agrred with your 960, 480, 240 all give the total energy input when multiplied by the appropriate error.
I simply pointed out that therefore, there is absolutely no problem with using 240, as climate science does.
There should be no controversy about that.
And yet you keep endlessly shamelessly claiming that there is a problem with it, which you could choose to stop, anytime.
But you dont. What is your problem?
I have explained, at great length, the problem with 240 W/m^2 as an instantaneous average for irradiance. None of those arguments are remotely changed by the fact that 240 W/m^2 multiplied by the Earth’s total surface area = the total power received.
You’re clutching at straws.
And no, barry did not admit his error. In fact, he claimed he’d merely “put that badly”, and tried to act like it wasn’t a problem!
You work together. Support each other. Try to change the subject when things don’t go the way one of you wants. I can never just talk to one of you at a time.
It’s a new month now. Get on with your lives.
“barry, an averaged flux value from a non-isothermal surface does not abide by the S/B Law,”
The Stefan-Boltzmann law only applies when you convert temperature to radiative flux – that’s literally what the equation does:
Flux = σT⁴
So when you say an averaged flux ‘doesn’t abide by the S/B Law,’ you’re smuggling that conversion back in. If no temperature-flux conversion is being performed, the S/B law simply doesn’t apply. That’s the plain, unavoidable truth. You just don’t want to admit it.
barry, the fact that an averaged flux value from a non-isothermal surface does not abide by the S/B Law has been confirmed for you by Google. There were even other commenters (like Gadden) from your own “team” who agreed. Of course “conversion” is implied by the fact that the law involves the conversion of temperature to flux. However, the law does not “only apply” when a mathematical conversion takes place. That an averaged flux value from a non-isothermal surface will not convert to the “correct” temperature value is still true whether you convert it or not.
When I think of a flux value, I’m often thinking about “what sort of temperature would that convert to?”, whether I actually bother to do the maths or not. With the output values from the Earth’s energy budget, we know they would not convert to the “correct” temperatures. Regardless of whether we actually do it, or not. In that way, they are not physically meaningful values. Now, is that a major complaint? Not really. I’ve said many times already that Clint’s point #2 is only a minor point, IMO. But, is it an issue? Yes. Should Clint have been so severely misrepresented and falsely accused? No.
Is this worth months and months of back and forth? Depends. From my point of view, it’s important to get things right. It’s important not to misrepresent and falsely accuse people. So, I’ve continued to respond.
P.S: your failure to properly acknowledge your error and apologise for your earlier blunder and abusive comment is glaring, barry. This is why you’re not worth my time, and it’s why you’re not going to get treated with respect in future. If I bother to continue commenting, which I might not. Certainly I’ll be taking a break for a while.
“the fact that an averaged flux value from a non-isothermal surface does not abide by the S/B Law has been confirmed for you by Google. There were even other commenters (like Gadden) from your own “team” who agreed. Of course “conversion” is implied by the fact that the law involves the conversion of temperature to flux. However, the law does not “only apply” when a mathematical conversion takes place. That an averaged flux value from a non-isothermal surface will not convert to the “correct” temperature value is still true whether you convert it or not.”
You’re going around in circles with, alternately claiming you are not advocating converting temp to flux at all, and then pointing out the inequality that arises when you do so as the basis of your argument.
The S/B Law does not apply in a flux-based energy budget. No matter how much you try to smuggle it in, it is not relevant.
Your comments trying to argue the contrary are just as relevant. Bye.
“You’re going around in circles with, alternately claiming you are not advocating converting temp to flux at all, and then pointing out the inequality that arises when you do so as the basis of your argument.”
False, barry. I’m not advocating “averaging temps and then converting to flux” in order to “do” an energy budget. That’s the straw man that you have attacked approximately twenty times throughout this whole thing. I do, obviously, point out that if you were to convert the averaged flux values to temperature values, they would be the “wrong” temperature values.
“The S/B Law does not apply in a flux-based energy budget. No matter how much you try to smuggle it in, it is not relevant. Your comments trying to argue the contrary are just as relevant. Bye.”
The S/B Law always applies so long as the flux values exist, barry. It doesn’t only apply when you actually perform a mathematical operation to convert them!
Keep saying “bye”, keep returning, keep refusing to apologise or acknowledge your errors. Keep reminding me why you’re not worth my time.
Willard says,sounds like denial to me,is that so Willard, the UK climate began warming shortly after 1850 , to say a short period of records after 1980 proves extremes are getting worse ,is nonsense. as for sea level increase North Shields tidal guage shows no such alarmist rate of increase, what has changed, is the fact that the Met office now give any normal depression a fancy name, most which would not get into Hubert Lambs list of historic Storms, no one denies the climate has changed, why would it not? Why did you not show the slight cooling of the sixties and seventies, a cooling that in the early sixties almost destroyed the Icelandic fishing industry, a cooling that triggered a great drought in South America,and the coldest winter in England since the little ice age, in the early seventies floods in Australia,widespread severe cold in the Eastern seaboard of the US, and many parts of Northern Europe with shipping frozen in the Adriatic,i could give you a comprehensive list of UK weather reports five or six hundred years,but life is too short,if the last forty years bothers you,then i cant help you.
Yes, Ian.
As I said, you can always jump right to Step 3 – Saying Stuff.
Rhetorical Fun For Today:
GROK estimates
Subtotal (2011–2023): ~$10.1T has been spent on Fighting Climate Change globally.
A couple of questions-
Money well spent?
Will a couple of trillion a year going forward still save the planet? or will more than that be required?
Andrew
“Subtotal (2011–2023): ~$10.1T has been spent on Fighting Climate Change globally.”
Where from?
Most likely a lot of this is simply adding much needed clean grid power at a cost less than coal or nuclear.
Yes, that seems worthwhile.
I found no credible source that documents “Subtotal (2011-2023): ~$10.1T has been spent on Fighting Climate Change globally.”
Question: where did you get that number?
Ark,
It was in an answer from GROK. The question was Can the total amount of money spent on fighting climate change be estimated?
Nate,
“Yes, that seems worthwhile.”
Did you do a cost/benefit analysis?
Andrew
So, no facts.
All you need to know is that the professional engineering societies that oversee the standards for our physical infrastructure (civil, mechanical, electrical, and chemical) explicitly recognize the reality of climate change. They are revising design standards to ensure mitigation, adaptation, and resilience in the systems that society depends on.
AI
Bad,
Your figure, even if accurate, sounds immense until placed in context.
According to the U.S. Bureau of Economic Analysis (https://fred.stlouisfed.org/series/A679RC1Q027SBEA), private fixed investment in information-processing equipment and software within the U. S. alone totaled roughly $10.5 trillion over that same period.
IOW, the entire world’s climate-related spending (if your number were even correct) would merely represent roughly the same magnitude as just one domestic category of U.S. business investment.
Engineers understand such magnitudes as routine elements of economic modernization, not aberrations.
That is why the professional engineering societies responsible for real infrastructure (civil, mechanical, electrical, and chemical) formally recognize climate change and are revising standards for mitigation, adaptation, and resilience.
AI
Bad,
For still broader perspective:
The US National Debt has increased by $1.7 trillion since the Debt Ceiling was raised just 3 months ago, from $36.2 trillion to $37.9 trillion (https://fiscaldata.treasury.gov/datasets/debt-to-the-penny/debt-to-the-penny).
Follow the money. It’s a billion dollar industry that quite happily fly experts & influencers around the world to extol the virtues of believing in climate change vs capitalism.
Climate changes, whoops do. There are more pressing issues.
“It’s a billion dollar industry”
AFAR,
Lemme issue you one slight correction-
Evidently it’s a Trilllllllion dollar industry.
Otherwise, I agree.
Andrew
California, the fourth largest economy on planet Earth, is this summer using 40 percent less natural gas than it did two years ago to generate electricity.
If you wanna know why the fossil fuel industry is freaking out and sponsoring every bad politician on Earth, that’s why.
https://bsky.app/profile/emorwee.bsky.social/post/3lvbtbyv5z22p
Contrarians need no sponsor tho.
This 40% reduction in natural gas in California is due in large part to a reduced AC demand from a cooler than normal summer. Not to worry, the media narrative works both ways, so climate change also includes cooler than normal weather. It also shows how clueless people will push short term effects into long range projections.
Speaking of California…
I wonder if this Climate Change Remedy was included in our total?
“Overview of the Project
The California high-speed rail project was initially proposed to connect San Francisco and Los Angeles with a high-speed train, aiming to revolutionize transportation in the state. However, the project has been plagued by numerous challenges since its inception, including extensive delays and massive cost overruns. Originally estimated to cost around $33 billion in 2008, the projected cost has now escalated to between $128 billion and $135 billion, with completion timelines pushed into the 2030s.
Current Status
As of now, the project has not laid any high-speed tracks despite 16 years of planning and approximately $15 billion spent.”
Can we even survive until 2030? California will be underwater!
Fight On, Climate Warriors! We’re all counting on you! lol
Andrew
The Chinese are in seventh heaven ,all that money to manufacture components and solar panels using millions of tons of coal,as the diplomat said,useful western idiots,
So it’s a deal – about an order of magnitude less – when compared to the annual costs of fossil fuels. Good to know.
AI Overview
Yes, the total amount of money spent on producing and burning fossil fuels can be estimated, with global estimates from organizations like the International Monetary Fund (IMF) and the International Energy Agency (IEA) putting the cost in the trillions of dollars annually, encompassing both direct subsidies and the societal costs of climate change and pollution. For example, the IMF estimated global fossil fuel subsidies reached $7 trillion in 2022, an amount that includes explicit financial support to the industry and the implicit costs of air pollution and climate change.
Donald,
Thanks for your post. Ah… but there’s a little catch in your comparison…
Producing and Burning Fossil Fuel = Reality
Fighting Climate Change = Fantasy
I wonder why AI didn’t catch that little wrinkle?
Andrew
Do subsidies only count when talking non-fossil fuels?
It is now generally cheaper to generate energy using renewables than using fossil fuels, and the price is only going down.
Even if only factoring in the undisputed subsidies for fossil fuels, renewables are cheaper already and don’t contribute to the currently estimated 2 year reduction in average global life expectancy attributed to air pollution.
Bad Andrew
“I wonder why AI didn’t catch that little wrinkle? ”
Because AI is getting better at spotting bullsh*t like yours.
Climate Warrior EM,
Let us know when you Climate Warriors have saved the planet and how much it cost. Just leave a comment here. Thanx.
Andrew
Climate Misinformer BA,
I took a look at your Event Horizon blog and noticed that while it covers a range of personal and political reflections, there’s no indication of formal background or published work in climate science, atmospheric physics, or energy systems. That’s fine in itself, but it makes your confident statements about global climate spending and physical climate processes a clear case of someone speaking out of school.
If you want to critique the scale and complexity of climate policy meaningfully it helps to start from the evidence base, rather than selective cost figures pulled out of context.
Unless your goal is simply to spread misinformation rather than contribute to informed debate.
Thanx.
AI
Ark, if you want people to only address the real science, then you should start it off. Explain how CO2’s 15μ photons can raise the temperature of a 288K surface.
Unless your goal is simply to spread misinformation, due to your TDS and alarmism, rather than contribute to informed debate.
Now, run home to hide under your bed….
“a clear case of someone speaking out of school”
Ark,
You may have missed this concept along the line somewhere, but I represent a guy commenting on a blog.
You’re obviously taking the issues discussed here way too seriously.
…which is the point, of course.
Andrew
Bad,
Serious issues merit serious consideration. Put simply, if rigor feels excessive, we have different standards.
AI
“Serious issues merit serious consideration.”
Ark,
Sure. These issues are so serious that you’ll… comment on a blog just like me.
OK, Climate Hero. You’re doin’ great, Champ. Keep it up. You’re a Rigorous Climate Blog Superstar, Rigorously Saving The Planet. Clap, clap, clap.
Andrew
Bad,
Yes, some subjects actually are serious. Stop embarrassing yourself.
AI
“Yes, some subjects actually are serious.”
Ark,
And apparently, I’M a serious subject, because you are spending an awful lot of time on me. I’m touched.
Andrew
Bad,
You’re an unserious person who raised a very serious subjet; a subject which merits my utmost attention.
Thank you for your attention to this [serious] matter.
AI
EU alone is planning to use 1.5 trillion euros ($1.6 trillion) per year of investments to meet its 2050 net zero emissions target.
It was UN diplomat Maurice Strong who came up with this Anthropogenic Global Warming (AGW) concept (see the Club of Rome and Agenda 2030/Agenda 21). Maurice Strong lived in China and was financed by China. That is why AGW is also called “Chinese hoax”.
“The concept of global warming was created by and for the Chinese in order to make U.S. manufacturing non-competitive,” Donald Trump wrote on Twitter in 2012.
“We have certain things in common, Jeffrey”, wrote Donald to Jeffrey in 2003.
https://www.cnbc.com/2025/09/08/trump-epstein-birthday-book-oversight.html
Willard: Both Donald Trump and Jeffrey Epstein belonged to the jet set of New York City in 1970’s and 1980’s, so surely they met each other often in parties and nightclubs like Studio 54 and The Mudd Club. They were both rich and famous businessmen and media personalities so they had much in common. However in 2007, after Epstein sexually harassed an underage daughter of another Mar-a-Lago member, Trump revoked his Mar-a-Lago membership and their friendship was over.
When you say “jet set” you get the first half right, champ:
Donald has been traveling to campaign events on a jet that was previously owned by convicted pedophile Jeffrey Epstein.
Donald’s usual mode of transport, a Boeing 757 jet nicknamed ‘Donald Force One,’ was temporarily grounded on Friday following what was described by the Secret Service as a “mechanical issue” that forced him to land in Billings, Montana.
https://www.independent.co.uk/news/world/americas/us-politics/trump-jeffrey-epstein-plane-campaign-b2595204.html
The assumption by many Climate Scientists that water vapor increase is just feedback from temperature increase caused by CO2 increase is shown to be FALSE. Verification, with links to source data, is at Sect 7 in the analysis documented at https://watervaporandwarming.blogspot.com.
The assumption is wrong because the NASA/RSS measured average global WV increase is substantially more than possible from just feedback from planet warming as measured by UAH 6.1. The maximum possible WV increase from feedback is limited by the Clausius-Clapeyron relation.
The nominal ratio, measured-WV/max-WV-from-feedback has been declining since a maximum of about 2 in 2016 to about 1.4 in 2024. Even at a ratio of 1.4 the probability that the assumption is false is more than 99 %.
Uggh. Debunked here already many times.
This is the first time the current (Oct 6 2025) version has been posted here. Blaming Global Warming on CO2 is shown to be wrong.
Nate believes if he speaks then it is debunked.
SOLAR MINIMUM UPDATE
There are five markets that are in the spotlight for us at the moment:
Saudi Arabia signed the-largest deal within Europe, Middle-East and Africa, or EMEA, region — the 2.6 gigawatts Masdar KEPCO and GD Power Al Sadawi PV Plant.
Germany was the largest market for wind investments after China, and also has a strong solar portfolio building.
India’s renewable energy investments reached $11.8 billion in the first half of the year, with auctions of projects that combine solar, wind and storage being the main driver of new capacity.
Turkey saw solar investment rise 12% in the first half of 2025.
Indonesian investment rose nearly fivefold over the-same period, with the government’s latest power development plan creating a $96 billion investment opportunity over the next 10 years.
https://about.bnef.com/insights/clean-energy/record-renewable-energy-investment-in-2025-three-things-to-know/
Another win for Dirty Donald!
You can’t run businesses, hospitals, etc. on occasional electricity like wind turbines and solar panels. The electrical grid is expected to deliver continuous and uninterrupted electricity no matter what.
That’s what batteries are for.
You’re so 2015, Max:
Worldwide solar and wind power generation has outpaced electricity demand this year, and for the first time on record, renewable energies combined generated more power than coal
https://www.cbc.ca/news/science/solar-wind-renewables-coal-electricity-1.7653234
Ever heard of batteries?
Willard: Running big industrial factories on batteries! I nearly laughed my head off. 🙂
Laughter is good for the soul, troglodyte:
With GE Vernova steam turbines, cement manufacturers can recover heat from the kiln exhaust released during the manufacturing process and then generate electricity from that waste heat. This heat is typically produced by pre-heater waste gas and air-quenching waste gas.
Steam produced from these two waste gases during the cement waste heat recovery process powers the steam turbine, creating an electrical power source for the plant. Because the cement plant is using waste in this way, it can reduce its dependence on costly fuel sources and grid power.
https://www.gevernova.com/gas-power/industries/cement
You realize I’m no hippie, right?
RLH: Modern hydrogen steel plant needs electricity 1200 MW/h continuously day and night. Where can I buy such a battery?
Canada is the source of about 5% of all aluminium produced globally, almost exclusively manufactured using mechanical energy storage.
As mentioned earlier – renewables now generate more electrical power than does coal, globally; apparently, energy storage is being addressed in the real world.
Here, Champ:
https://stegra.com/the-boden-plant
The more you make me work for you, the less credibility you got.
“Modern hydrogen steel plant needs electricity 1200 MW/h continuously day and night. Where can I buy such a battery?”
Try specking one!
Heh, this blog is about science, not science fiction. Anyone reading the above needs to go to the IEA (international energy data) and the EIA (U.S. energy data) and look at the latest annual data. Solar and wind are a cruel joke. And look at the increases in coal in India and China.
The UK currently generates more than half of its electricity from renewables, and is still increasing that ratio. This is reality. The UK has heavy industry – it’s pretty famous for having invented it, actually.
Will all fossil fuel plants be immediately replaced? No, some such plants will be required as part of a resilient system for many decades yet.
But pretending that renewables are not practical and are not more cost effective than new fossil fuel power generation? Now that’s fiction.
Not at all. They are the largest contributor to NEW power generation.
Historically every new source of energy, coal, oil, hydro, nuclear, natural gas, had exponential growth initially, that lasted 30-40 y.
We are in that initial growth period for solar and wind.
According to the recent Ember report, China and India have reduced fossil-fuel generation by 2% and 3.1% respectively, while increasing renewables by about 30% (China: +43% solar, +16% wind)
Are coal emissions increasing in _absolute_ terms? Yes, because China is undertaking an industrial and urban revolution, while still producing only a fraction of US per capita emissions. But those coal plants are being designed as back ups to the far larger volume of new renewables.
Thomas handwaves to this:
https://www.iea.org/news/global-renewable-capacity-is-set-to-grow-strongly-driven-by-solar-pv
Roy’s contrarians are cruel, but considering the current administration, they’re no joke.
Well, keep trying guys. I CAN be convinced by data and argument. I have changed my mind before. But fear doesn’t work too well on me. I have faced imminent death twice in my life. Once in uniform, once out of uniform.
As the saying goes “size matters.” The direction of a vector is important. The length of the vector is even more important. With me, numbers always “Trump” (intentional attempt to trigger certain people on this blog) words. An energy source can comprise 2% of total supply or consumption and increase 50% to 3% of total supply/consumption over, let’s say, a short period of time. It still will pale in comparison to the other 97%. Further, the overall energy supply will be growing at a fast pace (third world development, AI, crypto mining). So, absolute CO2 production is very likely to continue to increase. Do you really expect developing countries with vast numbers of energy starved poor people to reduce their coal use? I am glad that the relatively meaningless growth rate of highly subsidized, inefficient and ineffective wind and solar floats your boat, but can we global warming heretics please stop subsidizing the true believers whimsy?
So, what is wrong with my logic? I didn’t supply exact numbers, but they are easily obtainable at IEA and EIA. I didn’t make anything up. And stop using a pro warming think tank for your argument. Use somewhat independent DATA, please.
Dear Thomas,
If you ever want to be taken seriously, do like Rob and post your audited results:
https://qoppac.blogspot.com/2025/04/annual-performance-update-returneth.html
Until then, you’re just an old guy who keeps saying stuff.
Who in their right mind would like to convince troglodytes?
?”I am glad that the relatively meaningless growth rate of highly subsidized, inefficient and ineffective wind and solar floats”
Quantify ‘meaningless’ in your view please.
In what way are these inefficient?
In 1910 the number of US horses was still 40x larger than the number of automobiles, yet automobile numbers were exponentially rising…which Thomas would have called ‘meaningless’.
Horses will dominate for the forseeable future, he would have declared.
We all know what happened next.
clint…”“Earth’s shadow causes the phases of the Moon”.
That was just one of gordon’s many flubs. After repeated criticisms, I believe he has begrudgingly recanted”.
***
Let’s put this one to bed. I was obviously having a bad hair day and confused eclipses with phases. On several occasions, I have explained how phases come about, through the view angle between the lunar near side and the Sun, so I obviously understand the difference. I find it somewhat sad that alarmists cling to one gaffe and cannot even begin to scientifically rebut any other claims I have made.
Ironically, NASA uses the motion of the same phase shift in shadow on the near face as proof that the Moon is rotating. I have heard nothing out of the spinners about that, who obviously regard NASA as an authority figure. NASA is essentially claiming that the apparently moving shadow created by the Sun shining at different angles in the lunar orbit on the near face is proof of rotation.
With regard to Clint’s whine that I have made many flubs, I am still awaiting a scientific critique from him. All he seems to manage are insults and ad homs.
He has recently made a fool of himself by claiming flux is not conserved then follows that up by claiming distance and area are conserved. That gaffe indicates Clint has no idea what conservation means in this context. Besides, Einstein might disagree with him. E. thought that length varied as an object approached the speed of light. E. like Clint failed to understand that time has no existence outside the human mind. Having redefined time incorrectly to suit his bad theory, he reasoned that since length is a function of time, to humans, it must change as time changes.
Again, flux is a mathematical concept introduced by Newton as a measure of a rate of change. Referring to such flux in terms of conservation is ingenuous. As such, flux is nothing more than an idea, or thought, having no meaning in actuality. It is energy that has meaning, an actuality, even though we have no idea to date of what it is in actuality. When we refer to a flux in relation to an energy like electromagnetic energy, magnetic energy, or solar energy, which is EM, we are referring to an instantaneous rate of change of those energies over an area.
With electrical energy of a specific frequency, say 60 Hz, we average the power over one cycle of a sine wave. Presumably, it is possible to average the energy of EM over one cycle, provided the EM frequency is a single frequency. How can you do that when bazzilions of frequencies are involved? Planck claims to have done it, using presumptions and fudging. At that, his calculations apply only to an imaginary energy, blackbody radiation.
Let’s look at how the definition of flux has become obfuscated in modern times. For example, what do we mean by solar flux per metre squared at TOA? Through any square metre is beaming bazillions of different frequencies of EM. Since the frequency of each constituent EM component varies, there has to be great phase differences over the spectrum, meaning EM summation is taking place.
How do we measure such a vast range of frequencies? We can’t, there are simply no instruments that can measure the entire spectrum accurately. So, we use mathematical means using something antiquated like S-B. We calculate the estimated solar surface temperature and apply S-B to calculate the EM generated. Then we created a sphere with a diameter of approx. 93 million miles and work out what the EM should be in a square meter of the sphere at TOA.
Let’s face it, this is Mickey Mouse science at its best. Calling the power/square meter calculated ‘flux’ is even more MM. For it to be regarded as flux, a known function must be applied and the derivative take of that function. To apply Newton correctly, we need to measure each individual frequency in the square meter and calculate how it is varying.
All we can do is generalize based on projected averages. Any instrumental measurement is severely restricted to the bandwidth of the instrument and at that, all the instrument can do is measure the average intensity, not being able to measure in distinct ranges like UV. Essentially, all the 1300+ watts claimed at TOA per square meter can tell you is how good a suntan you might acquire.
It would be far more helpful if we could measure in narrow bandwidths to see how solar output is varying in each bandwidth.
Ergo, solar flux is an ambiguous term that reveals nothing about how the energy is changing instantaneously in the square metre. Hence, flux is being used generically and not as Newton intended it. It is actually a reference to a fuzzy human concept of how the energy in that square metre appears visually, a collection of lines, as in a magnetic field, or bazillions of photons/quanta as in an EM field. And that presumes photons exist.
The problem is that we in modern times have focused the meaning of flux to refer to changes in such imaginary fields. That was not how Newton had intended the meaning of flux, or fluxions, as he called them. He was referring to an instantaneous rate of change between two or more variables in a general manner, not referring only to imaginary fields, as we now use the word. The modern term for fluxions is the derivative, or instantaneous rate of change of a function.
Poor Clint, mired in his particular form of logic, sticks obstinately to his egregiously incorrect definitions in science. He thinks heat is not energy but a transfer of an undefined energy which in reality has to be thermal energy, or heat. He thinks electric current flows positive to negative even though modern textbooks grudgingly admit that electrons, the actual current carriers, flow negative to positive. They cannot explain what could possibly flow positive to negative since all the real positive charges in a conductor are fixed in place in the nucleus of atoms.
Clint thinks entropy is a measure of disorder even though Clausius defined it as a summation of heat quantities. That is clear in his formula for entropy which is S = integral dq/T. Not a mention of disorder, just one variable, q, the symbol for heat.
Clint goes on an on, one gaffe after another. But, hey, other than that, he’s an OK guy.
gordon, you can’t support any of your false accusations. Like the other Leftists, you just make up crap to clog the blog. Even Bindi knows you’re a fraud.
But, keep proving me right. I like being right.
binny…”I have often enough exposed Robertson’s blatant lies about Lanka and measles”.
***
The above reference is to an offer of 100,000 Euros offered by scientist Stefan Lanka if anyone could prove, using one paper, that the measles virus has been isolated.
Fortunately, the German high court saw the argument differently than you. That is, Lanka still has the 100,000 Euros claimed by the plaintiff.
Lanka had argued that no one paper has successfully proved the measles virus has been isolated. If he is right, then the measles vaccine is some concoction of substances that has nothing to do with measles.
The lower court erred, in the view of the higher court, since they allowed the plaintiff to reference (cherry pick) dribbles from several papers. In essence, he has collated arguments from several papers to present his proof that measles virus had been successfully isolated.
This sound a lot like modern climate alarm where the entire theory, AGW, is stitched together from various fabrications. No pun intended.
That suggests to me that the plaintiff was an ijit, much like Binny, the two appearing to be peas of a pod. He obviously could not comprehend a simple set of instructions laid out by Lanka and Binny cannot understand any of it. He as offered statements referencing the plaintiff as referencing Lanka.
The higher court went one step further, it called it’s own expert, who ended up agreeing with Lanka. The court had no intention of ruling on whether the measles virus has been isolated, their sole intention was to verify, or not, the lower court decision, which Lanka had claimed erred by allowing several papers to be referenced.
However, the overall outcome of the trial was an important discovery made by Lanka. The basis of most viral experiments trying to prove viral action was that the suspected virus killed healthy laboratory cells, an idea that came, I think, from Koch’s Postulate. Lanka proved, using an independent lab, that the healthy cells would have died anyway due to pre-treatment in the labs, whether or not they were infected by a viral substance.
The healthy cells are treated with antibiotics to prevent infection and they are starved to ensure a timely death. In other words, the cells were set up to die anyway. When I read that, I found it hard to accept that modern scientists are so obtuse as to use such laboratory chicanery. Lanka, discovered, through research, that no lab claiming to have isolated a virus, had performed a control study to check for the obvious.
Lanka has claimed that none of the modern viruses, including covid, have proved to have been isolated. When the original SARS virus (an ancestor of covid) had been claimed isolated, the paper was rejected on the ground that the particles claimed to be a virus were uncertain as to their origin.
This is a serious problem in viral research, trying to prove that what is claimed as a virus is actually a virus.
student b…”The quantity Bν(ν, T) is the spectral radiance as a function of temperature and frequency. It has units of W·m−2·sr−1·Hz−1 in the SI system.”
To obtain Wm-2 you must integrate Bν(ν, T) over all solid angles and frequencies”.
***
You are failing to grasp my point. Bν(ν, T) as used here, by Planck, is a reference to a theorized set of vibrations, as if they were tiny oscillators. That was the model applied by Planck since he did not know of electrons, which produced the frequencies due to their angular velocity in an orbit.
Planck intended this at one temperature, a blackbody temperature. It was never meant to represent anything other than a theory, hence it could be integrated theoretically from 0 -> infinity with just frequency. Wein came along and extrapolated Planck’s function to changing temperatures.
Stefan’s original formula, I = sigma.T^4, was derived from Tyndall’s experiment which did actual laboratory measurement in a range from about 500C to 1200C. The T^4 relationship was calculated some 15 years before Planck and in a specific temperature range.
There is no way to imply Stefan from Planck unless you restrict the integration to the range of 500C to 1200C and use a whole lot of fudging and imagination. No one has ever proved that S-B is valid over the entire absolute temperature range. That is also why ice gets a ridiculous value of radiation over 300 w/m^2.
I have read, with higher temperatures, the S-B exponent reaches T^5.
“I have read,…”
Sure you have. Which comic book was it?
Dear all
I`ve been following this discussion for about 35 years. And the arguments on either side remain the same. I have been very skeptical
myself about the human driven warming. There has been the Iris-Effect and the AMO and the PDO going together into a negative phase and of course the ENSO. The difference in 2025 is, that we have much more information about our planet. We know much more about the temperature in different layers of the oceans than we knew in the times, when the temperture was measured on the surface.
BACK AT THE RANCH
White House Deputy Chief of Staff Stephen Miller raised eyebrows during a live CNN interview this week after claiming that President Donald had “plenary authority” during a conversation about the deployment of the National Guard in Oregon.
Video of Miller’s statement has gone viral – not only due to Miller’s controversial assertion – but because of the way he suddenly cut himself off mid-sentence, leaving his statement incomplete.
Donald having “plenary authority” suggests the president has assumed total power over the decision to deploy the National Guard in some states. It is unclear whether Miller paused due to technical difficulties or stopped himself after apparently realising the implications of what he was saying.
https://www.independent.co.uk/news/world/americas/us-politics/plenary-authority-stephen-miller-cnn-dictator-b2841627.html
An angel must have whispered “Posse Comitatus” in his ear.
Either way, another win for Donald!
Two things going on there:
1/ The revealing slip of the mask.
And,
2/ The sudden cutoff indicates that they perceive real danger in letting that idea stand unqualified in a public, broadcast setting.
This may become Exhibit A in the Nuremburg style trials when the regime is eventually brought to account.
Ark, you better get back under your bed. They are coming for you.
Hey Puffman, riddle me this –
About 1 in 3 US Nobel prize winners are immigrants.
About 1 in 4 were government employees at some point.
About 44% of all Nobel prize winners were educated in US higher education.
Do you think Donald is destroying the Murican education system so he and other troglodytes have better chances to win a prize?
Most people in China, India, Africa and South America live in poverty without proper education. Then there is this Islamic world, where 50% of people (women) have no education and men study only Qur’an.
Only in the USA, Canada, Australia, part of Asia and West Europe (including Russia) people get higher education. In the USA people waste their time studying imaginary AGW, intersectionality and things like CO2 emissions of cow’s farts. Trump is destroying this part of the American education system, which is a good thing and worth a Nobel prize.
MaxC,
Yeah, not the only thing Trump is destroying: Farm bankruptcies are soaring amid low crop prices, while Trump considers bailout of up to $14 billion.
Nobel Prize in Economics, you reckon?
Dang Ark, is supply/demand another concept you don’t understand?
Russia is dumping wheat to help pay for their invasion of Ukraine. China is slowing learning to grow enough wheat to feed their population, so their imports are dropping. And US producers, being the most effective, are achieving harvests up to 40 bushels/acre.
Trump will support US farmers, you can count on that. In the past, farmers have been paid NOT to plant, until the prices stabilize.
But the satellites are tracking you. Better throw your cell phone down the toilet, put more layers of tin foil on your head and get back under your bed. They’re coming after you….
Hey Puffman, riddle me this –
Donald believed his Truth Social post demanding prosecutions of James Comey and other political foes was a private message to his attorney general, and “and was surprised to learn it was public.”
Do you realize you’re in my thread?
Don’t worry Willard, you’re probably not the only cult child that didn’t get it.
Maybe when you grow up?
I’m quite sure everybody but you realize you’re replying to my comments, Puffman.
Riddle me this – are you obsessing over people monitoring your activity because you are using Covenant Eyes like Mike J does?
The Truth Social post is a doozy. What caught my eye beyond the flagrant weaponization of the DoJ, was that Trump demanded the AG prosecute people because not doing so made them “look bad.”
WTF?
The executor of the law isn’t interested in the propriety of the prosecutions, only the optics on his reputation.
Which we already knew, but now he’s just gone and stated it in black and white.
Conservatives excoriated Biden on the notion that he was making Garland go after political enemies. This with no evidence at all that Biden made demands on Garland, and some evidence to the contrary.
But when dear leader does the same thing they lashed, in full public view – well, now you see just as plainly the ethical consistency of conservatives.
Zero. They have zero ethical standards. They are salivating at the revenge, suddenly all on board with weaponising the DoJ. No principle, no scruple, just vengeance.
The US govt is pushing a return to coal.
Problem is, nobody wants it.
They tried to auction the rights to 167 Million tons of coal on federal land in Montana.
The only bid was 0.1 cents per ton, from a Navajo tribe.
https://apnews.com/article/trump-coal-sales-public-lands-montana-b2dbbdc81e7afbf24947b9a4b32fa417
A decade ago, such coal auctions yielded $1.10 per ton.
Conservatives are all about letting the market decide.
Seems it decided: coal is worthless.
Simple. Fracking made nat gas far cheaper. It is also cleaner, but that is not why we have gone to it. It has greatly reduced the U.S. production of CO2. Your welcome. Now work on getting China and India to buy our LNG.
Yes gas. And renewables.
Using this tool energy trends can be charted
https://www.energyinst.org/statistical-review/energy-charting-tool/energy-charting-tool
For the US energy consumption (EJ) by source and year we see:
Year. Coal Gas Renewables
2005. 22.4 21.7. 1.3
2024. 7.9. 32.5. 9.7
Change. -14.5. 10.8. 8.4
we still burn coal in the UK Nate, many prefer it for domestic use,especially those living in rural areas who do not have Access to gas.the big problem is ,it has to be imported from Columbia, the irony is that the people who burn it are living on top of millions of tons of coal, but our quaint governments, past and present refuse to allow anyone to dig a hole in the ground,
Certainly coal built your empire.
But then stuff like this happened:
https://www.britannica.com/event/Great-Smog-of-London
Most people dwcided they prefer clean air apparently.
Luckily you guys have a massive wind energy resource. And its clean and renewable.
In 2015 the measured increase trend from 1988 was 0.923 kg/m^2 while the calculated increase, limited by the Clausius-Clapeyron relation and based on the UAH temperature trend for the same time period, was 0.486 kg/m^2. This demonstrates that the assumption by many Climate Scientists that water vapor increase is just feedback from temperature increase caused by CO2 increase is wrong.
Sorry, are you saying the alarmist scientists underestimated water vapour increase?
Yes. AFAIK, they use the WV level calculated within the GCMs instead of the up to about twice as high (in 2016) values measured and reported by NASA/RSS. The surge in WV has been contributed to by increasing world population of about 3.1 billion since 1988, increasing population of desert areas, and increasing irrigation.
The Clausius-Clapeyron relation yields 6-7% increase in atmos WV for every 1K of warming.
UAH LT global temp increased by a total of 0.3K over the period 1988 to 2015 inclusive.
If global mean TPW baseline before the 1980s is about 25 kg/m2, then the increase for the temp change is 0.52 kg/m2 (7% increase C/C).
What figures did you use?
Having looked around at various papers there is a wide range of values given for WV increase, with fairly wide uncertainty (often as much as 30% – 40%). Picking just one figure without acknowledging this range and uncertainty doesn’t seem to be a neutral read on the matter.
To minimize noise in the measured UAH data I used the regression for the data 1988 to 2015. Regression eqn 0.009444x-18.979 gives 0.255 K for the 27 years. Times my best assessment of 6.7 %/K and a nominal WV level of 28.5 kg/m^2 yields WV increase from planet warming of 0.255 * 0.067 * 28.8 = 0.487 kg/m^2.
NASA/RSS reports average global WV anomalies at https://data.remss.com/vapor/monthly_1deg/old_files/tpw_v07r02_198801_202312.time_series.txt and claim an RMS accuracy of about 1 mm (= 1 kg/m^2). The regression slope for this data is 0.03423 for an increase in the 27 yr of 0.03423 * 27 = 0.924 kg/m^2.
Comparison ratios for neighboring years are shown at Fig 7.1 in the analysis at (click my name).
stoopidb “I have read,…”
Sure you have. Which comic book was it?”
***
Stoopidb has obviously conceded that he is out of his element and unable to respond to the science I have presented, hence he resorts to his true nature…ad homs and insults.
He is even more stoopid than I thought, however, since the premise I presented is stoopid simple. That is, you simply cannot compare Planck, whose equation refers to blackbody radiation derived from a thought experiment, and at a constant temperature, with generous mathematical fudging, to a relationship (Stefan’s) derived from actual experimentation in a fixed temperature range.
Put more succinctly, there are no provisions in Planck for a variation in temperature. Unable to understand basic calculus, Stoopidb presents a line integral that sums frequencies from 0 ->infinity while holding the temperature constant.
Anyone who has used data from a fixed temperature range would not dream of extrapolating the derived equation to a different range based on statistical analysis without further experimental proof.
Unless, of course, you are as stoopid as stoopidb.
Here is the thing.
The SBL has been around since 1879.
“Master mind” GR proposes it is not applicable over all temperatures. i.e. he wants us to believe that nobody has bothered to check its veracity in over 125 years.
Think about it.
125 years.
Think of the thousands, nay, tens of thousands of scientists who have apparently been deluded over this time span!
Only now, with his cutting insights and mastery of calculus has GR revealed their folly!
My god! Let’s put GR up on a pedestal with Newton, Einstein etc.!
FFS
So you should not have a problem in showing the papers?
studentb
In the past I spent some time finding and posting links to Gordon showing experiments done at cooler temperatures than the fisrt experiments. The experiments verified SB law but Gordon ignores any thing other than what he blindly believes.
Case of point, he believes a crackpot named Lanka on Measles and rejects all evidence that does not agree with Lanka. I have linked him to Electron Microscope images of measles and then he is a super expert in the field of electron microscopes (even though he has never even ran one before or set up samples) so he rejects all this.
I asked him to explain how measles vaccine (a weakened virus of the more dangerous one) was able to almost eradicate the disease but he ignores this as he has no answer but Lanka (the mighty one) could not possibly be a liar and crackpot so the more logical path is that every researcher in the field of viruses is wrong and corrupt or stupid, only Lanka knows anything. More logical thought process would be to think Lanka is wrong and the others may actually know what they are talking about.
One thing is most certain. Gordon Robertson thinks he is right in all his zany ideas (which are not his own, he reads crackpot web sites) and will never think or question his version of reality.
ent…Bad Andrew
“I wonder why AI didn’t catch that little wrinkle? ”
***
ent…hope you are not reliant on AI. Many people regard it as something novel, something dangerous that will take over society. For someone like myself, who has spent decades working with computer hardware, software, and electronics, especially digital electronics, I see nothing to fear.
Any computer is only as good as its program and programs are written by humans. Programs vary markedly in quality but even the best cannot replicate the human mind simply because no one has any idea how it works. We don’t even understand intelligence or awareness so what’s the point of talking about artificial intelligence?
Computers can do calculations much faster than humans, in general, although the human mind has an uncanny ability to do parallel thinking that computers cannot do. I think that’s partly because computers do multitasking through code threads that cannot always be running at the same time. Parallel processing in a computer is more using multiple processors (cores) to operate threads in parallel.
AI is a reference to the fast processing speed coupled with ways of storing information and accessing it. Algorithms have been developed to enhance data processing and data processing is not intelligence. Google has imposed their AI on us with every search and from what I have seen, Google AI is simply a very fast data processor. However, it seems reliant on entities like Wikipedia.
GIGO…garage in, garbage out.
The human mind does not require multiple processors to do very complex functions. It is the control centre for much of the body and keeps us alive, freeing us to think independently. As evidenced here in Roy’s blog much of that free thinking is wasted due to a hard-coding imposed on the system by culture and conditioning. We also have the ability to see the conditioning and become aware of it, a trait many of us are not even aware exists.
I expect “AI” to be a failure.
The large language models just manipulate words without meaning and their hallucinations corrupt datasets.
Following the South Sea bubble, the tulip bubble, the railway bubble, the dotcom bubble and the biotech bubble I expect an AI bubble.
GR,
I, for one, am not reliant on AI. I occasionally probe GROK with questions just to kind of test the AI waters, mostly for entertainment purposes.
I do think GROK collects the “conventional wisdom”- whether that “wisdom” is right, wrong, insane, stupid, deceptive or whatever. It could be any of the above. So, with that expectation, I don’t expect AI to be anything but glorified GIGO programming.
Andrew
Agreed.
SOLAR MINIMUM UPDATE
Solar set a new ERCOT record (last Tuesday) on Sept. 9, generating almost half of total demand in the fast-growing Texas electricity market while providing more than 40% of the state’s electricity for seven straight hours, from 9 a.m. to 4 p.m.
The latest record is the 17th of 2025, an astounding 7,785 megawatts (MW) higher than the first record of 22,092 MW set Jan. 24. New data from ERCOT—the Electric Reliability Council of Texas—also highlights solar’s reliability over the summer: For the period from June 1 through Aug. 31, solar met 15.2% of all demand in the ERCOT system, more than coal’s 12.5% market share.
It also covered 26.9% of peak-hour demand. The peak hour output, which averaged 20,817 MW over the course of the summer, was a 5,408MW increase from just one year ago.
https://ieefa.org/resources/summer-solar-and-battery-storage-records-texas
Wow! 7 entire hours!! Just WOW!!!
Everything’s bigger in Texas.
stephen p anderson
I do not know if you would wander up the thread to look at my response to your post.
https://www.drroyspencer.com/2025/10/uah-v6-1-global-temperature-update-for-september-2025-0-53-deg-c/#comment-1717496
You linked to some pages covering thermodynamics and claimed this shows it is “nonsense” to accept that energy from a cold object does flow to a hotter one.
Your link DOES NOT demonstrate anything about it. It has no study at all on heat transfer. It is just discussing some basic ideas in thermodynamics (1st, 2nd Law, Entropy, reversible process, Carnot engines) but nothing concerning how energy transfer works!
Here is one for you to look at.
https://en.wikipedia.org/wiki/Carnot_heat_engine
The warmer the cold reservoir with respect to the hot reservoir, the less efficient the engine!! The temperature of the cold certainly affects the energy flow from the hot source.
stephen p anderson
Here is a link to show that energy transfer IS a TWO-WAY process (CAPS for emphasis). The energy of the lower energy object gets transferred to the higher energy object.
https://en.wikipedia.org/wiki/Elastic_collision
Even though the energy in atomic collision is two way (or multiple if more than two atoms are involved) the macroscopic heat flow is one way. A hotter gas will transfer its energy to the lower temperature gas but the lower temperature gas, on the atomic level, transfers its energy to the atom with higher kinetic energy. It is not a ONE-WAY transfer of energy. So that the warmer the cold gas is the slower the hot gas loses its energy.
Real Heat transfer will have a heated gas (additional source of energy constantly supplying it) reach a higher temperature if the surrounding wall temperature is increased. The rate the gas will lose heat is reduced as the wall temperature goes up so that the same input energy will cause the gas to reach a higher temperature.
Likewise with GHG. There reduce the rate the surface loses energy and so the solar input will cause the surface to reach a higher temperature.
Sorry Norman but you’re still confused.
You criticize gordon for spouting nonsense, but you do the same. You’re confusing your opinions with science.
https://www.drroyspencer.com/2025/10/uah-v6-1-global-temperature-update-for-september-2025-0-53-deg-c/#comment-1717474
You don’t have a clue about the Carnot cycle. You just find things on the Internet you can’t understand. You’ve never studied thermodynamics, so you don’t know the Carnot cycle refers to things like steam engines, air conditioners, and heat pumps.
But keep trying to pervert the laws of physics.
Good golly. The unscientist comes along to insult and pretend he knows science. So will you support your claims or not or will you just continue your endless taunts and insults? We all know what you will not do! Provide any valid science for your opinions. Since you know nothing about heat exchange or thermodynamics why don’t you try to leatn it?
Hey Puffman, riddle me this –
Drunken Pete, Donald’s pick to run the Pentagon, regularly abused alcohol to the point that he passed out at family gatherings, and once needed to be dragged out of a strip club while in uniform, according to an ex-relative’s account of his behavior that was given to U.S. lawmakers and reviewed by The Wall Street Journal.
https://www.wsj.com/politics/policy/pete-hegseth-affidavit-witness-drunk-passing-out-e216ca85
Does anything says “America First” more than letting another country put an Air Force base in Idaho, and why do you keep trying to make yourself relevant?
Norman,
Nowhere in the textbook that states energy exchanges between a hot and cold object. It states the Laws of Thermodynamics as they were originally written. It also has section on entropy and microstates. It isn’t impossible for energy to flow from cold to hot, only improbable due to entropy. Does energy flow from Earth to Sun? Not impossible but improbable.
SOLAR MINIMUM UPDATE
The planned demolition of the UK’s last coal-fired power station has reached a key step.
Ratcliffe-on-Soar Power Station was switched off on 30 September 2024 after generating electricity since 1968.
On Thursday, Rushcliffe Borough Council approved plans to knock down the cooling towers, the main power station building, and other buildings on site with controlled explosives.
According to plans, it will take until at least 2030 to knock down and clear the site.
https://www.bbc.com/news/articles/cvgqez9gqrko
Let’s spare a thought for Matt King Coal.
That is why electricity prices are so high in UK. However 34% of UK energy is still from fossil fuels, mainly gas. In UK you can not buy house coal anymore, but you can buy anthracite imported from China!
Step 3 – Saying Stuff
https://www.gov.uk/government/statistical-data-sets/historical-electricity-data
For some reason our troglodyte doesn’t seem to apply the same logic to Donald shutting down solar plants.
Anthracite and coal based smokeless fuel {ovoids] are still used by many households in Northumberland,two coal merchants deliver to our small village every week, shipped into Tyne Dock from Columbia.
There must still people who use oil lamps too.
That surely means something.
Matt King Coal is alive and kicking in the far east, just as well, someone has produce all the renewable junk.
norman…”n the past I spent some time finding and posting links to Gordon showing experiments done at cooler temperatures than the fisrt experiments. The experiments verified SB law but Gordon ignores any thing other than what he blindly believes”.
***
Don’t recall those links, Norman. Don’t go to a lot of trouble, but if you have one on hand, please re-post.
I saw one the other day that claims the surface temperature of the Earth is 288.15K, based on S-B. It uses blackbody theory coupled with S-B and a whole lot of suppositions. Google AI points out how to calculate the temperature using S-B then admits it is theoretical and essentially wrong, because Earth’s surface temperature is not even and has a very wide range of temperatures.
Therefore, at any one time, Earth’s surface temperature could range from -90C(183.15K) to +60C (333.15 K) in any one spot, and the +15C average based on S-B calculations is more smoke and mirrors than actual. The S-B average of +15C (288.15K) means absolutely nothing.
———–
“Case of point, he believes a crackpot named Lanka on Measles and rejects all evidence that does not agree with Lanka. I have linked him to Electron Microscope images of measles and then he is a super expert in the field of electron microscopes (even though he has never even ran one before or set up samples) so he rejects all this”.
****
Yes, but Lanka is an expert on EM image interpretation and he claims the image shown for measles is not a virus but cell debris. That’s not so unusual. The first claim of the SARS virus isolation was rejected due to the fact no one could agree it was a virus shown by the EM.
Besides, Norman, Lanka has a standing offer of 100,000 Euros for anyone who can prove, using one paper, that measles has been isolated. No one has claimed it although one wag tried, cherry picking several papers. The lower court fell for it but the higher court dismissed their claim. If he is such a crackpot, why was he able to convince the higher court, who appointed their own expert, who agreed with Lanka?
An interesting aside came from the court hearing. Lanka had an independent lab verify that cells used to test viruses will die on their own due the lab preparations. The cells are pre-starved and affected by antibiotics used to prevent them being infected by bacteria. Why do cells have to be pre-starved, to ensure they’ll die?
Why has no one noticed this gaffe in lab protocol other than Lanka? Not one study claiming to have isolated a virus, on the basis they infected and killed healthy cells, bothered to run a control study to see if the cell pre-treatment would cause the cells to die on their own.
———
“I asked him to explain how measles vaccine (a weakened virus of the more dangerous one) was able to almost eradicate the disease but he ignores….”
***
I did not ignore it, Norman, I claimed I did not know the facts. However, I have gained enough skepticism of claims that disease has been eradicated with vaccines to claim we need to look deeper into the matter. The fact that such skepticism is being rejected by the poobahs is of concern. People should e encouraged to do such science, not be coerced into not rocking the boat.
I was never vaccinated for polio and I have never had polio. Touch wood. I grew up in conditions of poverty with a diet that would be considered today to be sub-standard, yet no polio and no major illnesses. I am thankful.
norman…”Here is a link to show that energy transfer IS a TWO-WAY process (CAPS for emphasis). The energy of the lower energy object gets transferred to the higher energy object.
https://en.wikipedia.org/wiki/Elastic_collision
Even though the energy in atomic collision is two way (or multiple if more than two atoms are involved) the macroscopic heat flow is one way. A hotter gas will transfer its energy to the lower temperature gas but the lower temperature gas, on the atomic level, transfers its energy to the atom with higher kinetic energy. It is not a ONE-WAY transfer of energy. So that the warmer the cold gas is the slower the hot gas loses its energy”.
***
Norman, how can I get through to you that the word energy is a generic representation of different forms of energy? On its own, energy does not mean much and the word can be seriously misleading.
Elastic collisions (mechanical energy) occur only between solids with hard surfaces, like snooker balls. In that case, with two balls colliding, there is a transfer of momentum from one mass to the other. Call it an energy transfer if you want but a transfer of momentum is easier to visualize. It means a heavier mass traveling at the same velocity as a lighter mass will have have a higher momentum since momentum = mass x velocity.
During a collision, the heavier mass will transfer more momentum to the lighter mass than the lighter mass transfers to the heavier mass. Nothing to do with heat transfer.
I realize some try to apply this to atoms in a gas but they are wrong. Any collisions are of a different nature altogether, involving electrostatic forces. That theory dates back to the 19th century before the atomic structure was discovered. Of course, you and Clint may be that old. Tee hee.
Atomic collisions are a different principle altogether since there is never a solid colliding with a solid. An atom is comprised of an estimated 99.99% empty space. Most of the mass is concentrated in the nucleus and the electron orbits are so large wrt the nucleus the space taken up by electrons and the orbital extents is essentially trivial.
You seem to be visualizing gas atoms in a container as tiny snooker balls, or ping pong balls, bounding off the solid walls of the container.
———–
“Real Heat transfer will have a heated gas (additional source of energy constantly supplying it) reach a higher temperature if the surrounding wall temperature is increased. The rate the gas will lose heat is reduced as the wall temperature goes up so that the same input energy will cause the gas to reach a higher temperature”.
***
You have failed to define what heat is and how it is transferred. Atoms gain and lose heat through electrons. It’s dumb to talk about one atom heating or cooling although it makes sense micro-scopically. Here, we are talking about gaining and losing KE, where heat is defined macroscopically as the relative KE of the atoms. Electrons gain and lose heat by gaining and losing KE, which they gain through being exposed to a heat source, or by absorbing certain frequencies of EM.
That’s the reason heat cannot be transferred from a colder body to a hotter body. Electrons don’t work in reverse in that they cannot absorb EM frequencies from a colder mass. They cannot absorb heat either from a colder mass since they need to absorb it from electrons at a higher KE level, ergo, a hotter mass.
———
“Likewise with GHG. There reduce the rate the surface loses energy and so the solar input will cause the surface to reach a higher temperature”.
***
How can a trace gas possibly affect the rate of cooling of the surface? Newton’s Law of Cooling of a surface is based on temperature difference and the temperature of the atmosphere is obviously controlled by nitrogen and oxygen, which account for 99% of the atmosphere.
Actually, there would be no temperature difference since two bodies in contact, like the atmosphere and surface, should be at thermal equilibrium. However, air has the property that when heated by the surface, its constituent air rise, allowing cooler air to replace it. That’s how the surface cools principally, via cooler air from aloft. That air is 99% nitrogen and oxygen. CO2 has a negligible effect.
student b…”The SBL has been around since 1879.
“Master mind” GR proposes it is not applicable over all temperatures. i.e. he wants us to believe that nobody has bothered to check its veracity in over 125 years”.
***
You could prove it yourself. Just use S-B to calculate the EM given off by ice, which is claimed to be 300+ w/m^2, then use the EM to warm something while measuring the warming effect with a thermometer.
That ouhgta show ’em. Then you could post here while bragging about your Nobel.
If you get enough square meters of ice, you should be able to fry an egg. May be why no one has tried to prove it.
But, hey, if I’m missing something, I’m willing to hear your explanation.
Please remember that EM contains no heat and no mechanical energy, and should not be measured in watts. Under certain conditions, if a source is hot enough, it can give off EM of sufficient intensity to cause warming if a cooler mass absorbs it and converts it to heat. That does not work the other way around…2nd law.
746 electrical watts represents 1 mechanical horsepower. A 750 watt electrical heater gives off loads of heat as a space heater, but those are electrical watts, which are equivalent to 1 HP.
According to S-B, there should be an equivalent amount of power available in 2 m^2 of ice. After all, 300+ watts is almost half a horsepower. Sure, it’s spread over a square metre, but it should e additive with enough ice.
What am I missing?
Poor gordon is never going to be able to understand these issues. So I no longer try to teach him. But, the danger is he will mislead others who have a desire to learn. This is why I make the effort here.
Like all of “climate science”, gordon does not understand “flux”. This is the short term used for the radiant flux calculated from the Stefan-Boltzmann Law. That flux being the photons emitted from a surface, based on its temperature.
There is a lot of confusion about this simple, straight-forward concept. A flux is not the same as energy. The photons have energy, but the flux cannot be treated as energy. For example, energy can be treated as a quantity, that is, it can be added, subtracted and averaged. Energy is said to be “conserved”. But flux, except in very special cases, cannot be added, subtracted, or averaged. “Flux” is NOT conserved.
gordon keeps confusing flux with energy and power. He doesn’t understand that Watts/m² is NOT the same as Joules. Worse, he’s now comparing flux to “horsepower”. Don’t be confused by his confusion!
gordon claims the S/B Law is invalid because it shows a block of ice is emitting about 300 W/m². He believes that means the ice is emitting the same as a 3-100W light bulbs. (He’s believing “Watts” (units of power) are the same as “W/m²” (units of flux). What gordon can’t understand is a 100W light bulb has a filament temperature close to 3000K (5000 °F)! So from the S/B Law, the filament is emitting over 4,000,000 W/m². Don’t be confused by his confusion.
Flux has units of W/m², energy has units of Joules, and power has units of Watts. They are all very different, and cannot be treated the same.
Energy — Joules
Power — Watts — Joules/second
Flux — W/m² — Power/square meter
“What am I missing?”
Don’t tempt me !!!
In any case, I think CR has explained your confusion.
(surprisingly, I will give credit to CR….just this once though).
One last attempt from my end.
GR, imagine you are suddenly floating alone in deepest darkest space. Your body begins to rapidly cool. You are heading towards being snap frozen at -273degC.
Suddenly I come by and offer you a frozen blanket (at 0degC)
Should you take it to ward off being snap frozen or do you
reject my kind offer on the basis that the blanket is colder than your body and cannot possibly be of any use?
SOLAR MINIMUM UPDATE
While Australia debates the merits of going nuclear and frustration grows over the slower-than-needed rollout of solar and wind power, China is going all in on renewables.
New figures show the pace of its clean energy transition is roughly the equivalent of installing five large-scale nuclear power plants worth of renewables every week.
A report by Sydney-based think tank Climate Energy Finance (CEF) said China was installing renewables so rapidly it would meet its end-of-2030 target by the end of this month — or 6.5 years early.
https://www.abc.net.au/news/science/2024-07-16/chinas-renewable-energy-boom-breaks-records/104086640
Will Donald win that one, or is he only barking this morning to make his best friends more money in shaking off weak hands?
Time will tell!
At the same time China has expanded the capacity of coal-fired plants more in the first half of 2025 than at any time in the past 9 years!
And in the U.S Department of Energy (DOE) announced a $625 million investment to expand and reinvigorate America’s coal industry, aiming to boost energy production and support coal communities nationwide.
Donald and Xi are winners!
For some reason our troglodyte omitted some bits from his assistant:
In the first half of 2025, China added a record amount of renewable energy capacity, including approximately 210 GW of new solar and 50 GW of new wind capacity.
The country’s new solar capacity additions alone in the first half of 2025 were more than twice the rest of the world combined.
China’s total installed solar photovoltaic capacity surpassed 1,000 GW (1 TW) for the first time in May 2025, and its combined wind and solar capacity now exceeds its thermal (mostly coal) capacity.
The official strategy is for new coal plants to increasingly serve a “supporting” or “regulating” role—acting as a flexible backup to manage the intermittent nature of high volumes of solar and wind power—rather than as primary baseload generators
Willard: So you finally admit that for every TW of solar and wind power you have to build massive coal-fired power stations to “support” and “regulate” occasional wind and solar power.
As soon as you’ll admit that coal currently accounts for half of China’s energy production, down from three-quarters in 2016, Max.
Troglodytes have *no* idea how fast these damn socialists are moving.
Albert Einstein’s Desk on the day of his death 18th of April 1955 at age 76: https://ibb.co/Fk0SNBfm
I was out riding my horse and shooting my guns all morning so maybe I missed it, but how’s the big Wall Street Stock Market rally going?
Also, has Trump been awarded the Nobel Peace Prize yet?
No Ark, you were hiding under your bed all morning. Then you heard the stock market dropped, but being a child you don’t understand that is a “buying opportunity”.
Trump is mocking the bogus “Nobel Peace Prize”. He, like most adults, knows it is a hoax. Greta is more likely to get it than Trump. It’s a “reward” for brain-dead Leftists, by brain-dead Swedish Leftists.
If you ever grow up, you will understand.
So it was you who shot the Wall Street bears!
Norway had two choices, and they chose 400% tariffs.
… Wall Street bulls! Sorry, my bad.
My advice is not to sell in panic during stock market crash. Get rich instead.
MaxC.
“So it was you who shot the Wall Street bears!”
My youngest son pushed me into Gold more than 10 years ago. Yesterday I sent him a Goldgenie phone.
“Norway had two choices, and they chose 400% tariffs.”
The Nobel Peace prize was more breaking news this year than any of the others because Trump had been very vocal recently in claiming that he should win it. Trump received multiple nominations for the award, but many of them came after the February 1 deadline for the 2025 prize so, (1) Trump was aware of the deadline and is simply playing to his moronic cult, or (2) Trump truly doesn’t understand how this works.
Instead, it went to a DEI nominee (Maria Corina Machado) from the current super bad enemy of the day, Venezuela, for being subversive while identifying as a woman. Her accomplishments are pretty meh.
I am busting a gut here; it is just too funny. The whole thing is a publicity stunt anyway to make us forget that Alfred Nobel made a fortune selling dynamite for wars.
Donald only has one choice:
To win.
And now the market, that sore loser, is reacting.
Have his sons dumped their crypto beforehand, and how is that legal?
Troglodytes don’t care.
People like Clint R, Robertson and some others who constantly haunt this blog deny everything, regardless of the evidence.
Clint R’s most recent denial:
” Trump is mocking the bogus “Nobel Peace Prize”. He, like most adults, knows it is a hoax. Greta is more likely to get it than Trump. It’s a “reward” for brain-dead Leftists, by brain-dead Swedish Leftists. ”
*
How can anyone be so stupid as to perversely ignore what is visible everywhere – probably even on Fox News?
*
Let’s look at the Hill site which is anything but a leftist corner.
https://thehill.com/homenews/administration/5529126-donald-trump-nobel-peace-prize-insult/
” Trump: It would be ‘an insult to our country’ if he doesn’t get Nobel Peace Prize ”
*
” Among the many surprising moments at President-elect Donald Trump’s campaign rallies this year were his repeated declarations that he should be awarded the Nobel Peace Prize.
Last month, Trump stood on a stage in Las Vegas and declared, “They gave Obama the Nobel Prize … He got elected and they announced he’s getting the Nobel Prize. I got elected in a much bigger, better, crazier election, but they gave him the Nobel Prize.”
On the campaign trail, Trump often mentioned being nominated for the Nobel Prize — the last time in October 2024 by a member of the House of Representatives. His previous nominations have focused on his Middle East diplomacy, his effort to bring about diplomatic normalization between Kosovo and Serbia, and for his outreach and summitry with North Korean leader Kim Jong Un. ”
*
Clint R and his friend Robertson are, among all deniers of everything (from the GHE till the lunar spin), the dumbest and the most brazen ones.
Bindi’s TDS is making him even worse than his cultism.
Never mix two illnesses….
Most climatologists have been misled by Raymond Pierrehumbert’s promotion of the concept known as “radiative forcing”—a notion that has been rigorously challenged by leading scientists such as Professor Claes Johnson. It is a fundamental error to claim that radiation from colder regions of the troposphere can raise the temperature of a warmer surface. This violates basic thermodynamic principles.
The surface is warmer not because of back-radiation, but primarily due to the gravitationally induced temperature gradient—a well-established physical reality recognized by physicists since the 1870s. Moreover, such downward radiation does not slow the rate of radiative cooling at the surface, and it certainly has no effect on dominant non-radiative cooling mechanisms like convection and evaporation.
Excellent point, Clint R
https://www.drroyspencer.com/2025/10/uah-v6-1-global-temperature-update-for-september-2025-0-53-deg-c/#comment-1718165
Gordon Robertson
So you can’t say I did not show you, I am sending you a link to an experiment where Stefan-Boltzmann Law holds at much colder temperatures than your platinum heated metal used in the original experiment. It is still warmer than room temperature but much colder than your range. The Law holds. It is considered a science Law because (like Gravity) it holds for all experimental tests so far.
https://stuff.lanowen.com/Physics/Labs/Phys%20260L/Lab4/Lab_4_Stafan-Boltzmann-Law.pdf
clint…”Like all of “climate science”, gordon does not understand “flux”. This is the short term used for the radiant flux calculated from the Stefan-Boltzmann Law. That flux being the photons emitted from a surface, based on its temperature”.
***
And what, pray tell, is emitted from a surface? It is electromagnetic energy. Flux is simply a mathematical concept to help us visualize the EM and quantify it. With a pure magnetic flux, the flux is a reference to the magnetic field strength around a magnet, again, a visualization aid.
It is EM intensity that is measured by S-B.
Here’s a good one. A flux meter is used to measure magnetic flux. It works by moving a coil of wires in a magnetic field and measuring the voltage/current induced in the coil. Therefore, lines of force per unit area are measured using a voltage just as temperature is a measure of the expansion of mercury in a mercury thermometer.
If a piece of iron is held close to a magnet, a physical force is developed that draws the iron to the magnetic. If we want to determine the strength of the magnetic flux field, we can state it in webers, where 1 weber = 10^8 lines of force. Of course no one can see lines of force since they are mathematical visualization concepts.
I mean, how the heck would you measure the number of lines of force? It’s nothing more than a figment of the human imagination, quantified imaginatively in a relative manner. Something is definitely there causing a force ut we have no idea what it is physically.
It is unfortunate that some ijits came up with the idea of honouring physicists by renaming terms that can be visualized, like lines of force or flux density, with human names.
The human ego knows no bounds.
With electrically-operated relays, there is a pole piece with wires wound around it that produces a magnetic field when current runs through the coils. Essentially, it is an electromagnet. The coil has a steel pole piece in the middle to concentrate magnetic flux, which flows through the core like an electric current, through the armature and back into the core. The armature is steel and on a hinge with a spring so it can be attracted to the magnetic pole piece and release when the current is stopped.
Incorporated in most relays is a flux gap, which is a variable gap between the pole piece and the armature, that controls the intensity of the magnetic flux by varying an air gap over which the flux must flow. Varying the air gap, one can control the speed at which the relay activates and releases.
Here, the word flux is used to describe an unknown. We have no idea what a magnetic field is, or an electric field for that matter. However, we need words to describe the unknown phenomena, hence the word flux.
***
Clint ruminates even more incorrectly…
“There is a lot of confusion about this simple, straight-forward concept. A flux is not the same as energy. The photons have energy, but the flux cannot be treated as energy. For example, energy can be treated as a quantity, that is, it can be added, subtracted and averaged. Energy is said to be “conserved”. But flux, except in very special cases, cannot be added, subtracted, or averaged. “Flux” is NOT conserved”.
***
Utter confusion. Flux does not exist, it is a concept developed by humans to aid in visualization. Talking about it being conserved, or not, is plain silly. How does one conserve something that is not there, like time? The idea was introduced by Newton in a generalized way to enable him to define the instantaneous rate of change of a function.
Something is there but we don’t know what it is or what form it takes. In lieu of that, we invented a visualization and called it flux.
Put another way, if there is no electromagnetic energy flowing through an area there can be no flux. Fourier called heat flow a flux and if there is no heat flowing, there is no flux.
Ergo, flux represents a flow of energy.
Scientists in the 19th century, like Faraday, Oersted, and Lenz, discovered ‘something’ happening around a conductor when a direct electric current flowed in the conductor. ‘Something’ was deflecting a compass needle. They had to call it something, so they called it flux. In that case, the flux was a name for an electromagnetic field, although no one understood the relationship between electric charges flowing in a conductor and electric and/or magnetic fields.
Why do I know this? I have been indoctrinated in it since an early age in the field of electronics. We were taught all this in basic electronics.
SOLAR MINIMUM UPDATE
Picture how big the Hoover Dam is. An absolute unit. The Hoover Dam has a power capacity of 2 gigawatts (GW).
The solar farm that the Admin just cancelled could have produces 6.2 GW of power. That’s more than 3 Hoover Dams.
https://bsky.app/profile/costasamaras.com/post/3m2srukufxc2s
Prices will go up.
Will Donald be able to blame Joe?
Australia produces more power from renewables than it could ever use,but it has high electricity prices,the UK is on the same path, cheep power from Solar and wind is a myth, to blame fossil fuels is a denial of reality, in the UK its a double whammy, not only are we paying high electricity prices,but it is government subsidized with tax payers money.
Too much false information, Ian:
The Clean Energy Investor Group (CEIG) today released a report that
shows without renewables and battery storage, Australian households and businesses would have faced wholesale electricity prices up to $80/MWh higher in 2024, along with an increased risk of blackouts.
https://www.ceig.org.au/wp-content/uploads/2025/03/CEIG-MR_New-Report-confirms-renewables-reduce-power-prices_FINAL.pdf
You should emulate Max’ glittering generalities.
DREMT is wrong:
“The only way you can say the irradiance for the Earth is approx. 240 W/m^2 is if you average the input over at least 24 hours. That’s just a fact, barry. Nobody else on your side of the debate would even dispute it. Once again I’m getting pushback for being correct!”
Here’s how:
1/ The value of 240 W/m² represents an instantaneous global average, not a 24-hour time average.
2/ The factor of ¼ is not a temporal averaging factor, but a geometric one that arises from the ratio of the Earth’s cross-sectional area intercepting sunlight to its total surface area.
3/ This geometric relationship holds independently of time and even for a non-rotating planet.
4/ The value of 240 W/m² is the global mean absorbed solar radiation, not the incident irradiance.
Premise 1) We wish to find a figure for the irradiance of the Earth involving the entire Earth’s surface.
Premise 2) The entire Earth’s surface is only irradiated once it has completed one full rotation.
Therefore:
Conclusion: A figure for the irradiance of the Earth involving the entire Earth’s surface is necessarily “time-averaged” over at least 24 hours.
QED.
“1/ The value of 240 W/m² represents an instantaneous global average, not a 24-hour time average.”
At any instant, half the globe is not irradiated.
“2/ The factor of ¼ is…a geometric one that arises from the ratio of the Earth’s cross-sectional area intercepting sunlight to its total surface area.”
Understood since high school.
“3/ This geometric relationship holds independently of time and even for a non-rotating planet.”
Half of a non-rotating planet will never be irradiated, assuming there’s only one energy source.
“4/ The value of 240 W/m² is the global mean absorbed solar radiation, not the incident irradiance.”
And, the argument made in my 10:25 AM comment remains correct, regardless.
Ark doesn’t understand the science. Earth warmed by 4 sources each providing 240 W/m² to the surface and equally spaced around the equator would only raise Earth to 255K (0 °F, -18 °C).
That’s just typical for the GHE cultists. They have no knowledge of radiative physics and thermodynamics, and they can’t learn….
Several things falsify GHE theory. (1) Continuity Equation, (2) Equivalence Principle, and (3) The Lapse Rate. For cultists like Ark and Willard, political correctness is way more important than scientific correctness.
Yes Stephen, it’s nonsense. Sad that so many “scientists” are apparently unable to debunk it. One has to wonder if ego and funding are not factors.
Even people with little science can see through the hoax. Just watching the cult kids play here is enough for people with common sense to know that “dog won’t hunt”.
They are afraid of all the psychopathic bullies on the left. Leftism truly is a mental disorder affecting a large percentage of the population. Look what it has done to California and New York. The sane are fleeing those states in droves.
You might also like:
The convicted felon and current President of the United States officially launched a new government website dubbed DonaldRx during a press conference at the White House on Friday. It’s very Donaldy. And we mean that in the worst way possible.
https://gizmodo.com/trumprx-is-a-narcissistic-ai-generated-nightmare-2000671309
Who is we?
Roy Spencer appears to be the primary victim of his own blog’s “philosophy” of preserving freedom of speech.
Despite his explicit request to the blog posters to finally stop their endless denying, they continue to publish their utter nonsense.
https://www.drroyspencer.com/2024/08/yes-the-greenhouse-effect-is-like-a-real-greenhouse-and-other-odds-and-ends/
*
These stupid, ignorant boys truly lack any respect, hence deserve themselves none.
Bindi, if you would like a proper debunking of any “experiment” that claims “cold” can warm “hot”, I’m willing to do it if you will agree to not comment here for 90 days.
If I can find at least 5 things wrong with it, you must also agree to not comment for an additional 90 days.
So, pick out your best “experiment”. You need a vacation anyway….
The pushback for being correct continues…
It’s not even a controversial point, that’s the funny thing. That the approx. 240 W/m^2 figure for irradiance of the Earth necessarily involves “time-averaging” over at least 24 hours would not even be disputed by any serious scientist. That’s not the controversial part of the overall argument.
The only thing I got wrong was saying to barry, “nobody else on your side of the debate would even dispute it”. Clearly, in fact there are indeed other people whose views align with barry that are prepared to kick up a fuss about irrefutable facts for some reason.
I bet if I simply posted a comment saying the Earth was round I would get pushback from the usual suspects on here…
Bindidon.
Dr Spencer, in the post you linked to, was reminding us that great people talk about ideas, average people talk about events, and small people talk about other people.
IOW he wants us to the great people.
Thanks for the reminder.
Well, the “idea” is that it’s not even remotely controversial to say the approx. 240 W/m^2 value for irradiance is necessarily “time-averaged” over at least 24 hours.
I’ve been too busy to comment, but i found this reply from DREMT on my return.
“Well, the ‘idea’ is that it’s not even remotely controversial to say the approx. 240 W/m^2 value for irradiance is necessarily ‘time-averaged’ over at least 24 hours.”
No, it’s area-averaged. The calculation does not include time (other than watts are joules per second), it simply involves the ratio of a disc to a sphere of the same radius.
A non-rotating sphere that receives 960 W/m2 from a sun emits an average of 240W/m2 from its entire surface.
No clocks were harmed in the calculating of this result!
You don’t need a diurnal cycle to do this calculation.
“…emits an average…”
barry, we’re not talking about the output.
We’re talking about the input. The irradiance.
Just go back to sleep.
If you want to know the energy per second that a whole sphere is receiving, area-averaging the absorbed solar irradiance over the whole sphere will give you the correct answer. (This will also give you the area-averaged emission)
You don’t need a diurnal cycle to do this. This works for a non-rotating sphere.
240 W/m2 = 960/4 W/m2
I do not know why this is so hard to understand. Perhaps because you don’t understand that averaging works depending on the purpose. Maybe that’s why you keep coming up wth purposes that don’t apply to an energy budget, like working out the average temperature, or pointing out the obvious but useless fact that the sun only shines on one side of a sphere. At equilibrium none of those things matter for the energy budget of a sphere in space.
barry, it is understood that 240 is 960 divided by 4.
Can you understand that at any one moment, a sphere is not receiving irradiance over its entire surface area?
Understanding that is important, because, if you ask Google:
“Should you average irradiance over an amount of surface area which is not receiving that irradiance?”
You get the following response:
No, you should not average irradiance over an area that is not receiving it, because irradiance is a measure of power per unit area, and including areas with zero irradiance would incorrectly lower the overall average. To get a meaningful average, you should only consider the total power received by the surface area that is exposed to the irradiance.
Irradiance is power per area: The definition of irradiance is the power from the sun that reaches a surface per unit area, expressed as Watts per square meter (W/m^2).
Correct calculation: To find the total solar power available, you multiply the irradiance by the area that is actually receiving the light (e.g. W/m^2 times m^2=W).
Incorrect average: Averaging the irradiance over a larger area that includes areas not receiving any sunlight would give you a lower, inaccurate number that does not reflect the actual solar power available to the parts of the surface that are exposed.
Use case example: For solar panel systems, this is crucial for calculating potential power output. A system’s power output is directly dependent on the irradiance it receives, so including areas that are in shade would lead to a faulty calculation of its performance.”
So, the minimum possible irradiance average for a non-rotating sphere receiving 960 W/m^2 would be 480 W/m^2. That would be a spatial average over the lit hemisphere.
The minimum possible irradiance average for a rotating sphere receiving 960 W/m^2 and rotating once every 24 hours would be 240 W/m^2. That would be a spatial and temporal average over the whole sphere and over the course of at least 24 hours.
He is telling us there is a diurnal cycle.
But the insists it is not about the diurnal cycle.
Nate dreams of another 30-day session with his companion barry, where they can both psychologically manipulate and gaslight me over the lengthy time period in the hope of getting me to reject what I know to be true. Such a rejection will never occur.
So you are blaming your opponents for your contradictions.
Got it.
barry said: “…pointing out the obvious but useless fact that the sun only shines on one side of a sphere. At equilibrium none of those things matter for the ENERGY BUDGET of a sphere in space.”
DREMT said: “Averaging the irradiance over a larger area that includes areas not receiving any sunlight would give you a lower, inaccurate number that does not reflect the actual solar power available to the parts of the surface that are exposed.
Irrelevant for an energy budget. Good lord, you keep wanting to make different goal posts to prove your irrelevant point. You continue…
“Use case example: For solar panel systems, this is crucial for calculating potential power output.”
FFS this is dim. Yet more red herrings. What did I say a post ago? Oh yes!
“Perhaps because you don’t understand that averaging works depending on the purpose. Maybe that’s why you keep coming up wth purposes that don’t apply to an energy budget…”
Thank you for yet another demonstration of this point.
You are being purely argumentative. This is below freshman level logic, let alone physics. You have no counter to area-averaging insolation for an energy budget, so you argue that it doesn’t apply to a bunch of other stuff. Sheesh!
Calm down, barry.
All that you have quoted is output from Google. And, Google’s point is general. It doesn’t matter how you try to excuse or justify it, barry, you should not average irradiance over surface area that is not receiving that irradiance. Full stop, period, end of story.
I’m not interested in another long back and forth, either.
It’s done.
Oh it’s definitely done. You could not address the point within the context of an energy budget – which is THE context – so you threw up a bunch of red herrings. And it’s an automatic lose when you posit a language program knows the truth about physics. Hilariously, you don’t even know how pathetic that is.
Do have the last word. Even a half-wit can read the conversation and see you fail to the address the actual point while bringing up a train of irrelevancies.
Gaslighter, you continuously harp on about the purpose of the average being for an energy budget, and therefore it’s “OK” to average solar irradiance where the Sun don’t shine.
Well, it may interest you to learn that the approx. 240 W/m^2 figure used in the Earth’s energy budget is, in fact, a spatial and temporal average. It’s “time-averaged” over the course of an entire year!
So…I’m correct. Once again.
“You are being purely argumentative. This is below freshman level logic, let alone physics. You have no counter to area-averaging insolation for an energy budget, so you argue that it doesn’t apply to a bunch of other stuff. Sheesh!”
Exactly! Well put.
And why does he keep shamelessly deferring to the demonstrably flawed expertise of Google/AI?
Classic sophistry.
“it may interest you to learn that the approx. 240 W/m^2 figure used in the Earth’s energy budget is, in fact, a spatial and temporal average.”
Temporal averaging is done over a year or many years to smooth out temporal fluctuations like seasons, ENSO, changes in cloud cover etc. Used for actual climate diagnostics of Earth with an atmosphere, orbital variation and weather systems.
We’ve been talking about a sphere in space.
Again, you move the goalposts. None of that negates what I’ve said. You don’t need to time average insolation on a sphere to determine the equilibrium energy budget over the whole sphere. Dividing the irradiance flux by 4 (area) is sufficient. This debunks the specific argument Clint was (and you are) making.
And still you can’t rebut the actual point.
But maybe you could mention the temporal averaging to Clint. I don’t think he realises how much work goes into Earth’s energy budget estimates.
Apologies. I was giving you the last word. You go right ahead.
Is to falsely accuse me of “moving goalposts” the new memo that all of you guys have received?
Seems I’m getting accused of that in several different ongoing discussions and not in one case is it true.
I kept it general, and I was accused of moving the goalposts. I moved it to the specific case of Earth’s energy budget, since that’s what you were saying was the relevant context, and you accused me of moving the goalposts again. So, I will go back to the general. No doubt you will accuse me of moving the goalposts a third time.
barry, you shouldn’t average irradiance over surface area not receiving that irradiance. That means a non-rotating sphere only receives the energy over half of its surface area, and your irradiance average should reflect that fact. A rotating sphere will receive energy over all of its surface area, but obviously only after it completes one full rotation. Only after time has elapsed. So, you have a choice with a rotating sphere – an instantaneous average which reflects the fact that at any one moment it only receives energy over one hemisphere, or a spatial and temporal average over the whole surface area.
If you want to claim that irradiance can always be averaged over the entire surface area of an object, regardless of whether it is received over that entire surface or not, you may as well just claim that flux is conserved. I know that you don’t think that flux is conserved, barry. So, start acting like you actually accept that.
Wait until these guys learn that the approx. 240 W/m^2 value for irradiance is typically “time-averaged” over a full year, to account for seasonal variation…
Science understands that both the spatial average and the temporal average global flux is 240 W/m2.
There is no sound rationale to deny this.
I’m correct, Nate.
Thats called you are high on your own supply.
Just saying ‘Im correct’ is not an argument, and since you employ this non-argument way too often, you have lost all credibility.
Too bad.
Nate, I’m not going to have the same discussion with you in two different places. That would just be stupid. Take it down-thread.
To much false information ,says Willard, you post a link from a biased group, i get my information from the horses mouth,i have friends and family in Australia from Wagawaga to Durban ,and they all say the same thing,ever since the forced transition prices have increased yearly,the only people who really benefit from this ,are the ones rich enough to install their own solar and battery back up.it benefits no one,other than the rich.as for the environment,dont get me started, all this destruction because of a none existent climate crisis, at least Queensland have seen the light,and committed themselves to coal untill at least 2046.
Ian, you rant and rant and again expect room service. Australia has open electricity markets, a bit like ERCOT. There, for reasons troglodytes may never understand, it costs more. Regulated markets are cheaper, in general but also in Australia. At least unless you’re not stuck with private rentier monopolies like in the Deep South.
If you reduce energy sources, prices increase; renewables are an energy sources. Ask your buddies if they can do syllogisms. If not, tell them this: when coal or gas goes up, electricity goes up.
If everybody uses coal or gas, both go up. When renewables go up, well we don’t know about that because they always go down.
Also, nobody should be living in WA. Not enough people for too big of a grid. When they’ll go solar and tide, I’ll reconsider. Only half-joking. The only WA dude I know is quite a rascal. Can’t even comment here anymore. All work and no play made him a dull boy.
now your ranting Willard, you still wont accept the move to renewables is government driven and not consumer driven, it reminds me of the big government push for nuclear in the fifties and sixties,it was sold as cheep unlimited energy for all, does that sound familiar?. that was bullshit as well.loved the bit about renewables going down in price, was that a joke? the big joke is that none of this has had any effect on the climate,
What you call a rant was a short overview of the electricity market in various parts of the land down under, Ian. That and a very basic principle of economics. With more energy sources, we get more energy, which means consumers pay less.
Remove nuclear capacity and the Brits will pay more:
https://en.wikipedia.org/wiki/Nuclear_power_in_the_United_Kingdom#/media/File:Nuclear_capacity_as_a_proportion_of_total_capacity,_1955-2016.png
Not less. So consider yourself lucky. Or not:
“Sir Ed will argue that the ROC scheme was introduced “when ministers didn’t have the foresight to realise that renewable power would get so much cheaper over the next two decades”.
He will call on ministers to move all legacy agreements on to CfD, saying the transition would slash household energy bills by “breaking the link” between gas prices and electricity costs.”
https://www.independent.co.uk/news/business/liberal-democrat-ed-davey-nigel-farage-kemi-badenoch-government-b2789700.html
CfDs. Does that sound like an ideological thing to you?
norman…”Gordon Robertson
So you can’t say I did not show you, I am sending you a link to an experiment where Stefan-Boltzmann Law holds at much colder temperatures than your platinum heated metal used in the original experiment. It is still warmer than room temperature but much colder than your range. The Law holds. It is considered a science Law because (like Gravity) it holds for all experimental tests so far.
https://stuff.lanowen.com/Physics/Labs/Phys%20260L/Lab4/Lab_4_Stafan-Boltzmann-Law.pdf
***
Norman…have you actually read through and understood this so called experiment? It’s not actually an experiment but a lab class for undergrads aimed at using pseudo-science to convince the naive that it actually proves S-B at room temperature.
The scientific method:
1)state your theory
2)sate your method
3)describe your equipment and material
4) make your observations
5)draw your conclusions to back your theory.
That method is not followed here.
1)it begins with a theory already established in a temperature range of about 500C to 1200C. In other words, it begins at a conclusion and sets out to prove it, albeit badly. Then it interpolates the results outside that range using inference.
2)it fails to adequately describe the equipment.
It uses a thermistor, which is a resistor that is sensitive to HEAT. A thermistor is of no use detecting infrared. It may respond somewhat to a high intensity IR but not as a useful devise for detecting IR accurately. Here. hopefully, they use it only to measure surface temperature.
It uses a Leslie cube which is a cube filled with hot water. The sides of the cube are painted with different colours to change the emissivity of each side. A thermistor is of no use detecting IT intensity from any face of the cube unless you attach the thermistor directly to the faces of the cube, in which case it measures heat, not IR.
As an aside, this reminds me of an experiment we were offered in electrical engineering where the voltage current relationship in a resistor was presented as a straight-line curve on an oscilloscope. When I told the lab instructor that you can’t do that he nearly crapped himself.
Smoke and mirrors!!! If you measure the the DC voltage across a resistor using an oscilloscope, it gives you a straight line representation on the scope, above a zero base line. But, how do you represent current, which a scope cannot measure? You use smoke and mirrors.
You insert another resistor into the circuit and input that into the scope y-axis as another voltage, and it resolves the two inputs as a sloped straight line. If you put two AC signals of the same frequency into the vertical and horizontal inputs, the scope resolves them as a circle, called a Lissajous figure. If the ratio between frequencies is 2:1, the scope produces a figure of eight, and so on.
Oscilloscopes measure voltages, not currents. They can only e used to measure a current by measuring the voltage across a resistor then using Ohm’s Law.
This lab instructor in the S-B experiment is only pulling the wool over the eyes of gullible students by trying to convince them that S-B applies at room temperature. They are doing nothing more than using slight of hand to do it.
They begin by offering a table of thermistor readings with the note…
“TABLE I: Thermistor measurements along with the calculated Temperatures for several Leslie cubes, as well as the sensor measurements from the Thermopile for all 4 sides of the cubes”.
Note the ‘calculated temperatures’ slipped in there.
Excuse me? They have not described the cube or a thermopile, which also measures heat, presuming both can be used to measure IR. Later, they use radiation from the thermopile as a basis for an IR measurement, without measuring the IR intensity directly, which cannot be done. This is a fundamental mistake, presuming essentially that heat and IR are the same thing. EM is an electric field orthogonal to a magnetic field and contains no heat.
This is shoddy reasoning, that somehow, a cube filled with hot water is only radiating IR and that the radiated IR is heat. Not so. Heat and IR have essentially nothing in common. Most of the heat from the water is conducted through the cube faces and is dissipated mainly through air molecules absorbing the heat directly.
I might add that Tyndall’s original experiment, in which he discovered IR being absorbed by CO2, made the same error. They used a very primitive thermopile to detect the IR, claiming the IR as heat. I am not disputing his claim that CO2 can absorb IR, only that the experiment as a whole is flawed due to the use of a thermopile, which measures heat, not IR.
There is no way, in this experiment, to ascertain how much of the heat dissipated is due to direct conduction to air molecules and how much is radiated via IR. This is the same error included in the AGW theory, where it is presumed that most of the Earth’s surface heat dissipation is due to IR emission.
They go on and on making inferences based on calculations. In the conclusions they state…
“This experiment was able to confirm the Stefan-Boltzmann Law, at low temperatures using Leslie Cube’s at various
temperatures to measuring the infrared radiation of various materials at various temperatures and was confirmed to
be dependent on T4”.
At no time in the entire experiment did they ****MEASURE**** IR intensity, they simply inferred it using Planck and S-B itself. In other words, they used methodology and inference equally to arrive at their conclusion.
We did measure the IR intensity, this is the equipment manifest and experiment guide.
https://stuff.lanowen.com/Physics/Labs/Phys%20260L/Lab4/Introduction%20to%20Thermal%20Radiation%20-%20Inverse%20Square%20Law%20-%20Stefan-Boltzmann%20Law%20(low%20and%20high%20temperature).pdf
I don’t know why you are arguing about this stuff and citing my labs, I haven’t read all your comments here but I have a feeling like you are a difficult person.
Go do the experiments and get a life honestly.
ark….”Here’s how:
1/ The value of 240 W/m² represents an instantaneous global average, not a 24-hour time average”.
***
The 240 w/m^2 is based on the calculated solar power at TOA which itself is misleading. It is not possible to calculate a meaningful intensity over a spectrum of frequencies as broad as the solar spectrum. That’s especially true when the intensity varies with frequency with most power concentrated in the UV band.
Skin burning and skin cancer are caused by a tiny part of the solar spectrum, in the UV band. The meaning is clear, most solar EM intensity is concentrated in the UV spectrum. That means e = hf was wrong and Planck had to include an exponential term in his equation to fudge his curve.
———
“2/ The factor of ¼ is not a temporal averaging factor, but a geometric one that arises from the ratio of the Earth’s cross-sectional area intercepting sunlight to its total surface area”.
***
Don’t forget, the Earth’s axis is tilted toward and away from the Sun during one orbit. That causes the Arctic and Antarctic to suffer from low and no solar intensities. Geometry does not work very well with such annual variations and Earth’s temperatures are far more due to that tilt factor than any trace gas.
——–
“3/ This geometric relationship holds independently of time and even for a non-rotating planet”.
***
Does not hold for any planet since it is a constant trying to represent a very dynamic process.
——–
“4/ The value of 240 W/m² is the global mean absorbed solar radiation, not the incident irradiance”.
***
The value is a fictitious value fabricated by minds trying to establish a moot point, that a trace gas is dangerously warming our atmosphere/planet. It’s akin to the fictitious global average temperature.
Sad. I must award a giant F.
On the bright side, I hear there is a school for delinquent engineers. I am sure GR can be rehabilitated.
SOLAR MIMINUM UPDATE
The hundreds of thousands of homeowners who have expiring flood insurance policies under the NFIP are unable to renew them while the authorization is lapsed. The program will not be able to ensure payment of claims if a major flood drains its reserve funds, and experts predict that the ongoing lapse could affect more than 1,000 real estate sales each day.
Republican leaders have said numerous times that Congress has to fund the government before other priorities can be negotiated, but there is nothing stopping lawmakers from bringing legislation to the floor during a shutdown.
https://www.eenews.net/articles/lawmakers-cast-blame-for-flood-insurance-lapse-but-do-little-about-it/
Another day, another occasion for Donald to DOGE his obligations, another win!
Willard wants a specialty sammich made to order! when the dems should simply agree to open the government for everybody.
Gill wants to shield his troglodyte buddies from any responsibility by misconstruing the concept of sammich request.
Next he’s gonna argue like his best billionaire buddy who, right after calling COVID restrictions “fascism” and saying that SEC penalties for announcing a fake leveraged buyout of Tesla trampled on his first amendment free speech protections, that the “only solution” is to send jackboots on the ground:
https://www.sfchronicle.com/sf/article/elon-musk-benioff-federal-troops-san-francisco-21097096.php
LOL!
the dems don’t want to open the government for everyone and treat everyone equally.
instead they want this controversy and instead of accepting the sammich prepared by the majority they want thousands of sammiches custom prepared so they can cherry pick politically to their own benefit.
obviously Willard isn’t a real fan of democracy he just pretends to be when it suits him.
Gill has a very hard time grokking “there is nothing stopping lawmakers from bringing legislation to the floor during a shutdown”.
Perhaps he should ask Grok?
Meanwhile, he condones Russ Vought doing illegal things. But even if it was legal, imagine the ad:
“Come work for the GOP, where you randomly won’t be paid whenever Congress is dysfunctional.”
Signed by the GOP, with tagline – because we like it dysfunctional.
Too bad there’s no blue pill for that, Mike Johnson!
legislation has been on the floor since before the government shutdown to continue funding the government but Willard wants a different sammich made especially for him.
Gill fabricates once more.
It’d be easy for the gubmint to pass a bill to keep food assistance programmes open. Or to pay employees, which they are legally bound to do. Or to meet every single of their other payment obligation.
Including for insurance.
But the GOP, like our troglodytes, is all bluster and no substance. Its members prefer performative outrage to real leadership.
And they’re still getting paid.
ROFL!
Willard fabricates an invalid argument that only a part of federal budget goes to pay someone that the government is obligated to part. and the only part he wants to selectively pass is the part he sees to be most beneficial to himself.
the custom sammich orders are getting out of control.
So obviously Gill can’t get “there is nothing stopping lawmakers from bringing legislation to the floor during a shutdown”.
Let’s try with three numbers:
15M — the number of people Republicans want to kick off health care
20M — the number of people Republicans want to 2x health premiums for
0 — the number of times Republicans have called the House back to reopen the government.
Will he be able to feign ignorance once more?
Willard says:
So obviously Gill can’t get “there is nothing stopping lawmakers from bringing legislation to the floor during a shutdown”.
Let’s try with three numbers:
15M — the number of people Republicans want to kick off health care
15M – the number of illegal immigrants.
20M — the number of people Republicans want to 2x health premiums for
those were passed by the democrats with an expiration date set by the democrats in 2021 as a temporary assistance due to the pandemic. the pandemic has been over for years now.
0 — the number of times Republicans have called the House back to reopen the government.
thats because the house bill has been passed and is now waiting for senate approval. the dems are making government worker families to go without food and/or shelter to get their custom sammich.
Gill speaks as if Russ Vought wasn’t on the troglodytes’ side.
He might as well argue that peeping Mike isn’t responsible for not swearing in Adelita!.
Roy’s troglodytes are as disingenuous as the GOP.
Evidence please.
Step 2 – Sammich Request
Book of Radiance, Chapter 1, Verses 1-6
1/ And lo, there arose among the doubters one who said, “Behold, flux in needeth not equal flux out, for the day shineth not upon all the Earth at once.”
2/ And the wise did smite their foreheads, saying, “Verily, thou hast mistaken a shadow for the Sun.”
3/ For he measureth the instant and calleth it eternity, and counteth the hemisphere for the whole, forgetting that the sphere turneth ever beneath the light.
4/ Knowest thou not that geometry, not the clock, divideth the power by four? And that this was established from the first rotation, yea, even before thy spreadsheet was born?
5/ Surely the Earth needeth not wait a day to know her share of the Sun, for her balance is written in area, not in hours.
6/ Therefore is it spoken: He that confuseth the moment with the mean shall wander forever in the desert of false fluxes, crying “Time average!” where none is needed.
And yea, verily, Google was asked:
“Is the 240 W/m^2 figure for irradiance time-averaged over at least 24 hours?“
And it respondeth with:
“Yes, the figure of 240 W/m² for Earth’s irradiance is an average value that is calculated over a 24-hour cycle and across the entire surface of the globe.”
In fact, you will find that the approx. 240 W/m^2 figure is typically averaged over an entire year. As I said up-thread, and you ignored. You don’t have to remain ignorant, Arkady, you’re never too old to learn basic facts about climate science.
Exactly how old are you pretending to be, again? 80? 90?
Nice.
“Knowest thou not that geometry, not the clock, divideth the power by four?”
I never said that the “divide by four” was anything other than related to geometry. If you “divideth the power by four” you are effectively spreading the irradiance over the entire surface area of the Earth. What I am pointing out is that the entire surface area of the Earth only receives the light after one complete rotation. So no, I am also not “forgetting that the sphere turneth ever beneath the light”.
You can only call the 240 W/m^2 figure an “instantaneous global average” if you are prepared to average irradiance over surface area not receiving the irradiance! That would give you an artificially low and unrealistic number. A more realistic “instantaneous global average” would in fact be 480 W/m^2.
In any case, you can’t deny that in practice, the 240 W/m^2 figure is “time-averaged” over at least 24 hours. I just get people pushing back when I’m obviously correct about something, because it’s me!
You now seem to be saying that, for a rotating Earth the instantaneous a b s o r b e d flux (1-α)So/4 is somehow less than it would be for a tidally locked Earth.
IOW, Thou hast cast aside the law of balance, and forgotten the commandment of energy, which saith: What cometh in, must also go forth.
Thus it is written: Flux in and flux out are ever joined; what God and geometry have made one, let not the doubters put asunder.
“You now seem to be saying that, for a rotating Earth the instantaneous a b s o r b e d flux (1-α)So/4 is somehow less than it would be for a tidally locked Earth.”
A more realistic instantaneous absorbed flux for a rotating Earth is the same as it would be for a non-rotating Earth – 480 W/m^2.
Glad to see you understand something, Ark. You correctly make a distinction between “rotating” and “tidally locked”. (Although “tidally locked” is just a nonsense phrase for “not rotating”.)
But, you’re still confusing energy with flux. That’s one of the mistakes in “climate science”. Flux cannot be divided, but energy can. Also, “flux-in and flux-out” are not the same for Earth. Even energy-in and energy-out are not the same.
DREMT.
Good luck finding a credible source in support of your “more realistic instantaneous a b s o r b e d flux… 480 W/m^2.“
No source required – just the ability to think for yourself and understand that at any instant, the Earth receives radiation from the Sun over only half the surface area that it is emitting from. So, if we accept that the Earth emits approx. 240 W/m^2 from its entire surface area, then it will be receiving 480 W/m^2, spatially averaged, over the lit hemisphere in that instant.
“No source required – just the ability to think for yourself…”
So, it’s just in your head. Got it.
If you really want what you would probably consider a “credible source”, then try the Green Plate Effect, from Eli Rabett. Nobody had any problems accepting that the Blue Plate, on its own, receives 400 W/m^2 on one side (equivalent to the “lit hemisphere”) and emits 200 W/m^2 from its entire surface area, at equilibrium. It’s exactly the same principle.
Gemini:
“As a geometrical sphere (or more accurately, a spheroid), Earth has only one continuous, outer surface.”
A quick reminder of the principle:
https://www.drroyspencer.com/2025/09/uah-v6-1-global-temperature-update-for-august-2025-0-39-deg-c/#comment-1715262
A quick reminder on Sky Dragon cranks:
https://xkcd.com/3155/
https://climateofsophistry.com/2025/08/02/the-history-of-climate-sophistry/
Google/AI
What is the spatially averaged abs.orbed solar flux?
“The spatially averaged absorbed solar flux is the average amount of solar energy absorbed by a planet’s surface and atmosphere over a specific area. For Earth, the globally averaged absorbed solar flux is approximately 238 W/m2”
Some people never learn.
I’m correct, Nate.
In your own mind. In reality, obviously not.
“Can you average irradiance over surface area not receiving that irradiance?”
Returns:
“No, you cannot average irradiance over a surface area that is not receiving it, because irradiance is defined as the power per unit area that is falling on the surface“.
Gemini also says:
“One watt is equivalent to:
One joule of energy transferred per second”
And it also says:
“Yes, a second is significantly shorter than a year.”
Re: “spatially averaged global flux”
Google/AI correctly answers
“For Earth, the globally averaged absorbed solar flux is approximately 238 W/m2”
And if you want to find a spatially averaged global X, where X can be anything, you have to look at the value at every location (0 or not 0), sum it up, and divide by global surface area.
We dont remove areas that have 0 from the global surface area.
That would not give an accurate global average.
Premise 1) We wish to find a figure for the irradiance of the Earth involving the entire Earth’s surface.
Premise 2) The entire Earth’s surface is only irradiated once it has completed one full rotation.
Therefore:
Conclusion: A figure for the irradiance of the Earth involving the entire Earth’s surface is necessarily “time-averaged” over at least 24 hours.
QED.
Premise 1) (1-α)So/4
Premise 2) (1-α)So/4
Therefore:
Conclusion: Always (1-α)So/4
QED
Yes…sadly, that about sums up your argument, Arkady. You seem unable to take on board new information. I already said to you:
“If you “divideth the [flux] by four” you are effectively spreading the irradiance over the entire surface area of the Earth. What I am pointing out is that the entire surface area of the Earth only receives the light after one complete rotation. So no, I am also not “forgetting that the sphere turneth ever beneath the light”.
And, you are completely non-responsive to that new information. You simply continue to chant, “divide by four”, “divide by four”, over and over again.
Pointless!
You are completely non-responsive to the geometry and conservation principles involved: Energy in = Energy out.
(1-α)SoπR² = 4πR²σT^4
Pointless!
But, I agree – typically, energy (J) in does have to equal energy (J) out.
The mistake you are making up-thread is to consider that flux (W/m^2) in has to equal flux (W/m^2) out!
Down here, I’m perfectly happy to accept a figure for approx. 240 W/m^2 for the irradiance of the Earth…so long as it’s understood that’s “time-averaged” – with all the criticisms that go along with such “time-averaged” values.
Who knows, if we ever get past the pushback I’m receiving on this not-at-all controversial issue, we might be able to proceed to discussing the controversial part!
Ark and Nate will probably NEVER get it. Ark is now converting to energy by multiplying Earth’s surface area by the bogus flux. Multiplying by “bogus” results in “bogus”.
And poor Nate is so confused he doesn’t even know his own cult’s “science”. He believes in “238 W/m2” for absorbed solar, ignoring NASA’s claim of “163 W/m²”.
They can’t even understand their own nonsense….
“Can you average irradiance over surface area not receiving that irradiance?”
Silly queustion.
No one here is saying average the flux only on the non-irradiated side to find the irradiance on the other side!
Of course its answer is no.
“No, you cannot average irradiance over a surface area that is not receiving it, because irradiance is defined as the power per unit area that is falling on the surface“.
For the whole Earth, the surface is the surface of the whole Earth obviously. And the spatial average for THAT surface is 238 W/m2, same as the temporal average.
Nate tries to dream up some ridiculous interpretation of my question.
The question is clear, the answer is clear.
You seem to need to push back on this issue. I have no idea why.
“No, you cannot average irradiance over a surface area that is not receiving it, because irradiance is defined as the power per unit area that is falling on the surface“.
The irradiance “falls only on the lit surface”, obviously. By definition, then, you cannot average irradiance over the surface area that is not receiving it, i.e. the side of the object that is not irradiated in that moment!
This goes back to my very first comment this month, which I intended to be my only comment:
https://www.drroyspencer.com/2025/10/uah-v6-1-global-temperature-update-for-september-2025-0-53-deg-c/#comment-1717320
You guys really do everything in your power to assert that “flux in” must always equal “flux out”. As I said, and you now prove once again, even going so far as to try to redefine what “irradiance” is!
DREMT.
Of course you find it inconvenient but it’s called a law for a reason, it applies everywhere, “up-thread” and “Down here.”
All I’ve done is write the longhand form of the equation because you were triggered by the “divide by four” version.
Arkady, the law doesn’t apply to flux (W/m^2), it applies to energy (J). There’s no problem with energy conservation in anything that I’m saying, either up-thread or down here.
You need to stop bashing your straw men and start listening to what the adults are saying. I know, it’s hard being a teenager. I remember. But, there’s no need for you to go online impersonating an 80-year old man with 50 years engineering experience just because nobody takes you seriously out in the real world.
Gemini:
“In a climate model, energy is typically expressed and analyzed in terms of fluxes.”
Nate, the approx. 240 W/m^2 figure for irradiance is a spatial and temporal average, as explained, and not refuted. Discussion over. No need for another month’s back and forth.
It appears the cult kids need a refresher:
Why the “Earth’s Energy Budget” graphic is nonsense.
https://postimg.cc/yJFTRZzW
#1 Flux does NOT balance.
Radiative flux is not a conserved quantity. That means it does not need to “balance”. It’s very possible to have more flux coming in than going out. For example, a hypothetical sphere receiving 960 W/m² would be emitting 240 W/m². “960” does not equal “240”. The cult tries to treat flux as energy. Energy is a conserved quantity, flux is not conserved.
#2 Flux does NOT average.
Because of the non-linear nature of radiative flux, it can not be averaged.
#3 The incoming solar is NOT 340.4 W/m².
The cult has divided the solar constant, about 1370 W/m², by 4. Radiative flux can not be simply divided!
#4 The absorbed solar is NOT 163.3 W/m².
After dividing solar constant by 4, they then adjust for albedo. Then, they adjust again for more albedo. Reducing solar to a measly 163 W/m² which would correspond to a temperature of about 232K (-43°F, -42°C). Solar panels would not work. That flux couldn’t even melt ice!
#5 The cult can’t even get the arithmetic right.
Solar does not add correctly 340.4 – 77 – 22.9 – 77.1 = 163.4, NOT 163.3. (I know it’s a petty point, but it’s in the graphic. The cult kids couldn’t even catch an arithmetic error!)
#6 The 239.9 W/m² is bogus.
No one knows what Earth’s emitted “average” flux is. A hypothetical sphere at 288K would be emitting 390 W/m². At some point in space, that same flux would be reduced to 239.9 W/m², but it would also be reduced to 139.9 W/m², or 39.9 W/m², or any value between 390 and 0 W/m², at distance, due to the Inverse Square Law. Claiming Earth emits 239.9 W/m² is just more fraud.
#7 Back-radiation of 340.3 W/m² cannot warm a 288K surface.
An expensive IR thermometer measures overhead clear sky at about -50°F. But 340.3 W/m² corresponds to 41°F! Compare the bogus 340.3 back radiation with the bogus “absorbed solar” of 163.3 W/m². In cult “science”, the sky is warming Earth more than Sun!!! That ain’t science, it’s fraud.
#8 Back-radiation is not all CO2.
There are several radiative gases in the atmosphere. CO2 is one of the least effective, as it has a very limited line spectrum from Earth’s surface emission, specifically the 15μ photon, which carries less energy than the WDL photon from an ice cube.
#9 Assigning some values of flux to thermals and latent heat is another prime example of the fraud.
How did they conjure up values of W/m² for thermals and latent heat? That ain’t science!
#10 Earth’s outgoing energy seldom matches the incoming energy.
In fact, the outgoing energy is typically LESS than the incoming due to “losses” like molecular collisions, weather, and photosynthesis. The solar energy gets converted to other forms of energy than thermal, so never leaves the system.
#11 The clouds only emit!
In the cult’s bogus energy “budget”, clouds are only emitting. It’s as if the clouds have some internal energy source.
*****
Well if anyone is interested in reality, that should be enough to completely debunk the “Earth Energy Budget”. But, there’s one more important point. They end up with a “net absorbed” of 0.6 W/m². The implication is that Earth is accumulating energy. But notice they NEVER provide any error margins. All their values are meant to be taken as absolute. That is, they get to make up whatever they want.
Photosynthesis by itself is estimated to be about 2% of solar. After albedo, that amounts to about 19.2 W/m². If you use their “divide-by-4” fallacy, it still means 4.8 W/m² is devoted to photosynthesis. That’s 8 times the bogus 0.6 W/m²! And I suspect their other errors are even larger.
It’s all bogus, and would make great comedy if so much money, and negative impacts on society, weren’t involved.
But, there was one thing they got correct. Notice in the distribution of solar (yellow arrows to left) — the 77 W/m² And the 22.9 W/m². Notice the descriptions, “reflected by clouds and atmosphere” and “reflected by surface”. They are admitting flux can be reflected. Maybe the cult kids will now accept that flux can be reflected….
DREMT at 6:40 PM
“Arkady, the law doesn’t apply to flux (W/m^2), it applies to energy (J). There’s no problem with energy conservation in anything that I’m saying, either up-thread or down here.”
In the planetary context, the Law of Conservation of Energy necessarily involves energy flows (fluxes) since, without flux, conservation is trivial.
Your confusion is elementary.
“You need to stop bashing your straw men and start listening to what the adults are saying. I know, it’s hard being a teenager. I remember. But, there’s no need for you to go online impersonating an 80-year old man with 50 years engineering experience just because nobody takes you seriously out in the real world.”
Your sophomoric attempt to impugn my character merely confirms that I’ve already won the argument.
Sorry for your loss.
You haven’t listened to a word I’ve said, and I couldn’t care less if you think you’ve won something. Give yourself a pat on the back, if you wish, Arkady.
“You seem to need to push back on this issue. I have no idea why.”
On the contrary, the situation is that I found via your favorite Google/AI that the spatial average absorbed flux is 238 W/m2.
And there is absolutely no controversy about this. It is a geometrical fact, and easily calculated from the know parameters of the sun and Earth.
YOU, need to deny this fact. Who knows why.
As always, you think you know better than scientists, and all valid sources
It’s the spatial and temporal average, so if you ask it what the spatial average is, of course it’s going to give you that answer.
Ask it a more sensible question:
“Is the 240 W/m^2 figure for solar irradiance at TOA a spatial and temporal average?”
and you will get a more sensible answer:
“Yes, the 240 W/m^2 figure is a spatial and temporal average, specifically representing the global average of solar energy absorbed by the Earth, not the incoming solar irradiance at the top of the atmosphere (TOA).”
I realize Ark, Nate, and Willard will NEVER understand any of this. So, for any adults interested:
Photons emitted from a surface fall in the category of a “radiative flux”. It may just be called “flux”. But, if it involves photons emitted from a surface, it has units of “W/m²”. It may be called “energy flux” by the unwashed, but it is actually a “power/flux”. And, since “power” is not conserved, a power/flux is certainly not conserved.
Cult children can get so confused that they can’t be un-confused!
There is no reason to keep asking Google confusing, leading questions, when you should be able to do the simple math.
At any moment in time, the input solar flux, spatially averaged over the globe, is F0(1-alpha)/4.
Where as you know, F0 is the solar flux at the Earth-sun distance.
Now continue to obfuscate endlessly.
Gemini:
“Albedo is a measure of the reflectivity of a surface or a body, indicating the fraction of incident (incoming) light or electromagnetic radiation that it reflects.”
Again, Clint’s brain explodes when confronted with the simple fact that the area involved in this problem is the surface area of the Earth, which is fixed.
Thus scientists divide energy by this fixed area and talk about the energy input and output of the Earth “per m^2”
They have no problem or confusion about this. I don’t know why Clint does.
And everyone in this field can understand that power times time is energy.
Thus scientists can talk about the average global power input or output per m^2, IOW in flux units.
They have no problem or confusion about this.
In fact, they prefer to talk about flux because it is directly related to temperature.
So there is no problem here at all. Scientists can do simple math, since that is a requirement of their profession.
Now Clint will continue to insist there is a problem here. But it is not an actual problem, for scientists.
You can ask it as many times as you like, the answer is always in the affirmative. You get a differently-worded response every time, of course. Here is a more detailed response:
“Yes, the figure of 240 W/m^2 for solar irradiance at the top of the atmosphere (TOA) is a global, annual average, not a constant value. The actual amount of solar radiation received varies significantly by location, time of day, and season due to factors like Earth’s spherical shape, axial tilt, and atmospheric conditions. The global solar constant, for example, is a much higher average of approximately 1361 W/m^2 at the edge of space, which is then reduced and absorbed as it passes through the atmosphere.
The 240 W/m^2 figure represents the total solar energy absorbed by the Earth over the course of a year, averaged across the entire planet’s surface.
This is different from the solar constant, which is the solar irradiance measured at Earth’s distance from the sun before the effects of the atmosphere are considered.
The Earth’s actual energy budget is a balance between incoming solar radiation and outgoing thermal radiation to space, with the 240 W/m^2 value reflecting the amount absorbed after reflection and absorption by clouds, aerosols, and gases.”
BTW DREMT,
There is no logic in this sentence.
“It’s the spatial and temporal average, so if you ask it what the spatial average is, of course it’s going to give you that answer.”
“At any moment in time, the input solar flux, spatially averaged over the globe, is F0(1-alpha)/4.”
Ah, but you can’t spatially average it over the entire globe, at any moment in time. That’s the problem. At any moment in time, only half of the globe is actually receiving the irradiance. So, unless you’re willing to redefine “irradiance”, the 240 W/m^2 value does not represent what is received “at any moment in time”.
As I have said several times, the cult kids will NEVER understand this. They keep believing “flux” is “energy”. They don’t have enough background to understand that “W/m²” is not “Joules”.
It seems they are only here to prove me right.
Works for me….
“There is no logic in this sentence…”
What I’m saying is, you are expecting too much of the AI. It’s unlikely to be able to differentiate between “a spatial and temporal average” and just “a spatial average”. So when you ask it for the latter, it’s just going to give you the former. Do you really expect it to put all the information together, and be able to think for itself, “hmmm, well the irradiance is only received on one half of the globe at any one moment, so a more realistic average for what is received at any one moment would actually be 480 W/m^2?”
Of course not! It’s just going to return the value that gets bandied around the internet the most, 240 W/m^2, and not even realise the problem with that.
This is why I try to ask it simple questions that lead to a “yes” or “no” type of response. Less chance of it messing up.
“but you can’t spatially average it over the entire globe, at any moment in time.”
Of course you can. Not an actual rule. Just your assertion.
Now continue to try to tell scientists that what they are doing is not allowed.
FyI. there are parts of the poles that recieve no sunlight for months, we still include them in the spatial or temporal average.
The bizarre, endless, relentless pushback over nothing continues.
“Of course you can. Not an actual rule. Just your assertion…”
https://www.drroyspencer.com/2025/10/uah-v6-1-global-temperature-update-for-september-2025-0-53-deg-c/#comment-1718576
“…in the spatial or temporal average.”
It’s complete nonsense to try and suggest there’s a “temporal average” all of its own. I mean…how would that even work? Averaged over time but somehow not averaged over the entire surface area of the Earth!? Nonsense. If it’s averaged over time (at least 24 hours) then it’s necessarily averaged over the entire surface area of the Earth. Spatial and temporal.
There are two things getting discussed here:
1) An “instantaneous global average” for irradiance, i.e. what is received by the Earth “at any one moment”.
2) A “spatial and temporal average” for irradiance, i.e. what is received by the Earth over at least 24 hours and therefore over its entire surface area.
You propose that 1) and 2) are the same value, approx. 240 W/m^2.
I suggest 480 W/m^2 is more realistic for 1), and 240 W/m^2 works for 2).
Either way, there is no “temporal average” all of its own!
You keep redefining global on the fly. In (1) you mean only the sunlit hemisphere, in (2) the whole globe.
The correct instantaneous global-mean a b s o r b e d flux is:
(Sunlit half + Nightside half)/2 =
(((1-α)So)/2 + 0)/2 = (480+0)/2 = 240 = (1-α)So/4
QED.
The instantaneous irradiance for the globe is only on the sunlit half. Obviously. You’re averaging irradiance over surface area not receiving the irradiance! Then you applaud yourself for it.
There is nothing that can be said by mathematical symbols and relations which cannot also be said by words. The converse, however, is false. Much that can be and is said by words cannot successfully be put into equations, because it is nonsense. When you express an assertion in words only, you are refusing to stand up to the test.
I went over the maths last month with the simple example of the plate:
https://www.drroyspencer.com/2025/09/uah-v6-1-global-temperature-update-for-august-2025-0-39-deg-c/#comment-1715262
It’s the exact same principle, just with bigger numbers.
Clint says: “#1 Flux does NOT balance. … For example, a hypothetical sphere receiving 960 W/m² would be emitting 240 W/m².”
Clint, you are exposing a fundamental misunderstanding here. Your sphere is NOT receiving 960 W per square meter of its surface. Every square meter of one entire hemisphere is receiving 0 W. The other hemisphere facing the light source is receiving between 960 W per square meter of surface and 0 W per square meter.
If the sphere was truly receiving 960 W per square meter of surface, then (in steady-state, of course) it would emit 960 W per square meter of surface.
The source RADIATES a unidirectional 960 W/m^2 beam toward the sphere.
The sphere RECEIVES between 0 – 960 W/m^2 on its surface
The sphere RECEIVES an average of 240 W/m^2 over its surface
The sphere EMITS an average of 240 W/m^2 over its surface
Until people clarify (in their writing and in their own thinking) precisely what flex they mean, misunderstandings will just fester.
DREMT.
“The instantaneous irradiance for the globe is only on the sunlit half. Obviously. You’re averaging irradiance over surface area not receiving the irradiance! Then you applaud yourself for it.”
The globe has Antipodal Points which you want us to pretend do not exist because they don’t fit your narrative.
“The sphere RECEIVES an average of 240 W/m^2 over its surface…”
Assuming the sphere is not rotating, then the minimum possible average it can receive is 480 W/m^2 (averaged over the lit hemisphere). An average as low as 240 W/m^2 would require redefining what “irradiance” means.
This is getting boring…
DREMT.
Tell me you’ve never studied Physics without saying you’ve never studied Physics.
You are trying to solve a physics problem with philosophy and rhetoric rather than physical principles. Your reasoning is metaphysical, not physical.
You are arguing the “tree falls in the forest” fallacy: in Physics, the wave exists whether or not someone hears it.
“Ah, but you can’t spatially average it over the entire globe, at any moment in time. That’s the problem. At any moment in time, only half of the globe is actually receiving the irradiance. So, unless you’re willing to redefine “irradiance”, the 240 W/m^2 value does not represent what is received “at any moment in time”.”
Again DREMT you are weirdly making up strange rules about averaging, that make no sens.
The surface pf interest is the Earths surface. We want to find the average of quantities over that whole surface.
We sum the values in every km^2 on the surface then divide by the total km^2 of the Earth.
There is no change to this calculation if some of the values are 0.
Because the average for the Earth must include the whole surface area
Nate, I’m not making up any “rule”. You, on the other hand, are trying to redefine “irradiance”.
https://www.drroyspencer.com/2025/10/uah-v6-1-global-temperature-update-for-september-2025-0-53-deg-c/#comment-1718576
That is why you fail. All of you.
Nothing to do with the definition of irradiance, which is flux per unit area of a surface.
Because we are interested in AVERAGE flux hitting a surface. There is no requirement that the whole surface is receiving flux. For example a disk lit in the center. We can stll determine the average flux over the disk, if that was of interest.
That is of interest for the Earth. Because the averge flux for the Earth moment to moment will at all times be approx 238 W/m2, approx the same as the average output flux.
Fact. And in fact it might be of interest to know the variations of this over a day.
Are these facts that somehow cannot or should not be known?
If so, that is truly absurd thinking.
“No, you cannot average irradiance over a surface area that is not receiving it, because irradiance is defined as the power per unit area that is falling on the surface“.
The irradiance “falls only on the lit surface”, obviously. By definition, then, you cannot average irradiance over the surface area that is not receiving it, i.e. the side of the object that is not irradiated in that moment!
This goes back to my very first comment this month, which I intended to be my only comment:
https://www.drroyspencer.com/2025/10/uah-v6-1-global-temperature-update-for-september-2025-0-53-deg-c/#comment-1717320
You guys really do everything in your power to assert that “flux in” must always equal “flux out”. As I said, and you now prove once again, even going so far as to try to redefine what “irradiance” is!
https://en.wikipedia.org/wiki/Solar_irradiance
“The average annual solar radiation arriving at the top of the Earth’s atmosphere is about 1361 W/m^2. This represents the power per unit area of solar irradiance across the spherical surface surrounding the Sun with a radius equal to the distance to the Earth (1 AU). This means that the approximately circular disc of the Earth, as viewed from the Sun, receives a roughly stable 1361 W/m^2 at all times. The area of this circular disc is πr^2, in which r is the radius of the Earth. Because the Earth is approximately spherical, it has total area 4πr^2, meaning that the solar radiation arriving at the top of the atmosphere, averaged over the entire surface of the Earth, is simply divided by four to get 340 W/m2. In other words,averaged over the year and the day, the Earth’s atmosphere receives 340 W/m2 from the Sun. This figure is important in radiative forcing.”
That would then be further adjusted for albedo to get the approx. 240 W/m^2 figure. According to all sources, except the extremists currently pushing back on this blog, the approx. 240 W/m^2 figure for irradiance of the Earth is a spatial and temporal average.
A more detailed answer from Google on irradiance:
“No, you cannot average irradiance over a surface area that is not receiving it. Irradiance is defined as the power per unit area, so if a part of the surface area is not receiving any radiation (irradiance of zero), its contribution to the average is zero. Averaging would only include the area that is actually illuminated. Irradiance is a measure of power per area: The formula is E=P/A, where E is irradiance, P is power, and A is the area the power is falling on.
Zero irradiance: If a portion of the surface area receives no light, the irradiance for that specific area is zero.
Averaging calculation: When calculating the average irradiance for a system with some parts receiving light and some parts not, you would only sum the power from the illuminated areas and divide by the total illuminated area, not the entire surface area.
Example: Imagine a solar panel where half is covered. The total power output is only from the illuminated half. The total illuminated area is half the panel’s size. The average irradiance would be the total power divided by the illuminated half, not the total panel area.”
Gemini:
“At its core, an Energy Balance Model (EBM) is designed to find the equilibrium state where:
Energy In=Energy Out
From the perspective of physics and calculus, the fundamental energy balance equation must hold at every instant in time.”
Google Gemini:
Question:
is the following assertion correct: “when calculating the average irradiance for a system with some parts receiving light and some parts not, you would only sum the power from the illuminated areas and divide by the total illuminated area, not the entire surface area.”
Answer:
The assertion is incorrect because the average irradiance is defined as the total power incident on a surface divided by the entire surface area, including both illuminated and unilluminated parts. The average irradiance represents the overall power density across the entire system.
…
In fields like solar energy, average irradiance is a standard metric used to compare system performance and determine expected energy generation. Using the total area in the calculation provides a realistic view of the overall power density, which is crucial for accurate system modeling and analysis.
Well, my response came from the question I asked earlier, and every time I ask Google that question (main search bar) I get a similar AI overview.
Just tried it again:
“No, you cannot average irradiance over a surface area that is not receiving it. Irradiance is the power received per unit area, and it can only be averaged over the area that is actually receiving the radiation”.
which stands to reason!
If you were averaging a group of people’s heights, you wouldn’t include a “non-entity” with a height of zero, now would you? That would skew the average down and give you a physically meaningless result.
“No, you cannot average irradiance over a surface area that is not receiving it, because irradiance is defined as the power per unit area that is falling on the surface“.”
Again, you are telling me that I cannot do what I did, and telling scientists they cannot do what they do.
It seems that you have trouble understanding how that logically is a failed argument.
Now, keep saying it. Maybe if you say it enough times it will begin to make sense.
But not likely.
DREMT argues: “If you were averaging a group of people’s heights, you wouldn’t include a “non-entity” with a height of zero, now would you? That would skew the average down and give you a physically meaningless result.”
A better analogy would be averaging a group of people’s *incomes*. Consider a group of 10 people.
* 10 @ $20,000 each –> the group average is $20,000 per person.
* 5 @ $40,000 each, 5 @ $0 –> the group average is $20,000 per person.
* 1 @ $200,000, 9 @ $0 –> the group average is $20,000 per person.
The people who are not earning incomes are not ‘non-entities’ and are included in calculating the average.
And the surface on the back side is not ‘non-surface’. “Zero” is a perfectly number to include in an average.
If you want an average just of the lit SUBSET of a surface of an object, that is fine. But if you want an average of the ENTIRE object, you must include the entire surface! And in this case, since we are looking at the average EMITTED from the ENTIRE surface, then logically we would compare that to the average RECEIVED by the ENTIRE surface.
The aim is to reflect physical reality.
For an instantaneous average of irradiance, we are looking to reflect the reality that at any one moment, the Earth receives sunlight over only the lit hemisphere, whilst it emits from the entire surface area of the globe.
480 W/m^2 in and 240 W/m^2 out reflects that reality.
240 W/m^2 in and 240 W/m^2 out does not.
Nate falsely attributes a quote to me which was actually from Google, then rants and raves childishly.
DREMT argues: “If you were averaging a group of people’s heights, you wouldn’t include a “non-entity” with a height of zero, now would you? That would skew the average down and give you a physically meaningless result.”
A better analogy is averaging a group of people’s INCOMES. Consider a group of 10 people.
* 10 people @ $20,000 each average of $20,000 per person
* 5 people @ $40,000 + 0 people $0 average of $20,000 per person
* 1 person @ $200,000 + 0 people $0 average of $20,000 per person
The group average is averaged of the whole group. The people earning $0 are not ‘non-entities’.
Similarly, if you want the average irradiance of the earth, you average over the whole earth, INCLUDING the areas where irradiance happens to be 0 W/m^2. Sure, you could say the irradiance is 480 W/m^2 on the lit hemisphere and 0 W/m^2 on the unlit hemisphere. But in the context of earth’s energy balance, the “physically meaningful result” is the whole earth average of 240 W/m^2.
DREMT writes:
“The aim is to reflect physical reality.”
…
“480 W/m^2 in and 240 W/m^2 out reflects that reality.”
I’m not a climate scientist but, a back of the envelope calculation using a 240 W/m^2 (480-240) Earth Energy Imbalance gives you about 35 °C per year heating rate.
That’s not “physical reality,” that’s magic and moonbeams.
“Nate falsely attributes a quote to me which was actually from Google, then rants and raves childishly.”
This is the idea that your are promoting and arguing.
Are you now realizing it makes no sense and are backing away from it?
Finally!
““There is no logic in this sentence…”
What I’m saying is, you are expecting too much of the AI. It’s unlikely to be able to differentiate between “a spatial and temporal average” and just “a spatial average”. So when you ask it for the latter, it’s just going to give you the former.”
And I agree that Google/AI can easily be confused by science questions and give inaccurate or contradictory answers.
It even made this very point.
So why do you keep offering its (cherry picked) answers as evidence of anything?!
How bout just using logic and agreed upon facts?
Arkady still doesn’t even understand that “flux in” (W/m^2) does not need to equal “flux out” (W/m^2) for energy (J) to balance. I have no idea why he would choose to embarrass himself like that. Nobody else is confused by the concept.
Tim, we’re currently talking about an instantaneous average for irradiance. In which case, you cannot average irradiance over the entire globe, because the entire globe is not receiving the irradiance, moment by moment.
Reality does not seem to concern these guys. They literally want to average solar irradiance where the Sun don’t shine!
DREMT writes:
“Arkady still doesn’t even understand that “flux in” (W/m^2) does not need to equal “flux out” (W/m^2) for energy (J) to balance. I have no idea why he would choose to embarrass himself like that. Nobody else is confused by the concept.”
Energy flow in – Accumulation = Energy flow out
It’s very simple actually!
“How bout just using logic and agreed upon facts?”
Well, it seems to be a universally accepted and agreed upon fact (besides the “cult kids” on here, who think they know better), that the approx. 240 W/m^2 figure for solar irradiance is, necessarily, a spatial and temporal average. I’ve not seen any decent evidence to the contrary, and I’m the only person who has presented any evidence besides Google AI/Gemini (I linked to a Wikipedia article, which everybody studiously ignored).
So, that’s that.
“I’ve not seen any decent evidence to the contrary, and I’m the only person who has presented any evidence besides”
Is just about the ability to do simple math.
The instantaneous global average flux is F0(1-alpha)/4.
But maybe some of us cant do the simple math, and require some AI bot to explain it to them.
Oh well.
Why are you pretending I don’t understand that 960 W/m^2 divided by 4 is 240 W/m^2?
What exactly do you think you will gain by making this ridiculous false accusation? Who will you convince, do you think?
Do you think nobody has been paying attention to the discussion? Is that it?
Nate, “dividing by four” averages the irradiance over the entire surface area of the sphere. The question has always been, when is it appropriate to do so?
The answer is: only when the Earth has completed at least one full rotation.
The approx. 240 W/m^2 figure for irradiance is, necessarily, a spatial and temporal average.
“Ah, but you can’t spatially average it over the entire globe, at any moment in time.”
Yes, I can and did.
Where do you get the F*ked up idea that you can tell scientists that they cannot do what the obviously do?
You have lost all credibility.
Weird response from Nate.
DREMT argues: “Tim, we’re currently talking about an instantaneous average for irradiance. In which case, you cannot average irradiance over the entire globe, because the entire globe is not receiving the irradiance, moment by moment.”
Maybe this will break you out of your limited thinking.
It is currently night outside where I am. If I go out and measure the solar irradiation, what will I get? The answer is clearly 0 W/m^2. Not “undefined because it is not receiving radiation”. Not “unknown because we have to wait for dawn.”. I don’t need to measure for a year or even a day or even an hour. The value at this instant is 0 W/m^2.
Someone else 100 km away could measure at this same instant and also get 0 W/m^2. Someone a couple 1000 km away might get 50 W/m^2 at this same instant. Someone half way around the world might 600 W/m^2 at this same instant. Someone where it is noon might get 960 W/m^2 at this instant.
If we average a million measurements at this instant taken randomly around the world, we would get about 240 W/m^2. Again, there is no need to wait a day. We have the instantaneous result.
Now, of course, that number might go up or down a bit if we remeasure in an hour or a day or a month. But that has never been your issue. For some reason, you don’t seem to grasp that “0 W/m^2” is a perfectly valid measurement and a perfectly valid input to an average.
Tim, I’m not disputing that a zero figure for irradiance is a valid measurement. I’m pointing out that, as Google confirms, irradiance is only to be averaged over the surface area receiving it. Every time it’s asked the question “can you average irradiance over surface area not receiving that irradiance?”, it returns a result in the negative. I’ve posted up several of the results already.
But, even if you dispute that evidence, and insist that for some illogical reason you think it makes sense to average solar irradiance where the Sun don’t shine, then you’re still left with the fact that, for an instantaneous average, 480 W/m^2 in and 240 W/m^2 out better reflects the reality that at any one moment the Earth receives light over only the lit hemisphere whilst it emits from the entire sphere. 240 W/m^2 in and 240 W/m^2 out does not reflect that reality at all.
So, for example, here is another response to the question asked of Google:
“You cannot average irradiance over a surface area that is not receiving it because irradiance, by definition, is the radiant power incident on a surface per unit area. A surface area that receives no radiation has an irradiance of zero, so averaging over it would be mathematically meaningless and physically inaccurate. Here is a breakdown of why this is a flawed concept:
Irradiance is about reception. The core idea of irradiance (W/m^2) is to measure the concentration of power hitting a surface. If a part of a surface is shaded or is not in the path of the light source, no radiant power is incident on it.
Zero irradiance. The irradiance on any area not receiving radiation is zero. If you include this zero-irradiance area in your calculation, you would be averaging the power received over a much larger area than the one that is actually receiving the power. This would result in an average value that misrepresents the true power density.
Misleading result. For example, imagine calculating the average solar irradiance for a rooftop. If you include the area of the rooftop that is permanently in the shade, your average would be artificially low and would not accurately reflect the conditions affecting solar panels placed in the sunny areas.
Focus on the active area. In practice, engineers and scientists focus on calculating the average irradiance over the active area—the part of the surface that is actually receiving radiation. For a photovoltaic (PV) panel, for instance, you would calculate the average irradiance over the panel’s active area, taking into account the angle of incidence, rather than averaging over the entire, non-irradiated surroundings.”
Gemini:
“A zero-dimensional (0D) model, also known as a lumped-parameter model, is a mathematical or physical model that ignores all spatial dimensions and variations within the system being analyzed.
In a 0D model, the entire system or a component of it is treated as a single point or a single control volume where all properties (like temperature, pressure, concentration, or velocity) are assumed to be uniform throughout.”
The problem is…mathematically, you can do whatever you like. It’s hard to argue, “you can’t average irradiance over surface area not receiving the irradiance” because mathematically, you can, of course. The question is really whether you should do, or not. The question is also whether it represents the correct physics to do so, or not. I think what the Google responses are trying to get at is that generally it’s just going to give you a misleading result by artificially lowering the overall average figure.
Gemini:
“A 0D model doesn’t work by including “zero-height” entities.”
“as Google confirms …”
That, in itself, should be a huge red flag! Google and AI are NOT competent scientific sources.
“Every time it’s asked the question “can you average irradiance over surface area not receiving that irradiance?”, it returns a result in the negative. “
Try a better, more basic question, like “How do you calculate average irradiance for an object?” Then the answer is “To calculate average irradiance for an object, divide the total radiant power P received by the object by its surface area A using the formula I=P/A.” Clearly this equation for average irradiance for the earth would use the earth’s total area.
Others have already done similar queries with similar results. You already knew that other, similar queries produce ‘our’ interpretation. Only your ‘confirmation bias’ leads you prefer your goggle result.
“you’re still left with the fact that, for an instantaneous average, 480 W/m^2 in and 240 W/m^2 out better reflects the reality”
I disagree 110%. What next?? “270 W/m^2 out on the day side and 210 W/m^2 out on the cooler night side far better reflects the instantaneous reality.” “280 W/m^2 out near the equator and 200 W/m^2 out near the poles far better reflects the instantaneous reality.”
The discussion is about energy balance for the earth. The WHOLE earth. As such, an average over the WHOLE earth is FAR more informative and useful than averaging different quantities over different parts of the surface.
At any given instant, when averaged over the surface of the earth:
* the average flux in is about 240 W/m^2
* the average flux out is about 240 W/m^2
Tim dismisses Google as a scientific source…then uses it himself. He gets what he thinks is the answer he wants, then declares that I am the one with “confirmation bias”.
Yes, Tim, it’s understood that you divide power by area to get the irradiance. The question is, obviously, should you be dividing by only the surface area which is actually receiving the power?
I posted my last Google response because I think it makes a good case. And, it’s not a biased source. It has no ulterior motive for making the case that it does. It’s saying things that I would be saying myself, but I know that if I say them, I’ll just receive pushback no matter what. So, that’s why I’m using it. Clearly, you have no real argument against what it’s saying.
And, the rest of your comment is just more of the same as what you’ve already said. You don’t have an argument against what I’m saying, so you just attack some straw man about “what next??”
Endless denial.
You admit Google AI can be confused, thee keep giving its answers to confusing questionds as evidence.
“you can’t average irradiance over surface area not receiving the irradiance”
This answer assumes light is shined on one surface and someone wants to find irradiance over a different surface.
Nothing to do with our problem.
“This answer assumes light is shined on one surface and someone wants to find irradiance over a different surface.”
False, Nate. But, you got one thing right…your denial is endless.
They just keep pushing back on the parts of the argument that are not controversial. Truly bizarre.
“Yes, Tim, it’s understood that you divide power by area to get the irradiance. The question is, obviously, should you be dividing by only the surface area which is actually receiving the power?”
Well, again, you seem to not understand what averaging over a SURFACE means.
For the disk that is lit in the center, if you divide by only the area that is lit, you will not be getting the average flux over the surface of the disk.
Oh well.
DREMT,
You keep arguing about what area we “should” be using. You are the one not giving a strong case for your position. When talking about the energy balance of the earth as a whole, we “should” be talking about the earth as a whole, and the average flux for the whole surface. Averaging different quantities over different areas simply makes later steps more complicated and less transparent.
On the contrary, Tim, I (and Google) have given an excellent case for “my” position. You just haven’t responded to any of it. For one thing, “my” position does not involve redefining what “irradiance” is. Your position does. As Google and I have pointed out many times, “irradiance” is the power per unit area over the surface area receiving it. Your redefinition is, “irradiance” is the power per unit area over whatever the hell surface area we feel like. So, if a spotlight is illuminating a five metre squared circle on an absolutely massive stage, you apparently think you would average the power received over any surface area you want. Perhaps a ten metre squared circle with the illuminated spot in the centre. Perhaps the entire, massive stage. Perhaps half the massive stage with the illuminated spot in the centre. Perhaps the entire auditorium! Why not the entire unlit hemisphere of the Earth, including the illuminated spot! Just dilute the actual intensity as much as is required. No need to worry about reality…
Tim says down-thread:
“But since the discussion is about energy balance over the entire sphere…”
This all started from Clint’s eleven-point critique of the Earth’s energy budget, from over a month ago. The approx. 240 W/m^2 figure for irradiance in the Earth’s energy budget is a spatial and temporal average. It’s averaged over an entire year! The figure is not meant to be, nor is it even implied to be, an instantaneous average. So, let’s get that straight, right now. I’m already correct, because in the context of our discussion, the approx. 240 W/m^2 for irradiance is a spatial and temporal average.
You still want to argue with me about an instantaneous average, for some reason. All I can do is point out that you all apparently agree “flux is not conserved”. Well, the reason “flux is not conserved” is that irradiance and radiant exitance often don’t occur over the same amount of surface area. Yet, you seem to want to argue that the surface area can always be the same if you just choose to average irradiance over the object’s total surface area. In which case, you may as well be suggesting that flux is conserved!
You’re just contradicting yourselves.
Gemini:
“The word “instantaneous” generally means:
1. Happening or done immediately and very quickly, without any perceptible delay.
Example: “We received an instantaneous response to the emergency call.”
2. Occurring or present at a particular instant (a single moment in time).
This meaning is often used in scientific or mathematical contexts, such as in physics or calculus. For example, instantaneous velocity is the velocity of an object at a specific, precise moment in time, as opposed to its average velocity over a time interval.
Example: There is no doubt that the former is a better representation of the reality, for an instantaneous average.”
“Irradiance is the power per unit area over the surface area receiving it. Your redefinition is, “irradiance” is the power per unit area over whatever the hell surface area we feel like.”
Indeed scientists find average flux over any surface they feel like, or need to, to analyze a problem.
Even if some parts of that surface have 0 flux.
No matter how often someone bizarrely tells them they ‘shouldn’t’.
To measure the averge absorbed solar global flux over the month of June we record the flux at every location ideally every minute of every day, for the whole month.
Do we include areas, such as in the middle of Antarctica, that recieve no flux at all during June, in the calculation?
Doing what DREMT says we SHOULD do, we would not count the areas that receive no flux.
But then that is not the whole Earth area that would be used the denominator of the average calculation.
Would we get the correct global average flux, 240 W/m2?
No we would obviously not, because we are not performing the average over the full global area.
To correctly find a global average, we need to include all points on the globe, regardless of whether they have 0 flux or not.
QED
Nate, why don’t you just admit that you think flux is conserved?
All of this is just your elaborate way of denying the fact that “flux is not conserved”, basically.
I make arguments. You guys completely ignore them, and just keep repeating yourselves. Your aim is always just to be the last ones repeating yourselves.
You push back endlessly on parts of the overall argument that are really not controversial. So I get tied up in this sort of nonsense indefinitely.
There’s nothing controversial about what I’m saying. Irradiance is the power per unit area over the surface area receiving it. Otherwise, a blackbody cube receiving 1200 W/m^2 on one face and emitting 200 W/m^2 could be described as receiving 200 W/m^2 “averaged over all of its surface area”. I mean…like I said, you may as well just be honest and admit you think flux is conserved, if you want us to buy that.
“To measure the averge absorbed solar global flux over the month of June we record the flux at every location ideally every minute of every day, for the whole month…”
…and so, that is a spatial and temporal average. Of course I accept using zero irradiance values in such an average. Pretty much every location on the planet is going to have zero irradiance values at some point over 24 hours…it’s called “night time”.
“Do we include areas, such as in the middle of Antarctica, that recieve no flux at all during June, in the calculation?”
Yes. It’s a spatial and temporal average, so again, including zero irradiance values is going to be necessary.
When looking at the instantaneous average, or the average irradiance for a sphere that is not rotating, you would only average over the surface area actually receiving the irradiance. Like with the cube I mentioned. Otherwise, you may as well just argue that flux is conserved!
I made an argument that demonstrate the flaws in your logic.
Naturally, you have no rebuttal so you completely ignore it, and try to change the subject.
So thats that.
“Irradiance is the power per unit area over the surface area receiving it”
Sure, and it can be 0. Thus its average over a given surface, must consider all the values on that surface, even the 0 values, as we must do to find the global average for the Earth , as shown above.
This is an absolutely standard way to average.
There should be no pushback on this non controversial fact.
And yet….
“Yes. It’s a spatial and temporal average, so again, including zero irradiance values is going to be necessary.”
Indeed so. Glad to hear it.
But this of course contradicts your argument that the definition of irradiance prevents us from considering the places with 0 flux.
Nate…do you accept that flux is not conserved?
If so, does the cube receive 1200 W/m^2, or does it receive 200 W/m^2?
Just make up your minds, already…
“But this of course contradicts your argument that the definition of irradiance prevents us from considering the places with 0 flux.”
There’s no contradiction, because all locations receive irradiance given enough time, and this is a spatial and temporal average we’re talking about.
“There’s no contradiction, because all locations receive irradiance given enough time, and this is a spatial and temporal average we’re talking about.”
False. Rationlizing your erroneous argument.
In the month of June which is the month of interest, there clearly are regions with zero irradiance.
We dont change the calculation due to these zero regions.
Your ‘its the definition of irradiance’ argument is thoroughly debunked.
Thus you have been shamelessly trying to change the subject.
“We don’t change the calculation due to these zero regions…”
…because, in time, they too will be irradiated. That’s why these spatial and temporal averages are typically performed over the full year.
You’ve debunked nothing, Nate. In fact, it’s you that’s using this as an excuse to avoid answering my questions, because you know your argument is debunked.
“because, in time, they too will be irradiated.”
New ad-hoc rules added to get you out of jail for violating your other made-up rules.
If we can use future irradiance to qualify regions, then our original use of the unlit side of the Earth in the calculation of the instantaneous spatial average global abso.rbed solar ought to be just fine.
Your rules upon rules are fun but uneccessary.
Much simpler rule, use whatever the hell surface you want to use to average the flux over. As science does.
Nate doesn’t seem to understand that “temporal” means you average “over time” and “instantaneous” means you average “in the moment”.
“In the moment”, the Earth only receives energy over half of its surface area. A fact that is correctly represented by an input of 480 W/m^2, and incorrectly represented by an input of 240 W/m^2.
And, that is the end of the rational debate. Of course, Nate will continue anyway…
Nope, you just keep trying dodgy excuses, but still contradicting yourself.
Your rules are for you, but not for science.
“In the moment”, the Earth only receives energy over half of its surface area.”
In the month of June, the Earth receives energy over ~ 90% of its surface area.
Yet (only) in the second case do you use 100% of global area.
Whether you acknowledge it or not, that is a contradiction, and thus illustrates the arbitrary nature of your made up rules.
Of course, Nate will continue anyway…
Book of Radiance, Chapter 1, Verses 7-10
7/ And lo, I say unto thee: In the matter of the heavens and the Earth, the Law of Conservation of Energy is fulfilled only through the flowing of power, for without flux there is naught to conserve.
8/ Verily, thy confusion is elementary, and thy wisdom as the vapour that vanisheth in the sun.
9/ Thy childish striving to wound my name proclaimeth my triumph before all men.
10/ Truly, I say unto thee, sorry for thy loss.
Arkady acts his age.
DREMT acts like a sphere is the same as a hemisphere.
https://climateofsophistry.com/2025/08/02/the-history-of-climate-sophistry/
DREMT acts like the Antipodal Points of the globe are non-entities. Metaphysics.
False accusations won’t win arguments, Arkady.
It’s so simple to learn how thermistors work, how they can be used to measure infrared in a wide frequency spectrum…
Any ‘real’ engineer knows that.
BACK AT THE RANCH
The 2,900 pages of chats, shared among a dozen millennial and Gen Z Republicans between early January and mid-August, chronicle their campaign to seize control of the national Young Republican organization on a hardline pro-Donald platform. Many of the chat members already work inside government or party politics, and one serves as a state senator.
Together, the messages reveal a culture where racist, antisemitic and violent rhetoric circulate freely — and where the Donald-era loosening of political norms has made such talk feel less taboo among those positioning themselves as the party’s next leaders.
https://www.politico.com/news/2025/10/14/private-chat-among-young-gop-club-members-00592146
Another WIN for Donald!
THE NON-LINEARITY OF THE S-B EMISSION LAW is a kind of approach to the planet surface emission behavior, when considering two identical planets absorbing the same amount of incident EM energy as HEAT. And then, the planets IR emiting the same exactly amount of outgoing energy.
So the faster rotating planet’s surface would have the less differentiated temperature, and the higher average surface temperature.
Thus, when a planet rotates faster, all other things the same, it is considered that the planet absorbs the same amount of HEAT, no matter how much faster the planet rotates.
But when a planet rotates faster, all other things the same, the planet actually absorbs a larger amount of HEAT.
And, of course, that larger amount of absorbed HEAT is IR emitted too, so the radiative energy balance
( Energy in = Energy out ) to be necessarily met.
The faster rotation leads to a larger amount of absorbed HEAT, that is what makes it very POWERFUL the Solar Irradiated planet surface Rotational Warming Phenomenon (N*cp )^1/16 true.
The ROTATIONAL WARMING PHENOMENON amplifies the planet average surface temperature.
So, the planetary surface (N*cp ) product is one of the planet average surface temperature deterministic parameters.
–
https://www.cristos-vournas.com
christos….interesting point about faster rotating planet being warmer. Seems obvious, since more of the surface is covered by solar radiation per rotation. What is not so obvious is the intensity of radiation from the surface must be lower than the intensity of radiation from the Sun.
Since intensity is measured in w/m^2, that means less power is emitted than is received, per unit time. It is equally obvious that energy in cannot equal energy out since there is a time factor involve where the energy in cannot equal the energy out in the same time.
That is a good explanation for the so-called greenhouse effect, which is independent of human causes.
A mistake made in the AGW theory is focusing too much on radiation, which is 260 times less effective at cooling the surface than direct conduction of heat from the surface to the atmosphere.
Here’s another point. Different planets will have different atmospheres. The thicker the atmosphere, the more the atmosphere will absorb heat from the surface. And, the hotter the atmosphere will be. Venus is closer to the Sun and has more solar input. It has a much more dense atmosphere than Earth therefore it warms more.
Venus rotates much more slowly than Earth and should be cooler on average. However, the atmosphere is very dense and the surface temperature is about 30 times hotter.
That warming on Venus has been blamed incorrectly on a greenhouse effect. The surface of Venus is some 400C hotter than Earth’s surface, its atmosphere is thicker, and it is closer to the Sun. The Earth’s warming has been incorrectly blamed by Carl Sagan on a greenhouse effect and his views were perpetuated by James Hansen at NASA GISS.
Good evening, Gordon!
I would like to develop the Rotational Warming Phenomenon in short again.
Again, because it gets explained time-after -time better and better.
0). The EM energy is not heat. When hitting a surface (matter) the EM energy is not heat.
There an interaction process occurs.
When interacting, the matter doesn’t permit the EM energy in. What matter spontaneously does is to emit EM energy, not to absorb EM energy.
Matter is able to absorb energy only when the energy is in form of heat (by conduction and convection).
When EM energy interacting with matter:
1). Some is immediately gets reflected from the skin layer at the same frequencies it hits matter (SW reflection)
2). The rest, the not reflected part, because the skin layer couldn’t reflect it as it is (SW), couldn’t reflect that portion at its initial frequencies…
The rest, while interacting with matter, which matter is already incapable to get rid of it at the initial (SW) frequencies – that process induces the skin layer’s higher temperature.
The immediate IR emission takes place.
The higher the skin layer’s temperature, the higher the immediate IR emission’s the EM energy’s frequencies.
As a result – the higher the skin layer’s temperature, the higher the immediate IR emission’s the EM energy’s INTENSITY.
3). There is a temperature gradient (the skin layer / the inner layers) – the gradient conducts energy in form of heat into inner layers and that heat gets absorbed.
Let’s see now,
The higher the skin layer’s induced temperature – the more energy is IR emitted and the less energy is conducted into inner layers.
The lower the skin layer’s induced temperature – the less energy is IR emitted and the more energy is conducted into inner layers.
A question begs for an answer:
Why the higher temperature gradient (the skin layer / the inner layers) leads to the lesser energy being conducted as heat into inner layers.
It is because the skin layer emits IR EM energy at fourth power (4) of its absolute temperature T.
And. on the other hand, the skin layer conducts heat at ΔT gradient
(the skin layer / the inner layers), which is much-much smaller.
Conclusion:
For the same portion of the not reflected EM energy, which portion interacts with skin layer, while the matter mobilizes its strengths to get it back out as the EM energy it is…
the tension induces a higher skin layer’s temperature…
But, the higher is the surface’s (N*cp) product, the less is the induced the skin layer’s temperature…
And, the higher is the surface’s (N*cp) product, the less is the immediate IR energy, and the more is the energy in form of heat absorbed in inner layers.
So, for the same portion of the not reflected EM energy, some planets or moons absorb more in form of heat, and some absorb less.
Also, it should be noticed, that the not reflected portion of the incident solar flux never gets entirely absorbed as heat in inner layers.
It never gets entirely absorbed as heat in inner layers, because, when EM energy hits matter, there is always the interaction process occurs, thus there is always present a smaller or a larger amount of the immediate IR emitted EM energy.
//////////////////
For the more remote planets and moons the incident solar flux is weaker.
So, the weaker is the on the planet the solar flux , but for surface’s with the same (N*cp) product, the higher is by the planet’s surface
the (absorbed heat / immediate IR emission) ratio.
Because, for those planets, the skin layer’s induced temperature T is much lower, so, as a concequence, it is much lower the immediate iR emission EM energy (the T in fourth power),
And, the ΔT gradient (the skin layer / the inner layers) the temperature difference is comparably to the (the T in fourth power) allows to conduct heat at higher ratio.
So, for two planets with the same (N*cp) product, the more remote planet has a higher
the (absorbed heat / immediate IR emission) ratio.
/////////////////////////
Thank you Gordon, for your support.
Good night.
–
https://www.cristos-vournas.com
SOLAR MINIMUM UPDATE
Brazil is now generating more power from solar than Germany. Pakistan, over six years, has imported solar panels at such volume that their capacity equals that of the national electricity grid. Countries across Africa, where hundreds of millions lack a grid connection, are lighting homes and businesses and medical clinics with Chinese-made solar panels at a record scale. Oil-rich Nigeria is even installing a solar mini-grid at its presidential villa — a way to work around persistent power outages.
https://thinc.blog/2025/10/13/trump-war-on-clean-energy-a-massive-self-own-but-is-it-fatal/
Perhaps giving Argentina money when it sells its soybeans to China will allow Donald to win again?
Belt and Road,
binny…”It’s so simple to learn how thermistors work, how they can be used to measure infrared in a wide frequency spectrum…
Any ‘real’ engineer knows that”.
***
Here we have an example of a climate alarmist who insists on expressing incorrect opinions in a field where another (me) has specialized.
A thermistor is called a thermistor because it is designed to respond to heat. The ‘therm” in the name should e a clue since it means heat, as therme, in Greek. Ask Christos, he speaks the language.
A thermistor is a special kind of resistor in which the resistance varies with temperature, within a small range of temperatures. One application is attached to a heat sink where the thermistor can send back temperature information to a control centre to advise it that the heat sink, hence the semiconductor it is cooling through heat dissipation, is getting outside its safe temperature range.
Thermistors are not used as IR detectors for a good reason. One could conceivably heat a thermistor using an IR heat lamp but the change in resistance would be meaningless. The resistance change would not indicate the temperature of the source only that the thermistor had been heated enough to change resistance.
Although the thermistor might heat enough to affect its resistance, provided the IR intensity was strong enough to affect it, it responds much more efficiently if it is connected directly to the heat source, where it can detect temperature directly via heat conduction.
At a distance, any IR detected would have reduced significantly in strength due to the inverse square law. Unlike detectors that respond to IR frequency, hence are affective at a distance, the thermistor is unlikely to respond to IR intensity at a distance. That’s especially true in the experiment mentioned since it is performed at room temperature where IR emission intensity would be negligible.
To detect IR at a distance, highly sensitive semiconductor devices are used where the IR frequency affects current flow at the electron level. That tells us nothing in itself, unless the device is calibrated to known IR temperature effects on the semiconductor in a lab. In other words, the device must have that data in its EEPROM memory with which it can compare the effect of weak IR on the semiconductor.
I have given an example several times of the IS^2 law. A 1500 watts ring, glowing cherry red on an electric stove would burn flesh severely if touched directly. Such is the effect of 1500 watts. However, a finger can be brought close to touching the ring, within an inch, and will not burn the flesh significantly over a short period. Most of the heat detected is via direct conduction through heated air molecules.
With the finger held a few inches away from the heated source, little is felt from either direct conduction or radiation. With the finger a foot away, little or nothing is detected from either source.
It’s the same for a thermistor, It heats only as much as the heat source will permit. A few inches from the source it may detect warmth in the air from heated air molecules, but little or nothing from the IR emitted.
Let’s face it, the colour red on the heated rings indicates it is giving off EM in the visible spectrum. A piece of iron heated to the same colour should have the same temperature. If the iron could be heated further, its colour would change to orange, yellow and might give off colours eventually reaching into the blue spectrum.
The fact that the iron will appear white is a clear indication of additive colouring. White can be produced by adding the colours red, green and blue in proper proportion. In other words, the colours of a rainbow are not given off visibly since somewhere beyond red the separate colours start to add, producing other colours.
That is the case with an arc welder where staring at the arc will burn parts of the retina due to strong UV light given off (flash). The point is, at room temperature, none of that is possible and any IR given off is very weak. If we go further down the temperature scale to ice, at 0C, there is simply no way it can given of the S-B calculated value of 315 watts/metre squared.
The Sun can only produce a claimed 240 watts/metre squared at the Earth’s surface yet S-B claims ice can produce more heat than the Sun.
Yeah, right!!
The longer Robertson’s posts, the least information they contain, the better he shows his ignorance.
BACK AT THE RANCH
As artificial intelligence company OpenAI plans its rapid construction of behemoth power-guzzling data centers to fuel the AI boom, it has hired a new energy chief – an official from the first Trump administration who is a dedicated champion of natural gas.
John McCarrick, the company’s new head of Global Energy Policy, was a senior energy policy advisor in the first Trump administration’s Bureau of Energy Resources in the Department of State while under former Secretaries of State Rex Tillerson and Mike Pompeo.
OpenAI has additionally chosen not to disclose the carbon footprint of ChatGPT-5, its most advanced AI model to date, despite the fact that researchers told the Guardian it uses “a significantly larger amount of energy” than responses from GPT-40. The company, which is rapidly expanding internationally, does not have formally announced climate or sustainability targets.
https://www.desmog.com/2025/10/13/openais-new-energy-chief-is-a-trump-administration-natural-gas-evangelist/
Willard, why should company need to formally announce its climate of ESG goals? If you don’t want to use AI then that’s your choice but what gives you the right to demand others must follow your beliefs?
Step 2 – Sammich Request
Let’s remind our mouse:
The deal with Broadcom would use as much power as 8 million US households, according to Reuters, as concerns have been raised about AI’s impact on the environment. A 2024 Department of Energy report on data center energy usage found that data centers are expected to consume about 6.7% to 12% of total US electricity by 2028, up from 4.4% in 2023.
https://edition.cnn.com/2025/10/13/tech/openai-broadcom-power
This will raise electricity prices of everyone, more so in states with troglodytes controlling Public Service Commissions. We all know how they specialize in shady deals.
I forgot to reply to the Hunter boy’s nonsense he wrote in the previous thread (September 28, 2025 at 10:42 AM):
” The non-spinner position is that minimal angular momentum of a rotation is when the axis is deemed to be at the center of an object and that the angular momentum increases exponentially as the axis is deemed to exist further from the COM of the object.
that is a brilliant and very useful observation. ”
Wow.
*
Like his friends, the Hunter boy has still not provided any data to support his claim. They all endlessly repeat the same unscientific assumptions without providing any evidence other than, for example, Nikola Tesla’s trivial denying pamphlet, published in an anonymous inventor’s newsletter.
Furthermore none of them was ever able to explain why Moon’s alleged inability to spin about its polar axis is valid for satellites only, surprisingly however not for planets.
Finally, the spin of Jupiter’s and Saturn’s major satellites has been observed and measured since probably two centuries.
*
” It was taught to Bindidon but Bindidon took the additional step of claiming that the rotation on an external axis doesn’t exist but instead is a translation of the object combined with a rotation on the COM of the object. ”
Never in my life have I ever written such neither technically let alone scientifically valuable, imbecile nonsense.
Kepler has clearly stated that the shape of all celestial bodies’ orbits is an ellipse; orbits are not rotations. Conversely, the bodies’ rotation has nothing to do with orbiting.
*
” To maintain this viewpoint Bindidon is willing to ignore the fact that the entire rotational motion of moon is guided by earth’s gravity, not from some mysterious unidentified object that sometime far in the past put a spin on the moon. ”
That is now the very best of the Hunter boy’s sheer nonsense.
If that were the case, then we can all be one hundred percent sure that Isaac Newton, the brilliant discoverer of the concept of… gravity, would have explained it that way.
He did not at all. It’s so boring to have to repeat this all the time…
On the contrary, he explained in his Principia Scientifica that he agreed to the concept of the lunar spin (whose first data – period, inclination of the spin axis – was collected and processed by Domenico Cassini: anybody can see this in Book III, Proposition XVII, Theorem XV).
Original text in Latin, annotated by two very knowledgeable persons:
https://books.google.de/books?id=x-_K1KGZvv4C&pg=PA51&lpg=PA51&source=bl&ots=LtVy4wJkn_&sig=ACfU3U3JXf_82r1c#v=onepage&q&f=false
The most recent translation from Latin (among about ten others) made by Ian Bruce in 2012:
http://www.17centurymaths.com/contents/newton/book3s1.pdf
(Page 744 / 23)
*
It is simply unbelievable that lunar spin deniers consider Newton a hero and accept everything he wrote… except his explanations of… the lunar spin – explanations which were understood and accepted by an incredible amount of scientists who lived and worked after him.
It is simply unbelievable that lunar spin deniers doubt centuries-old scientific findings in this field, including the fact that calculations of the lunar spin period from 1750 and today produce the same value, even though they are based on completely different observational instruments and methods for processing the observational data.
It is simply unbelievable that lunar spin deniers dare to doubt the usefulness of the lunar spin based computation of the drift of lunar descent points with respect to the orbiting module’s trajectory, in order to obtain a lunar ascent time for a secure rendez-vous of the lunar vehicle and the module.
Finally, it is no wonder that they are all too cowardly to simply go to an observatory with their nonsensical claims: they are all afraid of having to give them up quickly.
Bindi is obsessed with this Moon nonsense. He must know he’s lost the debate because he keeps throwing the same crap against the wall:
* He takes Newton out-of-context.
* He has no viable model of “orbiting without spin”.
* His attempt to foist a bunch of phony links, “proving lunar spin”, has failed.
But funnier yet, he doesn’t realize the inconsistency in modern astronomy (formerly astrology). Modern astronomy realizes Earth rotates 365.25 times in one orbit. That is the actual axial rotations we see. They don’t add a rotation for the orbit, since an orbit does not make for an actual axial rotation. Yet they claim Moon has 1 spin per orbit.
Earth actual spins/orbit = 365.25, no spin added for orbiting.
Moon actual spins/orbit = 0, but they add one for orbiting.
Institutionalized science strikes again, and fools many.
Obsessed? No. I just replied once more to the Hunter boy’s sheer nonsense.
*
1. ” * He takes Newton out-of-context. ”
What exactly in the text below could anybody take ‘out-of-context’ [sic] ?
This is from Ian Bruce’s direct translation of Newton’s original Latin text:
PROPOSITION XVII. THEOREM XV.
” The daily motions of the planets is uniform, and the libration of the moon arises from its daily motion.
It is apparent by the first law of motion and Corol. 22. Prop. LXVI. Book I that Jupiter certainly is revolving with respect to the fixed stars in 9 hours and 56 minutes, Mars in 24 hours and 39 minutes, Venus in around 23 hours, the earth in 23 hours 56 minutes, the sun in 25 1/2 and the moon in 27 days 7 hours 43 minutes.
It is evident that these are found from the phenomena.
Spots in the body of the sun return at the same place on the solar disc in around 27 1/2, with respect to the earth; and thus with respect to the fixed stars the sun is rotating in around 25 1/2 days.
Truly because there is the monthly revolution of the moon about its axis : the same face of this will always look at the more distant focus of its orbit, as nearly as possible, and therefore according to the situation of that focus will hence deviate thence from the earth.
This is the libration of the moon in longitude: For the libration in latitude has arisen from the latitude of the moon and the inclination of its axis to the plane of the ecliptic.
N. Mercator has explained this theory of the libration of the moon more fully in letters from me, published in his Astronomy at the start of the year 1676. ”
*
I have shown many times the place in Mercator’s treatise where he explains us what Newton told him.
*
2. ” * He has no viable model of ‘orbiting without spin’. ”
Why?
Apart from asteroids, no celestial body orbiting another one has been ever discovered which would lack the spin about its polar axis.
*
3. ” * His attempt to foist a bunch of phony links, “proving lunar spin”, has failed. ”
For years, I’ve been waiting for denialist Clint R to prove this with real arguments, data, and scientific sources. I’ll probably have to wait forever.
*
4. ” But funnier yet, he doesn’t realize the inconsistency in modern astronomy (formerly astrology). ”
Clint R doesn’t himself realize that he herewith insults even Newton as an ‘astrologer’.
*
For the incredibly confused rest I repeat:
Finally, it is no wonder that they are all too cowardly to simply go to an observatory with their nonsensical claims: they are all afraid of having to give them up quickly.
Hence Clint R never will tell his nonsense to anyone who scientifically proves him wrong.
You see how denial works…
1. As has been explained MANY times, Newton was referring to “revolving with respect to the fixed stars“. But with respect to Earth, or respect to its orbital path, Moon is NOT rotating. There is NO angular momentum about its CoM.
2. Bindi has NO viable model for “orbiting without spin”, only incessant blah-blah.”
3. Bindi can’t link to even ONE “proof” of lunar spin. That’s because there is NO lunar spin.
4. Bindi can’t explain why Earth has no extra spin days, while Moon gets an extra spin day. Inconsistencies in astrology.”
And we get to go to “an observatory” every night there is a clear sky. We always see the same side of Moon.
What will Bindi try next?
” 1. As has been explained MANY times, Newton was referring to ‘revolving with respect to the fixed stars’. But with respect to Earth, or respect to its orbital path, Moon is NOT rotating. ”
For years, I incessantly tried to explain to Clint R, Robertson, the fake mod DREMT and the Hunter boy that when Newton (and anyone else) uses the expression ‘with respect to the fixed stars’, s/he does not refer to the motion of celestial bodies but to these bodies’ motion PERIOD:
” Spots in the body of the sun return at the same place on the solar disc in around 27 1/2, with respect to the earth; and thus with respect to the fixed stars the sun is rotating in around 25 1/2 days. ”
None of these stubborn four deniers has ever been able to understand this, let alone to accept it and to stop their common, intentional misrepresentation of the concept.
*
” 2. Bindi has NO viable model for ‘orbiting without spin, only incessant blah-blah. ”
Sorry, this is simply too dumb.
*
” 3. Bindi can’t link to even ONE ‘proof’ of lunar spin. ”
This is a pure lie: I have shown many proofs of this spin, but YOU are the one who polemically discedrits these proffs and denigrates their authors, but are unable to technically and scientifically disprove them.
*
” 4. Bindi can’t explain why Earth has no extra spin days, while Moon gets an extra spin day. Inconsistencies in astrology. ”
No idea what you invent here, show us a published article proving your unscientific claim.
*
” And we get to go to ‘an observatory’ every night there is a clear sky. ”
I didn’t mean you looking at stars with a telescope, child.
I mean, you clearly lack the balls to enter into a discussion with an astronomer and explain to him/her that the Moon does not spin: you will never do that.
*
” We always see the same side of Moon. ”
” Truly because there is the monthly revolution of the moon about its axis : the same face of this will always look at the more distant focus of its orbit… ”
You don’t understand what Newton said, do you?
*
Feel free to answer with more nonsense; I won’t reply however, you are too obstinated, too boring.
Bindi, you’re just like gordon — all blah-blah, but no substance.
Start here:
https://www.drroyspencer.com/2025/10/uah-v6-1-global-temperature-update-for-september-2025-0-53-deg-c/#comment-1718805
DREMT’s hubris.
Google Gemini:
Question:
Evaluate the accuracy of the following assertion: the only instance in which “flux in” does not need to equal “flux out” for energy to balance is when the Accumulation term is non-zero.
Answer:
The assertion is accurate. The energy balance equation demonstrates that “flux in” must equal “flux out” for energy balance only when the accumulation term is zero, a condition known as a steady-state system.
If the accumulation term is non-zero, then “flux in” and “flux out” are unequal.
Try to learn, this time:
https://www.drroyspencer.com/2025/09/uah-v6-1-global-temperature-update-for-august-2025-0-39-deg-c/#comment-1715262
SOLAR MINIMUM UPDATE
A series of political missteps and policy disputes has strained Energy Secretary Chris Wright’s relationship with the White House, 10 people familiar with the dynamic told POLITICO — causing some to question how much longer he can last in Donald’s Cabinet.
The friction, these people said, includes complaints that Wright was too slow to loop in the White House on his plans to kill tens of billions of dollars in Biden-era clean energy grants — and too willing to defend the interests of industries that want some of that funding preserved. Decisions on revoking those grants brought him into conflict with White House staff, POLITICO reported last week.
https://www.politico.com/news/2025/10/17/chris-wright-white-house-00612920
In other news, the Leopard Ate My Face meme turned 10 years yesterday.
Hegseth in Spetzop-dress
” Following the meeting between Trump and Zelensky, one detail is causing a stir in Russia: the tie worn by US Secretary of Defense Pete Hegseth. Hegseth caused a stir with an unexpected fashion choice, writes the Russian state news agency Tass: ‘A tie in the colors of the Russian tricolor’.
https://i.postimg.cc/Fs0pXDJD/Hegseth-in-Spetzop-look.jpg
In fact, footage of the meeting shows the US Secretary of Defense in the White House wearing a tie with white, blue, and red stripes, in the same order as the Russian national flag. However, the US flag also has these colors, but not in that order; an unfortunate coincidence? ”
*
For those who don’t know: ‘Spetzop’ is the name given by the Russian warriors for their war against Ukraine.
People like Robertson (see his “Azov Battalion” syndrome), but also many young Russians who celebrated the end of World War II in Moscow on May 9 of this year, truly believe that Russia is fighting in Ukraine a country full of Nazis, just as it fought against Hitler’s SS henchmen and the Wehrmacht in World War II.
OMG…
*
Some in the White House are apparently naive enough to believe they can stop Putin from sending drones into Ukraine every day to kill civilians and destroy Ukraine’s energy sector just before winter sets in.
Putin has no interest in peace and has the Trump’ing boy firmly in his grasp.
So one day the Trump’ing boy says that the US has plenty of Tomahawks and can therefore supply many to Ukraine via Europe; the next day, after a phone call with Putin, the Trump’ing boy says that the US indeed does have plenty of Tomahawks, but needs them for itself…
Do you have a point other than venting your TDS in here ???
You might like:
A Republican Minnesota state senator who was caught in a sting operation resigned under fire Thursday after he was charged with soliciting a minor for prostitution, stepping down before the Senate could vote on whether to expel him.
According to Eichorn’s profile, which has now been removed from the Senate website, he is married with four children. He listed his profession as entrepreneur and was first elected in 2016. He got some national attention earlier this month as one sponsor of a not-very-serious bill that would have designated “Donald derangement syndrome” as a mental illness.
https://apnews.com/article/senator-justin-eichorn-resigns-b79bc500b740f61d1e5f280e3822fb9b
Aaaah, the little all time ankle-biting dachshund is here again.
Apparently he has not yet managed to realize that it is actually he himself who has been driving us crazy for months with his dumb Trump addiction syndrome.
And by the way, dachshund: come yourself back to us with a ‘point’ similar to two of all those I posted just this year, e.g.
https://www.drroyspencer.com/2025/10/uah-v6-1-global-temperature-update-for-september-2025-0-53-deg-c/#comment-1718833
or
https://wattsupwiththat.com/2025/04/19/is-arctic-amplification-an-averaging-error/#comment-4067318
*
All you were able to do here until now is to hatefully aggress people whose opinion you dislike – as do all MAGAmaniacal Trumpistas.
*
No King!
No ICE!
Freedom of speech!
Gordon Robertson says:
October 15, 2025 at 10:19 PM
christos….
“interesting point about faster rotating planet being warmer. Seems obvious, since more of the surface is covered by solar radiation per rotation.”
–
Does not compute.
Think of it this way’
If your comment was right, then by the same logic more of the surface is covered by darkness per rotation as well.
The warmth due to faster rotation is due to the phenomenon of
Stefan-Boltzmann law, statement that the total radiant heat power emitted from a surface is proportional to the fourth power of its absolute temperature.
Shame about the drought and shortage of rainfall in the UK last winter and spring of 2025. how does that fit in with your increasing winter rainfall theory? maybe its just weather,
Step 2 – Sammich Request
More warmth means more water, more water means more rain, bigger rains means more water at some place, less at others.
Alternatively, RTFR:
https://www.ipcc.ch/report/ar6/wg2/chapter/chapter-4/
“maybe its just weather,”
I don’t think that I’ll ever forget the winter of ’72
It must have been the coldest year that I ever knew
I left my home in Dallas to head out for Idaho
Before I reached Colorado I hit three feet of snow
Oh Lord, let the wind blow you know I’m so cold
Rock Springs to Cheyenne is a bad stretch I’ve been told
2 o’clock in the morning on Thanksgiving Day
It’s a damn good thing I’m a God fearing man
I’ve been forced to pray
Yeah it’s a damn good thing I’m a God fearing man
I’ve been forced to pray.
The Earth is not a flat plate.
The Earth receives solar radiation over the equivalent of a flat disk because, at a distance of ≈215 solar radii, the sun’s rays arrive in plane-parallel configuration.
(1-α)So(πR²) = (4πR²)σT^4
(1-α)So/4 = σT^4
Any 480 W/m² “in” scenario implicitly assumes a very different geometry, one where the Sun is so close that its rays diverge significantly, which is not the case in reality.
“Sure, you could say the irradiance is 480 W/m^2 on the lit hemisphere…”
– Tim Folkerts
Ark displays his ignorance of the science.
Only one spot on Earth receives the 960 W/m². The rest of the hemisphere is reduced by the cosine function, being 0 W/m² at Earth’s limb. The integrated value then is 480 W/m², if flux could be treated as such. But, the 480 W/m² is much closer to reality than the 240 W/m² nonsense.
Even Bindi knows this….
“the surface on the back side is not ‘non-surface'”, op. cit.
“Any 480 W/m² “in” scenario implicitly assumes a very different geometry, one where the Sun is so close that its rays diverge significantly…”
Incorrect. They’re now so desperate they’re just openly spreading misinformation. None of the others step in to correct it.
“They’re now so desperate they’re just openly spreading misinformation.”
Talk about a double standard, coming from the guy who cherry-picked Tim Folkerts’ most excellent comment (https://www.drroyspencer.com/2025/10/uah-v6-1-global-temperature-update-for-september-2025-0-53-deg-c/#comment-1718752).
Tim should have corrected your misinformation himself, so I quoted him…the part of his comment that shows you’re talking crap that not even people on your own “team” agree with.
“If the sphere was truly receiving 960 W per square meter of surface, then (in steady-state, of course) it would emit 960 W per square meter of surface.” Op. Cit.
None of the others step in to correct it.
“There is no need to wait a day. We have the instantaneous result. “. Op. cit.
The reality is, at any one moment the Earth is only receiving light over one hemisphere, while it emits from the entire sphere.
480 W/m^2 in and 240 W/m^2 out reflects that reality.
240 W/m^2 in and 240 W/m^2 out does not.
There is no doubt that the former is a better representation of the reality, for an instantaneous average. I just get endless pushback for stating obviously true things.
DREMT:
480 W/m^2 in averaged over the sunlit hemisphere and 240 W/m^2 out averaged over the entire sphere reflects reality.
240 W/m^2 in averaged over the entire sphere and 240 W/m^2 out averaged over the entire sphere reflects reality.
Both reflect reality. Each is interesting and useful.
But since the discussion is about energy balance over the entire sphere, then for most purposes, the SECOND option is more useful and informative for current purposes.
The reality I’m referring to is that at any one moment the Earth is only receiving light over one hemisphere, while it emits from the entire sphere. The second option does not reflect that reality.
At least DREAMT is making some progress about understanding 240 W/m^2.
EARLIER: “The only way you can say the irradiance for the Earth is approx. 240 W/m^2 is if you average the input over at least 24 hours.”
NOW: “There is no doubt that the former is a better representation of the reality, for an instantaneous average.”
“240 W/m^2” as an instantaneous average has moved from ‘impossible’ to merely ‘less good’.
———————————–
As for what is ‘better’, that depends on the purpose. Let’s expand on your idea of ‘two regions is better than one’. If two regions [better represents reality than one, why not 10 regions instead of 2? For example, find the average irradiance for the bands of the globe where the sun is 80-90 degrees above the horizon, 70-80, … 0-10, and below the horizon. That a MUCH better ‘representation of reality’ than 480 W/m^2 for an entire hemisphere. Or how about a grid of 360 x 180 regions each 1 degree on a side? Even better yet!
BUT! Averages are not meant to be ‘the best representation of reality’. Averages are meant to be the best 1 number summary of a set of data.
And for GLOABAL energy balance, the best 1 number summary is a GLOBAL average.
I’ve not changed my position one iota, Tim. And, I never will.
I stand by what I said. The only way you can say the irradiance for the Earth is approx. 240 W/m^2 is if you average the input over at least 24 hours. Or, if you change the meaning of “irradiance”, of course…which you’re perfectly prepared to do.
By pointing out that the former option better represents reality than the latter, I’m merely acknowledging your refusal to let the latter option go. I’m pandering to your beliefs, not changing my position. I’m just trying to get you to concede anything at all.
But, there’s no chance of that. I’m wasting my breath.
“The only way you can say the irradiance for the Earth is approx. 240 W/m^2 is if you average the input over at least 24 hours. ”
Still no! In 1 second irradiance can be measured in any specific location at that specific time. If you measure a bunch of these scattered around the world at that moment and average them, you will get ~ 240 W/m^2.
There is no need to wait 24 hr to get a value of ~ 240 W/m^2.
I understand, but disagree, as explained:
https://www.drroyspencer.com/2025/10/uah-v6-1-global-temperature-update-for-september-2025-0-53-deg-c/#comment-1719316
DREMT says (in his link): “For one thing, “my” position does not involve redefining what “irradiance” is.”
My position does NOT redefine irradiance.
I define irradiance as watts per square meter of EM flux — the standard definition. For example, as measured by something like this:
https://www.tequipment.net/Fluke/IRR1-SOL/Solar-Field-Analyzers/
There is a fixed area of the detector and it measures how much light is arriving and gives a reading for irradiance for the detecting area.
“you apparently think you would average the power received over any surface area you want.”
Ah! Do you want to now talk about AVERAGE irradiance over an area, rather than irradiance at one specific spot? I can indeed average the irradiance over any area I want. I just choose an area that is interesting or important to me.
Suppose I take my meter and measure inside your spotlight and get 100 W/m^2. Then I check 9 other uniformly spaced locations on the stage and get 0 W/m^2 (outside the spotlight). The average for the whole stage is 10 W/m^2. I don’t see how you could possible object to averaging multiple readings from multiple locations. The fact that some locations are measured to be 0 W/m^2 and some are measured to be 100 W/m^2 doesn’t stop me from finding a valid average of the individual measurements across the stage. (And yes, I could also average over the whole auditorium and maybe get 2 W/m^2)
“10 W/m^2” is the best 1-number summary of the brightness of the stage as a whole. Just like the average “240 W/m^2” is the best 1-number summary of solar irradiance for the earth.
…and, just to be extra clear, this:
“If you measure a bunch of these scattered around the world at that moment and average them…”
…is what I’m disagreeing with. You shouldn’t be taking samples from the entire Earth’s surface and averaging them, because the entire Earth’s surface is not irradiated in that moment. You should only be taking samples from the lit hemisphere, and averaging them. You are redefining what “irradiance” is, as explained in the linked comment.
“My position does NOT redefine irradiance.“
Yes it does, Tim, as explained in my linked comment, and not refuted by your response here. I recommend readers just look at the linked comment in full. I’m getting bored of repeating myself.
“You shouldn’t be taking samples from the entire Earth’s surface and averaging them, because the entire Earth’s surface is not irradiated in that moment. ”
We are trying to compare (total incoming power to the whole surface) with (the total outgoing power from the whole surface), Absolutely we should be averaging both incoming radiation and outgoing radiation for the whole surface.
The reality I’m referring to is that at any one moment the Earth is only receiving light over one hemisphere, while it emits from the entire sphere. “240 W/m^2 in and 240 W/m^2 out” does not reflect that reality.
Getting very bored of repeating myself.
DREMT, what question are you trying to answer? Why are you averaging the fluxes to begin with? Why are you interested in the average irradiance?
I am trying to address the question “How does the total EM power leaving the earth, P(out), compare to the total EM power arriving at the earth, P(in)?”
To understand P(out) and P(in), I could just as well study P(out)/A and P(in)/A, where A is the total area of the earth. Dividing both sides by a fixed, known amount keeps the relationship the same.
But P(in)/A is just the average incoming flux over the whole surface. P(out)/A is just the average outgoing flux over the whole surface.
Dividing P(in) by total area gives me useful information about my original question.
The reality I’m referring to is that at any one moment the Earth is only receiving light over one hemisphere, while it emits from the entire sphere. “240 W/m^2 in and 240 W/m^2 out” does not reflect that reality.
The question I want answered is, “why do you people hate reality so much?”
“Suppose I take my meter and measure inside your spotlight and get 100 W/m^2. Then I check 9 other uniformly spaced locations on the stage and get 0 W/m^2 (outside the spotlight). The average for the whole stage is 10 W/m^2. I don’t see how you could possible object to averaging multiple readings from multiple locations.“
As I said up-thread…mathematically, you can do whatever you want. Nobody is disputing the maths. The point is – your 10 W/m^2 for the stage is misleading at best. And your 2 W/m^2 for the whole auditorium is even more misleading, and meaningless. The reality is, there’s only a spotlight on that 5 m^2 area of the stage. That’s it. This averaging including surface area that is not irradiated just dilutes the flux. Now…I could even concede there are situations where it might be useful to know the information…but, everything has limits. Everything has to be “within reason”. I say, averaging solar radiation where the Sun don’t shine, for an instantaneous average of 240 W/m^2, is well outside of reason.
Only an instantaneous average of 480 W/m^2 has anything to do with reality…and even then, it’s still pushing it. Some might argue 960 W/m^2 (no averaging at all) is the way to go. I’m at least trying to meet you guys in the middle.
“The point is – your 10 W/m^2 for the stage is misleading at best. “
The point is — ANY average is “misleading”. The whole point of an average is to ignore specific values and come up with one number that summarizes some set of information. An average NEVER gives a complete picture.
“there are situations where it might be useful to know the information …”
Not “might be”, but “are”! 240 W/m^2 tells you that — if you multiply by the area for the object being illuminated — you get the total power to the object. At the total power into the object is an EXTREMELY valuable number.
For energy balance, your 480 W/m^2 is the useless information. Useless until you ALSO specify it is for half the surface, and FURTHER specific the remaining surface is 0 W/m^2.
Tim admits that all the 240 W/m^2 can tell him is “total power” – a number which you can get without even needing to average at all. Whereas, the 480 W/m^2 actually reflects the reality that only the hemisphere is irradiated in that moment. The 240 W/m^2 does not reflect that reality at all. So, Tim chooses against reality, for no real reason.
Gemini:
“The term “Solar Constant” (S0) is a bit of a misnomer; it is not a physical constant like the speed of light. It is an average value that represents the mean solar electromagnetic power per unit area.”
Obviously, you can get the “total power” received with all three of the numbers:
1) 960 W/m^2 x area of the “Earth’s shadow” disk = “total power” received.
2) 480 W/m^2 x area of the lit hemisphere = “total power” received.
3) 240 W/m^2 x area of the sphere = “total power” received.
So, truly, there is nothing to be gained by using the 240 W/m^2 number. It just dilutes the flux, fails to represent reality and fails to even meet the definition of “irradiance”. It’s basically just an insult to people’s intelligence.
Gemini:
“A 1D (One-Dimensional) climate model is a simplified computer simulation of a planet’s climate that focuses on variations along only one spatial dimension, typically either altitude (vertical) or latitude (horizontal).
These models are much less complex and computationally intensive than full-scale 3D Global Climate Models (GCMs), making them ideal for initial studies, conceptual understanding, and testing fundamental climate physics.”
https://climateofsophistry.com/2025/08/02/the-history-of-climate-sophistry/
https://xkcd.com/3155/
#2
https://climateofsophistry.com/2025/08/02/the-history-of-climate-sophistry/
“So, truly, there is nothing to be gained by using the 240 W/m^2 number. It just dilutes the flux, fails to represent reality and fails to even meet the definition of “irradiance”. It’”
For the billionth time, no one here or in climate science is denying the diurnal cycle.
Therefore your claim of a “failure to represent reality” is a non-failure and totally fake problem.
In science, it is standard to look at only the subset of available information that is needed to answer a question
Here, the 240 W/m2 average input flux is addressing the questipn of an energy imbalance.
You want to instead study the diurnal cycle? Probably not, but no one is stopping you.
Now its time to find a new non controversy.
There’s no controversy in anything I’m saying, Nate. That’s the funny thing.
Perhaps readers will check out the linked article. Then they will find the controversial part of the argument. Nobody on here even allows me to get to it, pushing back instead on the parts that should not even be disputed!
“Then they will find the controversial part of the argument”
Which
a. You cannot explain, yet you defer to the authority of a non-authority crank.
b. Have been thoroughly debunked by many, including Roy Spencer.
I’m afraid all Dr Spencer has ever done is wildly misrepresent Postma. As you all do. Deliberately.
For one thing, it’s nothing to do with “diurnal cycle”. The Earth is constantly receiving a higher flux than 240 W/m^2, all the time, as it rotates. The 480 W/m^2 is received over half of the Earth’s surface area, all the time, whilst the Earth rotates. You have to think more along the lines of a “rotisserie chicken”.
Ultimately, though, the argument all comes down to the questions Stephen keeps asking you, which you refuse to answer.
1) Without GHGs, what would the temperature be at the surface of the Earth?
2) Without GHGs, what would the temperature be at the top of the troposphere?
“The Earth is constantly receiving a higher flux than 240 W/m^2, all the time, as it rotates. The 480 W/m^2 is received over half of the Earth’s surface area, all the time, whilst the Earth rotates.”
A spatial instantaneous average, no better or worse than the one we do.
Like ours it is not reflecting the true reality that the irradiance in fact varies from 0 to 960 W/m2 over that surface.
Why is that ok, King of Contradictions?
And accusing an actual authority on the subject, Roy Spencer, of not understanding the faux authority Postma and his nonsense.
Only science ignorati are gullible enough to believe the sky dragon slayers obfuscations.
Nate pretends not to understand that 480 W/m^2 is more than 240 W/m^2. He pretends not to understand what I meant by “rotisserie chicken”. He pretends that the “on the flat Earth rants of Joe Postma” article wasn’t the most shameless misrepresentation of Postma’s views ever written. And, above all, he pretends not to notice I just asked him two questions he’s not at all prepared to answer.
What a guy.
Gemini:
“In a real-world scientific context like planetary energy balance, simply comparing the numerical values of irradiance (W/m2) in isolation is generally meaningless without defining the total power and the area it applies to.”
I’m suddenly reminded that in fact there was an even worse article for shamelessly misrepresenting Postma’s views. It was published at the blog, “And Then There’s Physics”, called “Mind Your Units”, and was written by the guy who has tried to interject in my discussions about twenty times so far this month, without receiving a direct response from me. I’ve been trying to ignore him, but he’s weirdly insistent on contributing worthless tidbits of information, most of which are not even disputed.
DREMT keeps shamelessly claiming that Roy Spencer and others are ‘misrepresenting Postma’, without offering any evidence or explanation whatsoever.
He expects us to believe that he, a non-scientist, has a better understanding of Postma’s argument, than Roy Spencer.
Much more plausible: DREMT is an ignorant rube when it comes to science, and has been taken in by Postma’s BS.
Yes that is clearly what happened.
That’s just personal abuse, Nate.
Your failure to answer the questions reveals all.
With each comment that passes without an answer, I just win the overall argument that much more. Thank you.
The reality is that Joe misrepresents climate models when he subsumes them all under a simple 0D model.
There is no doubt that the Earth can’t emit more than it receives, and it doesn’t receive more energy by representing it as a 3D micro-grid that spins and orbits, a kind of model that Joe never achieved.
Graham can’t succeed in overthrowing the greenhouse effect by only misstating trivial stuff, so perhaps he should own his silly motte-and-bailey.
Another comment without an answer to my questions. Another easy win!
One of my favourite victories.
Awww abuse?
Given that accuse our host of
Postma hurls angry bile at those who point out flaws in his science, as I did (politely) with his fake physics analysis of the GPE, and finally bans them, as I was.
Thus he collects followers who applaud his approach to critics and only amplify his erroneous thinking.
Then we have you claiming, without evidence, that our host
‘deliberately’ misrepresented Postma.
Yet you wont ever get banned.
The evidence is – Dr Spencer’s article. Read it. You know full well that’s a misrepresentation of Postma’s argument. What Postma is saying is not difficult to follow, so I don’t buy that Dr Spencer doesn’t “get it”. I don’t buy that any of you don’t “get it”.
But, thanks for refusing to answer the questions. The victory continues.
“The evidence is –” and always will be left unexplained.
We have learned to ignore your hyperbolic empty claims of ‘victory’.
Look you tried and failed miserably, for the last 2 months to explain the problem with averaging solar absorbed flux globally.
You just cannot articulate it. Just as Postma could not.
As I noted, and you could not refute, no information is lost by averaging as we do.
Anyone including you or Postma or anyone interested, are not prevented from averaging the available data differently.
This is how science works.
If there is something to be discovered about climate change by averaging the solar input over a hemisphere, you have yet to report what that is.
Thus, the breathless claims that ‘realty’ is being misreprented are vacuous.
But continue to make bonkers claims of ‘victory’.
It really will be tremendously apparent to anyone reading that you refuse to answer the two questions…and, down-thread I’ve explained exactly why you’re avoiding them.
You’ll keep responding, but you won’t answer the questions.
Every time that happens, I win.
Everything has been said multiple times.
The argument is over.
You have relevant questions that havent been answered.
He still hasn’t answered! Yet, he keeps responding…
You have no questions relevant to this discuussion, loser.
You are just seeking distraction from your loss.
If you think those questions are not relevant to the discussion, then you obviously haven’t even read the linked article. Actually read it:
https://climateofsophistry.com/2025/08/02/the-history-of-climate-sophistry/
Then answer the questions.
Nope. Still no relevant questions. You still cant articulate any actual problem here.
To keep lamely deferring to the expertise of con-man Postma just confirms you are an easy mark.
Here is why Nate refuses to answer the questions:
https://www.drroyspencer.com/2025/10/uah-v6-1-global-temperature-update-for-september-2025-0-53-deg-c/#comment-1720684
Ive skimmed the article. I can see that its arguments are identical to the weak arguments youve made here for weeks.
“What Postma is aying us not difficult to follow”
Yep.
“so I don’t believe that Dr. Spencer doesnt “get it”. I don’t buy that any of you don’t “get it”.”
Yep it is clear that you think he is a genius, while those of us, such as Roy. Tim, and I, all trained in science, do not. We find his arguments unconvincing, misleading, and often dishonest.
Again, the main point we are making is that there is no actual negative consequence to averaging globally, that you guys have articulated.
If you dont buy that, then you havent been paying attention to any of our rebuttals.
Again the laser analogy has been discussed here at length.
It is pure obuscation, in my opinion.
Yes, there are ranges of light intensity where serious destruction of surfaces can happen.
But since the range of sunlight intensity hitting the Earth is never anywhere near this range of intensity, this destruction will never ever happen.
The reality is that averaging over the diurnal cycle does not miss anything significant for the purpose of analyzing long term climate change.
We know this because there are climate models that DO NOT average over the diurnal cycle, yet find similar global warming as those that do.
Lots of strawmen in there.
He mentions that the Hadley cell circulation cannot be derived from the 1-D model.
This is both obvious and well known!
But in the 1970s the first General Circulation climate models were able to generate the Hadley Cell circulation. Of course these are the more realistic climat models still used today!
And they still have a GHE and still have GW.
Again, there is no actual problem identified here.
What should concern you is that the commenters on this article are all cheerleaders and sychophants.
So, Nate hadn’t actually even read the article that I’d been linking to for a couple of months. Amazingly ridiculous. Now, he shows zero understanding of any of it. Maybe actually take the time to read it properly, Nate. Not just skim it.
Then, answer my questions.
No answers for my Postma criticisms.
I still see no questions relevant to this discussion.
I see only way off topic questions that lead down another rabbit hole.
Not interested.
A poor fisherman claims ‘victory’ when no fish take the bait!
Nate, you’ve been claiming victory constantly.
I haven’t seen anything worth taking seriously in your responses re the article. For example, you mention that the Sun can’t literally burn the Earth’s surface like a laser can. Well, duh! Obviously. That was never what was being suggested by the analogy. All the analogy shows is that “time-averaging” gives a false indication of the true intensity of the source. I told you already, the reality is that the Earth is receiving higher intensity radiation than 240 W/m^2, continuously, whilst it rotates. It’s receiving an average of 480 W/m^2, over half of its surface area, all the time, whilst rotating. I then pointed out the analogy of the “rotisserie chicken”. It should all be fairly self-explanatory. Yet, you refuse to engage.
You guys have been pushing back continuously on the not-at-all controversial parts of the argument, refusing to let me even get onto the controversial bit. The controversial bit involves the lapse rate, and the two questions I asked you which you refuse to answer! I even linked you to where I explain it all further, down-thread. You’re just refusing to engage, again. Hard not to claim victory when your opponent refuses to engage at all with your argument!
The laser analogy is highly misleading.
My home heating system turns on and off. When it is on, it is not a flame thrower burning the furniture. Its heating is low enough to do no harm.
To model it as a steady lower flow of heat into the house works perfectly well.
And it is a strawman. Modern climate general circulation models include the diurnal cycle and all other relevant details of the Earth.
They and 1 D and 2D models find similar GW.
Nate mentions “diurnal cycle”, again. He’s not listening. That was already taken care of three days ago, in my comment of October 24, 2025 at 9:53 AM.
He’s, generally, full of crap, of course. He just admitted he’s only now read the article. Yet, he’s been saying, before reading it, stuff like:
“Look you tried and failed miserably, for the last 2 months to explain the problem with averaging solar absorbed flux globally. You just cannot articulate it. Just as Postma could not.”
And, he utterly refuses to answer the two questions.
Nate, either answer the two questions, or concede the “33 K GHE” is bogus. The questions are:
1) Without GHGs, what would the temperature be at the surface of the Earth?
2) Without GHGs, what would the temperature be at the top of the troposphere?
“He just admitted he’s only now read the article. Yet, he’s been saying, before reading it”
You are not any making sense. His arguments have been discussed here many times. Roy Spencer posted an article critiquing it all awhile back. You and I discussed Roy’s debunking of his ideas. Remember??
Q1,Q2.
I dont know. I can only speculate. Do you know?
I recall a paper awhile back modeling removal of all CO2. There was deep cooling and growth in ice cover over the Earth.
Weather and convection as we know it drops dramtically,
because there is no mechanism to remove heat at TOA.
Dr Spencer never debunked his ideas. His article “on the flat Earth rants of Joe Postma” completely misrepresents his arguments. As I already said.
Just answer the questions or stop responding to me. God, this is getting boring.
“I dont know”
OMG. Talk about desperate to avoid engaging. Again, read through the comments from here:
https://www.drroyspencer.com/2025/10/uah-v6-1-global-temperature-update-for-september-2025-0-53-deg-c/#comment-1720684
Obviously nobody “knows” for certain. I’m asking for your opinion, and I’m asking because I don’t think you’re prepared to stick your neck out and contradict Dr Spencer. But, I no longer think it’s too controversial to suggest there would be a lapse rate without GHGs. Which does contradict Dr Spencer, who thinks the atmosphere would be isothermal. And, if it’s the dry adiabatic lapse rate, as it would have to be, then it would be a steeper lapse rate than the one we have with GHGs. I don’t see how the average temperature of the surface and atmosphere could be 255 K without GHGs unless the surface was significantly warmer than 255 K. Every bit that the surface is warmer than 255 K without GHGs reduces the “33 K GHE” claim.
This is the controversial part of Postma’s claims. We’ve never discussed it before.
You offer no rebuttal of Roy Spencer’s commentary, nor mine in my comments above.
Until then, your opinion can be safely ignored.
We already understand that you think Postma is a genius.
How do you know?
Personally, if I dont have expertise in a field of science, I find it hard to make judgements about which model/theory is better.
Like two different approaches to Liver disease. I know I’m not qualified to judge which is better. I could never be a peer reviewer of a Liver disease paper.
So why do you feel so certain that you know Joe Postma is right and Roy Spencer is wrong?
Seriously. Why do you feel quslified to judge?
“I dont know”
OMG. Talk about desperate to avoid engaging. Again, read through the comments from here”
Anyone saying they dont know in this blog should be applauded.
It is much more believable than the many people here claiming they KNOW things, after a 5 minute Google search or reading blog.
You are saying you KNOW what the lapse rate would do, and that Roy Spencer is getting it wrong.
Lacking any expertise in this subject, and providing no detailed explanation, logic, or facts, your claims of KNOWING are not believable
Nothing worth responding to in either of Nate’s last comments.
Ok, you asked me questions and demanded answers. I give you answers, but you dismiss them.
You have no answers to my specific criticisms of Postma. I ask you how you ‘know’ what you claim to know, which disagrees with the analysis of Roy Spencer, and others here with actual scientific training.
You have no answers, so just blame the messenger.
If you say so, Nate. If that helps you “self-soothe”, so be it.
The reality of the discussion can be read by anyone interested. Nobody will be swayed by your false summary.
The facts are that you cannot defend Postma on the merits of his argument. You cannot defend your claim that Roy Spencer misrepresented him.
So these declarations can be safely ignored.
Those are the facts.
“. I don’t see how the average temperature of the surface and atmosphere could be 255 K without GHGs unless the surface was significantly warmer than 255 K”
I dont know where you get this idea. Its quite simple, the surface cannot be warmer that 255 K because the surface radiates direct to space. If there is a steep lapse rate it must end at a colder T at the tropopause. Which would be a lower altitude.
Read it:
https://www.drroyspencer.com/2019/06/on-the-flat-earth-rants-of-joe-postma/
If you were honest, you would agree that’s a total misrepresentation of what Postma is saying. What this discussion needs is some honesty from you. If you can’t be honest, what’s the point of talking to you? I’ve defended his arguments on their merit, at great length, and you just claim it’s a “fact” that I haven’t!
If indeed there is a lapse rate without GHGs, then the average temperature of the surface and the atmosphere combined must still be equal to the effective temperature, 255 K, as is the case with GHGs. That obviously doesn’t work if the surface itself is at 255 K and then it gets colder as you ascend! The average would be lower than 255 K.
OK, let’s look at Dr Spencer’s article:
“Joe’s claim (as far as I can tell) is that that the solar flux value (often quoted to be around 342 W/m2) is unrealistic because it is for a flat Earth. But as an astrophysicist, he should recognize the division by 4 (“Fs(1-A)/4” and “S/4”) in the upper-left portion of both figures, which takes the solar constant at the distance of the Earth from the sun (about 1,370 W/m2) and spreads it over the spherical shape of the Earth. Thus, the 342 W/m2 value represents a spherical (not flat) Earth.”
Postma is well aware of the geometry behind the “division by 4”. His actual claim is that the Earth cannot receive sunlight over its entire surface area at once, because it’s a sphere irradiated by one energy source! Half is in shadow. Thus, he reasons, saying that the Earth receives energy over its entire surface area at once (via the “division by 4”) is akin to picturing the Earth as a flat plane with everything laid out on the side facing the Sun. That’s where his “flat Earth” criticism comes from. Dr Spencer misrepresents him on that.
“Just because someone then draws a diagram using a flat surface representing the Earth doesn’t mean the calculation is for a “flat Earth”.”
Likewise, another misrepresentation. The rest is similarly flawed.
“His actual claim is that the Earth cannot receive sunlight over its entire surface area at once”
Well, gee, that’s quite a revelation.
NOT.
Again, the whole point is that there is no problem here. No one is actually claiming otherwise.
No information is lost by the way climate science averages the flux over the whole Earth, to study the energy imbalance of the Earth.
And he hasn’t demonstrated an actual negative consequence of that approach.
Nate, Dr Spencer misrepresented Postma. This is the part where you concede I was correct about that.
“Thus, he reasons, saying that the Earth receives energy over its entire surface area at once (via the “division by 4”) is akin to picturing the Earth as a flat plane with everything laid out on the side facing the Sun.”
For the billionth time, no one is saying it is receiving energy over its entire surface area at once.
Nobody but Postma.
“That’s where his “flat Earth” criticism comes from. Dr Spencer misrepresents him on that.”
IMO it is deserving of that criticism, because it is a strawman, see above.
“Just because someone then draws a diagram using a flat surface representing the Earth doesn’t mean the calculation is for a “flat Earth”.
Fair criticism, because Postma had been blasting this ‘Flat Earth physics’.
Spencer on Postma:
“our discussion ended with expletive-laced insults hurled my way”
The guy has problems.
“Next in that article, Joe’s (mistaken) value for the solar constant is then used to compute the resulting Earth-Sun distance implied by us silly climate scientists who believe the solar constant is 342.5 W/m2 (rather than the true value of 1,370 W/m2). He gets twice the true, known value of the Earth-Sun distance, simply because he used a solar flux that was off by a factor of 4.”
Yep, another appropriate criticism, IMO.
“Joe Postma has posted a YouTube video rebutting my article. If you listen to him from 2:30 to 2:45, Joe refuses to accept that the S=1,370 W/m2 “solar constant” energy that is intercepted by the cross-sectional area of the Earth must then get spread out, over time, over the whole (top-of-atmosphere) surface area of Earth. [This why S gets divided by 4 in global average energy budget diagrams, it’s the difference between the area of a circle and the area of a sphere with the same radius.] I am at a loss for words how he can refuse to accept something that is so obviously true — it’s simple geometry. I stand by everything I have written here.”
Yep
I have successfully explained how Dr Spencer misrepresented Postma, and await your concession of that.
“I have successfully explained how Dr Spencer misrepresented Postma”
You presented your opinion.
I presented mine.
They are different.
So there is simply need to be an asshole.
“Joe refuses to accept that the S=1,370 W/m2 “solar constant” energy that is intercepted by the cross-sectional area of the Earth must then get spread out, over time, over the whole (top-of-atmosphere) surface area of Earth…”
Well now, that’s the thing, isn’t it? “Over time”. That’s what we’ve just been endlessly discussing, with Nate and others expressing the opinion that the “divided by four” number can be used as an instantaneous average for irradiance, and me pointing out that it can actually only be a spatial and temporal average. Seems Dr Spencer lets it slip here that it only works “over time”.
And, that’s possibly one of the reasons why Postma wrote this newer article, to explain what’s wrong with this “temporal averaging” approach.
Did you miss this part of my post?
“For the billionth time, no one is saying it is receiving energy over its entire surface area at once.”
Again you try to tell us what we all know that there is a diurnal cycle, and we should not be denying this reality.
Then, weirdly, you say it is not about the diurnal cycle.
But, it can also be a mathematical fact, that any instant in time, the spatial average global flux will be approx the same as the 24 hour average.
Now the main point of Roy is that the rants of Joe about Climate Scientists using a ‘Flat Earth’ model, which somehow was another reason to disbelieve in the GHE, was absurd.
Joe should know all about how science works. Initial models are simplified, like the ‘spherical cow’ approximation.
The 60 y history of climate models was Manabe in 1967 used his 1 D climate model to predict GW. Its pedictions were darn good. Its diagrams look like the ones in Joes article.
Why does it work? Because the key physics of the GHE was all there.
Still, Manabe went on to develop a full 3D model, the so-called General Circulation models that we use today. These are better, but require much more powerful computers than we had in 1967.
So there is no actual problem here. Joes complaints are about the decades old models, which did work well even with their simplifications.
They are still used to explain, simply, the physics of the GHE. Why that is a problem for Joe is unclear.
“For the billionth time, no one is saying it is receiving energy over its entire surface area at once.”
Nobody needs to “say it”, Nate. An instantaneous average in which the irradiance undergoes the “division by four” actually does it. The irradiance is spread over the entire surface area at once. Actions speak louder than words.
Gemini:
“The m2 (square meter) term in a zero-dimensional (0D) Earth model is directly related to the Earth’s total surface area and its energy budget.”
So now simply doing math causes things to happen to the world.
Nate’s given up on seeing sense.
“An instantaneous average in which the irradiance undergoes the “division by four” actually does it. The irradiance is spread over the entire surface area at once. Actions speak louder than words.”
Do I really need to explain why doing a particular average, doing that MATH, so as to learn something about the Earth, does not cause things to happen in the world?
To suggest otherwise is to be in desperation mode.
Do I really need to point out that I am not saying that maths causes things to happen in the real world? Dividing by four spreads the irradiance over the whole surface of the modelled world, at once. Gee whizz.
Not Gemini:
“An instantaneous average in which the irradiance undergoes the “division by four” actually does it [receiving energy].
Gemini:
“It’s a way of saying, “If you accept this mathematical process (‘division by four’), you are essentially forced to accept that it performs the physical action of receiving energy over the entire surface, but I deny that the physical action is actually performed in that manner.””
So, let’s try that again:
“For the billionth time, no one is saying it is receiving energy over its entire surface area at once.”
Nobody needs to “say it”, Nate. An instantaneous average in which the irradiance undergoes the “division by four” actually does it. The irradiance is spread over the entire surface area of the modelled world at once. Actions speak louder than words.
Not Gemini:
“Not “might be”, but “are”! 240 W/m^2 tells you that — if you multiply by the area for the object being illuminated — you get the total power to the object. At the total power into the object is an EXTREMELY valuable number.
For energy balance, your 480 W/m^2 is the useless information. Useless until you ALSO specify it is for half the surface, and FURTHER specific the remaining surface is 0 W/m^2.”
Gemini:
“This statement offers a strong perspective on the utility of irradiance (power per unit area) and its role in an energy balance calculation. It is fundamentally correct in its core message: For an energy balance, you need the total power (Watts), not just the irradiance (W/m²), and calculating the total power requires a clear understanding of the geometry and the irradiance distribution over the object’s entire surface.”
…indeed, a clear understanding, such as was demonstrated here:
https://www.drroyspencer.com/2025/10/uah-v6-1-global-temperature-update-for-september-2025-0-53-deg-c/#comment-1720024
which is where the discussion should have ended.
Gemini:
“The statement, “truly, there is nothing to be gained by using the 240 W/m$^2$ number,” is wrong because 240 W/m2 is a fundamental and critical value in climate science, representing the core of Earth’s global energy budget.”
Indeed, climate science, and its defenders, will go to the ends of the Earth to protect the 240 W/m^2 number, as we have seen. However, as an instantaneous average for irradiance, it is misleading at best.
Gemini:
“That statement is a classic piece of misdirection often employed by climate change deniers to attack a foundational, well-understood number in climate science. Scientists use the 240 W/m2 figure because for the planet to be in energy balance, it must emit 240 W/m2 of longwave (infrared) radiation back to space. The crank’s objection to the 240 W/m2 is an attempt to create an issue with the simplest energy budget calculation.”
The emitted flux ain’t the problem.
Gemini:
“This response can be accurately described as:
Moving the Goalposts: By rejecting the 240 W/m2 focus, the crank is forcing you to chase their (still unstated) “real” problem.
Obscurantism/Evasion: The crank is avoiding the direct, pointed critique of their use of the 240 W/m2 number without offering a substantive counter-argument or a clearer statement of their actual position.”
The problem has been thoroughly explained. Of course, you won’t have explained any of it to Gemini correctly, since you’re clueless.
Graham D. Warner returns to his old ways.
Another win for Team Science!
If you say so, Willard.
“For the billionth time, no one is saying it is receiving energy over its entire surface area at once.”
“Nobody needs to “say it”, Nate.”
Well, that is pretty much the definition of a strawman.
Knocking over a notion that your opponent has never claimed.
Then going through great contortions to try to turn that man of straw into a real man…
You don’t need to “claim it” when the “division by four”, for an instantaneous average, actually “does it”, Nate. You’re being utterly ridiculous.
False. Desperate.
Averages are just doing math to aid in understanding a problem. They are not changing ‘reality’.
Now keep making up bonkers things that math does, that it obviously does not do, and telling us that is what we believe.
Neither false, nor desperate, Nate.
https://www.drroyspencer.com/2025/10/uah-v6-1-global-temperature-update-for-september-2025-0-53-deg-c/#comment-1721475
https://www.drroyspencer.com/2025/10/uah-v6-1-global-temperature-update-for-september-2025-0-53-deg-c/#comment-1721506
So, they say “obviously we don’t think the Sun shines over the entire Earth’s surface at once”.
Of course not! What a preposterous idea.
Then, for an instantaneous average for irradiance, they do the “division by four”…which spreads the sunlight over the entire modelled Earth’s surface at once!
Then, when that’s pointed out, they cry “straw man”.
It’s like somebody getting caught speeding, then saying, “straw man, officer. I never claimed I was speeding”.
Yeah, you’re still going to get the ticket.
“Then, for an instantaneous average for irradiance, they do the “division by four”…which spreads the sunlight over the entire modelled Earth’s surface at once!”
Again, fror the infinitely slow learners, neither dividing by 4, nor dividing by 2, to derive averages, changes the distribution of sunlight over a hemisphere or both hemispheres of a modelled Earth.
But please do quote a climate scientist saying that is their intent when they average.
If not, we will know this is simply very dum strawman.
“Again, fror the infinitely slow learners, neither dividing by 4, nor dividing by 2, to derive averages, changes the distribution of sunlight over a hemisphere or both hemispheres of a modelled Earth.”
Of course it does! For an instantaneous average, dividing by 4 quite literally spreads (divides) the irradiance over the entire surface area of the modelled Earth, and the “at once” goes with the “instantaneous”.
“Of course it does! For an instantaneous average, dividing by 4 quite literally spreads (divides) the irradiance over the entire surface area of the modelled Earth, and the “at once” goes with the “instantaneous”.”
I see. So you are again employing your now classic tactic of redefing words to match your prior claims
Here it is redefining ‘spreads’ as ‘divides’.
No. Just no. Utterly stoopid.
Then we have the teenager redefinition of ‘quite literally’ to ‘not actually’.
Just stop while youre behind.
No quote no credit!
If you say so, Nate.
(Nate is currently gaslighting me, so is not worth responding to; but for anyone reading, the “division by 4” is just a shortcut for taking the total power received by the Earth and dividing it by 4piR^2, in other words the surface area of the entire planet. So, for an instantaneous average, that means that the irradiance is being applied to the entire surface area of the modelled planet at once. There is no question that’s what is being done, no matter how much Nate protests)
To find a global average is to incorporate all values at all locations, whether zero, low, or high into an equation.
So solar flux over the globe requires summing the contributions of all the regions, even those with very little or no sunlight, then doing division by the total area.
There is no need to artificially put sunlight into regions where it is zero, else, the calculation will be wrong!
You just can’t help repeating the same dum poppycock over an over again.
Why?
Nate keeps trying to gaslight me. No surprises there.
You have a completely unique extraordinary interpretation of what an average does. If Im the one gaslighting, then your interpretation must be just ordinary, and you could support that with evidence..ie other cases where your interpretation has been used.
So please show us just one example.
In your view averaging is spreading the sunlight to where it is not. Replacing the 0 or low values of flux, with presumably the average value.
So in your hemisphere case, what effect does taking the average have? Is it replacing the value at each location with 480 W/m2?
If not then your interpretation of average as ‘spreading’ somehow does not apply to a hemisphere.
Again, this is a contradiction.
11:43 pm: “… that means that the irradiance is being applied to the entire surface area of the modelled planet at once.”
No. The solar irradiance is being applied to the sun lit side (half of the system surface area) and rounded to zero for the star lit side (the other half). 240 in and 240 out when in energy balance for the thermodynamic control volume of the earthen system properly conserving energy flux.
Nate…you suffer from a complete disconnect between the maths you do and the physics it represents. Don’t try to make out you speak for anyone but yourself.
When you “divide by four”, it’s a shortcut for taking the total power received by the Earth, and dividing it by the total surface area of the Earth. Physically, that’s like saying the entire modelled Earth’s surface is receiving the irradiance. If it’s an instantaneous average, then that means it’s like saying the entire modelled Earth’s surface is receiving the irradiance at once!
When you “divide by two”, it’s a shortcut for taking the total power received by the Earth, and dividing it by the surface area of the lit hemisphere of the Earth. Physically, that’s like saying the lit hemisphere of the modelled Earth’s surface is receiving the irradiance. If it’s an instantaneous average, then that means it’s like saying the lit hemisphere of the modelled Earth’s surface is receiving the irradiance at once. Which it is!
Not Gemini, on October 6, 2025 at 12:45 PM
“…I won’t be bothering, this month.”
2:23 pm: “Physically, that’s like saying the entire modelled Earth’s surface is receiving the (solar) irradiance.”
No again. The solar irradiance is being applied to the sun lit side (half of the surface area) and irradiance rounded to zero for the star lit side (the other half). Measured 240 in and 240 out when in energy balance for the thermodynamic control volume of the earthen system properly conserving energy flux.
Agree to disagree.
“When you “divide by four”, it’s a shortcut for taking the total power received by the Earth, and dividing it by the total surface area of the Earth.”
Agreed.
“Physically, that’s like saying the entire modelled Earth’s surface is receiving the irradiance. If it’s an instantaneous average, then that means it’s like saying the entire modelled Earth’s surface is receiving the irradiance at once!”
That does not follow. That is not what an average means at all. Averages include zero values, they dont try to make them non-zero.
Seriously, I dont know where you get that crazy idea.
I have asked you to find another example in which average is interpreted that way. Can you?
“When you “divide by two”, it’s a shortcut for taking the total power received by the Earth, and dividing it by the surface area of the lit hemisphere of the Earth.”
Ok.
“Physically, that’s like saying the lit hemisphere of the modelled Earth’s surface is receiving the irradiance. If it’s an instantaneous average, then that means it’s like saying the lit hemisphere of the modelled Earth’s surface is receiving the irradiance at once. Which it is!”
But not 480 W/m2 applied everywhere in the hemisphere at once.
Because the hemisphere average says NOTHING about how the flux varies over the hemisphere.
Just as the global average says NOYHING about how the flux varies over the globe.
Whenver an average is calculated it tells us nothing about the variation of the values.
Nate, is energy flux conserved? Yes or no?
“Whenver an average is calculated it tells us nothing about the variation of the values.”
What on Earth makes you think I’m saying otherwise!?
You wanted another example. Let’s try this. In district A, there are 10 people living per square mile. In district B, there are 0 people living per square mile. The districts are the same size. You average between the two districts. Now you’re saying there are 5 people living per square mile in districts A and B combined. That’s spreading the number of people between the two districts. Right? Or how would you see it?
“You wanted another example. Let’s try this”
I was asking for an example of others using your interpretation of what averaging does.
” In district A, there are 10 people living per square mile. In district B, there are 0 people living per square mile. The districts are the same size. You average between the two districts. Now you’re saying there are 5 people living per square mile in districts A and B combined. That’s spreading the number of people between the two districts. Right? Or how would you see it?”
I would see it as calculating and reporting the population density of a county. No spreading involved. Nothing reported or implied about the distribution of people within the county.
In a rural Alaska county, there could certainly be many square miles with no residents. Yet there is no problem reporting the average population density of county.
This example serves to illustrate that we can and do include locations with values of 0 in averages.
There’s the reality, and there’s the “mental model”. I’m not arguing that averaging between the two districts changes the reality. Far from it. The reality is there is nobody living in District B. That reality might be very important to understand. When you average between the two districts, you might be misled, if just presented with the average, into thinking there were people living in District B. The average “spreads” the people living in District A into District B, as well. Not in reality. In your “mental model” on being presented with the average.
It has also “diluted” the true number of people living in District A. From the average alone, you might be surprised, on visiting District A, to find twice as many people living there, per square mile, than you had been led to believe.
Gemini:
“The UK has thousands of islands, many of which are completely uninhabited, especially in archipelagos like the Hebrides in Scotland. Large areas within National Parks across the UK, such as mountainous parts of the Lake District, the Peak District, and the Brecon Beacons, consist of open land, forests, and high moorland where no one permanently resides. On official population maps, certain large geographical features that are not land are often coded as zero population.”
No matter how simple I make it, they always find a way to miss the point. Oh well.
“That reality might be very important to understand”
Sure. Again, taking tbe average does not destroy information.
Back to the Earth, finding the global average flux does not deny the diurnal cycle.
I wonder if it’s ever occurred to Nate, how many politicians reading the IPCC reports and seeing the energy budget understand that it would be perfectly legitimate, in fact preferable, to express the irradiance for the Earth as 480 W/m^2 over the lit hemisphere? It doesn’t even seem to occur to many of the science literate commenters on this blog, let alone politicians…
The point is there is no actual problem here.
If there wasn’t a problem you guys would have stopped responding to me a long, long time ago.
Not Gemini:
“It’s beyond my control.”
Still responding!
On the contrary. You have been insisting for weeks that there is a problem with averaging flux globally, which was a Joe Postma fallacy.
No actual problem was identified.
No fallacy was identified. Astute readers following through the discussion carefully this month can see the refutation of the GHE that follows from his arguments. That you close your eyes and ears to it is to be expected.
Two weeks ago, not Gemini:
“Graham can’t succeed in overthrowing the greenhouse effect by only misstating trivial stuff, so perhaps he should own his silly motte-and-bailey.”
10:58 am: Informed, critical more astute long-time readers here do know DREMT has been duped by Joe Postma’s former comments and continuing to be duped by Clint R & Gordon.
The earthen GHE is measured at about 33K and backed theoretically with other instrumentation given the fact that Earth has a significant convective troposphere except at some arctic locations.
DREMT referring readers to a climate sophistry blog URL is laughable.
False. I am happy to have anyone review the discussion. See if they can find any actual logical problem.
“There’s the reality, and there’s the “mental model”. I’m not arguing that averaging between the two districts changes the reality. Far from it. he reality is there is nobody living in District B. That reality might be very important to understand. When you average between the two districts, you might be misled, if just presented with the average, into thinking there were people living in District B.”The average “spreads” the people living in District A into District B, as well. Not in reality. In your “mental model” on being presented with the average”
No spreading at all. The population density of counties is reported in a govt table somewhere. It is just a data point. There are plenty of such stats on government web sites.
It is absurd to suggest that reporting such data is misleading anyone. It is not saying or implying that the population is spread evenly!
If anybody has that ‘mental model’ they are seriously mentally deficient.
So this all just more desperate silliness.
They just can’t let it go. Nate now brings back the district A and B “population density” example, which was just making a very basic, irrefutable point. That point seems to have flown over Nate’s head, as usual. Oh well.
“I am happy to have anyone review the discussion…”
Me too. That’s why I post on a blog. However, a lot of the argumentation refuting the GHE has been completely ignored by Nate. Readers need to review all the comments under the article this month relating to Postma’s argument. Certainly not just my discussion with Nate. Nate only considers, and disputes, the parts of Postma’s argument that are not even controversial!
What an odd chap.
“population density” example, which was just making a very basic, irrefutable point.”
Ummm… I just refuted it.
It was not at all logical.
False, Nate. You didn’t even address the points made. One of them you left out from your quote entirely (the “dilution” point). The other one you seem to have “misunderstood”.
So if population density of counties or states is reported in a table somewhere, and there are plenty of such stats on government web sites, you are arguing that reporting such data is MISLEADING people.
Misleading them into thinking that every square mile of that county or state, has the same population density!
How can you not see how absurd that idea is?
You seem to lack understanding of the basic purpose of statistics.
An statistical average over a bunch of data is single number. There is no way a single number can tell you all of the values in that data set.
Nor is it intended to.
The average flux over a hemisphere is a single number, 480 W/m^2. It cannot tell you the flux values in any particular location, nor should it mislead anyone to think the flux is 480 W/m^2 everywhere in the hemisphere.
The average flux over the globe is a single number 240 W/m^2. it cannot tell you the flux values in any particular location, nor should it mislead anyone to think the flux is 240 W/m^2 everywhere.
The average flux over the globe is a single number
It’s a really simple point, Nate. If you were just presented with the statistic that in districts A and B combined there were 5 people per square mile, you would likely assume that there were people living in district B. If you were honest with yourself, you would accept that is a valid point.
Gemini:
“The assertion that 480 W/m$^2$ in and 240 W/m$^2$ out is a “better representation” for an instantaneous average is incorrect in the context of the zero-balance model. The former scenario (480 in / 240 out) is based on a misunderstanding of how the average incident flux is calculated for the sphere.”
“you would likely assume that there were people living in district B. If you were honest with yourself, you would accept that is a valid point”
Nobody was given misleading information. Abnormal psychology is a different topic.
Not going to be honest with yourself? OK, then.
Back to the actual scenario. The Earth receives 480 W/m^2 over the lit hemisphere, at any one moment. In the same moment, the Earth emits 240 W/m^2 from its entire surface area. 480 W/m^2 is higher intensity radiation than 240 W/m^2. To say the Earth receives 240 W/m^2 over its entire surface area at any one moment is not only misleading, it’s actually a dilution of the real intensity of the radiation received.
11:38 am: “The Earth receives 480 W/m^2…the Earth emits 240 W/m^2 …”
DREMT still doesn’t realize can’t properly use the same symbol m for an area half of the other symbol m. Funny; and true, after DREMT has been many times informed of his mistaken formula symbols.
240 into the earthen system control volume and 240 out of the earthen system control volume is how steady state long term equilibrium works in basic thermodynamics – of which DREMT continuously exhibits little comprehension.
Ball4 embarrasses himself yet again.
“To say the Earth receives 240 W/m^2 over its entire surface area at any one moment is not only misleading, it’s actually a dilution of the real intensity of the radiation received.”
Another strawman! Nobody is saying that. Ypu are a broken record.
They are clearly saying the global AVERAGE is 240 W/m2. Noone who understands what an average means will be misled to think it is recieving 240 W/m2 everywhere.
Anymore than saying the hemisphere average is 480 W/m2 will mislead people into thinking the 960 W/m2 peak is diluted to 480.
Yoor problem is that you need to learn to let go of ideas that dont work.
Nate, if the total power received by the Earth isn’t divided by the Earth’s total surface area then the number isn’t 240 W/m^2. You keep yelling “straw man”, but maths is maths.
Dividing by half of the Earth’s surface area is correct, for an instantaneous average, because at any one moment half of the Earth’s surface area is receiving the irradiance. Dividing by the entire Earth’s surface area is incorrect. There’s nothing you can do or say to gaslight me into thinking other than what I know to be true. So, give it up, and stop responding to me.
“Dividing by the entire Earth’s surface area is incorrect. There’s nothing you can do or say to gaslight me into thinking other than what I know to be true. So, give it up, and stop responding to me.”
If so, then dividing by half the Earths surface area is equally incorrect, because it will mislead people into thinking the flux is 480 W/m2 everywhere in the hemisphere.
Yet, this is your feeling, and here you confirm that all contradictory facts and logic and inconsistencies are to be ignored.
Because your problem is that once you latch onto a bad idea, you cannot let it go, no matter how absurd your rationalization needs to get.
No average is perfect, but 240 W/m^2 is not an option for an instantaneous average for irradiance, as I’ve comprehensively and successfully explained. Now, stamp your feet some more.
Gemini:
“The Motte-and-Bailey Tactic works as follows:
Advance the Bailey: Argue that climate scientists are fundamentally wrong or deceptive for using 240 W/m2.
Challenge Issued: When challenged with the actual calculation, the arguer retreats to the Motte by saying, “the sun only shines on one hemisphere”
Conflation: They then try to pretend that the simple, obvious truth of the Motte is what they meant all along, and that this somehow invalidates the scientific use of the 240 W/m2 figure.”
BS. There are parts of Postma’s arguments that are “controversial”. You could call these parts the “bailey” if you wanted. Then there are parts that are not “controversial”. You could call these parts the “motte”. One of the “motte” points is that 480 W/m^2 should be the instantaneous average for irradiance. Note that this isn’t even ruling out using 240 W/m^2 as a spatial and temporal average. It’s just the instantaneous average! One tiny little point…and you guys go berserk. You go absolutely bananas, to the ends of the Earth, pushing back on this silly “motte” point, that shouldn’t even be disputed, that we never even get round to discussing the “bailey”. That’s the truth of it. That’s on you guys.
“No average is perfect, but 240 W/m^2 is not an option for an instantaneous average for irradiance as I’ve comprehensively and successfully explained
This is a false assertion. Nowhere in this discussion did you support that claim with facts or sound logic.
Just your usual nonsense after youve again run out of answers and made a series of absurd arguments.
Everything’s been said, and not just on this sub-thread, far from it. All the arguments have been made. It’s done. Now we just get Nate and co. hanging around like a bad smell.
After bragging that this time he won’t get caught, Graham spends more than a month bickering over a boring motte. And when caught trying to injecting his silly bailey he once again rips off his shirt. He’s just upset that even Gemini can see through his cranky Jedi tricks.
Besides, Gemini:
“Deflection: Graham D. Warner is intentionally diverting the conversation’s focus away from his claims.
Red Herring: The introduction of Joe’s con acts as a red herring—an irrelevant topic brought in to distract the opponent from the main argument.”
Now we just get Nate and co. hanging around like a bad smell.
Gemini:
“A suggested response would be:
“Whether you enjoy our presence is irrelevant. The core of this discussion remains your silly motte-and-bailey, Graham. We are simply awaiting you acknowledging that Sky Dragon cranks have little else than dirty tricks. Until you address that you have been trolling this website for more than five years, your feelings or your irrelevant side-arguments will be ignored.””
You’re completely wrong though, Willard. I have discussed the “bailey” points of Postma’s argument. Just not with you and Nate, because you won’t move on from this “motte” point about the 480 W/m^2.
Graham’s gaslighting continues.
They continue to hang around like a bad smell…
Graham D. Warner sprinkles a little dehumanization now.
Such a charming English man.
False accusations mean the point is conceded. Great!
Gemini:
“The zero-dimensional (0D) model is the simplest in a hierarchy of climate models. More sophisticated models are built by adding spatial dimensions to increase accuracy and detail.”
Arkady says: “Any 480 W/m² “in” scenario implicitly assumes a very different geometry, one where the Sun is so close that its rays diverge significantly, which is not the case in reality.”
I must admit I don’t understand this comment.
960 W/m² implies a parallel beam of 1370 W/m^2 sunlight with about 30% reflected away.
480 W/m² implies that beam averaged a hemisphere.
240 W/m² implies that beam averaged a sphere.
I am having trouble picturing 480 W/m² due to a close, diverging beam.
Tim Folkerts.
“I am having trouble picturing 480 W/m² due to a close, diverging beam.”
My reasoning is as follows.
Standard Model:
(1-α)So(πR²) = (4πR²)σT^4
(1-α)So/4 = σT^4
240 = σT^4
Non-Standard Model:
(1-α)So(2πR²) = (4πR²)σT^4
(1-α)So/2 = σT^4
480 = σT^4
Also shown here: https://ibb.co/20nXwN9r
Arkady, that doesn’t clarify anything for me. To increase the total power delivered, you would need to illuminate the “back side” a bit. I am not sure how you expect to illuminate the back side with a CLOSER source.
Okay.
The Non-Standard Model increases the size of Earth’s shadow from that of the Standard Model; nothing to do with illuminating the night side.
Do you see that (1-α)So/2 ≫ (1-α)So/4 ?
The Math and the linked figure are very clear, I think.
One of the most elaborate straw men I’ve ever seen. So much effort has gone into creating it. The little diagram, and everything! Classic. I’m honoured that you would go to such lengths to misrepresent something as simple as the “480 W/m^2 in”. Truly remarkable.
Gemini:
“The figure of 480 W/m2 is being used in a calculation or argument that involves Earth’s hemispherical area”
Arkady, Yes, something divided by 2 is larger than something divided by 4. But your shadow drawing is not a valid argument for more flux hitting the sphere.
You could double the absorbed power by, for example…
* putting a second sun on the opposite side, so there is no night side.
* moving the sun 0.707 AU away, so the intensity, So, is 2x stronger.
If you instead move the source closer but also dim it so that So is constant, you will intercept LESS flux. Look at this diagram. For a light source at “B” providing So to the surface, the intercepted area is the circle around “A”, not the area of some shadow somewhere behind the sphere.
https://undergroundmathematics.org/thinking-about-geometry/r9694/images/diagram-labelled.png
“your shadow drawing is not a valid argument for more flux hitting the sphere.”
Exactly my point!
Thanks.
“960 W/m² implies a parallel beam of 1370 W/m^2 sunlight with about 30% reflected away.
480 W/m² implies that beam averaged a hemisphere.
240 W/m² implies that beam averaged a sphere.”
Yes, it’s pretty straightforward. No need for elaborate straw men.
At any one moment, the Earth does not receive the sunlight over its entire surface area. “480 W/m^2 in” reflects that fact. “240 W/m^2” in does not, in any way, shape, or form, reflect that fact.
Gemini:
“The final equation in an Energy Balance Model (EBM) is an equality for a unit surface area.”
At any one moment, the Earth does not receive the sunlight over its entire surface area. “480 W/m^2 in” reflects that fact. “240 W/m^2 in” does not, in any way, shape, or form, reflect that fact.
Gemini:
“The Earth is receiving slightly more energy from the Sun than it is radiating back into space due to the increase in greenhouse gases. This small, persistent excess energy is what is accumulating as heat in the oceans, land, and atmosphere, causing the planet to warm.”
#2
At any one moment, the Earth does not receive the sunlight over its entire surface area. “480 W/m^2 in” reflects that fact. “240 W/m^2 in” does not, in any way, shape, or form, reflect that fact.
No, does NOT reflect that fact, DREMT 1:13 am, since “480 W/m^2 in” is over only half the Earth’s surface so 240 in and 240 out of Earth’s entire surface area.
Whenever DREMT comments, an informed reader has to watch the physics pea under DREMT’s shell very closely.
DREMT makes this mistake not realizing energy flux is always conserved, in any way, shape, or form to reflect that fact.
Beast of sophistry, begone.
“At any one moment, the Earth does not receive the sunlight over its entire surface area.”
Again, to suggest this is a revelation is silly.
Yet, the global average requires dividing input power by the global surface area.
For this to be a problem requires there to be an actual negative consequence.
None have been found.
Nate quotes me:
“At any one moment, the Earth does not receive the sunlight over its entire surface area.”
And chirrups:
“Again, to suggest this is a revelation is silly.”
OK, so he’s onboard with reality…but then:
“Yet, the global average requires dividing input power by the global surface area.”
Oh dear, he’s no longer onboard with reality! He still wants the instantaneous average to be 240 W/m^2. He can’t just be content with the 240 W/m^2 being a spatial and temporal average. Like a spoiled child, Nate wants everything his own way!
“He still wants the instantaneous average to be 240 W/m^2.”
No wanting. It is just a mathematical fact.
“He can’t just be content with the 240 W/m^2 being a spatial and temporal average. Like a spoiled child, Nate wants everything his own way!”
I am content to USE that fact. I see no need, as you seem to, to deny the other fact…the two facts are not mutually exclusive!
#3
At any one moment, the Earth does not receive the sunlight over its entire surface area. “480 W/m^2 in” reflects that fact. “240 W/m^2 in” does not, in any way, shape, or form, reflect that fact.
Wrong for third time DREMT 1:10pm the 480 is temporal (per sec.) and spatial (per m^2) over half the Earth surface so 240 in and 240 out over entire surface area is the correct balance. DREMT is yet again off by a factor of 2 since energy flux is conserved in thermodynamic control volumes. Humorous how DREMT keeps getting this obvious fact wrong.
Ball4’s reading comprehension fails him again.
I said that the “480 W/m^2 in” better reflects the fact that the sunlight doesn’t fall over the entire Earth’s surface area at once. So, I’m openly acknowledging that it’s an average for the lit hemisphere. That’s the point.
Gemini:
“The crank is mistaken if they are trying to use 480 W/m2 directly in the standard calculation for Te. The globally averaged solar insolation of ≈240 W/m2 is the correct value for this specific calculation. If they mistakenly plug ≈480 W/m2 into the S-B law as the outgoing power per unit area (σTe4), you would calculate a much higher effective temperature.”
Let’s hope it’s not trying to make Puffman sad.
Kids these days…
Today a bit of daily info about sea ice extent at both Poles.
1. Absolute data
1.1 Arctic
https://drive.google.com/file/d/1J9kx750_CtARv4sKfXBddRnkZm3E2U4v/view
1.2 Antarctic
https://drive.google.com/file/d/1BY_ACQnX5hfQbvPAih6YTzsYEISTatTO/view
*
As always, many prefer looking at absolute data; but it is no easy to see, in a 365 day chart, how far away from the mean of 1981-2010 the extent has been during the current year.
*
2. ‘Anomaly’ data
Obtained by subtracting for each day d in each year y, the value of the same day d30 in the daily means for 1981-2010 (the normals) from the value of d in y, thus removing the annual cycle.
{ The Robertson ignoramus has never understood this concept: He genuinely believes that NOAA’s trivial explanation to the inexperienced public would describe the exact procedure. }
2.1 Arctic
https://drive.google.com/file/d/1QBlh325tHF-4NRlWsHf_6sgskO_ipyse/view
2.2 Antarctic
https://drive.google.com/file/d/1PdqOctb7zaMgvdMdX2sId1g_o7U13mM-/view
*
3. Finally, a look at the global sum of 2.1 and 2.2:
3.1 Absolute
https://drive.google.com/file/d/1srcqo5JwpPsfCGMbRnbnGVq2JLxq-m3Y/view
This chart looks a bit strange, as it represents the sum of two complementary datasets.
3.2 ‘Anomaly’ data
https://drive.google.com/file/d/1DnrnCfQjICj21o1gOeFMbMI1xsF0nZoj/view
Nothing to scare about; we are – in my layman’s opinion, of course – far away from a dramatic sea ice loss situation.
Conversely, we are also far from the supposedly imminent recovery of sea ice everywhere, which is so often claimed by ‘interested’ pseudo-skeptics: we are currently at 3.5 Mkm^2 on mid October for the Globe, what is quite respectable, as is shown by graph 3.2.
It’s always funny to read things like:
” Hate to tell you Bindidon but all the months demonstrate a dramatic flattening of the decline in sea ice. ”
The Hunter boy was speaking about Arctic sea ice in September.
He doesn’t need to tell me anything about sea ice: I download its data from two sources since about 10 years.
I guess he never did and won’t ever; but he nonetheless always knows everything better; that’s the hallmark of the retired elementary school teacher :–)
Today, let’s look beyond the Arctic and take a look at global sea ice, and leave the daily corner to monthly data.
Here are the ten lowest records of the monthly global sea ice extent data for September:
2024 20.69 (Mkm^2)
2023 21.18
2025 22.39
2022 22.59
2016 22.68
2019 22.69
2017 22.73
2018 22.75
2020 22.77
2012 22.78
*
The 1981-2010 mean is with 24.90 km^2 at position 28 in the sort, just above 1994. This does not mean however that a return to more sea ice couldn’t happen in a near future: at position 27 in the list, we namely find… 2013.
*
Here is a chart comparing absolute sea ice extent data in the Arctic, the Antarctic and for the whole Globe:
https://drive.google.com/file/d/1PjYVPnEn62uSwtG7Nw_eTFtorNribnM3/view
Source of all the stuff:
https://masie_web.apps.nsidc.org/pub/DATASETS/NOAA/G02135/
Bindidon says:
”Today, let’s look beyond the Arctic and take a look at global sea ice, and leave the daily corner to monthly data.”
Mr. Po Datahead instead of acknowledging the point regarding a couple decades of alarmist warnings of imminent disaster in The Arctic consults his datasets and regales us with a dataset that merely demonstrates minor changes in ice levels that would seem to fit well within the boundaries of a natural variation seen in ice core deposits.
Just the type of response one would expect from a narcissist. Bindeadon comes through yet again.
Hunter boy
You behave like a little, stubborn and coleric 12-year old child. That’s why I name you ‘Hunter boy’.
Firstly, this information was not directed to you but rather to those who understand what I learned, use and mean. Neither do you.
*
Secondly, you were the one who pointed on September 2025 whixch showed the highest summer sea ice extent level in the Arctic since a decade or so.
Thirdly, you are inexperienced in puncto climate lime series – be it UAH or anything else – that you even did not see that I published above absolute data, which is always flatter then if anomaly-based.
You post about climate exactly like you wrt the Moon’s motions: zero technical skill, zero science.
The topic I was discussing Bindidon was the summer ice extent issue where graphic artists like you were prophesizing a significant loss of summer ice resulting in zero summer ice and the extinction of polar bears from drowning while desperately swimming to find an ice patty to rest upon being used to extract money from elderly dowagers. This hasn’t been occurring for an adequate period of time to DECLARE the climate is changing by your own standards.
Where is your graph on that Bindidon? After all it’s the only topic I brought up here. Why are you so desperately avoiding it to the extent of trying to change the discussion?
Oh I forgot to show you more of the alarmistic corner, this time starting in 1951:
https://drive.google.com/file/d/1ebdqPl_tmxazXAMchHEU87zVvvPdonef/view
Have some fun!
angech….”If your comment was right, then by the same logic more of the surface is covered by darkness per rotation as well.
The warmth due to faster rotation is due to the phenomenon of
Stefan-Boltzmann law, statement that the total radiant heat power emitted from a surface is proportional to the fourth power of its absolute temperature”.
***
S-B does not deal with heat, it deals only with EM. The related heat is lost as the EM is created and S-B is concerned only with the intensity of EM radiated. EM is produced when electrons in atoms of a surface drop from a higher energy level to a lower energy level. Since the higher energy level represents a higher KE for the electrons, it also represents a macro-level increase in heat. When the electrons drop back to a lower orbital level, the KE, hence heat, is converted to EM at the angular frequency of the orbiting electrons and the gained heat is lost completely.
As to the effect of a planet’s angular speed on temperature, let’s begin with the Moon which does not rotate locally at all. The Moon’s near side always points inwardly at the Earth. When the Moon is between the Earth and the Sun, the far side gets continuous sunlight for 14 days of the Moon’s 28 day orbital cycle. The far side’s average temperature is +127C during that period. When Earth is between the Moon and the Sun, the lunar near side gets perpetual sunlight, and the far side has an average temperature of -133C.
That range of -133C to +128C gives us an example of a planetary body that does not rotate at all. It’s mathematical average over one orbit is -6C whereas a faster rotating planet like Earth, with an extensive atmosphere, and oceans, has a mathematical average of +15C. Whereas the lunar average is an average of extremes and not that reliable it does demonstrate that a body that does not rotate on a local axis is cooler overall despite the extremes in temperature.
Your argument is based on the amount of time in the unlit state but you must consider the rate of heat dissipation versus the rate of heat intake on the lit side. The rate at which radiation in the IR spectrum is lost is 1/260th of the rate it is lost due to direct conduction to the atmosphere touching the surface. That figure comes from the work of studies done using the Pyrani gauge by Tom Shula.
https://tomn.substack.com/p/tom-shula-a-novel-perspective-on
It means that the rate of heat dissipation is much lower than the rate of heat creation from solar EM. Ergo, any heat created will be radiated on the unlit side much slower than it was created. Also, much of the created heat will be absorbed by the atmosphere and retained for a period of time.
This explains the so-called GHE far better than a trace gas.
It stands to reason that a faster rotating planet will expose more surface area to solar energy and have less time to dissipate the heat acquired before the solar warming cycle begins again.
Of course all this depends on several factors as well, such as the composition and thickness of an atmosphere, the native surface temperature, perhaps due to internal heat sources, etc.
binny…”People like Robertson (see his “Azov Battalion” syndrome), but also many young Russians who celebrated the end of World War II in Moscow on May 9 of this year, truly believe that Russia is fighting in Ukraine a country full of Nazis, just as it fought against Hitler’s SS henchmen and the Wehrmacht in World War II”.
***
Robertson bases his critique of the Ukraine on fact. Anyone interested might look up Oliver Stone’s video on the Net ‘Ukraine on Fire’. I was skeptical when I first watched the video and I tried to verify each controversial claim the video made. It proved accurate.
There were outright Nazi supporters in the Ukraine during WW II and they justified their eager participation on a means to free the Ukraine. Some Ukrainians stepped overboard and participated in the atrocities against Jews and other minorities targeted by the Nazis.
One of them was Stepan Bandera, a co-leader of the infamous UON, a group of Ukrainians white supremacists formed in 1929 while the Ukraine was a Russian soviet. Their petty actions against Stalin, a monster, got him so peeved that he started a famine in the Ukraine that wiped out many poor Ukrainians.
Another was the SS Galicia, a battalion of Ukrainians who fought freely for the Nazis. I say ‘freely’ because some nationalities were pressed into action at the risk of their lives if they reneged.
Both Bandera and the SS Galacia are feted each year in a candlelight vigil in the Ukraine and it was passed into law in 2016 that such Nazi collaborators be honoured in the Ukraine. I have no idea how many Ukrainians are involved in this lunacy and I am not trying to tar the entire country. However, if peace is to be attained in the Ukraine, something has to e done about the unrest created by out and out white supremacists who are armed.
The Azov battalion was sanctioned by the US Congress due to their Nazi associations. Their flag was based on a Nazi SS insignia and many of the soldiers openly wore the swastika tattooed on their bodies.
In 2012, when an internationally approved president was elected in the Ukraine, things went swimmingly till the president selected an economic package offered by Russia over the EU, whose offer was claimed by the president to involve cutbacks for ordinary Ukrainians. As a result, some Ukrainians revolted in a peaceful demonstration that turned ugly when Ukrainian nationalists got involved with arms and ran the president off.
When a president for whom they had voted was run off in a coup, native Russians trapped in the Ukraine, some 18 million, in the Donbass region, revolted. The ordinary army could not deal with them and Azov was sent in, committing atrocities. When that came to the attention of Putin, he took Crimea in retaliation but no move was made to invade the Ukraine.
We don’t hear of any of this through the Western media, who present the Ukraine as an innocent nation striving for democracy and being bullied by Russia.
The atrocities continued and the native Russians continued to fight back. Zelensky promised to fix the problem and made it worse. During the process he stifled the media and essentially became a dictator.
After 8 years of that, Putin lost it and invaded. As he put it, and I don’t know if he can be trusted, he only wanted to give the Russians a chance to vote on their future. He also wanted to get rid of Azov, which he did immediately. Russia has never tried to move further into the Ukraine than the Donbass region, lending credence to their claim they had no interest in taking over the country.
We won’t know till the violence is settled and meantime, NATO and the media are doing its best, using propaganda, to engage us in a nuclear war. Binny should e more careful with what it is he wishes for since he is essentially next door to Russia and one nuke will take most of Germany out.
That’s my concern. We should be talking to Putin seriously whereas all we are accomplishing is fanning the fires of a potentially disastrous nuclear war.
From ChatGPT:
Putin is a murderer. He’s “liberating” people that don’t want to be liberated. IOW, he’s trying to take over Ukraine.
christos…”The EM energy is not heat. When hitting a surface (matter) the EM energy is not heat.
There an interaction process occurs.
When interacting, the matter doesn’t permit the EM energy in. What matter spontaneously does is to emit EM energy, not to absorb EM energy.
Matter is able to absorb energy only when the energy is in form of heat (by conduction and convection)”.
***
Let’s explore this together.
My version…open to amendment.
According to Neils Bohr, circa 1913, electrons in atoms that make up a surface absorb EM energy and convert it to heat. Electrons that are in a normal orbital energy level in any atom are in the ‘ground state’. If they have moved to a higher orbital energy level, they are said to be excited, a temporary condition before falling back to a lower orbital energy level.
An electron in an excited state that is still orbiting an atomic nucleus, has gained kinetic energy. That gain in KE for all atoms of affected mass, is considered to be heat. The KE level of the electrons can be raised by adding heat to the mass, absorbing EM of the proper frequency from a hotter source, or by simply increasing the pressure on the mass.
If the excited electron drops back to a lower orbital energy level, not necessarily all the way to ground state, it must give up the KE it gained earlier to become excited. That means the electrons dropping back en masse lose heat. They do so by converting the KE to EM, which it radiates away at a specific frequency. If it drops only a few energy levels it emits IR and if it drops more energy levels the frequency of EM it radiates has a progressively higher frequency.
In hydrogen, for example, an electron can gain up to 7 orbital energy levels. If it drops back from level 7 to 4, or in between, it emits IR. If it drops all the way to ground state from level 7, it emits UV. The temperature of the hydrogen will have a decisive factor on the frequencies emitted.
Of course, EM radiation is only a surface feature since interior electrons in a mass do not radiate EM. Rather, they transfer any heat gained via electrons to other atoms.
I think that answers an earlier question you pose re why heat is lost as it penetrates further into a mass like the Earth’s surface. Each mass has a specific thermal resistance which is the inverse of its conductance.
Fourier stated the heat flow equation as…
dq/dt = [k.A.(Th – Tl)]/l
where…
dq/dt = instantaneous rate of heat flow
k = thermal conductivity of the material
A = cross-sectional area
Th = hot temperature in a gradient
Tl = low temperature in a gradient
l = length
Integrating this equation should give the total heat conducted and its obvious the amount is dependent on the temperature differential and the thickness of the mass.
Gordon,
So we agree, that the excess heat is what affects the climate, and not the greenhouse effect itself.
The solar energy is not heat. Only a portion of the incoming solar energy is transformed into heat, and that heat is what the planet surface absorbs.
The Rotational Warming Phenomenon describes the mechanism a planet with a higher the (N*cp) product is capable to absorb more solar energy in form of heat.
–
https://www.cristos-vournas.com
Still pushing BS uphill?
Nobody believes your arbitrary fudge factor FI (=1 or 0.47) which you have subjectively defined.
Very unscientific – as can be expected from skeptics.
Climate alarmists and Climate skeptics argue about the role of the greenhouse gasses in the Earth’s temperature.
Alarmists claim it is the GHG that cause a temperature rise.
Skeptics do not agree – they claim the temperature rise is due to other reasons.
But both, alarmists and skeptics follow the same mistaken concept, they mutually claim that it is the atmosphere – in the first place – it is the atmosphere which warms Earth’s surface, they mutually claim that atmosphere acts as a kind of a protective blanket.
And, it is a mistaken concept.
–
https://www.cristos-vournas.com
BACK AT THE RANCH
Colombian president says US military struck Colombian boat, killed his citizens
https://abcnews.go.com/International/colombian-president-us-military-struck-colombian-boat-killed/story?id=126348450
Let’s hope the pilots who did this did not wear crowns.
There’s only one KING!
The disgusting, dirty Trump~ing boy throws feces at peaceful protesters from his fighter jet:
https://www.n-tv.de/politik/Trump-kontert-Proteste-mit-KI-Videos-als-Koenig-article26106163.html
But I suspect millions of MAGA-obsessed Trumpistas applauded him joyfully and loudly.
You can’t fall any lower.
You left out the best part, Bindi. Trump was wearing a crown!
He really knows how to trigger Leftists.
What you kids don’t understand is that people wouldn’t be allowed to freely protest like this under a king/dictator. The (paid-for) crowd proves themselves wrong!
Hey Puffman, riddle me this –
Tennessee native Josh Abbotoy heads RidgeRunner. Abbotoy also is managing partner at New Founding, the conservative venture capital firm backing the Highland Rim Project.
Abbotoy is a later addition to New Founding. The company was started by Nate Fischer, the current CEO, and Matthew Peterson, who left New Founding for Glenn Beck’s Blaze Media. They each received financial assistance from the Claremont Institute, a right-wing think tank where Peterson was vice president for education and founder of the influential journal American Mind, aimed at young conservatives. Both Fischer and Abbotoy were Lincoln Fellows at Claremont.
https://baptistnews.com/article/the-far-right-is-building-aligned-communities-while-looking-for-a-red-caesar/
How come the Claremont Institute does not think it’s a joke, and actually is wishing for a Red Caesar?
It certainly is amazing that a 79 year-old, president no less, can behave like a naughty 10 year-old. MAGAS may laugh, but it is just another sign of the decline of the USA. Mark my words, there is more (and worse) to come.
Yes PP, USA has been in decline. MAGA is all about reversing that.
It’s only going to get worse for the cult kids. Reality can be harsh teacher.
Hey Puffman, riddle me this –
Colombian public media reports that a U.S. military strike on a boat on September 15—the second attack on a vessel by the U.S. in the Caribbean that we’re aware of—was a Colombian boat and was in Colombian territorial waters.
At least one of the three victims extrajudicially killed in the strike was Colombian lifelong fisherman Alejandro Carranza.
Alejandro’s identity is confirmed by his cousin.
The Colombian boat was adrift and had its distress signal up due to an engine failure.
https://bsky.app/profile/gabriellehecht.bsky.social/post/3m3kgxgwrf22b
Is this how teh Donald will make the US of A win again?
christos….”Gordon,
So we agree, that the excess heat is what affects the climate, and not the greenhouse effect itself.
The solar energy is not heat. Only a portion of the incoming solar energy is transformed into heat, and that heat is what the planet surface absorbs”.
***
In English, a misnomer is defined by Merriam-Webster as “a use of a wrong or inappropriate name”.
There is nothing more wrong, or inappropriate, as the misuse of the name ‘greenhouse effect’ to describe warming in the atmosphere. The GHE suggests that the atmosphere is warmer than it should be due to the same effect that warms a greenhouse.
This misinformation, which is now chicanery, is based on a misunderstanding dating back to the 19th century. In those days, no one knew anything about the structure of atoms or the relationship between electrons in those atoms and electromagnetic energy. It was presumed in those days that heat moved through the atmosphere as ‘heat rays’ and the concept of heat rays has been confused, in modern times, with the trapping of heat, when IR is trapped by glass in a real greenhouse.
Trapping IR in a real greenhouse has nothing to do with the warming of the air inside the greenhouse. The warming is all due to air molecules being warmed by infrastructure, soil, vegetation, being warmed by solar energy. When the air is warmed, the molecules become agitated and that is heat. Heated air must rise and as it does, the heated air is trapped by the glass ceiling and walls.
Warming in a real greenhouse is due to a blocking of natural convection by the glass. Modern greenhouses are cooled by opening vents in the ceilings and walls, allowing a certain amount of heat to escape, to control temperature. There is no such mechanism in the atmosphere itself and the action that does produce warming has nothing to do with blocking convection. In fact, air convection, as in rising, heated air, is seldom blocked.
Yes, we agree that any excess heat is due to other causes and not to a fictitious greenhouse effect. If the Earth had no oceans and no atmosphere, with its current rate of rotation, it would be cooler than the Moon, even though both are exposed to a similar amount of solar radiation.
I also agree that only a portion of incoming solar is converted to heat. Anything reflected from the surface or the atmosphere is not converted.
Foundational knowledge functions much like the structural base of a building; it is essential yet often overlooked. It bears the weight of all subsequent understanding and therefore requires periodic examination to confirm its integrity and to prevent unnoticed issues from compromising the entire structure.
Sorry Ark, but you’re STILL making the same mistakes. Just making “calculations” without the correct physics ain’t science.
You need to show how CO2’s 15μ photons can warm a 288k surface. And you can’t do that!
Now crawl back under your bed before the kings find you….
I see you are still banging on about magical 15μ photons that apparently “know” their source temperature. I bet you believe in unicorns too.
Child sb, making false accusations only demonstrates your immaturity and ignorance.
Please continue.
The spectrum of wavelengths emitted by black bodies at temperatures of 235k and 288K include photons of 15 microns.
Do the 15-micron photons originating from a 288K surface not warm a secondary 288K surface? If so, why would a 15-micron photon from a surface with a different temperature not also warm the same 288K surface?
Good question, Donald. It’s a good question because it hits directly at the crux of the problem — very few people understand the basic physics.
All of “climate science” seems to ignore the basic physics. The CO2 nonsense is all about increasing temperature, right? But none of the hoax promoters understands what temperature is, let alone what is required to raise temperature.
Start with an understanding of “temperature”:
Next, it’s necessary to understand what is required to raise temperature:
“It HAS TO BE the right kind of energy..” !!
FFS. What a load of garbage. You haven’t yet explained, despite numerous requests to do so, how to distinguish between a 15μ photon from CO2 and one coming from the sun.
Are you still ignorant about Wien’s Law?
Talk about delinquent.
All this proves is that Manabe and Strickler are a couple of cranks. We already knew that after they were exposed by Gerlich and Tscheuschner. G&T pointed out that none of their claims have been scientifically verified.
M&S are claiming in essence that a trace gas is causing a 10C warming in the atmosphere, a claim not backed by any known science. Such a claim defies the Ideal gas Law and the heat diffusion equation.
Heat diffusion is a reference to the ease with which heat moves through a substance. It’s known that air itself has a low conduction factor so why should a trace gas have the ability to transfer large amounts of heat?
That is emphasized better when the trace gas, CO2, makes up only 0.06% by mass of the entire atmosphere. The Ideal Gas Law tells us, for a constant volume, that the 0.06% mass translates to a warming of no more than 0.06C in the transfer of heat to the rest of the atmosphere.
From wiki…
Heat diffusivity = alpha = k/p.Cp
where k = thermal conductivity (W/m-K)
p = density (K/m^3)
Cp = specific heat capacity(J/Kg.K)
For anyone interested there is an excellent example of heat diffusivity calculation for the atmosphere in their paper (pages bottom 6 to 10) at the following link.
https://arxiv.org/PS_cache/arxiv/pdf/0707/0707.1161v4.pdf
One thing that stands out with those critical of G&T is the complete lack of scientific rebuttals. Any critiques have been abysmally rhetorical and lacking substance.
An example, when Halpern et al (Eli Rabbet) rebutted G&T, at one point they claimed that G&T’s use of the 2nd law suggested one body of two bodies radiating at each other was not radiating. They based that on the mistaken assumption that heat had to be transferred between two bodies at different temperatures, an assumption that is prevalent in climate alarm theory.
The 2nd law is clear and G&T used it correctly. In a rebuttal they pointed out that in a heat transfer, heat is the energy being transferred and that the only way to sum heats in a transfer is to sum heat quantities based on the 2nd law (that is, heat can only be transferred by its own means hot to cold). It is not permissible to mix EM with heat in the sum, based on an incorrect assumption that EM will produce heat in a hotter body when radiated from a cooler body.
Another giant F.
SOLAR MINIMUM UPDATE
For decades, state and federal officials have been warning about the kind of catastrophic damage wrought by the storm that hit Western Alaska over the weekend.
But those predictions, along with hundreds of millions of dollars in federal funding for mitigation efforts, were not enough to prevent dozens of homes from floating away when struck with the remnants of Typhoon Halong, leaving one person dead and hundreds in emergency shelters.
https://www.adn.com/alaska-news/rural-alaska/2025/10/16/officials-for-years-knew-about-flood-risks-in-rural-alaska-the-recent-storm-illustrated-how-little-they-have-to-show-for-it/
Drill, baby Donald, drill!
The 2009 Gerlich & Tscheuschner paper (GT09) has been scientifically debunked in the peer-reviewed literature (https://www.worldscientific.com/doi/10.1142/S021797921005555X), as well as in several excellent technical blogs.
This paper has been justifiably disregarded. None of its principal conclusions are substantiated or valid. Its overall quality falls well below the standards expected of a scientific publication, and its acceptance for publication is, at best, surprising.
GT09 appears to be structured mainly around disputing claims drawn from popular science sources, encyclopedias, and early twentieth-century writings, while showing little awareness of, or engagement with, the contemporary academic literature in climate science.
The paper relies on careless verbal reasoning and unsuitable examples that distort others’ arguments through a misapplication of basic thermodynamic principles.
Another recurring tactic is to claim that the subject is “too complex to be knowable,” using this as a pretext to dismiss legitimate efforts to establish a coherent body of knowledge.
Most critically, the paper’s conclusions are demonstrably inconsistent with observed reality.
The authors devote 18 pages to the physics of actual greenhouses, seemingly unaware that the term “greenhouse effect” is metaphorical and not meant to imply that the atmosphere operates identically to a physical greenhouse. While they correctly note certain differences, they overlook the essential point where the metaphor remains valid: in both cases, sunlight provides a continuous energy input, and in both, a mechanism slows the escape of heat, producing a rise in temperature as a result.
Ark, the reason people find it hard to debunk the GHE nonsense is because it’s a moving target. For example, can you state your definition/description of the GHE nonsense?
You can’t!
The reason why people find it hard to debunk “Earth is a sphere” nonsense is because it’s a moving target.
The same with the composition of the moon. It’s so hard these day to prove it is made of green cheese.
https://tinyurl.com/fpnk72ba
The seasons numbers are in. Looks like a significant recovery in ozone levels.
I expect cooling sea surface temps to follow
SOLAR MINIMUM UPDATE
Even as the federal government attempts to prop up the waning coal industry, New England’s last coal-fired power plant has ceased operations three years ahead of its planned retirement date. The closure of the New Hampshire facility paves the way for its owner to press ahead with an initiative to transform the site into a clean energy complex including solar panels and battery storage systems.
https://grist.org/energy/new-englands-final-coal-plant-shuts-down-years-ahead-of-schedule/
Should the DOE give Donald 250M like the DOJ intends to do?
Robertson’s lies about Russian aggression against Ukraine are unimaginable and just as disgusting as those of Russian Foreign Minister Sergei Viktorovich Lavrov, who two days ago brazenly repeated that Russia could not stop its “special operation” until Ukraine was completely “denazified.”
Robertson’s pro-Putin small talk about Russian aggression is exactly what French, Italian, and German neo-Nazis have been saying for years, especially on Telegram and Instagram.
It has been known for years that Russia funds all of these European far-right activities as often as possible. The goal is clear: destabilization.
*
I have responded to his incredible lies at least once, but Robertson doesn’t bother with replies to his posts (no matter what they were about), discards all those replies, and starts his lies all over again.
*
But it’s not just this “denazification lie” that should be emphasized; The other, no less relevant, claim is that Russia simply wanted to liberate the Russian-speaking regions of eastern Ukraine from Ukrainian oppression.
The worst thing about this Russian lie is that it is gradually becoming clear that what was already suspected is bitter reality: several hundred Ukrainians living in the east of the country, who openly speak out and demonstrate against the Russian siege, have been forcibly recruited by Russia over the past two years to fight against their own countrymen.
*
I previously posted a link to a 2022 article in the French newspaper Le Monde, which featured an interactive image showing how Russia started a war it thought it could win within three days.
Anyone can see that Russia’s invasion streams came not only from the east, but also from the north, with one attempt even to immediately capture Kyiv:
https://www.lemonde.fr/les-decodeurs/article/2022/03/02/guerre-en-ukraine-suivez-en-carte-l-evolution-de-l-invasion-russe-au-jour-le-jour_6115863_4355770.html
A more recent graphic shows the aggression from the beginning until October 2025:
https://www.lemonde.fr/les-decodeurs/article/2022/05/11/invasion-de-l-ukraine-en-cartes-l-evolution-des-combats-semaine-apres-semaine_6125591_4355770.html
*
The best part of Robertson’s infamous stories is that on May 9 of this year, the Russian nomenklatura declared that Ukraine did not exist as an independent country: it had always been part of Russia and would soon become so again.
*
What Putin, Medwedew, Lavrow, Pesky and their nearest acolytes in Moscow want is simply the re-establishment of the CCCP, i.e., the USSR.
In a paragraph above, I wrote incorrectly:
” The worst thing about this Russian lie is that it is gradually becoming clear that what was already suspected is bitter reality: several hundred Ukrainians living in the east of the country, who openly speak out and demonstrate against the Russian siege, have been forcibly recruited by Russia over the past two years to fight against their own countrymen. ”
Should read
” The worst thing about this Russian lie is that it is gradually becoming clear that what was already suspected is bitter reality: several hundred thousand Ukrainians living in the east/south of the country, who openly speak out and demonstrate against the Russian siege, have been forcibly recruited by Russia over the past two years to fight against their own countrymen.
These recruited Ukrainians are of course considered ‘Russians’ by Russia since it has illegally and unilaterally annected Ukraine’s eastern and southern regions. “
Perception vs Energy Conservation: it’s like they speak a different language!
Physics requires energy conservation over the entire object, not only the lit part. “Skeptics” see sunlight illuminating a disk of area πR² and assume that the rest of the sphere somehow “does not count.” But the laws of physics require that what is absorbed by the illuminated portion must, in steady state, be balanced by emission from the entire planet’s surface area, 4πR².
If I asked: if a tree falls in the forest and there is no one around to hear it, does it make a sound? I can guess with 99.99% certainty what the skeptics’ answer would be. Their reasoning often stops at perception, not physics.
Poor Arkady still hasn’t got over losing the argument.
Ark lives under his bed, hiding from the kings. About once a day, he emerges to demonstrate his ignorance of science. Here, he’s STILL confusing flux with energy.
They just can’t learn….
Arkady,
“Physics requires energy conservation over the entire object, not only the lit part. “Skeptics” see sunlight illuminating a disk of area πR² and assume that the rest of the sphere somehow “does not count.” But the laws of physics require that what is absorbed by the illuminated portion must, in steady state, be balanced by emission from the entire planet’s surface area, 4πR².”
(Emphasis added)
–
Arkady, please, define, what is absorbed by the illuminated portion???
–
https://www.cristos-vournas.com
ark…”Physics requires energy conservation over the entire object, not only the lit part. “Skeptics” see sunlight illuminating a disk of area pR² and assume that the rest of the sphere somehow “does not count.” But the laws of physics require that what is absorbed by the illuminated portion must, in steady state, be balanced by emission from the entire planet’s surface area, 4pR²”.
***
As I have claimed before, the conservation of energy laws are generalities based on the science prior to 1913 when Bohr discovered the real relationship between electrons in atoms and electromagnetic radiation. The conservation laws have been generalized from the 1st law of thermodynamics which actually dealt only with heat and work. sometimes either/or depending on which energy is available.
I think the idea that energy can neither be created nor destroyed is such a generality and the law applies more to energy transformation from one energy type to another. Naturally, if a certain amount of solar EM is converted to heat, there should be no losses in the conversion. We already know, however, that the law does not apply to reflected solar EM thus the law is incomplete to begin with in that energy in does not have to equal energy out as far as solar impinging on the surface.
Energy reflected away initially does not have to be balanced by radiated IR.
Both Christos and I have discussed this at length and neither of us had any problem with the unlit side of the planet, realizing that energy out via IR on the dark side is important. We, as well as other skeptics, also agree that the problem is far more complex than the overly simple Trenberth-Kiehle energy budget shamozzle which is based on calculations rather than direct observation.
Furthermore, the so-called energy budget essentially ignores heat dissipation at the surface via direct conduction to air molecules touching the surface. Such heat dissipation, according to Shula and the Pirani gauge, is 260 times more effective at heat dissipation than radiation and keeps heat in the atmosphere for extended periods, as do the oceans.
The energy budget theory a la Trenberth-Kiehle is far too naive to be taken seriously.
—————–
“Some recent attention has recently been going around the web concerning a new “paper” done by Joseph E. Postma (PDF here) which claims to “…physically negate the requirement for a postulation of a radiative atmospheric greenhouse effect.” It has been echoed particularly by some of the more crackpot web sources like climaterealists.com, and of course is spreading around various “skeptic” blogs.
The claims are of course extraordinary, along the lines of Gerlich and Tseuchner’s alleged falsification of the atmospheric greenhouse effect. As is often the case with these types of “skeptics…”
***
More propaganda from the peanut gallery. Joe Postma made at least one important observation, that we build greenhouses to do what the atmosphere cannot do. That says it all for the contrived greenhouse effect, which makes little sense.
The paper to which you referred earlier, by Halpern et al, which reputedly disproved G&T, is a serious joke. I have revealed several times the naivete in the paper re the 2nd law. When G&T, both experts in thermodynamics, claimed the 2nd law forbade a transfer of heat both ways between objects of different temperatures, Halpern et al naively claimed that would mean one object was not radiating.
Duh!!!
Clearly the authors do not understand that heat is not transferred both ways between bodies of different temperatures by radiation, conduction, or convection. Clausius and his contemporaries can be forgiven their view that heat moved through space as heat rays since the real mode of transfer via EM was not yet understood. Nevertheless, Clausius had the astuteness to claim that heat transfer via radiation must obey the 2nd law.
However, since it has been known since 1913 that heat is converted to EM, which can be transferred between bodies of different temperatures, but only from hot to cold, as per the 2nd law, there is no excuse for the authors in Halpern et al for not knowing that.
AGW theory is based partly on the same ignorance. It is presumed that heat can be transferred both ways between bodies of different temps by EM. a presumption that is wrong. That is the basis of G&T, that heat from a colder atmosphere cannot be transferred to a warmer surface that supplied the energy in the first place.
Bohr revealed in 1913, his theory of EM generation and absorption by electrons in atoms. That is the true basis of quantum theory to this day. The electrons can only absorb EM at discrete frequencies and the absorption involve a resonance between the frequency of the incoming EM and the angular frequency of the electron.
Anyone doubting this has only to look up the spectral lines of hydrogen. Each spectral line has a very specific frequency. For example, the lines corresponding to red in the spectrum is at 656.3 nm = 456.792 Thz. That’s how specific the electron emission frequency is when it created the EM for a red line.
Since the EM frequencies generated by colder masses do not resonate with the electron angular frequencies in hotter masses, the electrons simply ignore the EM from colder masses. Some have asked how an electron knows the difference and the answer is right there. An electron’s angular frequency depends on the temperature of the mass and as the temperature rises, the electron KE increases. If the temperature increases enough, the electrons will gain so much energy that bonds will break and the masses will disintegrate.
That’s basically why heat cannot be transferred cold to hot by any means. No energy can be transferred, by its own means, from a lower energy state to a higher energy state. That means AGW theory defies the basic energy laws.
So, what ‘portion’ of the ‘sunlight’ reaches the surface of the Earth?
It is what ‘portion’ of the ‘sunlight’ reaches the surface of the Earth, and what ‘portion’ of the ‘sunlight’ gets absorbed as heat in the surface of the Earth.
What reaches the surface of Earth is 70%, because the clouds’ Albedo is ~0,3.
What interacts with surface is 70% *0,47 = 32,9% , because there is a strong specular reflection from Earth’s surface.
There is also a significant the immediate IR EM energy emission from the surface.
So, the absorbed as heat by the surface portion is smaller than the 32,9%. It is something around 20% of the total incident on the top of the atmosphere (TOA), may be even less.
–
https://www.cristos-vournas.com
On FoxBusiness we read:
” President Donald Trump announced Thursday that trade negotiations with Canada have been terminated over a misleading advertisement featuring former President Ronald Reagan speaking out against tariffs.
“The Ronald Reagan Foundation has just announced that Canada has fraudulently used an advertisement, which is FAKE, featuring Ronald Reagan speaking negatively about Tariffs,” Trump wrote on Truth Social. ”
*
Here again we can see what a liar the Trump~ing boy is (he knows the truth about about all that, it’s on a gov page), and we see also that this alleged Ronald Reagan ‘Foundation’ in fact is a 100% FAKE source.
*
Here is the exact transcription of Ronald Reagan’s ‘Radio Address to the Nation on Free and Fair Trade’, dated April 25, 1987:
https://www.reaganlibrary.gov/archives/speech/radio-address-nation-free-and-fair-trade-4
*
As opposed to the Trump~ing boy, who is the worst president the US ever have experienced, Ronald Reagan was a wise person (and believe me: I’m not a fan of his ‘GOP’ party).
In the transctiption you read:
” You see, at first, when someone says, ``Let's impose tariffs on foreign imports,'' it looks like they're doing the patriotic thing by protecting American products and jobs.
And sometimes for a short while it works — but only for a short time.
What eventually occurs is: First, homegrown industries start relying on government protection in the form of high tariffs. They stop competing and stop making the innovative management and technological changes they need to succeed in world markets.
And then, while all this is going on, something even worse occurs.
High tariffs inevitably lead to retaliation by foreign countries and the triggering of fierce trade wars. The result is more and more tariffs, higher and higher trade barriers, and less and less competition.
So, soon, because of the prices made artificially high by tariffs that subsidize inefficiency and poor management, people stop buying.
Then the worst happens: Markets shrink and collapse; businesses and industries shut down; and millions of people lose their jobs. ”
*
Anyone who doesn’t understand how the Trump~ing boy is manipulating the whole US nation to the advantage of a few mega-enterprises, none of which are affected by his tariff war nonsense, is not just suffering from Trump addiction syndrome: Rather, he/she is suffering from a 360-degree mental disorder.
bindi can’t understand even the simplest concepts: And sometimes for a short while it works — but only for a short time.
Trump uses tariffs for leverage. He fixes the imbalances. He never intends for the tariffs to be forever!
Like with basic science, this is too hard for TDS children to understand.
Clint R apparently< is unable to accurately read comments.
The goal of my comment was simply to show that the Ronald Reagan 'Foundation' – probably directed by a bunch of MAGAmaniacal Trumpistas a la Clint R – produced (probably triggered by the Trump~ing boy himself) a pure, 100% lie:
" The Ronald Reagan Foundation has just announced that Canada has fraudulently used an advertisement, which is FAKE, featuring Ronald Reagan speaking negatively about Tariff… "
*
And the Trump~ing boy of course was happy to use the lie to threaten Canada. What a bad president!
*
By no means did I discuss whether or not tariffs are good or bad.
*
But Clint R, exactly as superficial, incompetent and opinionated as Robertson, did not understand what exactly I wrote.
Wrong again, Bindi.
You were trying to denigrate Trump because you’re filled with leftist jealousy. But, you got caught!
You’re a cult child, unable to face reality. You live in a fantasy world. And, you can’t grow up.
Hey Puffman, riddle me this –
Donald plans to funnel a $130 million donation from an anonymous ally toward paying military service members during the government shutdown, the Defense Department confirmed on Friday.
“The donation was made on the condition that it be used to offset the cost of Service members’ salaries and benefits,” chief Pentagon spokesman Sean Parnell said in a statement to CNN, adding that the money was accepted under the department’s “general gift acceptance authority.”
The move marks a striking departure from government procedure for funding the military, which traditionally relies on public funds appropriated by Congress. And it raised immediate questions about the donor’s identity and motivations for cutting the nine-figure check to the government.
https://www.cnn.com/2025/10/24/politics/anonymous-donor-military-pay-shutdown
Does it mean every soldier will receive 100 bucks, or do you think Donald will funnel more toward his favorite boot lickers?
Although Dr Spencer addressed Joe Postma’s Flat Earth Rants in his post of June 4th, 2019, he tacitly gave him a pass on his derivation of the adiabatic lapse rate.
Postma hangs his denial of the GHE on an incoherent derivation of the lapse rate and so it’s worth the effort to debunk it.
Postma’s derivation is as follows (in his own words):
Trigger alert: If you’re a Postma fanboy you should stop here!
Debunking Postma’s derivation of the Lapse Rate.
1/ The starting equation (“Under horizontal local thermodynamic equilibrium, dU = 0 = mCp*dT + mg*dh“) is thermodynamically incoherent because “horizontal local thermodynamic equilibrium” is not the condition that yields the vertical adiabatic lapse rate. The lapse rate is an emergent, adiabatic result of convective vertical motion under gravity, not an equilibrium statement about horizontal layers.
2/ “Adiabatic” means no net heat exchange during parcel motion; it does not imply dU=0. In an adiabatic ascent the parcel does work against pressure and gravity (dU=-pdV), so setting dU=0 removes the very mechanism that produces the lapse rate, IOW dU≠0.
3/ The dry/moist adiabatic lapse rate gives only the gradient not the intercept, and requires boundary conditions, usually the surface temperature which is determined by radiative balance between a b s o r b e d solar and emitted IR.
4/ Circular reasoning: his use of a “mass-average height” conflates that altitude with the effective emission height; the latter varies with wavelength and GHG concentration as observed by satellite spectra and radiosonde profiles. In effect he assumes GHE-determined parameters to deny the GHE.
5/ The most egregious infraction is where he linearly converts from a dry to moist adiabatic lapse rate: dT/dh = -g/Cp + L_H20 = -6.5 K/km.
This step is physically and mathematically fudged; it’s an arm waving insertion of an undefined “latent heat term.”
The quantities g/Cp and L_H20 have incompatible units and cannot be added together; one is in K/m and the other in J/Kg.
His biggest blunder is ignoring the fact that the effect of latent heat release on the lapse rate is a nonlinear function of temperature, pressure, and humidity, not a constant offset.
To summarize: his conclusion that “There is thus no radiative greenhouse effect” was reached by replacing thermodynamics with numerology. So, what do you know, there is a radiative GHE!
Just two questions for you to answer:
1) Without GHGs, what would the temperature be at the surface of the Earth?
2) Without GHGs, what would the temperature be at the top of the troposphere?
The mistake Ark makes is trying to use the “lapse rate” to somehow “prove” the GHE. The lapse rate is real, the GHE is nonsense.
Ark can’t even define/describe his bogus GHE.
They can’t answer those questions I asked because it puts them in an extremely difficult position. They have to answer “255 K” to question 1), or otherwise they’re arguing against their “33 K GHE” nonsense. It’s the second question that really upsets them. They’re on Dr Spencer’s blog, and they know full well that in absence of GHGs, Dr Spencer has argued the troposphere would be isothermal. But, if they commit to saying the top of the troposphere would also be 255 K, they know they’re denying the lapse rate! For instance, you can ask Google:
“Would there be a lapse rate without greenhouse gases?”
And you would be told yes, every time, e.g:
“Yes, there would still be a lapse rate without greenhouse gases, because the adiabatic lapse rate is determined by atmospheric pressure and gravity, not greenhouse gases. This means that as air rises and expands, it cools, and as it descends and compresses, it warms, creating a temperature gradient even in a hypothetical atmosphere with no greenhouse effect. The lapse rate would be the dry adiabatic lapse rate, which is a constant rate of cooling of approximately 10 degree C per 1000 meters of ascent.”
And, if they then give an answer of less than 255 K for question 2), then they know that it doesn’t work – the average temperature of the surface plus atmosphere would then be less than the magic 255 K! Messing up their entire argument.
” Would there be a lapse rate without greenhouse gases? ”
From Google’s AI corner (supported by all pseudo-skeptics unless it departs from their narrative):
” Yes, there would still be a lapse rate without greenhouse gases, but it would be a different kind, and the surface would be much colder.
The lapse rate is primarily caused by the decrease in air pressure with altitude; as air rises, it expands and cools adiabatically, and the Earth’s gravity holds more molecules closer to the surface, making the atmosphere denser at lower altitudes.
Without greenhouse gases, there would be no trapping of heat [no! IR radiation, please] near the surface, and the average temperature would be much colder, around -18 C (0 F). ”
*
Sounds correct, except for… see above.
You can’t have it both ways, Bindidon. Here’s Dr Spencer arguing the atmosphere would be isothermal without GHGs:
https://www.drroyspencer.com/2013/05/time-for-the-slayers-to-put-up-or-shut-up/
“Without greenhouse gases, the atmosphere would slowly approach an isothermal state through thermal conduction with a temperature close to the surface temperature, and convection would then be impossible.”
If you claim there would still be a lapse rate without GHGs, not only are you contradicting Dr Spencer, you’re contradicting the idea that the Earth’s surface and atmosphere would have an average temperature of 255 K without GHGs. You’re contradicting the idea of the Earth’s effective temperature being 255 K, and this matching with observations! If the surface is at 255 K and it only gets colder as you go up in the atmosphere, then the average temperature of the surface and atmosphere is going to be well below 255 K.
” If you claim there would still be a lapse rate without GHGs, not only are you contradicting Dr Spencer, you’re contradicting the idea that the Earth’s surface and atmosphere would have an average temperature of 255 K without GHGs. ”
*
First, I didn’t claim anything: I just reported what Google’s AI corner told me.
*
Second, Roy Spencer is one of many scientists in the domain discussed.
He has his ideas (if he still nowadays kept those of 2013), others have other ones.
*
Third, he did not tell anything in 2013 about the fact that without GHGs, much more of IR LW radiation emitted by Earth in response to Sun’s solar SW radiation directly reaches space, like it (luckily!) does everyday in the atmospheric window (~ 7.5 – 12.5 mu)
The blah blah beloved by pseudoskeptics, namely that N2 and O2 are the ones who mainly intercept IR, is sheer nonsense for two reasons:
– if they would, they would of course do it in the atmospheric window, and no life would exist on our planet;
– in the range 5-100 micron, and cosidering respective atmospheric abundances, N2 absorbs/emits 1,000,000 times less IR than H2O, and 10,000 times less than CO2.
Fifth, Google’s AI answer seems to vary depending on where/how Google is invoked; google.de doesn not give the same output as google.com.
Here is the complete output of the latter, to wwhich I anticipate that you will partly deny it.
” Yes, there would still be a lapse rate without greenhouse gases, but it would be a different one and the surface temperature would be much colder.
The adiabatic lapse rate, caused by air expanding and cooling as it rises due to lower pressure, would be the primary driver of the temperature decrease with altitude.
However, without greenhouse gases to trap heat at lower levels, the surface would be frigid, and the lapse rate would be a much steeper, more dramatic temperature drop.
Adiabatic lapse rate
How it works: As air rises, it expands because the surrounding pressure is lower. This expansion uses energy, causing the air to cool. Similarly, as air descends, it is compressed and warms.
Rate: The “dry adiabatic lapse rate” is the rate at which unsaturated air cools as it rises, which is a constant value of approximately 9.8 C per 1,000 meters (or 5.55 F per 1,000 feet).
Atmospheric composition: This process is independent of the presence of greenhouse gases and depends only on gravity and the physical properties of air.
The role of greenhouse gases
Greenhouse effect: Greenhouse gases trap infrared radiation emitted by the Earth’s surface, preventing it from escaping directly into space.
This keeps the planet’s average surface temperature much warmer than it would otherwise be.
Without them: In a world without greenhouse gases, the Earth would have an average surface temperature of about -18 C (0 F).
The atmosphere would be much thinner, and most of the heat would be radiated directly into space.
Combined effect: The presence of greenhouse gases creates an “effective radiating temperature” at a higher altitude where the atmosphere is thin enough for infrared radiation to escape into space.
The adiabatic lapse rate is then responsible for the temperature drop between the warm surface and this higher point. ”
*
Think what you want, fake mod; I’m not here to convince people like you and a few others who are brazen enough to deny centuries of science just because the Moon shows us always the same face.
¡Basta ya!
You’re not getting it, as usual. The idea that there is still a lapse rate without GHGs is not compatible with the existence of a Greenhouse Effect.
With GHGs, the average temperature of the surface plus atmosphere is equal to the Earth’s effective temperature, 255 K. Due to the lapse rate, you would not expect to find this average temperature at the surface. The surface will be warmer than the average.
Without GHGs, the same applies. If you believe there’s a lapse rate without GHGs, then the bottom of the atmosphere is still going to need to be warmer than 255 K, for the average of the surface and atmosphere to be 255 K. Equal to the effective temperature.
DREMT say: “You’re contradicting the idea of the Earth’s effective temperature being 255 K, and this matching with observations! If the surface is at 255 K and it only gets colder as you go up in the atmosphere, then the average temperature of the surface and atmosphere is going to be well below 255 K.”
Without getting into the question of lapse rate without GHGs, this statement is incorrect.
The reason we use an average of surface and atmospheric temperature for energy balance and effective temperature is because part of the outgoing radiation comes from the surface and part comes from the GHGs in the atmosphere. So we could have part coming from a warmer surface (above 255 K) and part coming from a cooler atmosphere (below 255 K). The weighted average comes out to an effective temperature of 255 K.
But if there are no GHGs there is no weighted average; everything comes from the surface. The effective temperature IS simply the ground’s effective temperature. Whether the atmosphere is warmed than 255 K or cooler than 255 K or equal to 255 K is immaterial because the atmosphere wood contribute nothing to the outgoing radiation.
Sorry, Tim, but nitrogen and oxygen emit IR.
“Sorry, Tim, but nitrogen and oxygen emit IR.”
Sorry, DREMT, but “greenhouse gas” means “emits IR”. If we are postulating no GHG and no GHE, then we are postulating that there is no IR from N2 and O2, either.
[And for all *practical* purposes, we can ignore the IR from N2 and O2 anyway. They emit MANY ORDERS OF MAGNITUDE less IR than true GHGs like CO2 and HJ2O and CH4.]
Sorry Tim, but no matter how much IR nitrogen and oxygen emit, the fact that they emit at all means the temperature of the atmosphere without GHGs gets included in the average.
Sorry DREMT, but no matter how much IR nitrogen and oxygen emit, the fact that they emit at all means … you moved the goalposts.
Your question was “1) Without GHGs, what would the temperature be at the surface of the Earth?”. Since “GHG” means “emits IR”, if you now postulate even a bit of IR from N2 & O2, then you are no longer dealing with the question you asked.
No, Tim, I haven’t moved the goalposts. If you’re going to start with the false accusations, I’m done talking to you.
Gemini:
“A non-radiative gas is a gas that does not significantly absorb or emit infrared radiation.”
Strip Earth’s atmosphere of GHGs and primarily nitrogen and oxygen remain. Once again, this is not controversial. I love it when they get this desperate.
Gemini:
“A weighted average (also known as a weighted mean) is a type of average where some data points contribute more to the final result than others. This is done by assigning a “weight” to each value based on its importance, frequency, or size.”
I love it when they get this desperate.
Yes, DREMT, you DID move the goal posts here. I know and you know and Google Gemini knows that a GHG is a gas that can emit IR. (From Gemini: “A greenhouse gas (GHG) is any gas in the Earth’s atmosphere that absorbs and re-emits infrared radiation (heat energy).”
Your original questions postulated “without GHGs”. Which means without any ability to absorb or emit thermal IR. We are exploring what the atmosphere would be like without the impacts of IR.
Now you are trying to re-introduce thermal IR in to the discussion.
If you say so, Tim.
How do you guys get on here and debate the Greenhouse Gas Model, but you don’t understand its fundamentals? From Winjgaarden and Happer, “Atmosphere and Greenhouse Gas Primer”:
https://arxiv.org/pdf/2303.00808
page 21, end of section 3….
“Without greenhouse gases, the adiabatic temperature profile of the troposphere would evolve into an isothermal profile with the same temperature as the surface.”
This is coming from two prominent physicists who believe the Greenhouse Gas Model.
Also, the debate against Postma is a false debate. His derivation of the lapse rate is wrong. Since Ark won’t answer I’ll ask again, is the Ideal Gas Law valid for atmospheric gases?
I just get bored arguing against the likes of Tim…when he starts telling me what my own argument is, I quickly lose interest.
“Also, the debate against Postma is a false debate. His derivation of the lapse rate is wrong”
Fair enough. His derivation may be wrong, but his overall point is right.
If you look at lapse rate, why is moist lapse rate more isothermal than dry lapse rate? Does that make any sense? The propagandists will say that it is because water vapor has evaporative cooling. It is also the strongest greenhouse gas. It doesn’t make any sense other than lapse rate is derived from pressure. There is no radiative function in the lapse rate.
Those two physicists are considered skeptics, but their view of atmospheric warming or attenuation is no different than GHE.
“If you look at lapse rate, why is moist lapse rate more isothermal than dry lapse rate?“
I’ve always understood that it’s because moist air has higher heat capacity than dry air. So once again, nothing to do with any radiative effect!
I think some of the people posting on this blog are well aware there’s no GHE, but defend it anyway (possibly for political reasons). Some are just “useful idiots”. I haven’t fully worked out who’s who, yet.
Gemini:
“The papers co-authored by van Wijngaarden and Happer have been rejected by several major peer-reviewed journals. Their claims are disputed by climate scientists who state the core arguments (like saturation) have been understood and accounted for in standard climate models for decades, and that the papers often omit the role of positive climate feedbacks (like water vapor) in total warming.”
“Gemini:
“The papers co-authored by van Wijngaarden and Happer have been rejected by several major peer-reviewed journals. Their claims are disputed by climate scientists who state the core arguments (like saturation) have been understood and accounted for in standard climate models for decades, and that the papers often omit the role of positive climate feedbacks (like water vapor) in total warming.”
This is immaterial. Science is about truth. The paper I linked wasn’t submitted for peer review as far as I could tell anyway. It appears to be done for educational purposes and completely transparent. It is stating the physics of GHE. So, mathematically, if greenhouse gases are not present then the atmosphere is isothermal. Argue with their math.
You’re rejecting a paper that states the GHG Theory mathematically. So, you’re rejecting your own theory. Staggers the imagination.
Gemini:
“The challenge in dealing with contrarian arguments is re-focusing the conversation on evidence and probability rather than just possibility. To appeal to truth effectively, a claim needs current, measurable justification, not just future potential. Otherwise, every baseless idea could claim immunity from criticism.”
For completeness, we should probably include Postma’s rebuttal to Arkady’s original post:
https://climateofsophistry.com/2025/08/02/the-history-of-climate-sophistry/#comment-131299
Google Gemini:
For completeness, is there any evidence that Joseph Postma who publishes the blog Climate of Sophistry has done any research in Climate Science?
Answer
Based on comprehensive searches, there is no evidence that Joseph Postma, who publishes the blog Climate of Sophistry, has conducted or published any formal, peer-reviewed research in the academic field of climate science, atmospheric science, or climatology.
His academic background and published research from the University of Calgary are strictly within astrophysics and astronomical instrumentation. His critiques of climate science and his alternative hypotheses regarding the greenhouse effect are presented on his personal blog and in self-published books, which are not considered formal peer-reviewed scientific literature in the field of climate science. His work on these topics has been analyzed and dismissed by experts in the climate science community.
There is no evidence from the available sources that Joseph Postma has conducted any formal, peer-reviewed academic research in the field of climate science, atmospheric physics, or climatology.
His academic research and professional work have consistently been in astrophysics and the technical aspects of astronomical instrumentation (the UVIT telescope).
His critiques of climate science are primarily presented on his personal blog, in self-published formats, or on “skeptic” websites, which are not considered formal, peer-reviewed scientific journals in the climate science community. Climate scientists who have reviewed his arguments note they contain fundamental errors and that his work was never intended for a legitimate climate science journal.
Sour grapes from Sabine.
#2
Whatever you say DREMT.
Yep, whatever I say.
SOLAR MINIMUM UPDATE
In 2025, New Jersey’s wholesale electric bills rose dramatically, with average residential customers seeing bills climb by roughly 17-20% per month. Next year, ratepayers can likely expect another 1.5 – 5% increase on top of that.
Several factors are contributing to the rate hikes in New Jersey. They include increased demand for electricity to power new data centers and New Jersey grid operator PJM Interconnection’s reported failure to quickly connect renewable projects to the grid. But news outlets owned by the Murdoch family — Fox Business and the editorial boards of The Wall Street Journal and the New York Post — are pinning the blame for electricity costs on renewable energy, insisting that eliminating subsidies for renewable energy and building more fossil fuel infrastructure in the state are among the answers to New Jersey’s cost-of-living crisis.
Donald has taken this approach as well, scrapping billions in renewable energy projects. Increasingly, the consequences consumers are already experiencing elsewhere reveal that a crusade against renewable energy is unlikely to benefit New Jersey or the country as a whole.
https://www.mediamatters.org/fox-business/murdoch-media-continues-scapegoating-renewable-energy-new-jersey
Another win for Donald’s friends!
Hey Willard, riddle me this:
For New Jersey, what’s the difference in $ / kilowatt-hour for wind, solar, natural gas, nuclear between the Levelized Cost of Energy (the cost analysis favored by the financial world to sell renewables) and the Levelized Full System Cost of Energy?
And what is your explanation for the following states having above average electricity costs compared to the U.S. average?:
California
Maine
Hawaii
Vermont
Massachusetts
Illinois
Rhode Island
New York
New Jersey
Michigan
Maryland
Delaware
Connecticut
Pennsylvania
New Hampshire
Alaska
Hey sock puppet, riddle me this –
https://www.latitudemedia.com/news/why-are-electricity-prices-going-up/
Are you using a sock puppet for a reason?
ark…you failed to debunk Joe Postma on the GHE, in fact, I don’t think you comprehended his paper. Here it is, and I found it, after a brief skim, to be thoughtfully prepared.
https://web.archive.org/web/20200115221914/https://principia-scientific.org/publications/The_Model_Atmosphere.pdf
You argued in part…
“1/ The starting equation (“Under horizontal local thermodynamic equilibrium, dU = 0 = mCp*dT + mg*dh“) is thermodynamically incoherent because “horizontal local thermodynamic equilibrium” is not the condition that yields the vertical adiabatic lapse rate. The lapse rate is an emergent, adiabatic result of convective vertical motion under gravity, not an equilibrium statement about horizontal layers”.
***
You seem to fail to grasp that a vertical lapse rate can be defined as a series of horizontal layers.
———-
“2/ “Adiabatic” means no net heat exchange during parcel motion; it does not imply dU=0. In an adiabatic ascent the parcel does work against pressure and gravity (dU=-pdV), so setting dU=0 removes the very mechanism that produces the lapse rate, IOW dU?0”.
***
There is no ‘net’ in the adiabatic definition just as there is no ‘net’ in the 2nd law. Adiabatic means there is zero heat entering or leaving a system and the 2nd law means there is no heat transfer, by natural means, from cold to hot. The ‘net’ word was used under an incorrect presumption that some heat flows cold to hot and that some heat flows in and out of a mass via an adiabatic process.
I don’t know anything about Joe Postma and I am not privy to the problems between Joe and Roy. I do know that certain members of Principia made themselves unwelcome on Roy’s blog but that was before my time. In general, Principia put out really good scientific articles from the likes of Claes Johnson but I acknowledge there were a few cranks involved.
I think Joe nailed it when he claimed we build greenhouses to do what the atmosphere cannot do. He explains that well in the article above.
BACK AT THE RANCH
Donald has continued to insist that there is “virtually no inflation”. “Prices are ‘WAY DOWN’ in the USA,” He wrote on social media in late August.
Yet according to a new Harris poll, Americans are still reporting soaring inflation and are increasingly pessimistic about the economy.
When asked to estimate how much their regular monthly household costs have increased from last year, 74% of those surveyed said they had seen increases of at least $100, according to the poll.
https://www.theguardian.com/business/2025/oct/16/inflation-economic-pessimism-poll
Data Centers Look to Old Airplane Engines for Power – Modified turbofans are helping to power the data-center boom. https://spectrum.ieee.org/ai-data-centers
There used to be people arguing that electric vehicles would overwhelm the grid. Probably still are.
Imagine a freakin’ jet engine, or a complete regional airport, running 24/7 in your neighborhood!
Meanwhile the human brain only consumes about 5 watts. Perhaps LLMs aren’t the way to go about this particular pursuit.
Right now, AI is practically free (or actually free) to the user in order to promote it and get people hooked on it. But given how much power it consumes, that can’t last. Soon Wall Street will get itchy and so will come “The Great Monitization” where 90% of the users will say “It’s cool, but not THAT cool.” With adoption falling well short of the analysts’ breathless estimates, the price for those who are determined to use it will soar just to break even. And so we’ll see the next big tech bust.
We have done without AI for how many generations now; and just like cellphones, AI is NOT a necessity.
The crash (literally) is already happening in the driverless taxi business. Waymo and the others have been developing long enough that now it’s crunch time. Prices will go up, cost saving corners are being cut.
Don’t worry Ark. You will hardly hear the jet engines, hiding under your bed with stuffing in your ears.
Just stay hidden. You don’t want the kings to find you….
A planet is solar irradiated from one direction.
So there is always only one point on the Globe where the sun is at the Zenit.
And, at vast majority of the Globe’s dayside area the sun appears to be very low above the Horizont.
Because most of the planetary dayside area is either mornings and afternoons, or higher latitudes and Polar regions.
That is why for a smooth surface planets and moons there is a strong specular reflection constituent, which is not seen, and which is not measured by satellites sensors.
That is why the satellite measured average surface Albedo cannot be considered as the Bond Albedo.
Satellites are not capable measuring the planetary Bond Albedo.
As a result, Earth’s solar radiative energy income is very much overestimated.
–
Link: https://www.cristos-vournas.com
F for fail.
SOLAR MINIMUM UPDATE
A conservation charity known for its anti-renewables stance has made submissions to federal and state inquiries that name non-existent government authorities and a nonexistent windfarm, and cite scientific articles that the supposed publisher says don’t exist, a Guardian Australia investigation has found.
https://www.theguardian.com/australia-news/2025/oct/18/queensland-anti-renewables-group-cited-nonexistent-papers-in-inquiry-submissions-using-ai-publisher-says
Our cranks should apply to work in think tanks.
Why are you assuming they don’t?
DREMT wrote:
“ Just two questions for you to answer:
1) Without GHGs, what would the temperature be at the surface of the Earth?
2) Without GHGs, what would the temperature be at the top of the troposphere?”
The current atmospheric vertical temperature profile depends on radiative effects driven by GHGs. Without GHGs there would be no troposphere or tropopause, and the vertical temperature profile would change to an almost featureless, isothermal temperature structure extending up to the mesosphere.
Surface temperature would approximate the planet’s effective radiating temperature of ~255 K ± 5-10 K depending on changes to the planetary albedo, sensible heat fluxes, depth of the convective overturning layer, and day/night cycle temperature contrasts.
The premise of the second question is invalid since the “top of the troposphere” does not exist in this scenario.
Ah, so you’re going with Dr Spencer.
“Ah, so you’re going with Dr Spencer.”
I’m going with Goody & Yung, Atmospheric Radiation: Theoretical Basis (1989).
When intelligent people independently arrive at the same conclusion, it validates the idea itself.
Well, the general consensus nowadays seems to be that without GHGs, the dry adiabatic lapse rate would still apply.
Sorry, but you’re hallucinating again if earth had no radiative gases that would mean it had no water so it would have less ability to cool itself so it’s temperature would be closer to if theoretical value from 480 W per square meter, averaged over a hemisphere
Also Ark, radiative gases have little to do with the tropopause. The tropopause occurs due to lack of molecules. Goody and Yang should have taught you this….
BACK AT THE RANCH
Reclusive oligarch Tim Mellon just gave $130 million, supposedly to pay the troops during the shutdown. Weird, huh? We should also note that his father Paul’s name appears in the Epstein files (with trafficking victims only referred to by their gender) and that his bank Mellon BNY was recently sued.
https://bsky.app/profile/nycjayjay.bsky.social/post/3m47bethzzd2i
Funny how the more corruption there is, the more Donald wins.
Earth’s surface has a huge thermal inertia.
And, the S-B formula is not applicable backwards either. It is about the emission (the heat into EM energy spontaneous transformation) and not about the EM energy absorption.
The solar EM energy incident on the planet only a small portion is transformed into heat and absorbed as heat in inner layers.
Also, at low (terrestrial) temperatures the Stefan-Boltzmann emission law is not applicable (doesn’t work).
The planetary surface emits IR EM energy at much lower intensities than the S-B law assertions.
The planet, in its orbiting path around the sun, is never in a perfect radiative equilibrium state.
For long-long millennias there may be a negative the heat absorption process (more energy emitted than absorbed), or, for long-long millennias, there may be a positive heat absorption process (less energy emitted than absorbed).
–
https://www.cristos-vournas.com
DREMT wrote:
“Well, the general consensus nowadays seems to be that without GHGs, the dry adiabatic lapse rate would still apply.”
I don’t know who besides Postma has reached that conclusion, and the assertion follows from his flawed (incompetent) derivation of the dry adiabatic lapse rate.
The assertion that “without GHGs, the dry adiabatic lapse rate would still apply” is tautological. It implicitly assumes adiabatic motion exists and then concludes that the temperature profile would therefore be adiabatic. In effect it is saying that if the air were convecting adiabatically, then the adiabatic lapse rate would apply.
The adiabatic lapse rate is not an intrinsic property of a static atmosphere (as Postma seems to think); it is the actual ambient lapse rate only when convection is occurring.
Prove me wrong.
Think what you like. Just stop starting new threads on the same topic all the time.
Ark, you’re terribly confused about “lapse rate”, and what causes it. Let’s make it simple so even children can understand:
Earth’s atmosphere is like a blanket, with “holes”. The “holes” are the radiative gases emitting energy to space. The rest of the atmosphere consists of nitrogen and oxygen. Without the “holes”, the atmosphere would provide even better insulation. So consider a thickness of insulation with a high temperature on one side and a cold temperature on the other side. There would be a temperature gradient (lapse rate) through the insulation.
See how easy that is?
Without the radiative gases, the surface and atmosphere would have to warm to a higher temperature to emit excess energy to space.
Remember, the actual observed lapse rate isn’t even a constant. It varies significantly as one moves from pole to pole.
Wow, tautological. Fancy word. There is no radiative function in the lapse rate. It is derived totally from hydrostatic pressure. Furthermore, the moist rate is more isothermal than the dry rate. So, the more greenhouse gases in the atmosphere the more isothermal the lapse rate.
According to Greenhouse Theory if no GHG are in the atmosphere then it is isothermal from the surface to the top of the atmosphere.
“the lapse rate… is derived totally from hydrostatic pressure.”
Show me.
Anybody who can look up tautological can look up where the lapse rate comes from. It must be a horrible realization for you after all these years of believing and spreading this propaganda. Then, physics slaps you in the face.
So, you can’t support your assertion that “the lapse rate… is derived totally from hydrostatic pressure.”
Can’t say that I’m surprised.
stephen p Anderson
What is a “horrible realization” is that you will always just say stuff, never able to back it up.
I have more productive discussions with a mind-numbingly dumb LLM than engaging with you. Good luck to you.
Would you like me to show you the multiplication tables too?
“So, you can’t support your assertion that “the lapse rate… is derived totally from hydrostatic pressure.”
Not my assertion, it is physics. Look up derivation of lapse rate in Wiki. Then filter out all the BS. The temperature difference between the summit and base of Mauna Loa is atmospheric pressure. No radiative component.
The continuity equation and the lapse rate together dismantle two tenets of Greenhouse Theory-that the CO2 rise was caused by humans and that there is a Greenhouse Effect that causes 33C of warming.
“Would you like me to show you the multiplication tables too?”
I keep those in my head. We had to memorize those in third grade.
“Look up derivation of lapse rate in Wiki.”
I don’t use Wiki. When I have a question, I just pull a book off my bookshelf.
Do you know the assumptions necessary to derive the adiabatic lapse rate?
“The continuity equation…”
The continuity equation is my bread and butter. Can you explain how the continuity equation expresses the balance between the local rate of accumulation of a quantity and the divergence of its flux?
Well, look at you. Mr. Tautological and Continuity Equation. I don’t have to explain anything to you. You’re onboard. Oh, wait. You still have to figure out the lapse rate. You’ll get there. Anybody who understands accumulation and diversion can understand a polytropic process.
Sorry meant to say divergence. But this is simple conservation of math. You know that right. Any comment on Berry’s third paper? Lots of accumulation and divergence there.
Ark,
Is the Ideal Gas Law valid for the atmosphere?
The claim that “without GHGs, the dry adiabatic lapse rate would still apply” is a tautology: the lapse rate only arises where convection occurs, and convection itself depends on radiative gradients created by GHGs.
The assumptions used to derive the adiabatic lapse rate are also the preconditions for its existence:
1/ An air parcel moves adiabatically (dQ = 0).
2/ The surrounding atmosphere is convectively active, so air parcels are free to rise and fall.
3/ Hydrostatic balance and ideal gas behavior apply.
In the absence of GHGs, radiative cooling aloft would vanish, convection would cease, and assumption (2) would fail, rendering the dry adiabatic lapse rate inapplicable. The resulting atmosphere would be radiatively stable and nearly isothermal.
Thus, asserting the conclusion (adiabatic lapse rate) by assuming the premise (adiabatic convection) is a tautology. It provides no physical justification for why the atmosphere should be adiabatic in the absence of GHGs.
From upthread:
“For instance, you can ask Google:
“Would there be a lapse rate without greenhouse gases?”
And you would be told yes, every time, e.g:
“Yes, there would still be a lapse rate without greenhouse gases, because the adiabatic lapse rate is determined by atmospheric pressure and gravity, not greenhouse gases. This means that as air rises and expands, it cools, and as it descends and compresses, it warms, creating a temperature gradient even in a hypothetical atmosphere with no greenhouse effect. The lapse rate would be the dry adiabatic lapse rate, which is a constant rate of cooling of approximately 10 degree C per 1000 meters of ascent.””
Wrong again, Ark.
In the absence of radiative gases convection would NOT cease. You’re making the same mistakes as in “climate science”. Sun heats the surface, unevenly. The hot spots cause air to rise. Cool air at altitude then falls. The atmosphere would NOT be stable.
You seem to be just digging a deeper hole. But, maybe that will keep you safe from the kings….
DREMT wrote:
“For instance, you can ask Google:
“Would there be a lapse rate without greenhouse gases?”
So, I asked Google:
Answer:
Once again, DREMT fails to remember that we all learned that Google/AI does a poor job with science questions of any complexity.
Here it fails to ‘think about’ or consider the lack of cooling of the upper troposphere.
Where does the heat transported up in the troposphere by convection go?
Does it simply vanish?
Happy this is correct:
“Yes, there would still be a lapse rate without greenhouse gases, because the adiabatic lapse rate is determined by atmospheric pressure and gravity, not greenhouse gases. This means that as air rises and expands, it cools, and as it descends and compresses, it warms, creating a temperature gradient even in a hypothetical atmosphere with no greenhouse effect. The lapse rate would be the dry adiabatic lapse rate, which is a constant rate of cooling of approximately 10 degree C per 1000 meters of ascent.””
After all, the reason the air “cools down” with height is that the thermal energy of the air gets converted into potential energy to counteract the gravitational energy pulling the air back towards the ground. This is an effect that is completely independent of GHGs.
“Happy this is correct…”
That’s called confirmation bias as is well known by those who know it well.
That’s a false accusation, Arkady. I then wrote “after all…” and proceeded to explain why I was happy with it. Ignoring that part of my comment and falsely accusing me is what’s known as “dishonest debate”, which any astute readers are very familiar with from your side of the discussion.
Don’t forget to respond to Clint R and Gordon, as well.
Lets ask Google/AI
Does Google/AI give accurate answers to science questions?
“No, Google AI does not always give accurate answers to science questions and can produce incorrect or “hallucinated” information. While the technology is designed to be accurate, it has shown a tendency to provide wrong information, sometimes drawing from unreliable sources like satire, and can be outdated despite its ability to cite sources. Therefore, it is crucial to critically evaluate any AI-generated answers and fact-check them with reliable sources, especially for complex or health-related science questions. “
Nate asked:
“Where does the heat transported up in the troposphere by convection go?
Does it simply vanish?”
His question has been answered. Let’s see if he will acknowledge that.
Again, DREMT and Google/AI ignore that heated air convected to the upper atmosphere, must then cool and fall back to the surface. Without the GHG radiative cooling to space, convection simply ceases.
DREMT
I didn’t ignore it. You do know why that’s wrong, don’t you?
The reason the air cools down is because the air parcel’s internal energy is converted to expansion work as it rises (dU = -pdV).
It’s not wrong, Arkady.
The total energy of a substance will include the thermal energy of the substance, its latent energy, its potential energy, and its kinetic energy. The further up you go, the more the air’s potential energy increases, due to gravity. It would thus be impossible for the atmosphere to be isothermal. Unless you’re denying the existence of gravity.
DREMT says “After all, the reason the air “cools down” with height is that the thermal energy of the air gets converted into potential energy to counteract the gravitational energy pulling the air back towards the ground. This is an effect that is completely independent of GHGs.”
To be more precise, the reason air “cools down” with height is that the thermal energy DOES WORK AS THE AIR EXPANDS.
DELTA(U) = Q – W.
the Delta(U) is a result of PdV work.
If you take a sealed, fixed-volume, insulated container up 1km (say with an airplane), it will NOT get cooler. The gravitational potential energy is not a useful way to look at it. The air will be the same temperature and pressure as it was 1 km lower. The only way for the air inside to get cooler is if the container is allowed to expand so that the air pressure matches new, lower pressure around the container. It is the EXPANSION that cools the air, not the change in GPE.
“Unless you’re denying the existence of gravity…”
…or denying 1LoT.
DREMT postulates: “After all, the reason the air “cools down” with height is that the thermal energy of the air gets converted into potential energy to counteract the gravitational energy pulling the air back towards the ground. This is an effect that is completely independent of GHGs.”
Actually, the reason the air “cools down” with height is EXPANSION. If you take a sealed, insulated, fixed-volume up 1 km, (say in an airplane, the air inside will NOT cool. The change in GPE is immaterial.
The air will cool down when the container is allowed to expand to equal the newer, lower pressure around it. The air does PdV work, losing U, and therefore dropping in T.
Its right there in the 1st Law: Delta(U) = Q – W.
“Where does the heat transported up in the troposphere by convection go?
Does it simply vanish?”
“His question has been answered. Let’s see if he will acknowledge that”
Where? And where did it go?
All we’ve heard is that it is doing work on and thus heating tge surrounding air.
Then what?
Can you not figure that, with nowhere to go, the heat accumulates up there, until it cant anymore?
And just one general comment here. We have a thought experiment discussing subtle effects far from current conditions on a poorly defined system. Some poorly defined conditions include:
* Are we including the tiny IR effects of N2 and O2?
* Are we including the day/night temperature cycles?
* Are we including the ozone layer absorbing UV?
* Does “no GHGs” mean no CO2 and no H2O – so we have no clouds and no oceans and no life?
* Are we including aerosols in the atmosphere?
(I am sure others could add to the list)
Unless we agree on a clearly defined set of conditions, there is no point in drawing any conclusions.
P.S. To me, the spirit of the thought experiment is:
1) The atmosphere is magically caused to be perfectly transparent to EM radiation (not just IR, but also eg transparent to UV in the ozone layer).
2) Other parameters are kept the same (same rotation, same albedo, same emissivity, etc).
If that is NOT the scenario someone else has in mind, then the differences need to be resolved … or we can agree to disagree and know that we will likely reach some very different conclusions.
Nate apparently didn’t understand, “the thermal energy of the air gets converted into potential energy to counteract the gravitational energy pulling the air back towards the ground. This is an effect that is completely independent of GHGs.”
He asks what happens to the thermal energy, and won’t accept “converted into potential energy”.
Again:
“The total energy of a substance will include the thermal energy of the substance, its latent energy, its potential energy, and its kinetic energy. The further up you go, the more the air’s potential energy increases, due to gravity. It would thus be impossible for the atmosphere to be isothermal. Unless you’re denying the existence of gravity, or 1LoT”.
People want to obfuscate, but I’m afraid I’m going to keep it simple.
DREMT wrote:
“ It’s not wrong, Arkady.
The total energy of a substance will include the thermal energy of the substance, its latent energy, its potential energy, and its kinetic energy. The further up you go, the more the air’s potential energy increases, due to gravity. It would thus be impossible for the atmosphere to be isothermal. Unless you’re denying the existence of gravity.”
Shifting the goalposts already I see.
You’re conflating internal and gravitational potential energies.
The parcel’s internal energy depends only on the temperature change: dU = cv * m * dT.
Gravitational potential energy (mgh) is external to the parcel’s thermodynamic state variable.
The gravitational potential energy is already accounted for with the hydrostatic balance condition, as I wrote above. You can’t add it to the parcel’s internal energy.
“Shifting the goalposts already I see.”
False accusation.
“You’re conflating internal and gravitational potential energies.”
False accusation.
What I’m saying is pretty straightforward.
The total energy of a substance will include the thermal energy of the substance, its latent energy, its potential energy, and its kinetic energy. The further up you go, the more the air’s potential energy increases, due to gravity. It would thus be impossible for the atmosphere to be isothermal. Unless you’re denying the existence of gravity, or 1LoT. Since the potential energy is increasing, as you ascend, and the internal (thermal) energy is decreasing, the total energy remains the same. As you would expect. Even though the air further up is colder, its total energy remains the same, because despite the decrease in internal (thermal) energy, it has gained potential energy.
Whoops – brain fart.
Where I’ve written “internal (thermal) energy” just read “thermal energy”.
Sorry about that.
DREMT, I really do understand what you are trying to say about gravity. It is a very compelling argument. But it is wrong. I know two simple arguments; I’ll start with the one I think is more obvious and compelling.
PERPETUAL MOTION PARADOX. Different gases have different specific heats, cp, and hence different lapse rates. For example, H2 gas has a cp about 14x larger than dry air, and hence a lapse rate 1/14th as large.
Consider insulated columns of each gas that are in thermal equilibrium at the bottom (let’s say they are both at 20 C at the bottom with some metal rod connecting the bottoms, keeping the bottoms at the same temperature).
*IF* a lapse rate is the equilibrium condition, *THEN* the tops of the columns will be different temperatures (~ 10 C for air, and ~ 19 C for H2 for our example) — but all of these locations would be in thermodynamic equilibrium with each other. But this means that we could connect a metal rod between the tops and heat would eternally flow between two systems at “thermodynamic equilibrium”. Or we could eternally run a heat engine between two reservoirs at “thermodynamic equilibrium”.
No. The tops must be at the same temperature as each other. We can’t do that with a lapse rate as part of the solution. The solution must be that the tops and bottoms of both columns must all be the same temperature (20 C for our example).
“What I’m saying is pretty straightforward.”
If it’s so “straightforward,” then write it in equation form.
If you’re not shifting the goalposts, then why are you now including “latent energy” in your energy balance? Where does it come from? The “substance” in this discussion is dry air with zero GHGs.
YOU are the one who stipulated an atmosphere with no GHGs, remember?
The system under discussion is a parcel of air rising/falling in a gravitational field. Gravity is already accounted for with the hydrostatic balance condition dp =-ρgdh, as is 1LoT with dU=dQ+dW where dQ=0 by definition. The lapse rate describes the temperature profile of the parcel itself.
Arkady’s left clutching at straws. Another easy win.
Whatever you say DREMT.
“Since the potential energy is increasing, as you ascend, and the internal (thermal) energy is decreasing, the total energy remains the same. As you would expect. Even though the air further up is colder, its total energy remains the same, because despite the decrease in internal (thermal) energy, it has gained potential energy.”
So, given the above, how could the atmosphere be isothermal? If, as you ascend, the thermal energy remains the same, but the potential energy is increasing due to gravity, then unless something else were decreasing in perfect lockstep, the total energy would somehow, inexplicably, be increasing as you ascended!
“Nate apparently didn’t understand, “the thermal energy of the air gets converted into potential energy to counteract the gravitational energy” pulling the air back towards the ground. This is an effect that is completely independent of GHGs.”
He asks what happens to the thermal energy, and won’t accept “converted into potential energy”.”
And DREMT plays very dum or is very dum, by not understanding that his energy, whatver form he thinks it is, once it gets deposited in the upper atmosphere, it does not vanish, and is no longer removed, as before with GHG.
Then it must build up.
It cannot do that indefinitely.
Thus where did it go?, has not been answered.
“…his energy, whatver form he thinks it is, once it gets deposited in the upper atmosphere…”
Nate is really struggling with the concept of “adiabatic cooling”. Luckily, Google is on hand to help him learn some physics:
https://www.drroyspencer.com/2025/10/uah-v6-1-global-temperature-update-for-september-2025-0-53-deg-c/#comment-1721455
Conservation of mass. Too many things going on. Hey Ark, if every nation is in debt, who is the creditor?
Asking Google:
“Is the thermal energy of a parcel of air converted to potential energy as it ascends?”
Returns:
“Yes, as a parcel of air ascends (adiabatically, meaning no heat is exchanged with its surroundings), its internal (thermal) energy is converted into potential energy (and work done on the surroundings).
Here is a breakdown of the process:
Expansion and Cooling: As the air parcel rises, it moves into a region of lower atmospheric pressure. This pressure difference causes the parcel to expand. This expansion requires energy to do work on the surrounding air.
Energy Source: Since the process is approximately adiabatic (especially for swiftly moving air, as air is a poor heat conductor), the energy for this work and for the gain in potential energy is drawn from the parcel’s own internal energy, which is its thermal energy (the kinetic energy of its molecules).
Temperature Drop: The decrease in internal energy results in a drop in the parcel’s temperature, a process known as adiabatic cooling.
Potential Energy Gain: As the parcel rises to a higher altitude, its gravitational potential energy increases. Therefore, the thermal energy of the parcel is effectively converted into the work of expansion and an increase in gravitational potential energy as it ascends.
If the air is saturated with water vapor, condensation can occur, which releases latent heat. This partially offsets the cooling, but the fundamental conversion from internal energy to potential energy still takes place.”
SOLAR MINIMUM UPDATE
Central Vietnam has been inundated by devastating floodwaters this week, following record-breaking rains that have claimed at least 10 lives and left five people missing, officials confirmed.
Cities, farmland, and transport networks bore the brunt of the onslaught.
The coastal city of Danang, a vital future growth engine for Vietnam, reported six fatalities and four missing individuals.
https://www.msn.com/en-gb/news/uknews/deadly-floods-batter-central-vietnam-killing-at-least-10/ar-AA1PpqxB
ark…”DREMT wrote:
“Well, the general consensus nowadays seems to be that without GHGs, the dry adiabatic lapse rate would still apply.”
I don’t know who besides Postma has reached that conclusion, and the assertion follows from his flawed (incompetent) derivation of the dry adiabatic lapse rate”.
***
Dremt is correct. Without GHGs there would be no difference in action between radiation from the surface and heat conduction directly to oxygen and nitrogen, the major gases. Heated air would still rise and 100% of the radiation generated would be radiated directly to space. Furthermore, the lapse rate would be the same.
As it stands, 90% of surface radiation goes directly to space with only about 10% absorbed by GHGs. If you removed all CO2 from a real greenhouse, it would heat to the same temperature.
The notion that a trace gas is responsible for heating the atmosphere, and cooling it, is sheer pseudo-science.
dremt…to ark…”Just stop starting new threads on the same topic all the time”.
***
dremt…fyi…I am guilty of the same thing. However, there is a method to my madness. I cannot post with Firefox on this blog and have to use the TOR browser. If I try posting to a pertinent thread which is up the page a bit, and it fails, I must find the thread again and hope it does not fail again. It’s much easier to post a new thread, although I do try to post in the thread if it is not too far back..
Not to worry, Gordon…I only said that because I was secretly hoping it would encourage them to start more threads on the subject. I know if they think it’s annoying me then they’ll just do it more, you see. It’s good that they’re getting this subject more attention by obsessively stalking me on it.
“There is no radiative function in the lapse rate.”
Wow. Deep sentence.
“In”?
Which lapse rate?
What’s a radiative function?
Why should anyone care, unless you’re a troglodyte trying to put the cart before the horse?
Thought I’d check Google AI on the lapse rate re whether it varies with latitude.
“Yes, the atmospheric lapse rate varies with latitude, decreasing as latitude increases from the equator to the poles. This variation is driven by differences in solar energy intensity, atmospheric circulation, and moisture content, with lower latitudes having steeper lapse rates and higher latitudes having shallower lapse rates.
How latitude affects lapse rate
Solar radiation: Lower latitudes receive more direct sunlight, which can lead to higher convection and a steeper lapse rate, especially where moist convection dominates.
Atmospheric circulation: Circulation patterns, which are influenced by latitude, play a significant role. High-latitude regions are dominated by baroclinic eddies, while low-latitude regions are dominated by moist convection.
Moisture and humidity: The amount of moisture in the air affects the lapse rate. Tropical regions often have a steeper lapse rate due to high humidity and convection, while drier areas like subtropics can have higher lapse rates.
Seasonality: The lapse rate also changes with the seasons. For example, the lapse rate is generally steeper in the summer and shallower in the winter.
Summary of latitudinal variation Equator to pole: The lapse rate generally decreases from the equator to higher latitudes.
Equatorial regions: Lapse rates are often steeper in the tropics due to high humidity and convection.
High latitudes: Lapse rates are shallower in high latitudes, which are often dominated by different atmospheric dynamics, such as baroclinic eddies.
Example values: One study found the average lapse rate decreases from approximately 6.3 degree C/km at the equator to 4.7 degree C/km at 70 degree N”.
—-
So, what can we deduce from this? Clearly, since CO2 is not varying, I presume, that the Earth’s orbit and axial tilt cause the variations.
Corollary: If CO2 caused the lapse rate, one would expect a constant lapse rate from Equator to the Poles.
I still think gravity plays a major role by producing a negative pressure gradient.
BACK AT THE RANCH
Effective October 15, 2025, due to non-renewed funding, NSIDC has suspended or reduced several Sea Ice Today tools and services.
https://nsidc.org/data/user-resources/data-announcements/user-notice-sea-ice-today-services-reduced
Great win for Donald’s oily friends!
MIT built a new test called WorldTest to see if, and how well, AI actually understands the world.
They tested 517 humans vs. Claude (Anthropic), Gemini 2.5 Pro (Google), and o3 (OpenAI). Humans crushed every model.
Key takeaways: (1) Today’s AIs don’t understand environments. (2) They don’t explore strategically, revise beliefs, or run experiments like humans do.
Meanwhile the human brain uses a consistent, low-power output of 5-20 watts for its cognitive functions; much lower that any AI model.
AI can’t do your job, but an AI salesman can 100% convince your boss to fire you and replace you with an AI that can’t do your job, and when the bubble bursts, the money-hemorrhaging “foundation models” will be shut off and we’ll lose the AI that can’t do your job, and you will be long gone, retrained or retired or “discouraged” and out of the labor market, and no one will do your job. AI is the asbestos we are shoveling into the walls of our society, and our descendants will be digging it out for generations.
https://arxiv.org/pdf/2510.19788
Ark, did you find something else that scares you?
Most responsible adults already know that “AI” is nothing more than a super fast search engine. That’s why it’s called “Artificial Intelligence”.
Now, keep digging that hole. You need to be really deep to escape the kings. They want to harvest your organs.
Boo!
OpenAI Plans IPO Targeting Massive $1 Trillion Valuation in Break From Nonprofit Roots https://www.financemagnates.com/trending/openai-plans-ipo-targeting-massive-1-trillion-valuation-in-break-from-nonprofit-roots/
We’ll just keep shoveling this asbestos into the walls of our society that our descendants will be digging out for generations.
That and the billions wasted on climate hysteria, i do worry about the future generation having to clean up all the junk that now clutters almost every corner of our planet,
Don’t worry. Everything’s just fine!
https://www.gatesnotes.com/home/home-page-topic/reader/three-tough-truths-about-climate
Bonfire of the Vanities
“About 85 percent of US GDP. That has been the average total value of all US stocks since 1970,” said Charles “Chuck” Prince, Citigroup CEO, in a July 2007, FT interview.
On Tuesday, October 28, that value reached 220% of US GDP. These high valuations are almost entirely due to AI companies, with a focus on the Magnificent Seven: Apple, Microsoft, Meta, Amazon, Alphabet, Nvidia and Tesla.
Microsoft, for example, took 35 years to reach a trillion-dollar valuation, in 2021. Just 4 years later it trades at 4 trillion dollars.
Those valuations comes on top of impressive infrastructure investment numbers: Google, Amazon, Meta and Microsoft, for example, plan to spend more than $400bn on data centers in 2026, on top of more than $350bn this year.
Of course it is not a decadal issue…
The planet, in its orbiting path around the sun, is never in a perfect radiative equilibrium state.
For long-long millennias there may be a negative the heat absorption process ( some more energy emitted than absorbed),
And, for long-long millennias, there may be a positive heat absorption process ( some less energy emitted than absorbed).
We wittness in our times the ( some less energy emitted than absorbed) a year after year the continuous an excess heat accumulation by the surface of the Earth.
Let’s consider the millennias long process of the year after year the continuous an excess heat accumulation by the surface of the Earth as an analogue to the yearly seasonal changes.
The orbital circumstances our Earth is currently in, they can be compared with the mid summer – about the 7th of July.
July is already a hot month, but the temperature day-after-day slowly continiue rising. The temperature rises slowly until the first decade of August…
By analogue to the millennias long warming pattern the Earth is in, the orbitally caused slow warming will continue for about a millennia and a half, and then, and only then, there will start a very slow at the beginning and then a gradually accelerating cooling pattern.
So, after about a millennia and a half, again by the orbital causes – the orbital circumstances our Earth would be in – they will change to the opposite direction:
which is the negative the heat absorption process ( some more energy emitted than absorbed).
–
–
In conclusion, we shall have some millennias of a warmer, and of a warmer climate on our Earth.
The good thing is that Earth’s surface has a huge thermal inertia!!!
So, the temperature rise will be limited.
–
https://www.cristos-vournas.com
“However, there is a method to my madness. I cannot post with Firefox on this blog and have to use the TOR browser.”
C’mon, Bordo. You’ve been doing this since at least 15 years.
Nevertheless, your lie had the side effect to make Graham reveal his Machiavellianism. So it’s all good.
Mac who…is that an Irishman?
dremt…from AI…
“Expansion and Cooling: As the air parcel rises, it moves into a region of lower atmospheric pressure. This pressure difference causes the parcel to expand. This expansion requires energy to do work on the surrounding air.
Energy Source: Since the process is approximately adiabatic (especially for swiftly moving air, as air is a poor heat conductor), the energy for this work and for the gain in potential energy is drawn from the parcel’s own internal energy, which is its thermal energy (the kinetic energy of its molecules).
Temperature Drop: The decrease in internal energy results in a drop in the parcel’s temperature, a process known as adiabatic cooling”.
***
The problem with AI, as we know, is it’s sources. AI is not a computer thinking for itself, it is nothing more, at this stage, as a very fast computer system looking up information sources.
We know that Google practices censorship, as far as the sources they support and oppose, so Google AI will be focused on looking up sources like the IPCC while negating anything from UAH. The answers given above from AI suggests such a bias.
This is not rocket science, if you have warmer air at a higher pressure rising into a cooler air parcel of lower pressure, it means the warmer air has more molecules per unit volume and they are in a state of higher agitation. When those molecules rise into air of a lower air density and lower agitation, they naturally have more room to move about hence lose kinetic energy due to a lower collision rate.
We have to stop for a moment and ask what we mean here by pressure. By definition re a gas, pressure is the sum of the forces applied by individual molecules on a surface. Where is that surface at 30,000 feet? It does not exist as long as there is no surface to act upon. The air molecules are surely no applying pressure on each other.
There is no work factor involved. Work is defined as a force acting over a distance which means a mass acting over a distance. That hardly applies to an air mass interacting with another air mass. It would apply to an air mass acting against a solid surface but with heated air rising their is no such overall action.
Rather, we have individual air molecules experiencing more space in which to move and molecules moving with a lower kinetic energy. All of this happens so gradually and over a distance that using a reference to work makes little sense.
The 1st law can operate without heat or without work and I think the expansion of warmer air into cooler air of a lower pressure is an example of the 1st law without work.
Remember, these laws, like the 1st and 2nd law are largely about heat since they are laws of thermodynamics, a study of heat, which according to some does not exist. I think it does exist as a form of energy and it is represented in air parcels as the energy of the air molecules themselves.
Ergo, as warmer air, with a higher individual KE for the molecules, moves into a region of colder temperature and lower air density, there are fewer and fewer molecules with which to collide and the KE of the warmer molecules is reduced.
That raises another question. If you have a molecule of O2 with a certain velocity and it has no resistance to it motion unless it collides with another molecule, why should it slow down? That is never the case since gravity is always acting on it, no matter how weak. Seems to me that the actuality of air molecules at any altitude is far more complex than any analysis I have seen of them.
This notion of adiabatic expansion is sheer nonsense. It focuses only on the conduction of heat between air molecules and ignores the convection of heat by the molecules themselves. The only way the term adiabatic could be applied is with the air parcels rising in an insulated conduit which allowed no heat to flow in and out of the conduit.
In other words, the ideas expressed by AI are fanciful mathematical imaginations based on pure theory. Air is not a poor heat conductor if the entire parcel is moving as a unit and carry heat with it. That’s how a forced air unit works with a furnace in a residential home. According to AI, no heat could be conducted from the heat generated in the basement to a room on the next floor due to the poor heat conduction of air. We know that is not the case since the entire heated air parcels is literally blown up shafts to the floor above by fans.
Without the fan, the air would still rise but not as efficiently. We must keep in mind that a furnace operates at essentially STP, where there is no pressure differential between floors. Our atmosphere represents a unique phenomenon where gravity acts to order air molecules in a negative pressure gradient, which orders air molecules by pressure, hence temperature, by altitude.
However, when you ask AI to explain, it offers the standard convoluted explanation which is essentially wrong. If there is the slightest horizontal convection force acting, or if rising air molecules move horizontally, the adiabatic idea gets thrown out the windows.
My main reason for posting it was that it confirms what I said is correct – in a rising parcel of air, thermal energy is converted to potential energy to counteract gravity which is trying to pull it back towards the ground.
As I see it, it’s not possible for the atmosphere to be isothermal without GHGs. If the thermal energy did not decrease with height, and instead remained the same, the fact that the potential energy increases with height would mean that the total energy would also be (inexplicably) increasing with height! Unless something else was somehow decreasing with height in perfect lockstep, but what?
It just plain doesn’t work.
Hypothetically eliminating radiation emitted from air means there are no longer tropospheric rising air parcels. Convection ceases when the now IR transparent air parcel is not warmed from below with air being at same steady state temperature as the planet’s surface.
My first paragraph was about a rising air parcel. My second paragraph wasn’t. It was about a column of air divided into lots of equal horizontal layers. Those layers could not possibly be of equal temperature, since as you ascend through the profile, the potential energy in each layer increases. That means that, unless the thermal energy in each layer is decreasing, the total energy of each layer would somehow be increasing!
You don’t even need to consider convection. The atmosphere without GHGs simply couldn’t be isothermal, due to gravity, and the increase in potential energy that occurs as you ascend through the profile, as a result of it.
5:03 pm: “the total energy of each layer would somehow be increasing”
… but not the thermodynamic internal energy of each non-convecting layer which would be constant (isothermal) up to the stratopause where the mesospheric temperature profile would take over. Potential energy is not temperature.
I never said, or even implied, that potential energy was temperature.
Ball4 fails to understand that the total energy of each layer could not possibly be increasing as you go up through the profile. Since the potential energy of each layer is increasing due to gravity, the thermal energy must decrease as you go up through the profile. Something has to decrease as you go up through the profile, to counteract the fact that the potential energy is increasing. If not the thermal energy, then what? That’s a rhetorical question, by the way.
2:22 am: “the thermal energy must decrease as you go up through the profile.”
No. The thermodynamic internal energy source of each layer is constant so the temperature profile up to the stratopause is constant at long term steady state. There is no convection and diabatic expansion of any rising air parcels since DREMT’s hypothesized atm. is completely transparent to radiation and steady at a constant T(z) (isothermal) in the stratosphere (i.e. no longer any troposphere where the air is constantly warmed from below causing convection in a gravity field with rising and descending air parcels).
DREMT is too limited in understanding basic meteorology (in many lost arguments about it for over a decade) to know DREMT 5:03 pm implied potential energy is temperature.
You are completely non-responsive to my argument.
nate…”“Where does the heat transported up in the troposphere by convection go?
Does it simply vanish?”
***
The heat cannot vanish completely as long as the molecules are still moving since heat is essentially the energy in motion we refer to as the KE of air molecules. However, heat is dissipated within the atmosphere by rising air molecules which lose KE, hence heat, as they expand into ever decreasing atmospheric pressure.
We dissipate a lot of solar within the atmosphere making less heat to be radiated away. That’s why our atmosphere remains warmer than it should be and that is the true greenhouse effect. A lot of heat is convected from the Equatorial regions poleward as Lindzen has explained. We benefit from that here in Vancouver, Canada where warmer air and ocean currents reach us from warmer climates. Keeps us some 20C warmer in winter.
Heat is not some magical entity that must be dissipated, it is related to the motion of air molecules that have acquired energy from solar energy directly and from a surface heated by it. The idea that heat can never be created nor destroyed is nonsense. We create it and dissipate it all the time.
Consider this. What would happen to an individual air molecule if it lost its upward velocity? It is always under the effect of an ever diminishing gravitational field and must begin accelerating toward the surface. There is a high likelihood that it will collide with another molecule en route and gain vertically upward momentum again.
I am sure there is an overall explanation but I have never read it. I think the explanation would be complex and not totally accurate.
“I am sure there is an overall explanation but I have never read it. I think the explanation would be complex and not totally accurate.”
HAHAHAHA
Isn’t that the most iconic statement that an ignoramus could ever utter?
When will this months (Oct) data be updated?
(Sep)s data would be nice.
BACK AT THE RANCH
Eboy’s pet commentator is trying to get Donald to save him from paying for the health condition he now has:
https://bsky.app/profile/razzball.bsky.social/post/3m4o5quzdk227
Looks like he will be winning bigly!
Willtard is the Lowest Scum of the human race
Eboy might also believe that paper beats rock:
https://bsky.app/profile/kateross.bsky.social/post/3m4qyrqca6c2p
Joe Biggs will always be there for Eastern Euros.
Google Gemini
If a vertical column of air which is adiabatically enclosed is in thermal equilibrium, is the temperature the same throughout the column or is there a temperature gradient along the direction of the gravitational field?
Answer:
A vertical column of air that is adiabatically enclosed and in thermal equilibrium has a uniform temperature throughout, meaning there is no temperature gradient.
The concept of an “adiabatic column in thermal equilibrium” is a specific thermodynamic condition. In a system in true thermodynamic equilibrium under gravity:
1/ The temperature is the same at all points of the column.
2/ The pressure and density will vary with height according to the barometric formula (hydrostatic equilibrium), but the average kinetic energy of the molecules (which defines temperature) remains constant with altitude.
3/ Any tendency for high-energy molecules to migrate upwards and lose kinetic energy to potential energy is exactly balanced by the fact that only high-energy molecules can reach higher altitudes in the first place, resulting in a constant average kinetic energy (temperature) at every height.
4/ If a temperature gradient existed, it would be possible to create a perpetual motion machine of the second kind (a violation of the second law of thermodynamics), using the temperature difference to do work.
The term adiabatic lapse rate (approximately 9.8 C per kilometer for dry air) describes the temperature change within a parcel of air that is rising or descending rapidly in the atmosphere without exchanging heat with its surroundings (an adiabatic process, not a state of equilibrium). This process results in a temperature gradient, but this is a dynamic, non-equilibrium condition that drives convection, not a stable thermal equilibrium state.
You guys ask the chatbot. I type questions directly into the Google search bar, and get the “AI overview” output. I did just that for your exact question, and received:
“There is a temperature gradient, meaning the temperature is not the same throughout the column. An adiabatically enclosed vertical column of air in thermal equilibrium will be warmer at the bottom and cooler at the top. This happens because gas molecules at higher altitudes have more gravitational potential energy, and as they move down, they lose this potential energy, which must be converted into kinetic energy, thus increasing the temperature.
Why a temperature gradient exists
Adiabatic process: An adiabatic process is one where there is no heat exchange with the surroundings. In this scenario, the air column is enclosed and considered isolated in terms of heat.
Gravitational potential energy: As air molecules rise, their gravitational potential energy increases. To conserve energy, their kinetic energy must decrease, leading to a lower temperature at higher altitudes. Conversely, molecules moving down gain kinetic energy, increasing their temperature.
Gravithermal effect: This phenomenon, also known as the gravithermal effect, demonstrates that a temperature gradient is a natural consequence of gravity in an adiabatic system.
Experimental evidence: Experiments have shown that a vertical air column in a gravitational field spontaneously develops a temperature gradient, with the temperature decreasing as the altitude increases.”
This was one of the papers that came up beneath the “AI overview” result:
https://www.nature.com/articles/s41598-022-10525-0
“The negative temperature gradient under gravity was observed with a vertical air column inside a practically insulated aluminum cylinder filled with sawdust.”
Not exactly an atmosphere with no GHGs.
Haven’t had time to read the paper properly, but on a skim through I didn’t notice any mention of the radiative properties of the air. Which might indicate they don’t consider them relevant to their experiment.
Arkady 1:51 pm, the isothermal solution is the classical one (from on or about ~1888 by several researchers). However, since nature seeks out the highest entropy end game, by at least 1998 a higher entropy solution was found. Now it is understood, at LTE, nature’s max. entropy solution would be T(z) i.e. not isothermal for your tall column of air adiabatically enclosed.
Your exercise shows that currently google search and Gemini have not yet gained access to all textbooks and properly published research papers. Today, an interested, critical, & informed person will still have to visit the college library stacks and do the research work with the help of a friendly librarian eager to ply their trade. This situation should improve at a moderate rate with the many $billions being spent on AI.
Ball4.
Please give me a specific reference, Title, chapter, and page number. The Google Gemini response agrees with the solution presented in “A paradox concerning the temperature distribution of a gas in a gravitational field” by Combes and Laue.
P.s.: The concept of LTE was introduced by Schwarzschild in 1906 in his study of stellar atmospheres. LTE is a non-equilibrium condition.
3:21 pm: By LTE is meant meeting necessary conditions for strict thermodynamic equilibrium which are no macro change with time of thermodynamic variables, no gradients of these variables, and no dependence of system on its history. Ref. Bohren & Albrecht 1998 text “Atmospheric Thermodynamics”, sec. 4.4, p. 164 which advances the adiabatic air column T(z) theory after your C&L 1985 et. al.
Ball4.
On page 167 Bohren & Albrecht 1998 makes clear that they are describing a process in a convecting atmosphere, clearly not what I described in my post above.
LTE means that molecular velocity and internal energy states are governed by the Maxwell-Boltzmann distribution at a single local kinetic temperature, because collisions dominate over radiative processes.
I would like to refer you to “Non-LTE Radiative Transfer in the Atmosphere” by Lopez-Puertas and Taylor (2001) for a good primer on LTE.
Ball4:
Your definition confuses global thermodynamic equilibrium (TE) with local thermodynamic equilibrium (LTE). Where from?
7:55 pm: This site limits my comments so not sure when I can ever reply or if this will even post. In climate studies, LTE is short for long term equilibrium as generally accepted and used in EEI work. Your ref. is paywalled so I can’t quickly find the author’s definition. Otherwise, the non-LTE situation is more commonly for upper atm. (low pressure, high solar) and the long-studied column of air is generally accepted as restricted to be tropospheric in nature (e.g. 1976 U.S. standard atm. 1013 hPa up to around 264 hPa).
Specifically, at 1:51 pm Arkady described “a vertical column of air” in which, of course, the actual tropospheric atmosphere would be subject to processes like convective mixing; at least up until the ultimate state of maximal entropy is attained in the stated enclosed column as B&A discuss.
Ball4:
In climate science LTE stands for Local Thermodynamic Equilibrium, as opposed to TE which is Global Thermodynamic Equilibrium. Taking detailed account of non-LTE processes is a must in remote sensing and modeling. B&A address LTE briefly on page 70.
Many good references are paywalled. You should take your own advice that “an interested, critical, & informed person will still have to visit the college library stacks and do the research work with the help of a friendly librarian eager to ply their trade.”
My original post in this sub-thread relates to the ongoing thought experiment in this month’s discussion about a hypothetical Earth atmosphere without GHGs. In such a scenario convection has ceased, and the follow up issue is whether gravity alone can cause a thermal gradient.
“In such a scenario convection has ceased, and the follow up issue is whether gravity alone can cause a thermal gradient.”
That’s not how I see this discussion as having progressed. I don’t see where it was ever agreed that convection would cease. I don’t see how the atmosphere could be isothermal even if it was stable, but I also can’t see how it would be stable in the first place!
Arkady, you specified a column of air. Air contains GHGs. You can specify no GHGs in your gas column if you wish. The T(z) will still produce entropy until it attains the maximum entropy possible.
.
Climate deals with long term equilibrium (LTE) not local equilibrium which is weather.
“Arkady, you specified a column of air. Air contains GHGs. You can specify no GHGs in your gas column if you wish. The T(z) will still produce entropy until it attains the maximum entropy possible.”
Not my thought experiment.
“Climate deals with long term equilibrium (LTE) not local equilibrium which is weather.”
The probability is exceedingly low (effectively nil) that someone genuinely versed in climate science would interpret LTE as “Long Term Equilibrium” rather than “Local Thermodynamic Equilibrium.”
It would be akin to a physicist mistaking QM for “Quantitative Methods” instead of “Quantum Mechanics.”
For a memory refresher, Arkady 1:51 pm specified: “If a vertical column of air…”
Ball4.
I don’t mean to be pedantic, but I must point out the ambiguity of using LTE to mean both Local Thermodynamic Equilibrium (the true meaning) and Long Term Equilibrium (your implied meaning).
At Thermodynamic Equilibrium T(z)=〈T〉, but at Local Thermodynamic Equilibrium T(z)≠〈T〉.
Just the facts.
Arkady 7:08 am, it doesn’t matter what you want to call it, your isolated column of (commonly standard tropospheric) air will eventually reach T(z) (the dry-adiabatic profile) since its entropy production will then cease at the maximum achievable entropy.
“your isolated column”
You’ve been answering the wrong question. Regardless, I’ve made my point clearly I think. Thank you for your attention to this matter.
“This process results in a temperature gradient, but this is a dynamic, non-equilibrium condition that drives convection, not a stable thermal equilibrium state.“
Why does anybody think there would be no convection without GHGs, by the way? I don’t see how the atmosphere is going to be “stable”, in any case. As Clint R pointed out:
“Sun heats the surface, unevenly. The hot spots cause air to rise. Cool air at altitude then falls. The atmosphere would NOT be stable.”
Then, when the Sun goes down, what happens to the “stability”? Same when it rises in the morning? What about air currents, advection? Do people think GHGs are responsible for everything?
How about the fact that nitrogen and oxygen still emit a little, anyway!?
“Why does anybody think there would be no convection without GHGs, by the way?”
I don’t know about anybody else, but here’s a summary of my reasoning regarding this thought experiment.
Because without GHGs the atmosphere would not cool or heat by radiative transfer, the principal mechanisms would be conduction (slow and inefficient) and turbulent mixing from the surface.
However, in this scenario with a ~255 K surface temperature, an air parcel near the surface would generally not become buoyant enough for sustained convection because the temperature excess relative to the layer above is small; and removing water vapor from the atmosphere further reduces the density contrast because moist air is lighter than dry air.
Daytime thermals would be confined to a shallow, near-surface, layer and would not create the same tropospheric overturning characteristic of a GHG-dominated atmosphere.
With no water vapour, and thus no clouds, the surface during the daytime could be experiencing the full 1,361 W/m^2 from the Sun…
…seems like that’s more than enough for an air parcel near the surface to become buoyant enough for sustained convection…
Please clarify.
Are you saying that a frozen Earth would have a zero albedo?
DREMT 3:43 am, the surface and transparent atm. are the same temperature so the gas is no longer warmed from below in a gravity field thus convection becomes nil at equilibrium.
Clint R is as usual not schooled enough to know the troposphere is eliminated as atm. is transparent and the gas at ground level becomes the lower isothermal stratosphere. Read what Arkady writes about the process and do not be duped by Clint R.
“…a frozen Earth”? You’re assuming your conclusion as a premise.
“…so the gas is no longer warmed from below”
With the ground potentially heated to temperatures in excess of 100 degrees C in the daytime, the gas most certainly will be warmed from below.
Since you didn’t answer my question, I asked your assistant.
Google: Would the Earth have a zero albedo if all the greenhouse gases were removed from the atmosphere?
Answer: No, removing greenhouse gases would not make Earth’s albedo zero; in fact, the albedo would increase significantly as the planet would become a “snowball” frozen by the lack of the greenhouse effect. Albedo measures the reflectivity of a surface, and while greenhouse gases primarily affect heat retention, the resulting temperature change would drastically alter Earth’s albedo.
You’d struggle to have snow with no water vapour or clouds. Plus, the oceans would be getting a heck of a lot more sunlight without cloud cover. So no, Google gets that one wrong I’m afraid.
Of course, albedo would not be zero. The oceans cover a lot of the Earth’s surface, though, and the albedo for them is something like 0.06.
Let me make sure I understand your point; you believe that removing all GHGs from Earth’s atmosphere would warm the planet?
You’d struggle to have snow with no water vapour or clouds. Plus, the oceans would be getting a heck of a lot more sunlight without cloud cover. So no, Google gets that one wrong I’m afraid.
Of course, albedo would not be zero. The oceans cover a lot of the Earth’s surface, though, and the albedo for them is something like 0.06.
Google: what do you call a person who believes that removing all GHGs from Earth’s atmosphere would warm the planet?
Answer: There is no standard term for someone who believes removing all greenhouse gases (GHGs) would warm the planet, as this idea contradicts the established scientific consensus that GHGs trap heat, thus warming the planet. However, one could describe such a person as a climate change denier or an individual holding a misguided belief about the greenhouse effect.
Good God!
DREMT 10:35 am: With the ground potentially heated to temperatures in excess of 100 degrees C in the daytime, the gas most certainly will also be at 100C thus nil convection once long term equilibrium is reached. Curious – what albedo did you use to get 100C?
Depends, Ball4. Asphalt has an albedo of approx. 0.05 and so could reach a potential temperature of 389.5 K or about 116 C. Desert sand is more like 0.35 and so could reach a potential temperature of about 354 K or 81 C.
You’ll struggle to get “long term equilibrium” given that the Sun will go down every 24 hours.
Arkady, I thought we were discussing “would there be convection in an atmosphere without GHGs”, not “would the Earth be warmer or cooler without GHGs”.
So far nobody has even remotely dealt with the points I made in my comment of 3:43 AM.
So DREMT doesn’t know what albedo computes to 100C at equilibrium, I was fairly sure that was the case.
“Arkady, I thought we were discussing “would there be convection in an atmosphere without GHGs”, not “would the Earth be warmer or cooler without GHGs”.”
At 8:29 AM you said that “With no water vapour, and thus no clouds, the surface during the daytime could be experiencing the full 1,361 W/m^2 from the Sun…”
And the at 10:35 AM you said “With the ground potentially heated to temperatures in excess of 100 degrees C in the daytime…”
So, are you not saying that removing all GHGs from Earth’s atmosphere would warm the planet?
All paleoclimate evidence indicates cooling with lower GHGs in the atmosphere. Please show your evidence to the contrary.
Ball4 is confused…I said, “in excess of 100 degrees C” and I just showed him what albedo could achieve that. It will be noted by astute readers that he had no response to my comment about his “long term equilibrium”.
Arkady is also confused. Arkady said, “however, in this scenario with a ~255 K surface temperature, an air parcel near the surface would generally not become buoyant enough for sustained convection”, and my point has been to show how much warmer the surface can be heated by the Sun than 255 K, especially given the conditions of the thought experiment, thus demonstrating that her statement is wrong.
Arkady has taken the fact that without water vapour, and thus clouds, the oceans would receive a heck of a lot more sunlight and also that there could be no snow to mean that the Earth would be warmer without GHGs, but note that is her inference, not mine. A discussion about whether the Earth would be warmer without GHGs is a distraction from the point of contention, which is whether there would be convection in an atmosphere without GHGs.
It will be noted by astute readers that nobody has even remotely dealt with the points I made in my comment of 3:43 AM. Currently then, as it stands, we’re to assume there would be convection in an atmosphere without GHGs.
I suppose it might be interesting to some (not just Ball4) that if the albedo of the ground is below 0.19, then that surface will warm to a maximum potential temperature of over 100 C.
“Arkady has taken the fact that without water vapour, and thus clouds, the oceans would receive a heck of a lot more sunlight and also that there could be no snow to mean that the Earth would be warmer without GHGs, but note that is her inference, not mine. A discussion about whether the Earth would be warmer without GHGs is a distraction from the point of contention, which is whether there would be convection in an atmosphere without GHGs.”
DREMT believes that Earth without GHGs would have a much lower albedo. She provides no evidence for her counterintuitive reasoning.
Paleoclimate studies contain evidence of a higher albedo. If albedo remains at 0.30 (unlikely) mean global surface temperature would be -18.5 C, much lower than the -2 C freezing point of sea water. Earth’s surface is 71% ocean, and bare ice has an albedo of about 0.60.
It’s not very difficult to calculate the albedo of a “snowball” Earth: 0.6*0.71+0.05*0.29=0.44 which gives 237 K (-36.2 C).
She needs to calculate how deep the convective layer would be in such a scenario. I suspect it will not reach 1 meter.
I’m a “he”, Arkady. I’m assuming you are a “she” given that your real name was revealed to be “Sabine”.
I’m sorry, but I don’t understand how paleoclimatic evidence about our real Earth can tell you something about a hypothetical Earth with no GHGs in the atmosphere. Do you dispute the logic that with no water vapour in the atmosphere, and thus no clouds:
1) There would be no snow.
2) The oceans would receive more direct warming from sunlight than they do on our real Earth.
How would the oceans freeze receiving more sunlight than they do currently!? They would receive all that SW energy during the day, to depth in the water, and then (without evaporation being allowed since water vapour cannot exist) they can only cool through radiation to space and via conduction to the air in contact with them. In other words, they would have one way less to cool and more heat input than with our real Earth!
DREMT 3:45 pm fails meteorology 101 yet again: “You’ll struggle to get “long term equilibrium” given that the Sun will go down every 24 hours.”
Me stuggle? No such struggle, nature already shows us long term equilibrium (climate timeframes) even with the diurnal cycle nil convection would be achieved at the planetary surface with radiatively transparent atm. eliminating the current troposphere.
—–
DREMT 11:32 pm & again 7:52 am: “Arkady has taken the fact that without water vapour, and thus clouds, the oceans …”
The oceans? No DREMT, you are still confused in that situation, there will be no oceans to freeze “without water vapour” from those oceans in the gas.
“I’m a “he”, Arkady. I’m assuming you are a “she” given that your real name was revealed to be “Sabine”.”
Feel better now? Now can you answer the question? Please and thank you.
“I’m sorry, but I don’t understand how paleoclimatic evidence about our real Earth can tell you something about a hypothetical Earth with no GHGs in the atmosphere.”
Let me Google that for you
I never said there would be snow.
The oceans would not receive more direct warming because total a b s o r b e d solar energy is fixed by planetary geometry and albedo, independent of atmospheric composition. I shouldn’t have to remind a Postma apostle that Earth does not receive sunlight as a flat surface and removing GHGs does not change the cos(θ) geometry. Further, global mean surface temperature would drop to -18 C and the ocean surface would become more reflective not less.
Ball4 continues his arguments by assertion.
Now he is claiming there would be no oceans! No need to throw the baby out with the bathwater. Just getting rid of water vapour will do, for the purposes of the thought experiment.
Arkady, the oceans would receive more direct sunlight than they do currently because there would be no cloud cover. With no evaporation, they would have one less means of cooling. No way they are going to freeze, sorry.
11:03 am: No need to throw out the cloud water droplets with the water vapor then. Keep making up DREMT’s own physics and DREMT can support any answer imaginable, sorry. Even can imagine no way for more freezing of oceans where temperatures are everywhere 18C less than today on avg. as humorously does DREMT.
—-
Arkady – local college library doesn’t have your ref., I’ll have to look state wide.
“The oceans would not receive more direct warming because total absorbed solar energy is fixed by planetary geometry and albedo, independent of atmospheric composition…”
Just in case this was somehow not clear to anybody, when you remove cloud cover, and snow, the planetary albedo will (of course) decrease. It would only increase again if the oceans froze. Which they’re not going to, because they would be receiving more direct sunlight, and would have one less means of cooling.
It’s like pulling teeth.
“… the planetary albedo will (of course) decrease.”
How much? Just check out a reliable college beginning meteorology text & actually read the relevant sections – which for DREMT is more painful than pulling teeth.
No water vapour, no clouds, Ball4. If you remove the oceans as well, Arkady won’t get her attempt at arguing for a “frozen Earth” without GHGs! You’re shooting your own “team member” in the foot again.
“…where temperatures are everywhere 18C less than today on avg.”
You guys really don’t understand “circular reasoning”, do you?
“How much?”
Let’s look at the area of interest – the oceans. Google tells us:
“The average albedo of the oceans, when including natural cloud cover above them (the "all-sky" albedo), is significantly higher than that of the clear-sky ocean surface alone. The albedo over ocean areas with typical cloudiness is approximately 0.3 (or 30%), which is similar to the Earth’s global average albedo.”
So, it’s 0.3 with cloud cover, and approx. 0.06 without cloud cover. A reduction in albedo of 0.24 for the oceans. They will also have one less means of cooling. Yet, you think they would freeze without GHGs. Sure.
No circular reasoning. With planetary albedo at the customary 0.30, atm. emissivity set to 0.0, 240 SW in and 240 LW out of the earthen control volume, the thermodynamic internal energy balances out to where it is 18C less temperature on average for the whole earthen surface at long term equilibrium.
DREMT really doesn’t understand using “faulty reasoning” will be opposed, do you? I do realize I may be approaching my chat count limit.
DREMT.
Feel better now? Now can you answer the question? Please and thank you.
Provide a credible citation for your claim that “With no water vapour, and thus no clouds, the surface during the daytime could be experiencing the full 1,361 W/m^2 from the Sun.“
DREMT has painted herself into a corner where her only outlet is if the oceans don’t freeze in a global mean surface temperature of -18 C world.
The question of whether the 255 K temperature applies to the surface or whether it should be considered to apply to some level of the atmosphere is one that we’re trying to answer by looking at this thought experiment. Assuming it applies to the surface is taking your conclusion as your premise.
But, we’re nowhere near answering that question because we’re currently only in a discussion about whether convection would occur in an atmosphere without GHGs.
And, we can’t even proceed with that because we’re hung up on this “frozen Earth” issue.
Arkady, if there’s no GHGs or clouds in the sky, the surface is potentially exposed to the full 1,361 W/m^2 from the Sun, at certain times/locations. Of course, the surface will reflect some of it. There’s really no need for a citation on something that is obviously correct.
Ball4 at 1:19 PM
Most university libraries have Interlibrary loan programs (ILL).
DREMT.
“whether the 255 K temperature applies to the surface or whether it should be considered to apply to some level of the atmosphere”
Conservation of energy applies. ✓
Without GHGs in the atmosphere, emissions to space can only come from the surface. ✓
“if there’s no GHGs or clouds in the sky, the surface is potentially exposed to the full 1,361 W/m^2 from the Sun, at certain times/locations.”
1 m² out of 510,000,000,000,000 m² at certain times/locations (subsolar point) is a pittance. ✓
“whether convection would occur in an atmosphere without GHGs”
Only a shallow convective layer, if any, can exist. ✓
“There’s really no need for a citation”
Hitchen’s razor applies. ✓
“Without GHGs in the atmosphere, emissions to space can only come from the surface.”
Nitrogen and oxygen still emit, Arkady.
“1 m² out of 510,000,000,000,000 m² at certain times/locations (subsolar point) is a pittance”
Silly to claim it’s only 1 m^2. A large chunk of the surface (more like 10%) would receive that full amount, or close to it, at any one moment; and the Earth rotates.
“Only a shallow convective layer, if any, can exist”
Argument by assertion, again.
Actually, I got the percentage receiving the zenith flux (or close to it) wrong.
According to Google:
“The portion of the Earth’s surface that receives over 90 percent of the maximum possible zenith flux (when the sun is directly overhead in a clear sky) at some point during the year is the area between the Tropic of Cancer (23.5° N) and the Tropic of Capricorn (23.5° S), known as the tropics.
This region accounts for approximately 39.8% of the Earth’s total surface area.”
“Nitrogen and oxygen still emit, Arkady.”
Within Earth’s LWR spectrum, Oxygen has one minor a b s o r p t i o n band centered at 6.4 μm; which a b s o r b s ~0.3% of the surface emission, and Nitrogen has an extremely weak far-IR band that a b s o r b s ~0.025%.
Without GHGs in the atmosphere, ~99.7% of emissions to space come from the surface.✓
“Silly to claim it’s only 1 m^2. A large chunk of the surface (more like 10%) would receive that full amount, or close to it, at any one moment; and the Earth rotates.”
The subsolar point is the point at which the Sun’s rays strike the planet exactly perpendicular to its surface. The subsolar point constantly moves westward with a speed of 444 m/s.
1 m² out of 510,000,000,000,000 m² at the subsolar point for one second is a pittance.✓
“Argument by assertion, again.”
Every accusation you make sounds like a confession.✓
Actually, I got the speed of the subsolar point wrong.
According to Google:
“Its speed is not a constant 444 m/s. The speed of the subsolar point across the Earth’s surface is approximately 465 m/s (1674 km/h or 1040 mph) at the equator, and decreases towards the poles. The value of 444 m/s (approx. 1600 km/h) is an approximate speed often used, but it’s not a constant universal speed and specifically varies with latitude.
Additionally, the subsolar point also moves north and south between the Tropic of Cancer and the Tropic of Capricorn over the course of a year, appearing to spiral like a helix.”
“Without GHGs in the atmosphere, ~99.7% of emissions to space come from the surface”
Right, so there’s emission from the atmosphere. Which means the question of whether the 255 K figure should apply to the surface or some level of the atmosphere is still open to debate. Since the oceans are not going to freeze, and they account for approx. 70% of the Earth’s surface area, it seems unlikely you’re going to get your 255 K at the surface. So…something’s definitely wrong with your thinking.
“1 m² out of 510,000,000,000,000 m² at the subsolar point for one second is a pittance“
Even sillier, and completely non-responsive to this:
“The portion of the Earth’s surface that receives over 90 percent of the maximum possible zenith flux (when the sun is directly overhead in a clear sky) at some point during the year is the area between the Tropic of Cancer (23.5° N) and the Tropic of Capricorn (23.5° S), known as the tropics.
This region accounts for approximately 39.8% of the Earth’s total surface area.”
One problem with your thinking is that the 255 K number is wrong, in any case, whether you applied it to the surface or to a layer of the atmosphere. Without GHGs, and thus no cloud cover, the albedo is not going to be 0.3. As the albedo of the oceans is 0.06, we could try using that value in our calculations of the effective temperature. That would give us approximately 273.7 K or 0.55 °C. Further evidence that the oceans would not freeze. That doesn’t even consider the fact that they would have one less means of cooling, of course.
“something’s definitely wrong with your thinking.”
Another accusation that reads like a confession.
Emission to space would be 239.28 W/m² from the surface, and 0.72 W/m² from the atmosphere.
I actually thought you could do this math. I’m disappointed.
No cloud cover, no oceans, DREMT. Whatever albedo can be supported allows for a near surface global avg. T to be supported.
Paleoclimate evidence indicates that without GHGs, Earth would cool below the freezing point of water and enter a high-albedo glacial state.
During the Last Glacial Maximum (CO2 ~ 180 ppm), the planetary albedo rose to about 0.33-0.34. In Neoproterozoic Snowball-Earth episodes (CO2 ~ 10 ppm), it likely reached 0.45-0.60.
My reasoning remains physically bounded rather than a purely speculative thought experiment.
Oh, I thought you understood Postma’s argument. My mistake!
In fact, you don’t even seem to understand the argument of your own “team”!
“Emission to space would be 239.28 W/m² from the surface, and 0.72 W/m² from the atmosphere…”
Just silly. On our real Earth, currently it’s estimated that only up to 12% of the total Outgoing Longwave Radiation (OLR) comes from the surface itself. So, by your logic, that means the surface only emits 28.8 W/m^2!
That’s not how it works, Arkady. Either you’re just ignorant, or you’re trying to deceive others…
Present Day Earth:✓
Surface emission= 398.2 W/m²
OLR= 240 W/m² of which ≈40.1 W/m² is from the surface.
Without GHGs:✓
Surface emission= 240 W/m²
OLR= 240 W/m² of which ≈239.28 W/m² is from the surface.
I’m sorry I didn’t realize you had dyscalculia sooner. I understand better now why certain things were challenging. My mistake!✓
At this moment, on Saturday, 8 November 2025, the Subsolar Point is at Latitude: 16° 49′ South, Longitude: 126° 12′ West, moving westward with ground speed of 391.15 m/s.
“Without GHGs:✓
Surface emission= 240 W/m²”
You’re still using your conclusion as a premise. You haven’t in any way established what the surface temperature would be, but the 240 W/m^2 correlates to 255 K. We know it can’t be 255 K, because that’s based on an albedo of 0.3. The albedo without GHGs won’t be 0.3. It won’t be higher than 0.3, as the oceans won’t freeze for the reasons I’ve explained, and you haven’t rebutted. Also, the effective temperature applies to the “mass average height” in the atmosphere, not the surface. Other than that, you’re doing great.
3:06 pm: “… as the oceans won’t freeze for the reasons I’ve explained, and you haven’t rebutted.”
Geological history revealing past snowball Earth rebuts DREMT so DREMT’s reasons are faulty. DREMT can pick a global albedo consistent with reduced atm. IR active gas to reasonably balance system control volume in and out W/m^2 with a reasonable earthen global avg. OLR and OSR at the time.
Throughout the known “geological history” you’re referring to, there has been water vapour along with the water. There has thus been cloud cover to prevent the oceans from receiving the full amount of heat from the Sun, and evaporation alongside the other means of cooling. So no, “geological history” is no rebuttal to what I’ve said.
DREMT issues a self rebuttal, thx. No clouds, no oceans DREMT.
Tell that to Arkady, Ball4. You’re the only one here who thinks getting rid of water vapour means the oceans have to go, too.
This particular discussion was meant to be about “would there be convection in an atmosphere without GHGs”. Since nobody can rebut the points made in my original post (3:43 AM) I guess we can conclude there would be convection.
That’s wrong DREMT, your imagination is rebutted by hard geological evidence showing higher reflectivity, lower atm. emissivity from less IR active gas for a lower global avg. T than today’s.
Incorrect, as already explained.
As explained only in DREMT’s faulty imagination & not with physical evidence.
Yeah, right.
Ball4’s comment at 8:12 PM is consistent with the Kirschvink (1992) hypothesis in that it raises the surface albedo and sets the stage for a snowball event.
At this moment, 8:29 AM, on Monday, 10 November 2025, the Subsolar Point is at Latitude: 17° 19′ South, Longitude: 40° 26′ West, moving westward with ground speed of currently 442.90 m/s.
Ball4’s 8:12 PM comment:
“DREMT issues a self rebuttal, thx. No clouds, no oceans DREMT.“
Now Arkady pictures a “snowball Earth” with no water whatsoever! Remarkable.
Ball4 at 8:10 PM, DREMT’s problem is not understanding the world as it is and thus being unable to imagine a world very different from the one we currently live in, let alone imagine many worlds that are all very different from this one and each other.
At this moment, 11:48 AM, on Monday, 10 November 2025, the Subsolar Point is at Latitude: 17° 21′ South, Longitude: 90° 02′ West, moving westward with ground speed of currently 442.81 m/s.
Personal remarks mean the point is conceded. Great!
Great. I accept your concession! I’ll re-iterate my unrebutted point for the benefit of the lurkers:
At this moment, 2:01 PM, on Monday, 10 November 2025, the Subsolar Point is at Latitude: 17° 23′ South, Longitude: 124° 17′ West, moving westward with ground speed of currently 442.75 m/s.
Readers can just scroll up to see the complete annihilation of your argument. Thanks again for your concession, it’s a pleasure to beat such a charming young lady in a battle of wits.
DREMT 3:12 pm can only annihilate Arkady’s argument in DREMT’s faulty imagination since Arkady’s argument is based on actual physical evidence.
—–
Arkady –
Lopez-Puertas book came in & the very first paragraph sec. 1.1 has his LTE being defined as local applying to an air parcel. Long term equilibrium then is applied to climate usually as a steady state.
Proven liar and notorious climate troll Ball4 waits until he thinks the coast is clear to try and slip a last word in.
Personal remarks mean my point is conceded by DREMT. Great!
You don’t have a point. All you do is obsessively stalk me from thread to thread, and you just sort of, “say anything” with no regard for truth whatsoever.
I typed the question directly into tbe Google search bar.
Answer:
“There is no temperature gradient; the temperature is the same throughout the column in a state of true thermodynamic equilibrium. While individual molecules’ kinetic and potential energy change with height, thermal equilibrium requires the average kinetic energy (and therefore temperature) to be uniform at all points in the column.”
…and, that might well be right. Although, it’s arguing against experiment.
In any case, we’ve moved on from that, I think.
Nate 11:06 am, google has only found the classical answer. Modern research has shown the isothermal situation will still produce entropy right up to the max. entropy possible at which point the column becomes T(z).
Found the modern research for me, no problem.
There is not any AGW on our planet Earth!
–
And, our planet is not warmed by the atmosphere. There is not +33°C atmospheric greenhouse effect either. The +33°C is a tragic mistake.
See about the Rotational Warming Phenomenon first.
Link: https://www.cristos-vournas.com
According to the National Bureau of Economic Research, every one degree climb in temperature knocks 20% off GDP. The paper concluded that by the end of the century people may well be 50% poorer than they would’ve been if it wasn’t for climate change.
https://www.nber.org/system/files/working_papers/w32450/w32450.pdf?utm_campaign=PANTHEON_STRIPPED&%3Butm_medium=PANTHEON_STRIPPED&%3Butm_source=PANTHEON_STRIPPED
US Army Tells Soldiers to Go to German Food Bank, Then Deletes It.
https://taskandpurpose.com/news/army-german-food-banks/
American soldiers asking for a handout from Germany. This is embarrassing.
The military hasn’t been paid in 37 days.
Air Traffic Controllers haven’t been paid in 37 days.
Park Rangers haven’t been paid in 37 days.
FDA Food inspectors haven’t been paid in 37 days.
Federal workers haven’t been paid in 37 days.
TSA agents haven’t been paid in 37 days.
Senate Staffers haven’t been paid in 37 days.
Federal contractors (janitors, food service, security, etc) haven’t been paid in 37 days.
Who IS getting paid? Trump and the Congress responsible for the shutdown.