
 Home/Blog
NOTE: This post has been superseded by this one in which I remove inter-station biases with a new station merging strategy.
SUMMARY
- Over the period 1900-2023, the average summer (JJA) daily high temperatures across the six southernmost large provinces of Canada (British Columbia, Alberta, Saskatchewan, Manitoba, Ontario, and Quebec) show no trend.
- The average of the 3 hottest days’ in each month month show a slight downward trend, while the 3 coolest days’ average temperature per month shows a slight upward trend.
- Recent years have generally averaged as warm as was experienced in the 1920s to 1940s, with 7 of the 10 hottest summers occurring in the 1930s.
- Results for the 6 provinces separately are also presented.
Introduction
Given media reports, it is likely that most Canadians think they have been experiencing unprecedented summer warmth in the last couple of decades. But this isn’t true.
Below I present analyses of daily high temperatures (Tmax) from all available stations in the 6 southernmost large provinces, based upon the daily Global Historical Climate Network (GHCNd) dataset. These are the 6 provinces that border the Lower 48, and contain 86% of Canada’s population.
I simply averaged together the relevant statistics (monthly average Tmax, average of the warmest 3 days in each month, and average of the coolest 3 days in each month) from all available stations. Each station had to have at least 90% of the days in a month reporting data for that month to be included in the analysis.
Since stations come and go over the years, and since there are some large terrain elevation variations in western Canada, I performed an elevation correction to these Tmax metrics, in all provinces, using the departure of each year’s station-average elevation from the all-year (1900-2023) station average elevation, using a lapse rate of 6.5 deg. C per km. Corrections for average changes in station-average latitude were not done, which might be necessary in the winter since there are large North-South gradients in air temperature then. Such corrections in the summer would likely be small, but I can revisit that nuance at a later time.
Results
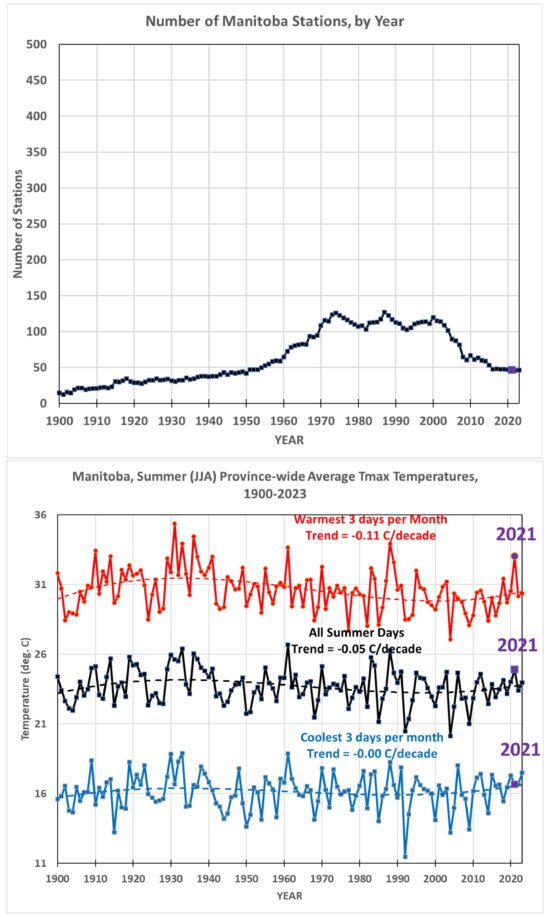
I’ll start with the 6-province average Tmax temperature time series, along with the total number of stations available in each year. In all plots that follow, I list the linear temperature trends, but plot a 3rd order polynomial fit to the data which captures the dominant feature of relative warmth in the 1920s to 1940s and in the most recent decades, but relative coolness in the intervening decades. In all provinces the number of stations increases from 1900 to the 1970s, then decreases substantially in recent years.
As can be seen in the first plot (averages for all 6 major provinces), there has been no long-term linear trend in the average summertime Tmax (0.00 deg. C/decade), a small downward trend in the 3 hottest days per month (-0.02 deg. C/decade), and a slight warming trend in the 3 coolest days per month (+0.03 deg. C/decade). Relative warmth around the 1930s is evident, as well as warming in recent years.
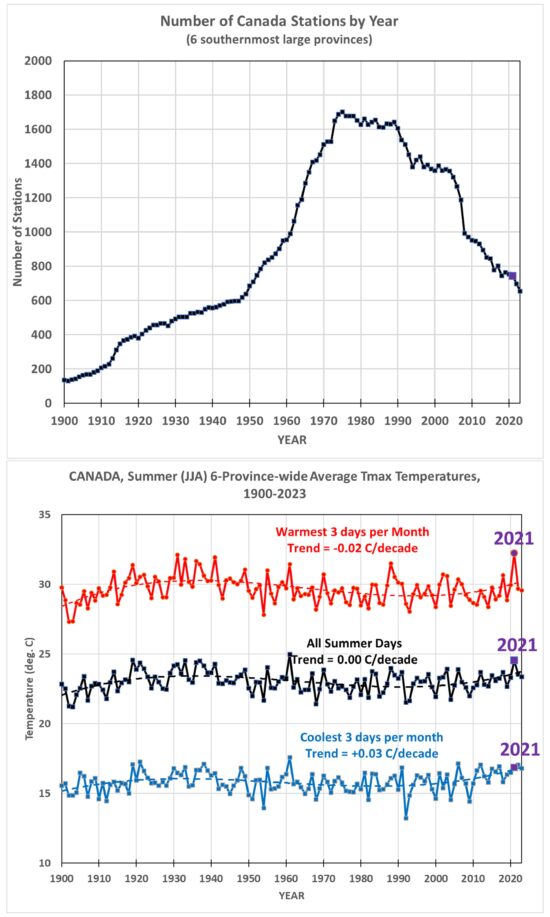
I have also annotated 2021, which experienced the extreme heatwave in late June in western Canada. While that pushed the hottest 3-day average Tmax metric (red curve) to the highest average temperature of any year since 1900, the 3-month (all-days) average summer Tmax temperatures was very close to other years (3rd place, behind 1961 and 1919).
Notably, 7 of the 10 hottest summers occurred in the 1930s.
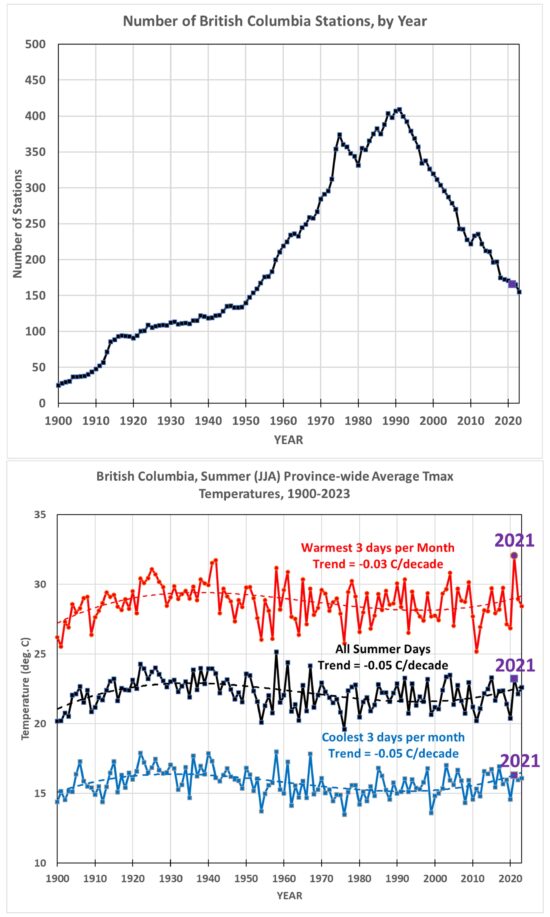
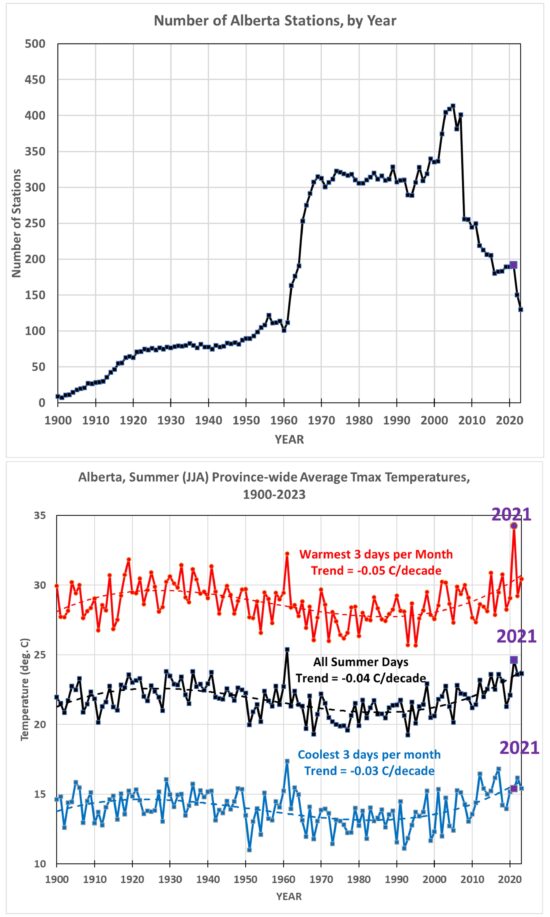
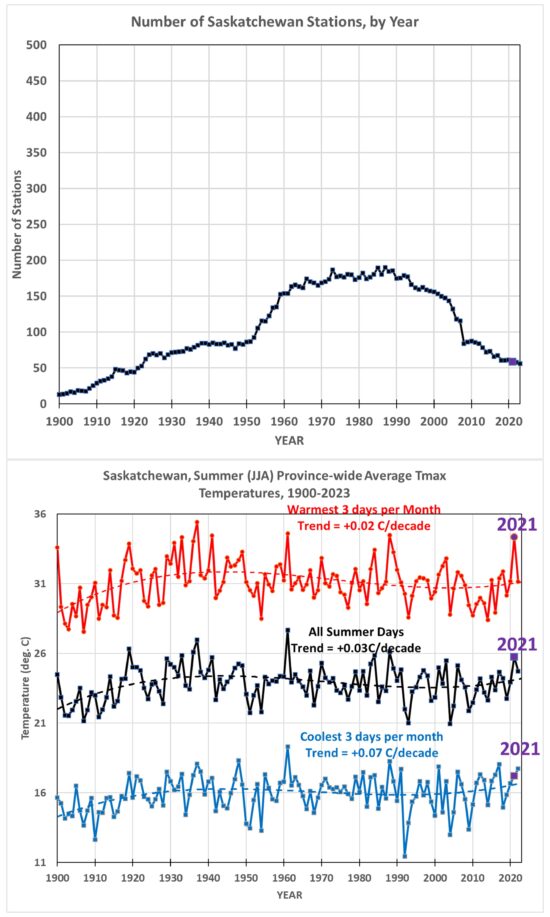
Individual Provinces
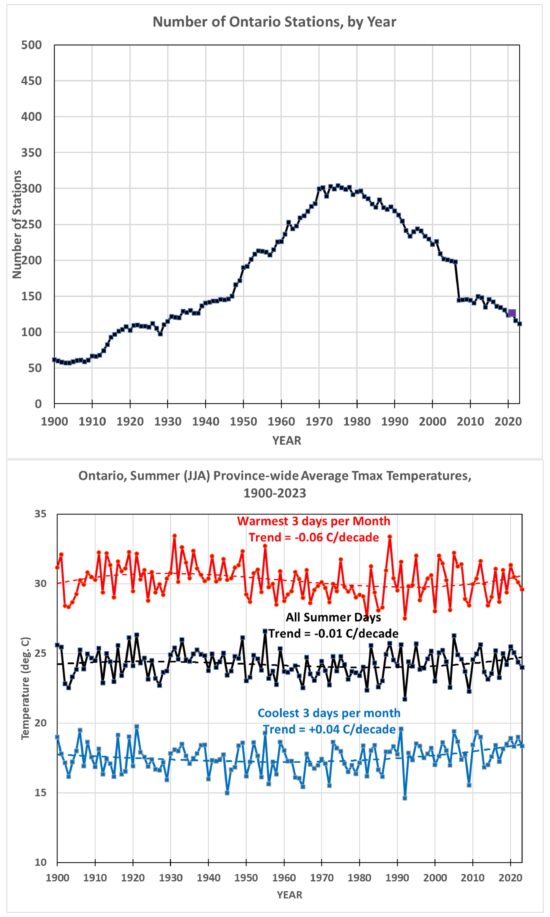
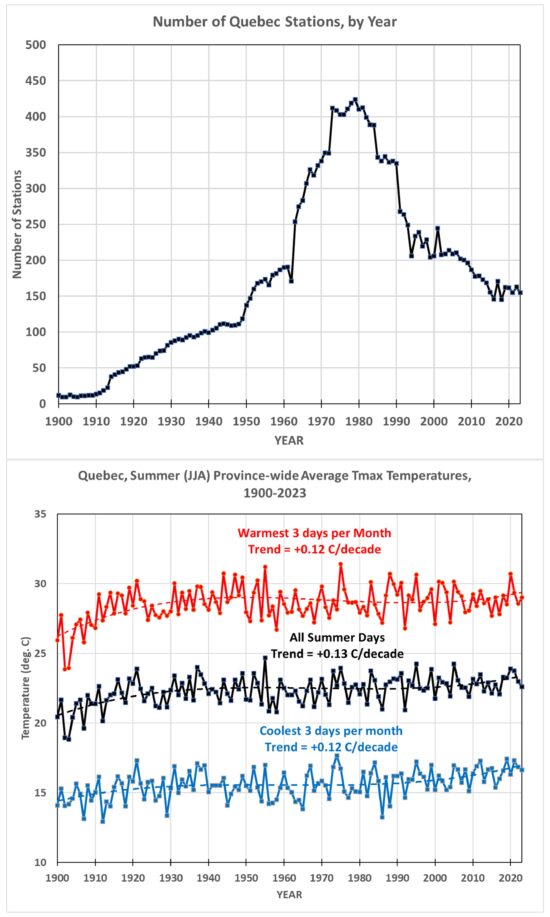
The results for the individual provinces follow. I present them without comment; my Canadian friends can peruse the results for their home province if they wish. These are presented from West to East:


I worked to 69 and 10 months as an envr engineer. I am 71 now and reading your works helps to stimulate my remaining neurons. I am fortunate that my local western IN meteorologist of 40 years experience always presents a n historic perspective. Thank you for doing this. Also Doc Curry
I believe a similar analysis of Tmin will show the opposite effect. Many have fear that Tavg increasing means temperatures are getting warmer across the board, but the reality is the range in temperature is narrowing, more so on the cold side.
This is also consistent with your analysis of continental US temperatures a few years ago. Tmax was trending lower.
I’m still not sure of the logic of only looking at the 3 hottest days in each calendar month. It means that a 9 day heatwave in the middle of July will only have 3 of it’s days counted, but if it starts at the end of July and finishes in August it may have 6 of it’s days counted.
And I’m really not sure how accurate these comparisons are if you are just averaging all stations, even allowing for elevation.
“Bellman: And I’m really not sure how accurate these comparisons are if you are just averaging all stations, even allowing for elevation.”
Using per station anomalies and area weighting are obvious and well-accepted approaches to addressing these issues as has been extensively documented in the literature.
Were this post done by an amateur the methodology would be dubious. That it’s done by a subject matter expert ought to be embarrassing, but here we are.
OTOH, you can have 2 back-to-back days with exceptionally high temperatures every 3 days throughout the month, and a heat wave will never have occurred. OR… if you make the threshold for a “heatwave” sufficiently high (say, above the 99th percentile), a 0.5 deg. C rise in average temperature can suddenly cause 5x more heat waves! Ahh, the magic of statistics!
But seriously, the average for the entire month would reflect what you are talking about… right??
I have lived in many places across Canada … I notice a big long wave in all the readings and wonder if that corelates to anything like the earths’ obliquity ???
I think that a running average of a week or two might give a better result It might get rid of some of the recent helter skelter ! But if I recall from childhood in Ottawa in the 60s and 70s, we did have longer hot spells in the summer 🙂 And huge snow falls in the winter… I can remember shoveling the roof because of the snow loads a few winters and then tobogganing from the peak to the road without having a drop at the eaves trough 🙂
I don’t think there is any perfect way of measuring heatwaves. It depends to an extent on what aspects you are interested in. But my main objection in this case is to the arbitrary calender month aspect. You could for instance look at just the average of the 9 warmest days regardless of month. Or look for the three warmest consequtive days.
Regardless, I doubt it will make much difference to the long term trend, which ever method is used.
Mr Spencer
Why does a honorable, experienced scientist like you, who ALWAYS used since decades anomalies removing the annual cycle when presenting UAH data, suddenly begin, since about a year or so, to present statistics based on a little few absolute TMAX values?
This is the continuation of a blind-alley which started long before the Death Valley nonsense.
This, Sir, is absolutely incredible.
I apologize for this reaction, but you discredit yourself, not only in my personal, layman opinion.
The author’s focus on extremes is somewhat opaque to me, as well. But if it’s such discreditable garbage, why not the refute his ‘all summer days’ curve, intermediate between max and min, and closely correlative?
The Canadian weather agency provides seasonal temperature trends here:
https://www.canada.ca/en/environment-climate-change/services/environmental-indicators/temperature-change.html
While they show data only from 1948 rather than 1900 as does Dr Spencer’s post, there is a clear and significant warming trend for summer across the country and across each province.
The details of creating the gridded dataset used in their analysis and discussion of the potential pitfalls of using non-homogeneous station measurements is here:
https://www.tandfonline.com/doi/full/10.1080/07055900.2025.2516796
So the generous interpretation of this analysis is that Dr Spencer unwittingly stepped into a number of these well documented pits.
Good Morning Bindindon,
I may have misread Dr Spencers post, but I believe he was attempting to alleviate fear from the Canandian populous from misunderstanding media reports of warmer summers. No one gets ready to go outside and says hey honey what is the anomoly today, should I wear a t-shirt or a sweater? Absoulute temperature is more appropriate for this.
As far a critique on averaging multiple sites, perhaps a single site analysis would be better for each site to see if any are experiencing a warming trend in any particular location. However, this result does not surprise me at all. You and I had this discussion many years ago on Tmax and it really is consistent with the effect that an Atmosphere has on incoming solar radiation and outgoing terrestrial radiation and the changing of atmosheric dynamics.
A simple example is 2 houses in a desert. One well insulated and one not. No HVAC, the house that has no insulation will exhibit extreme temperatures inside, 0 to 40C, but the insulated one will exhibit a smaller range. 10 to 38C though the average moved up 4C, the insulated house is actually more comfortable.
maybe its a way of telling easily led people that there is no climate crisis, and never was, what is a heatwave? and who decides?
One might hope that, having produced a result that is seemingly different than might be expected, you’d offer some discussion of why the result is seemingly different than the mainstream understanding.
There’s been a lot of published research on optimally combining surface temperature measurements that seems to be ignored by this post.
My guess is that you know about the analysis shown in Table S1 of Vincent et al 2018 that shows a negligible increase in number of hot days per year (over 30C) in lower Canada in the period 1900 to 2016. This analysis corroborates Roy’s analysis here.
I was not aware of this… I’ll take a look at it.
-Roy
an awful lot of rubbish has been published as well Mark, the UK thrives on it,a tiny increase in temperature and atmospheric C02 is a drop in the bucket compared to natural changes of the past,
According to Environment and Climate Change Canada, summer is the slowest warming season nationally, with average temperatures rising by 2.1C since 1948. In contrast, winter has warmed by 3.7C and autumn by 2.4C.
https://www.canada.ca/en/environment-climate-change/services/environmental-indicators/temperature-change.html
This analysis also excludes the Yukon, Northwest Territories, and Nunavut. These regions are warming significantly faster as shown in the regional temperature trend section.
” … summer is the slowest warming season nationally… ”
Yes.
*
” This analysis also excludes the Yukon, Northwest Territories, and Nunavut. ”
Yes.
*
I don’t understand Roy Spencer’s sudden change of heart, since three years ago he wrote very impressively about how the weather station at Las Vegas airport recorded the highest nighttime temperatures in winter, compared to stations far away in the Nevada wilderness.
*
Unsuprisingly, I noticed at home very similar things in US cities with a size like Las Vegas (El Paso, Oklahoma, Menphis, Boston, Seattle…), when compared to their context about 50 km away.
*
That was an analysis of the urban heat island effect that many people could understand and therefore fully accept.
What he writes these days is strongly reminiscent of Heartland and GWPF – and no longer of… Roy Spencer himself.
If warming is leading to dangerously high temperatures for humans, and life in general, it must appear in the highest temperatures of the summer period.
Paul Aubrin
1. That’s not what this is about at all: The discussion revolves around the urban heat island effect.
2. In 2003, 15,000 elderly people died in France due to a prolonged heat wave. They didn’t die from the high daytime temperatures, but from the high nighttime temperatures.
I have access to MET tower data going back 15 years here in Hartsville SC and I found similar results. All of the warming since 2012 occurred during the three coldest months of the year, and the three warmest months of the year experienced a slight cooling trend. I attributed this to shutting down the Progress Energy Unit 1 coal plant in the 2012-time frame which reduced the average temperature of Lake Robinson. With a lower lake temperature, there was significantly less evaporation during the colder months which affected how soon the sun could burn thru and heat the day up.
Anomalies are only necessary for removing the average annual cycle. If you are dealing with a single month or season, its unnecessary. Everyone has been asking for the absolute temperatures for so many years, now they want anomalies back again.
Roy Spencer
” Everyone has been asking for the absolute temperatures for so many years, now they want anomalies back again. ”
Everyone? Seriously? I can hardly imagine that.
Unless you mean all those pseudo-skeptics who discredit and denigrate everything that, in their opinion, helps to explain and support what they instinctively AND, above all, unscientifically reject.
*
” Anomalies are only necessary for removing the average annual cycle. ”
Really? With such a claim, you contradict substantial consequences of their use.
Because removing the annual cycle is a process applied separately to each measurement point, you do not solely remove seasonal dependencies but also spatial ones (e.g. altitude) and environmental ones (e.g. vegetation context, wind, distance to water etc).
You know this far better than I: this is the reason why you can build the average of anomalies constructed out of absolute surface station or satellite data wrt the same reference period, though all these data sources are located in completely different environments:
https://drive.google.com/file/d/1AOnVvwB9Hp3Maz_C4a6JIIz-QWzlGaip/view
What we do here is therefore not only ‘removing the annual cycle’: it is constructing the normals of time series.
This removal of spatial-temporal dependencies and biases goes so far that differences between the methods for calculating the daily mean from hourly data, such as (TMIN+TMAX)/2 and the 24-hour mean, which seem unavoidable when using absolute values, can be eliminated when using anomalies, as shown below:
Absolute daily time series out of hourly Meteostat data
https://drive.google.com/file/d/1_0TthnCtcX6y9YiNsr0p-jSNg4khTOso/view
Anomaly-based daily time series out of hourly Meteostat data
https://drive.google.com/file/d/1wHlBuzb4fGn9w-PVwpM3wCLNHdffgUNq/view
**
” If you are dealing with a single month or season, its unnecessary. ”
I apologize: I must contradict this claim as well.
Let us come back to this Death Valley story comparing, in July 1913, the Greenland Ranch station with stations as near as possible.
The comparison is best done by concatenating, for all stations of interest, several July months in a local time series from e.g. 1912 till 1922, and build their daily normals (baselines):
https://drive.google.com/file/d/13o86_hJyaT6DTv5Sxec5LdvG78XkPvqP/view
Then build, out of the normals and absolute data, the daily departures (anomalies):
https://drive.google.com/file/d/1jcgIKtFD_BpcX2awfEi9pwVZSs-oN2bn/view
You then see that though Logandale in Nevada has shown higher temperatures than Bakersfield in California, and hence a higher baseline average, it is nevertheless Bakersfield which is (1) nearest to Greenland Ranch in 1913, and (2) has in 2015 a peak similar to that of Greenland Ranch in 1913.
*
And when you repeat the same experiment for the period 1939-1960 with Greenland Ranch, Bakersfield AP and Cow Creek, you see that Cow Creek and Bakersfield AP are also very near to Greenland Ranch when considering the departures from their respective daily normals aka baselines, instead of their absolute data.
This lets ask what would have been if not the Bakersfield station had been compared to Greenland Ranch within 1912-1922, but… Cow Creek, distant from Greenland Ranch by tiny 8 km (Bakersfield is incredible 200 km away).
My guess: no one would have ever doubted Oscar Denton’s measurements.
Your first sentence described yourself, so people in glass houses shouldnt throw stones,
“Anomalies are only necessary for removing the average annual cycle.”
No! Anomalies are essential to achieve homogeneity in what you are averaging. Otherwise the stations in 2025 that you are averaging could just be a cooler lot of places than the lot you averaged in 1925.
And in Canada they generally were. There has been more development in the North, and so over the years more stations there.
I calculated here the average of climate means for the stations reporting (GHCNm) in July in Alberta. That isn’t weather; it just reflects the vagaries of the sample. It isn’t that different from te result here. But it is spurious – just samoling. Anomalies get rid of that.
My comment at WUWT here:
https://wattsupwiththat.com/2025/12/05/canada-summer-daily-high-temperature-trends-1900-2023/#comment-4138365
“Anomalies are only necessary for removing the average annual cycle. If you are dealing with a single month or season, its unnecessary.”
In addition to the points made by Nick Stokes and Bindidon above, the date dependent slope across a single month is not insignificant. For example, Toronto has a seasonal temperature range (mean expectation) of about 25 C. That is one would expect temperatures in July about 25 C warmer than mid January. Thus the slope in expectation temperature from the beginning to the end of June is a few degrees C and similarly for August. Consequently your “3 hottest days” metric is likely skewed toward dates in the second half of June and the first half of August by this effect.
testing
The later Professor Les Henry who worked as an extension specialist out of the University of Saskatchewan, provided me data from the Swift Current Agricultural Exp. Station on both precipitation and temperature going back into the 1880s. His focus was on 30-year moving averages of both as this is the MA used by the IPCC. (I tried to get other data from Les but he was always reluctant to share this type of thing fearing others would use it for purposes with which he disagreed. That he had quite a bit of data from other Ag Exp Stations across the province was clear from his extension writings.) His temperature data for Swift Current indicated that the average temperatures of the coldest months rose slightly, while those of the warmest months remained flat or even declined in one month. But the most interesting point concerned precipitation: It rose in the first few years (the years after the Palliser Triangle was proposed as an area not to be cropped), went into a long decline hitting lows in the mid 60s and 70s, then into a long increase, and started to tip down. Before he passed. Les was concerned that drought similar to the mid 1800s might be likely.
Roy…thank you kindly for confirming what I have experienced during my life in Vancouver, Canada, as well as brief stints in Regina and Saskatchewan on the Canadian Prairies and in the Tar Sands in and north of Edmonton.
I have no gripe against the idea that it may have warmed slightly, on average, the past 50 years, but we are talking a fraction of a degree C. There is no way such a slight warming can be classified as contributing to climate change and as far as I am concerned there is no evidence anywhere in southern Canada of climate change.
The problem with climate alarmists is their propensity to exaggerate a few tenths of a degree C warming into catastrophic climate events. They shy away rapidly from cooling events when we set records here in Vancouver recently for lows. From Google AI…
“For recent winters (late 2024/early 2025), Vancouver saw significant cold snaps, with lows dropping to around
-12.5°C (Dec 1, 2025) and -13.6°C (Nov 29, 2025) during an early winter blast in late 2025, and even colder temperatures like -11°C to -16°C in January 2024, though historically, December 2021 hit a remarkable -15.3°C, its coldest in 50+ years”.
Also from Google…
https://dailyhive.com/vancouver/vancouver-coldest-temperature-half-century
Naturally, the cold air descends from the Arctic, but is that not the same Arctic alarmists brag about as warming the most? They don’t get it that it is cold there in winter because our orbit and axial tilt cause the area to have little or no sunlight in winter. It does not matter how many gases like CO2 are in the air, it will never warm significantly there unless those two parameters change drastically.
How is that kind of cold in Vancouver possible when we are allegedly warming at an unprecedented rate? As a child and as an adult, I played soccer through many winters and seldom had a game postponed due to fields being frozen, or covered in snow. They wont allow games these days in December and January due to the prospect of rain-soaked turf getting damaged. However, as a child, I recalled happily plowing through puddle-soaked fields, then getting on a bus, soaking wet, to go home. Or even walking home.
I am trying to say that the climate around here has not changed in a detectable manner. We still play soccer outdoors through winter, as we have for at least half a century, although many grass fields are now synthetic turf or all-pupose gravel fields. We have always had warmish winters but only with respect to the colder parts of Canada and even British Columbia. I spent several nights north of Edmonton on a Tar Sands project circa 2008 and it was -25C outdoors.
However, the most miserable night I spent outdoors was on an outdoor night shift at the Vancouver airport. No matter how many clothes I put on, I still felt miserably cold and it was a couple of degrees C above 0C. The airport is right on the ocean at the mouth of the middle arm of the Fraser River. It gets seriously damp and with temps hovering around 0C, it can be downright miserable. Humidity not only exaggerates warmth in summer, it exaggerates cold even more in winter.
What has changed here is the propaganda driving the beliefs of Canadians into thinking there is an issue. At the same time, we are now facing economic disaster in part if we don’t quickly start getting our oil to international markets, and that has changed the tune of the government of Canada, who are now openly talking about pipelines to the West Coast and even Hudson Bay.
Our new PM is married to a woman who apparently supports the climate alarmist theories yet he is becoming progressively pragmatic re the need for Canada to scrap the policies imposed by his predecessor re carbon taxes and other impediments to growth and rapid expansion.
There are posts preceding mine in which Environment Canada is claiming warming and cooling. Their new name is Environment and Climate Change Canada, and that should clue anyone in with a scientific mind as to their pseudo-scientific agenda. EC is now firmly in the climate alarmist arena, with fudged data and the rest.
I wrote to them once and asked why there are no thermometers on the local mountains at 3000 feet. An EC rep asked in a bemused fashion why they would want to do that. When I replied that the mountains are part of the surface and considerably colder at 3000 feet, I received no reply.
I have told the story of living in Regina, Saskatchewan briefly during winter when the news of the day was a low temperature of -50C. That was not scuttlebutt from local gossips, it was printed in the Regina Leader Post newspaper. Recently, when I check the EC records for Regina, the coldest recorded temperature is some 5C lower. Same for Winnipeg, which was -55C on the same day.
That’s how EC gets such warming/cooling, by fudging the record. They have learned well from NOAA and NASA GISS.
Robertson, as usual, shows not only ignorance about everything he writes in lengthy, boring, endlessly repeated posts with zero dot zero content.
He also shows for the umpteenth time what a pathological, egomaniacal liar he is.
Look at what he brazenly posts!
” I wrote to them once and asked why there are no thermometers on the local mountains at 3000 feet. An EC rep asked in a bemused fashion why they would want to do that. When I replied that the mountains are part of the surface and considerably colder at 3000 feet, I received no reply. ”
*
Anyone having some experience in processing weather / climate data immediately understands when reading such nonsense that Robertson never did ever write that to Environment Canada. No ‘EC rep’ would ever ask ‘in a bemused fashion’ why there should be thermometers on mountains!
This is purely Robertson’s invention, exactly similar to what he allegedly obtained from NASA as he once allegedly asked them about the lunar spin.
*
In the GHCN daily station set, you can find about 130,000 stations, of which over 40,000 collect temperature data all around the world, including… Canada with over 6,000 stations having collected data since mid of the 19th century.
And over 30 of these stations are resp. were located above 2000 meters.
Not all of them are active, and not all of those, though active, give sufficient data to create time series out of their data, like e.g.
CA003052603 51.6333 -116.5000 2926.0 AB FALSE NICHOLAS
CA00305A003 51.0667 -115.7500 2621.0 AB LOOKOUT
CA00305MGFF 50.9500 -115.1833 2543.0 AB NAKISKA RIDGETOP
…
CA00117CA90 51.2333 -117.7000 1890.0 BC GLACIER NP MT FIDELITY
CA001168204 50.9000 -119.9167 1840.0 BC SUN PEAKS MOUNTAIN
…
They show incomplete records which can at best contribute to greater averages.
*
But let us look for example at the Canadian station ‘Kananaskis’ in GHCN daily:
CA003053600 51.0333 -115.0333 1391.0 AB KANANASKIS
located at 1391 meters (4563 ft), which shows a continuous record from 1940 till 2023 (other stations in the immediate near, located at higher altitudes, don’t at all).
Here is the absolute data I obtained from GHCN daily:
https://drive.google.com/file/d/1pWMuE8fgvWNFOYt8Bj7w-2sO3194K596/view
And here is the anomaly data evaluated wrt the mean of 1991-2020, together with NOAA’s Climate at a Glance anomalies plotted for the station’s coordinates:
https://drive.google.com/file/d/18mZapToFM23OcdLXMQLOpHeThqN2c_SK/view
Who would wonder if the dumb Robertson donkey would then say:
” Binny is as good in fudging data as is NOAA. ”
That’s the attitude of people lacking any technical skills, hence prefer to rely on contrarian ‘authority’, thus keep only able to discredit what they can’t contradict.
Gordon: “I wrote to them once and asked why there are no thermometers on the local mountains at 3000 feet. An EC rep asked in a bemused fashion why they would want to do that. When I replied that the mountains are part of the surface and considerably colder at 3000 feet, I received no reply.”
Good question! The truth is that those close-to-surface thermometers were originally meant for forecasting local weather and not the whole climate. Still they are used for propaganda purposes by climate alarmists.
” I wrote to them once and asked why there are no thermometers on the local mountains at 3000 feet. ”
*
Here is a list of the 43 of GHCN daily’s 507 Canadian weather stations located above 1000 m
https://drive.google.com/file/d/1gg–4ZlXK6ZqIXSxbcAKjvOw6uyooJ77/view
which together with 1497 others satisfied the requirements needed for a selection to build a time series comparing TMAX data below and above the latitudde 60N:
https://drive.google.com/file/d/1Up498Q0uVBydleuN7Aga-t4ezZF9_2FM/view
*
Among these 43, there is this one, for an evident reason of very special interest:
CA001105658 1971 2024 54 BC_N_VANC_GROUSE_MTN_RESORT___ 49.37 -123.08 1128.0
*
Some people are not only stupid…